Ylang: Universal Language for eBPF, Stap+, GDB, and More (Part 4 of 4)
This post is the 4th and final part of the series “Ylang: Universal Language for eBPF, Stap+, GDB, and More.” See also Part 1, Part 2. and Part 3.
Transparent Container Tracing
Ylang supports tracing across the boundaries of containers transparently. It can trace the Docker and Kubernetes containers just like normal target processes. One can specify the process ID or process group ID for the containerized processes. OpenResty XRay can also automatically detect applications running inside some containers of the same host.
The following screen shot of the OpenResty XRay web console shows a Perl target application running inside a Kubernetes container detected automatically.
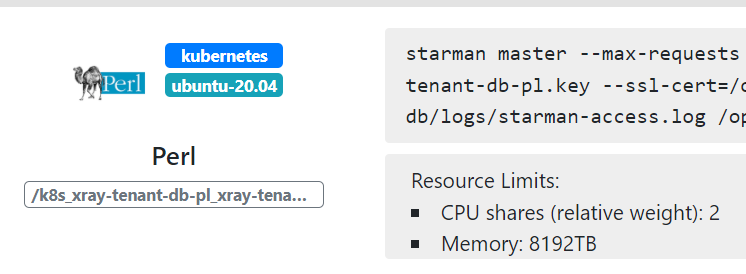
The target containers do not require any modifications or extra permissions. It is the beauty of 100% non-invasive dynamic tracing.
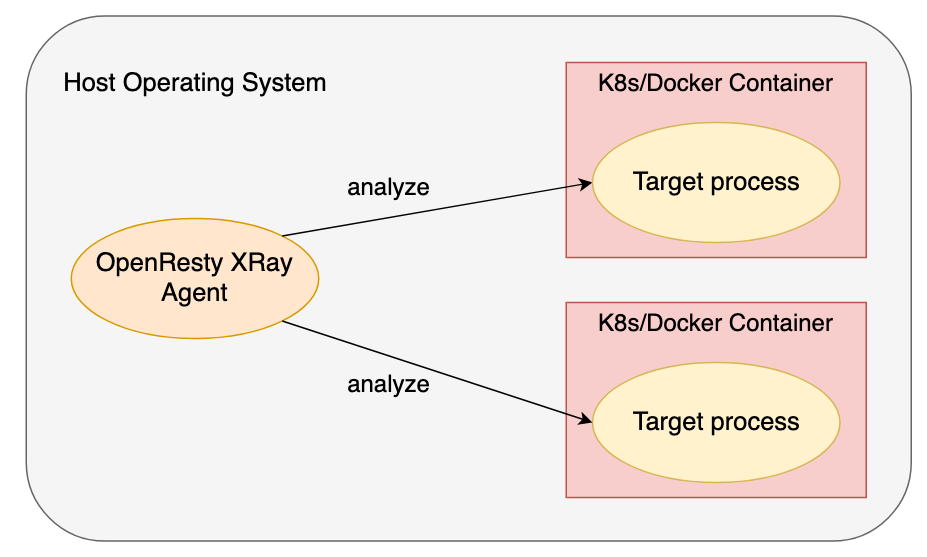
The generated tools from the Ylang compiler are executed and managed by the OpenResty Agent daemon process. The latter can transparently peek into any Docker and Kubernetes containers running in the same host operating system without any collaborations from the target containers themselves.
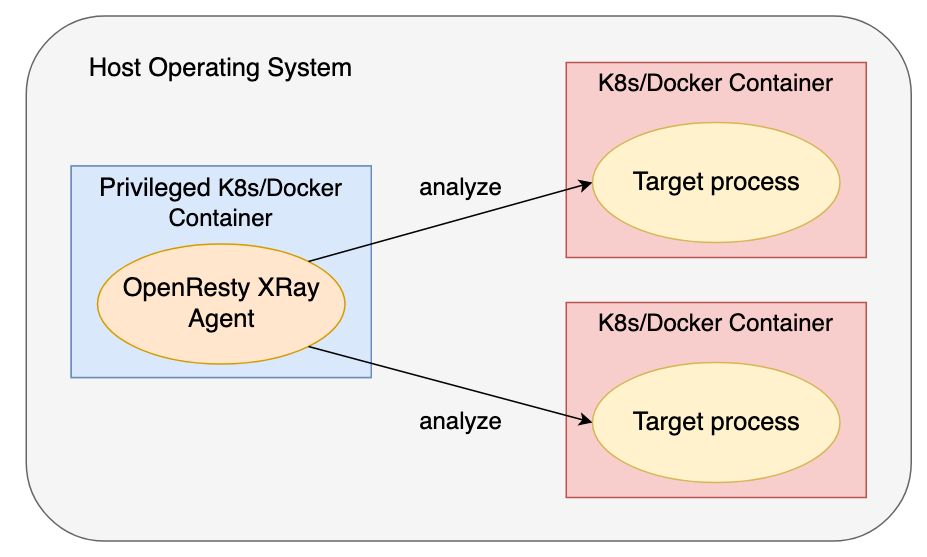
Some users prefer running the OpenResty XRay Agent processes inside a container. We also support that though the container for the Agent must be privileged, or otherwise, it won’t have the permissions to inspect any other containers (by definition).
As always, OpenResty XRay does not inject any code or require any changes inside those target processes. The original security isolations and permissions in those target containers are never compromised.
Efficient Stack Unwinding
The Ylang compiler can automatically compile unwinding data (indexed by OpenResty XRay’s Package Database) into very efficient native code that performs stack unwinding to produce a stack backtrace or just read specific local variables from the current runtime stack.
Backtraces are crucial because they provide a natural presentation for the current code execution context or “code path.” They are the cornerstones for many analyzers, including generating flame graphs for CPU, latency, and memory usage analysis.
Here is a quick Ylang example:
_probe usleep() {
    _print(_sym_ubt(_ubt()));
}
It puts a dynamic probe on the usleep C function call’s entry point and prints out a simple C backtrace string. Typical output looks like this:
f95e0: usleep[1]
401134: main[0]
27082: __libc_start_main[1]
40106e: _start[0]
Note that the integer numbers in the square brackets ([]) indicate the indexes of the target program module files. Here 0 is for the primary executable called a.out while 1 is for the libc-2.27.so file depended on by a.out. The user can quickly obtain the actual mapping relationships by other means in OpenResty XRay.
Full C Backtraces
Some of the Ylang backends also support the _print_full_ubt() built-in function to dump the full backtrace with argument and local variable values in all the stack frames. Below is an example:
_probe usleep() {
    _print_full_ubt();
}
The output may look like this with the ODB backend:
f95e0: usleep[1] (useconds=0x3)
  ts=0x0
401134: main[0]
27082: __libc_start_main[1] (main=0x401126, argc=1, argv=0x7ffcd83d8378, init=<optimized>, fini=<optimized>, rtld_fini=<optimized>, stack_end=0x7ffcd83d8368)
  result = <optimized>
  unwind_buf=0x0
  not_first_call = <optimized>
  afct = <optimized>
  head = <optimized>
  cnt = <optimized>
  __value = <optimized>
  __value = <optimized>
  ptr = <optimized>
  __p = <optimized>
  __result = <optimized>
40106e: _start[0]
It looks very similar to the output of GDB’s bt full command.
Reading Specific Variable Values from C Stacks
The full backtrace dumper can be very expensive. Sometimes we only need to read a particular variable on the current stack, which can be very efficient. For example, if we use the _stack_var("r", 1) Ylang function call, it will return the value of the first non-optimized local variable (including function arguments) named r on the current stack (from the stack top to its bottom). This _stack_var function is not yet available in the OpenResty XRay product though it is already available in our internal code repositories. We’ll update this article once it is released.
Dynamic Language Backtraces
Ylang provides standard libraries via header files for generating backtraces for dynamic languages. Dynamic languages include those scripting languages like Lua, PHP, Python, and Perl. We also support advanced statically-typed languages like Go (golang), Rust, and C++. Furthermore, we have plans to expand our language support in the future to include Ruby, Java (JVM), JavaScript (NodeJS), OCamel, Haskell, Erlang.
We’ll illustrate how to print out backtraces for the Lua and PHP languages below.
Lua Backtraces
For example, to generate a Lua-land backtrace string when some Lua code is running on LuaJIT 2.1, we can write:
#include "lj21.y"

_probe lj_cf_os_exit() {
    printf("%s", lj_dump_bt(NULL, "min"));
}
Here we put a dynamic probe on the lj_cf_os_exit() C function’s entry point and then dump out the Lua-land backtrace in the minimized format. One sample output looks like this:
$ run-y -c 'luajit test.lua'
test.lua:c
test.lua:b
test.lua:a
test.lua:0
C:pmain
The test.lua file looks like this:
local function c()
    local baz = "hello"
    os.exit(0)
end

local function b()
    local bar = 3.14
    c()
end

local function a()
    local foo = 32
    b()
end

a()
The os.exit() Lua function call will trigger the lj_cf_os_exit() C function call inside the LuaJIT VM.
The Lua-land Flame Graph analyzer provided by OpenResty XRay uses a similar Ylang code to produce the flame graphs. Here is an example graph.
Full Lua Backtraces
We can get the full Lua backtraces with local Lua variable values printed out in each Lua function call frame by writing lj_dump_bt(NULL, "full") in the Ylang program above. One sample output for the sample test.lua script above is as follows:
[builtin#os.exit]
exit
test.lua:3
    baz = "hello"
test.lua:c
test.lua:8
    bar = 3.140000
test.lua:b
test.lua:13
    foo = 32
test.lua:a
test.lua:16
    c = function @test.lua:1: (GCfunc *)0x7feff0851578
    b = function @test.lua:6: (GCfunc *)0x7feff0851658
    a = function @test.lua:11: (GCfunc *)0x7feff08516c8
C:pmain
Even the Lua standard library does not support full backtraces out of the box. Ylang does not need any collaborations from the LuaJIT VM or the target process because it knows about the LuaJIT VM internals.
PHP Backtraces
Below is an example for dumping PHP 7’s backtraces:
#include "php7.y"

_probe _timer.profile {
    printf("%s\n", php7_dump_bt());
    _exit();
}
One sample output is
C:sapi_cli_single_write
Application->setLogger
/tmp/test.php:24
C:sapi_cli_single_write
Application->getLogger
/tmp/test.php:30
C:sapi_cli_single_write
class@anonymous@/tmp/test.php:24$0->log
/tmp/test.php:30
Compared to Open-Source Toolchains
SystemTap directly embeds the unwinding data (usually in the DWARF format) into its compiled tools and interprets the unwinding data at runtime. It is slow because unwinding data formats like DWARF is a complex data format1, and also, they are usually optimized for compactness and space usage instead of for speed. Ylang is a proper compiler that converts DWARF data into specialized native code that runs at the fastest possible speed. GDB also interprets DWARF data instead of working as an actual compiler.
Linux’s perf copies the full runtime stack memory content to the user-land for unwinding, which has the following drawbacks:
- It may copy too much data from the kernel space to the user-land, and most of the data is useless for stack unwinding. The copying can quickly saturate the memory bus and expose sensitive data vulnerable to security breaches.
- It won’t be possible for complex tools to utilize the backtrace results directly in the kernel space.
And the open-source eBPF toolchain relies on the frame pointer registers2 to be used in the target programs, which goes against the recommendations of the x86_64 ABI, for example. And the user has to recompile most of the target programs with the C/C++ compiler flag -fno-omit-frame-pointer, which breaks the golden rule of dynamic tracing: no slowdown or explicit collaborations from the target programs.
None of the open-source toolchains support unwinding dynamic languages’ function call stacks or generating their backtraces.
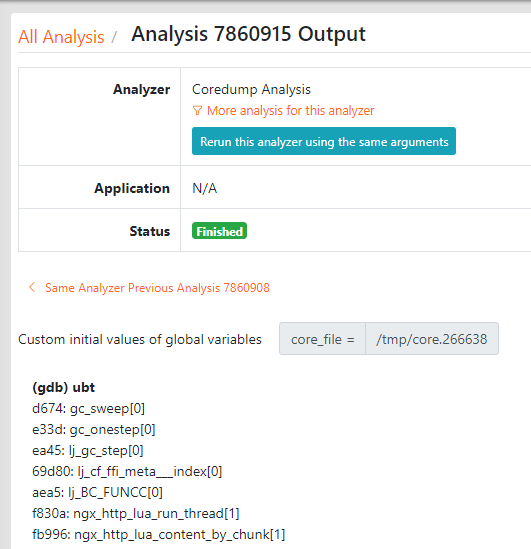
Analyzing Dead Processes (Core Dumps)
Ylang’s GDB backend is particularly useful for analyzing core dump files generated from crashed processes. Other backends like Stap+ and eBPF have no support for core dump files.
For the first time, the same analyzing tools can analyze both live processes and dead ones. Thanks to the higher-level language, Ylang, the same analyzing tools can analyze both live processes and dead ones for the first time.
It makes little sense to specify any probes other than _oneshot and _begin in Ylang analyzers for core dumps. After all, a core-dump is a corpse of dead processes3.
We also have plans to add a new Ylang backend for the Red Hat crash command-line utility so that we could also use Ylang to debug Linux kernel crash dumps (like those from kdump). Analyzing operating system kernel corpses is fun as well.
Very Low Tracing Overhead
Dynamic tracing has a very low runtime overhead because it only collects information needed for specific analysis goals. It is dramatically different from traditional approaches of collecting as much information as possible in log data4. The latter incurs much higher overhead due to writing and moving big data around5.
Dynamic tracing is also usually based on sampling. Because it never injects any code or loads any special modules into the target processes, it is precisely 0 overhead when it is not sampling. Most analyzers’ overhead is usually unmeasurable, even during the sampling window. When the target application reaches maximum throughput, the cost of sampling is generally under 5% of the throughput. Some full-instrumentation tools may incur higher overhead, like a cost of more than 30% of the maximum application throughput. However, we can still use them in production environments when the online performance is degraded to a crawl already.
Ylang is also an optimizing compiler that emits compact and efficient code for different backends. For example, the Python code generated by Ylang’s GDB backend is about four times faster than hand-crafted code6.
Standard Ylang Libraries & Tools
As we saw in previous sections, Ylang provides standard header files to import more functions and other features. It is similar to C/C++’s way of reusing code. We’ve already seen standard header files like lj21.y and php7.y, which form the standard libraries for Ylang. We also use Ylang to implement these libraries.
In the future, we may also support multiple compilation units in Ylang7 to reduce the amount of code that the compiler must re-compile.
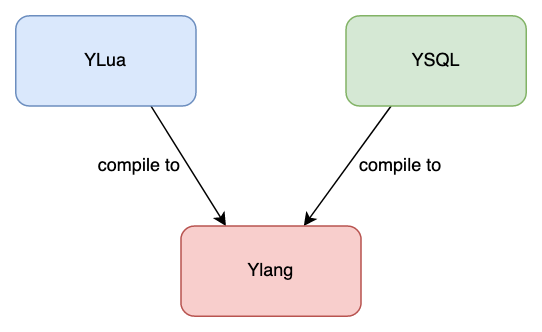
Additionally, OpenResty XRay offers hundreds of standard analyzers or tools for many different types of open-source software. Most of these tools are coded in Ylang. Some are written in even higher-level languages like YLua and YSQL. We have an entire “food chain” to build language abstractions on top of Ylang. It’s more natural to use the Lua language syntax, for instance, to manipulate Lua-land data structures than using the C syntax to inspect the C-level data structures.
Network Filtering & Control
Using Ylang to write in-kernel network programs to manipulate network packets is also possible. Thanks to the eBPF support in the Linux kernel’s network stack. eBPF’s predecessor, BPF, was created exclusively for network filters. With Ylang and OpenResty XRay’s eBPF toolchain, we no longer suffer from the painful limitations in the stock eBPF toolchain and VM implementation. We can hook up powerful programs to both the XDP and TC subsystems.
This feature has landed in OpenResty XRay. And the OpenResty DDoS slide deck also can be found on our OpenResty Edge product pages.
The Ylang Compiler’s Implementation
The Ylang compiler was written in the Fan language (or fanlang), our Perl 6 (or Raku) dialect language specifically designed to implement new optimizing compilers for general-purpose and domain specific languages. The fanlang compiler emits optimized LuaJIT bytecode and runs much faster than open-source Perl 6 implementations like Rakudo8. The fanlang compiler will also become part of our OpenResty Edge and OpenResty Plus products soon.
Operating System Support
Ylang and OpenResty XRay support most mainstream Linux distributions that have not reached end-of-life. Some of the end-of-life distribution versions like Ubuntu 14.04 and CentOS 6 are also working to some extend.
The next big operating system flavor that will get supported is Android because its kernel is based on Linux anyway. The eBPF backend of Ylang will work out of the box there.
We also plan to support more exotic systems like *BSD and macOS. Windows is also technically possible. Stay tuned!
Contributions to Open-Source Communities
We created Ylang and OpenResty XRay to help troubleshoot and optimize all kinds of open-source software. Open-source software is everywhere nowadays, but very few people have deep insights into the open-source software they use daily and love. And many people use it in suboptimal or even incorrect ways. Ylang and OpenResty XRay themselves also leverage a lot of high-quality open-source code.
Ylang makes it possible to create tremendously complex analyzers and tools, which imposing unprecedented pressure on the underlying open-source infrastructures. Indeed, we ran into many obscure bugs in almost all the open-source components we employ, like SystemTap, Clang/LLVM, libbpf, GDB, and Linux kernel (including the eBPF machinery, perf events, libbpf, btftool, etc.).
We’ve been reporting a lot of bugs and submitting many patches to these open-source projects to help make the open-source world better. Special thanks go to the author of the SystemTap project, Frank Ch. Eigler, for quickly reviewing and accepting our patches, as well as his general support over the years. We’ve also been leading our open-source projects, like OpenResty and we believe in the open-source movement.
Conclusion
Ylang is a universal debugging and dynamic tracing language targeting many different debugging frameworks and runtimes. Additionally, the backends used by Ylang also lift a lot of limitations and add many new features to their open-source counterparts (if there is a counterpart). Developing new dynamic tracing tools cannot be easier now. The user can use the Ylang language and toolchain via the OpenResty XRay product or use our standard analyzers written in Ylang.
This series of articles gives a 30,000 feet overview of the Ylang language’s features and advantages, with simple examples. You can find more details about the Ylang language in the official documentation.
Acknowledgments
We base our work upon many dynamic tracing and debugging giants.
Brendan Gregg’s blog first got me interested in this field back in 2012. He was mostly talking about DTrace in those years. In recent years, his work around Linux eBPF and perf toolchains is still inspiring us.
During 2012 ~ 2016, Cloudflare provided a big playground to apply dynamic-tracing technologies to solve real-world problems in large-scale clouds when I worked there.
Frank Ch. Eigler’s SystemTap delivers the most capable open-source dynamic tracing framework, which served me well in those early days. We’ve been closely working with Frank and other SystemTap developers at Red Hat over the years.
The people working on Linux eBPF are admirable. They bring the power of DTrace’s in-kernel VM into the Linux kernel and extend it to both the networking and tracing worlds.
Special thanks go to our developers at OpenResty Inc. for making Ylang and OpenResty XRay a reality. Also, thanks all our OpenResty XRay users for helping make the product better every day.
Last but not least, I must thank the developers who created DTrace at Sun Microsystems in the dawn of the 21st century. That sparked a whole new era in the computing world.
About The Author
Yichun Zhang (Github handle: agentzh), is the original creator of the OpenResty® open-source project and the CEO of OpenResty Inc..
Yichun is one of the earliest advocates and leaders of “open-source technology”. He worked at many internationally renowned tech companies, such as Cloudflare, Yahoo!. He is a pioneer of “edge computing”, “dynamic tracing” and “machine coding”, with over 22 years of programming and 16 years of open source experience. Yichun is well-known in the open-source space as the project leader of OpenResty®, adopted by more than 40 million global website domains.
OpenResty Inc., the enterprise software start-up founded by Yichun in 2017, has customers from some of the biggest companies in the world. Its flagship product, OpenResty XRay, is a non-invasive profiling and troubleshooting tool that significantly enhances and utilizes dynamic tracing technology. And its OpenResty Edge product is a powerful distributed traffic management and private CDN software product.
As an avid open-source contributor, Yichun has contributed more than a million lines of code to numerous open-source projects, including Linux kernel, Nginx, LuaJIT, GDB, SystemTap, LLVM, Perl, etc. He has also authored more than 60 open-source software libraries.
The DWARF format is so powerful that it looks like Turing-Complete. ↩︎
The frame pointer register on x86_64 is
rbp, for example. ↩︎We have proprietary technologies to bring crashed processes to life by loading the core dump file into a resurrected process. You are free to use all the probes like function probes and syscall probes in Ylang to trace them. ↩︎
The log data could be stored on the file system or sent over the network in real-time. ↩︎
It requires a lot of CPU time, memory bandwidth, disk/network bandwidth, to name a few. ↩︎
The GDB Python code emitted by the Ylang compiler does not use the
gdb.Valueorgdb.Typeobjects, which significantly reduces the runtime overhead. Humans cannot write such Python code since it will be too complicated for brains based on biology. ↩︎It is also similar to the C and C++ languages. ↩︎
The fan compiler is also compiling code much faster than Rakudo. ↩︎
Related Articles
OpenResty XRay Dec 28, 2021

OpenResty XRay Nov 14, 2021

OpenResty XRay Nov 12, 2021

OpenResty XRay Mar 3, 2026

OpenResty XRay Sep 24, 2025


