Ylang: Universal Language for eBPF, Stap+, GDB, and More (Part 3 of 4)
This post is the 3rd part of the series “Ylang: Universal Language for eBPF, Stap+, GDB, and More.” See also Part 1, Part 2, and Part 4.
The Language Syntax (Continued)
String Literals
Ylang supports the C string literal syntax, i.e., double-quoted strings.
But as always, we need to be careful about the two memory spaces in every Ylang program. By default, string literals reside in the tracer space, as Ylang’s built-in strings. But when we try to take the address of such string literals, Ylang will automatically find the exact literal string in the tracee land (i.e., in the target processes) and return an address in the tracee space. Below is an example:
const char *s = "hello, world\n";
Behind the scene, Ylang will try hard to scan the .rodata section of the target processes and return that matched string’s virtual memory address (only the first hit matters). If there are no hits, the Ylang compiler will return a compile-time error. The .rodata section data is usually indexed by OpenResty XRay’s package database so that the Ylang compiler does not need to analyze the target executables every time itself.
Built-in Regex Support
Perl-compatible regular expressions (or regexes) work natively in Ylang. Many standard features in Perl regex syntax are supported. Ylang uses the OpenResty Regex optimizing compiler to emit efficient code for user regexes. Our proprietary automata algorithms guarantee linear matching time wrt the length of the input string. And it also enjoys constant memory usage regardless of the input string’s content or size.
Below is an example:
_probe _oneshot {
    _str a = "hello, world";
    if (a !~~ rx/^([a-z]+), ([a-z]+)$/) {
        _error("not matched");
    }
    _print("0: ", $0, ", 1: ", $1, ", 2: ", $2, "\n");
}
When running this Ylang program, we get the following output:
$ run-y test.y
Start tracing...
0: hello, world, 1: hello, 2: world
We use the special variables $0 to capture the substring matching the whole regex and $1, $2 for the sub-match capturing groups.
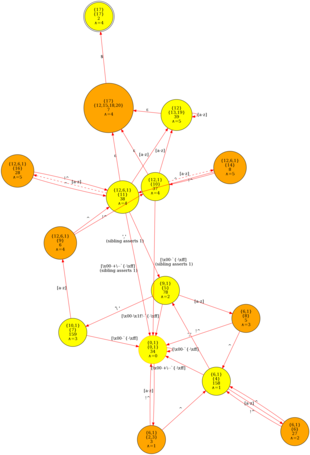
The OpenResty Regex compiler can construct a minimal DFA (Deterministic Finite Automaton) which looks like this:
Full Control-Flow Support
All the C control-flow statements like for, while, do while, if, else, switch/case, break, continue, etc., are supported in Ylang. Even C’s goto statement is fully working across Ylang’s all backends (Stap+, eBPF, ODB, and GDB). They also support recursive function calls. Below is a sample C code snippet from the LuaJIT source tree, also a valid Ylang code.
restart:
    lname = debug_varname(pt, proto_bcpos(pt, ip), slot);
    if (lname != NULL) { @name[0] = lname; return "local"; }
    while (--ip > proto_bc(pt)) {
        BCIns ins = *ip;
        BCOp op = bc_op(ins);
        BCReg ra = bc_a(ins);
        if (bcmode_a(op) == BCMbase) {
            if (slot >= ra && (op != BC_KNIL || slot <= bc_d(ins)))
                return NULL;
        } else if (bcmode_a(op) == BCMdst && ra == slot) {
            switch (bc_op(ins)) {
                case BC_MOV:
                    if (ra == slot) { slot = bc_d(ins); goto restart; }
                    break;
                default:
                    return NULL;
            }
        }
All the loops in Ylang are bounded, including generic goto statements. Only a limited number of Ylang statements are allowed to run for each probe handler. This limit is configurable. Also, a user-tunable threshold limits the depth of the recursive function calls. The Ylang compiler makes sure Ylang programs terminate (quickly) no matter what and use a limited stack size. Essentially we have a very efficient runtime sandbox for tools emitted by the Y compiler.
It’s worth noting that eBPF has minimal looping structures where the loops must unroll at compile time. The open-source eBPF C language prohibits general loops, especially backward jumping. It makes code reuse from the target applications very difficult. And rewriting the proven control flow of nontrivial C code can be very error-prone. Debugging bugs in dynamic tracing tools themselves can be challenging. The stock eBPF verifier is also quite stupid in estimating the total number of eBPF instructions to be executed. For example, a big switch statement can easily exceed its 1 million instruction limit even though, in reality, only a few instructions for a single case statement can run. OpenResty XRay’s eBPF implementation does not have these limitations. However, it still makes sure all Ylang programs are always safe to run in production systems, even when the Ylang programs themselves are buggy.
DTrace’s D language lacks any looping structures the last time I checked. DTrace users have to unroll the loops themselves if it is possible at all.
The open-source SystemTap has very flexible control-flow statements. But it still lacks the goto statement. OpenResty XRay’s Stap+ toolchain does not have these restrictions.
Floating-Point Number Support
Ylang’s all backends support floating-point numbers. Both the float and double C data types work in both the tracer-space and the tracee-space.
Below is an example for doing tracer-land floating-point arithmetic:
double a = 3.1234512345123451234;
double b = 1.8123451234512345123;

_probe _oneshot(void) {
  printf("a + b: %.15f\n", a + b);
  printf("b + a: %.15f\n", b + a);
  printf("a - b: %.15f\n", a - b);
  printf("b - a: %.15f\n", b - a);
}
And we run it with the run-y utility:
$ run-y test.y
Start tracing...
a + b: 4.935796357963580
b + a: 4.935796357963580
a - b: 1.311106111061111
b - a: -1.311106111061111
For the tracee-space, we can also read floating-point numbers from the target processes’ memory. Let’s assume a target C program has a struct typed variable as follows:
typedef struct foo {
    double d;
    float f;
} foo;

foo obj = { 3.14, -0.01 };

int main(void) {
    return 0;
}
It has both a double-typed field and a float-typed one. And we use the following Ylang code snippet to read those fields:
_target static foo obj;

_probe main() {
    printf(".d: %f\n", obj.d);
    printf(".f: %f\n", obj.f);
}
And the output of this Ylang program is like this:
$ run-y -c ./a.out test.y
Start tracing...
.d: 3.140000
.f: -0.010000
Here ./a.out is the executable compiled from the target C code above.
Compared to Open-Source Toolchains
Most of the kernel-based open-source toolchains lack floating-point number support. The only exceptions are DTrace on Solaris and SystemTap. The syntax in SystemTap for float-point numbers is also very cumbersome. It’s not pretty to use tapset functions for everything involved with floating-point numbers (like fp_lt, fp_to_long, and fp_add).
Transparent Debug Symbol Handling
Modern optimizing compilers can emit debug symbols (or debug info), making it possible to debug binary programs without sacrificing runtime performance. It is essentially a map for debuggers to navigate the cold binary world. These debug symbols enable us to directly reference any data types, field names, functions, and global/static variables by names in a Ylang program. Ylang will map those names to numbers in the emitted analyzers for Stap+, eBPF, GDB, etc. 1
Debug Symbols: No Runtime Overhead
C/C++ compilers usually support the -g option (or variants like -g3 and -ggdb), which emits debug symbols in special ELF file sections like .debug_info and .debug_line. The debug symbols may be in the DWARF format. Sometimes the compiler may use other debugging data formats like CTF and BTF. These sections won’t get mapped into RAM when the operating system loads the executable files, and thus no runtime overhead will incur. These debugging sections can also be stripped into separate debug files and may not even be present in the production system. For instance, RPM-based systems usually gather separate debug symbols into dedicated *-debuginfo RPM packages, while APT-based systems provide dedicated *-dbgsym or *-dbg DEB packages.
Centralized Package Database
Our crawlers constantly feed OpenResty XRay’s Package Database by fetching all the public binary packages from mainstream Linux distributions (like Ubuntu, Debian, CentOS, Rocky, RHEL, Fedora, Oracle, OpenSUSE, Amazon, Alpine, and many more) as well as many popular open-source software’s package repositories (like MySQL and PHP’s). Furthermore, if the user system has custom executable binaries with either embedded or separate debug symbols, OpenResty XRay will automatically collect the debug symbols. And then, it indexes the data in a tenant-specific database of the Package Database. Different tenants won’t see others’ private debug symbols for security and privacy considerations. Thanks to the centralized Package Database continuously growing in real-time, the user does not need to install debug symbols in every machine with the same program binaries. It is only required for OpenResty XRay to see the debug symbols for a particular executable binary file only once. And then, it can automatically map the same binary file to the correct version of debug symbols it has already indexed, even though the debug symbols are not readily available in the current system.
The Package Database also processes the debug symbol data and builds fast indexes for the Ylang compiler. Processing complex debugging data formats like DWARF is quite expensive, and thus it’s better to do the format parsing only once. It also invokes our Linux kernel fuzz testing system to ensure new kernel packages (including our user’s custom kernels) have no issues with our dynamic tracing toolchains.
The Package Database is gigantic! As of this writing, it already takes hundreds of terra-bytes and is ever-growing every minute. For this reason, the on-premises version of OpenResty XRay still requires accessing our centralized read-only Package Database for public software packages over (encrypted) Internet connections. However, the tenant part of the Package Database resides on the user’s machines for the on-premises version.
As of this writing, OpenResty XRay only supports the DWARF format. We have plans to add support for CTF and BTF in the future.
Fuzzy Matching Debug Symbols
Sometimes people may compile the programs without debug symbols2, intentionally strip the program binaries to make them smaller during the building or packaging process, or fail to find the debug symbol packages3. In such cases, there’s still hope that we could construct most of the debug symbols automatically in OpenResty XRay by fuzzy-matching existing debug symbols for similar though different executable binaries. Advanced machine learning and reverse engineering technologies are required here. We’ve been working on this for quite some time, though it’s not yet available in OpenResty XRay. For users’ custom programs with no “similar” binaries in the open-source world, the only way is to re-compile those binaries with the -g compiler option to make them debuggable.
To Be Continued
It is all I’d like to cover in Part 3. I have to pause here. Starting from Part 4, we will continue introducing more features and advantages of Ylang.
About The Author
Yichun Zhang (Github handle: agentzh), is the original creator of the OpenResty® open-source project and the CEO of OpenResty Inc..
Yichun is one of the earliest advocates and leaders of “open-source technology”. He worked at many internationally renowned tech companies, such as Cloudflare, Yahoo!. He is a pioneer of “edge computing”, “dynamic tracing” and “machine coding”, with over 22 years of programming and 16 years of open source experience. Yichun is well-known in the open-source space as the project leader of OpenResty®, adopted by more than 40 million global website domains.
OpenResty Inc., the enterprise software start-up founded by Yichun in 2017, has customers from some of the biggest companies in the world. Its flagship product, OpenResty XRay, is a non-invasive profiling and troubleshooting tool that significantly enhances and utilizes dynamic tracing technology. And its OpenResty Edge product is a powerful distributed traffic management and private CDN software product.
As an avid open-source contributor, Yichun has contributed more than a million lines of code to numerous open-source projects, including Linux kernel, Nginx, LuaJIT, GDB, SystemTap, LLVM, Perl, etc. He has also authored more than 60 open-source software libraries.
Because the Ylang compiler handles the debug symbols itself, the emitted tools do not rely on runtime debug info interpretation, making the final tools run much faster. Backends with built-in DWARF support do not use their DWARF features at all, like Stap+ and GDB. ↩︎
For example, the user may compile C/C++ programs without the
-gcompiler option. ↩︎certain Linux distributions refuse to provide debug info packages like Arch Linux and Slackware. ↩︎
Related Articles
OpenResty XRay Dec 31, 2021

OpenResty XRay Nov 14, 2021

OpenResty XRay Nov 12, 2021

OpenResty XRay Mar 3, 2026

OpenResty XRay Sep 24, 2025


