Ylang: Universal Language for eBPF, Stap+, GDB, and More (Part 2 of 4)
This post is the 2nd part of the series “Ylang: Universal Language for eBPF, Stap+, GDB, and More.” See also Part 1, Part 3, and Part 4.
Continuing our discussion of Part 1 of this series, let’s cover more details on the Y language’s syntax with various extensions to the C language in this Part 2.
The Language Syntax (Continued)
Macros with Extensions
Ylang does support all the C preprocessor directives to work with C macros, even with those GNU extensions. So #if, #elif, #define, #ifdef, #ifndef, and even variadic macros all work out of the box. The Ylang compiler invokes gcc’s preprocessor directly to process any macro directives in the Ylang source code to ensure 100% compatibility with gcc.
Additionally, Ylang supports a lot of its own preprocessor directives for reusing code in the dynamic tracing context. For example,
##ifdeftype SBufExt
#include "new.y"
##else
#include "old.y"
##endif
Here the ##ifdeftype directive is Ylang’s own preprocessor directive, which checks if the C/C++ data type specified by the directive’s argument exists in the target processes or applications. In this example, the Ylang source file new.y will get included if the C/C++ data type SBufExt exists in the target (or “tracee”). Usually, OpenResty XRay will extract type information from its centralized package databases and transparently feed it into the Ylang compiler. The debug information stored in the package databases is previously collected from debug symbols in formats like DWARF.
As you might have already noticed, Ylang’s own directive names start with ## instead of a single #. It is to avoid any conflicts with any C preprocessor directives. For Ylang’s own commands like ##ifdeftype, the user needs to use the corresponding ##elif, ##else, and ##endif directives instead of their C counterparts.
There are other symbol related directives introduced by Ylang itself and they are mostly self-explanatory:
##ifdeffield my_type my_field
##ifdeffunc do_something
##ifdeftype struct bar_s
##ifdefenum error_codes
##ifdefvar my_var
Tracer and Tracee Spaces
The memory managed in Ylang has two different spaces, the “tracer space” and the “tracee space.” The tracer space memory resides in the dynamic tracing tool or analyzer itself and is writable. On the other hand, the tracee-space memory lives in the target processes (or kernels) we are tracing and is strictly read-only. The tracee space is also sometimes called “target space.” The read-only tracee space memory ensures that Ylang tools and analyzers won’t change any states, not even a single bit, inside the target processes. Not only that, even reading invalid addresses in the tracee space (or tracer space) will never crash the target processes at all. Such invalid reads will only result in errors in the tracer space or return garbage data.
By default, all variables declared or defined in Ylang are in the tracer space, as in
int a;
long b[3];
double *d;
struct Foo foo;
For tracee space, you need to declare the variables with the _target keyword, as in
_target int a[5];
This line declares an array-typed variable named a in the tracee space. Because the tracee space is read-only, we can only declare variables that already exist in the tracee or target. The Ylang compiler automatically looks up information about the tracee variable symbols from OpenResty XRay’s package databases.
The data types used in Ylang are from the tracee space by default and do not require the _target keyword (actually, if you do, you will get grammar errors from the Ylang compiler).
Tracer-Space Composite Types
It is possible to declare composite typed variables in Ylang’s tracer space, as in
void foo(void) {
    struct foo a;
    a.name = "John";
    a.age = 32;
    printf("name: %s, age: %d", a.name, a.age);
}
Here the type struct foo is from the tracee space, and Ylang will try to resolve it automatically with the aid of the package databases from OpenResty XRay.
Many open-source dynamic tracing frameworks cannot define such composite tracer-land variables without dirty bloody hacks, like SystemTap, GDB, DTrace, etc. Ylang does not have this restriction.
Probes
One of the most critical language constructs in any dynamic tracing language is the probe definition. Ylang supports many probe points, both for user-land and kernel-space, and the number is ever-growing.
User-Land Probes
We can put dynamic probes onto the entry point of any C functions defined in the target processes. And the following code block will run every time the probe gets a hit. To define a function entry probe, we can use the _probe keyword and specify the target function’s name, as in
_probe main() {
    printf("main func is called!\n");
}
Here we define a probe at the entry point of the main() function for the target processes.
We can also declare and reference any parameters in the tracee space, as in
_probe ngx_http_finalize_request(ngx_http_request *r, ngx_int_t rc) {
    printf("uri: %.*s, status code: %d\n", (int) r->uri.len, r->uri.data, rc);
}
Here we output data from the parameters r and rc of the C function ngx_http_finalize_request defined in the target processes.
Function Return Probes
We can also define return probes on any user-land functions, as in
_probe foo() -> int {
    printf("foo() func returned!\n");
}
It’s also possible to reference any return values, just declare a return variable like this:
_probe foo() -> int a {
    printf("foo is returning %d\n", a);
}
Naturally, inlined functions and optimized tail-calls in the target processes won’t trigger these return probes because they never return, at least not returning in common sense.
Other Dynamic Tracing Frameworks
It’s worth noting that the function return probes support is missing for many other dynamic tracing frameworks, or the implementation is buggy. For instance, GDB lacks built-in support for function return probes (or breakpoints in its terminology), and the user has to manually set a breakpoint on every return point in the target function herself. And eBPF, SystemTap, Bpftrace, etc., rely on the kernel’s uretprobes facility, which has an inherent design flaw that messes up the stack of the target processes and breaks many things like stack unwinding.
Fortunately, Ylang automatically works around such limitations even when it targets such backends or targets an enhanced version of the target provided by OpenResty XRay (like Stap+ and OpenResty XRay’s own eBPF implementation).
Kernel-Space Probes
Ylang also supports analyzing user-land target processes in many kernel-space probes.
Scheduler Probes
To probe the operating system process scheduler’s “CPU-on” and “CPU-off” events:
_probe _scheduler.cpu_on {
    int tid = _tid();
    printf("thread %d is on a CPU.\n", tid);
}

_probe _scheduler.cpu_off {
    int tid = _tid();
    printf("thread %d is off any CPUs.\n", tid);
}
These probe points are within the OS kernel’s process/thread scheduler and thus also in the kernel space. The off-CPU Flame Graph analyzers in OpenResty XRay utilize identical Ylang probes, for example.
Profiler Probe
For CPU hotness profiling, we can use the _timer.profile probe point, as in
_probe _timer.profile {
    _str bt = _ubt();  /* user-land backtrace string */

    /* do aggregates on the bt string value here... */
}
Here we use Ylang’s built-in function _ubt() to fetch the current user-land backtrace as a string (of the Ylang built-in type _str). OpenResty XRay’s standard analyzers for generating various kinds of on-CPU Flame Graphs use the same Ylang probe point.
For pure user-land tracing backends like GDB and ODB, the use of any kernel-space probes will lead to compile-time errors. Those backends cannot tap into the kernel space by design.
Timer Probes
It is handy to fire off a probe event after a specific amount of time, like a time, either a one-off timer or a periodic timer. Ylang supports such probe points via the _timer.s and _timer.ms probe names. Below are some examples:
_probe _timer.s(3) {
    printf("firing every 3 seconds.\n");
}

_probe _timer.ms(100) {
    printf("firing after 100ms");
    _exit();  // quit so that this timer is a one-off.
}
Note that the standard eBPF toolchain does not support such timer probes, but Ylang can emit code to emulate them correctly on the user-land.
System Call Probes
We can also probe onto system calls, as in
_probe _syscall.open {
    // ...
}
This probes the open system call (or “syscall” for short).
Process Begin and End Probes
Ylang can also probe on user-land process startup and exit points, as in
_probe _process.begin {
  // ...
}

_probe _process.end {
  // ...
}
If the target processes are already running when the Ylang analyzer or tool starts to run, then the _process.begin probe handlers will still run once and only once for those processes, even when they are still sleeping.
DWARF-less Probing
Ylang uses OpenResty XRay’s package databases to look up the memory addresses and offsets for variables, composite types' field offsets, entry-points, and return-points of any target functions. And the lookups are usually by symbol names. So it does not require the user to dive into the bloody binary worlds. Nor does it need the target system (often a production system) to carry around debug symbols or symbol tables in their binary files or separate .debug files. This way, we can also work with other debug info formats like CTF, BTF, and even information derived automatically from the binary executables by machine learning algorithms.
Extended Variable Types
For convenience, Ylang extends the C language with variable types usually found in dynamic languages like Perl and Python. Indeed, Ylang borrows some of the notations from the Perl 6 language and SystemTap’s script language, as we will see soon.
Built-in Strings
Ylang has built-in support for strings even though traditional C strings are also supported. Built-in strings are convenient, and many of Ylang’s built-in functions work on built-in strings instead of on C strings (though it’s also possible to convert C strings into built-in strings, even from the tracee space, sometimes even implicitly).
The built-in string type name is _str, and unlike C strings, it records the string length explicitly and allows null characters (\0) in the middle of the payload. Nevertheless, the string data always contains a trailing NIL character for safety (excluded from the string length).
Naturally, built-in strings can only be allocated in the tracer space since it is Ylang’s own data type.
You can use the _str type in user-defined functions as either parameter type or return type, and in tracer-land global and auto variables. Below is an example:
_str foo(_str a) {
    _str b = a + ", world";
    printf("b = %s (len: %d)", b, _len(b));
    return b;
}
Note that we can use the overloaded + operator to do string concatenation of two built-in strings.
To convert a tracee-space C string to a tracer-space built-in string, we can use the Ylang built-in function _tostr(), as in
_target char *p;
...
_str s = _tostr(p);
But the reverse is not possible since the tracee land is read-only by design.
Use of the built-in strings is the best way to do string processing on the tracer land. Ylang provides many built-in functions to operate on built-in strings, like prefix/suffix/regex matching, sub-string extractions, etc.
When Ylang’s user-defined functions use built-in strings as parameters, their function calls always pass the strings by references, and no value copying is involved.
Built-in Aggregates
Aggregate data types are very similar to SystemTap’s statistics data type. Other tracing frameworks like DTrace and Bpftrace also provide something similar. Aggregates provide a very memory and CPU-efficient way to compute on-flight data aggregations and statistics, like computing min, max, average, sum, count, variance, etc. They can also calculate and output histograms for visualizing data value distributions. Below is a simple example:
_agg my_agg;

_probe foo() -> int retval {
    my_agg <<< retval;
}

_probe _timer.s(3) {
    long cnt = _count(my_agg);
    if (cnt == 0) {
        printf("no samples found.\n");
        _exit();
    }
    printf("min/avg/max: %ld/%ld/%ld\n", _min(my_agg), _avg(my_agg), _max(my_agg));
    _print(_hist_log(my_agg));  // print out the logrithmic histogram from my_agg
}
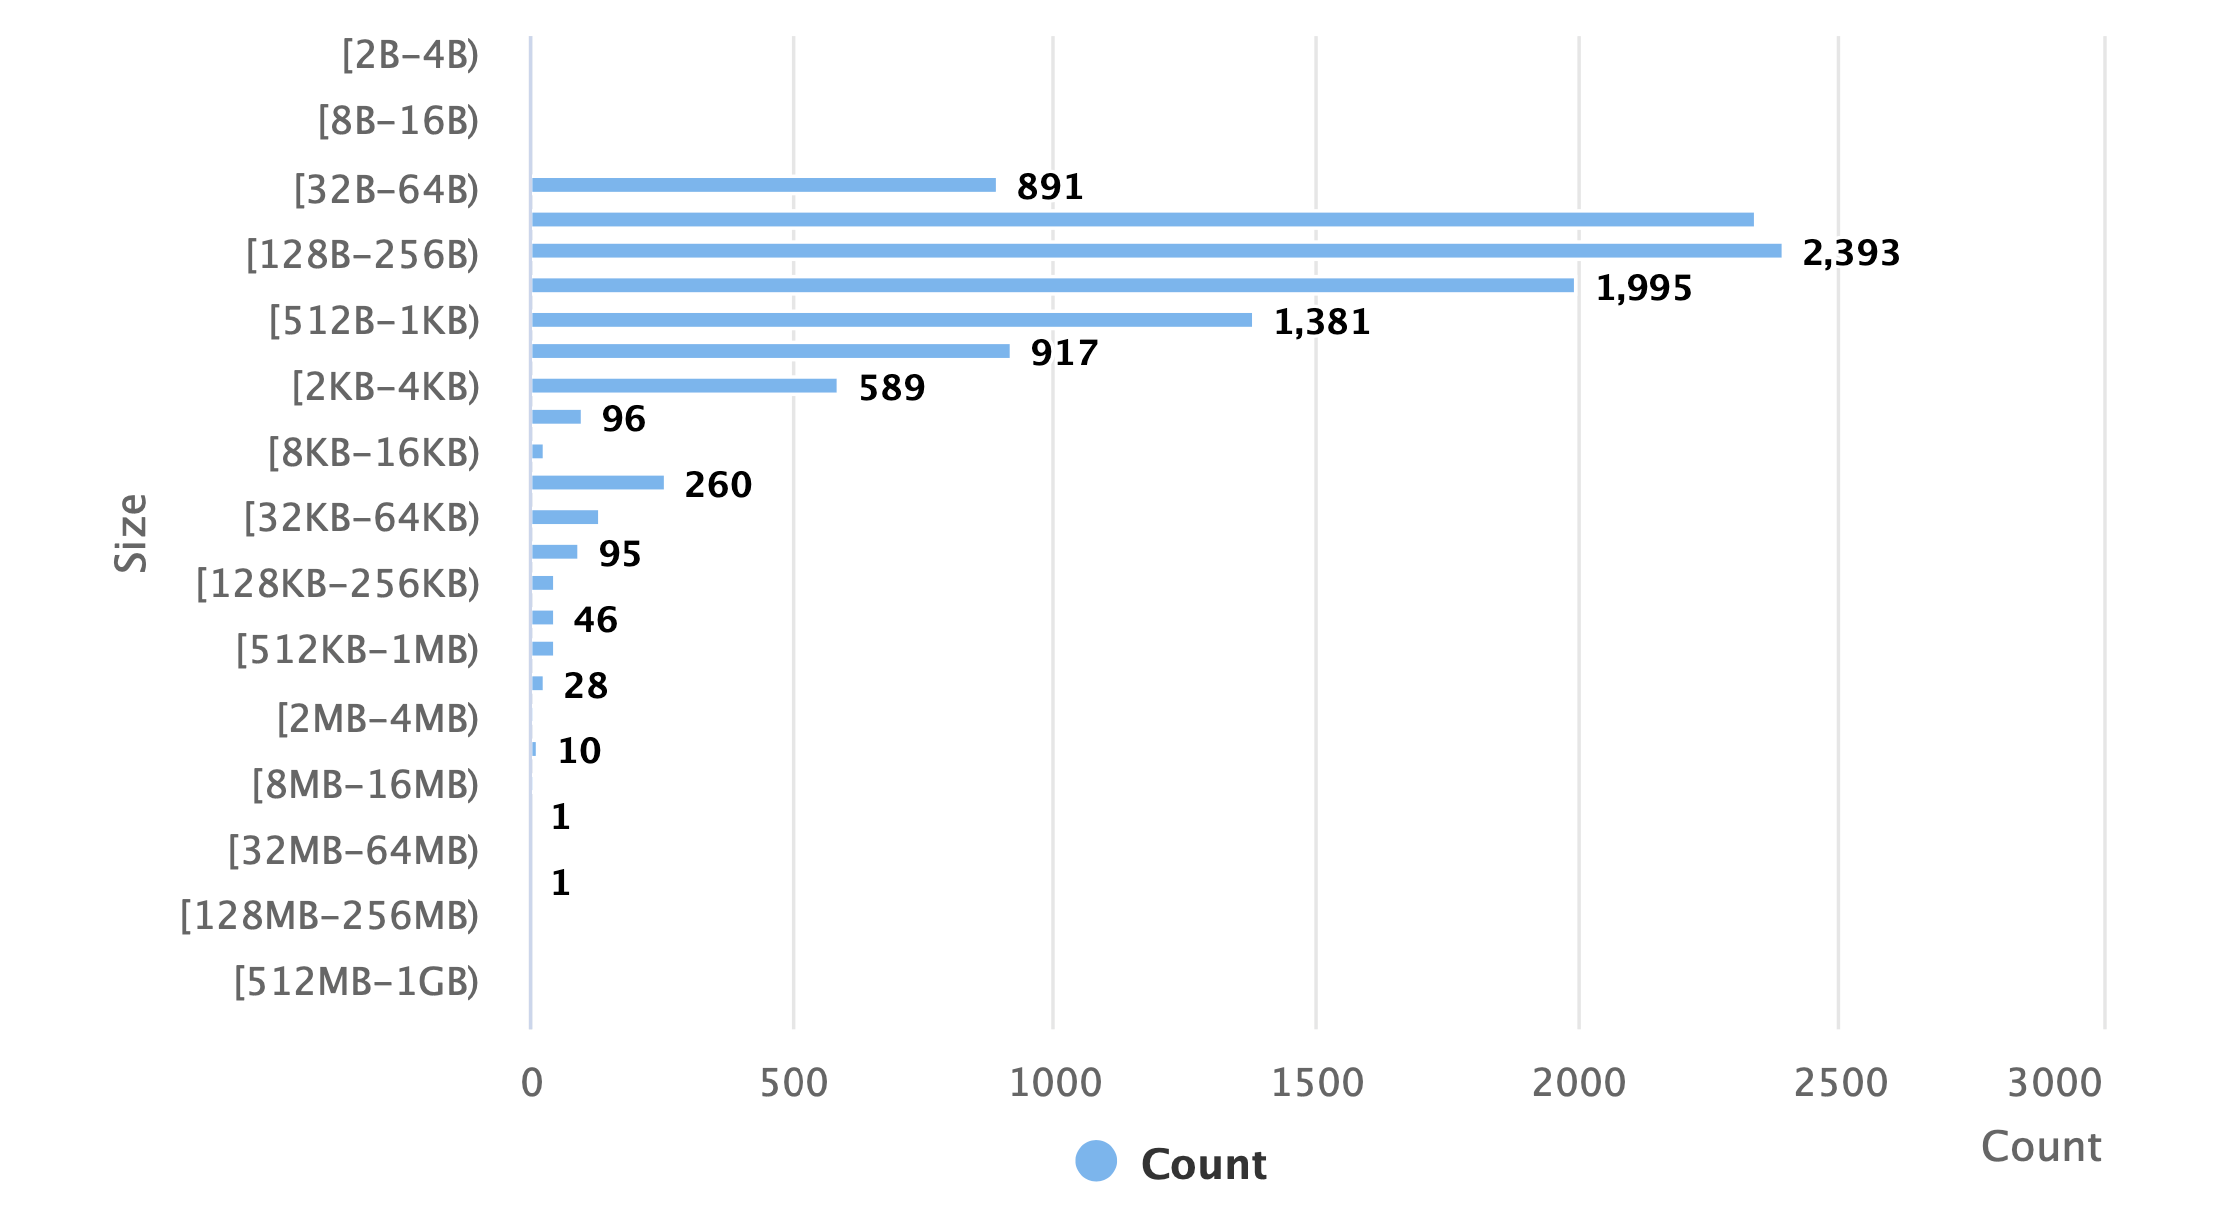
A sample logarithmic histogram is like this:
value |-------------------------------------------------- count
 1024 |                                                   0
 2048 |                                                   0
 4096 |@@@@@@@                                            7
 8192 |@                                                  1
16384 |@@@                                                3
32768 |                                                   0
65536 |                                                   0
65536 |                                                   0
And OpenResty XRay can also automatically render such textual graphs into beautiful web charts like below.
To clear all the data recorded in an aggregate, we can use the _del prefix operator introduced by Ylang:
_del my_agg;
Built-in aggregates can also be passed around via arguments to Ylang’s user-defined functions (but not as return values), as in
void foo(_agg a) {
    // ...
}
Function calls always pass aggregate-typed arguments by references.
Built-in Arrays
Ylang provides a built-in array type for variables. We all know that C arrays are painful to deal with. Built-in array variables all take a sigil @ just as in the Perl 6 language. Below is a quick example:
void foo(void) {
    _str @a;  // define a tracer-land array with the element type _str
    _push(@a, "world");  // append a new _str typed elem to @a
    _unshift(@a, "hello");  // prepend an elem to @a
    printf("array len: %d\n", _elems(@a));  // # of elems in array @a
    printf("a[0]: %s, a[1]: %s", @a[0], @a[1]);  // output the 1st and 2nd elems
}
This example defines an array whose elements are of the built-in string type (_str). We can define arbitrary element types like int, double, pointer types, and even composite types.
You can also remove elements from the beginning or end of a built-in array, as in
int @a;
_push(@a, 32);
_push(@a, 64);
_push(@a, -7);
int v = _pop(@a);  // v gets -7
v = _shift(@a);  // v now gets 32
To iterate through built-in arrays, we can use the classic C for loop statement like this:
_str @arr;
// ...
int len = _elems(@arr);  // cache the array len in a local var
for (int i = 0; i < len; i++) {
    printf("arr[%d]: %s\n", @arr[i]);
}
We can also pass built-in arrays around by user-defined functions' arguments, as in
void foo(int @a) {
    // ...
}
Function calls always pass arguments of the built-in array type by references.
To clear all the elements in an array and reset its length to zero, we can use Ylang’s prefix operator _del, as in
_del @arr;
Built-in Hash Tables
Ylang also provides a built-in hash table type. Like built-in arrays, built-in hash variables take a sigil, but a different one, which is % (just like Perl 6). To declare a hash table with built-in string keys and integer values, we can write something like this:
int %ages{_str};
Both the hash key and values can be of any data type.
To insert a new key-value pair, we can write
%ages{"Tom"} = 32;
To find the value for a key that already exists, we write
int age = %ages{"Bob"};
But if we are unsure if a key exists, we should always use the Ylang prefix operator, _exists to test it first, as in
if (_exists %ages{"Zoe"}) {
    int age = %ages{"Zoe"};
}
We recommend testing the existence of keys when we are unsure. Because 1) some Ylang backends like GDB Python may throw out runtime exceptions when the key does not exist, and 2) some other backends like Stap+ (or SystemTap) may just silently return zero integer or floating-point values in such cases.
We can also pass built-in hash tables around by user-defined functions' arguments, as in
void foo(int %a{_str}) {
    // ...
}
Function calls always pass arguments of the built-in hash table type by references.
To delete a key from a hash table, we can use Ylang’s _del operator, as in
_del %my_hash{my_key};
or clear the whole hash table without specifying the key part:
_del %my_hash;
To iterate through a built-in hash table, we can use the special _foreach loop statement, as in
_foreach %my_hash -> _str name, int age {
    printf("%s: %d\n", name, age);
}
Perl 6 users should find this loop construct familiar. We borrowed its syntax here.
To Be Continued
It is all I’d like to cover in Part 2. I have to pause here. Starting from Part 3, we will continue introducing more features and advantages of Ylang.
About The Author
Yichun Zhang (Github handle: agentzh), is the original creator of the OpenResty® open-source project and the CEO of OpenResty Inc..
Yichun is one of the earliest advocates and leaders of “open-source technology”. He worked at many internationally renowned tech companies, such as Cloudflare, Yahoo!. He is a pioneer of “edge computing”, “dynamic tracing” and “machine coding”, with over 22 years of programming and 16 years of open source experience. Yichun is well-known in the open-source space as the project leader of OpenResty®, adopted by more than 40 million global website domains.
OpenResty Inc., the enterprise software start-up founded by Yichun in 2017, has customers from some of the biggest companies in the world. Its flagship product, OpenResty XRay, is a non-invasive profiling and troubleshooting tool that significantly enhances and utilizes dynamic tracing technology. And its OpenResty Edge product is a powerful distributed traffic management and private CDN software product.
As an avid open-source contributor, Yichun has contributed more than a million lines of code to numerous open-source projects, including Linux kernel, Nginx, LuaJIT, GDB, SystemTap, LLVM, Perl, etc. He has also authored more than 60 open-source software libraries.
Related Articles
OpenResty XRay Dec 31, 2021

OpenResty XRay Dec 28, 2021

OpenResty XRay Nov 12, 2021

OpenResty XRay Apr 4, 2024

OpenResty XRay Nov 24, 2023
")


")
")
")


")