OpenResty XRay Web Console: Insights, Dashboards & Guided Root-Cause Analysis
The OpenResty XRay web console is the browser-based UI for monitoring and troubleshooting running applications — non-invasively, without changing a line of their code. It has four areas: Insights auto-generates daily and weekly analysis reports (in this tour, one OpenResty app surfaced 12 CPU-related issues); the Dashboard streams real-time CPU and memory metrics; Guided Analysis runs on-demand root-cause diagnosis and produces flame graphs; and Settings manages your agents. This walkthrough tours each one, using the OpenResty XRay Web Console for real-time monitoring and management. The same features are also available on your phone — see OpenResty XRay Mobile Apps: Monitor and Troubleshoot Your Apps from Android & iOS.
What does the OpenResty XRay Insights page show?
The Insights page of the OpenResty XRay Web Console shows the analysis reports XRay automatically generates for all your apps across all of your servers.
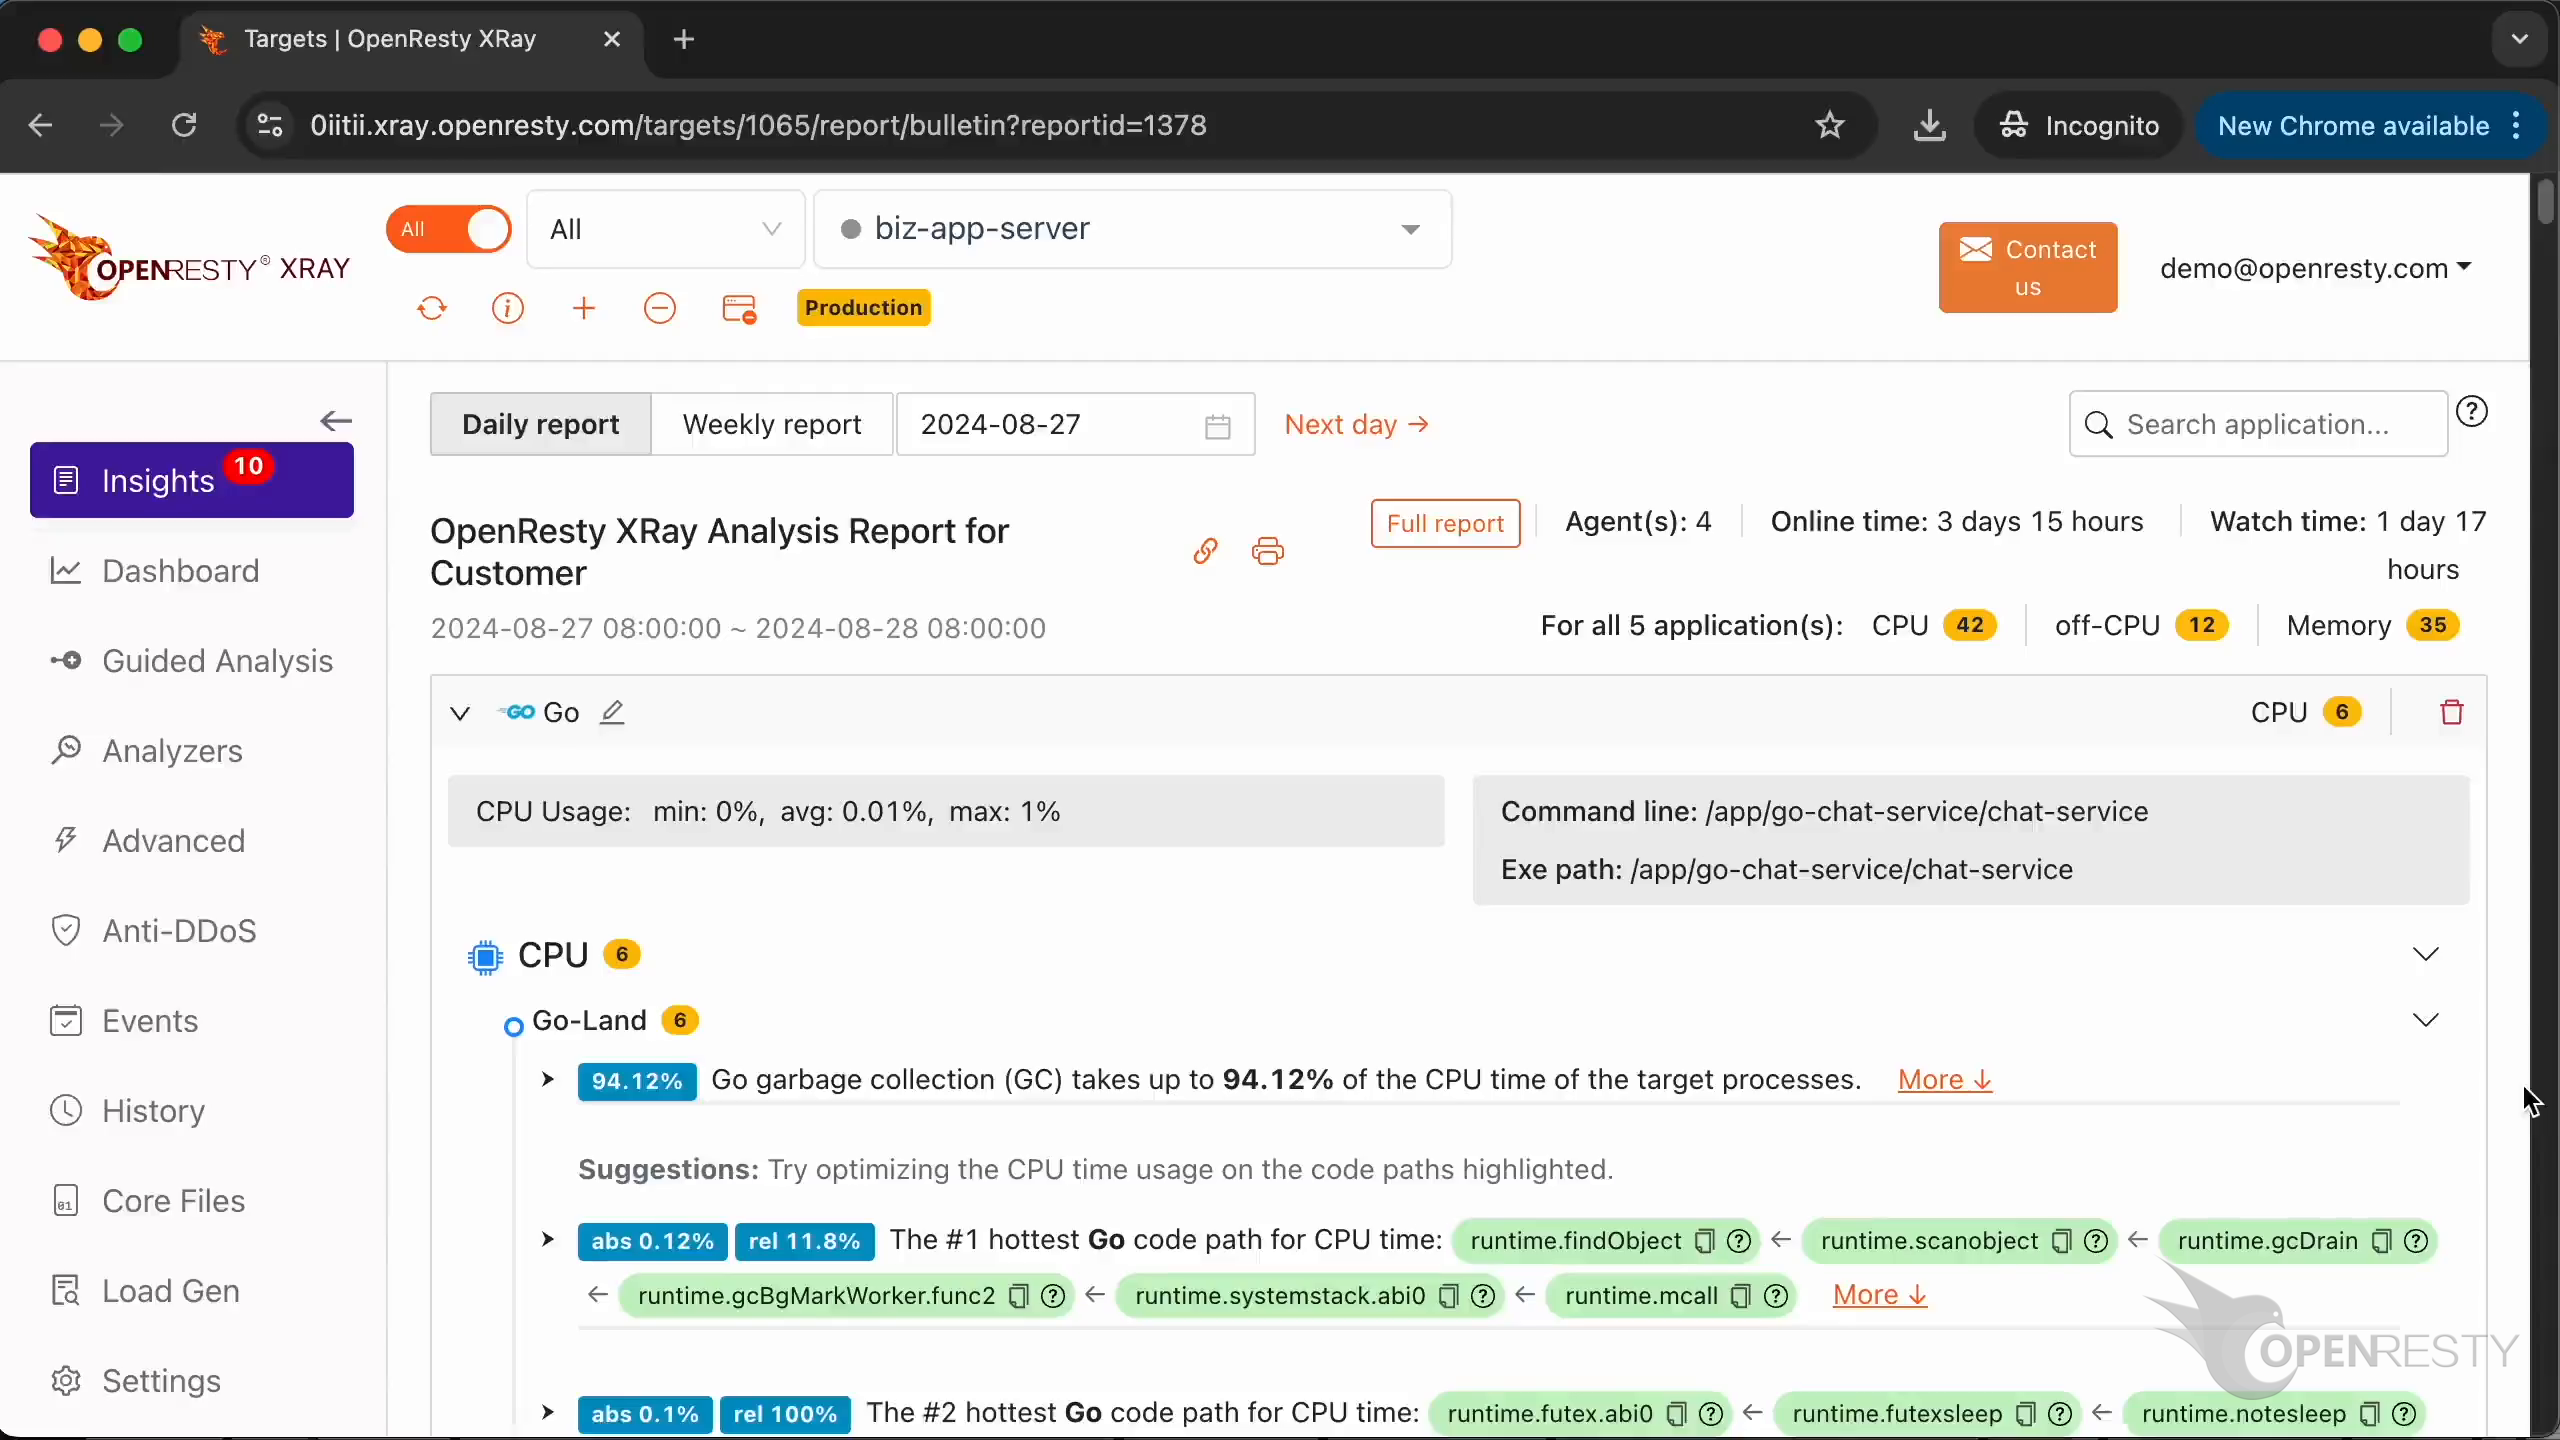
You can find the reports for daily and weekly periods. By default, it displays today’s daily report. It can also show weekly reports.
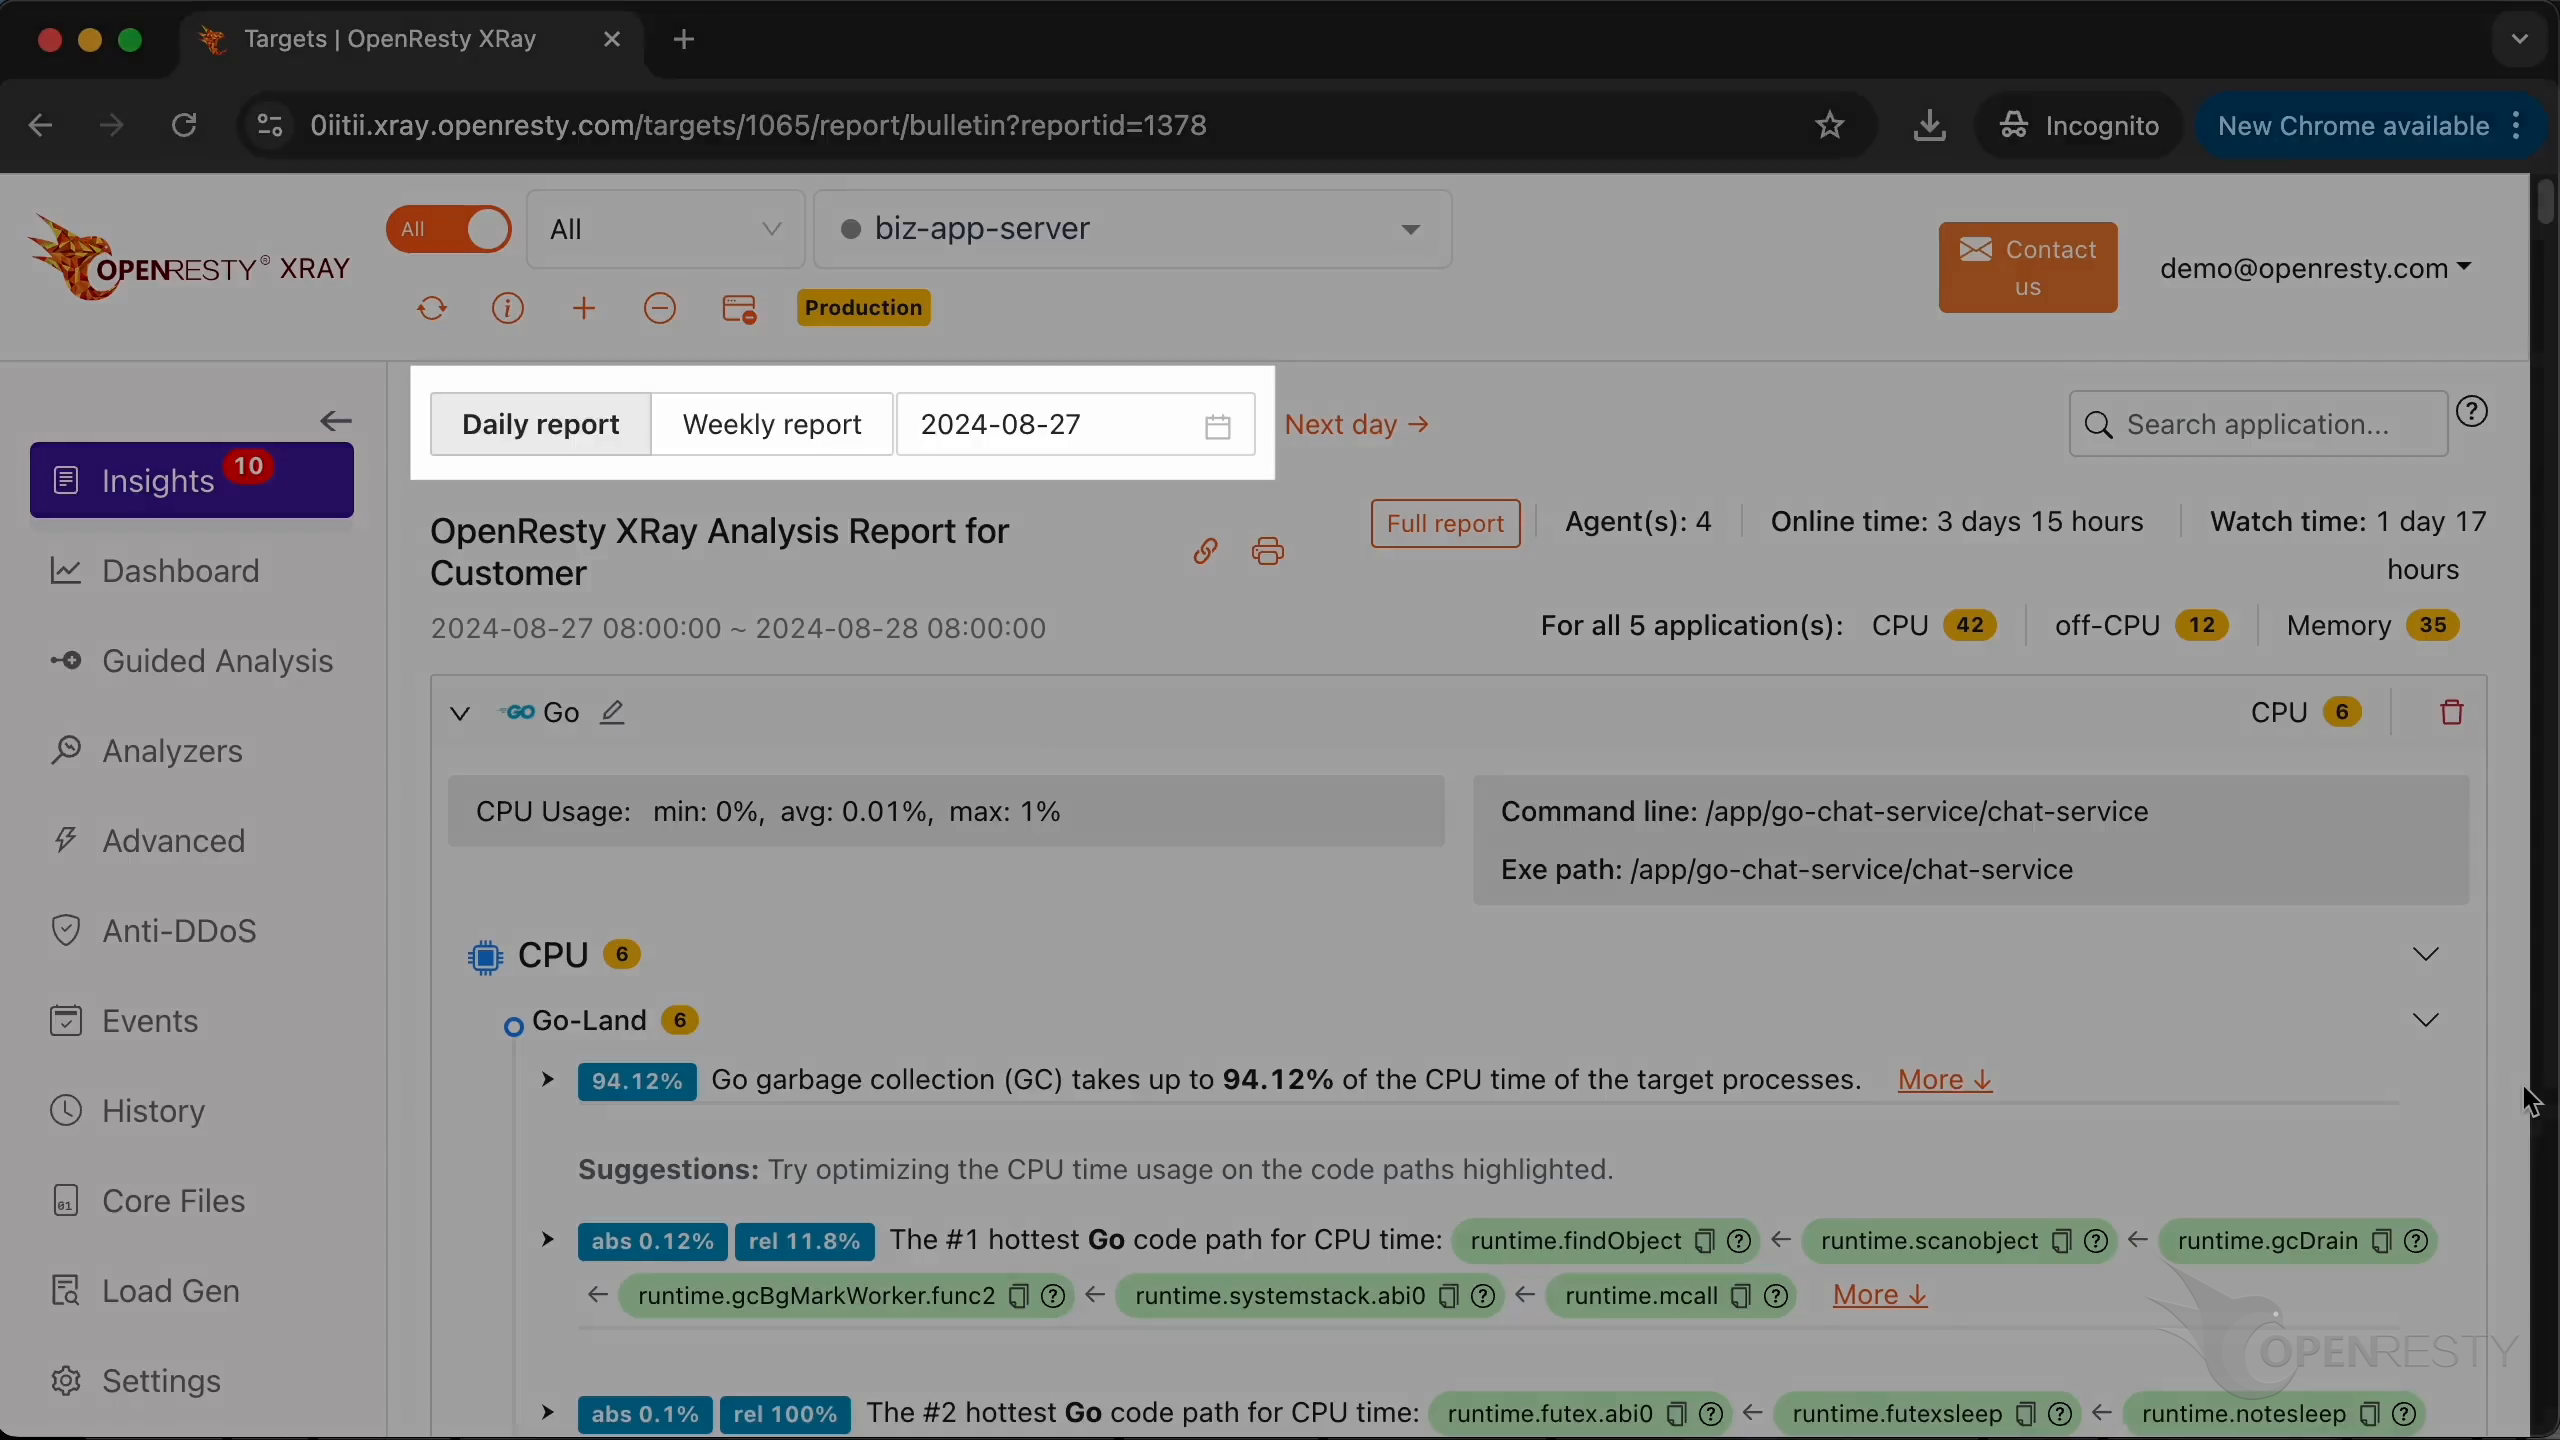
Click to fold the details of these applications.
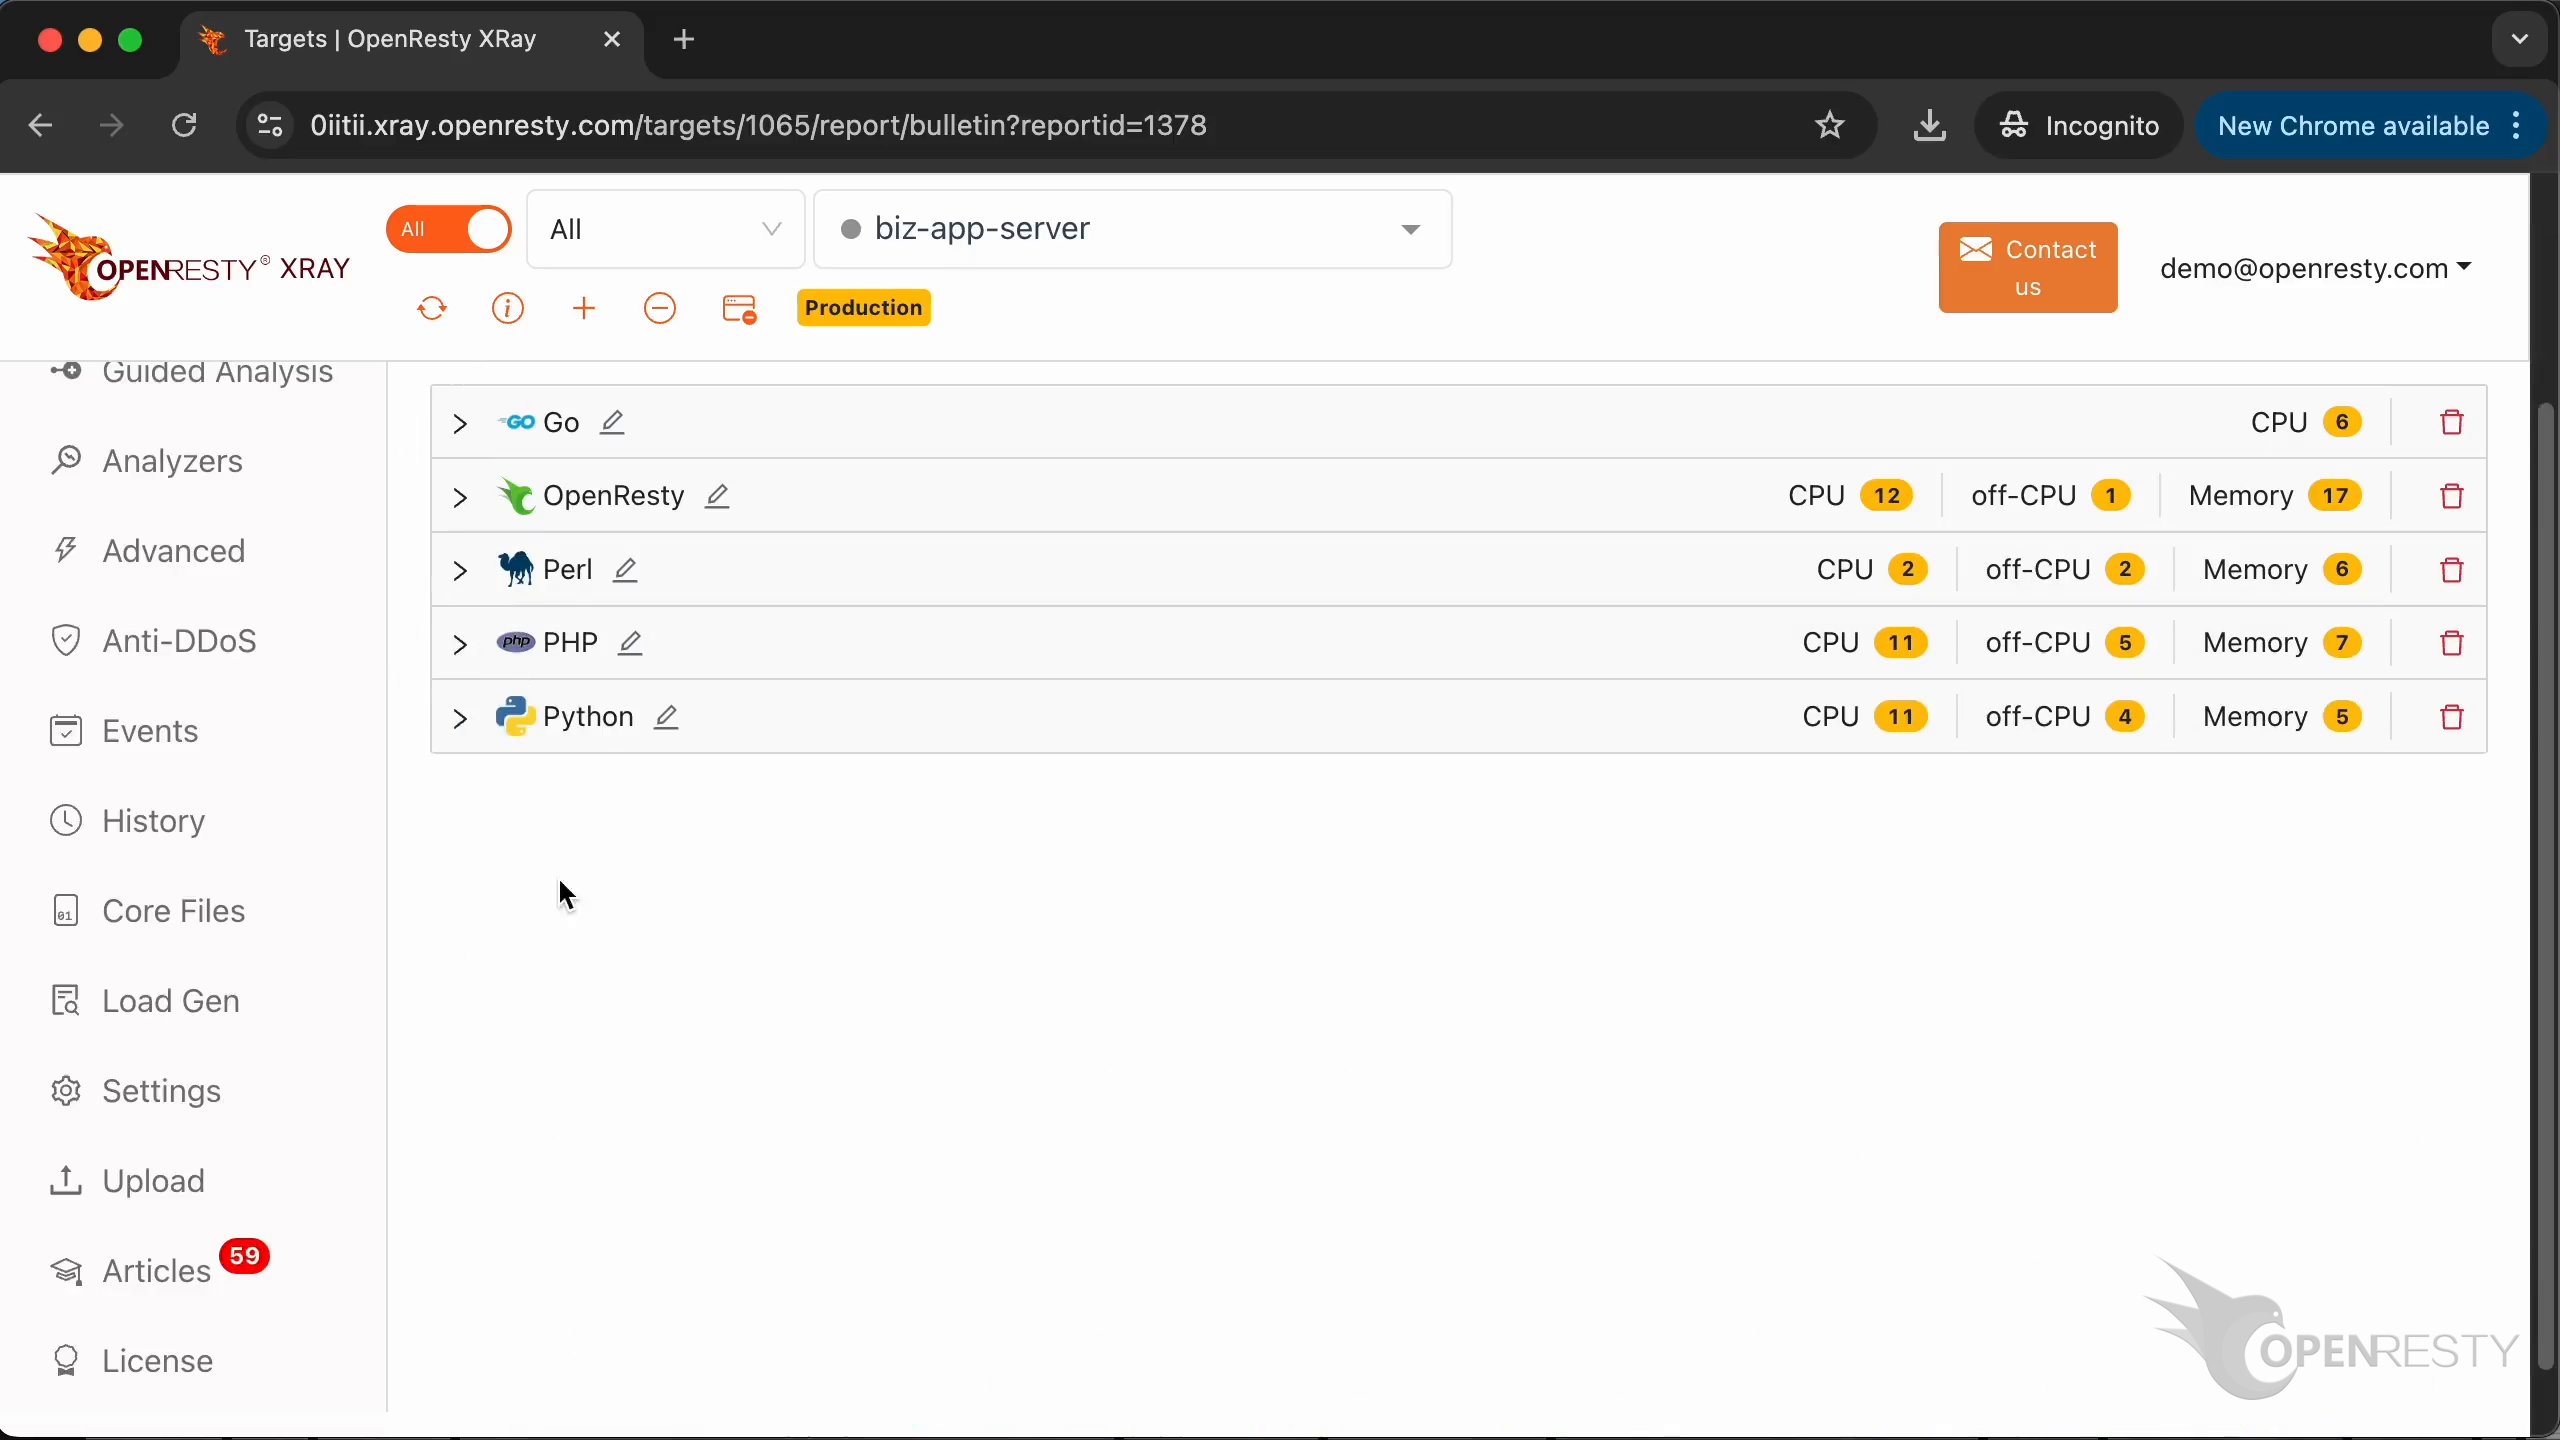
As shown, OpenResty XRay can analyze a wide variety of applications.
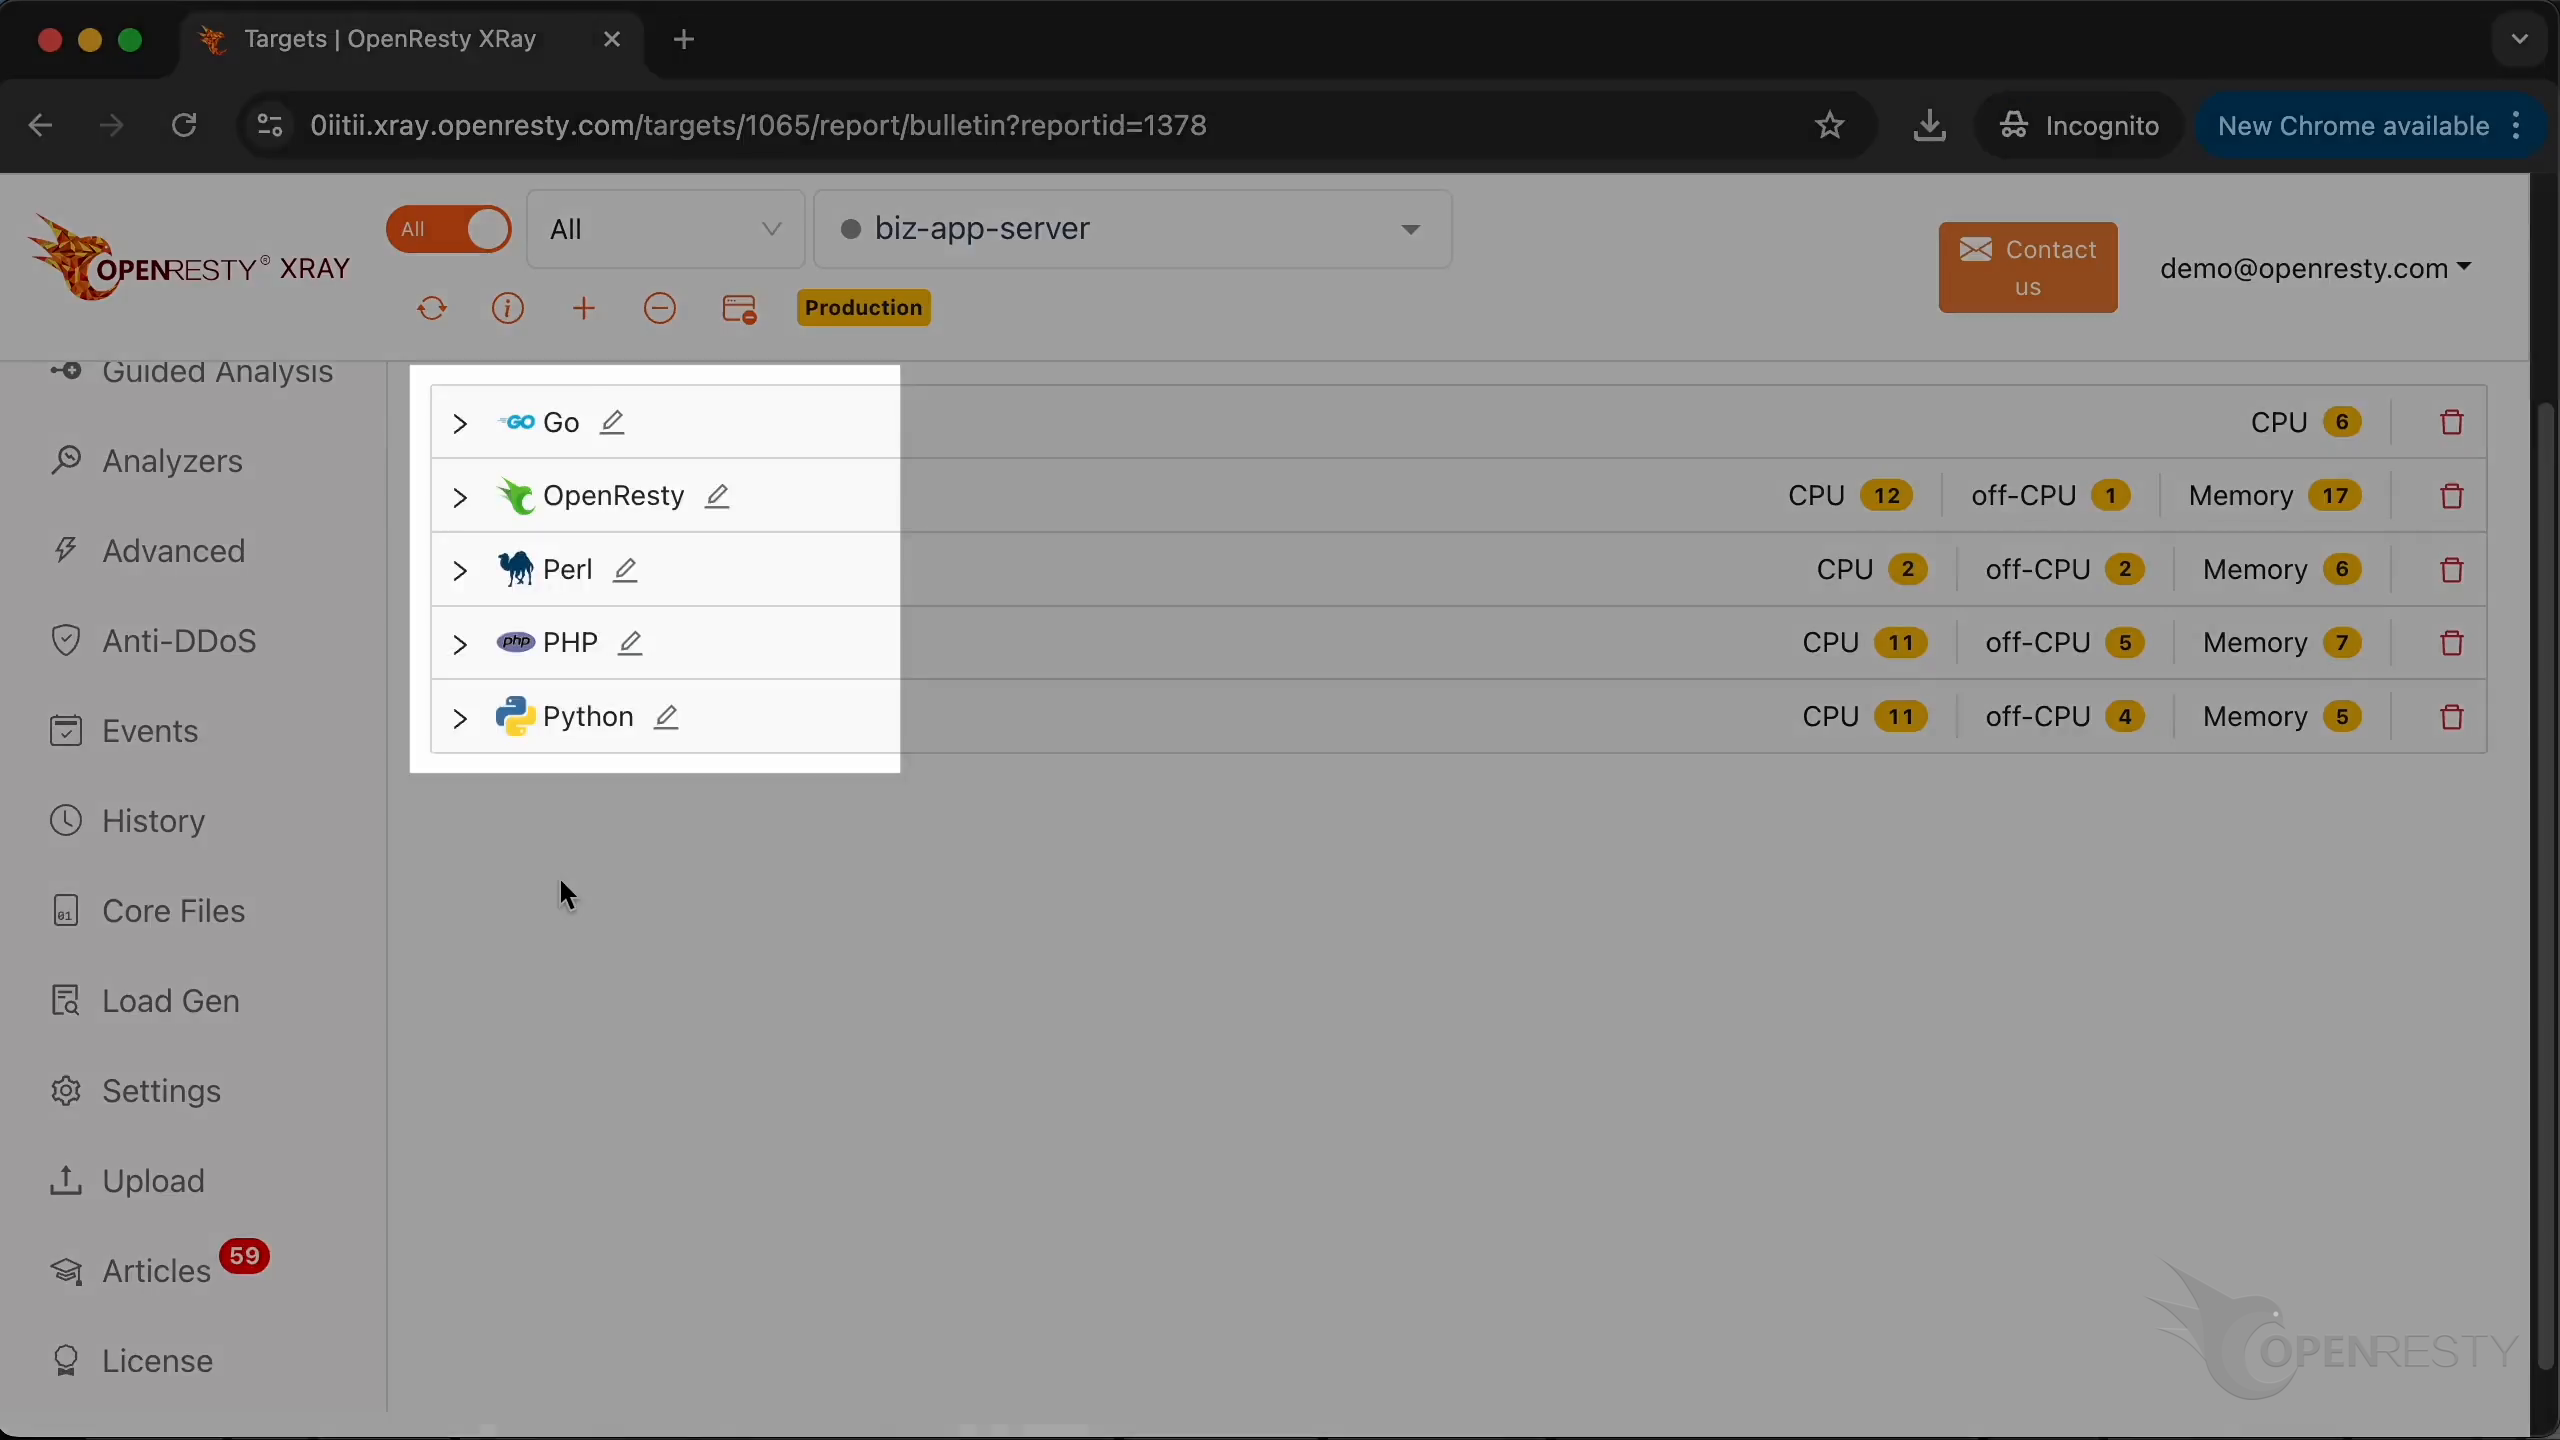
Unfold the “OpenResty” application.
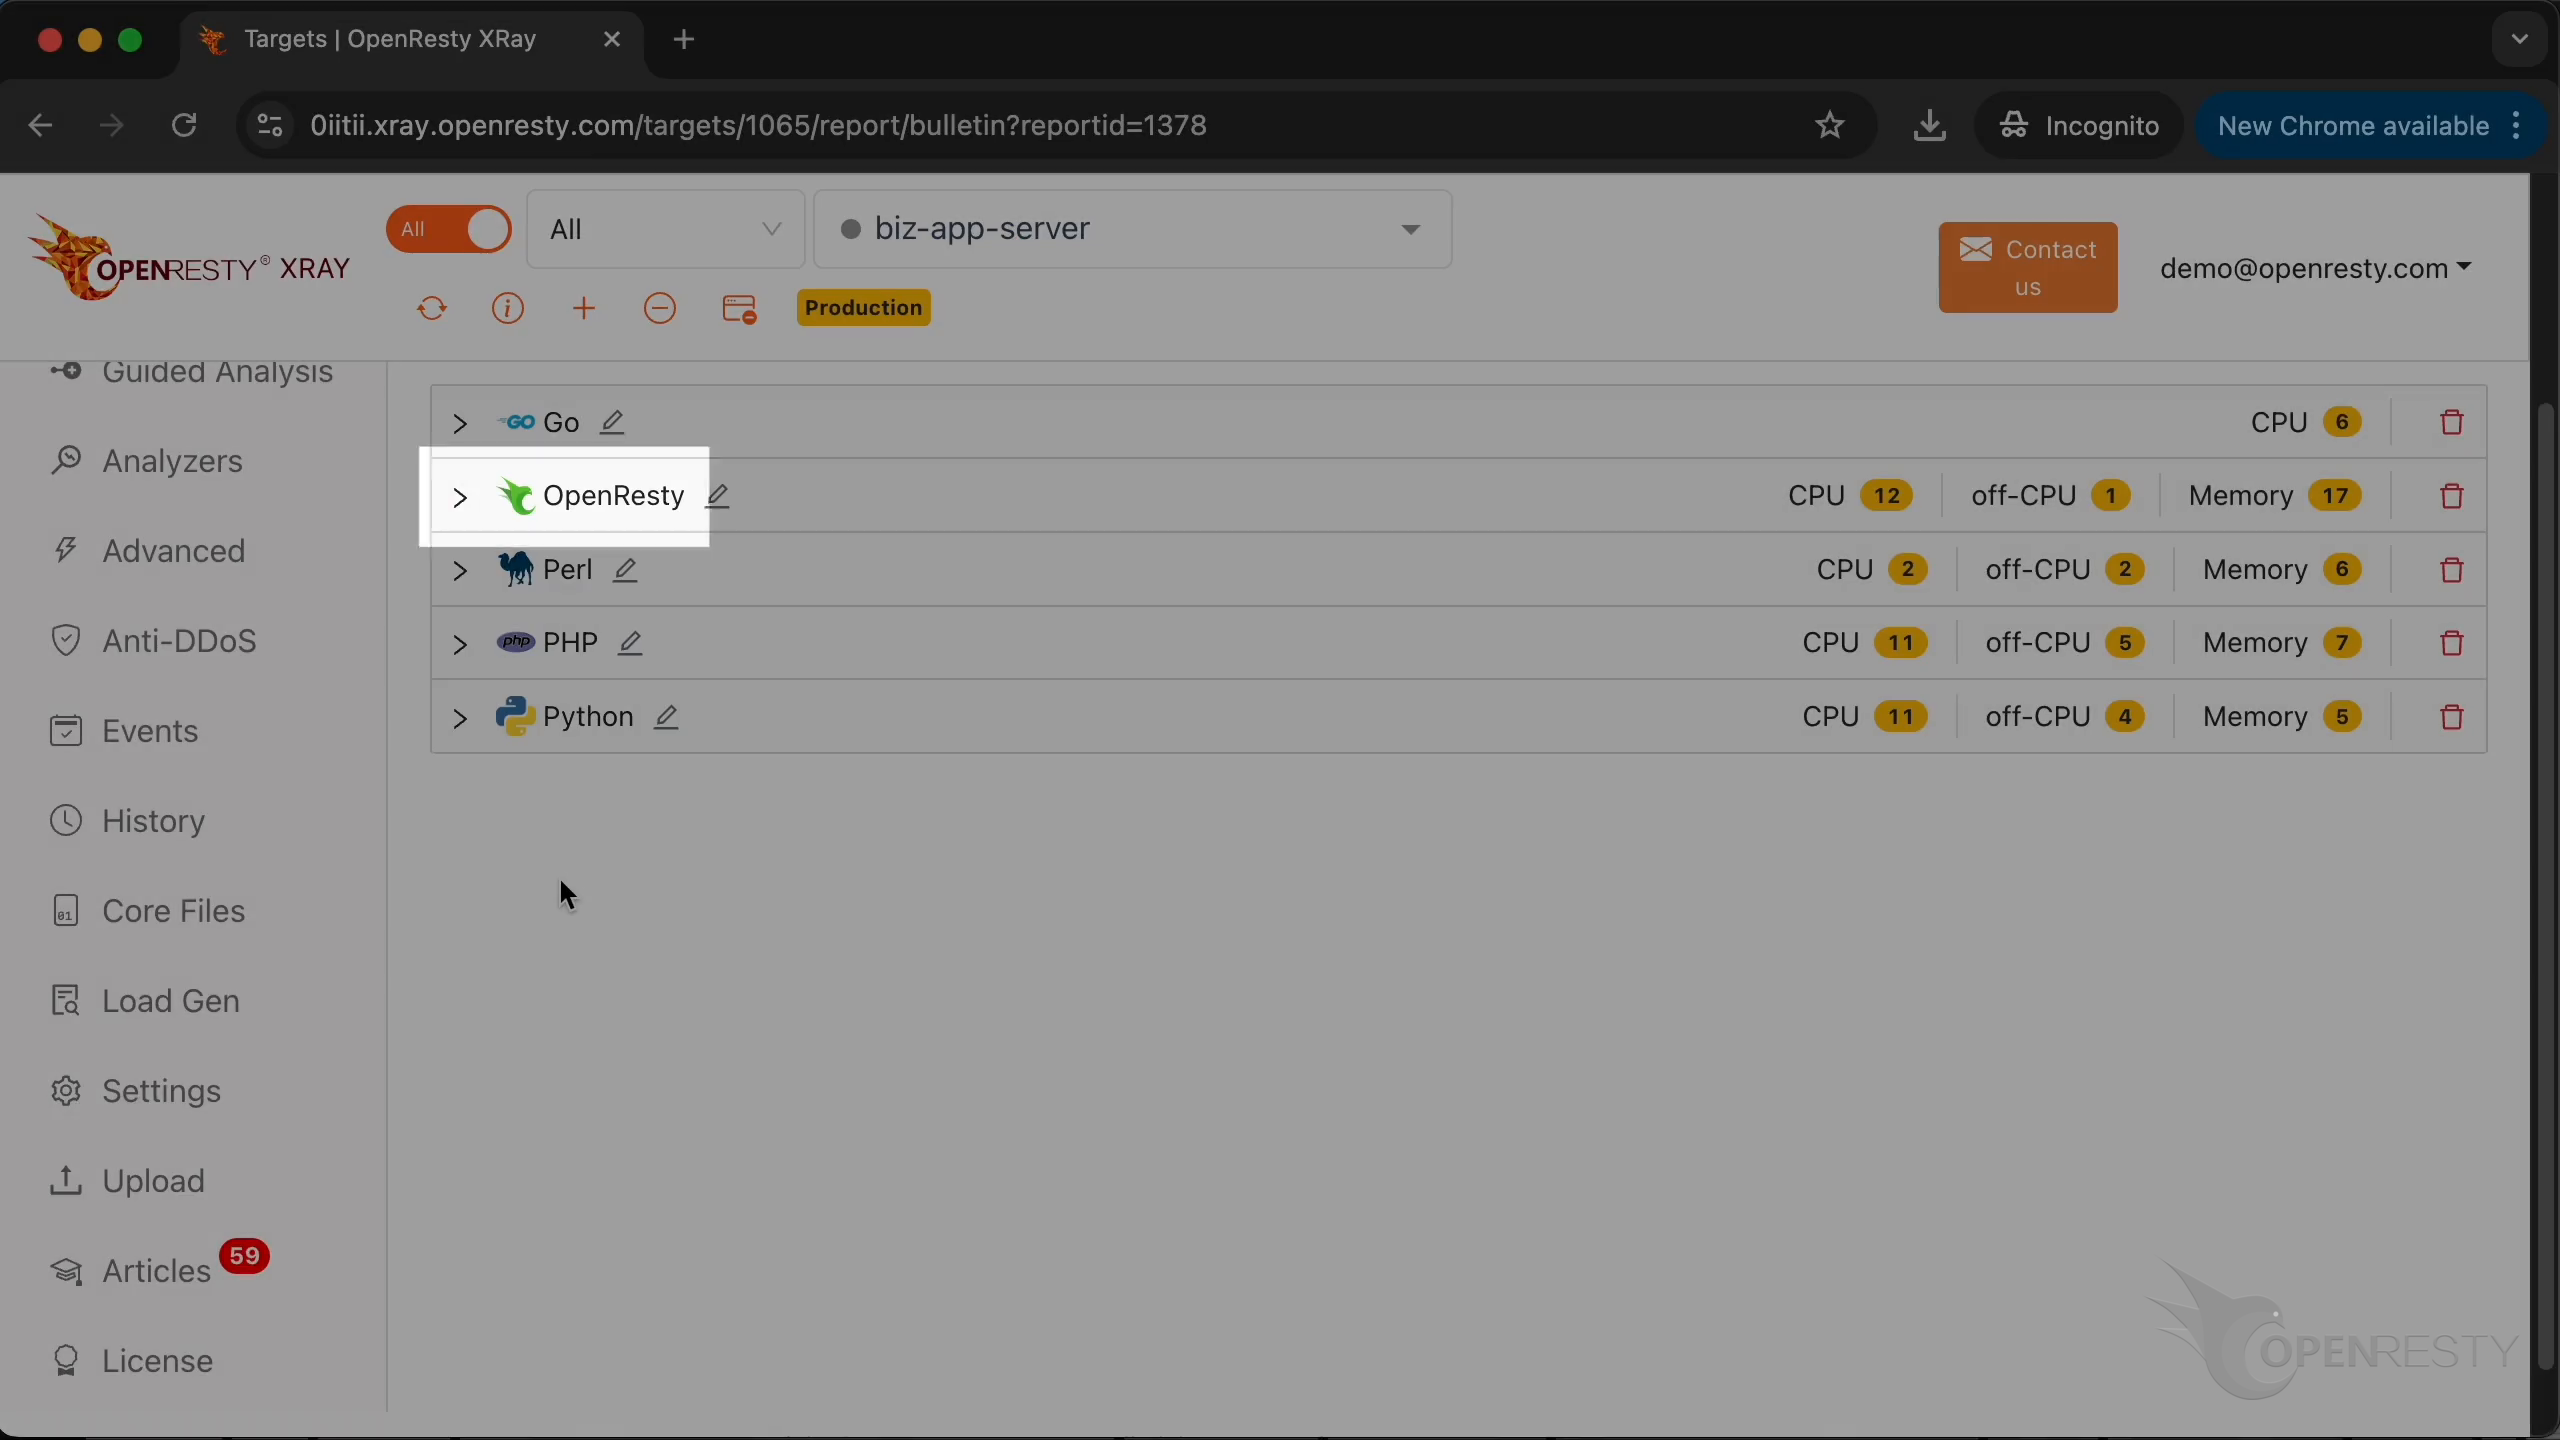
Tap on category titles to unfold the list of issues.
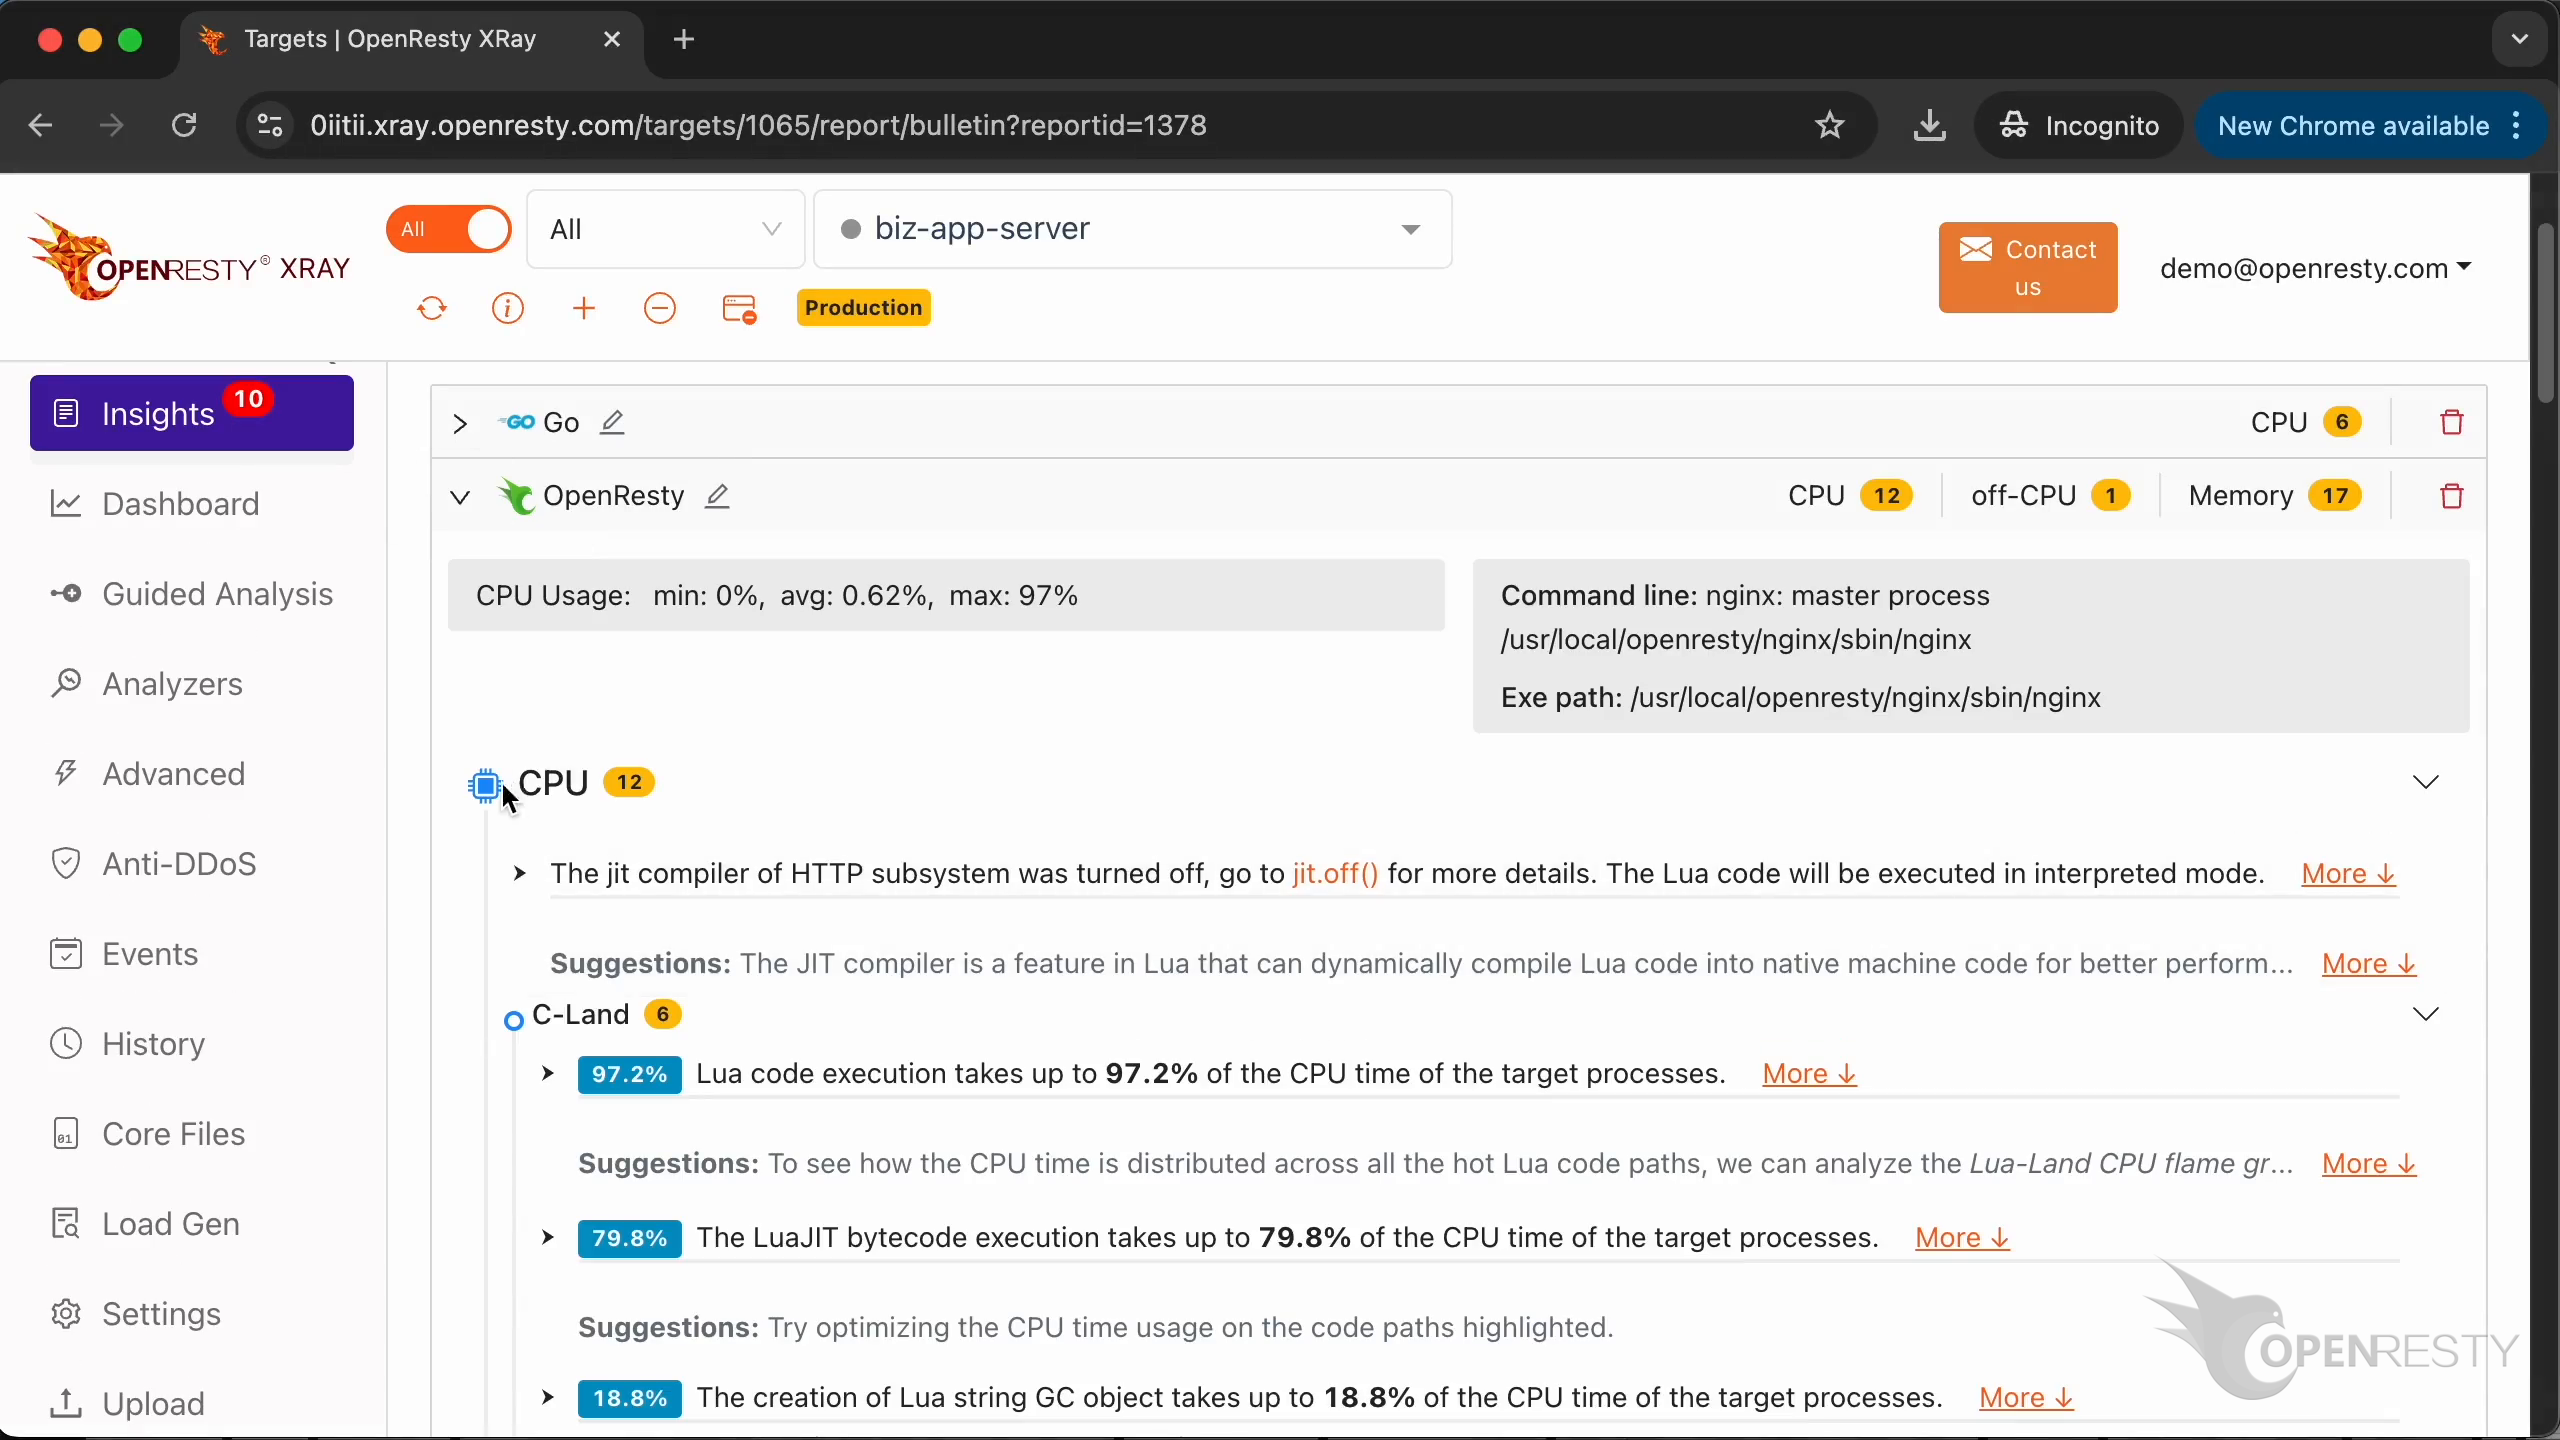
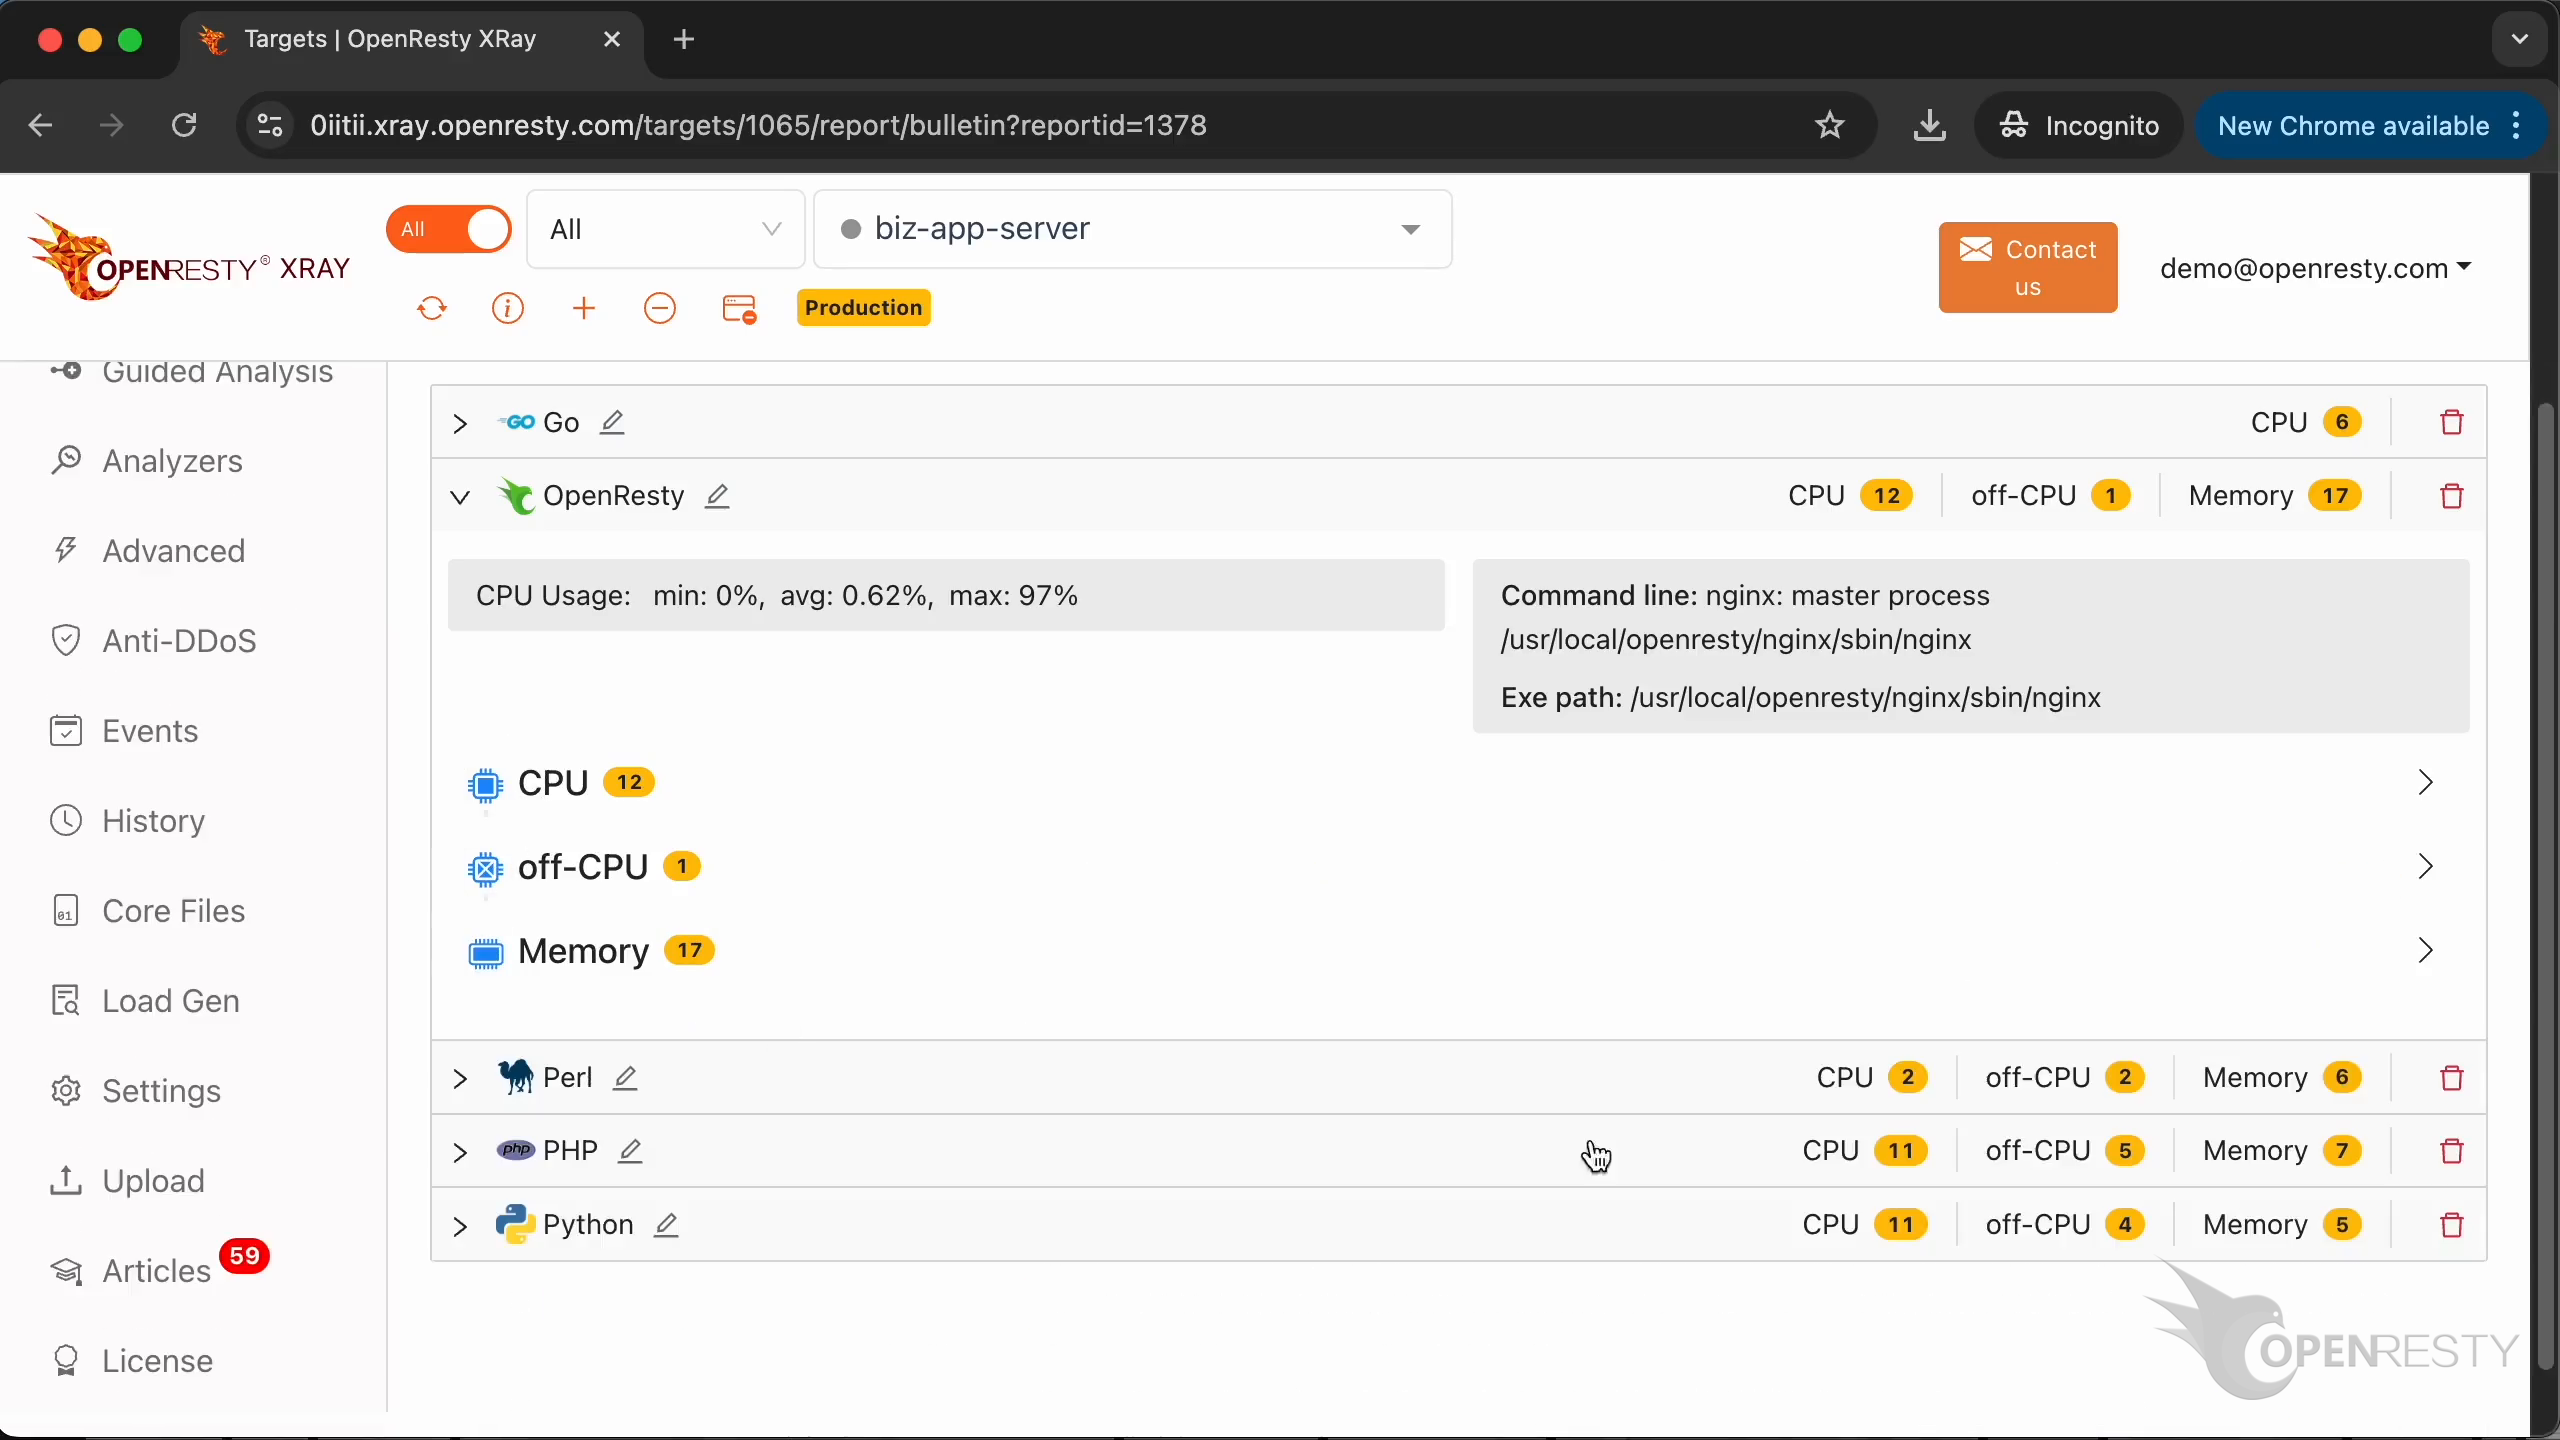
Issues were categorized by type, making it easy to find the ones you’re interested in. The number following represents the number of issues found of that type.
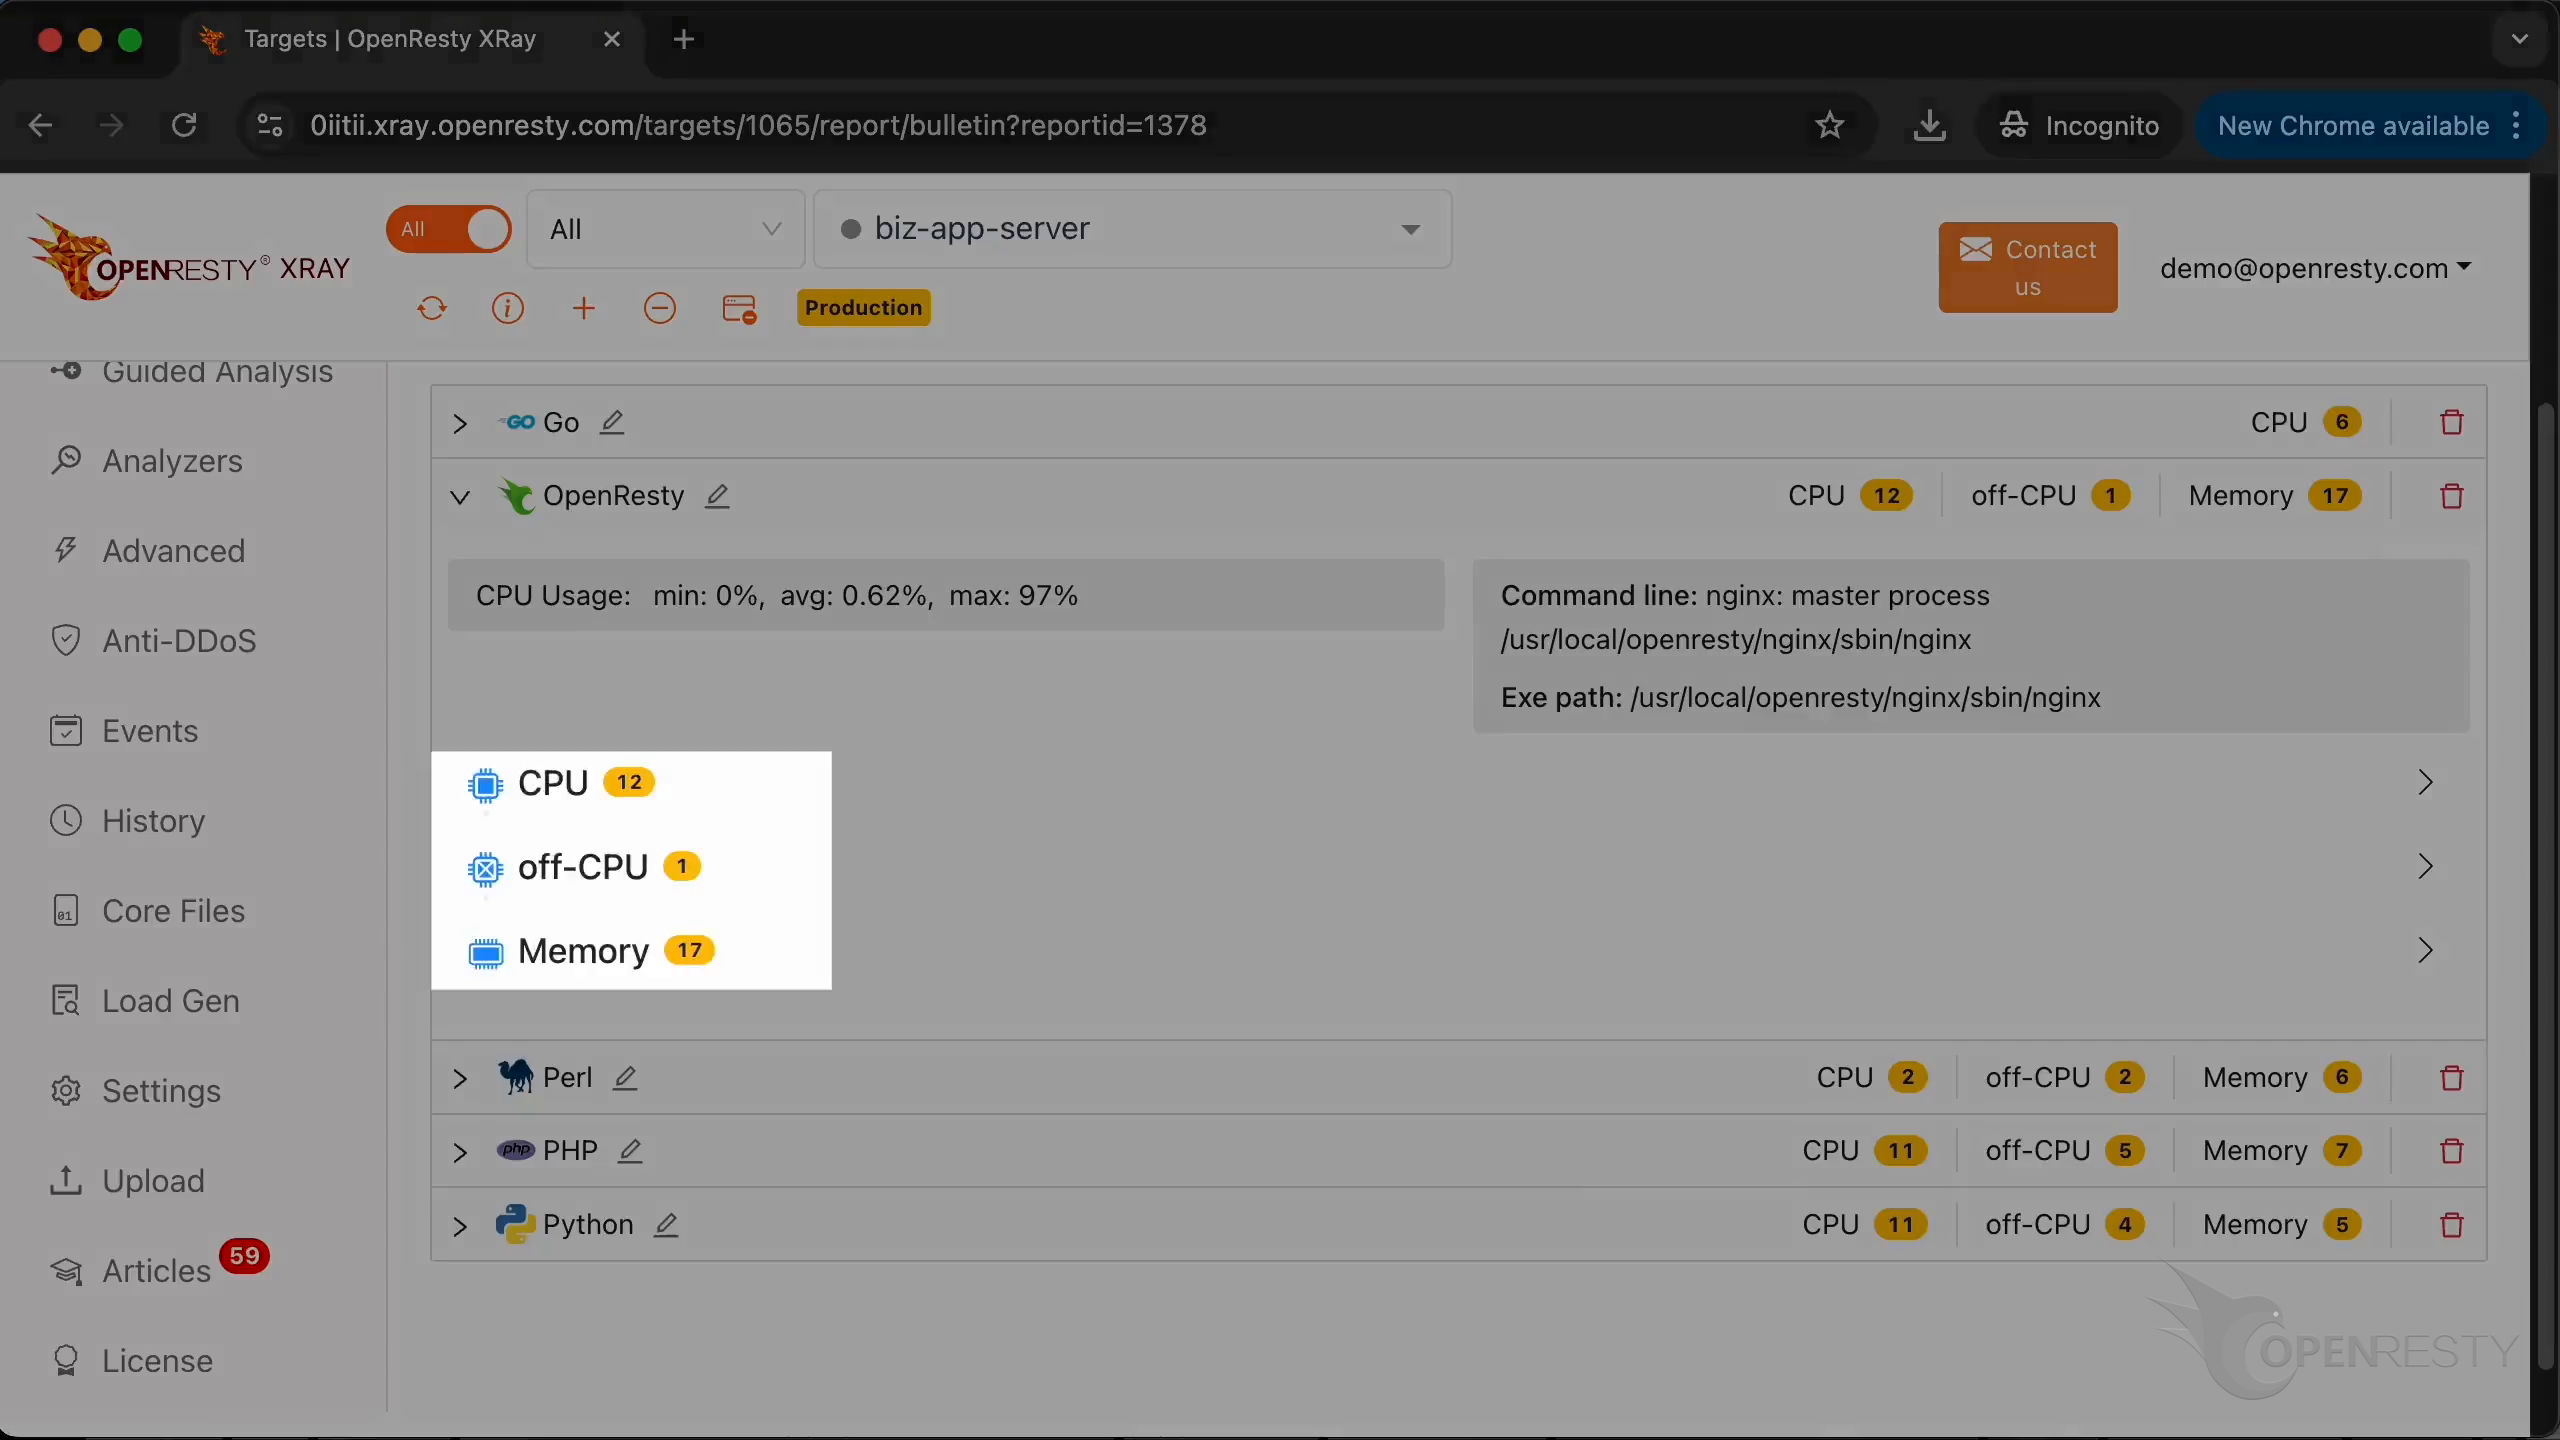
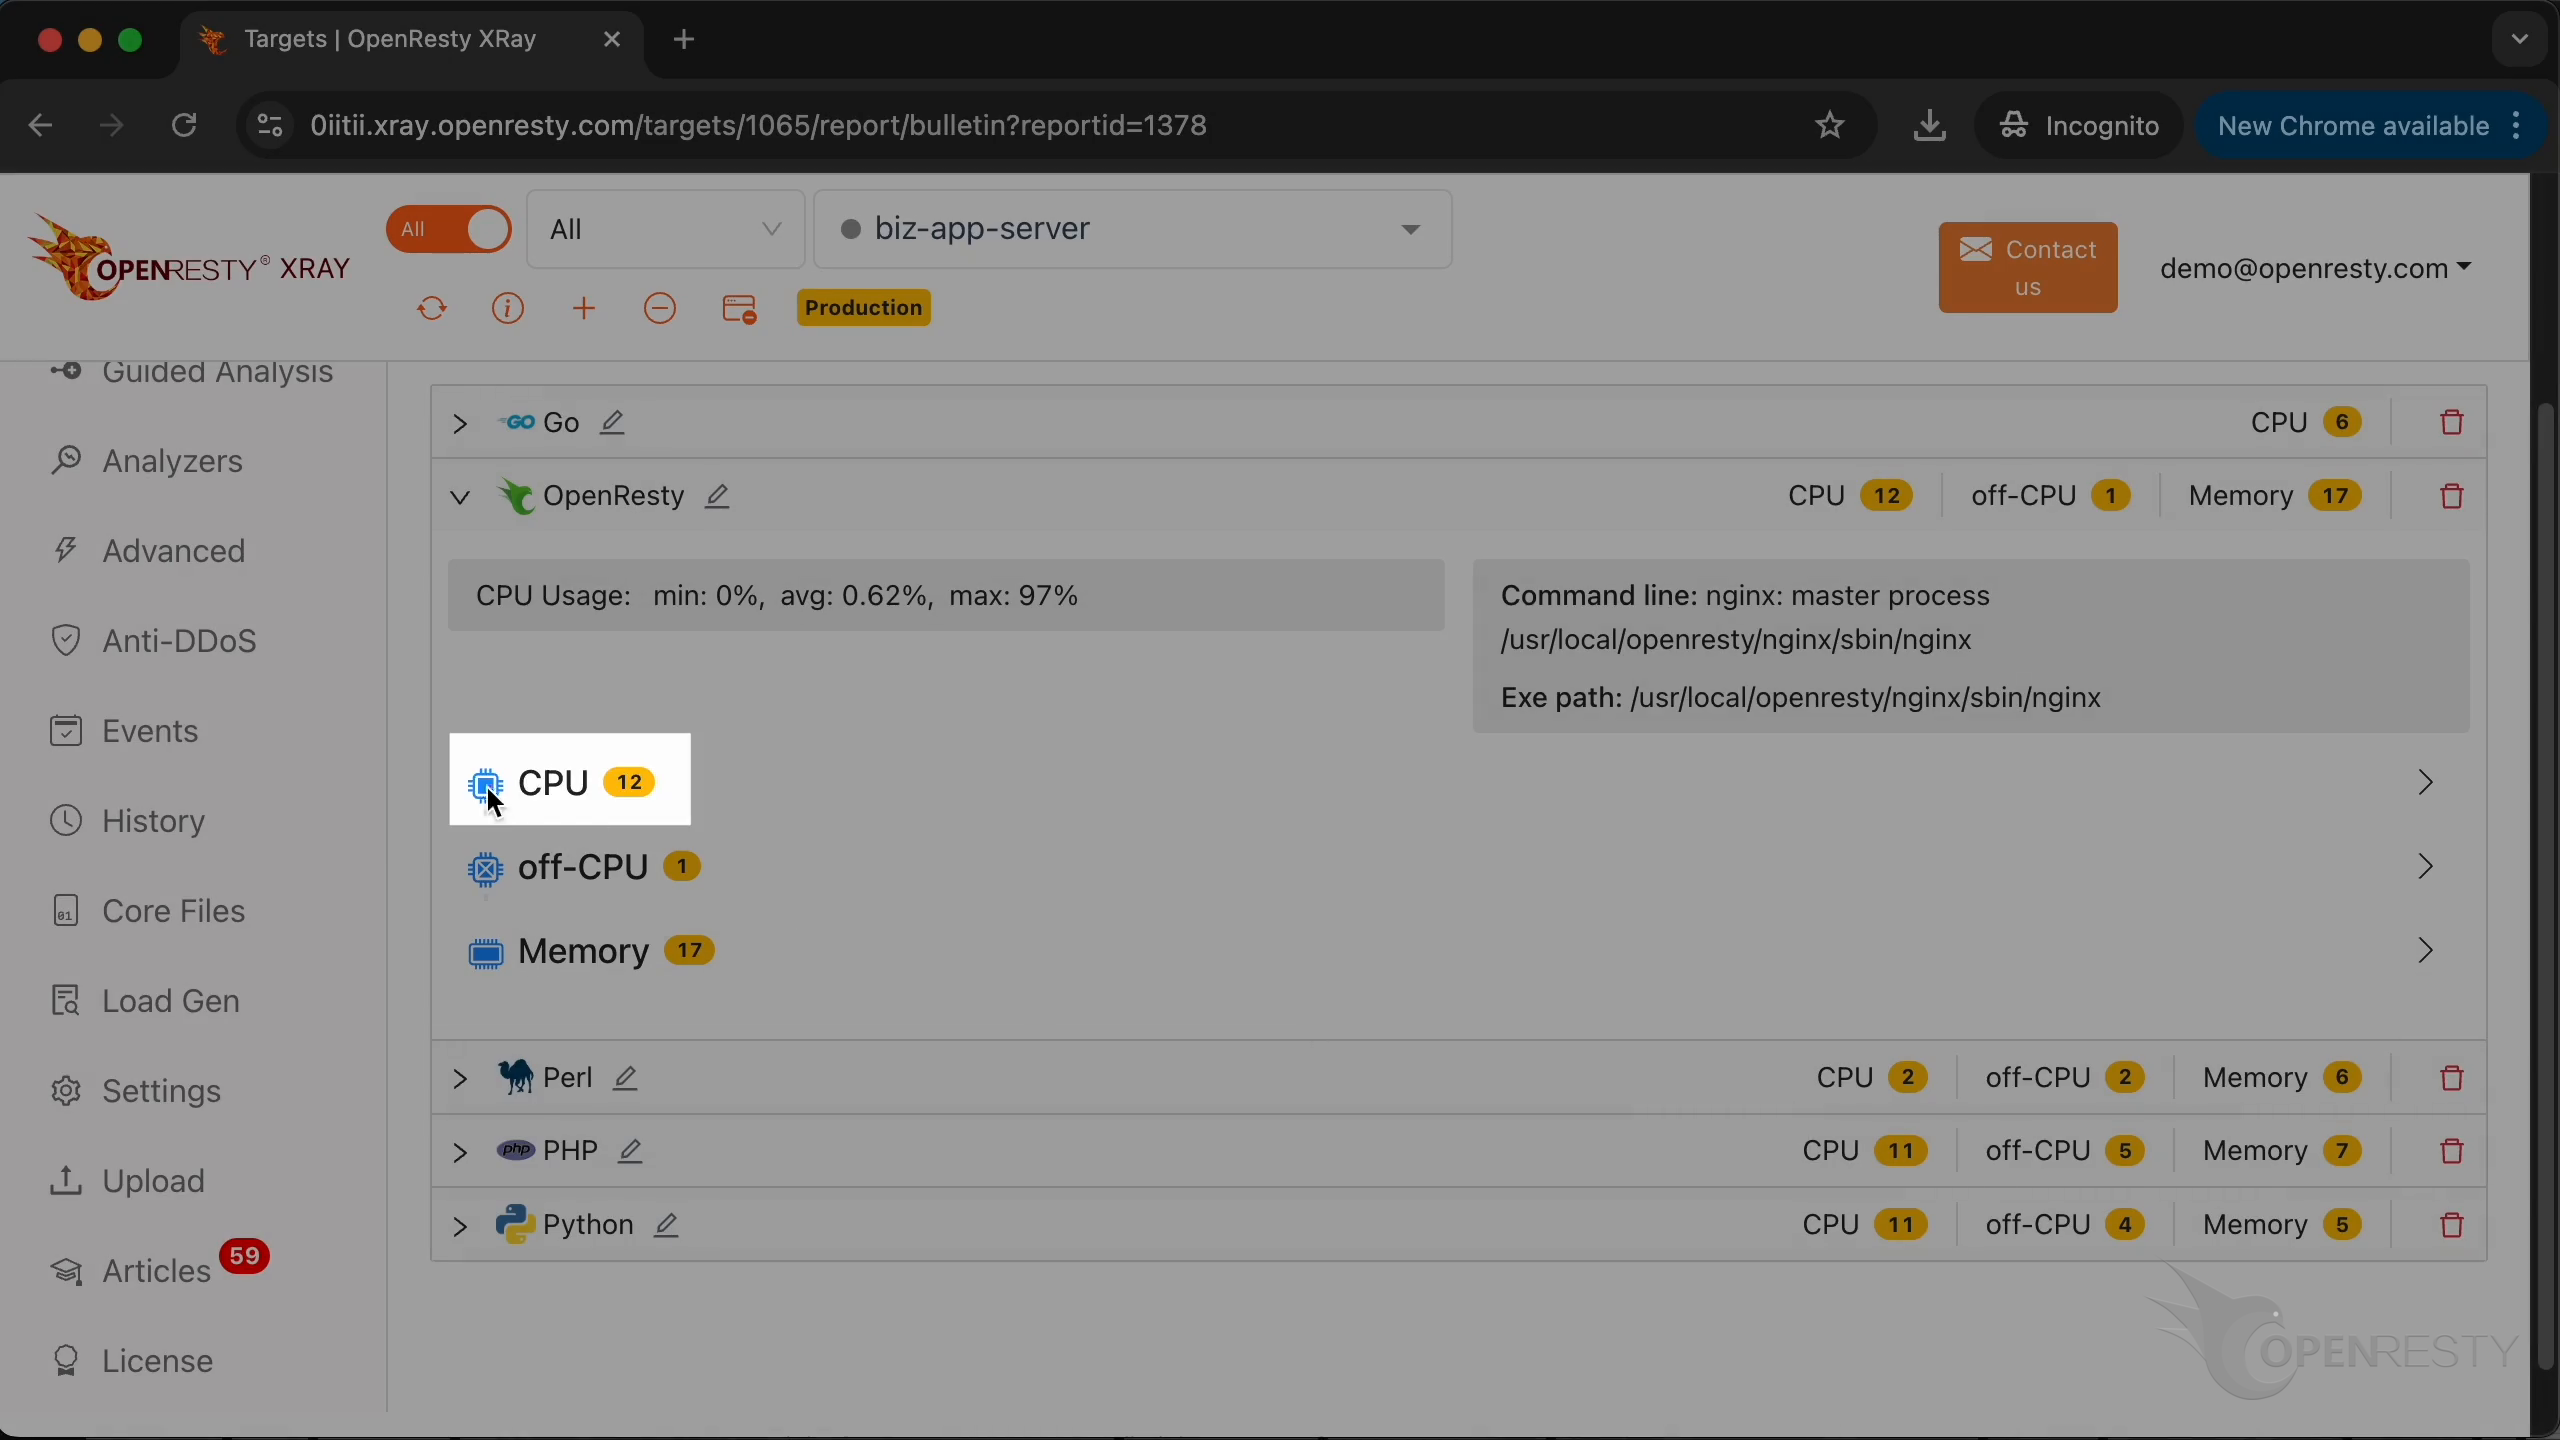
Let’s check out the CPU issues in this OpenResty application. It lists 12 issues below, all related to “CPU”.
How do you read an OpenResty XRay analysis report?
To read an OpenResty XRay analysis report, open any issue and click More — the report centers on a flame graph that pinpoints the hot code path, followed by plain-language explanations and fix suggestions. To view detailed information for a specific issue in the issue list,
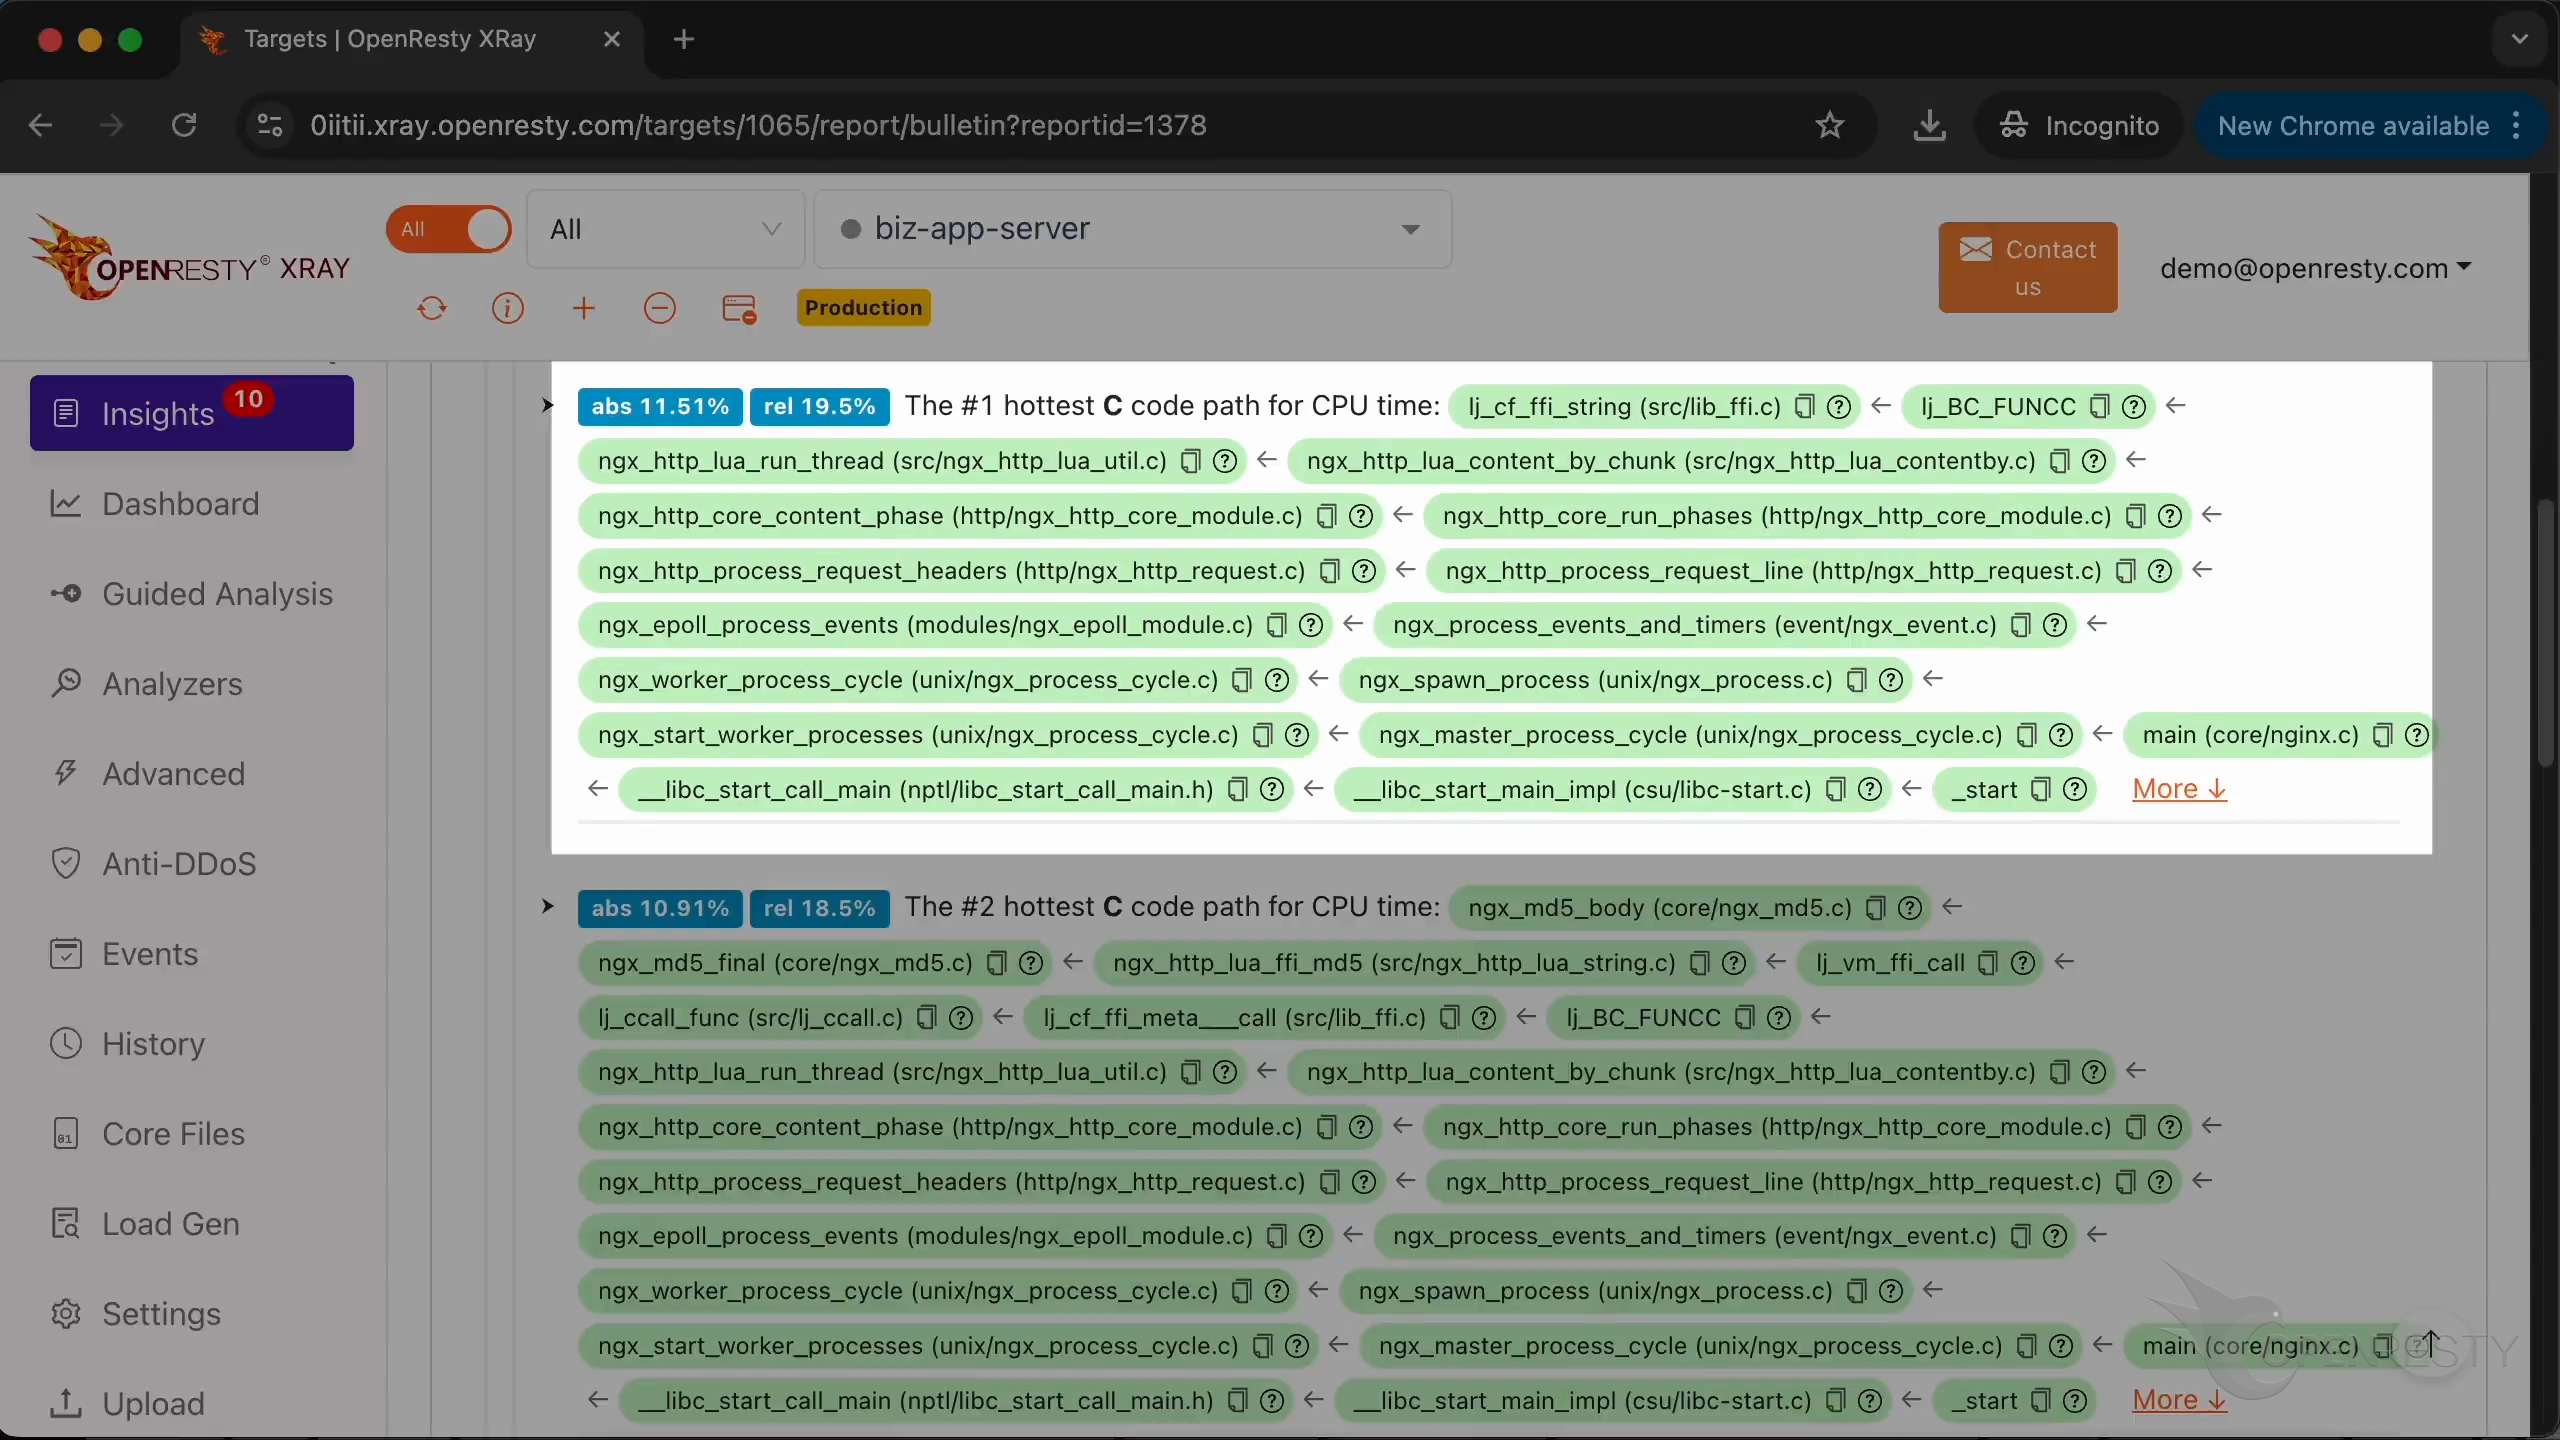
just click on “More”.
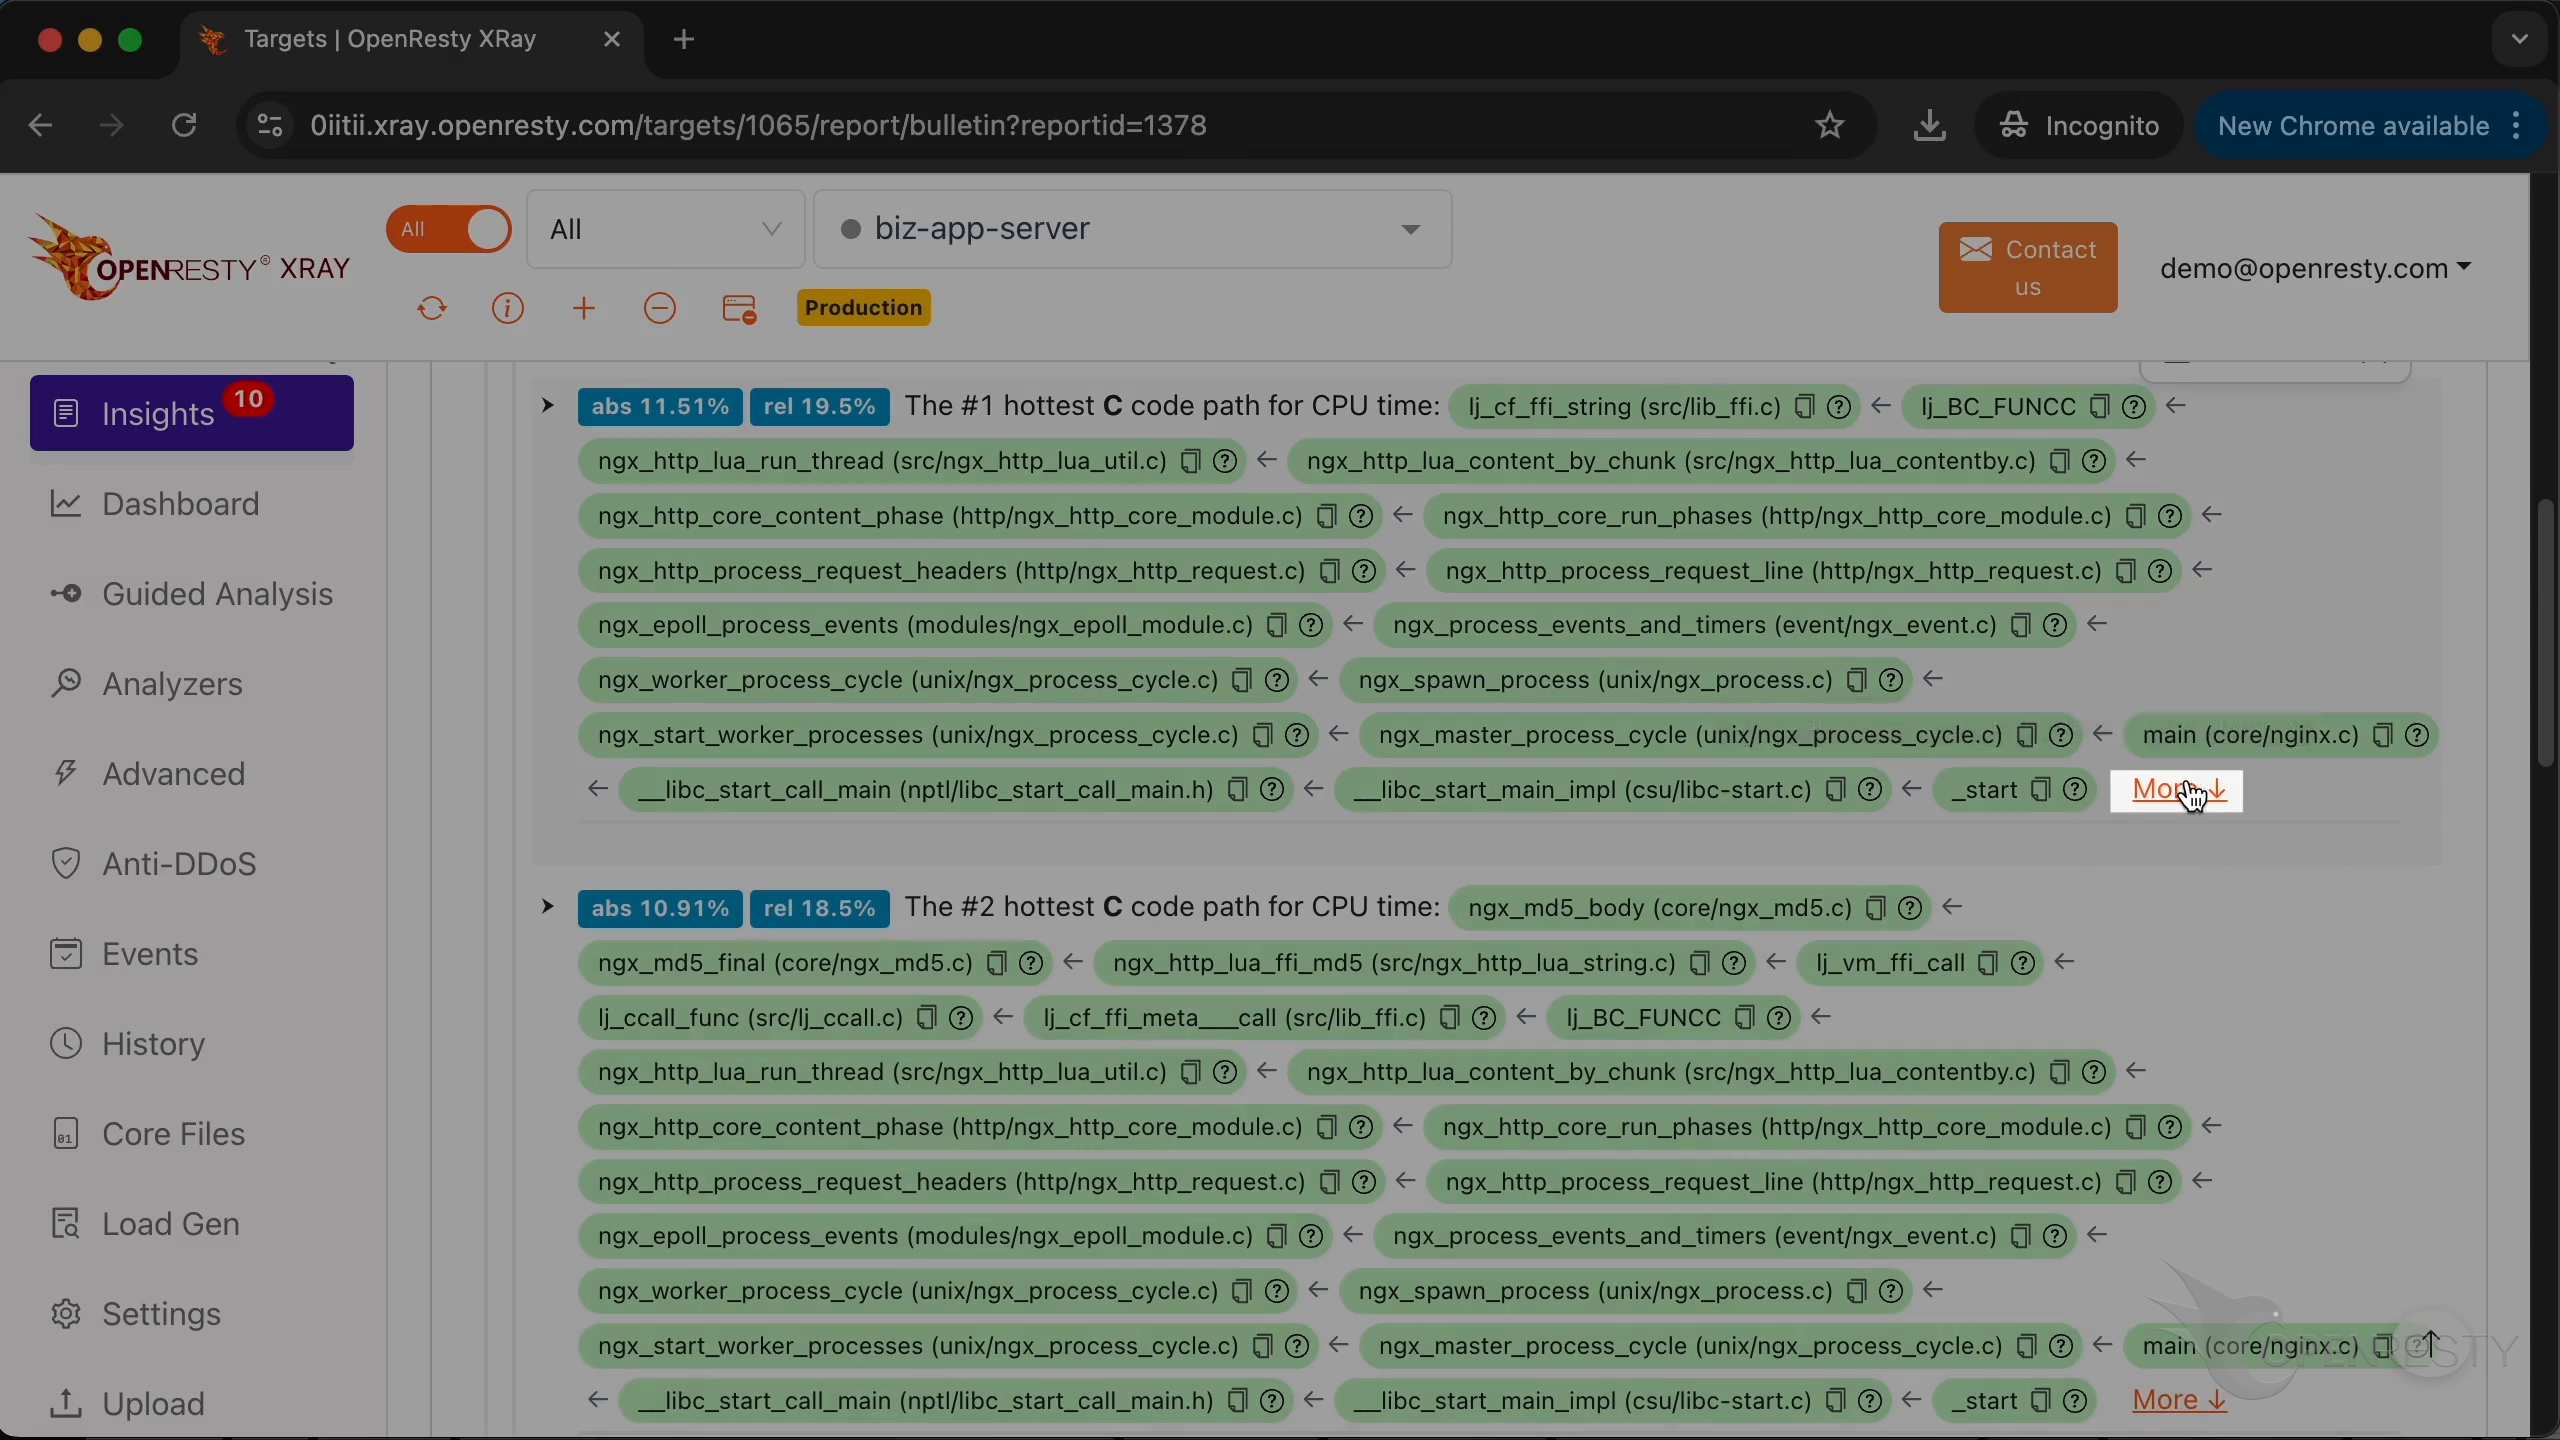
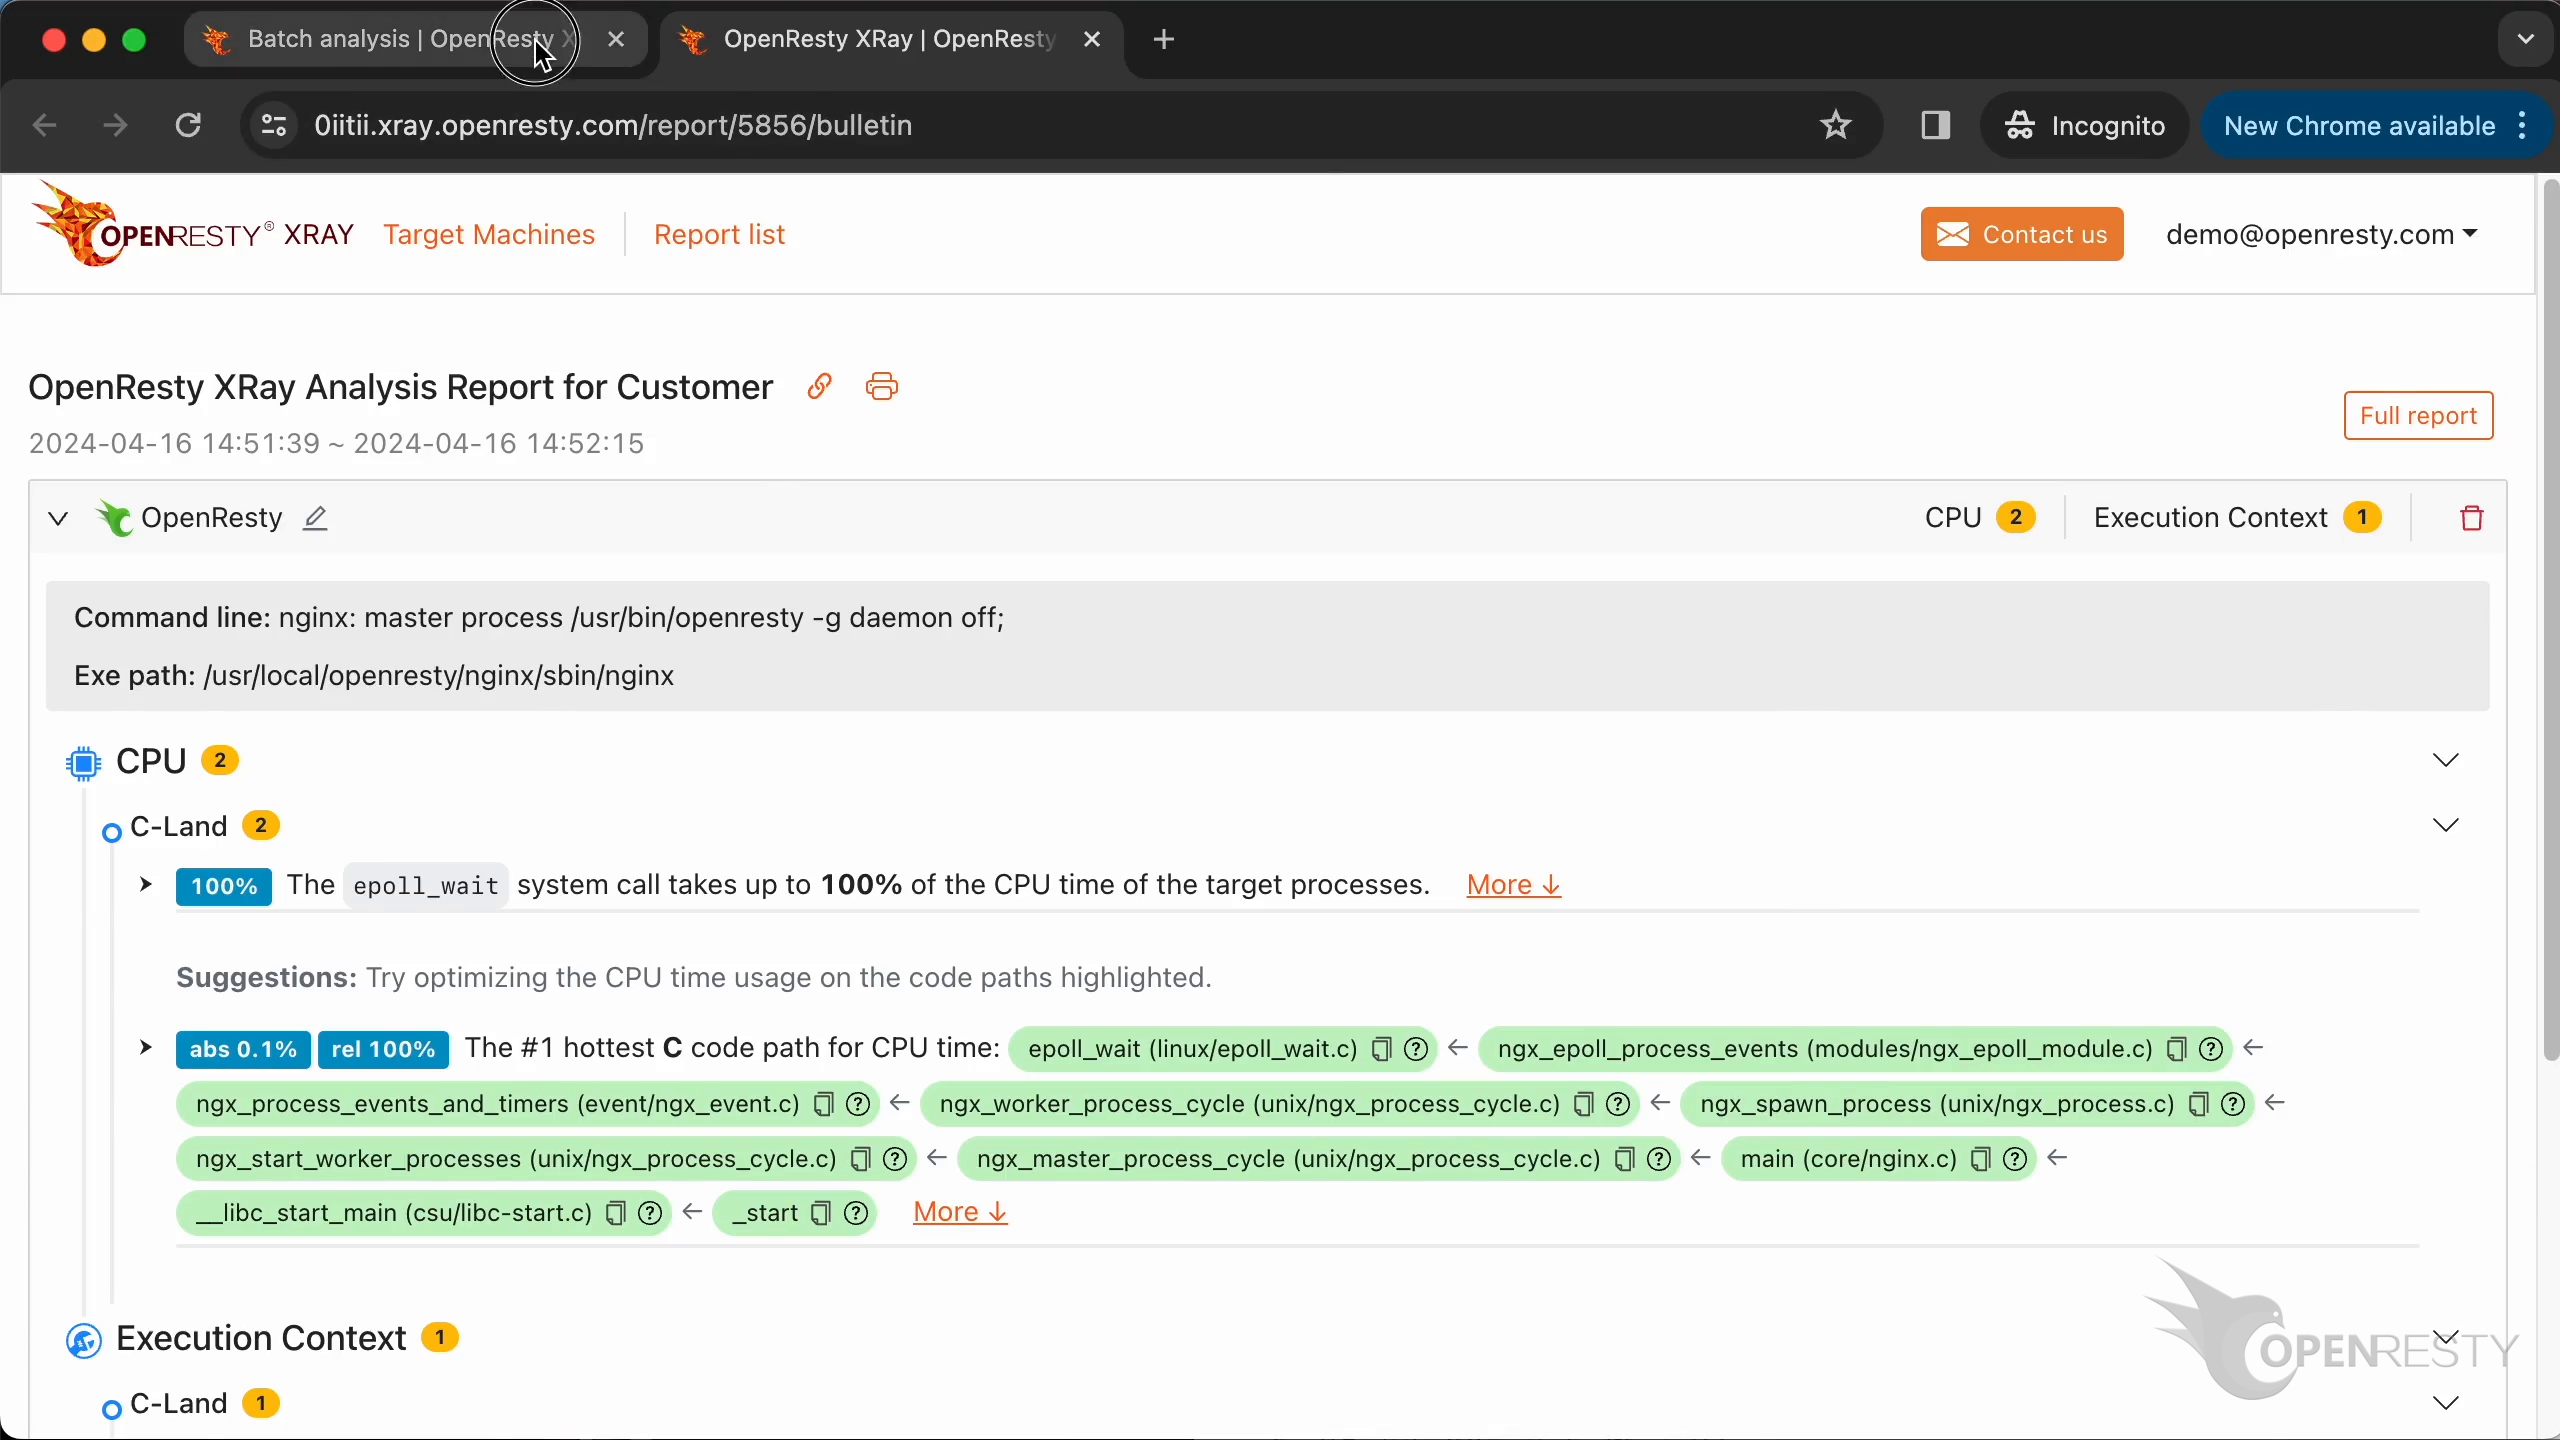
Current issue is automatically inferred from this C-land Flame graph.
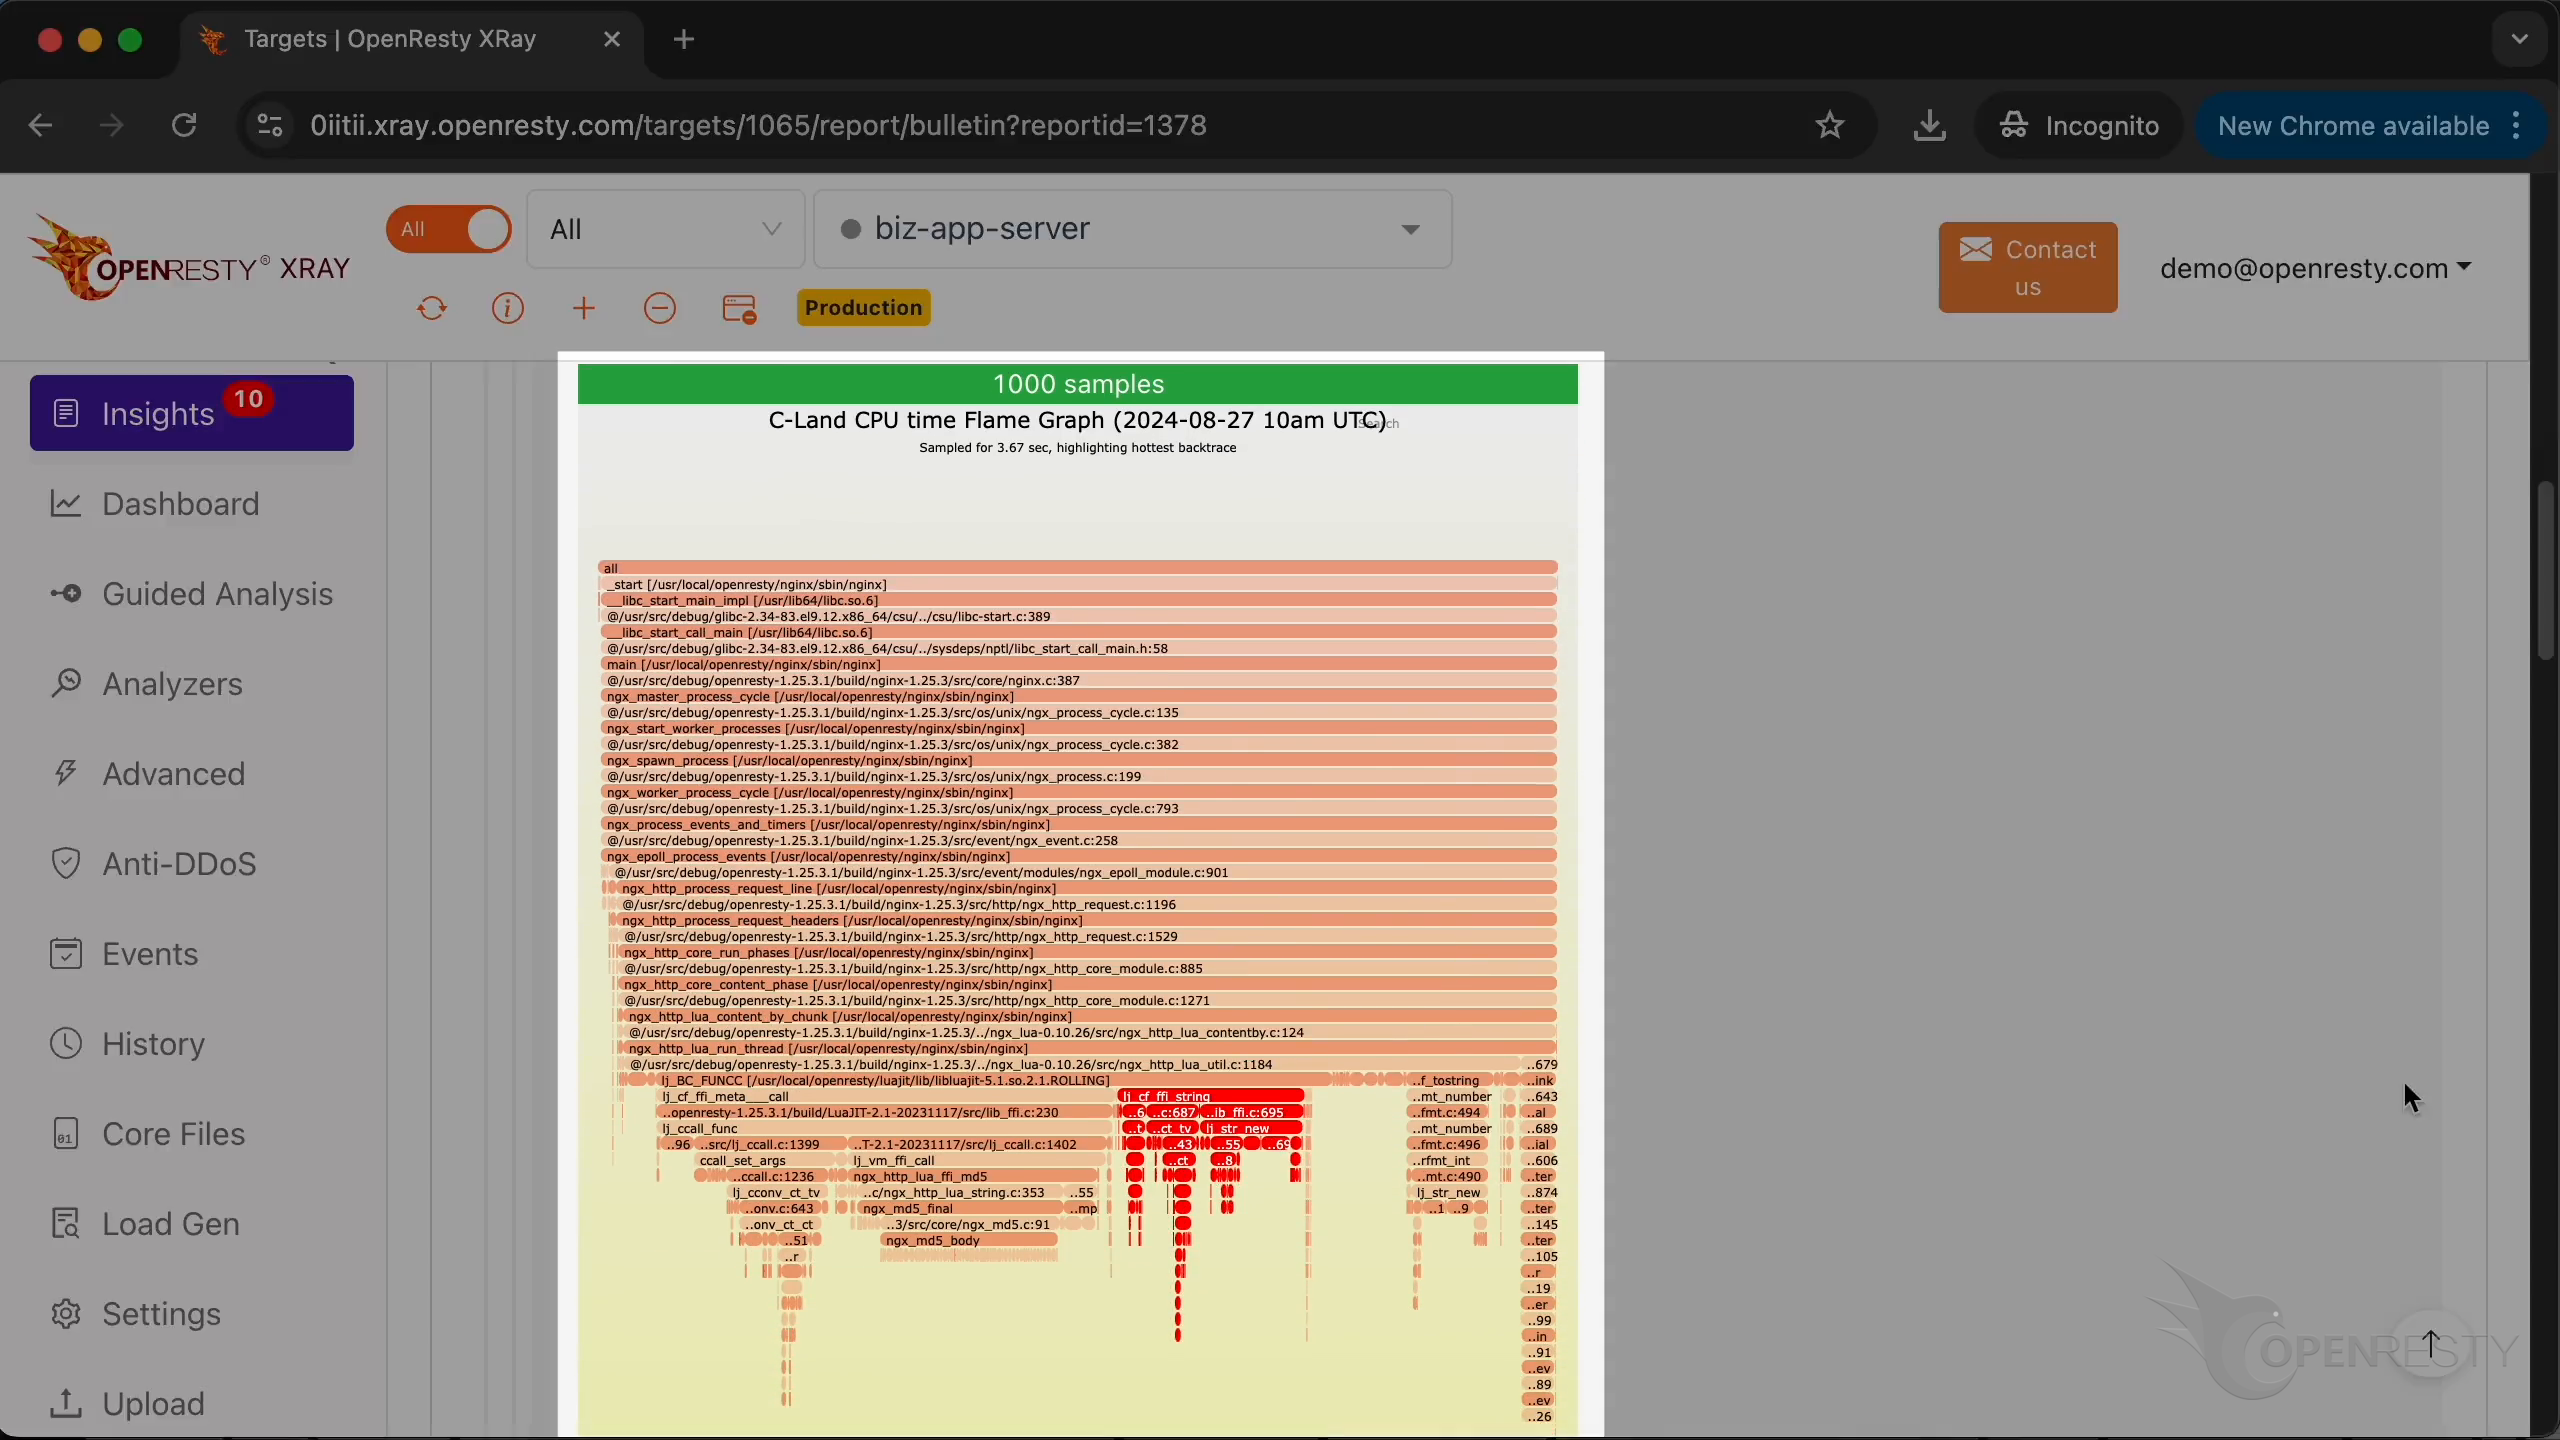
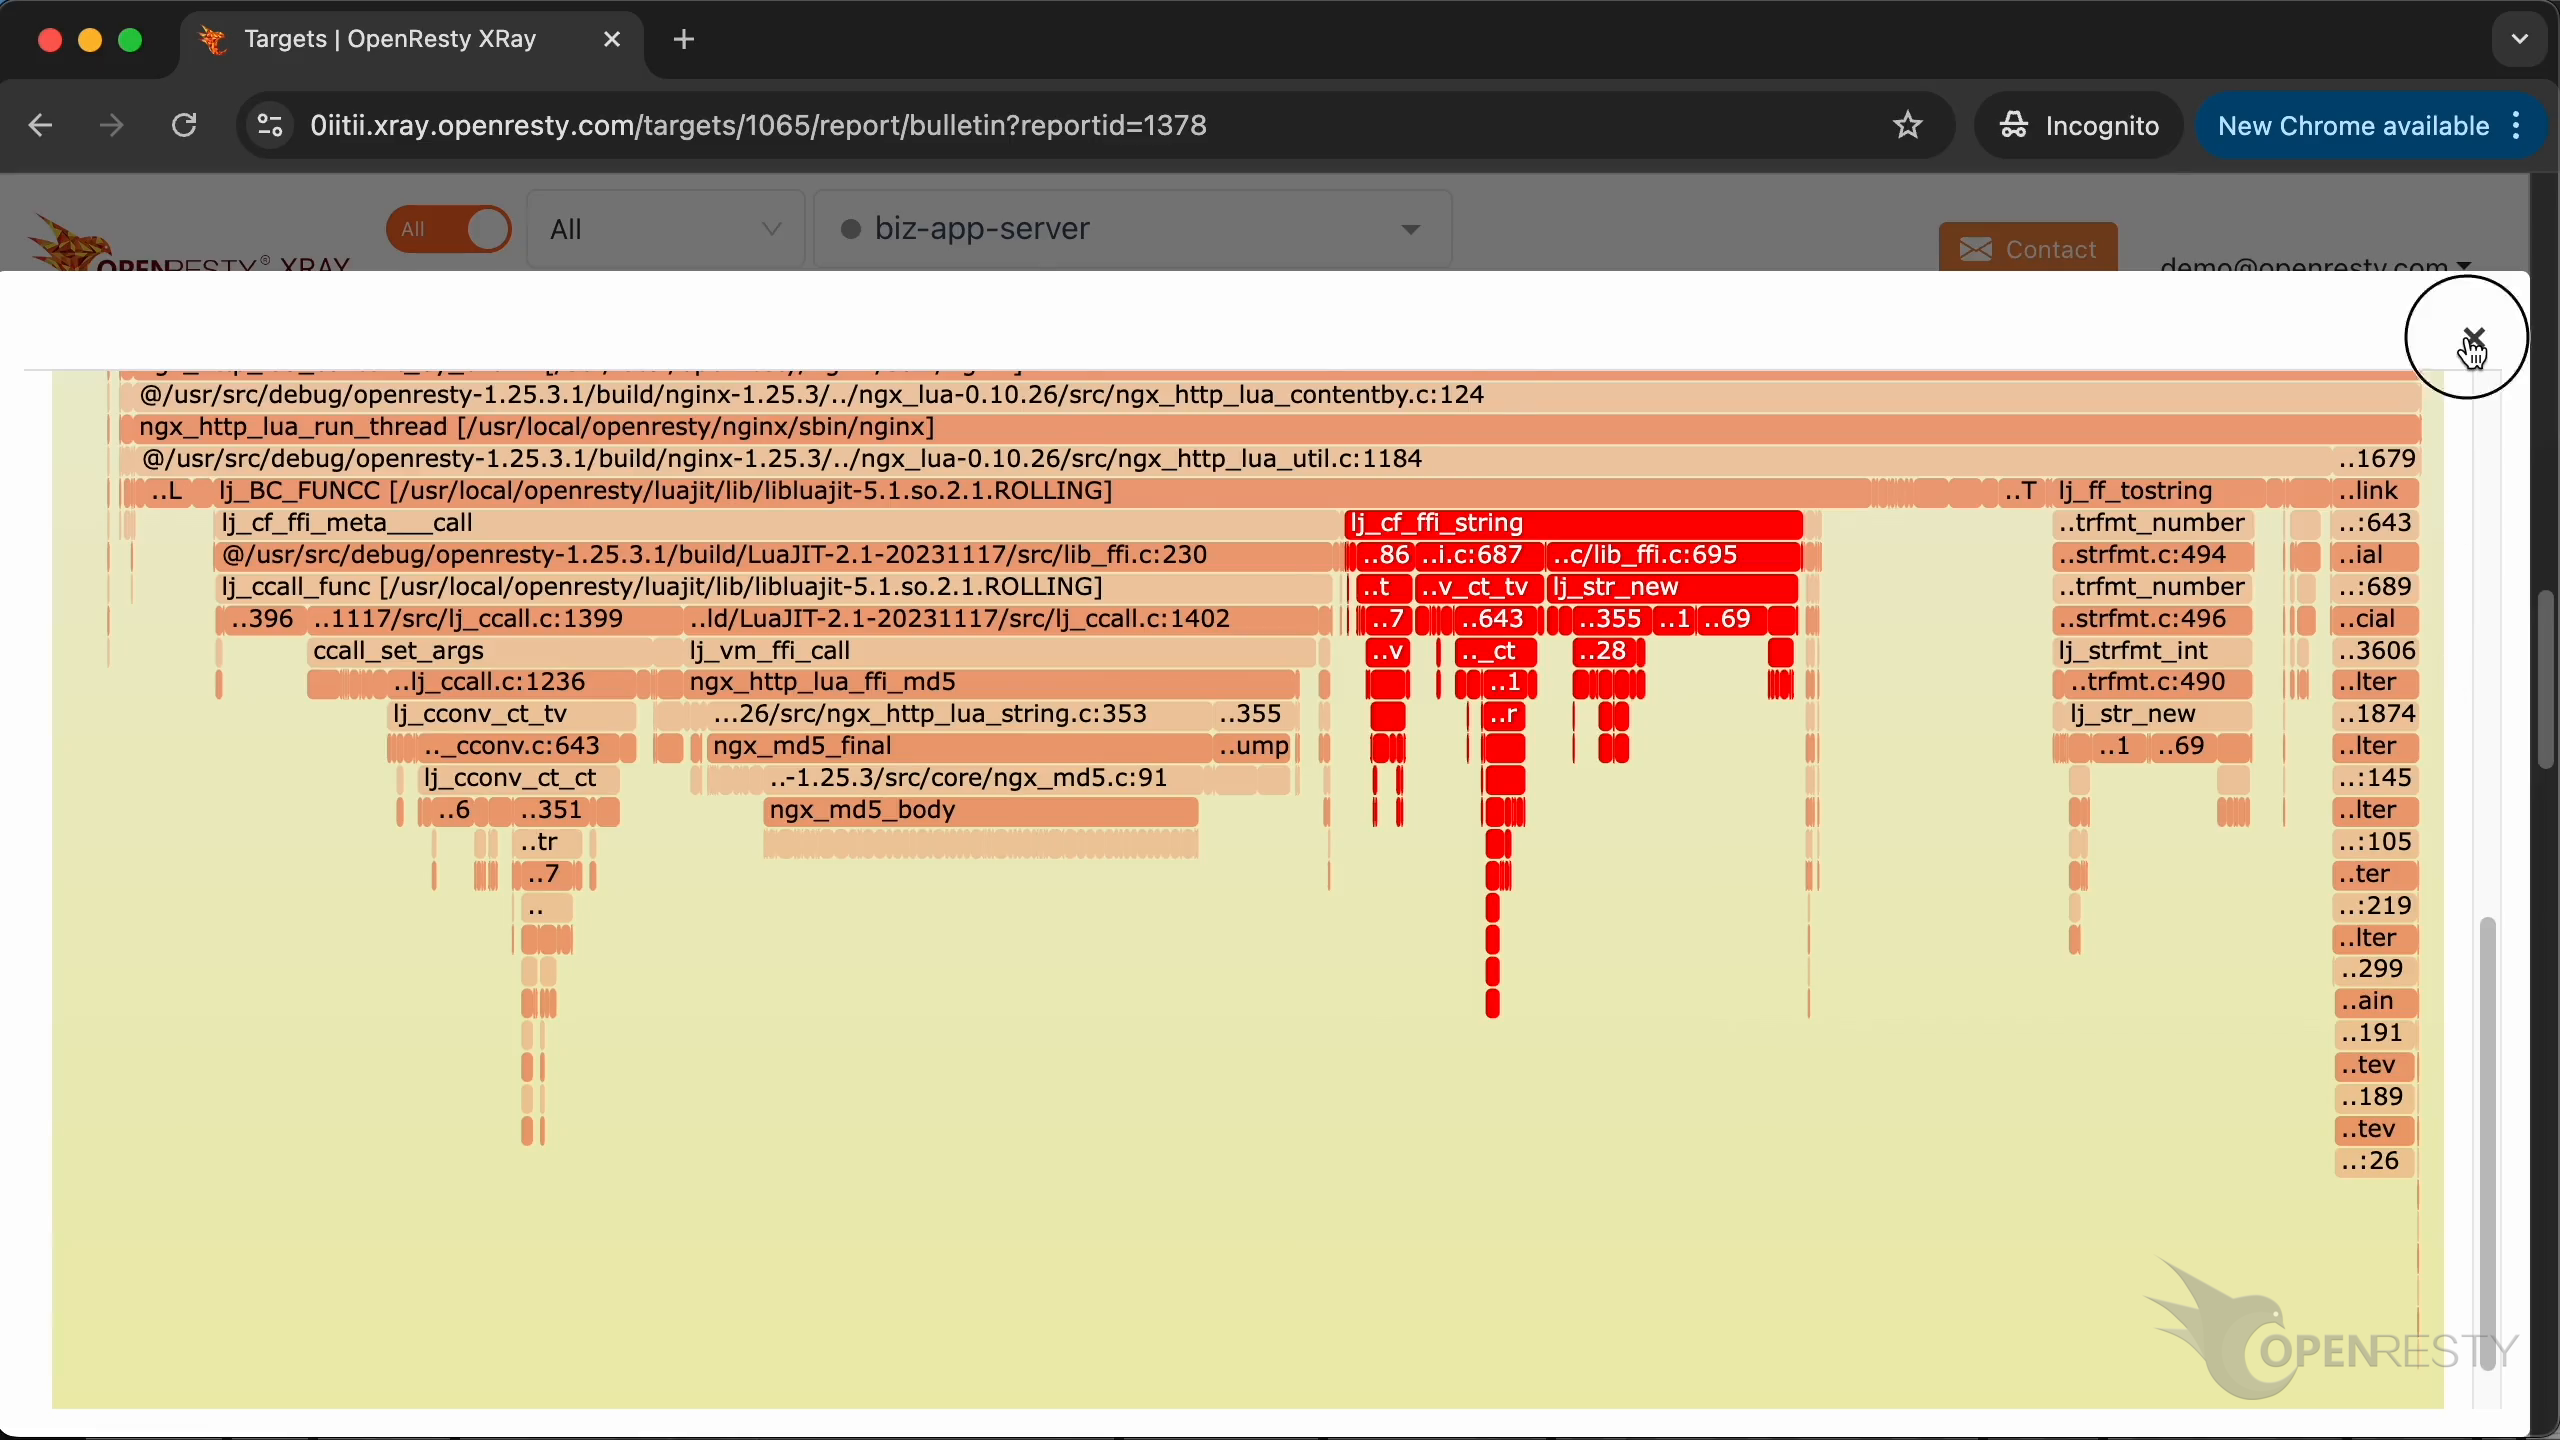
Enlarge it.
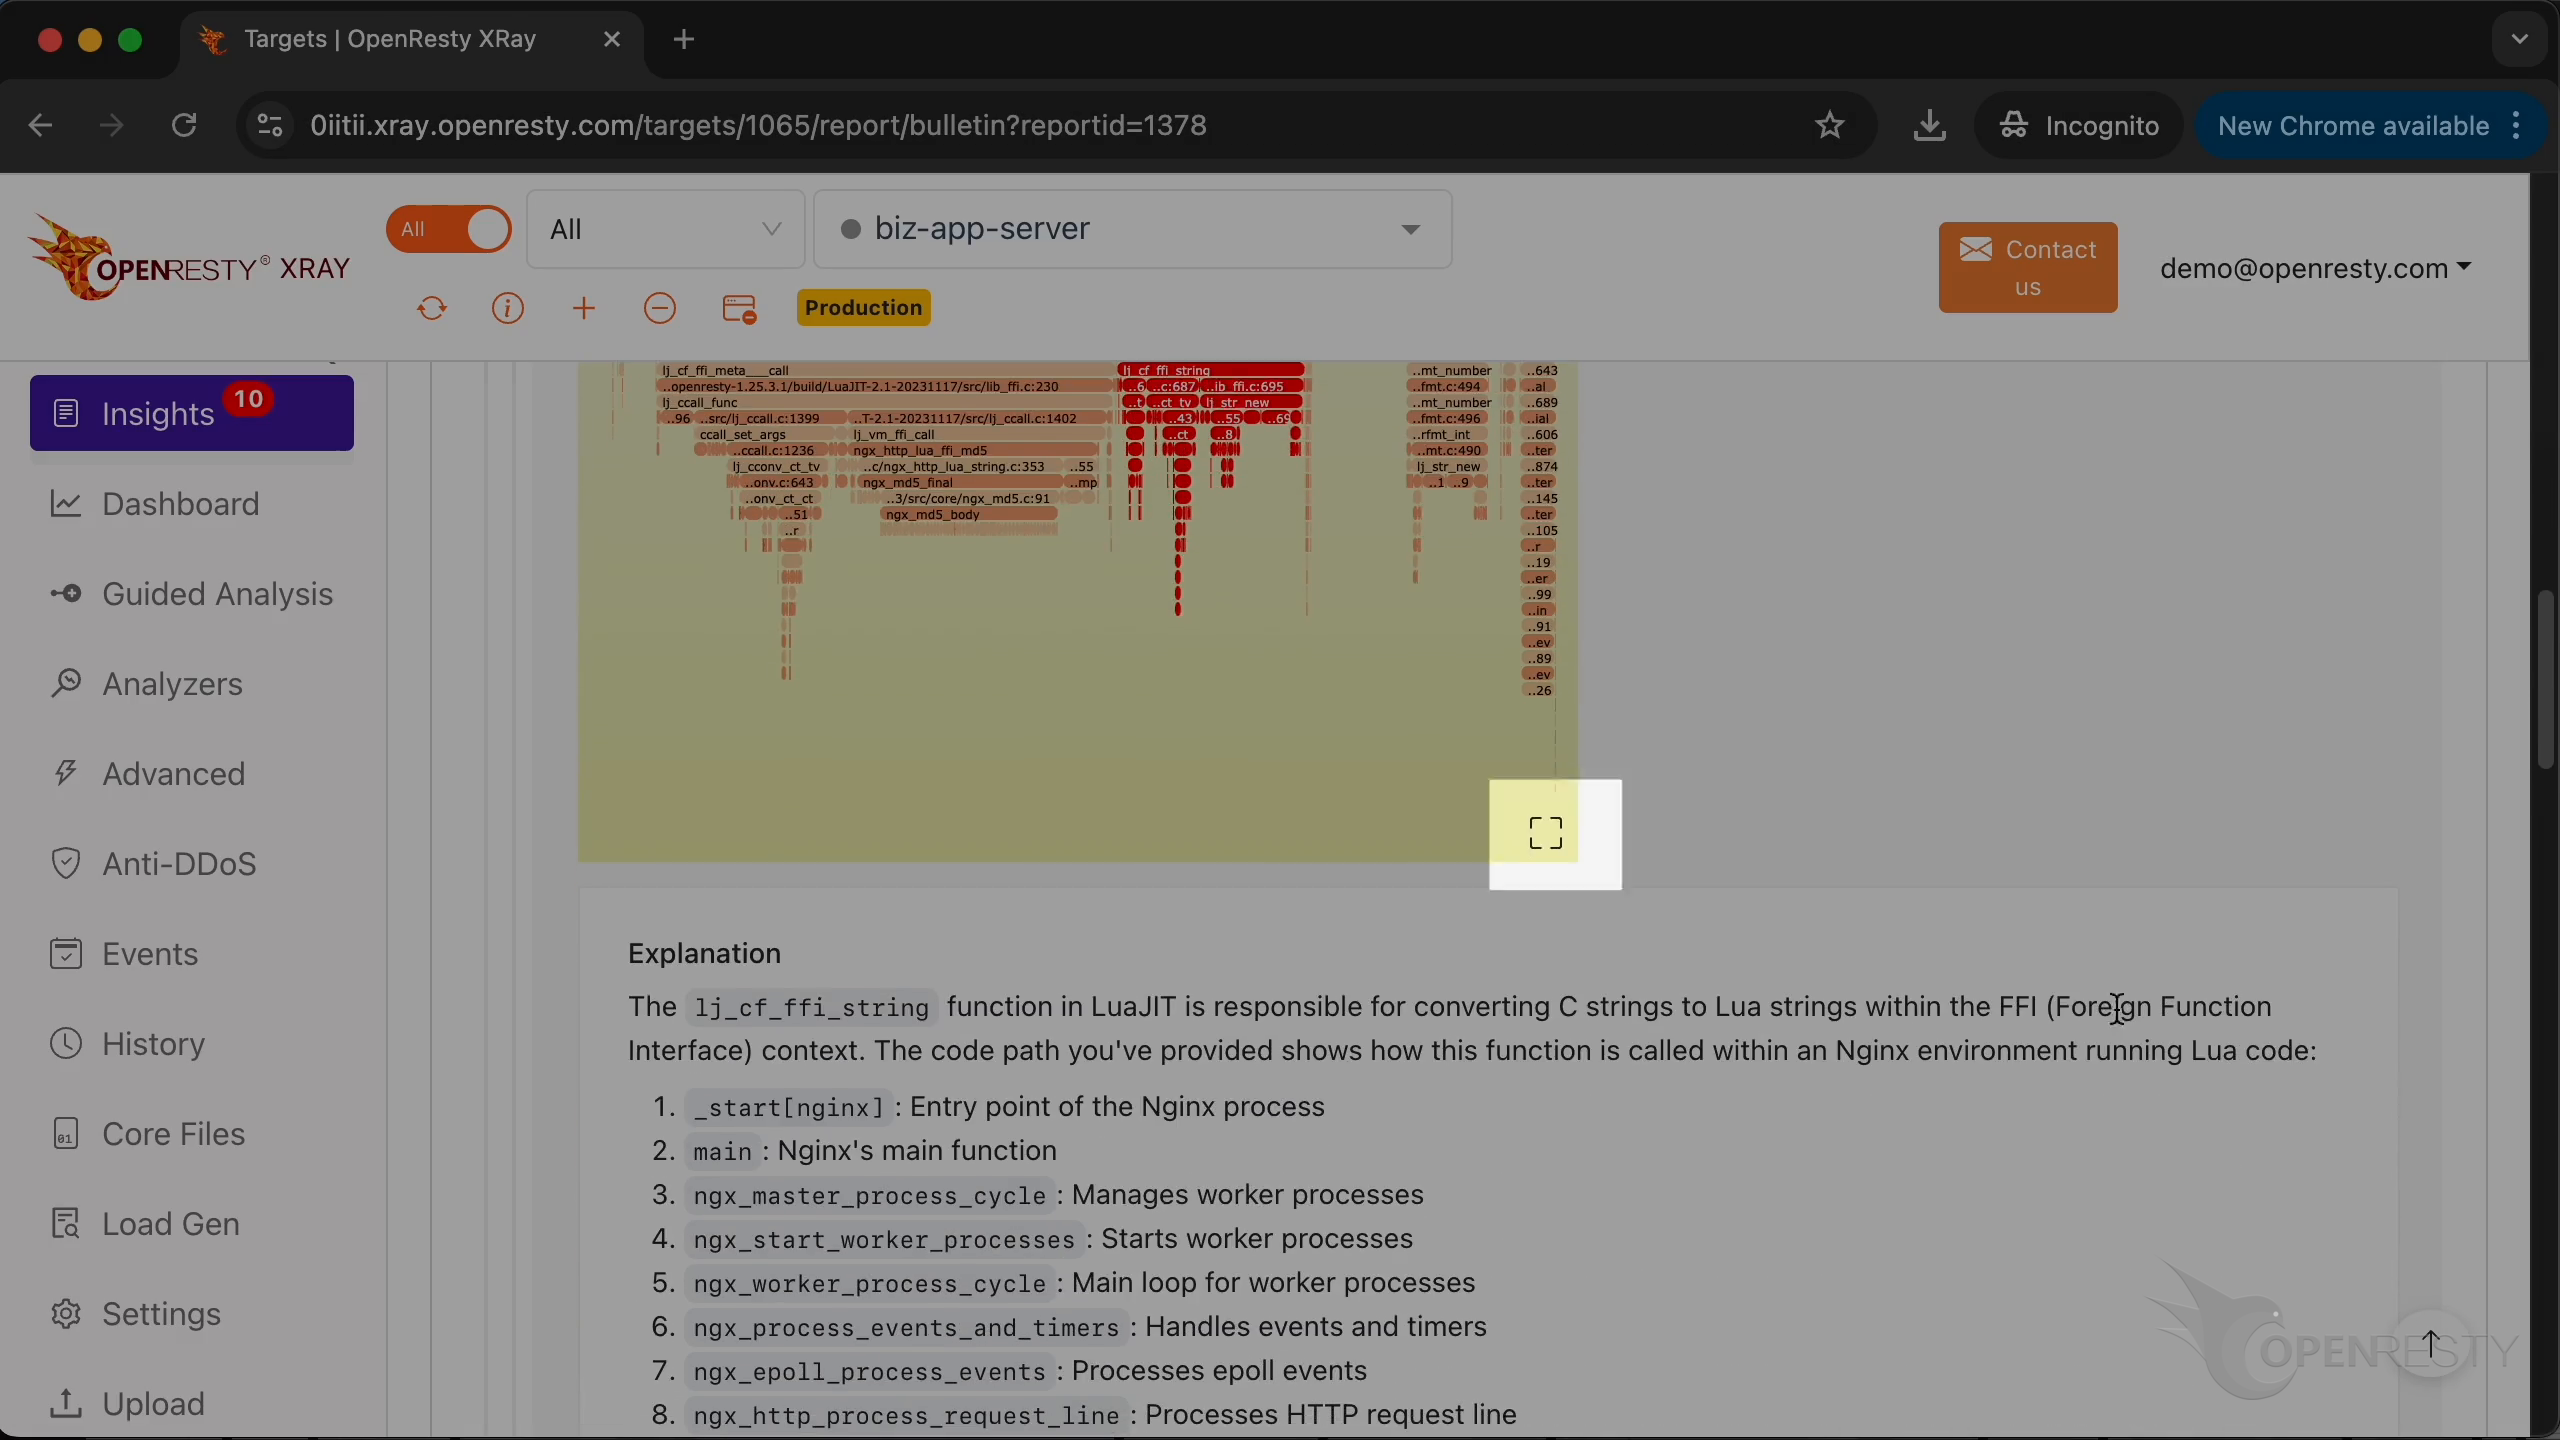
The flame graph can help you locate the root cause of the issue.
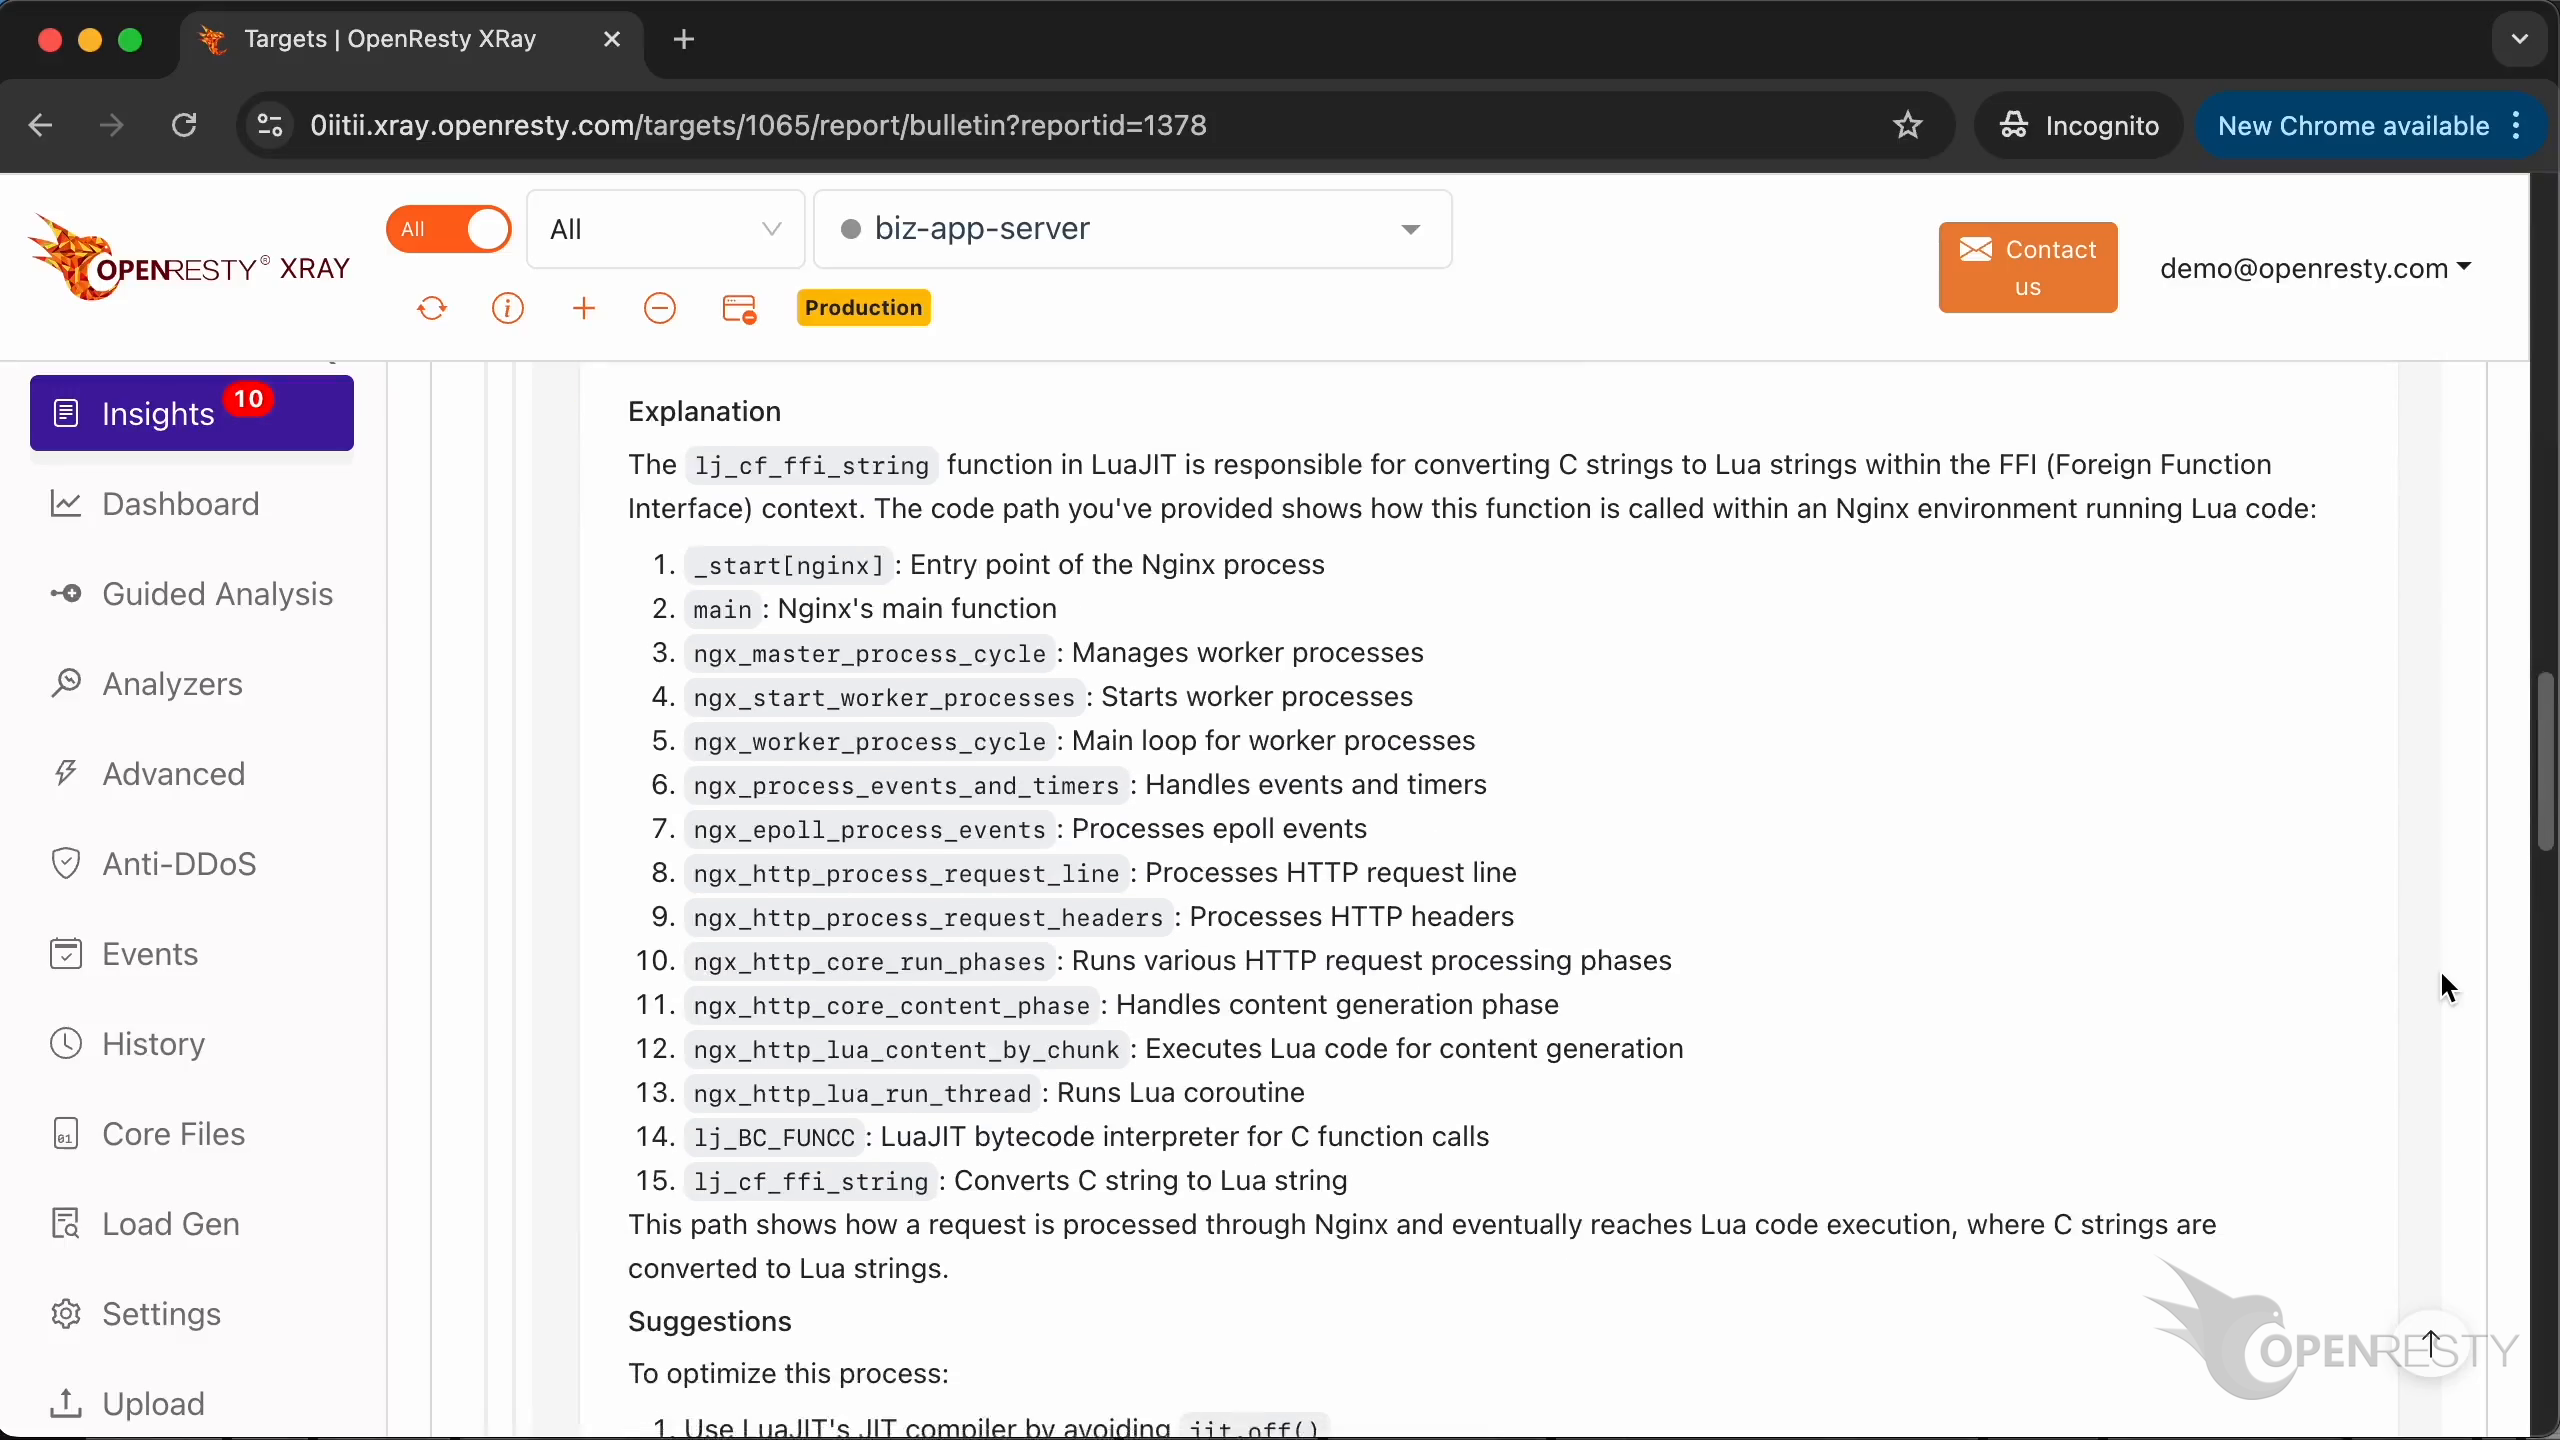
Below are more detailed explanations and suggestions about the issue.
Click this button to view more analysis results.
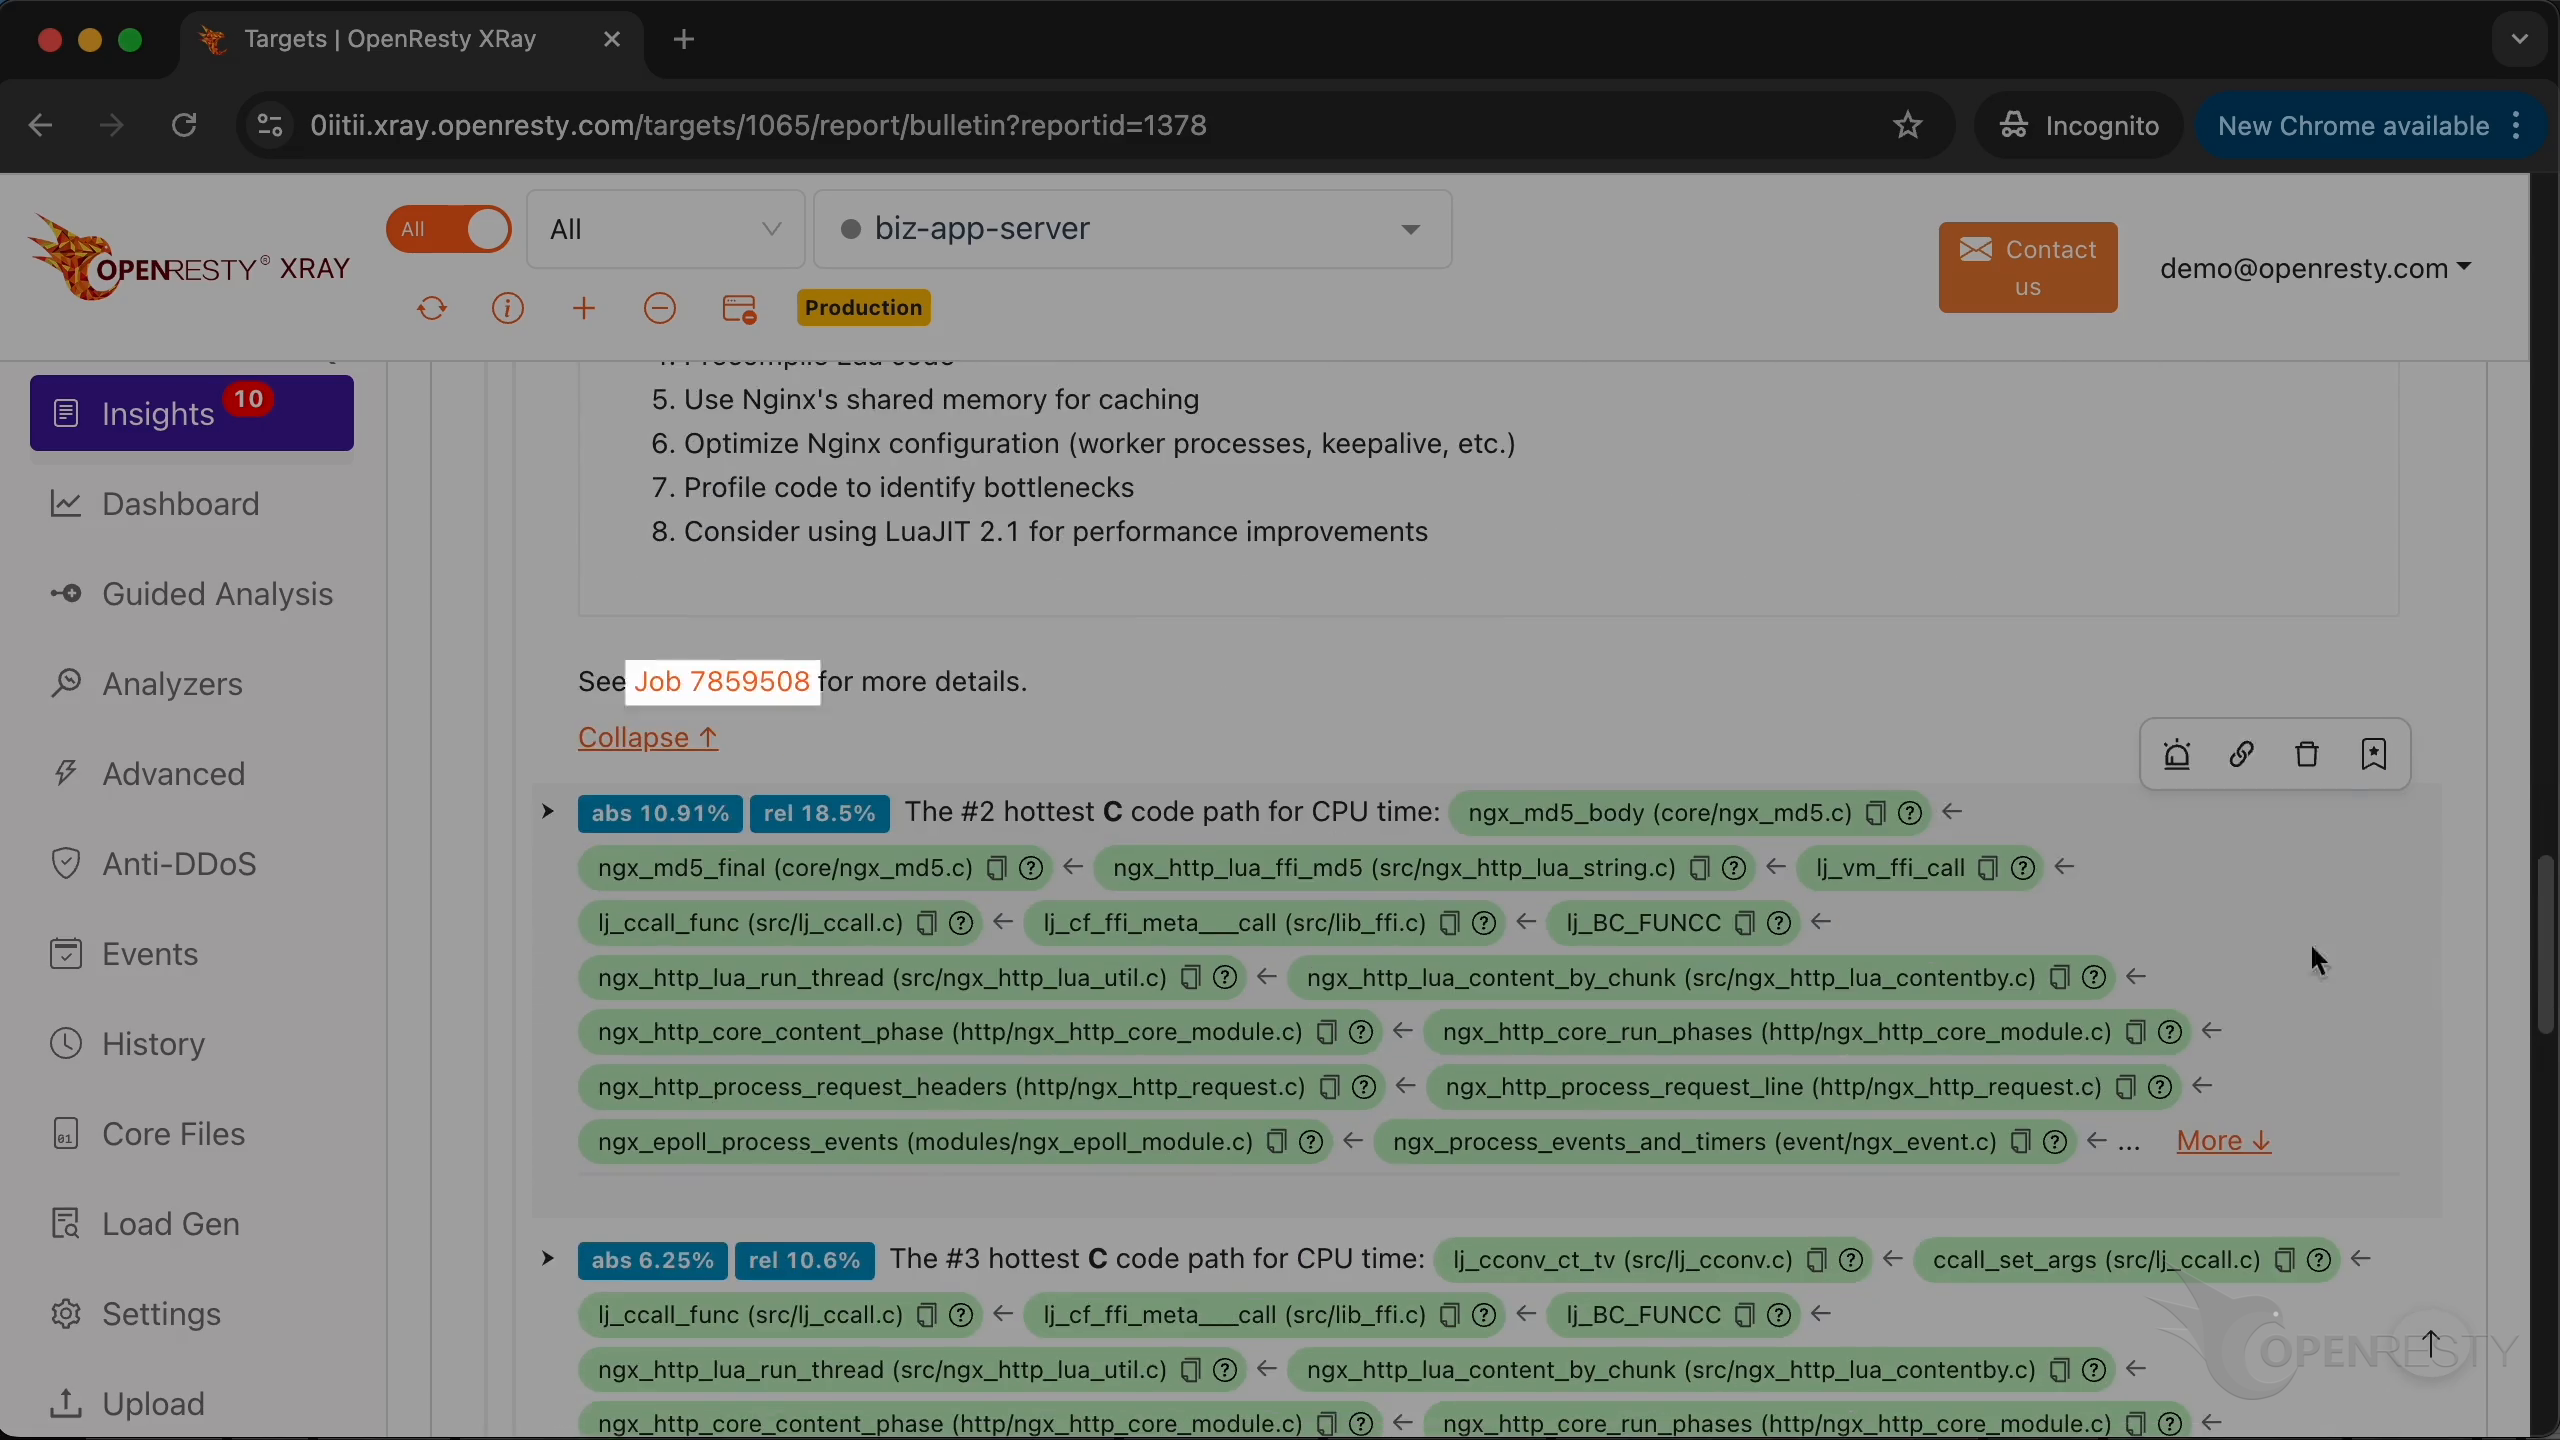
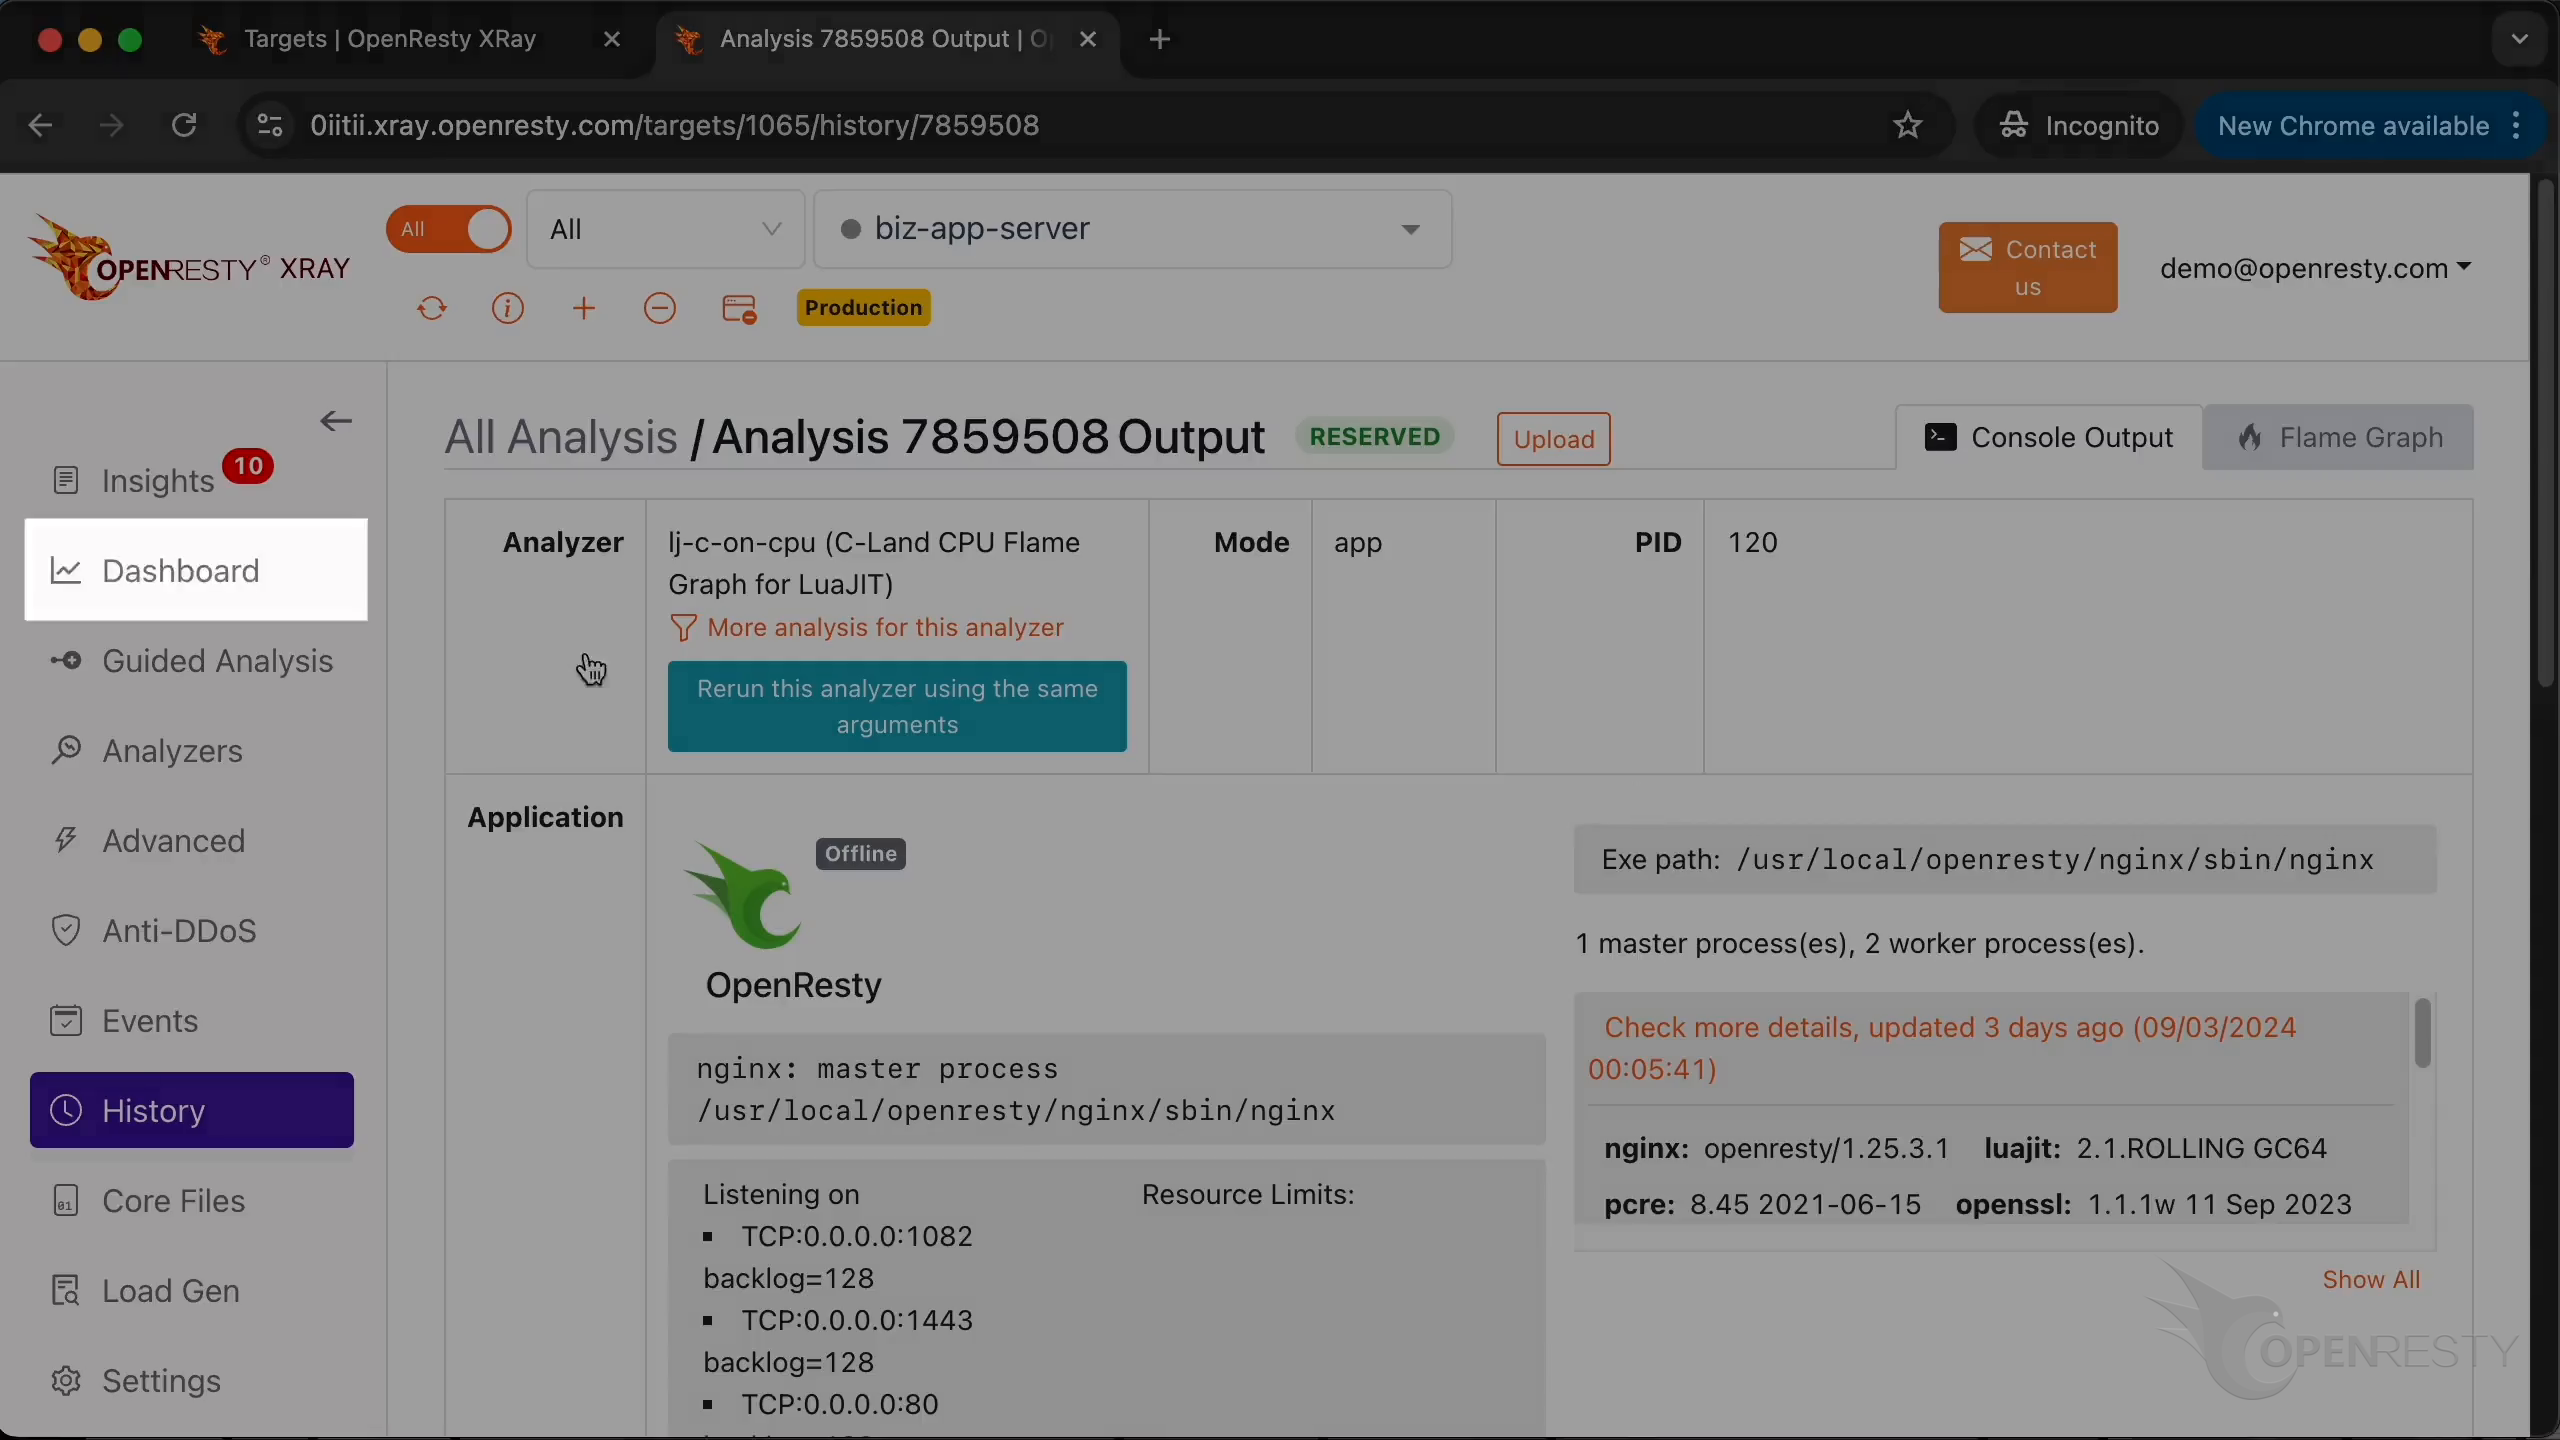
Here is the complete information of the report, such as which analyzer was used and application information.
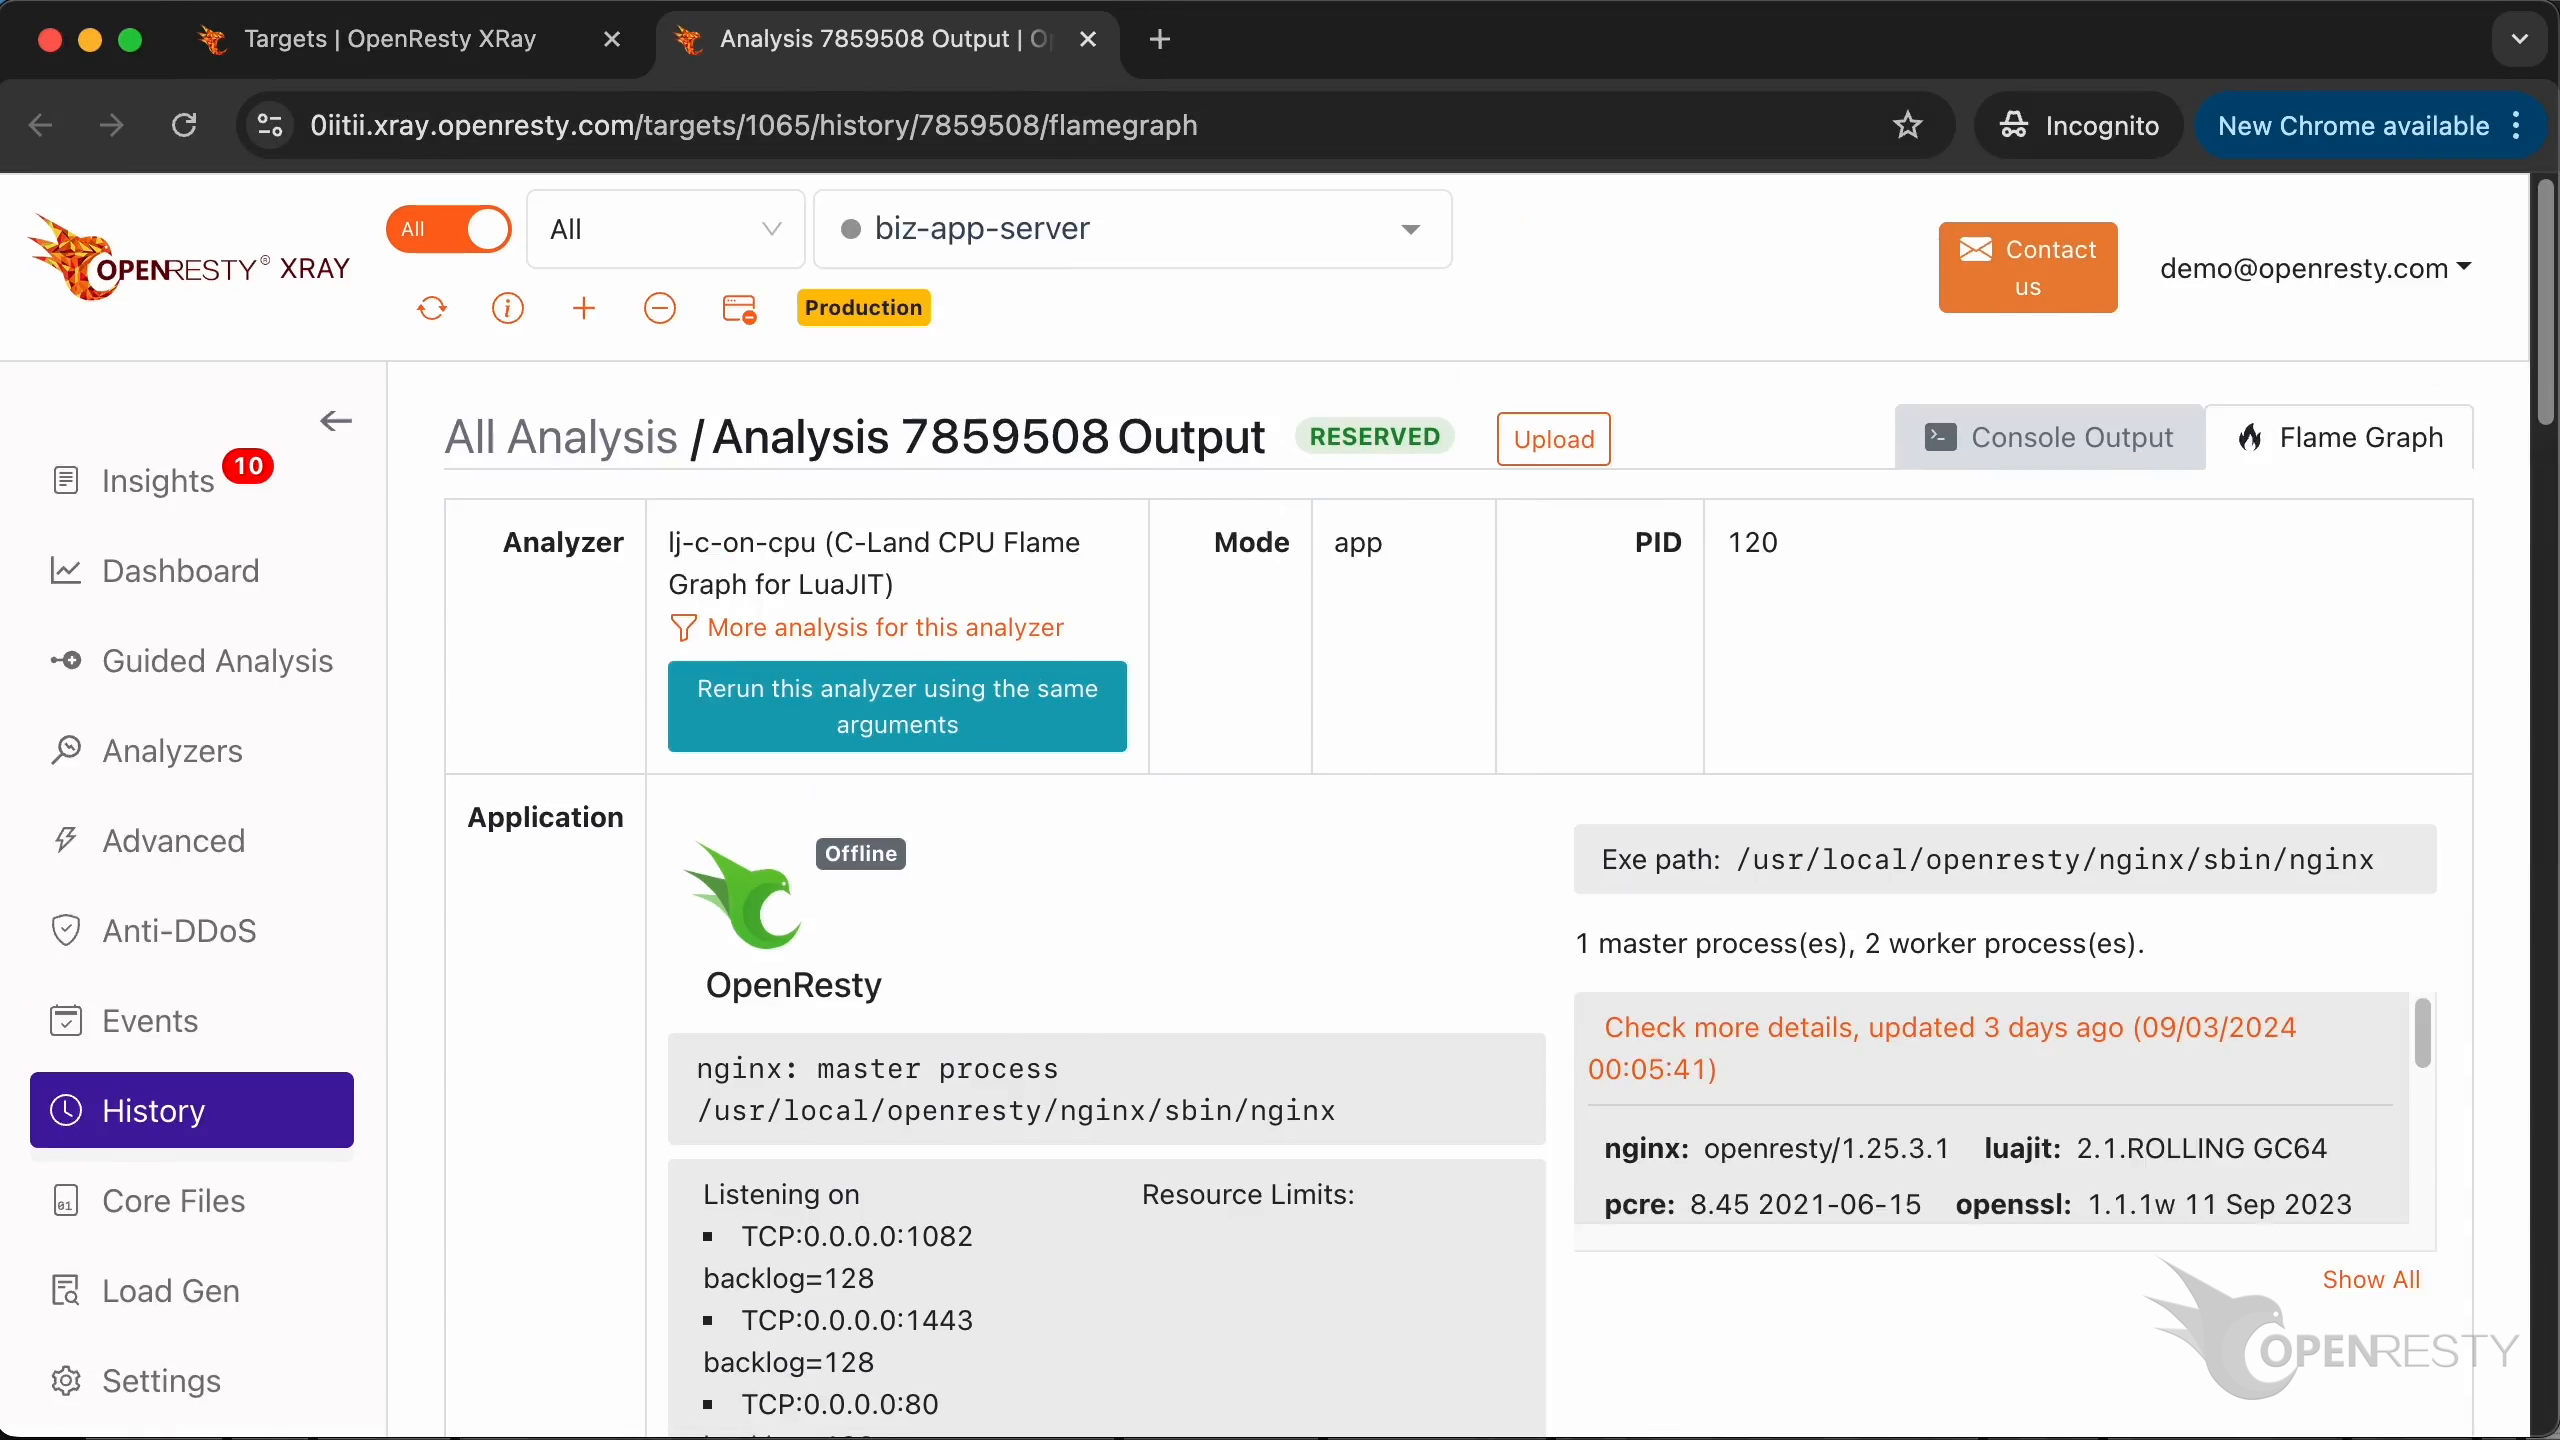
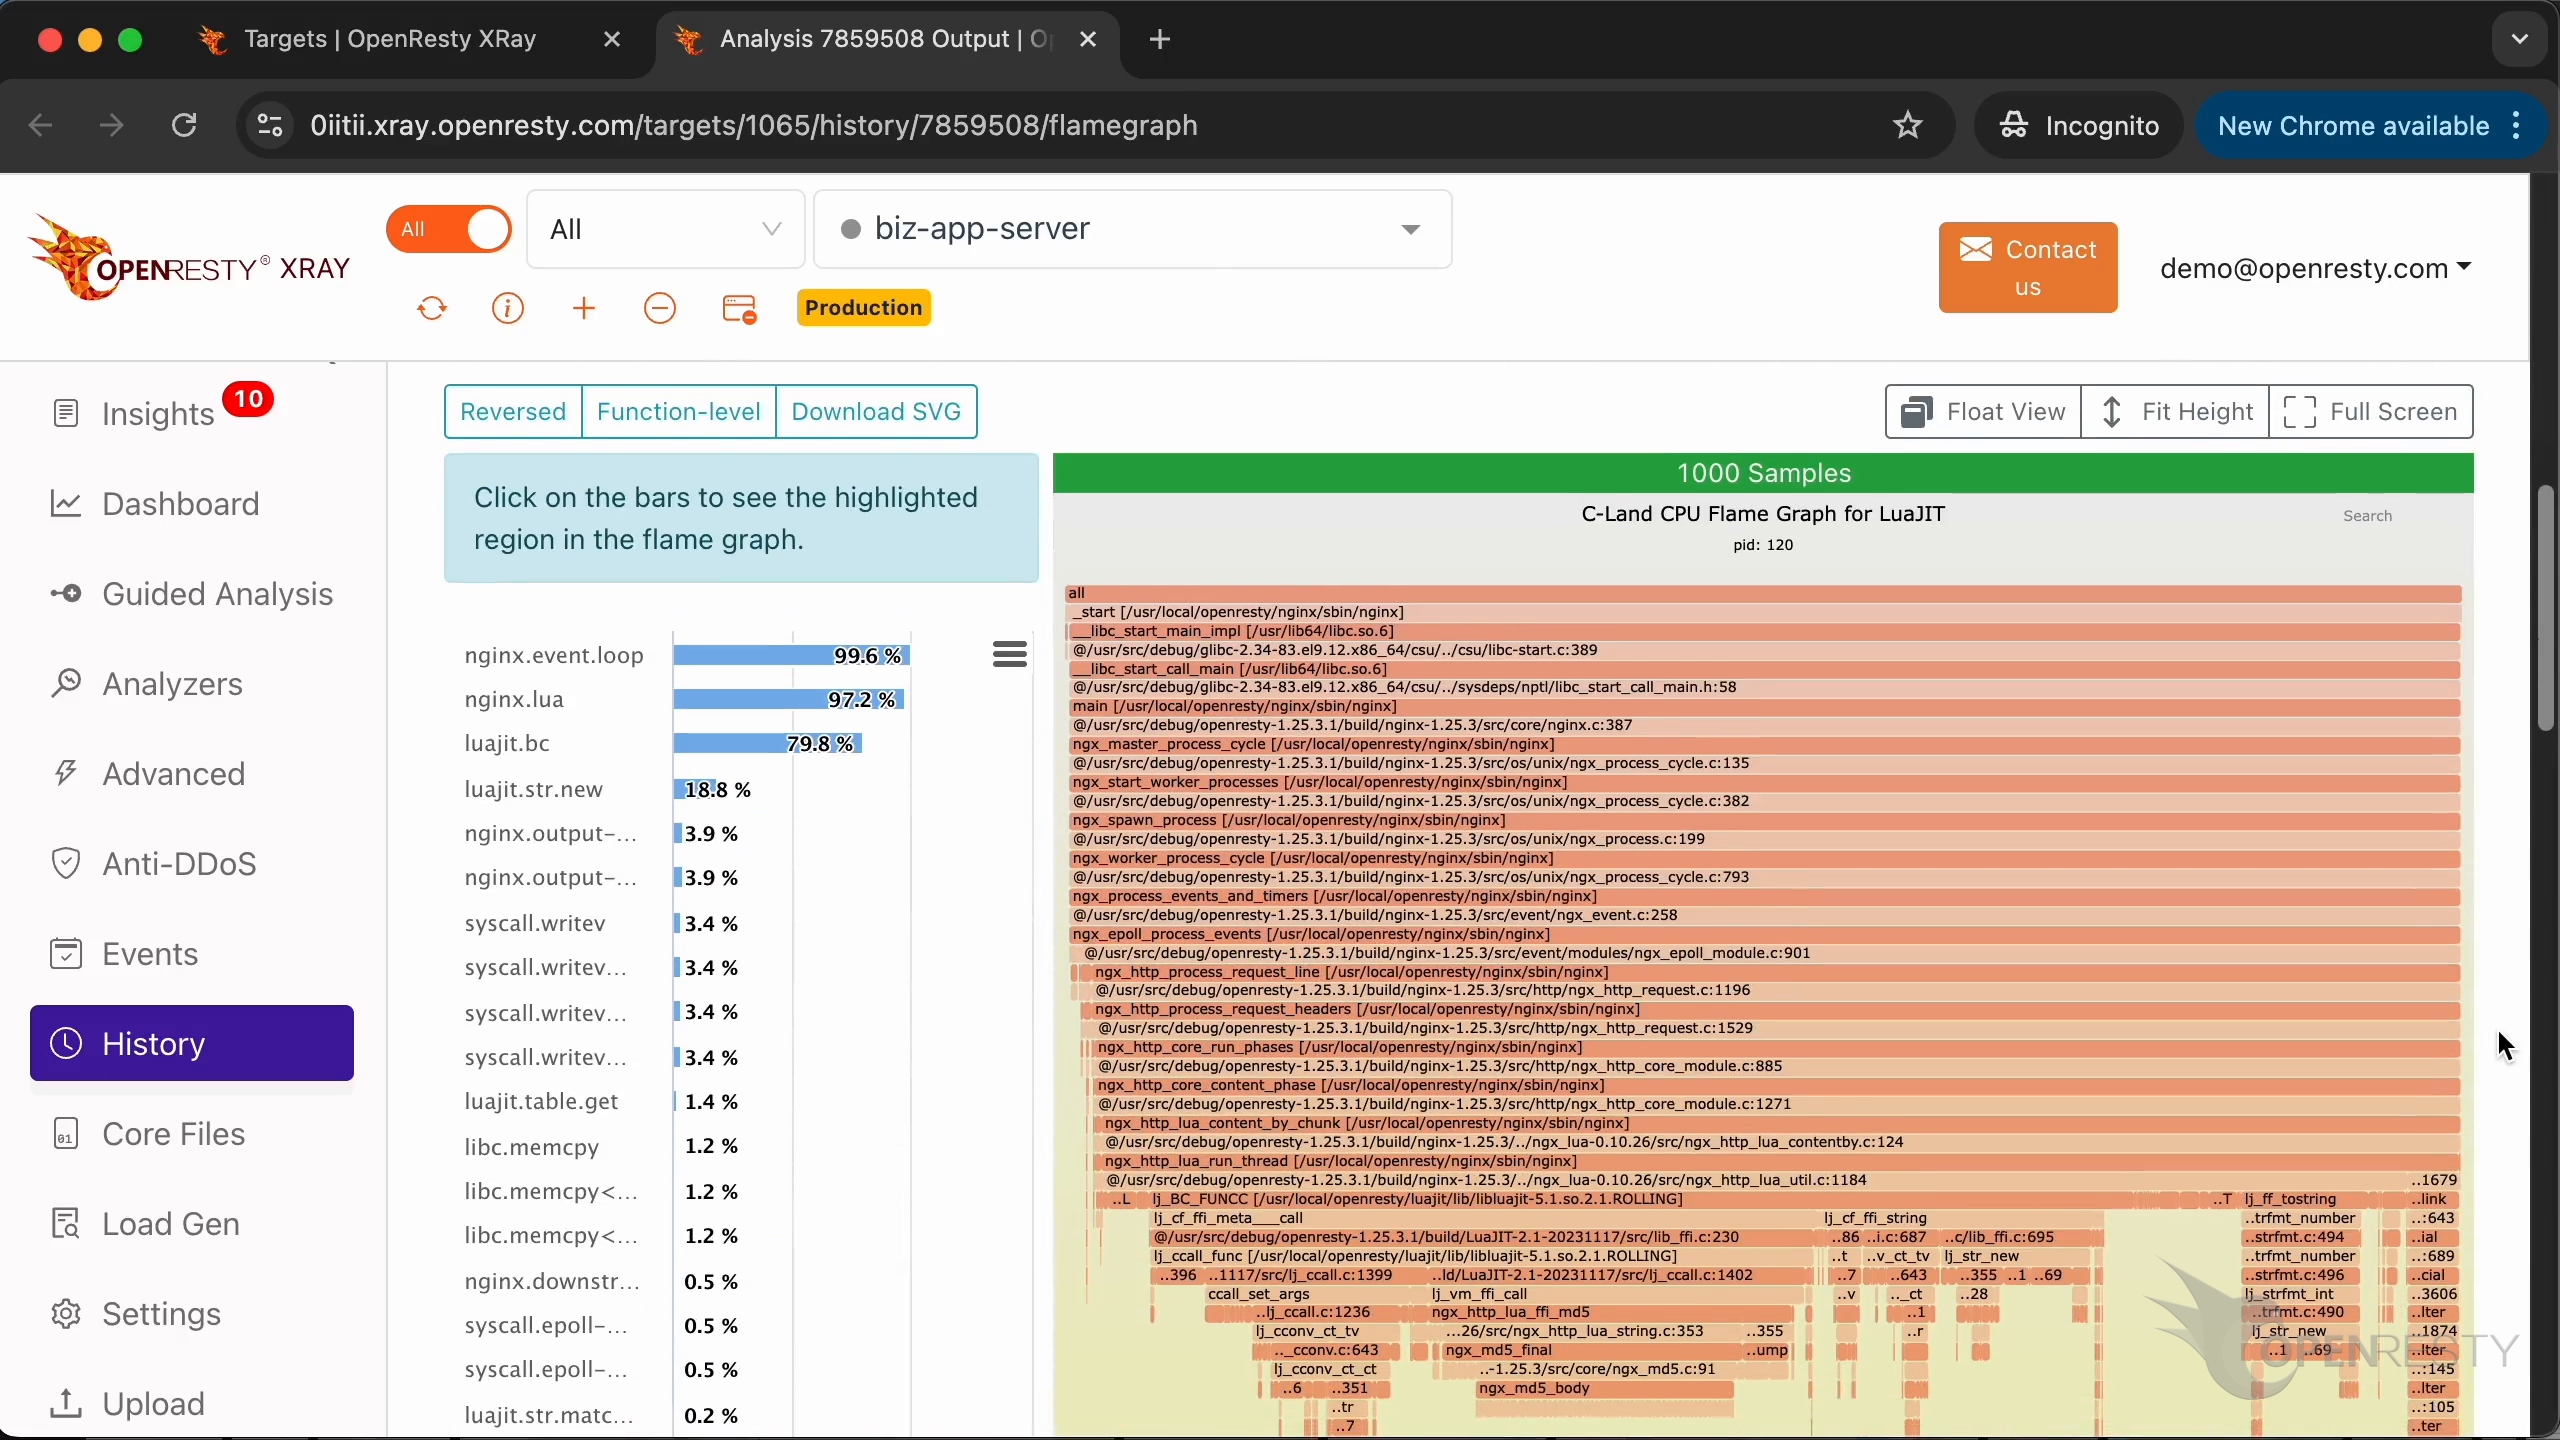
You’ll also find the flame graph and other charts here.
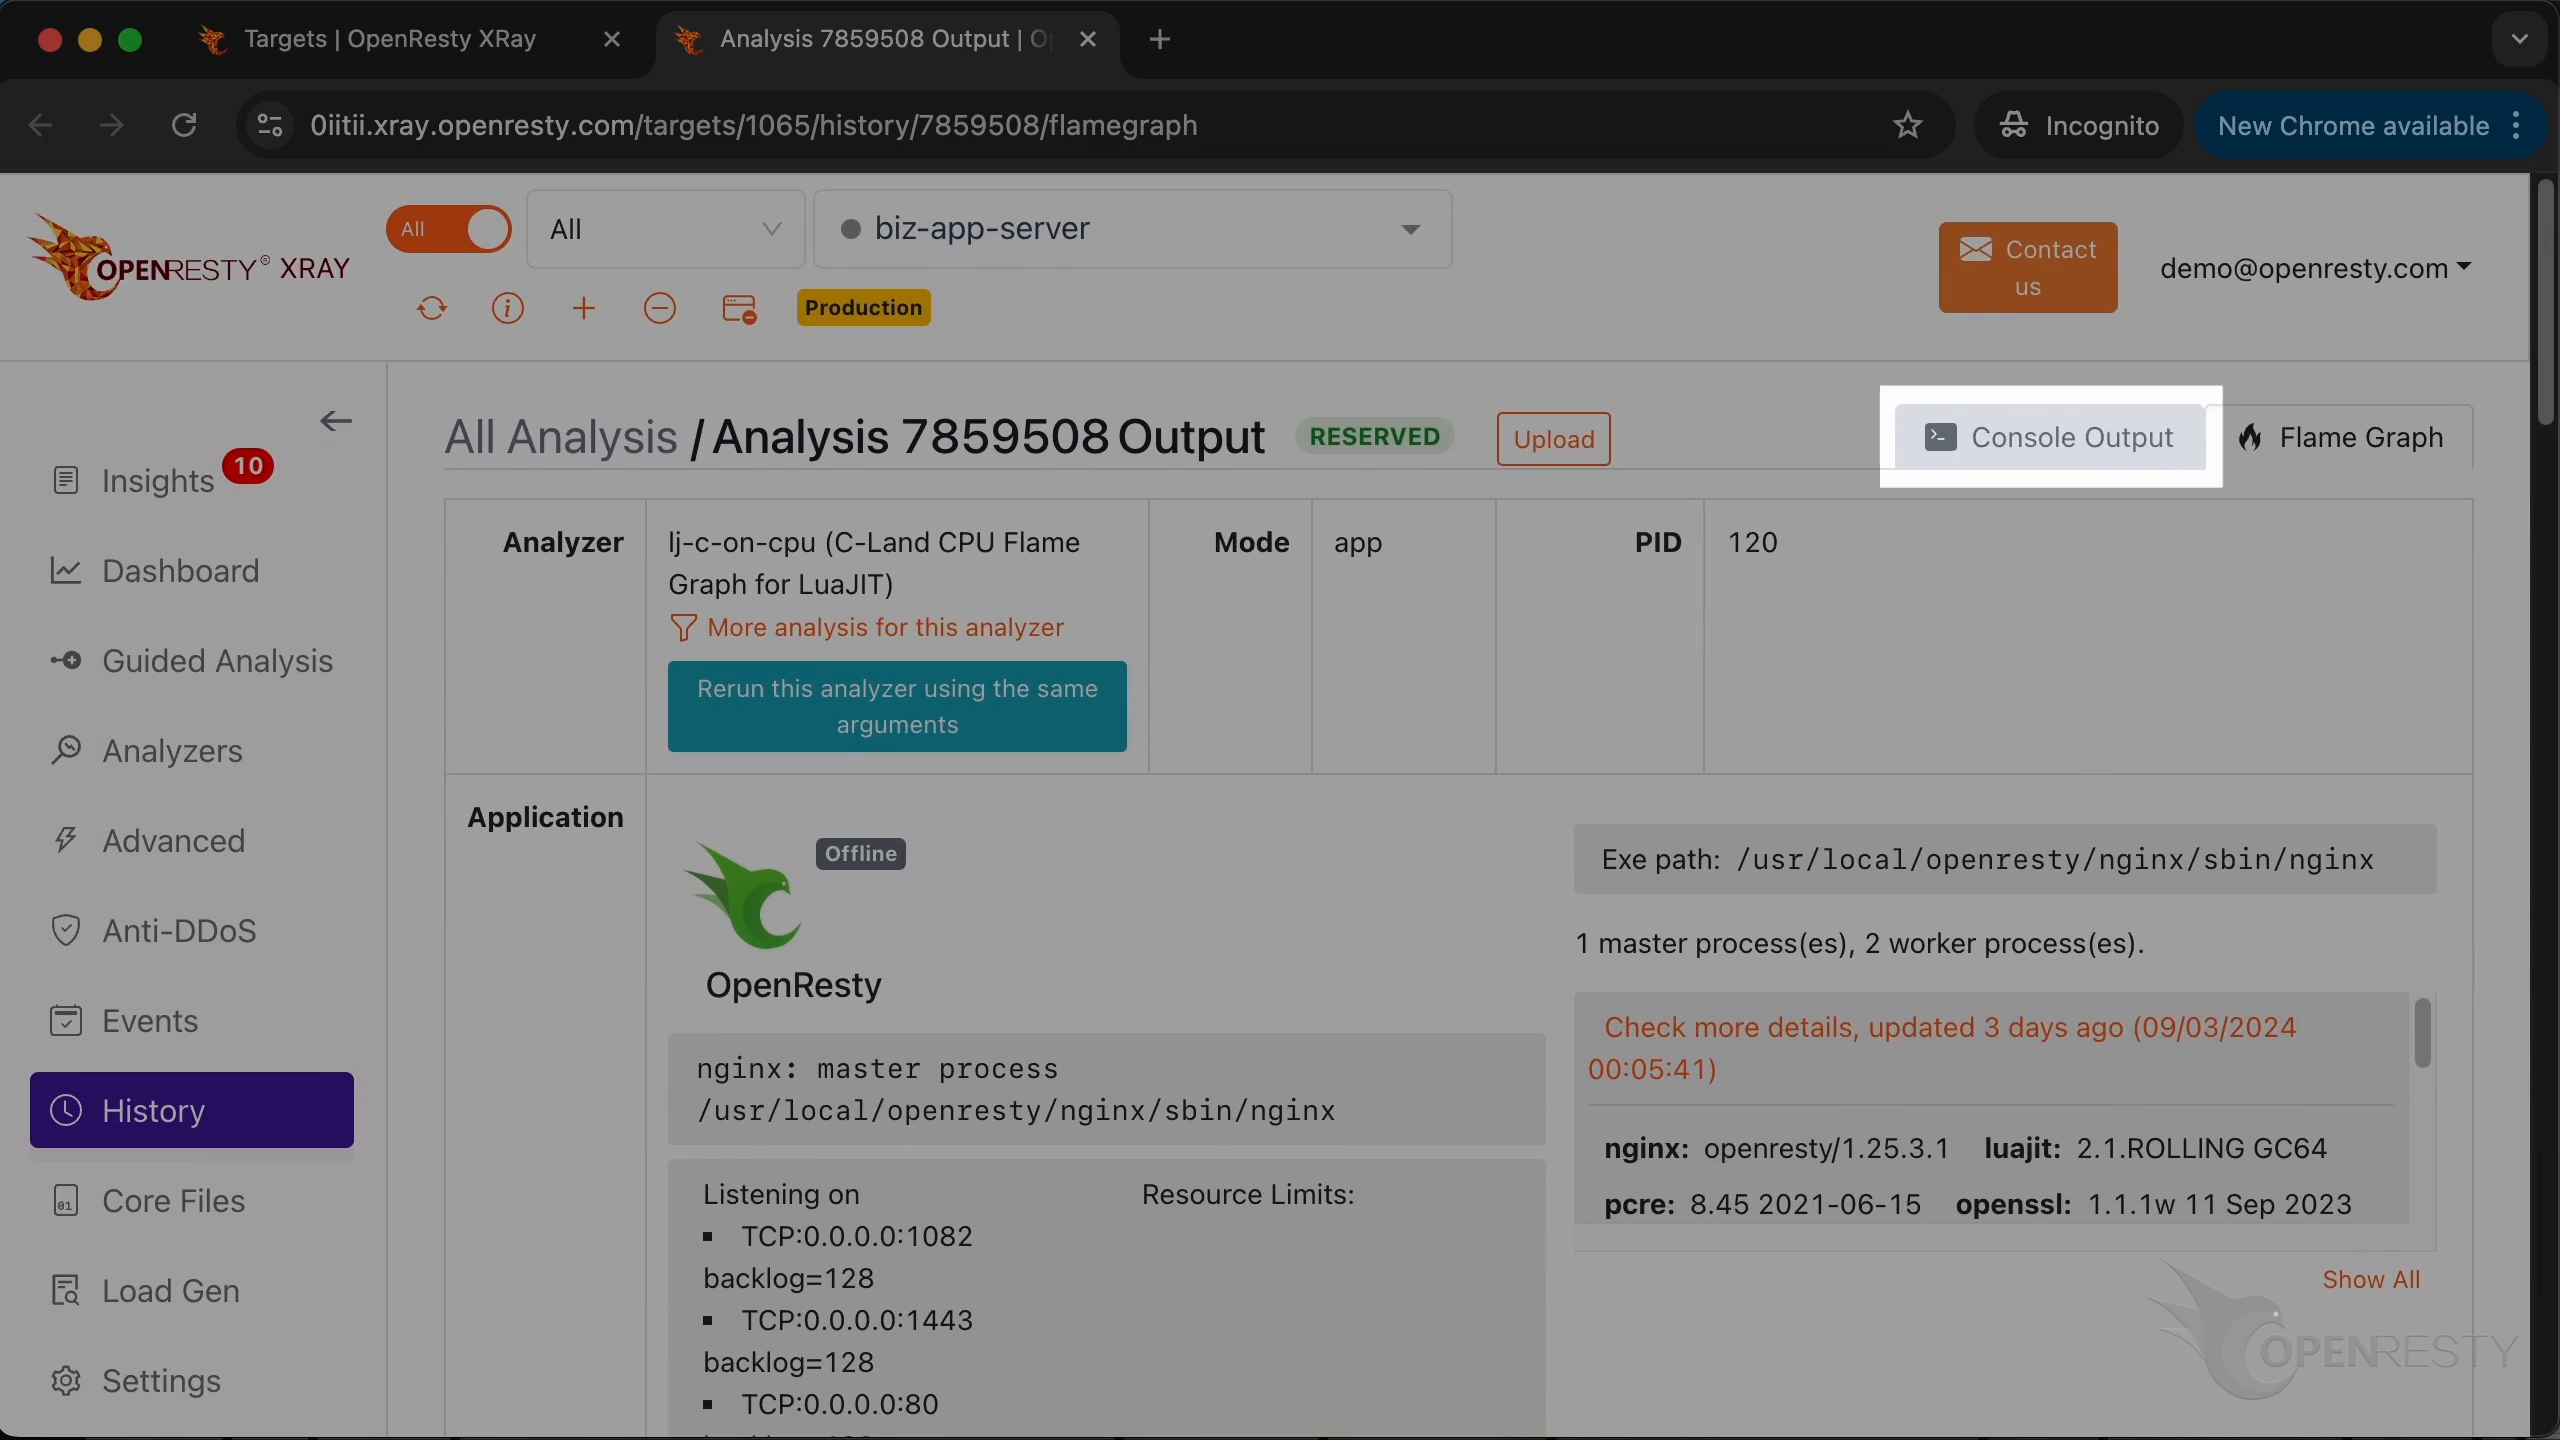
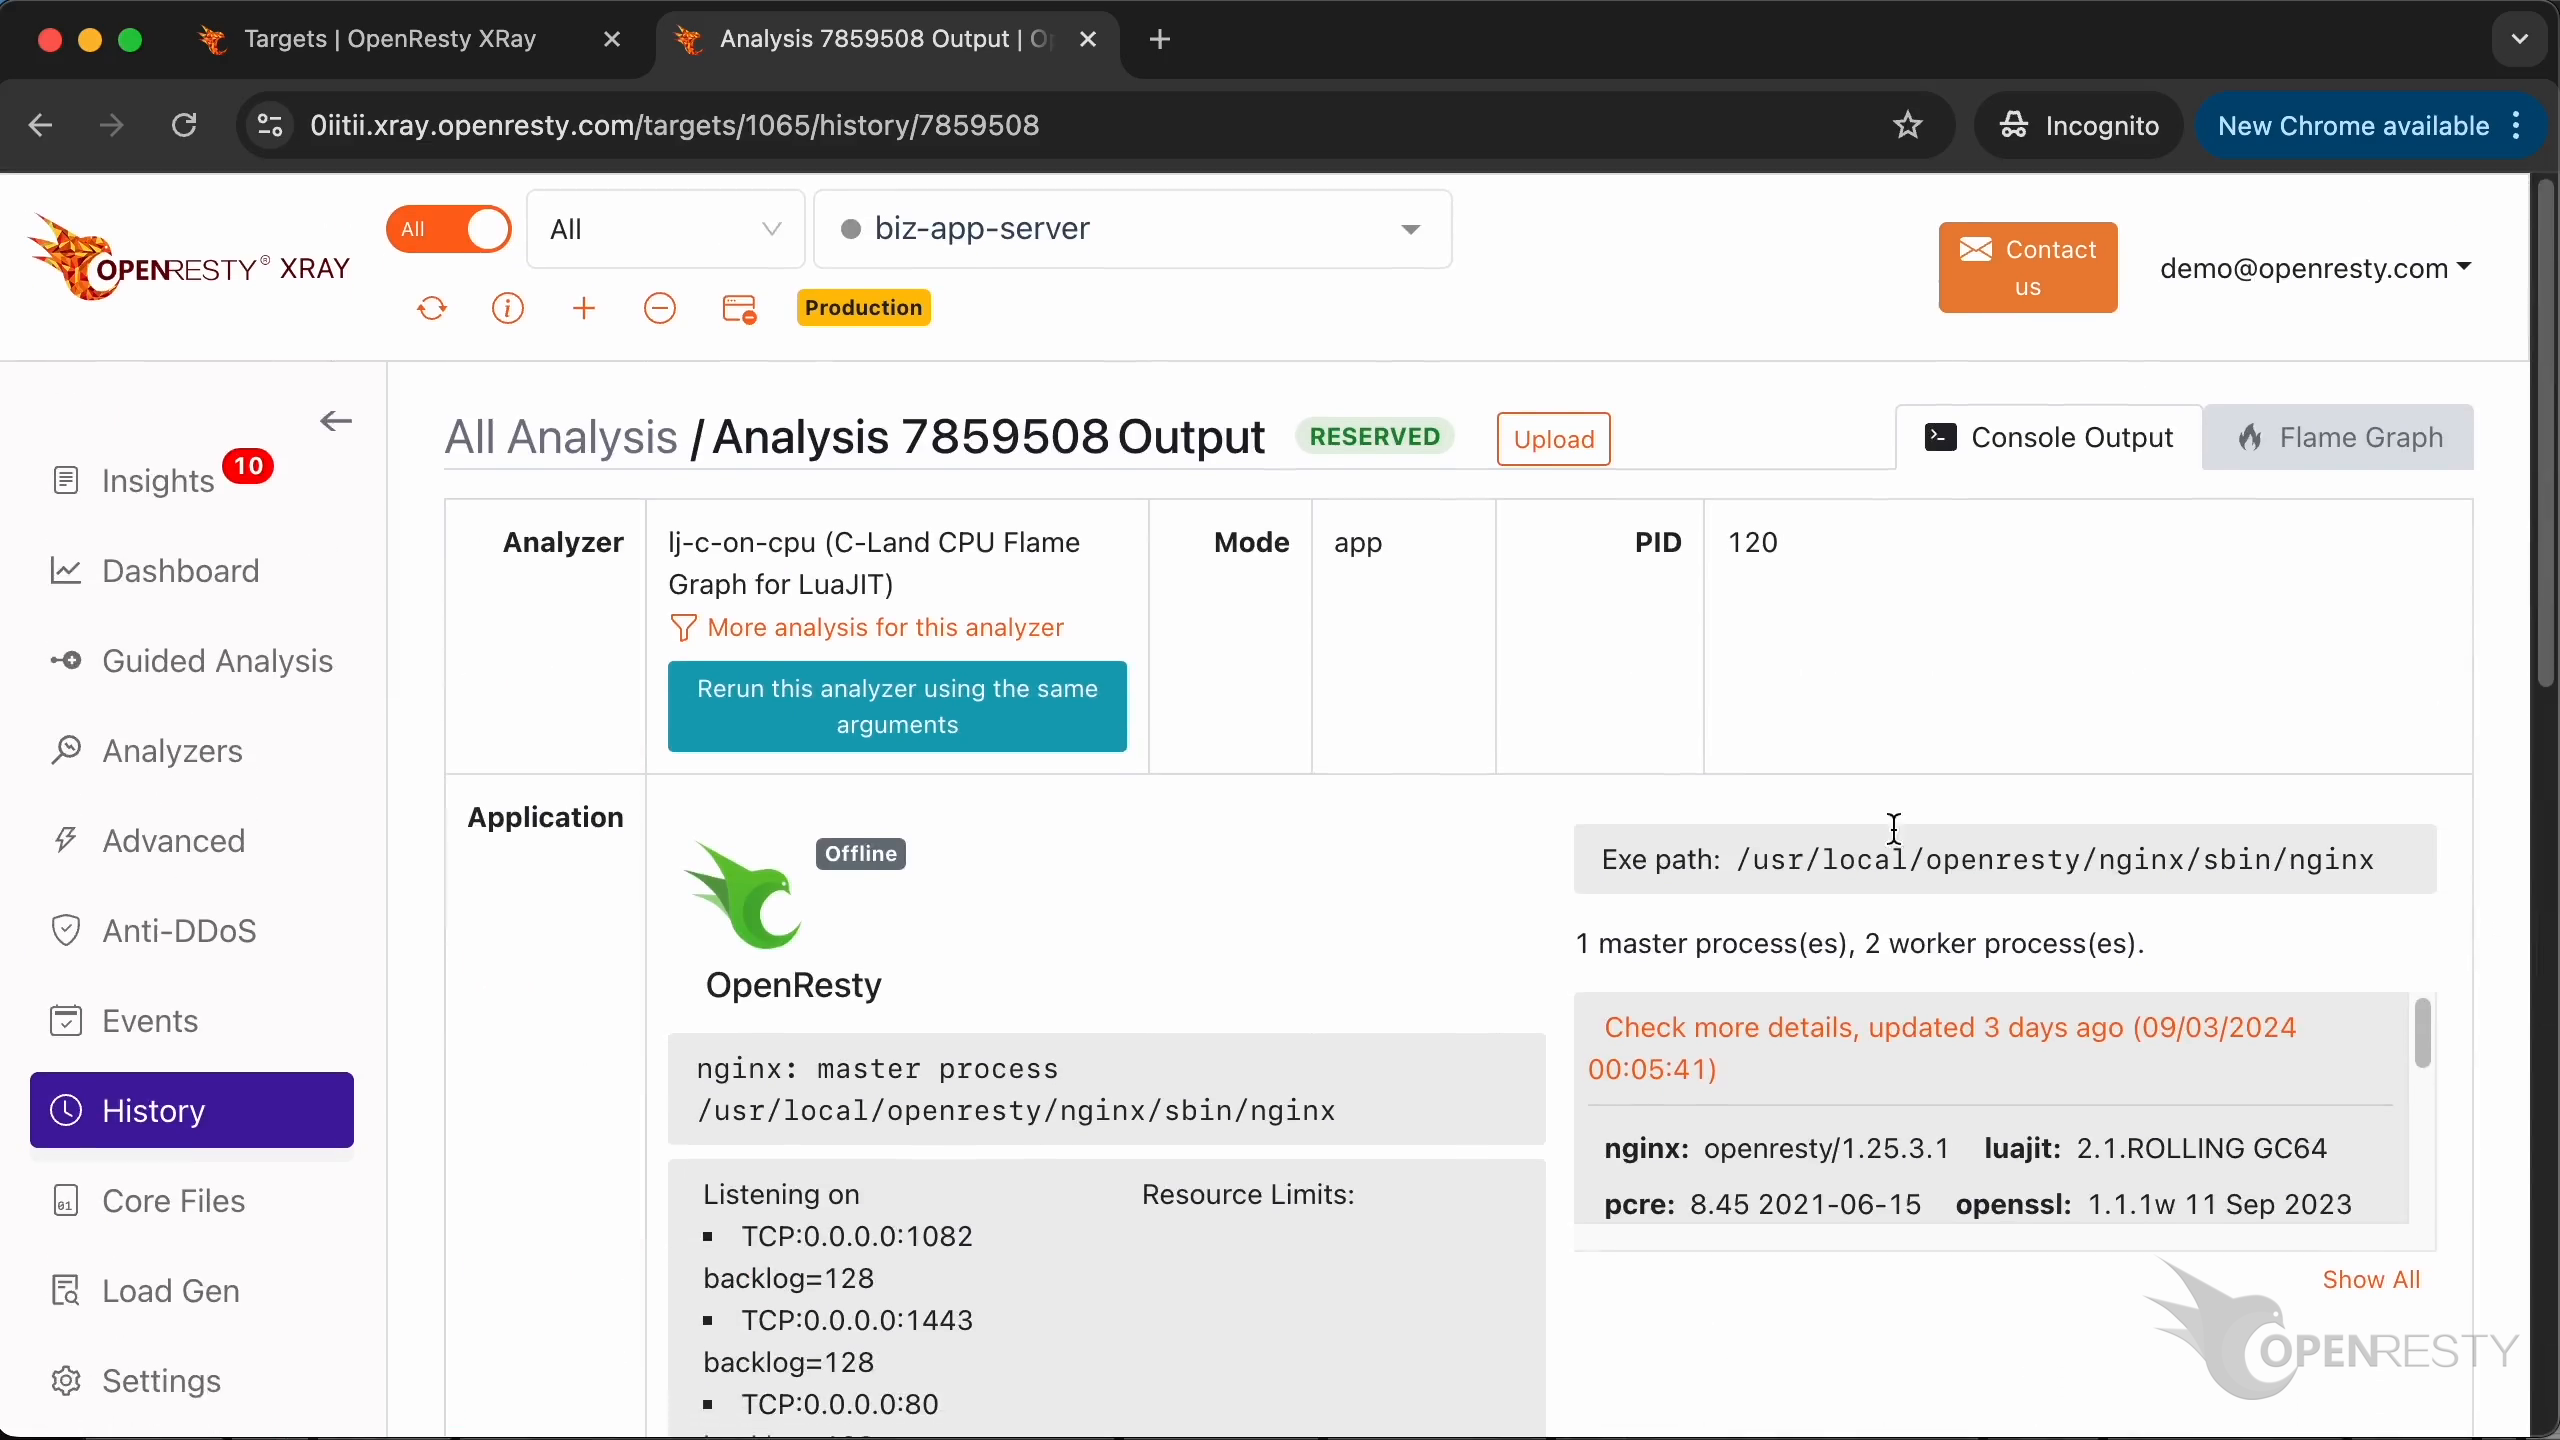
And the complete terminal output.

OpenResty XRay can help you quickly discover and solve problems of your applications.
What metrics does the OpenResty XRay Dashboard show?
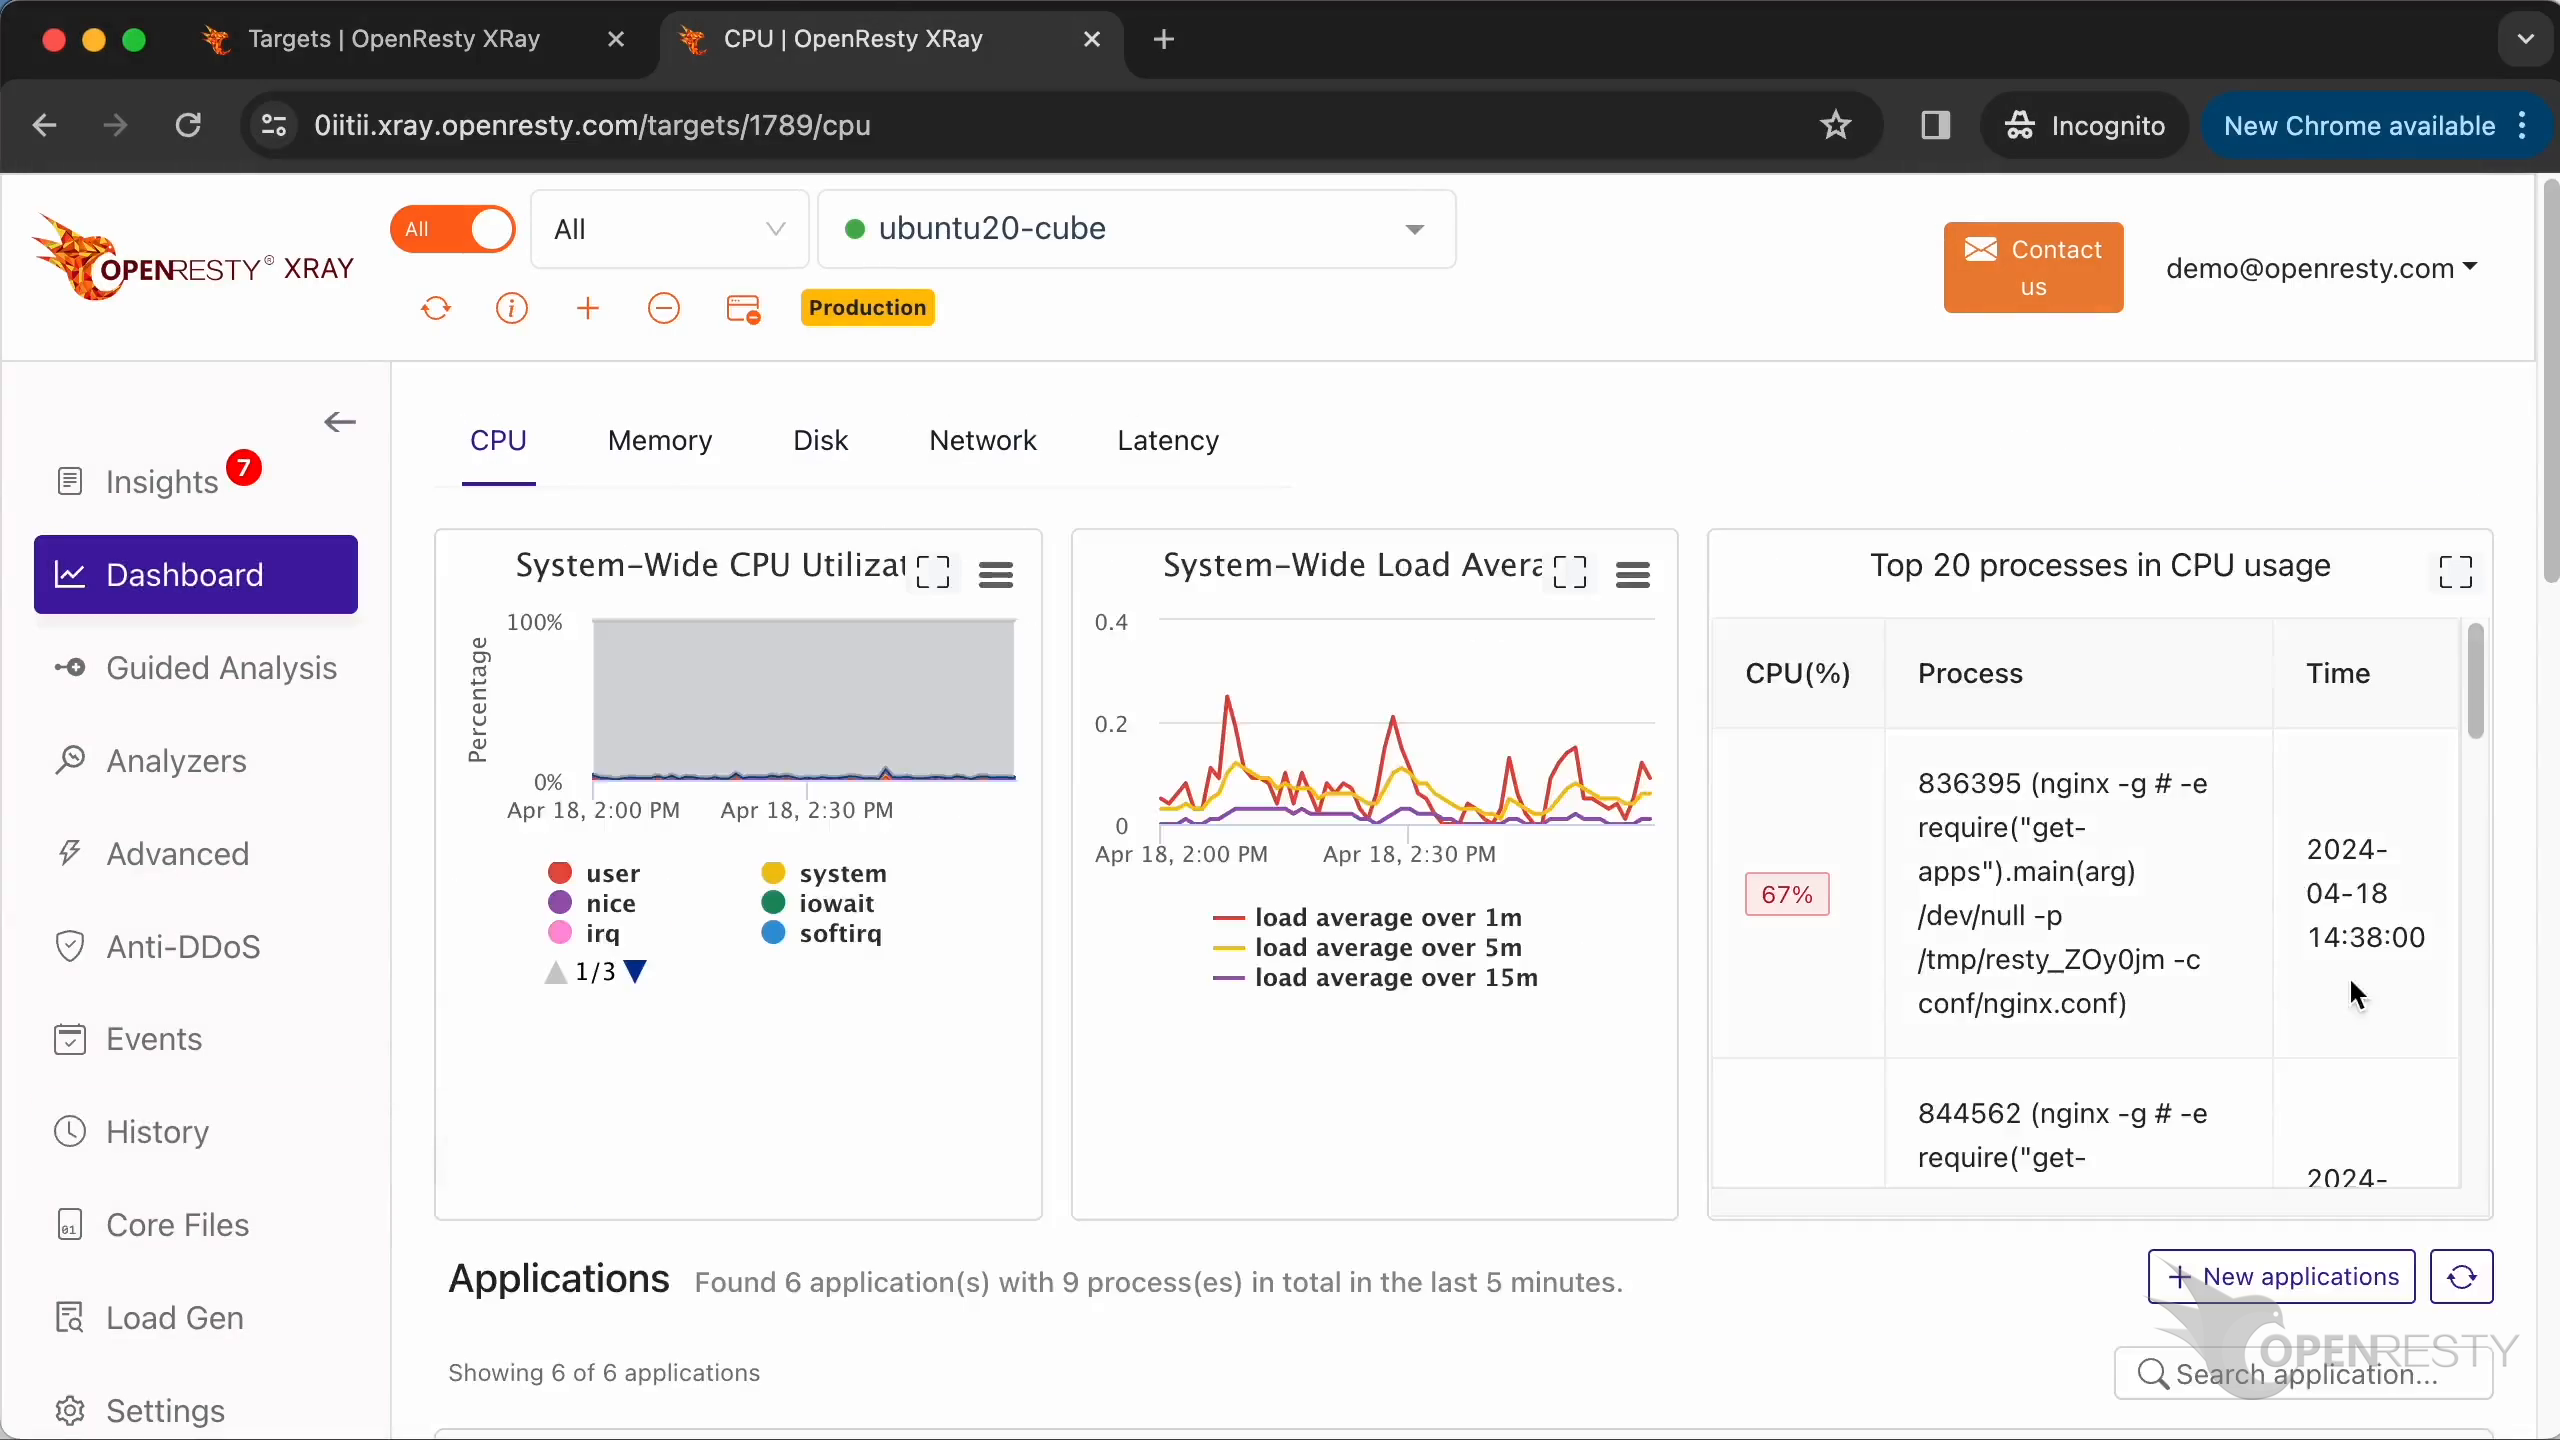
The Dashboard shows real-time CPU and memory metrics, plus per-application charts for runtimes like Go. Visit the “Dashboard” page for more detailed monitoring data.
Here are system metrics that display your system’s performance data.
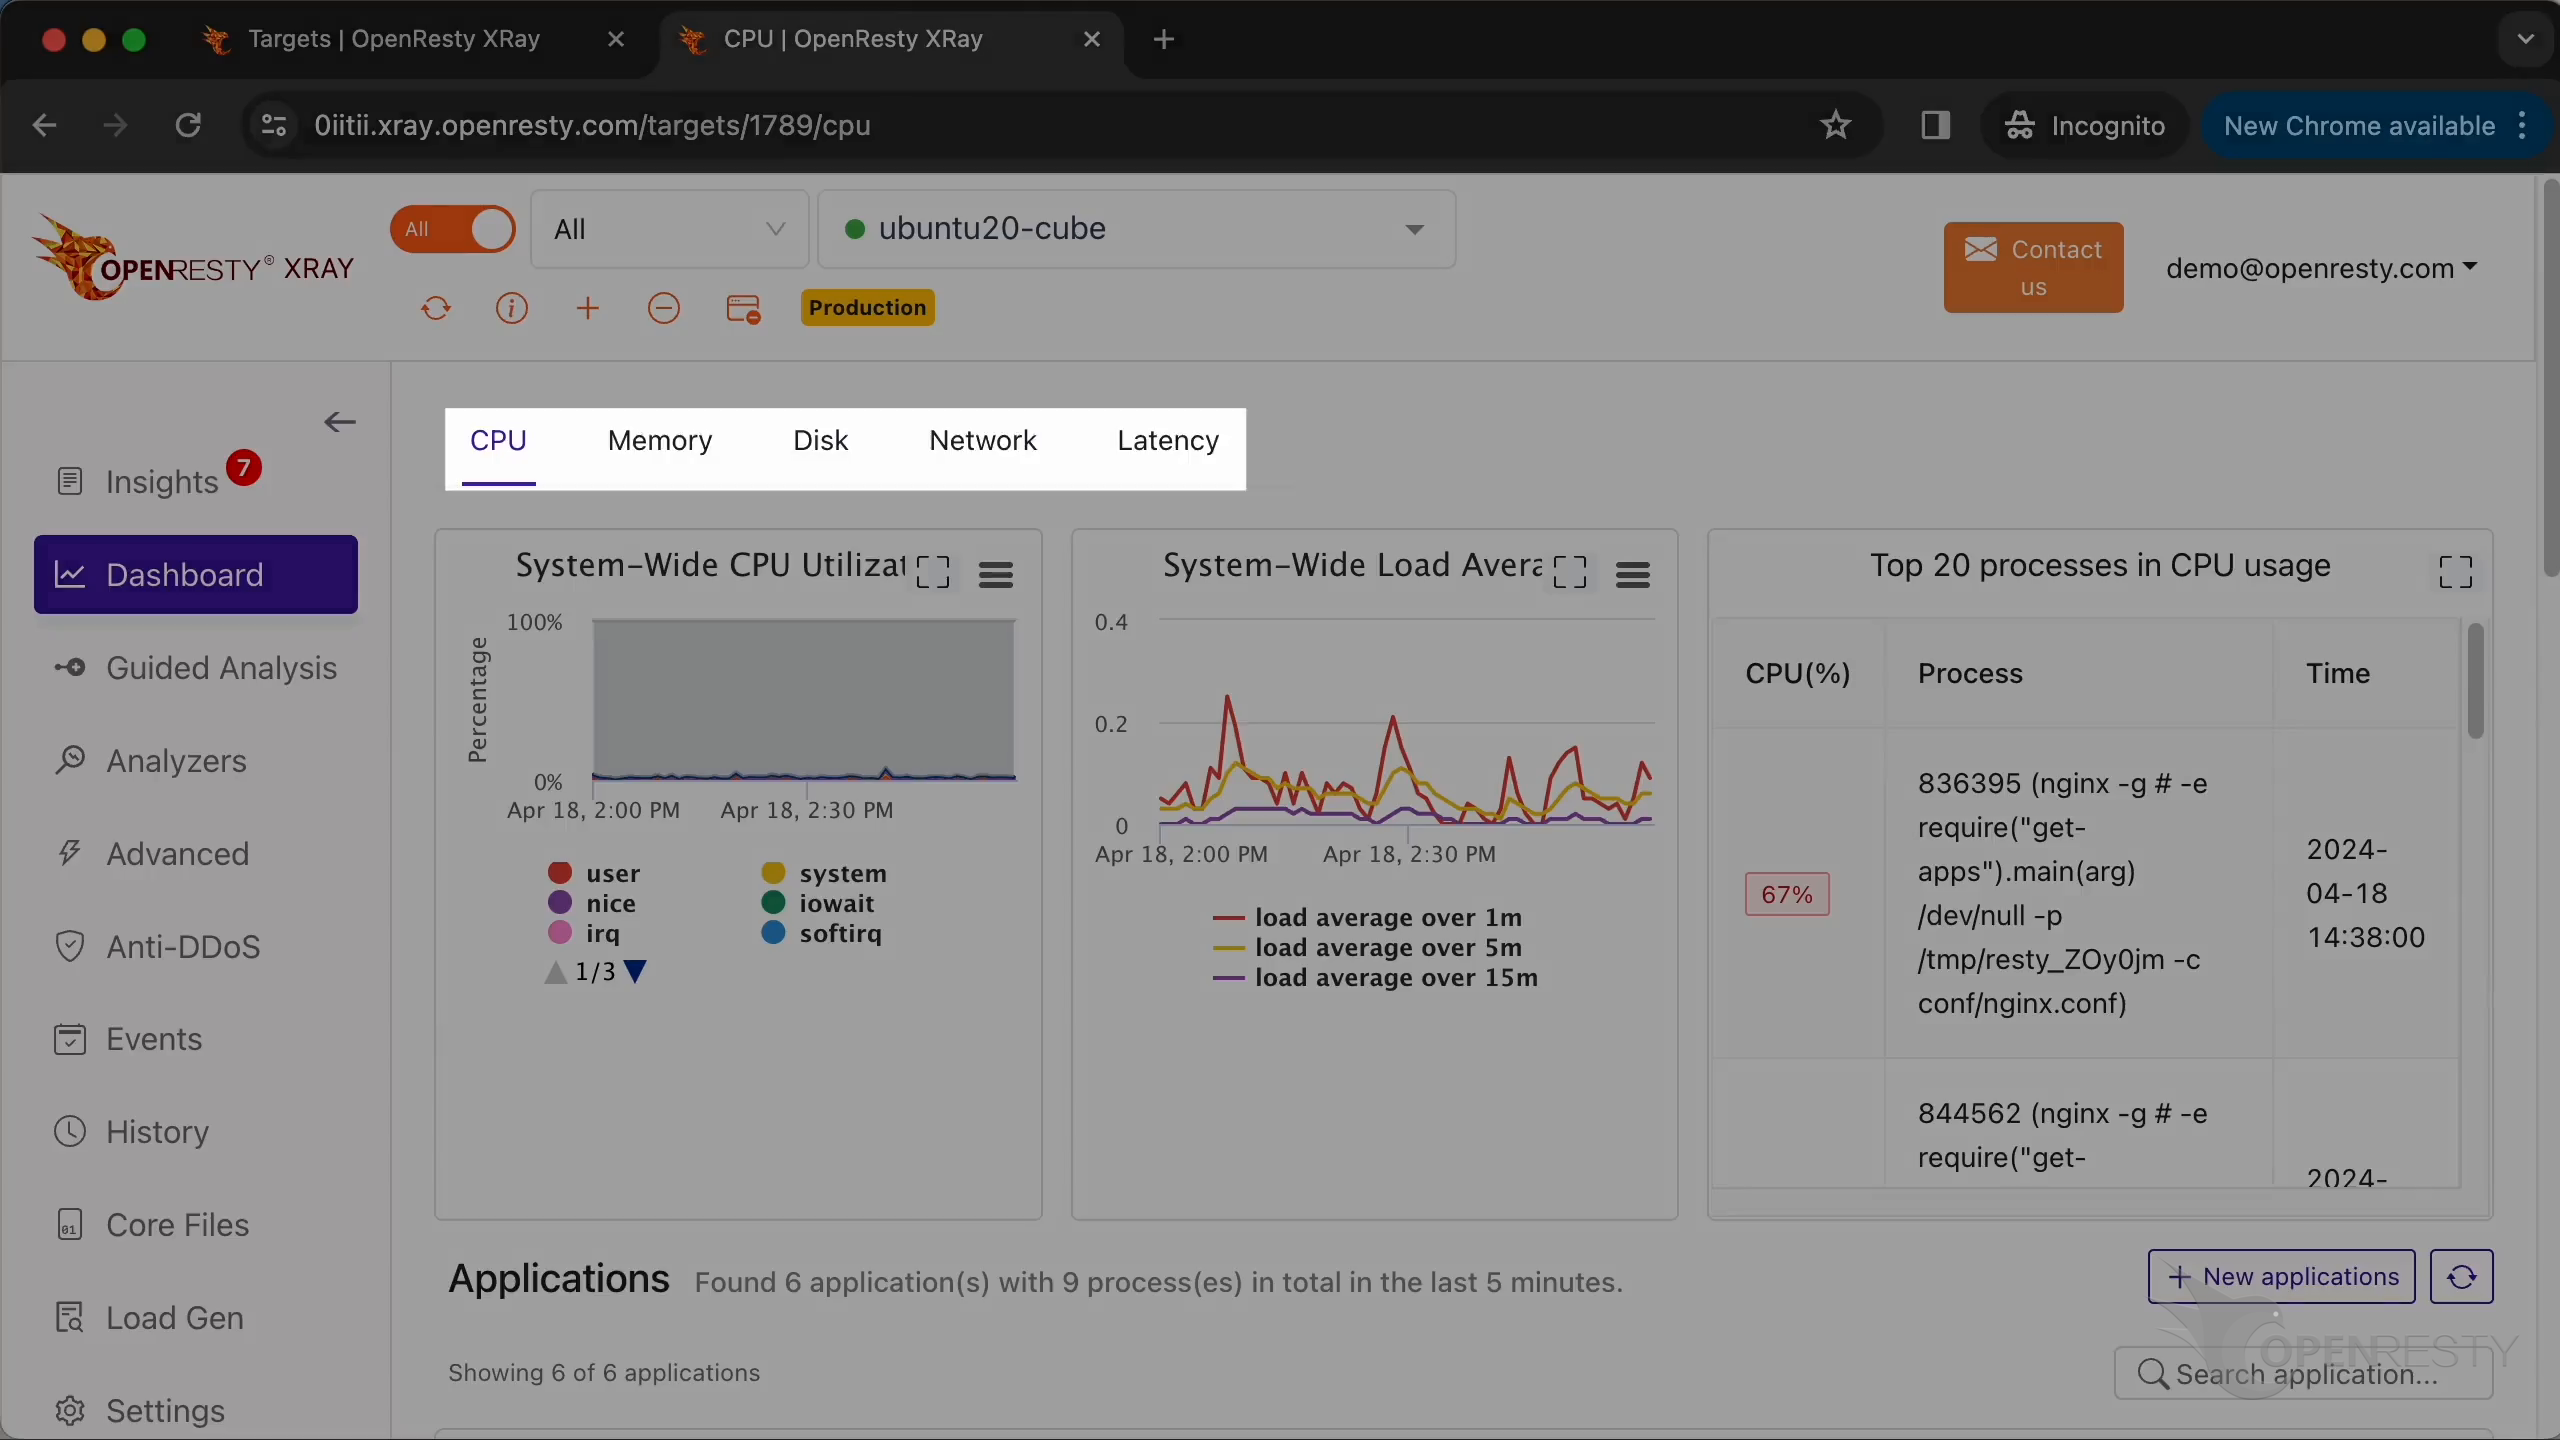
You can easily switch in the upper corner to view other types of metrics.
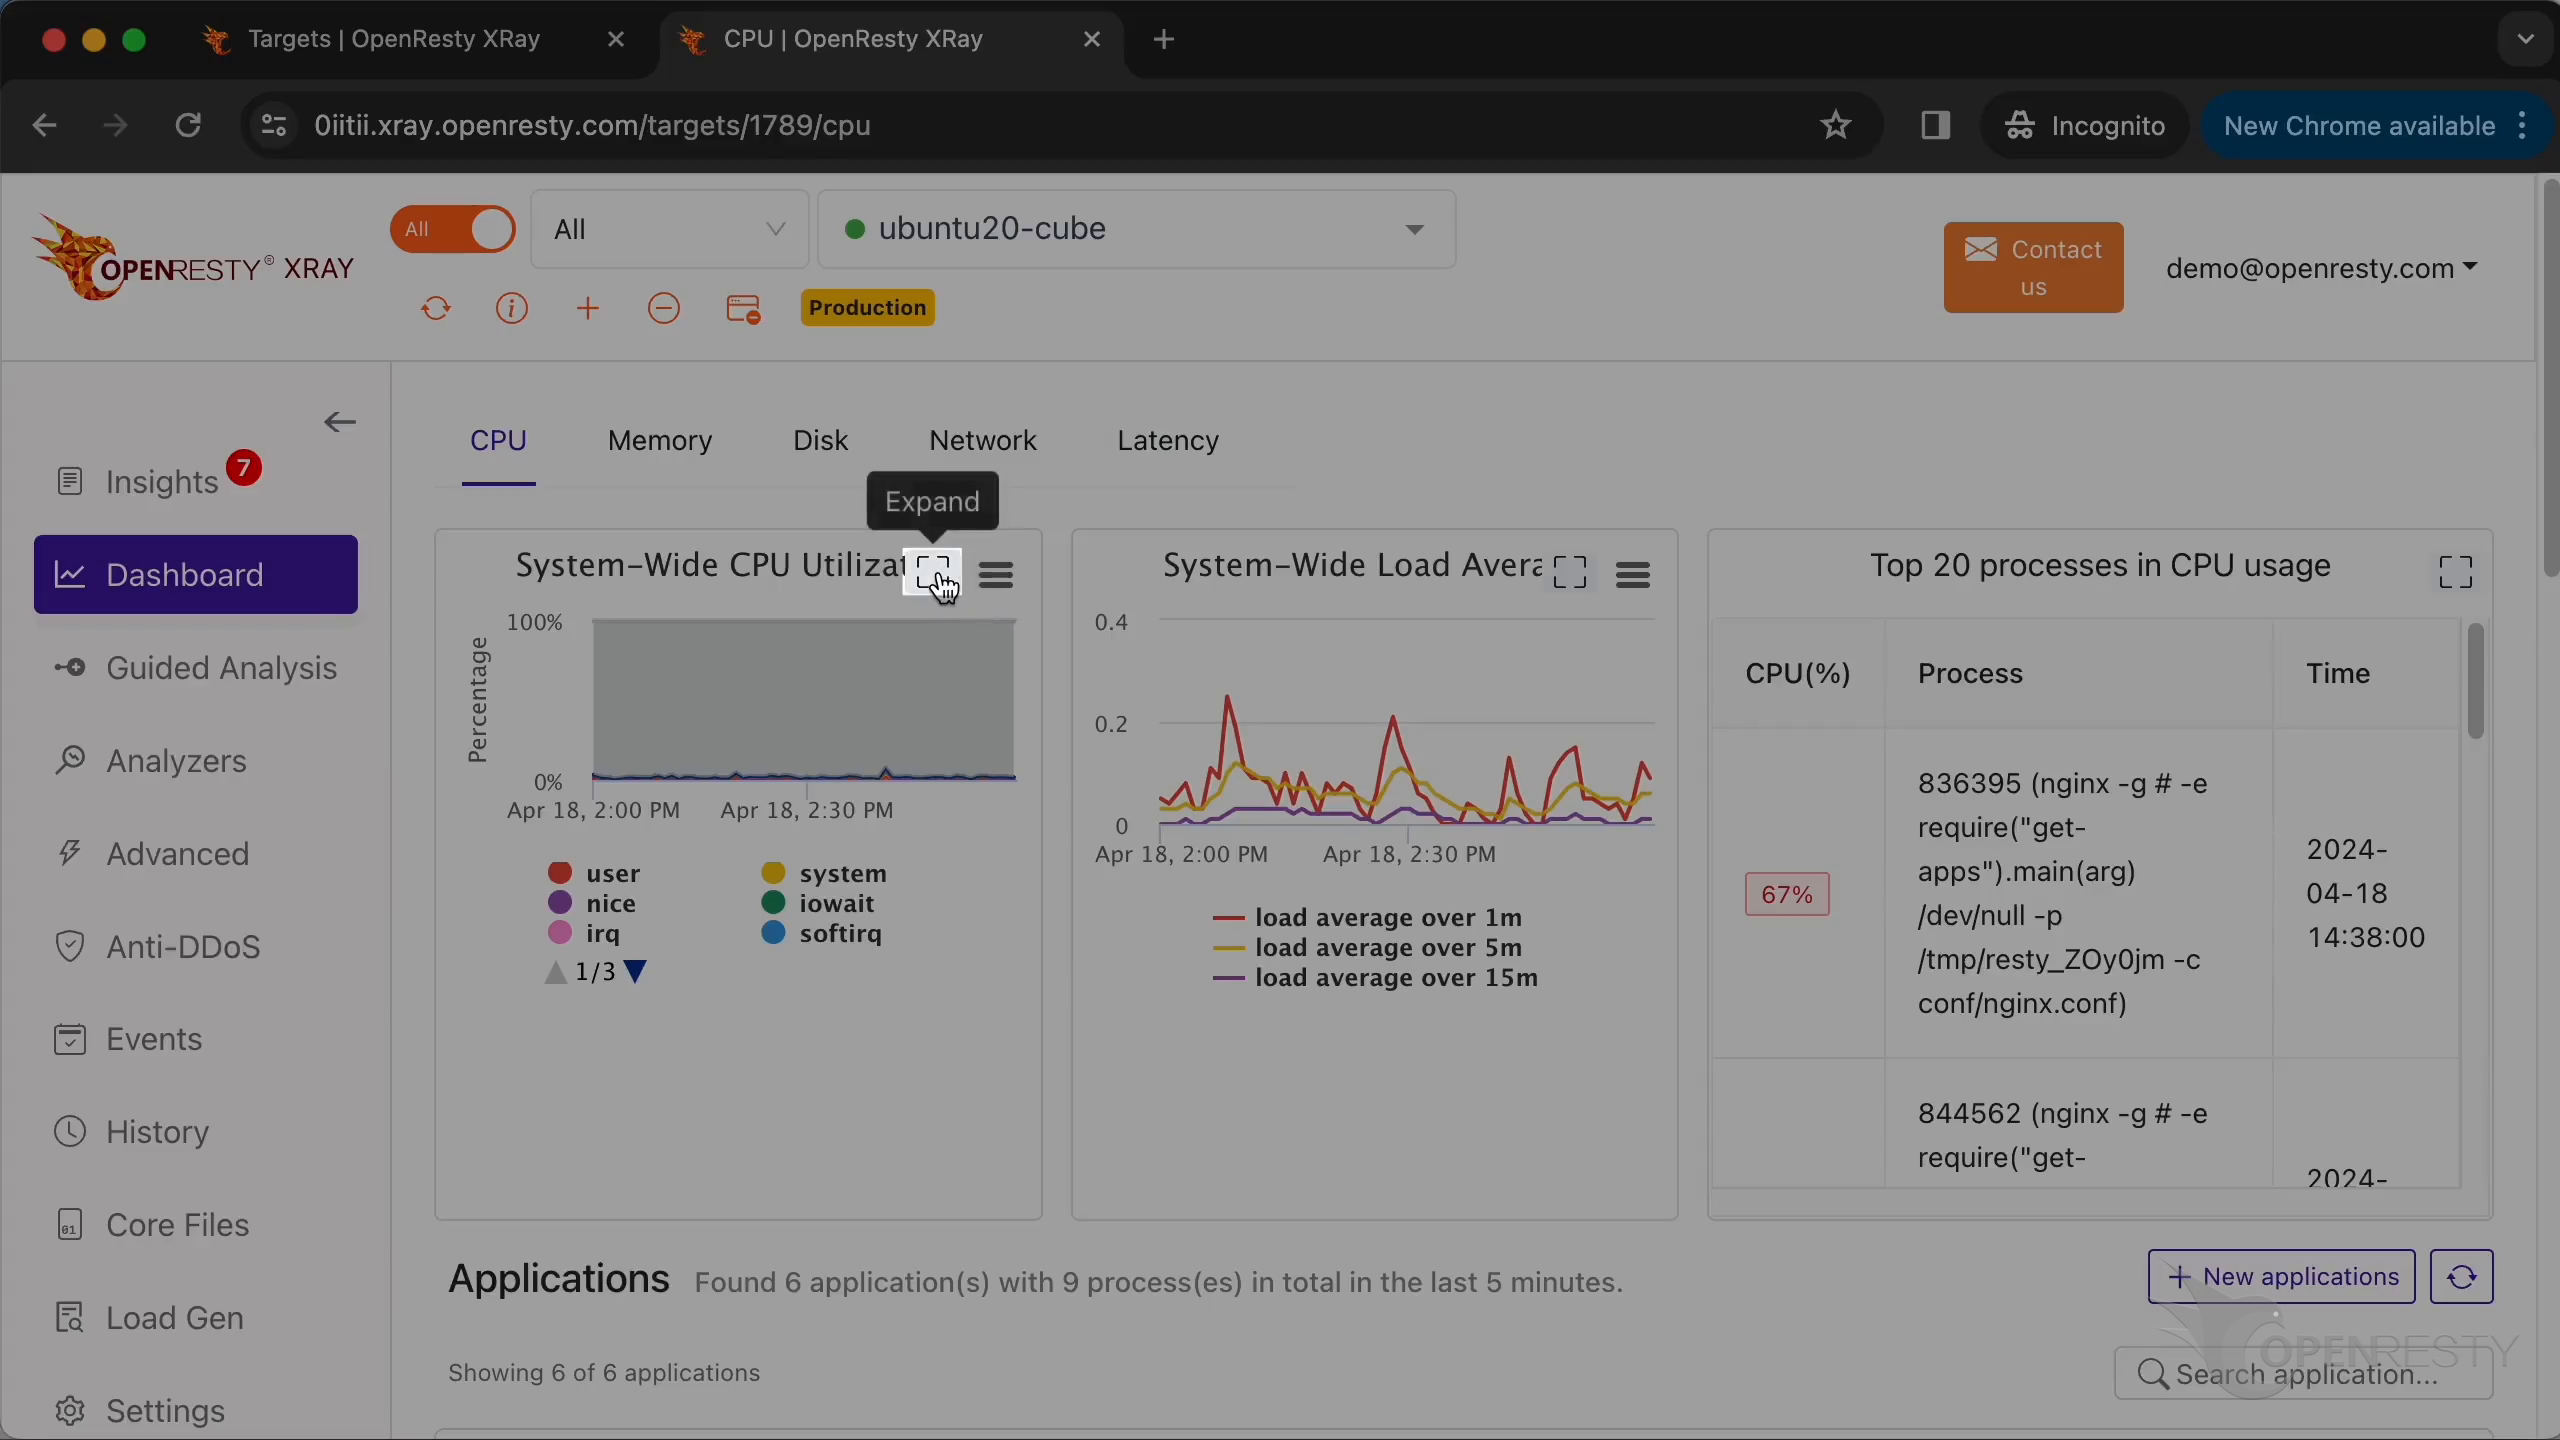
Here are different kinds of charts related to CPU usage in real time.
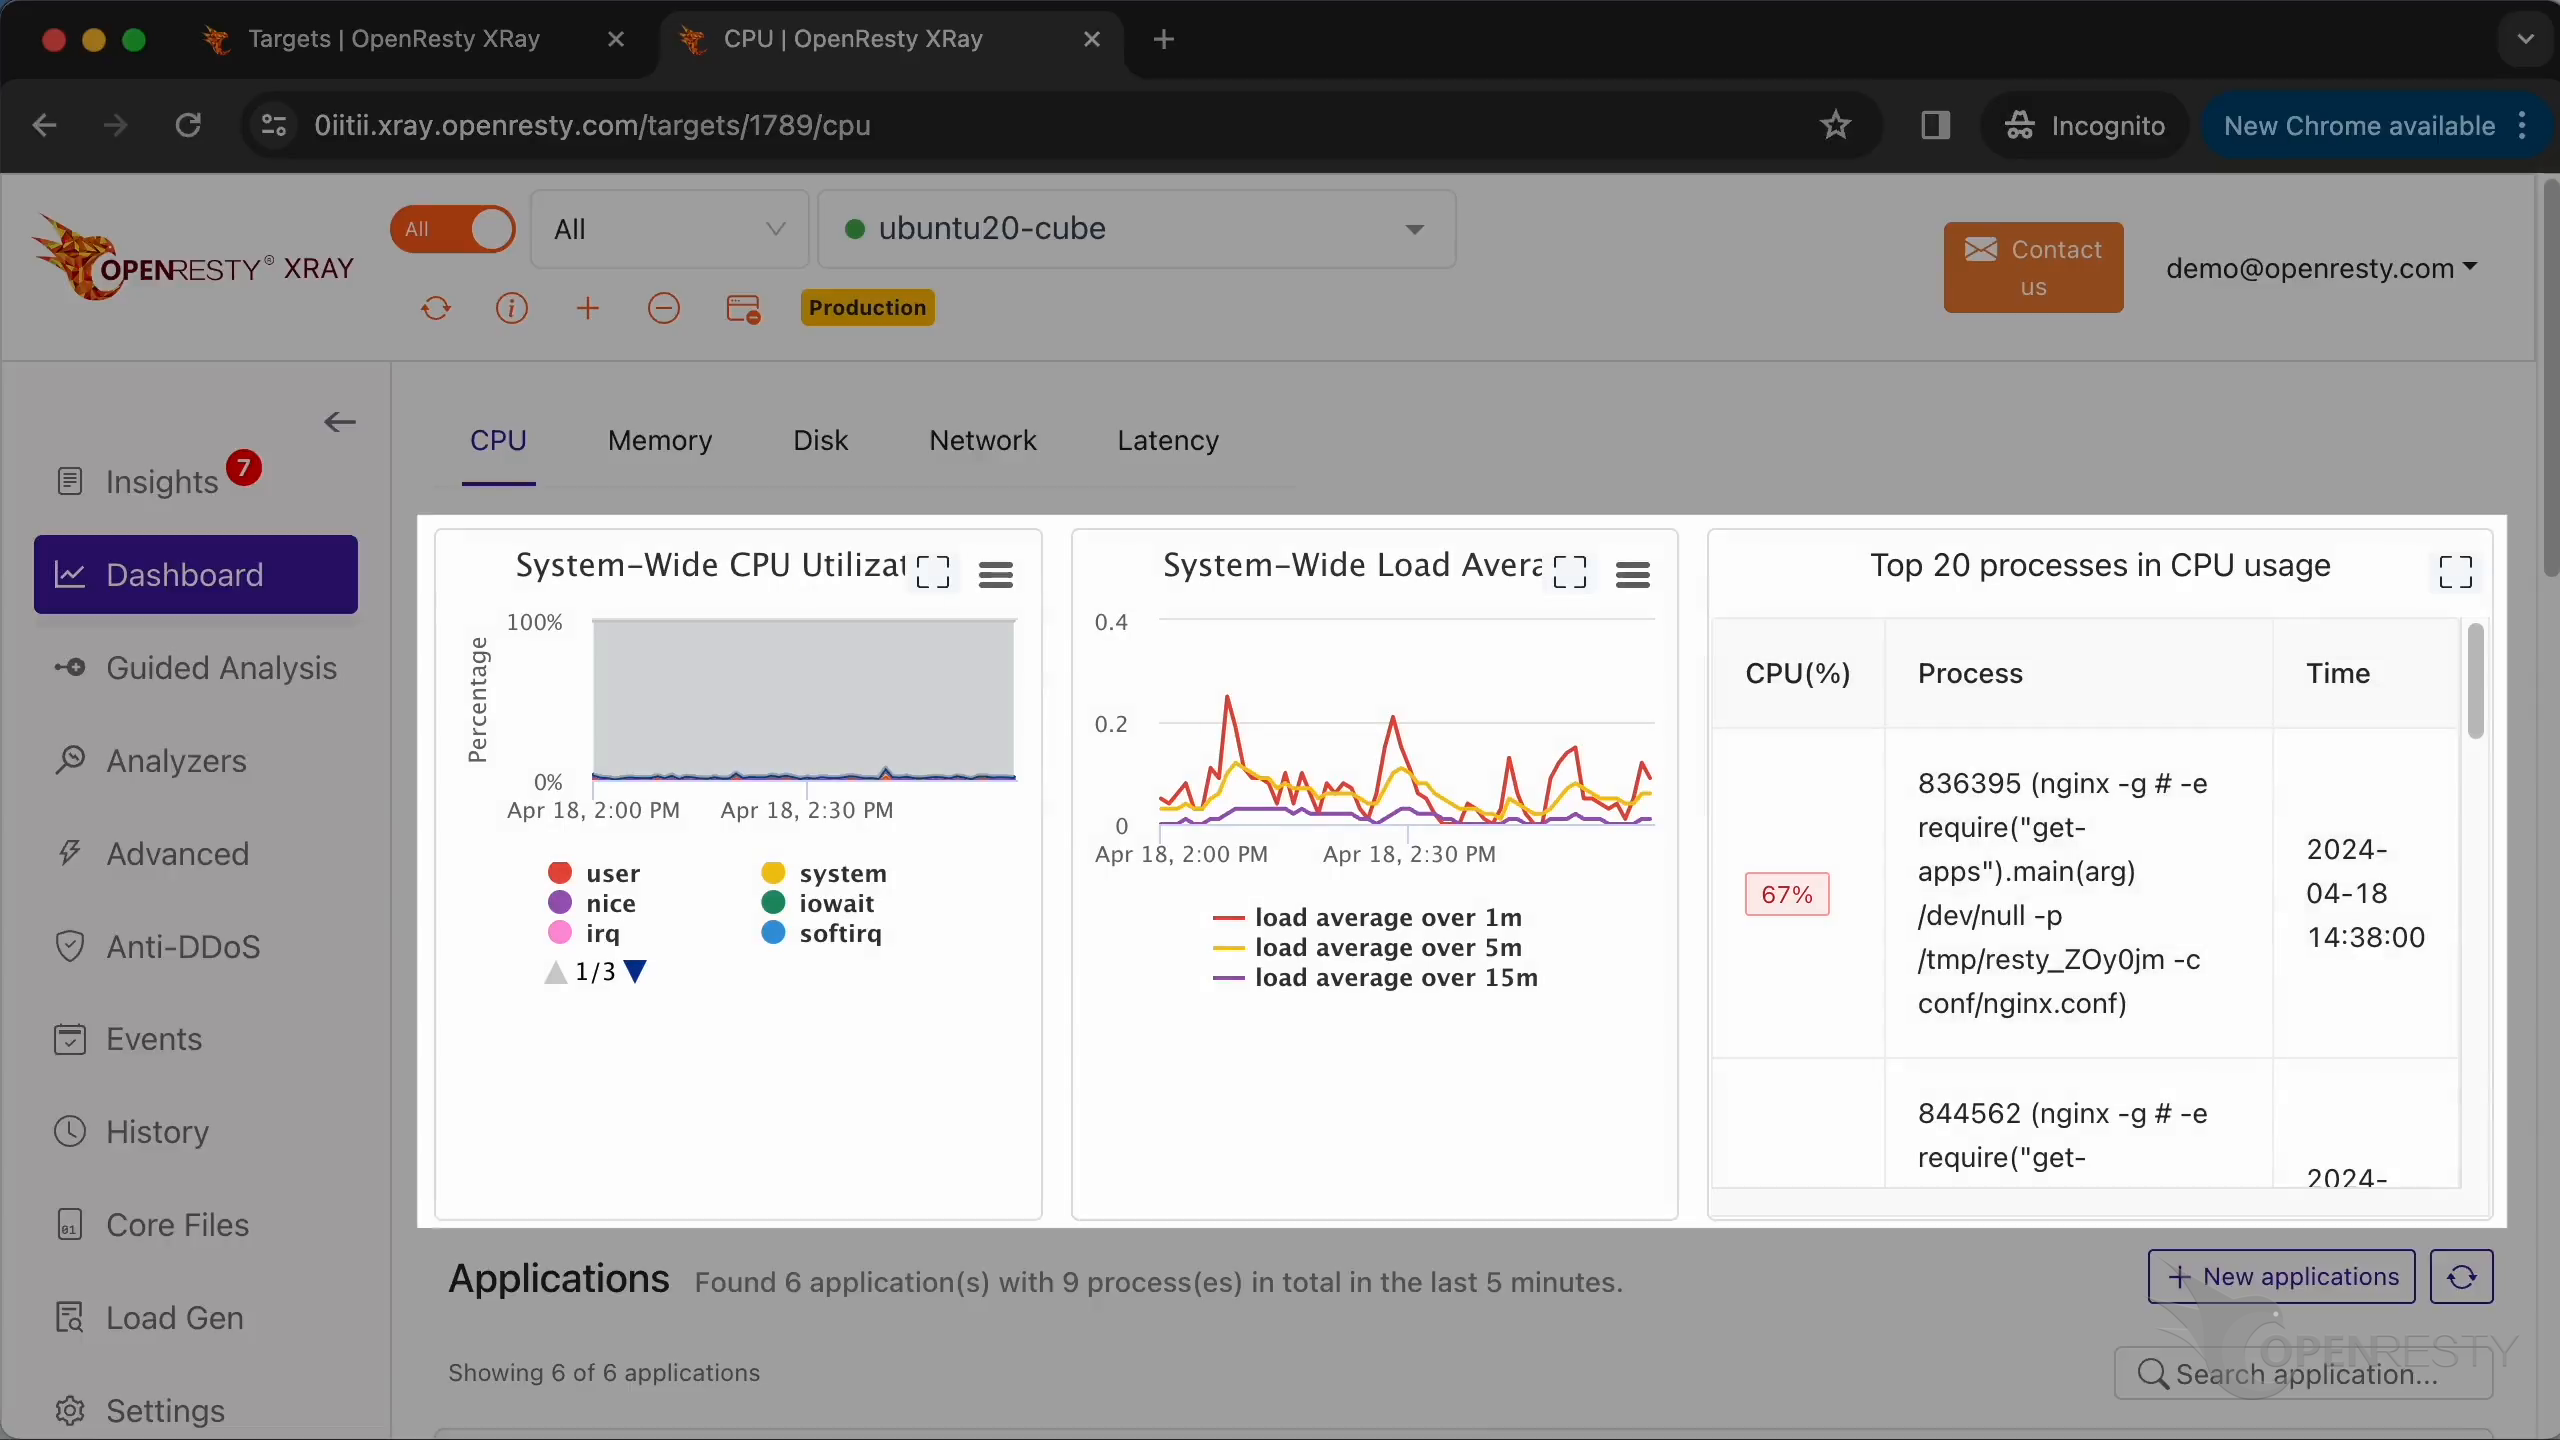
Click to view this chart on the full screen.
Now, it shows data from the past 1 hour.
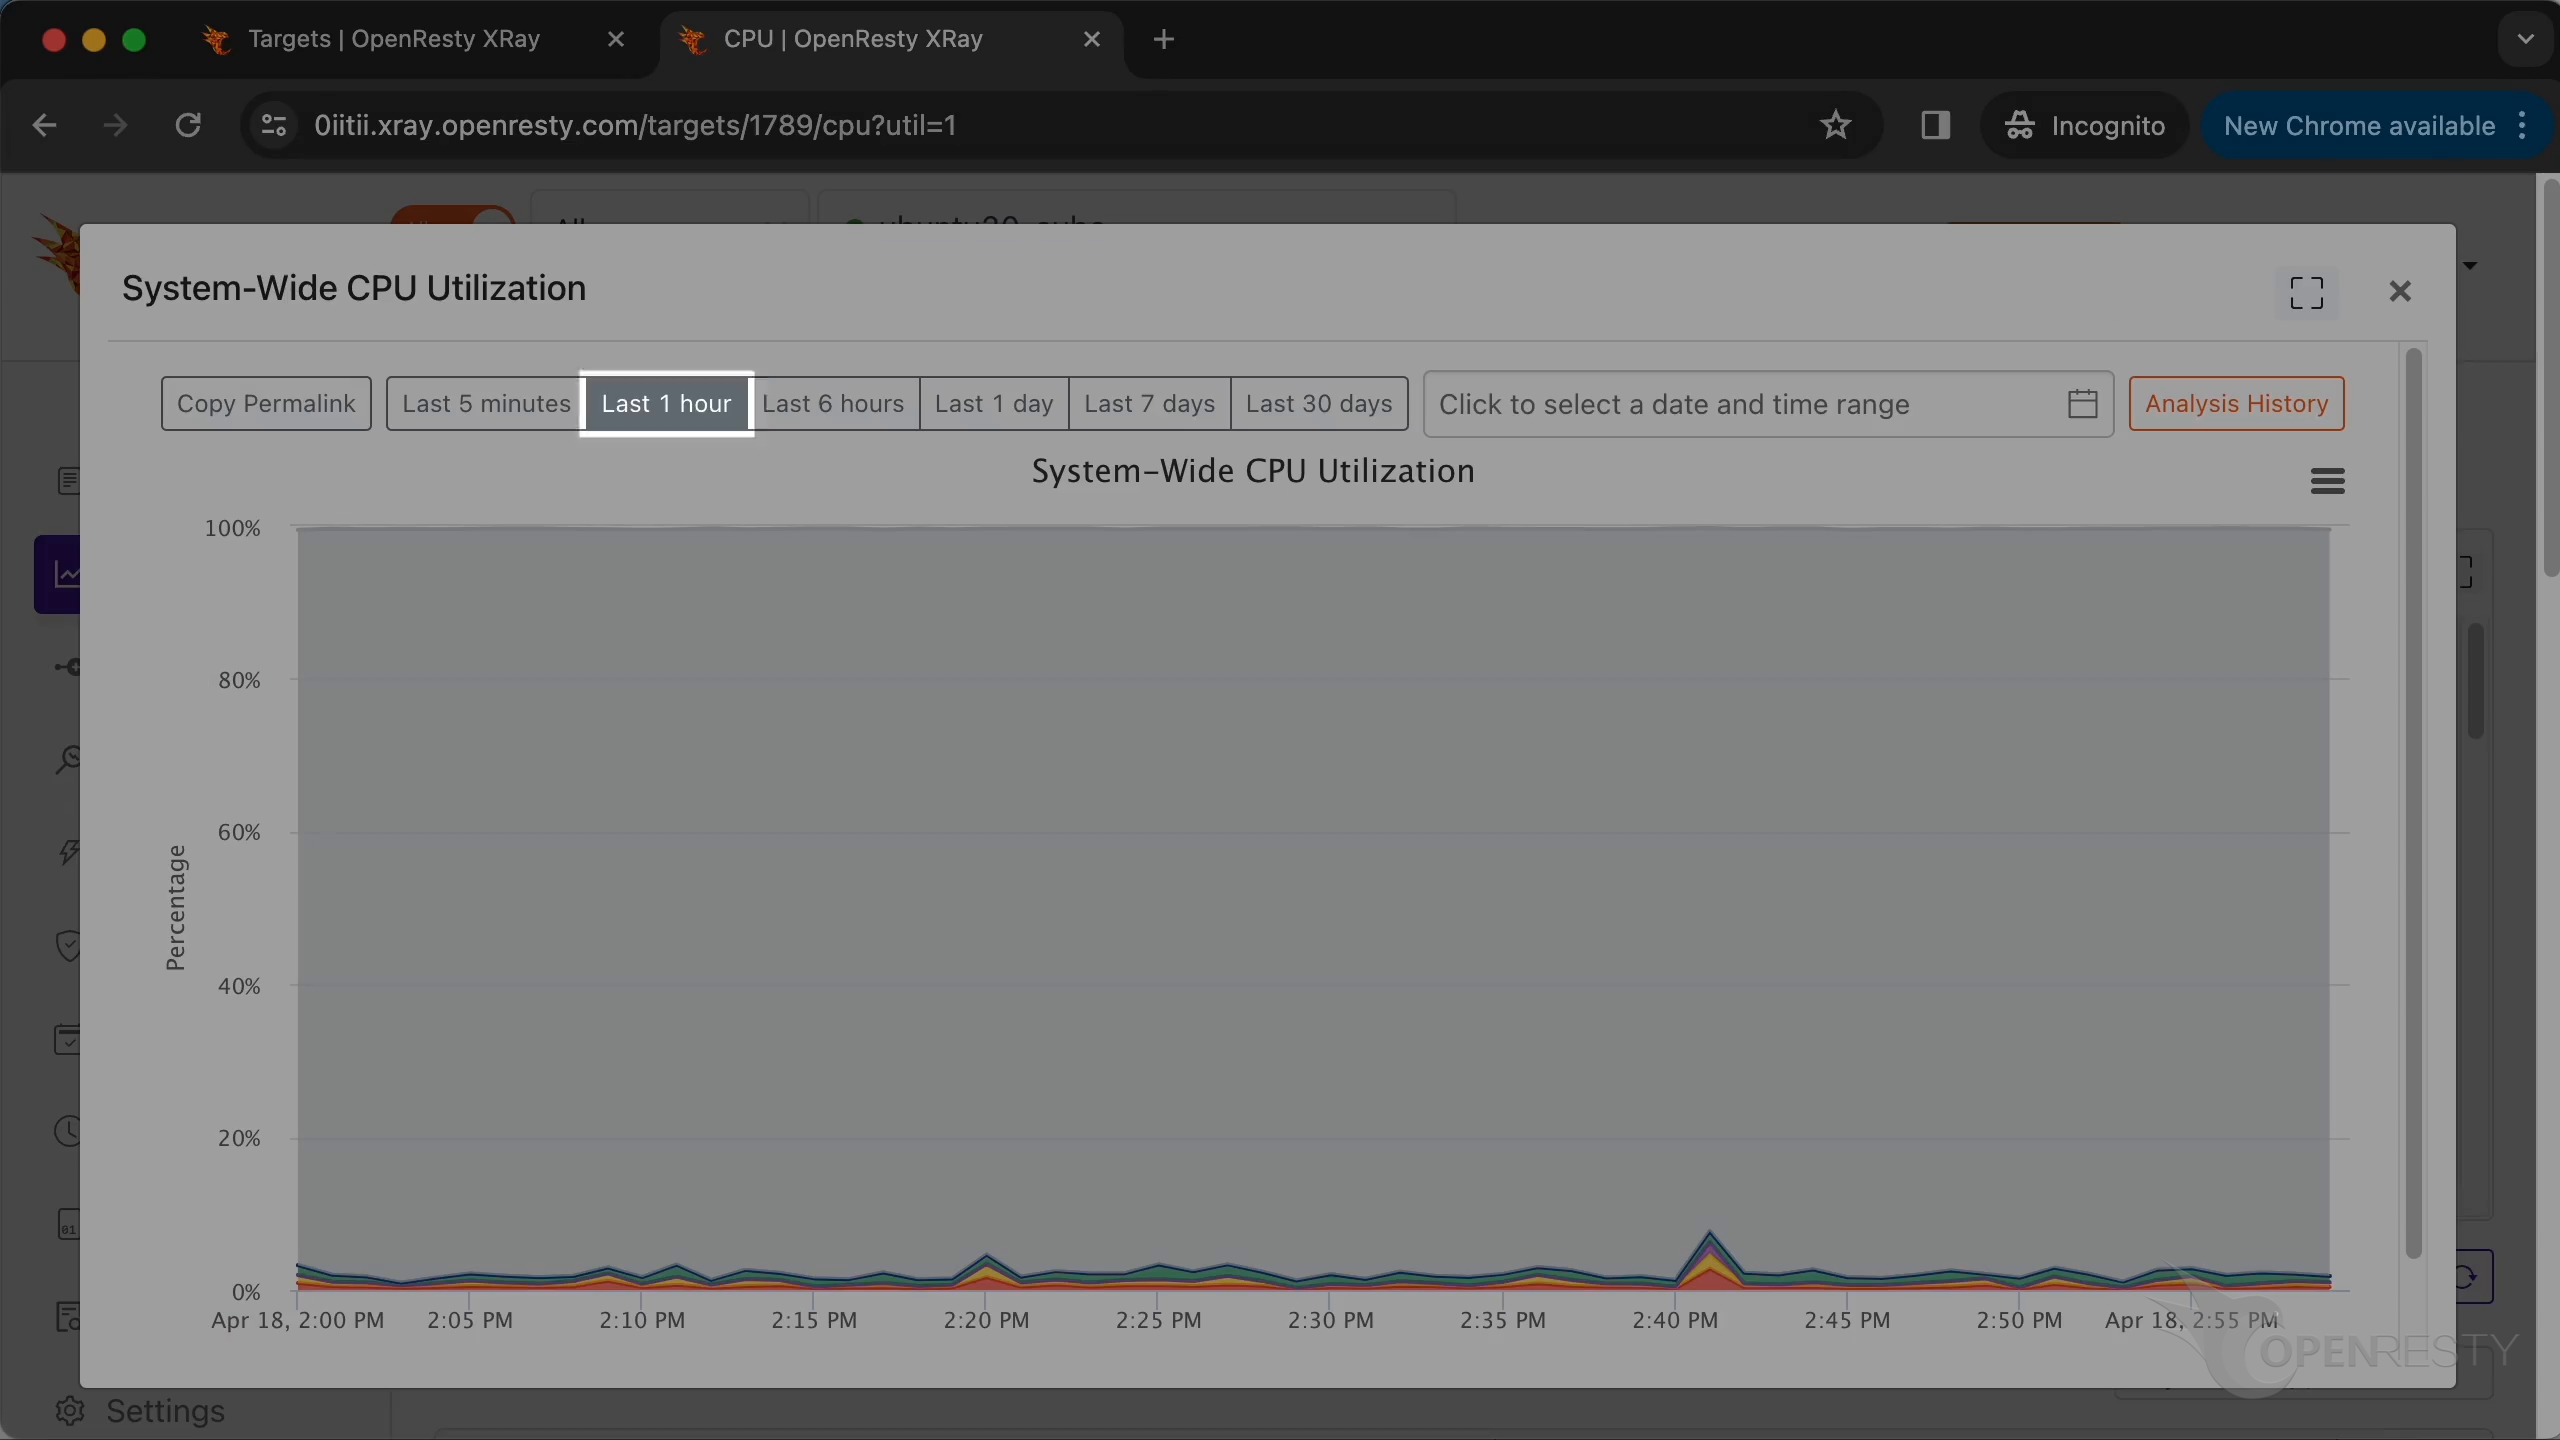
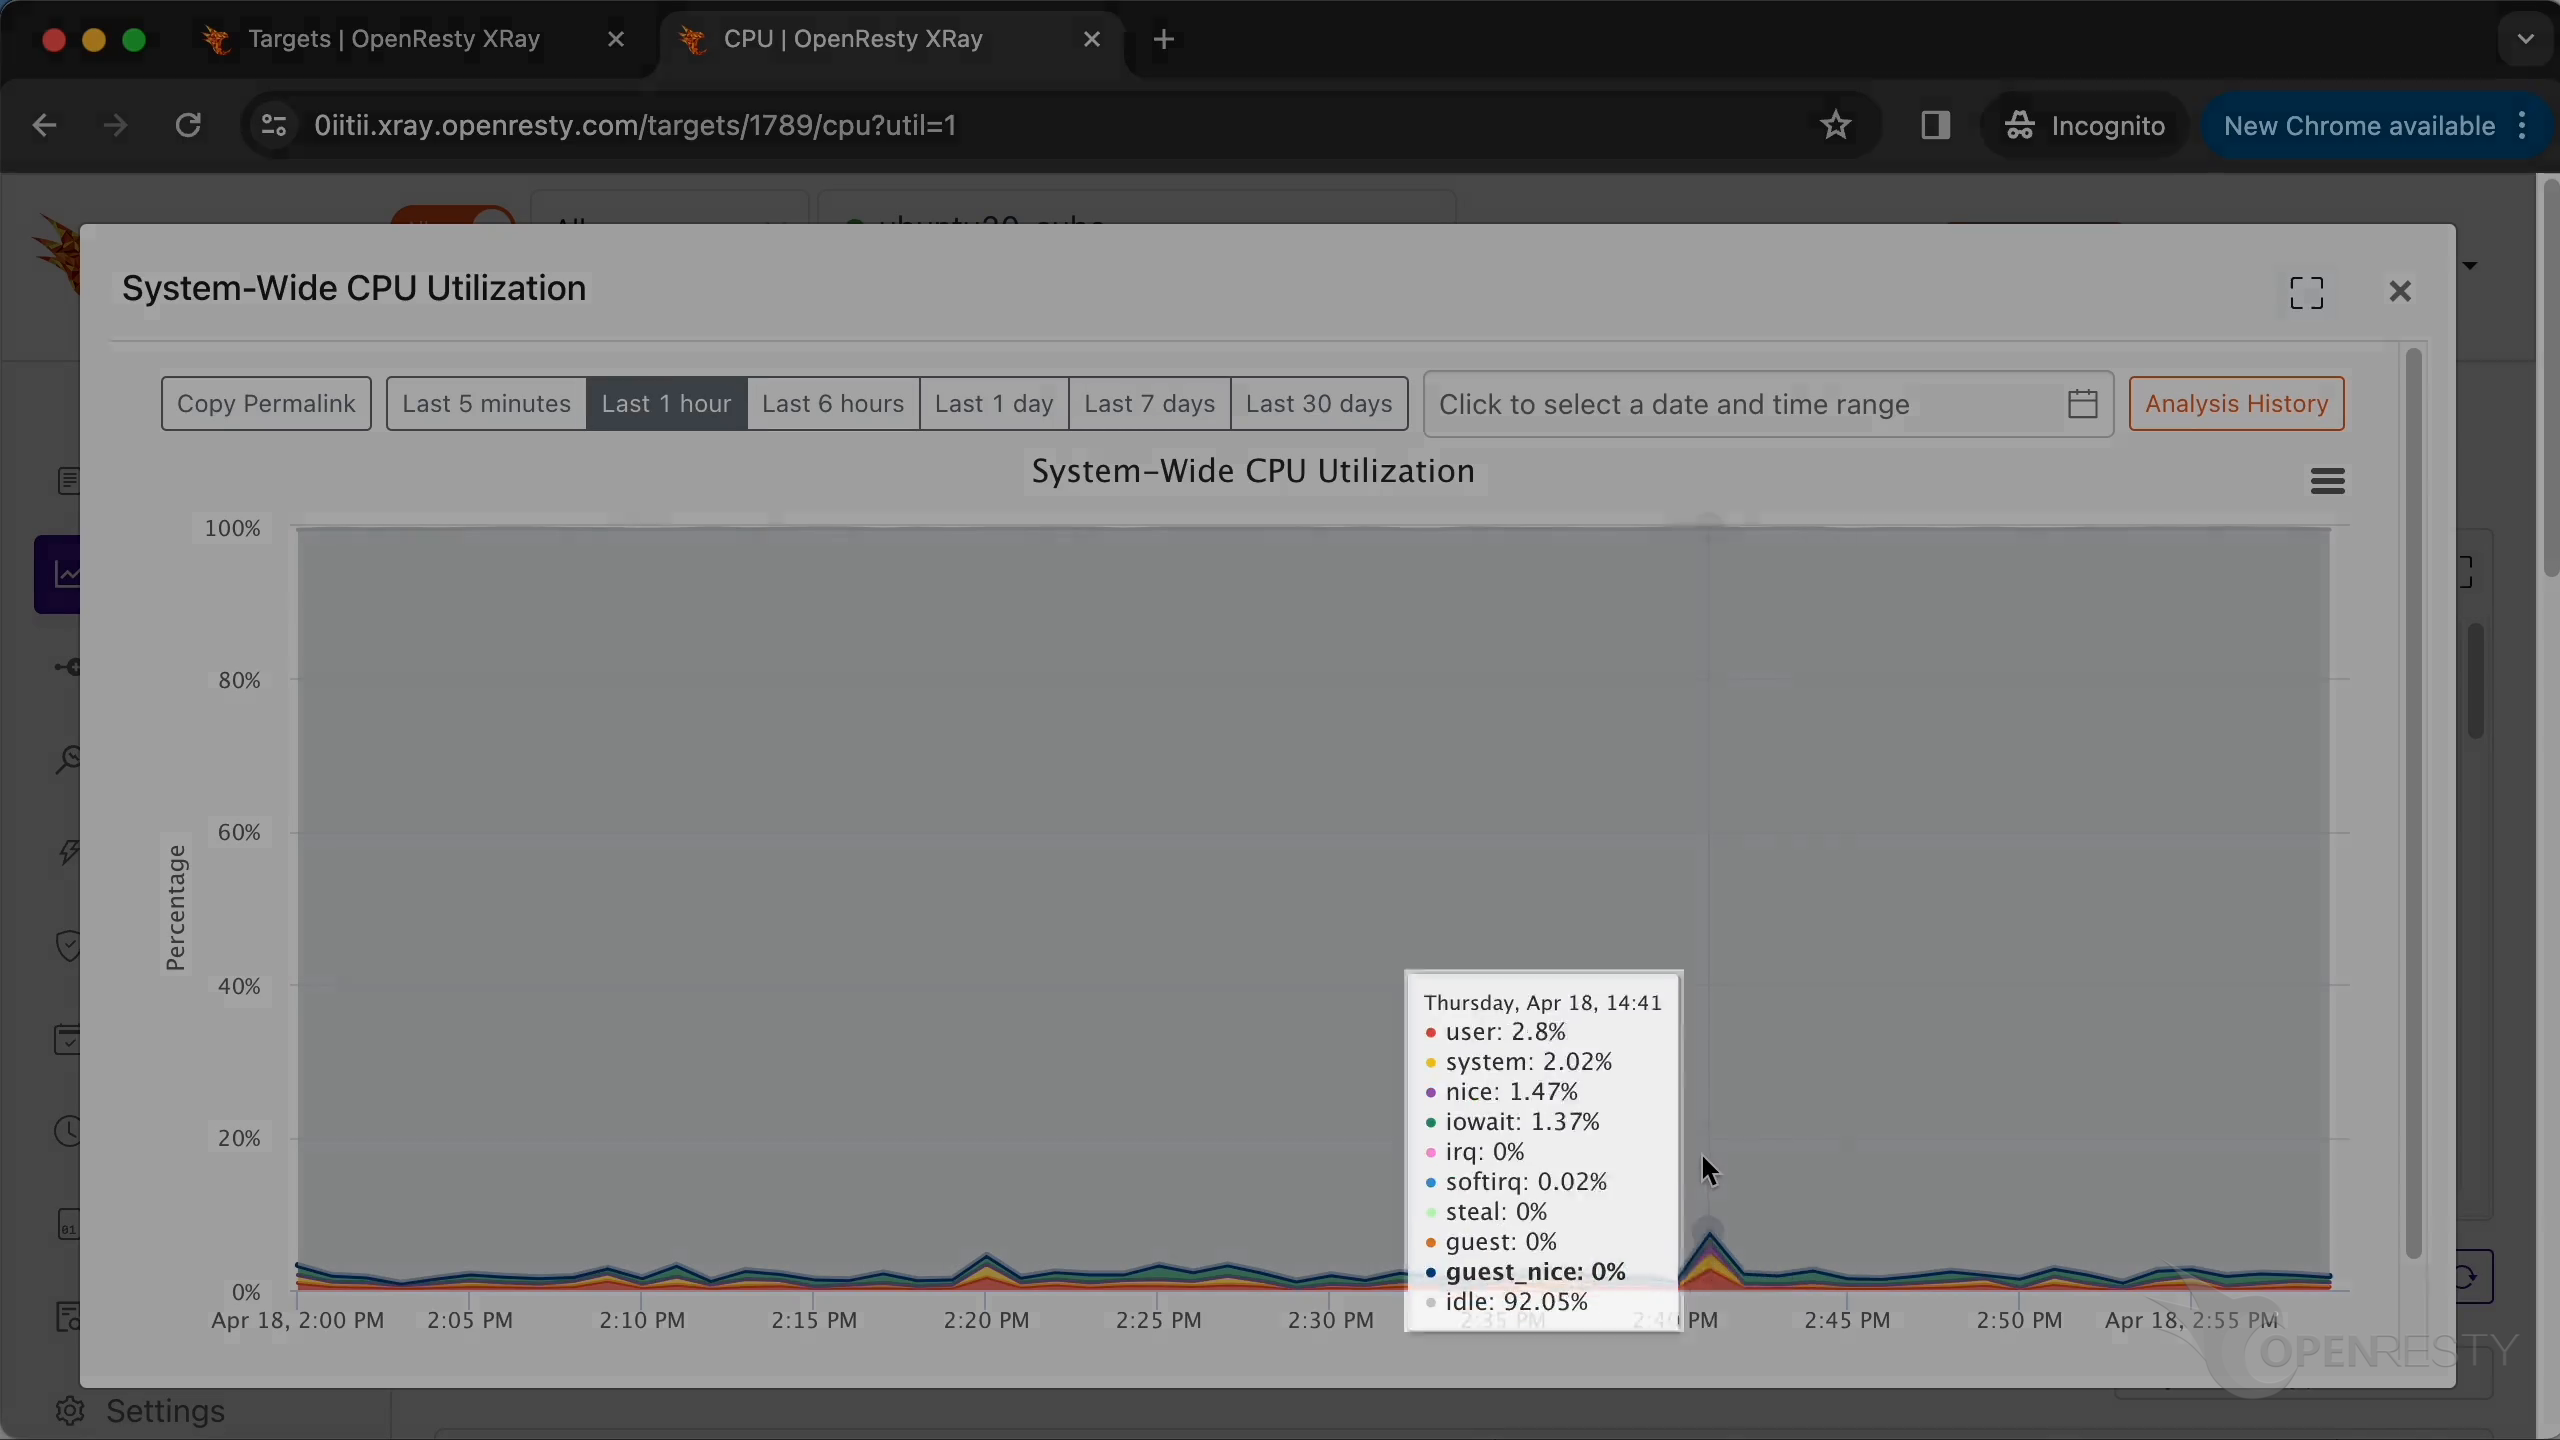
These are detailed metrics for system CPU utilization.
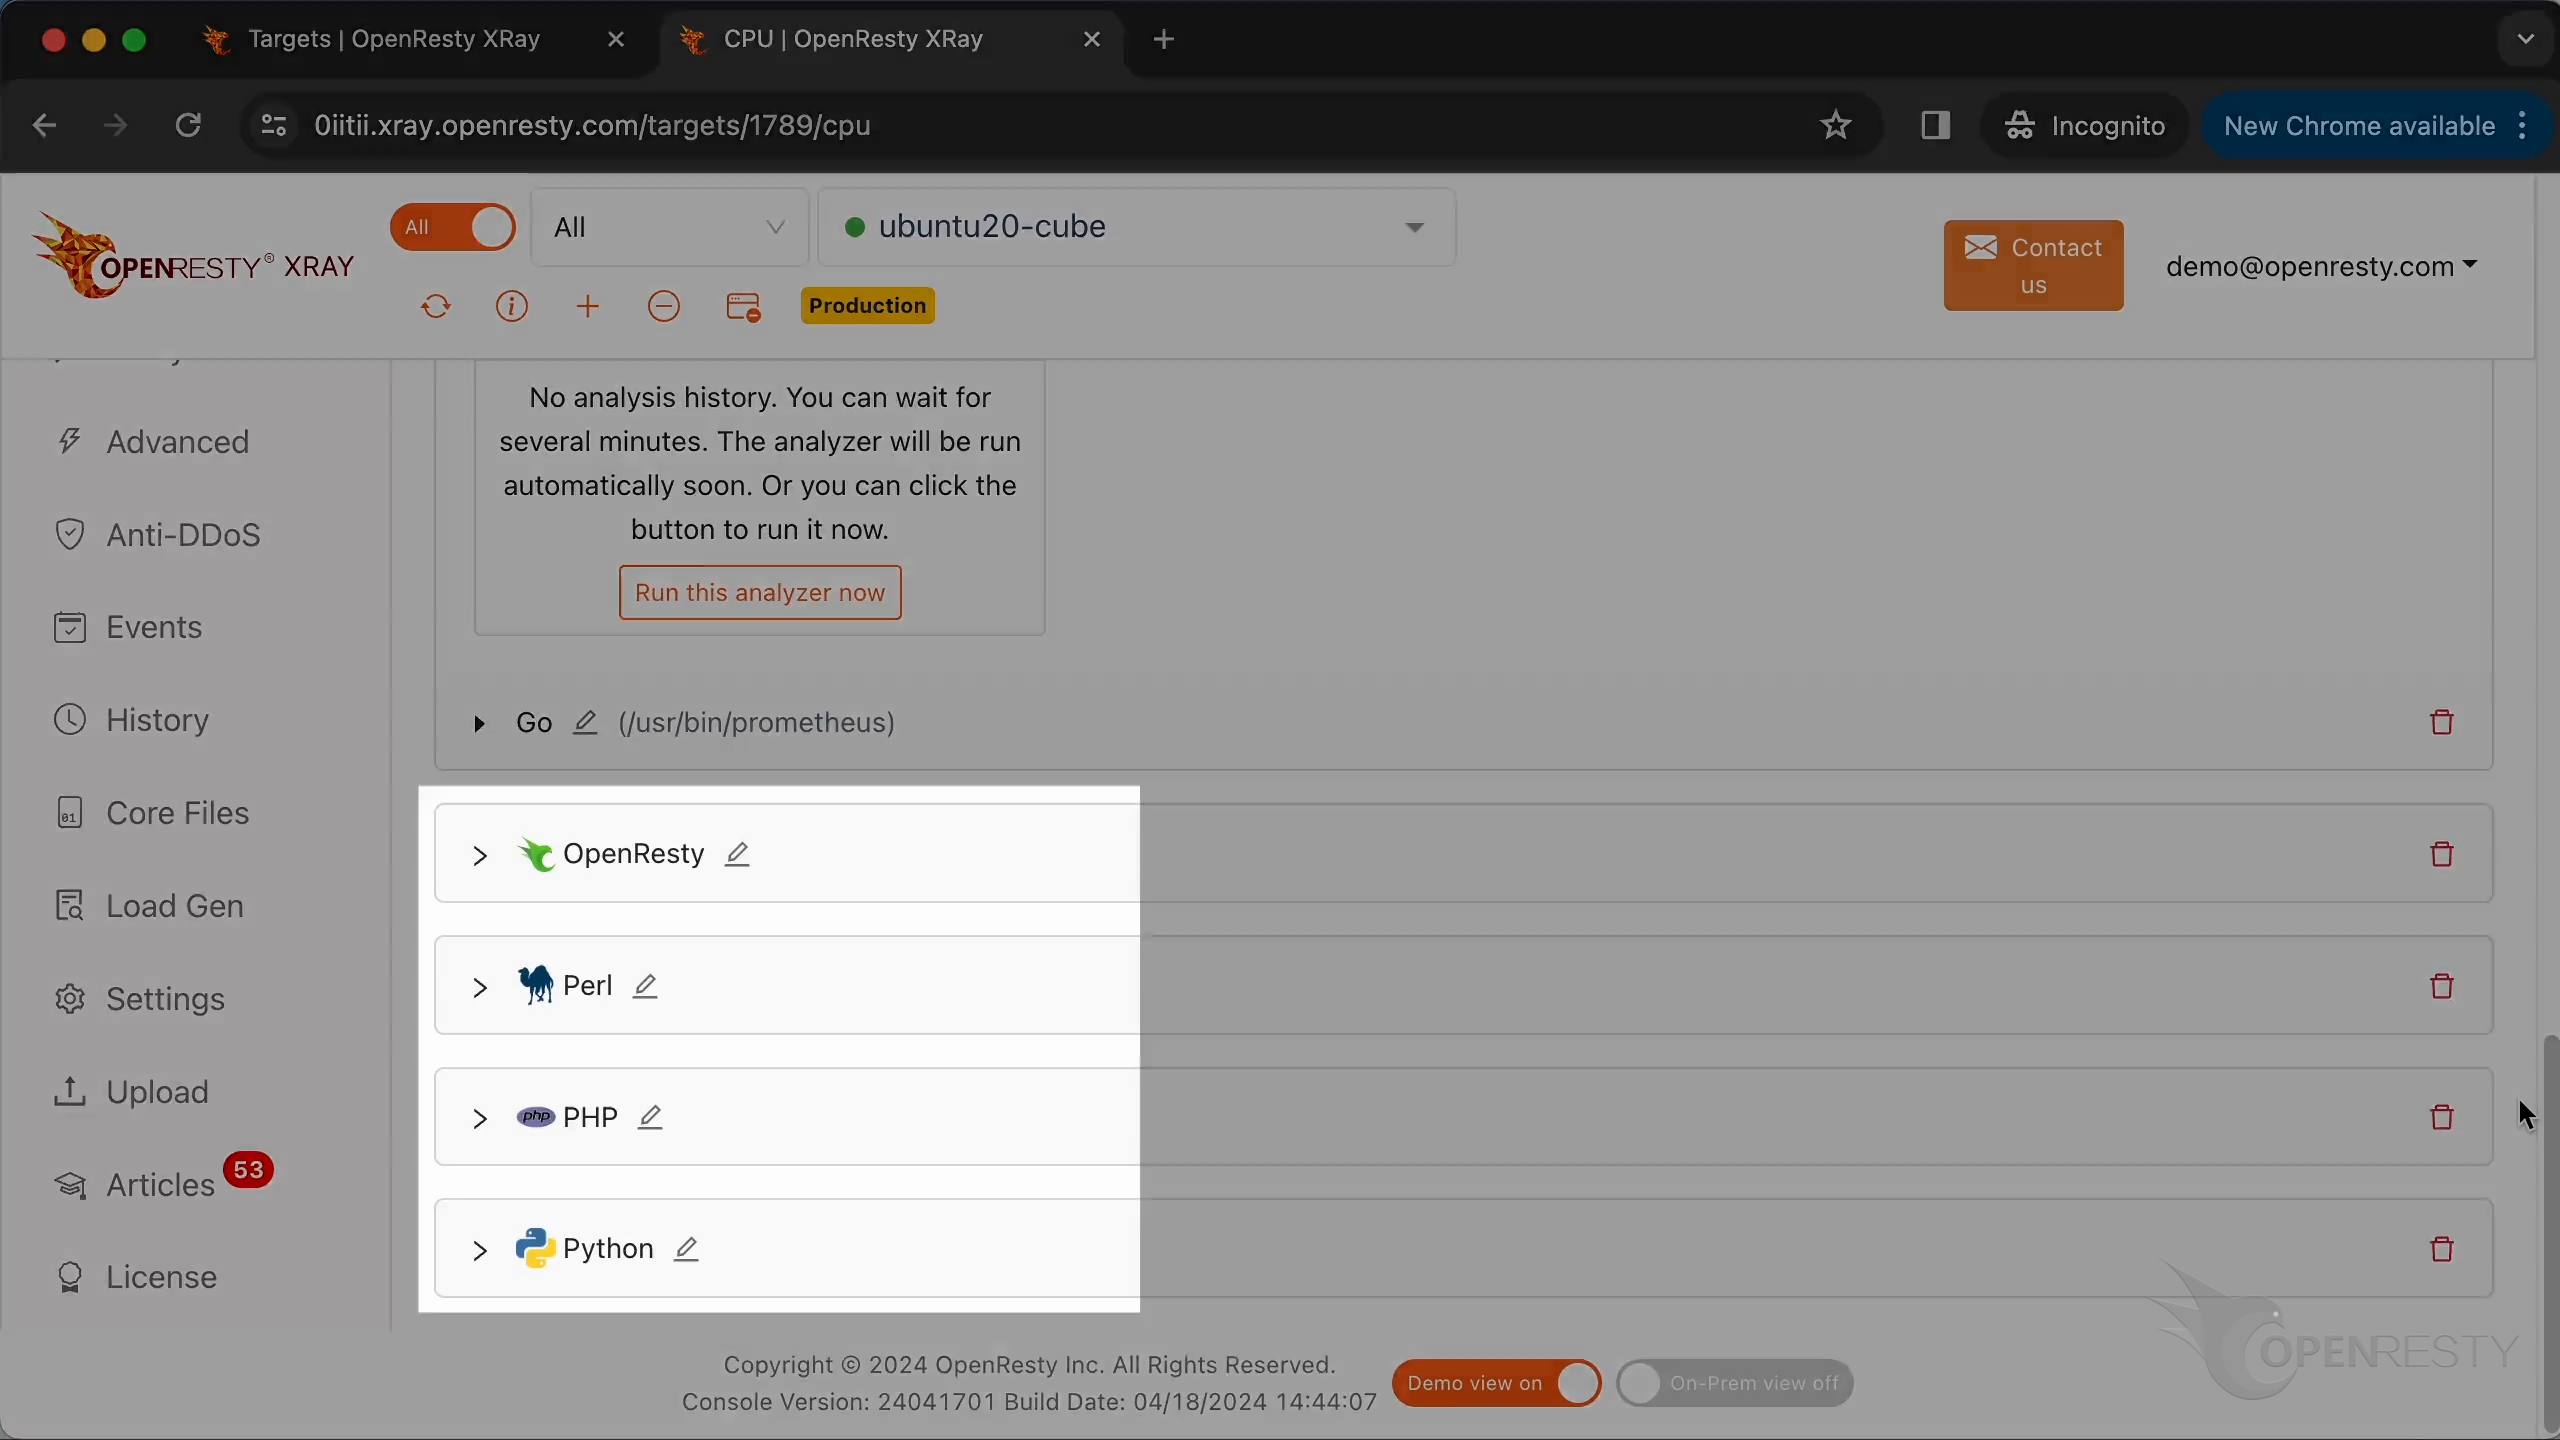
Below is basic information sorted by application type. This one is about the Go application.
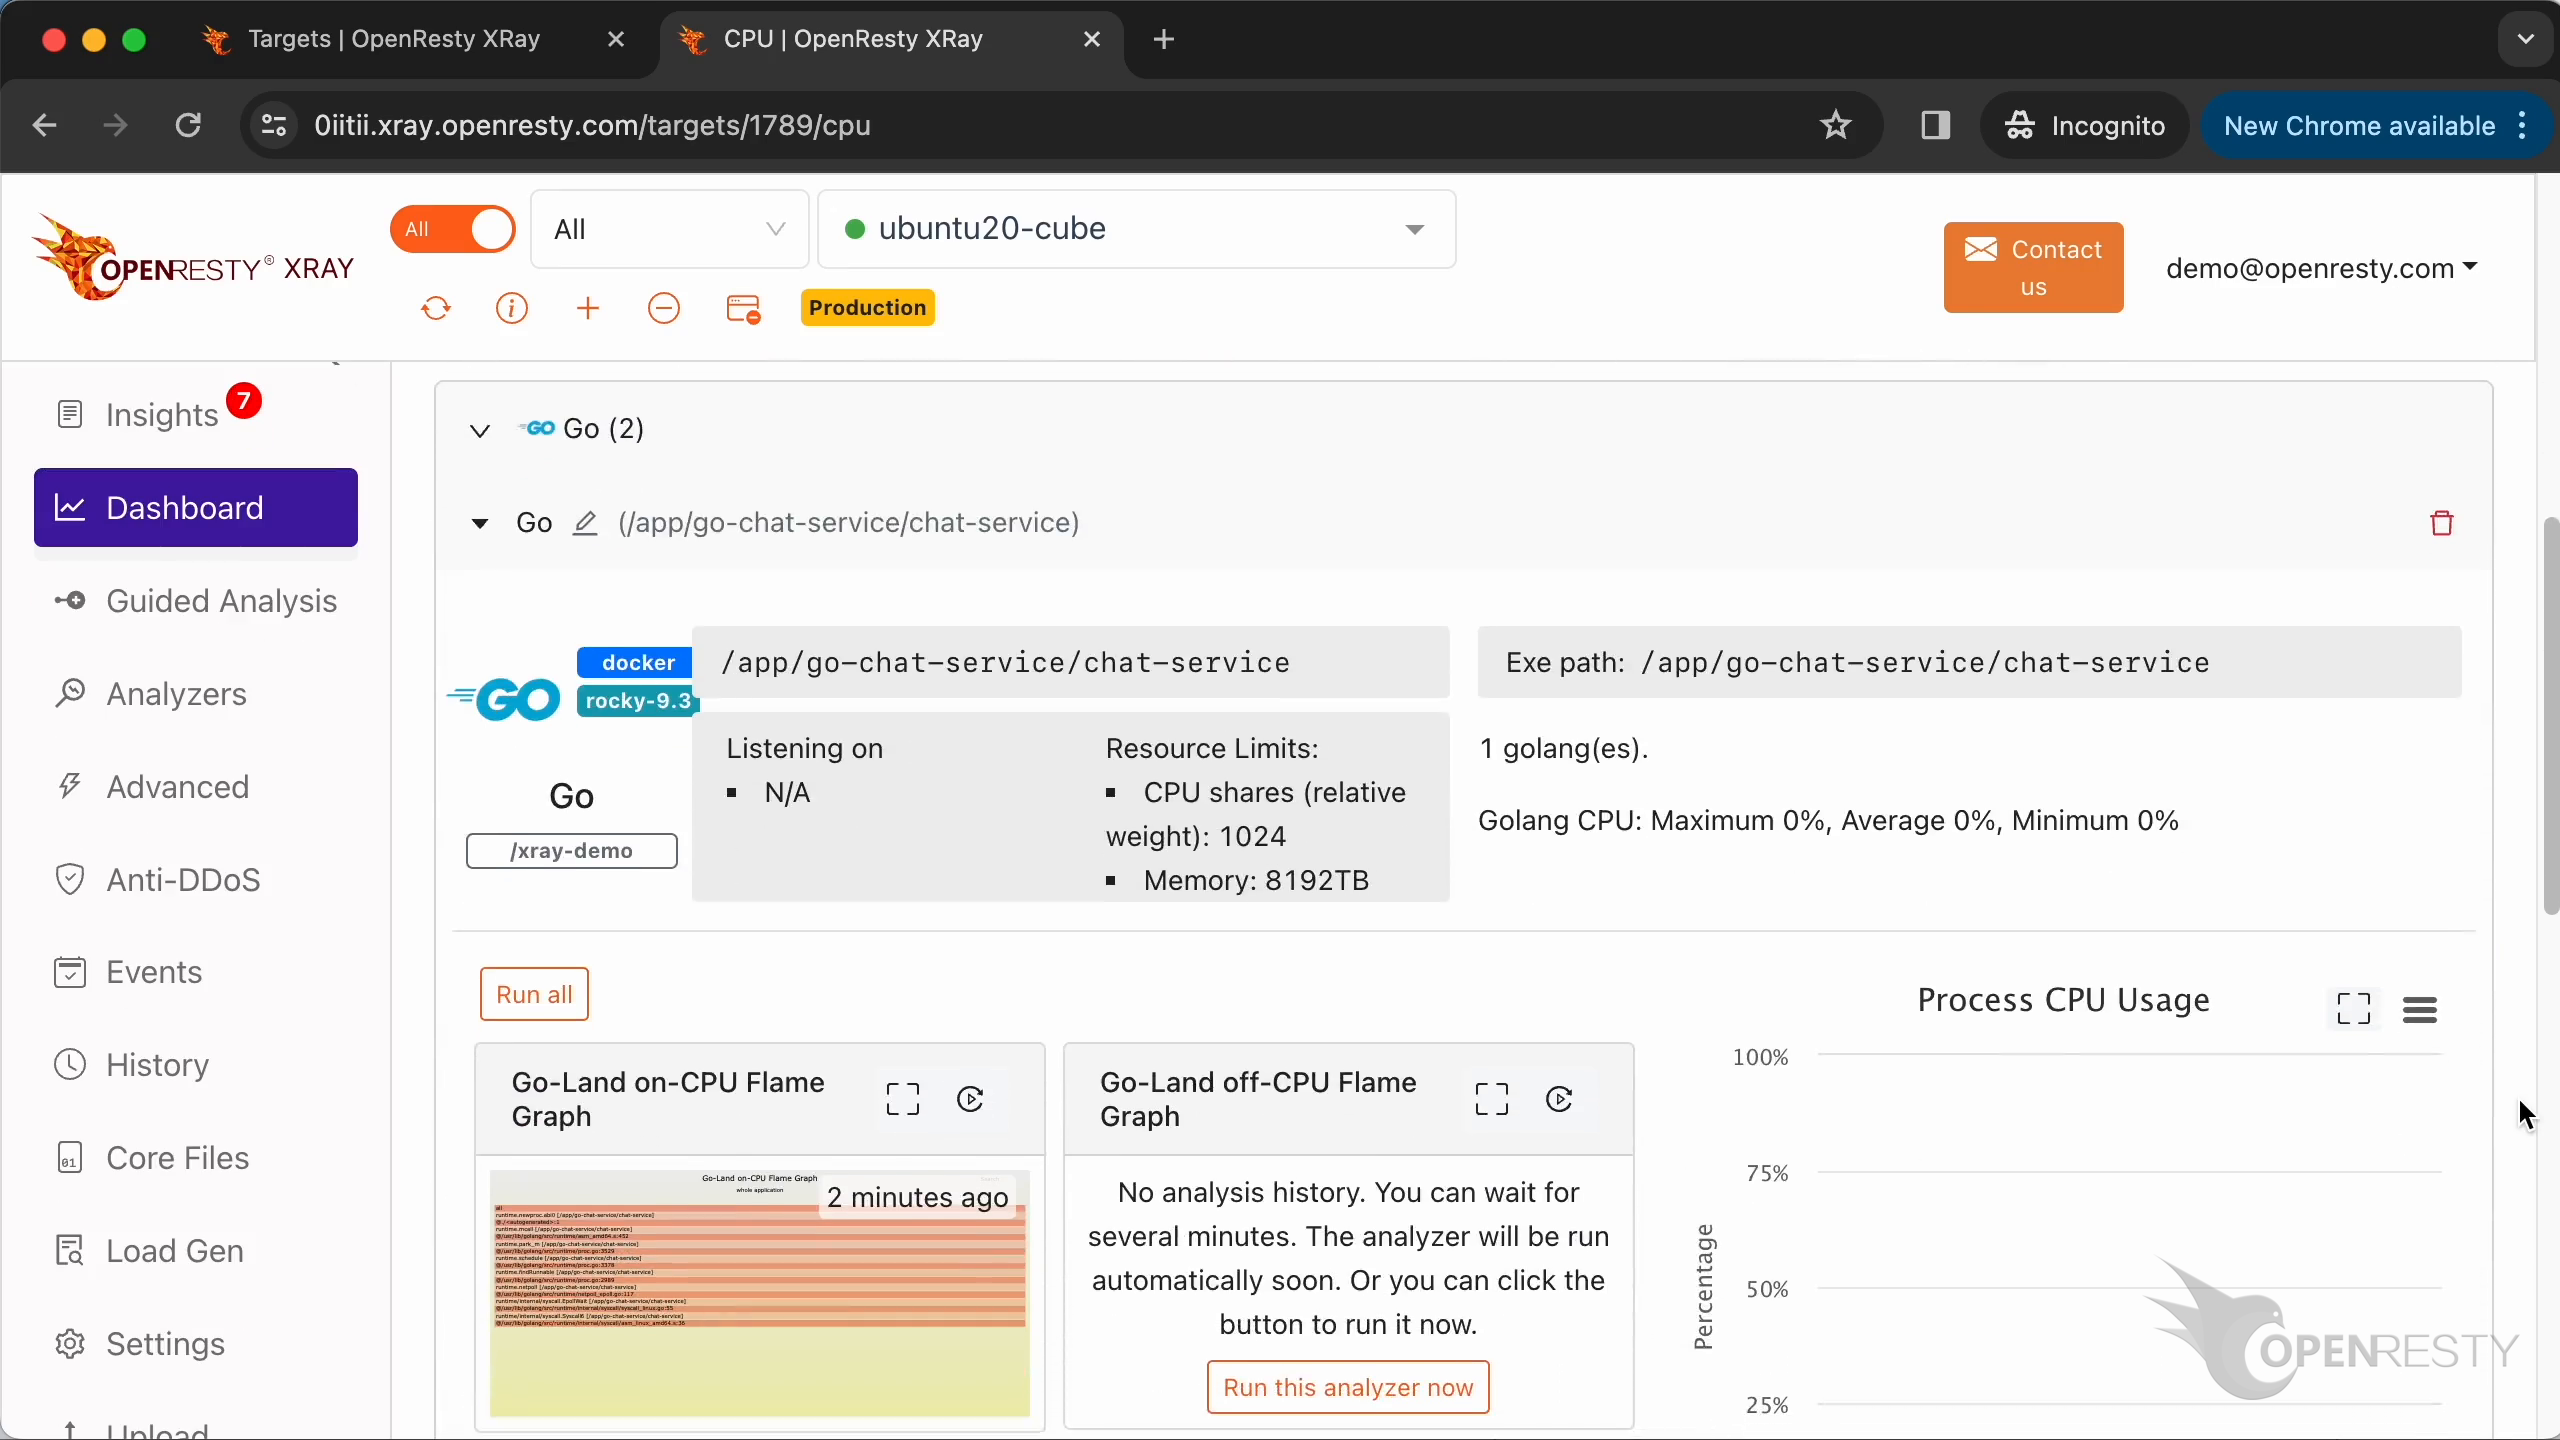
There are other analytic diagrams and charts for various kinds of applications on the Dashboard page.
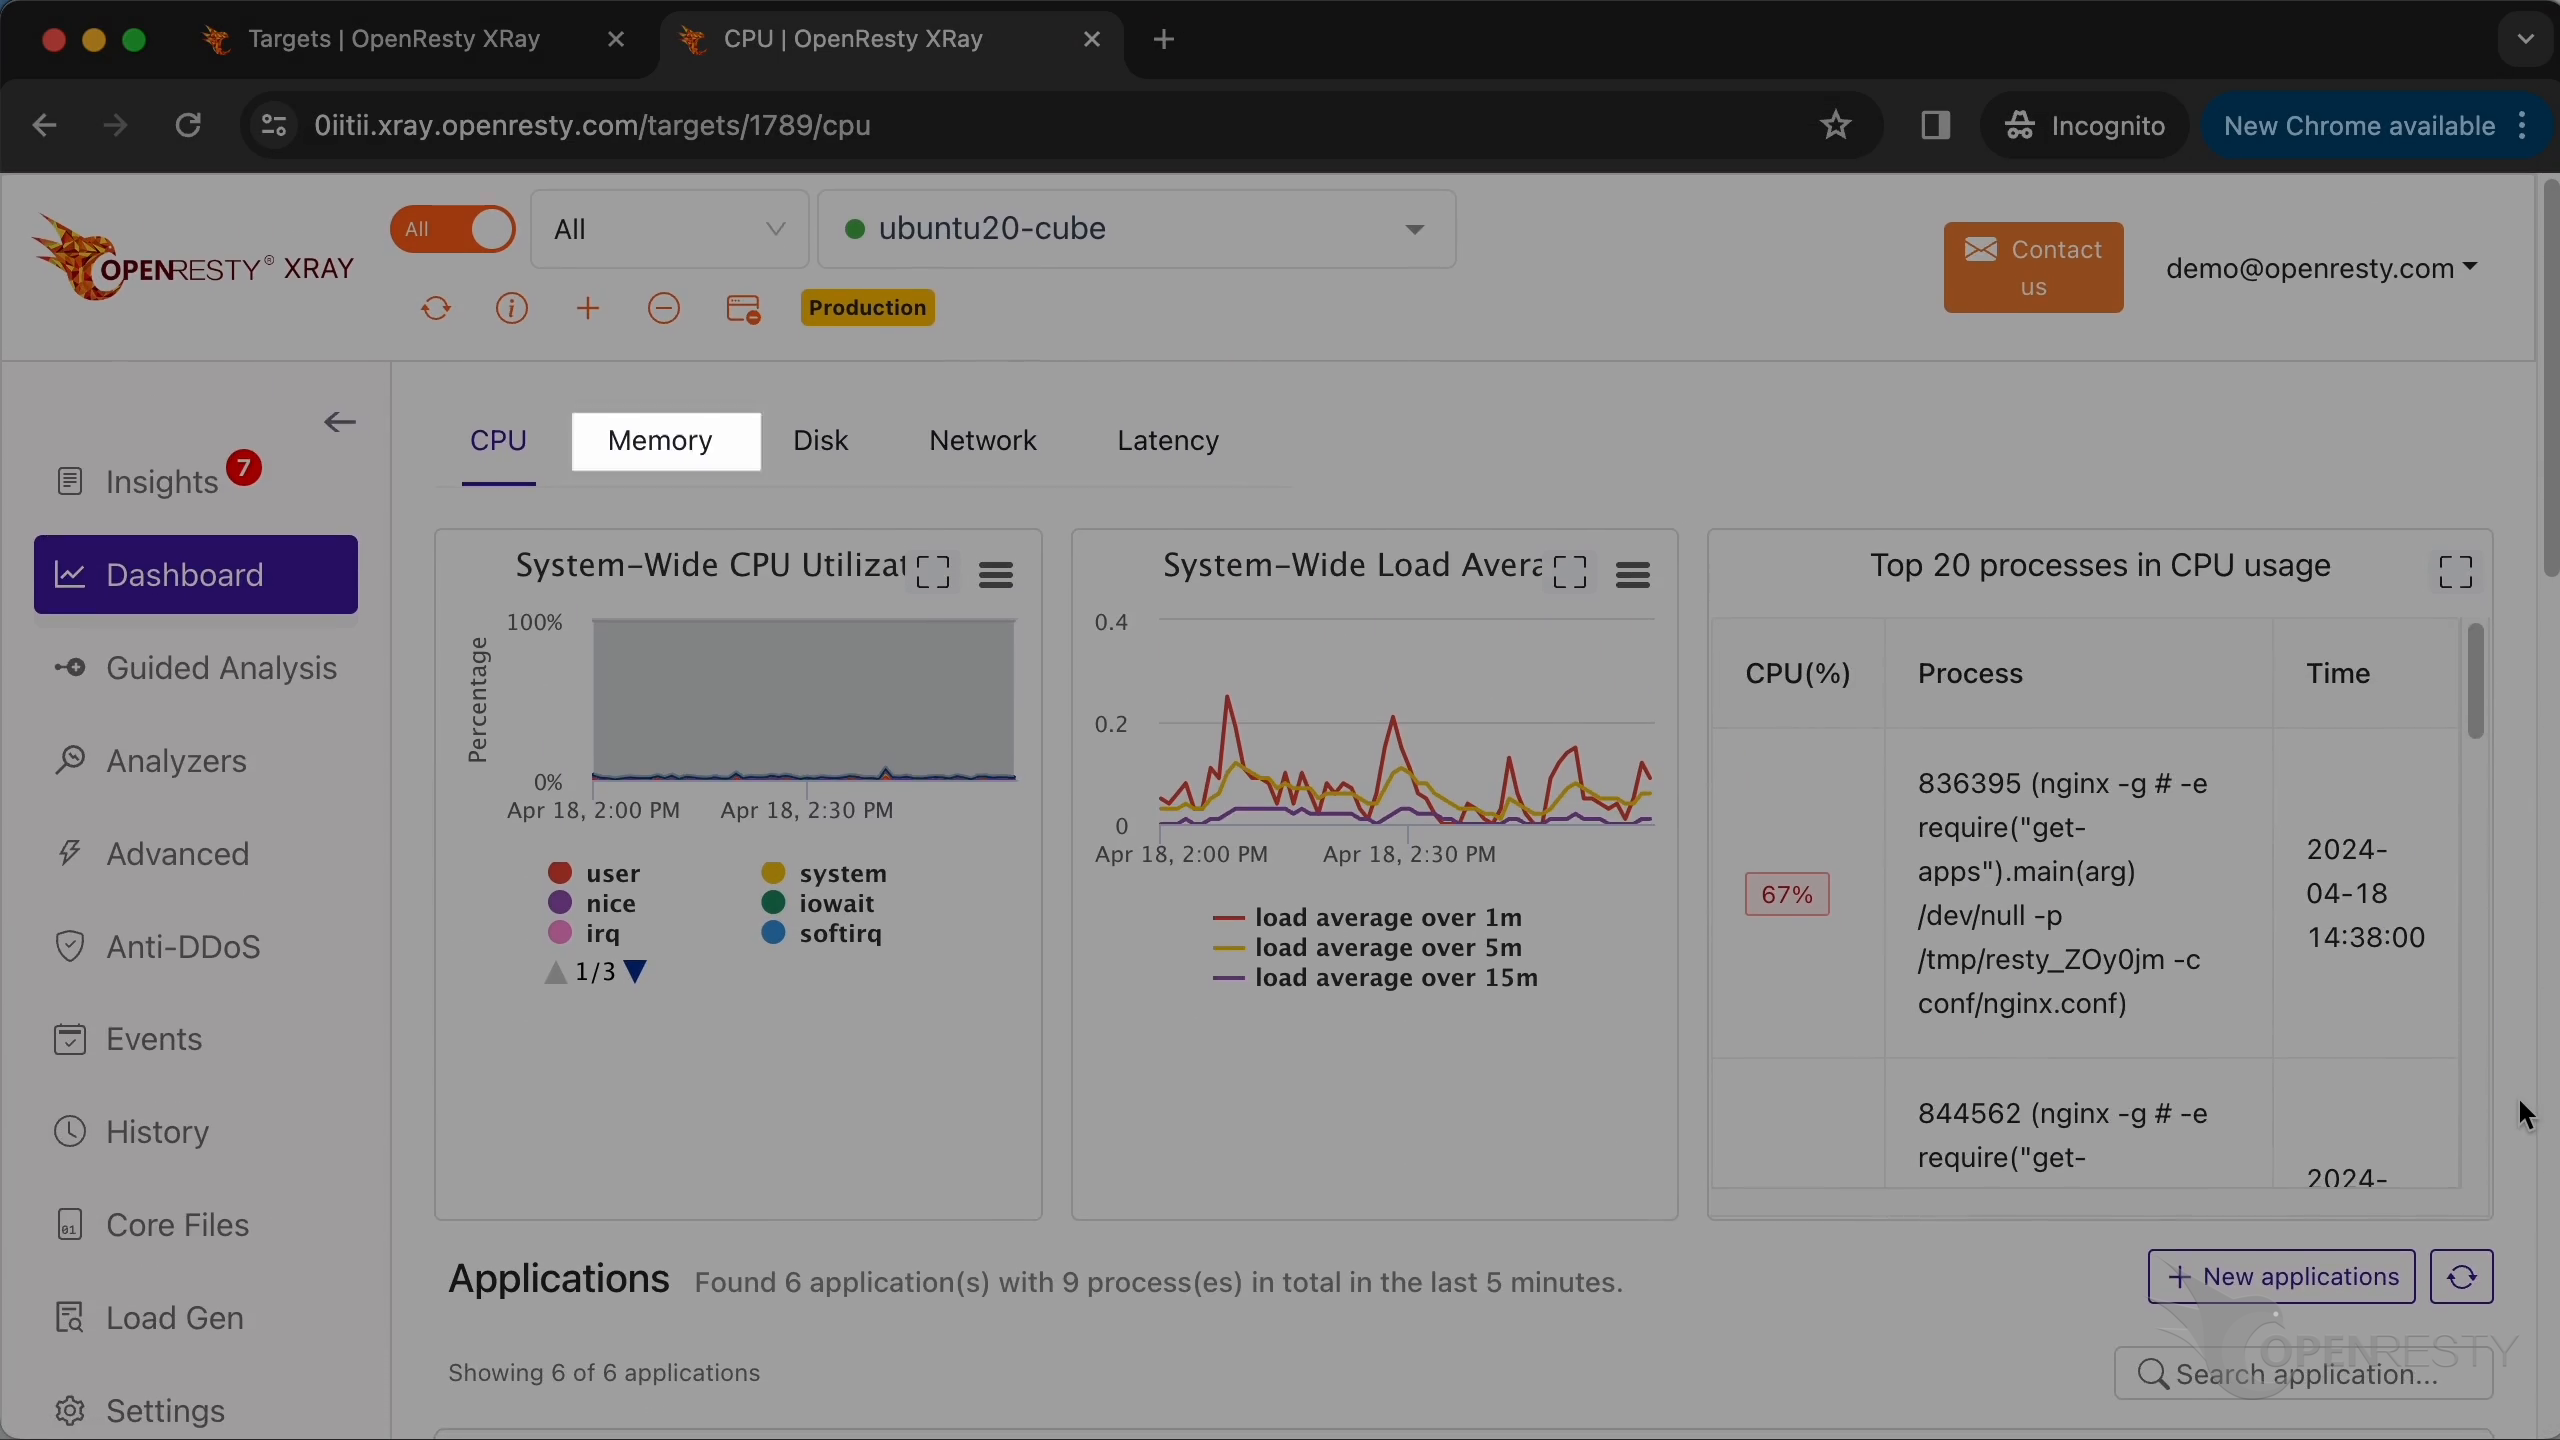
Go to the memory metrics page.
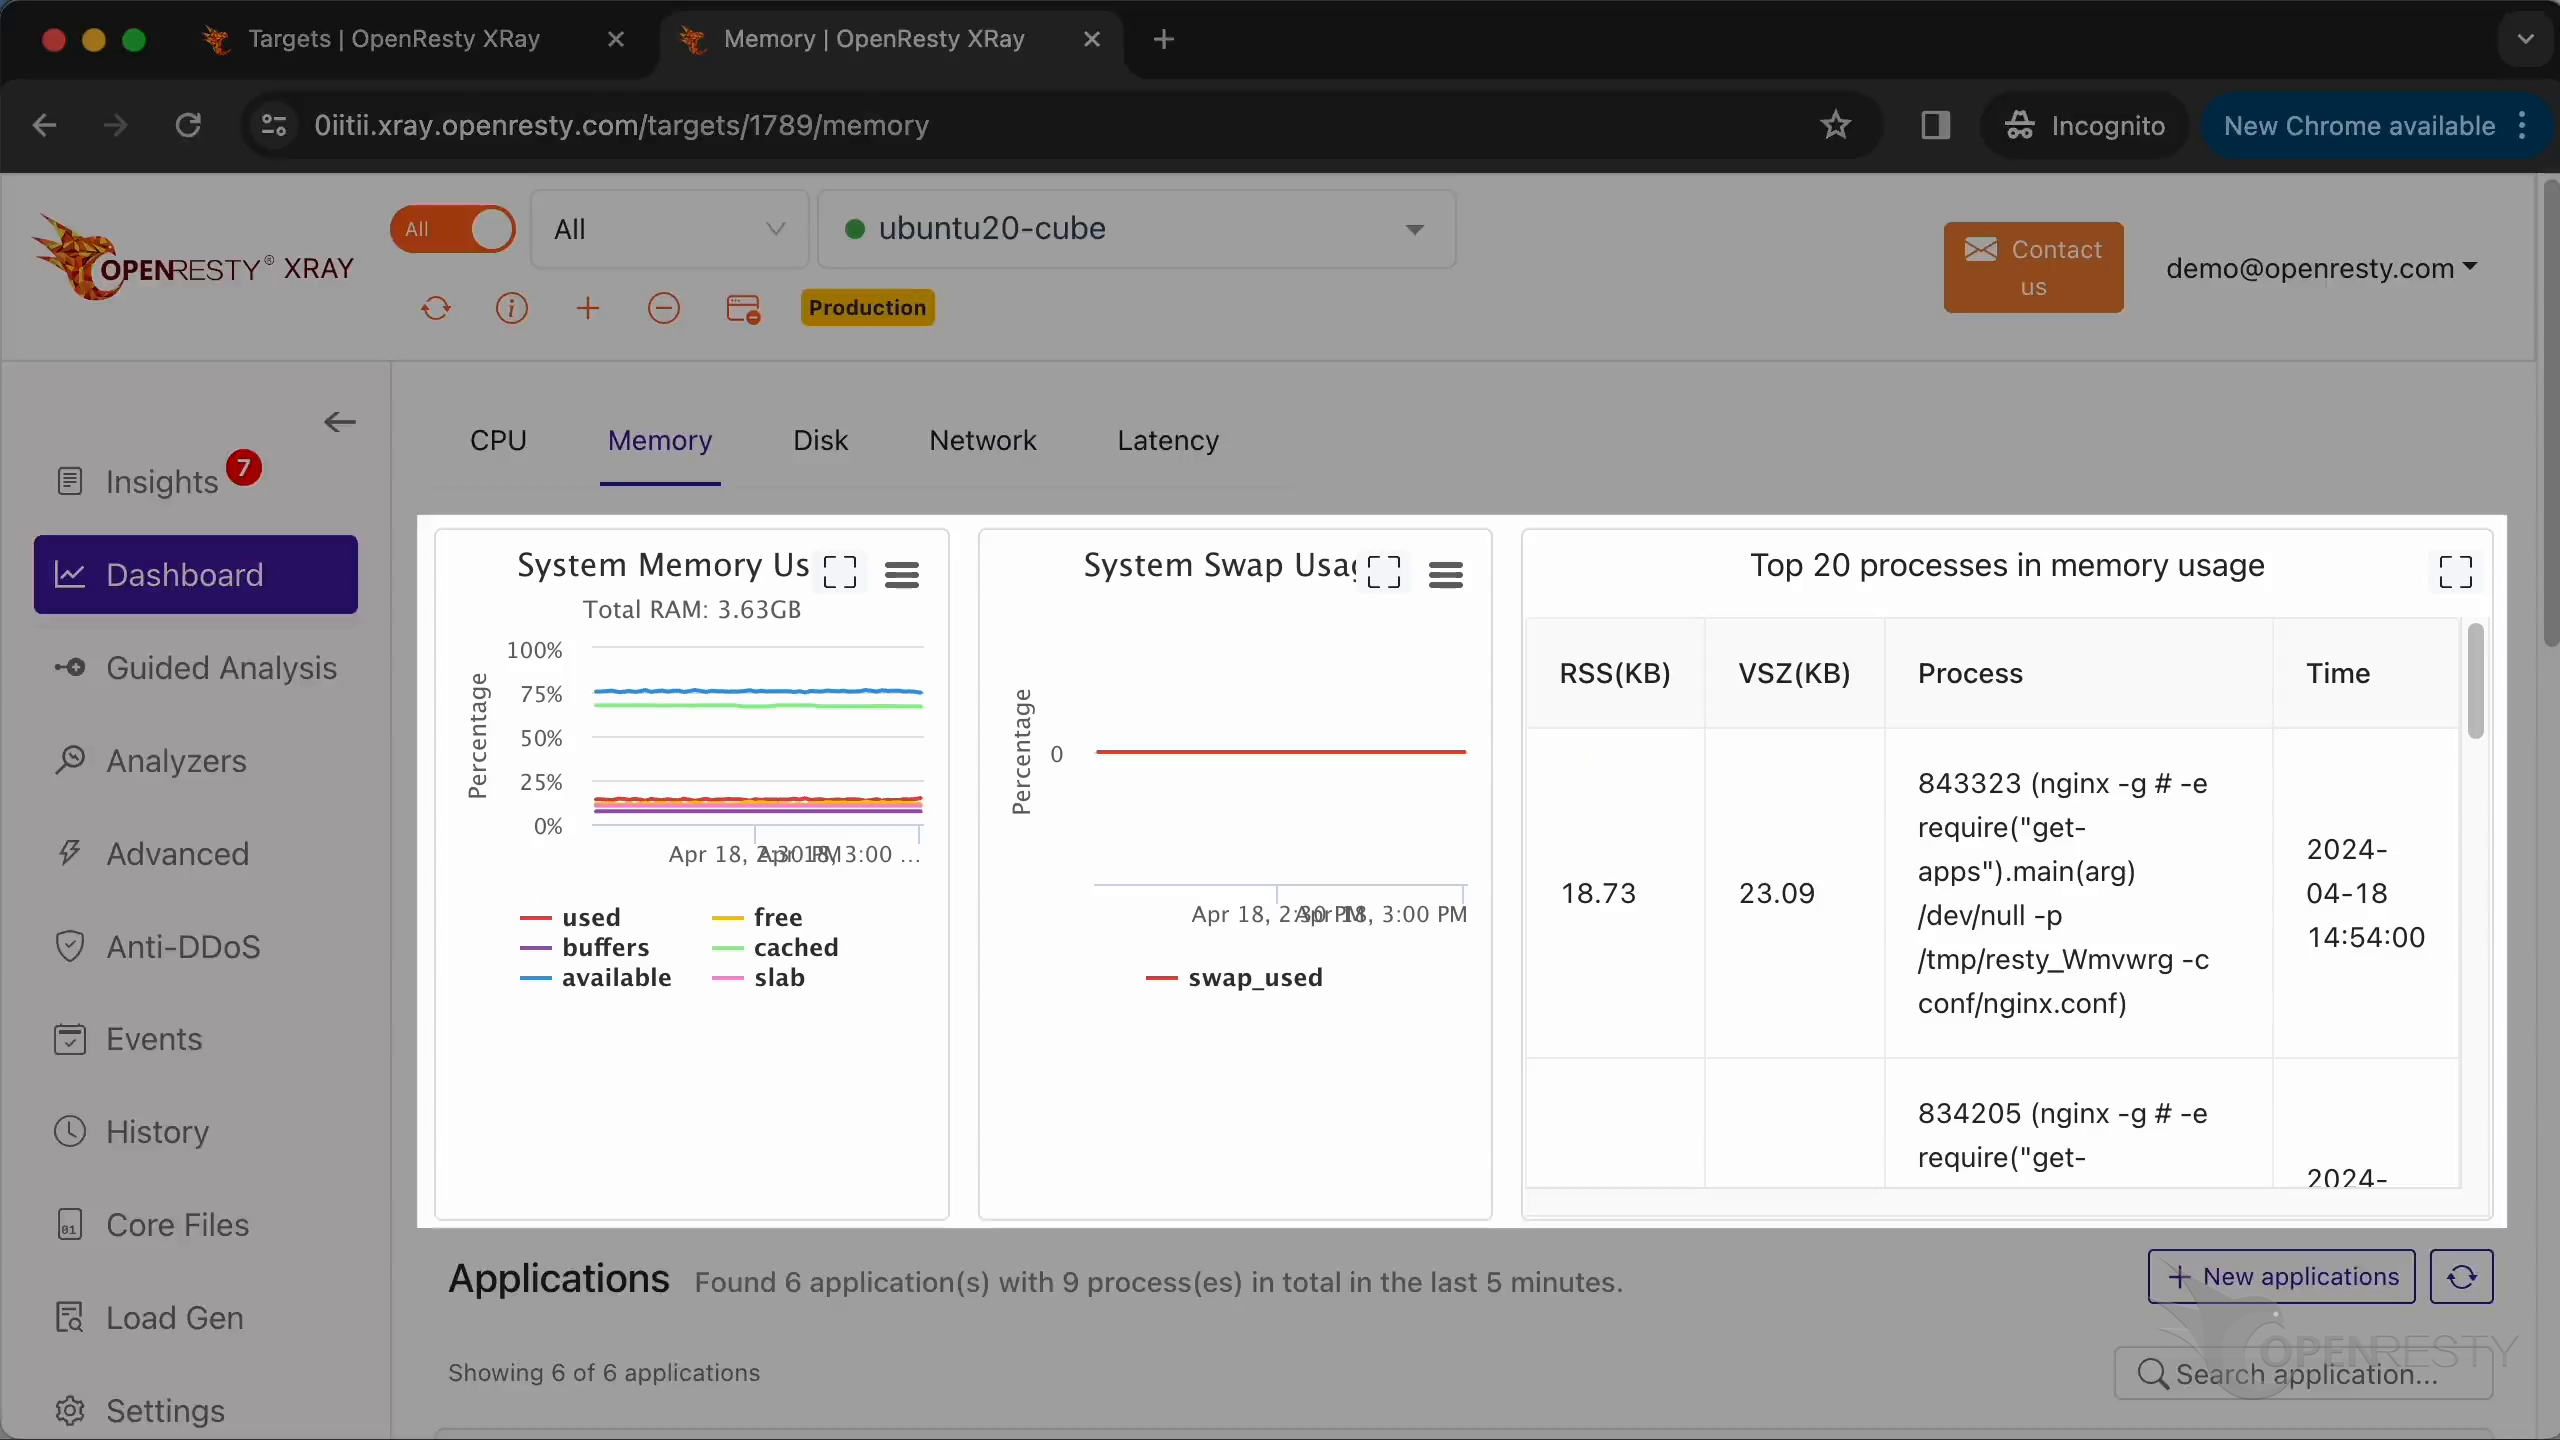
These system metrics are all about memory usage.
To go from watching memory usage to tracing an actual leak down to the source line, see Memory Leak Detection in Production.
How do you diagnose high CPU usage with Guided Analysis?
To diagnose high CPU usage, open Guided Analysis, pick High CPU Usage, choose the application and its worker process, keep both Lua and C/C++ selected, and start — XRay runs successive rounds (up to 300 seconds by default) and produces a report whose flame graph points to the hot code path. With the “Guided Analysis” feature, users can easily analyze performance problems online. Click on the “Guided Analysis” page.
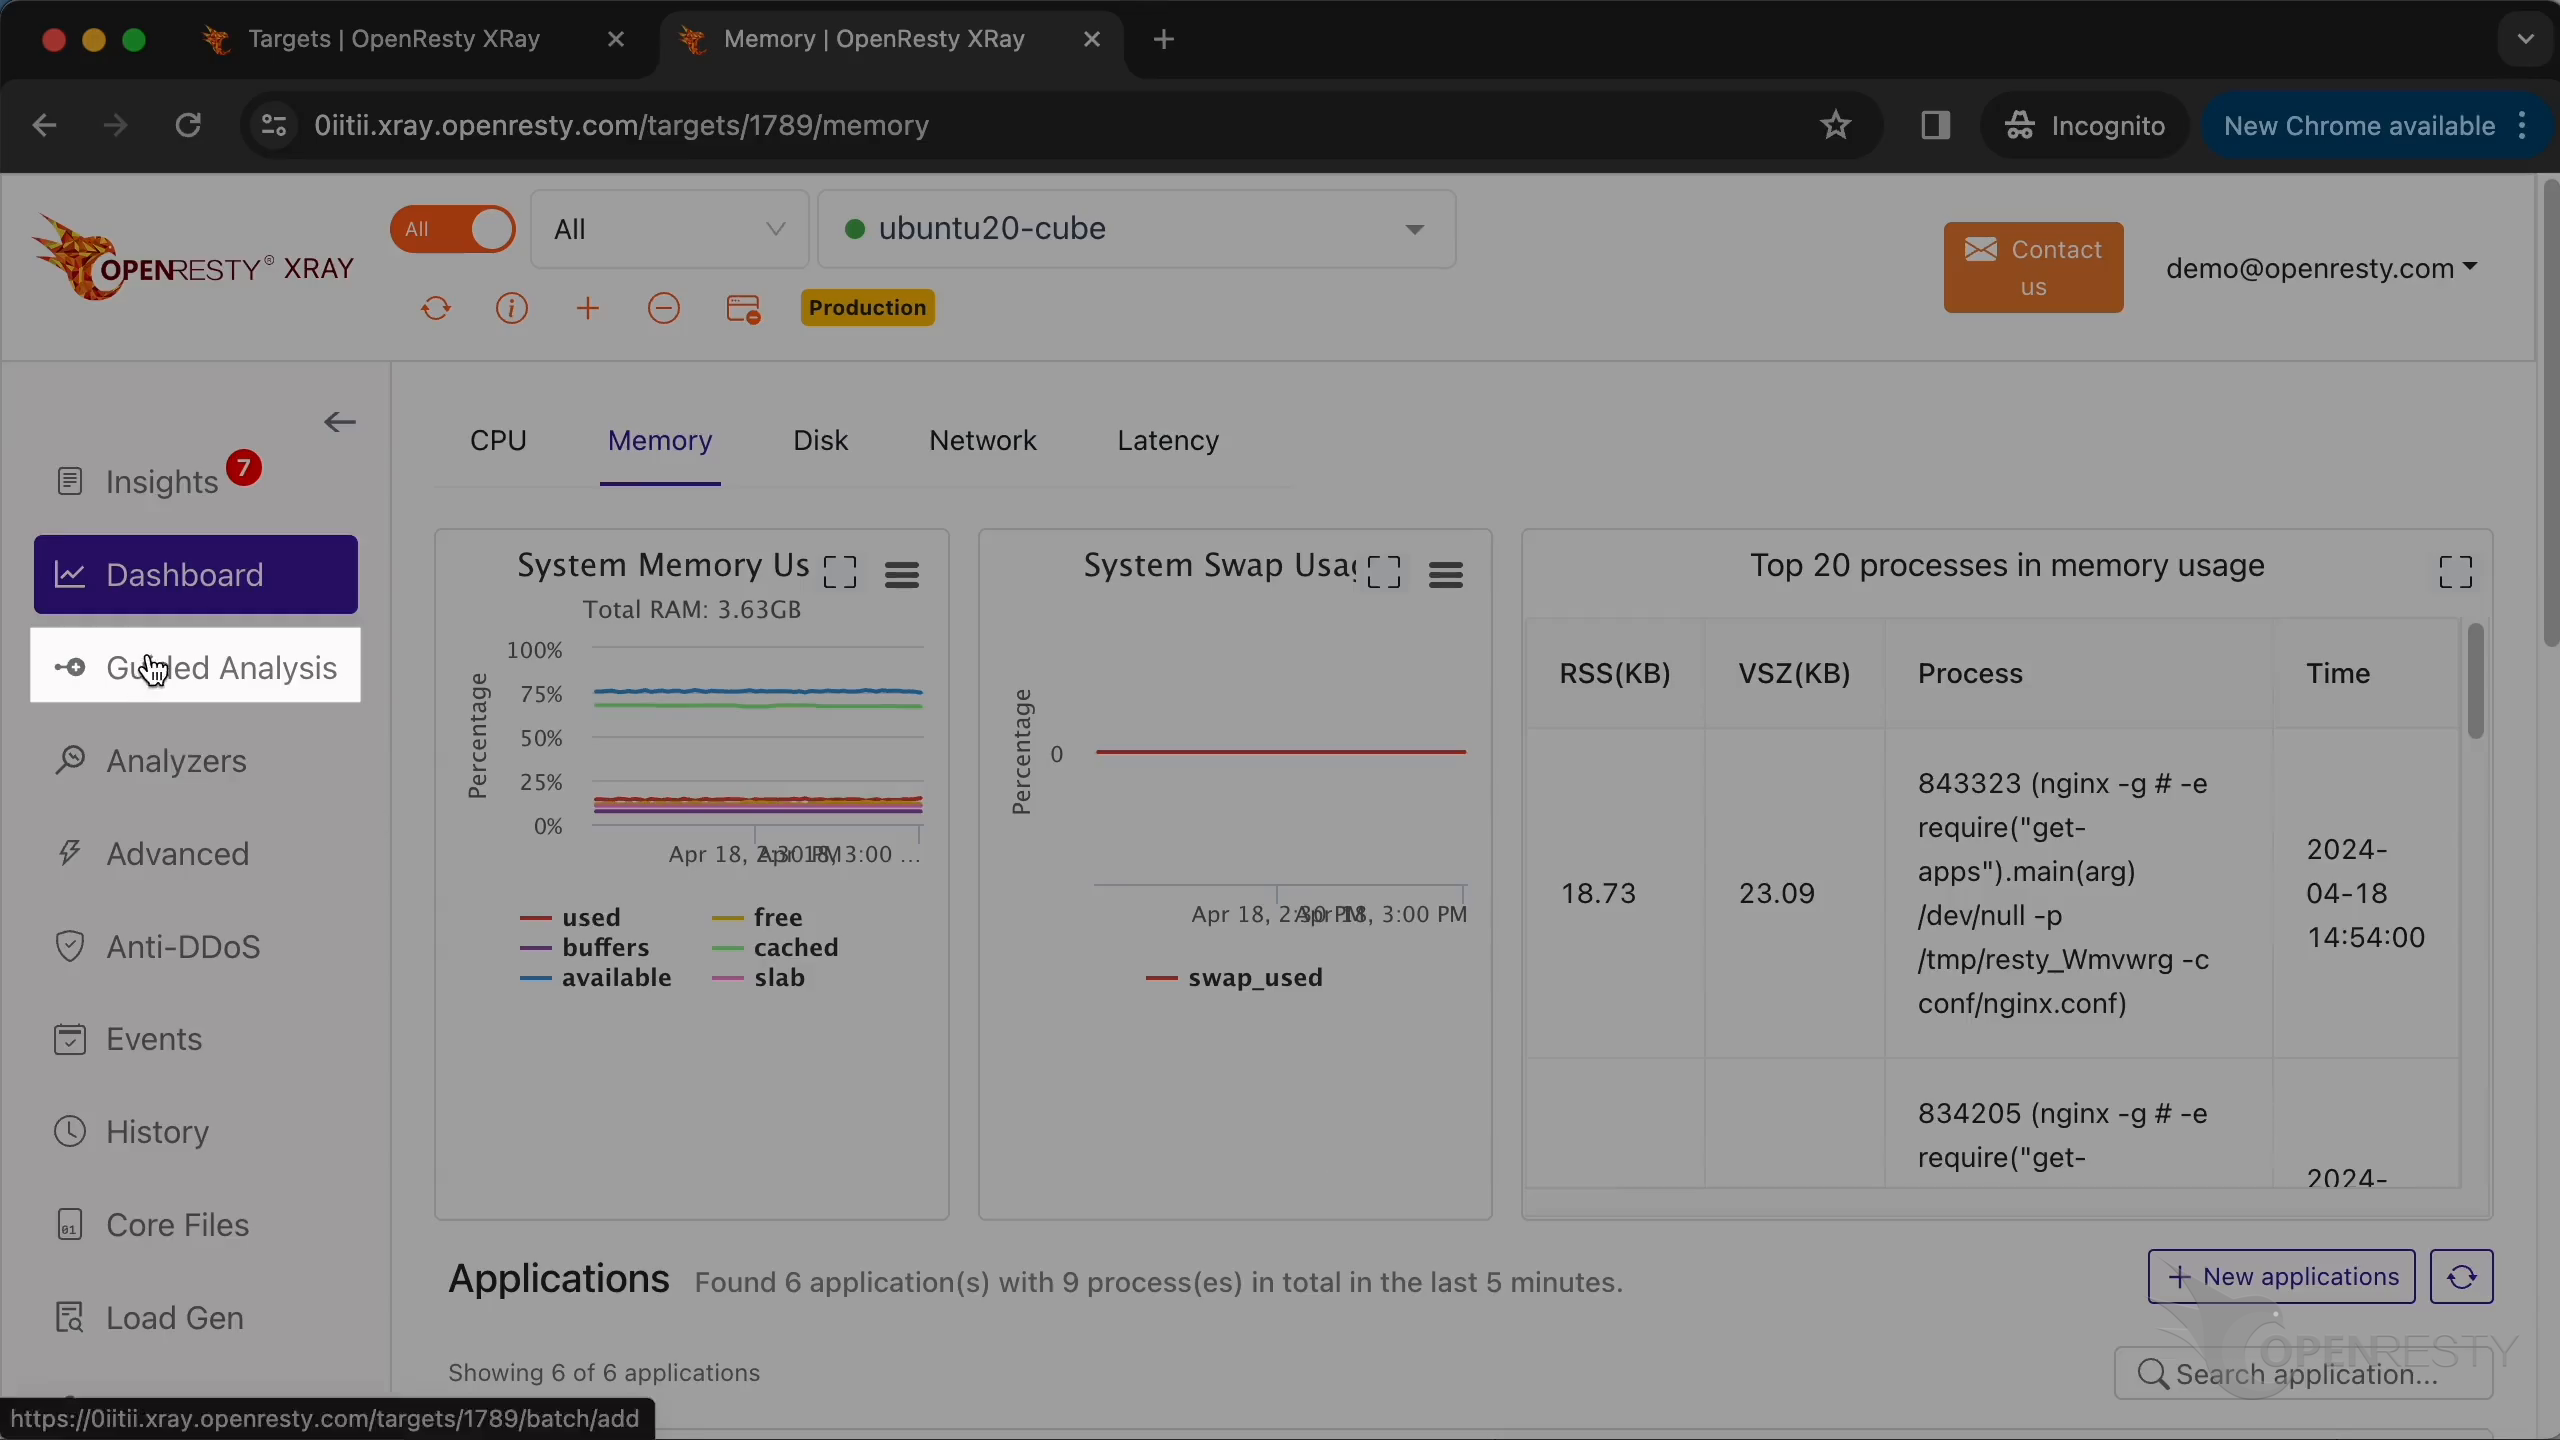
Here, you can see different types of problems that you can diagnose.
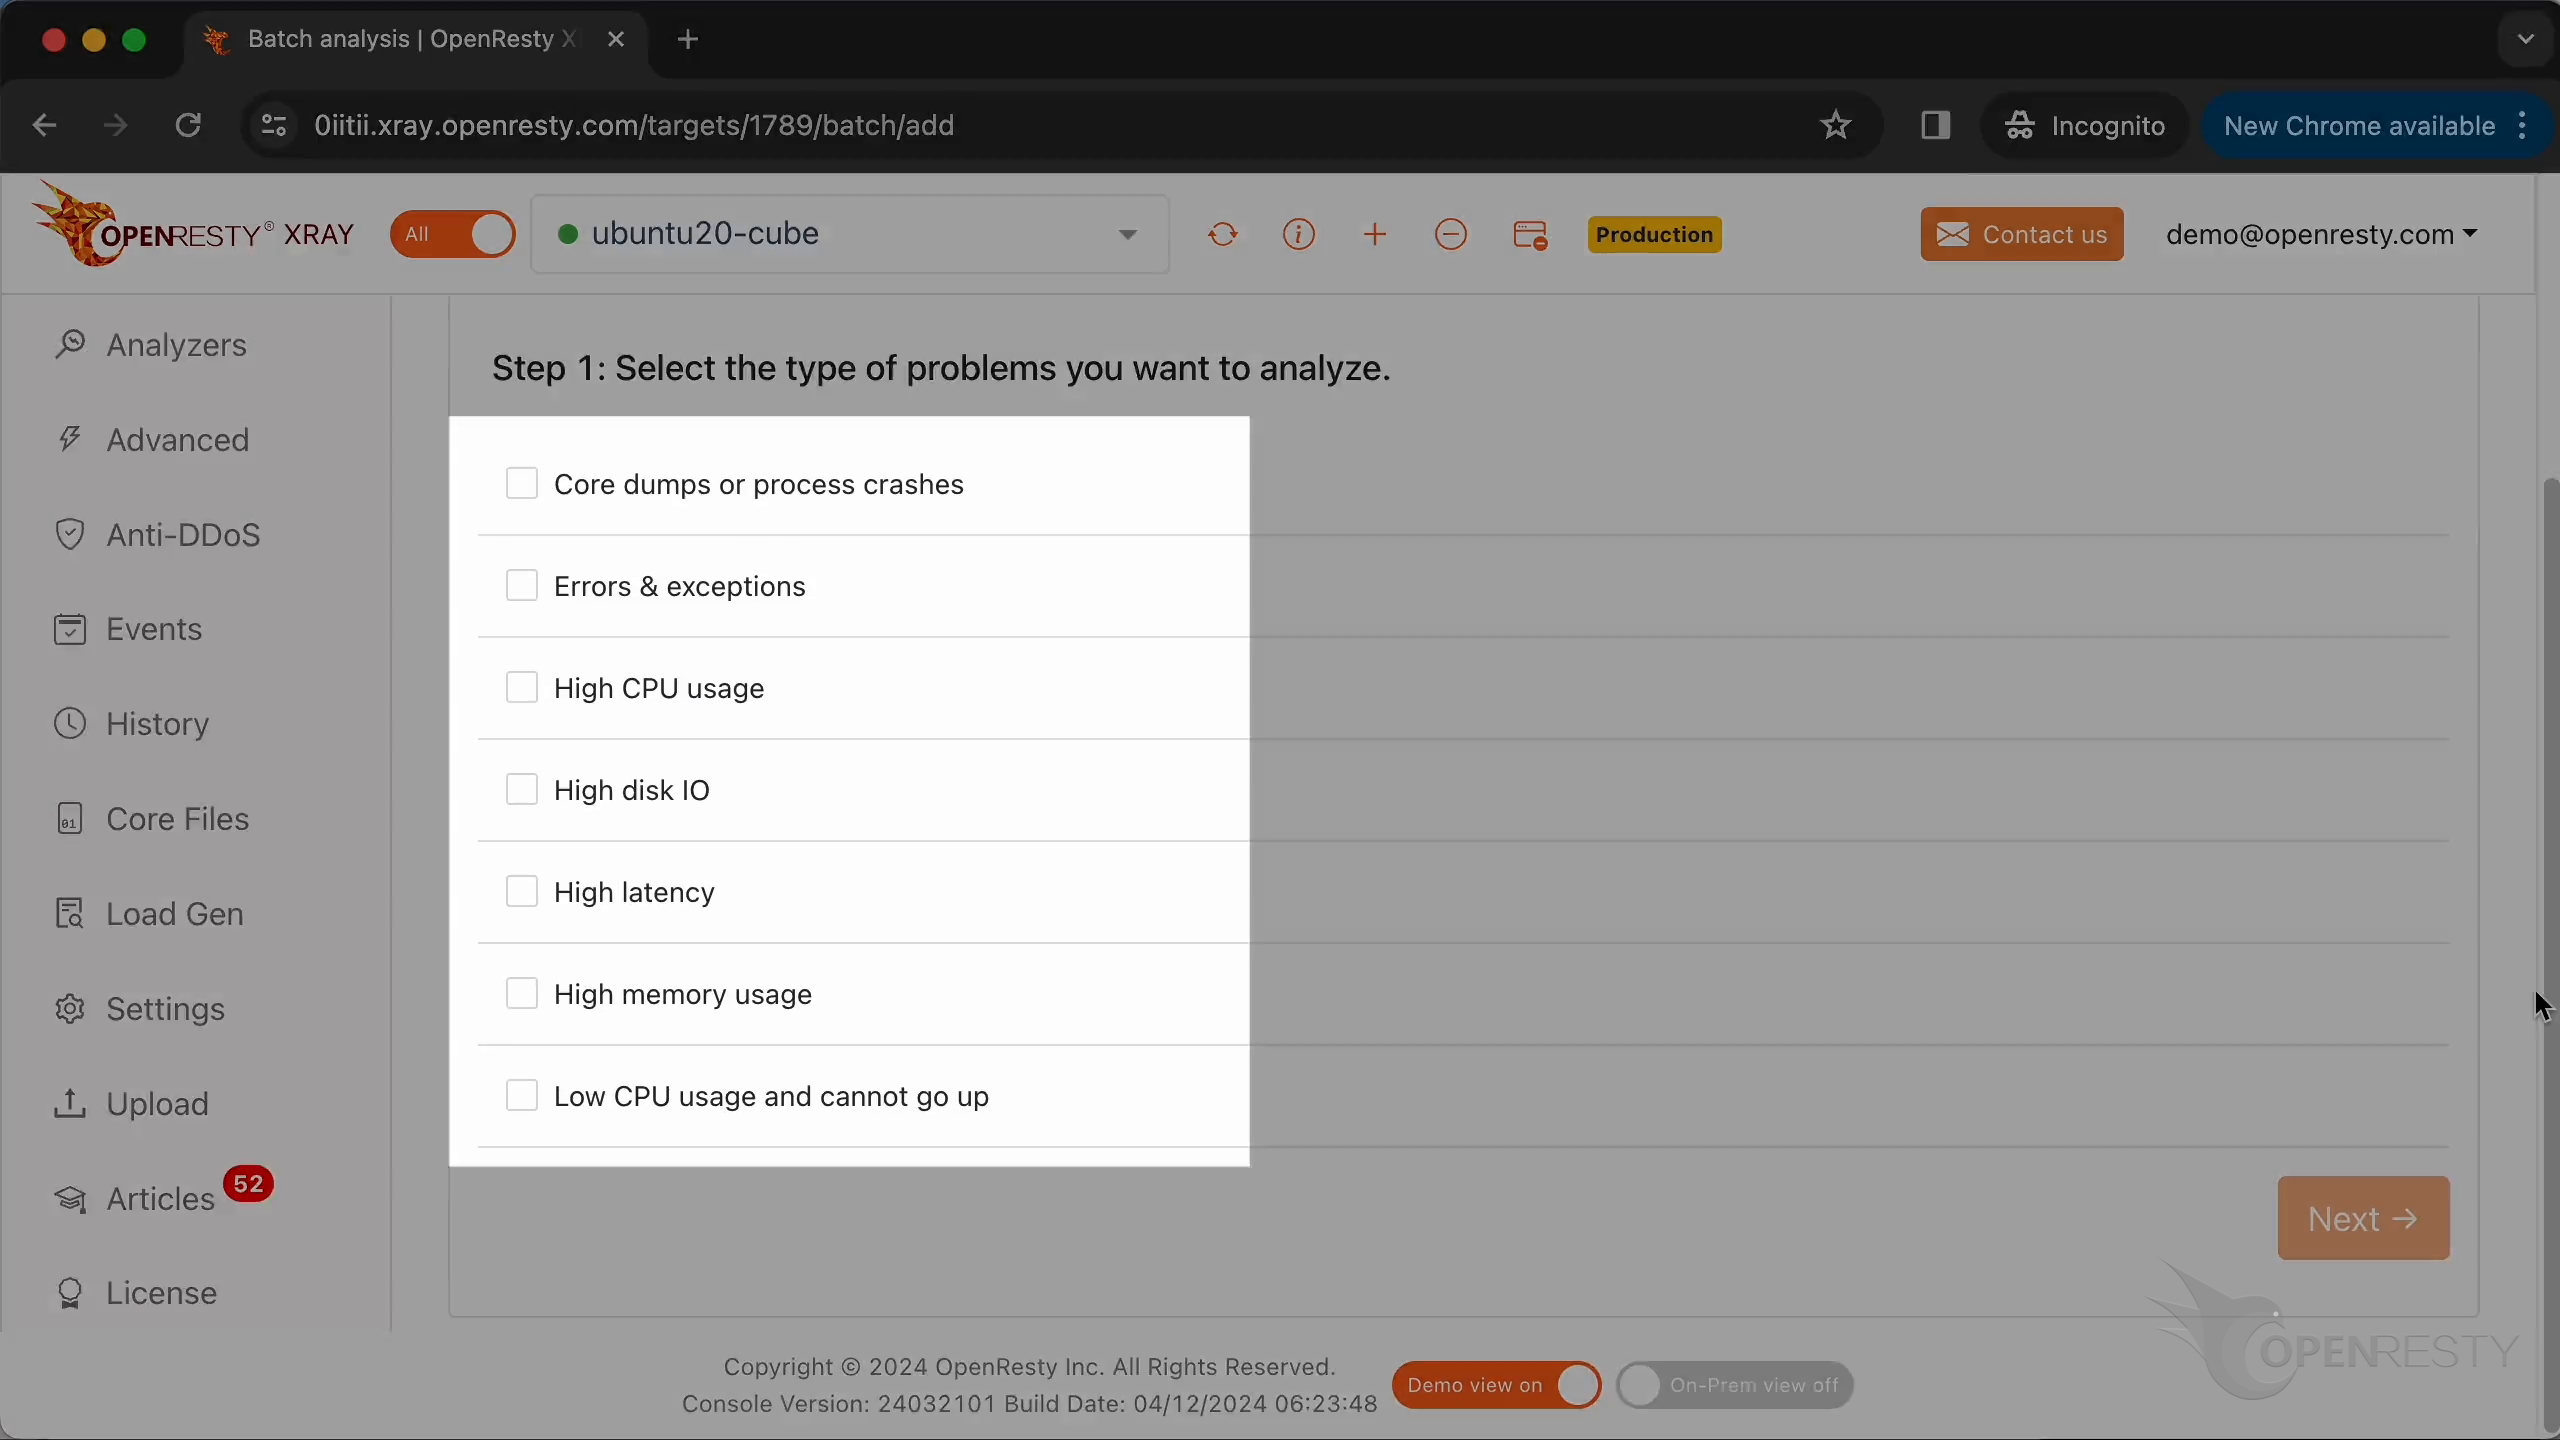
Let’s select “High CPU Usage”.
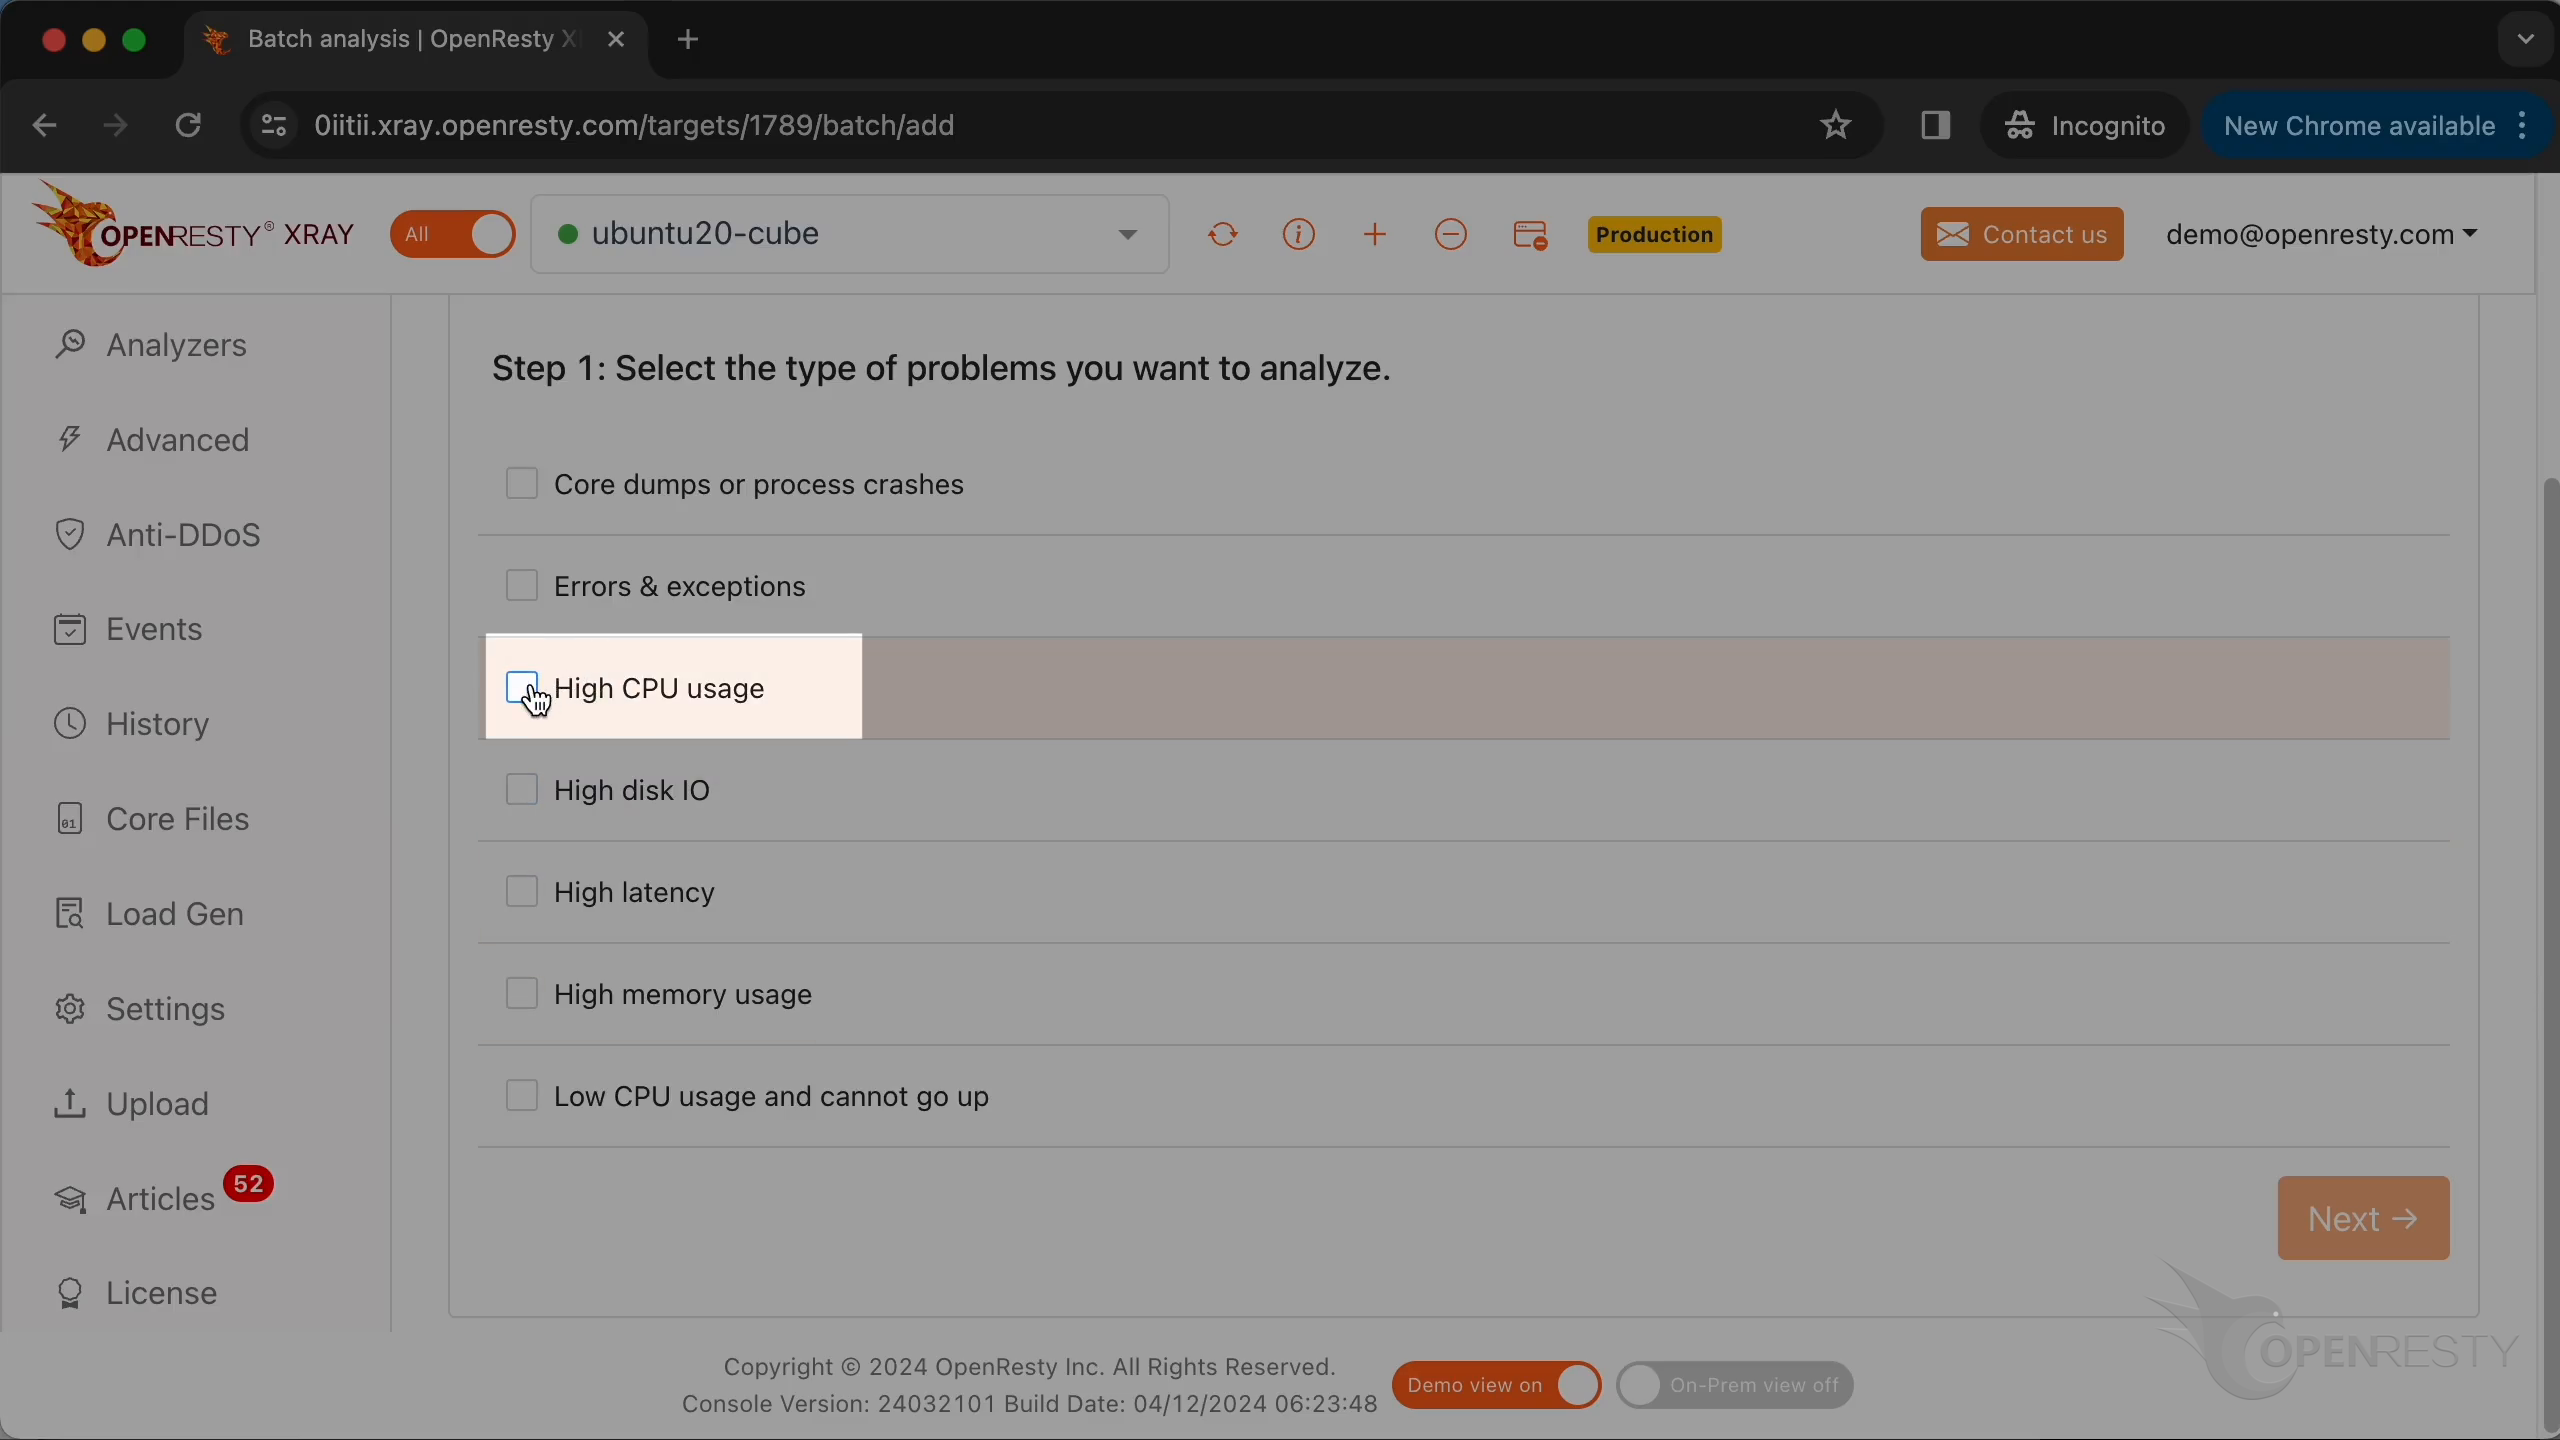
Click on “Next”.
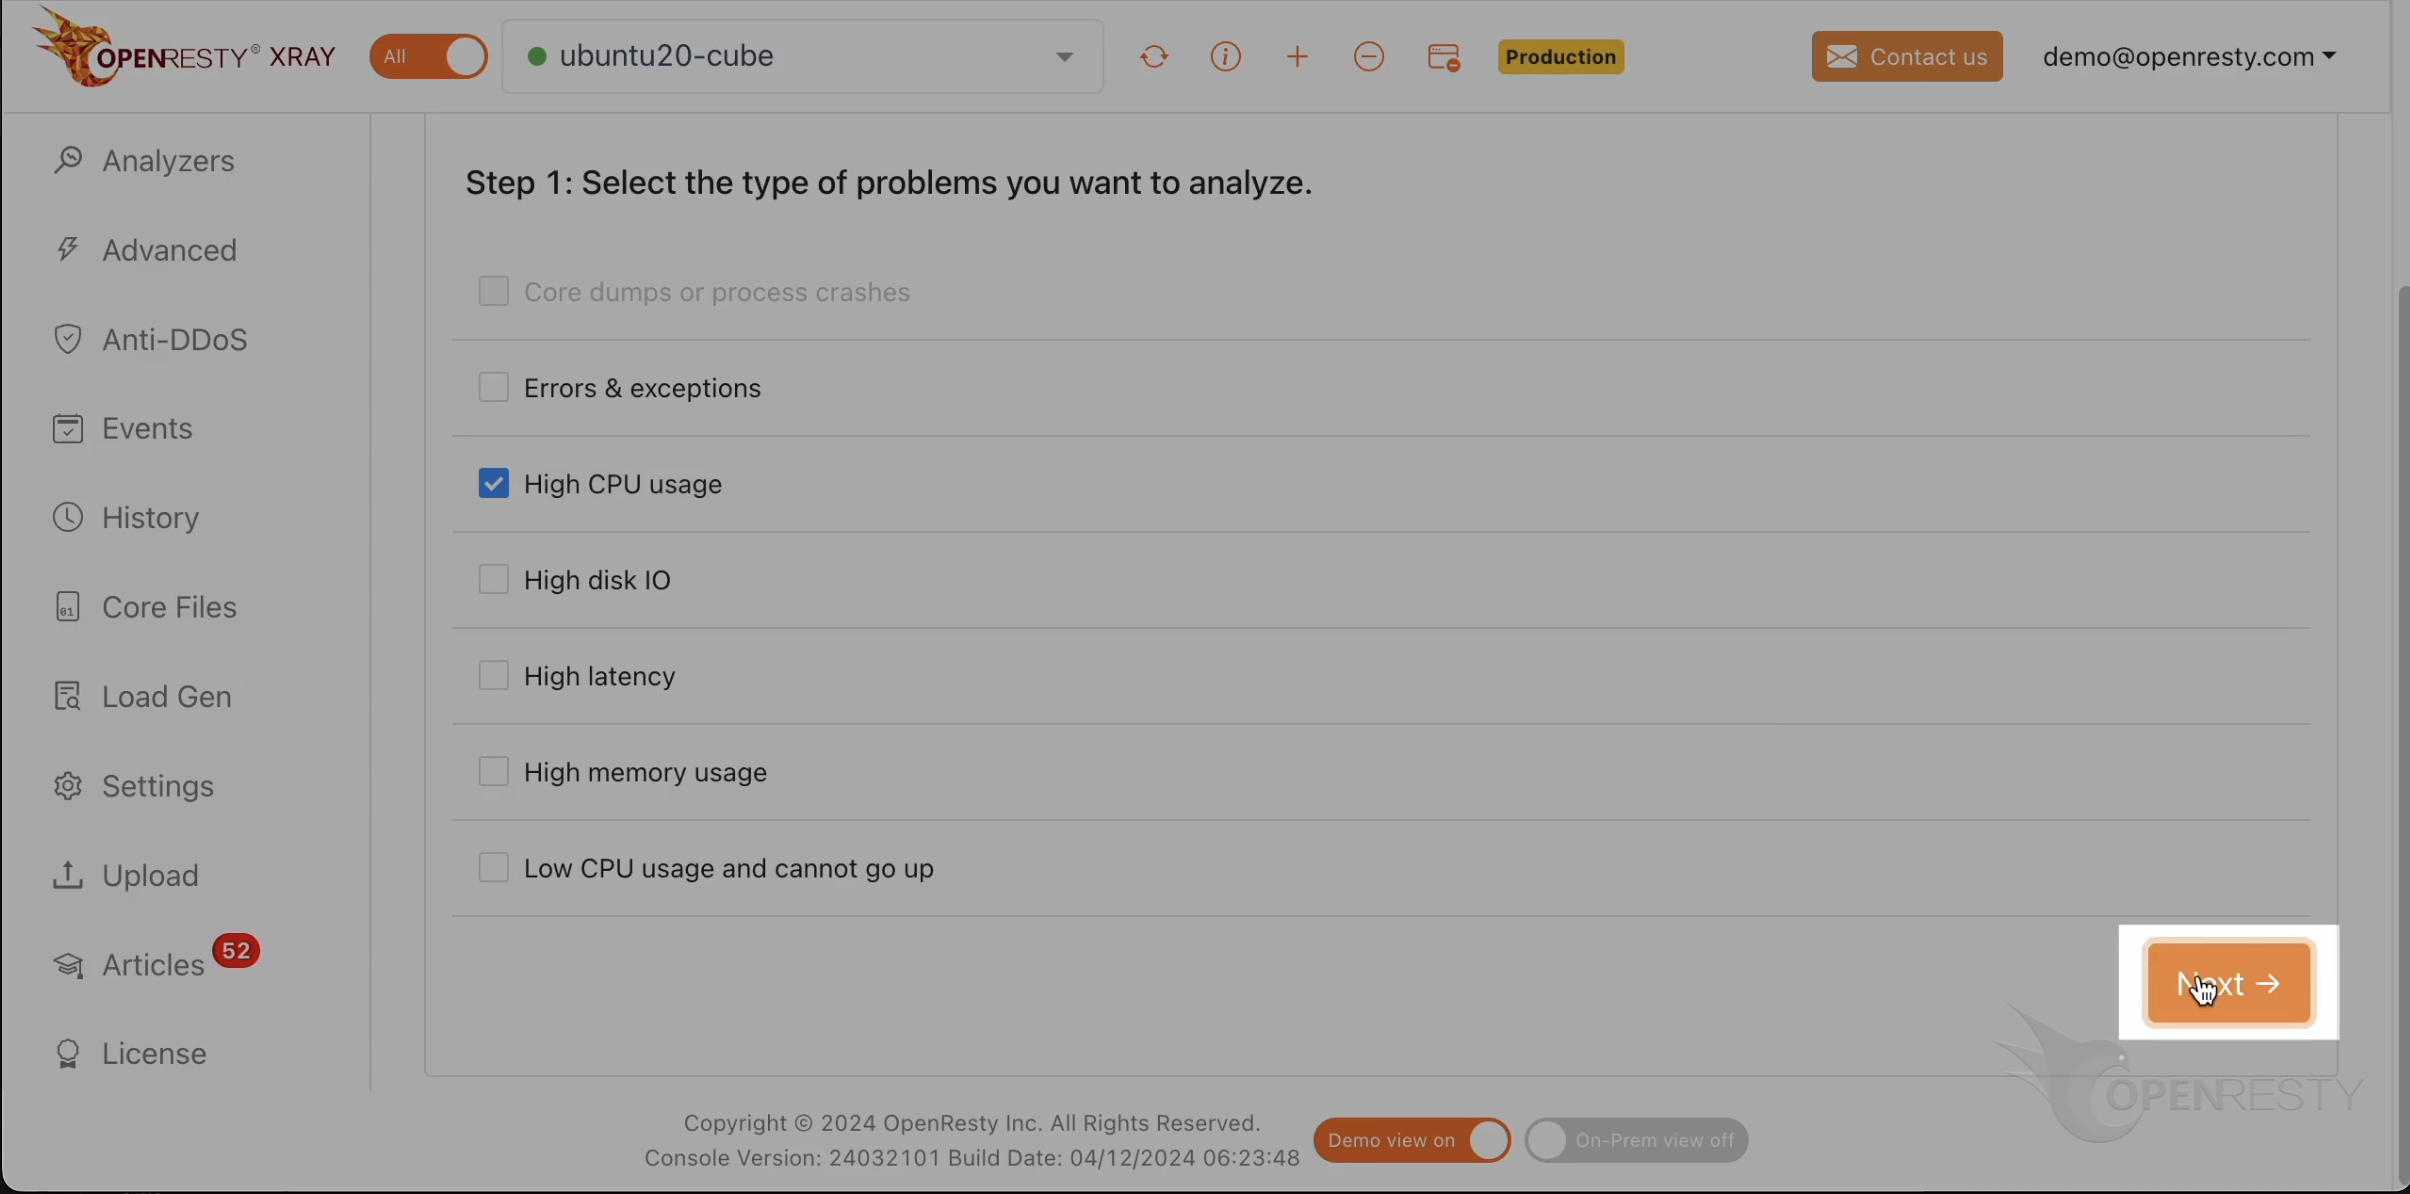
Select the OpenResty application.
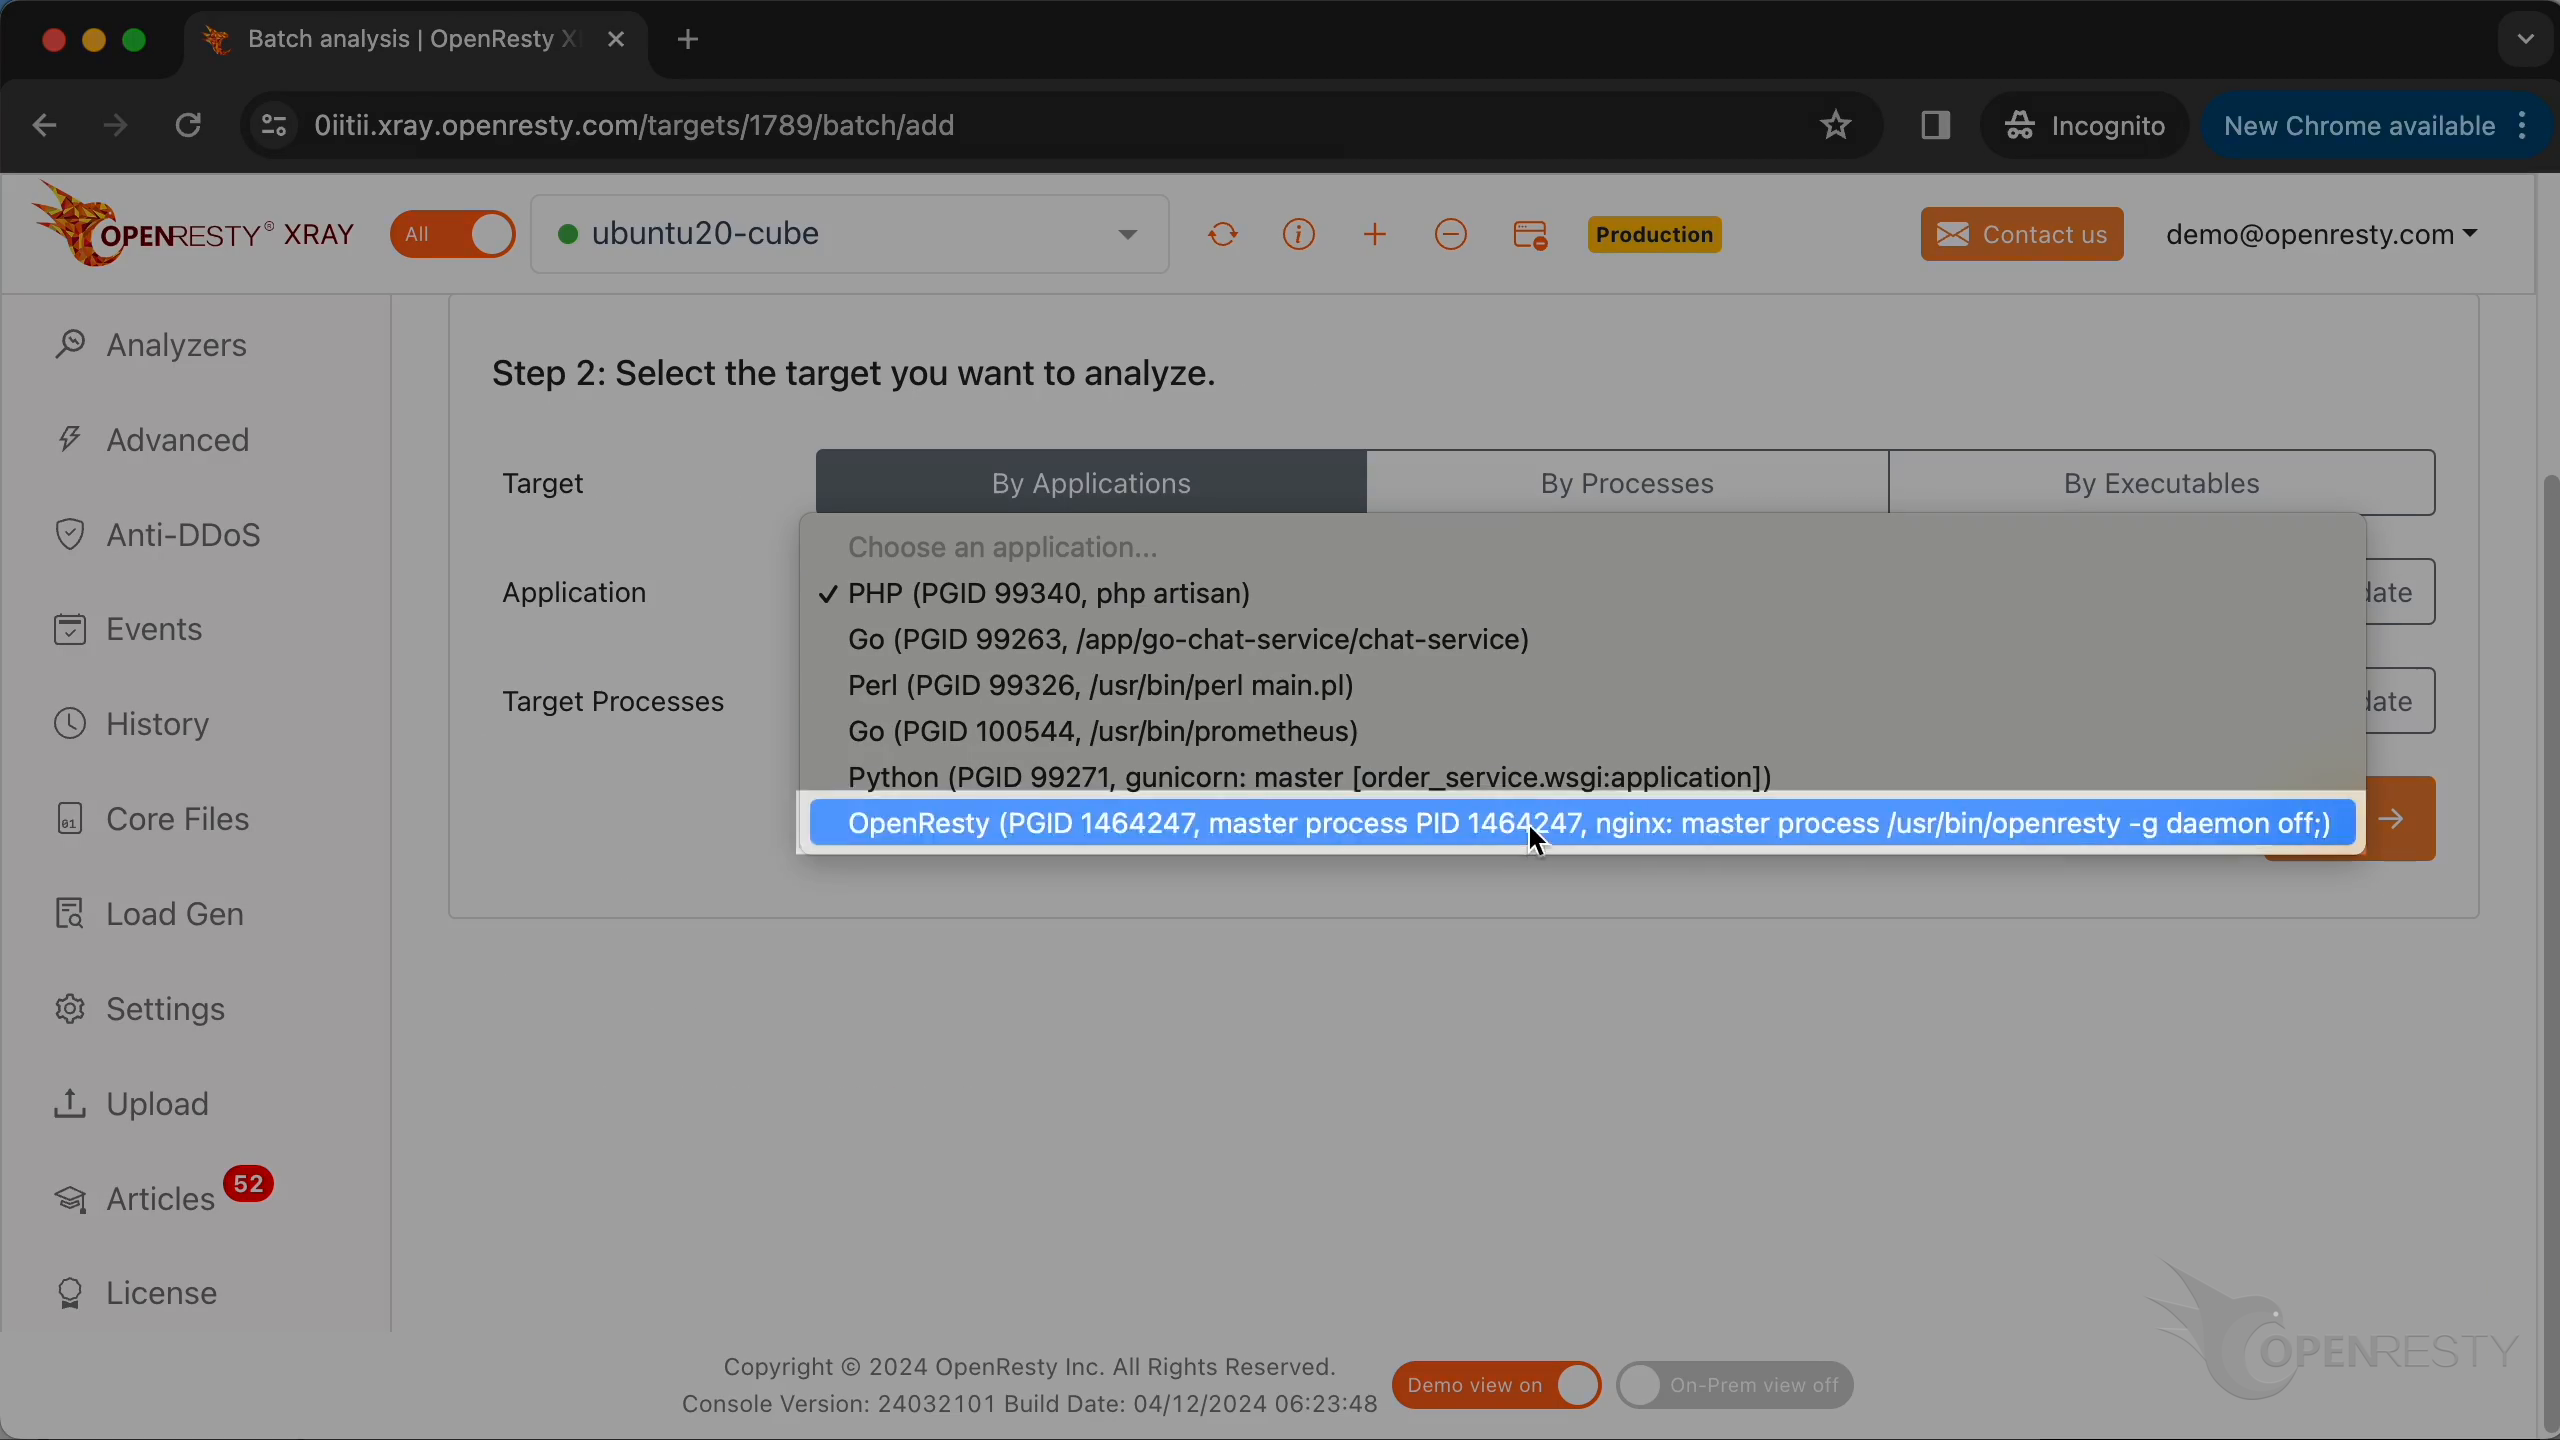
Select the worker process.
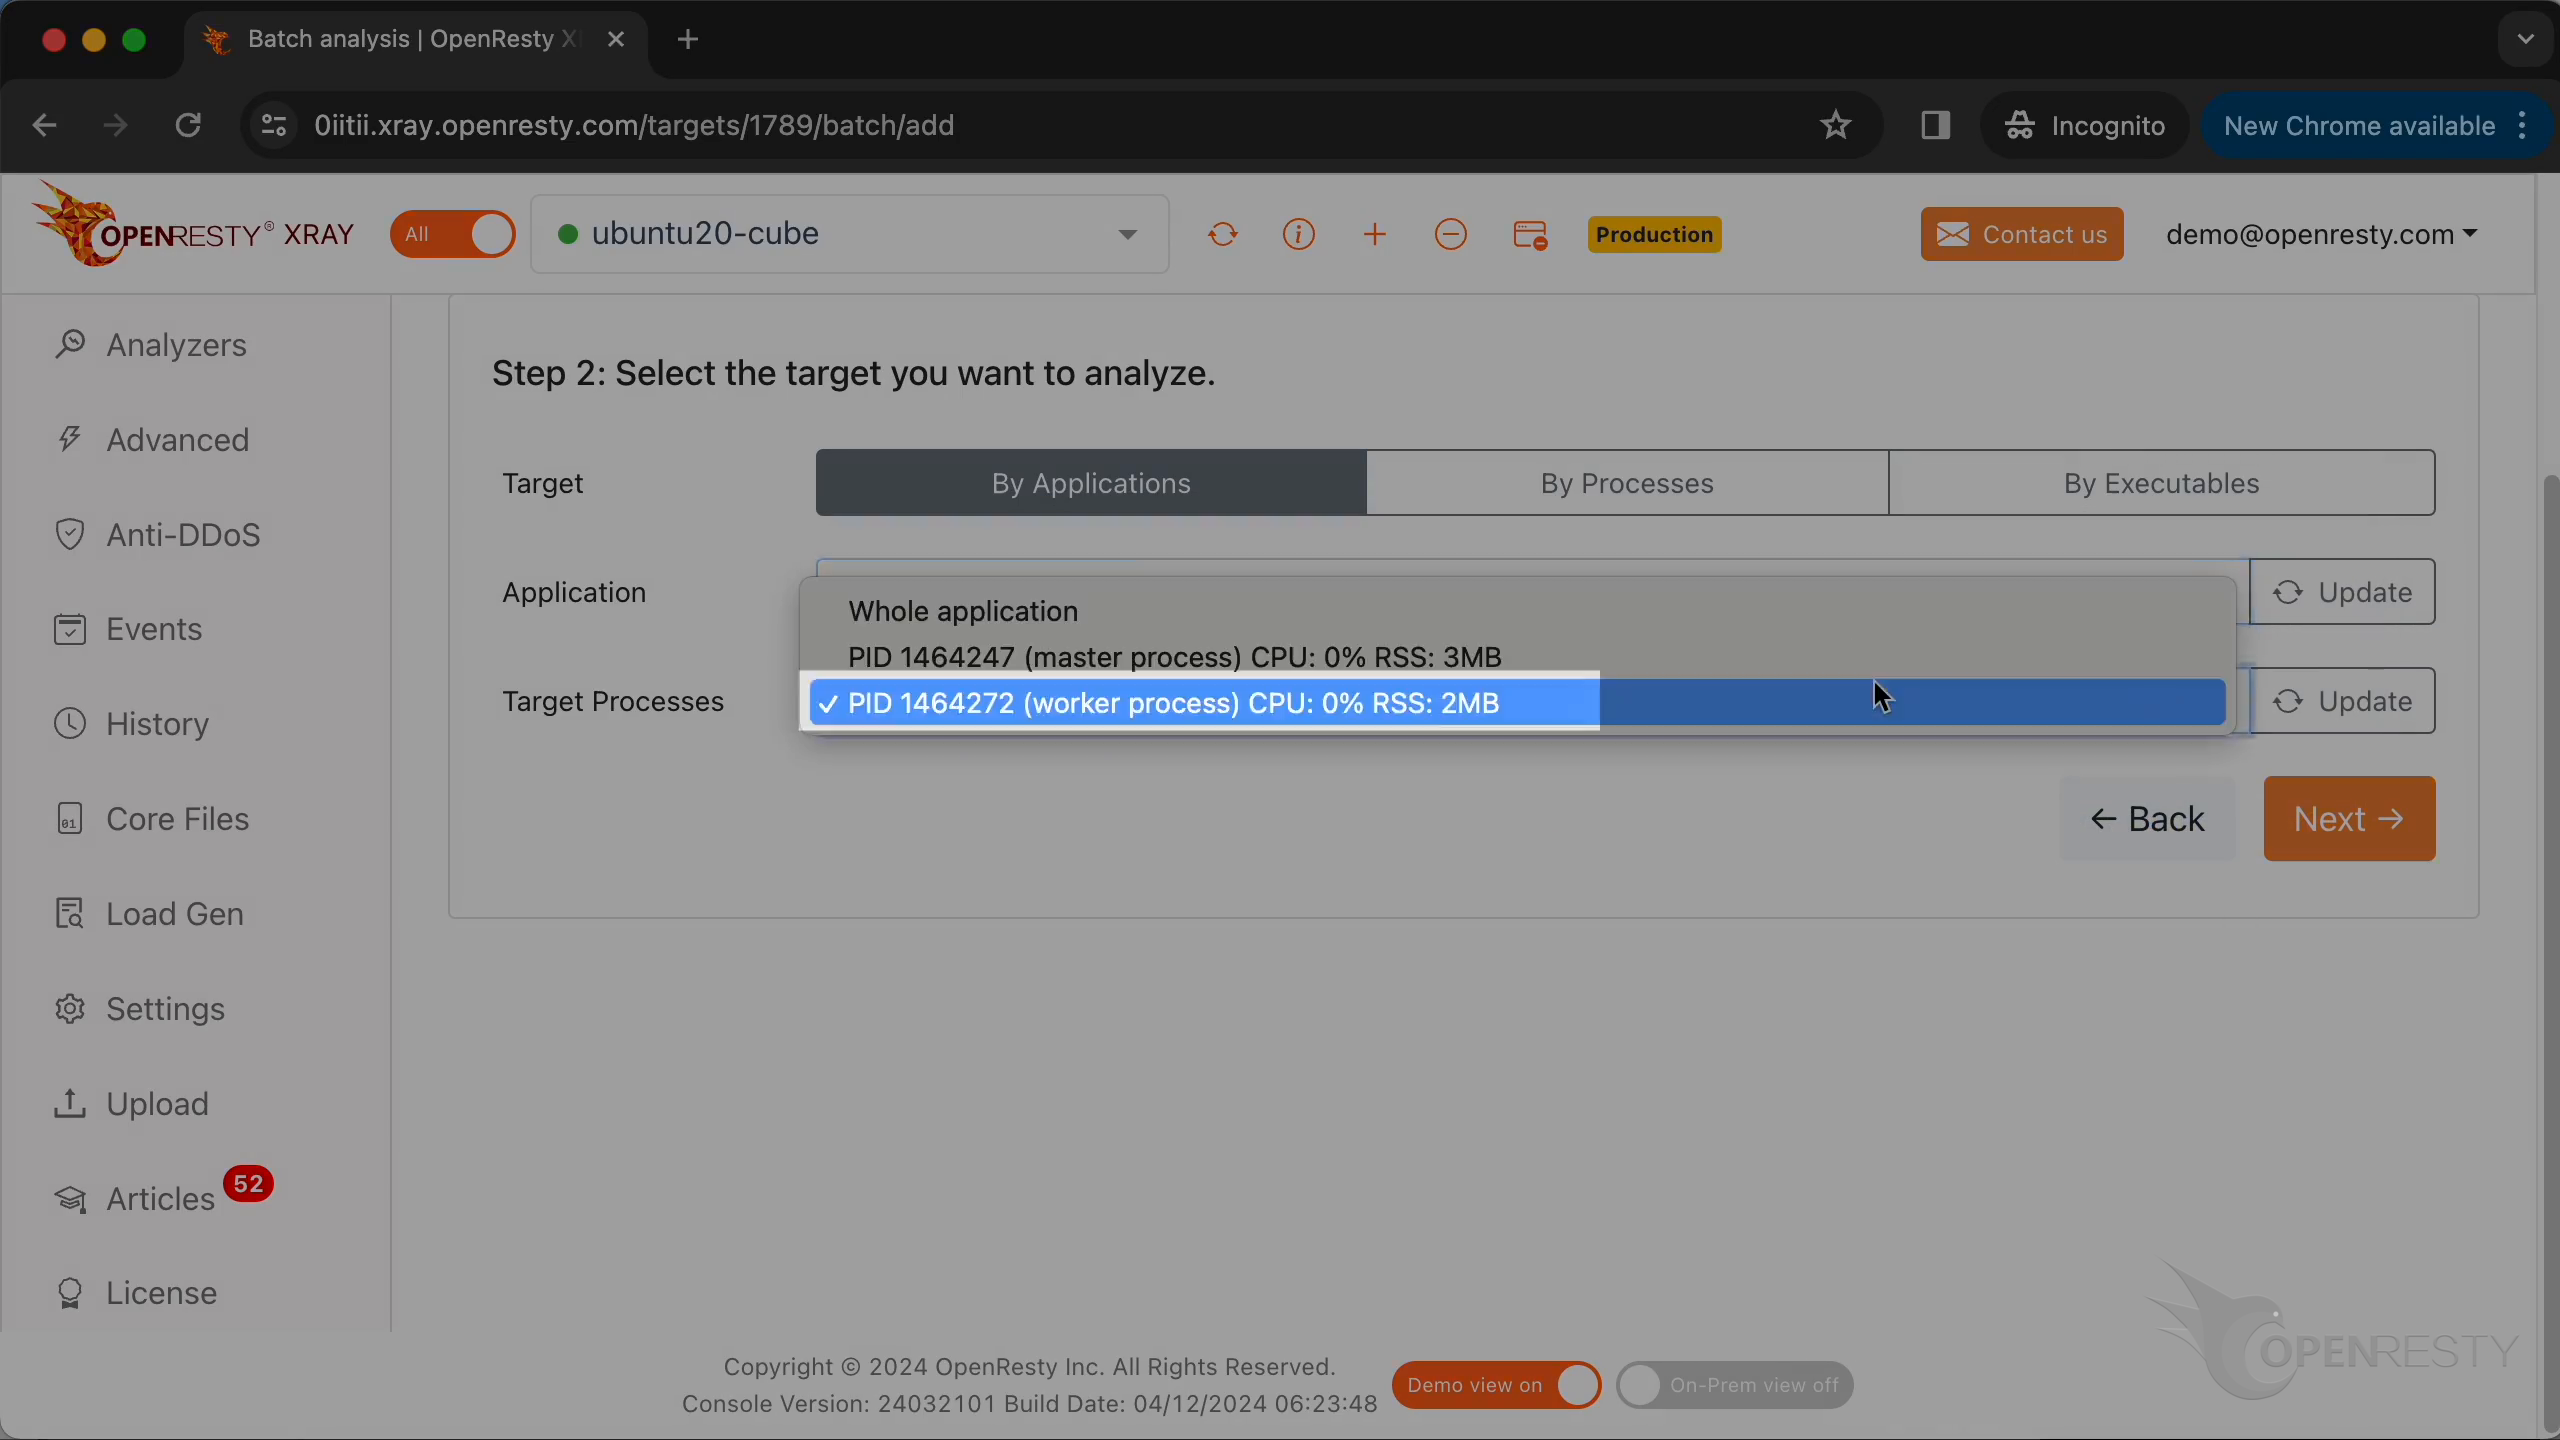
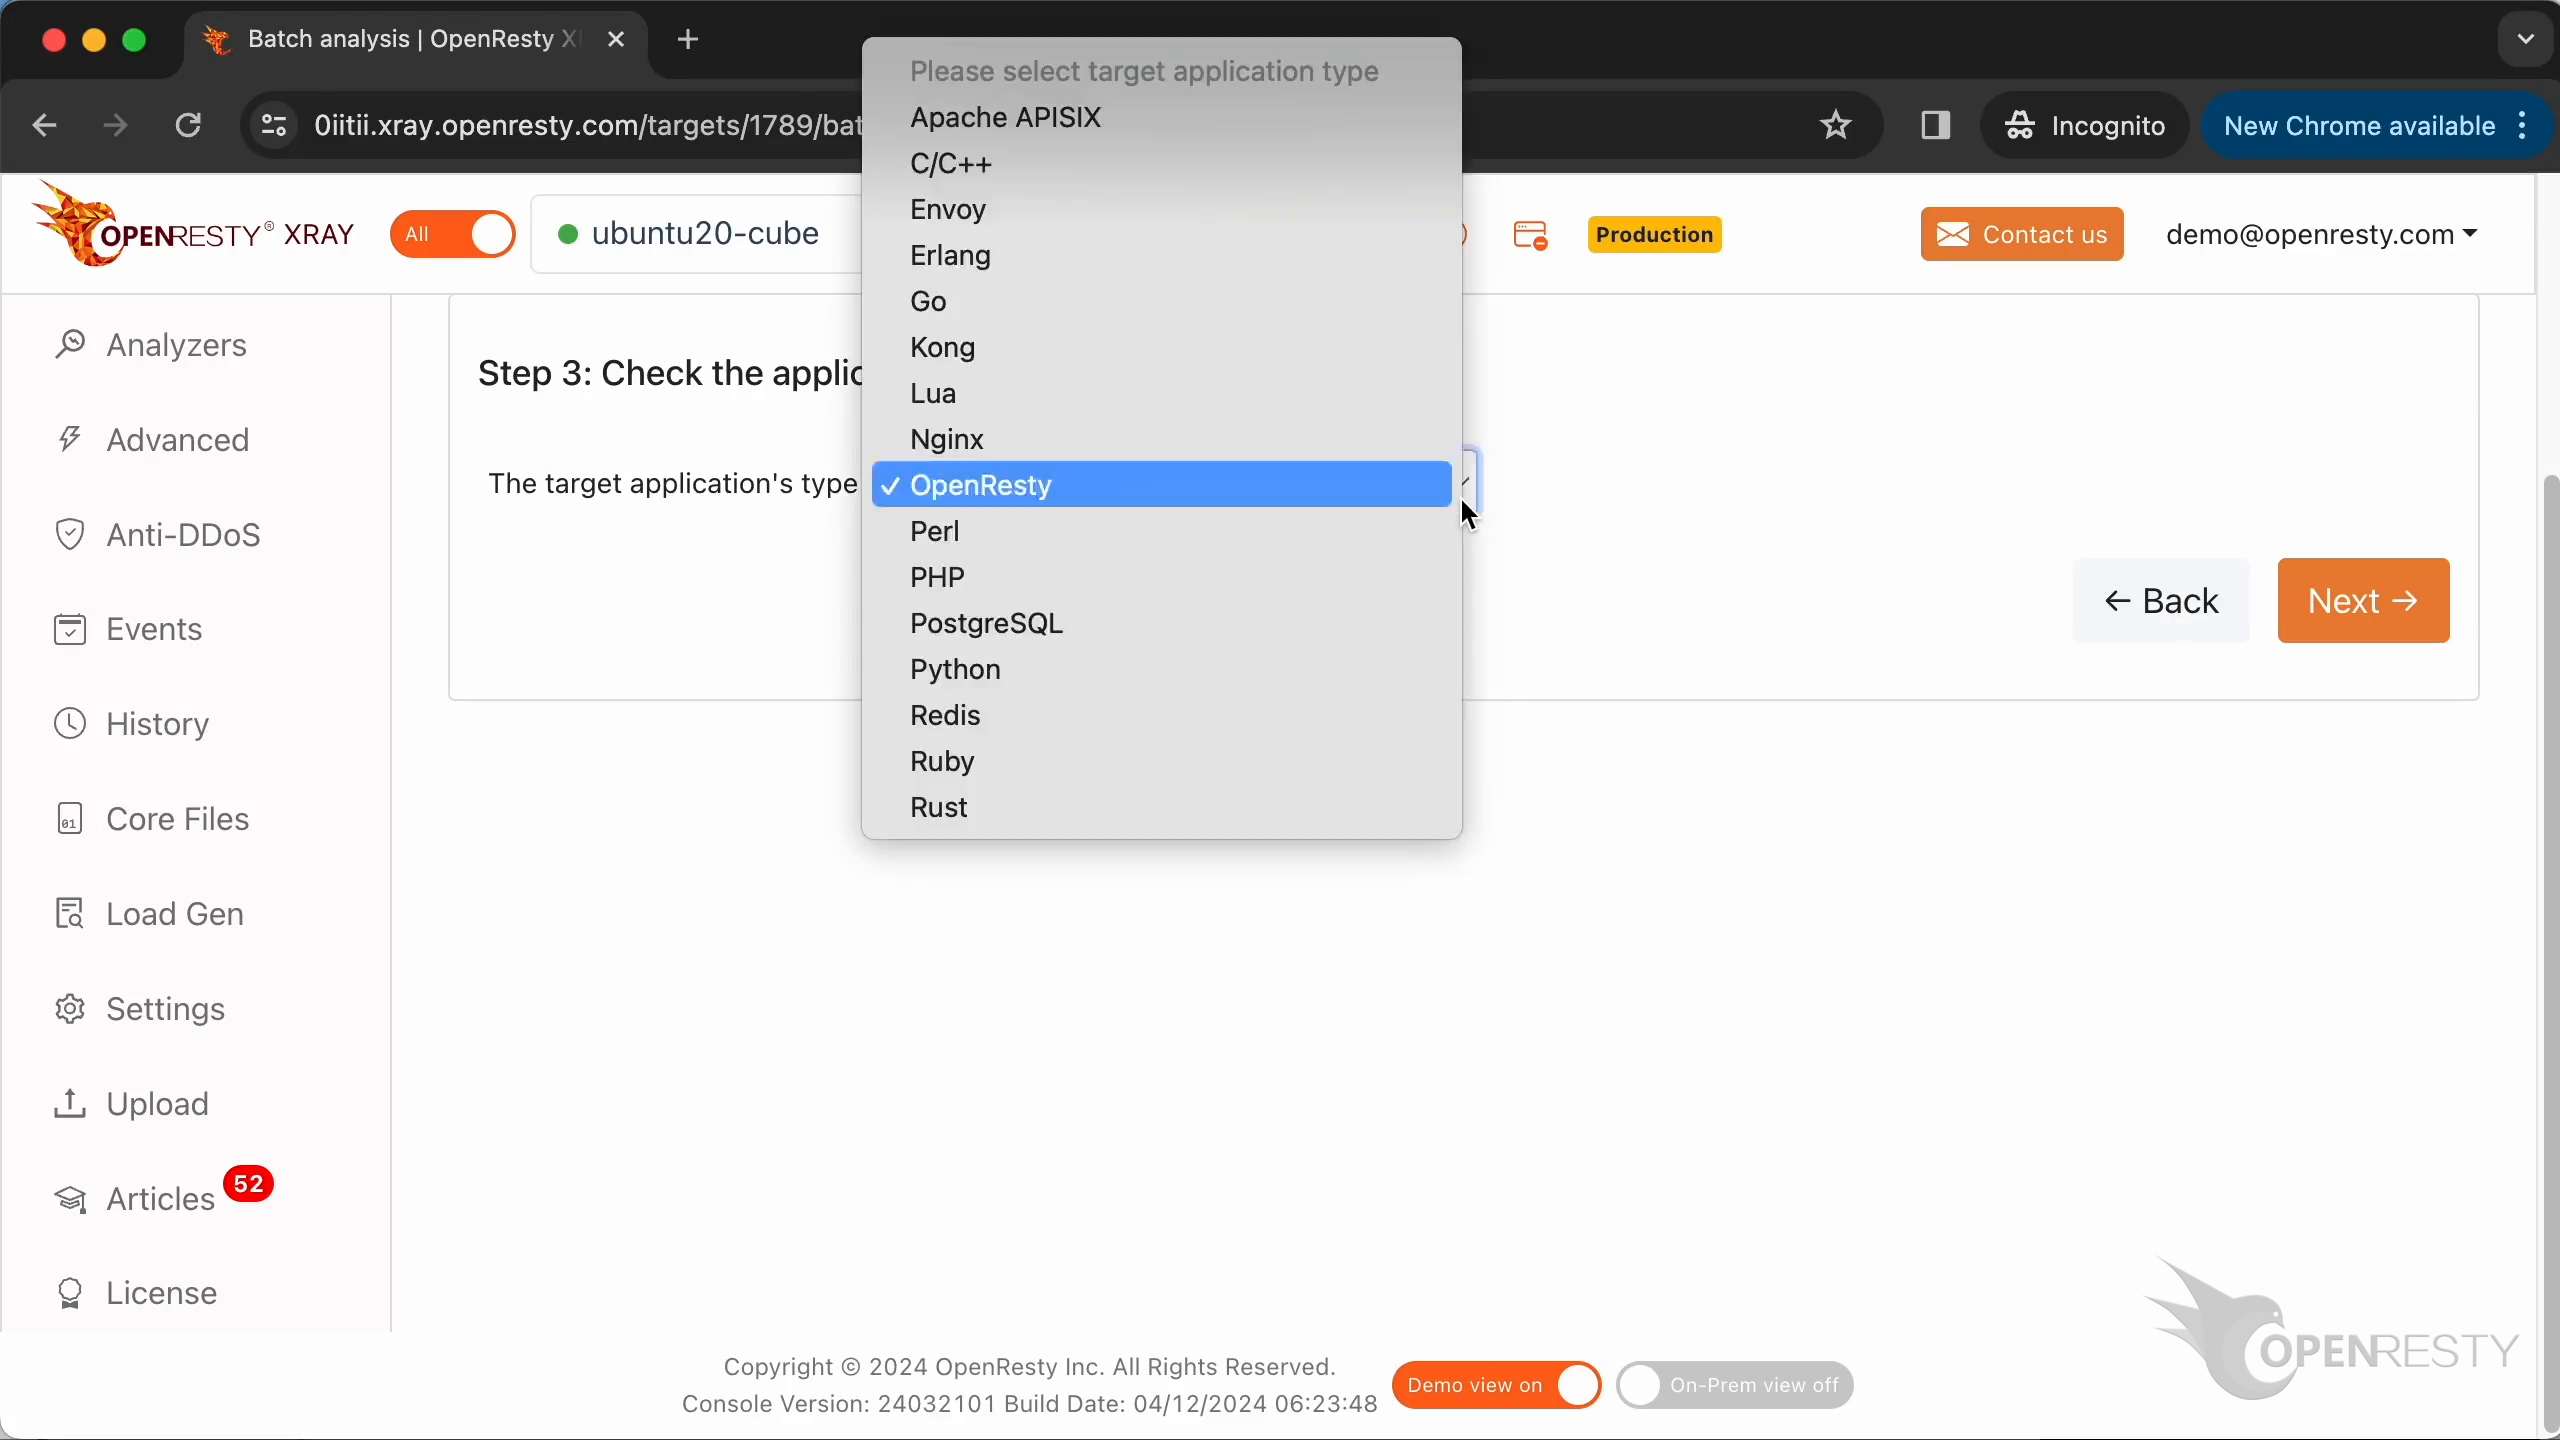
Make sure that the application type is right. Usually, the default should be correct.
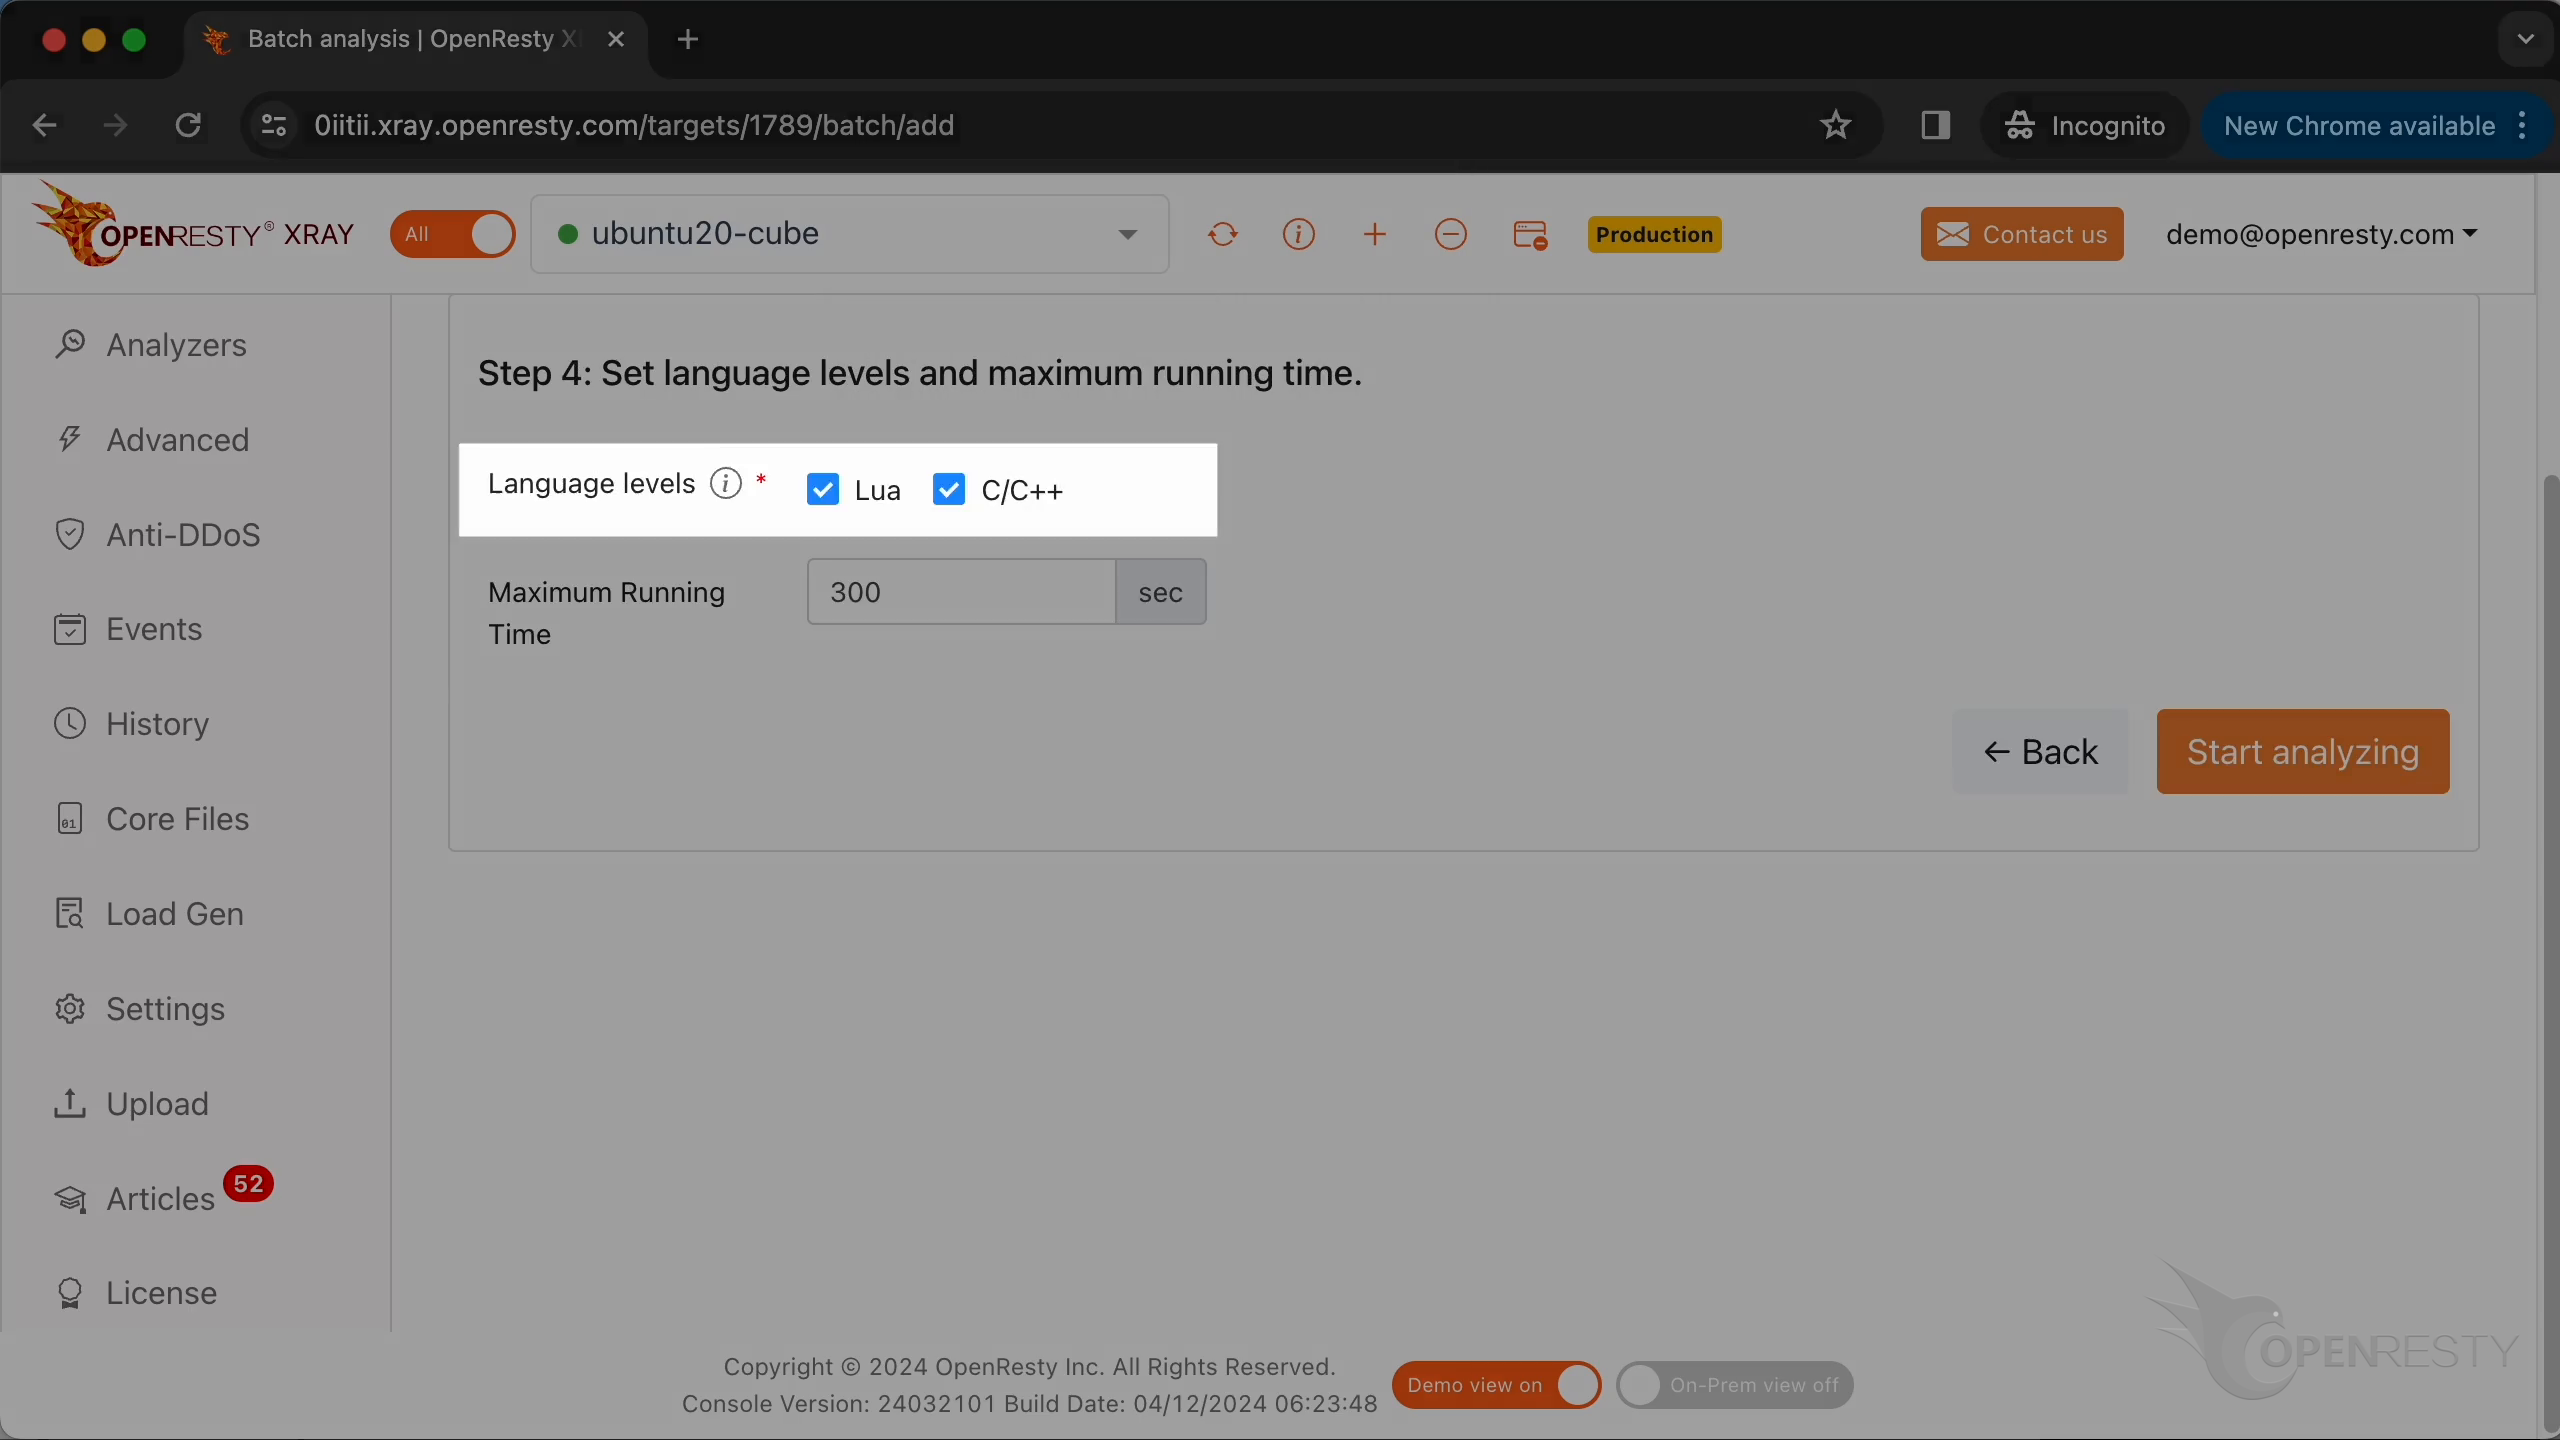
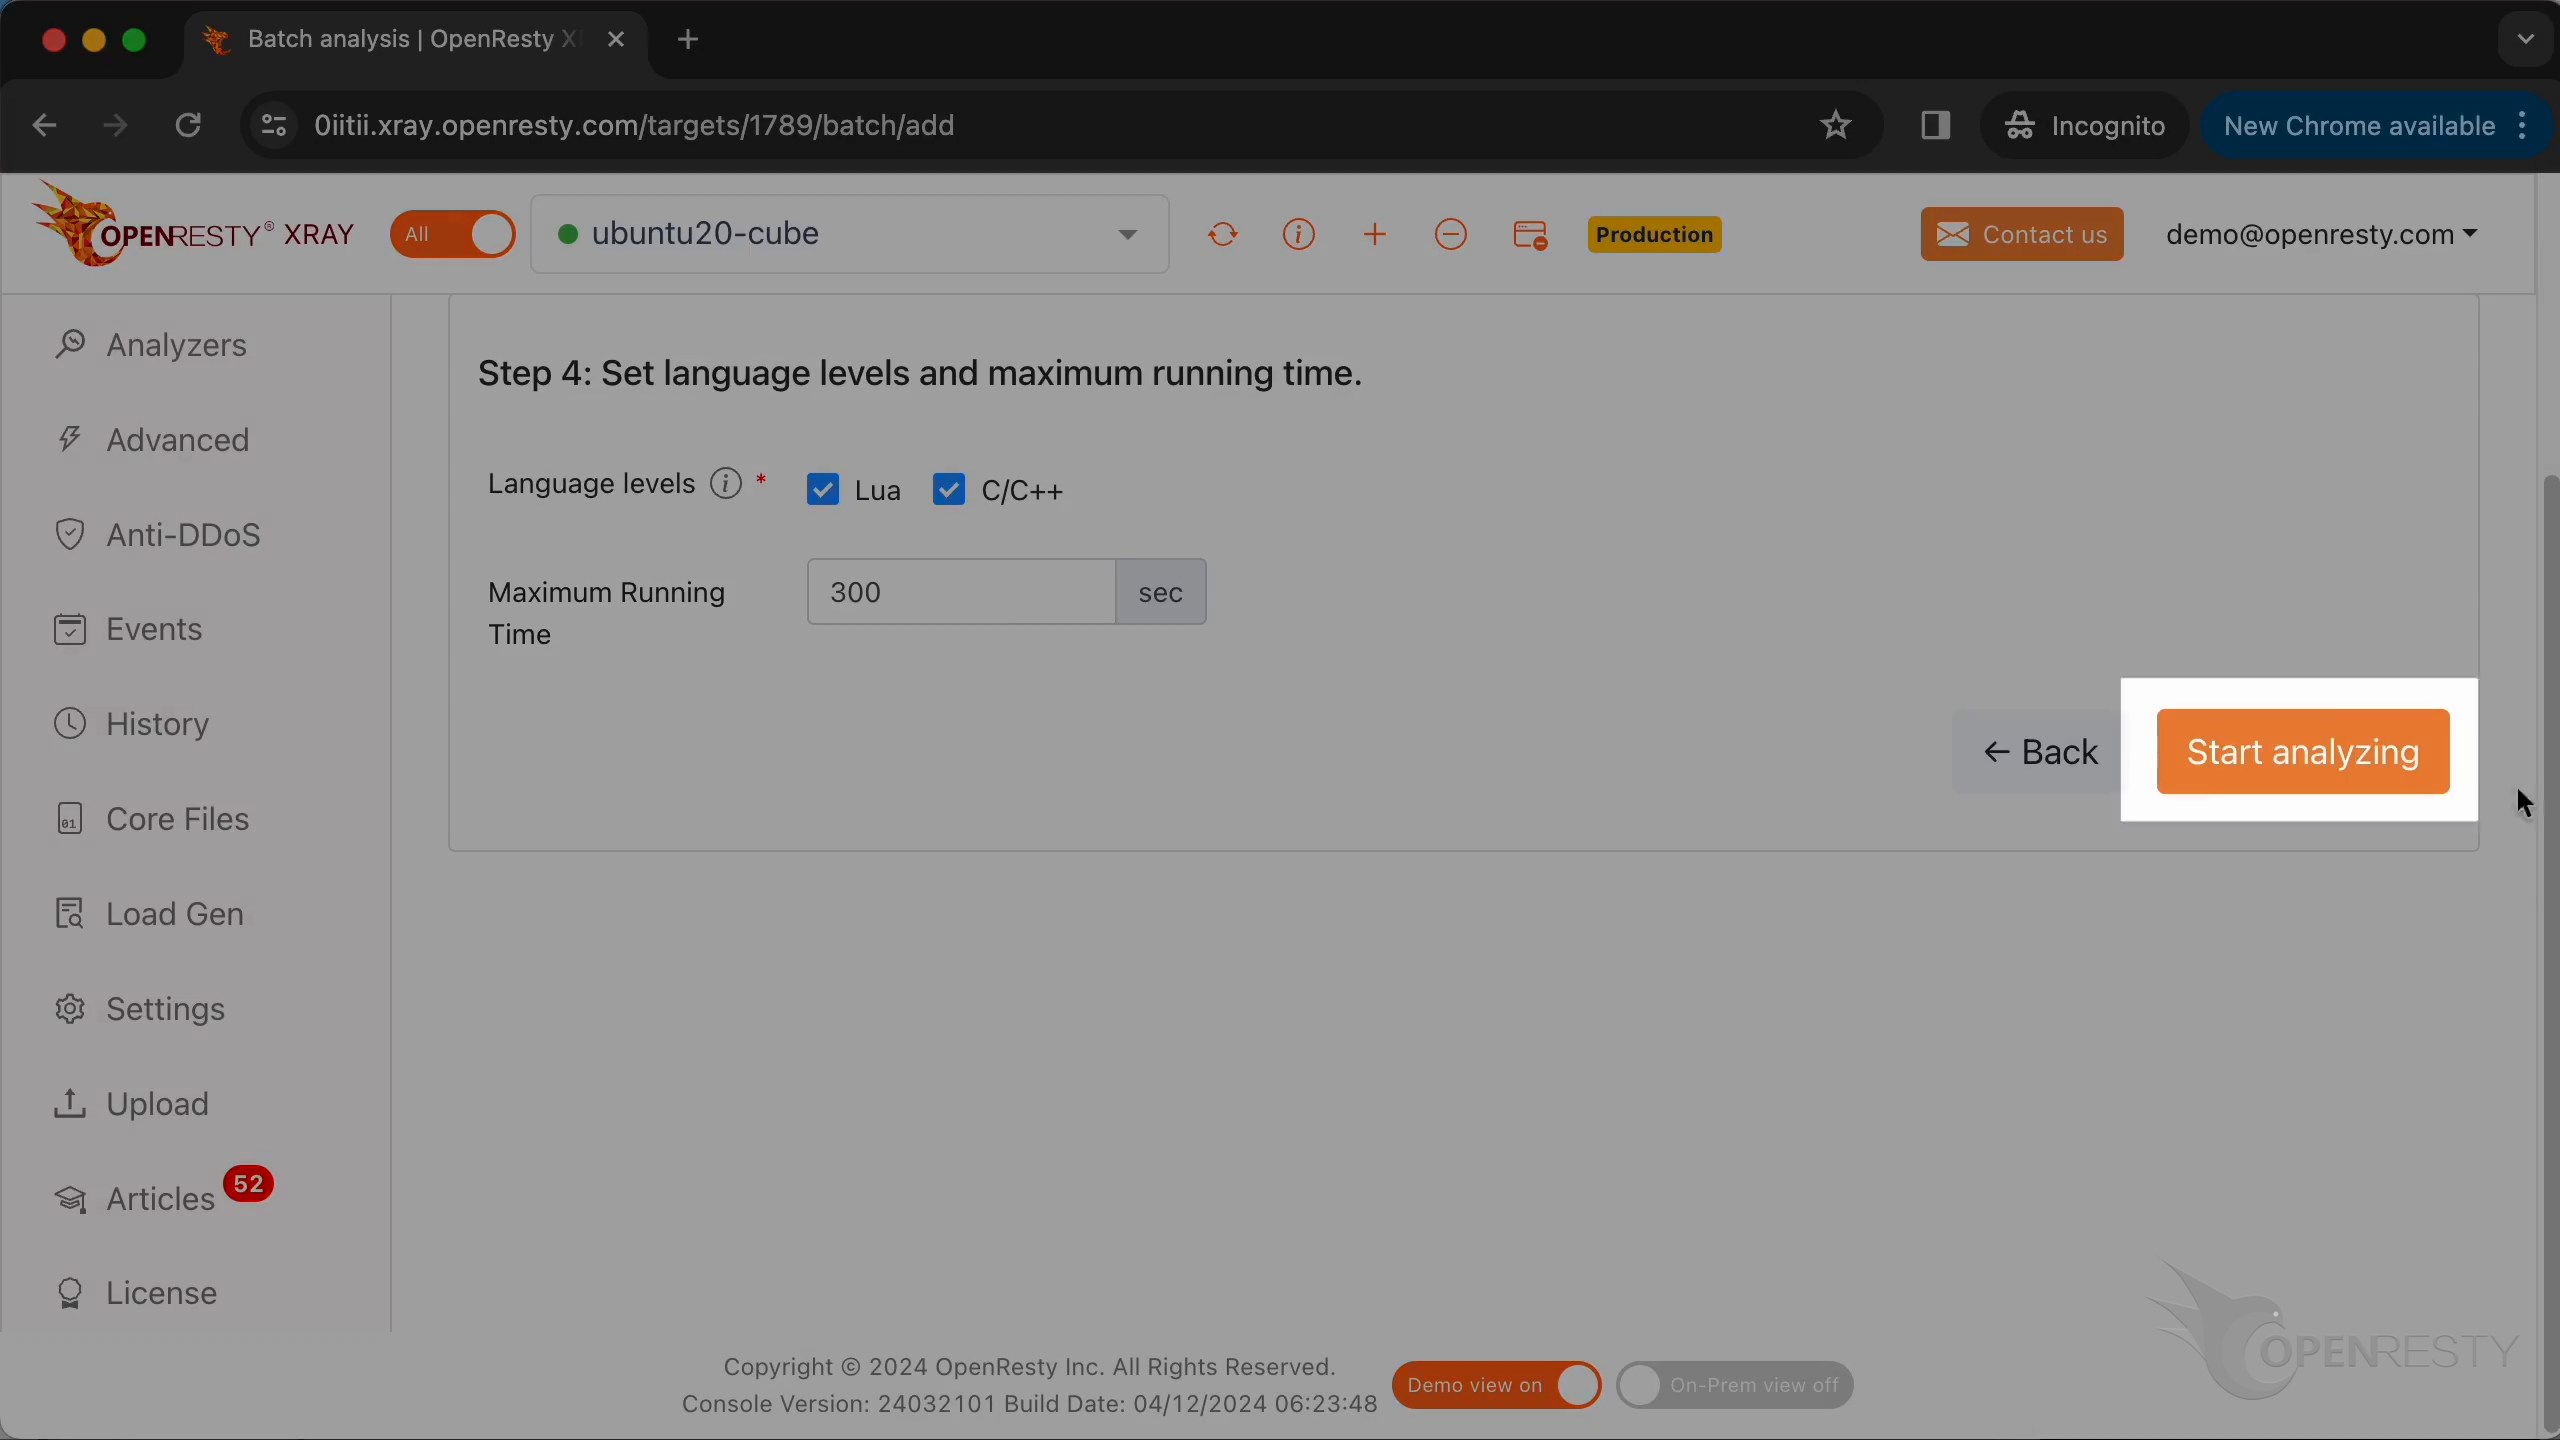
OpenResty XRay can analyze multiple language levels at the same time. We’ll keep both Lua and C/C++ selected.
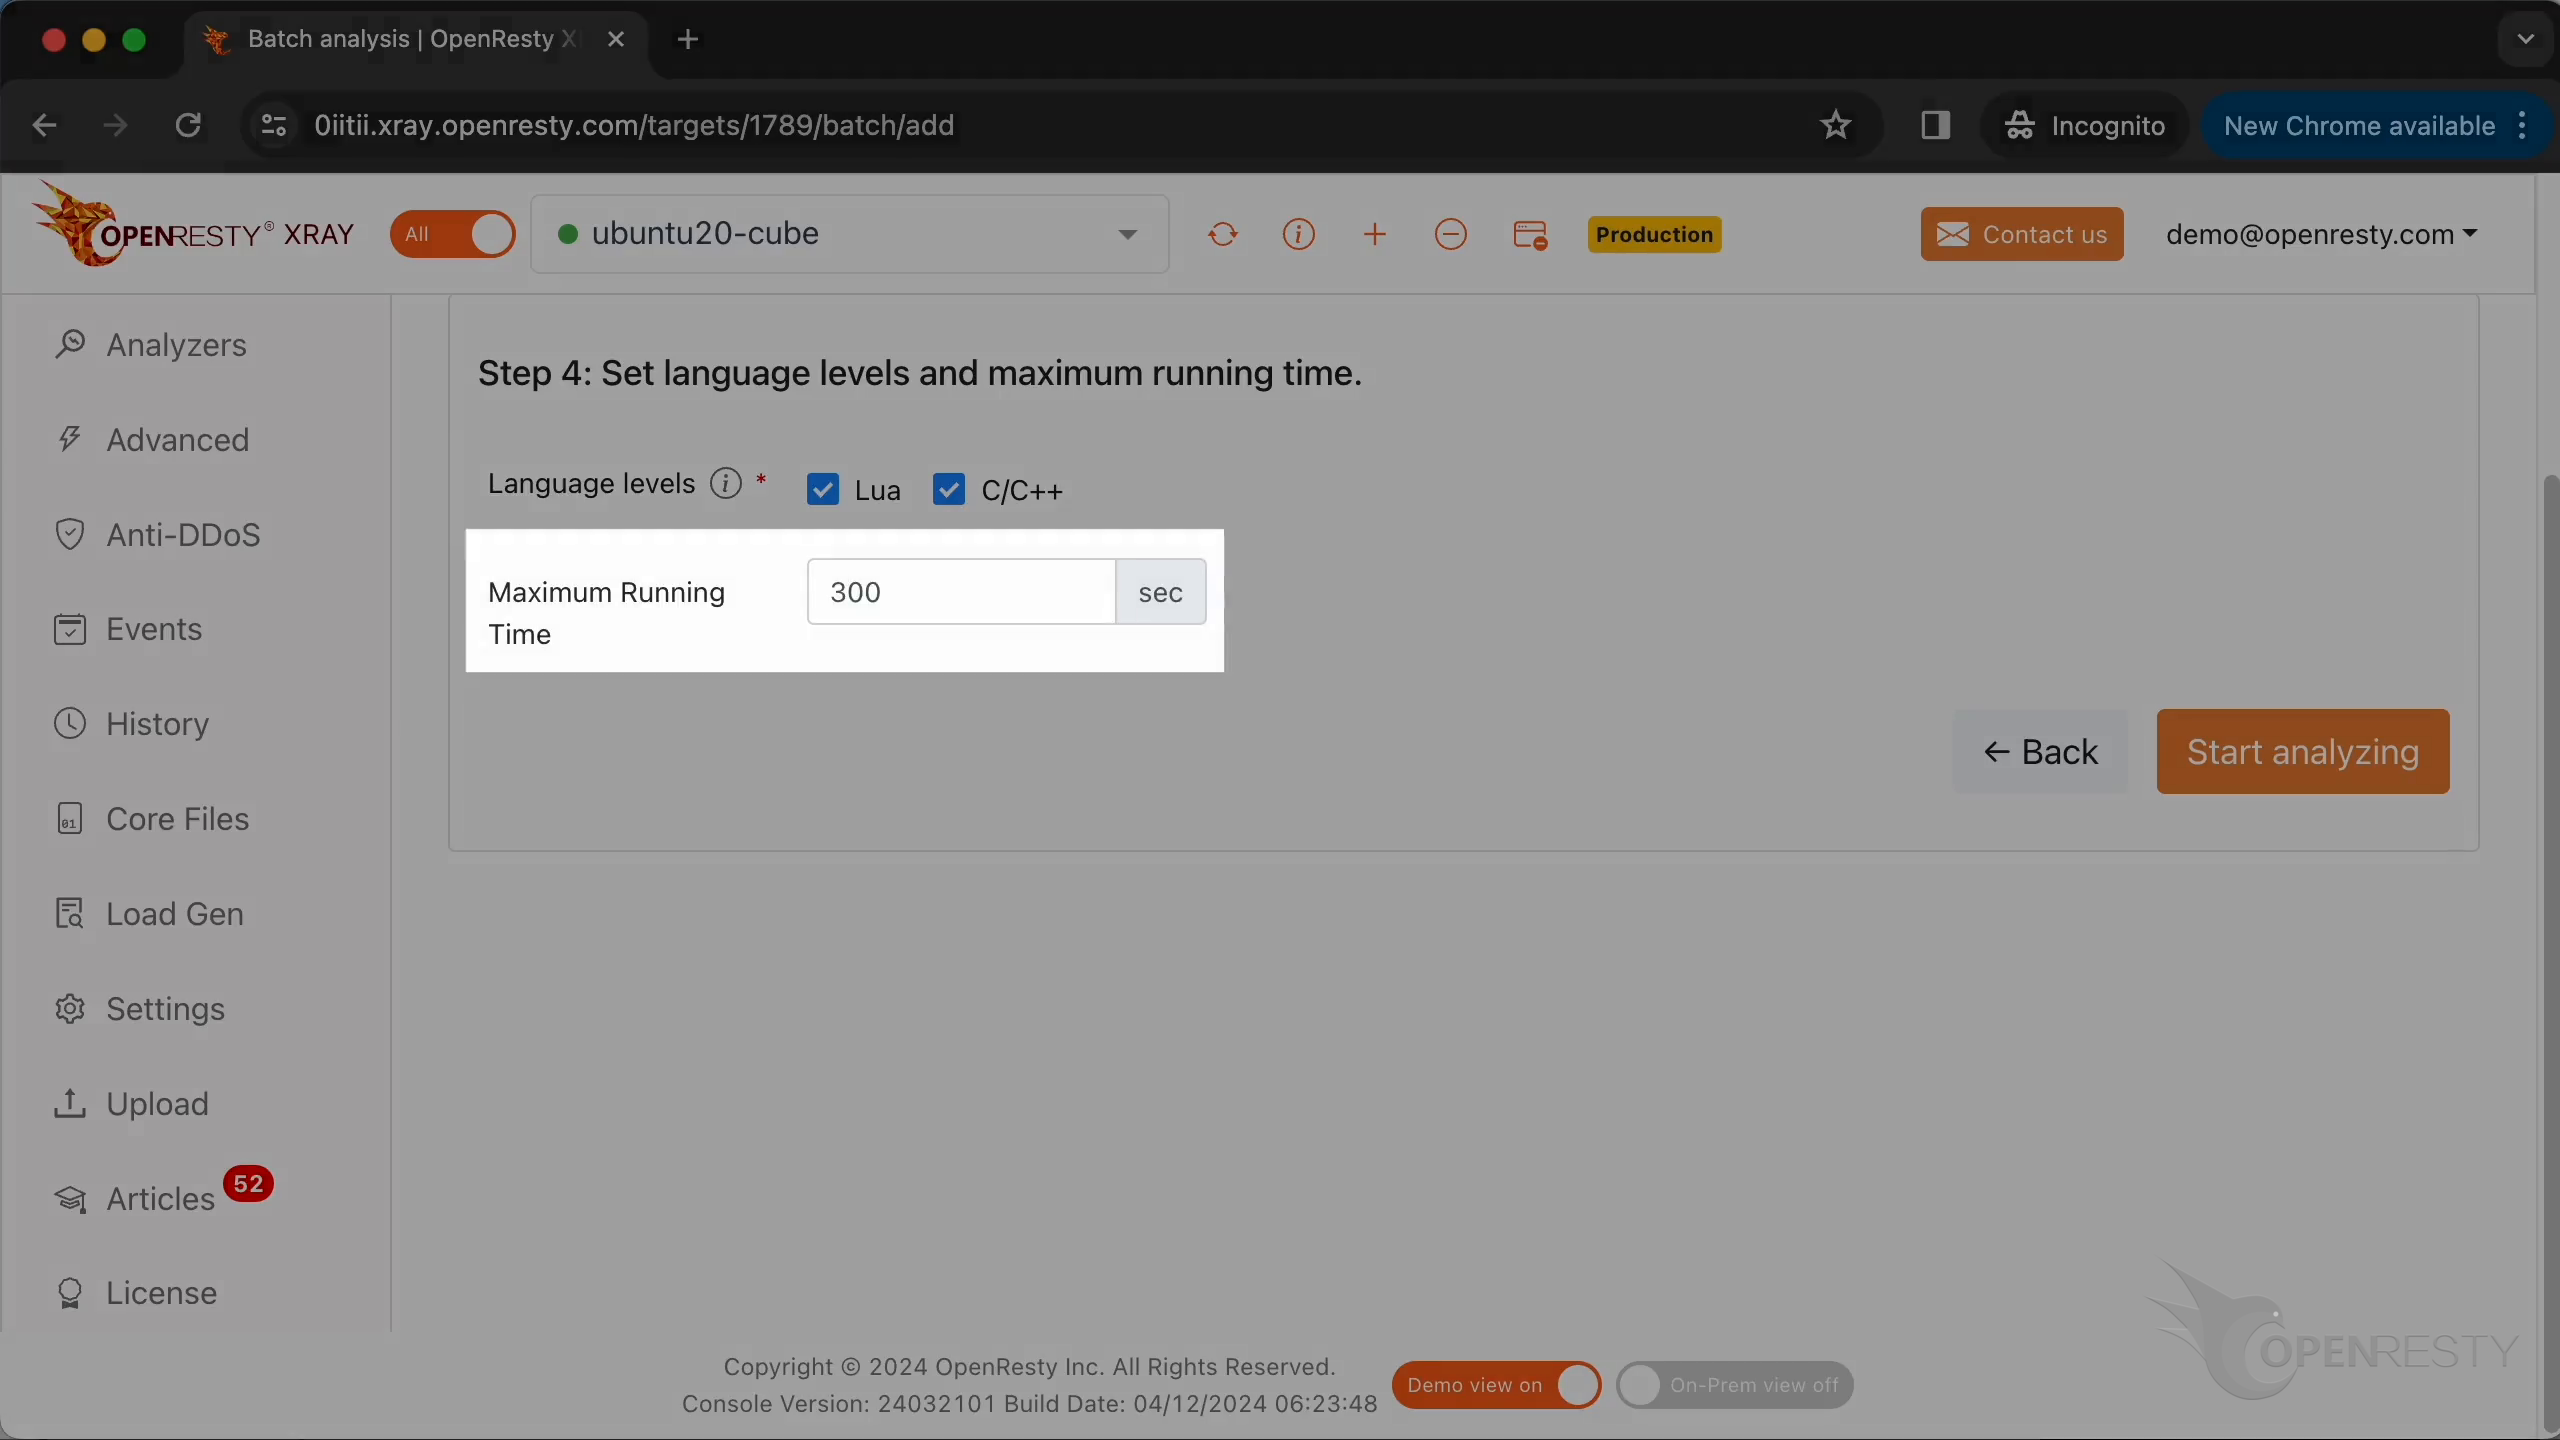
We can also set the maximum analyzing time. We’ll leave it as 300 seconds, which is the default value.
Start analyzing.
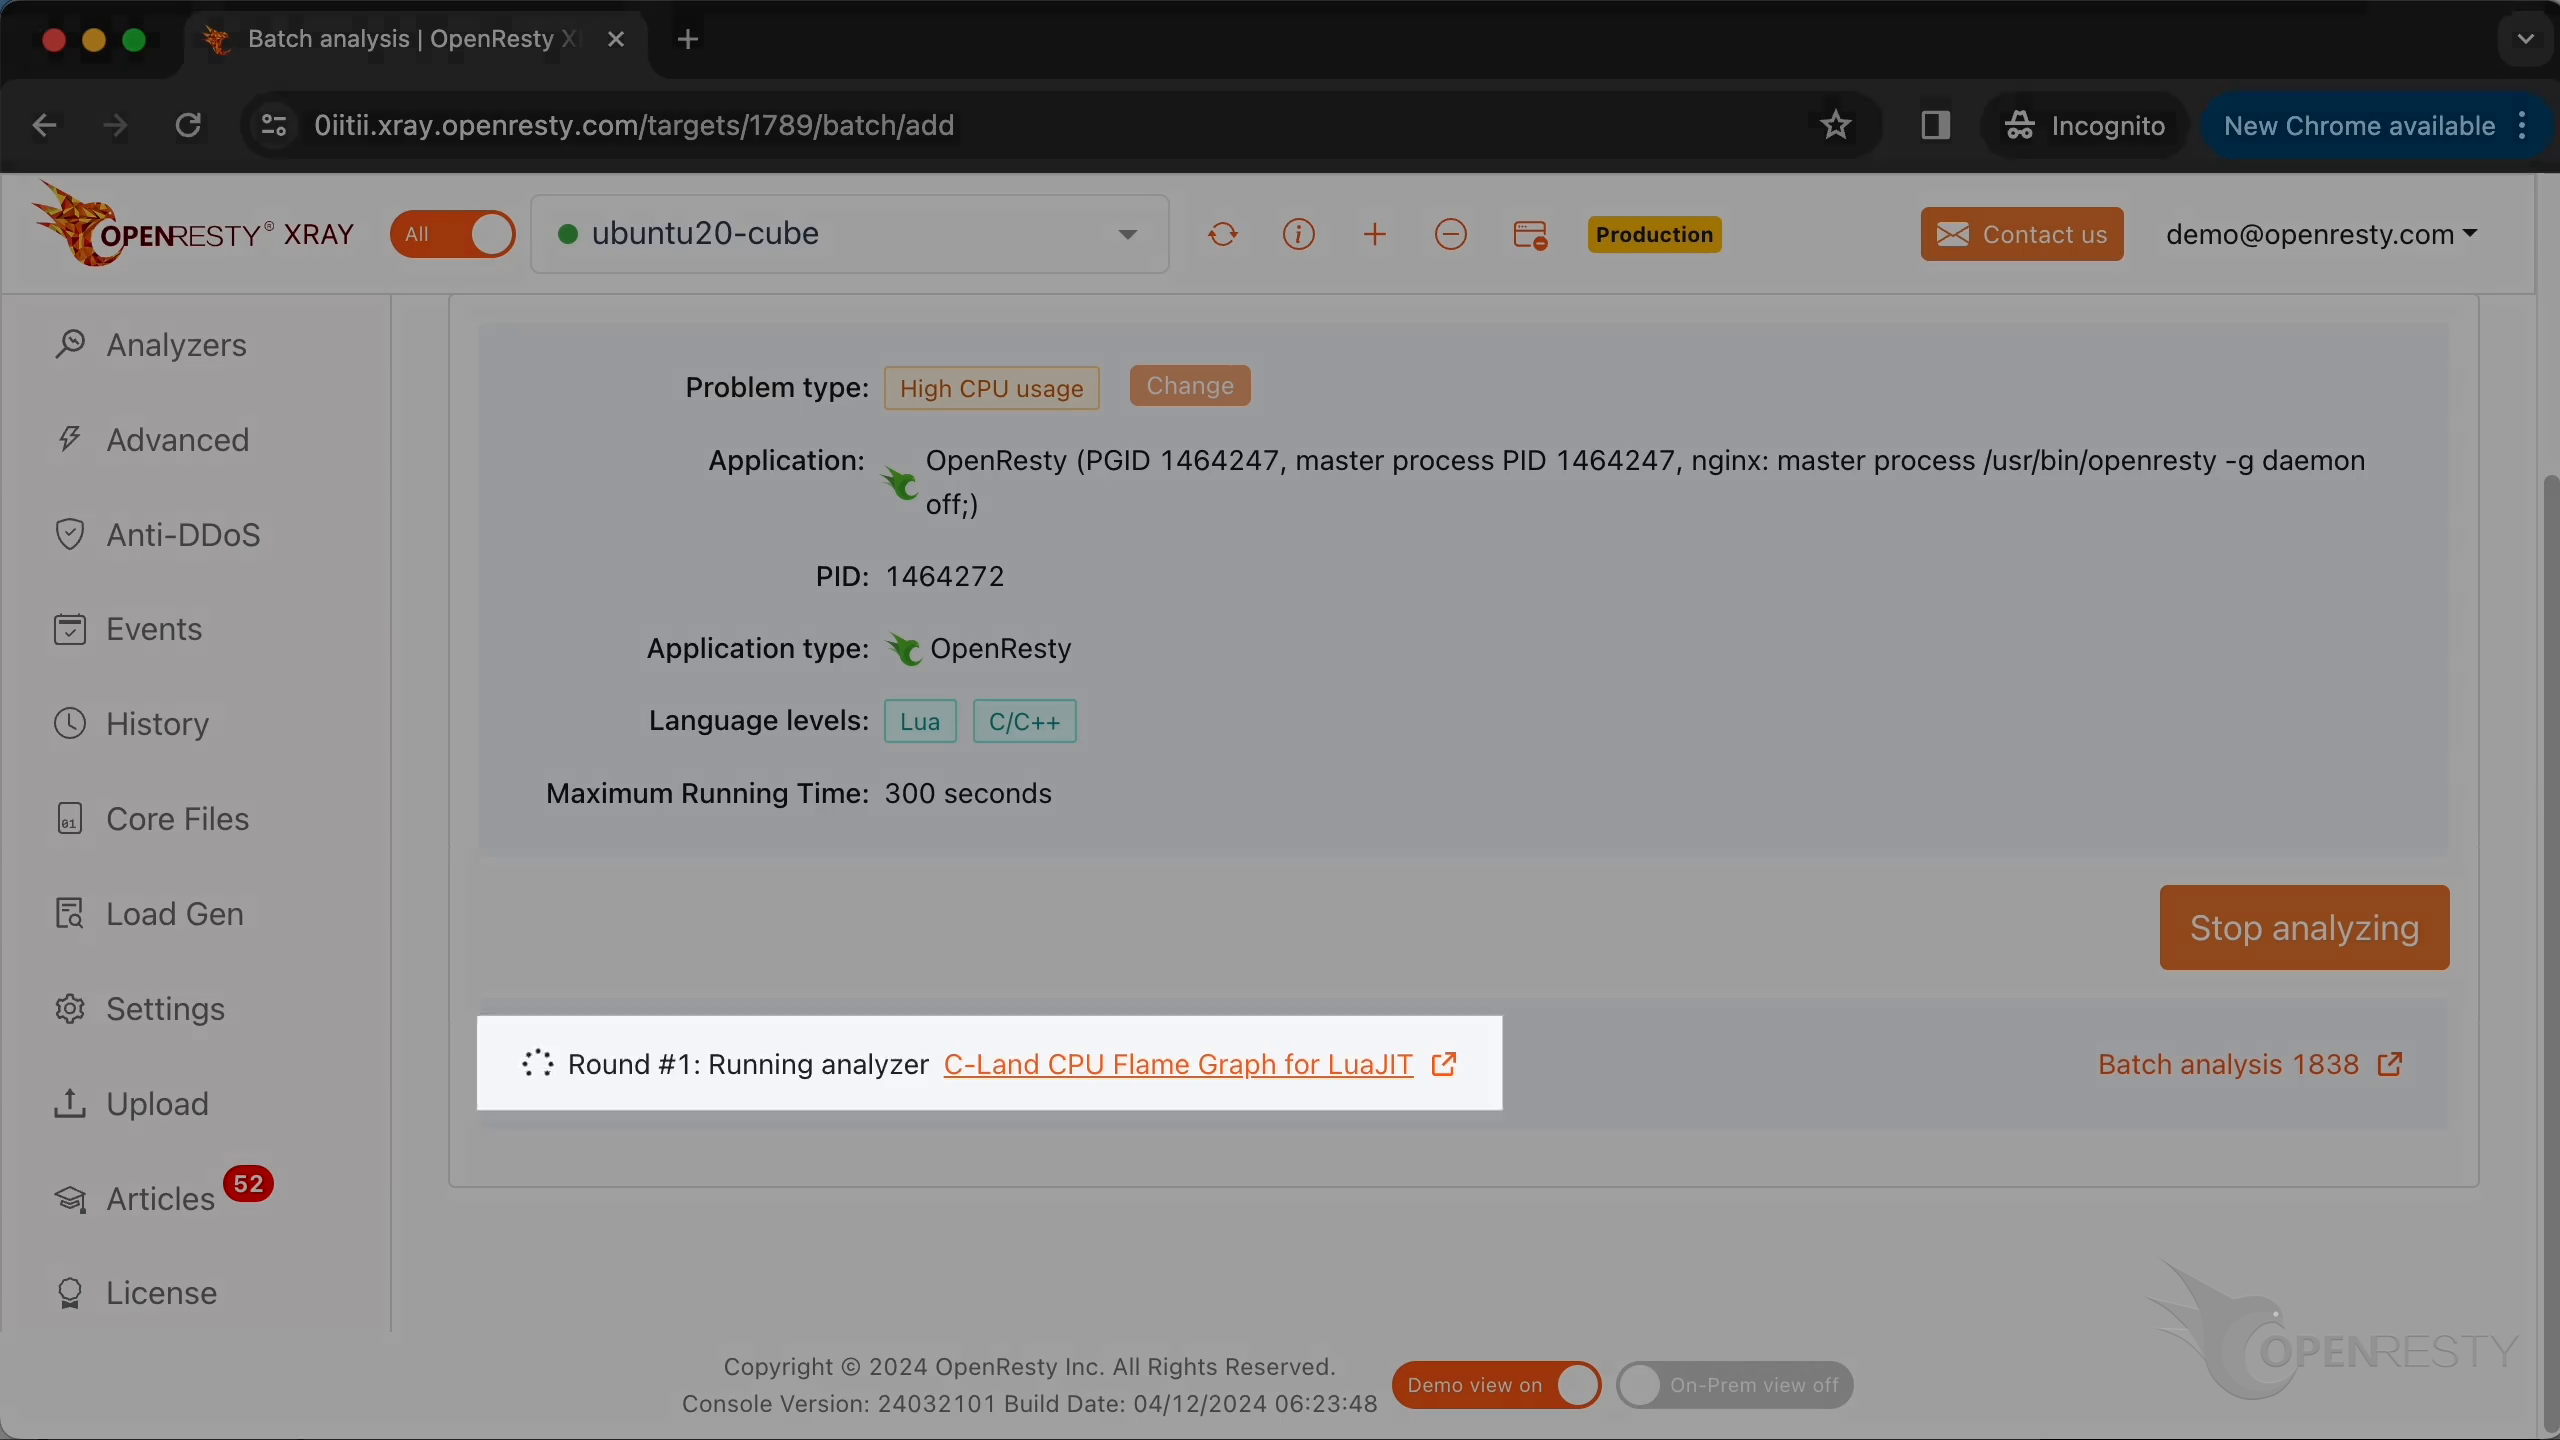
The system will keep performing different rounds of analysis. Now, it’s executing the first round.
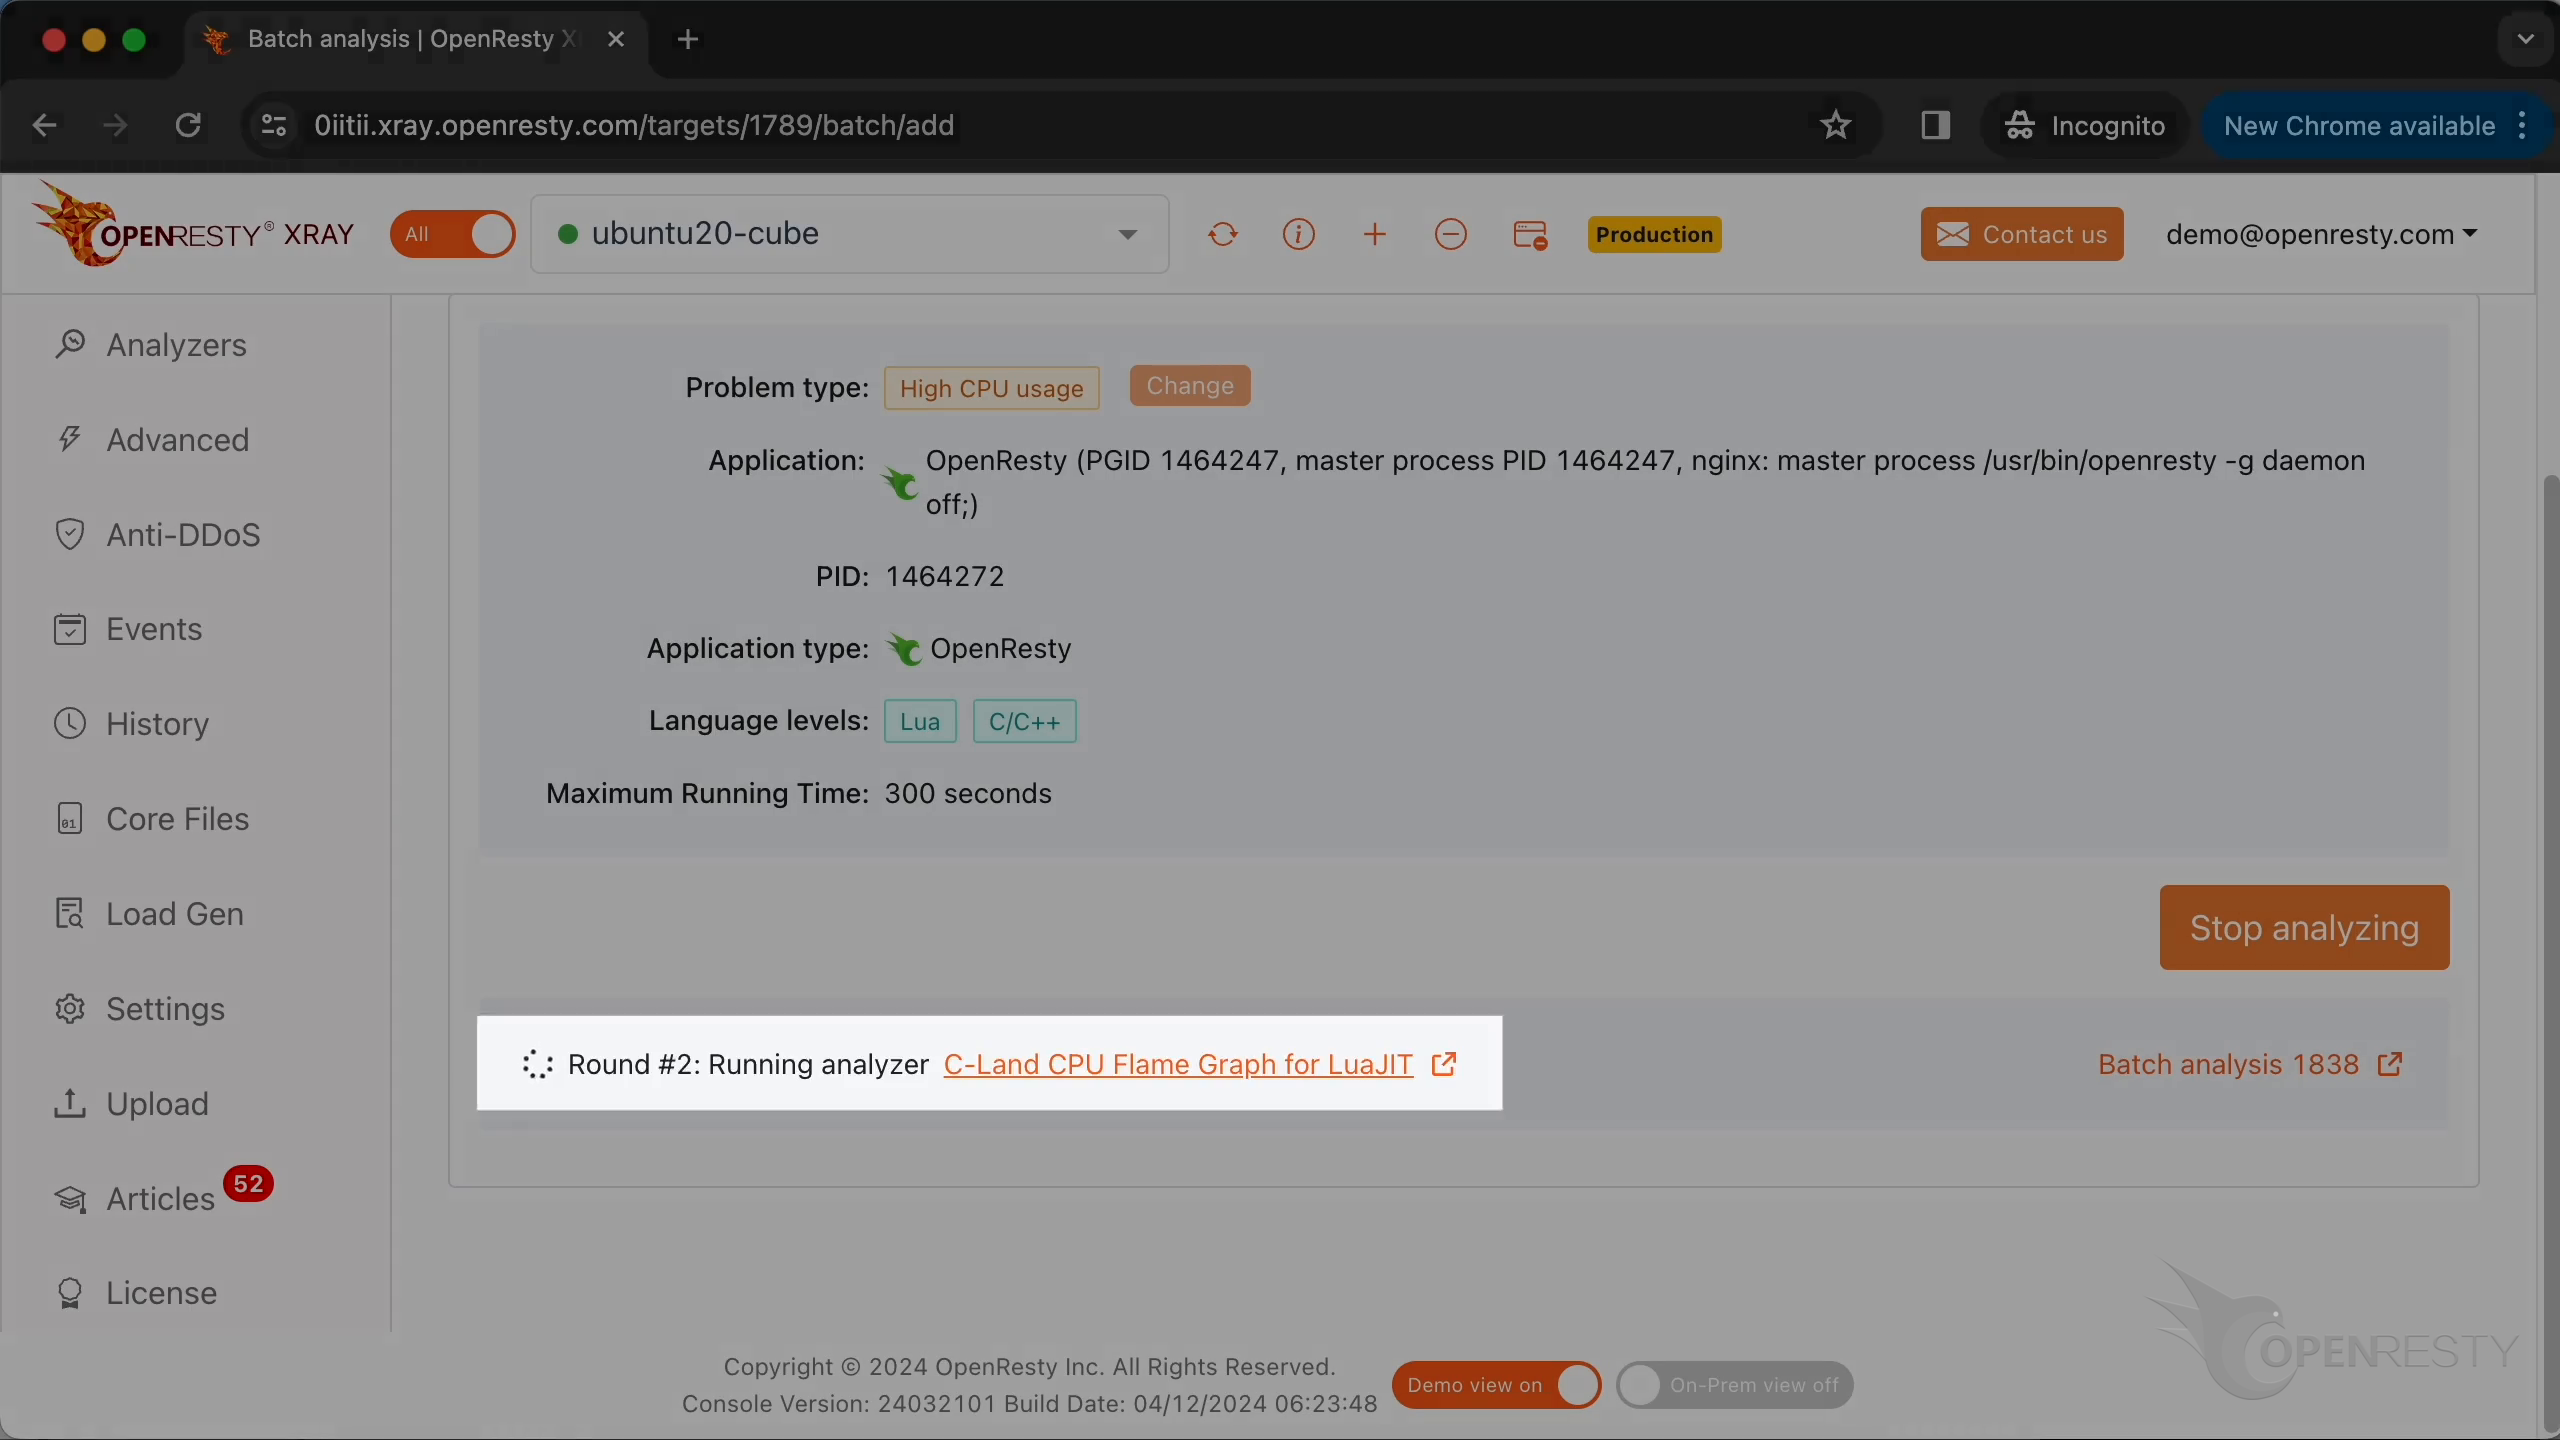
The first round is done, and it’s already on the second one. That’s enough for this case.
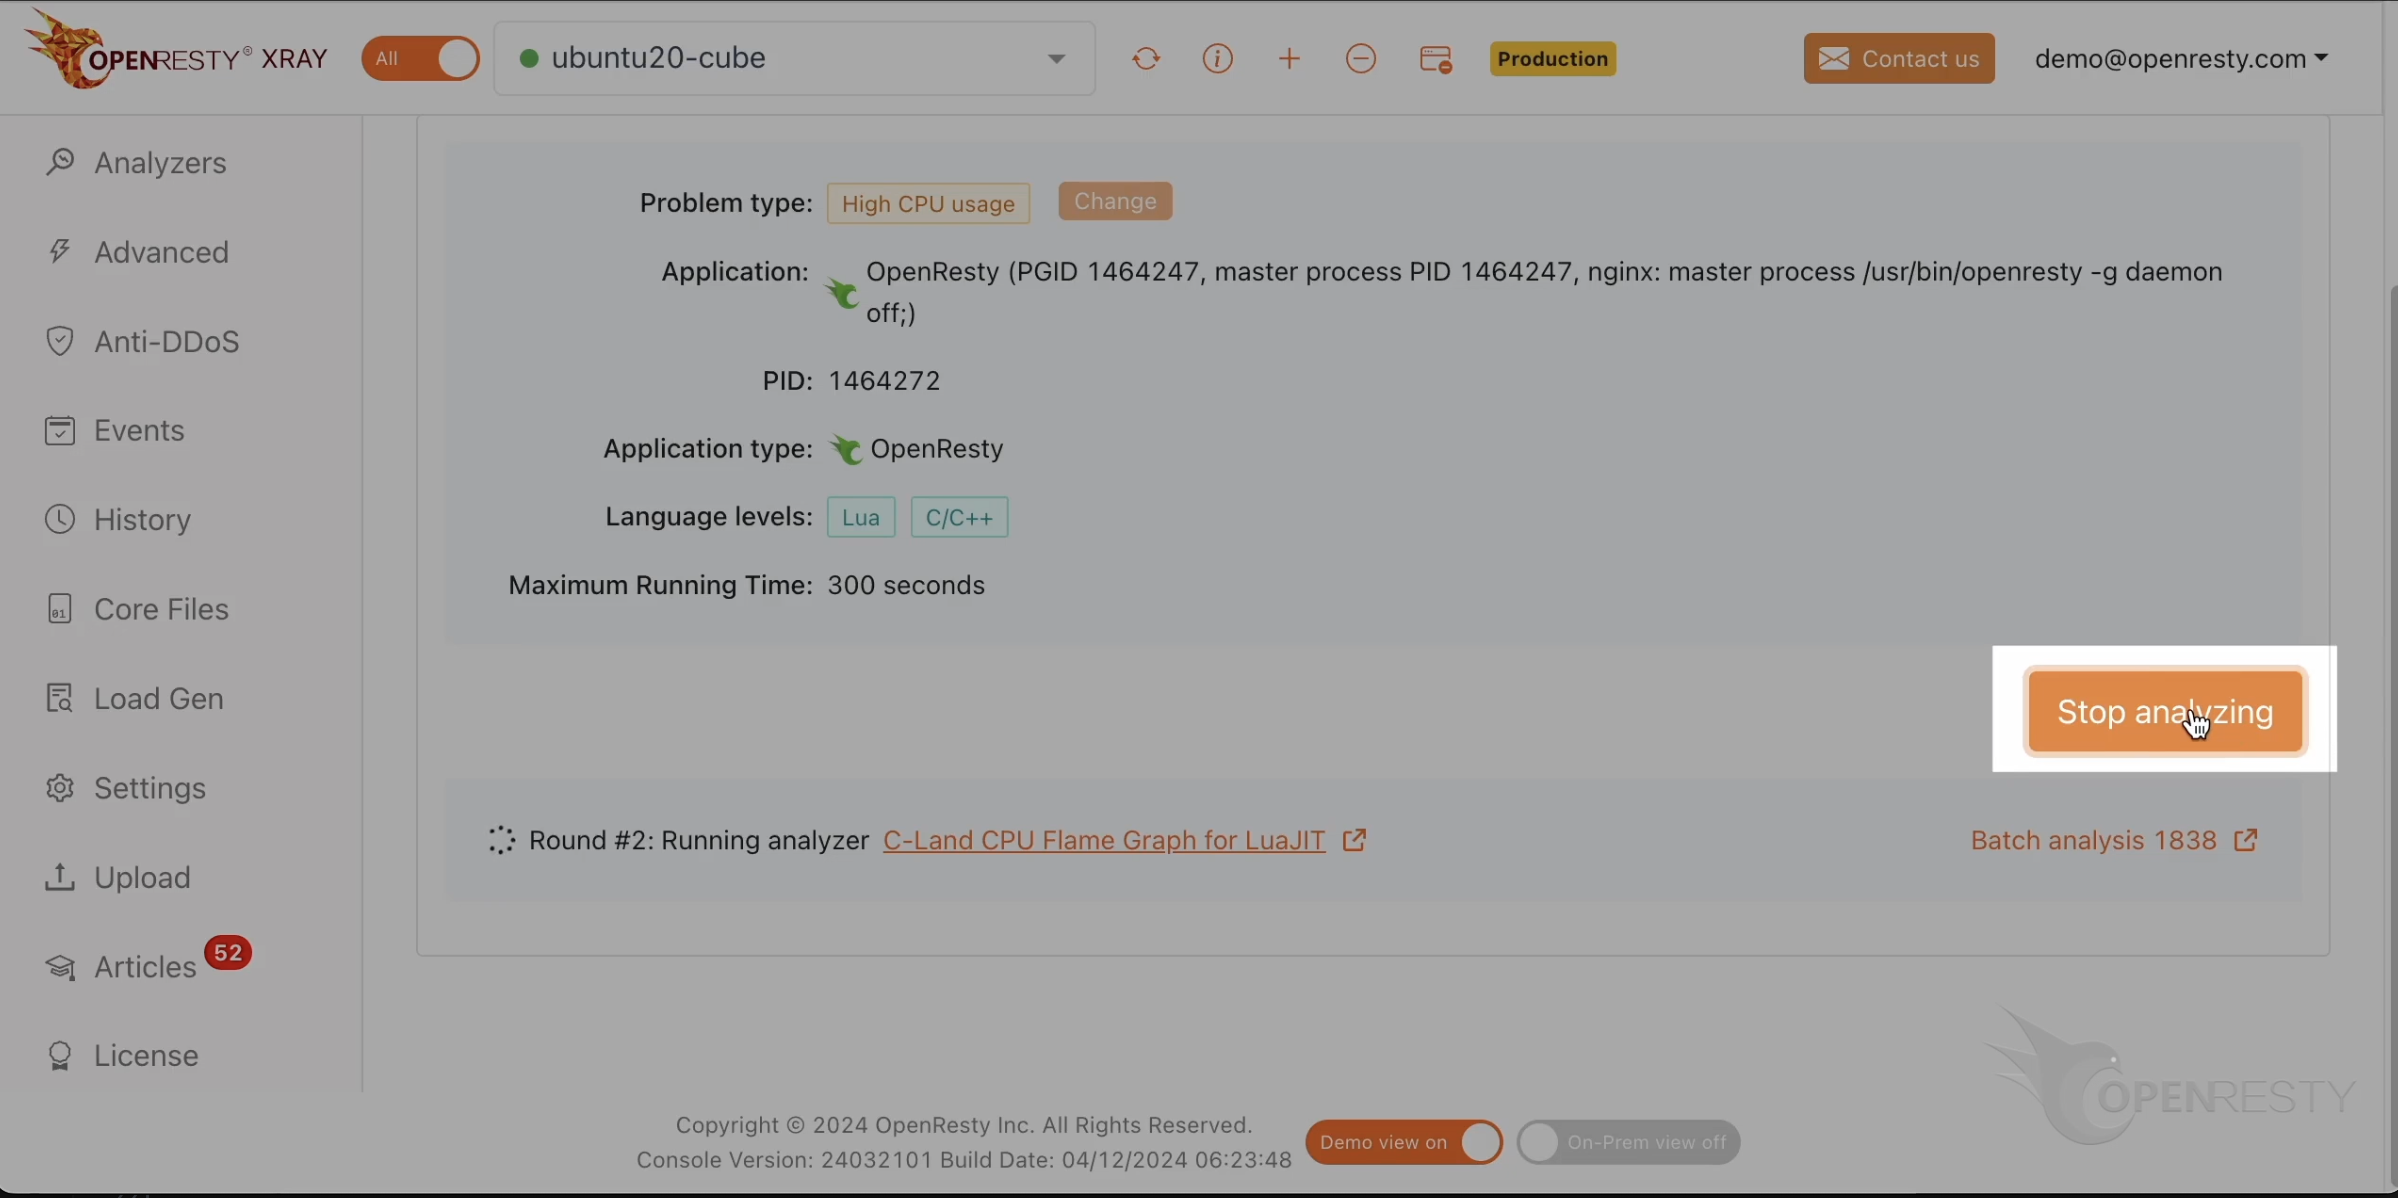
Let’s stop analyzing.
It automatically generated an analysis report.
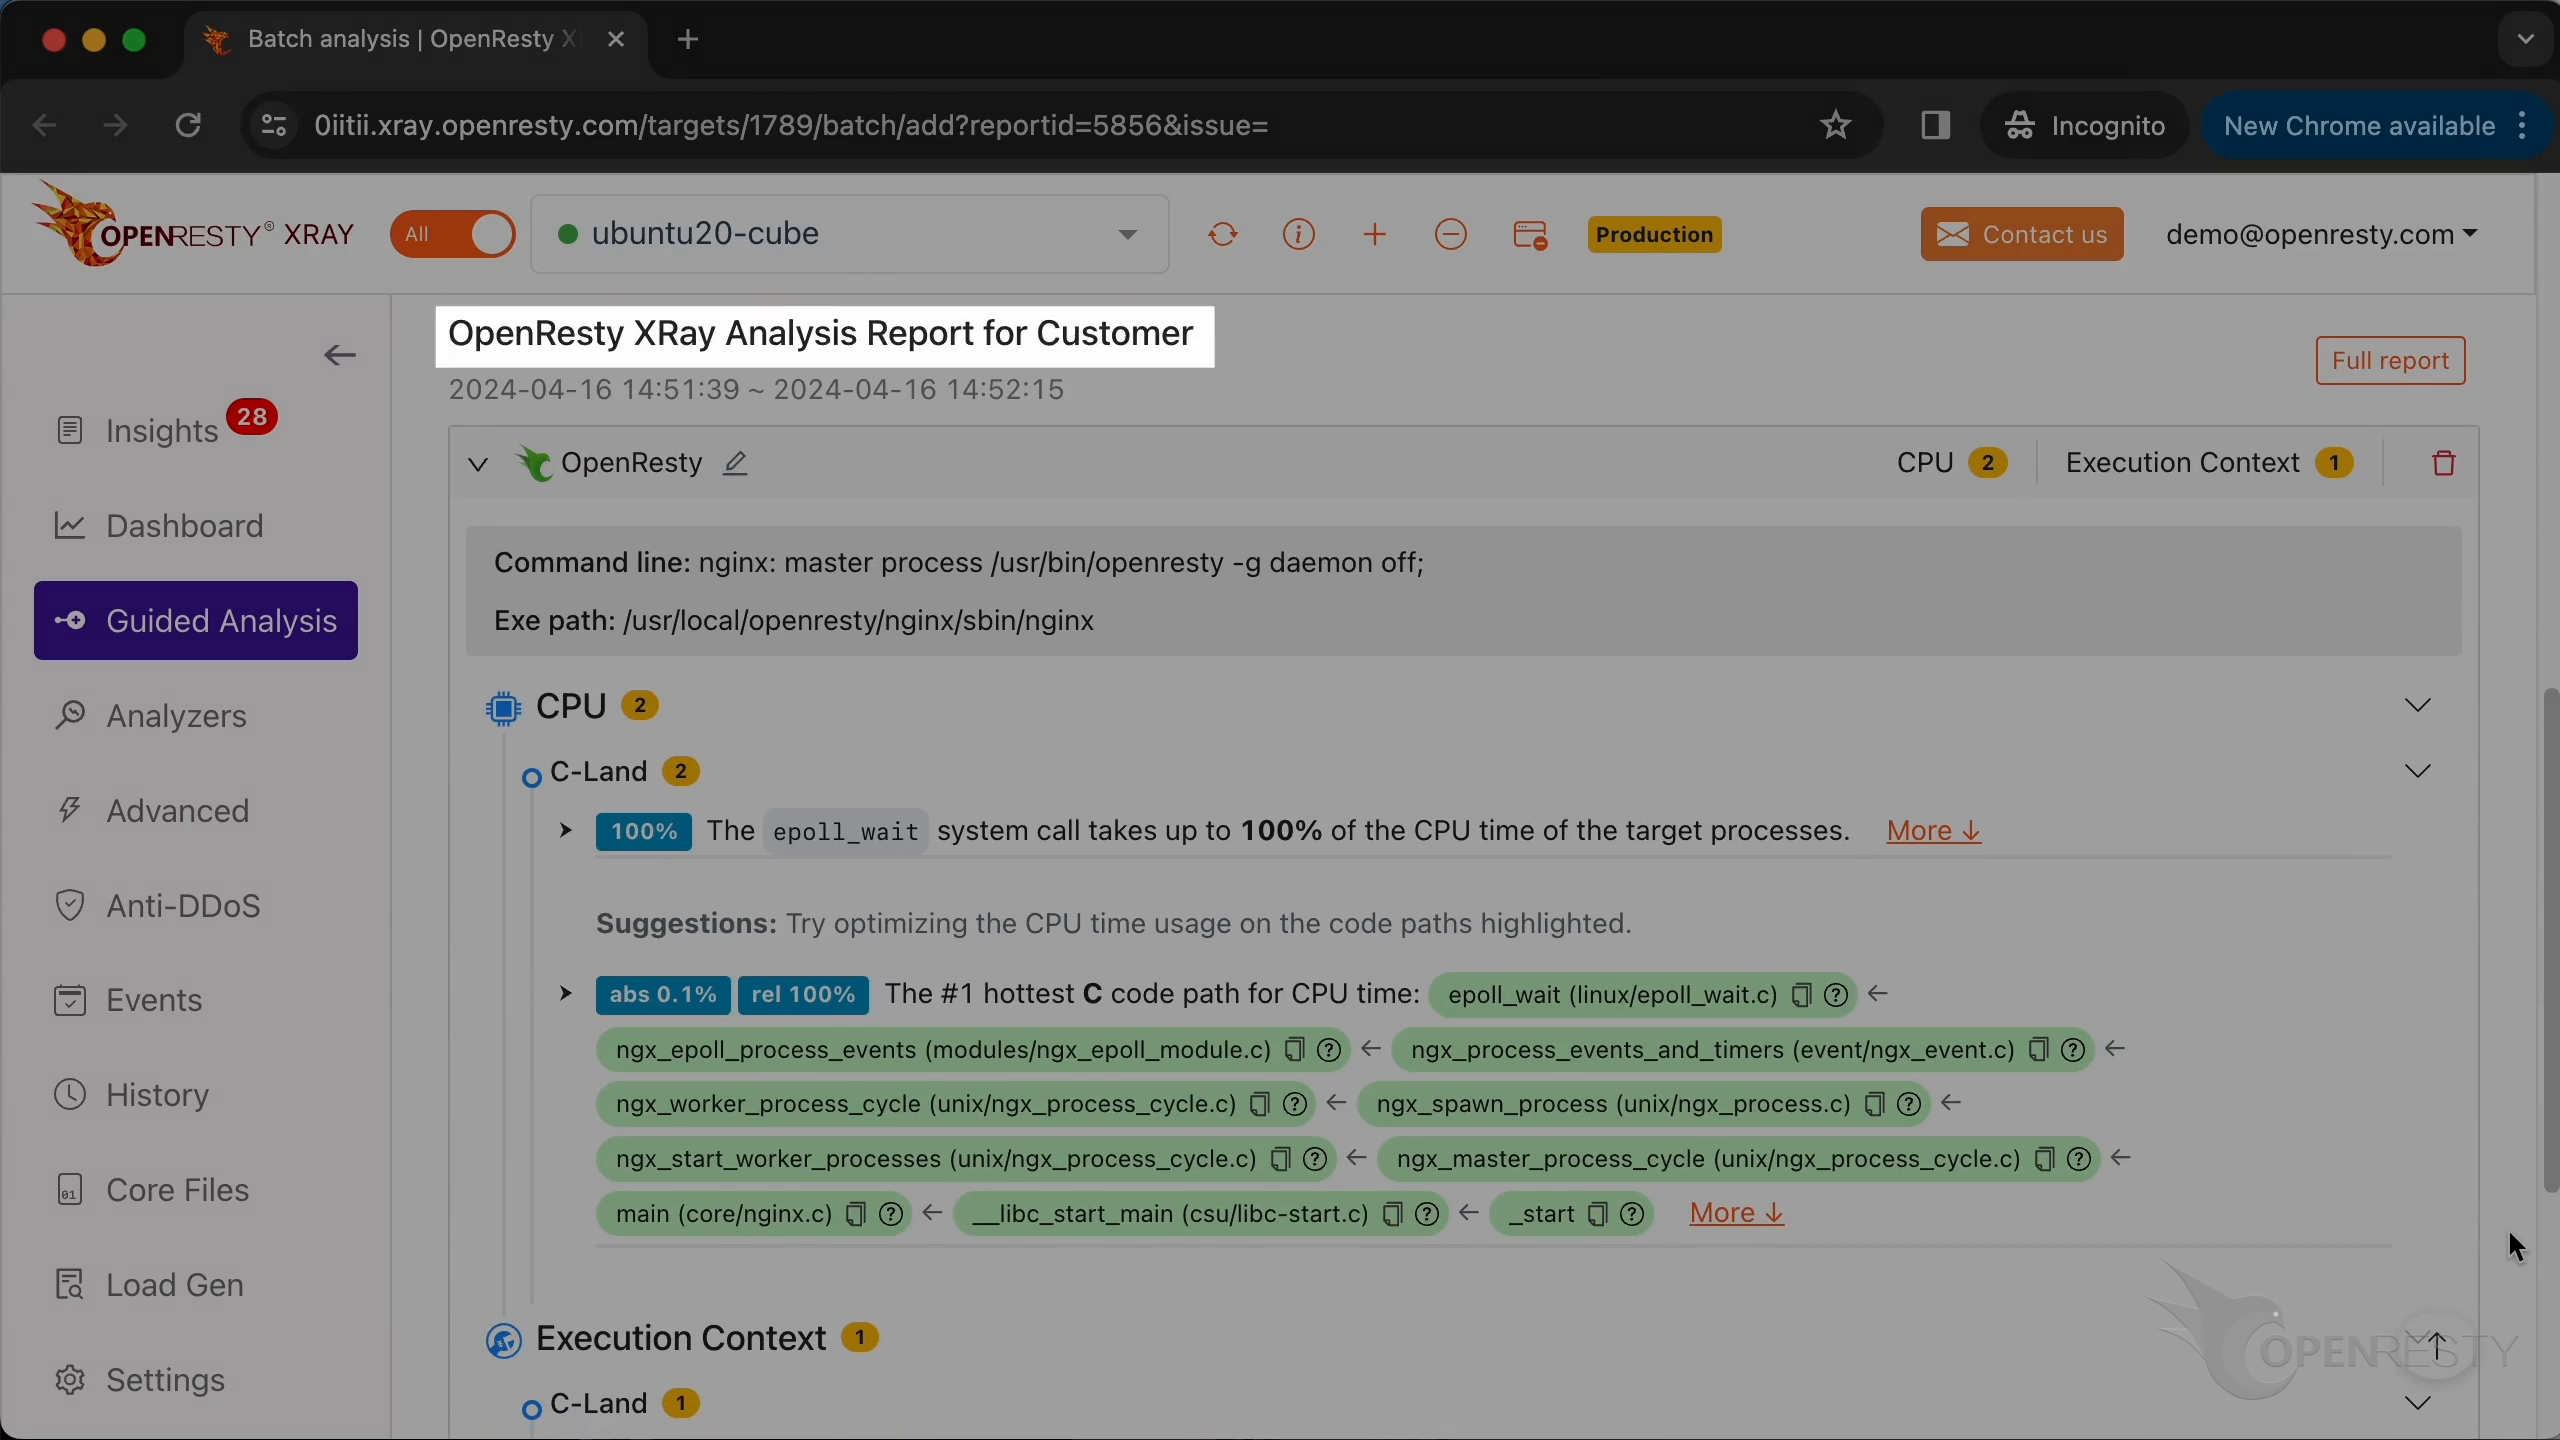
Click here to enter the historical report list page.
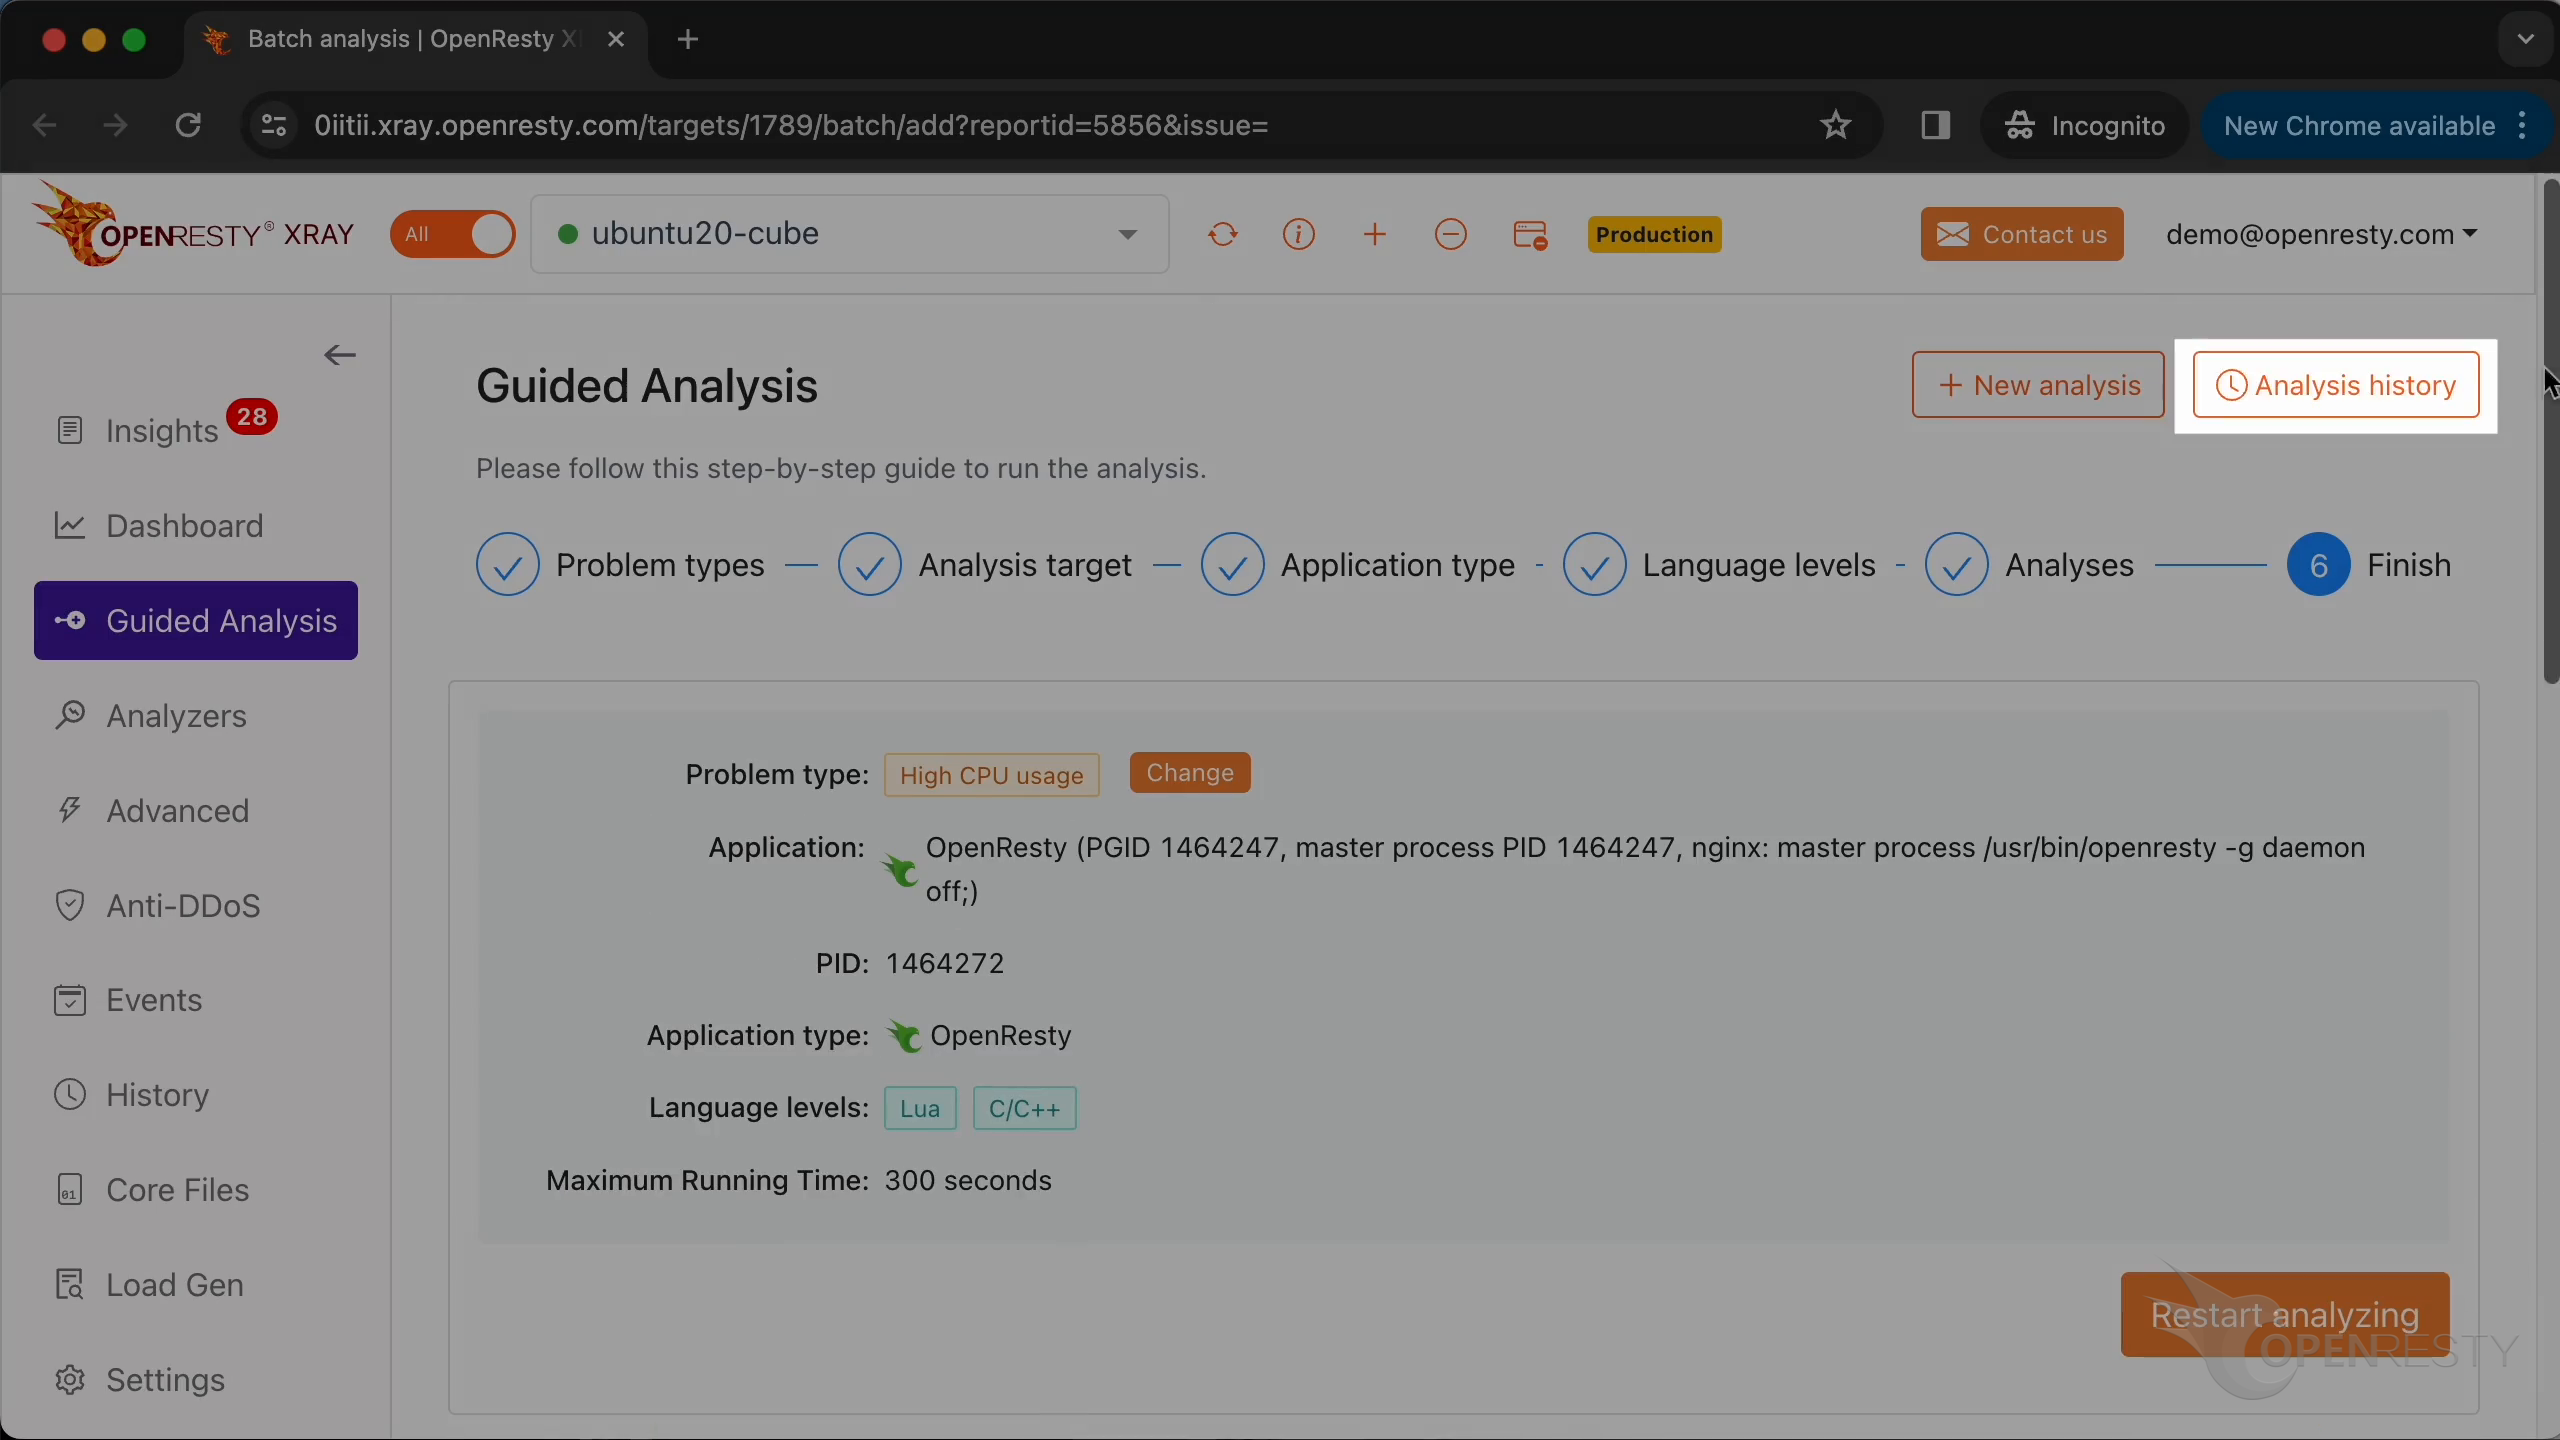
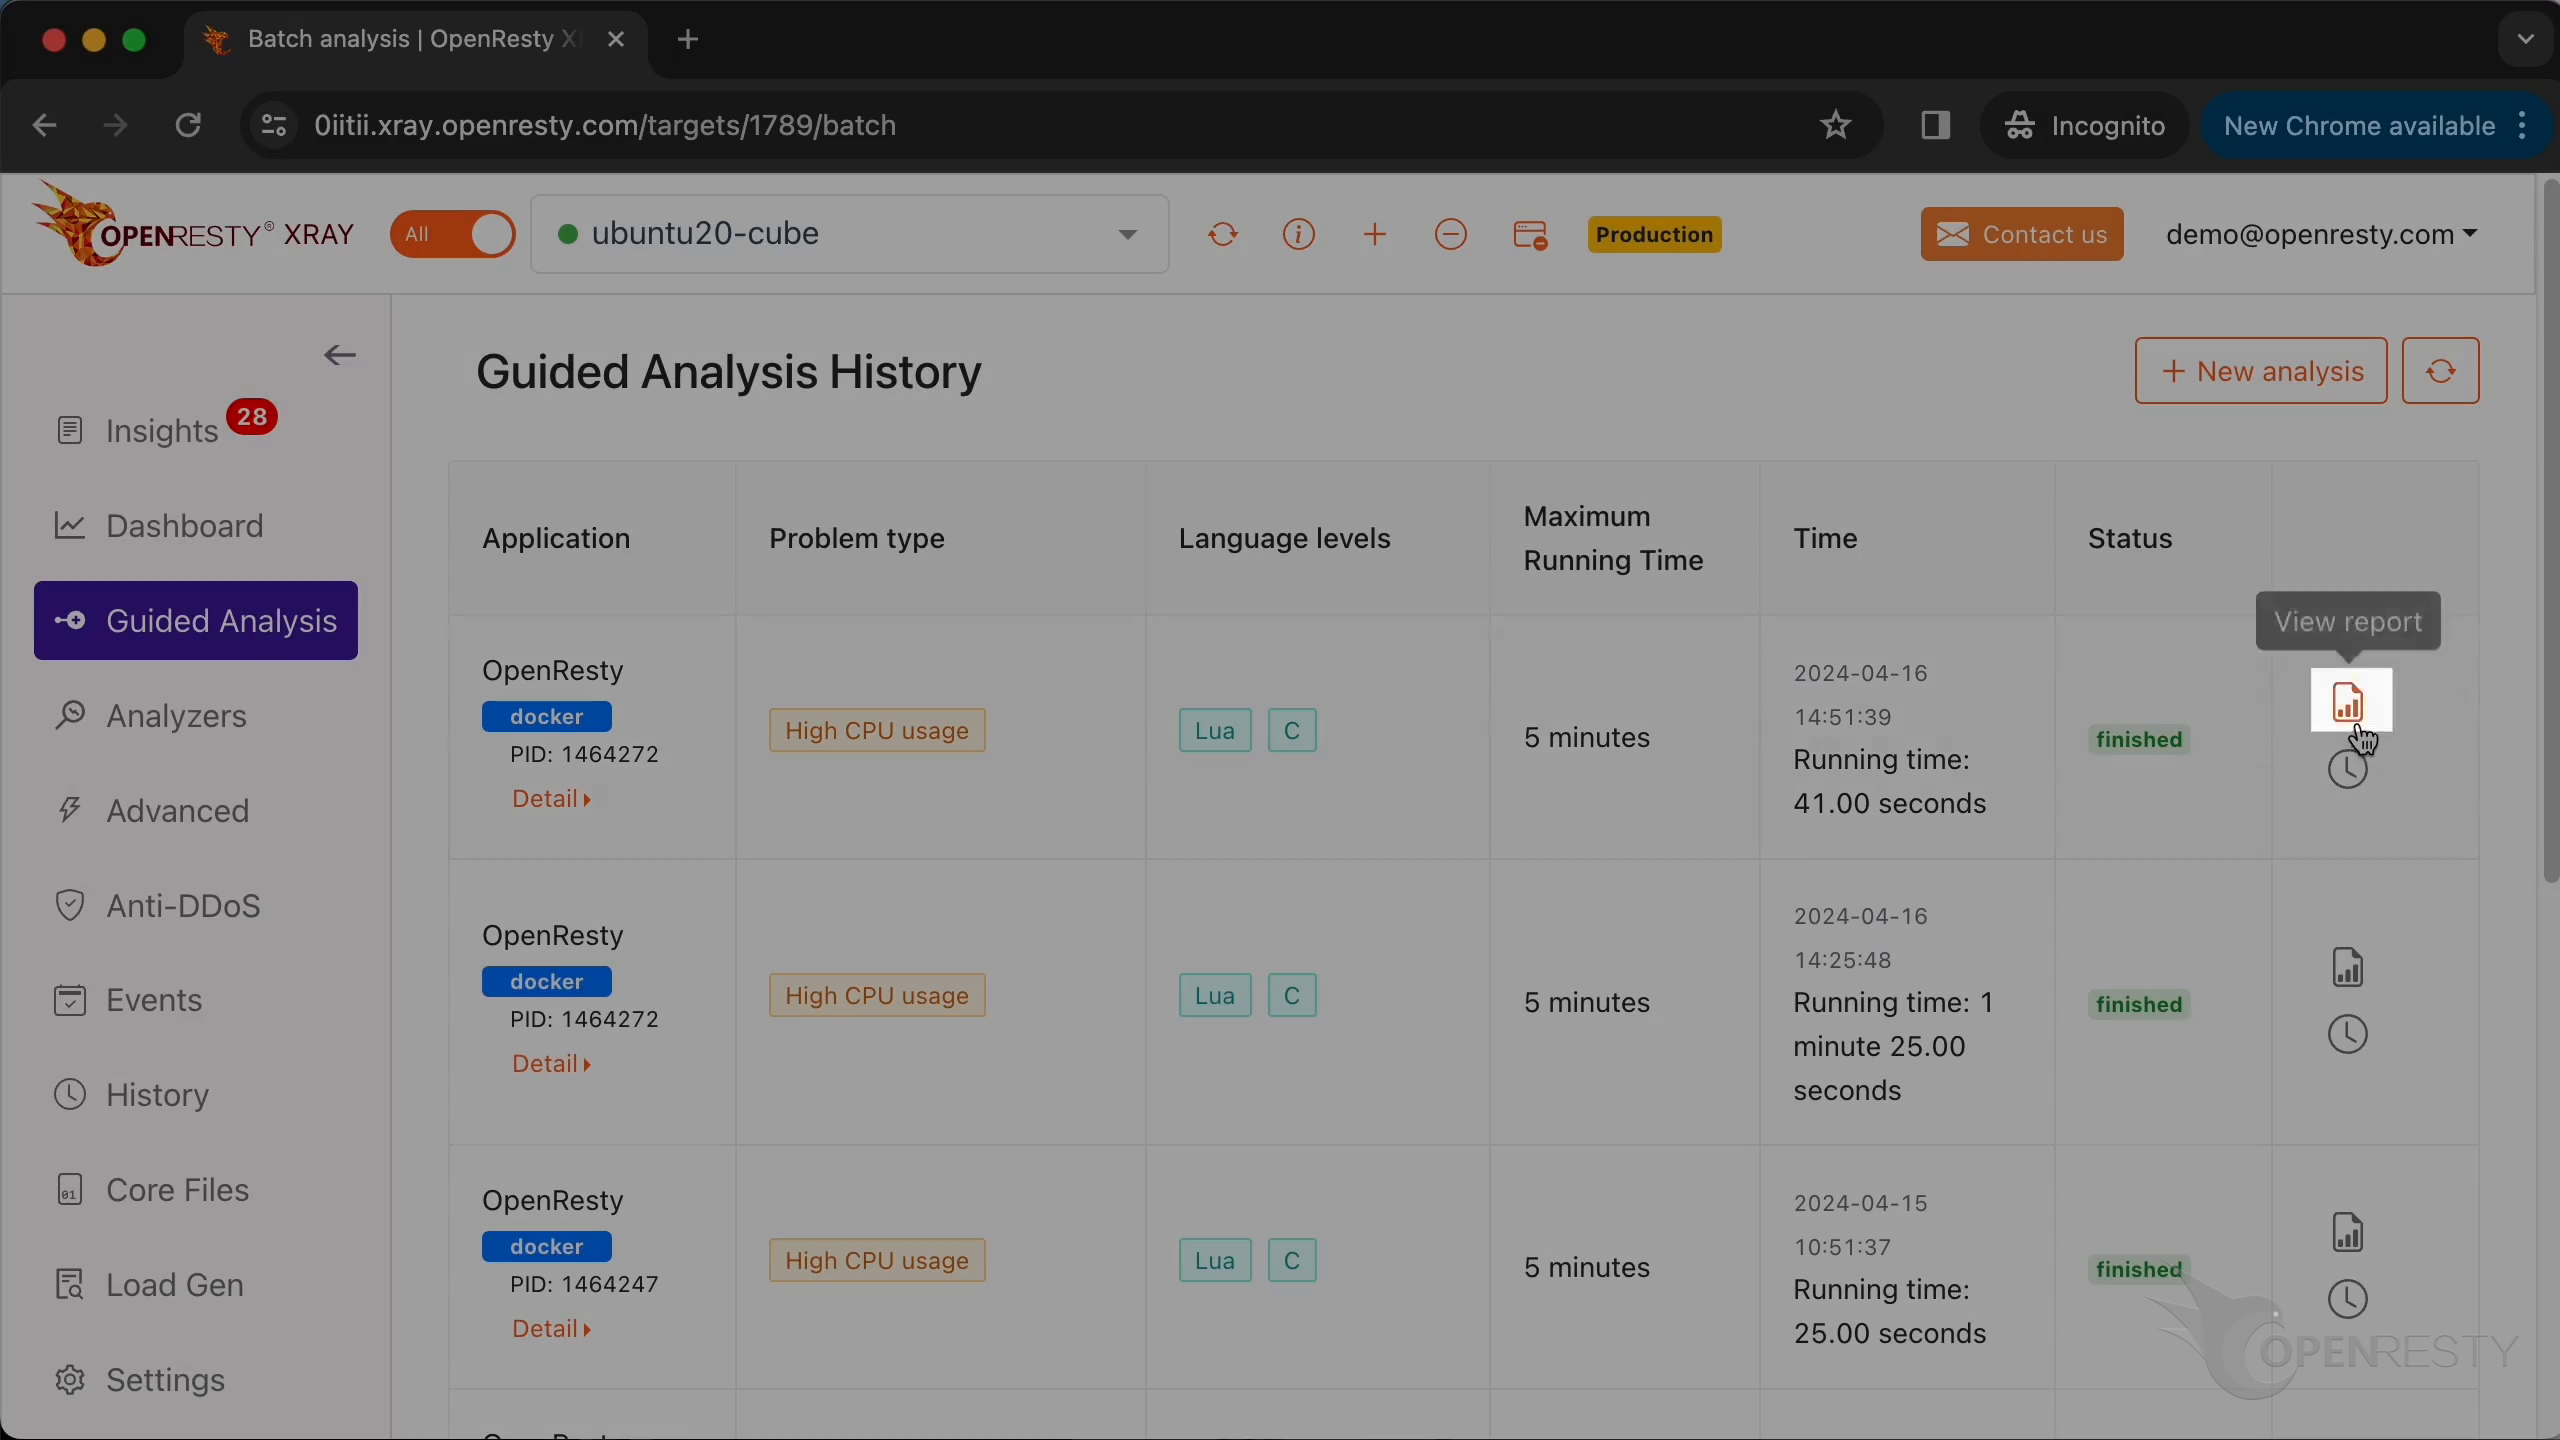
Here are the historical guided analysis reports.
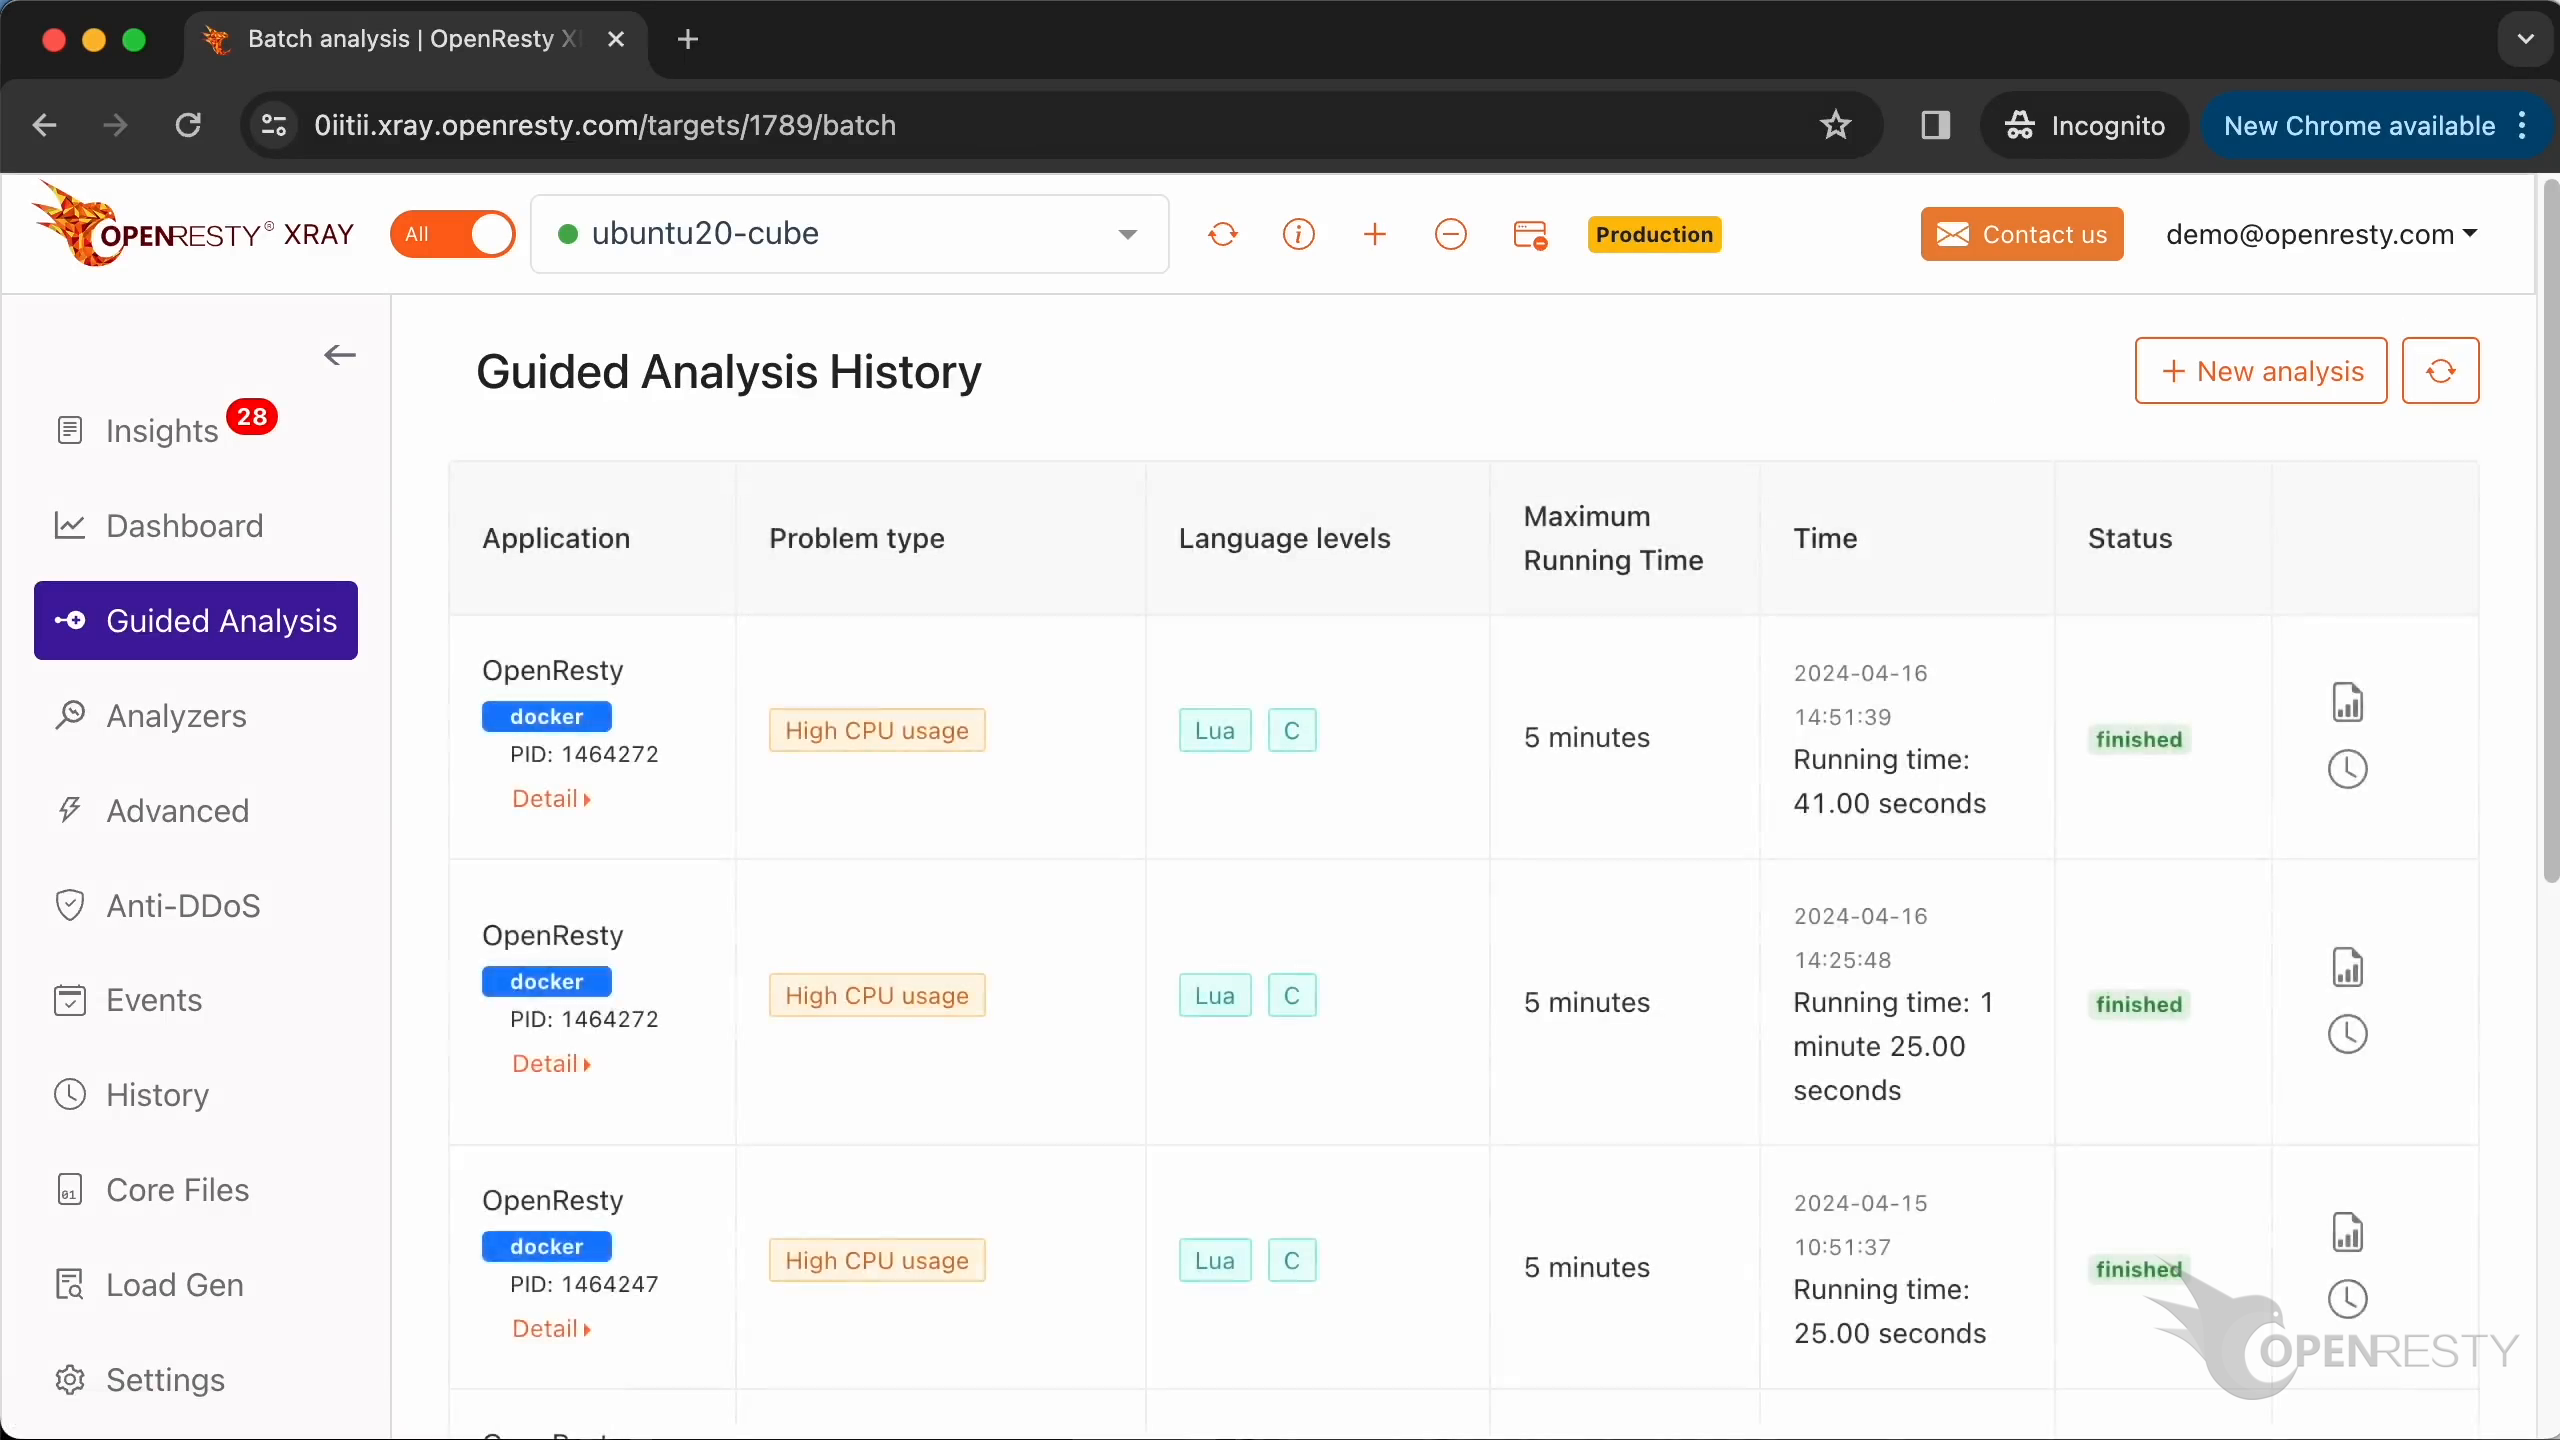
This is the report we just generated.
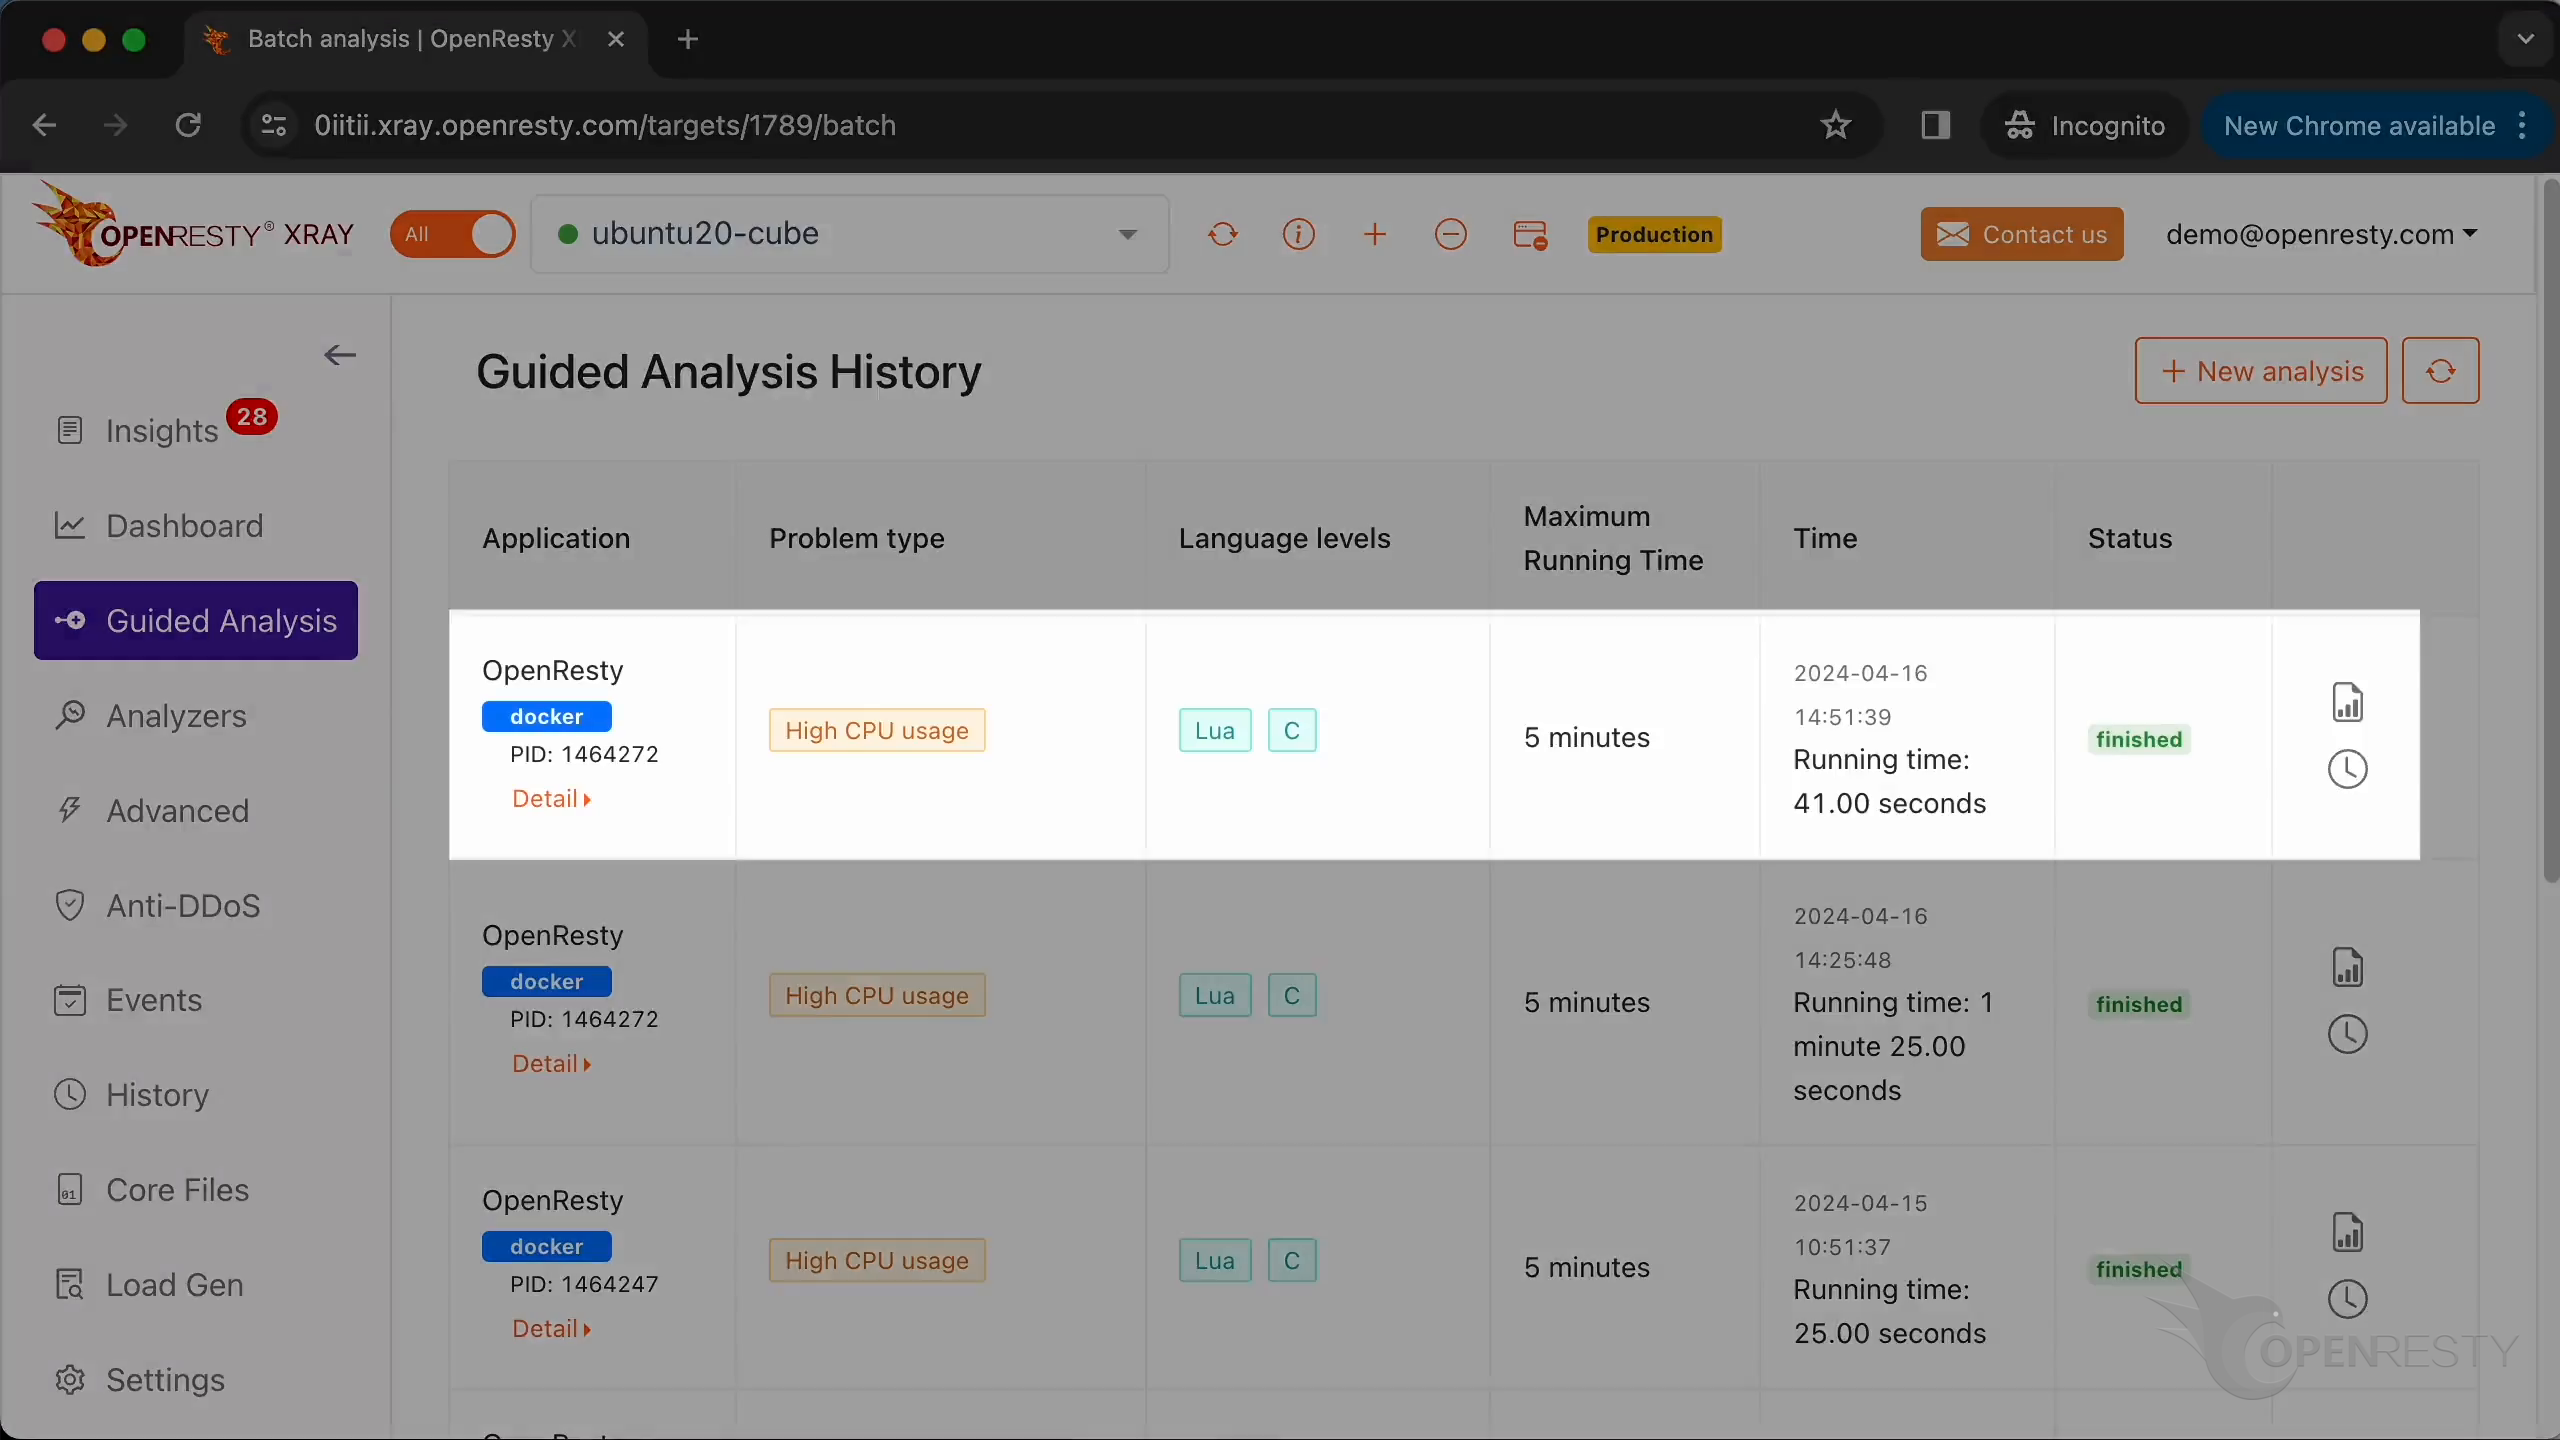
Click to enter the report details page.
How do you configure an OpenResty XRay agent?
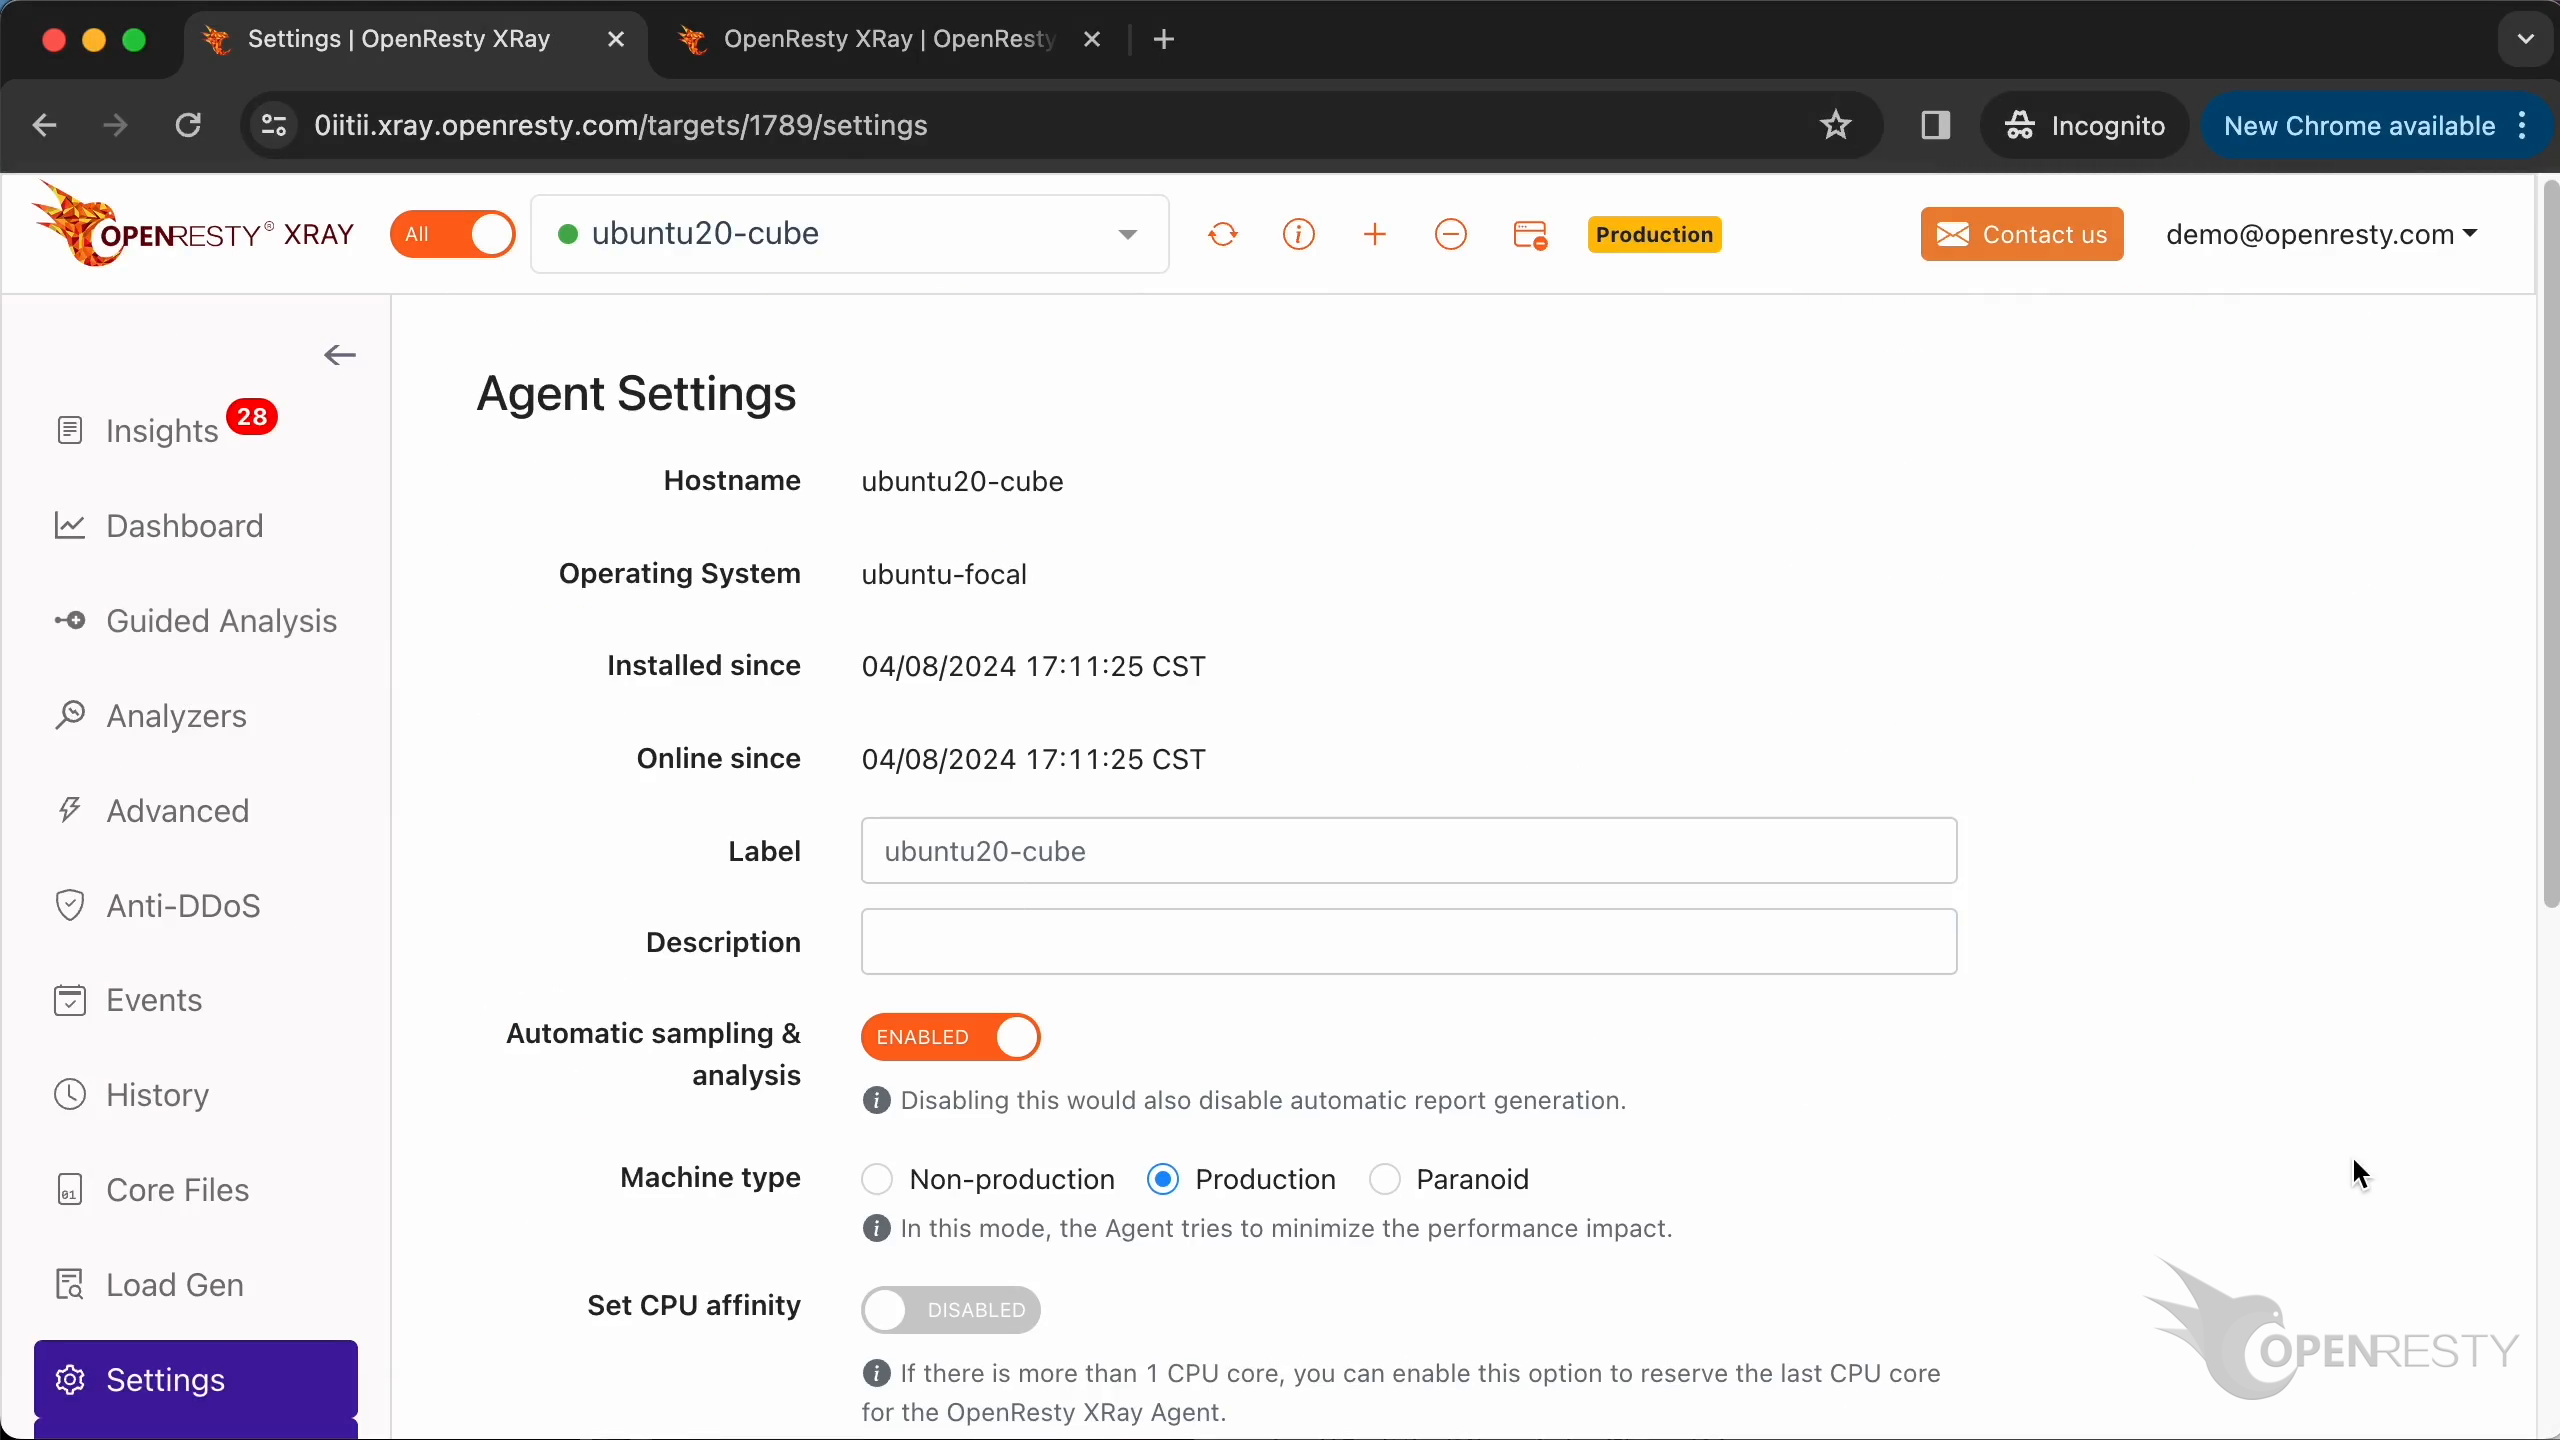
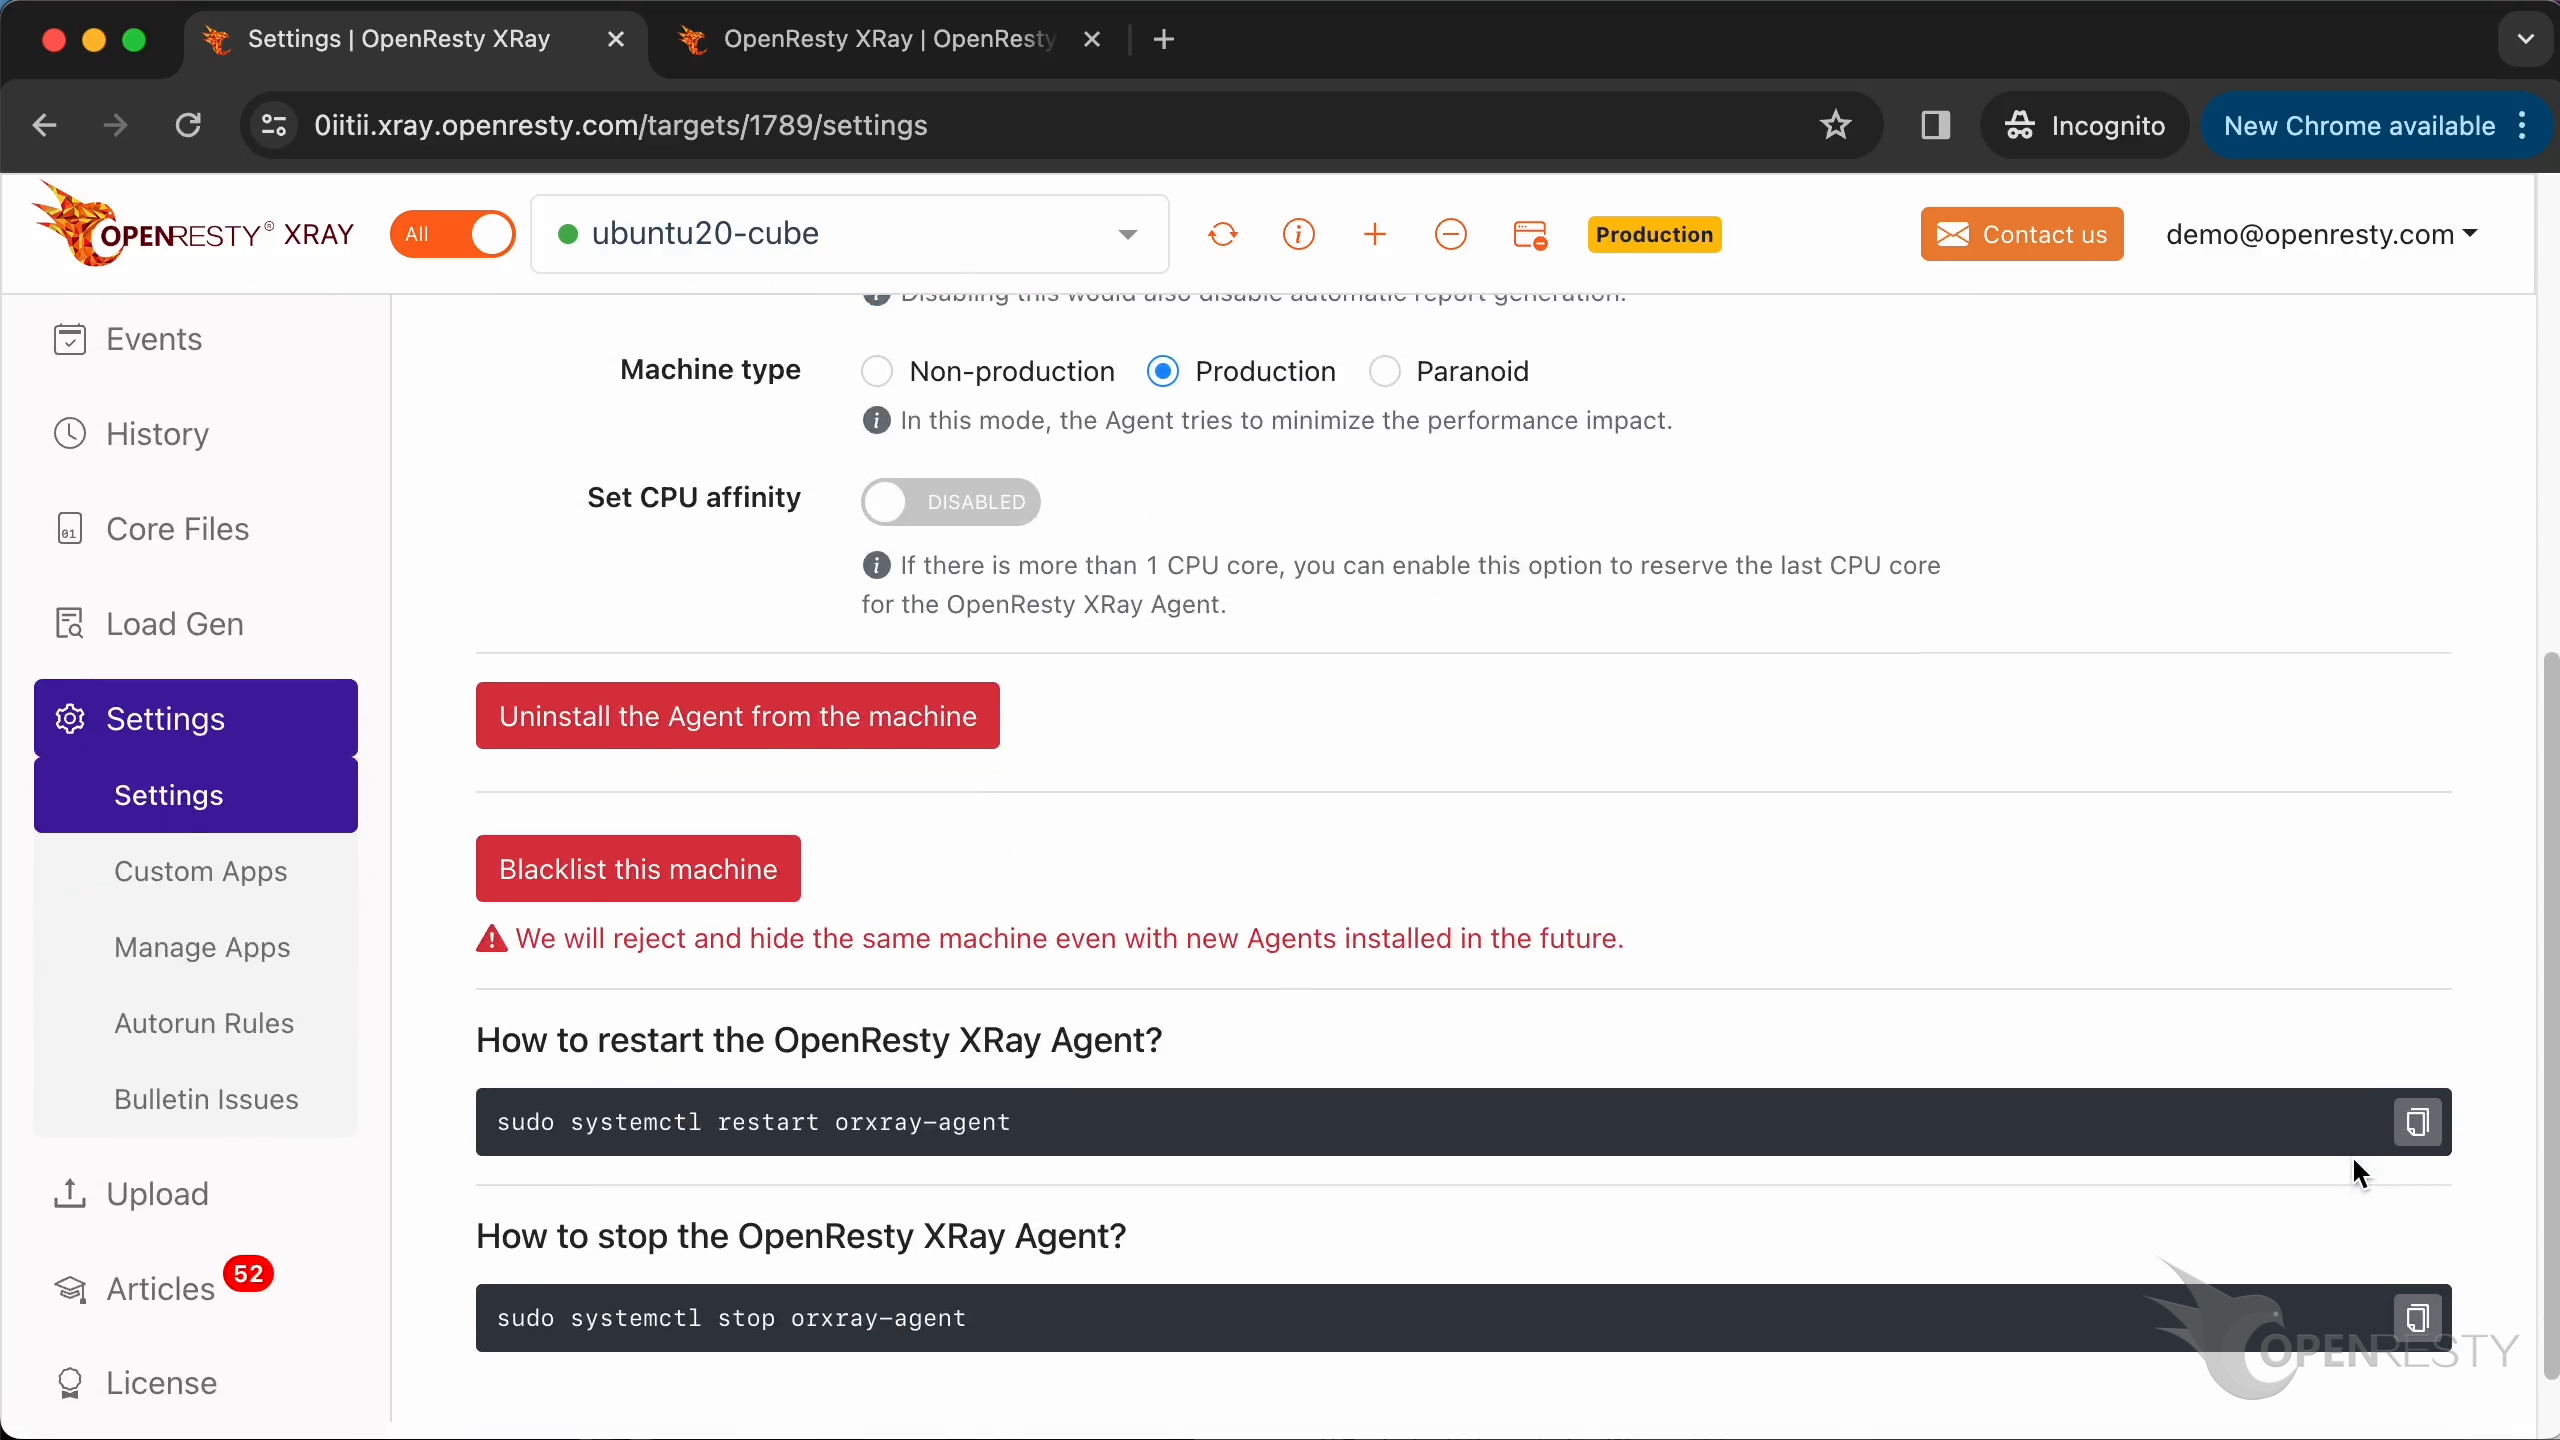
In the Settings page you select an agent and adjust its configuration. Go back to the console page. Click here to enter the “Settings” page.
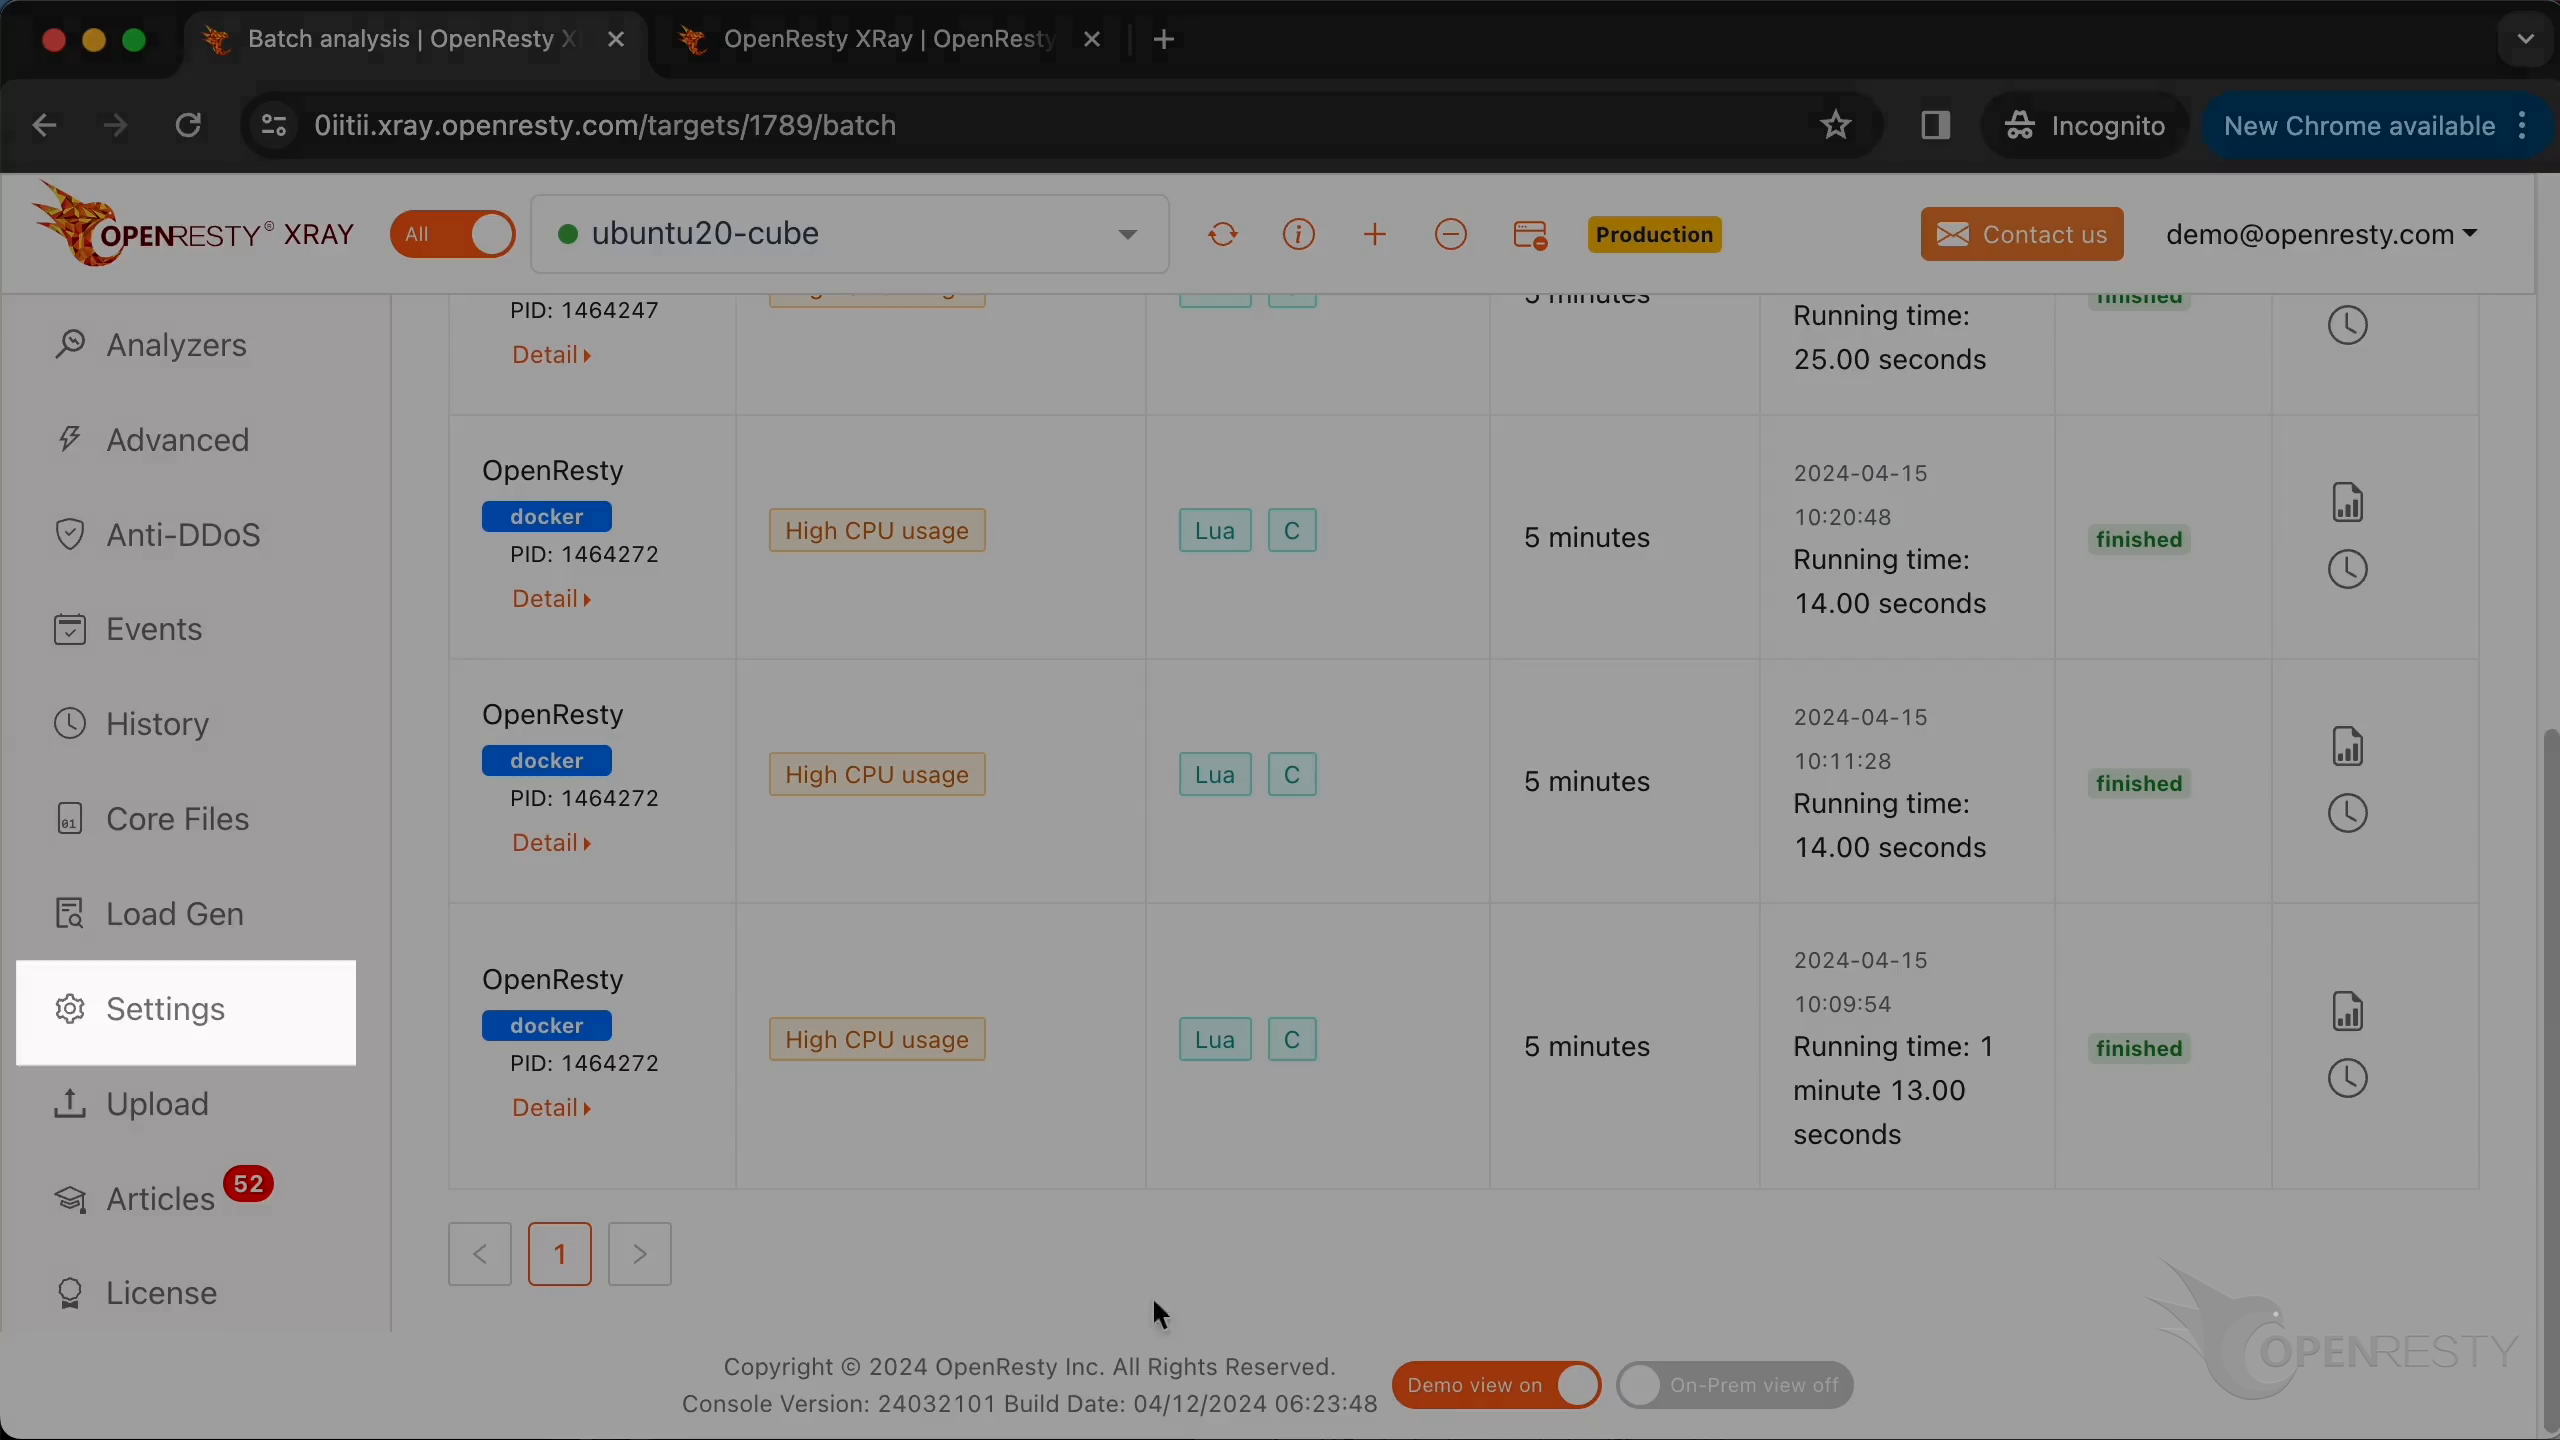
Select the settings feature.
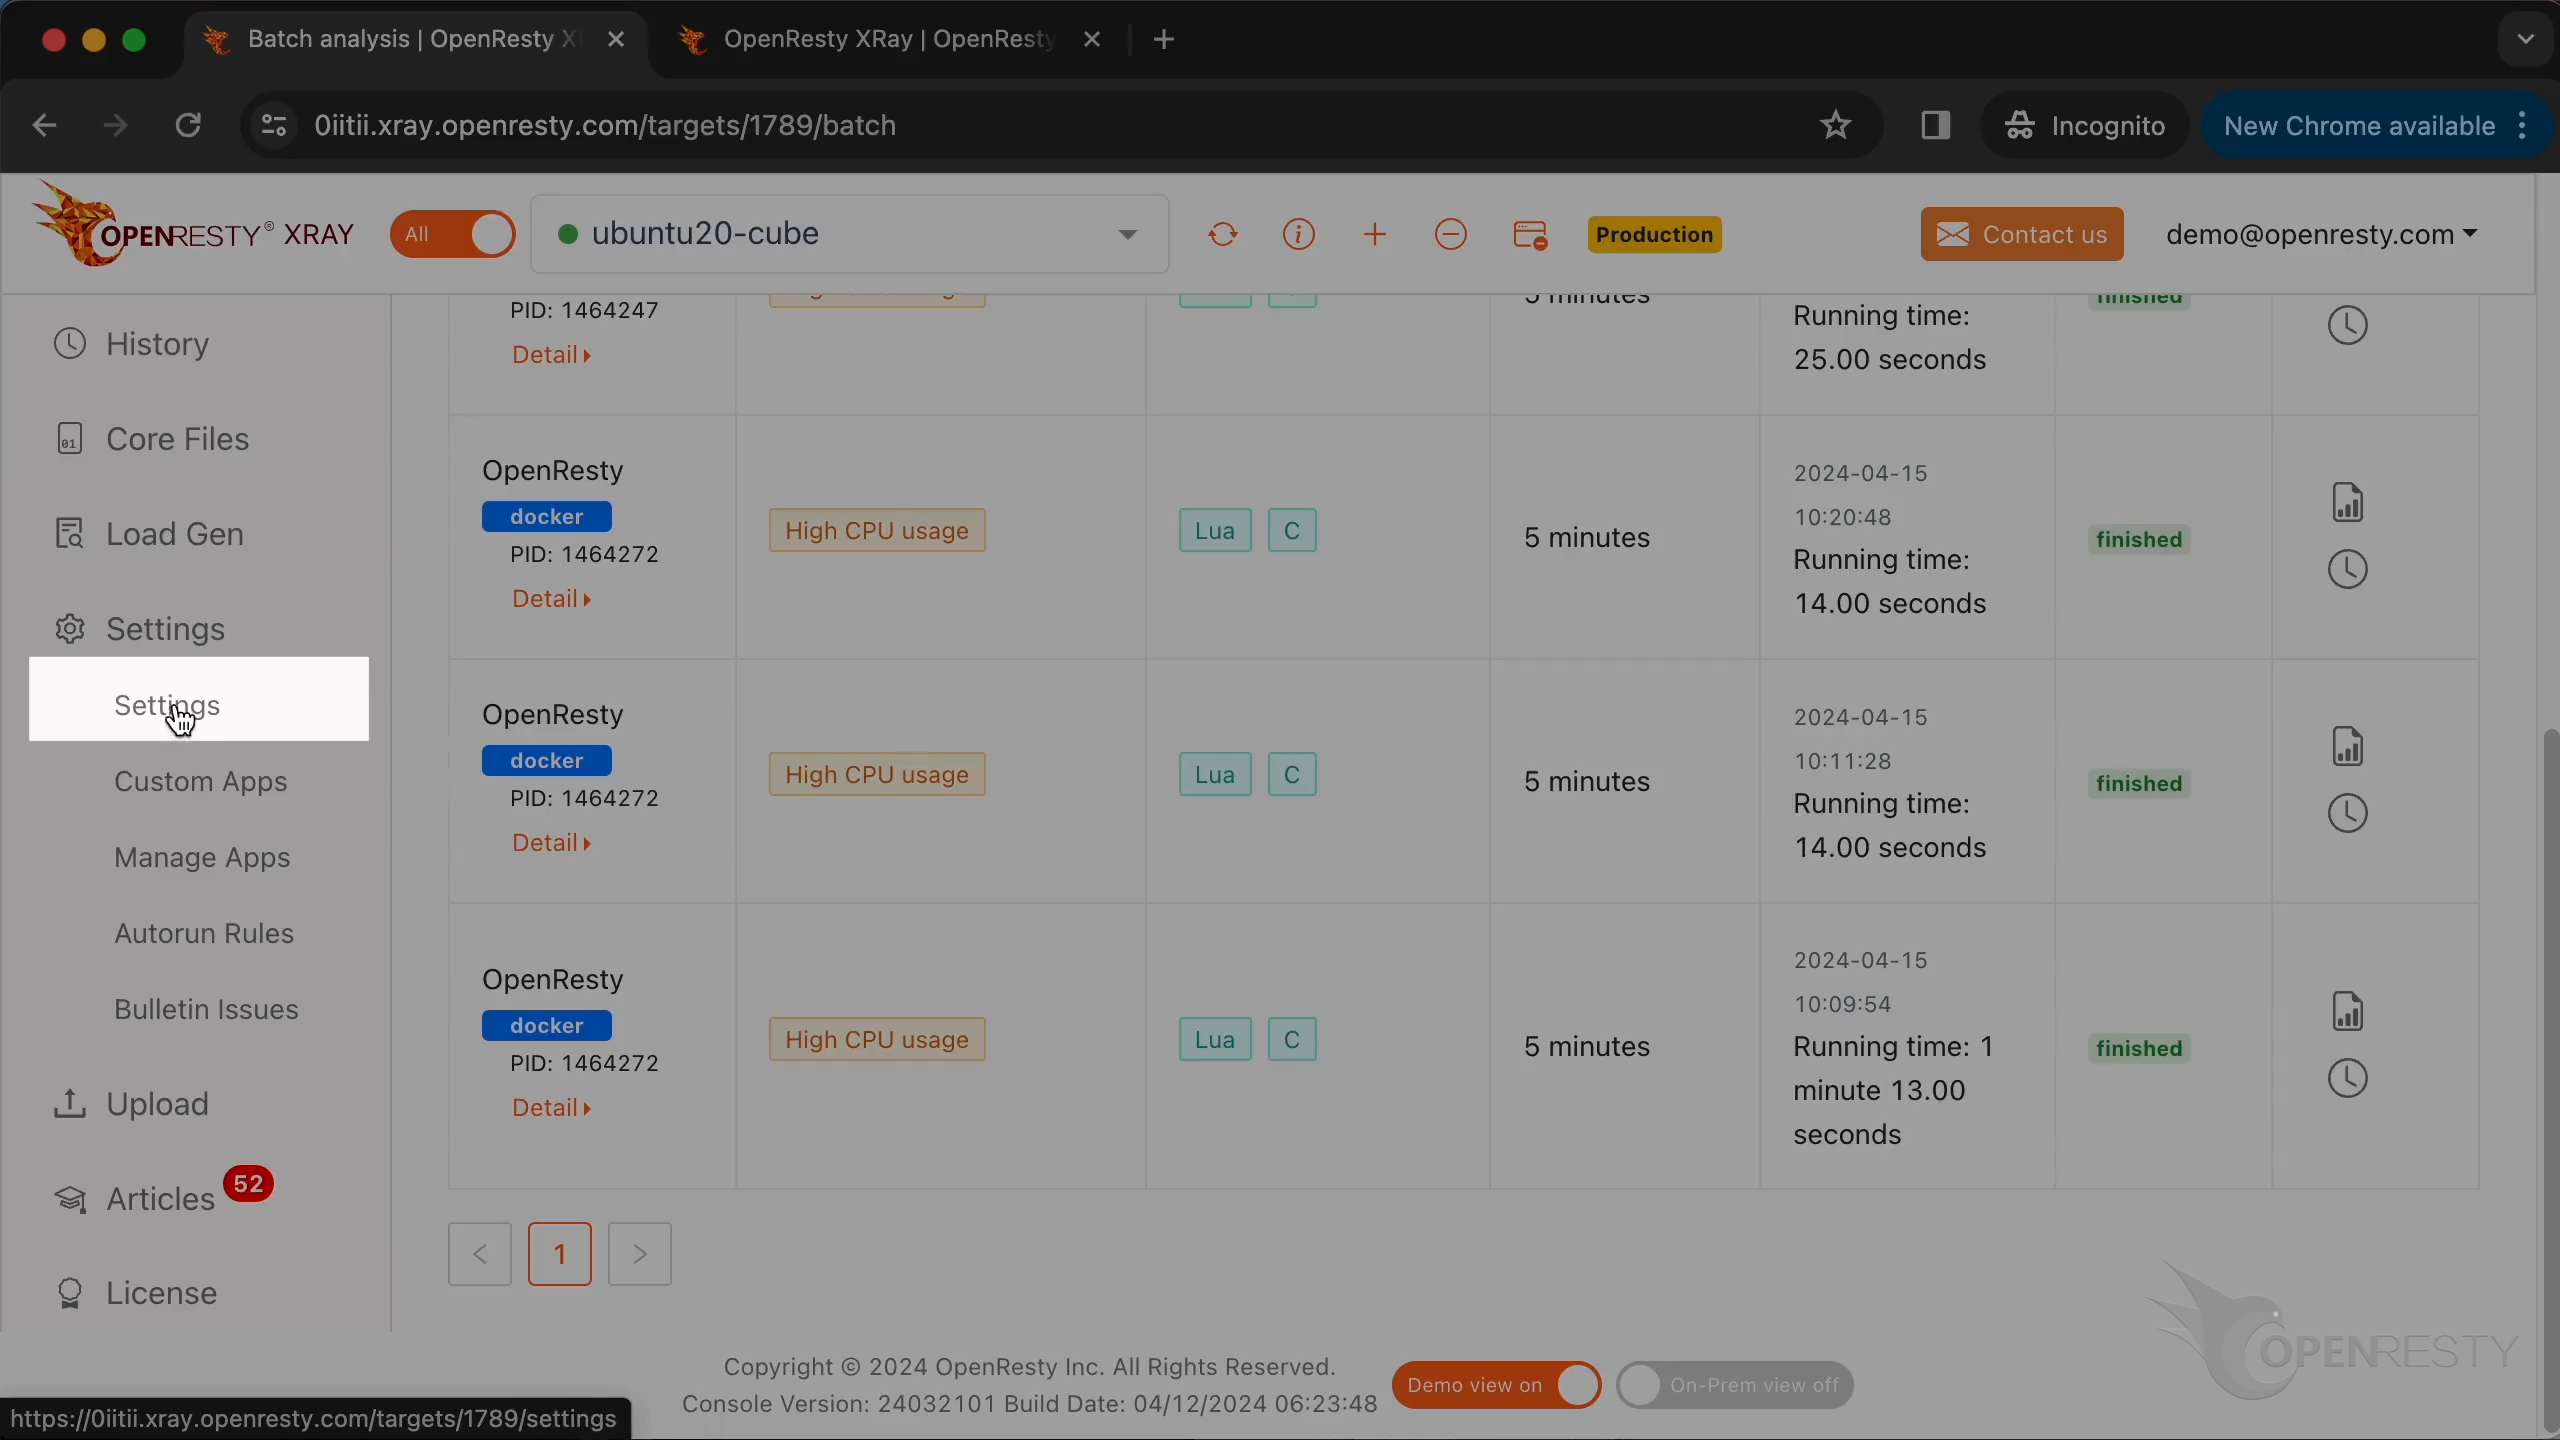
Here, you can see the information on the selected agent and make some configurations for it.
OpenResty XRay Web Console FAQ
Does OpenResty XRay require changing your application code?
No. OpenResty XRay is a non-invasive tool that analyzes running applications as-is. You drive everything from the web console — no recompiling, no instrumentation, and no code changes.
What’s the difference between Insights reports and Guided Analysis?
Insights reports are generated automatically on a daily and weekly schedule for every app across your servers. Guided Analysis is on-demand: you pick a problem type, target, and duration, then trigger a live analysis yourself. Both produce reports with flame graphs and suggestions.
How often does OpenResty XRay generate Insights reports?
Automatically, on daily and weekly cycles. The Insights page defaults to today’s daily report and can also show the weekly report, so there is always a recent analysis waiting without any manual trigger.
What is OpenResty XRay?
OpenResty XRay is a dynamic-tracing product that automatically analyzes your running applications to troubleshoot performance problems, behavioral issues, and security vulnerabilities with actionable suggestions. Under the hood, OpenResty XRay is powered by our Y language targeting various runtimes like Stap+, eBPF+, GDB, and ODB, depending on the contexts.
If you like this tutorial, please subscribe to this blog site and/or our YouTube channel. Thank you!
About The Author
Yichun Zhang (Github handle: agentzh), is the original creator of the OpenResty® open-source project and the CEO of OpenResty Inc..
Yichun is one of the earliest advocates and leaders of “open-source technology”. He worked at many internationally renowned tech companies, such as Cloudflare, Yahoo!. He is a pioneer of “edge computing”, “dynamic tracing” and “machine coding”, with over 22 years of programming and 16 years of open source experience. Yichun is well-known in the open-source space as the project leader of OpenResty®, adopted by more than 40 million global website domains.
OpenResty Inc., the enterprise software start-up founded by Yichun in 2017, has customers from some of the biggest companies in the world. Its flagship product, OpenResty XRay, is a non-invasive profiling and troubleshooting tool that significantly enhances and utilizes dynamic tracing technology. And its OpenResty Edge product is a powerful distributed traffic management and private CDN software product.
As an avid open-source contributor, Yichun has contributed more than a million lines of code to numerous open-source projects, including Linux kernel, Nginx, LuaJIT, GDB, SystemTap, LLVM, Perl, etc. He has also authored more than 60 open-source software libraries.
Related Articles
OpenResty XRay Aug 12, 2024

OpenResty XRay Aug 4, 2024

OpenResty XRay Jul 26, 2024

OpenResty XRay May 24, 2024

OpenResty XRay May 12, 2024