How to Diagnose 504 Gateway Timeout Errors in OpenResty & Nginx
A 504 Gateway Timeout in OpenResty or Nginx means your server, acting as a reverse proxy, gave up waiting for a response from an upstream server. The root cause is almost always one of three things: a slow upstream server, a slow network link between the two, or a too-short timeout setting on the proxy. This tutorial shows how to pinpoint which one is to blame in a live OpenResty or Nginx server, using OpenResty XRay. A 504 is often where tail latency ends up once it keeps degrading; if your symptom is still an occasional high P99 rather than a hard timeout, start with P99 latency explained.
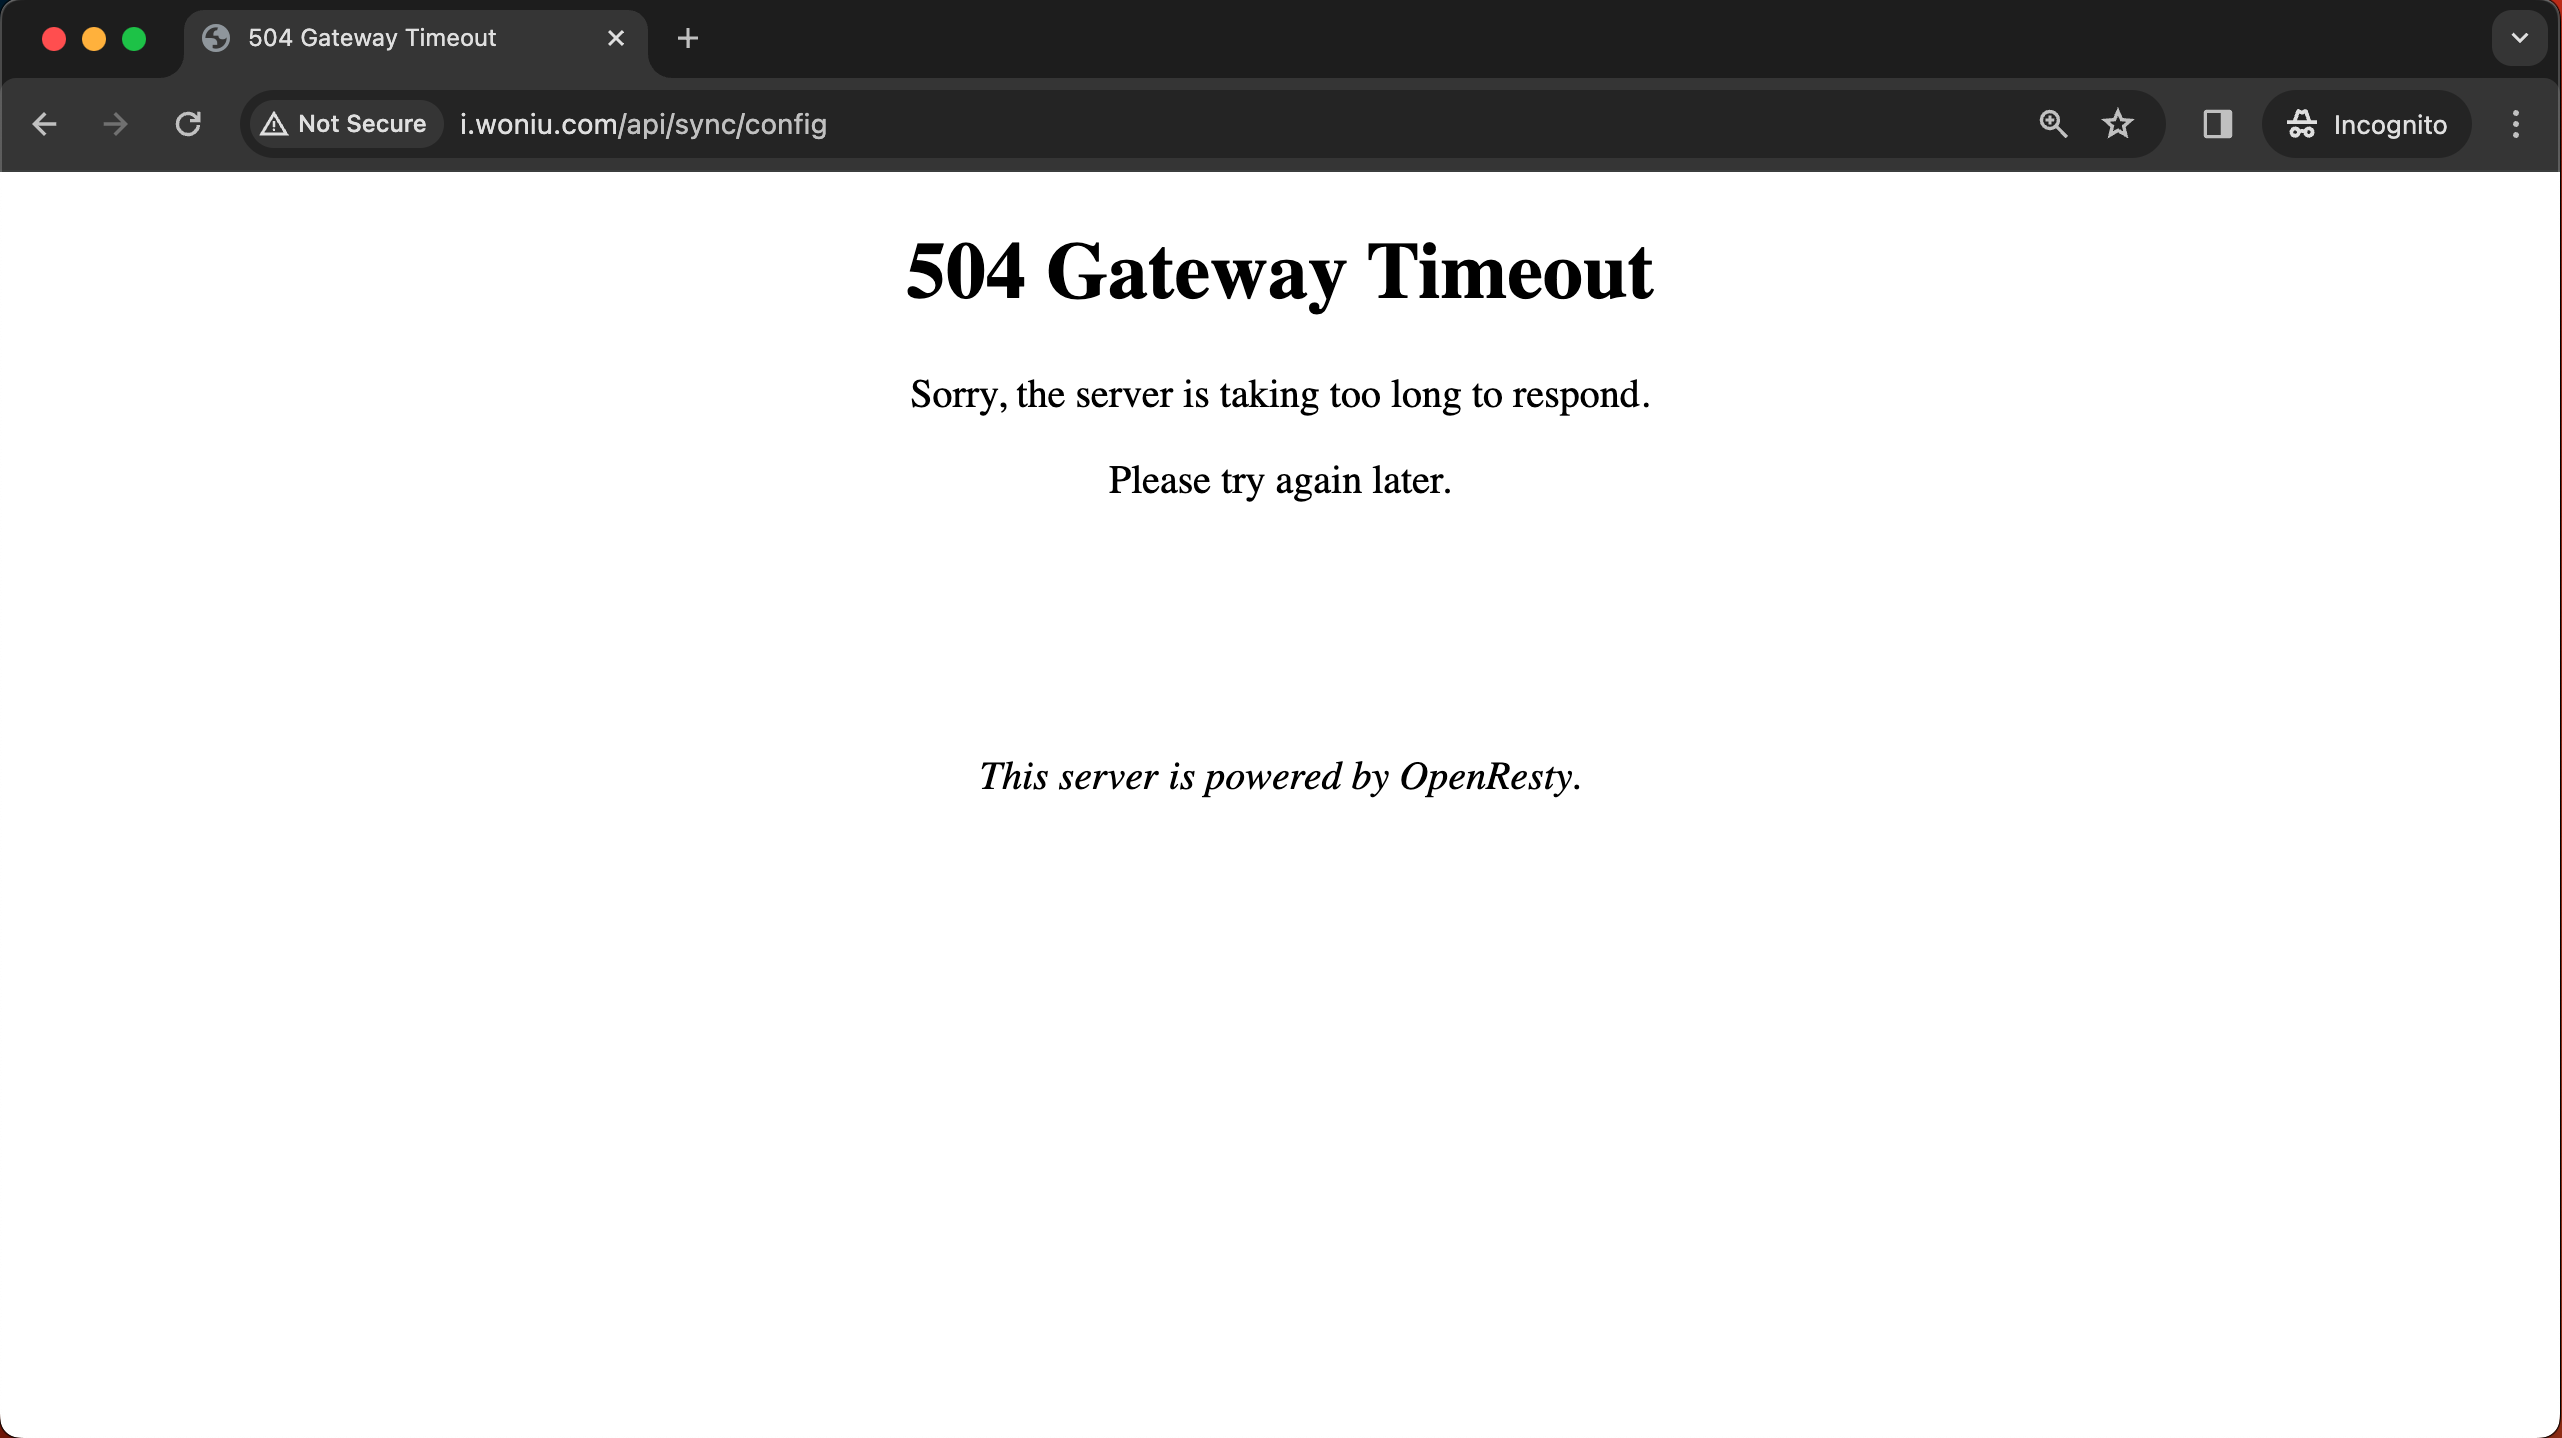
Confirming the 504 Gateway Timeout in the OpenResty Access Log
Start where every 504 investigation starts: the access log. Here we tail the OpenResty access log and filter for the 504 status code.
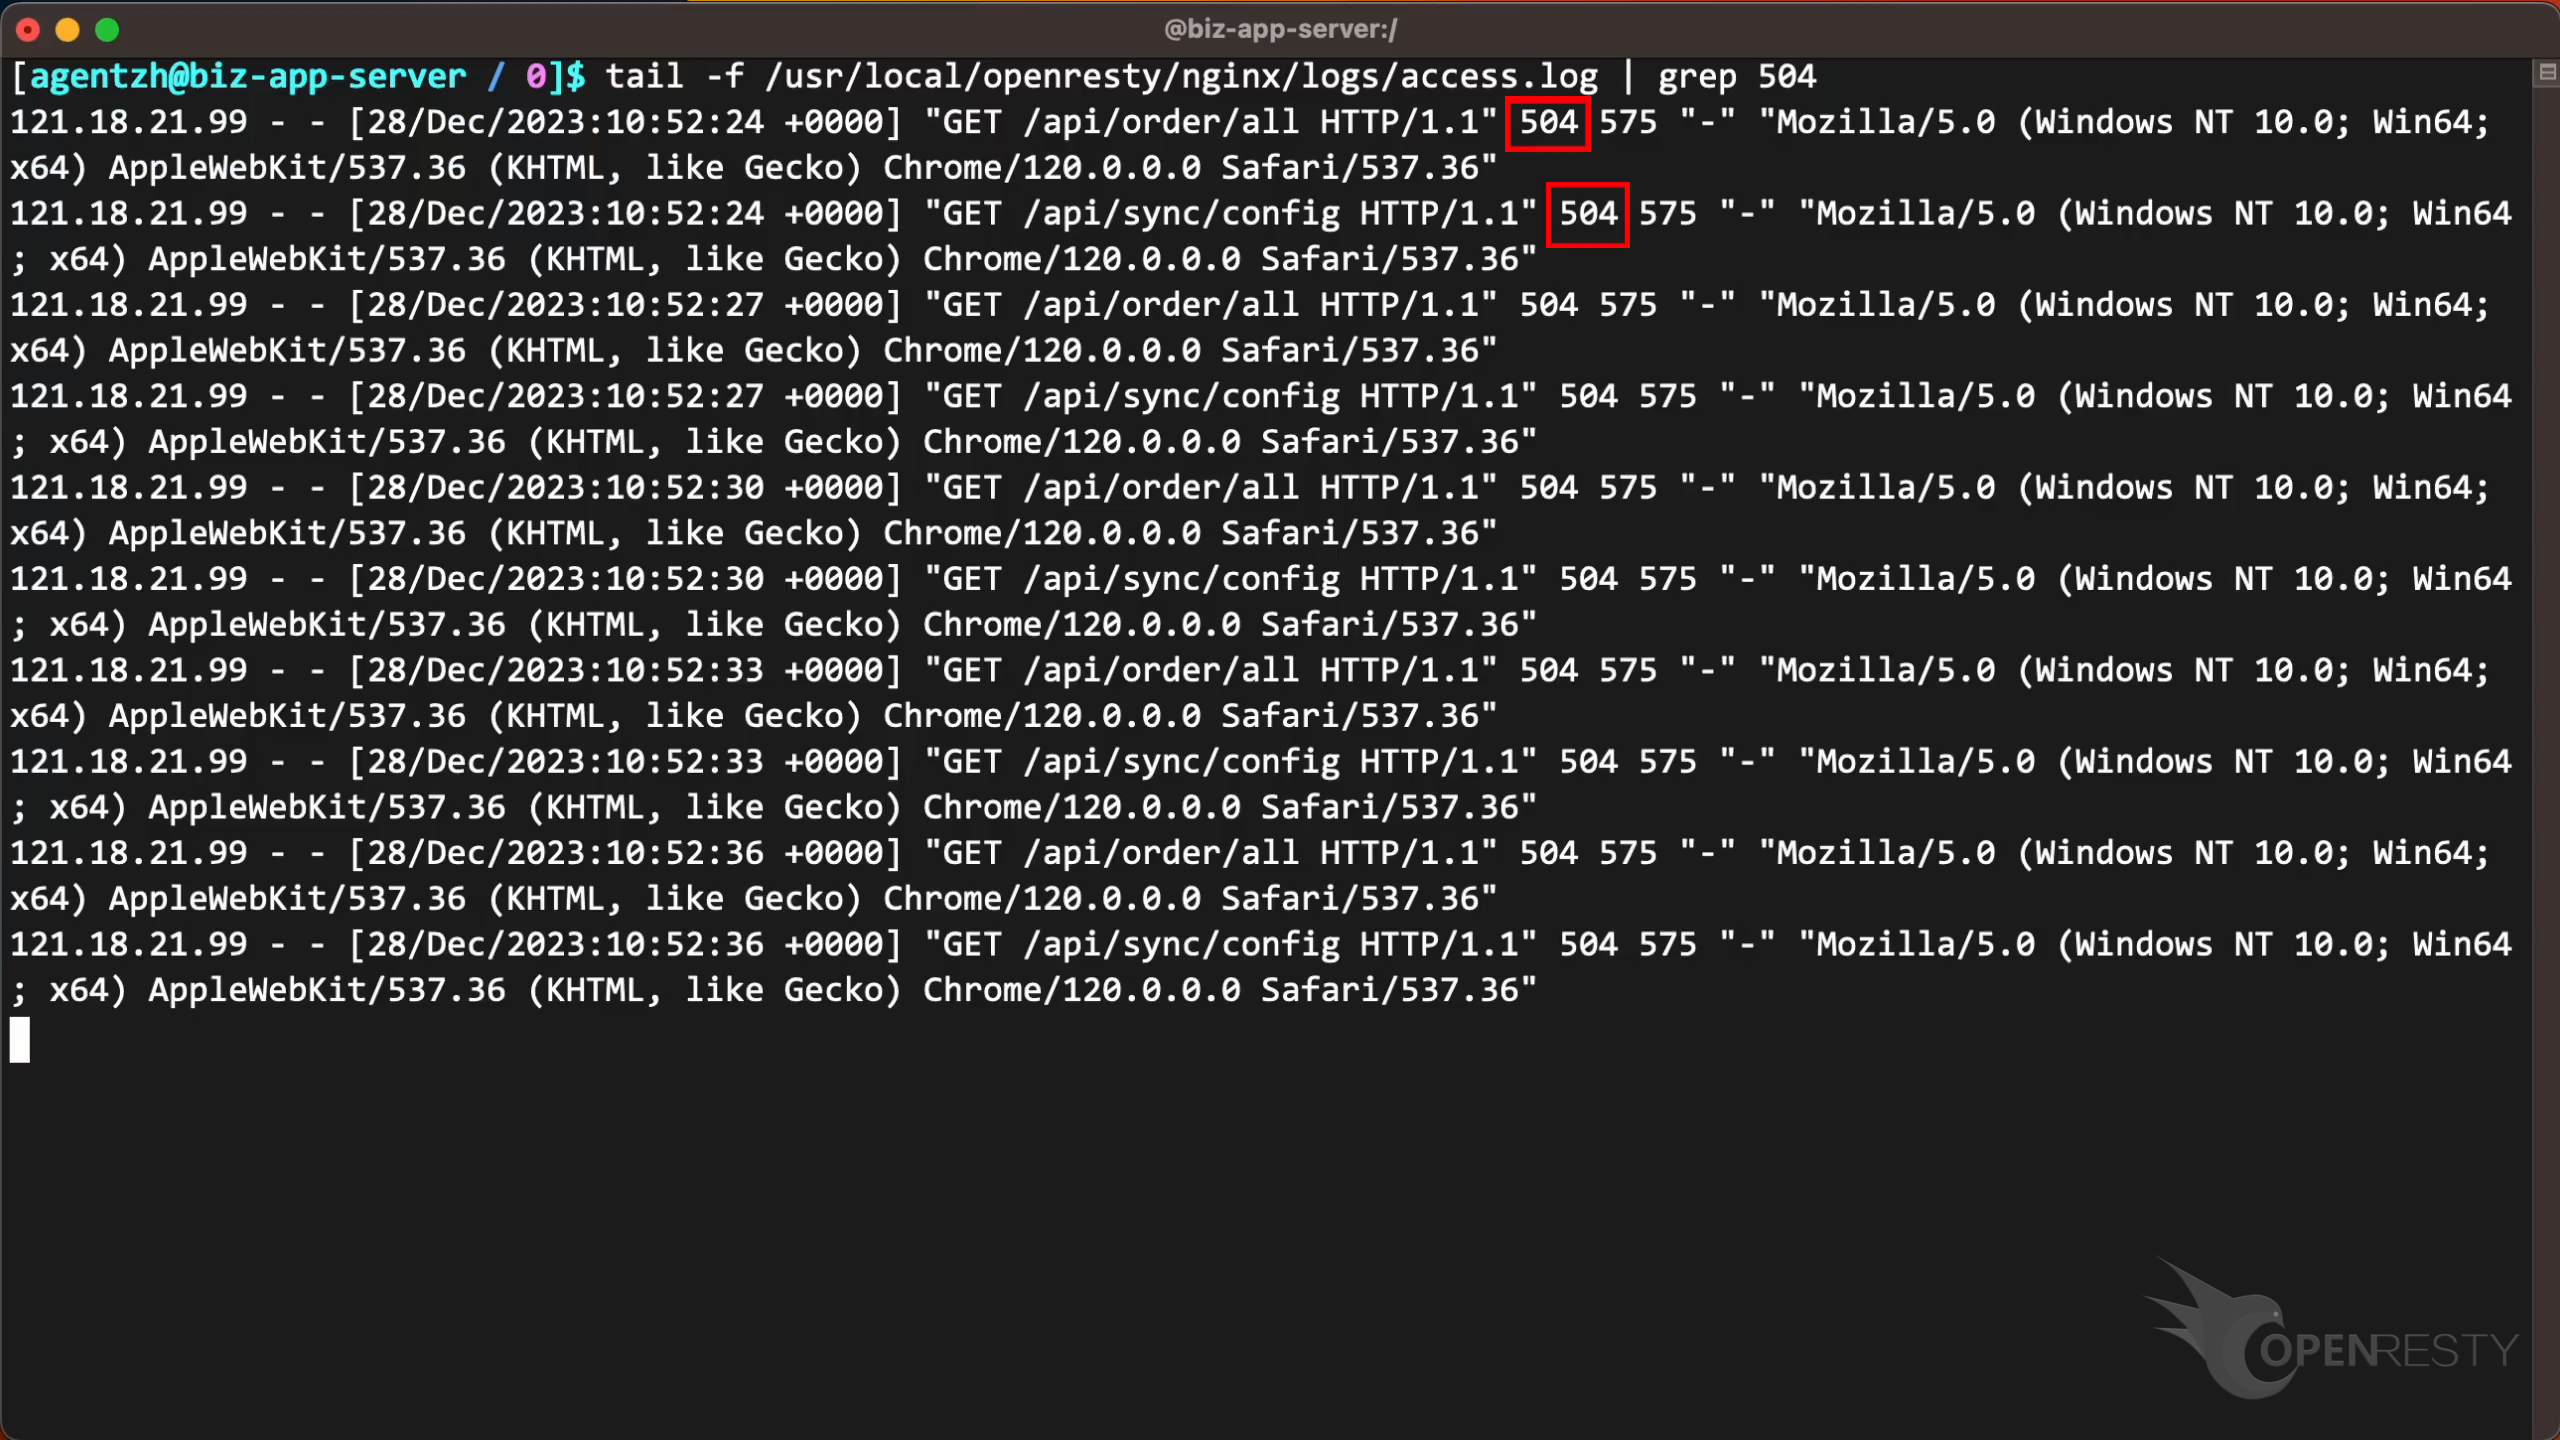
The log confirms the symptom clearly enough: the /api/order/all and /api/sync/config requests are all returning status 504, and they keep repeating every few seconds. So we know 504 errors are happening and which endpoints are affected.
But this is exactly where the access log runs out of answers. A slow upstream server, a slow network link, and a too-short proxy timeout all produce the same 504 line — the status code cannot tell them apart. To know which of the three is really to blame, you have to look inside the TCP connection that led to the 504 and find where the time actually went. That is what the next step does.
Diagnosing the 504 Root Cause with OpenResty XRay Guided Analysis
OpenResty XRay can analyze these 504 errors on a live server and reconstruct exactly what happened inside the connection. Open the XRay web console, confirm you are watching the right machine, and go to the Guided Analysis page, where you pick the type of problem to diagnose.
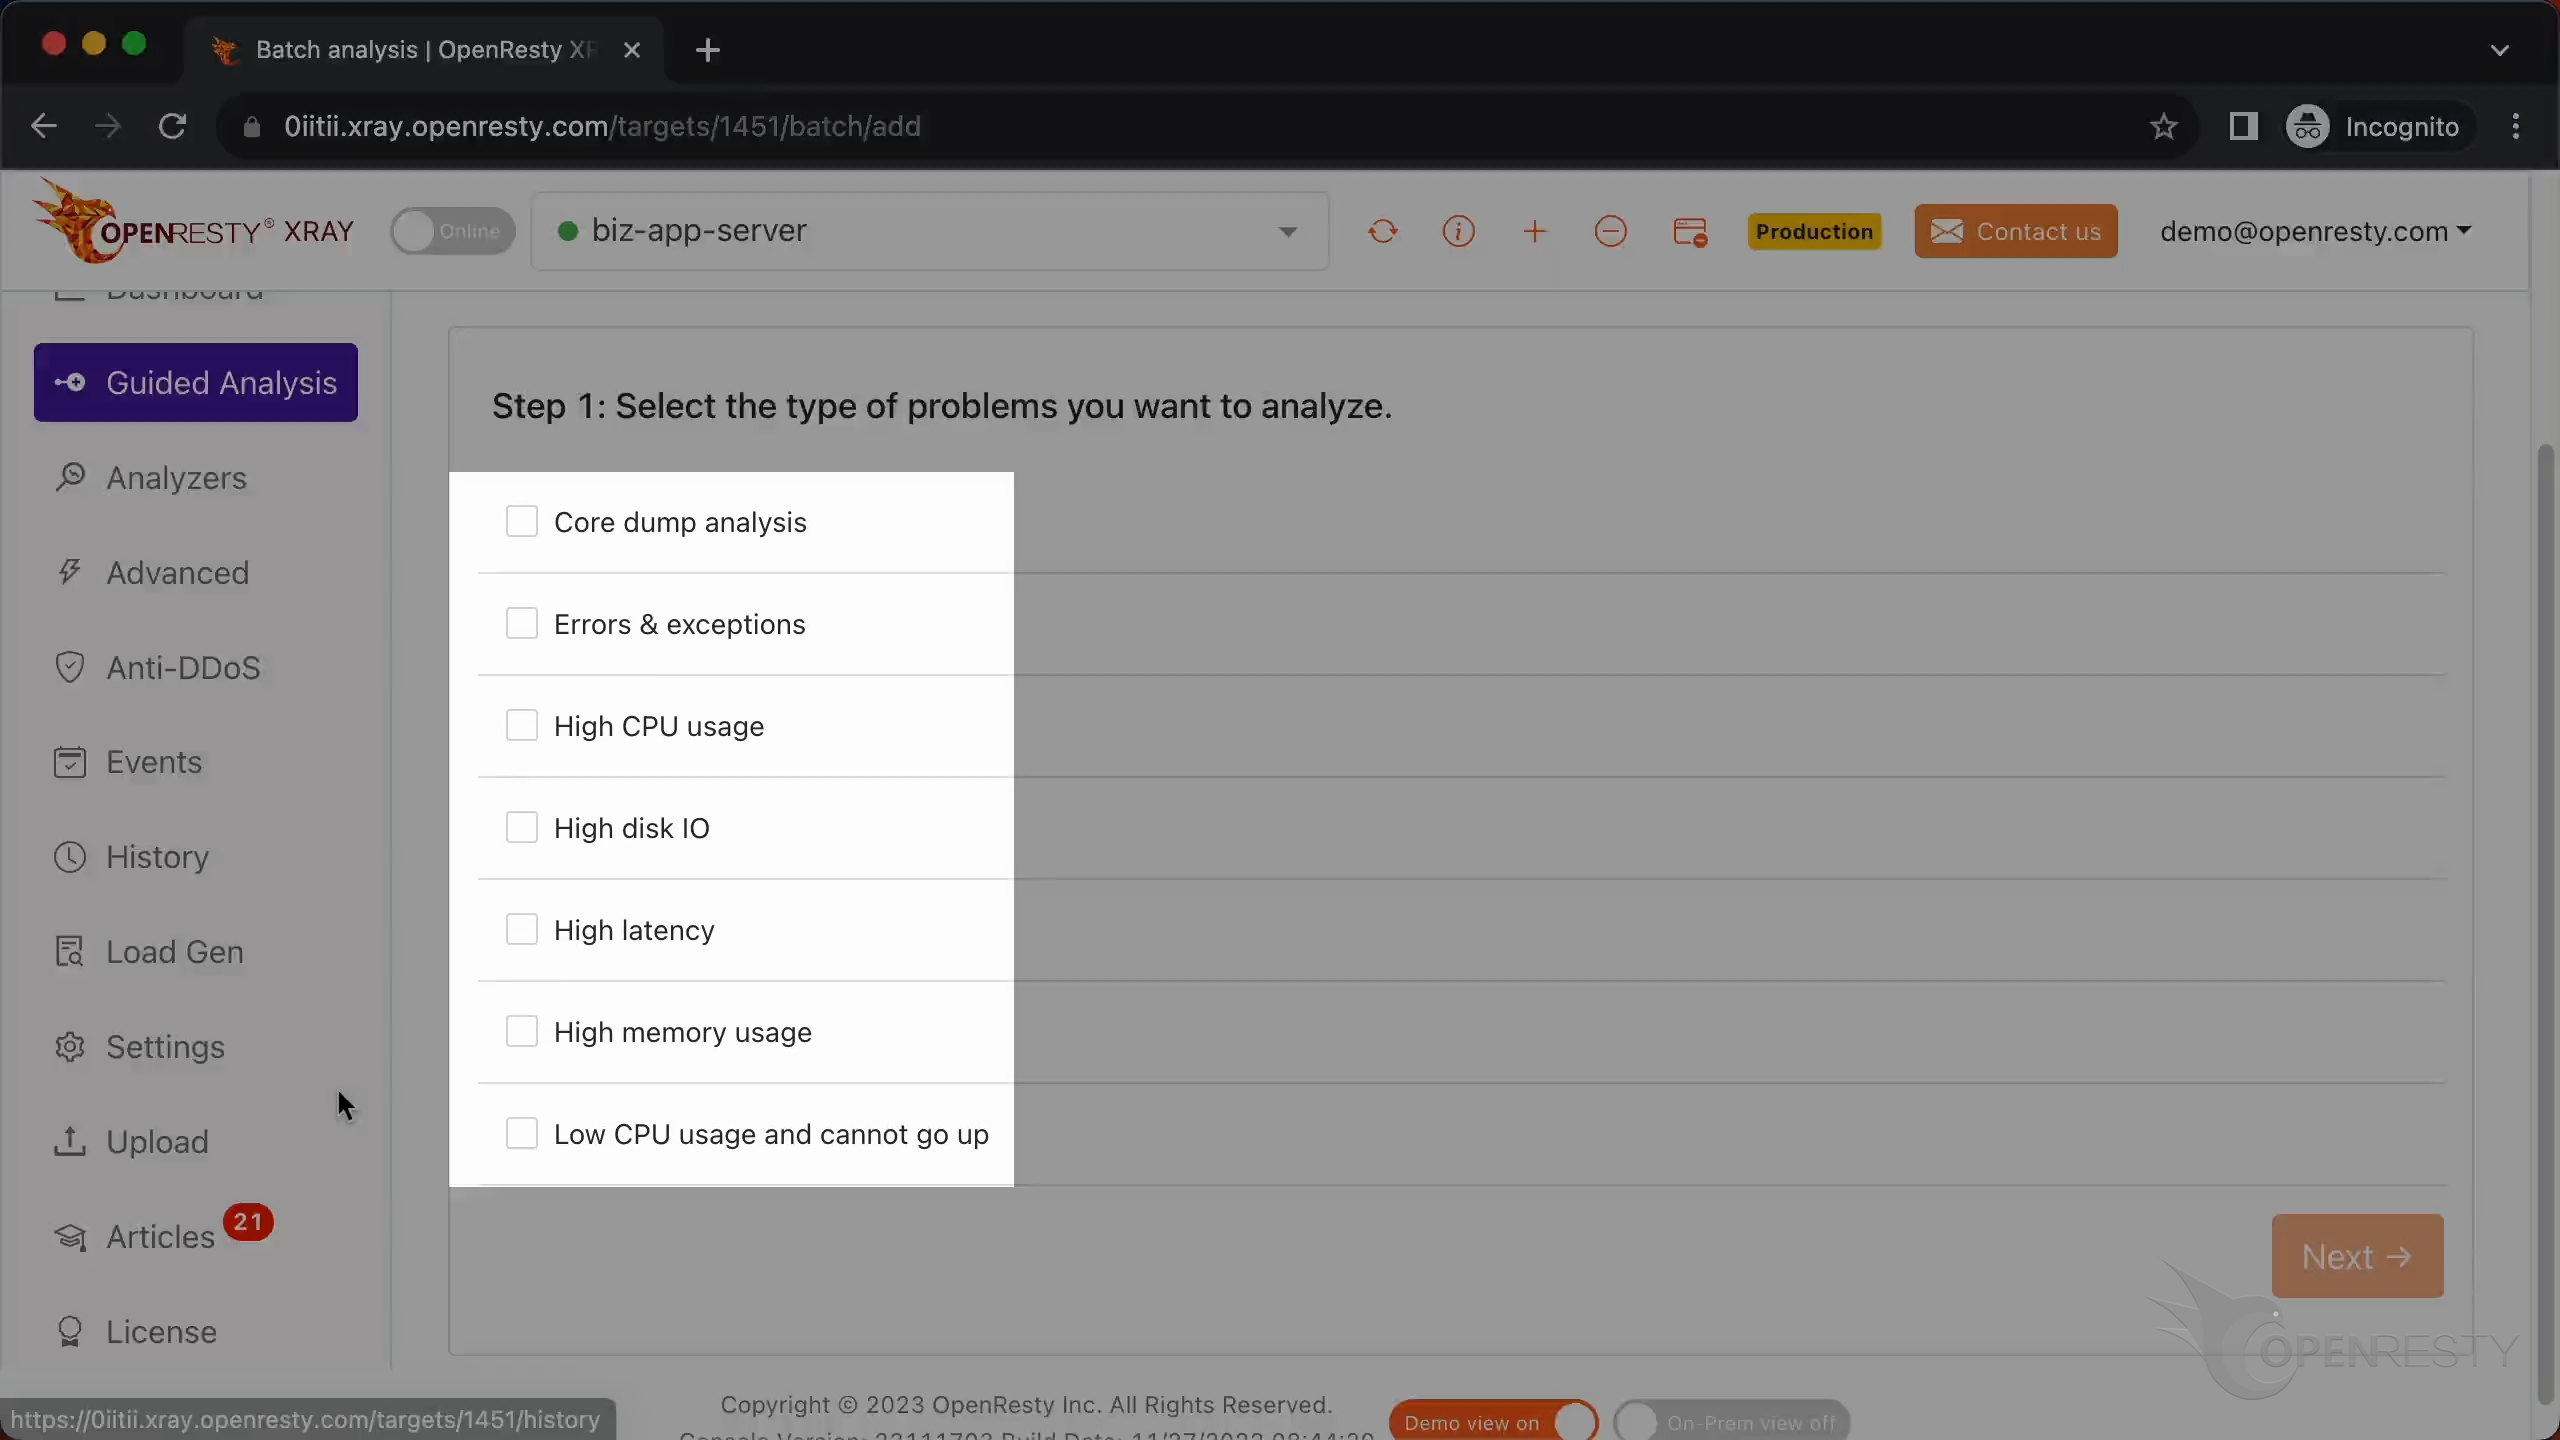
The setup is short: select Errors & exceptions, choose the OpenResty application from the previous step, set the scope to Whole application, keep the Lua and C/C++ language levels and the default 300-second analysis time, and start. XRay runs several rounds of analysis automatically and then generates a report.
Reading the Report: Two Kinds of 504 in One Analysis
The generated report groups everything under Errors & Exceptions, and for this server it surfaces two distinct HTTP 504 problems at once.
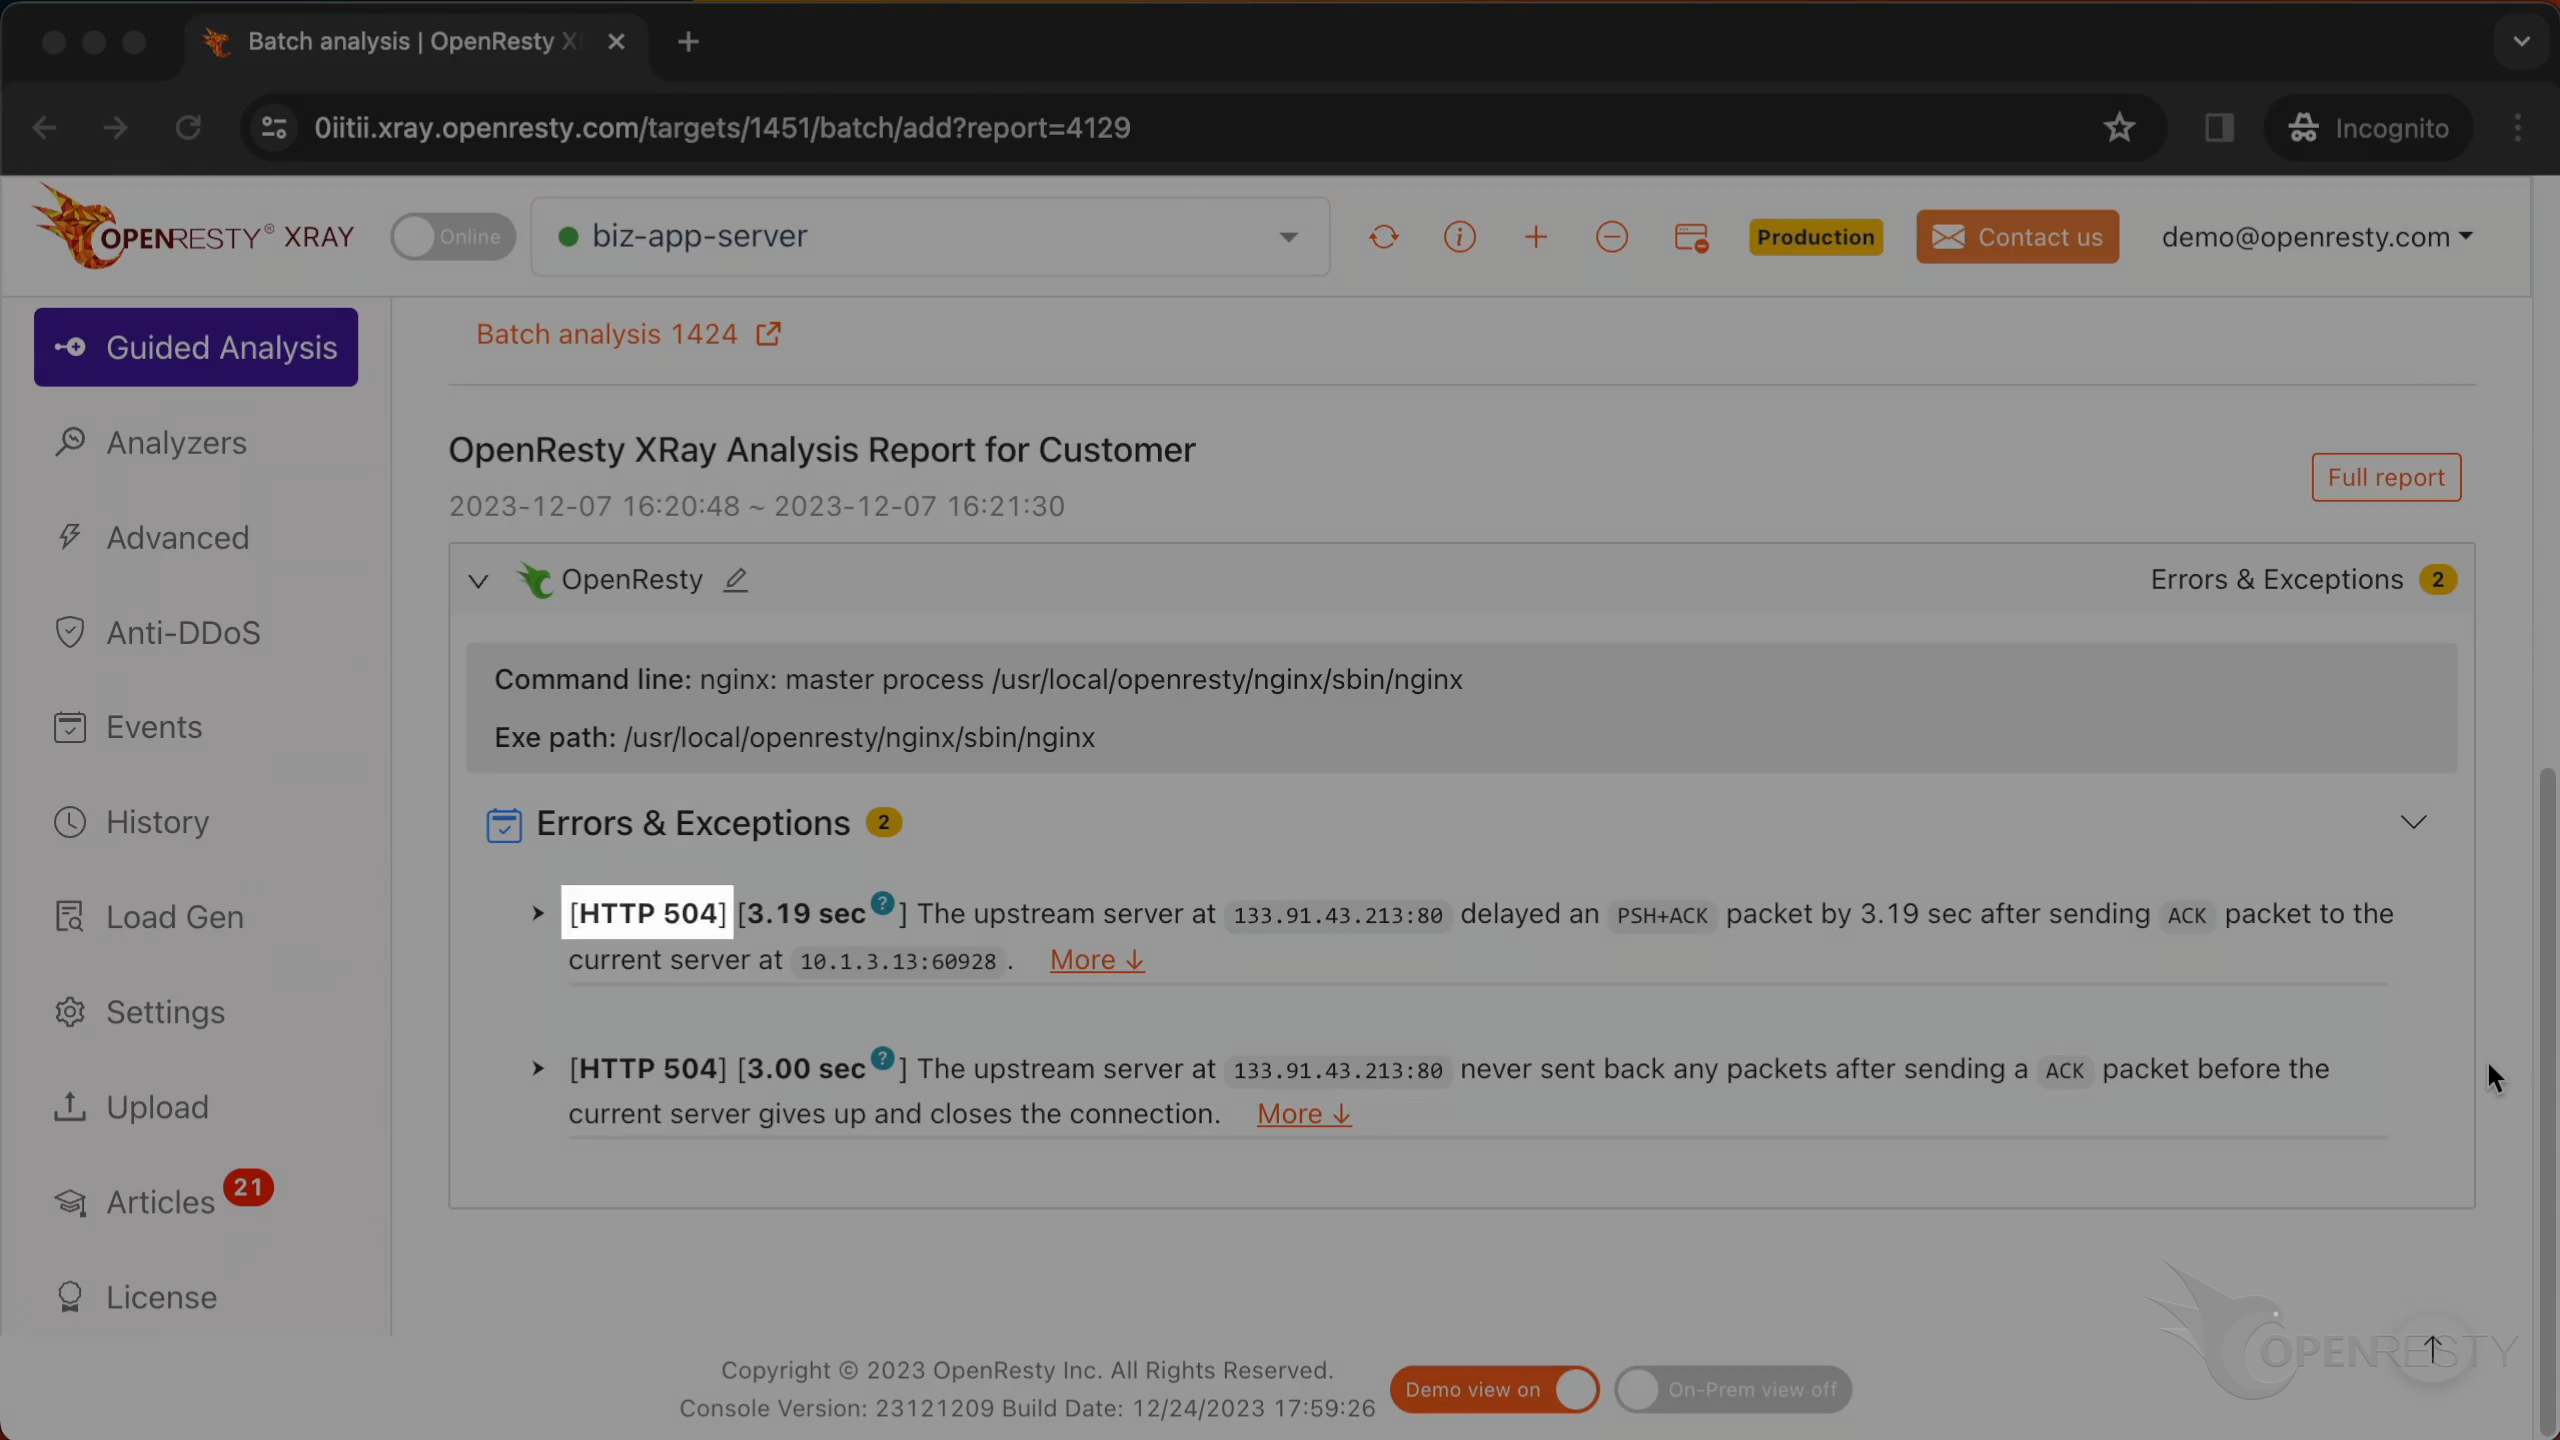
Read the two one-line summaries carefully, because they describe two genuinely different failure modes:
- The first 504 took 3.19 sec because the upstream server at
133.91.43.213:80delayed a PSH+ACK packet after the current server had sent it an ACK. - The second 504 happened because the upstream never sent back any packet — the current server waited, then gave up and closed the connection itself.
The trick to telling these apart is simple, and it is the single most useful idea in this whole analysis: look at the slowest packet in the connection and ask whether the current server received it or sent it. The two cases below show each outcome.
Case 1: The Delay Is on a Packet the Upstream Sent
Expand the first 504 and XRay plots every packet on the problematic TCP connection, in order, with the time gap before each one.
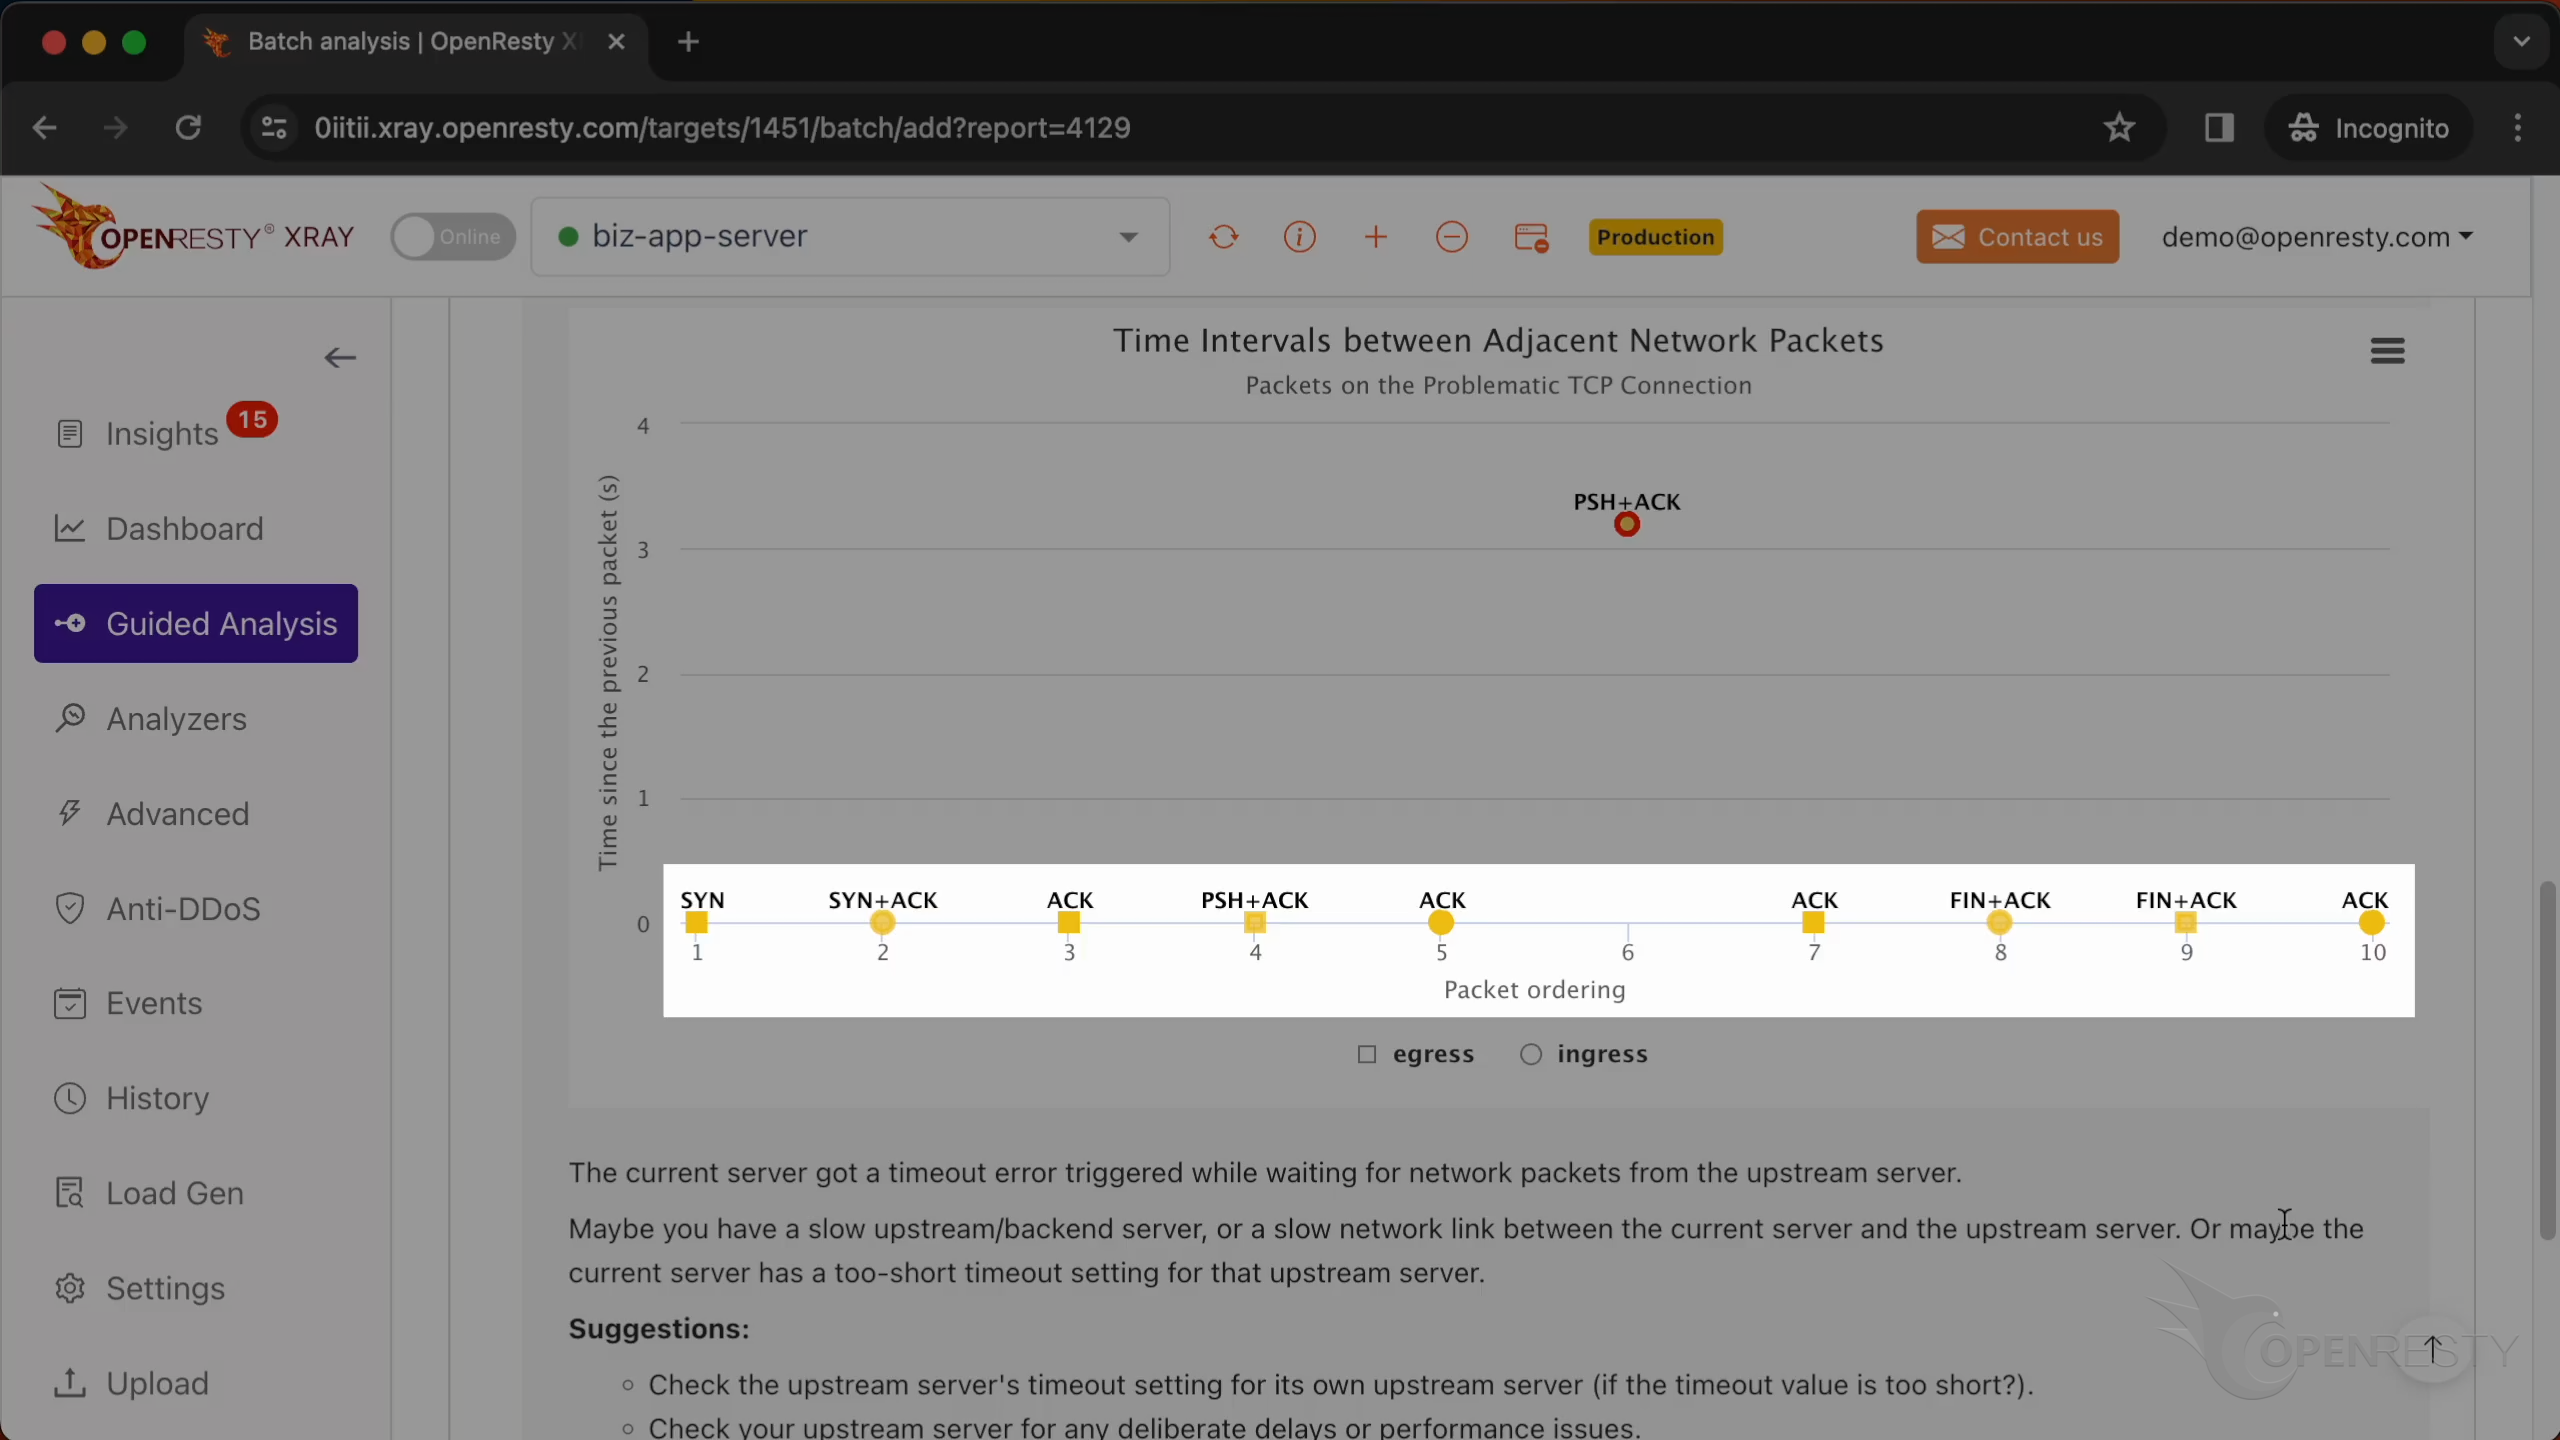
The chart reads at a glance. The horizontal axis is the packet order (1, 2, 3 …); the vertical axis is the delay before each packet; squares are packets the current server sent (egress), circles are packets it received (ingress). Almost every gap sits at zero — except one circle, the PSH+ACK packet, which spikes past 3 seconds. Hovering over it confirms the number and the direction.
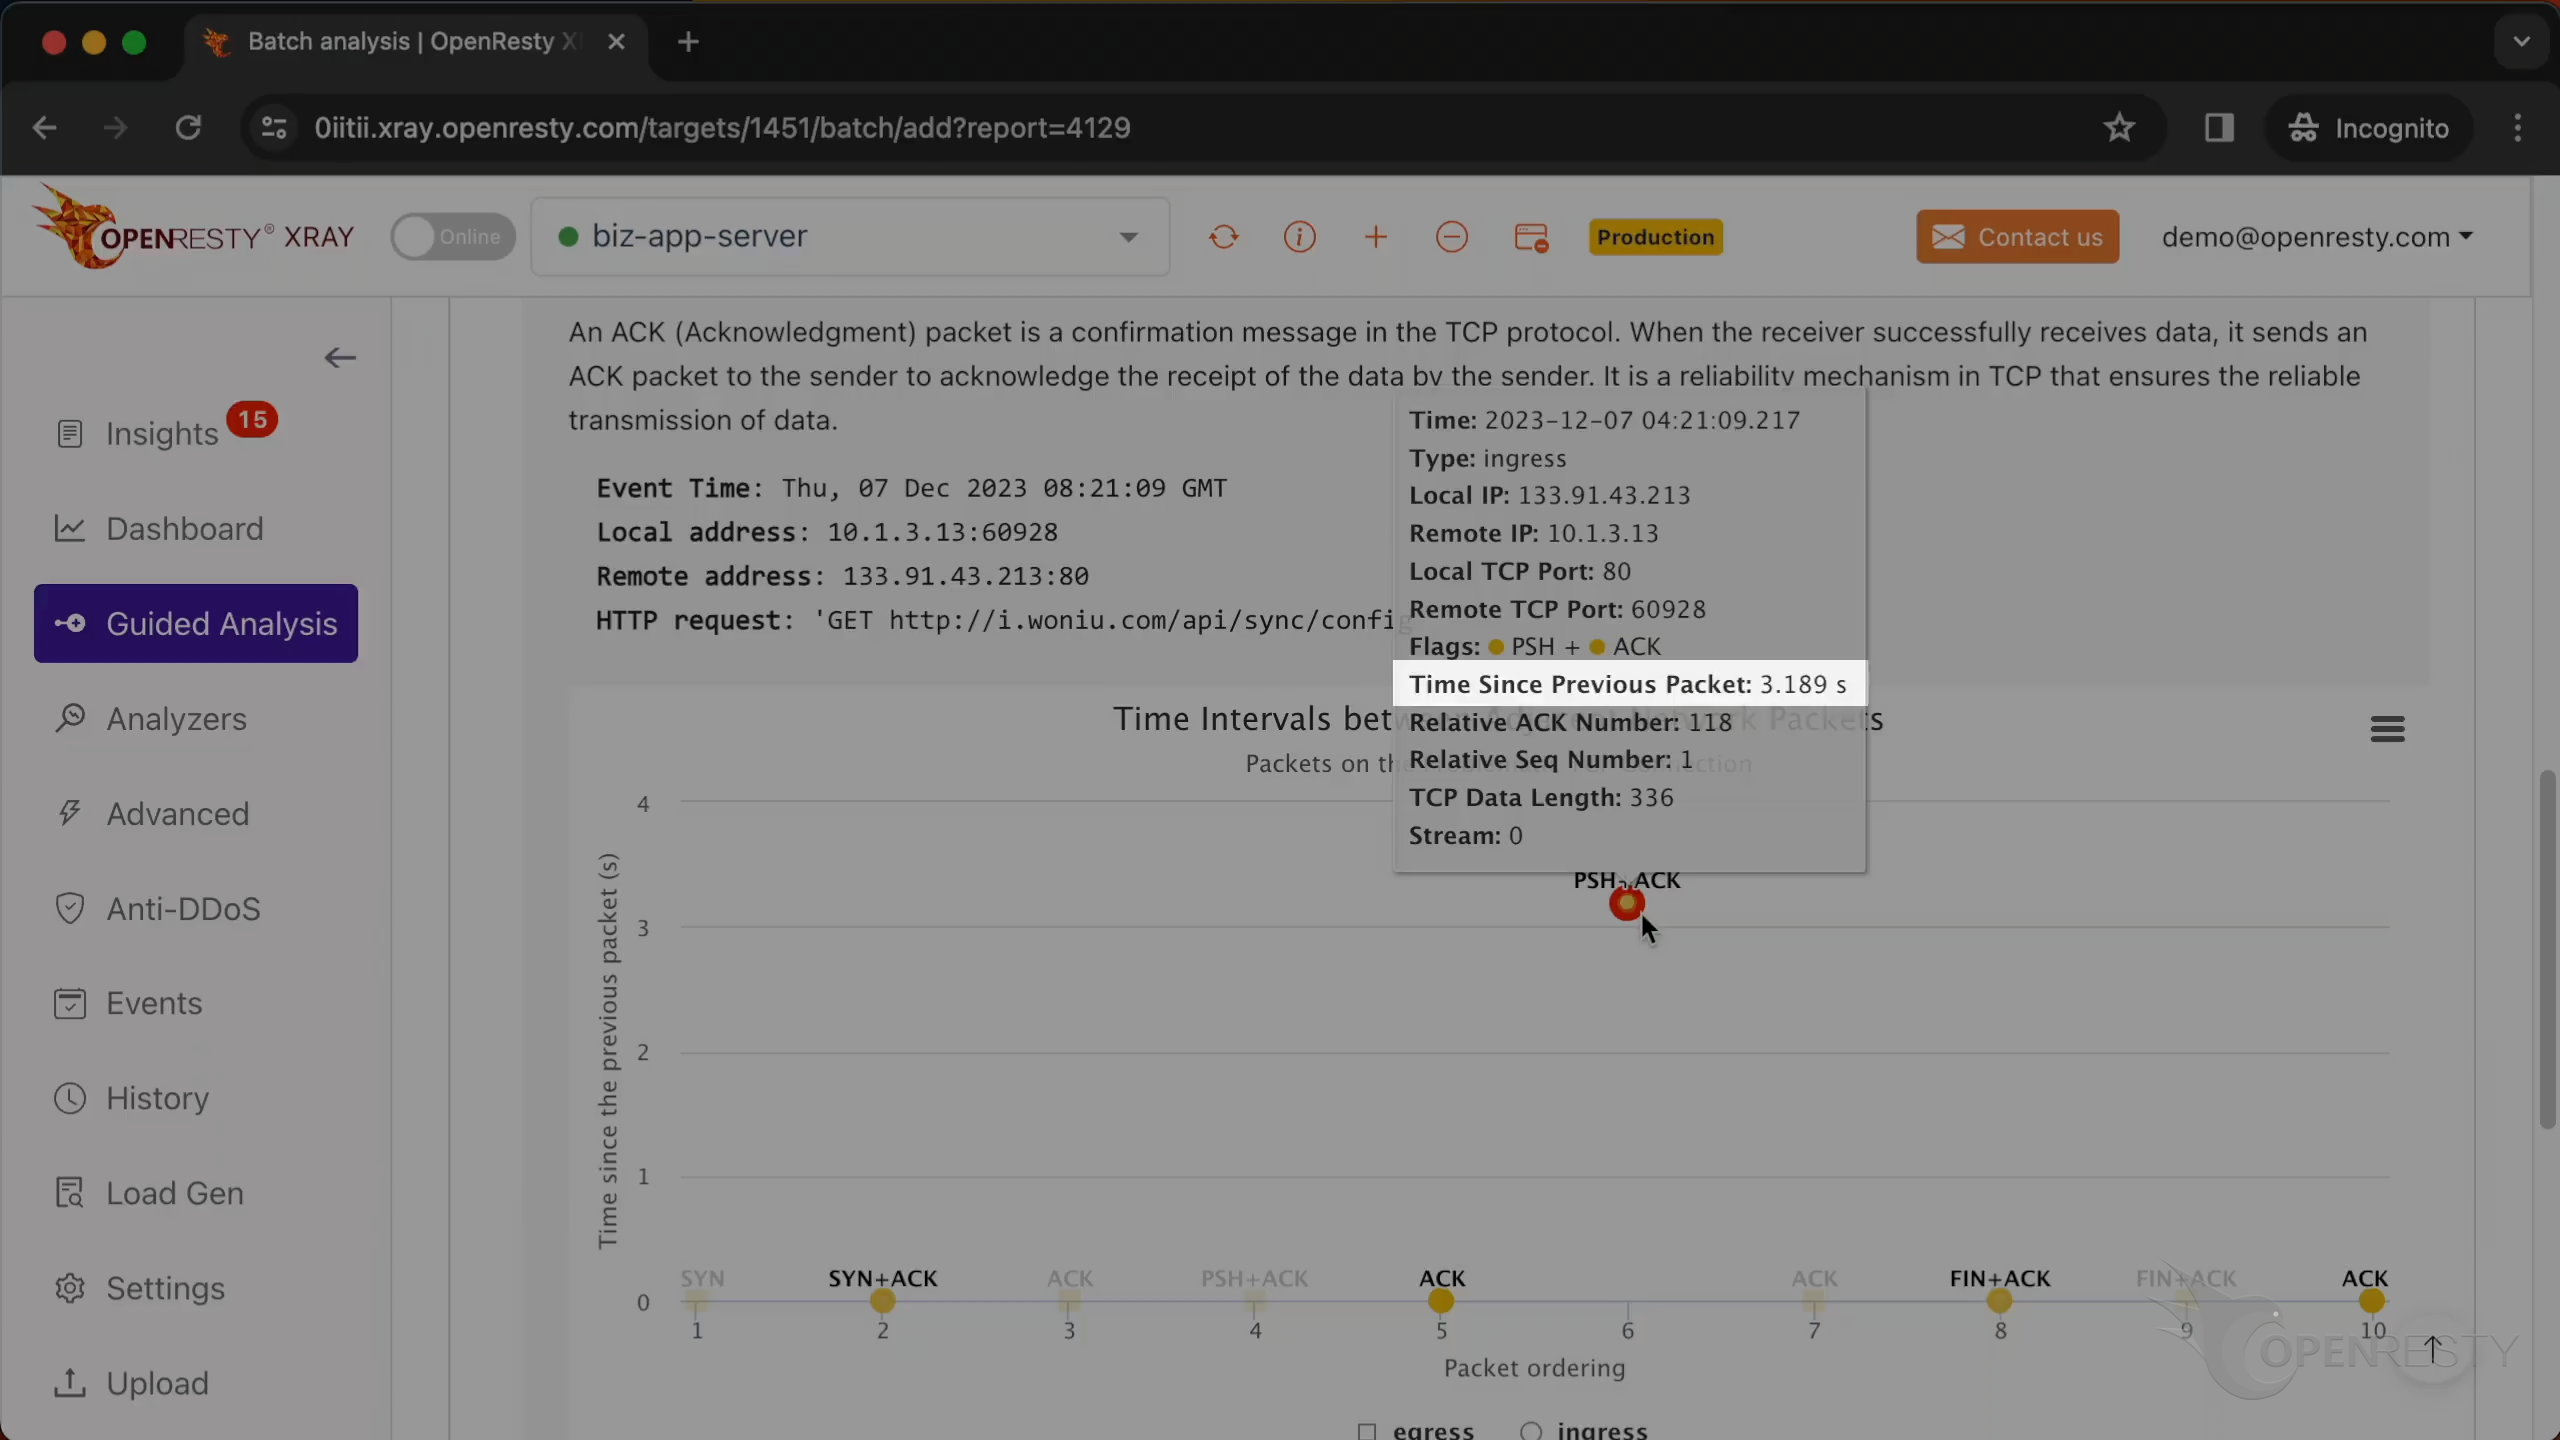
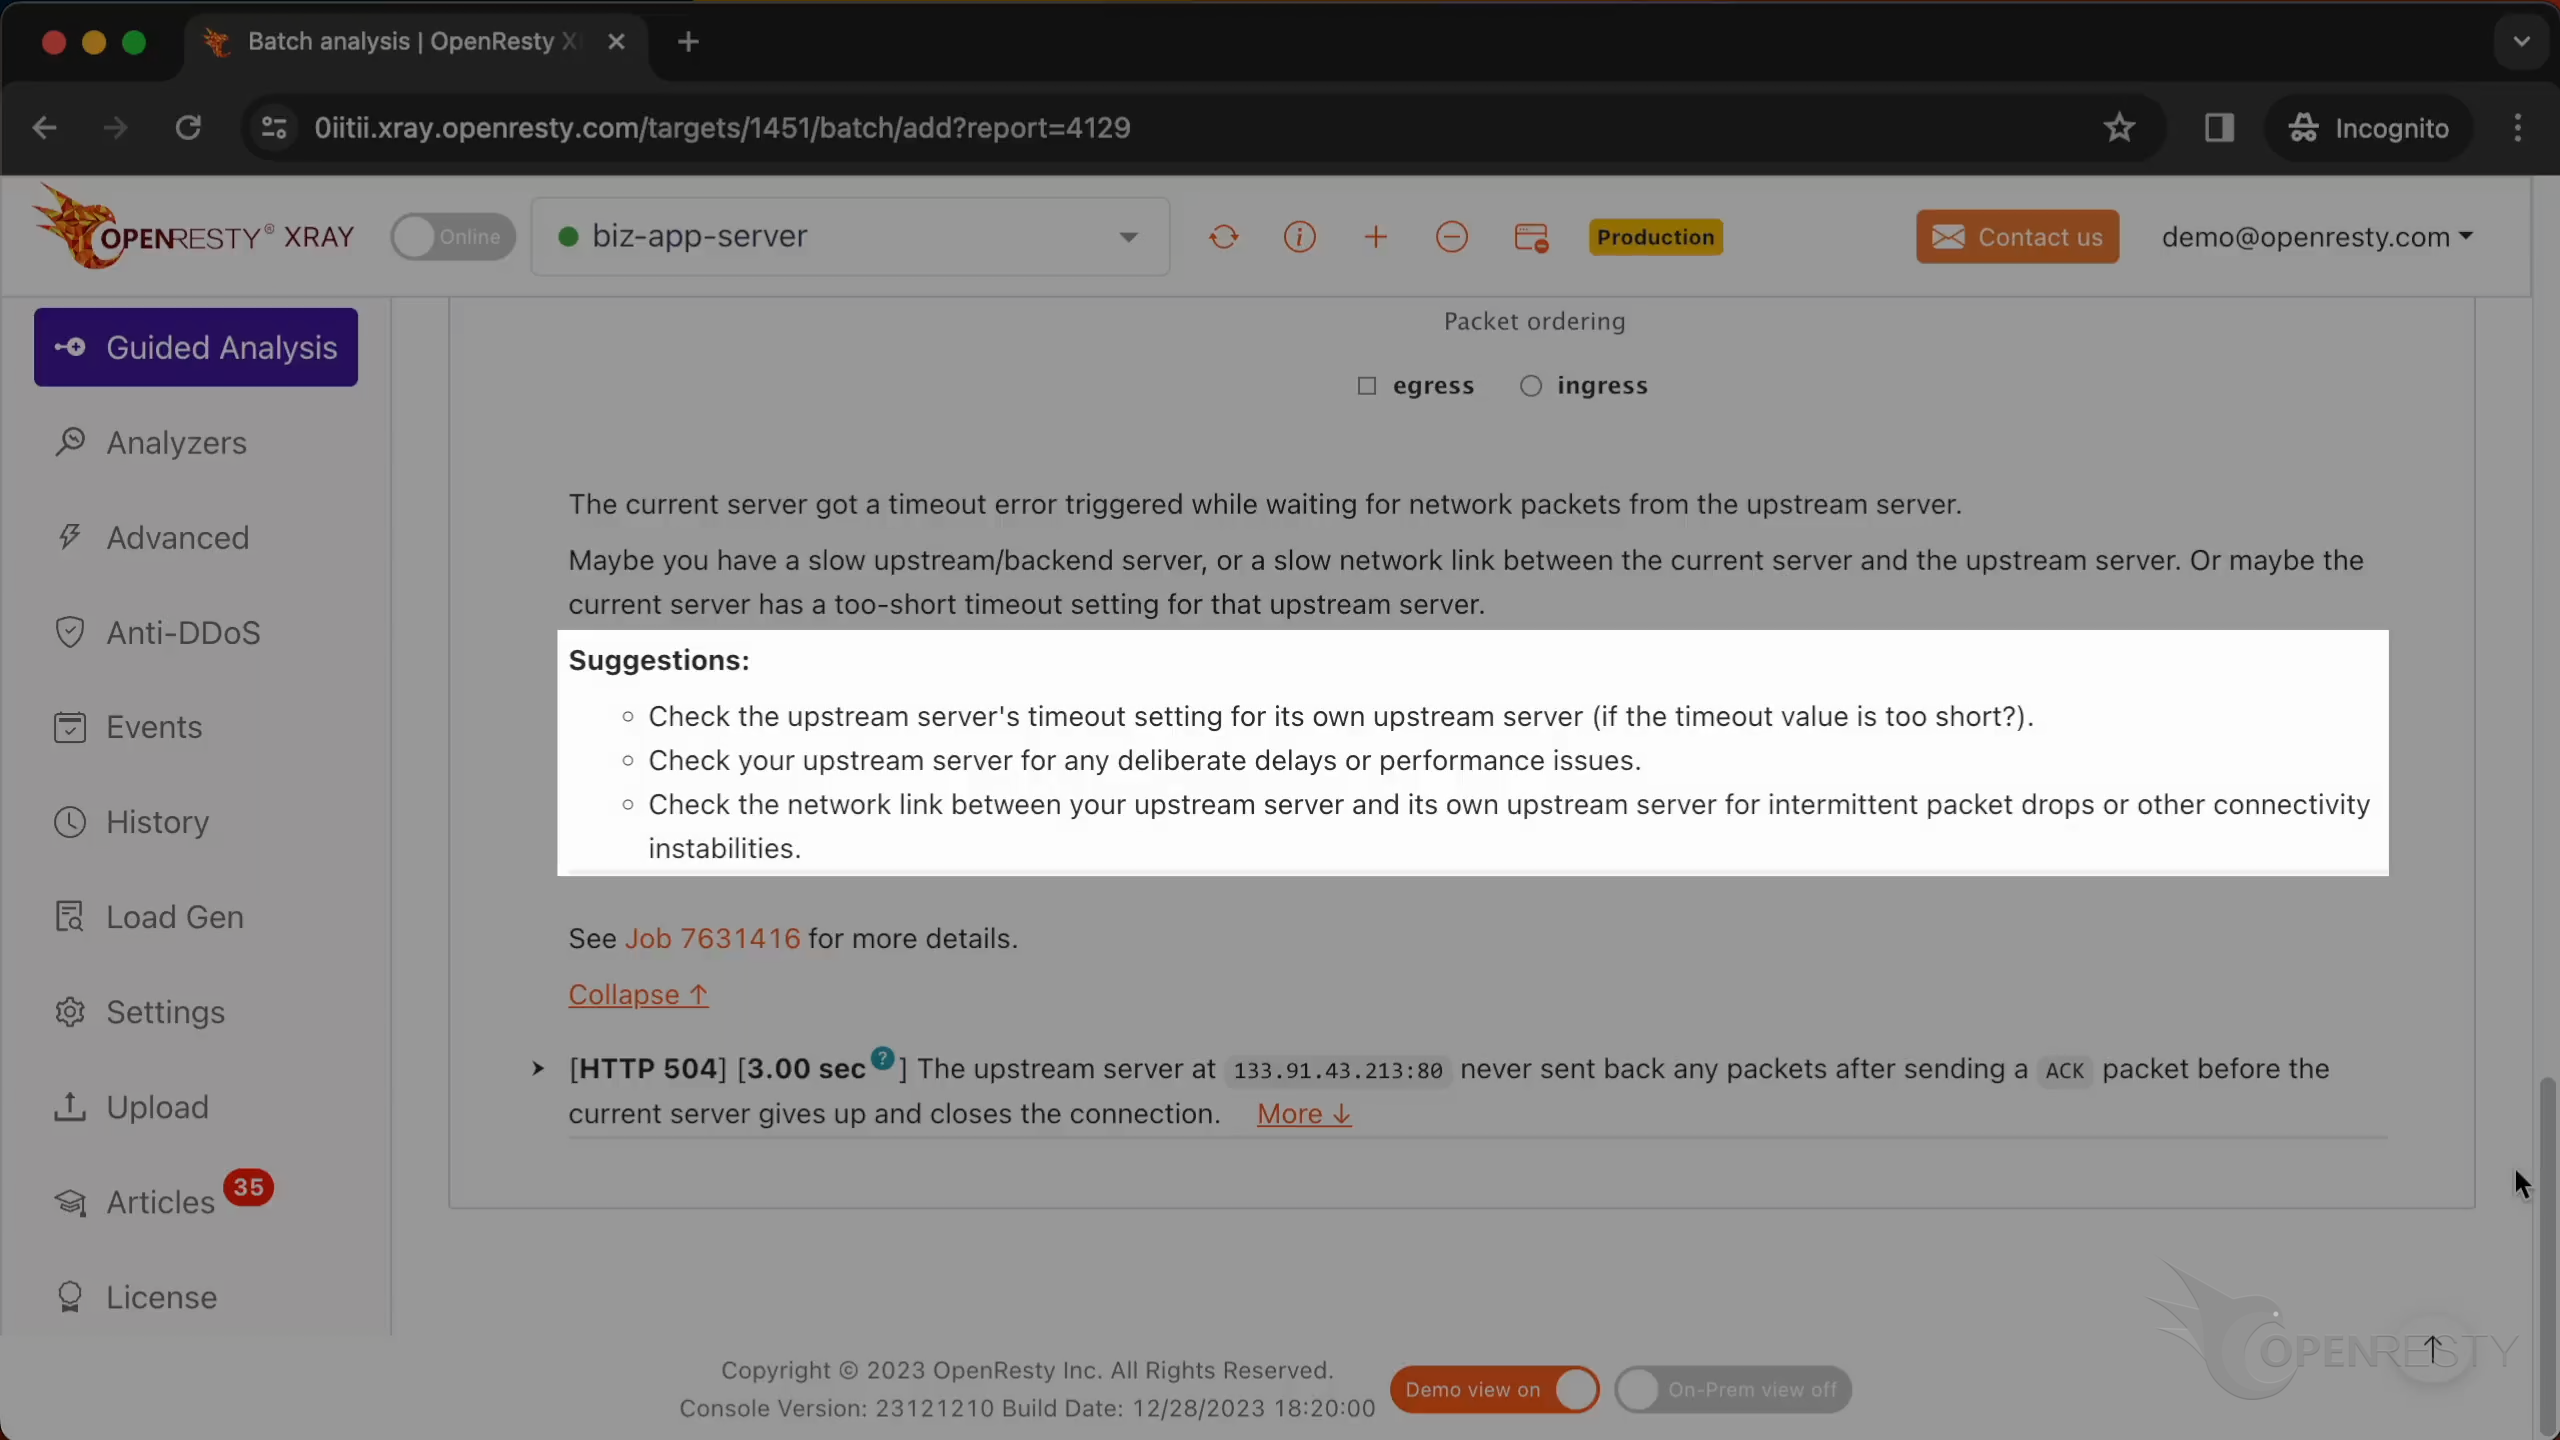
That spike is a circle, so it is a packet the current server was waiting to receive from the upstream. In other words, the current server did its part on time and then sat idle for three seconds waiting for the upstream to talk back. XRay states the conclusion and the three candidate root causes — a slow upstream server, a slow network link between the two, or a too-short timeout on the proxy — and, importantly, turns them into concrete things to check.
Case 2: The Delay Is on a Packet the Current Server Sent
The second 504 looks similar in the report but is the mirror image in the packet chart.
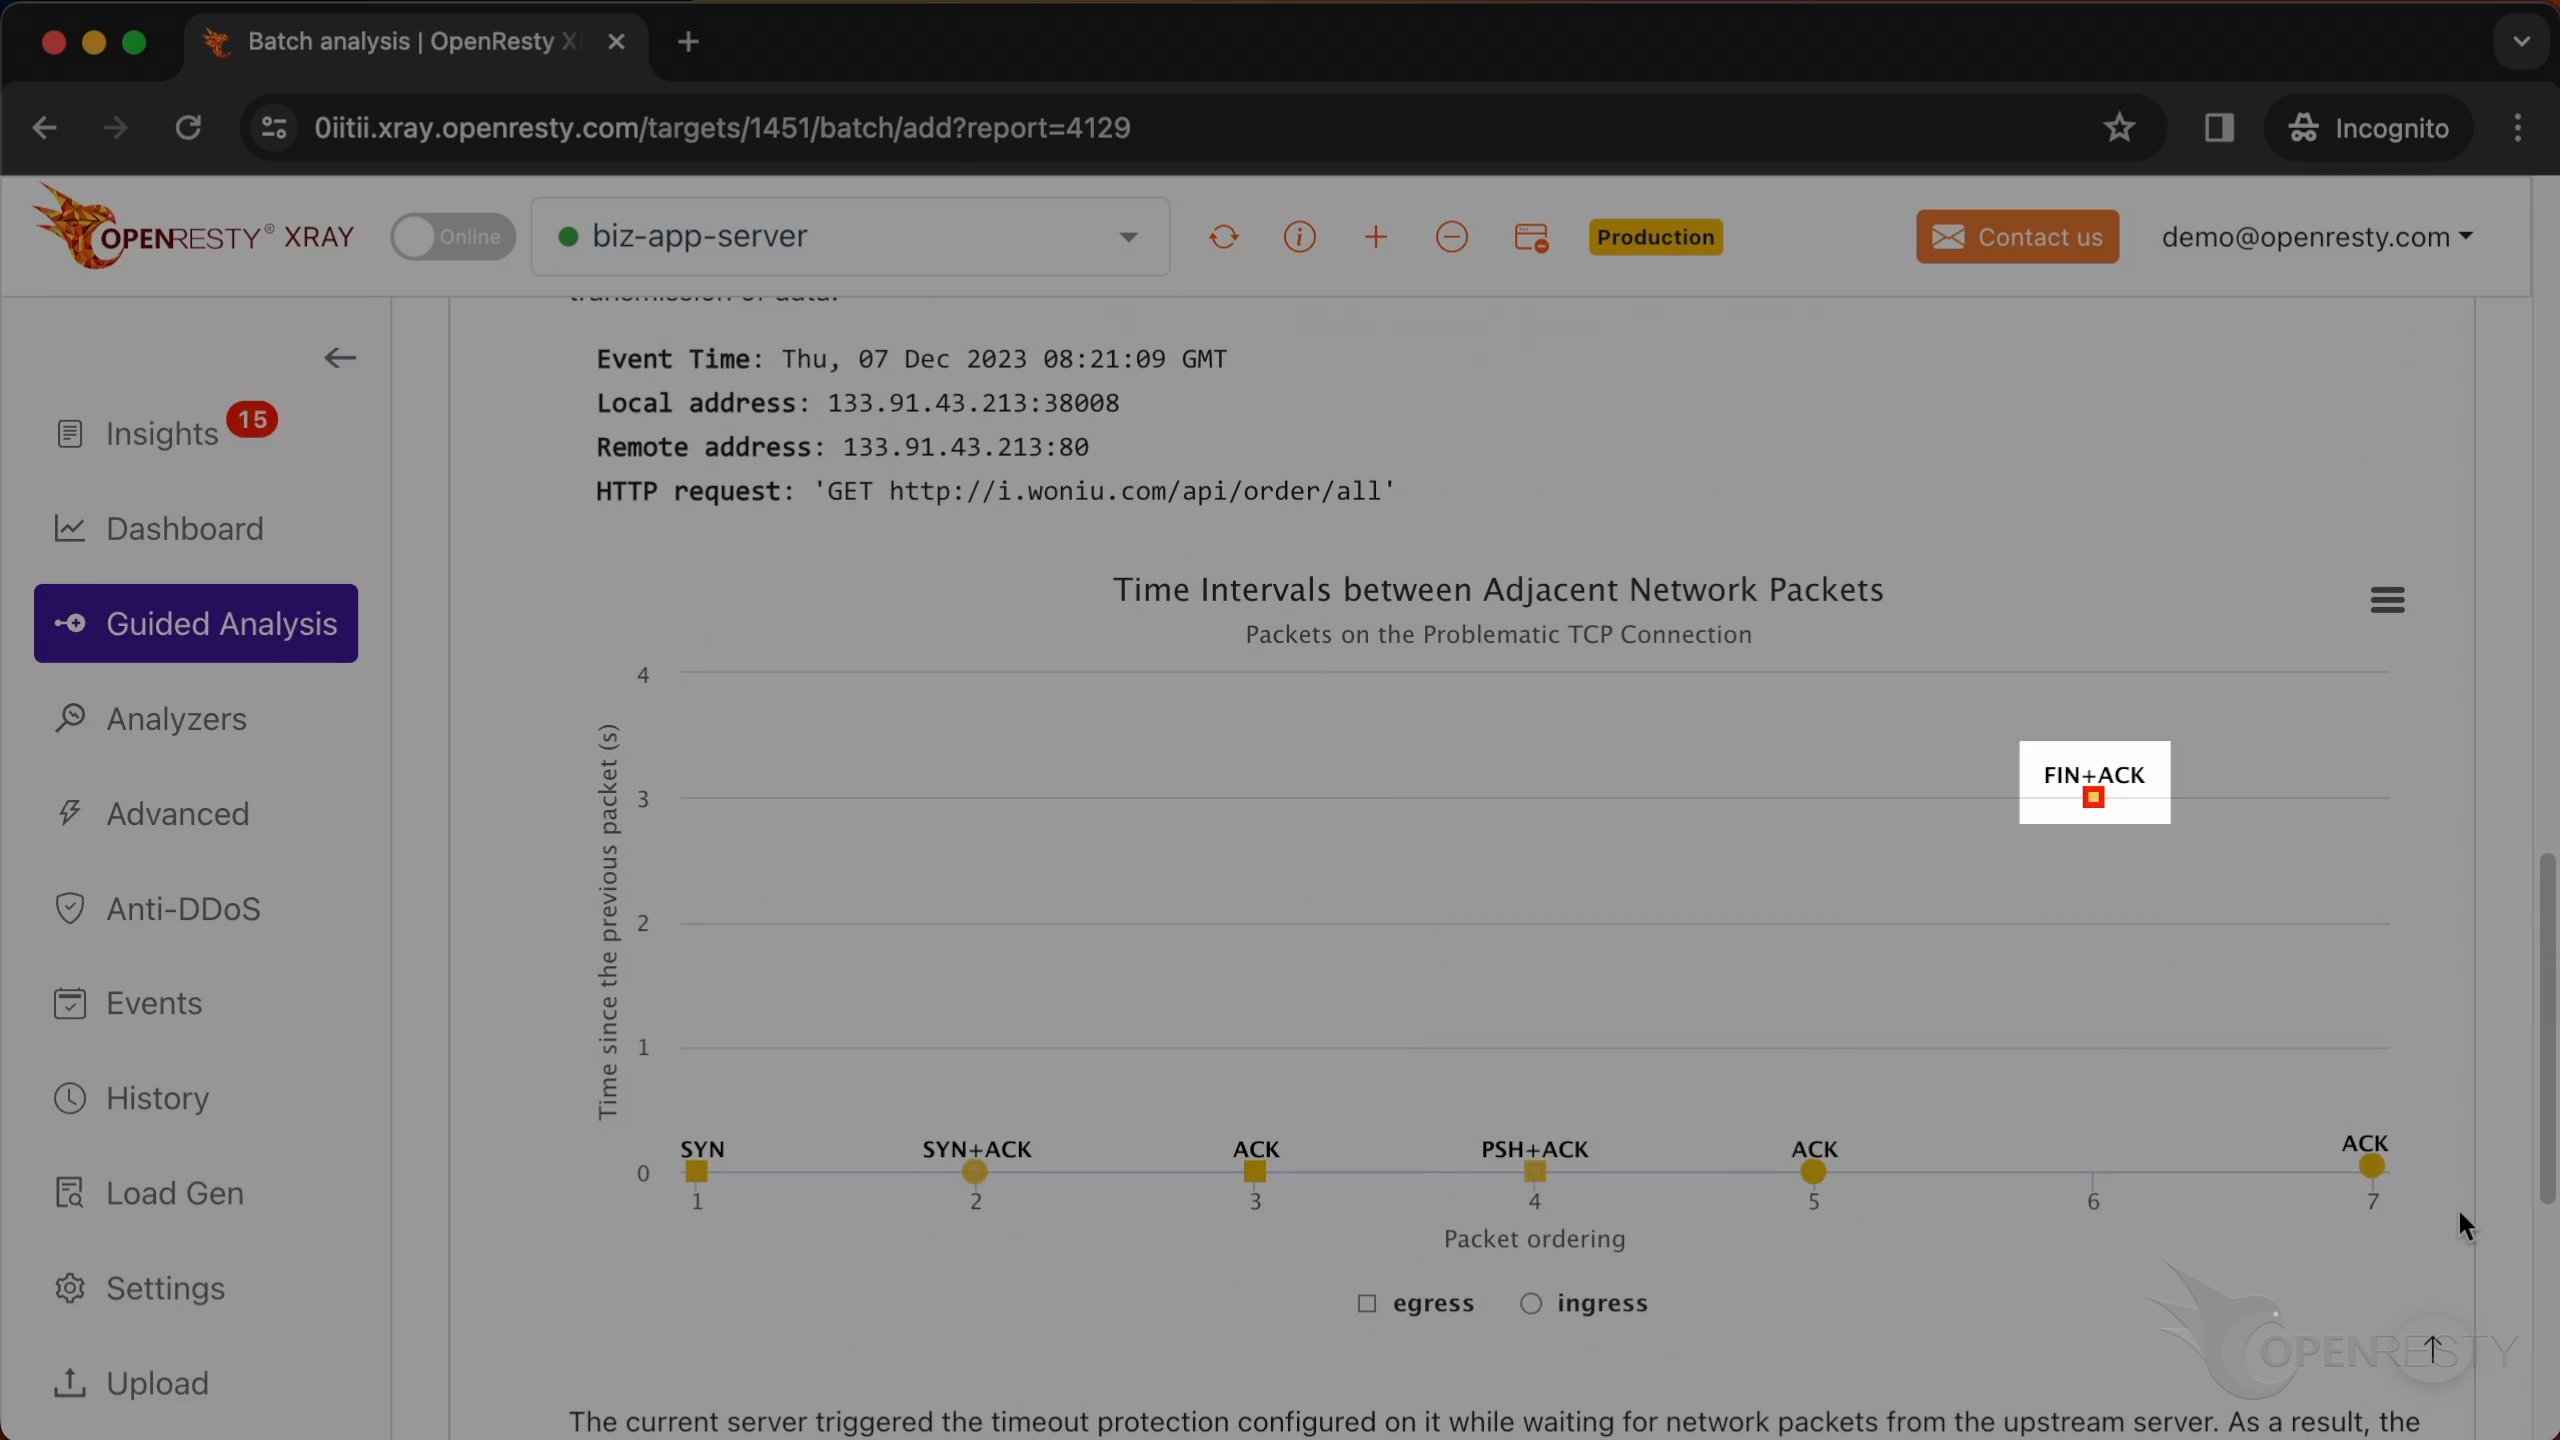
Here the slowest packet is a square, and it carries the FIN+ACK flags. A square means the current server sent it, and FIN+ACK means it closed the connection. So the story is different: the upstream sent nothing at all, the current server hit its own timeout protection, gave up waiting, and tore the connection down itself.
That is the whole diagnostic method in one sentence: for the same 504 status code, a slow received packet means you are still waiting on the upstream, while a slow sent FIN+ACK means your own timeout fired and closed the connection. Both point back to the same three root causes, but knowing which side stalled tells you where to look first.
By capturing only the packets in the TCP connection leading to the 504 errors on the application level, OpenResty XRay minimizes the performance impact. This makes it ideal for production environments that are sensitive to performance overhead and latency. This is our powerful Smart Packet Capture technology.
Once OpenResty XRay confirms that the upstream server is the slow party, the next question is why that upstream is slow. If the upstream is itself an OpenResty or Nginx service, dig into its request latency and off-CPU time to find the real bottleneck. If it is a Java or Tomcat backend, pinpoint the exact slow request with per-request packet capture.
Automatic Root-Cause Reports on the Insights Page
The Guided Analysis above is what you reach for during a live incident. For everyday monitoring, the Insights page runs the very same analysis automatically and publishes it as daily and weekly reports.
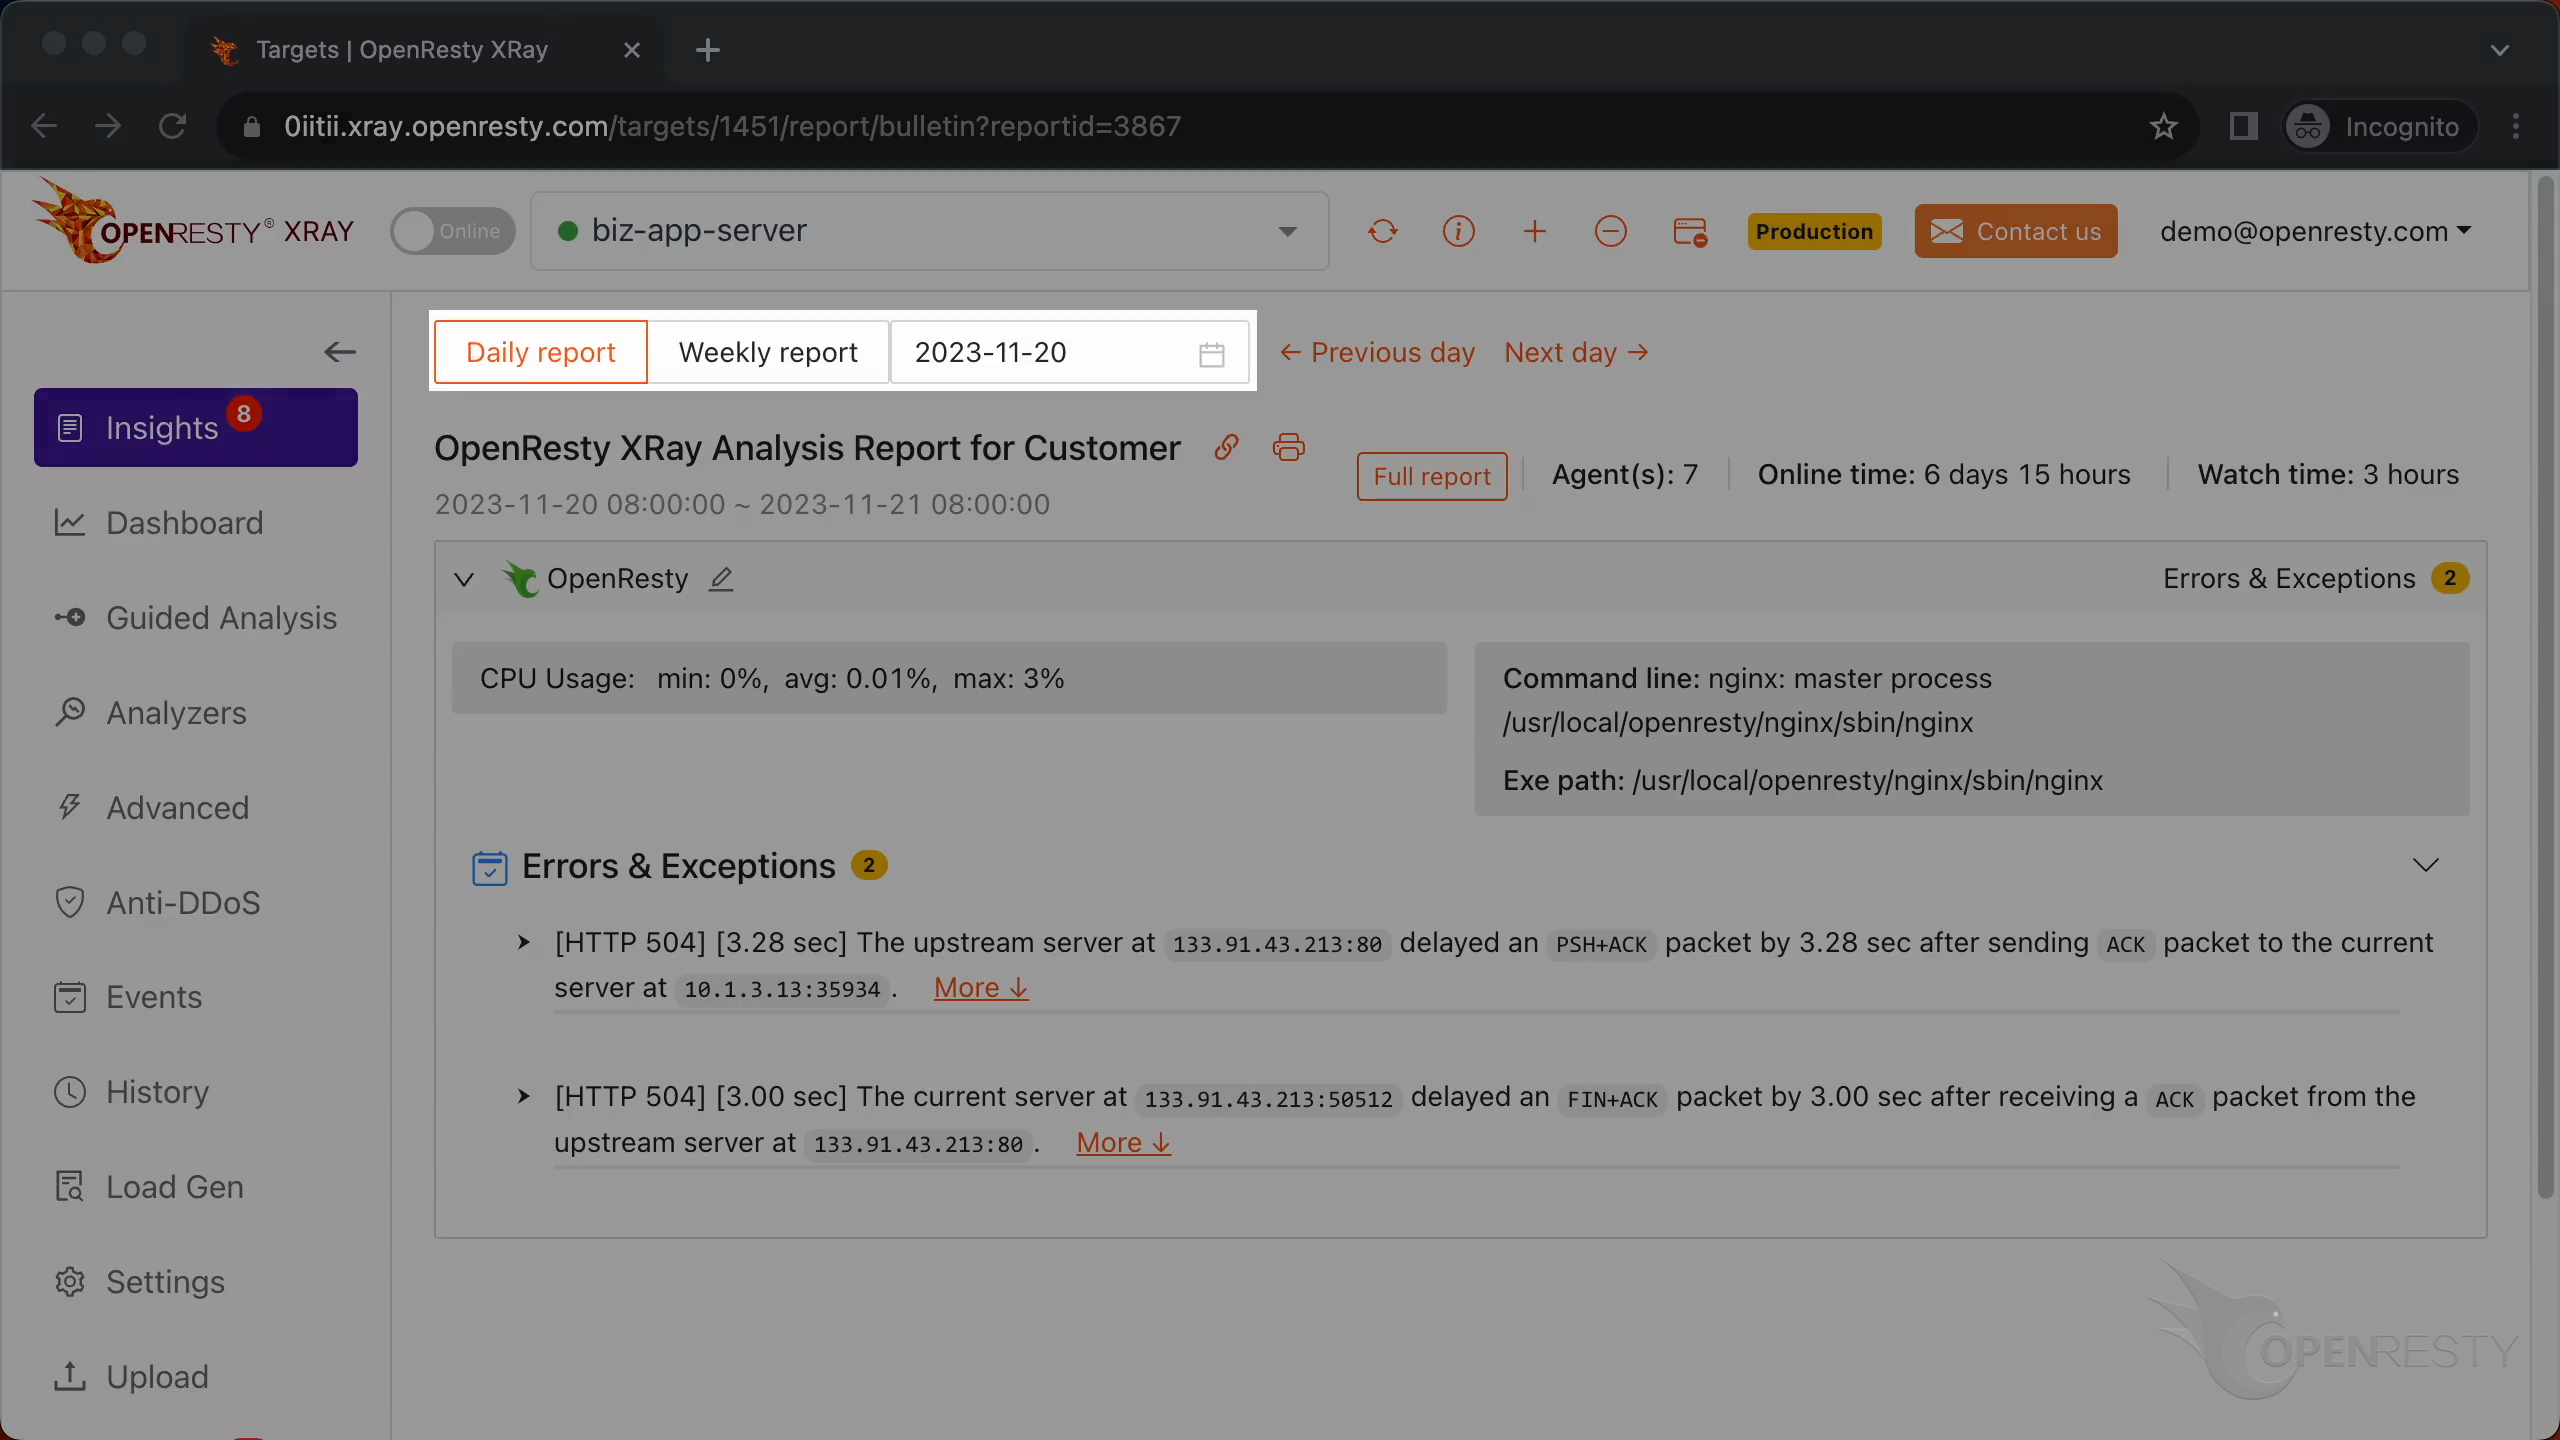
The same two 504 problems show up here on their own — you do not have to launch an analysis to see them. Guided Analysis stays useful for troubleshooting a problem as it happens or walking through a case in detail; Insights makes sure recurring issues like these never go unnoticed in the meantime.
Frequently Asked Questions
What causes a 504 gateway timeout in OpenResty or Nginx?
A 504 gateway timeout happens when your OpenResty or Nginx server, acting as a reverse proxy, does not receive a response from the upstream server in time. As this analysis shows, the root cause is almost always one of three things: a slow upstream server, a slow network link between the proxy and the upstream, or a too-short timeout setting on the proxy itself.
How do I find the root cause of a 504 gateway timeout?
The access log confirms that 504s are happening, but it cannot tell the three root causes apart — a slow upstream, a slow link, and a too-short timeout all produce an identical 504 line. To distinguish them you have to look inside the TCP connection: capture its packets and find the one with the largest delay. OpenResty XRay’s Guided Analysis does this automatically — it identifies the slowest packet, shows whether your server sent or received it, and concludes whether a slow upstream, a slow network link, or a too-short timeout setting caused the error.
Does capturing packets to diagnose 504 errors affect production performance?
OpenResty XRay uses Smart Packet Capture, which records only the packets in the TCP connections that lead to 504 errors, at the application level. Because it does not capture all traffic, the performance overhead stays minimal, making it safe to run in latency-sensitive production environments.
How do I fix a 504 gateway timeout once I know the cause?
It depends on which root cause the analysis points to. If the upstream server is slow, speed up or scale the backend. If the network link is slow, investigate the connection between the two servers. If the proxy’s timeout is simply too short for a legitimately long request, increase the upstream timeout setting. OpenResty XRay also provides detailed suggestions with each report.
What is OpenResty XRay
OpenResty XRay is a dynamic-tracing product that automatically analyzes your running applications to troubleshoot performance problems, behavioral issues, and security vulnerabilities with actionable suggestions. Under the hood, OpenResty XRay is powered by our Y language targeting various runtimes like Stap+, eBPF+, GDB, and ODB, depending on the contexts.
If you like this tutorial, please subscribe to this blog site and/or our YouTube channel. Thank you!
About The Author
Yichun Zhang (Github handle: agentzh), is the original creator of the OpenResty® open-source project and the CEO of OpenResty Inc..
Yichun is one of the earliest advocates and leaders of “open-source technology”. He worked at many internationally renowned tech companies, such as Cloudflare, Yahoo!. He is a pioneer of “edge computing”, “dynamic tracing” and “machine coding”, with over 22 years of programming and 16 years of open source experience. Yichun is well-known in the open-source space as the project leader of OpenResty®, adopted by more than 40 million global website domains.
OpenResty Inc., the enterprise software start-up founded by Yichun in 2017, has customers from some of the biggest companies in the world. Its flagship product, OpenResty XRay, is a non-invasive profiling and troubleshooting tool that significantly enhances and utilizes dynamic tracing technology. And its OpenResty Edge product is a powerful distributed traffic management and private CDN software product.
As an avid open-source contributor, Yichun has contributed more than a million lines of code to numerous open-source projects, including Linux kernel, Nginx, LuaJIT, GDB, SystemTap, LLVM, Perl, etc. He has also authored more than 60 open-source software libraries.
Related Articles
OpenResty XRay Dec 25, 2023

OpenResty XRay Dec 25, 2023

OpenResty XRay Dec 15, 2023

OpenResty XRay Dec 7, 2023

OpenResty XRay Dec 5, 2023