Automatic Core Dump Analysis (using OpenResty XRay)
This tutorial demonstrates how OpenResty XRay does automatic in-depth analysis of a core dump file for a crashed OpenResty/Nginx application. OpenResty XRay gives you a comprehensive report with C backtraces, Lua backtraces, Lua GC object reference graph analysis, Lua coroutine analysis, concurrent HTTP request analysis, and libc allocator analysis. It guides you to the root causes of the core dump files online in no time. We will see most of the fancy dynamic tracing analyzers and flame graphs can also be transparently applied to dead process corpses like core dump files.
Check the core dump file
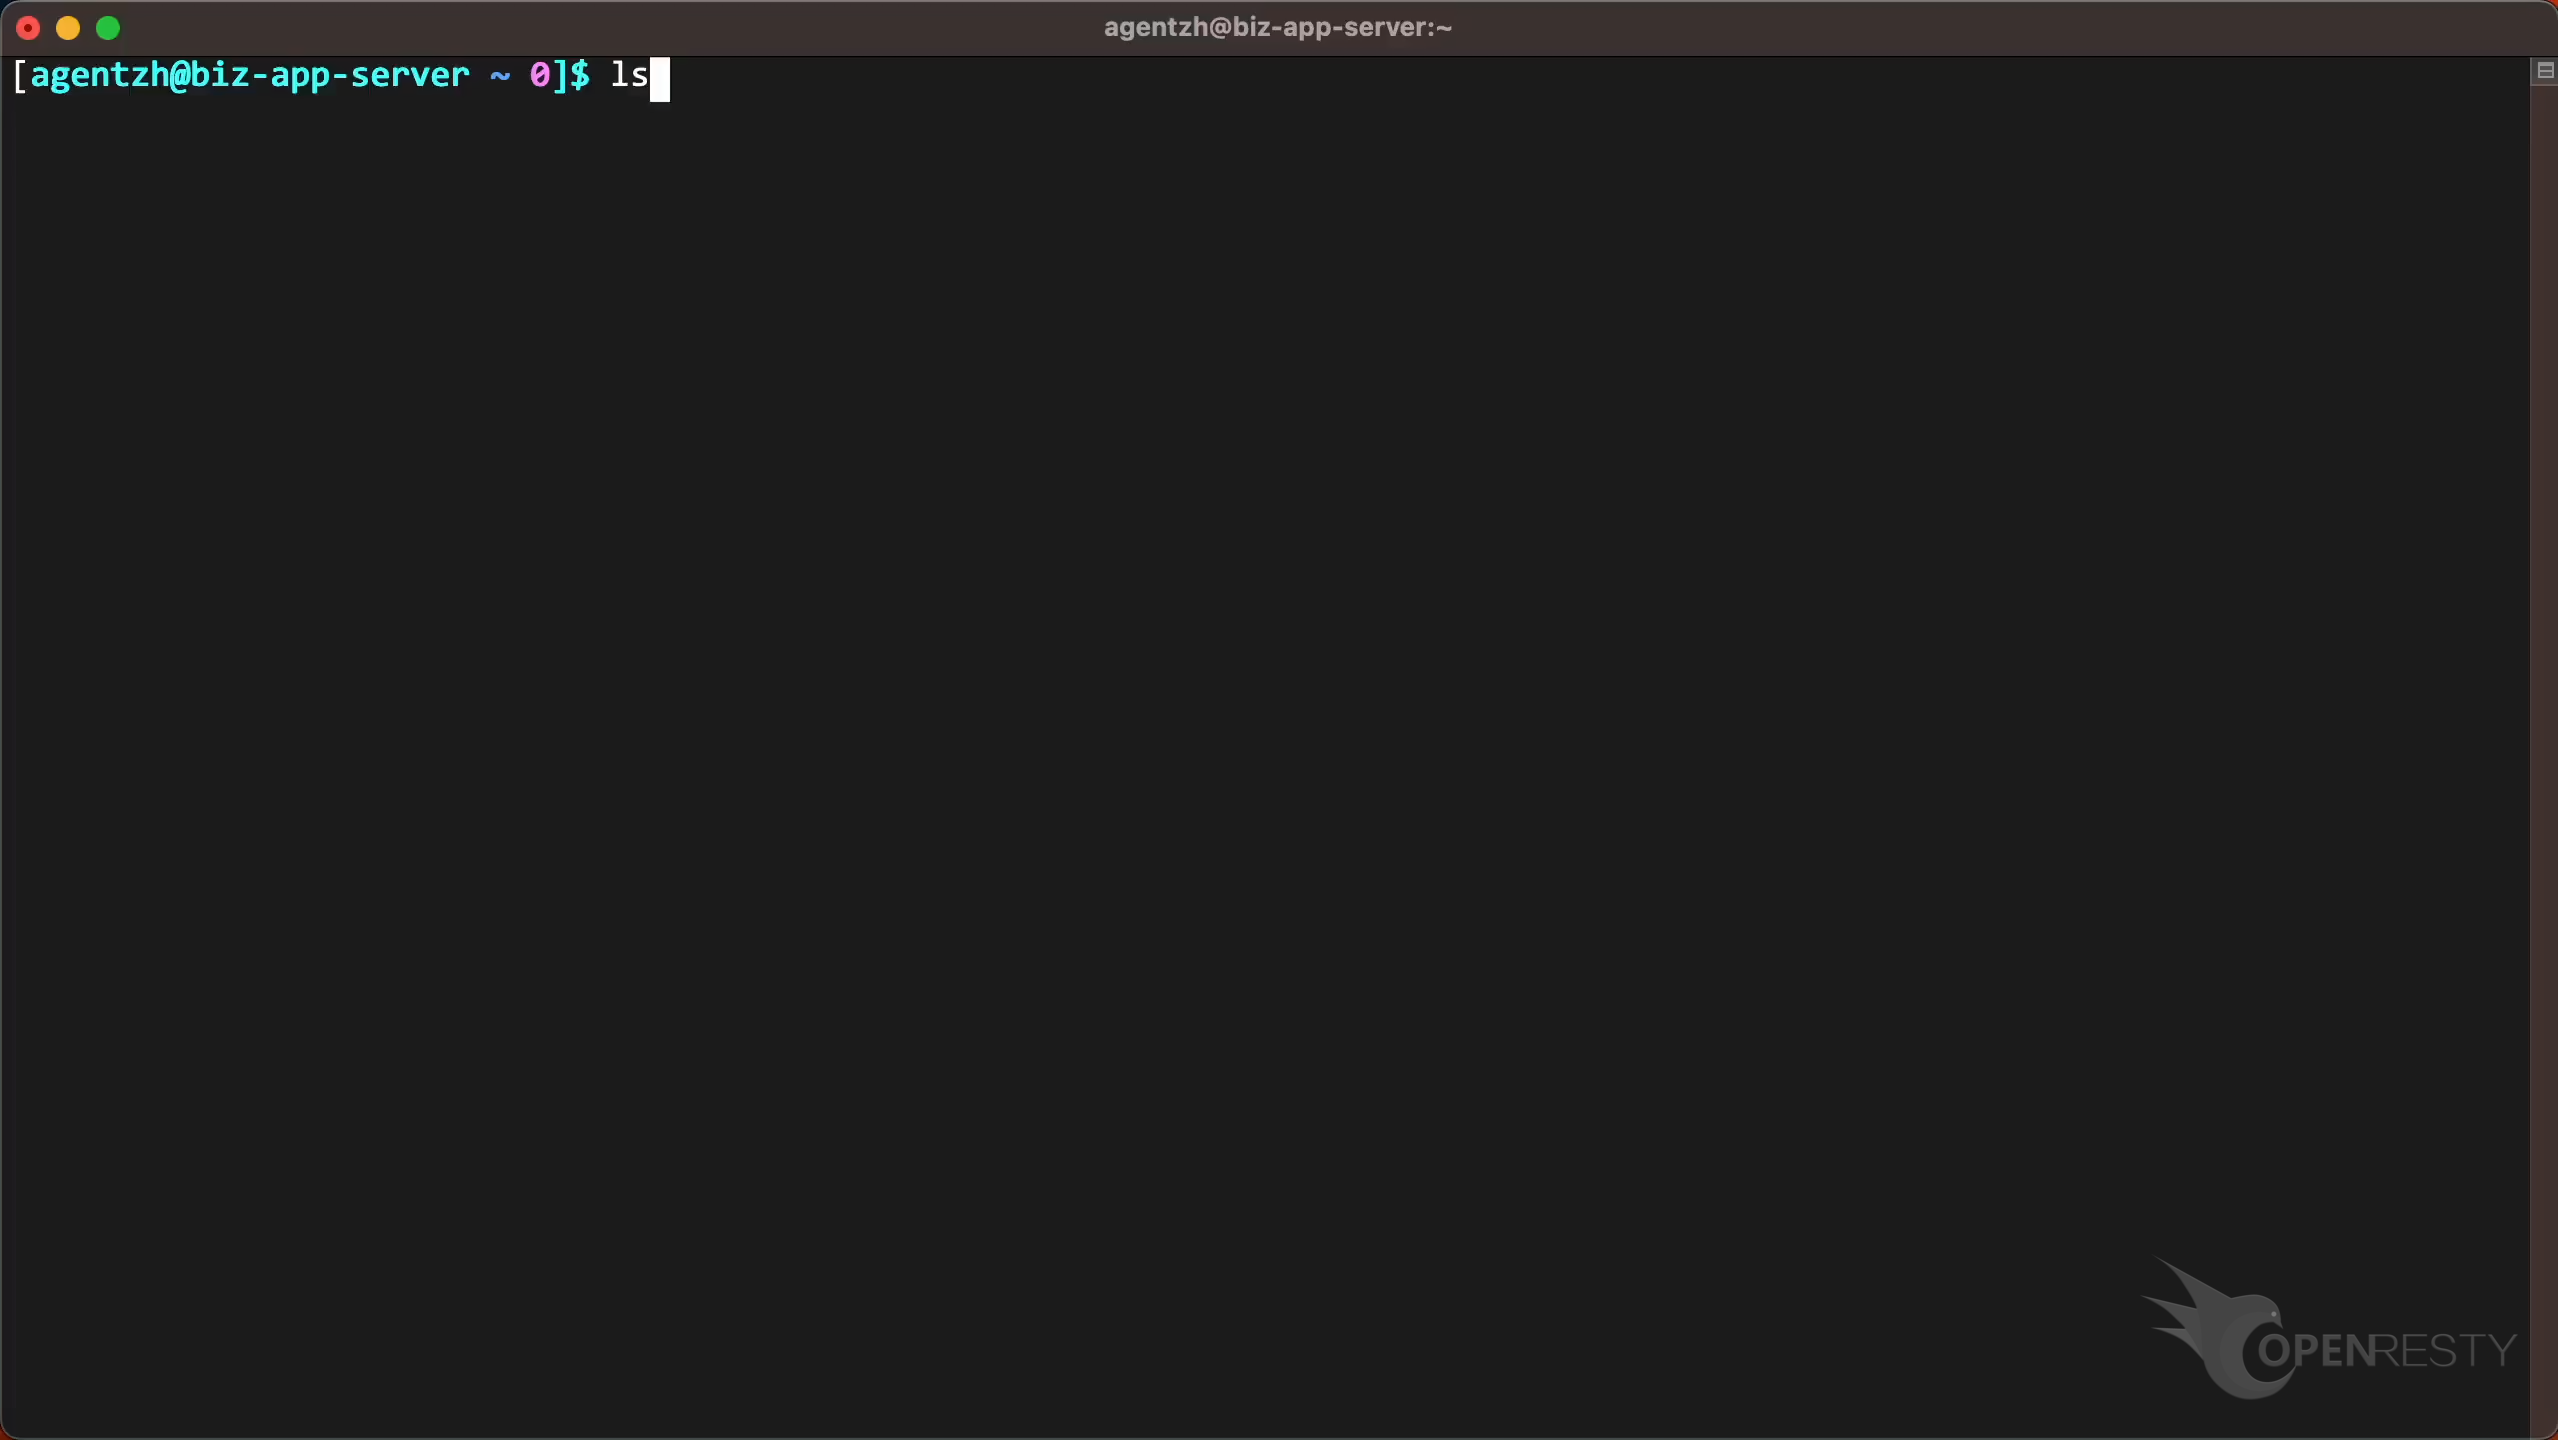
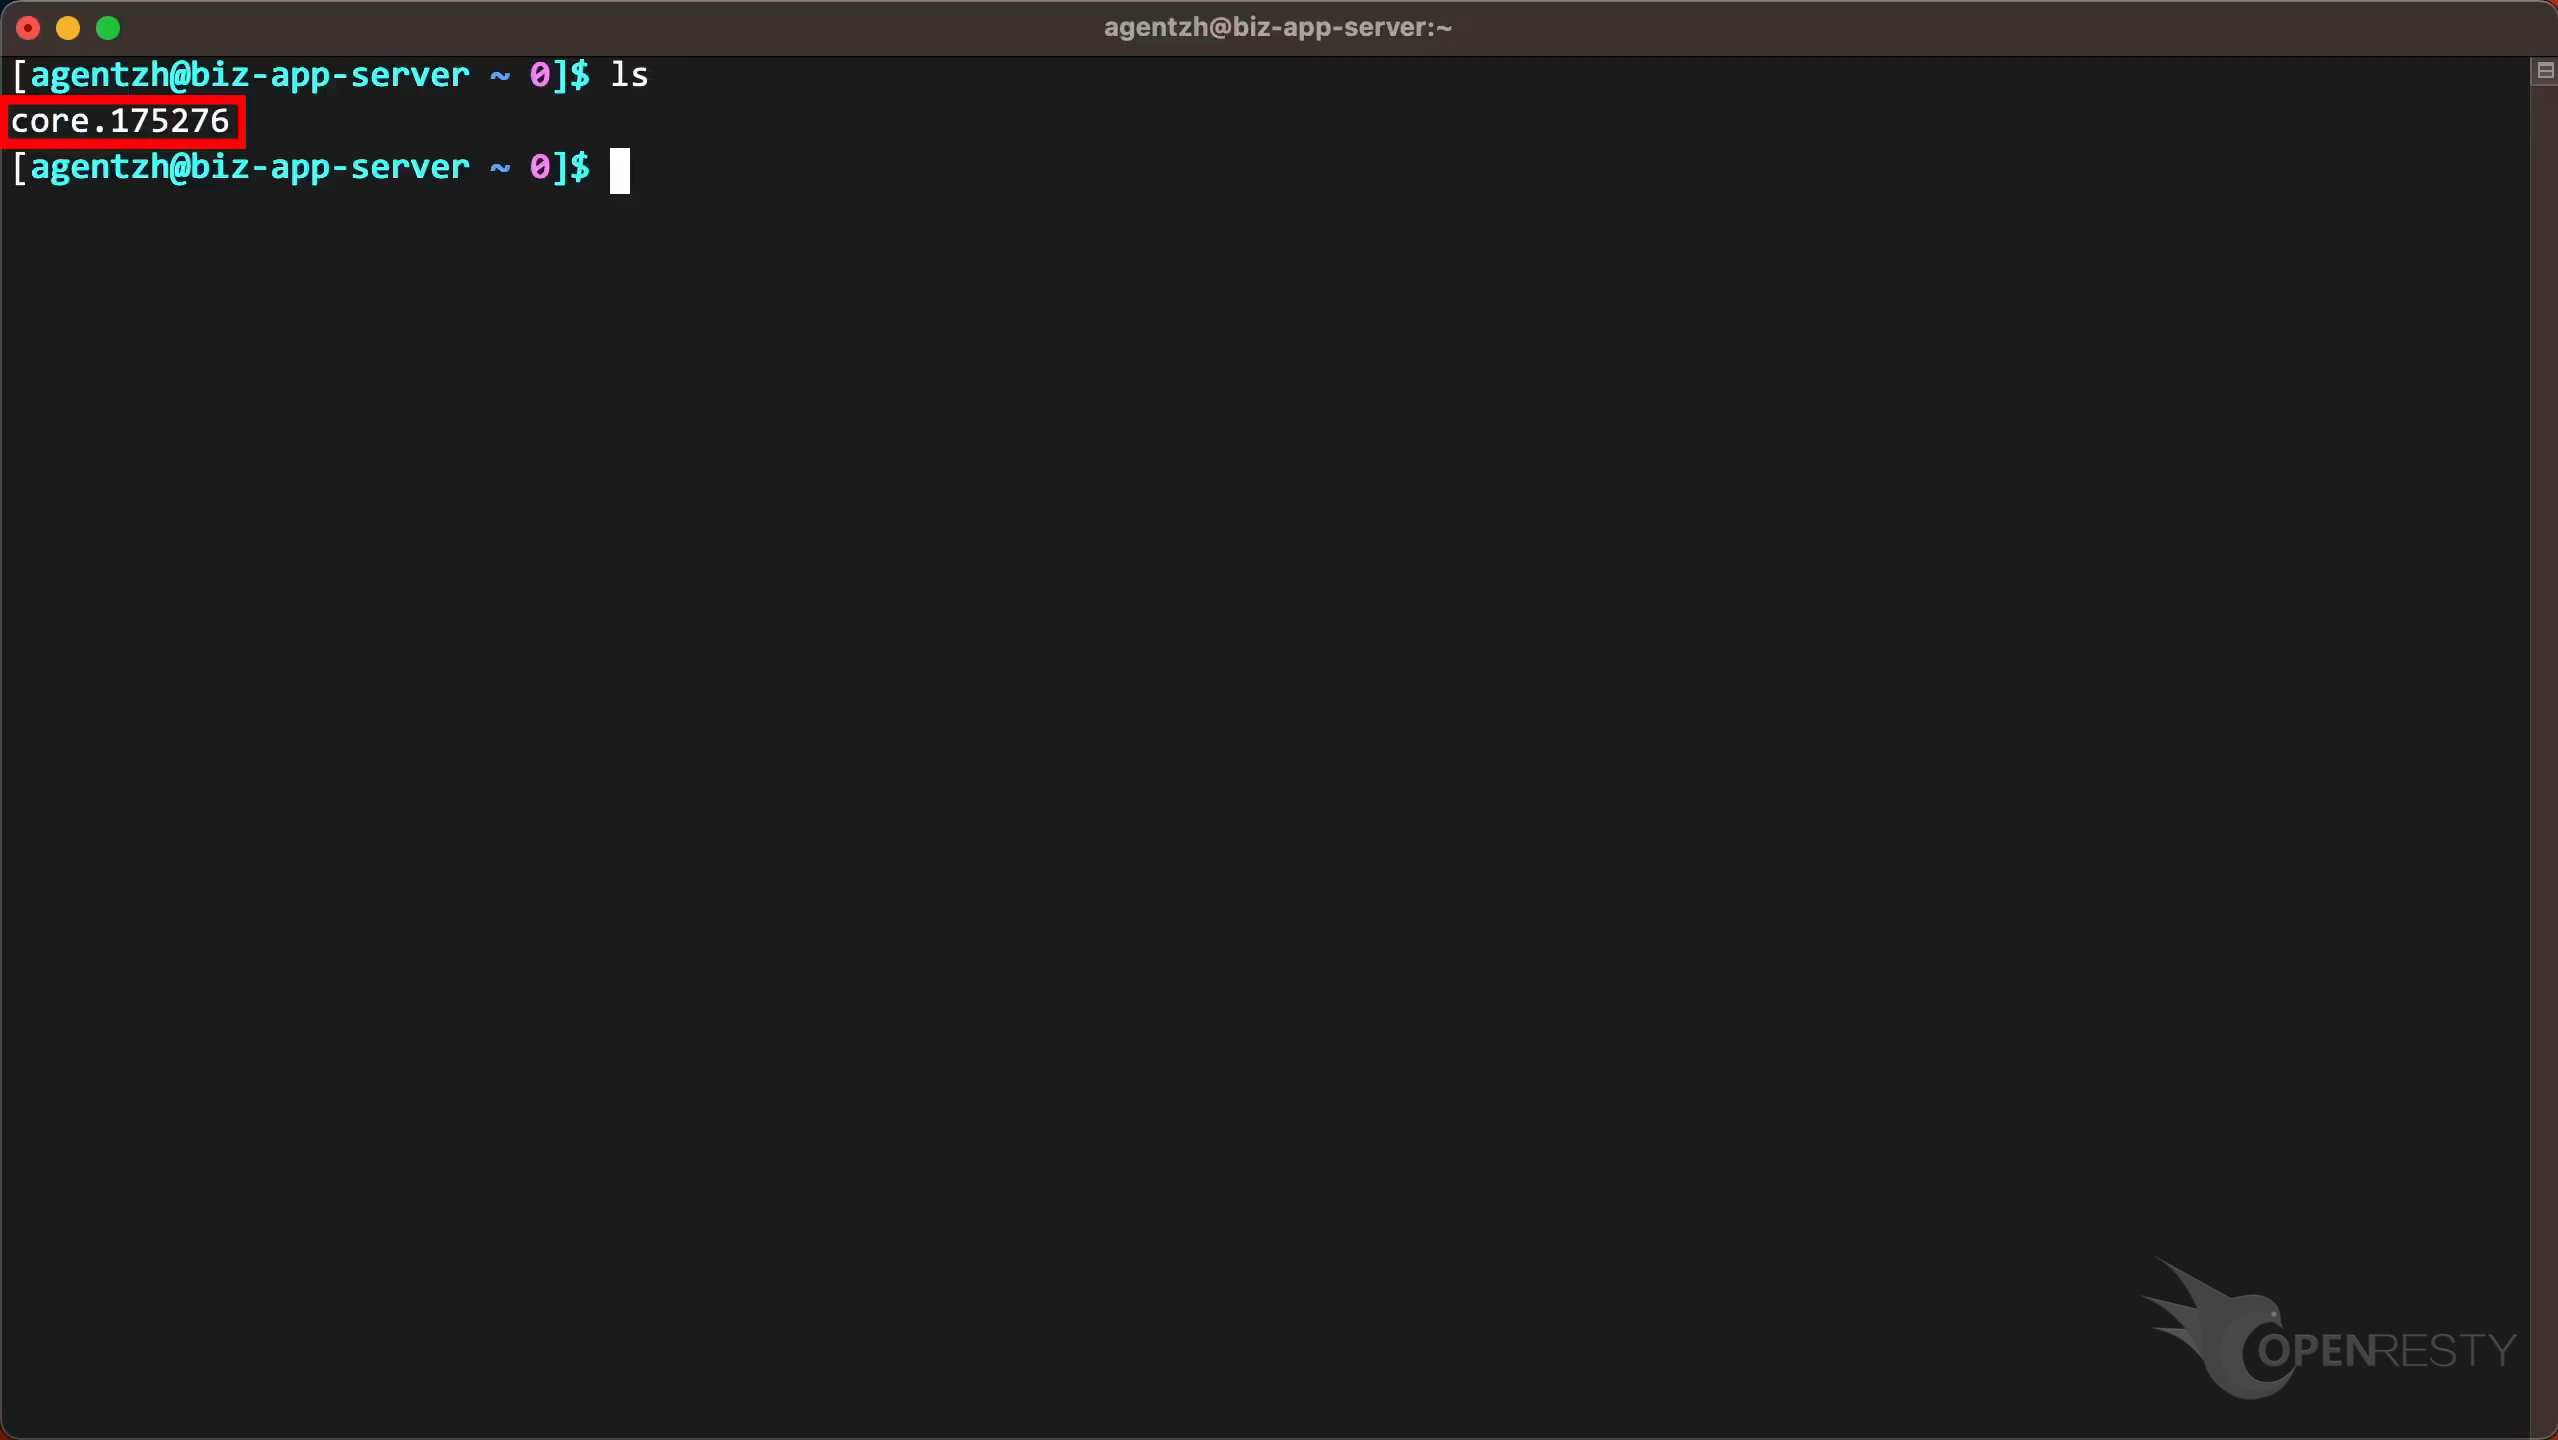
Run the ls command to list all files under the current directory.
We can see a new core dump file here. While core files can be stored in various directories, our application is pre-configured to save them here for convenience.
Run the readlink command to view the absolute path of the file.
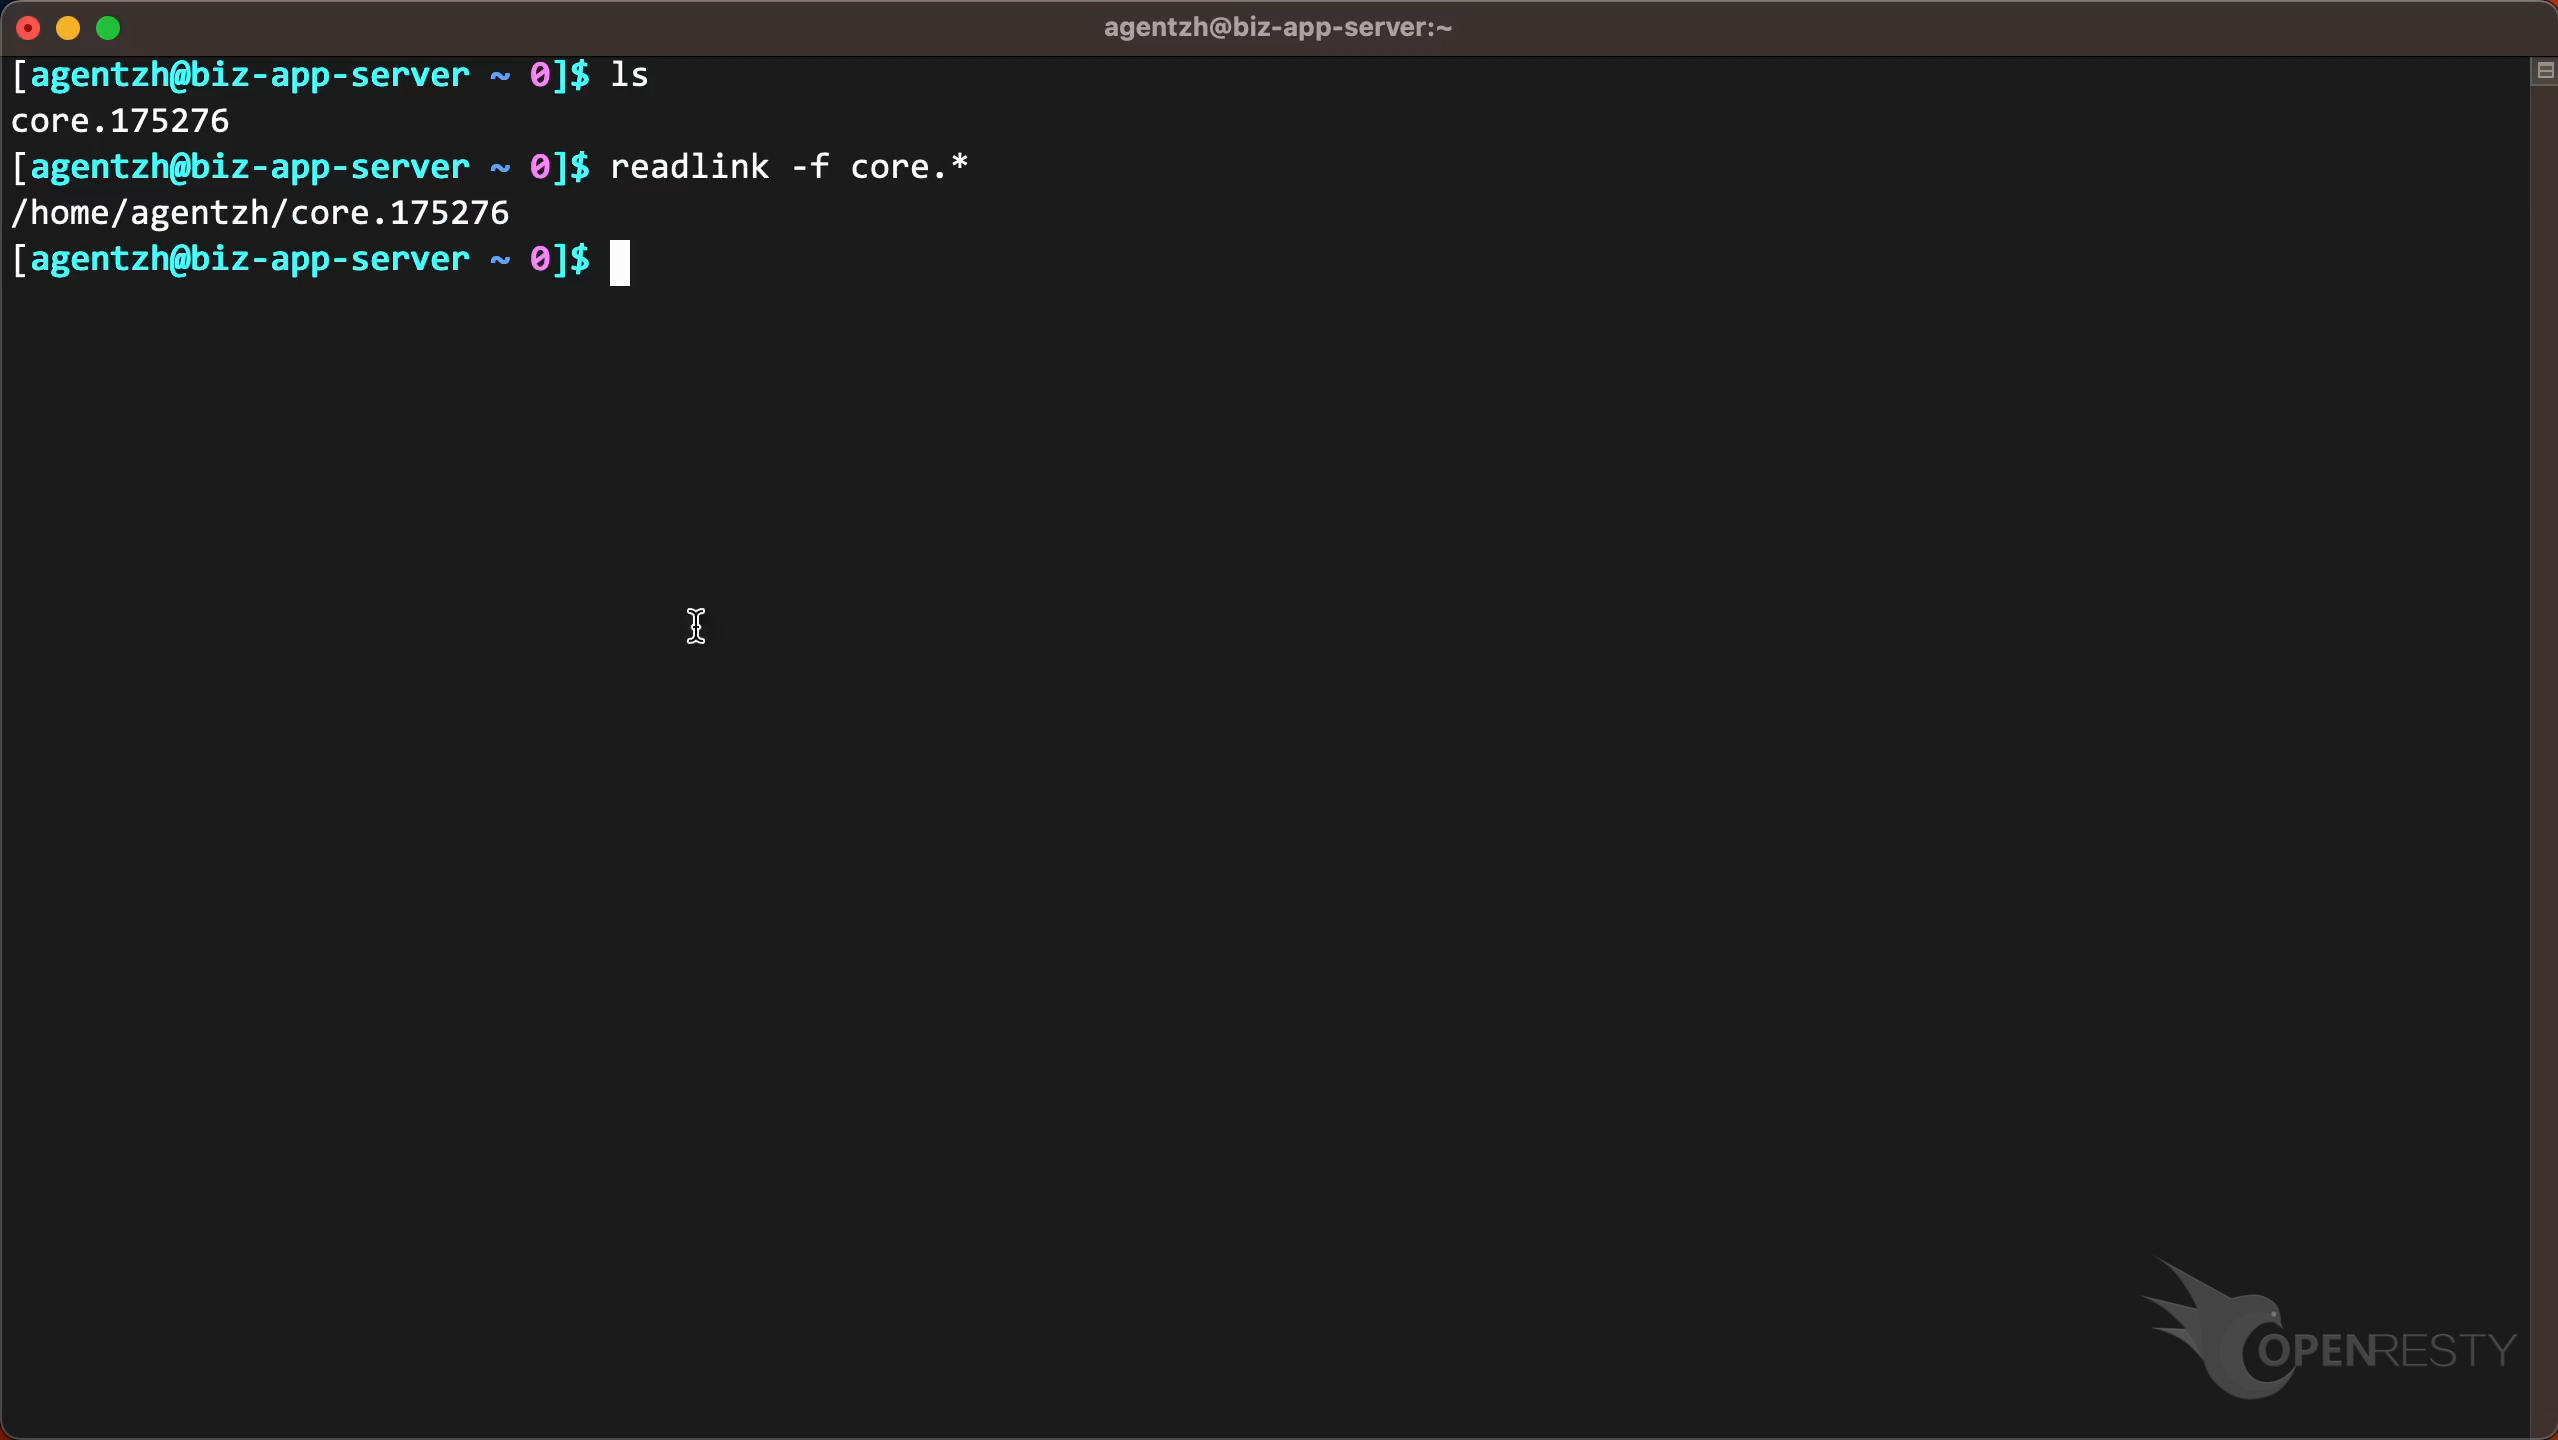
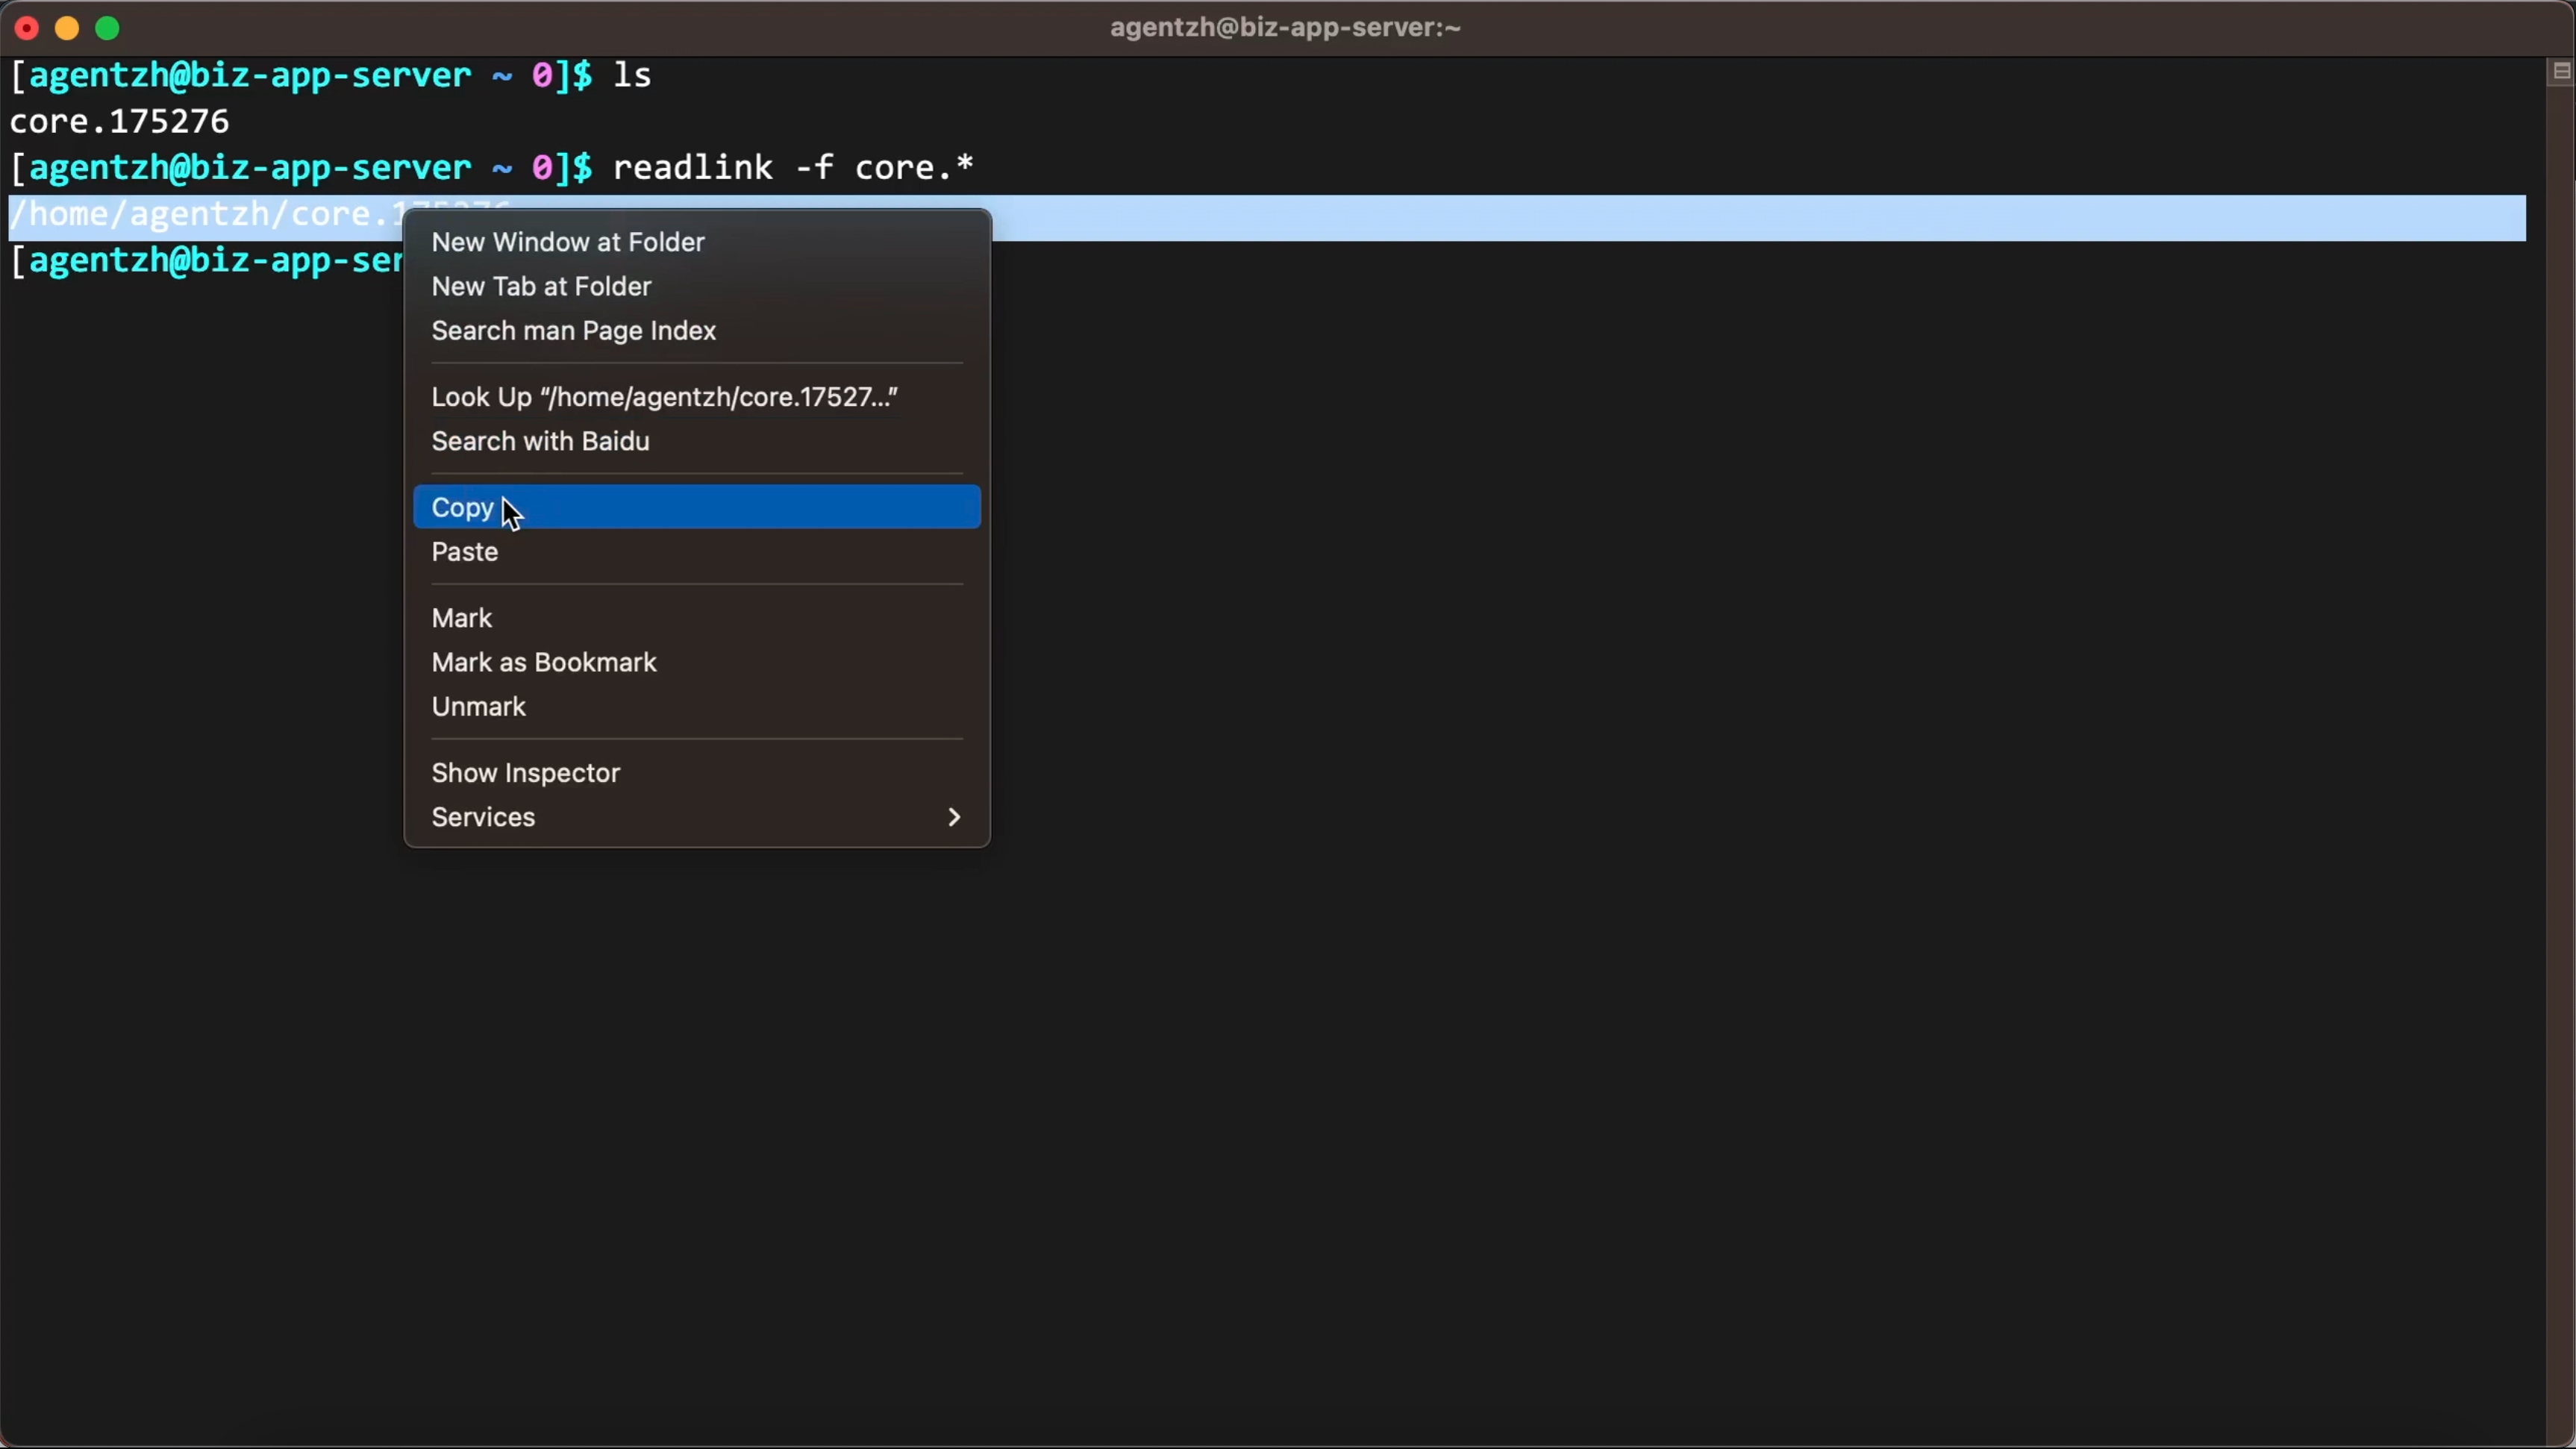
Let’s use OpenResty XRay to perform a real-time analysis of this core file to find out the cause of the process crash and the context information. Copy the path of this core file.
Use the guided analysis feature of OpenResty XRay to analyze the core file
Open the OpenResty XRay web console in the web browser.
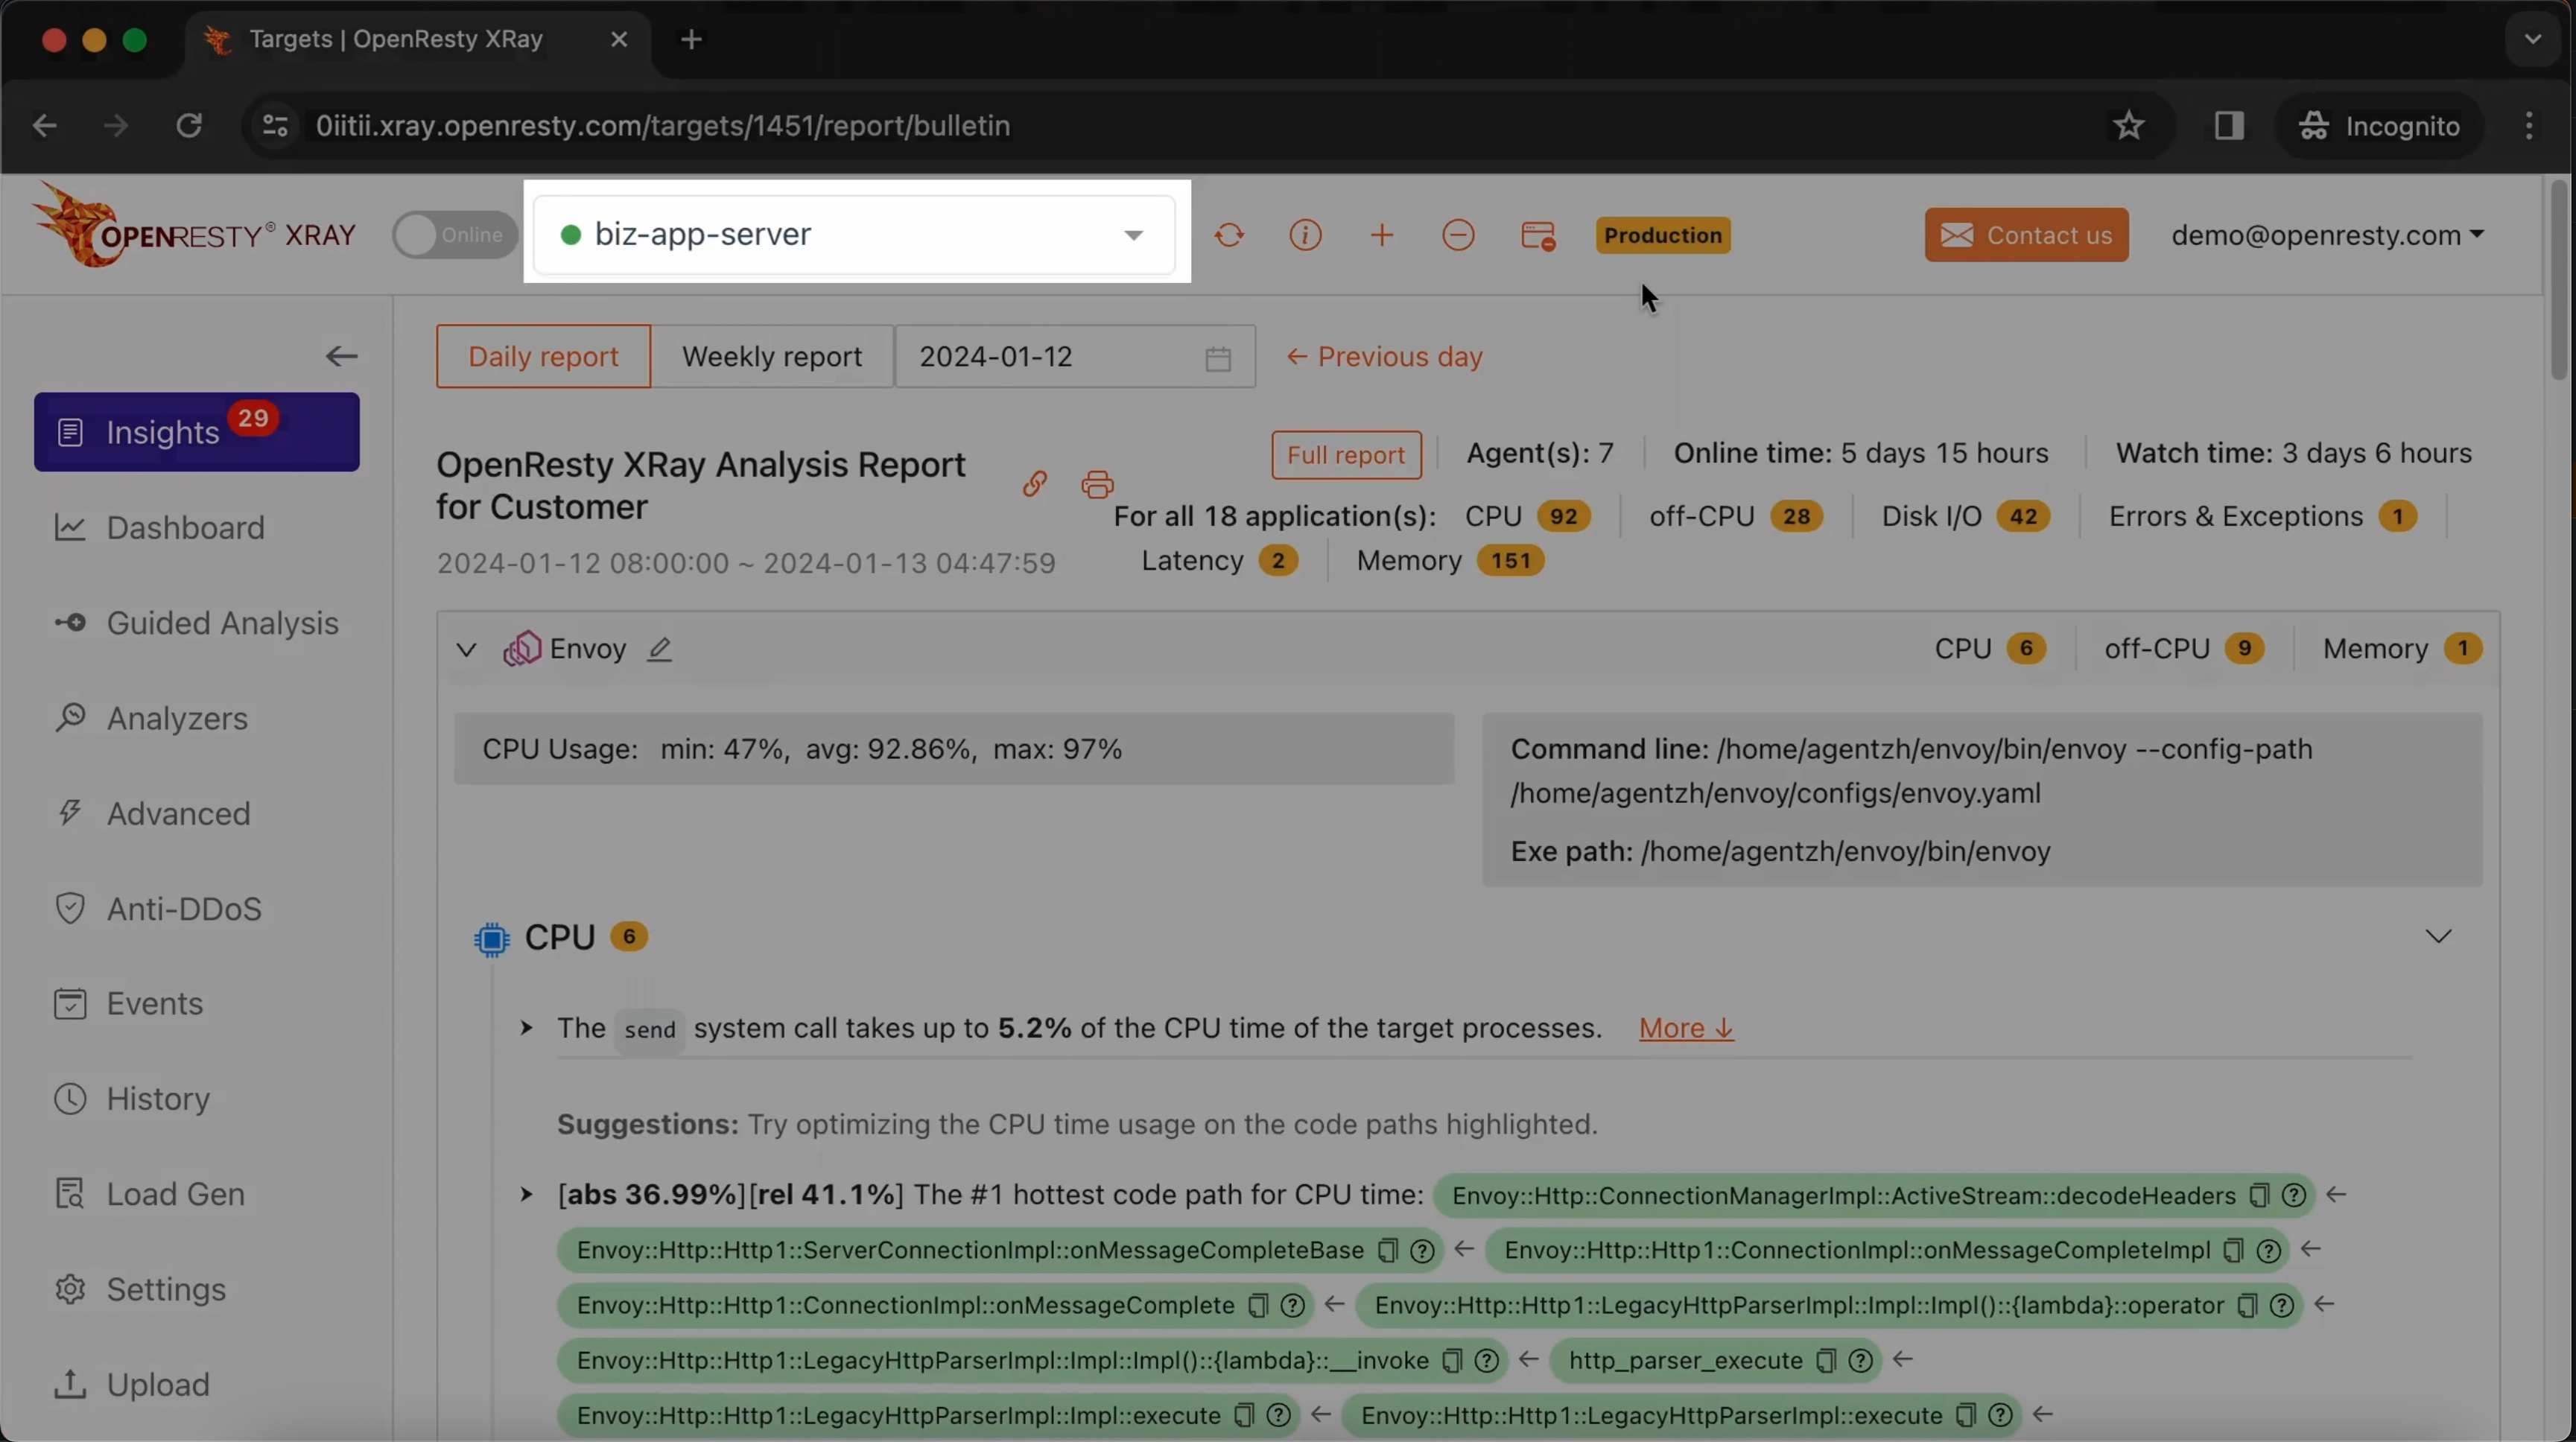
Make sure it is the right machine you are watching.
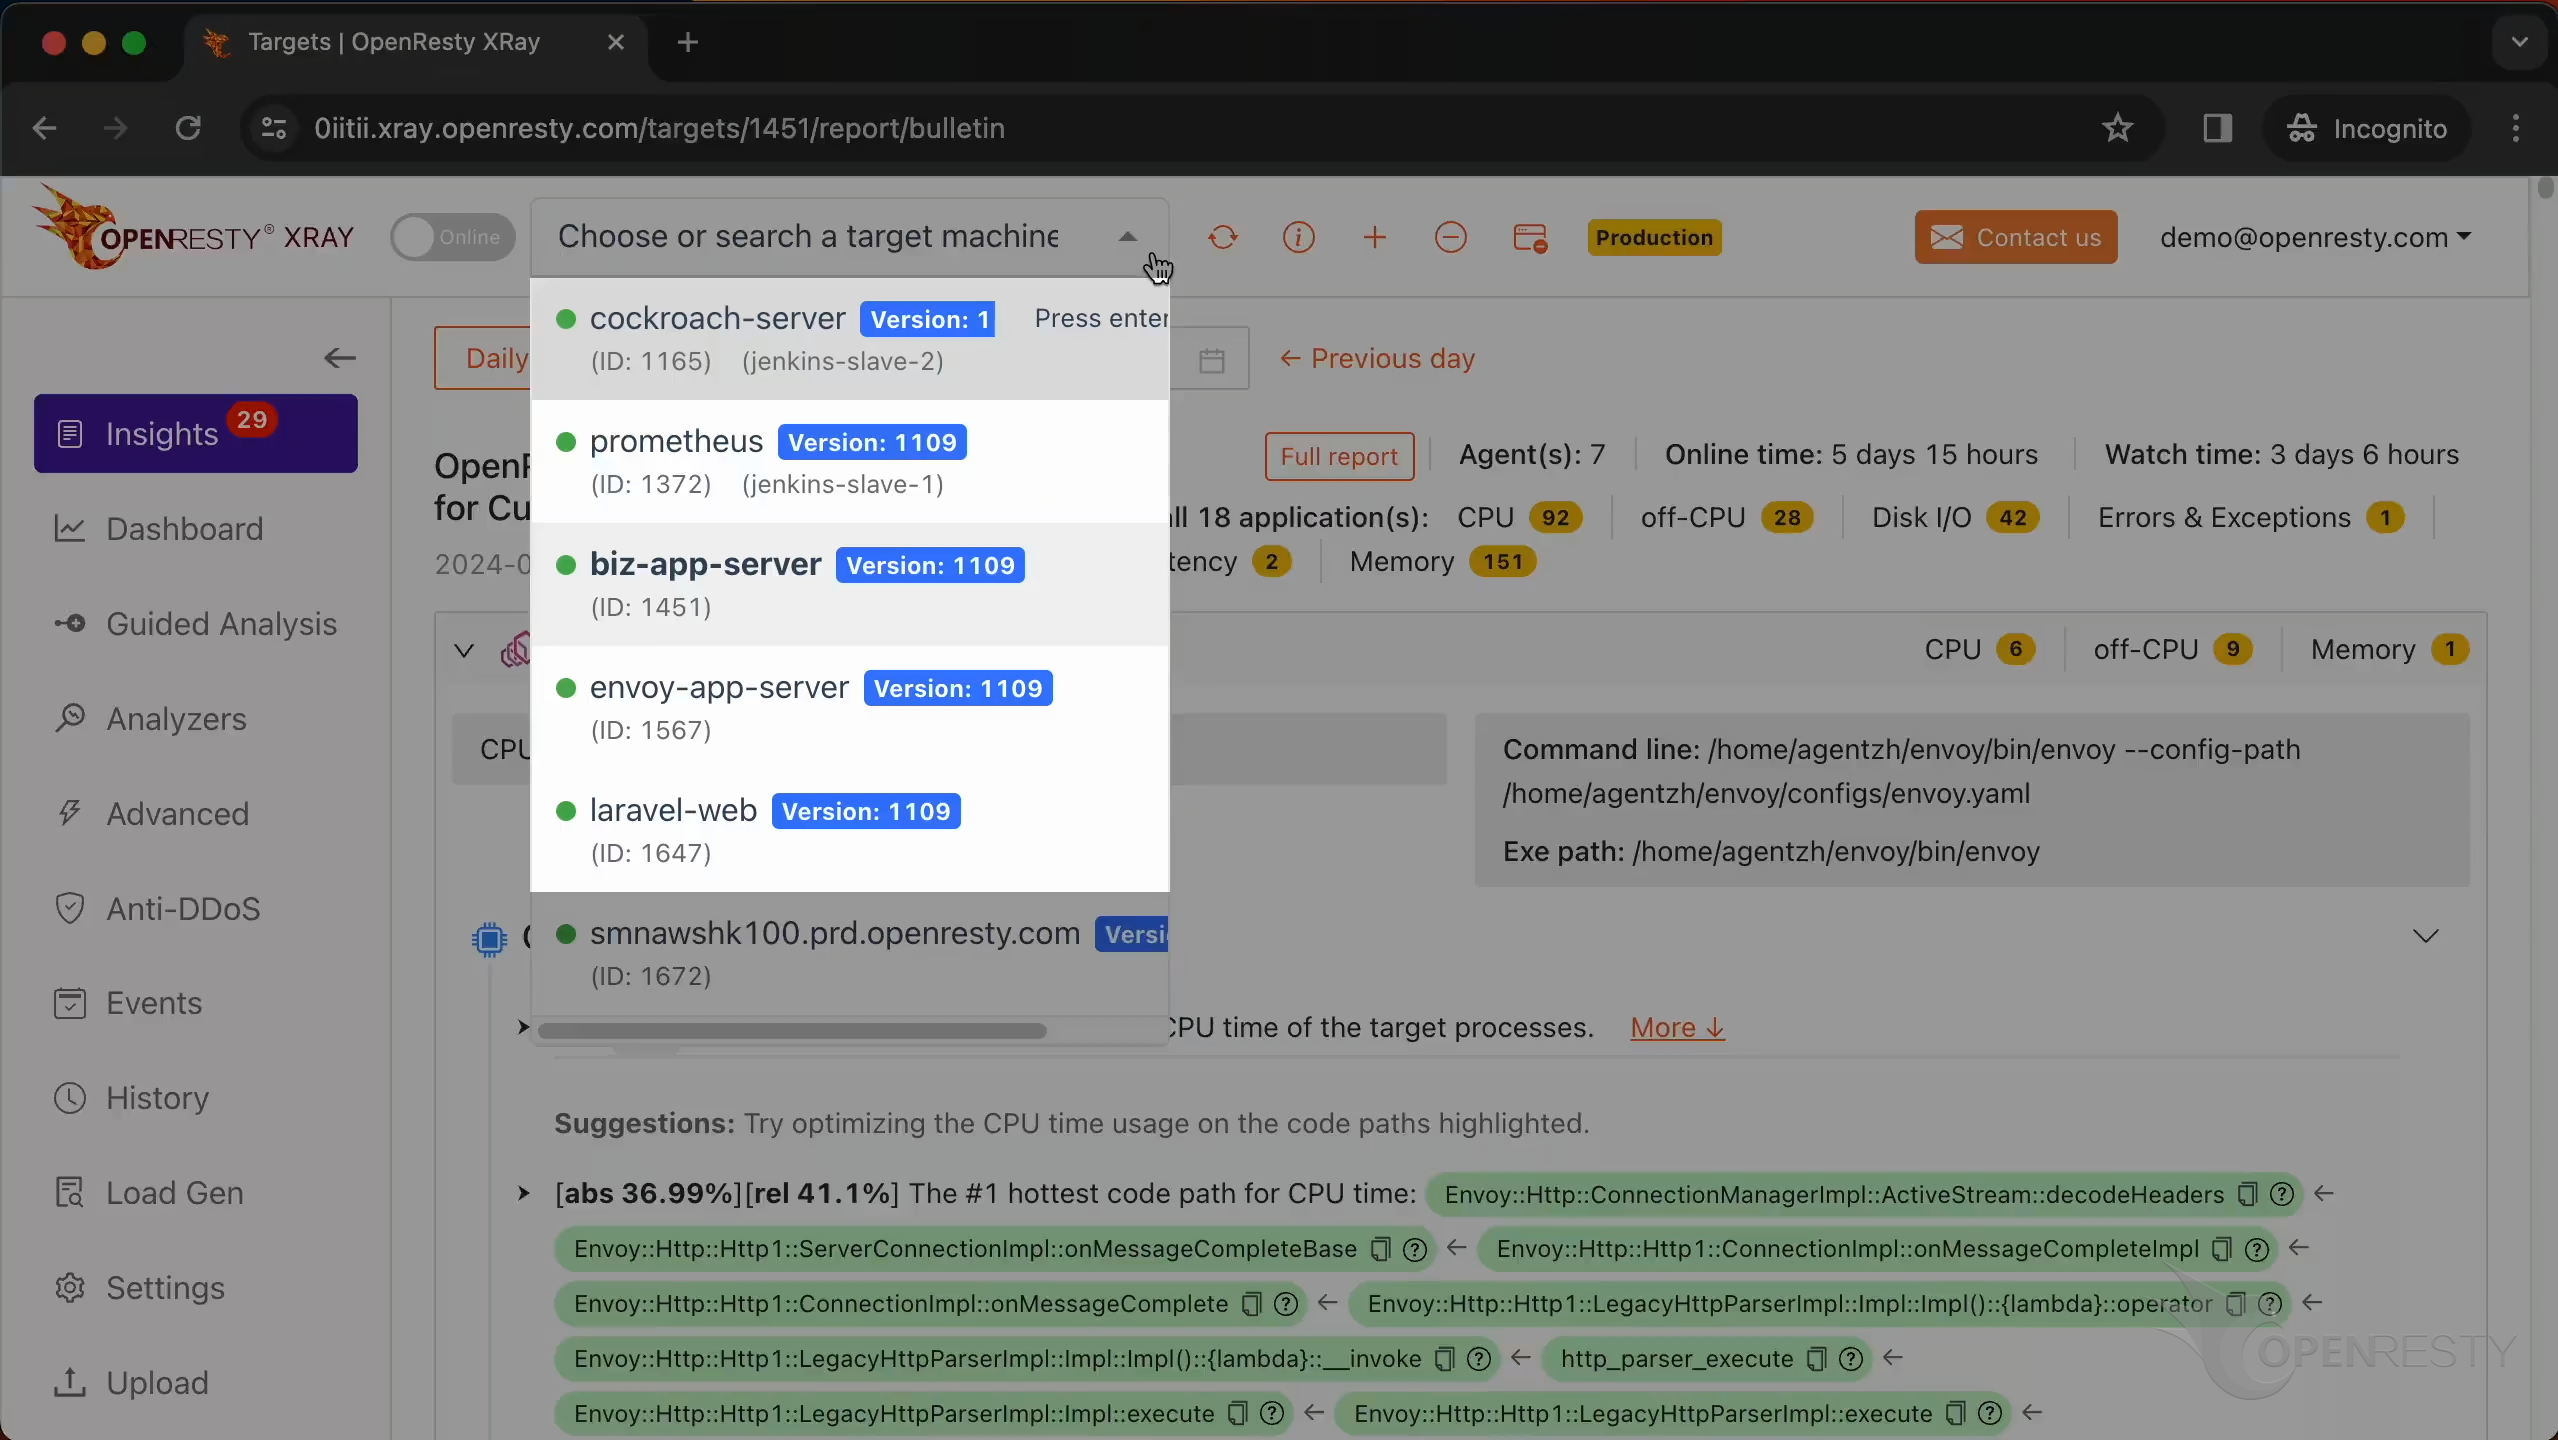
You can choose the right machine from the list below if the current one is not correct.
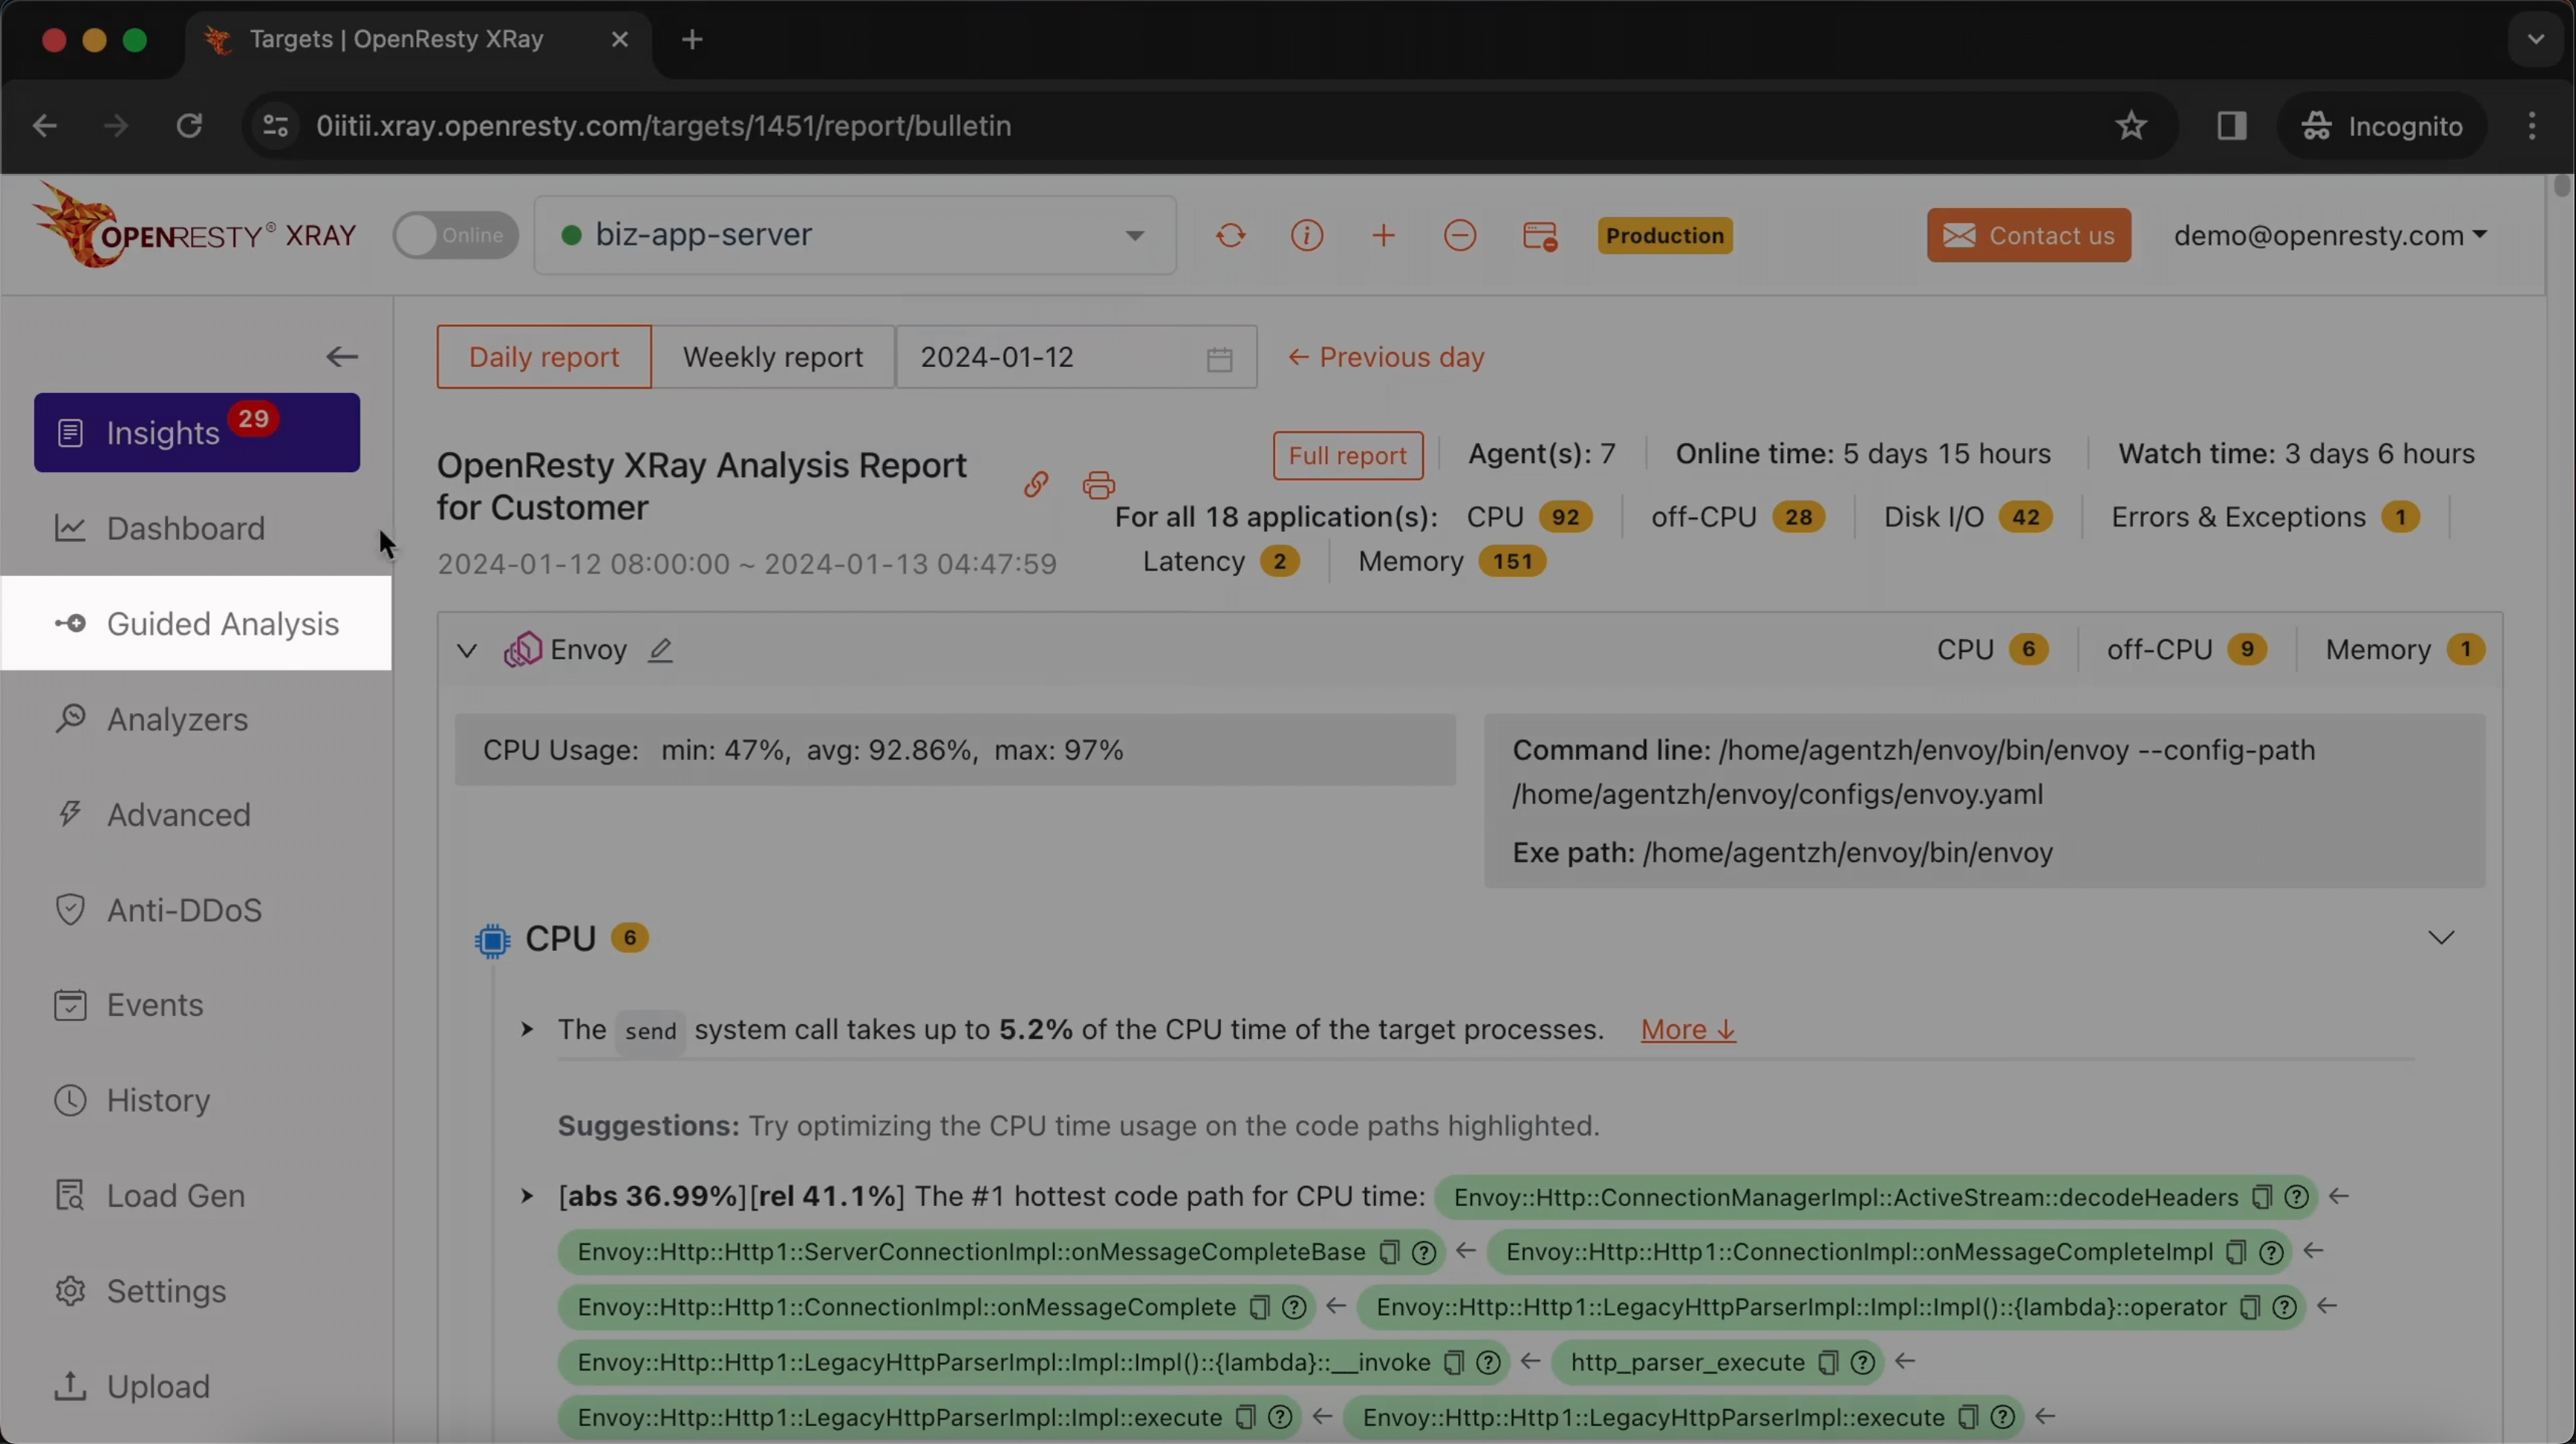
Go to the “Guided Analysis” page.
Here, you can see different types of problems that you can diagnose.
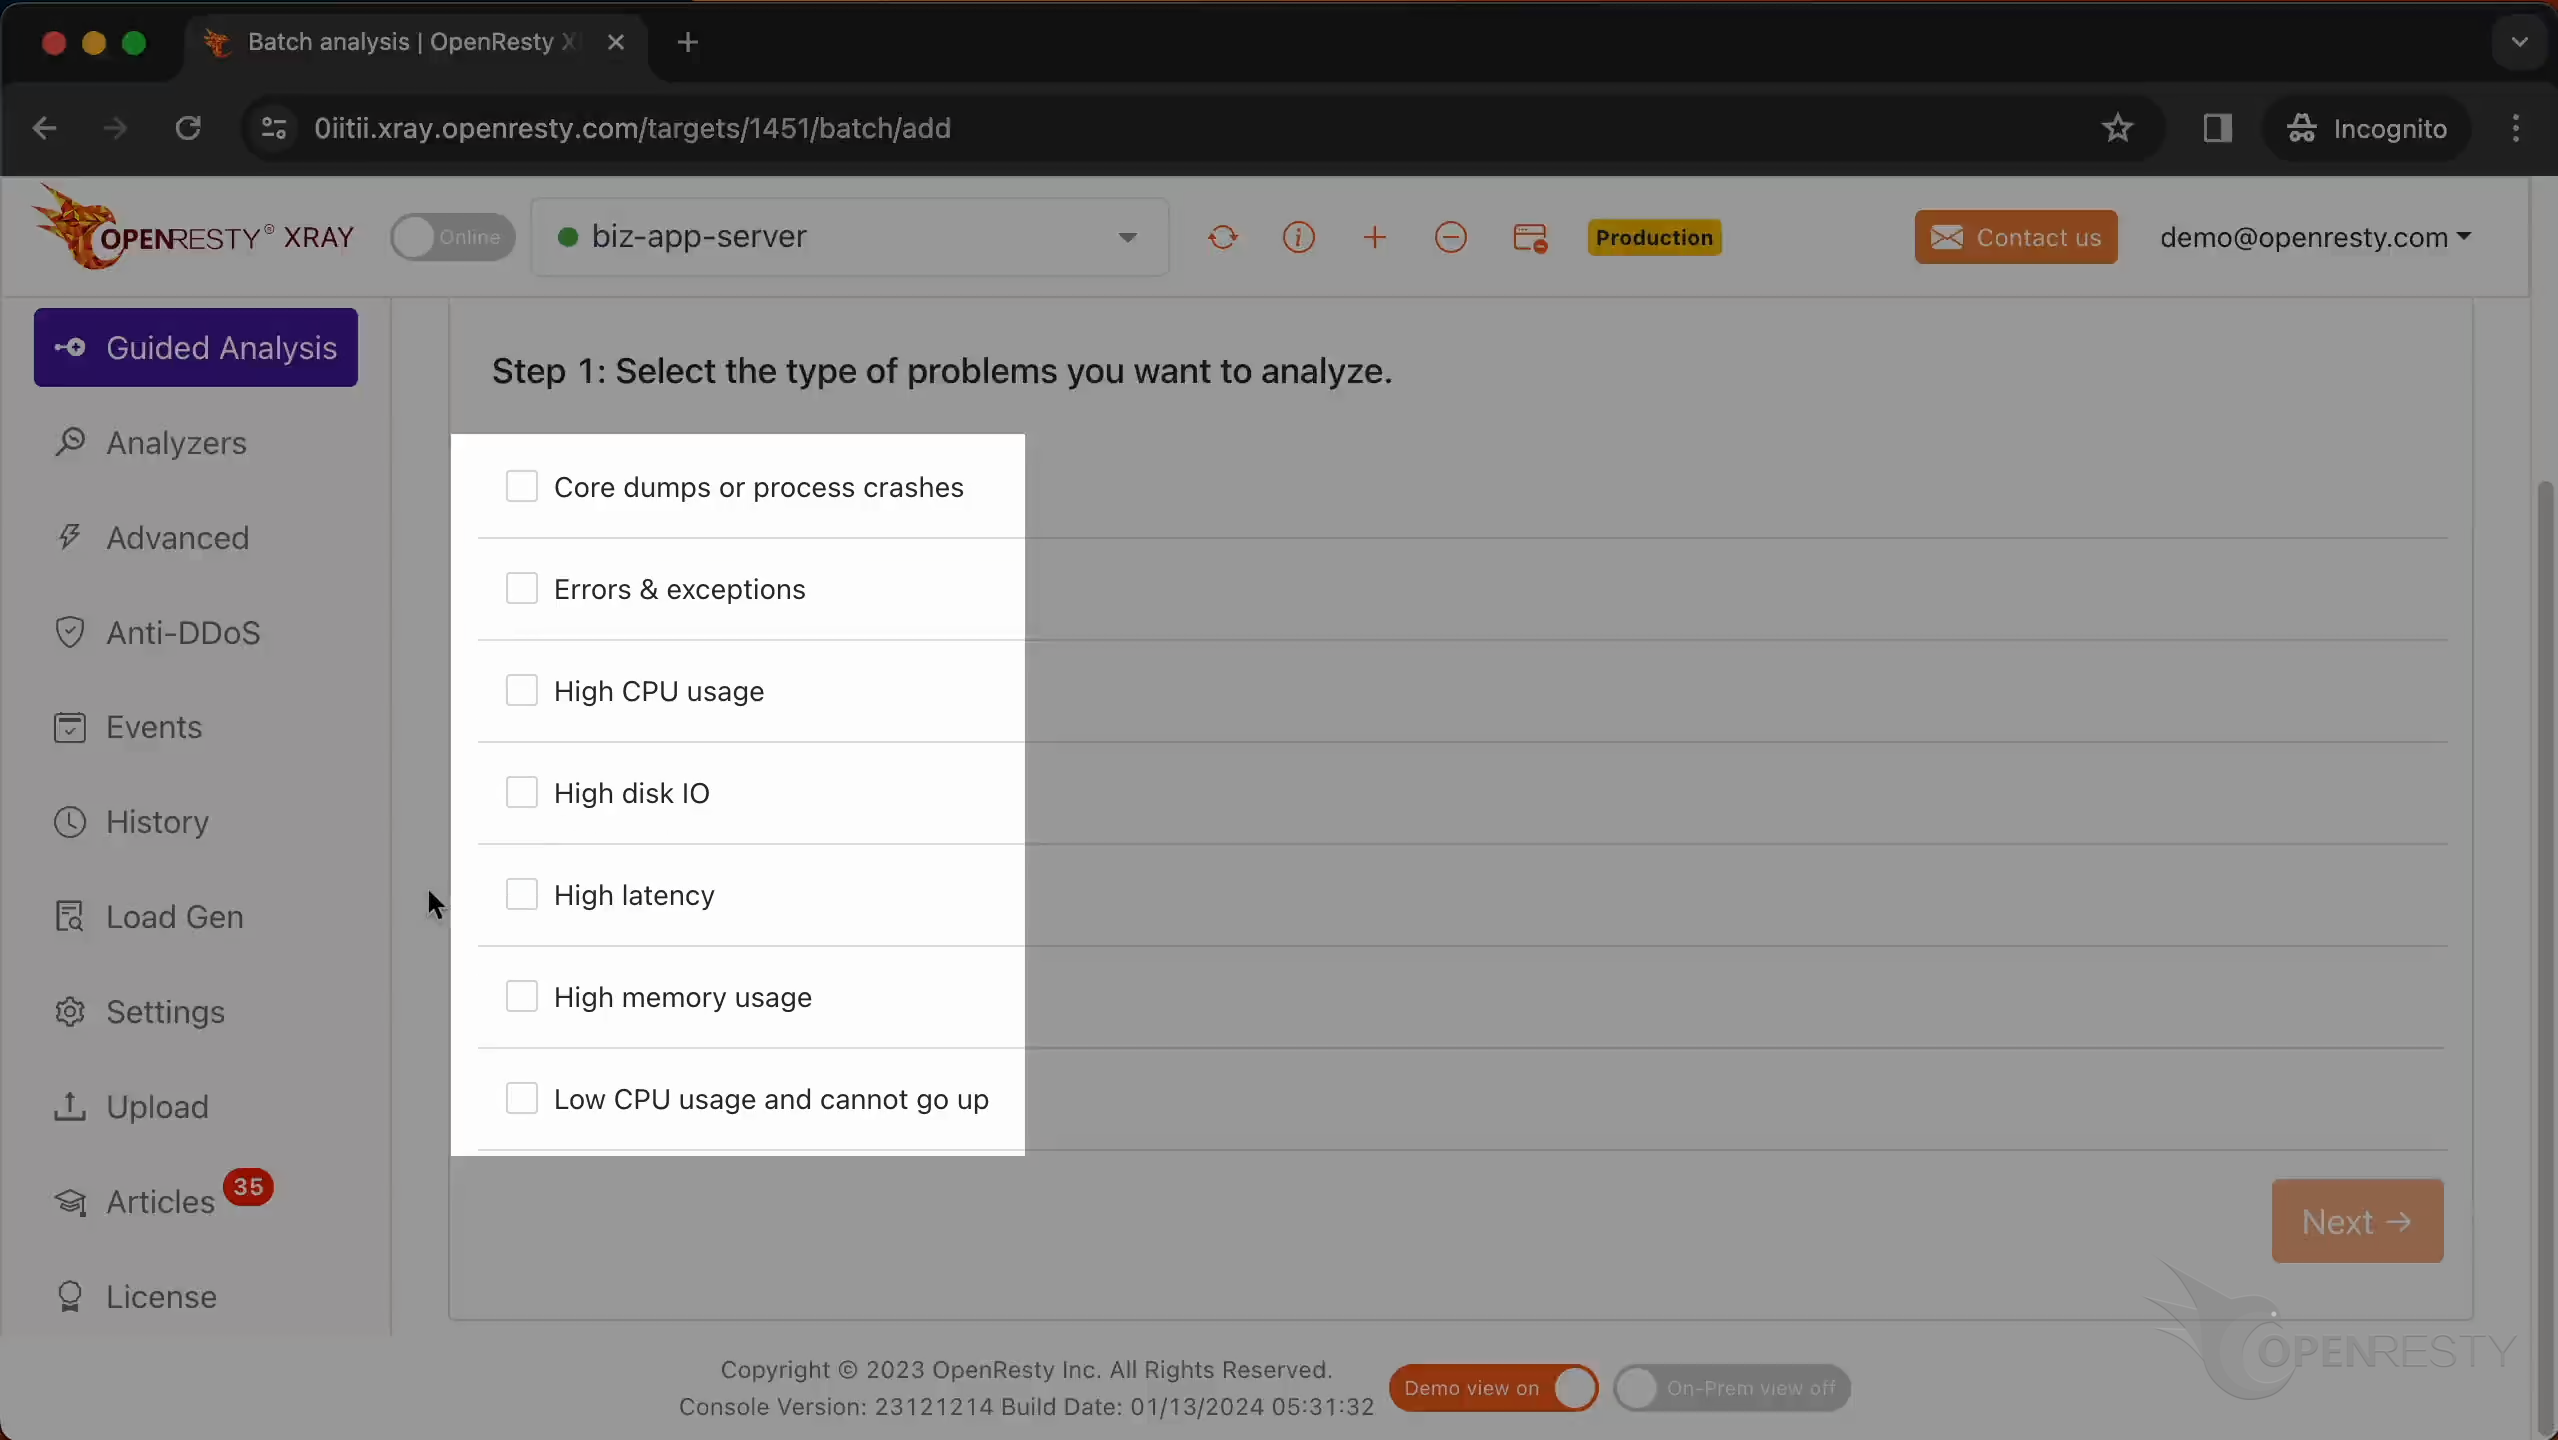
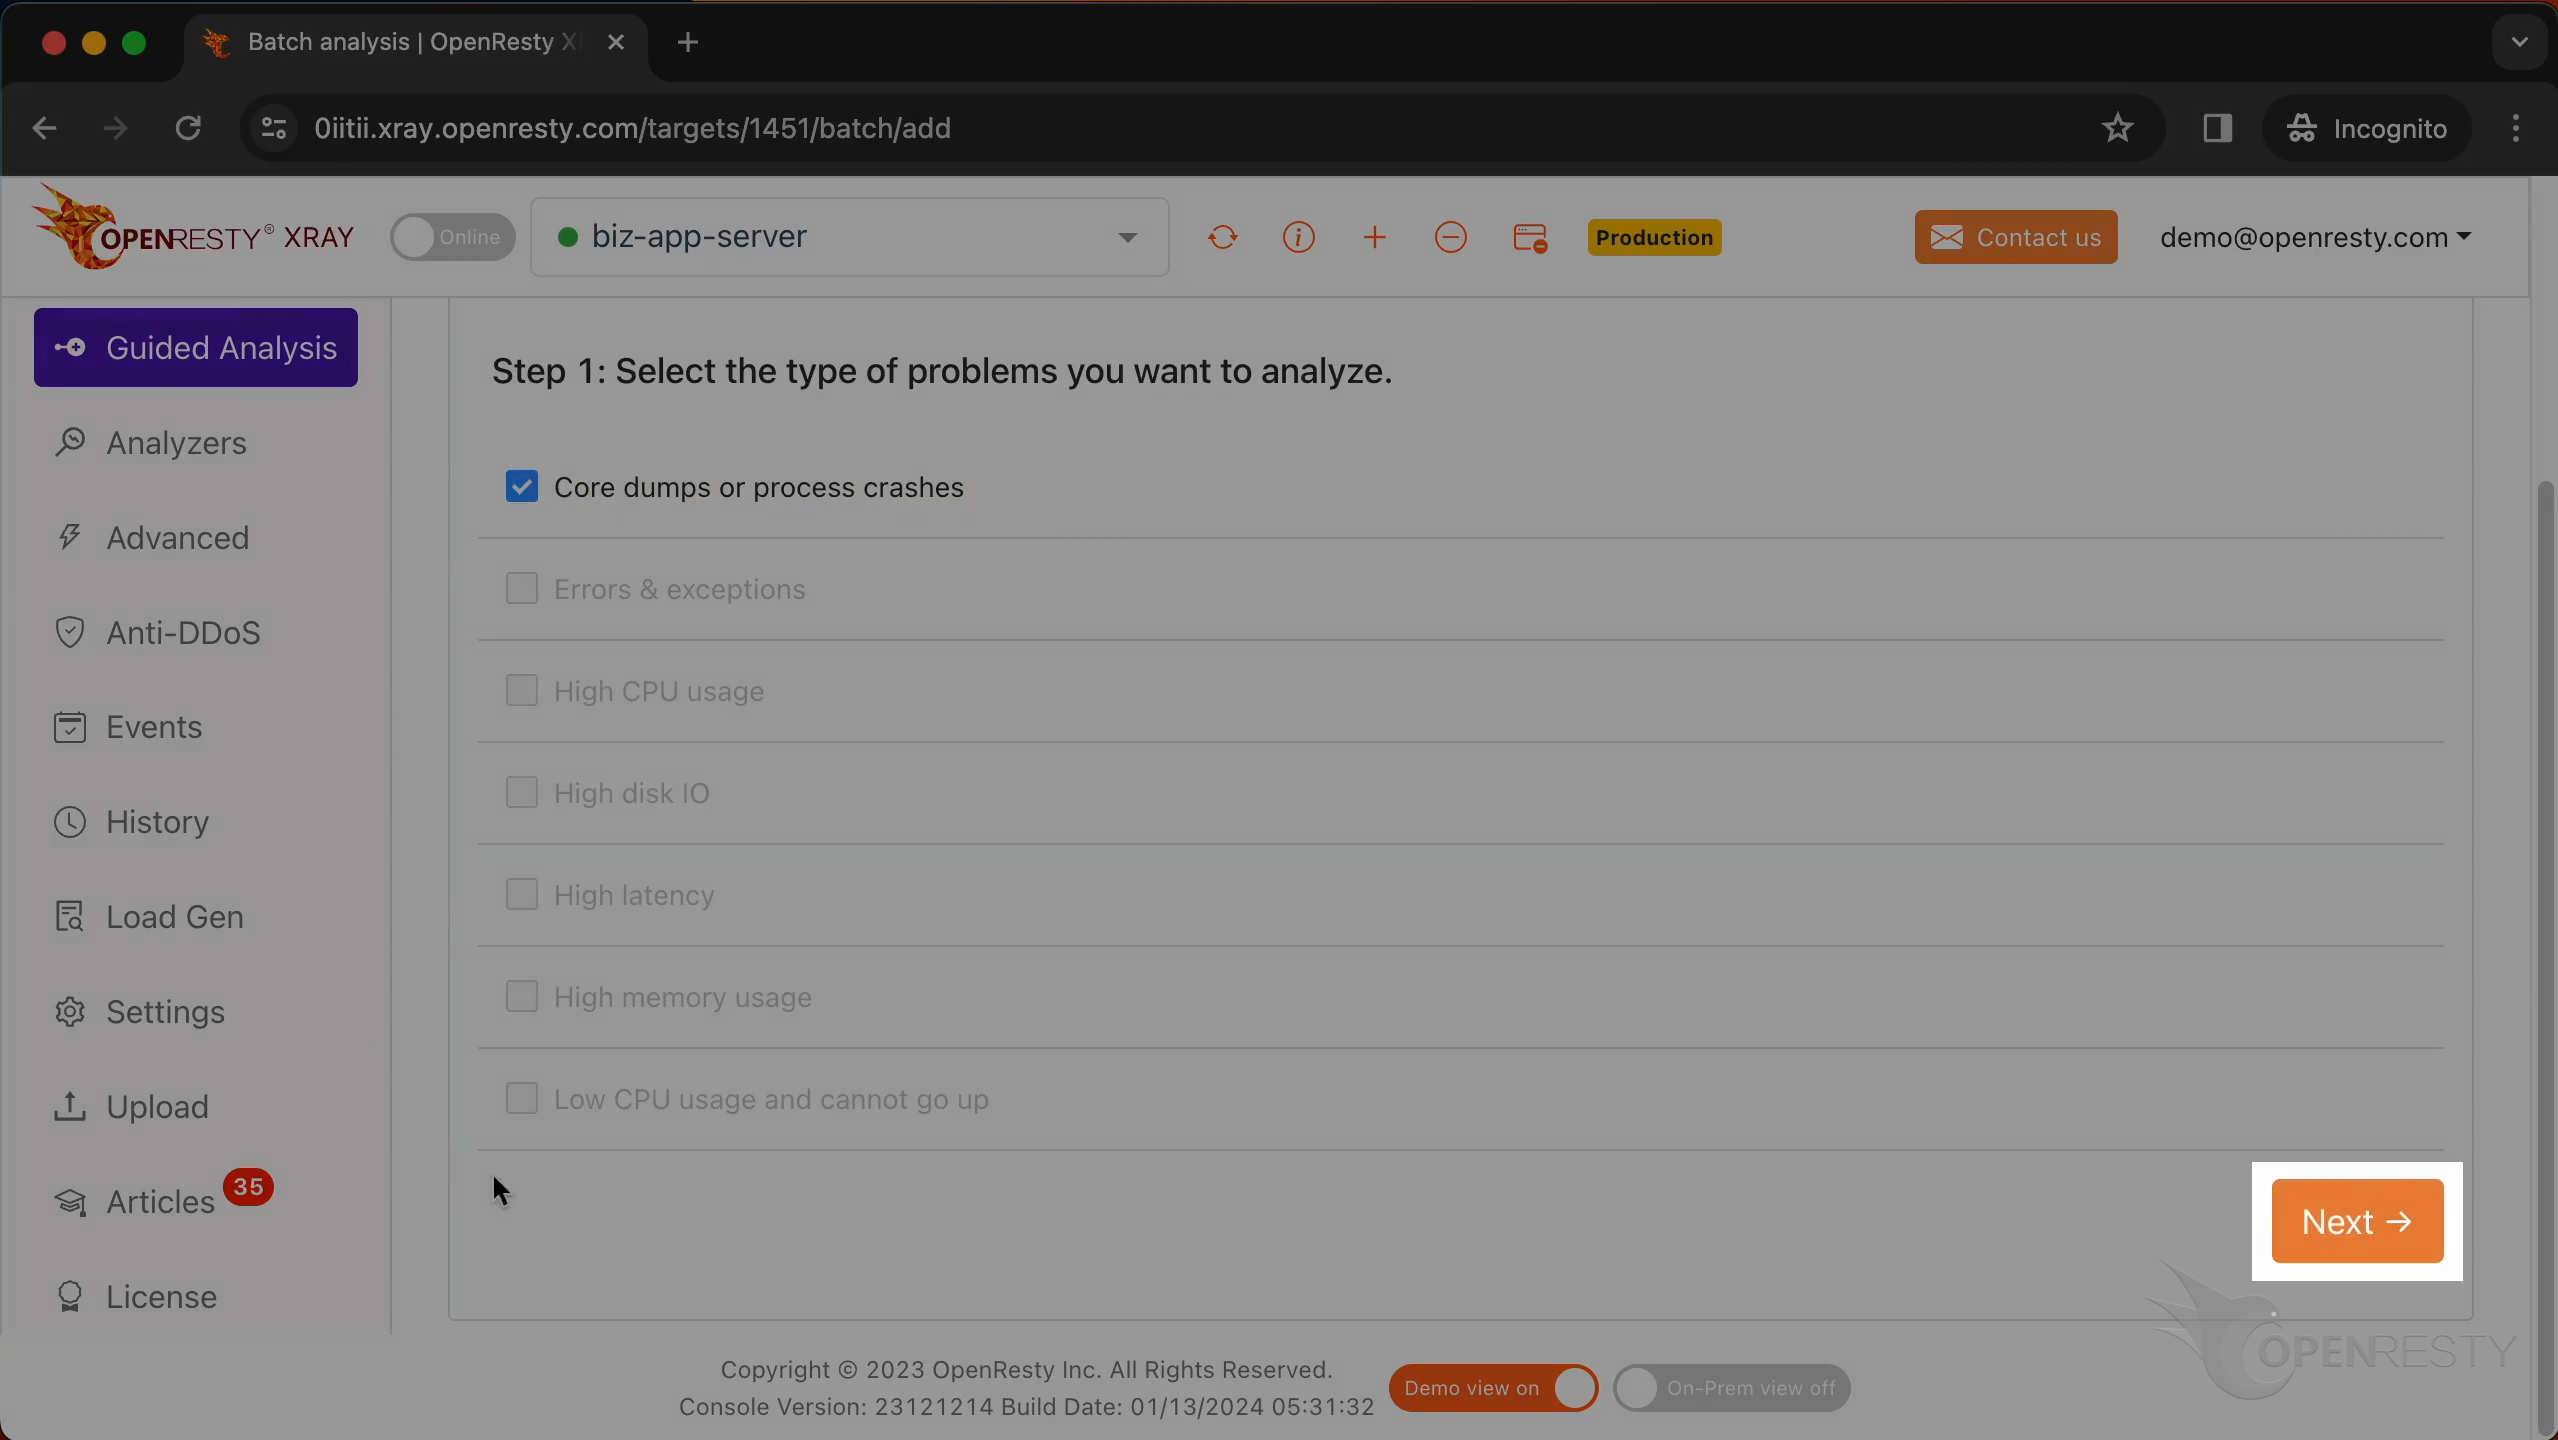
Let’s select “Core dumps or process crashes”.
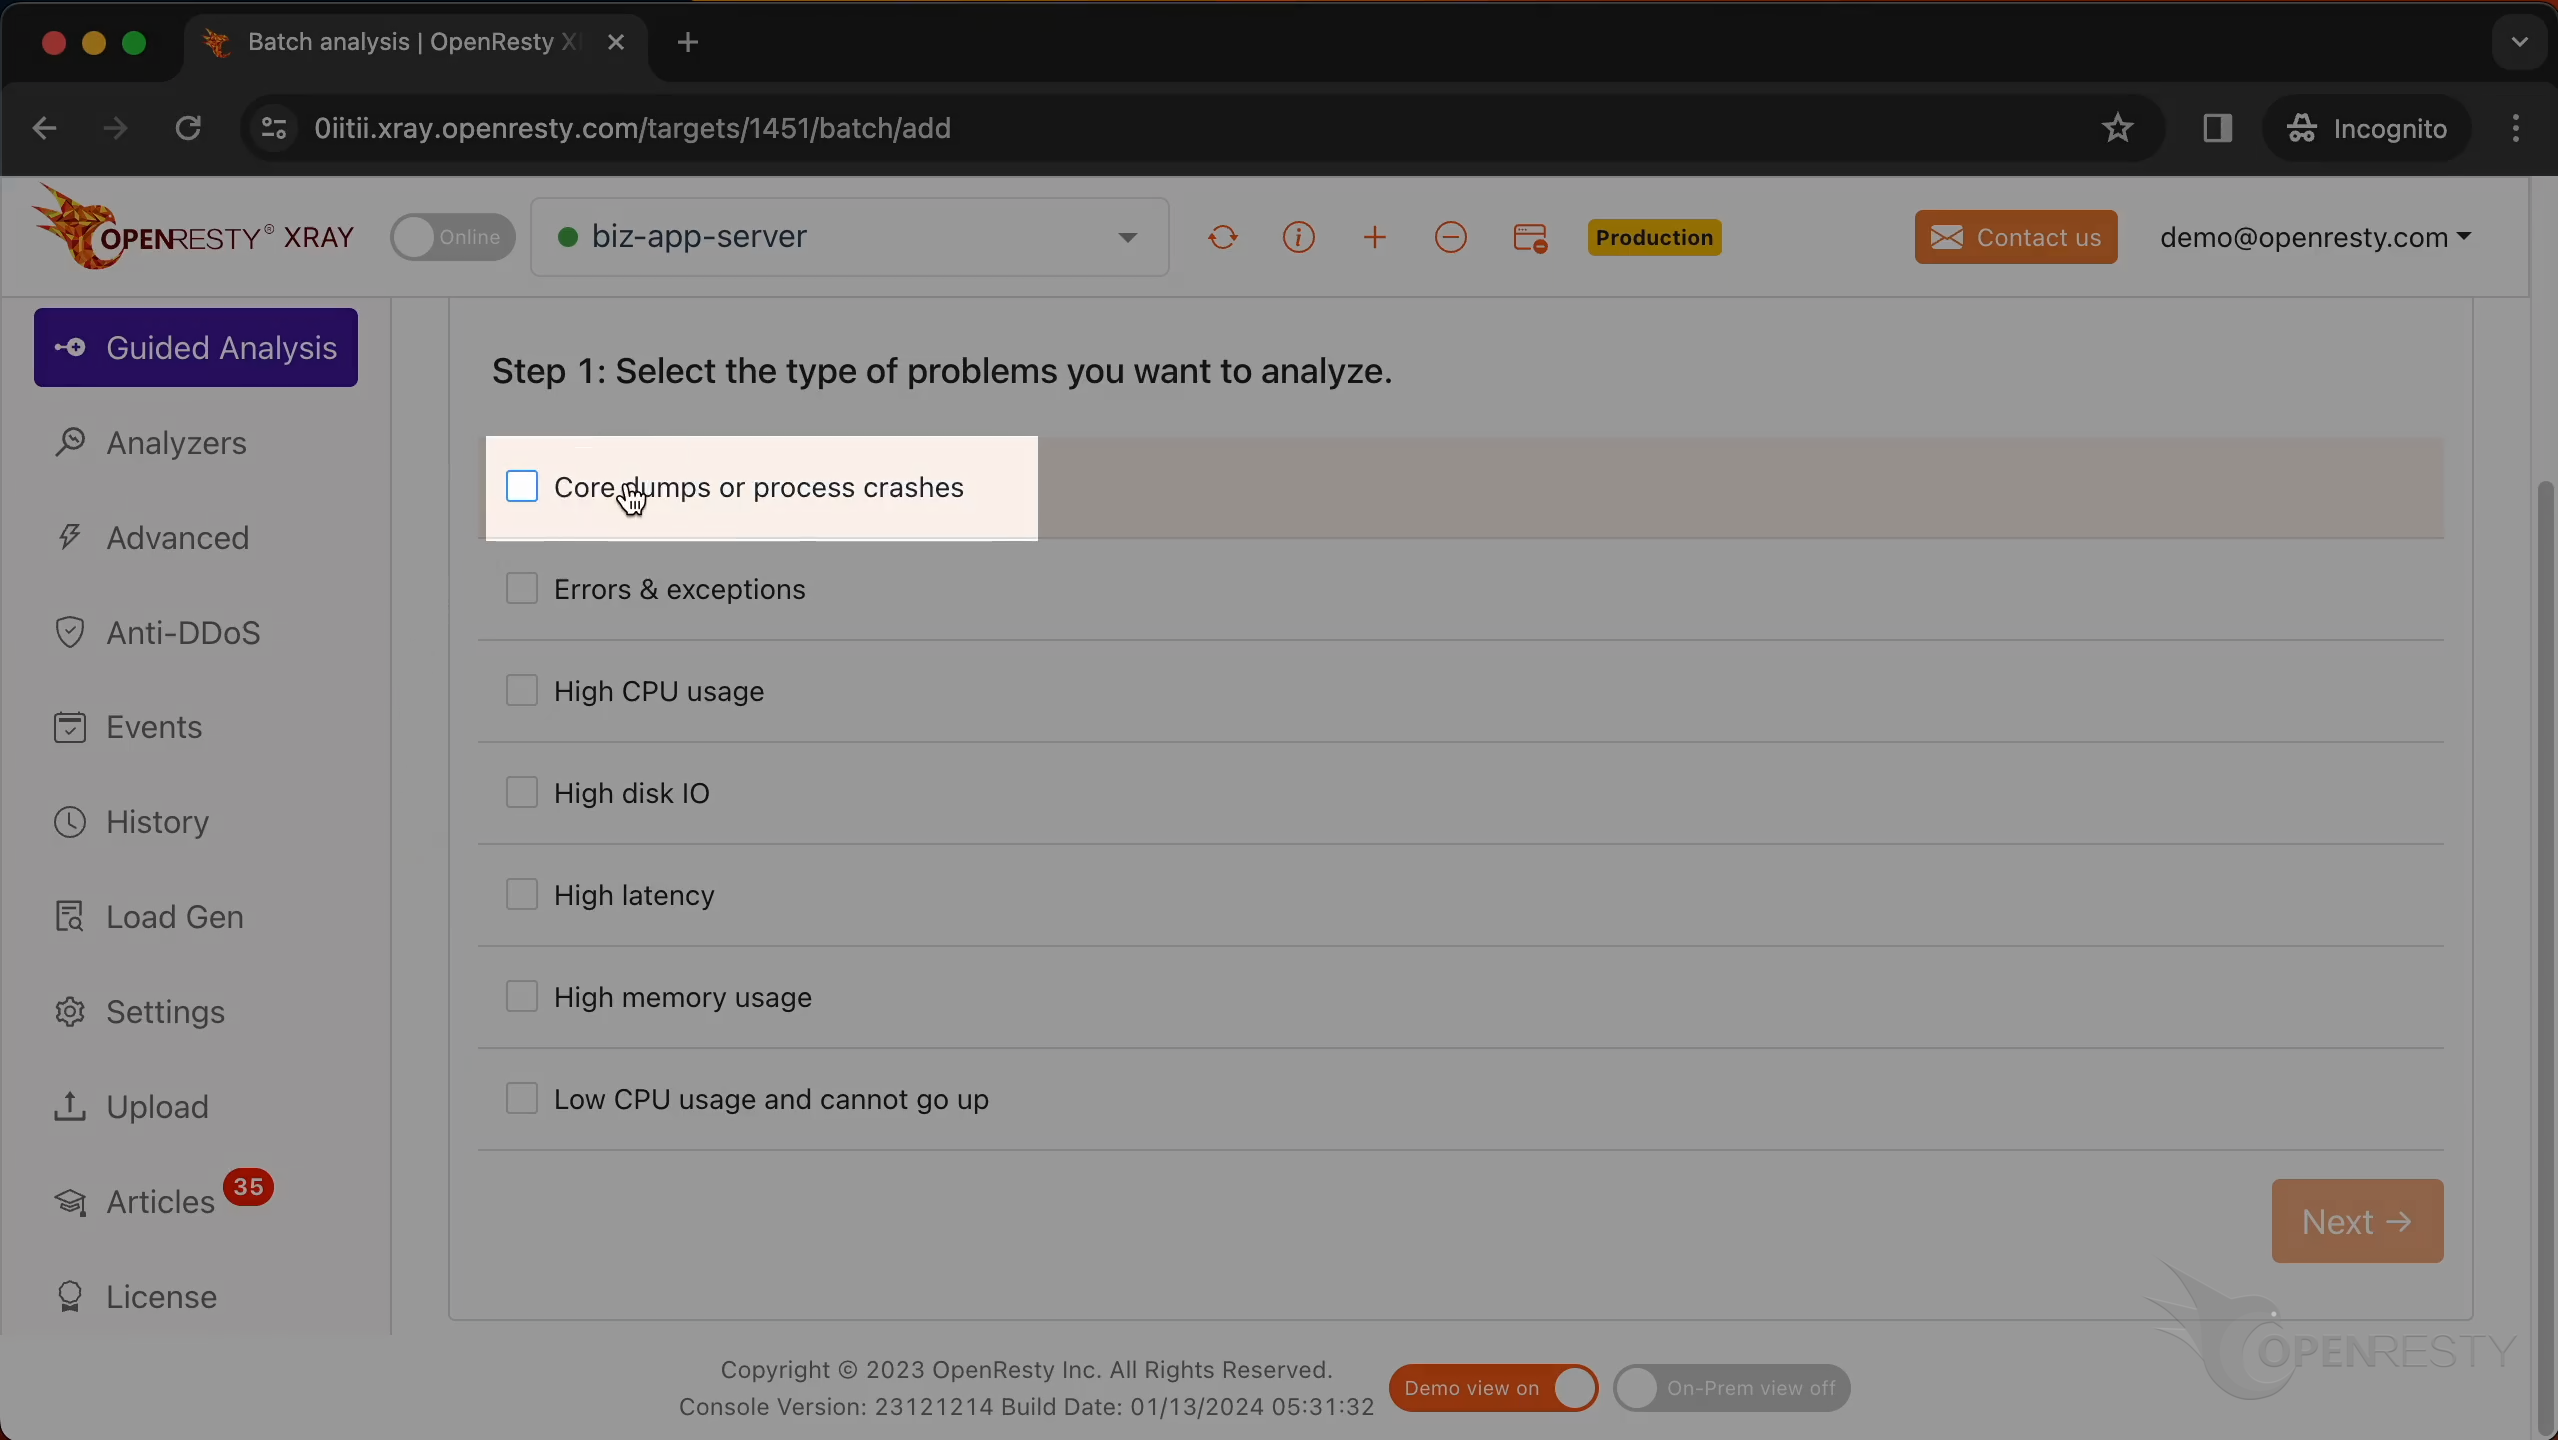
Click on “Next”.
Paste the path of the core file we just copied here.
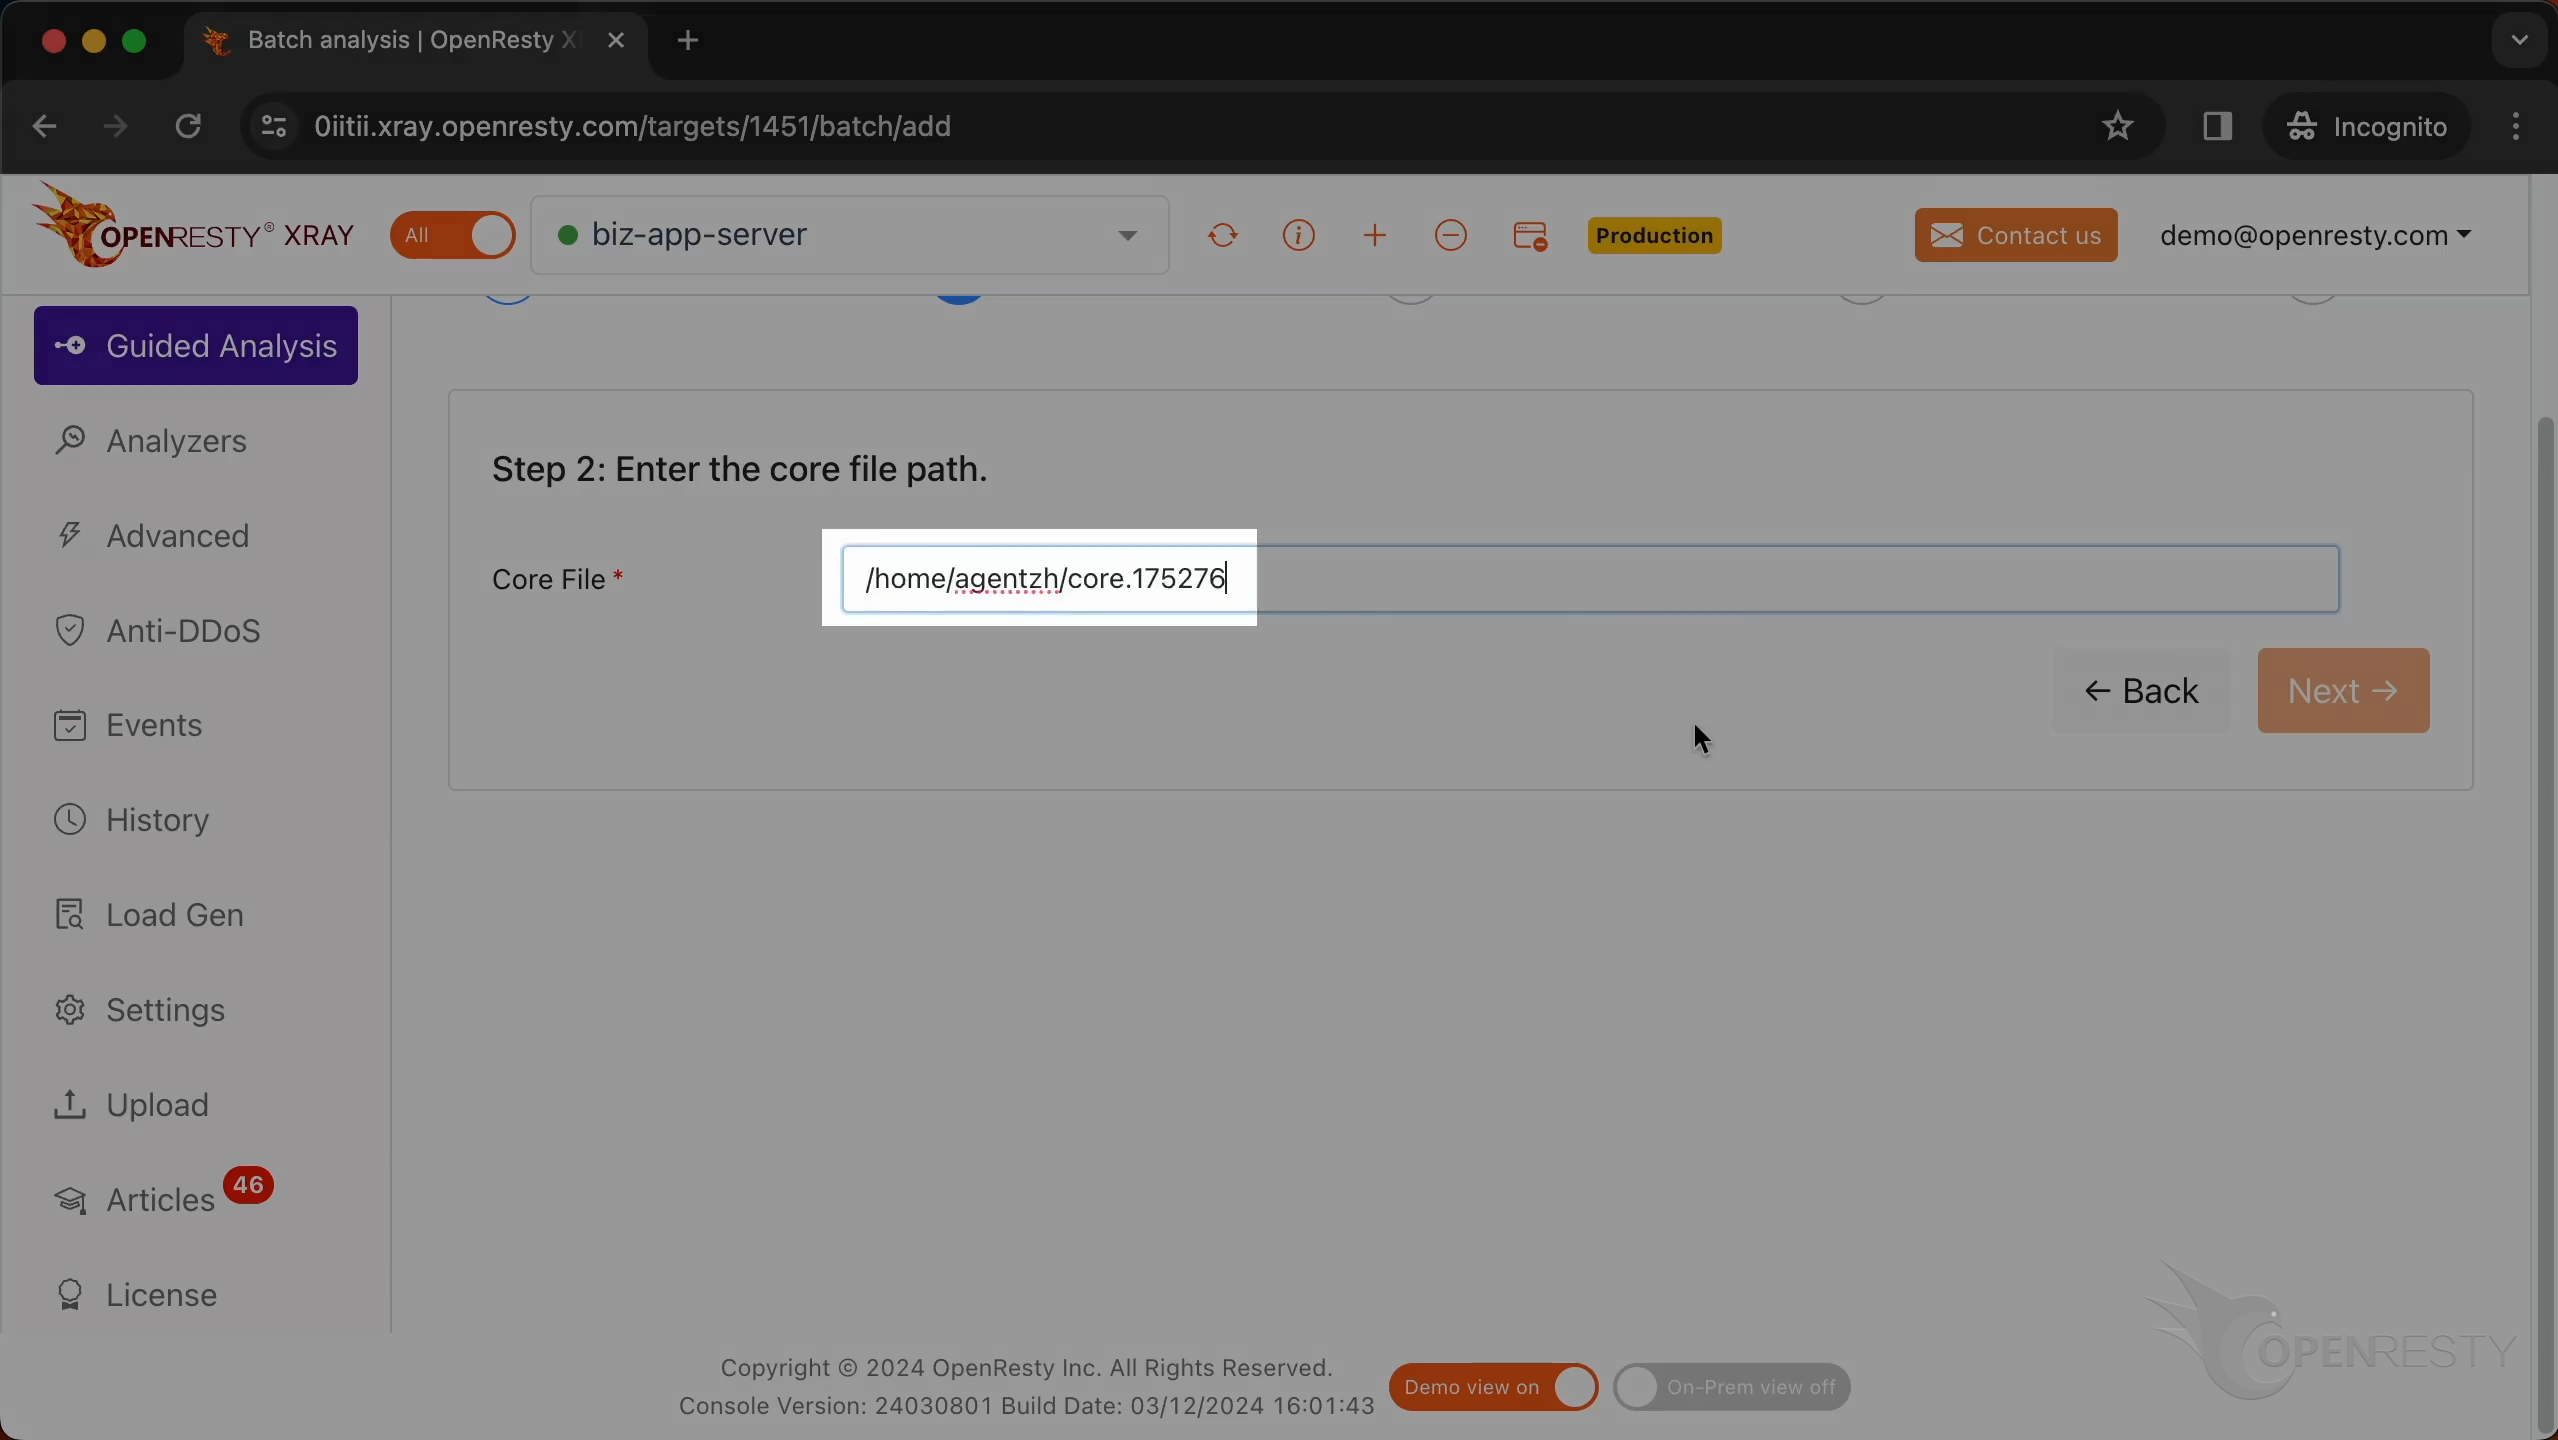
OpenResty XRay automatically extracts the executable file path from this core dump file and fills in this text box.
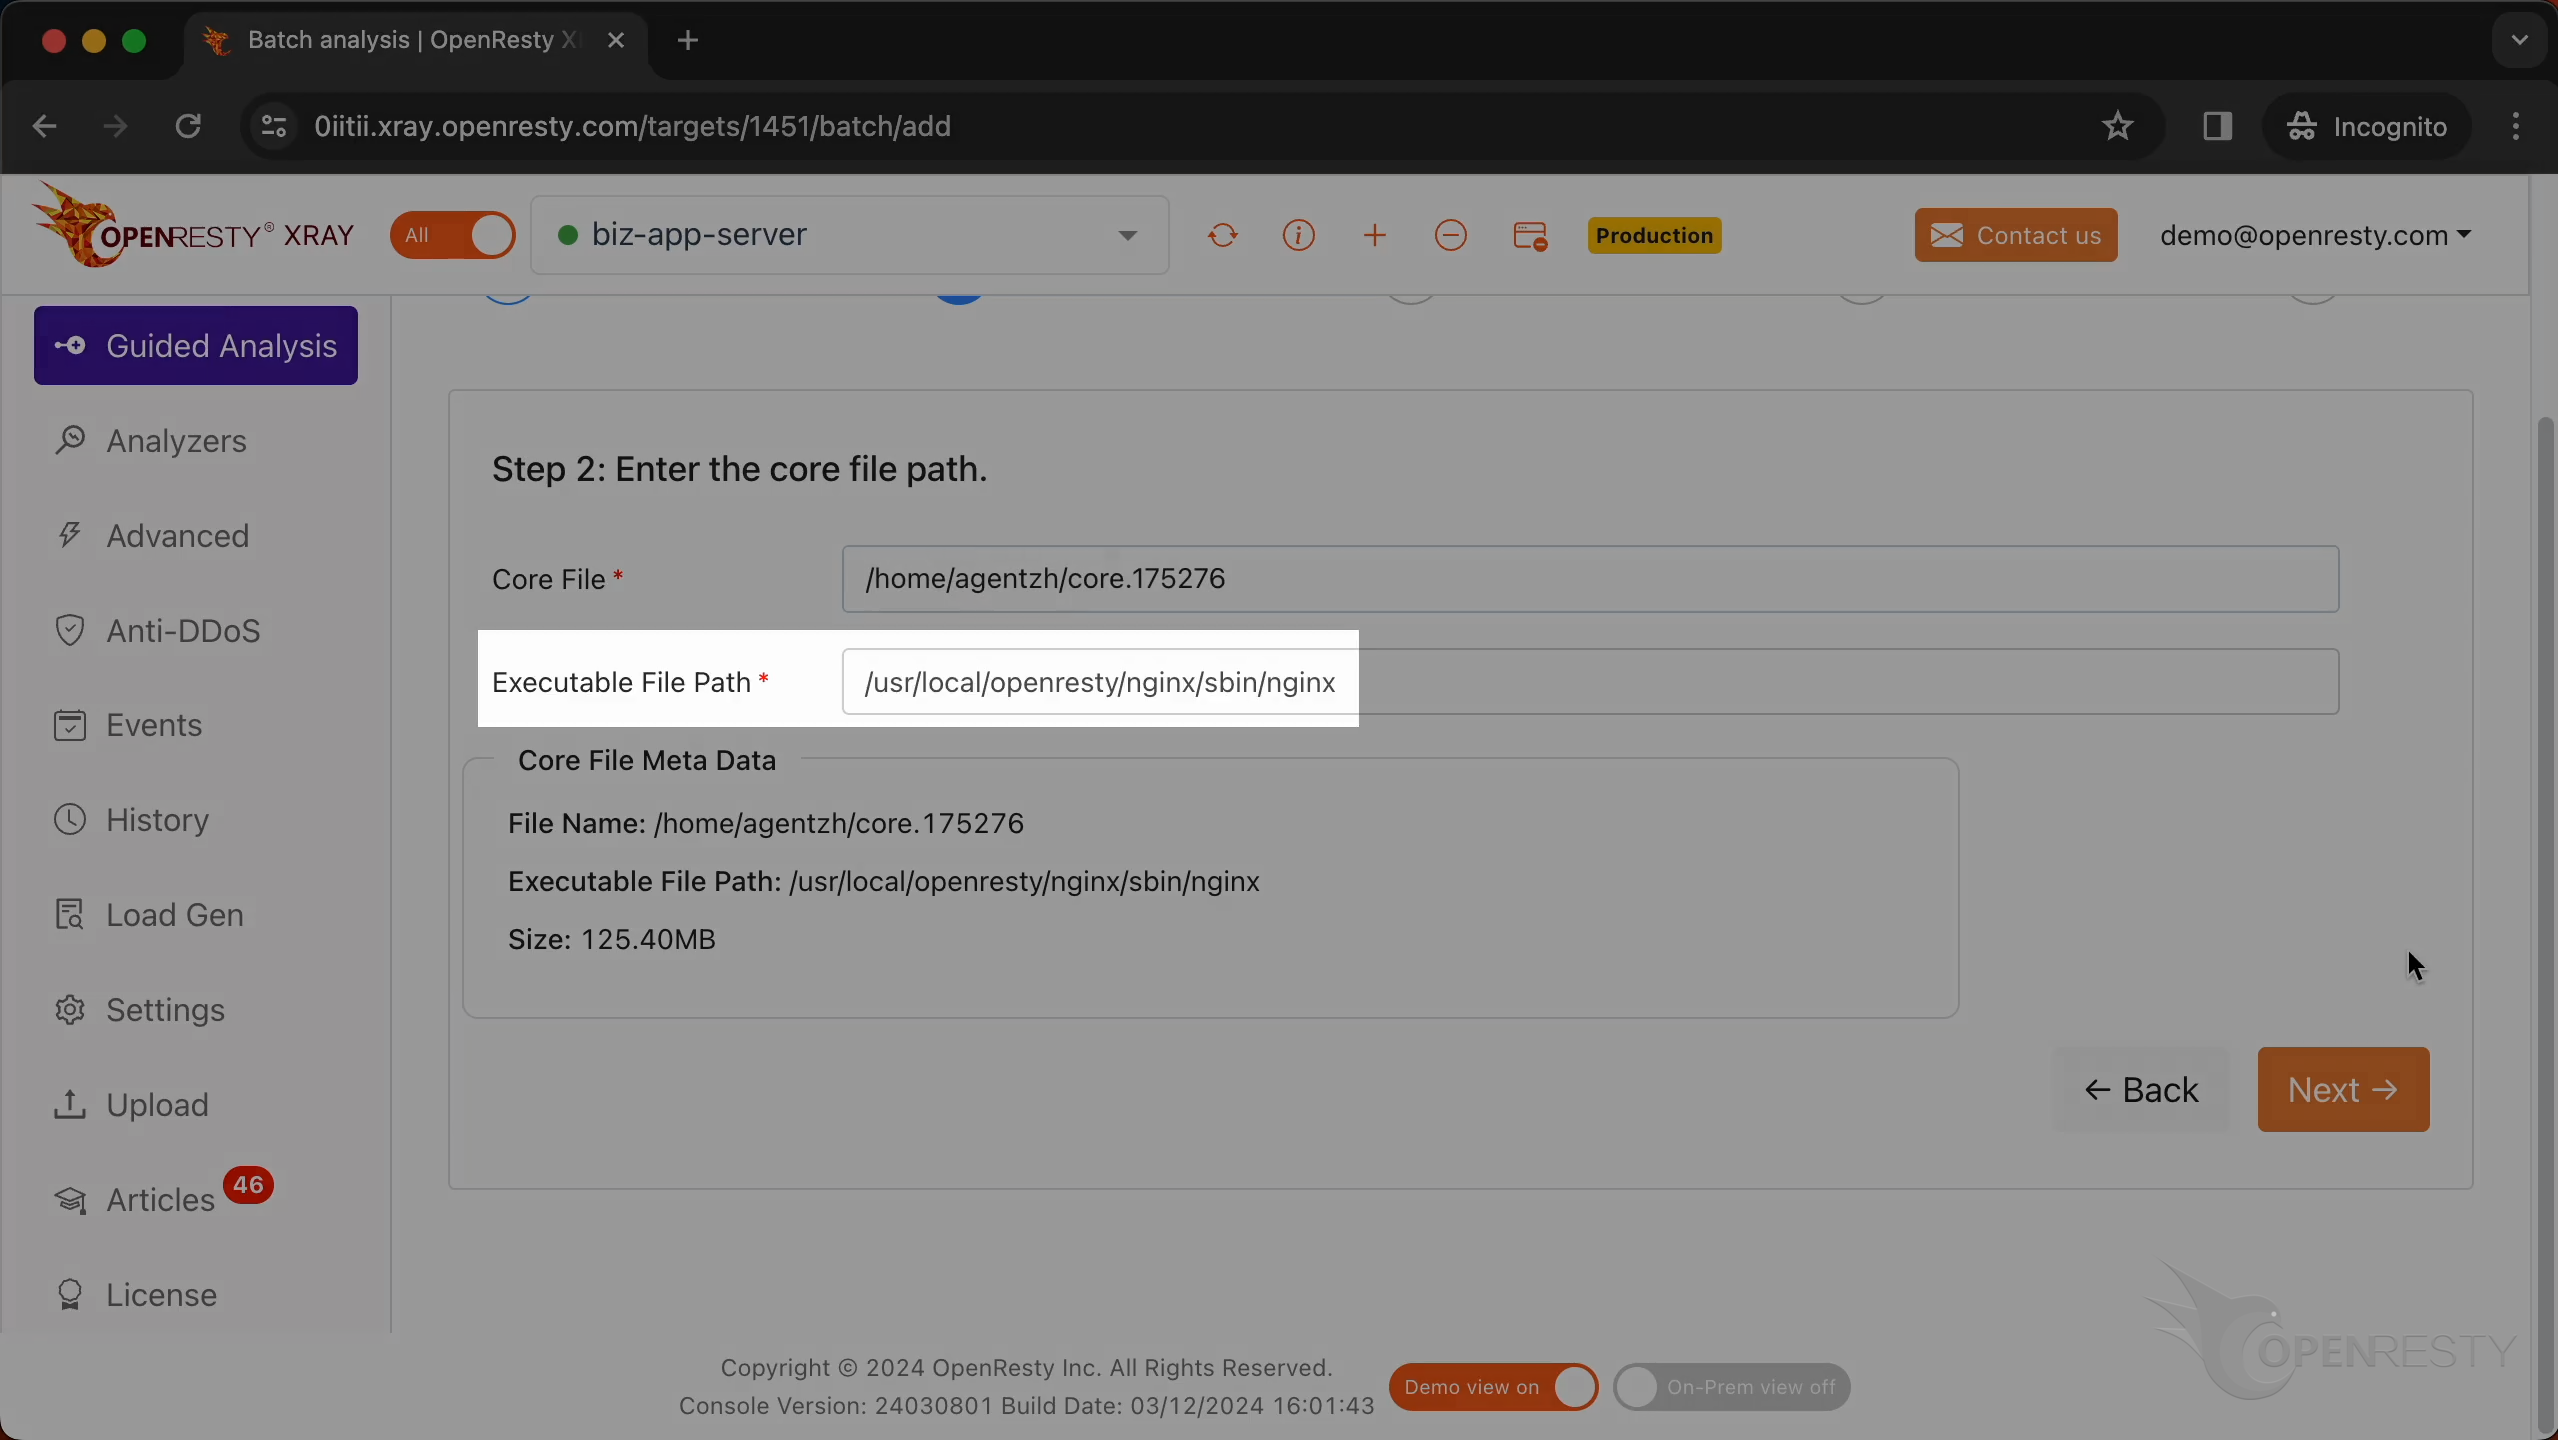
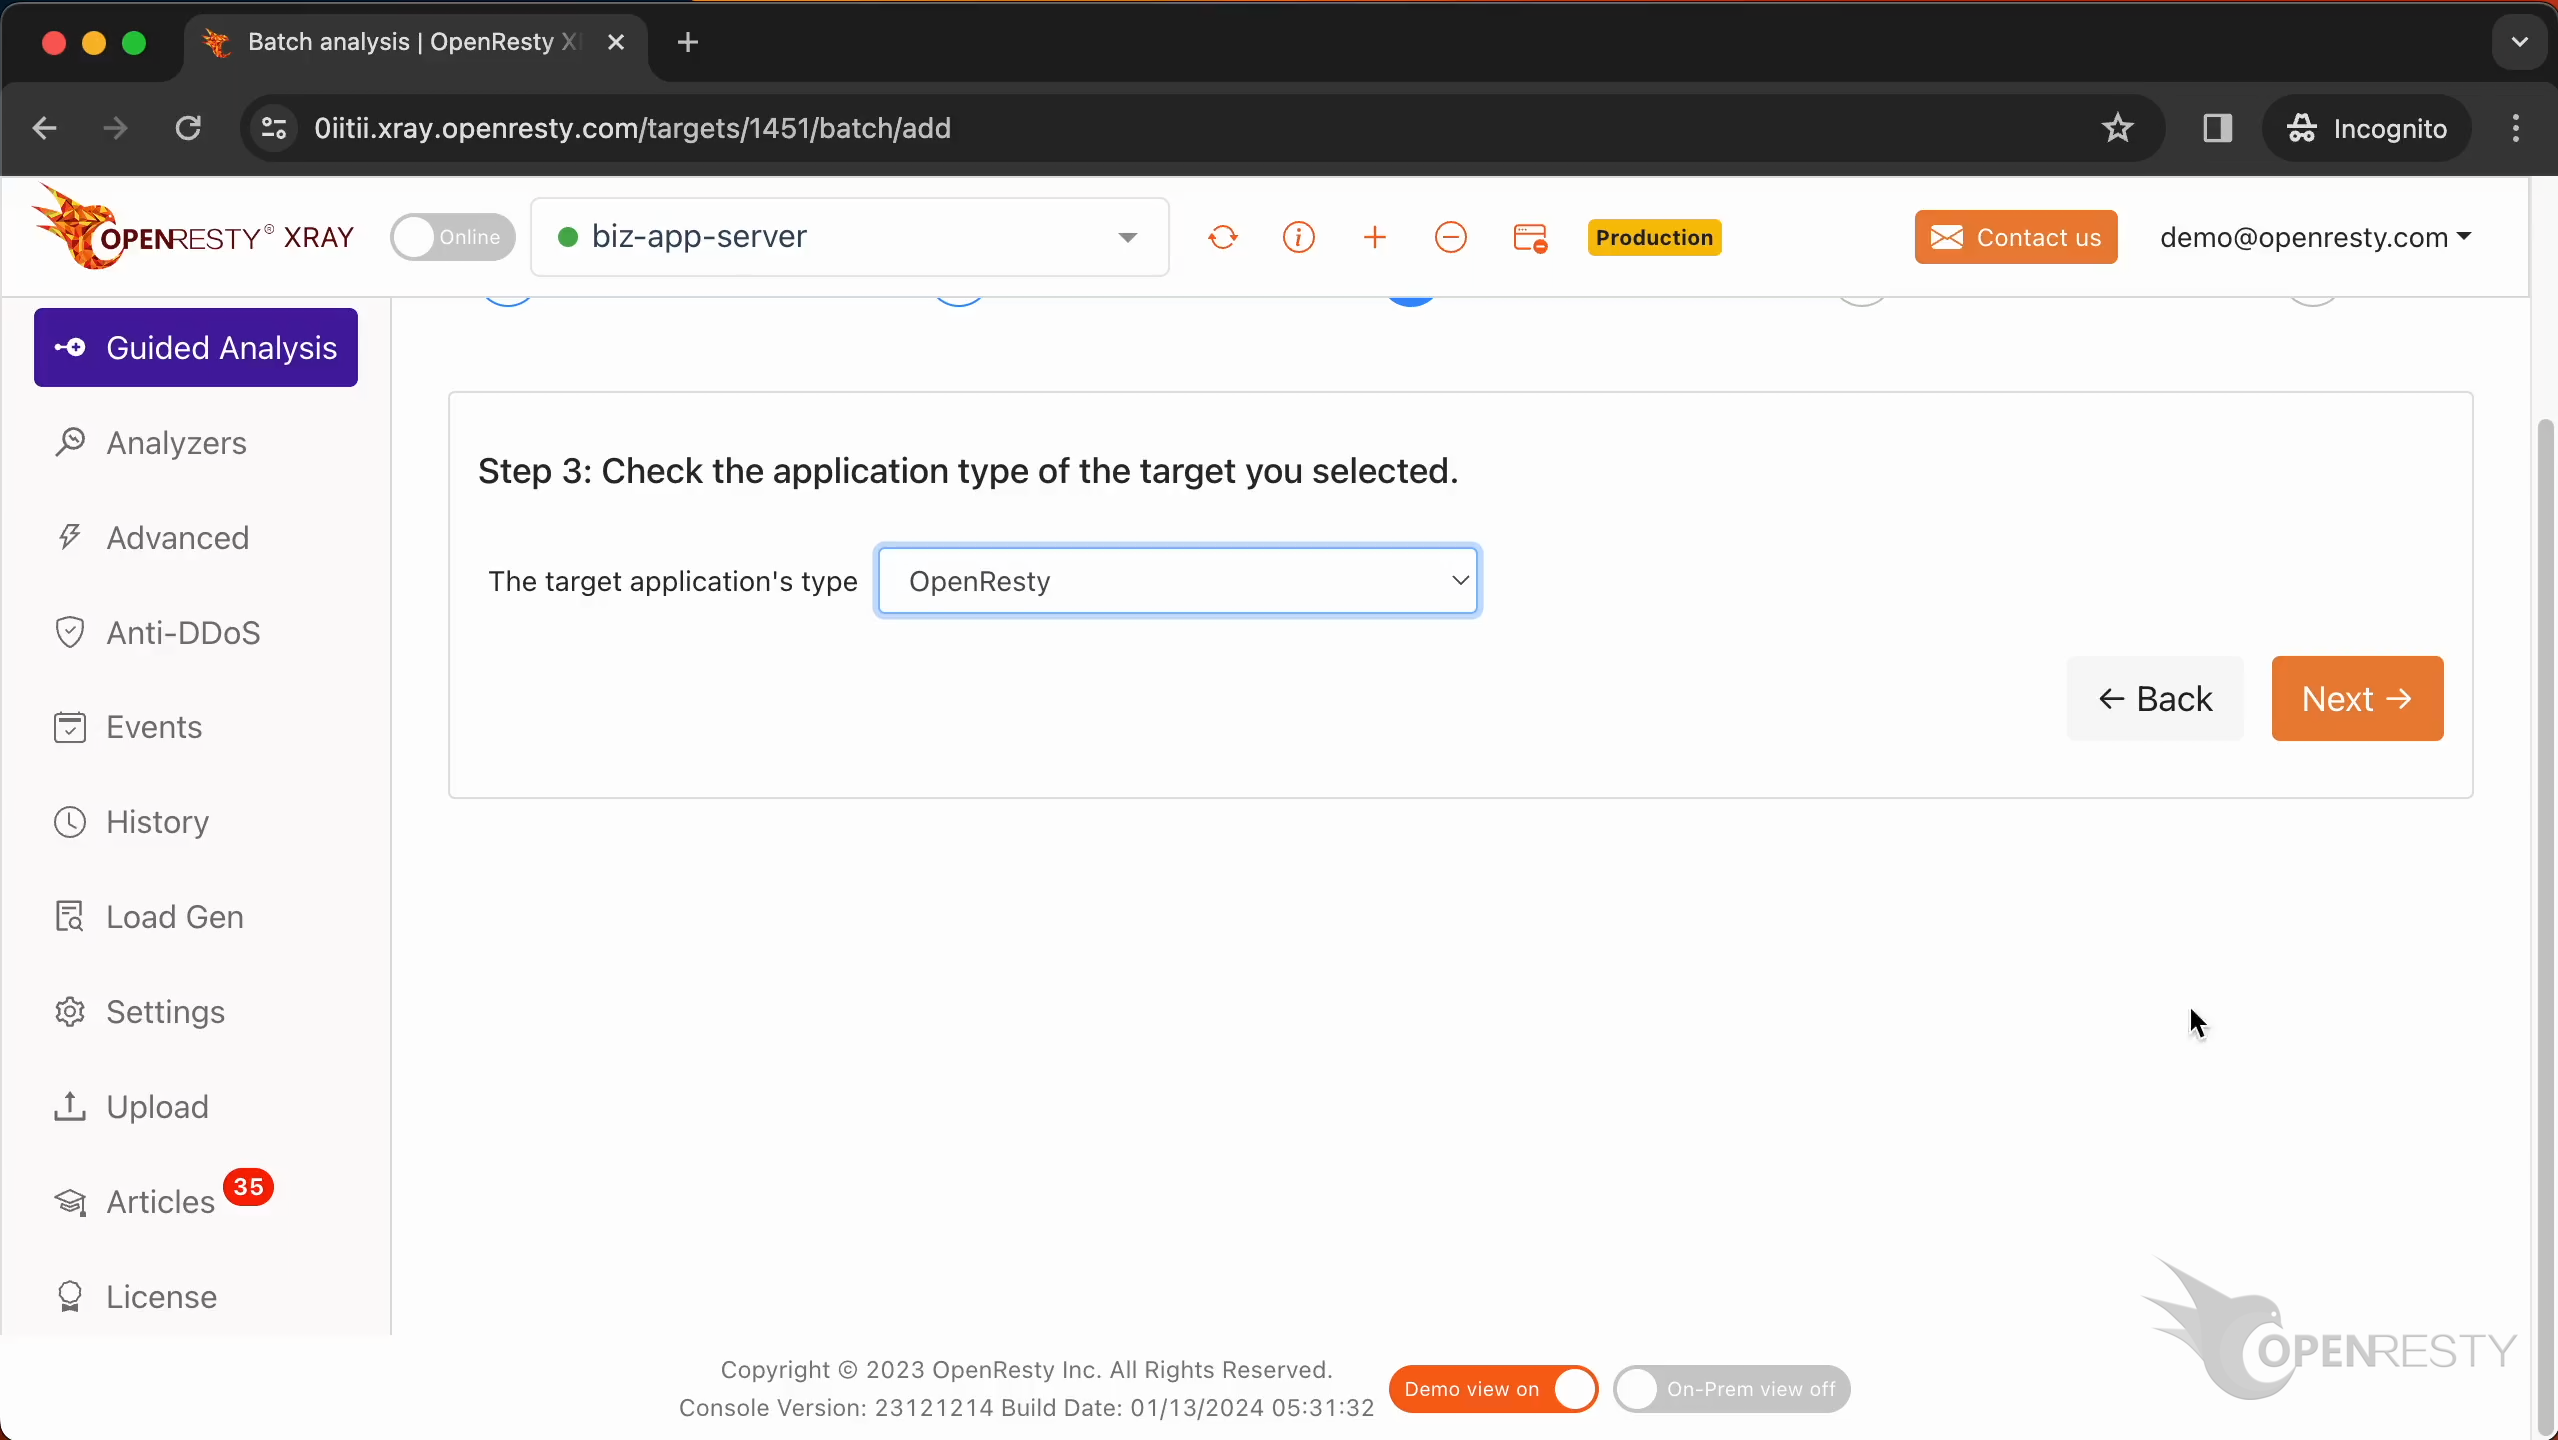
Make sure that the application type is correct. Usually, the default should be correct.
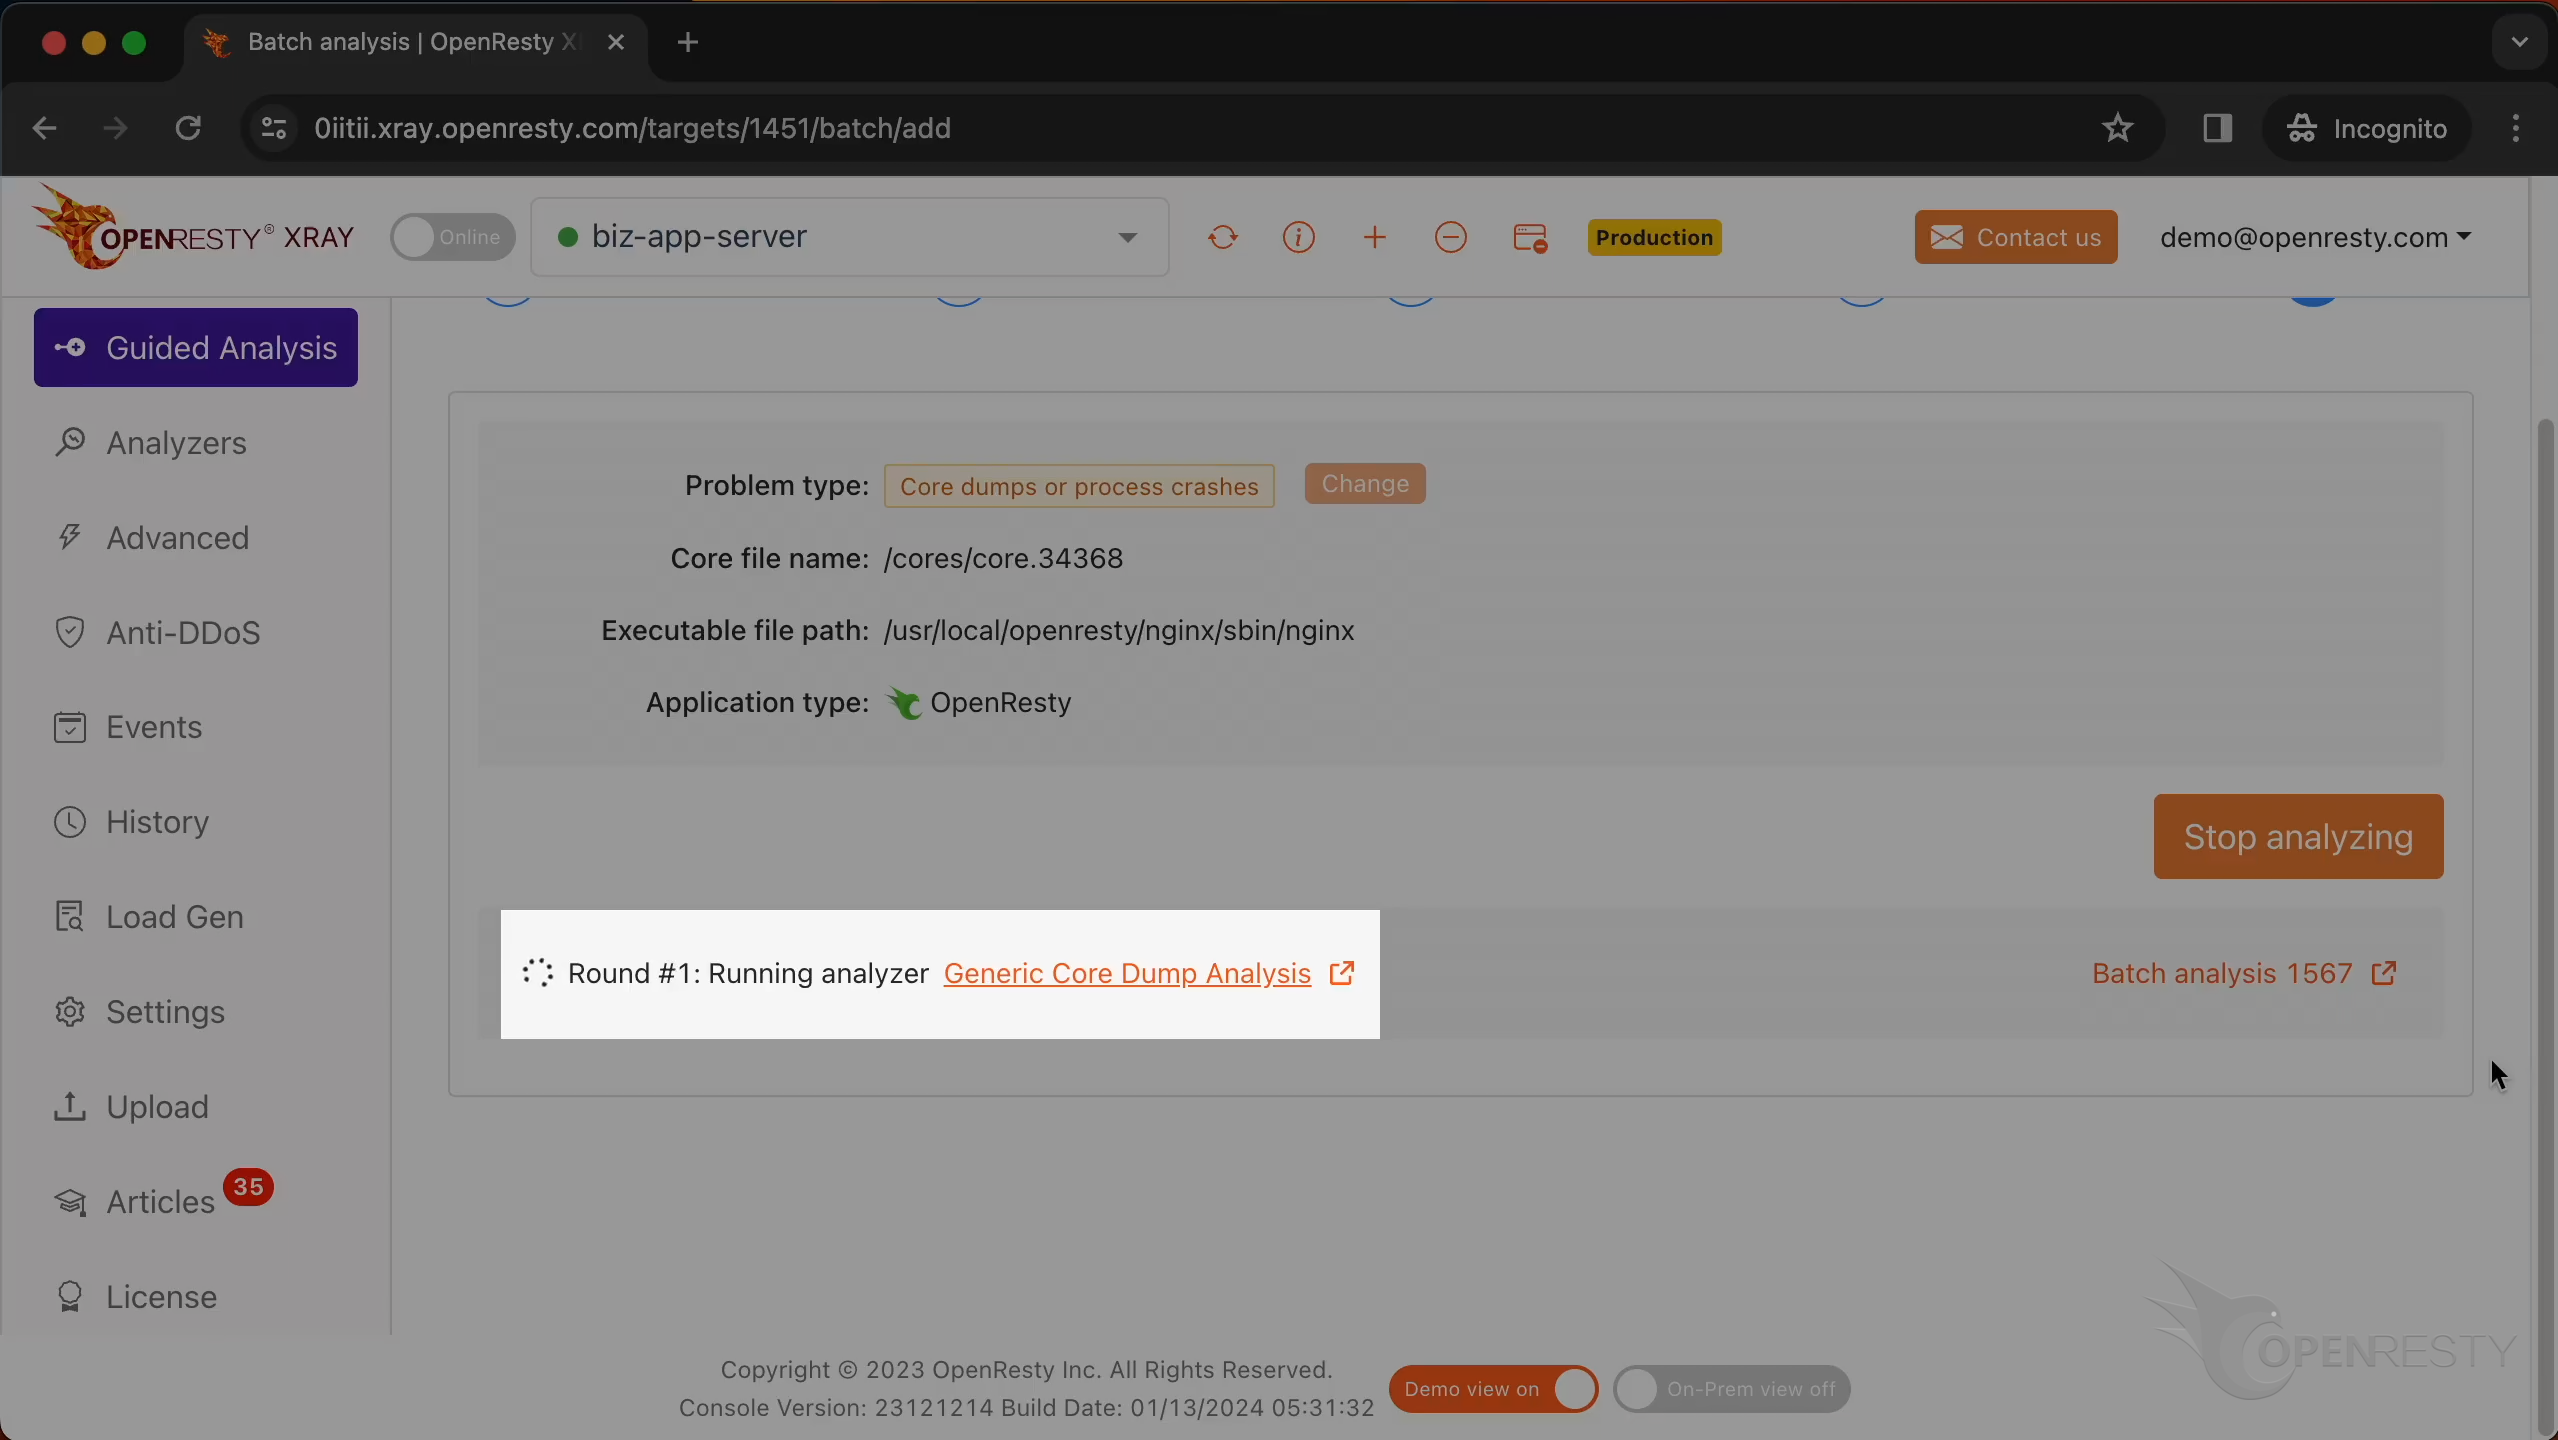
Let’s start analyzing. The system is executing the analysis.
The analysis is done and it is generating a report.
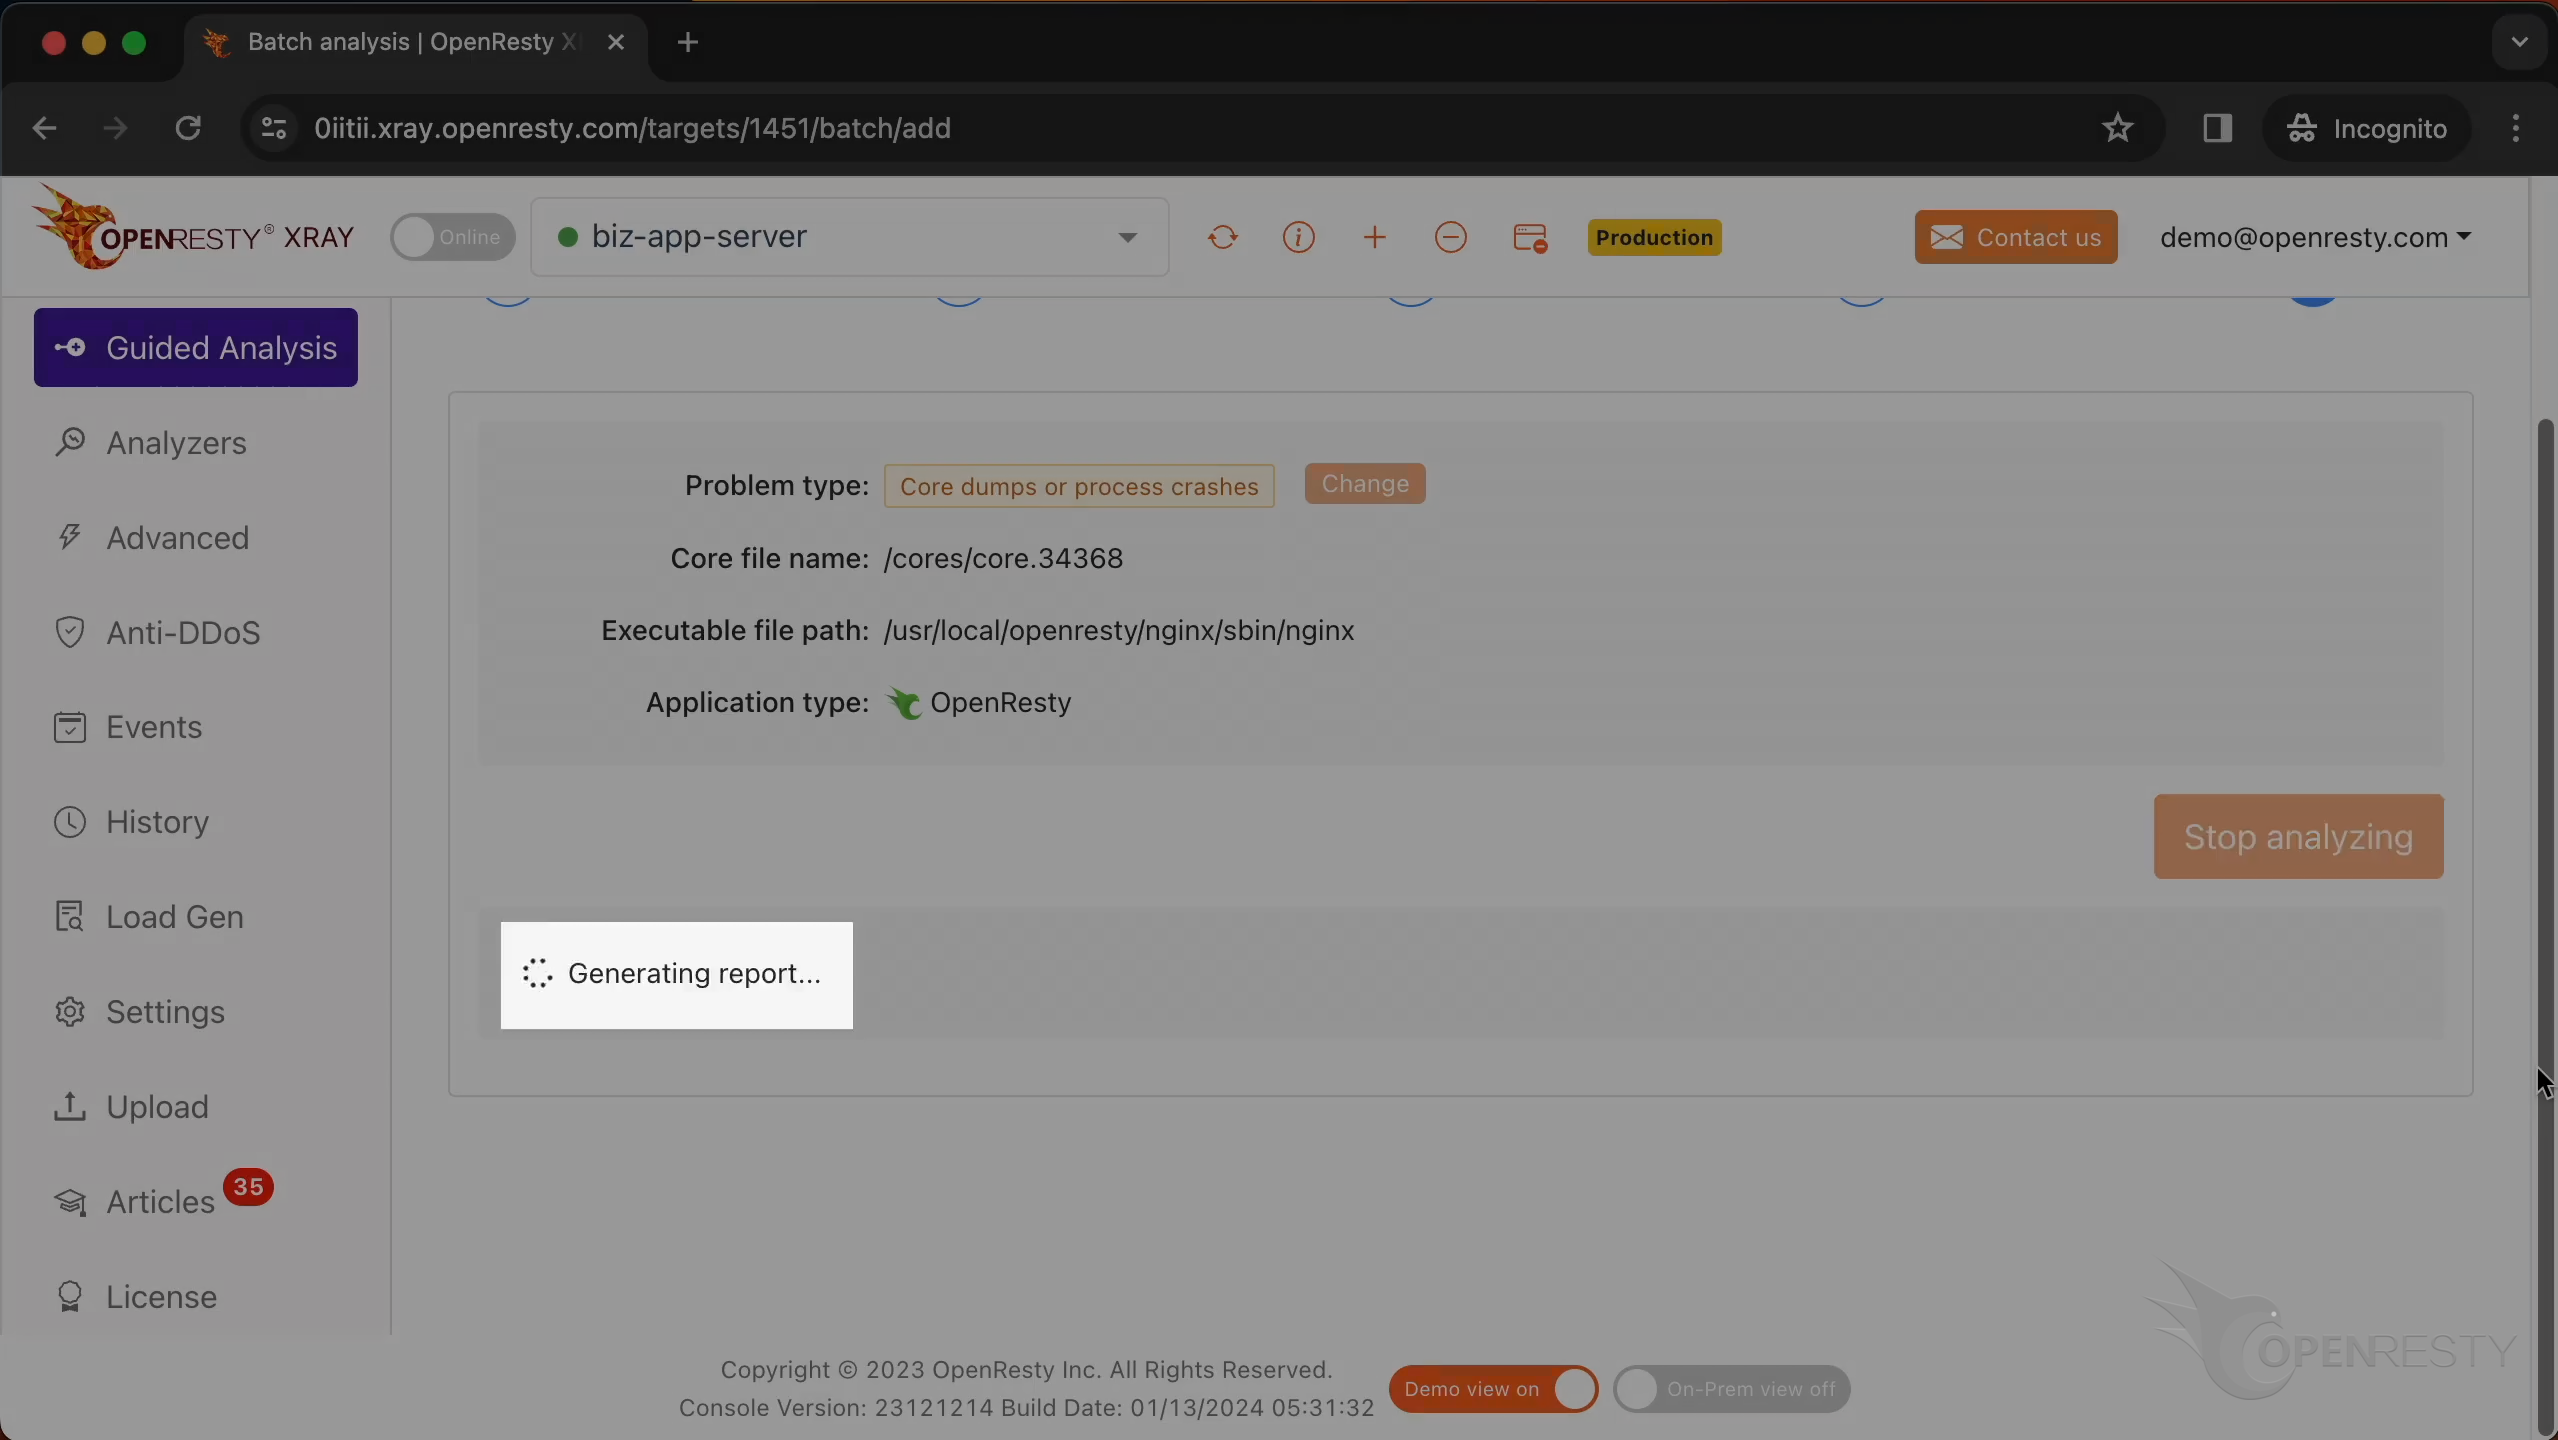
We can see it automatically created an analysis report.
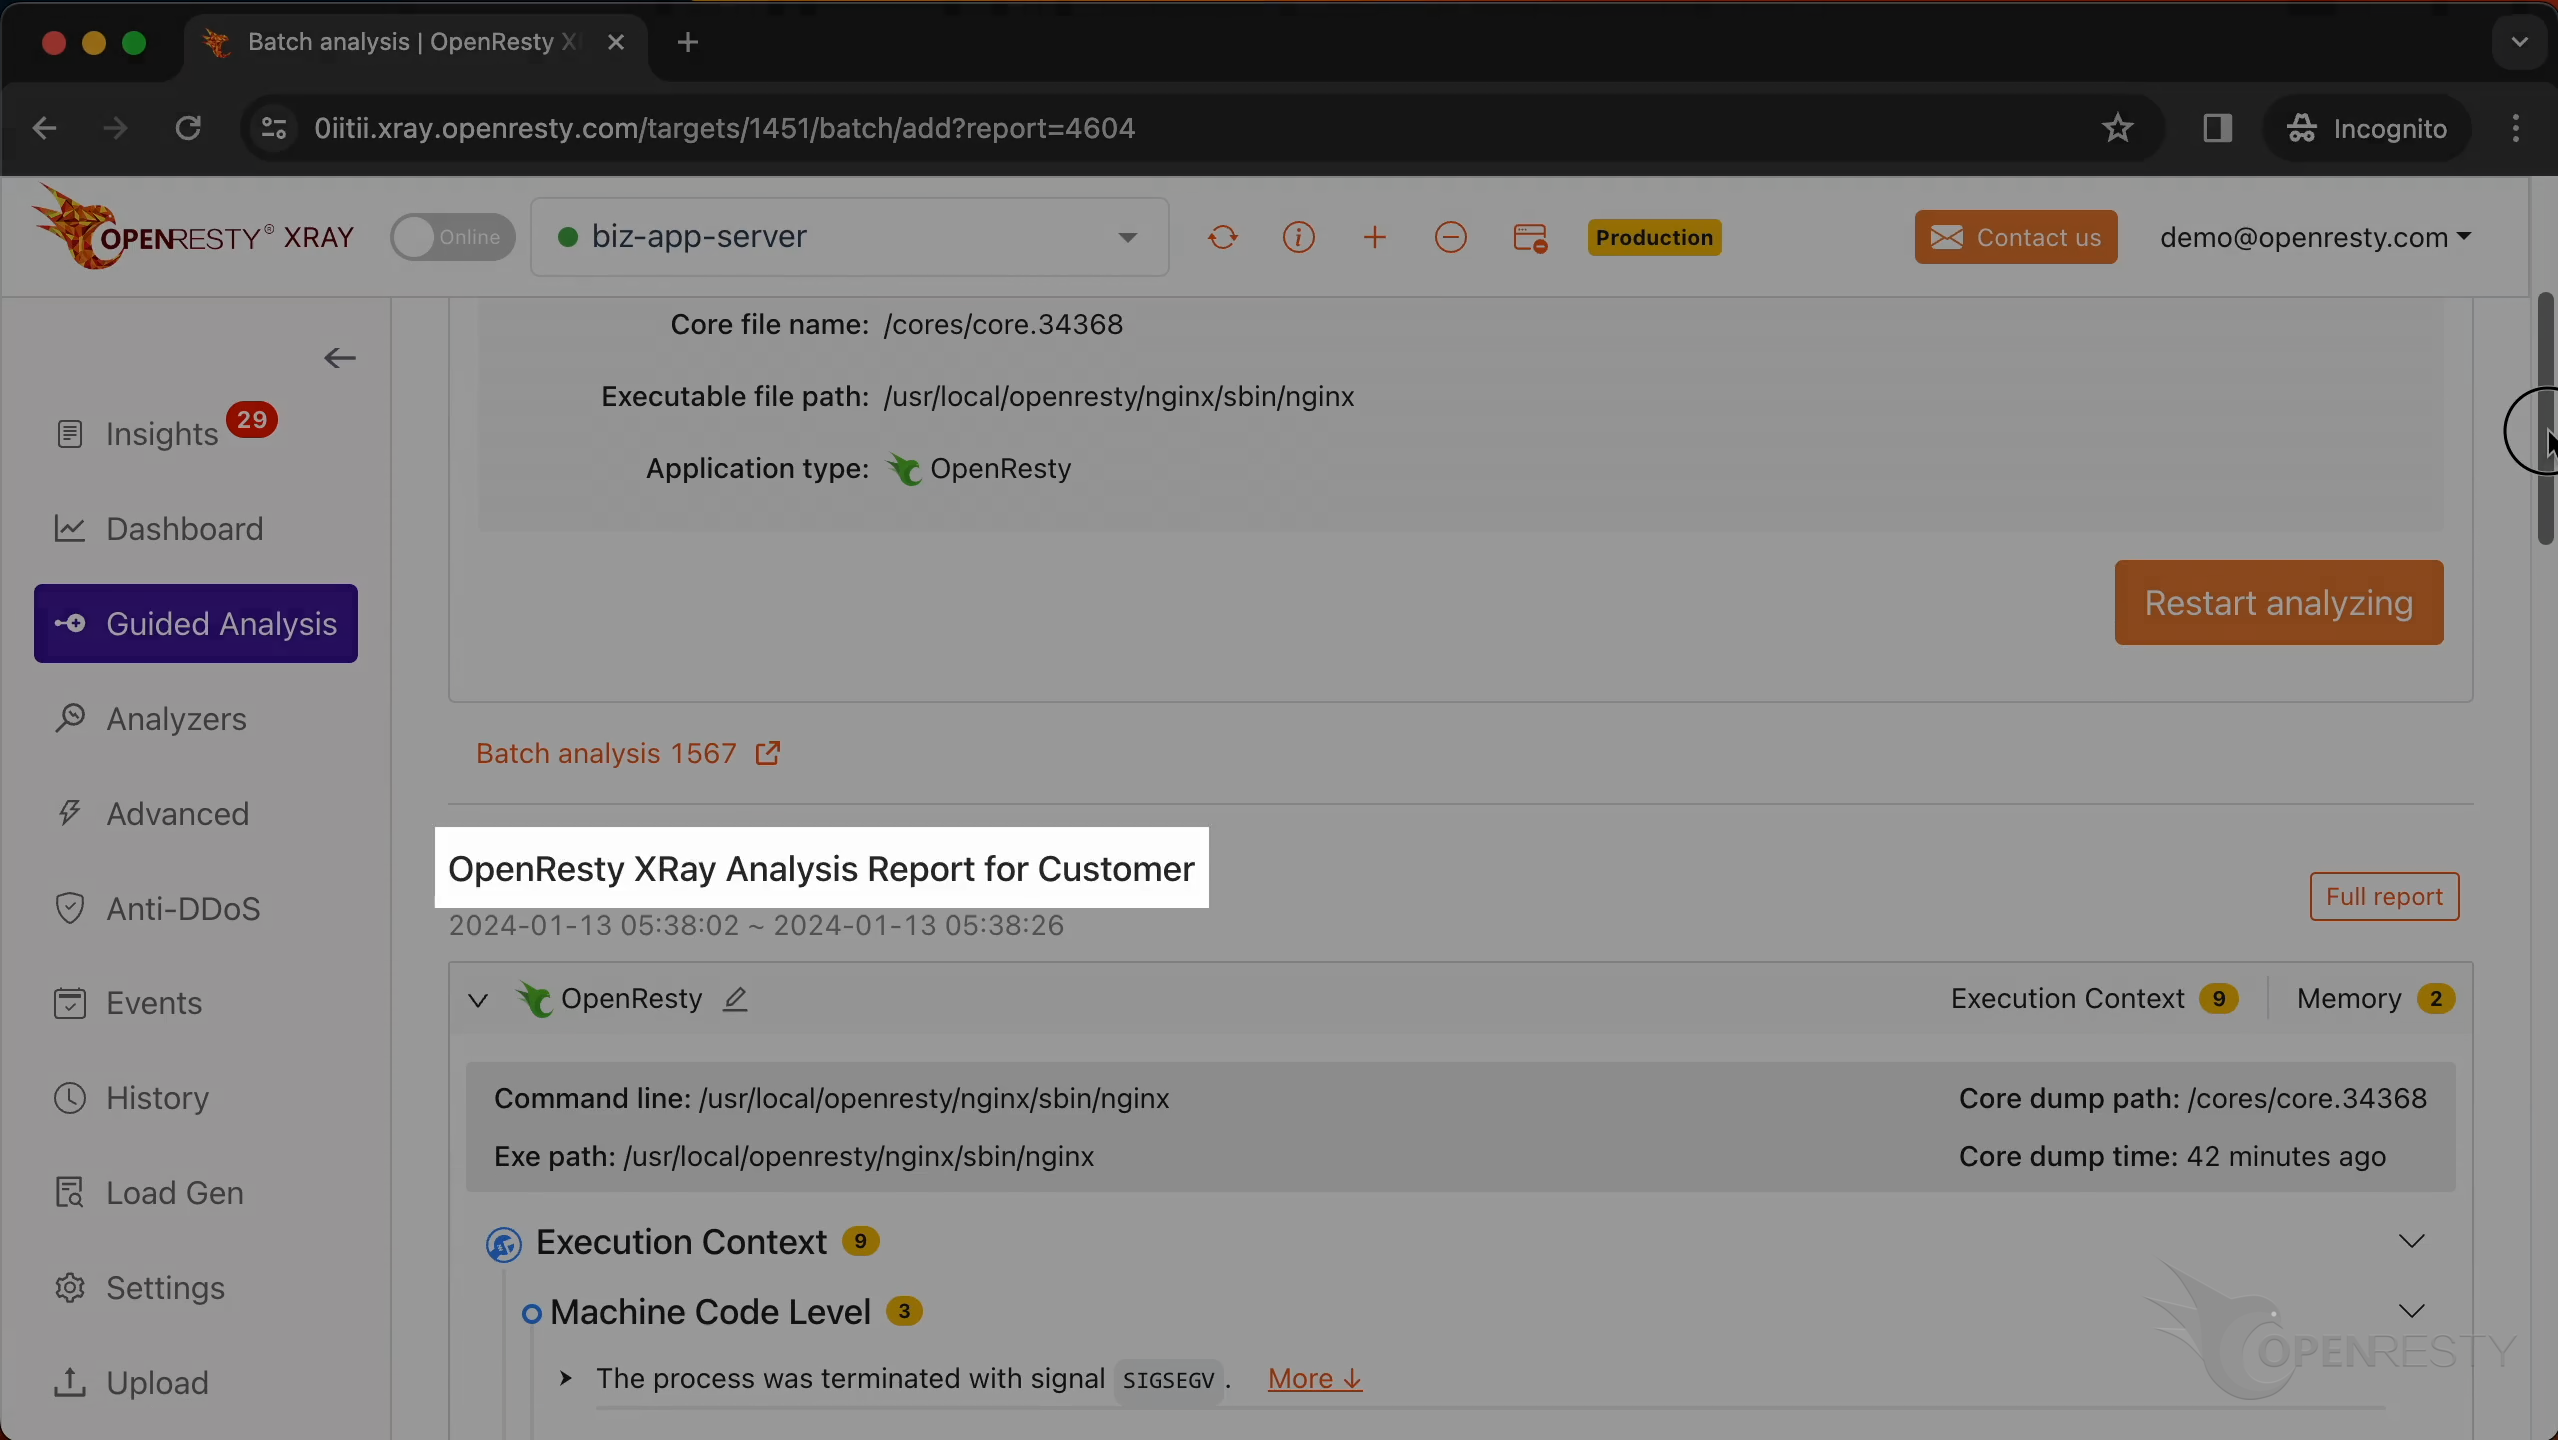
In the top right of the report, you can see the path of the core file and when it was created.
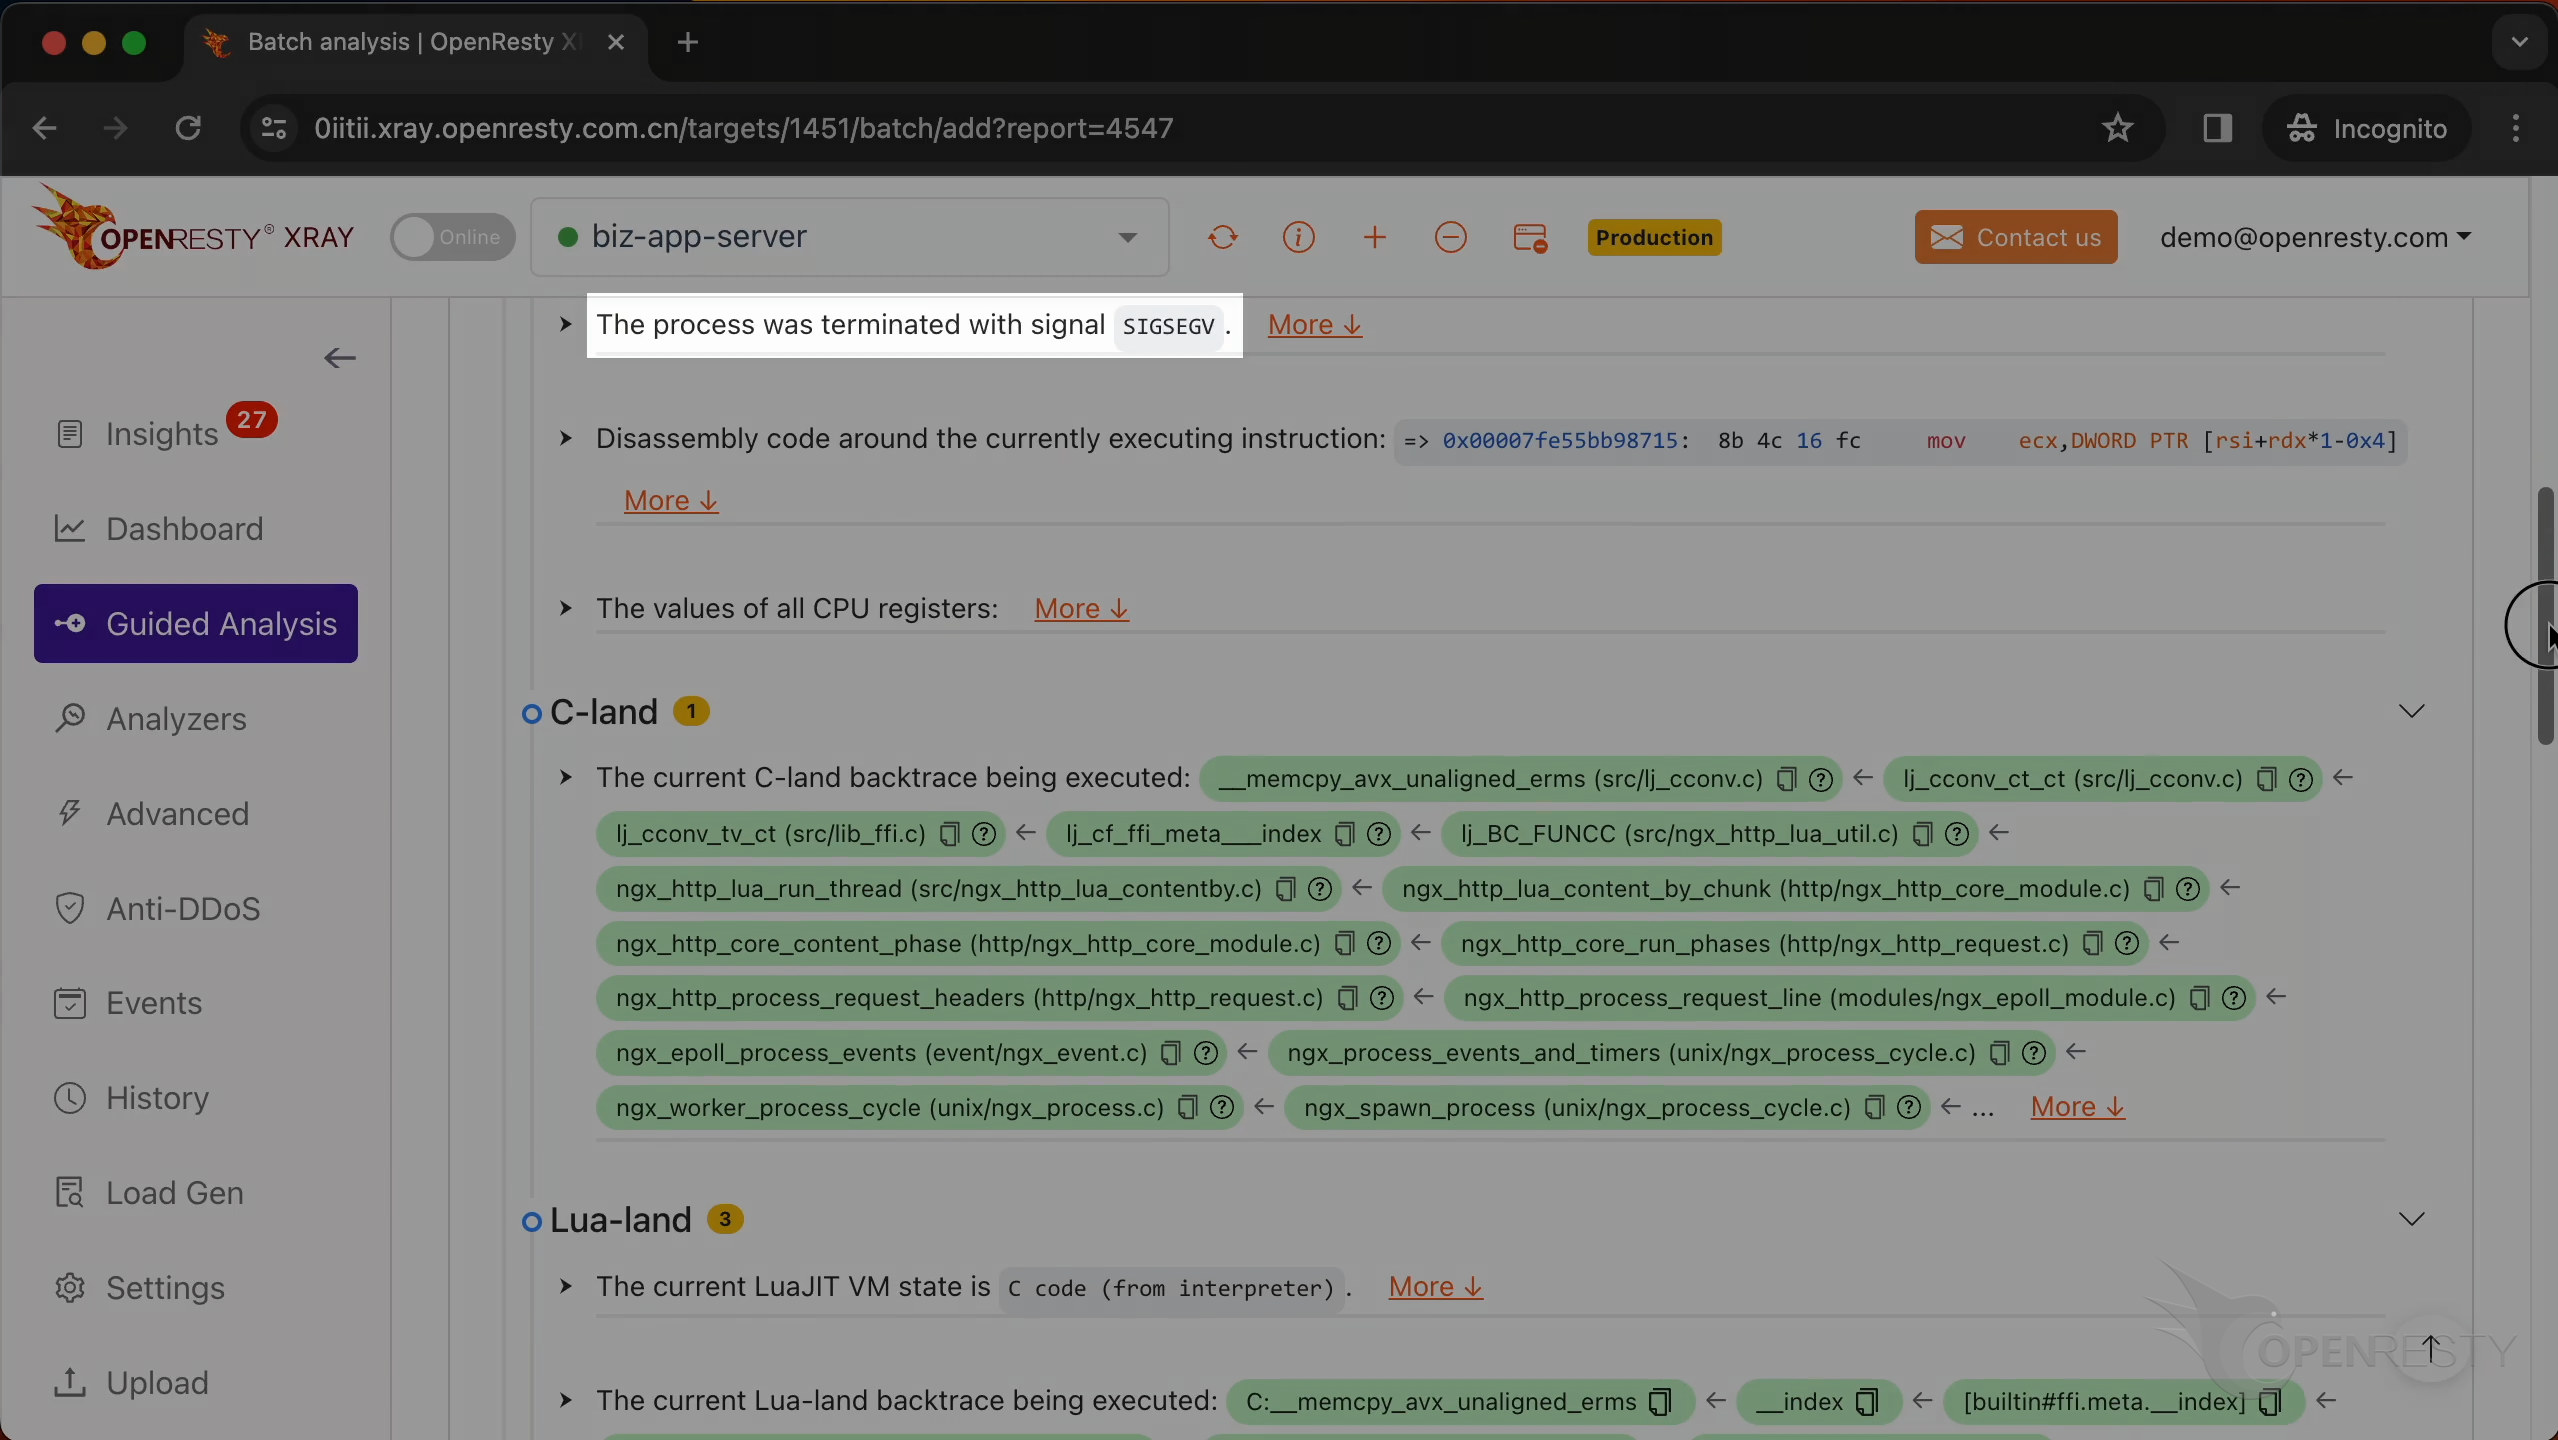
Let’s check the execution context first.
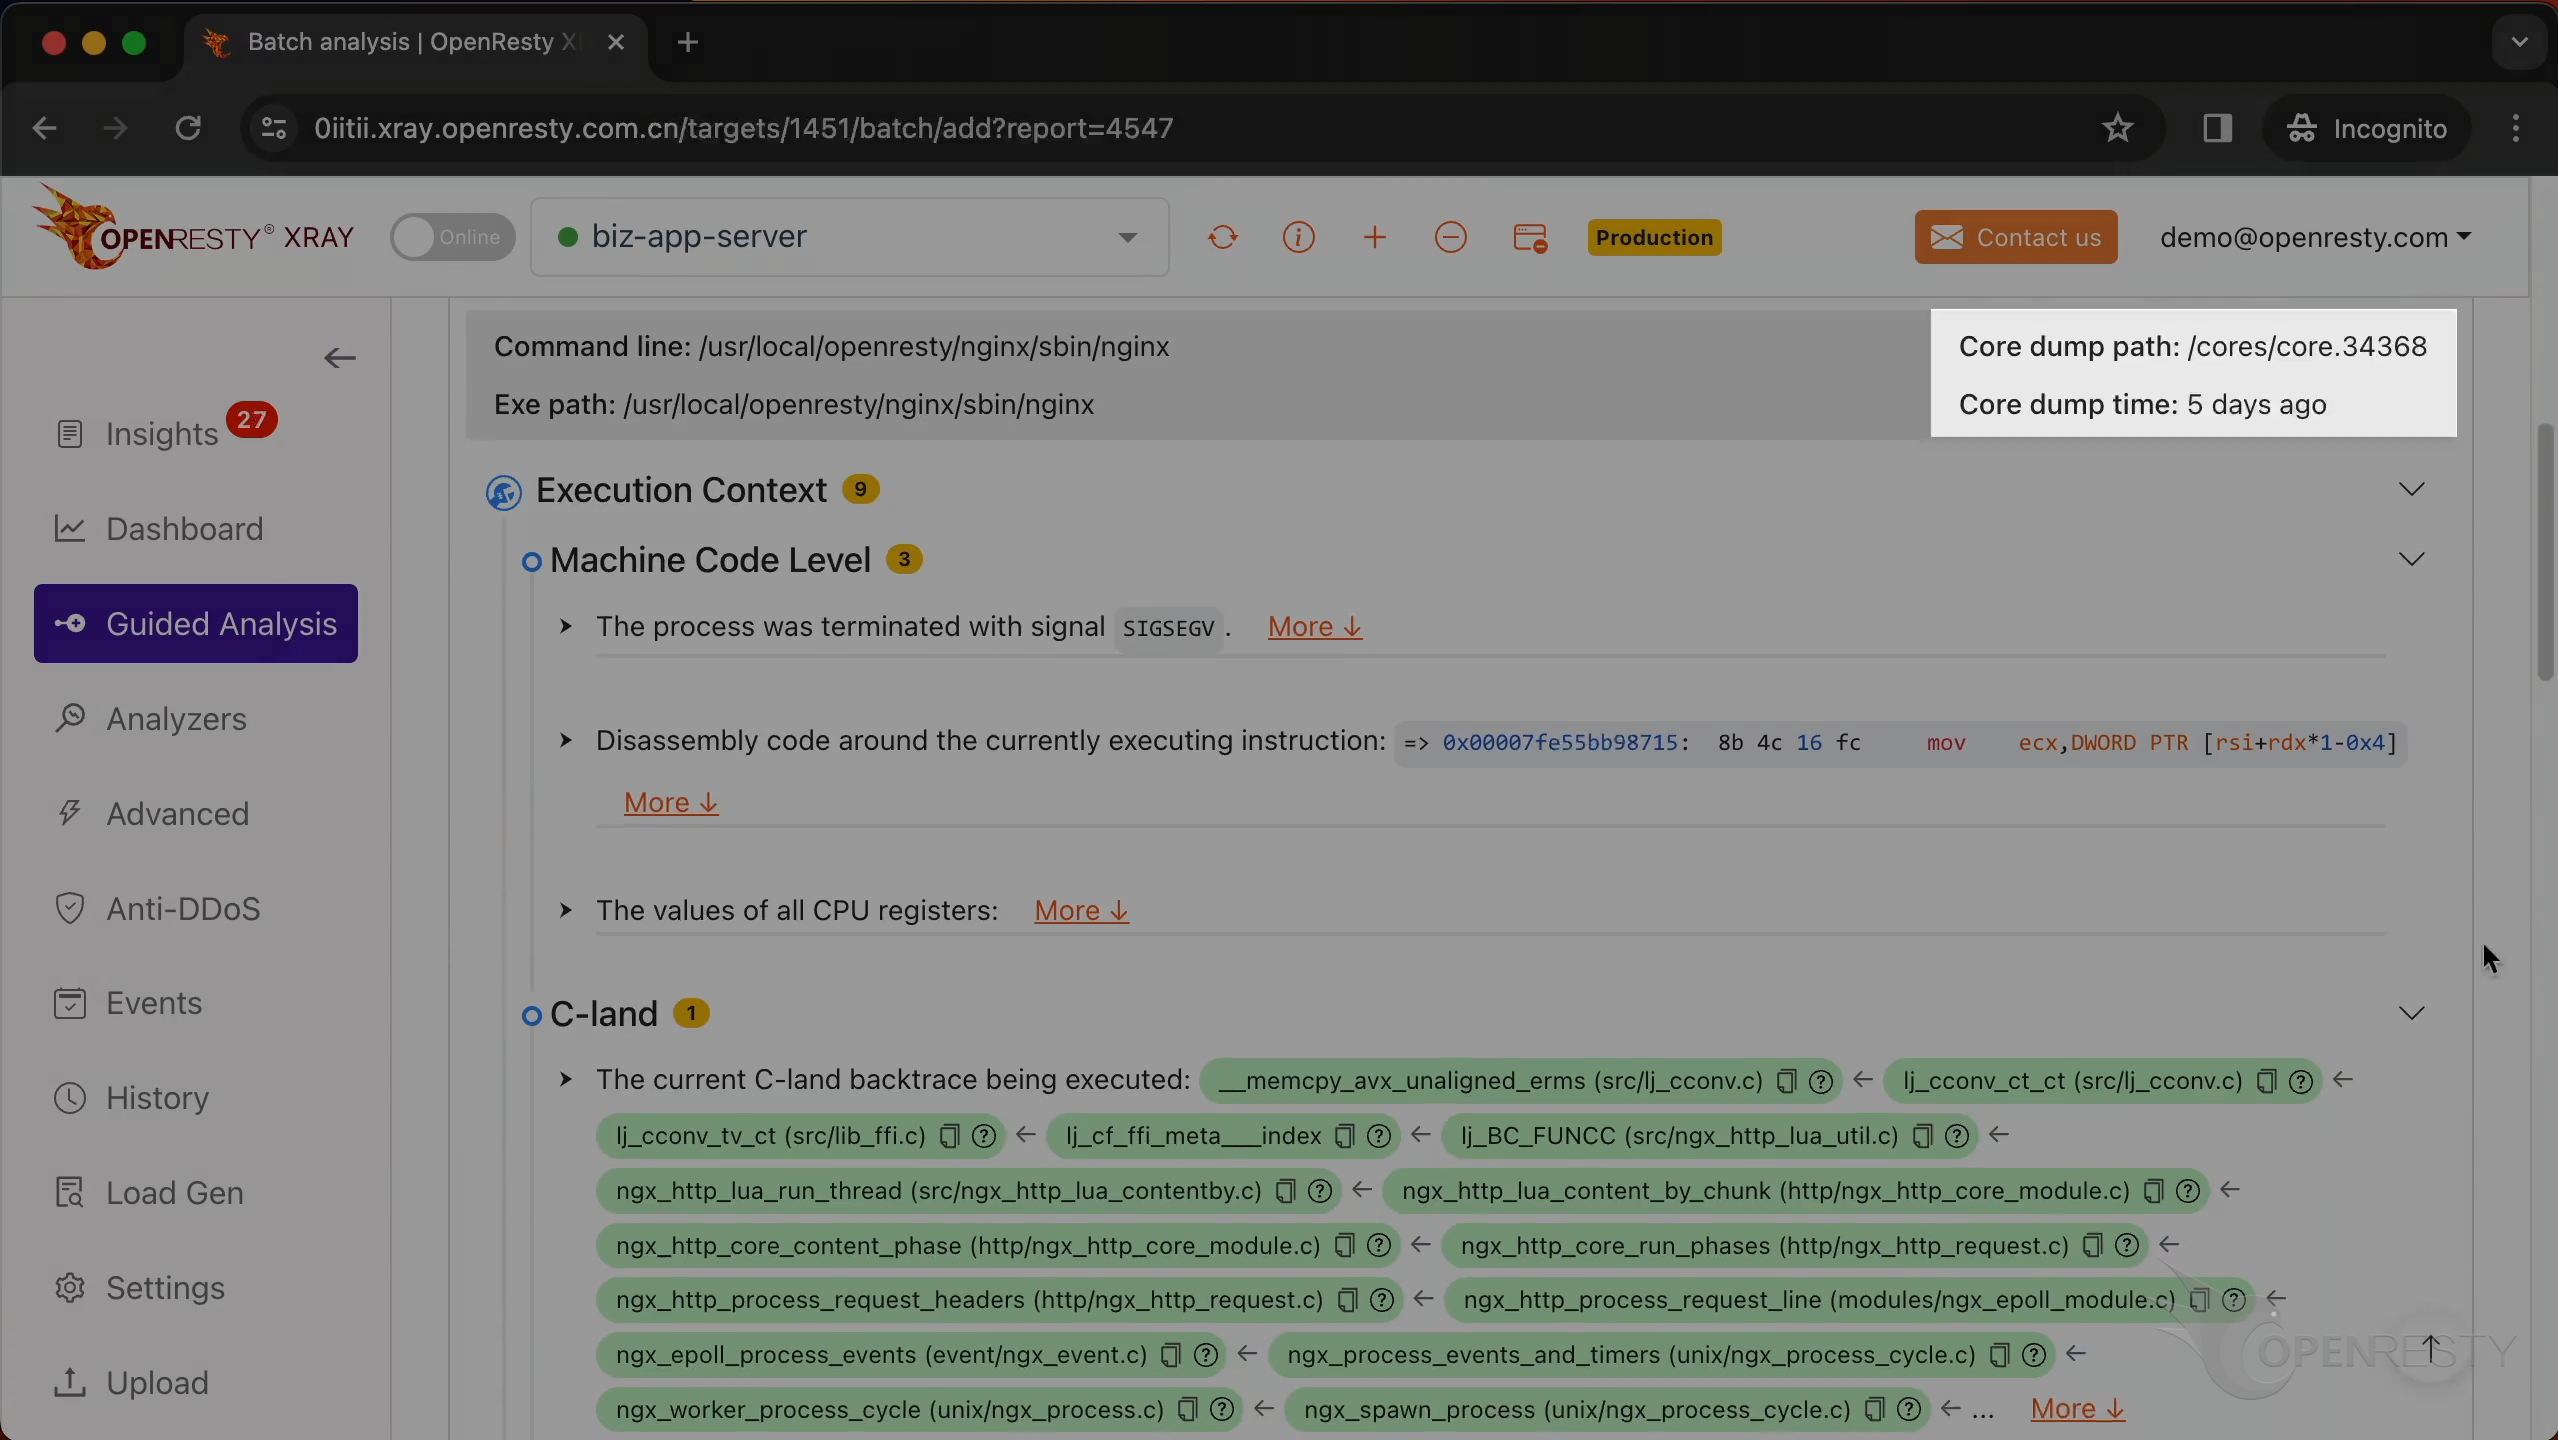
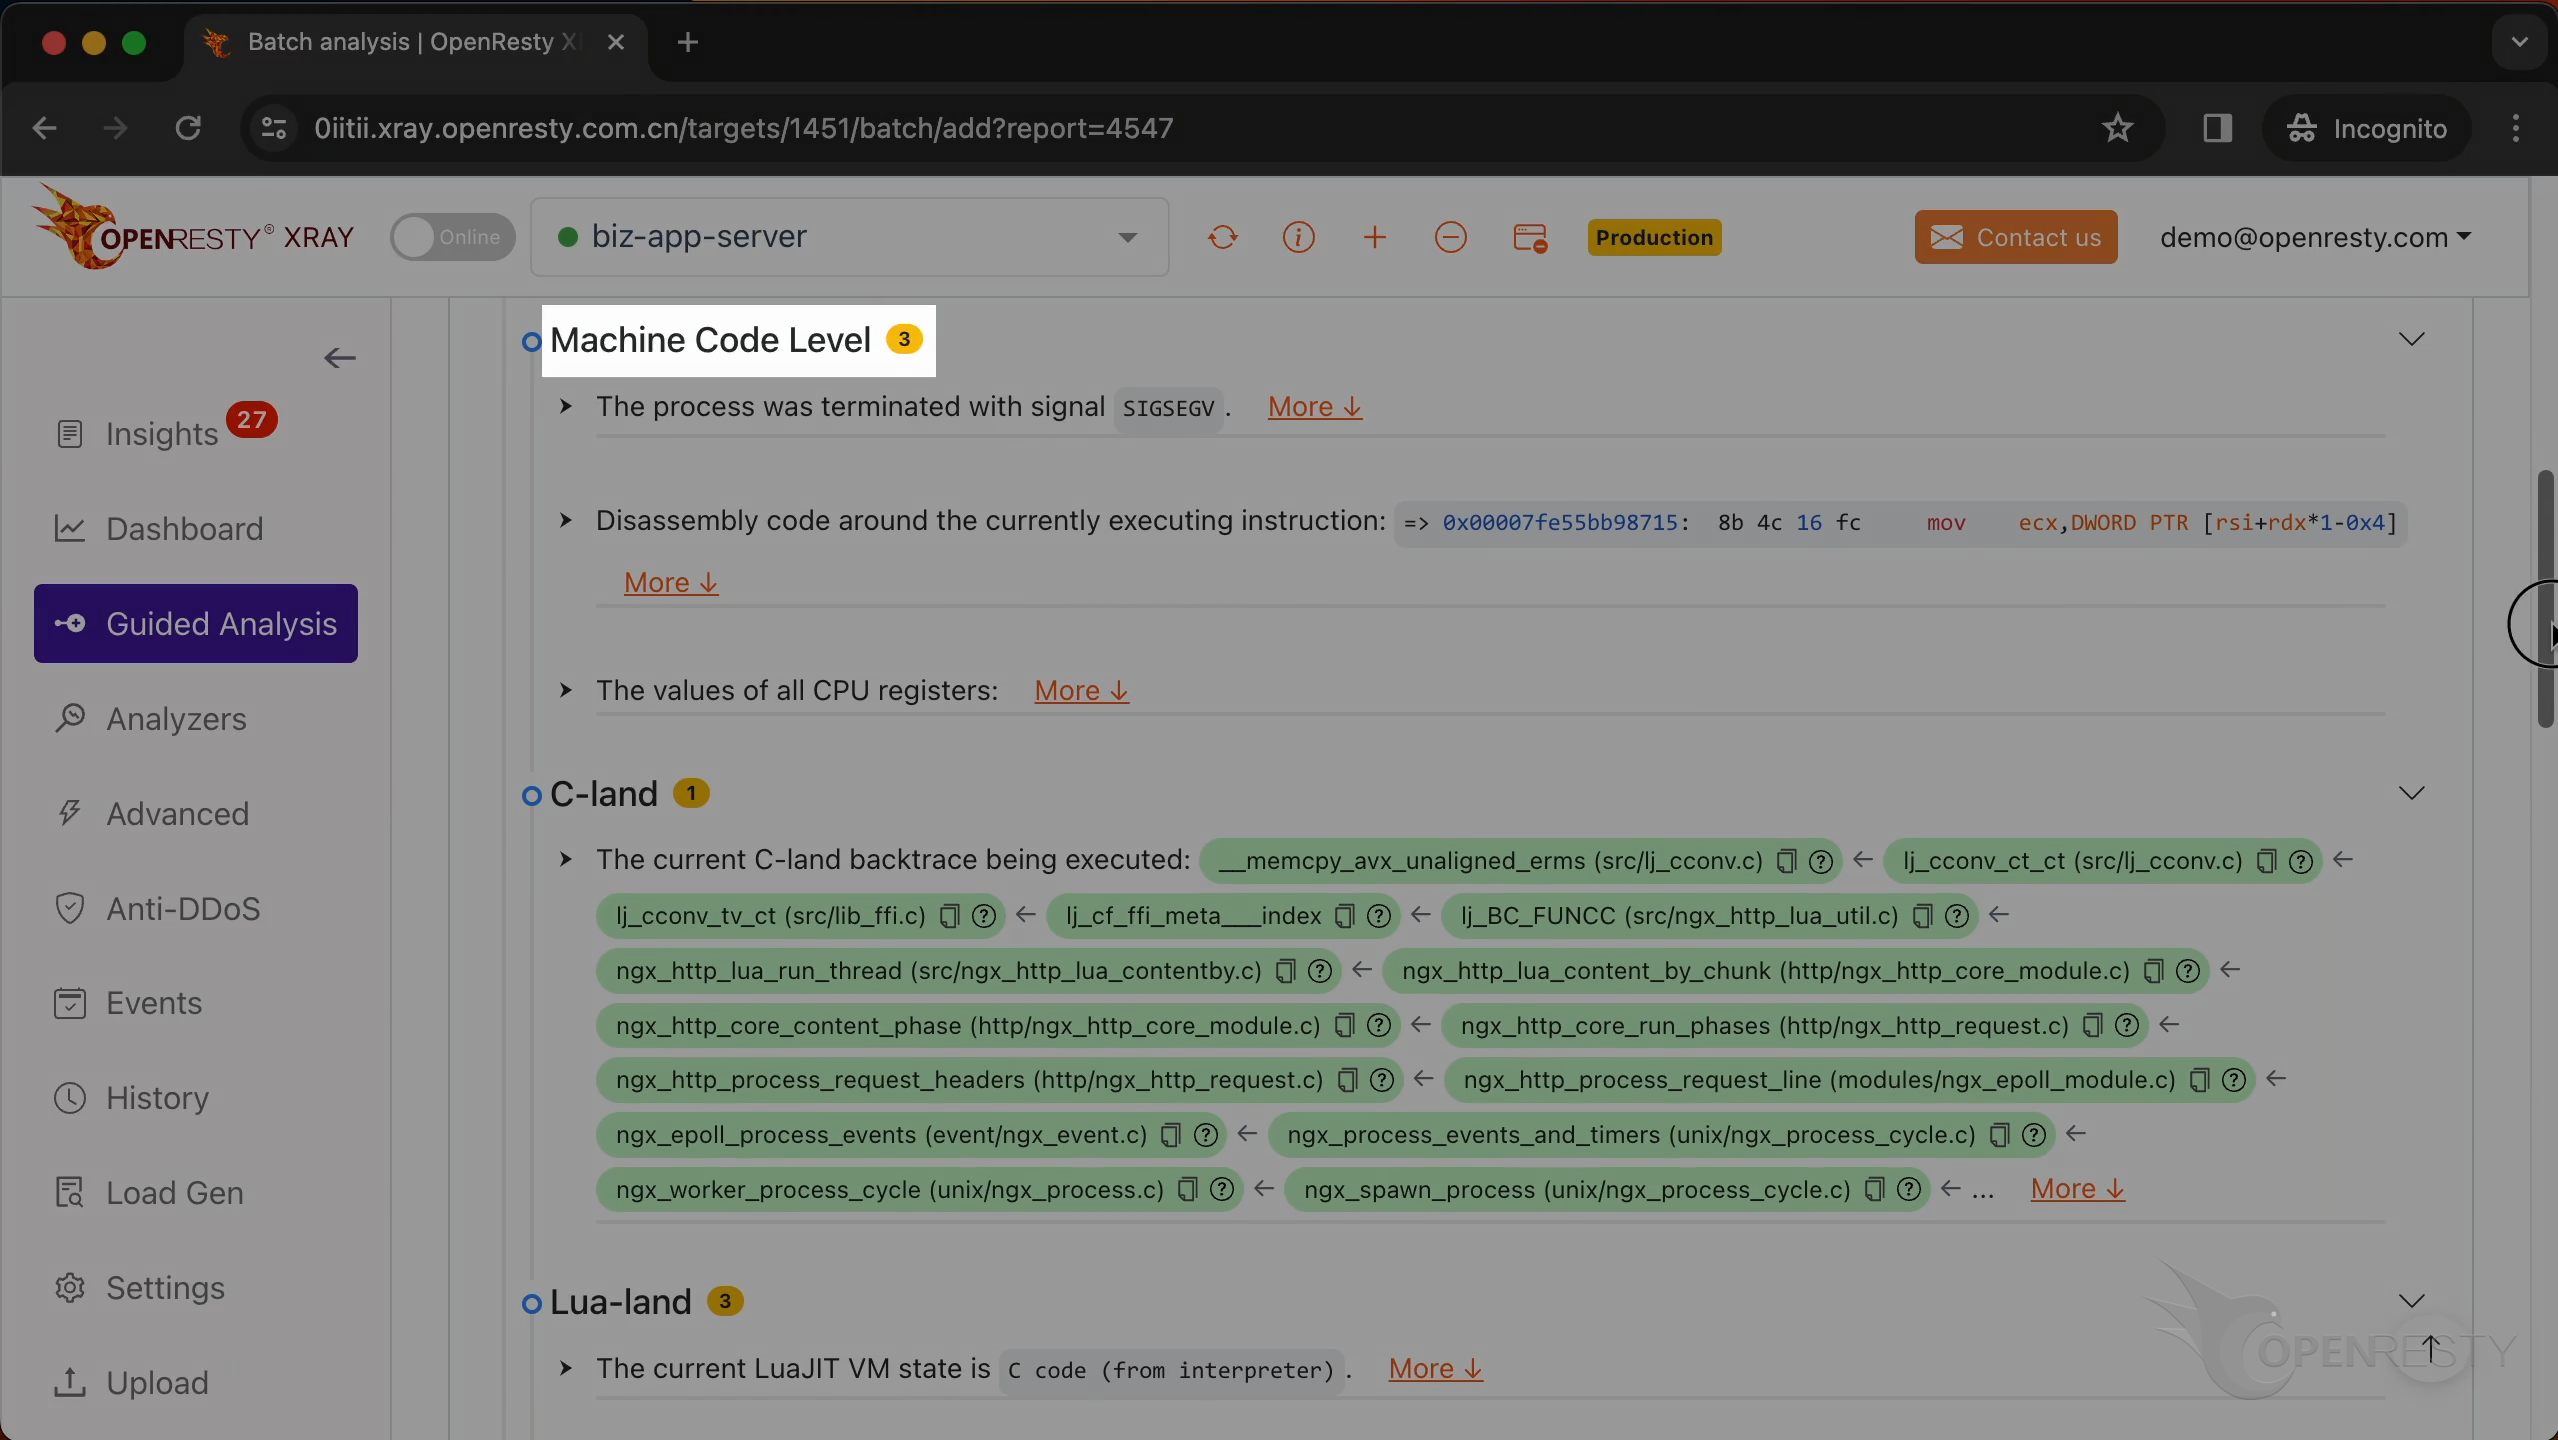
Check the machine code level information.
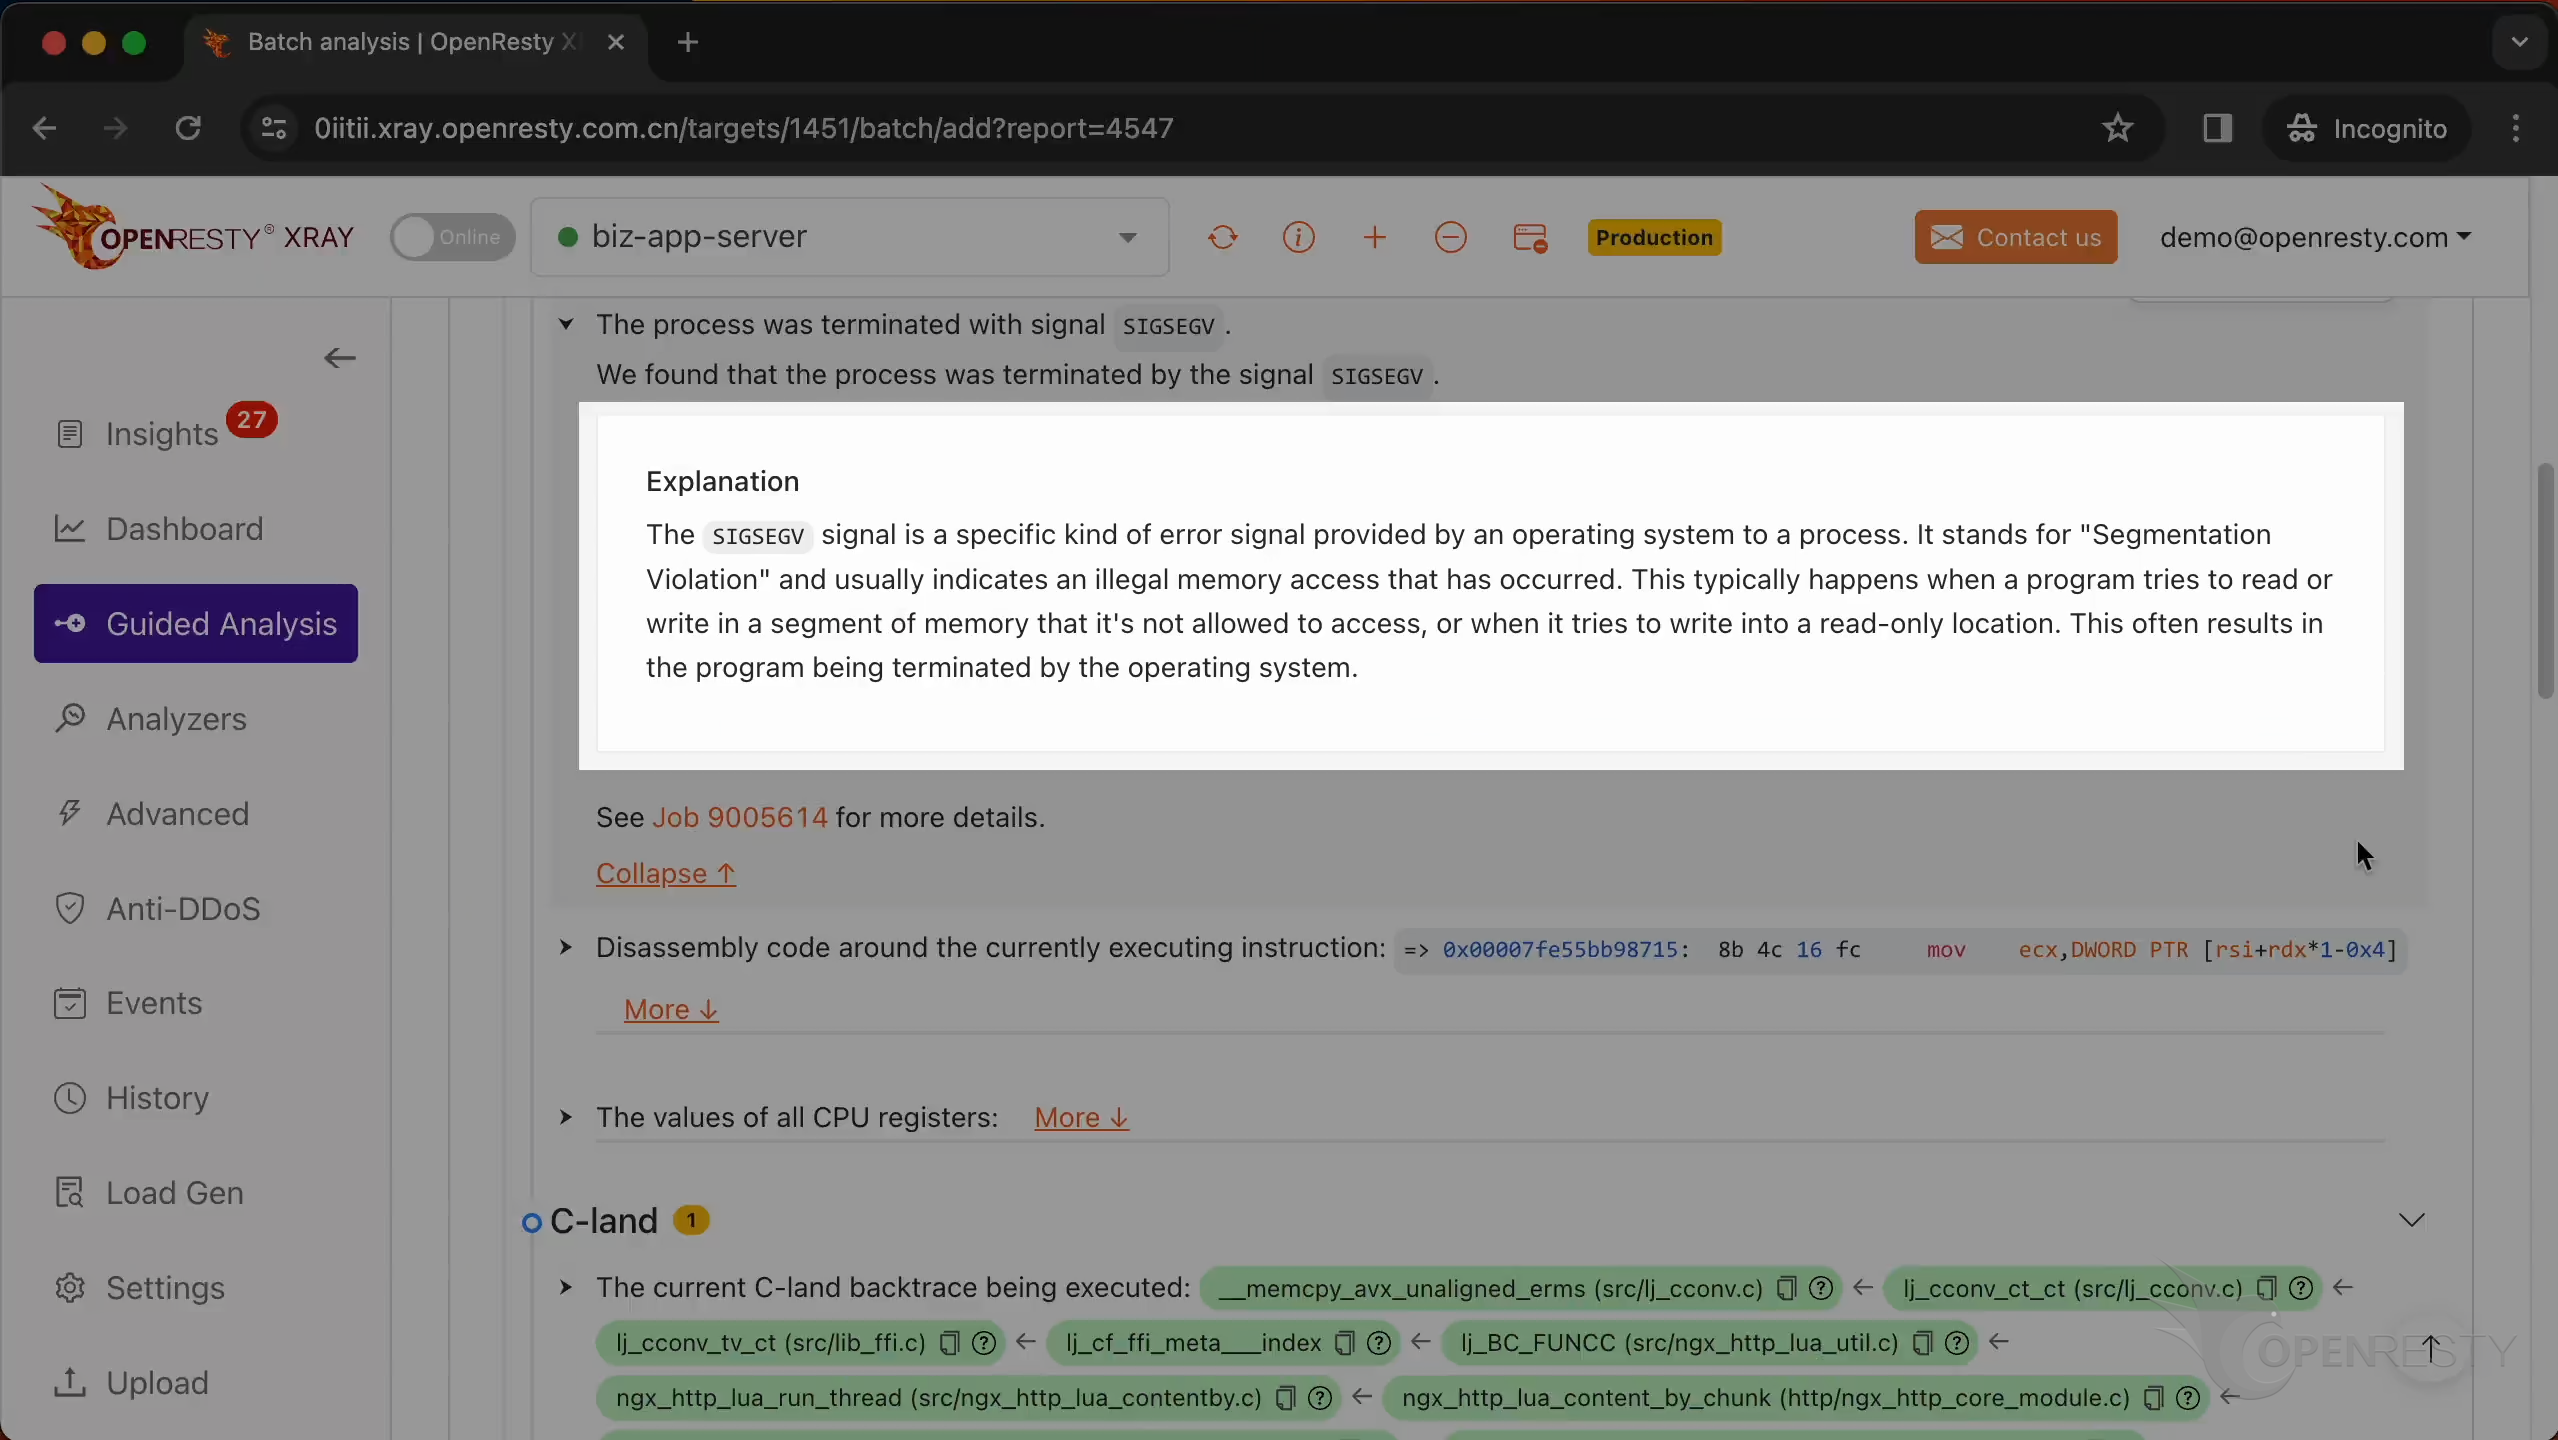
It is the SEGV signal that triggered the core dump.
Below are the detailed explanations of this signal. SEGV stands for “Segmentation Violation” and usually indicates an illegal memory access that has occurred.
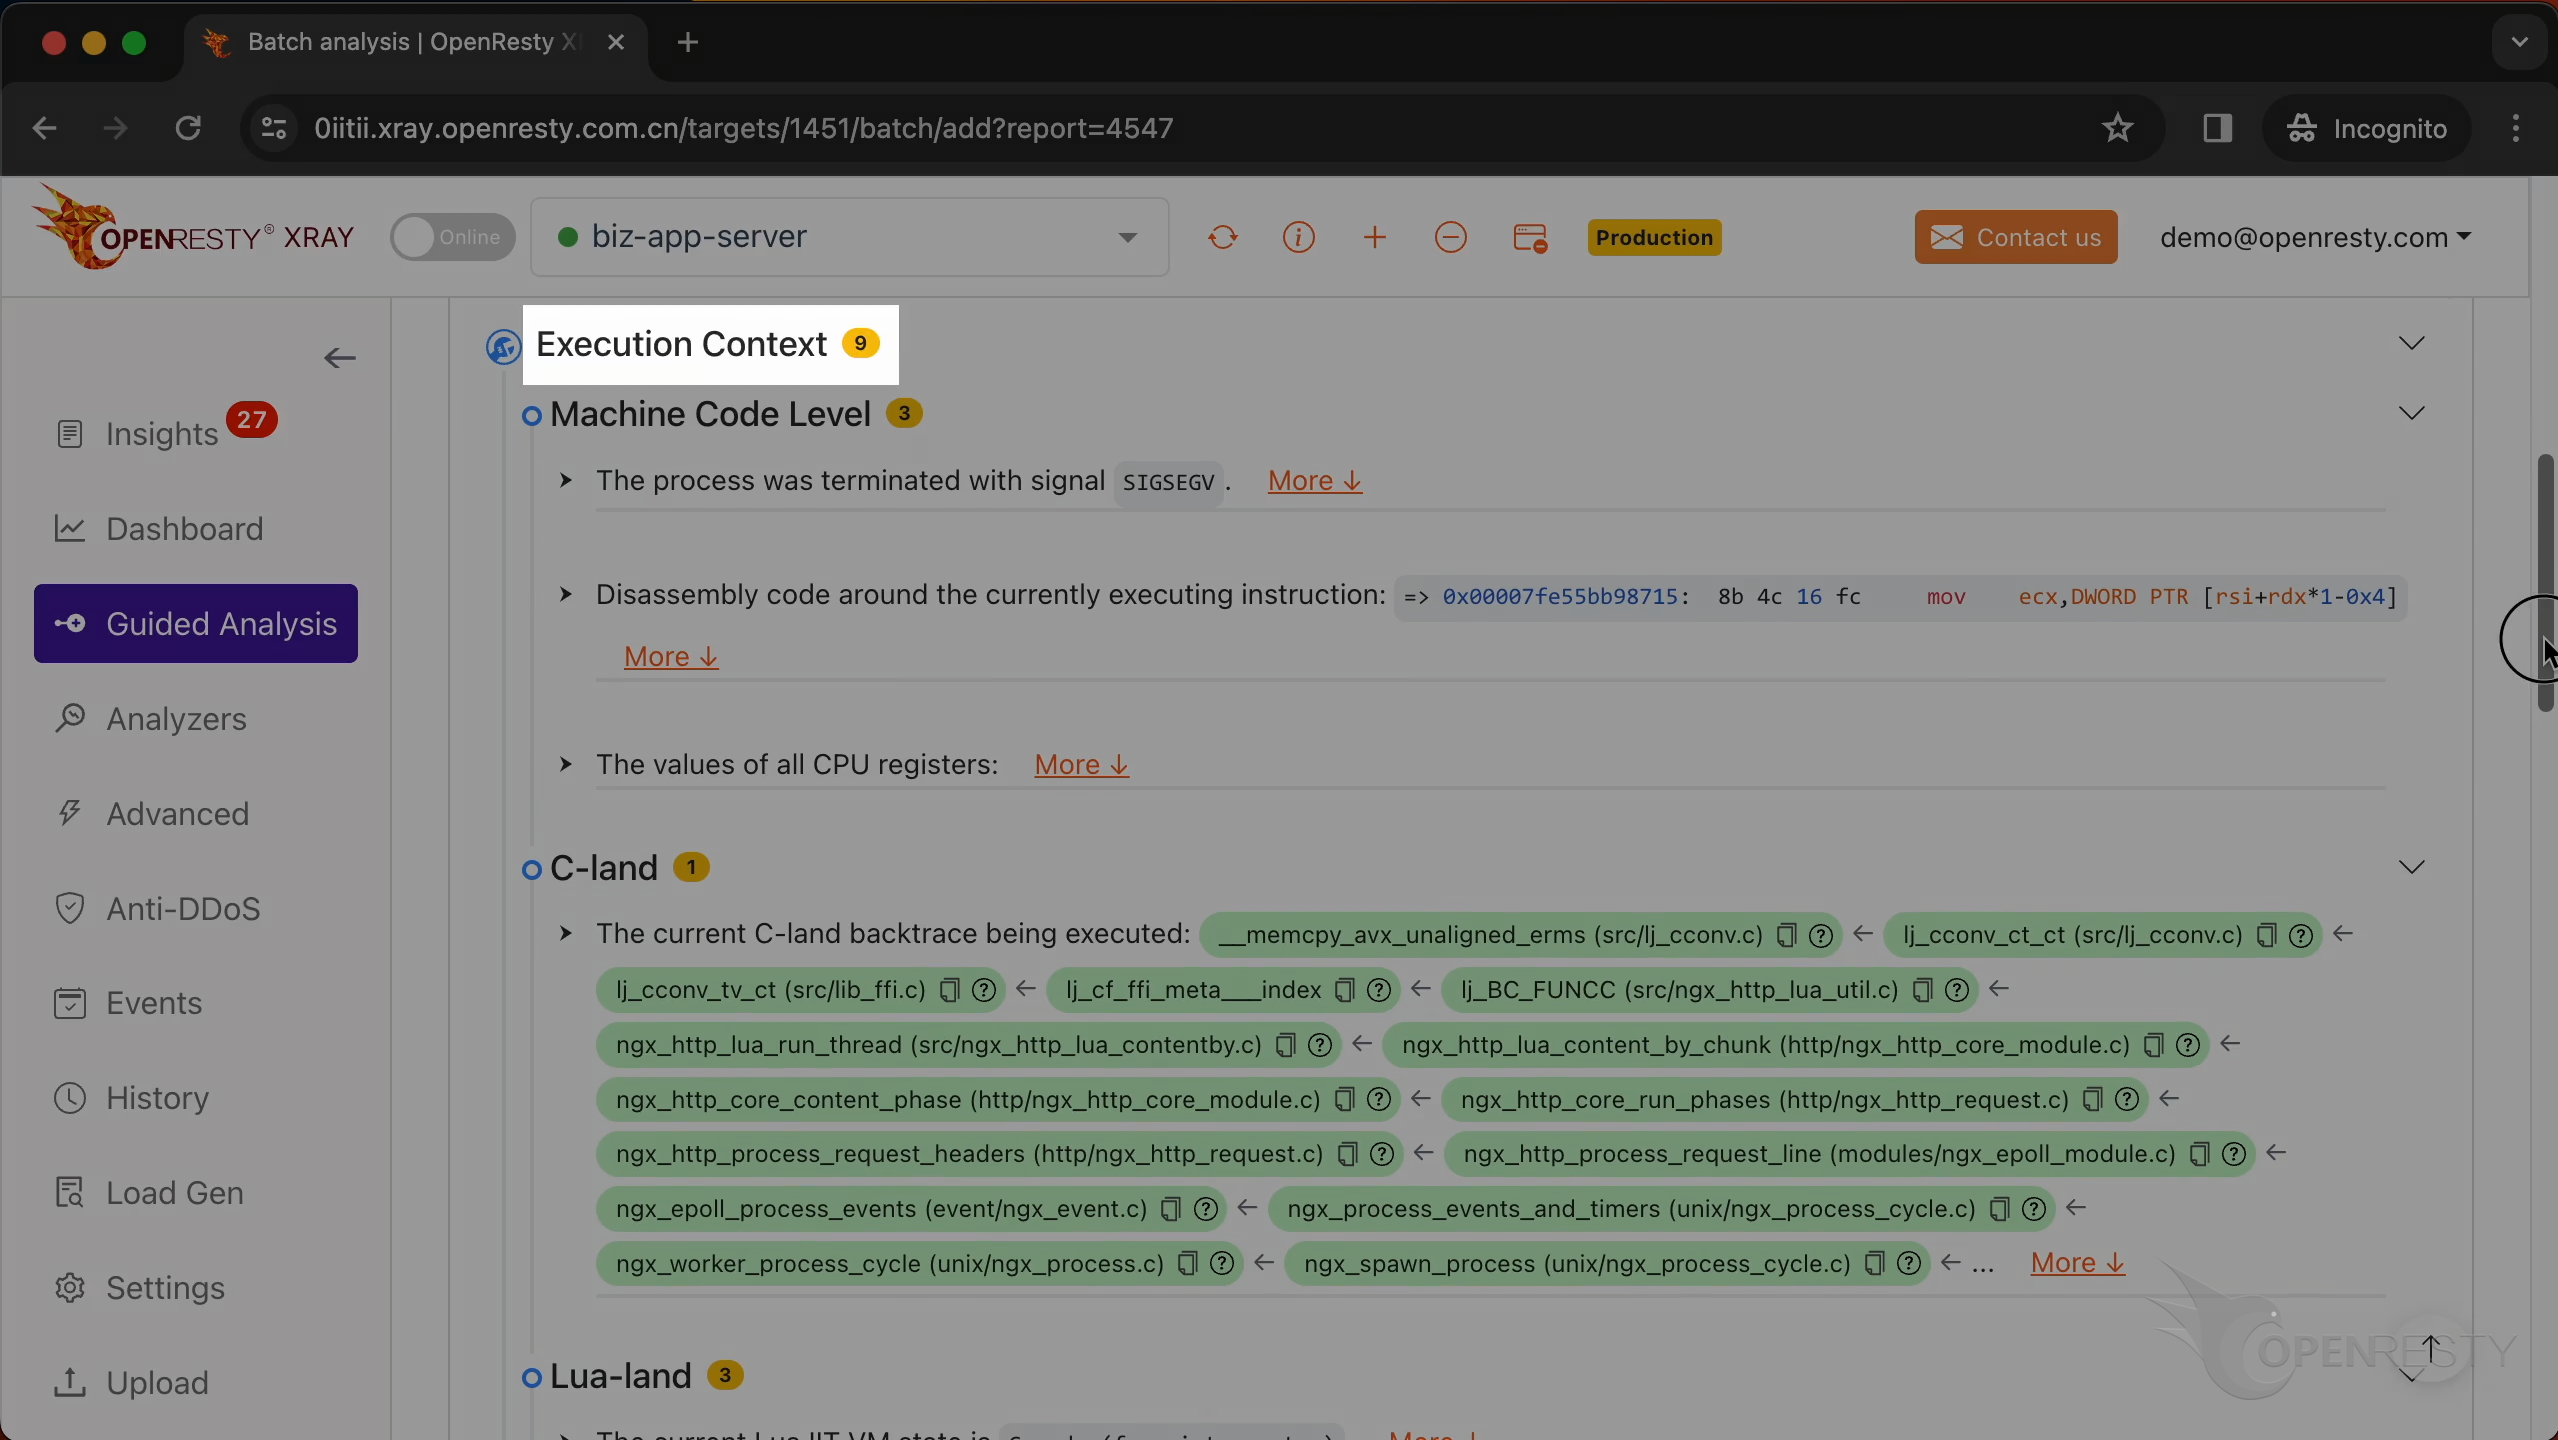
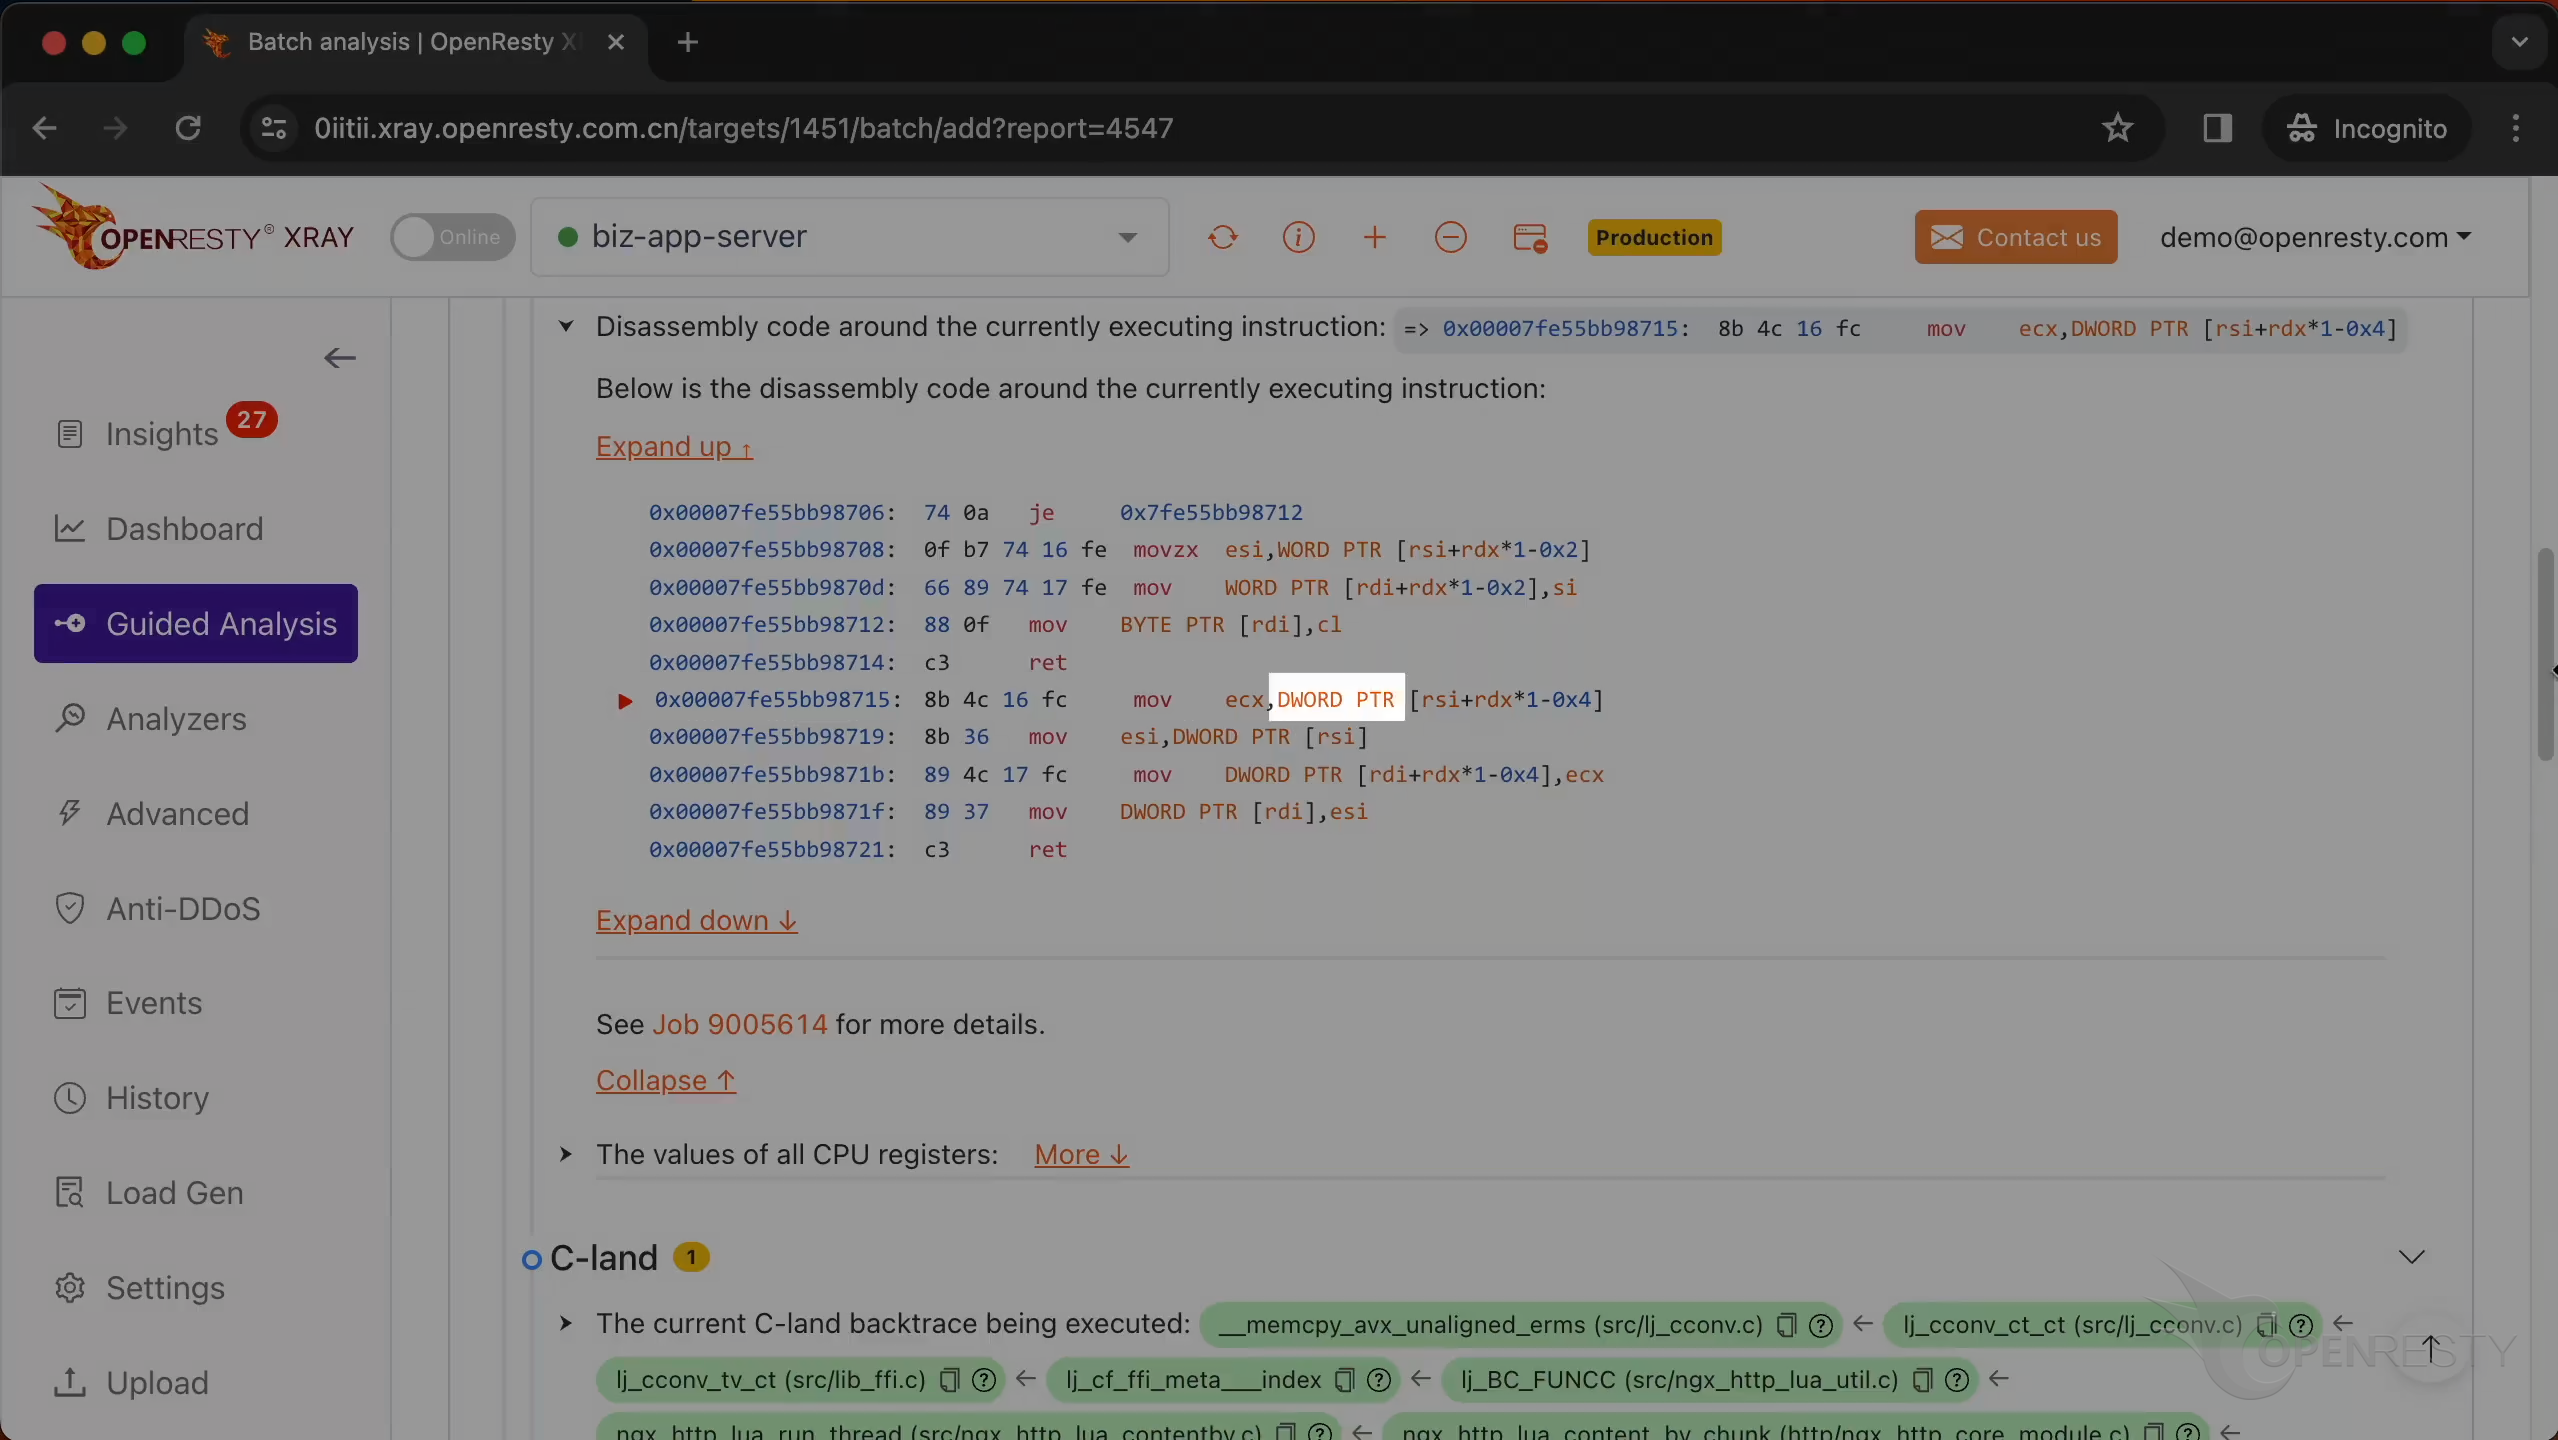
In this section, you will find the disassembly code around the currently executing instruction.
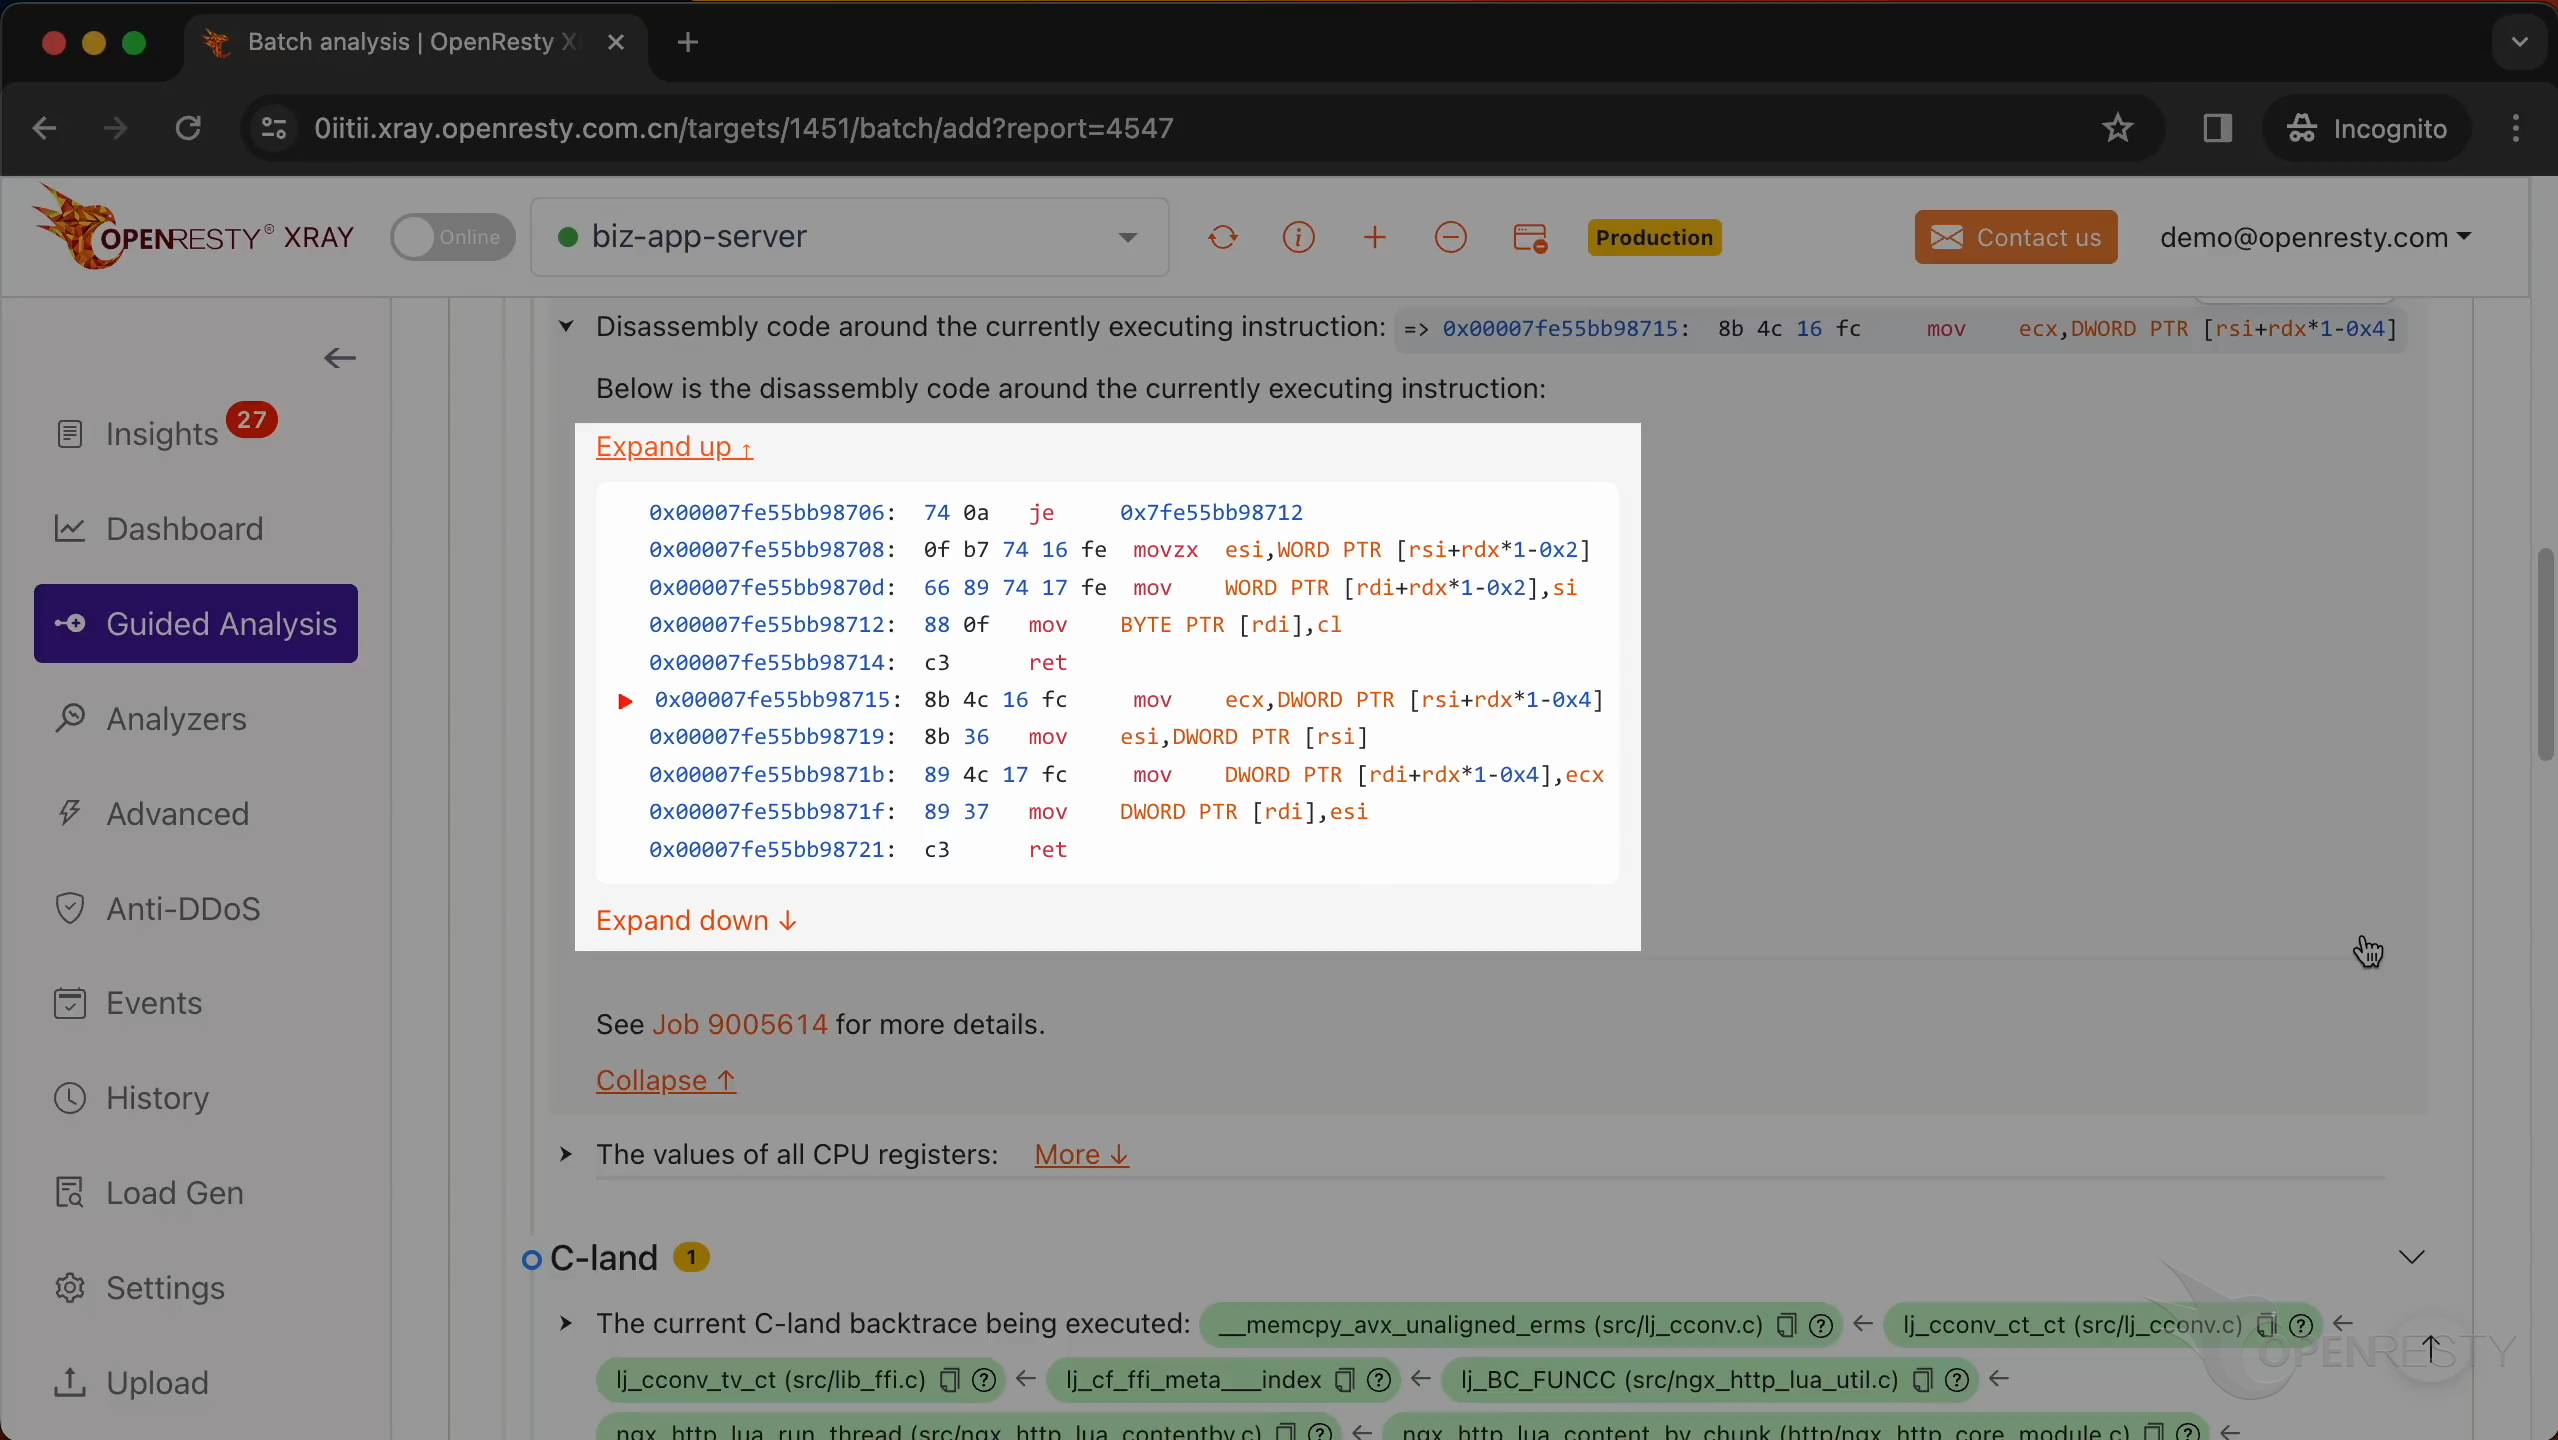
A red arrow in front indicates the instruction currently being executed. A segmentation fault occurred while this instruction was running.
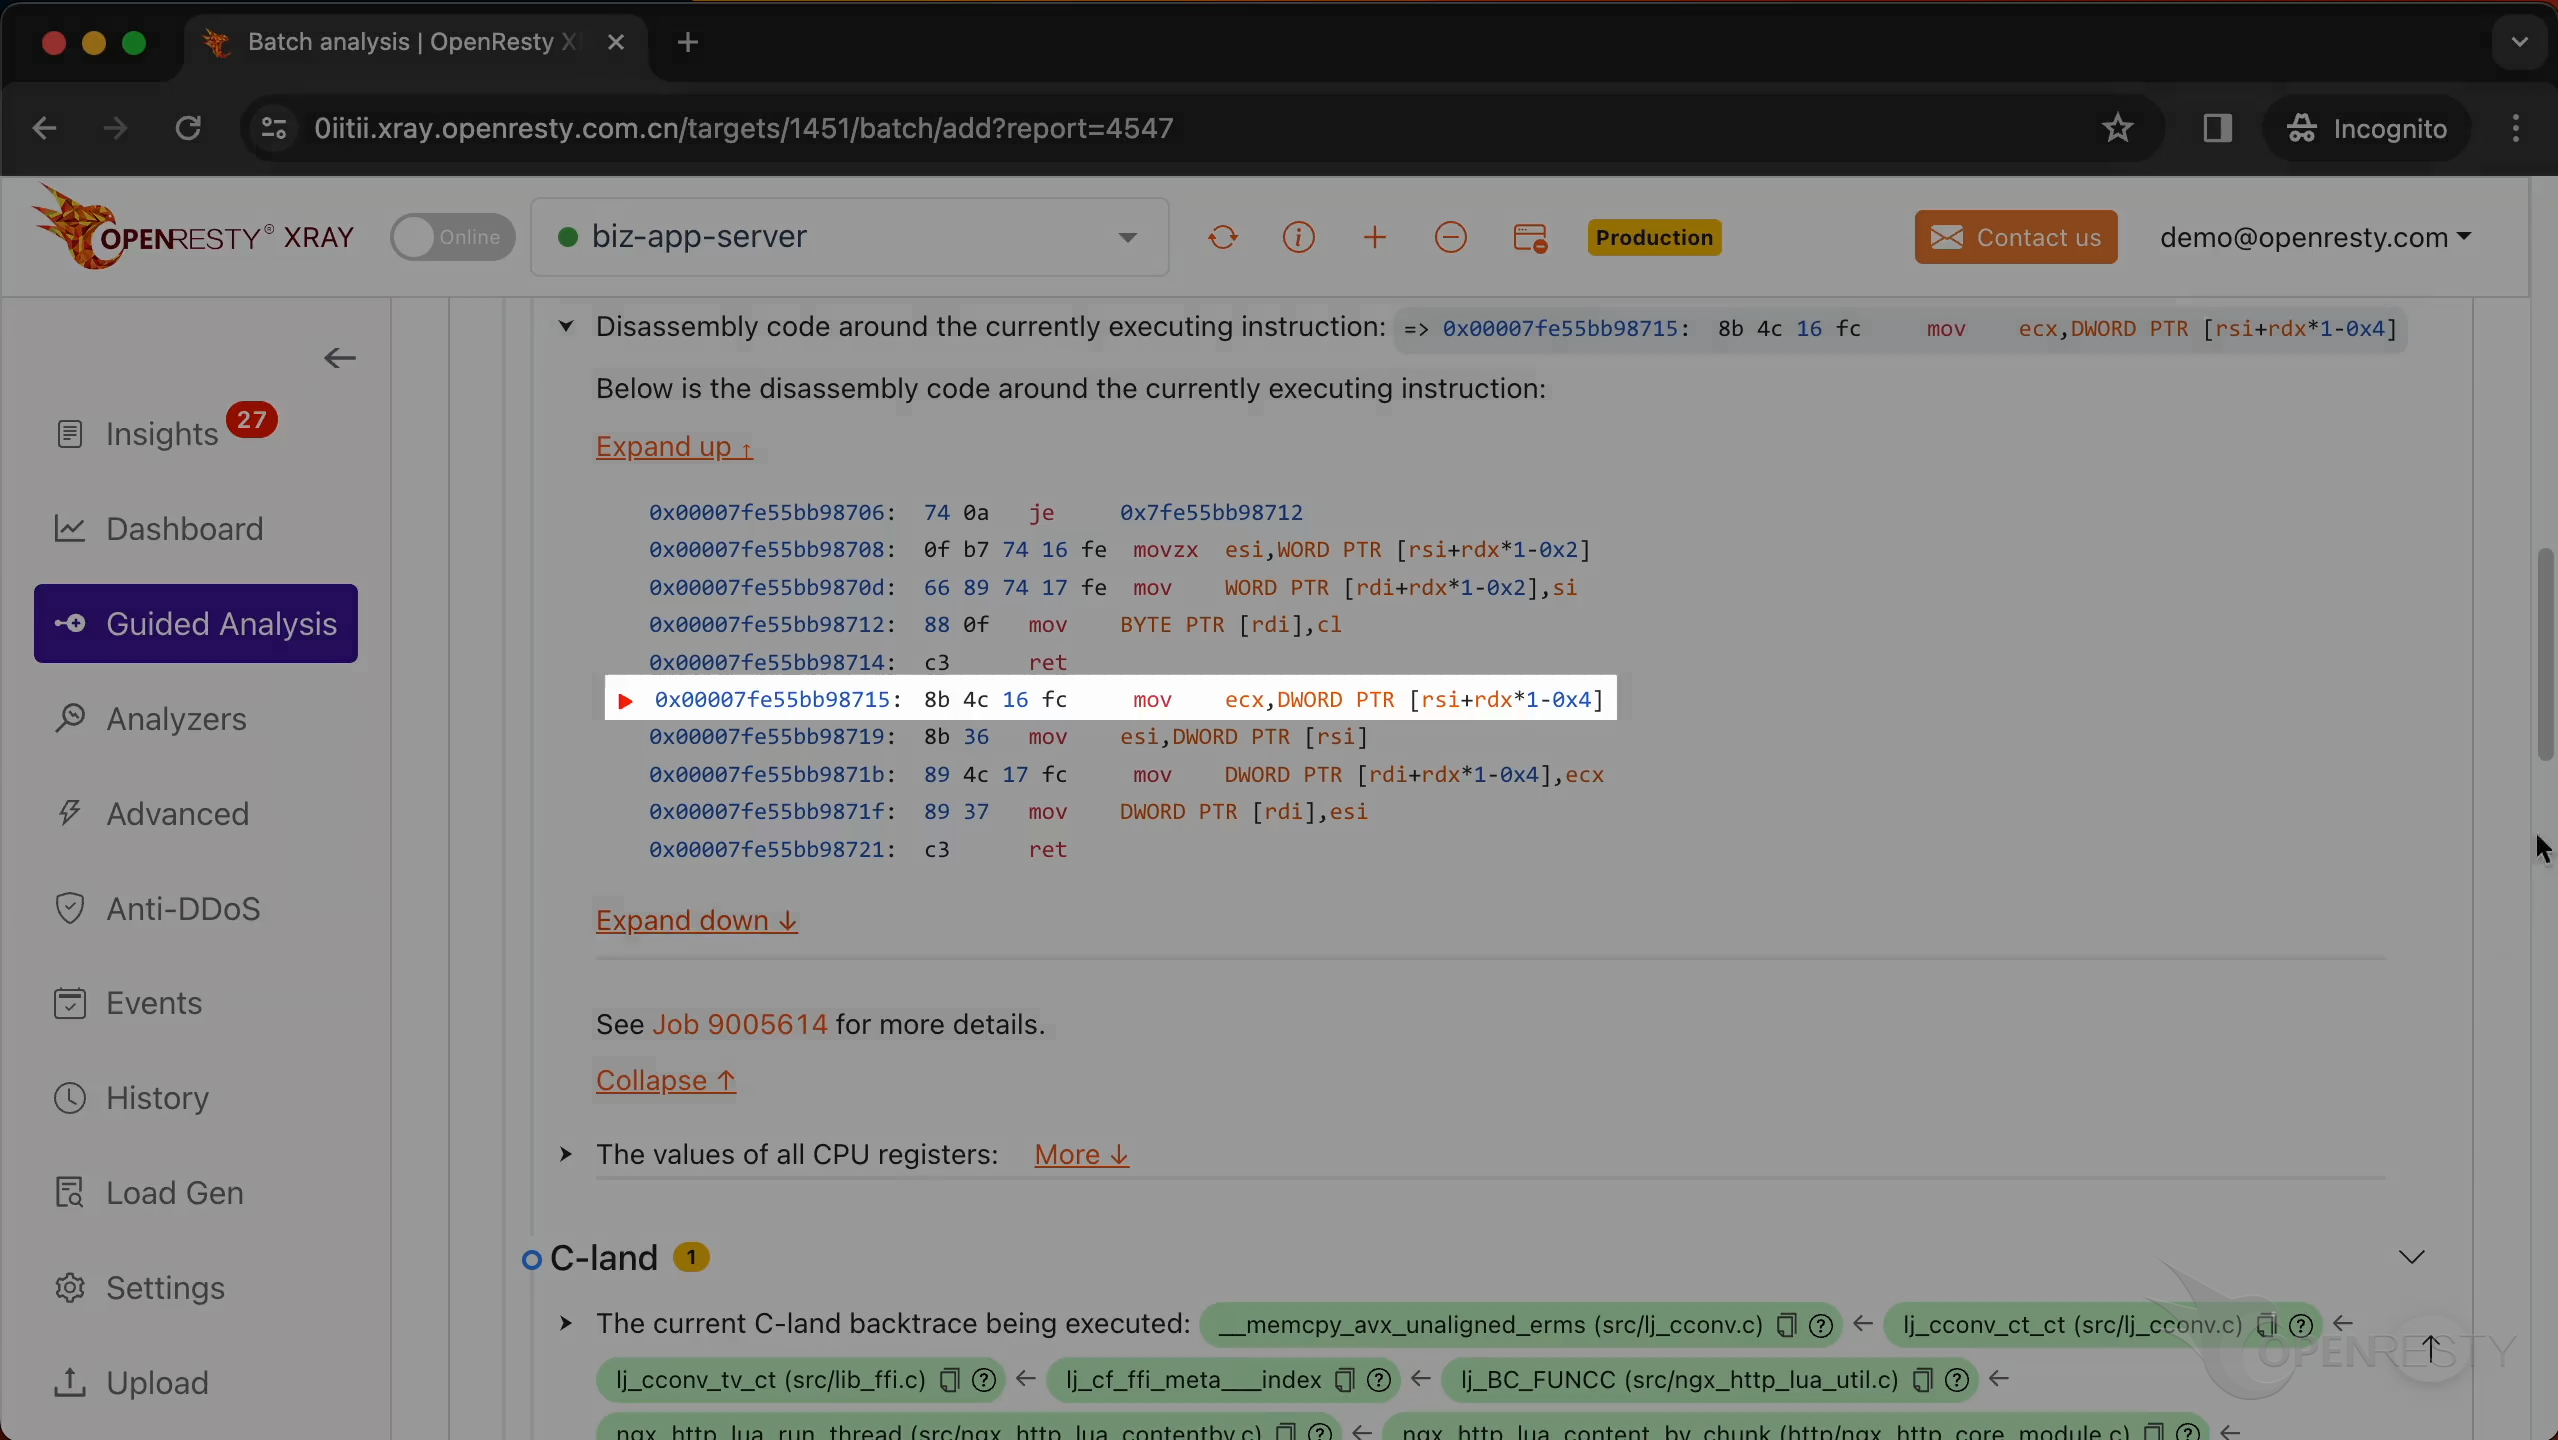
The instruction is currently accessing a specific memory address.
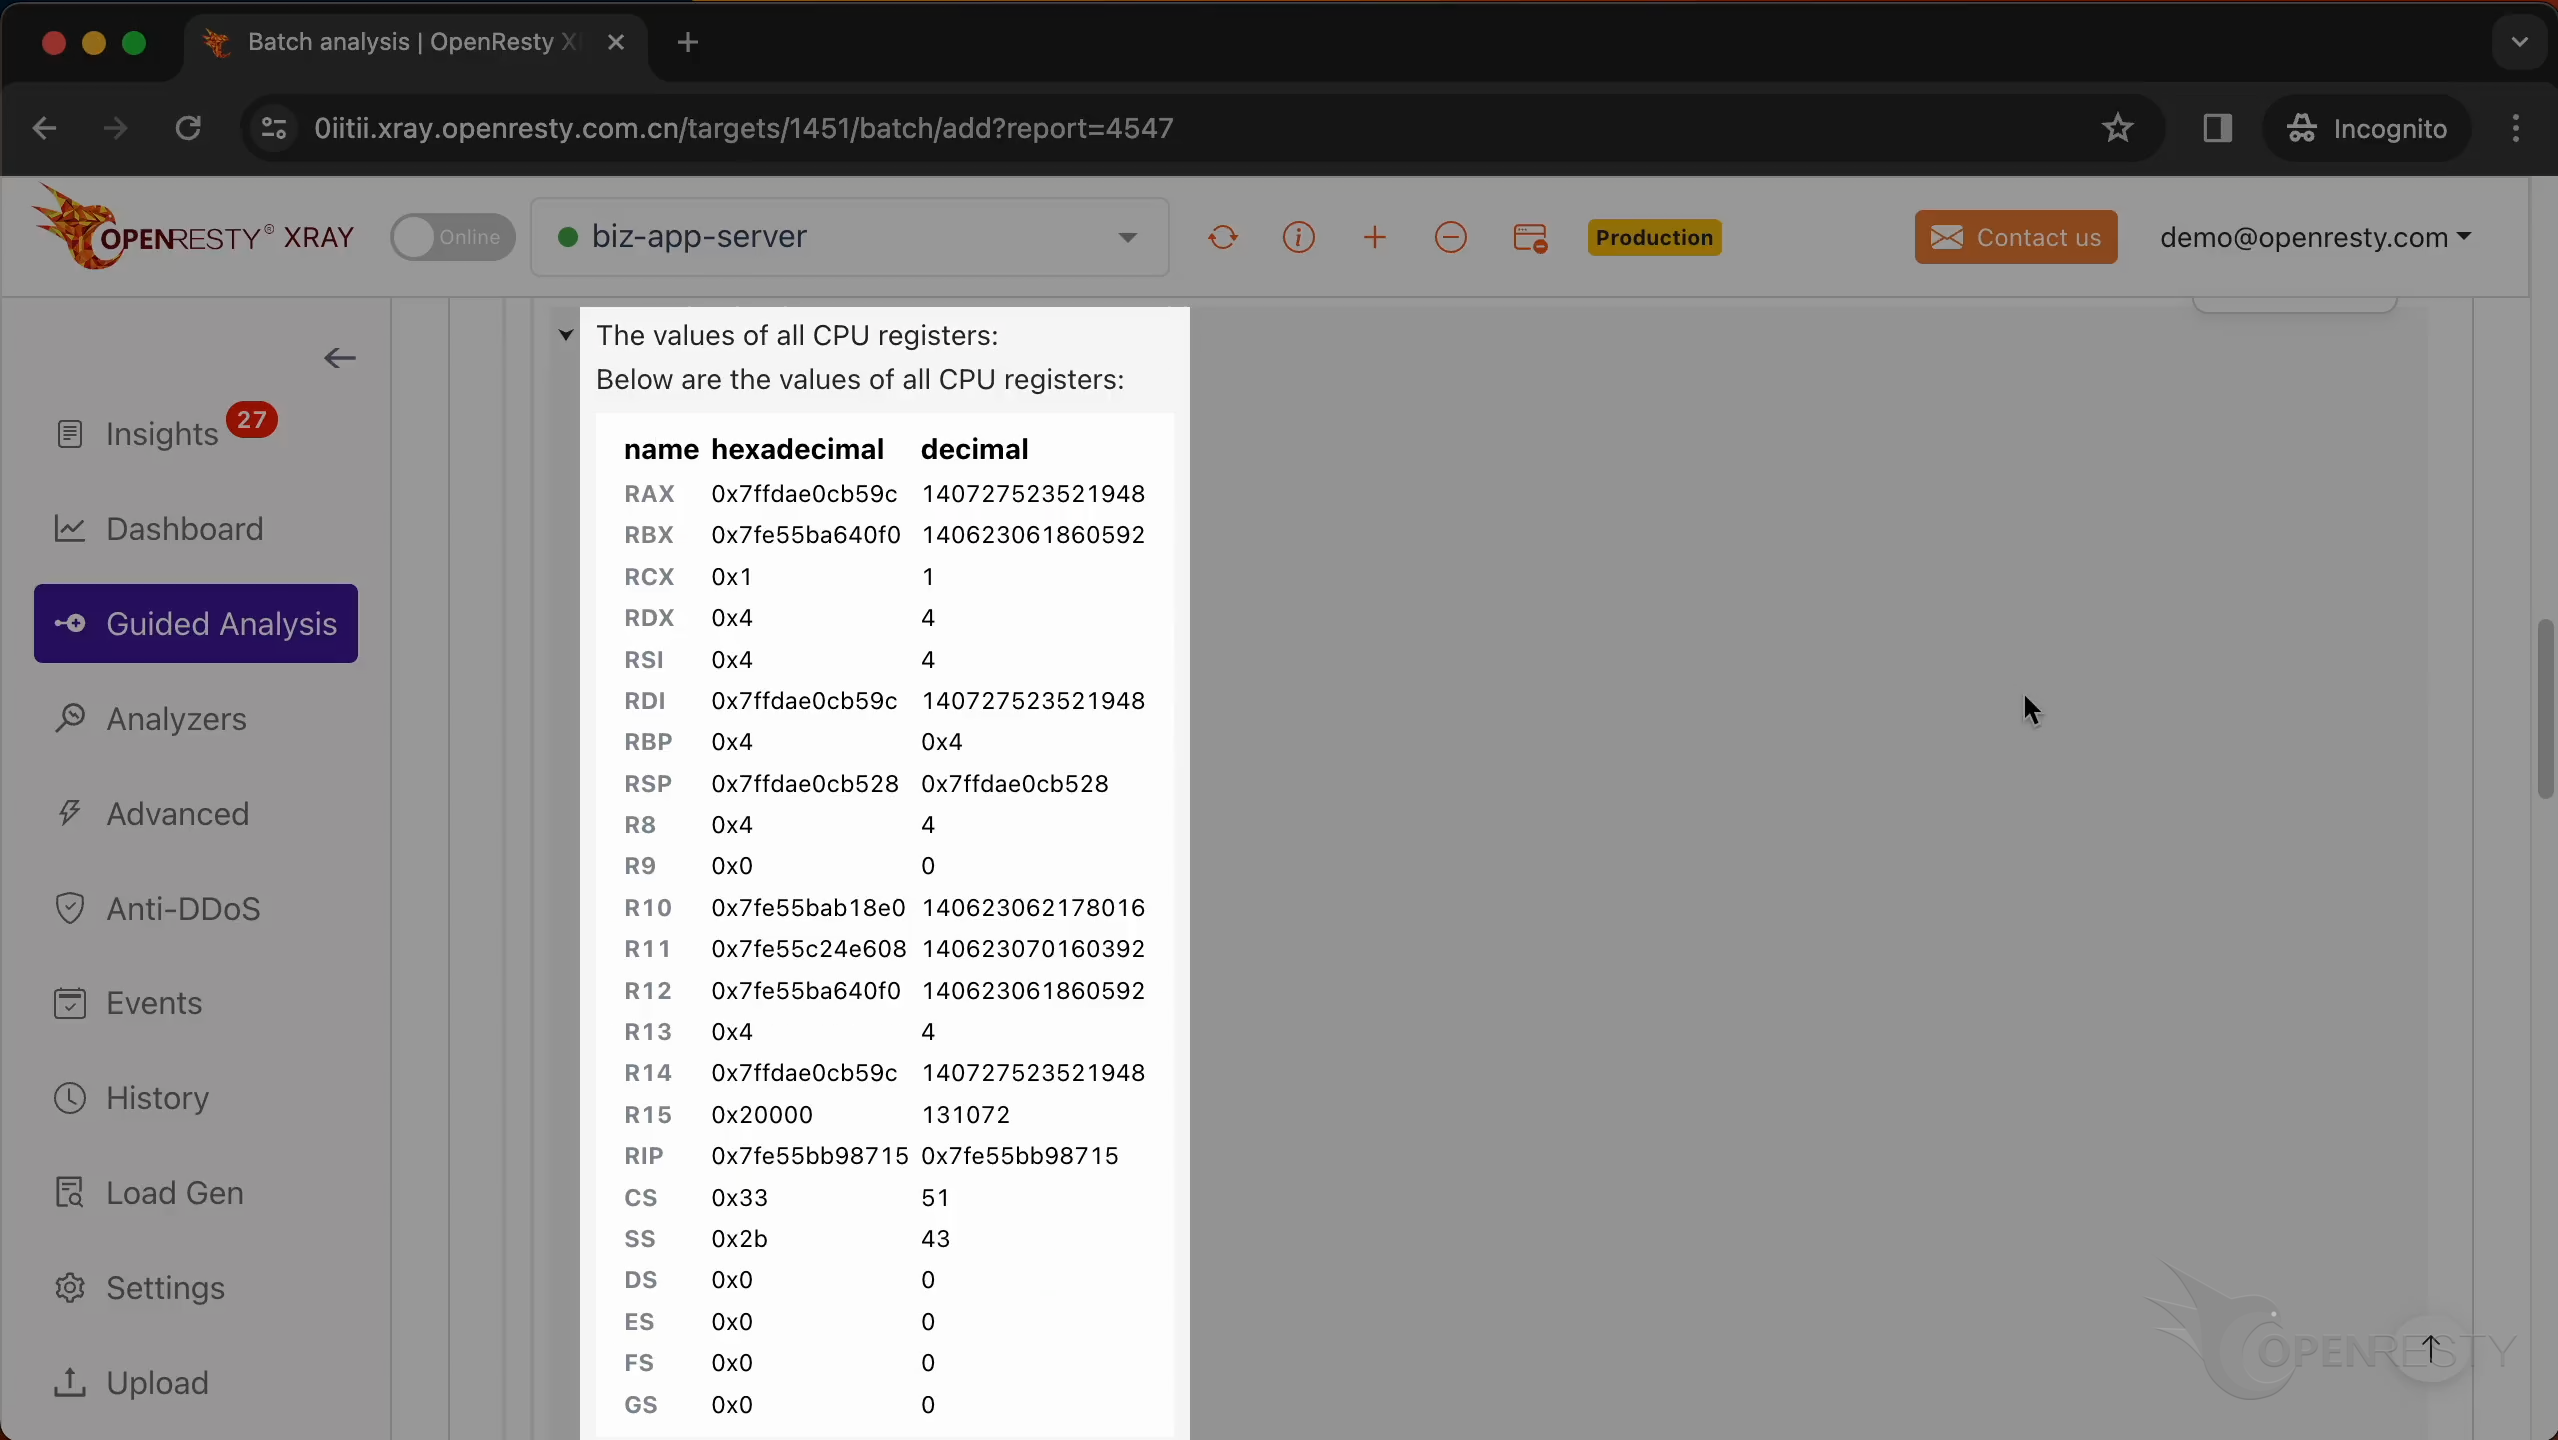
This is the value of the CPU register when the core dump occurred.
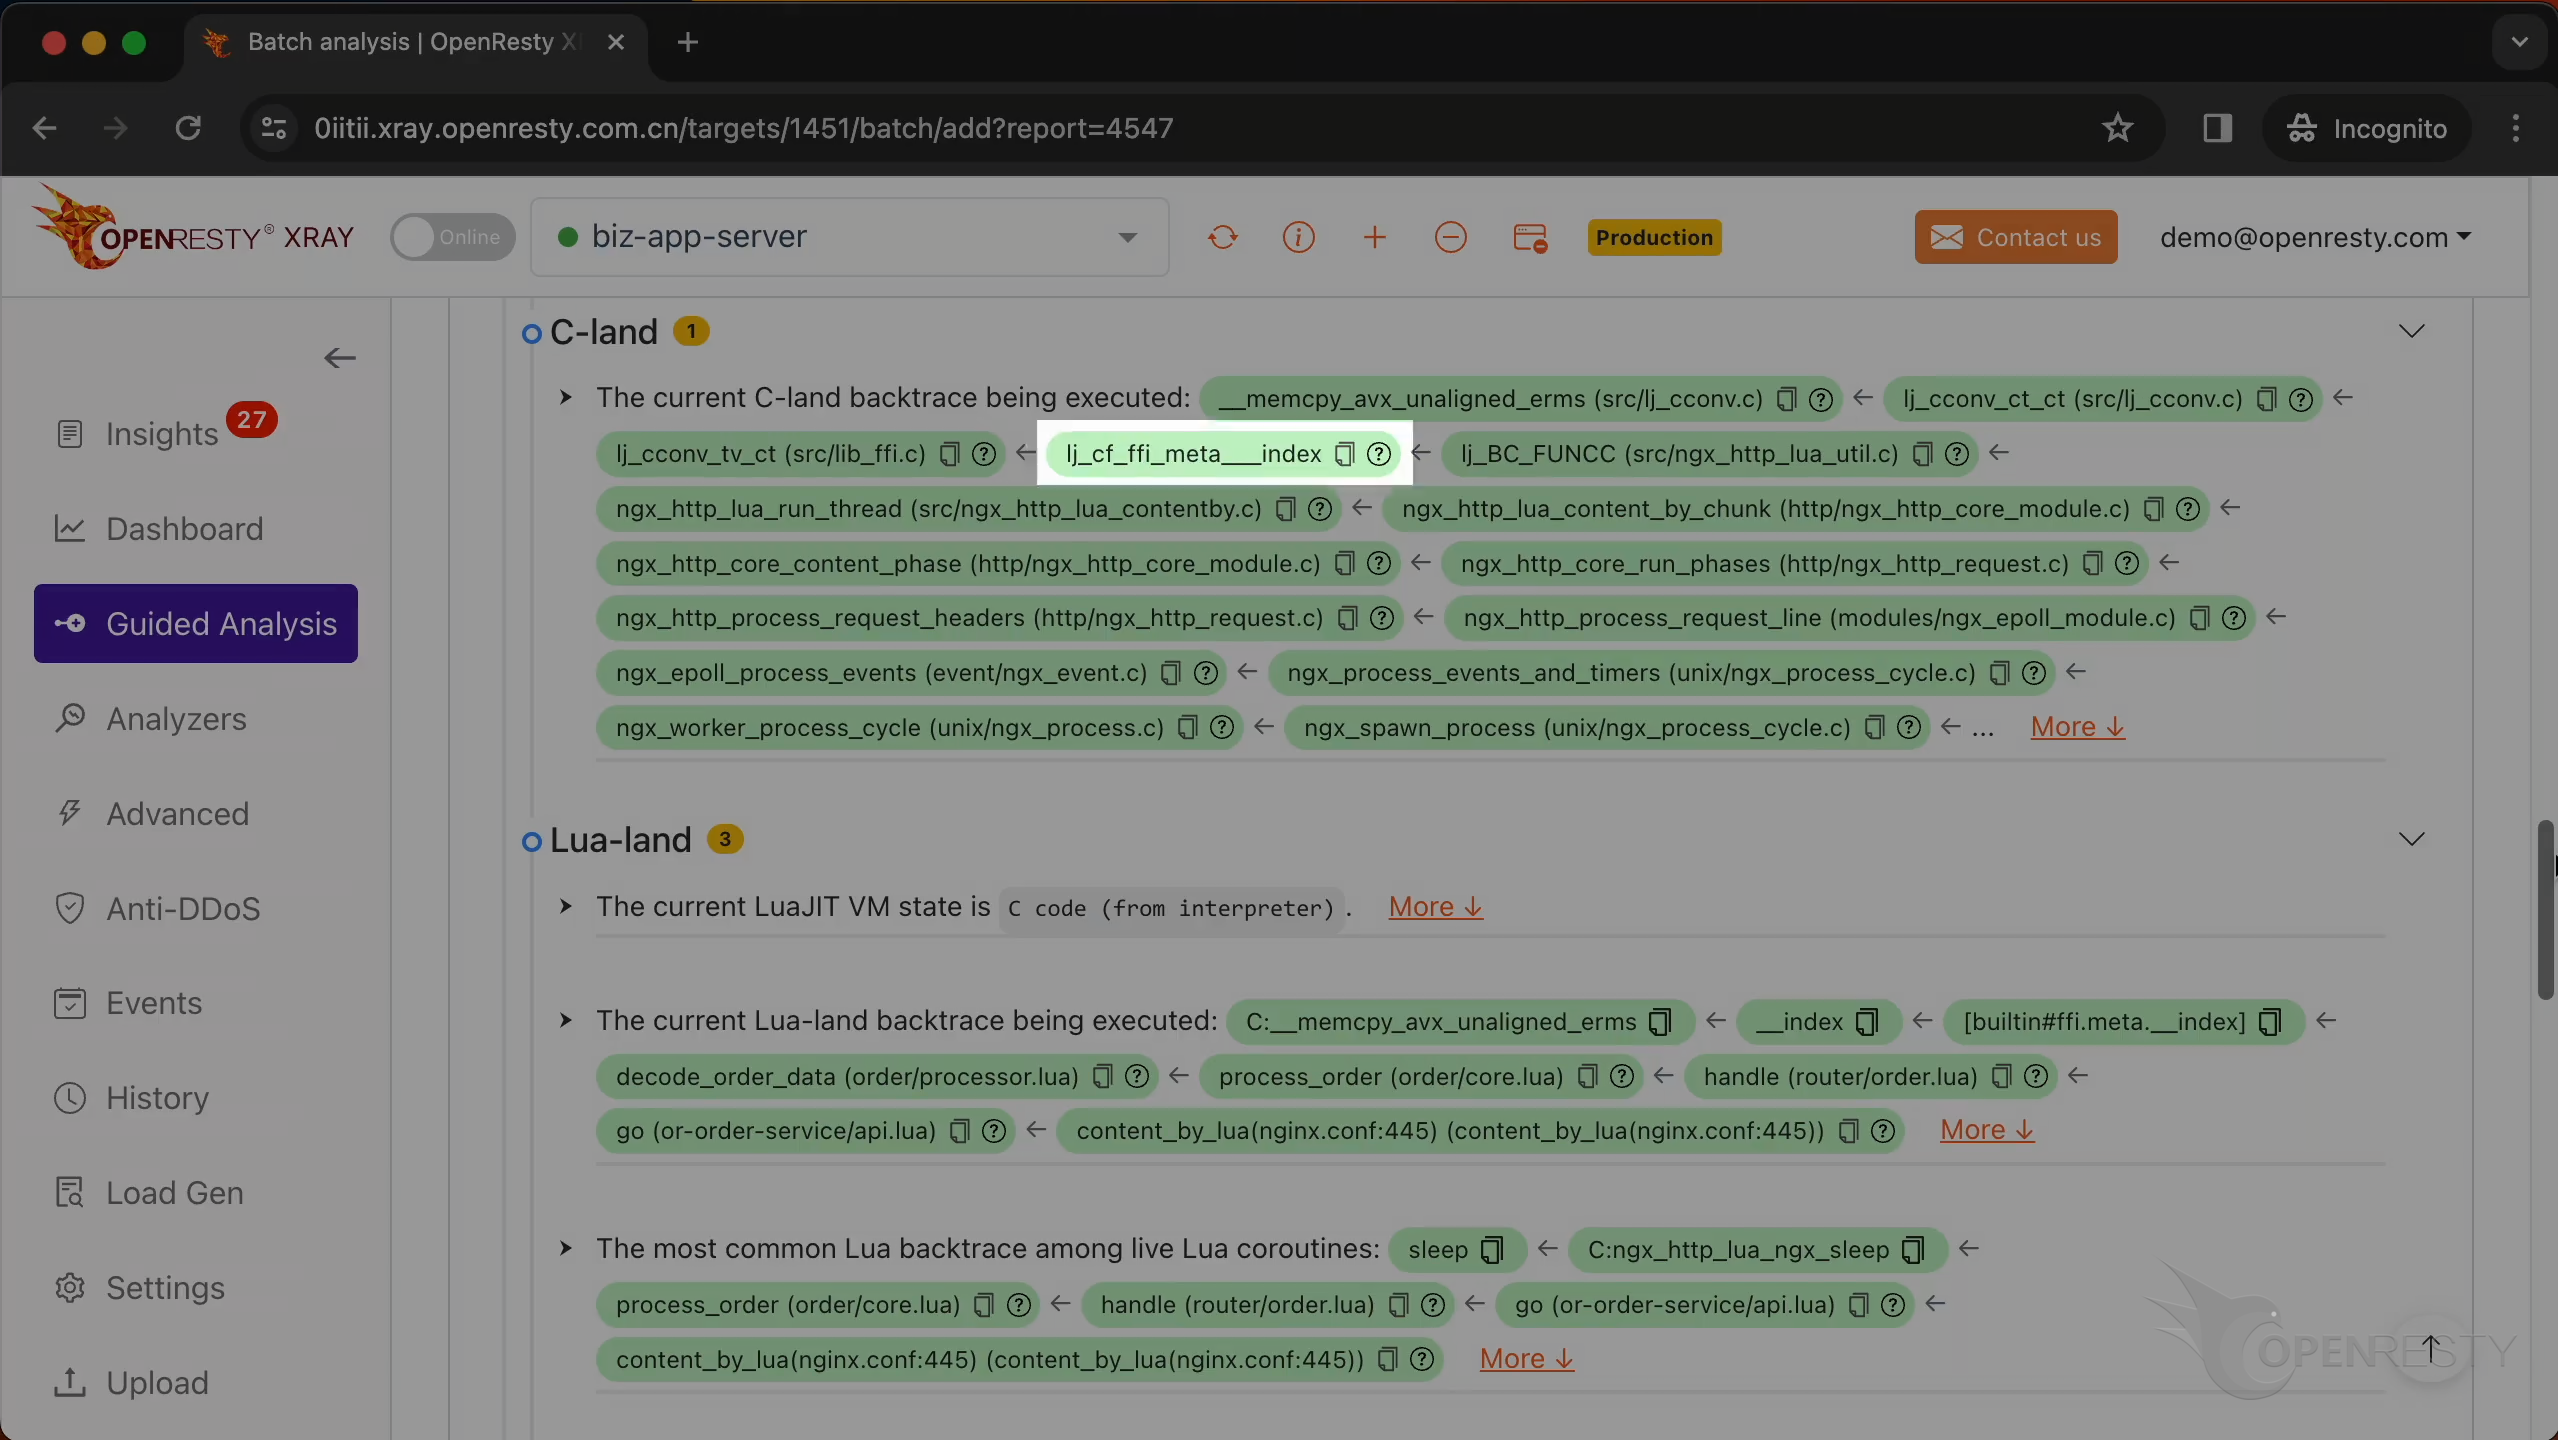
This is the current C backtrace being executed.
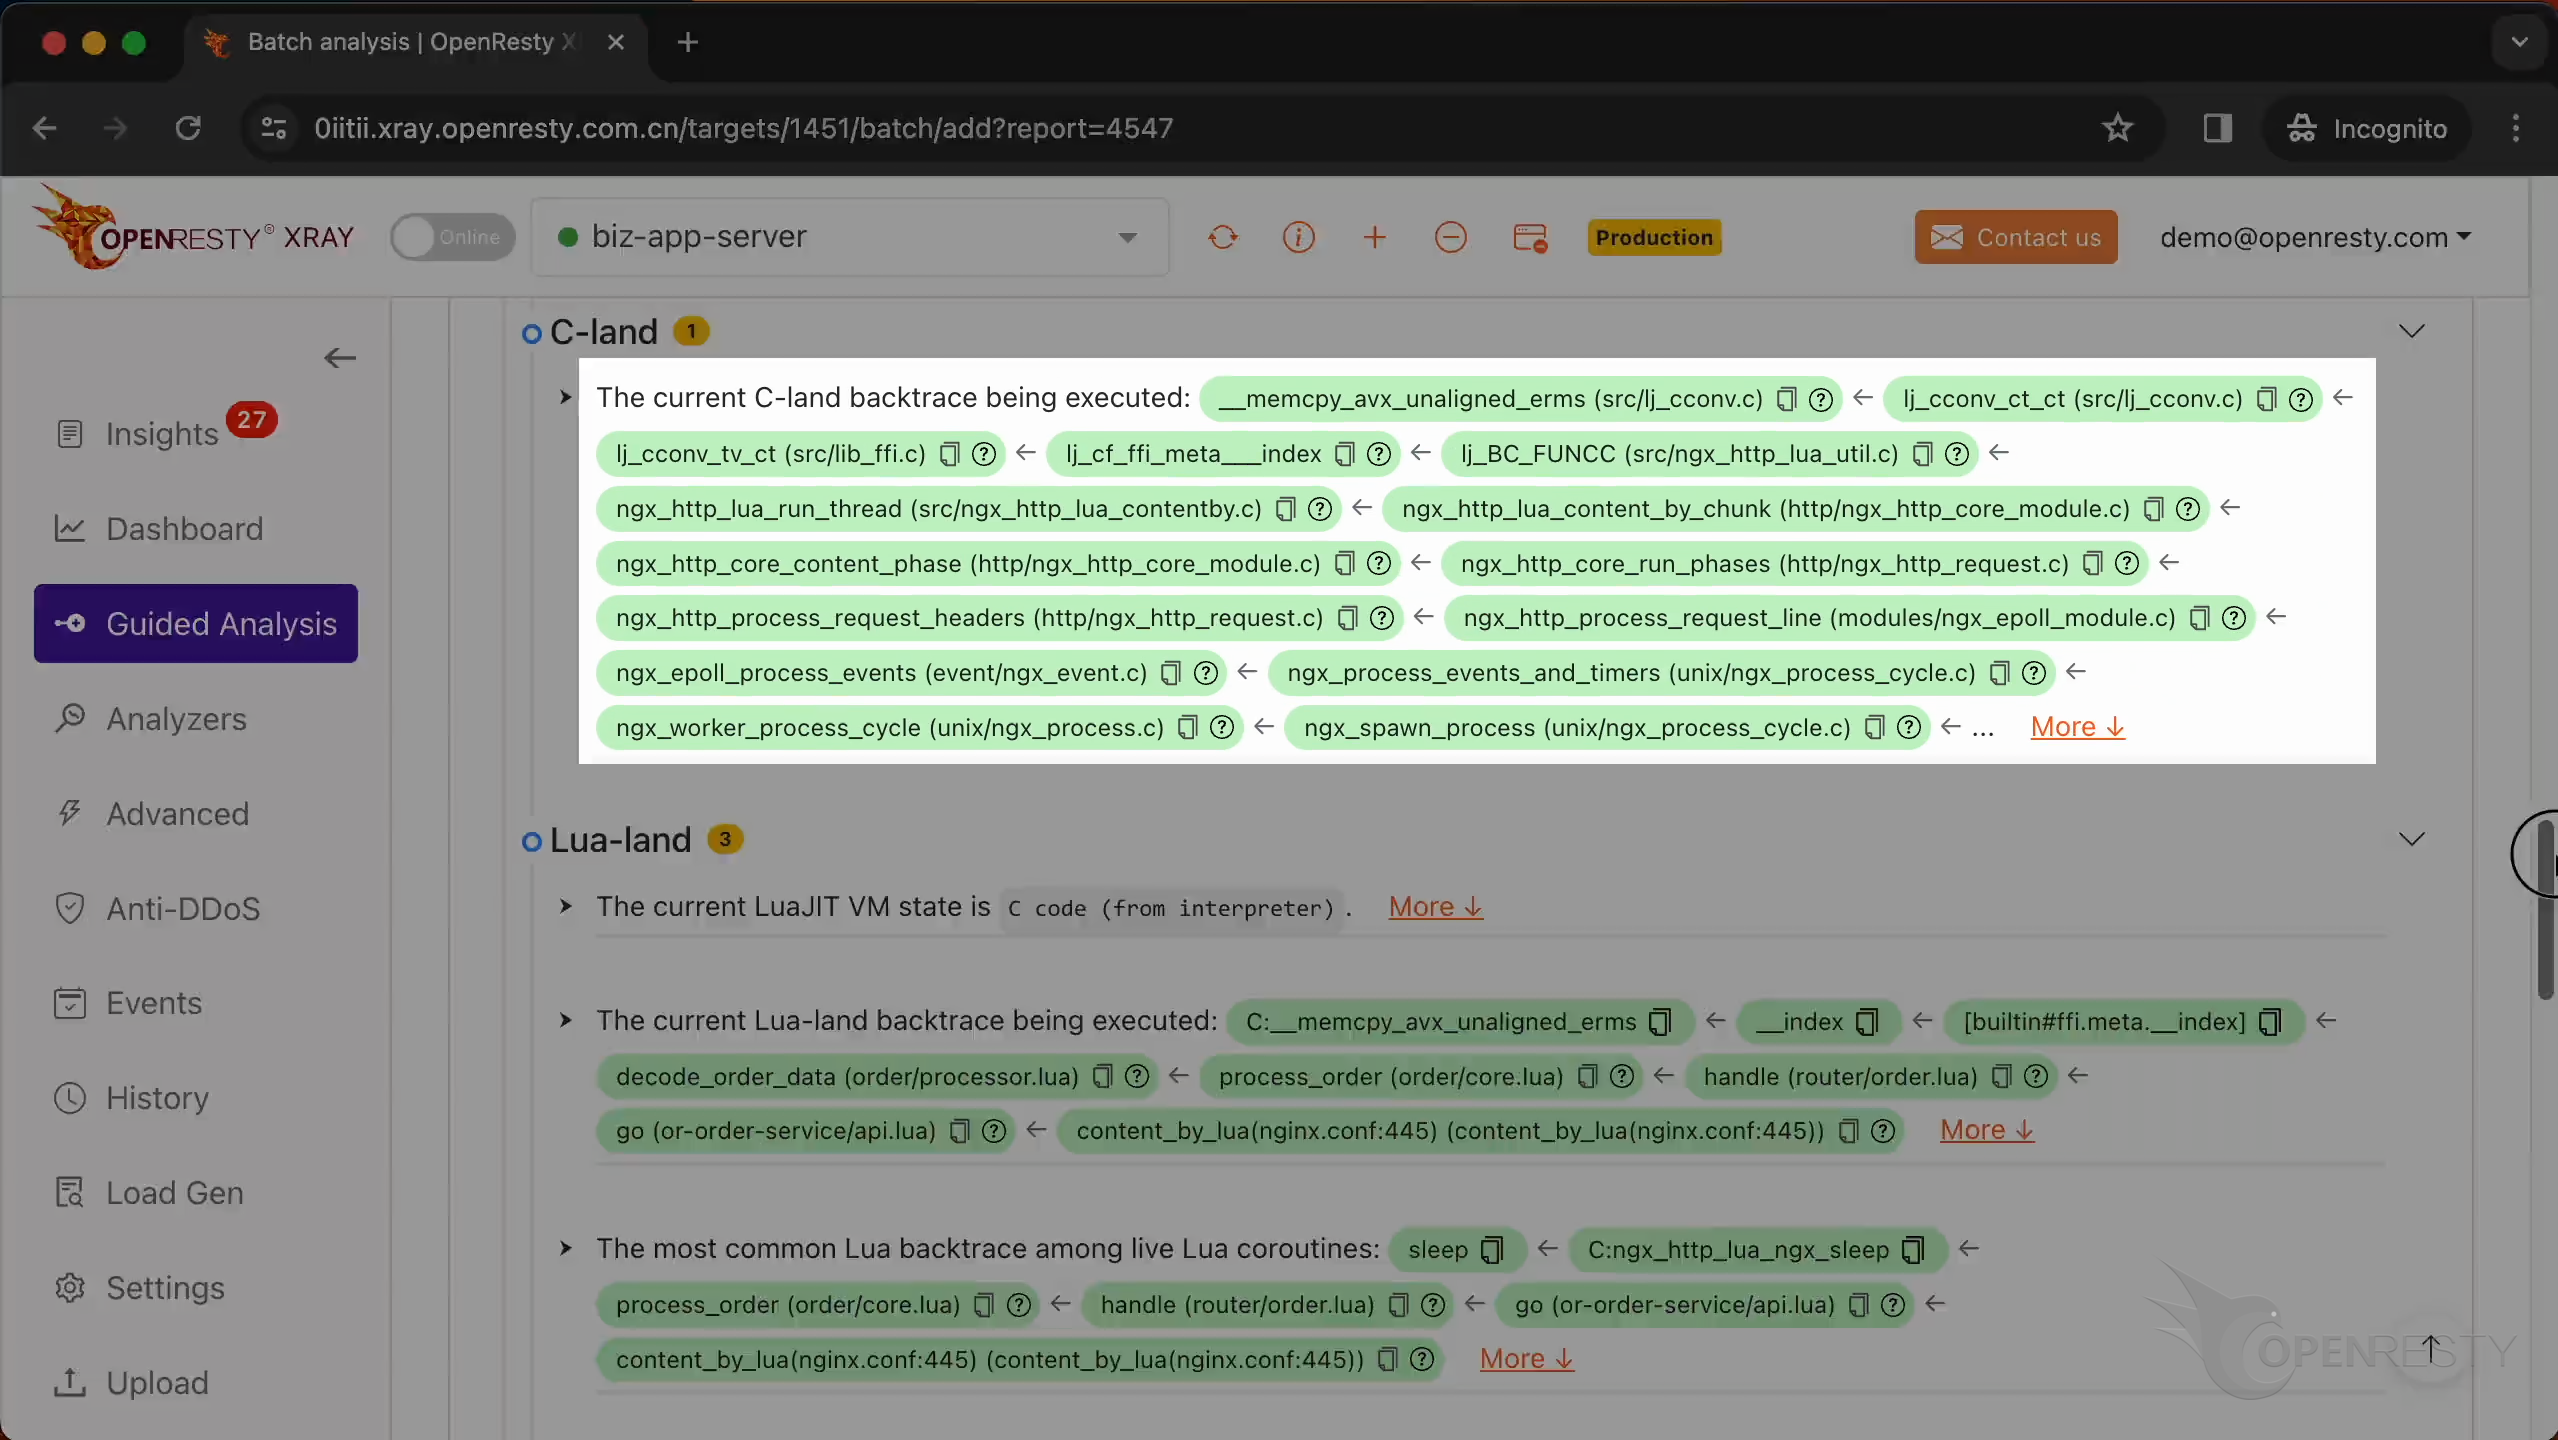
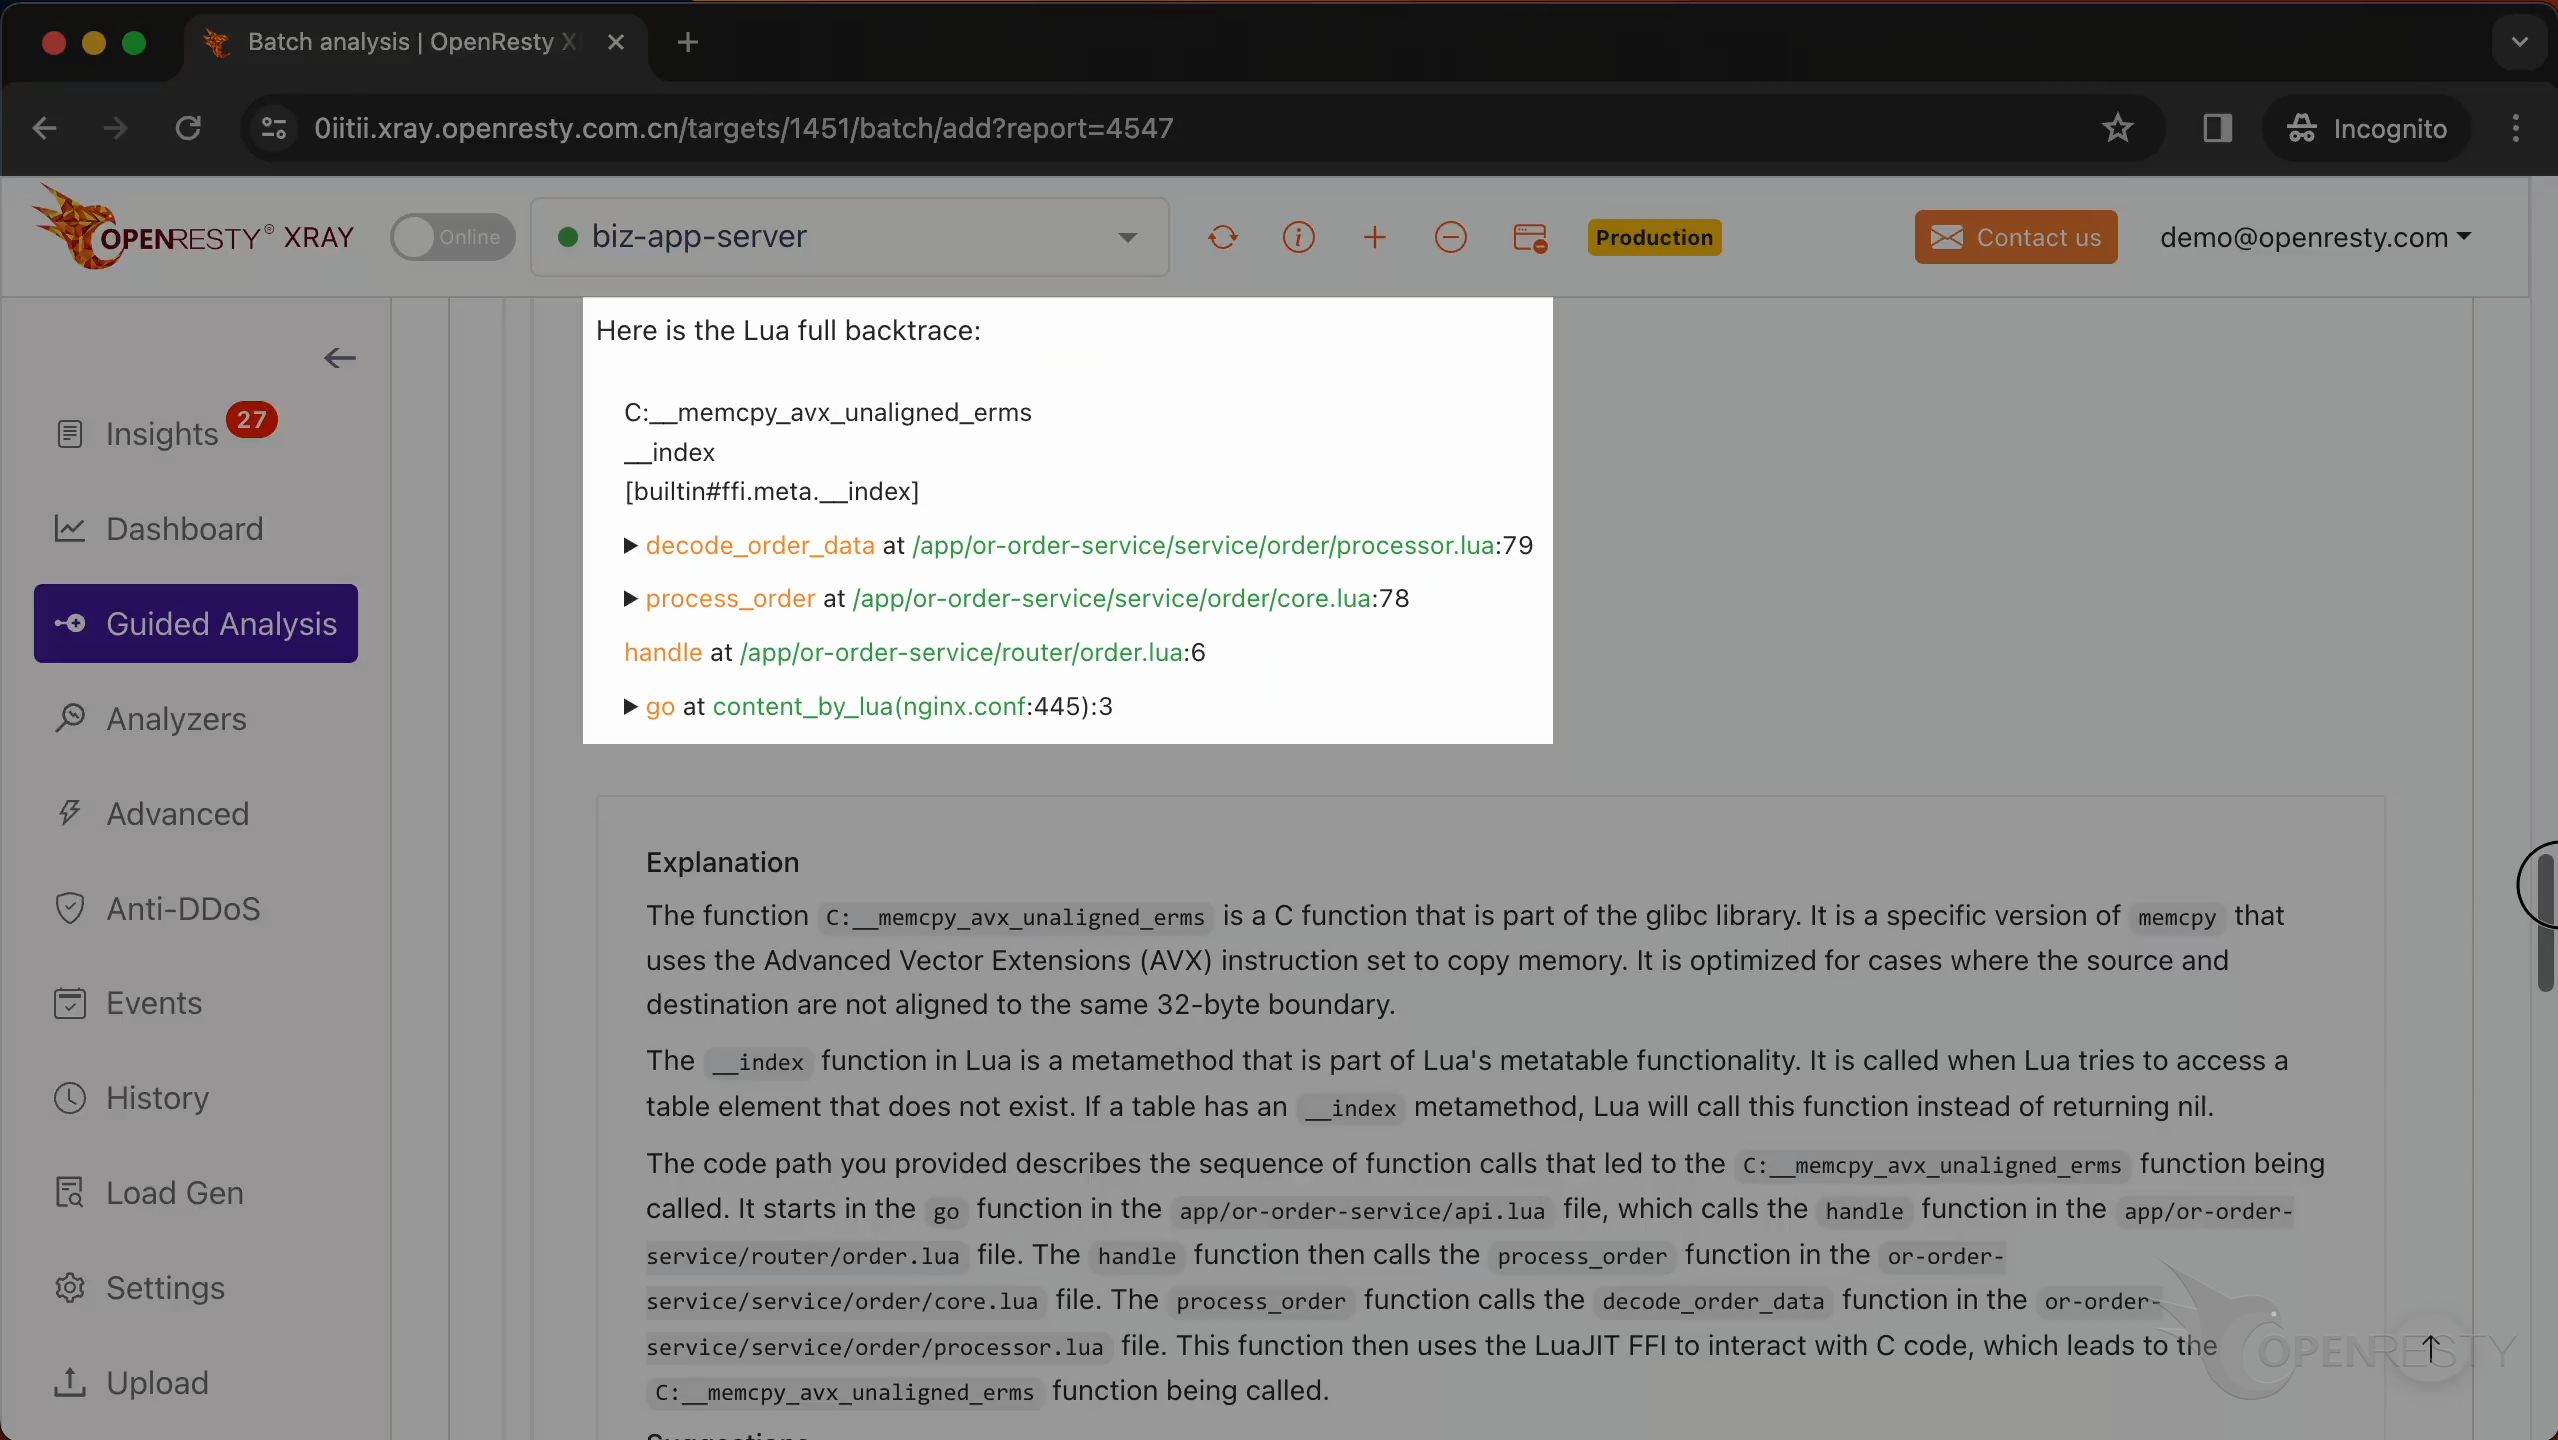
This is a function from the GNU C library. It copies a block of memory from one location to another.
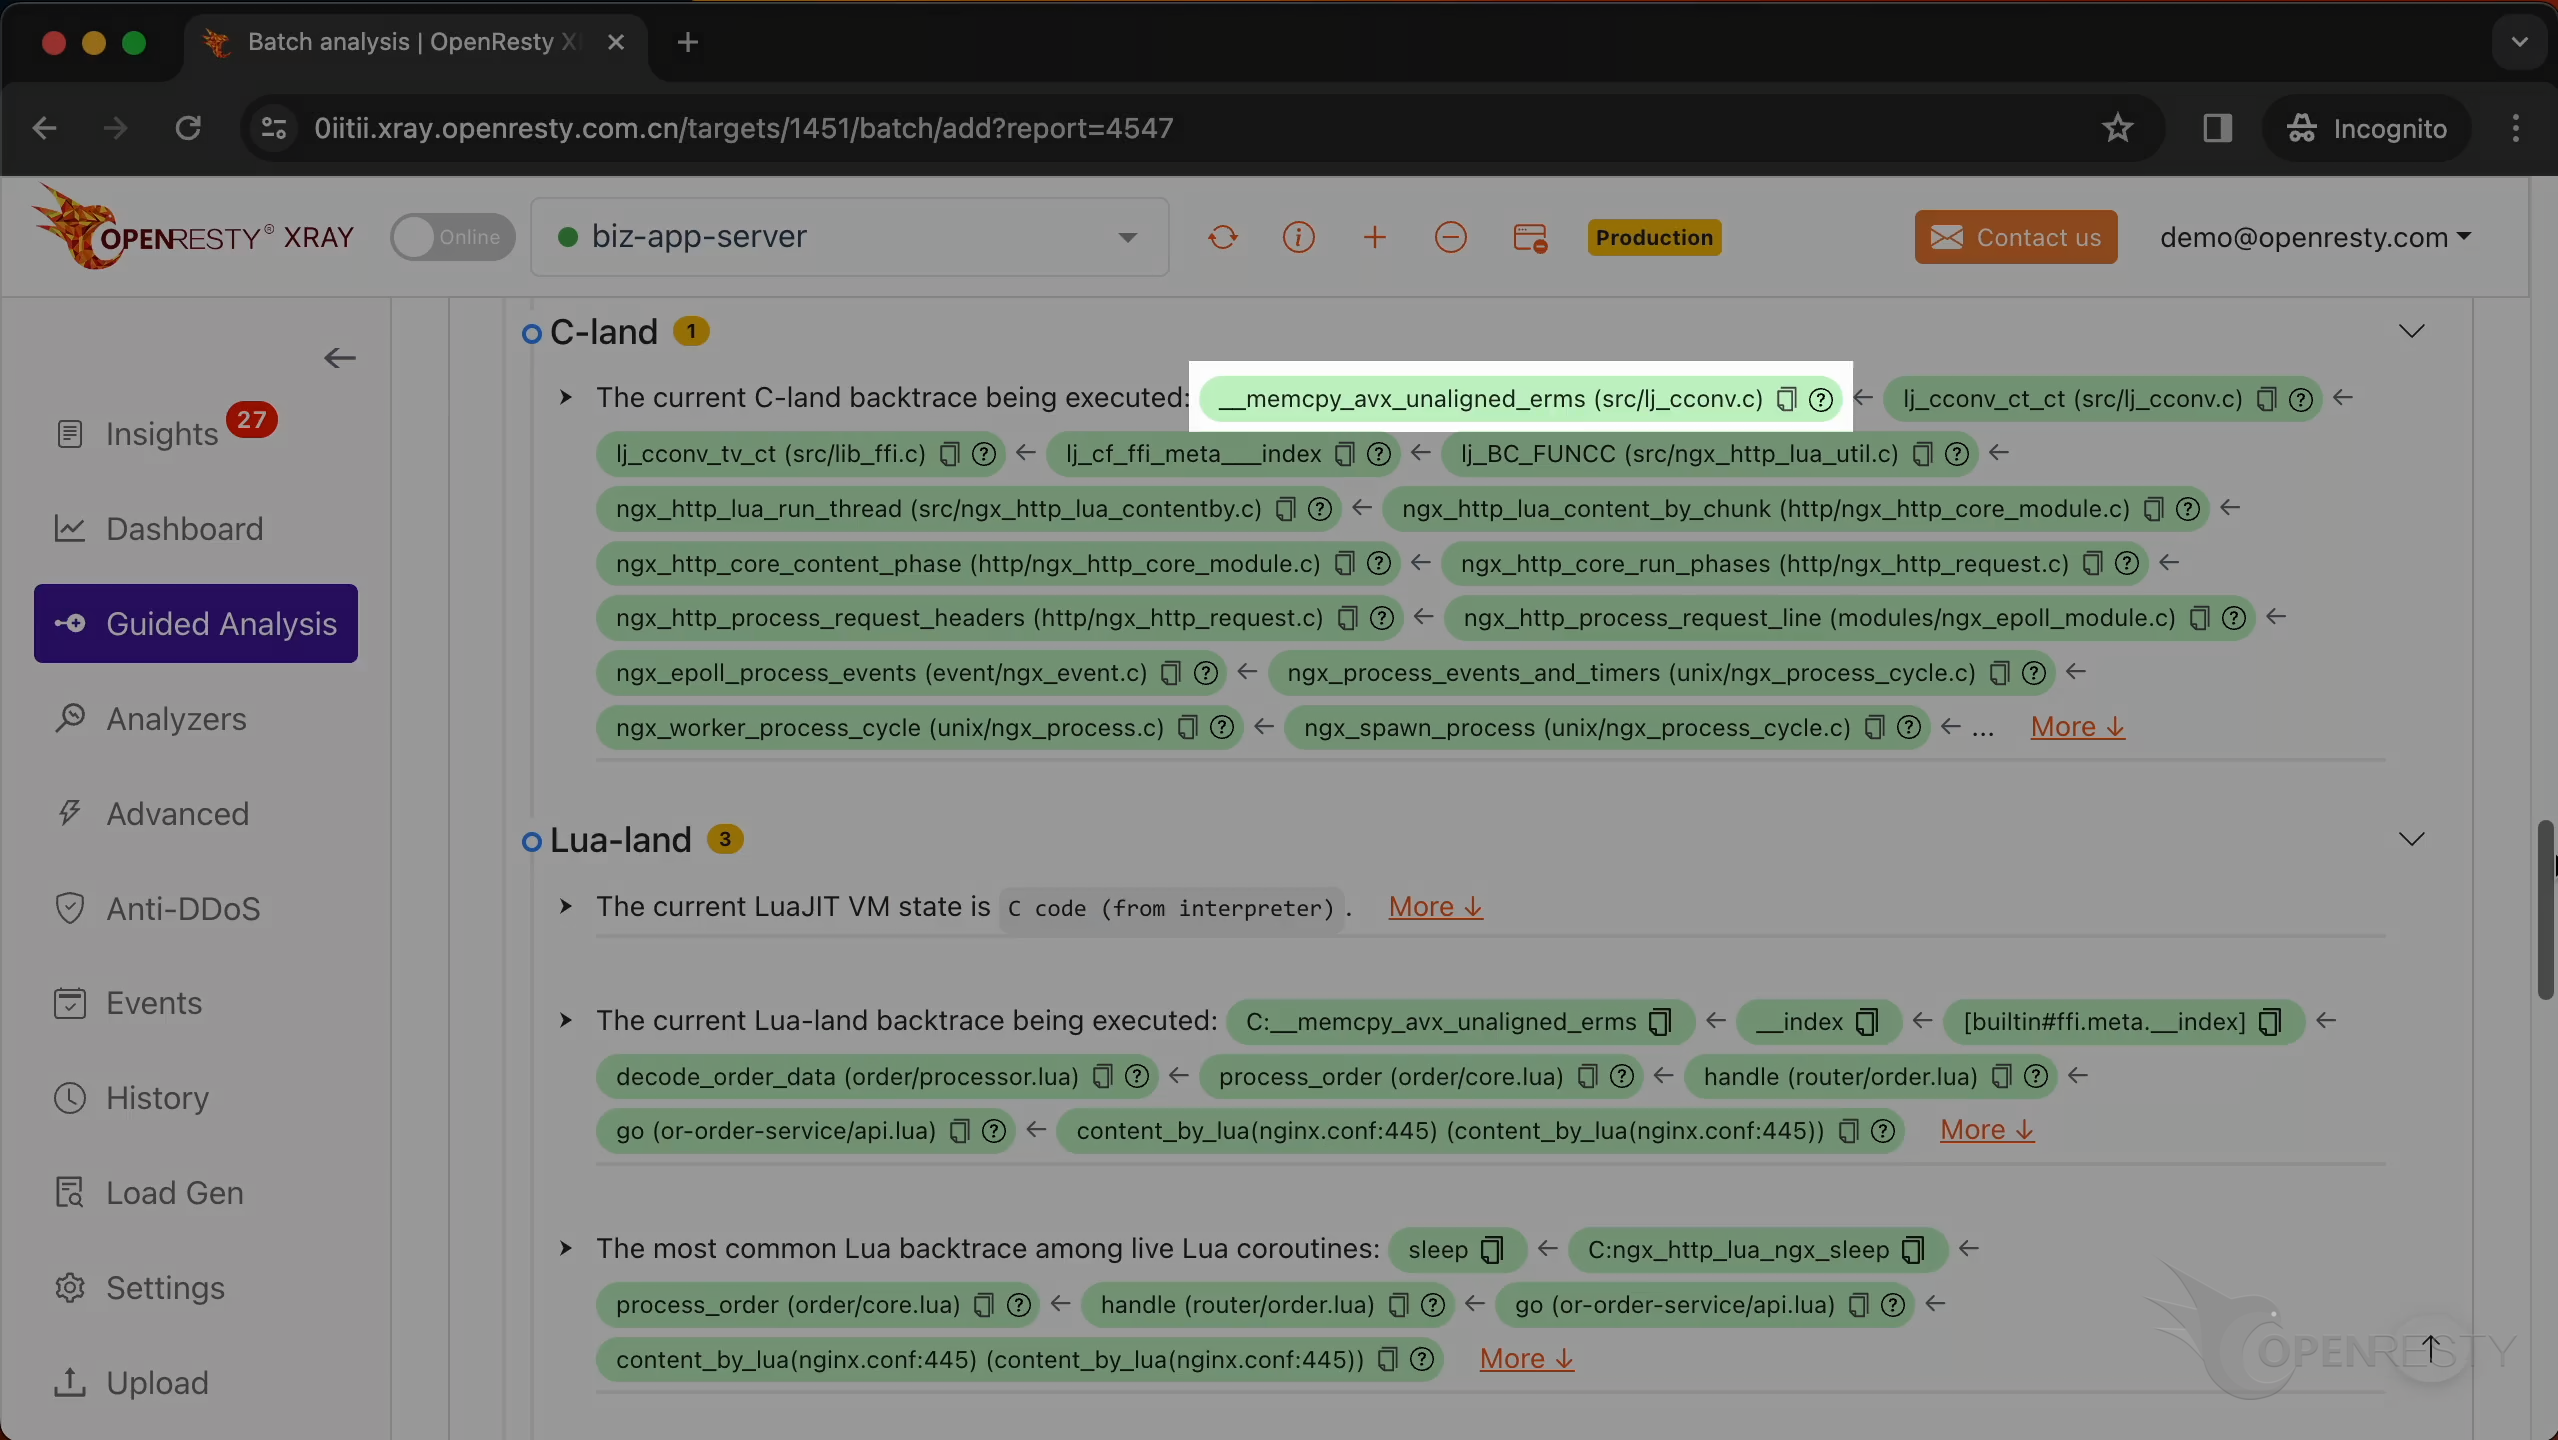
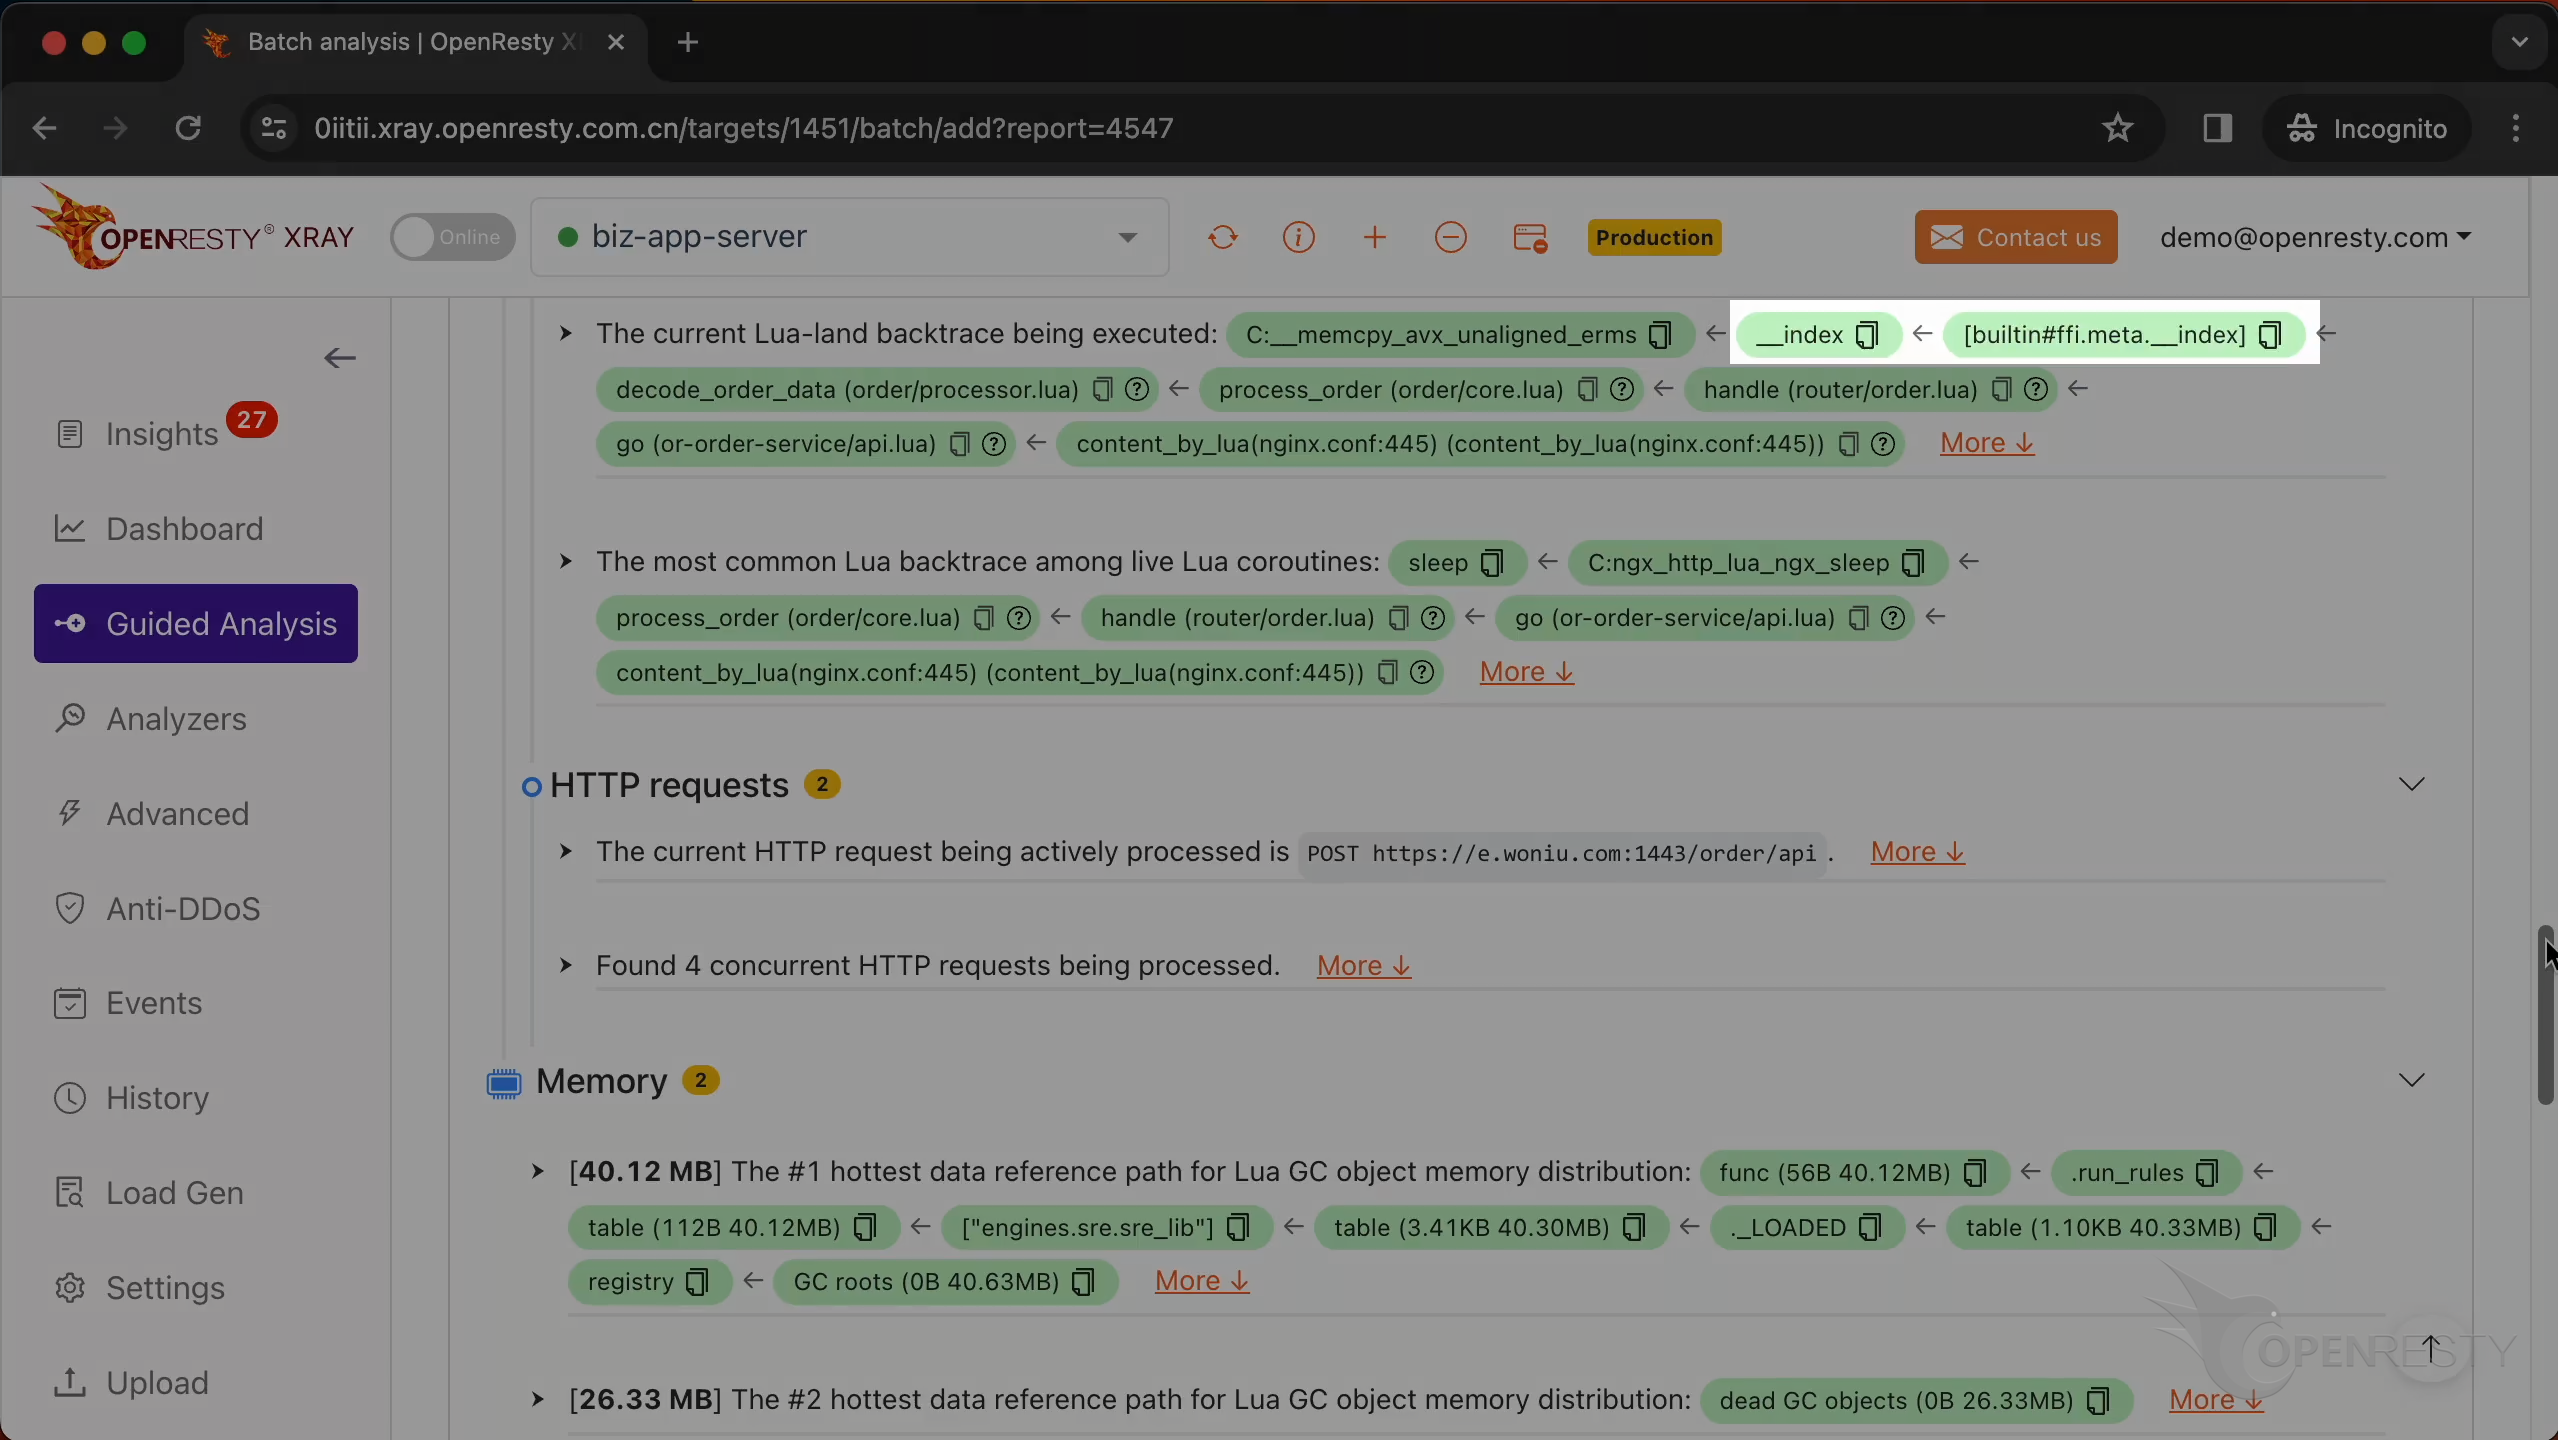
This function is a part of LuaJIT. It handles the __index metamethod for FFI cdata types.
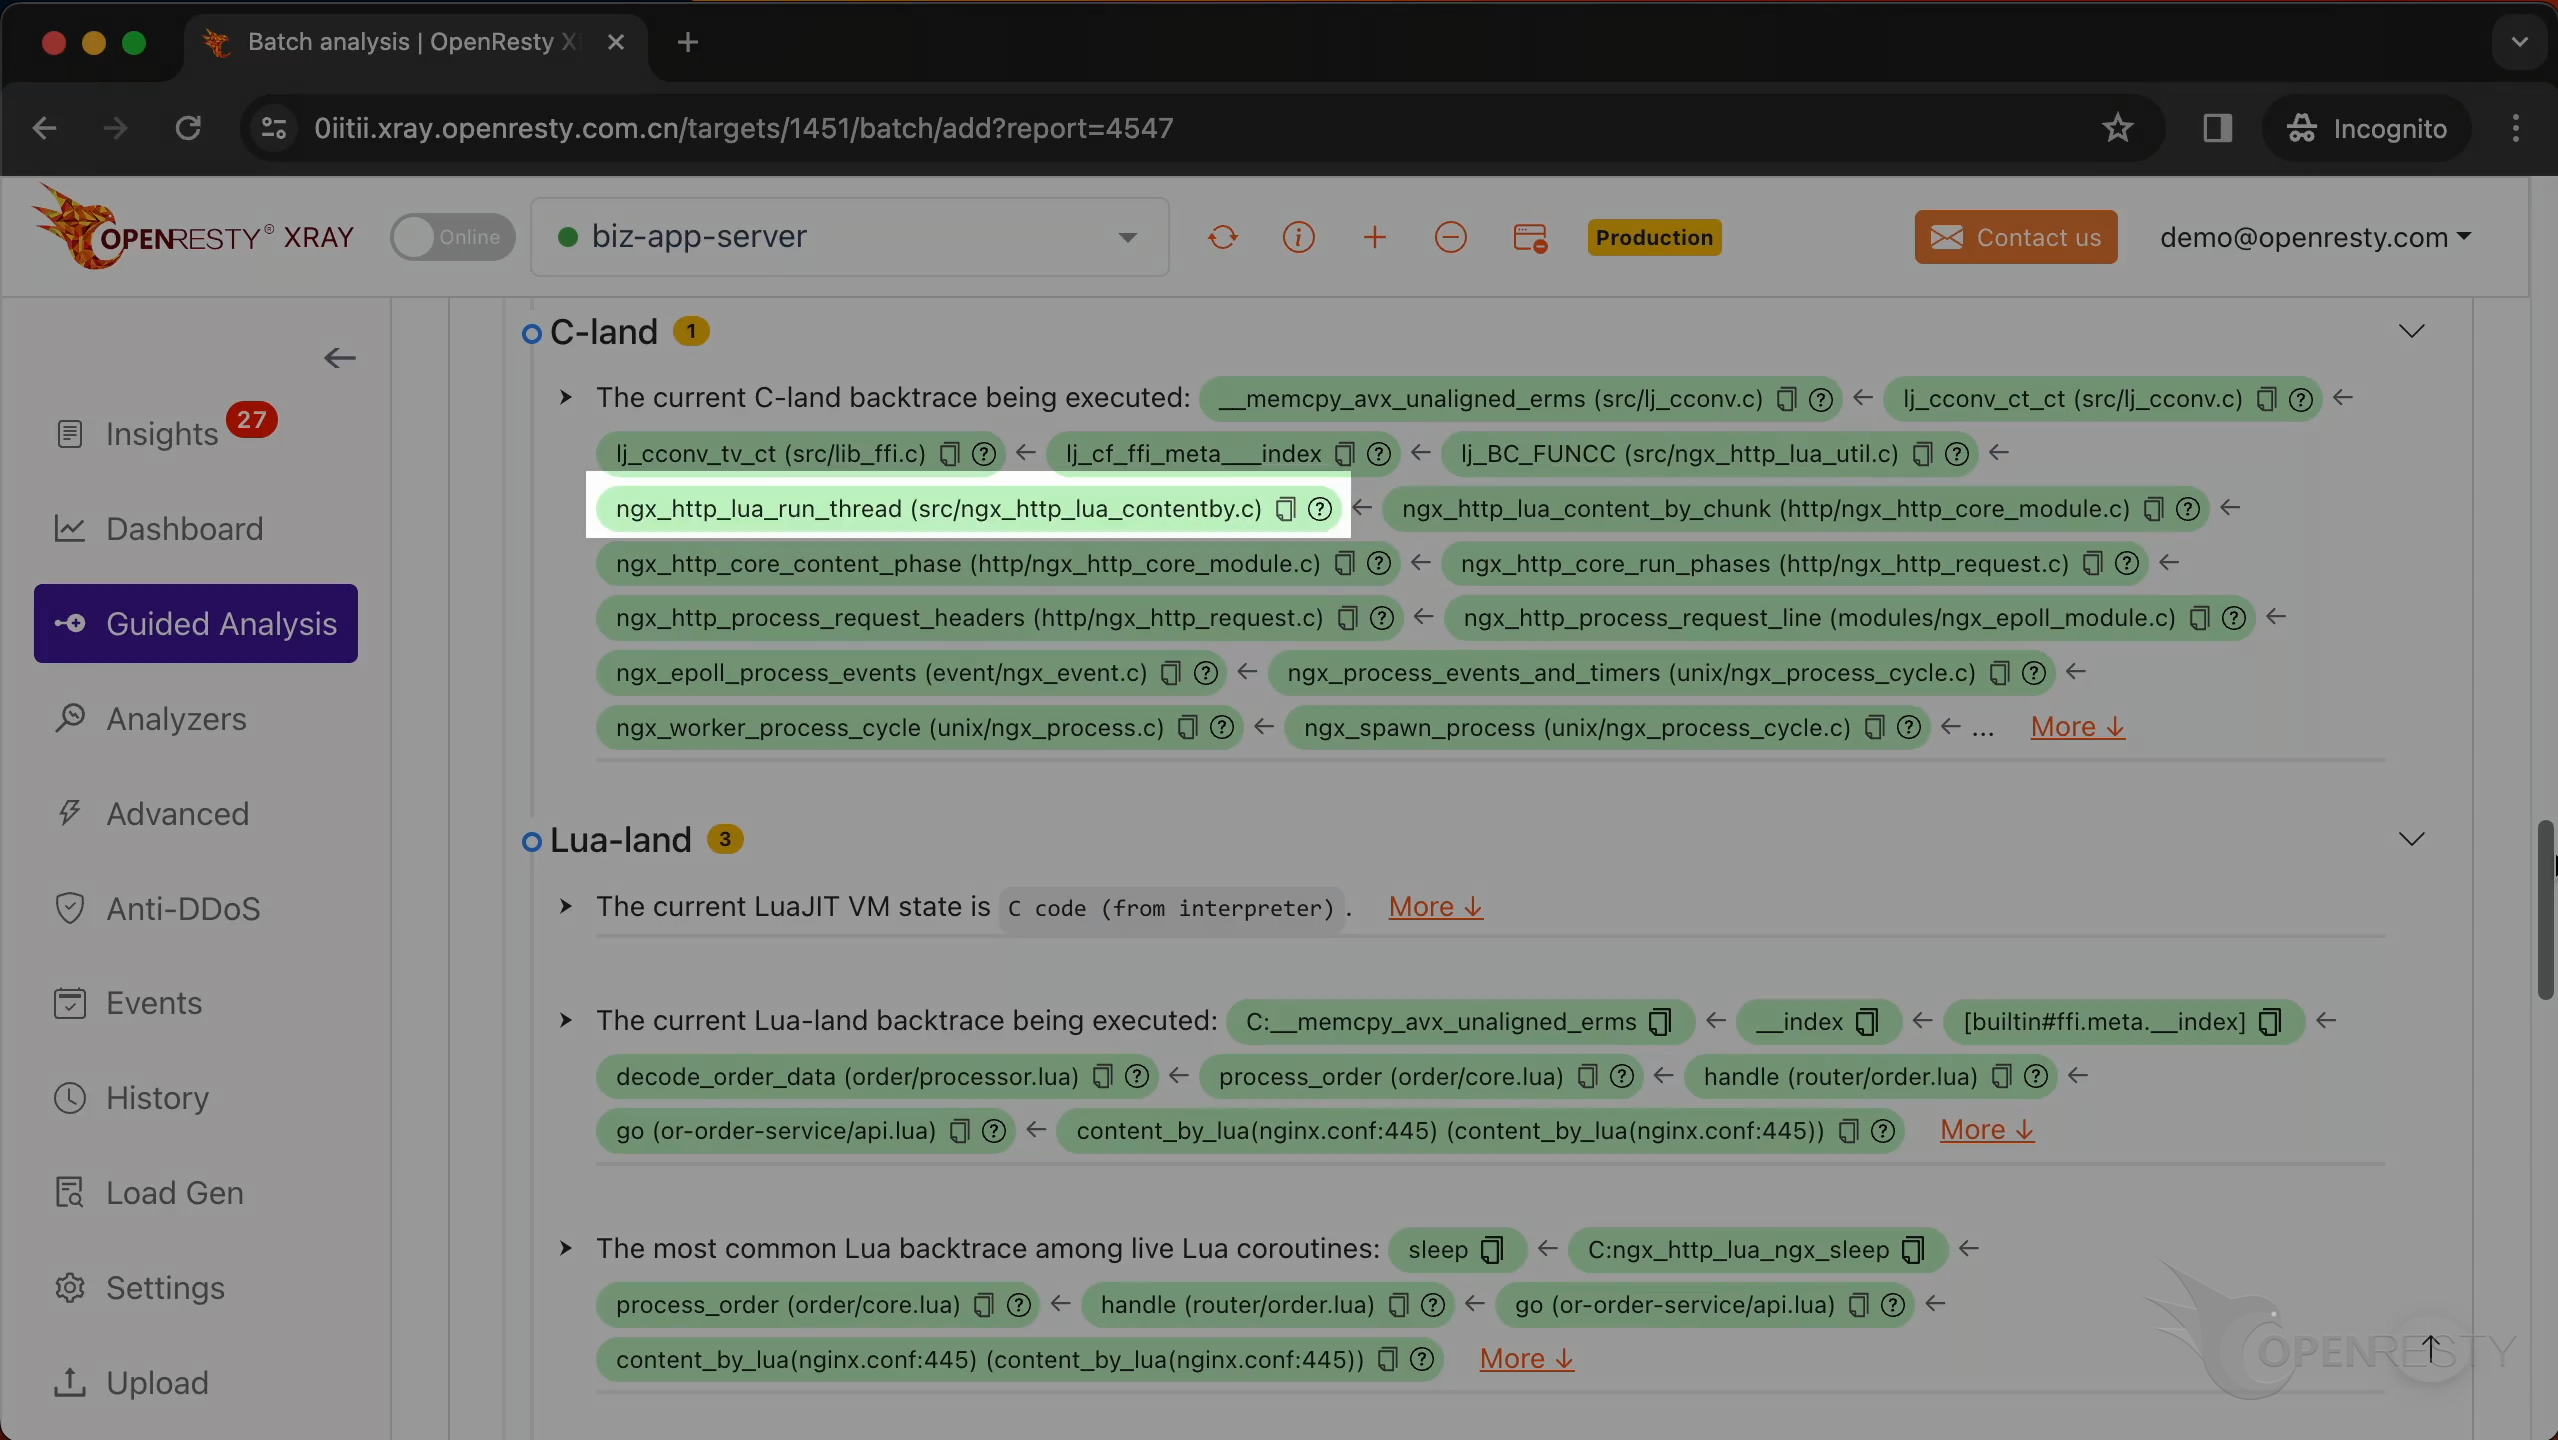
ngx_http_lua_run_thread is a function from the Nginx web server that runs a Lua routine.
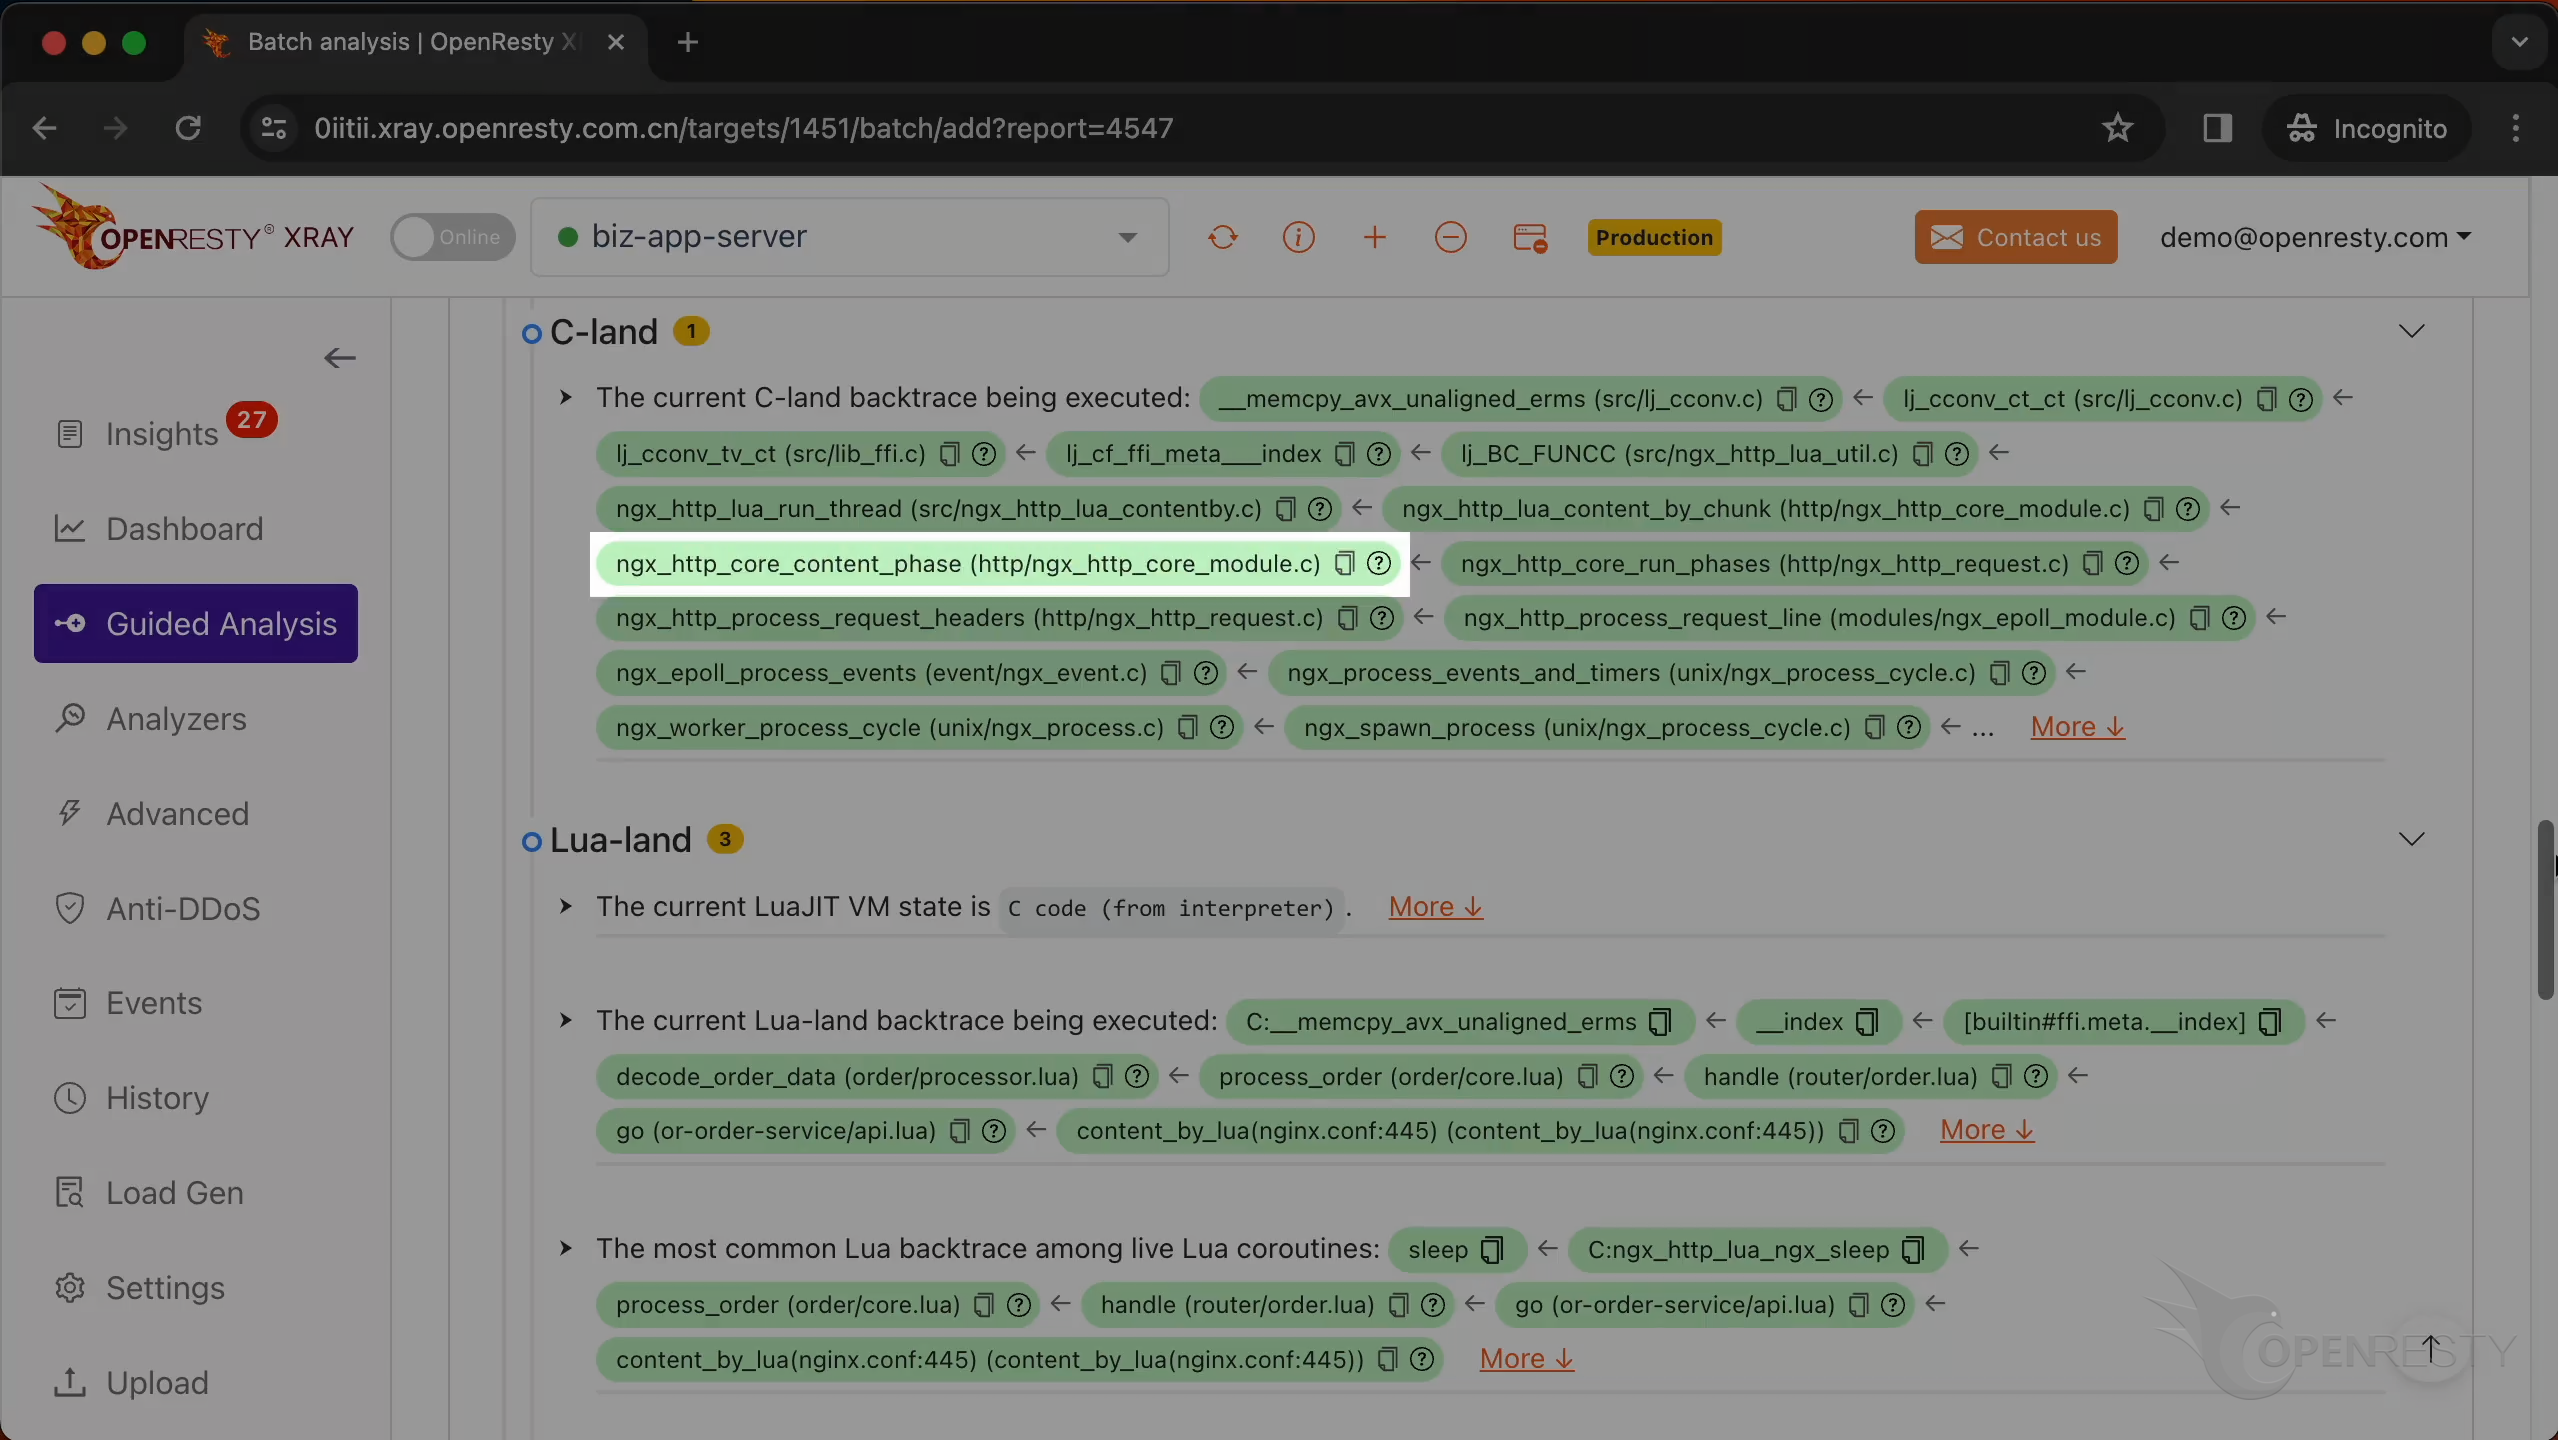
ngx_http_core_content_phase is responsible for processing the content phase of the HTTP request processing cycle.
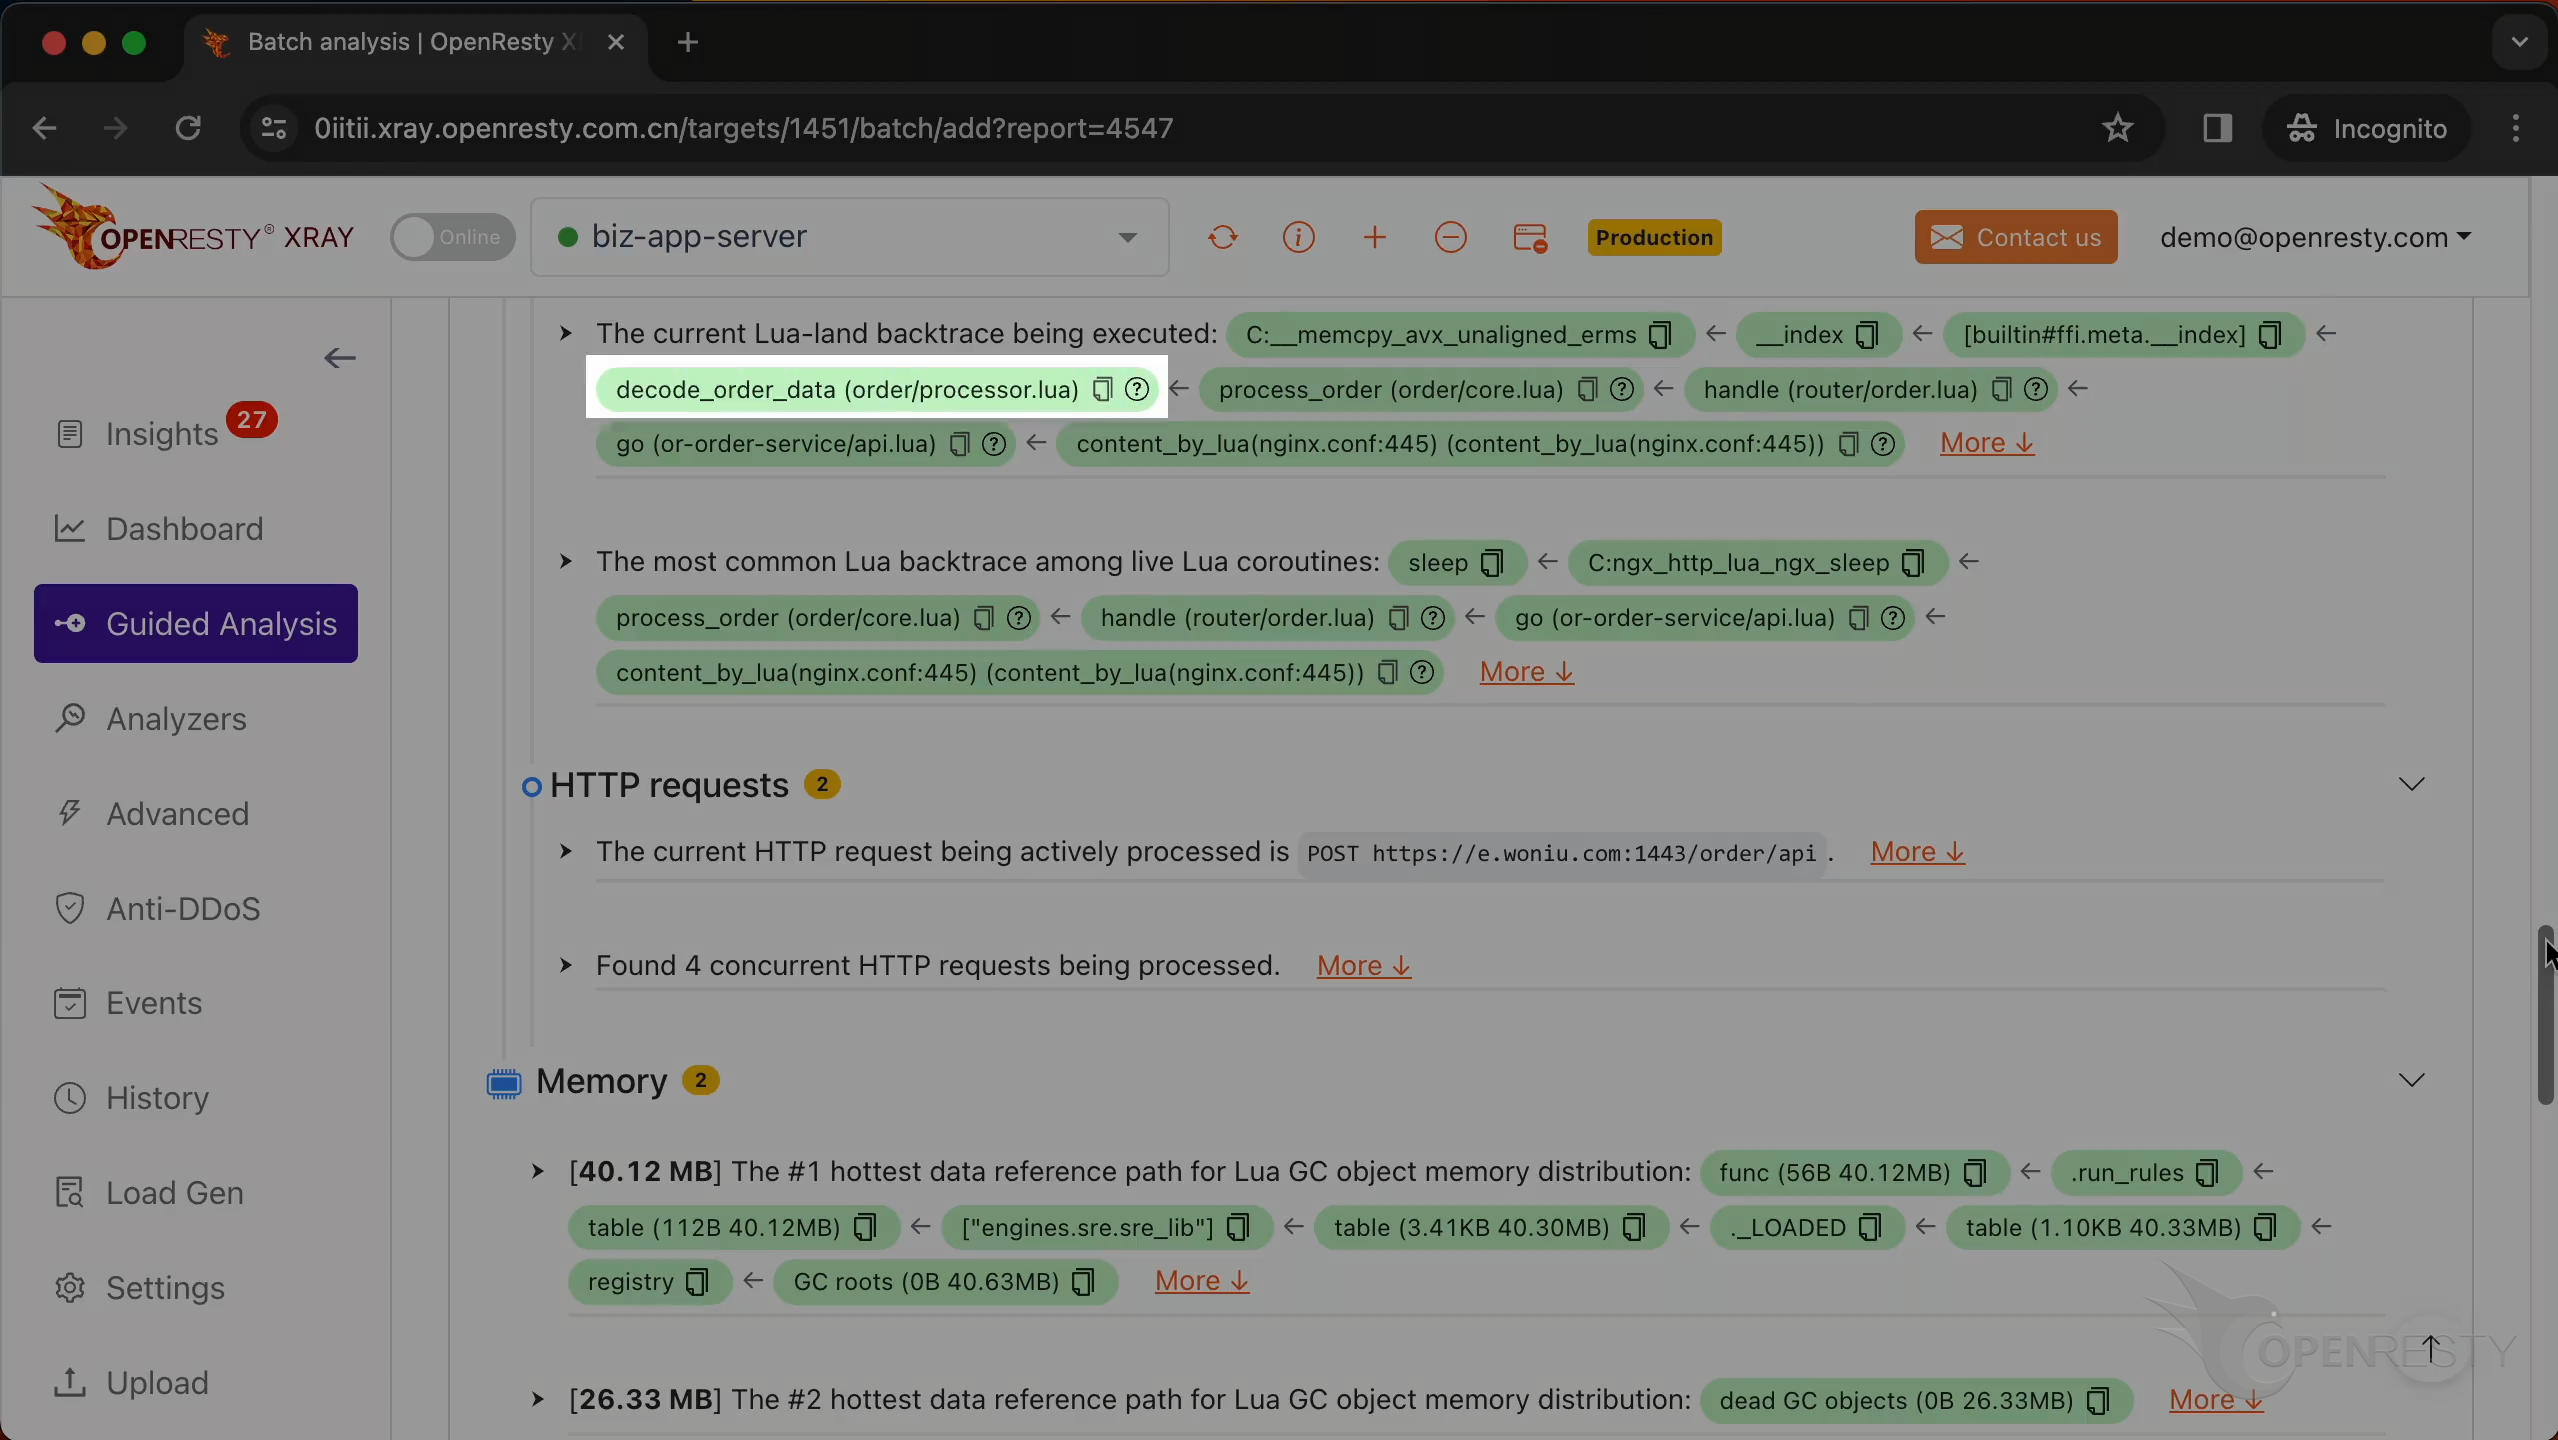
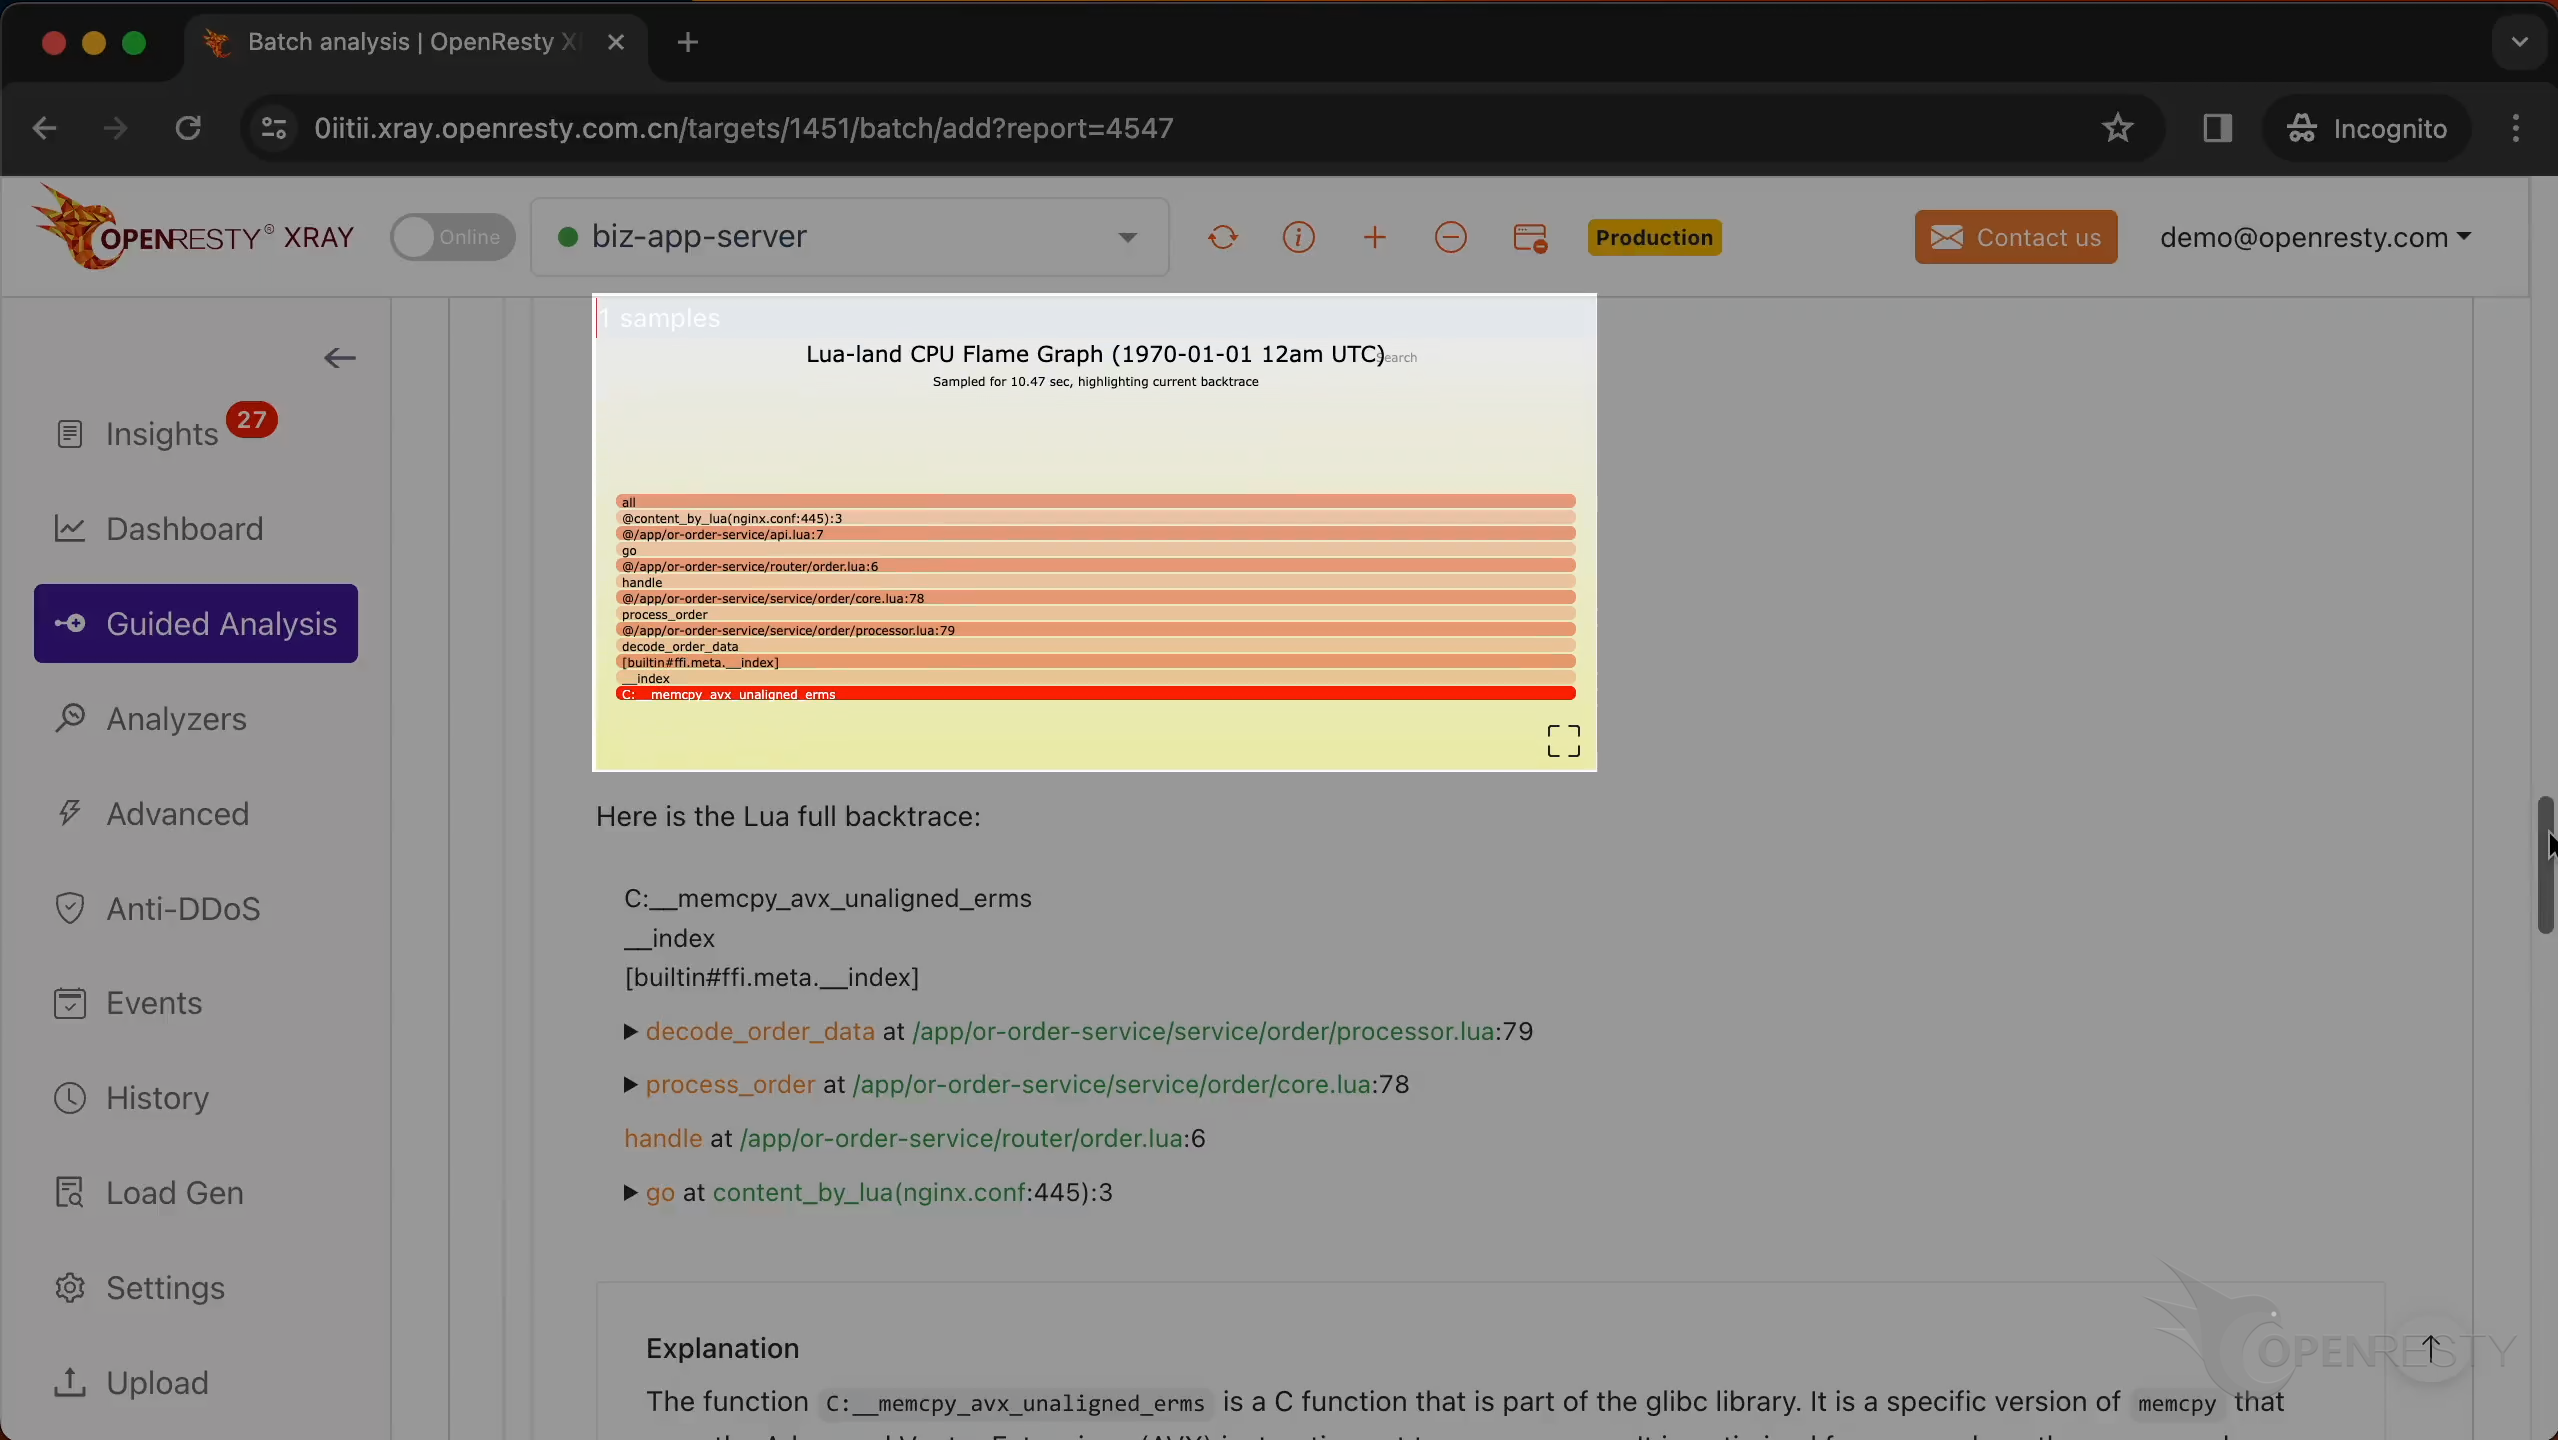
This is the Lua backtrace being executed.
This C function performs the memory copy operation, which we already saw in the C backtrace.
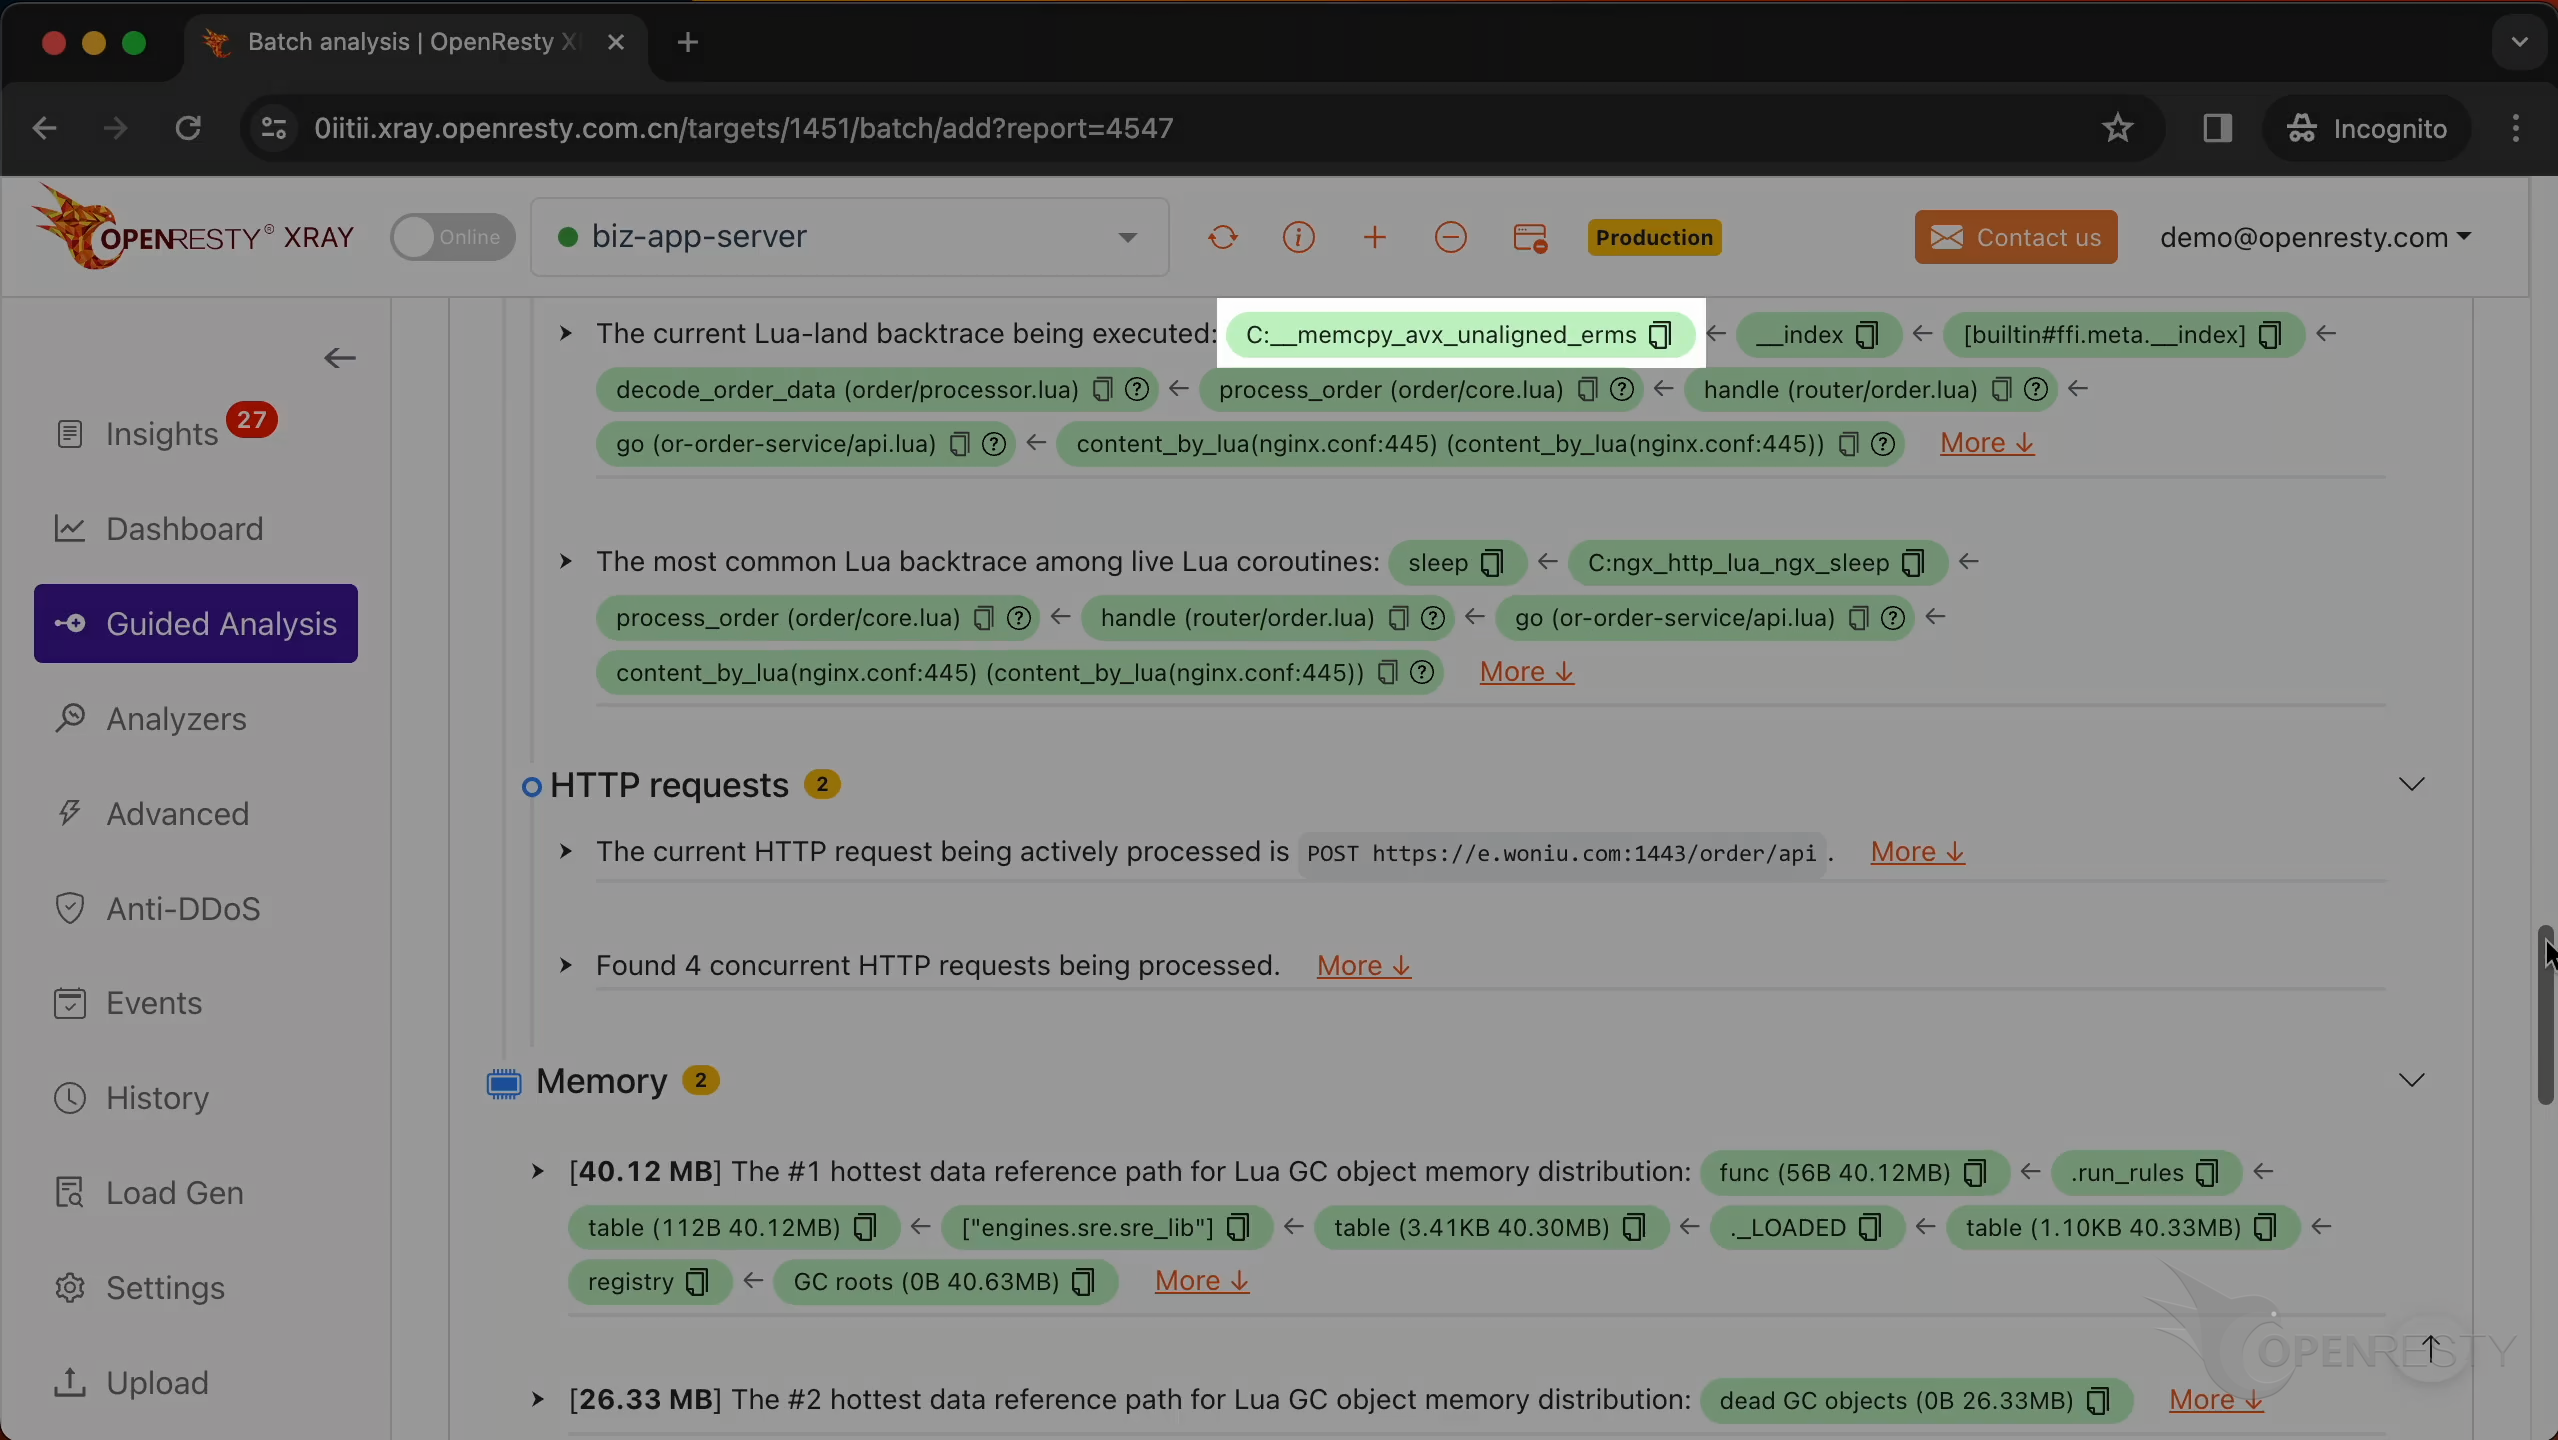
These two meta methods are called when accessing a field member inside cdata.
decode_order_data is a Lua function in the business code.
Click “More” to see more details.
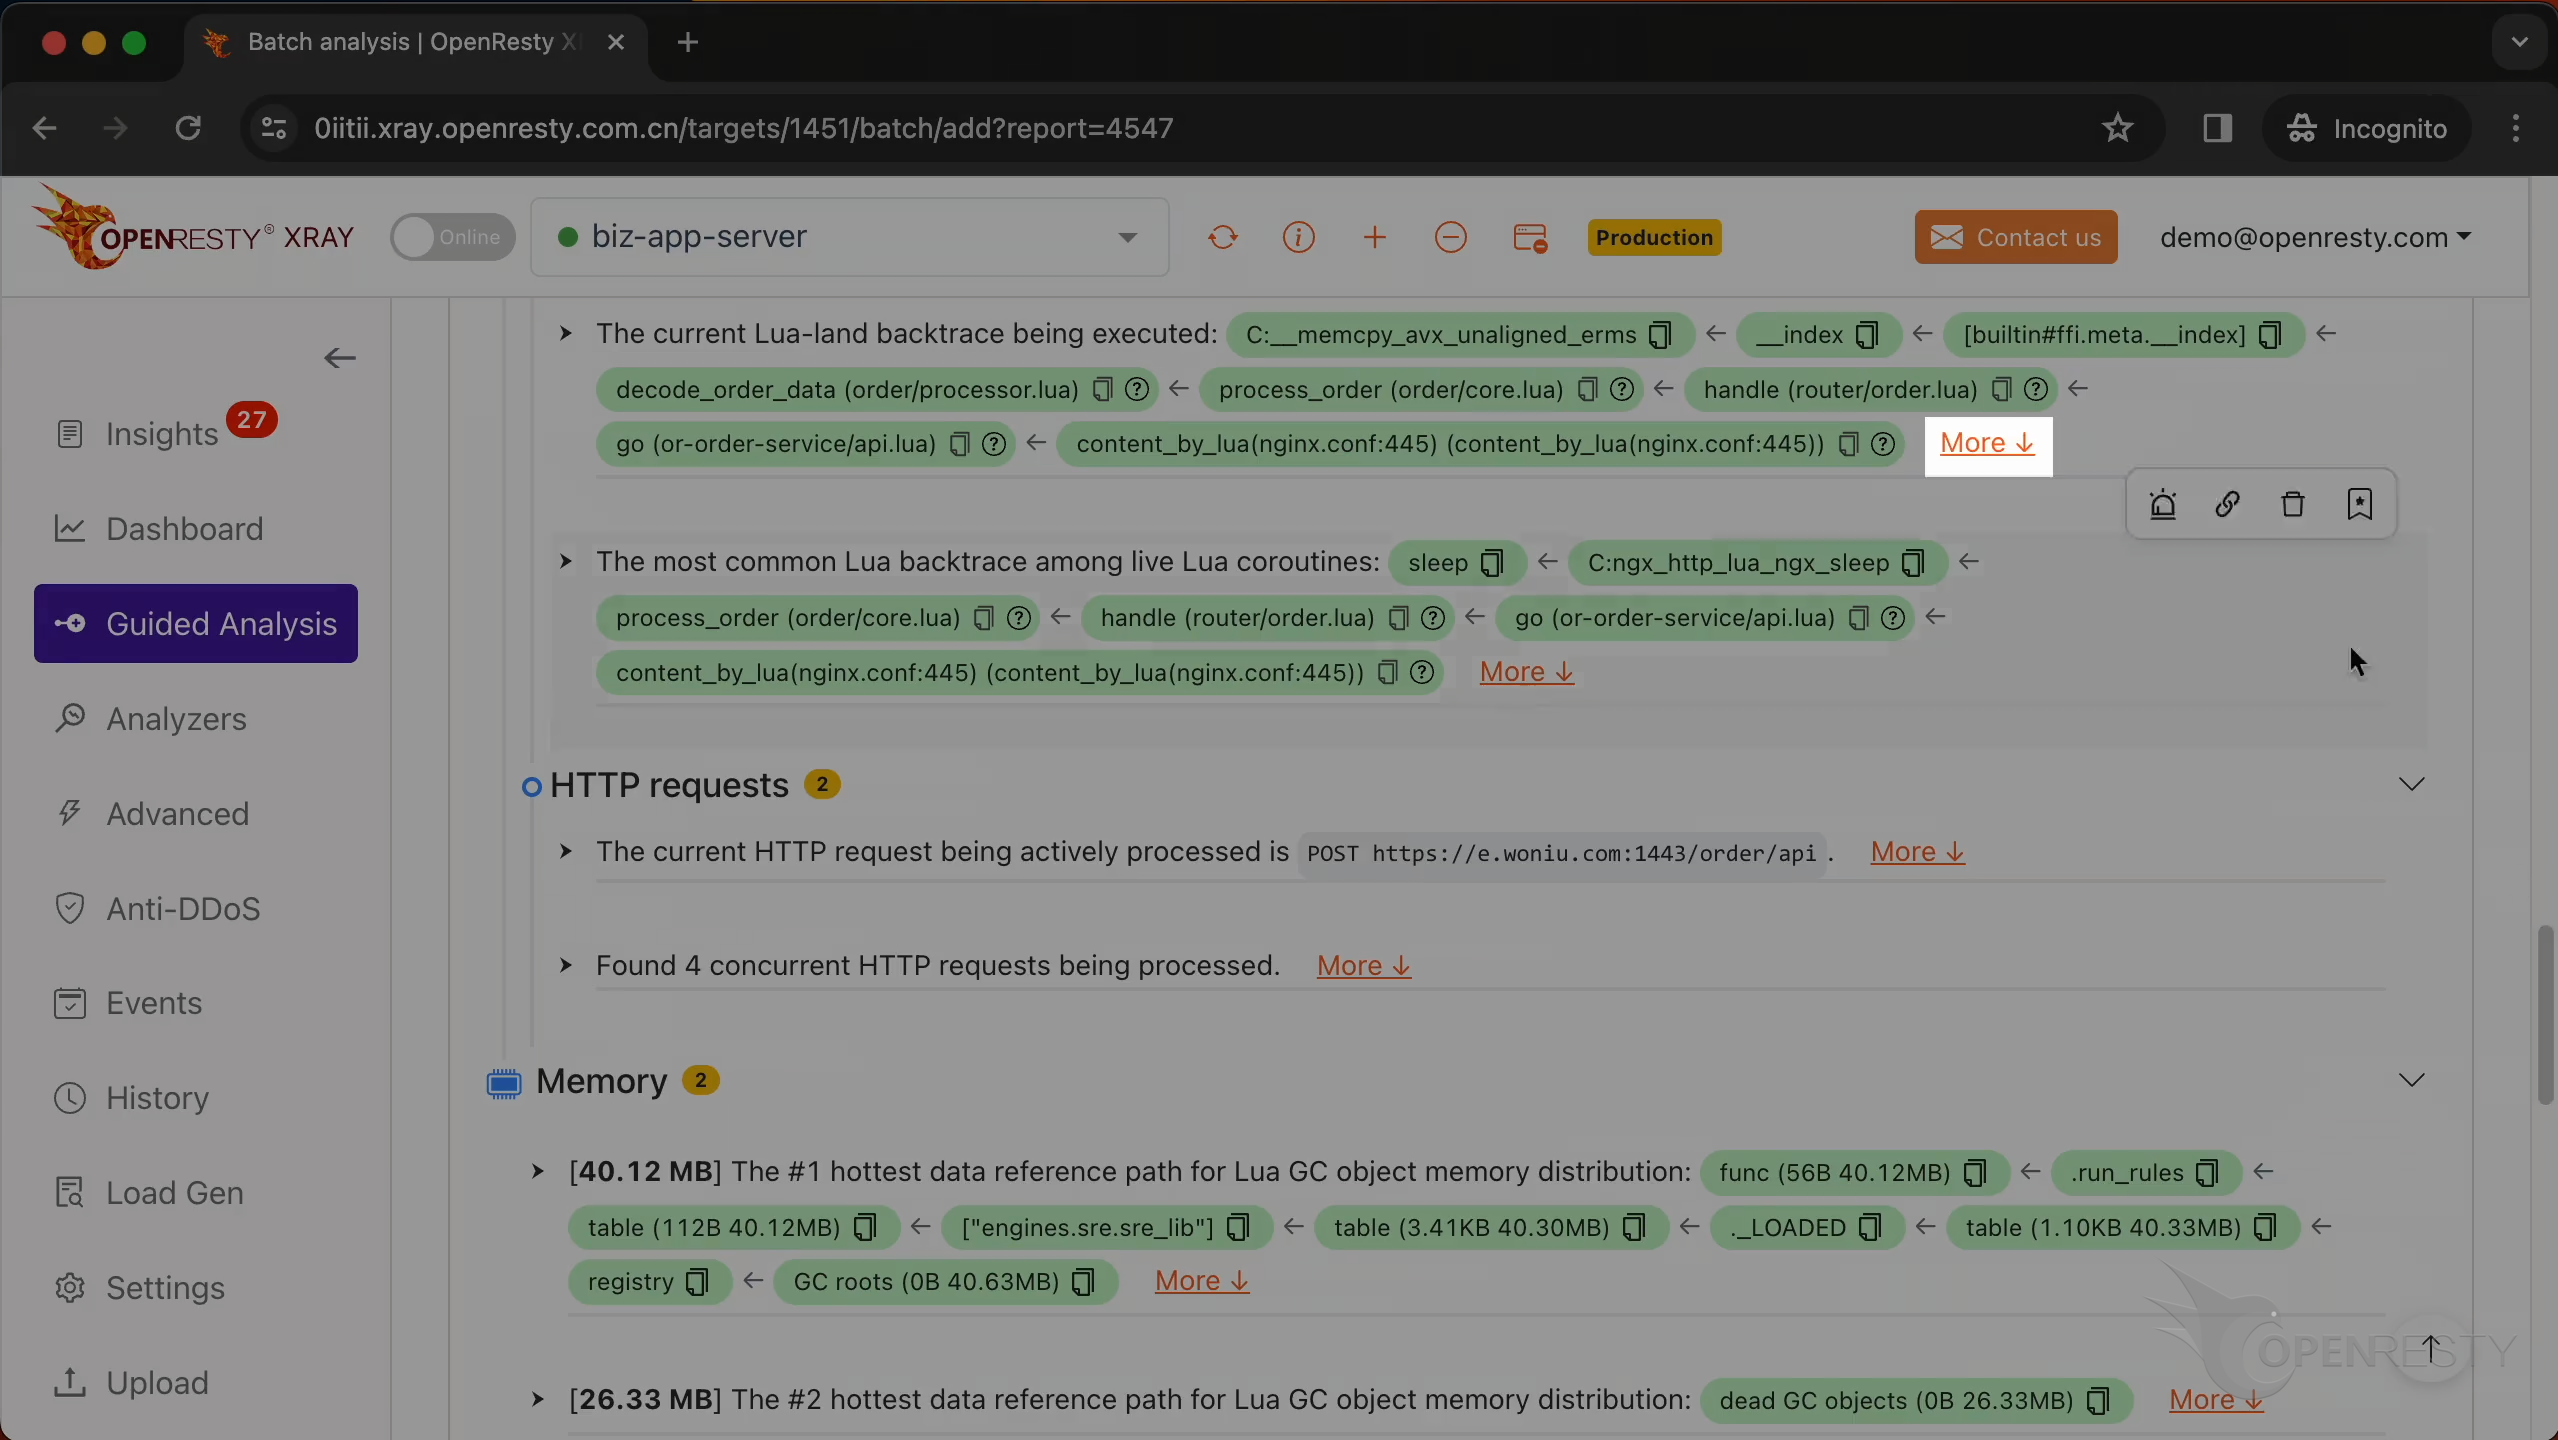
The backtrace above is automatically inferred from this Lua CPU flame graph.
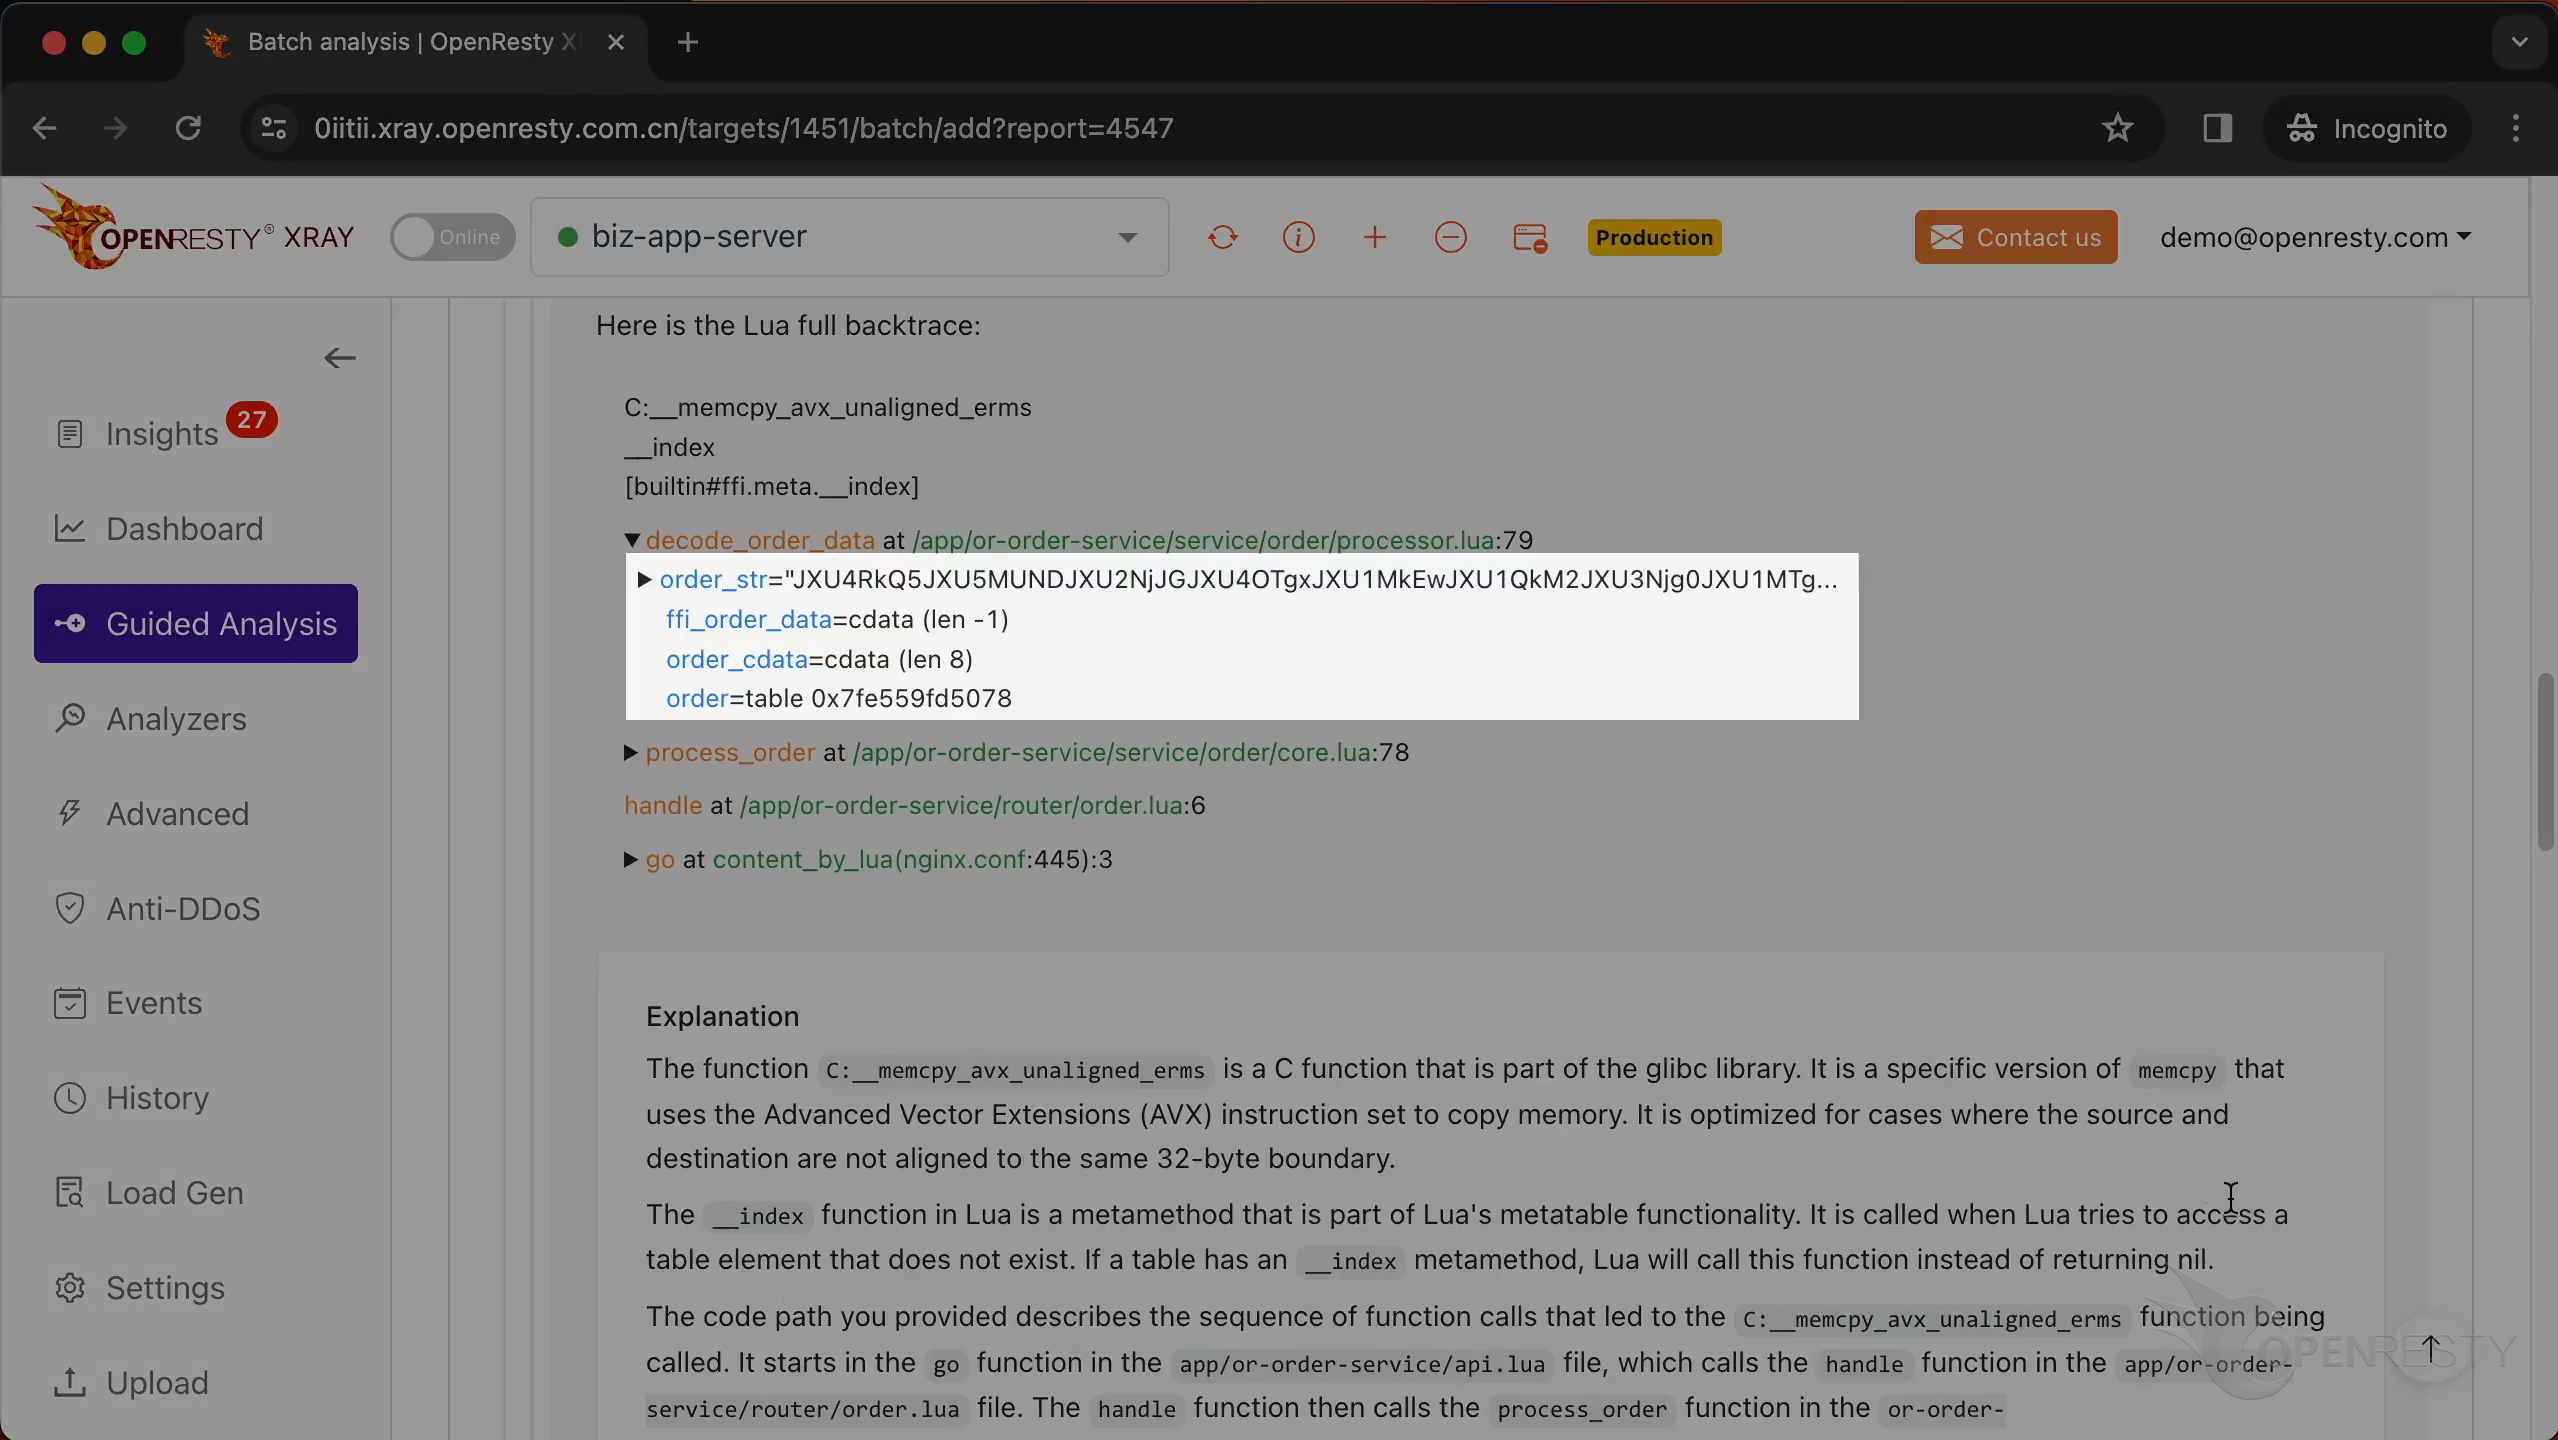
Below is the full call stack trace, containing the values of all parameters and local variables in each Lua function frame.
Click here to view all the local variables and parameter variables of the function decode_order_data.
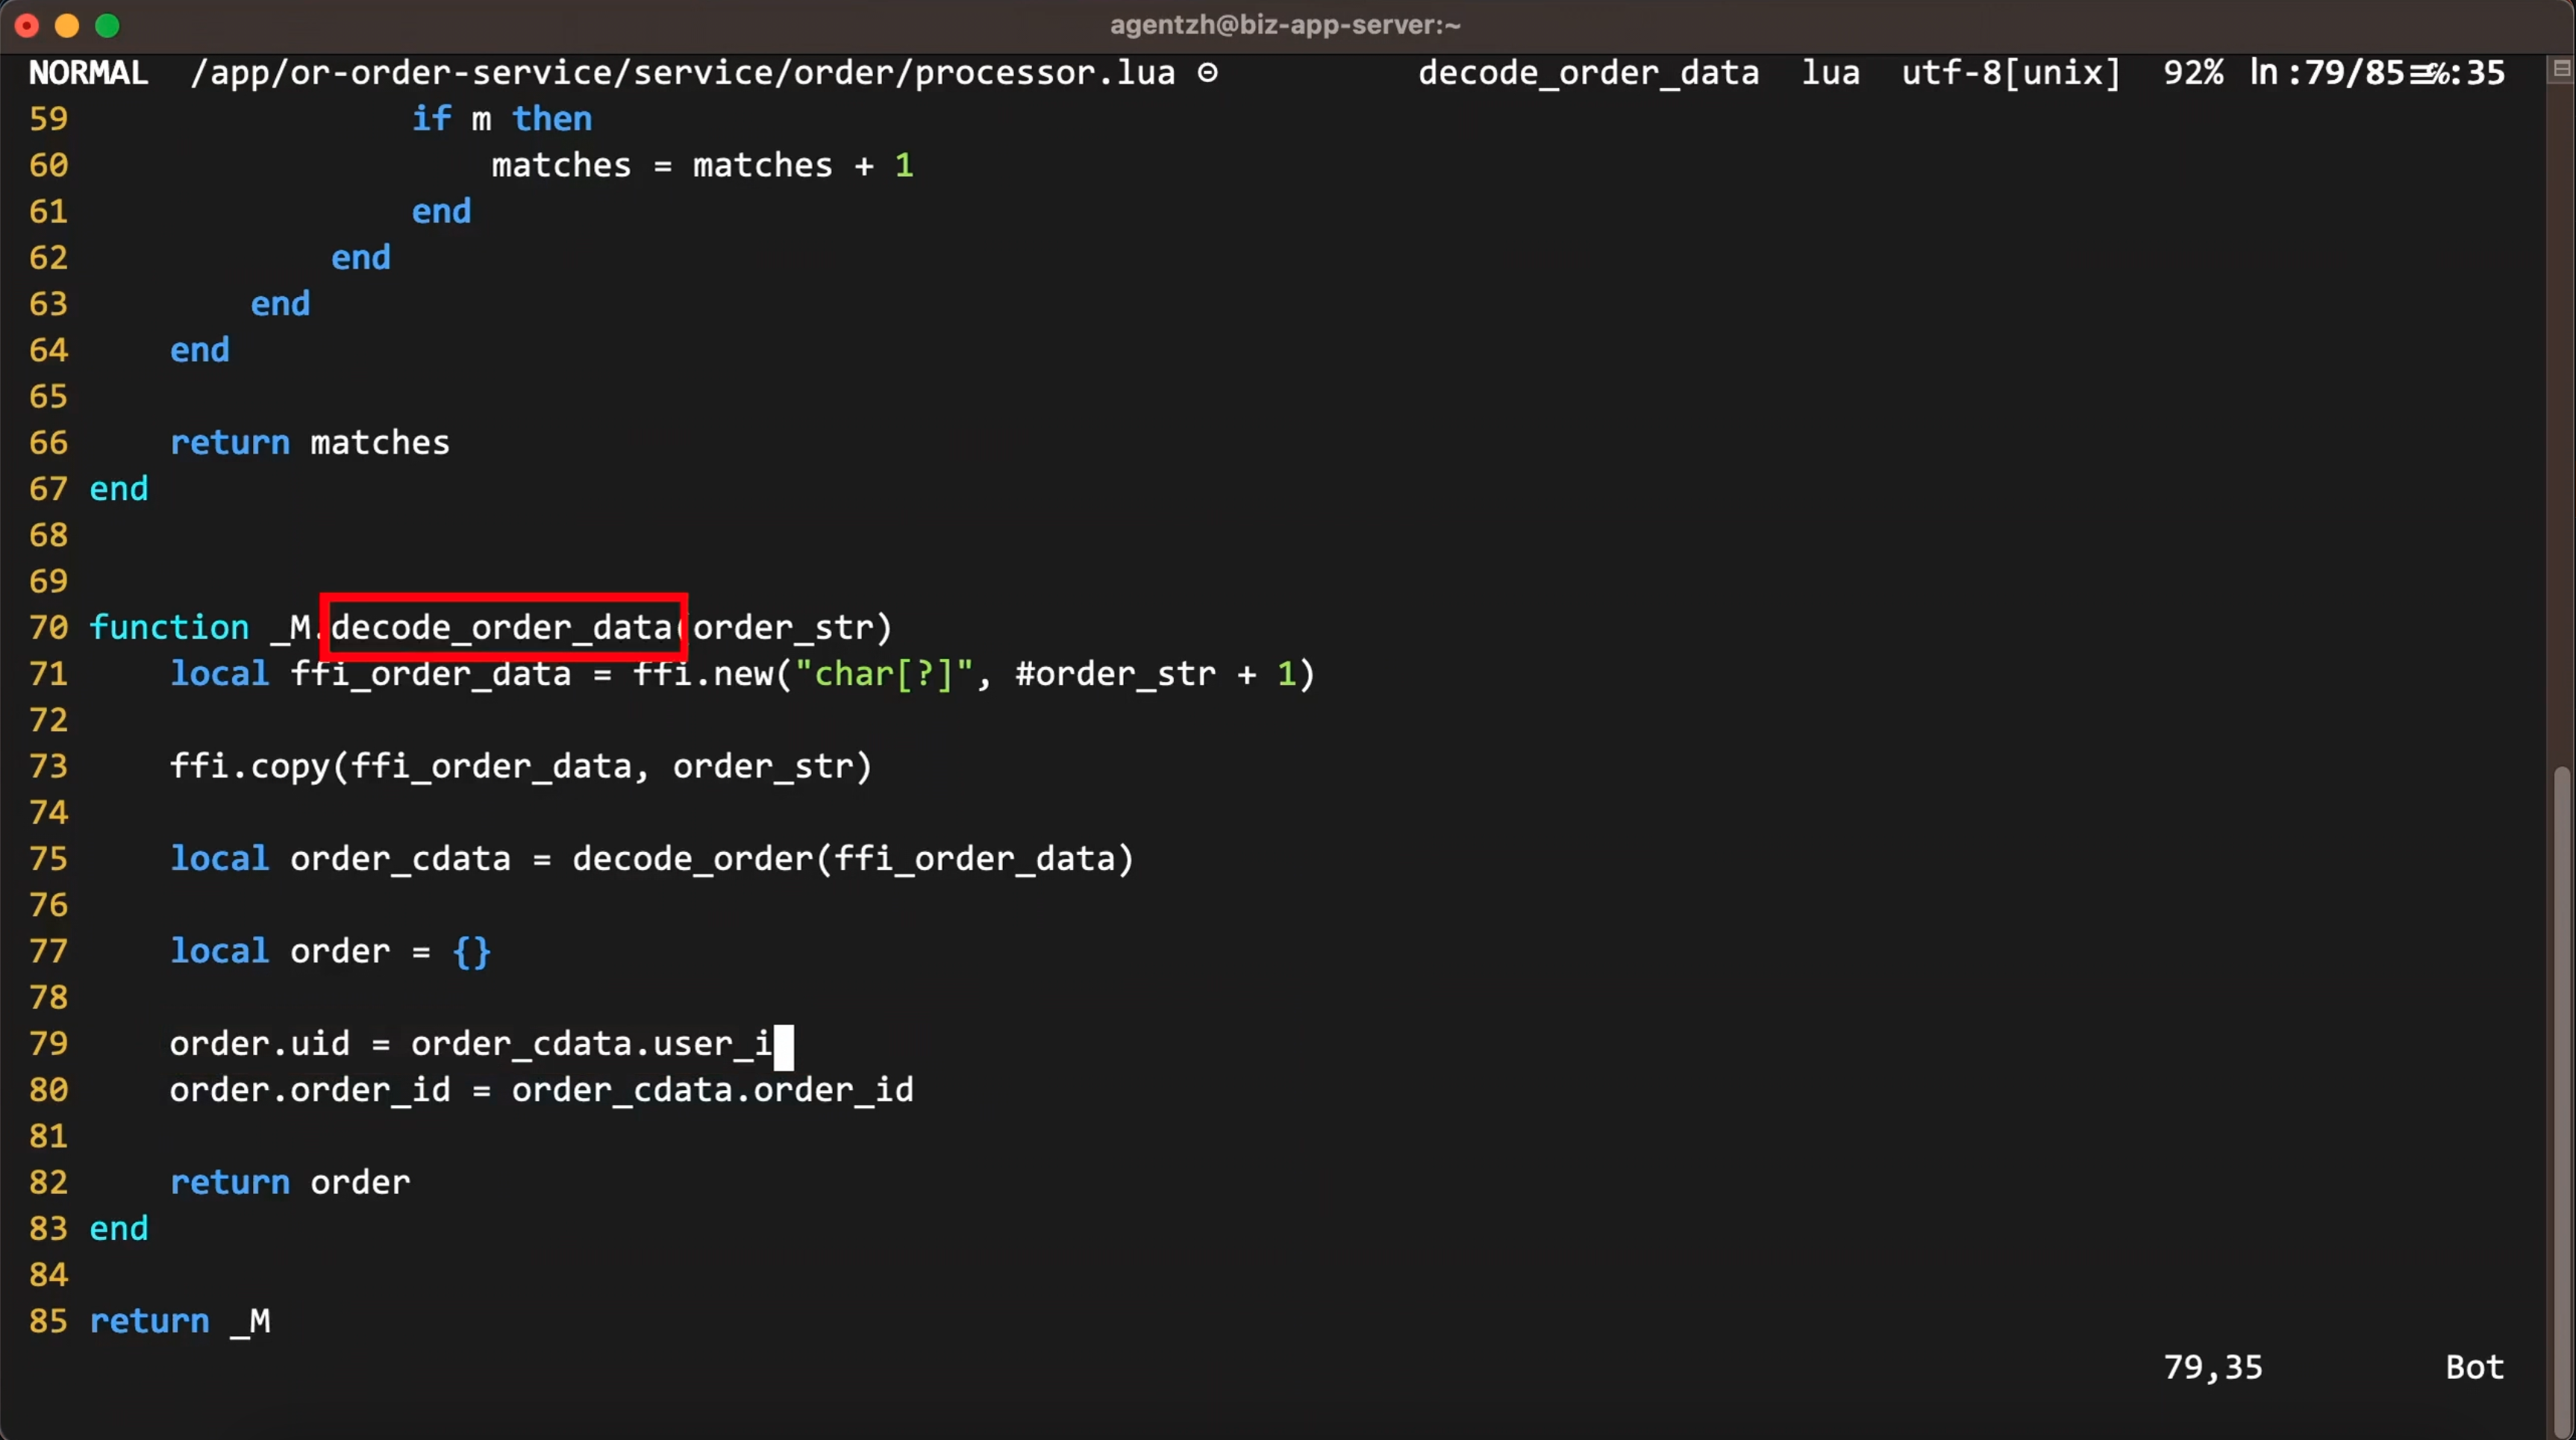
Let’s go back to the business-level function decode_order_data. Hover the mouse over the green box for this function.
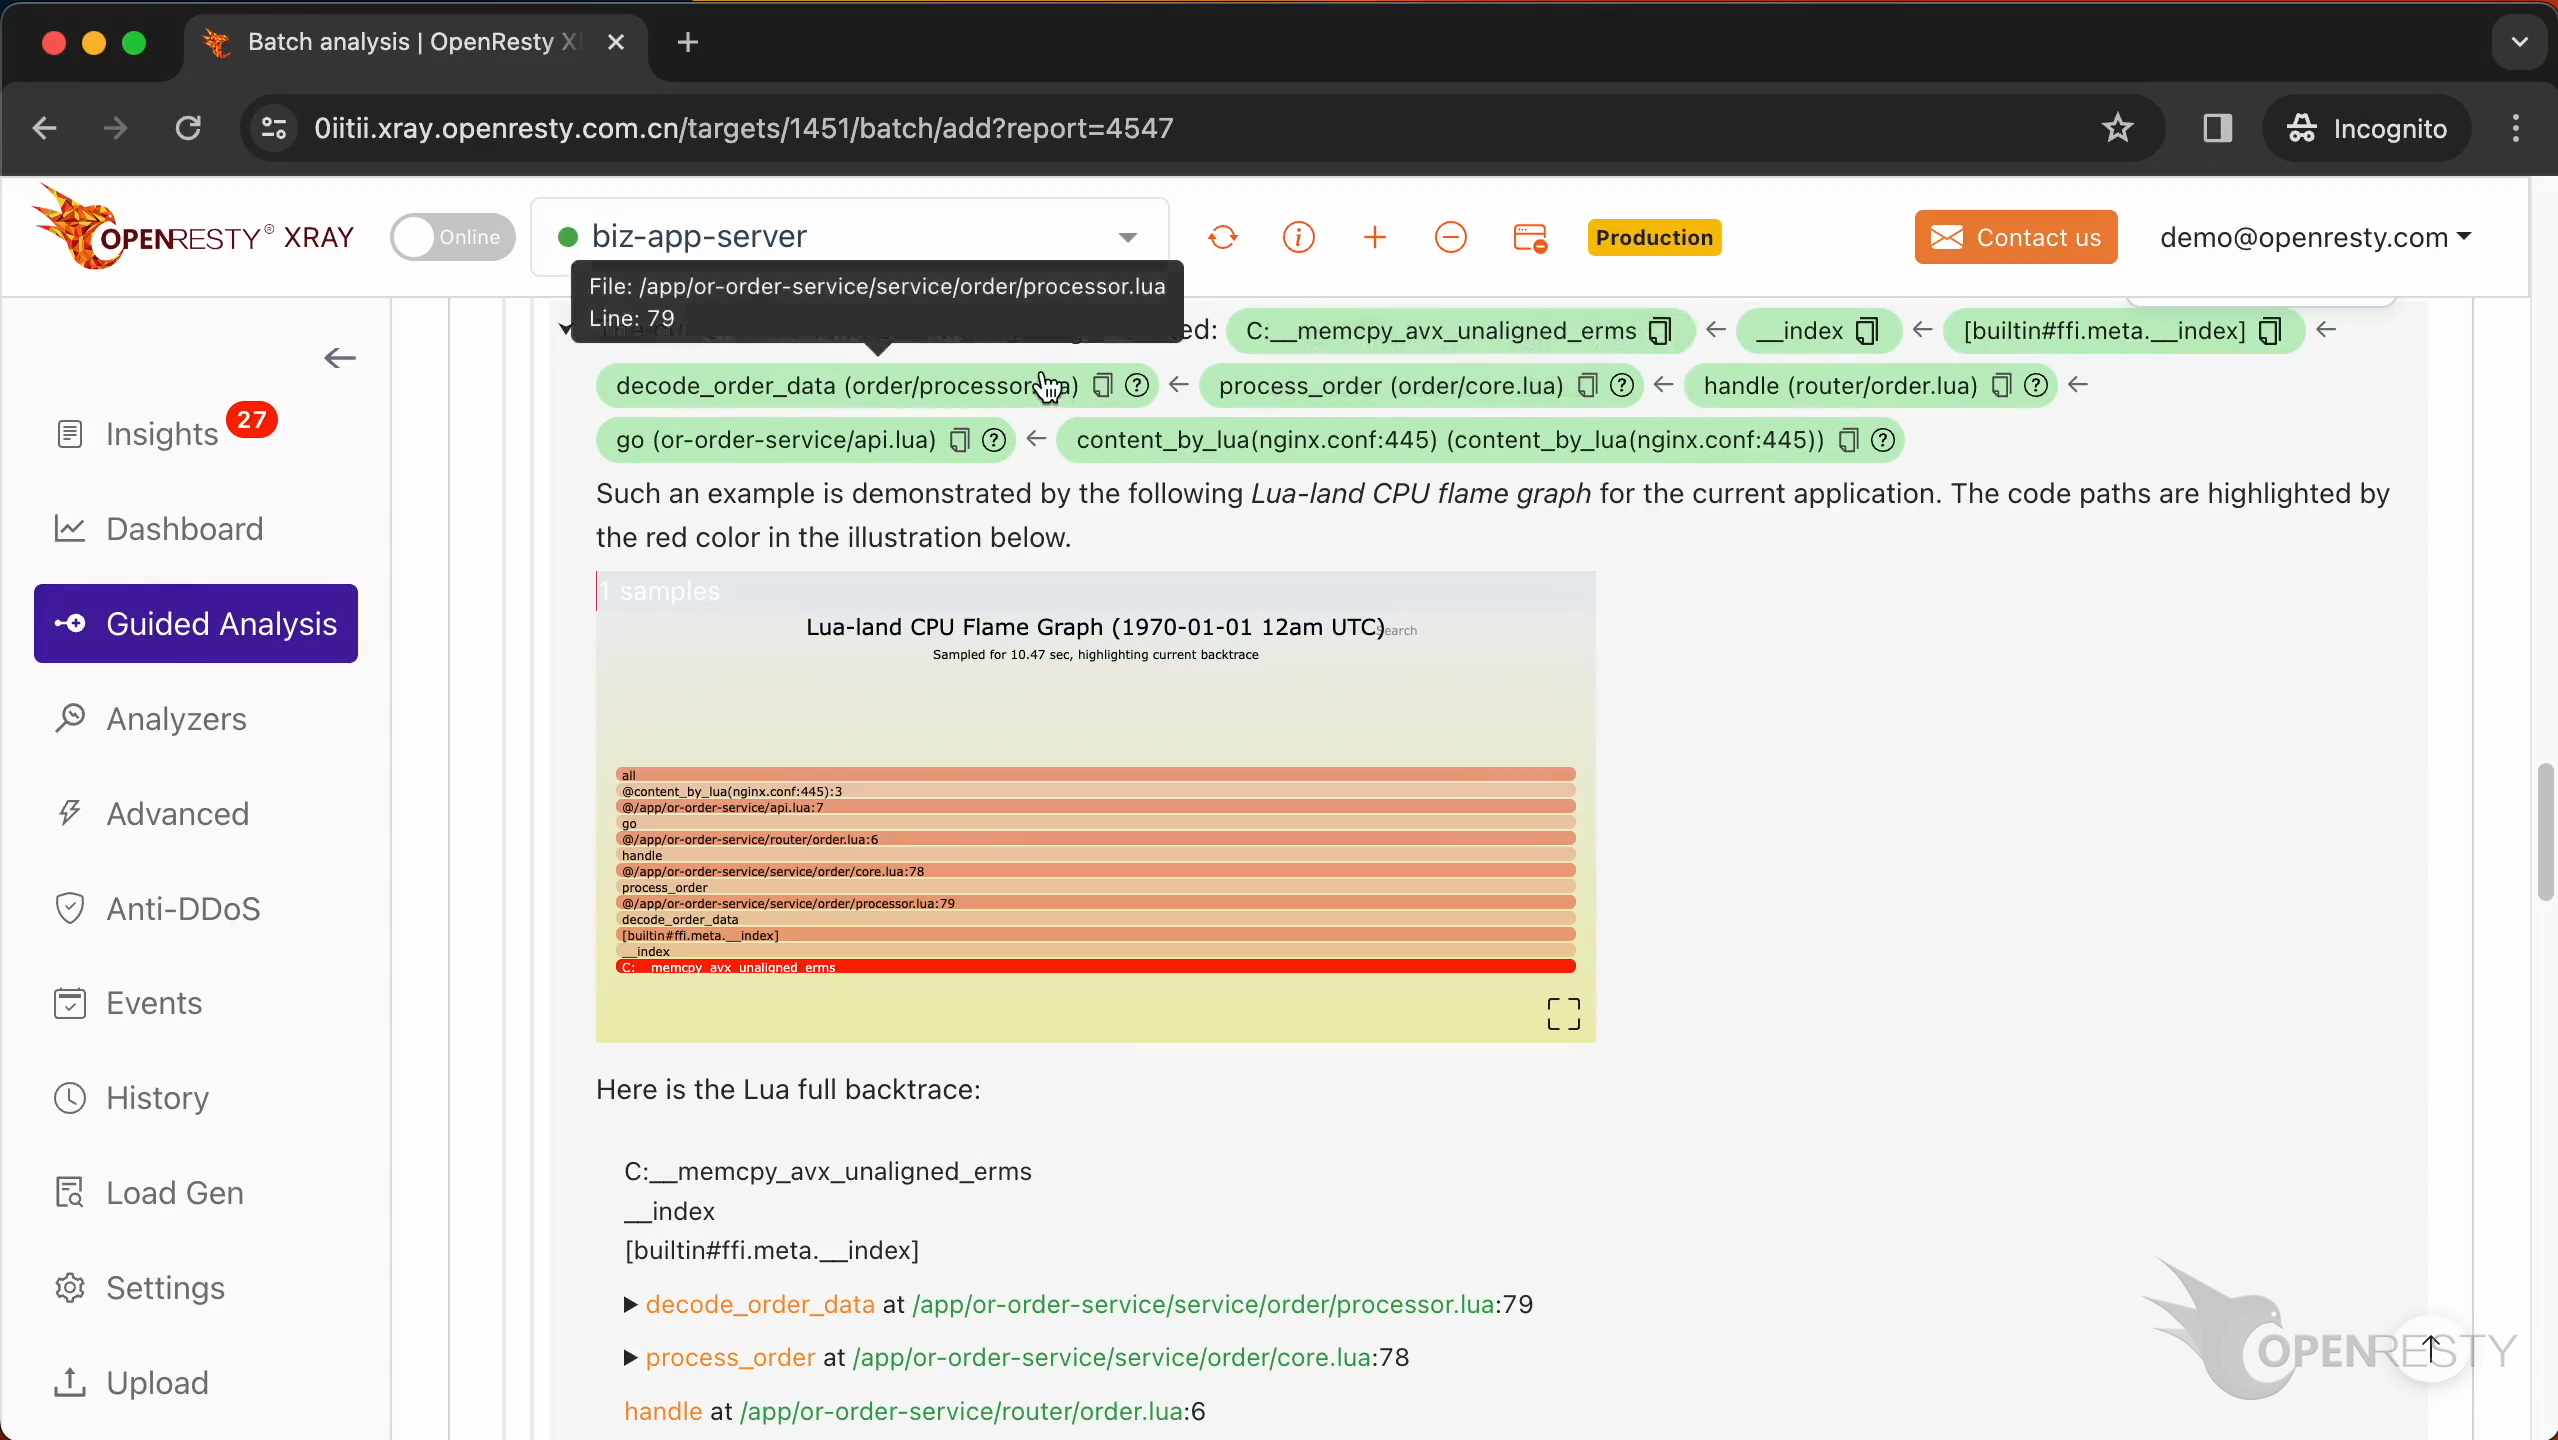
We can see the source file of this function. And its full path in the tooltip.
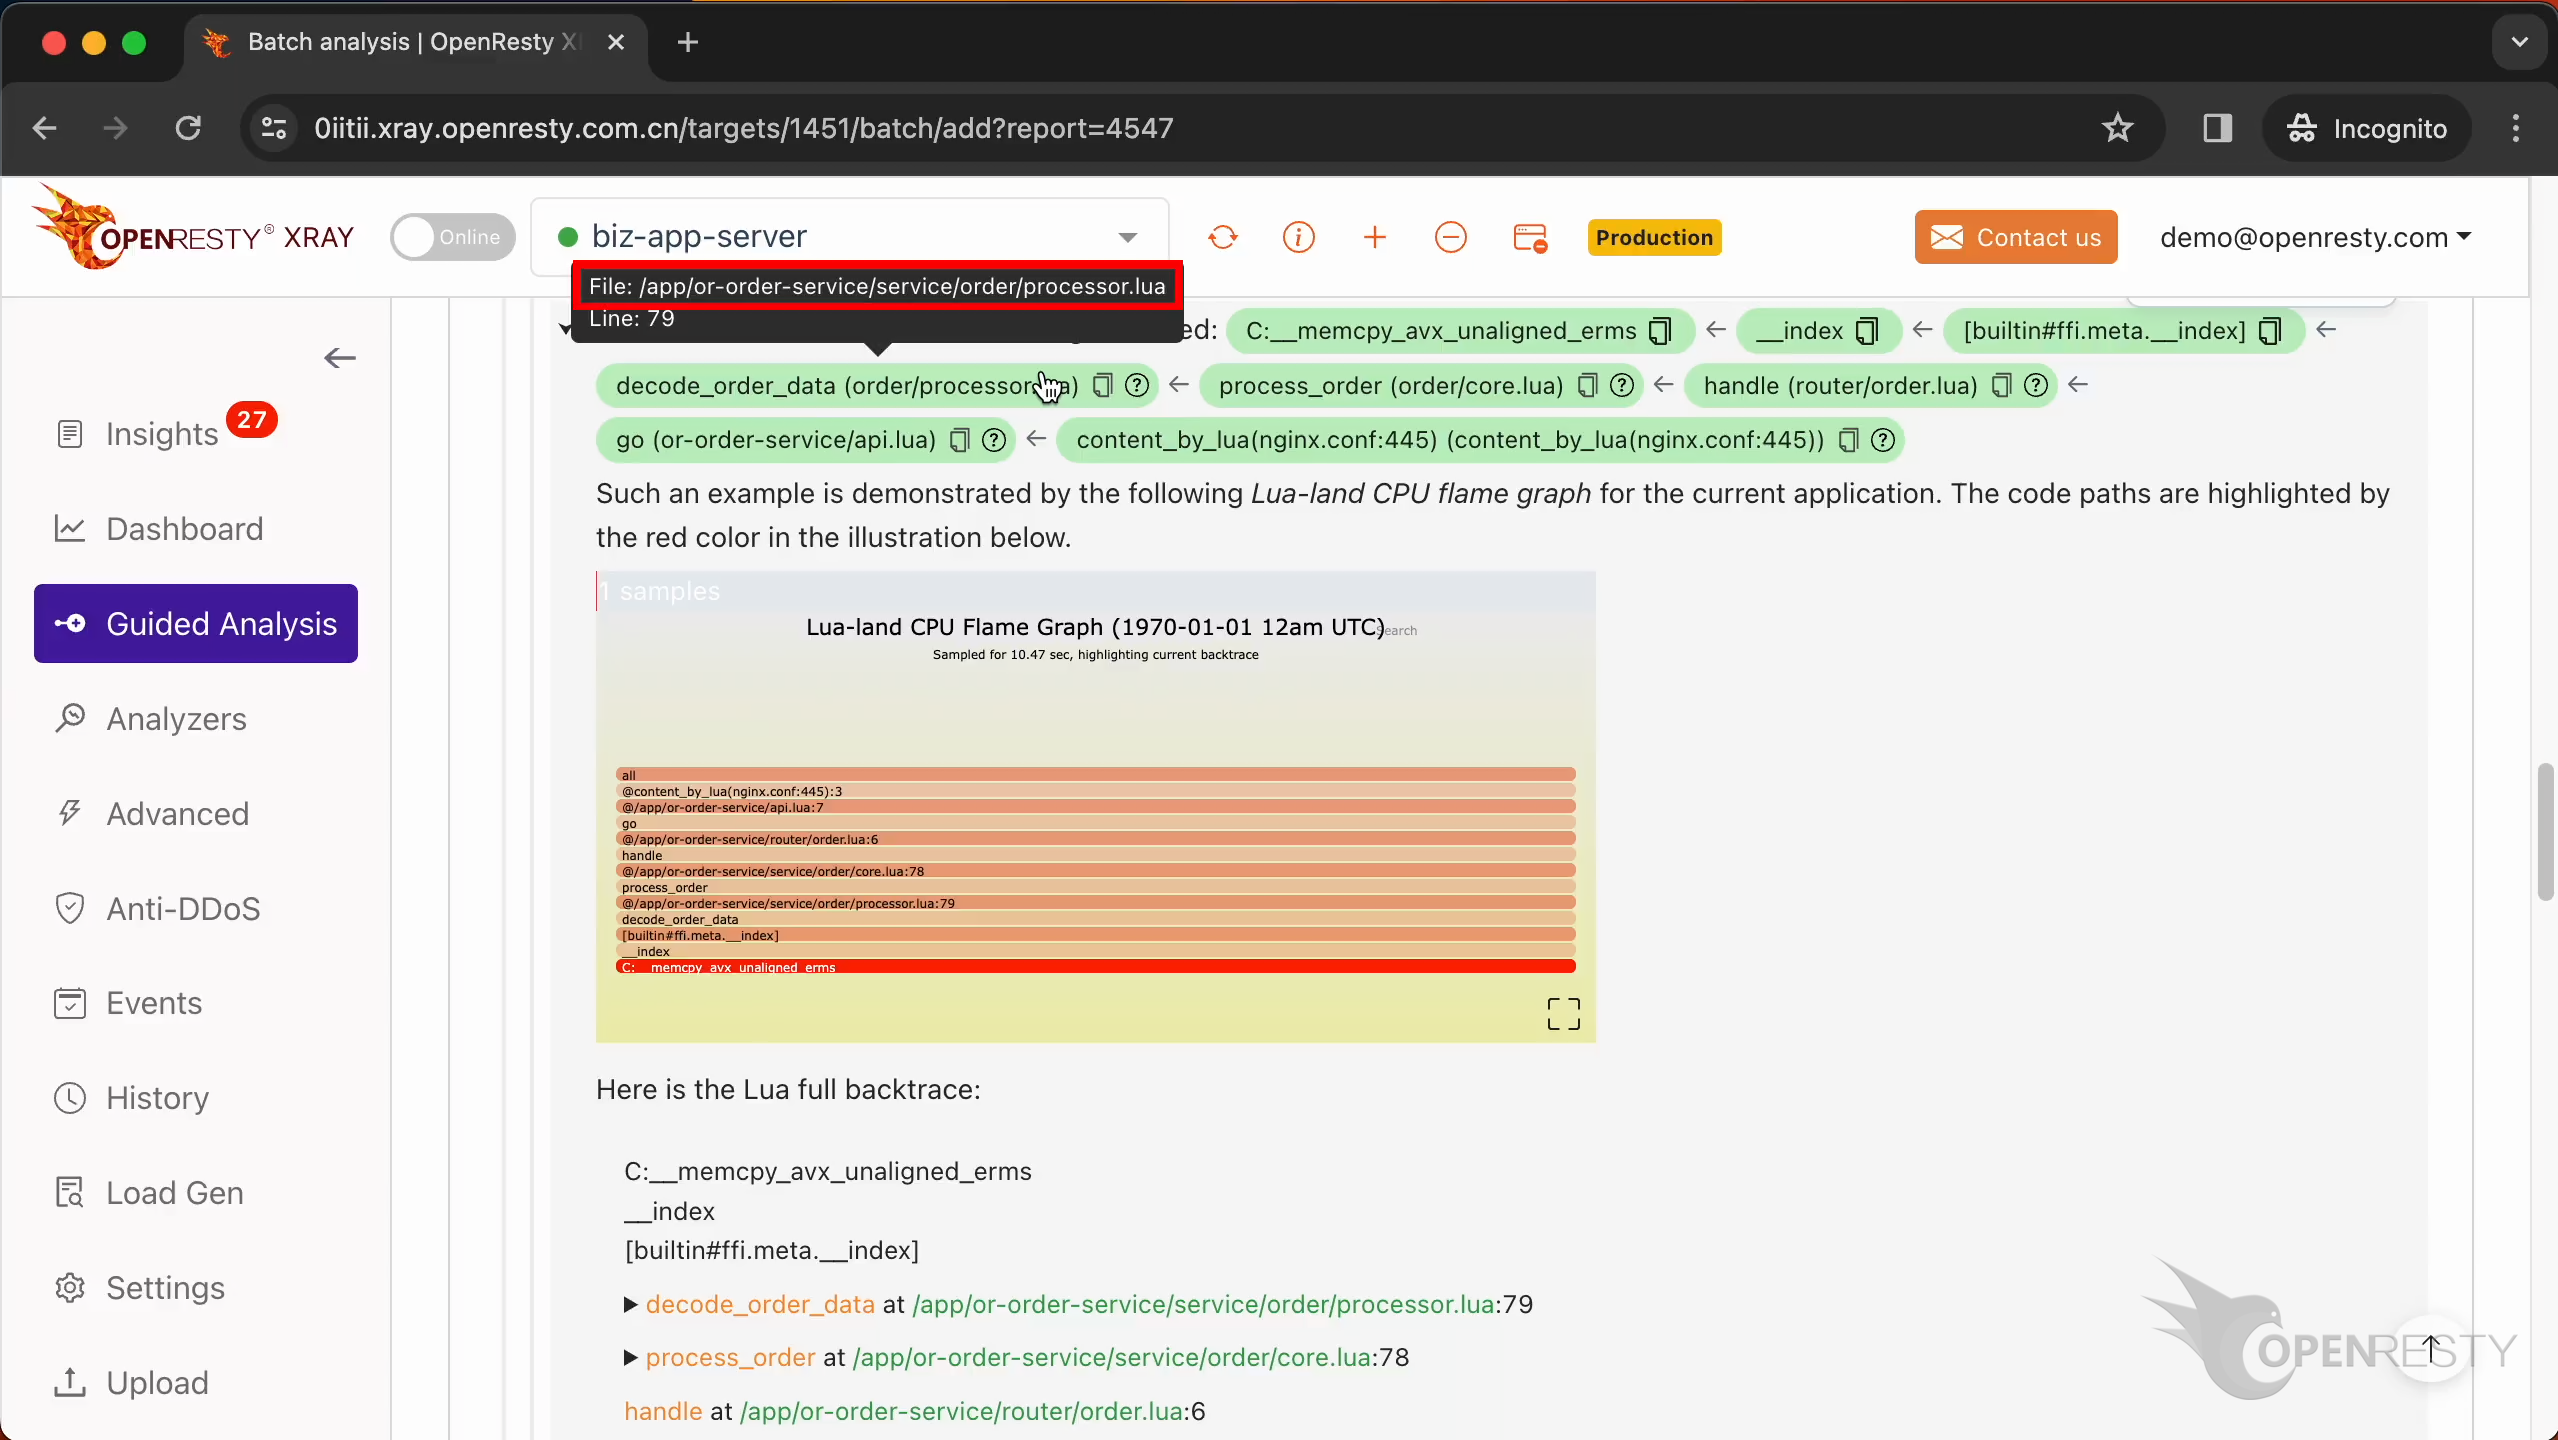
The source line number is 79.
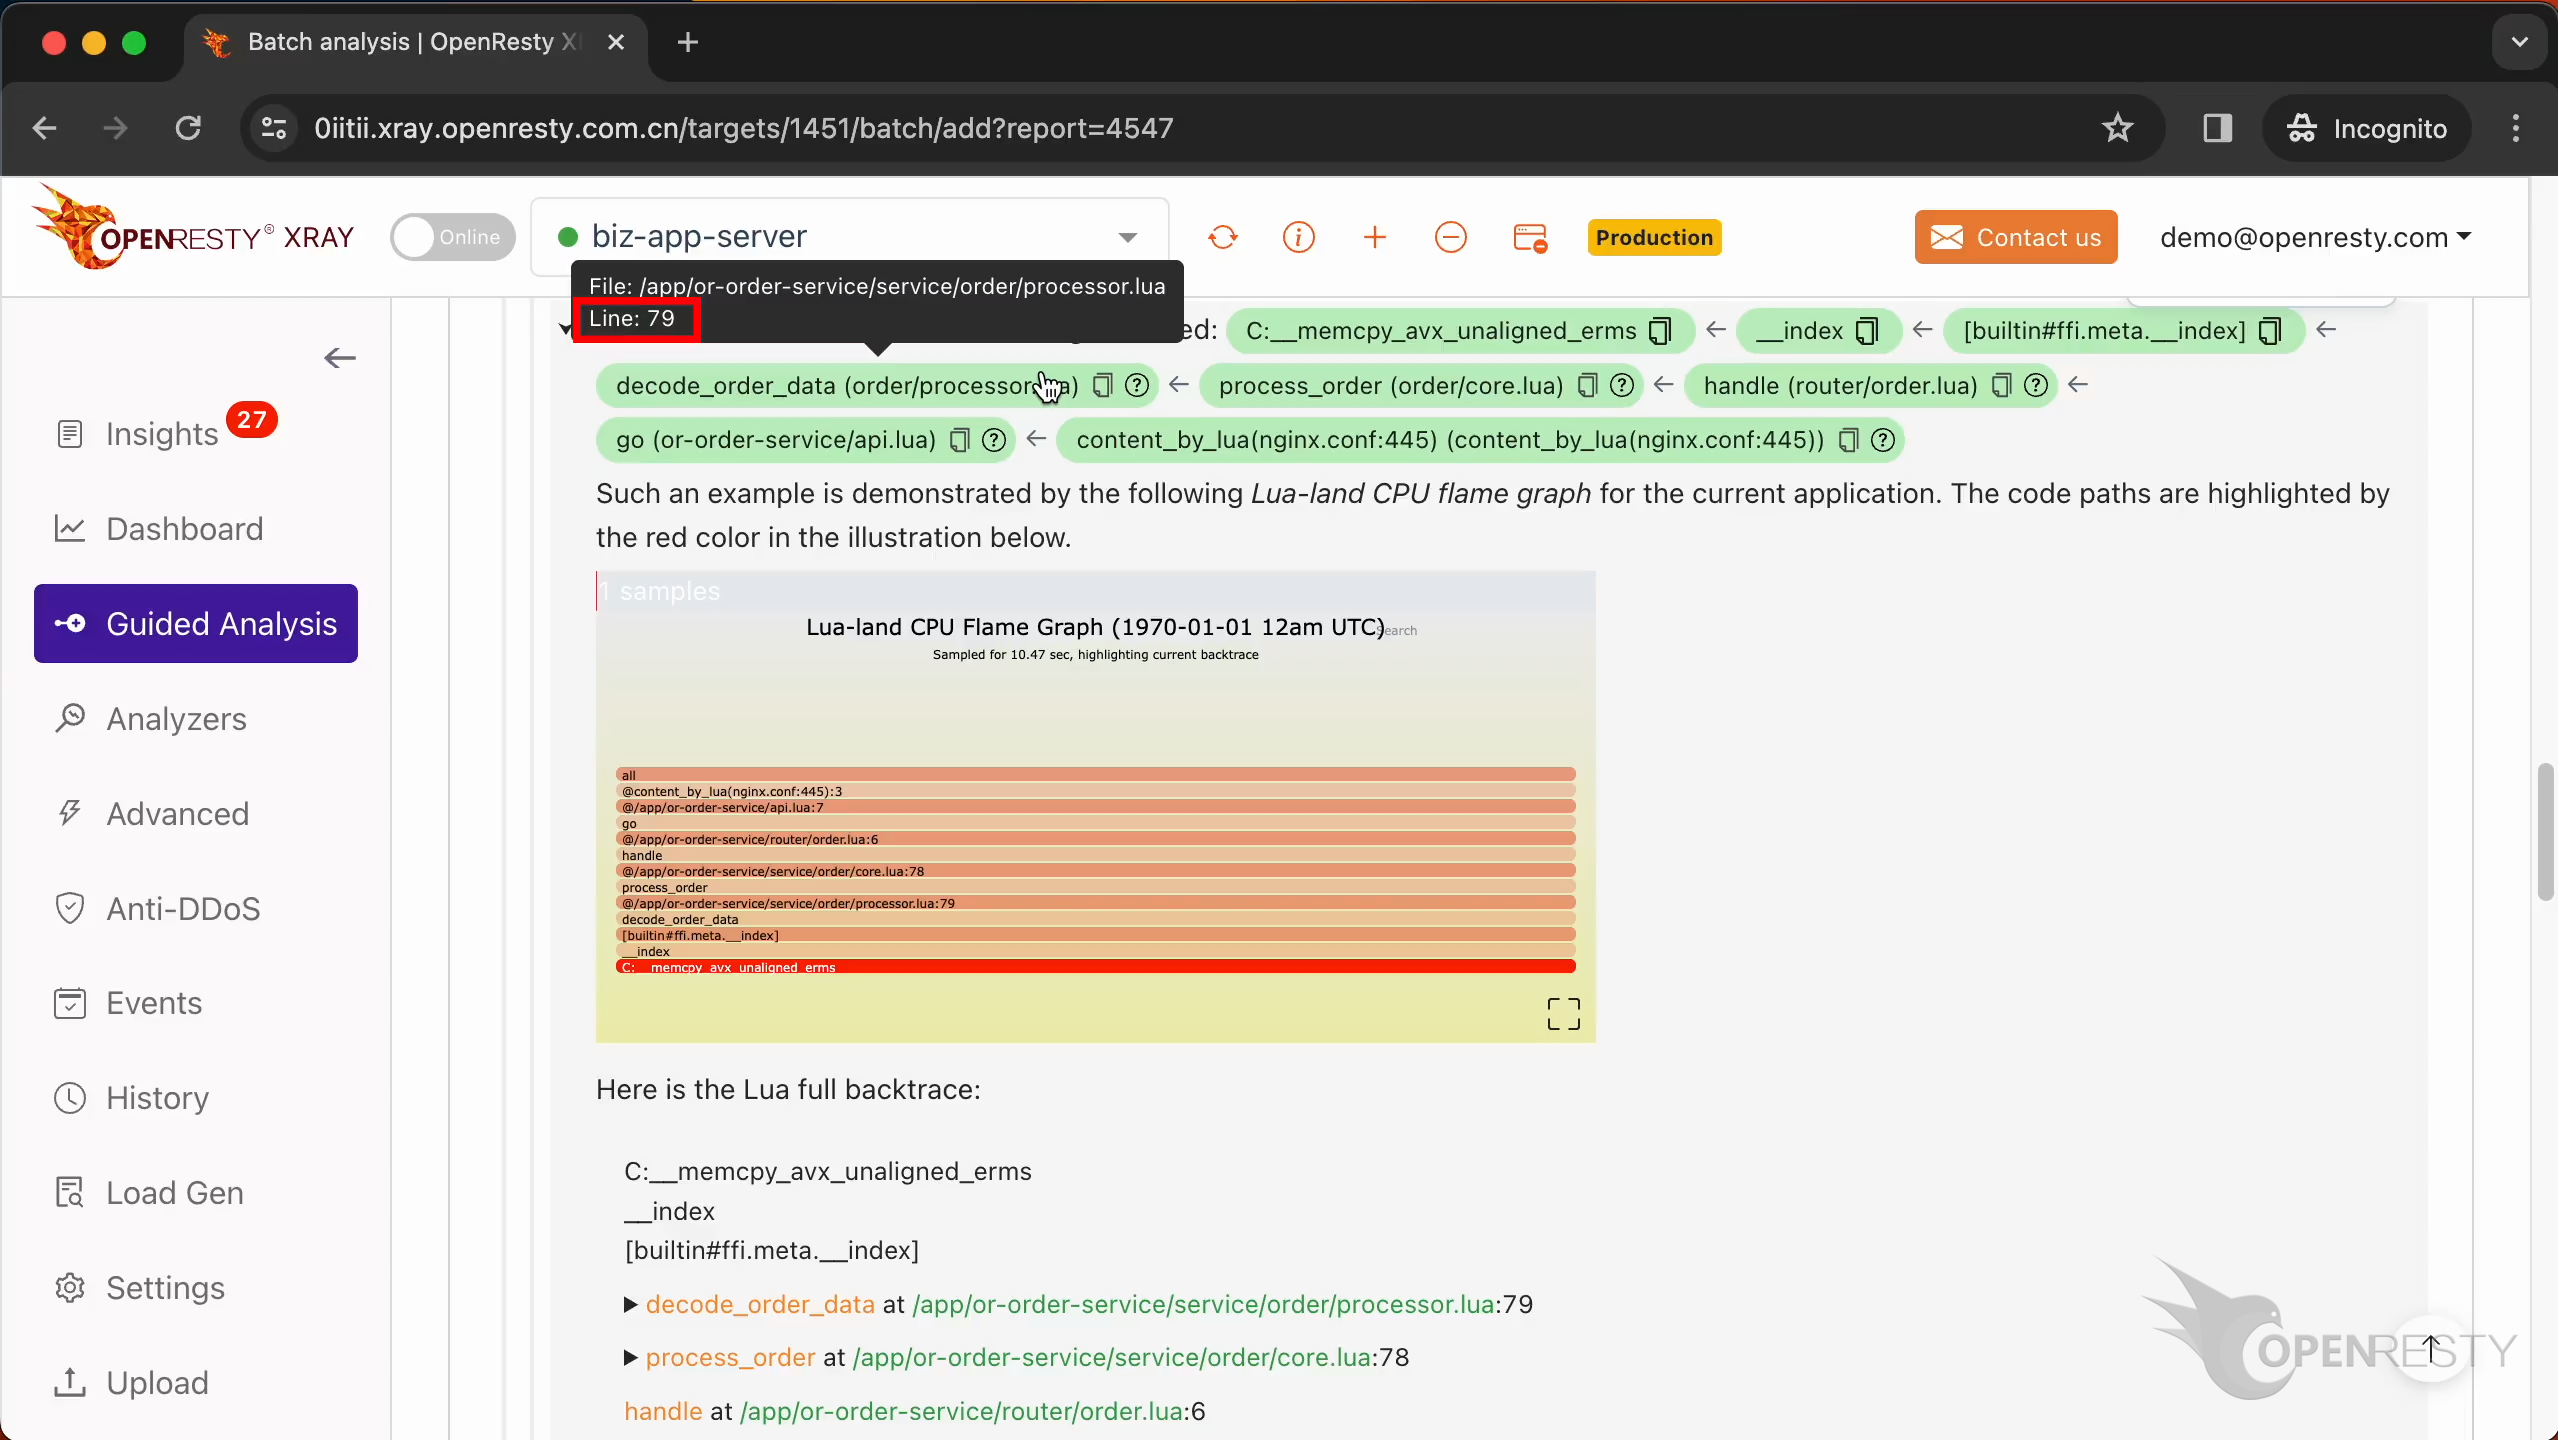
Click the icon to copy the full source file path for this function.
![]()
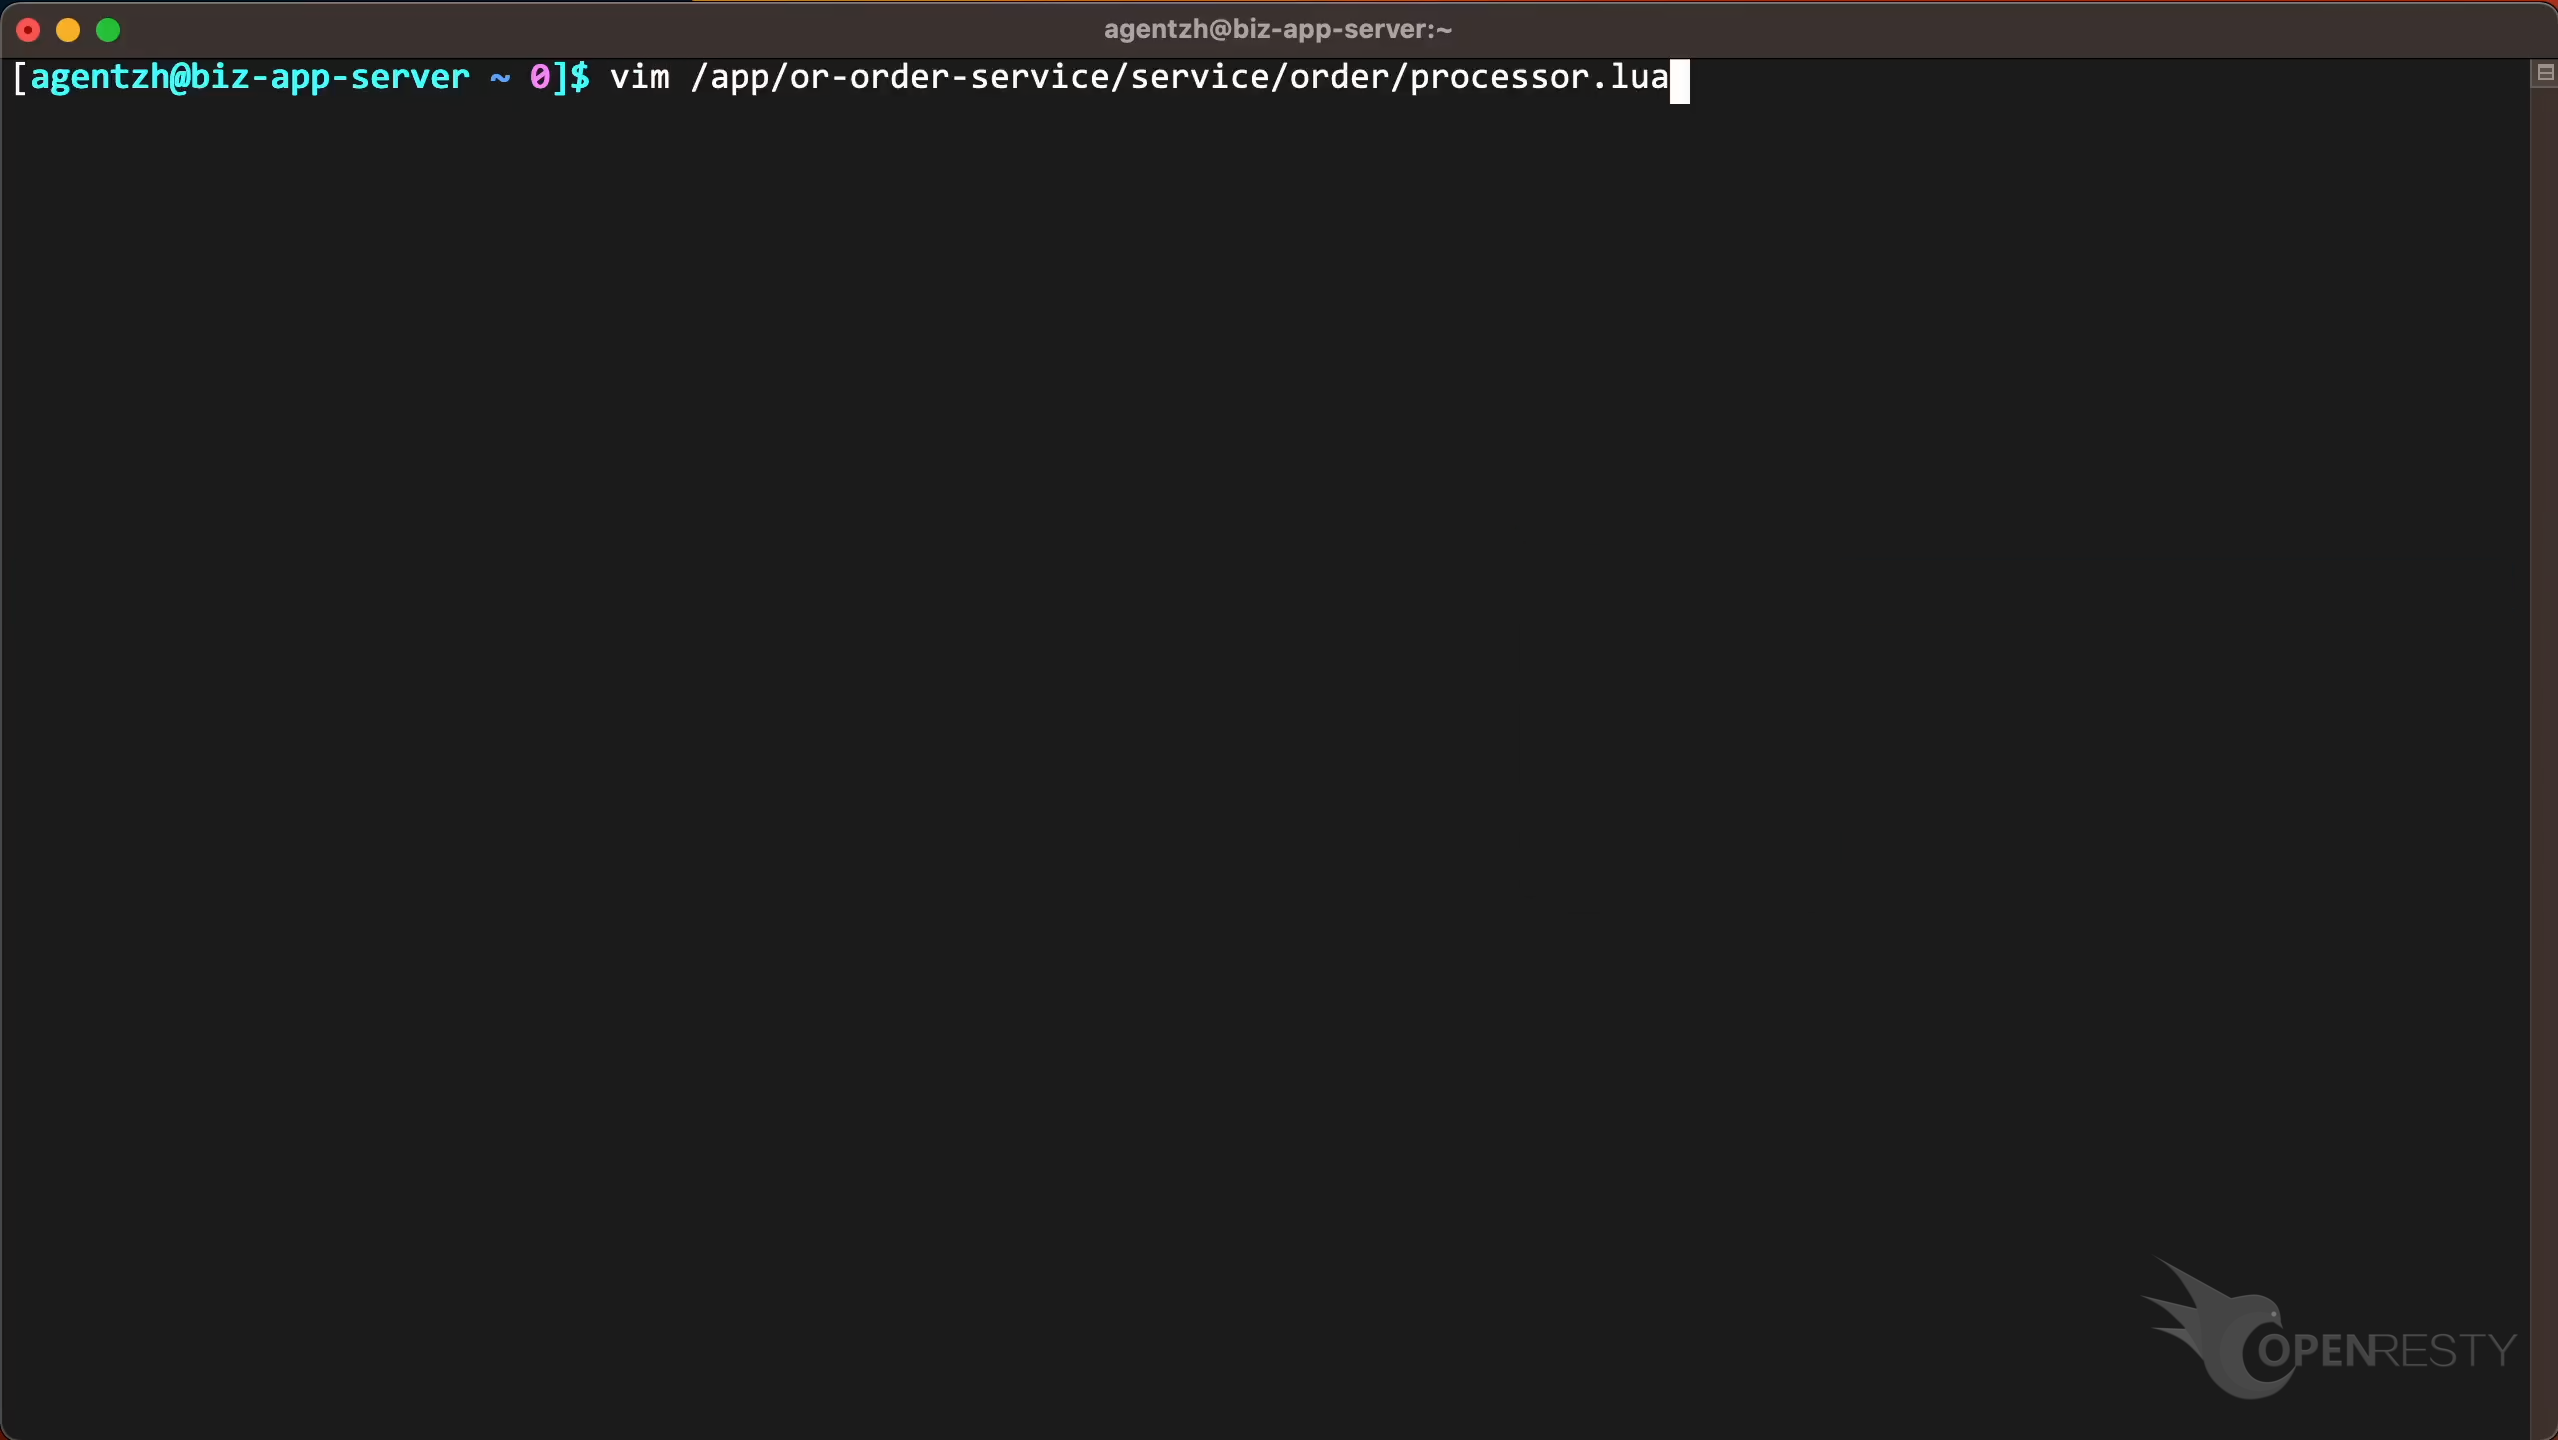
Use the vim editor to open the source file. And look at the Lua code in this file. You can use any editors you like.
Go to line 79, as shown in the report tooltip.
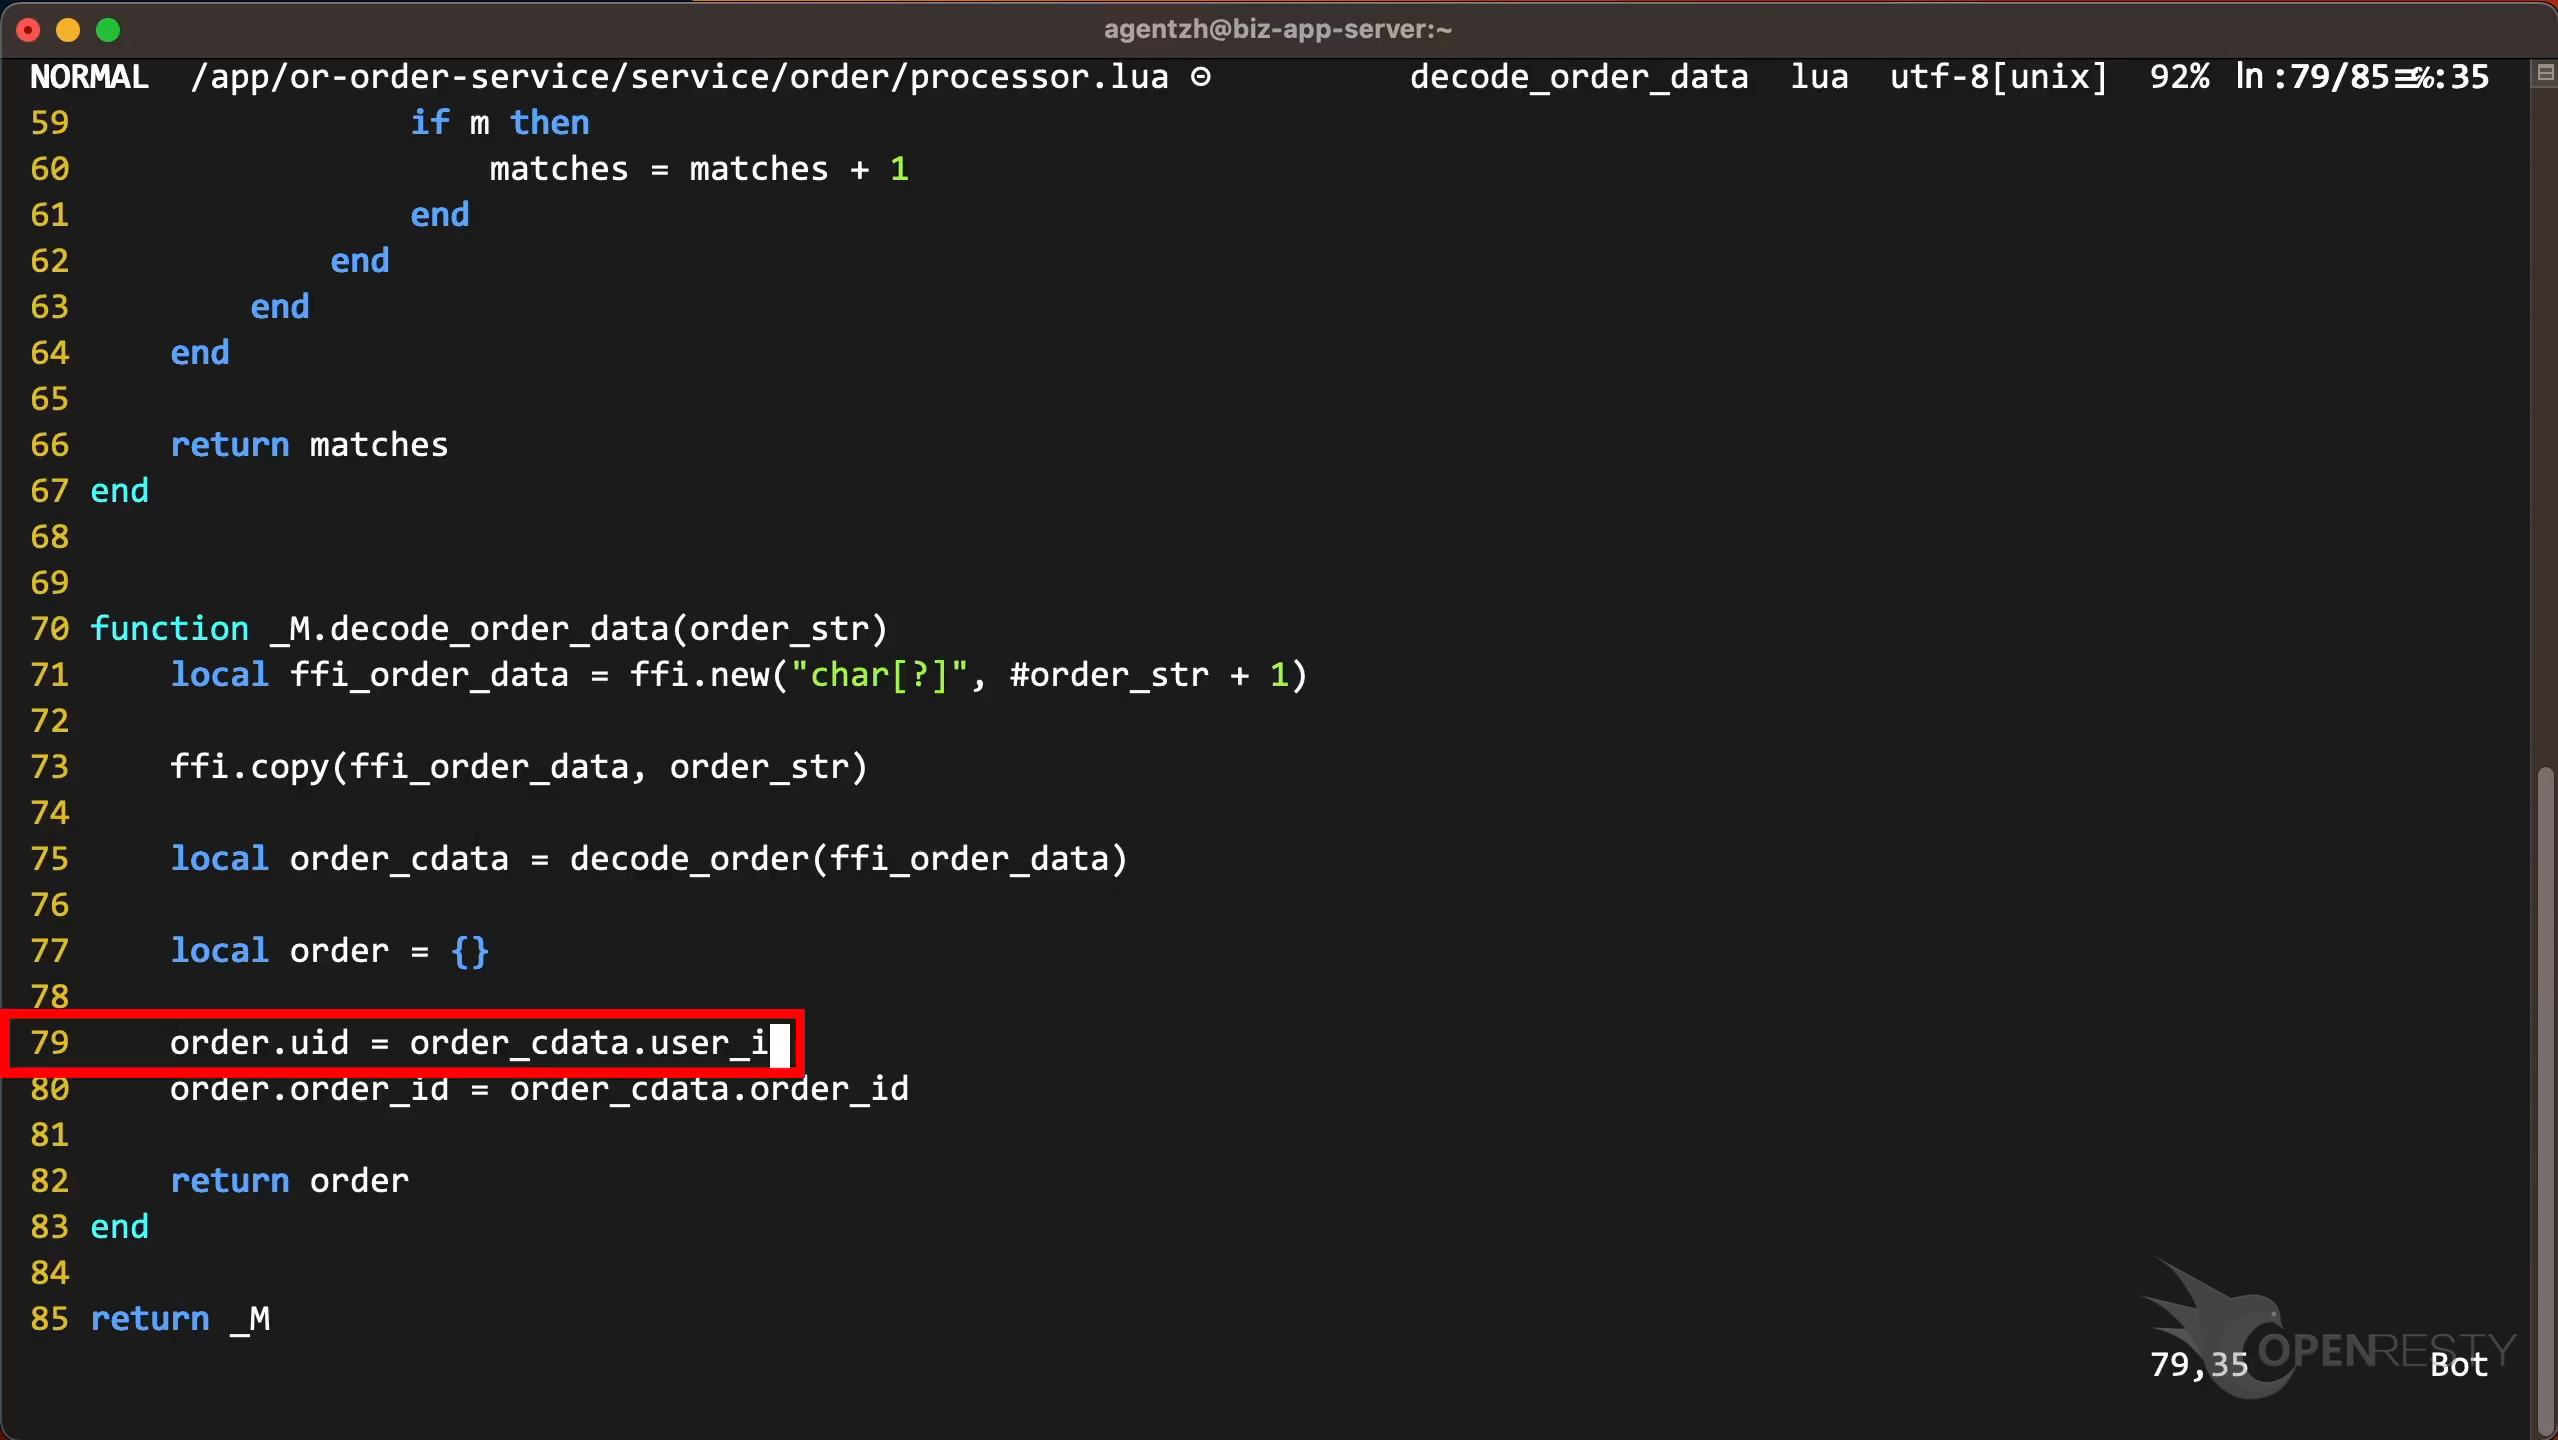
The program tried to access the user_id field of order_cdata. Maybe this order_cdata is null. This caused a segmentation fault, and the program crashed. So, there should be a check to see if order_cdata is null before accessing it.
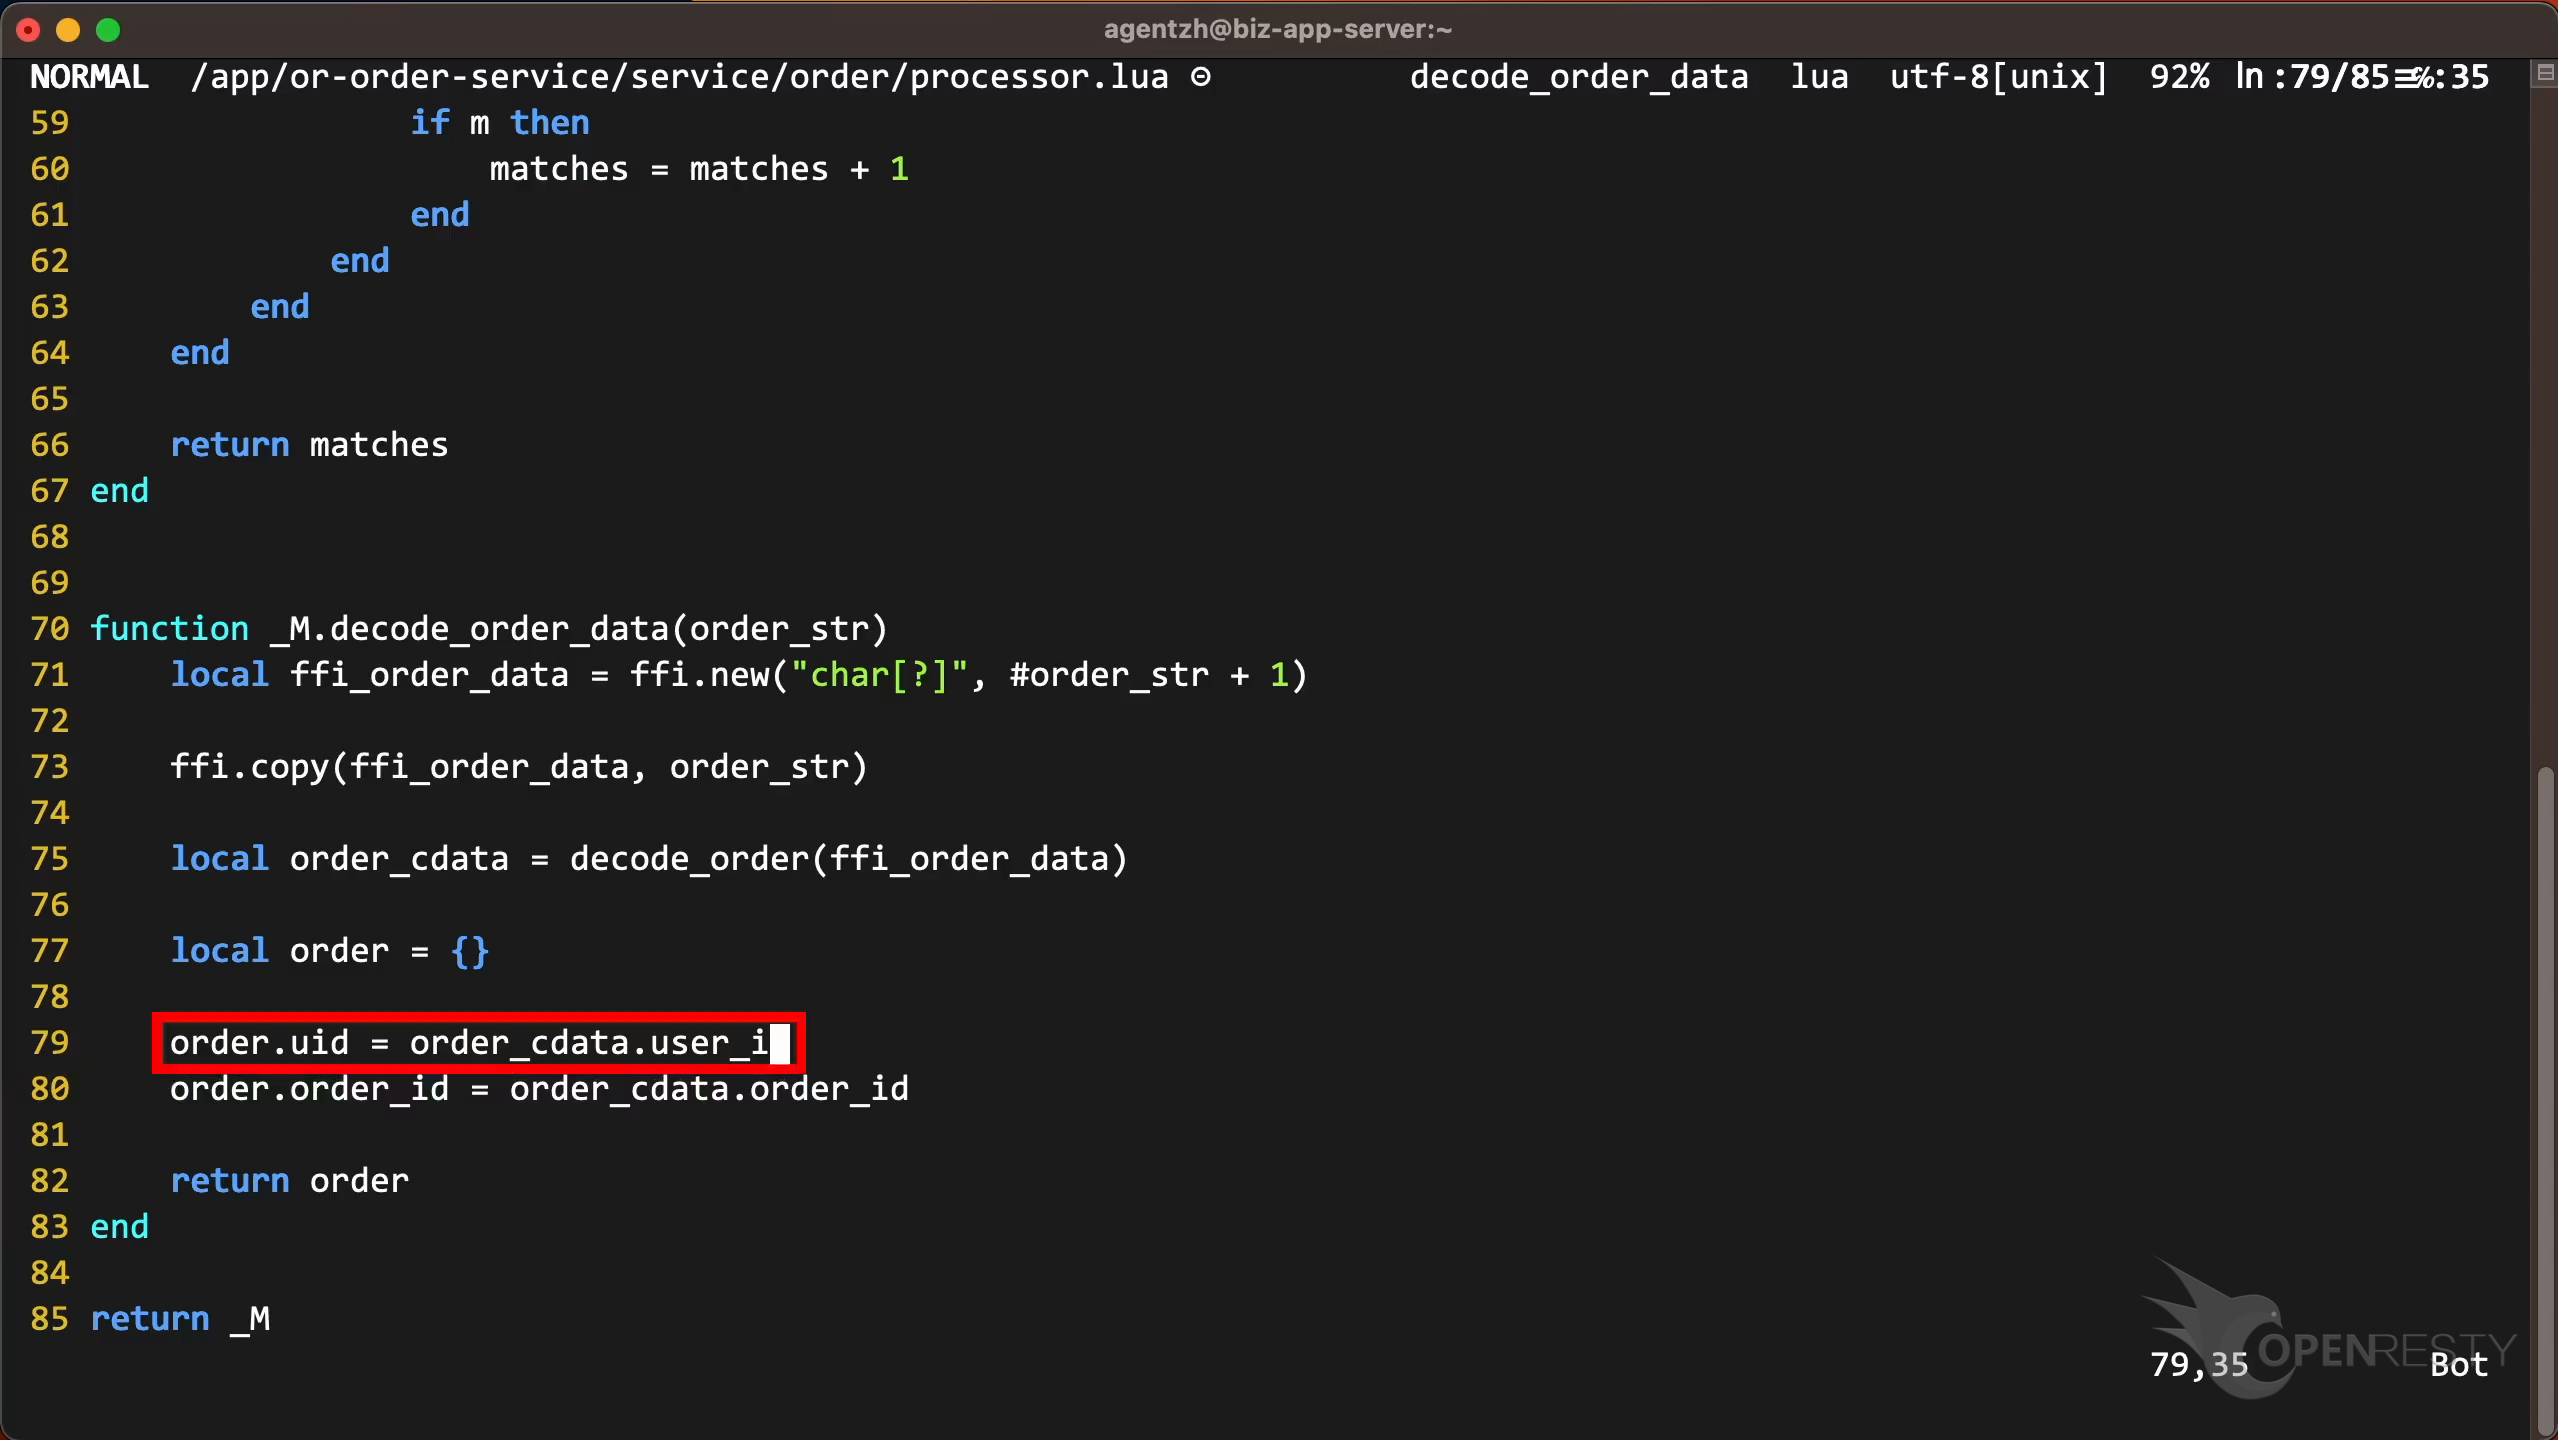
This line is in the function decode_order_data, as shown in the report.
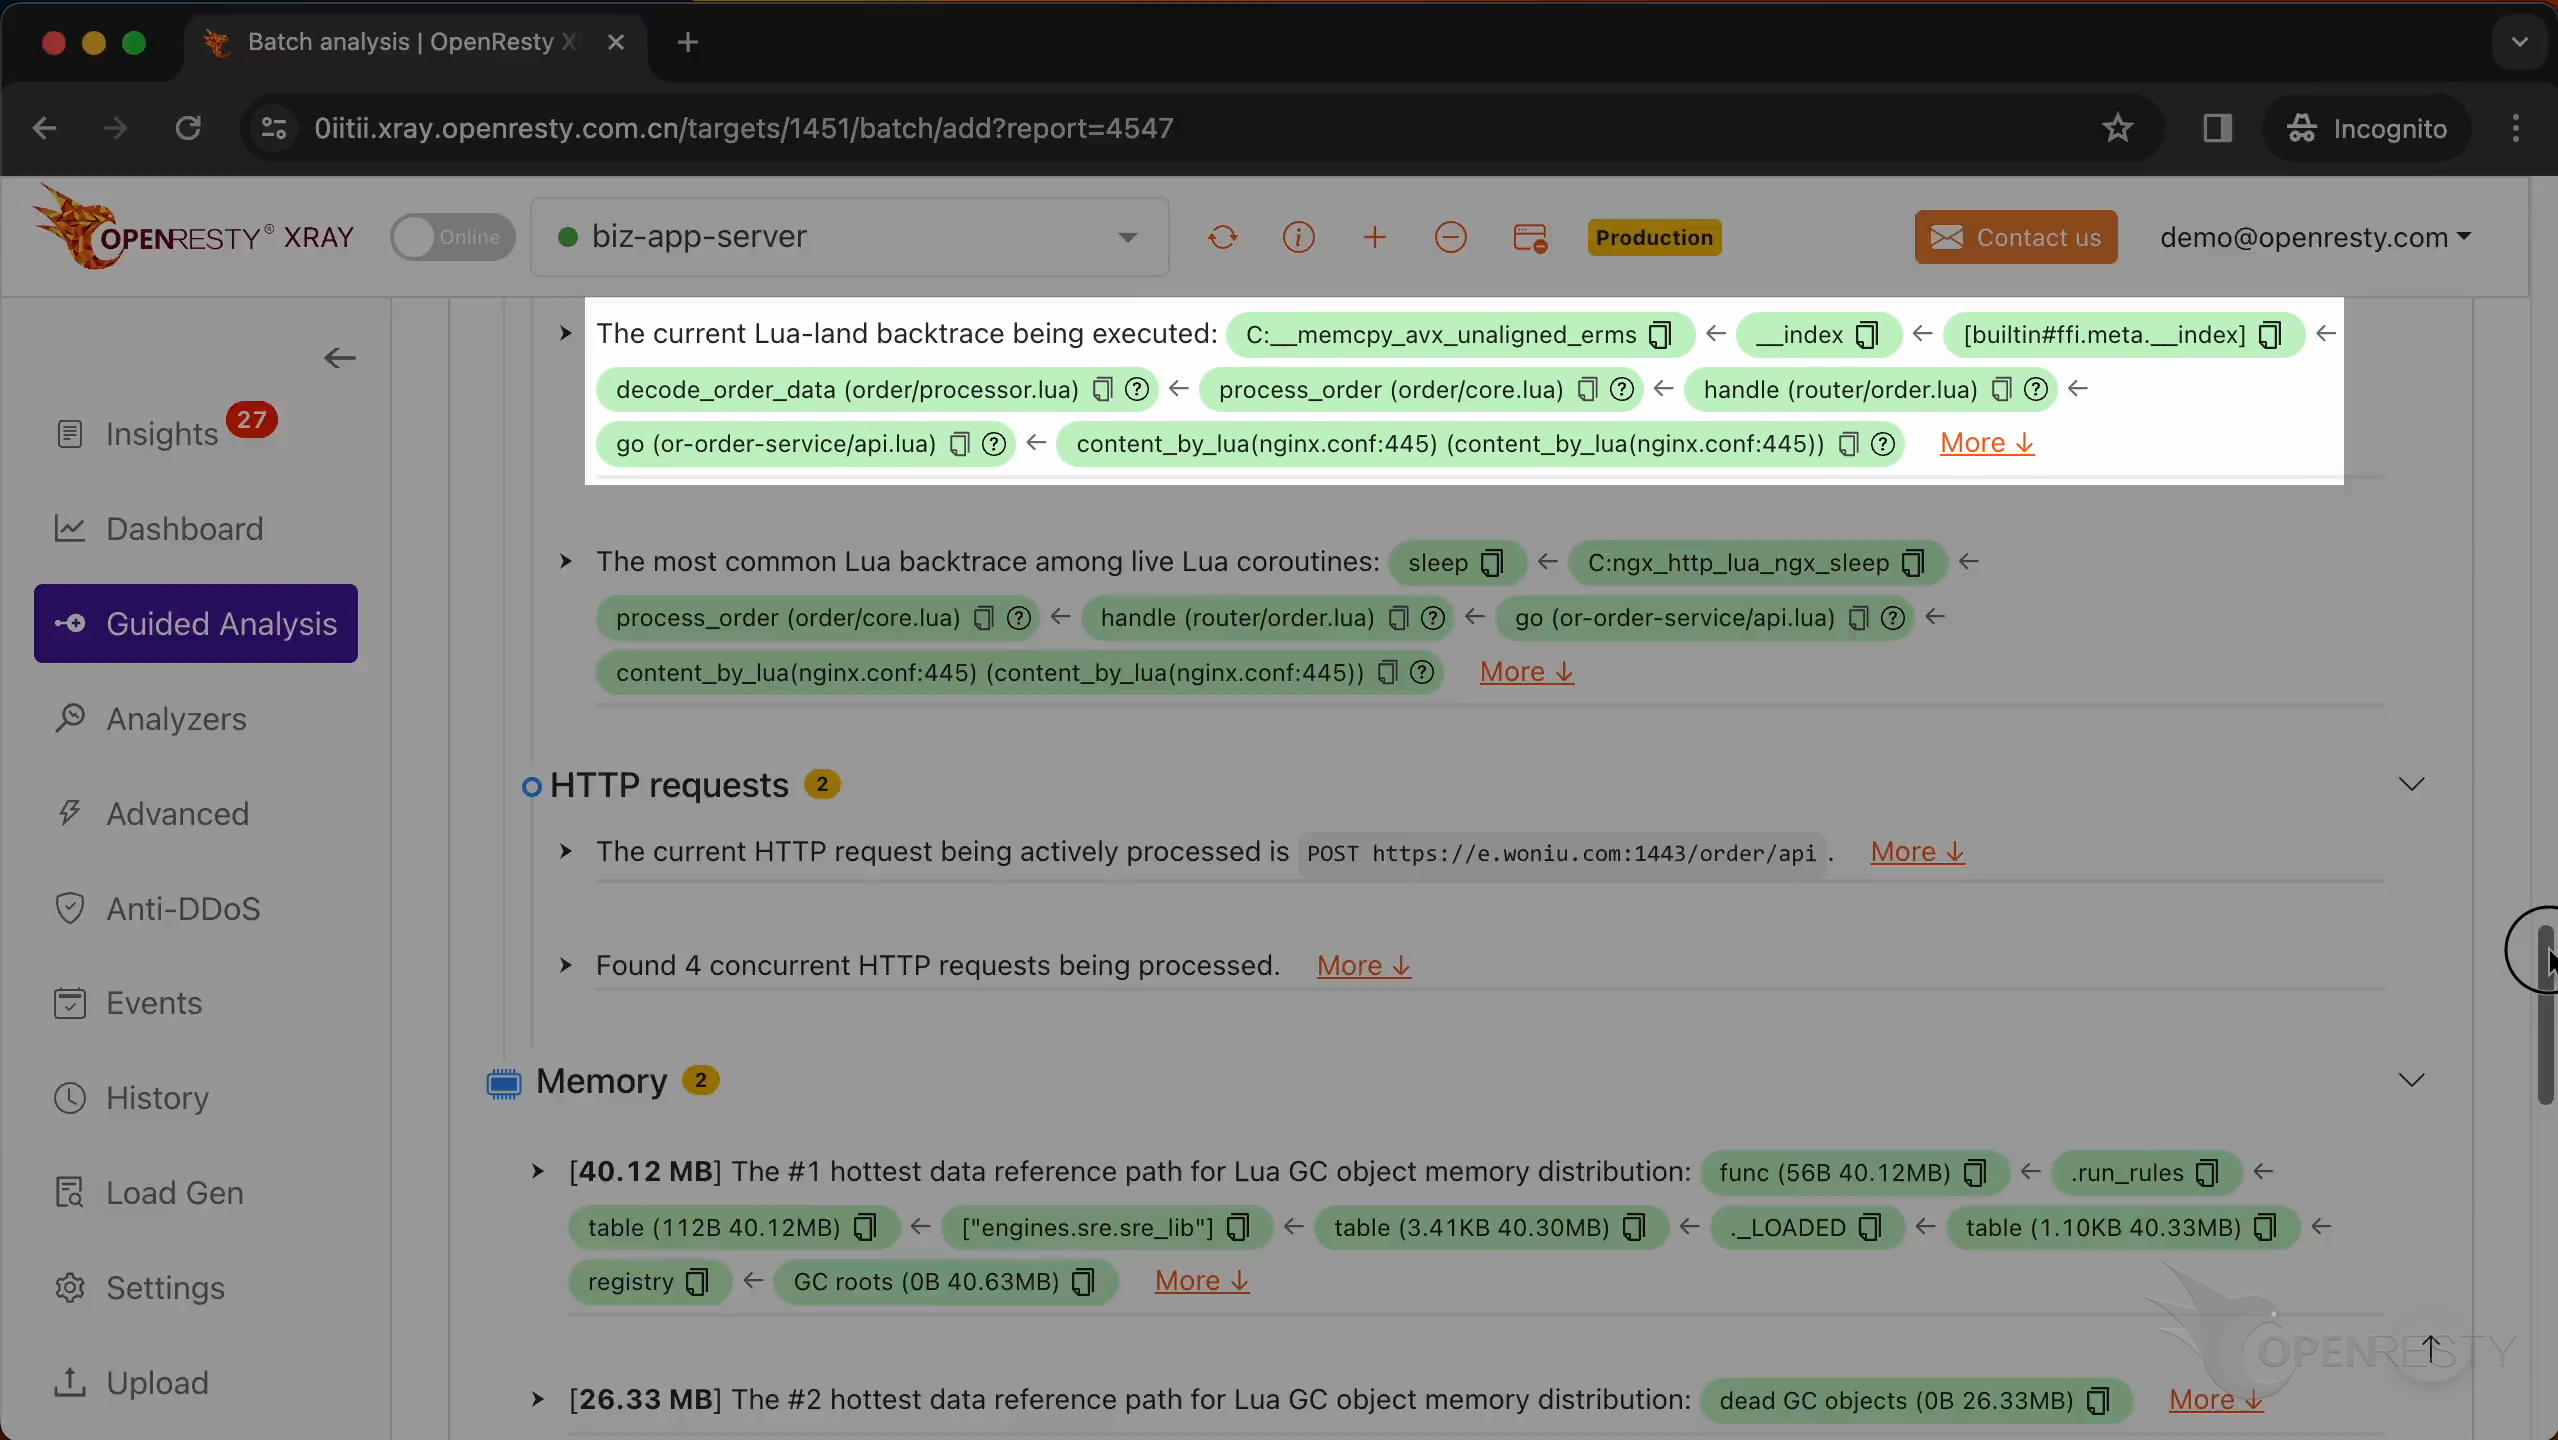
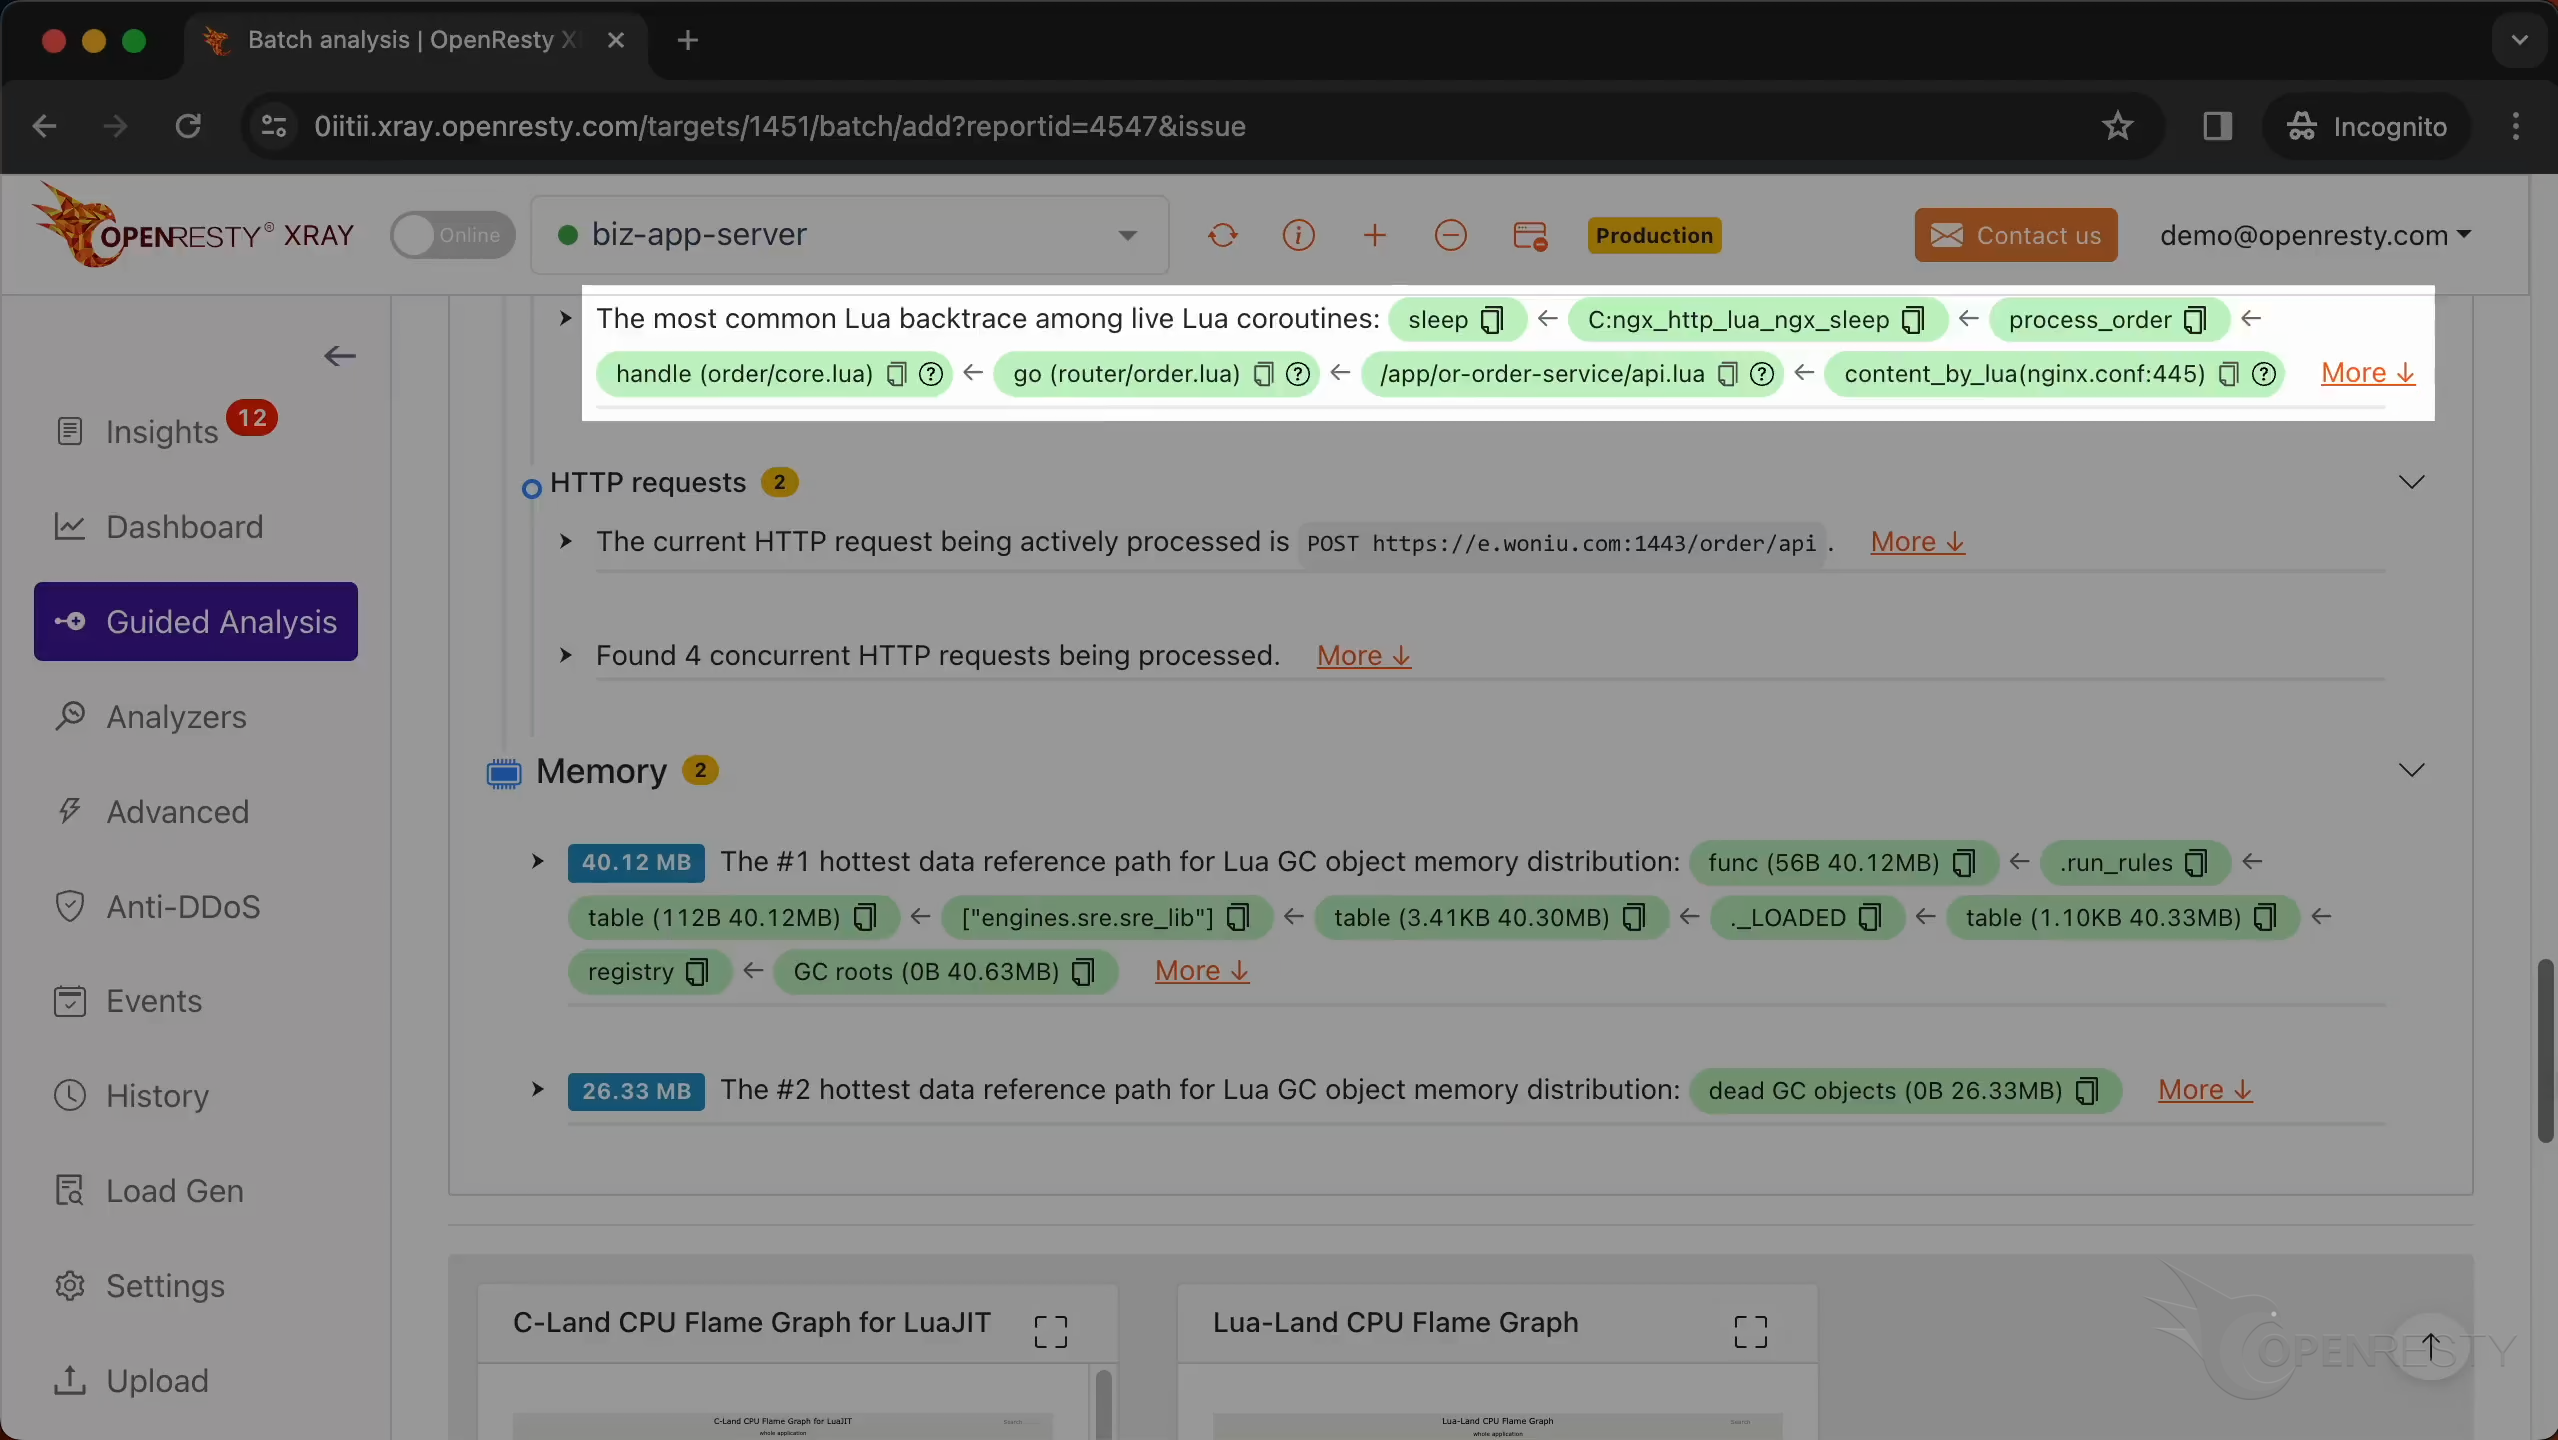
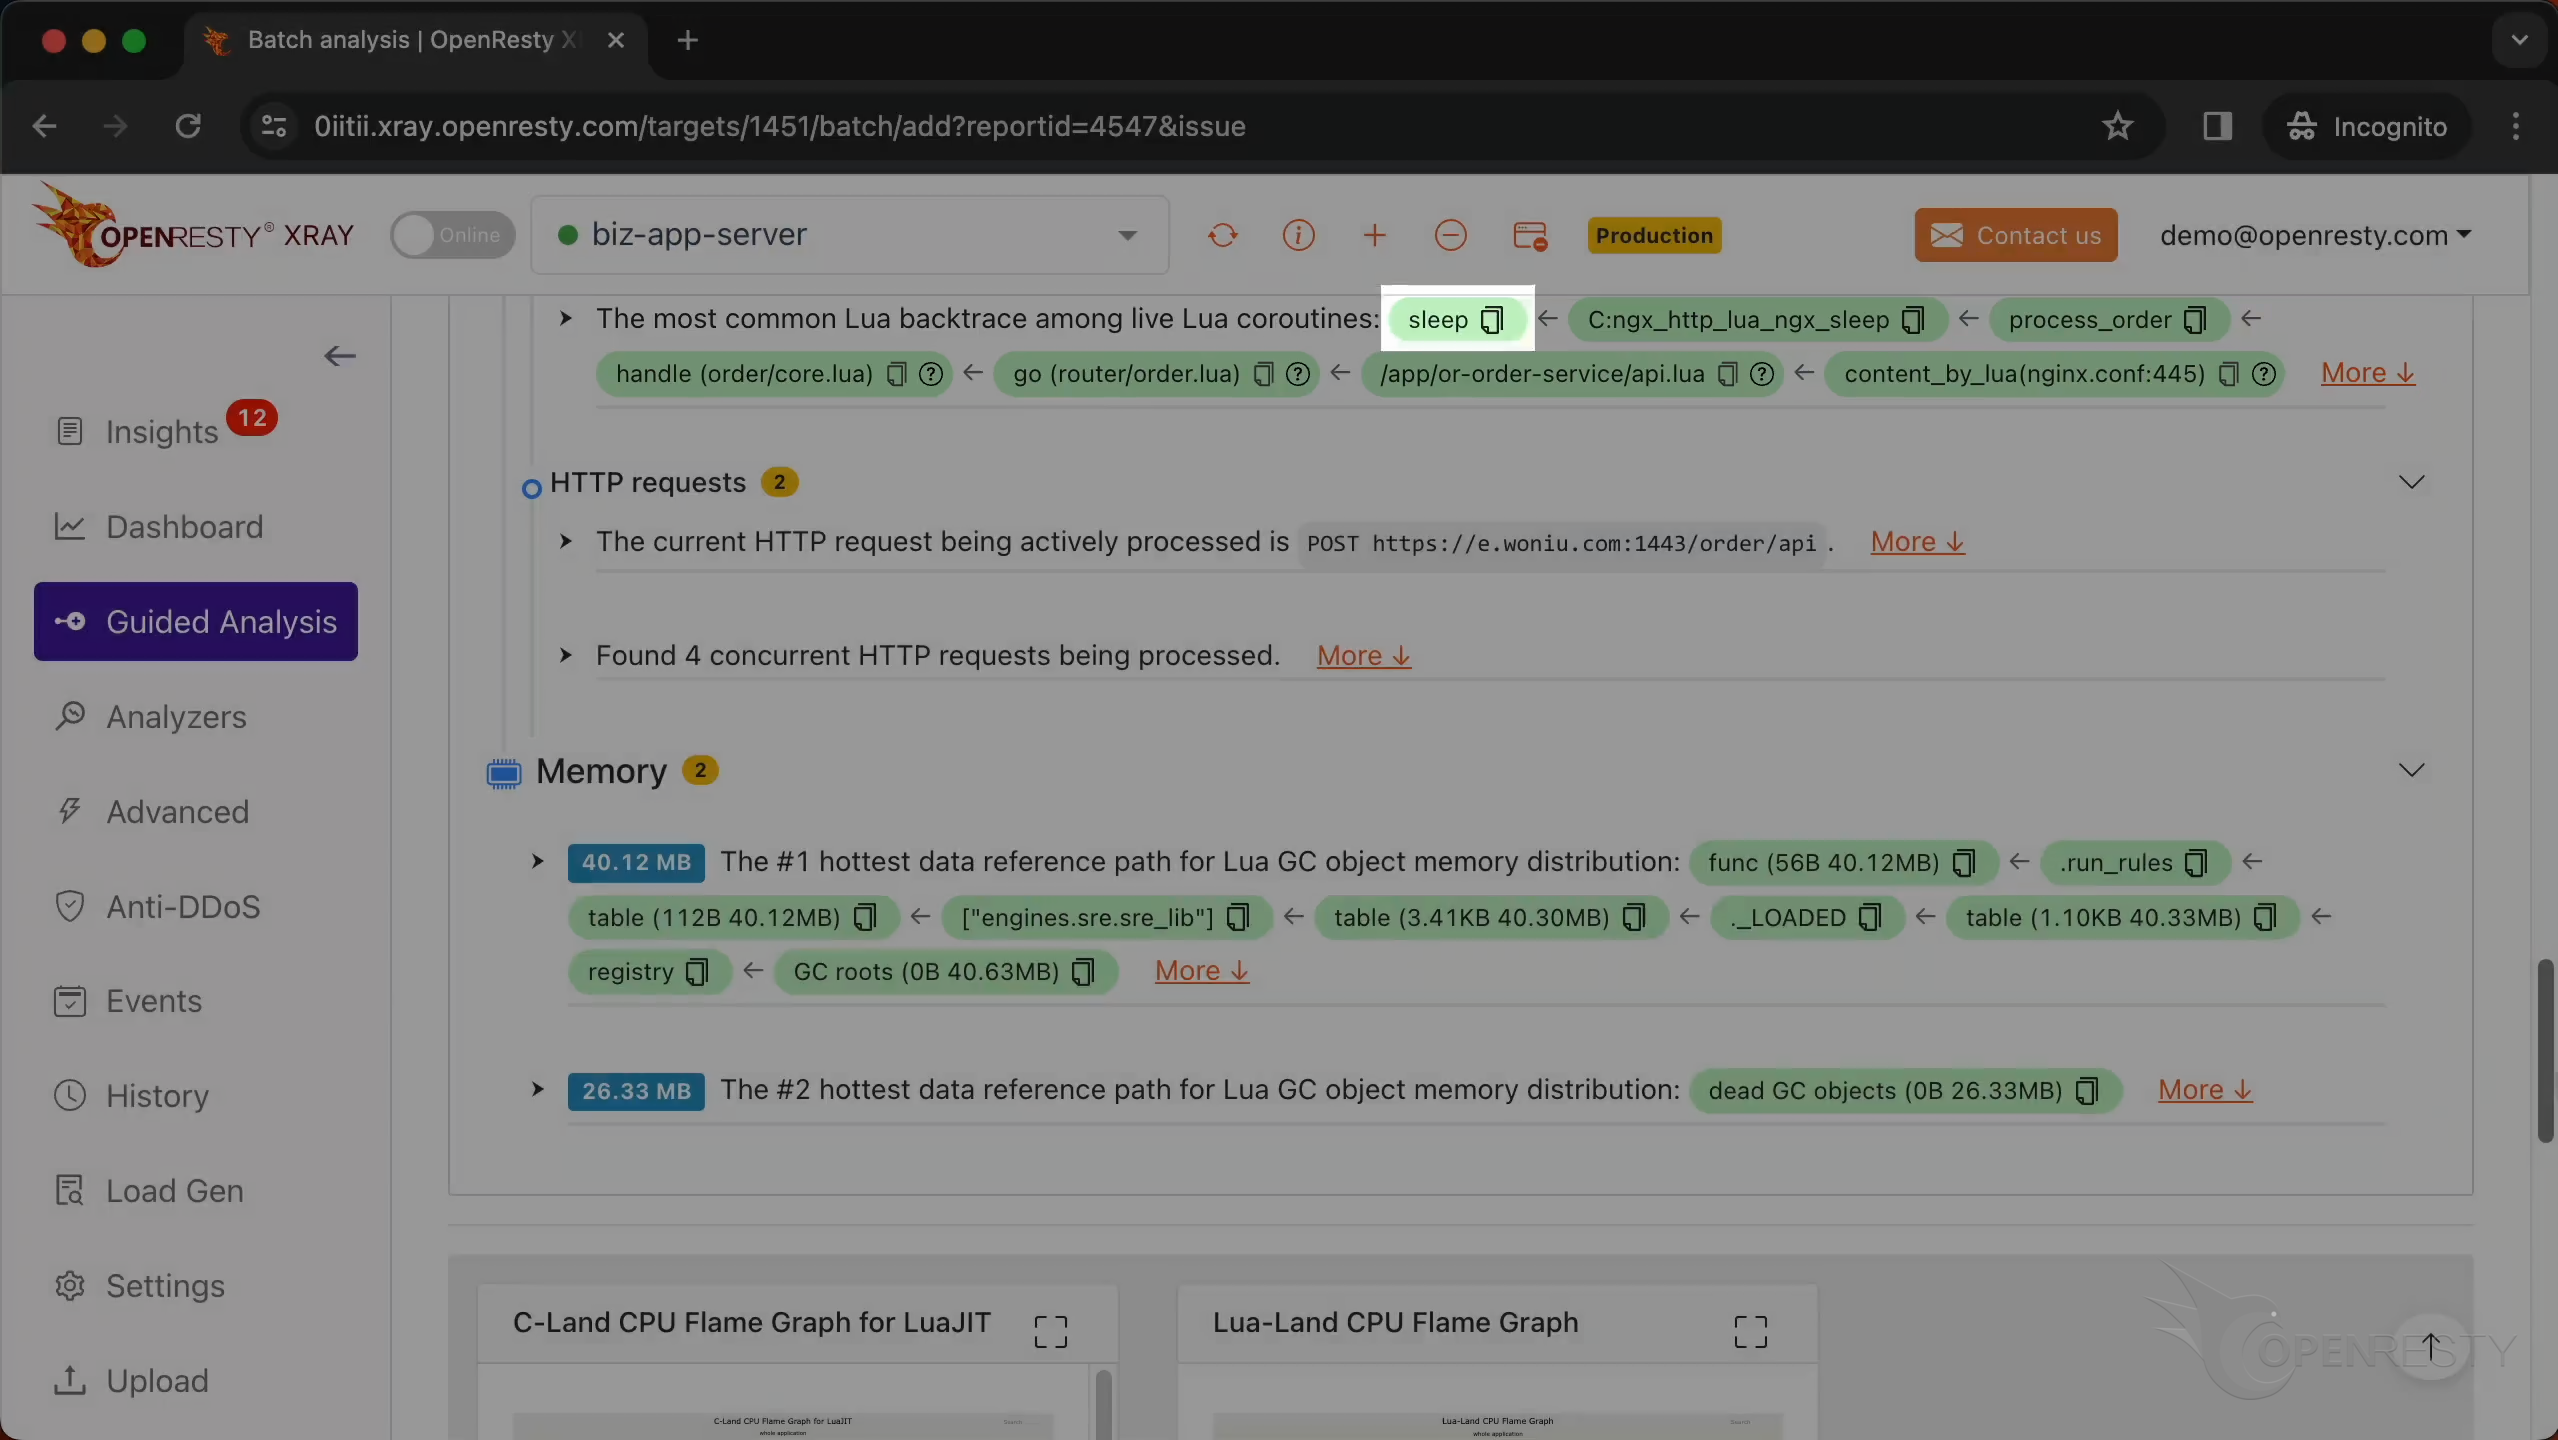
This is the most common Lua backtrace among all existing Lua coroutines.
The sleep function in C is used to pause the execution of the current thread for a specified number of seconds.
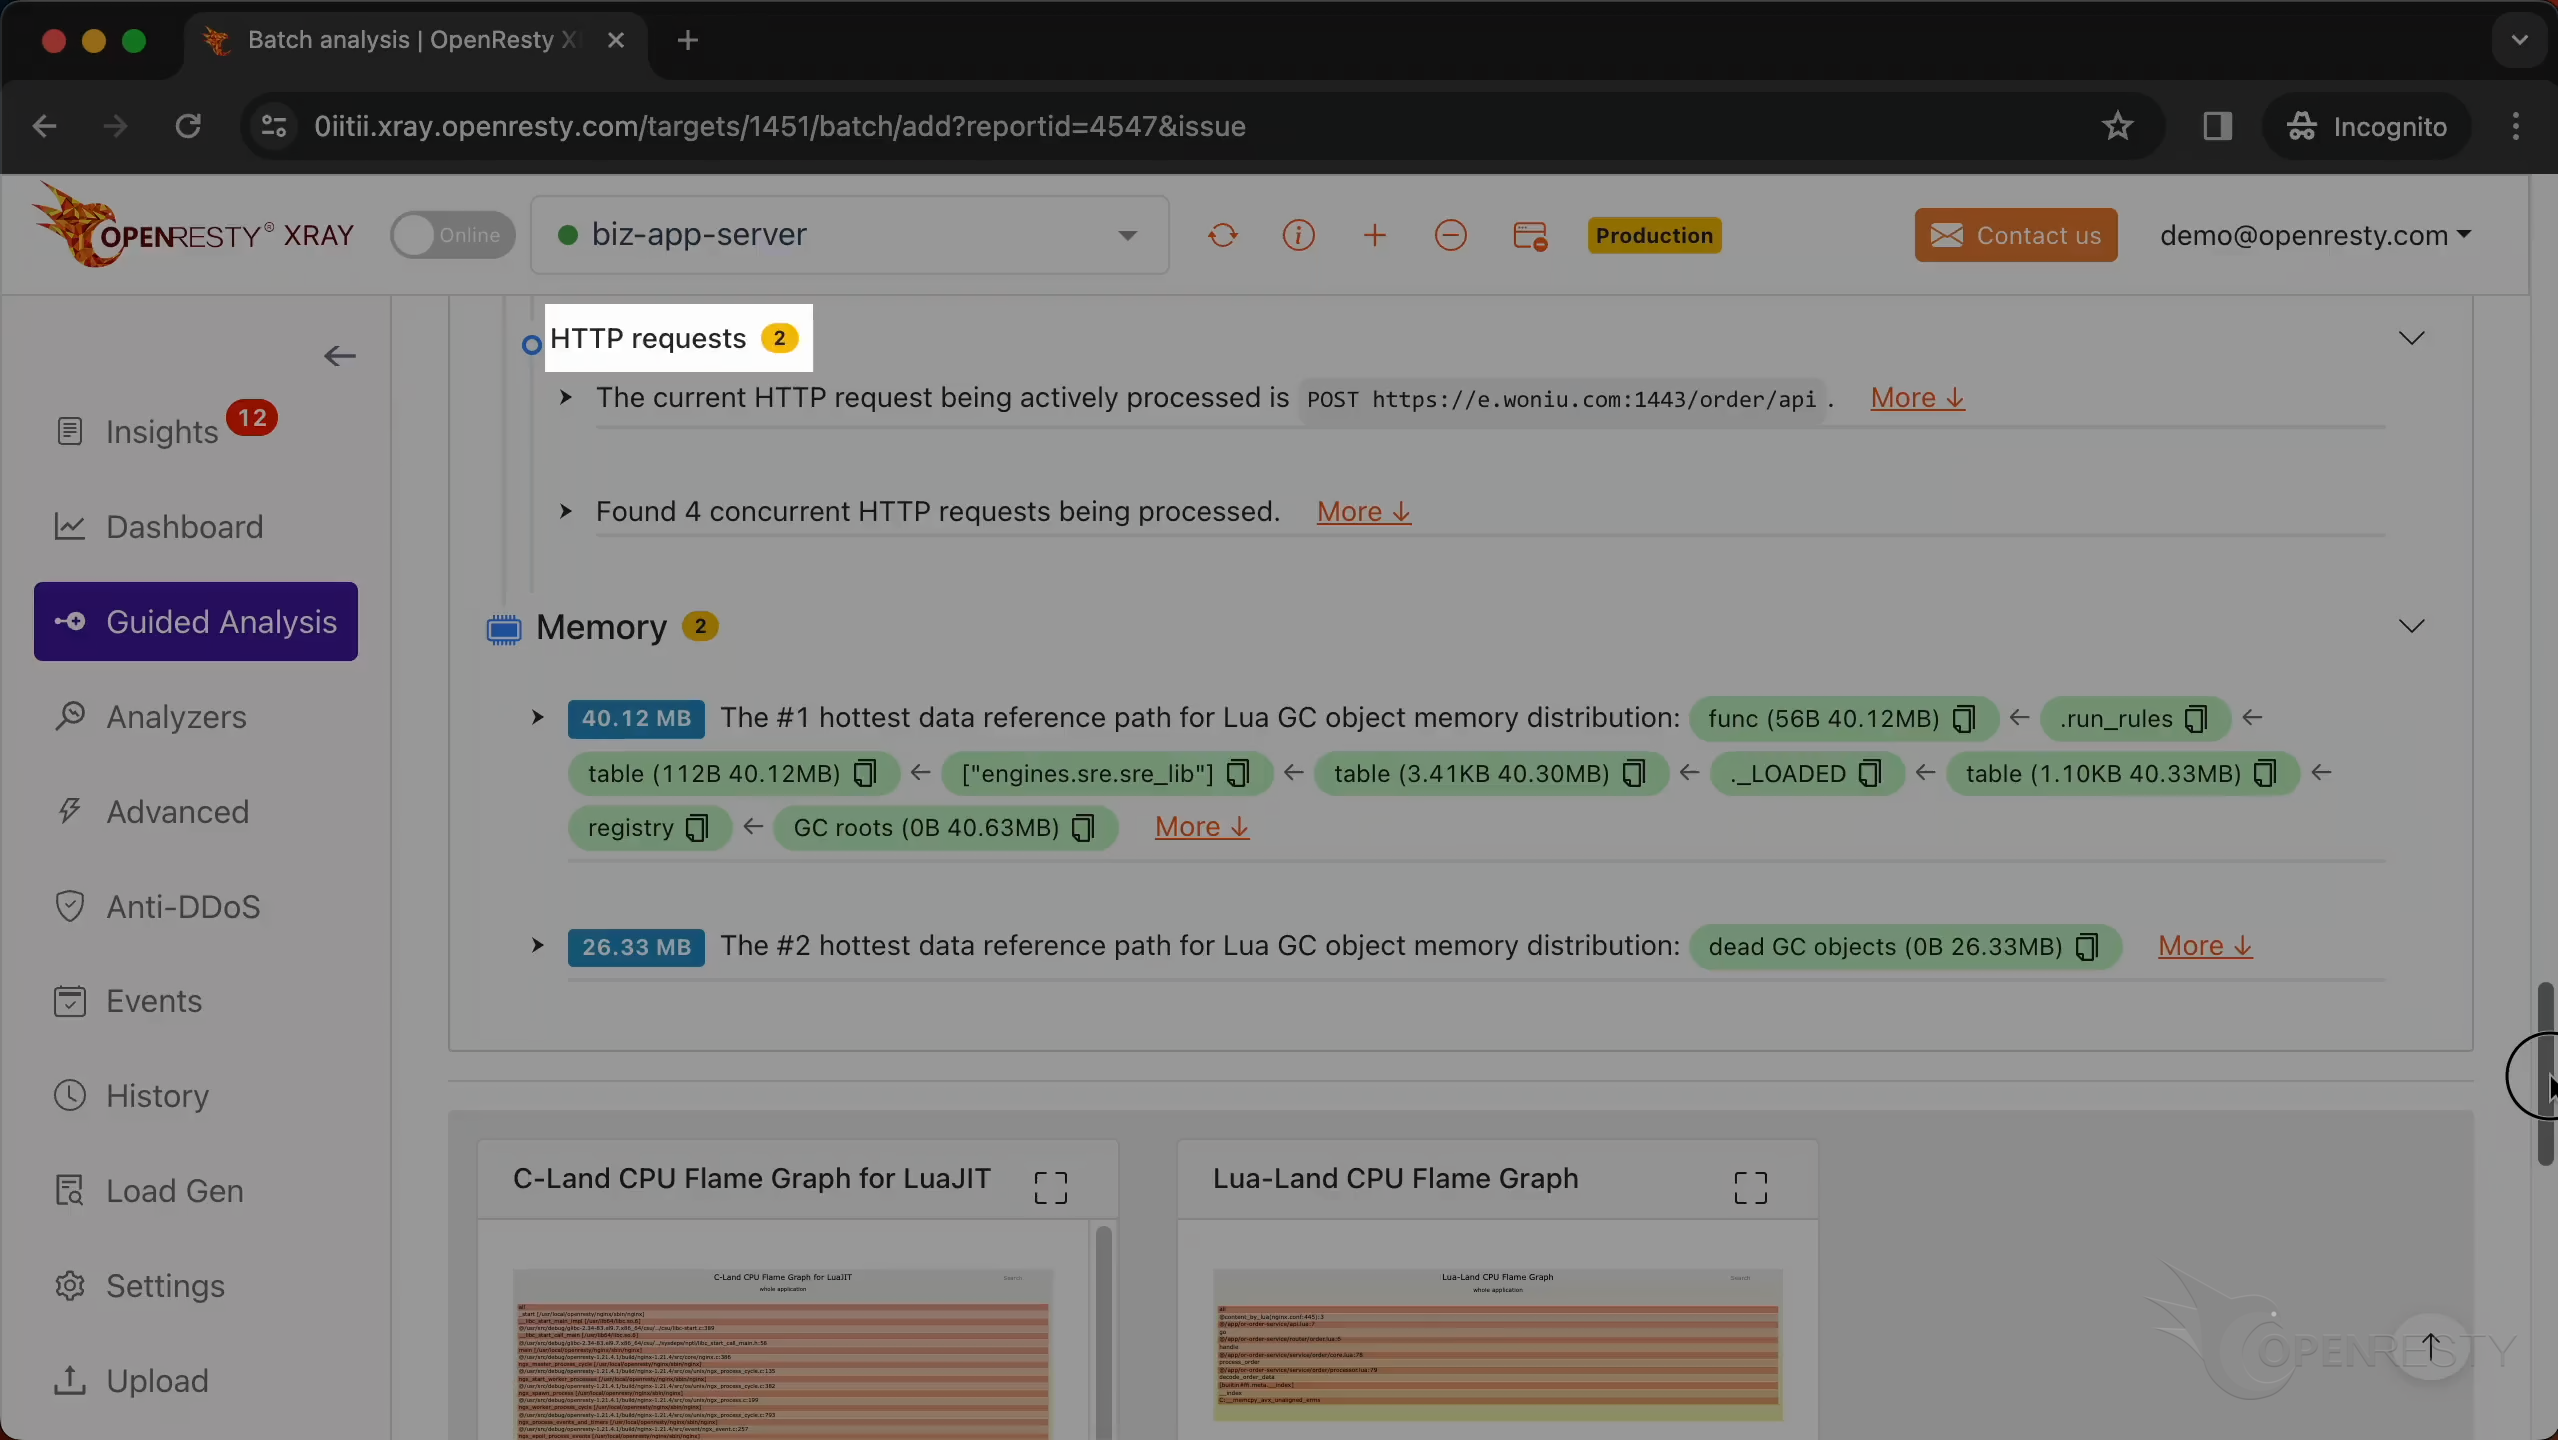
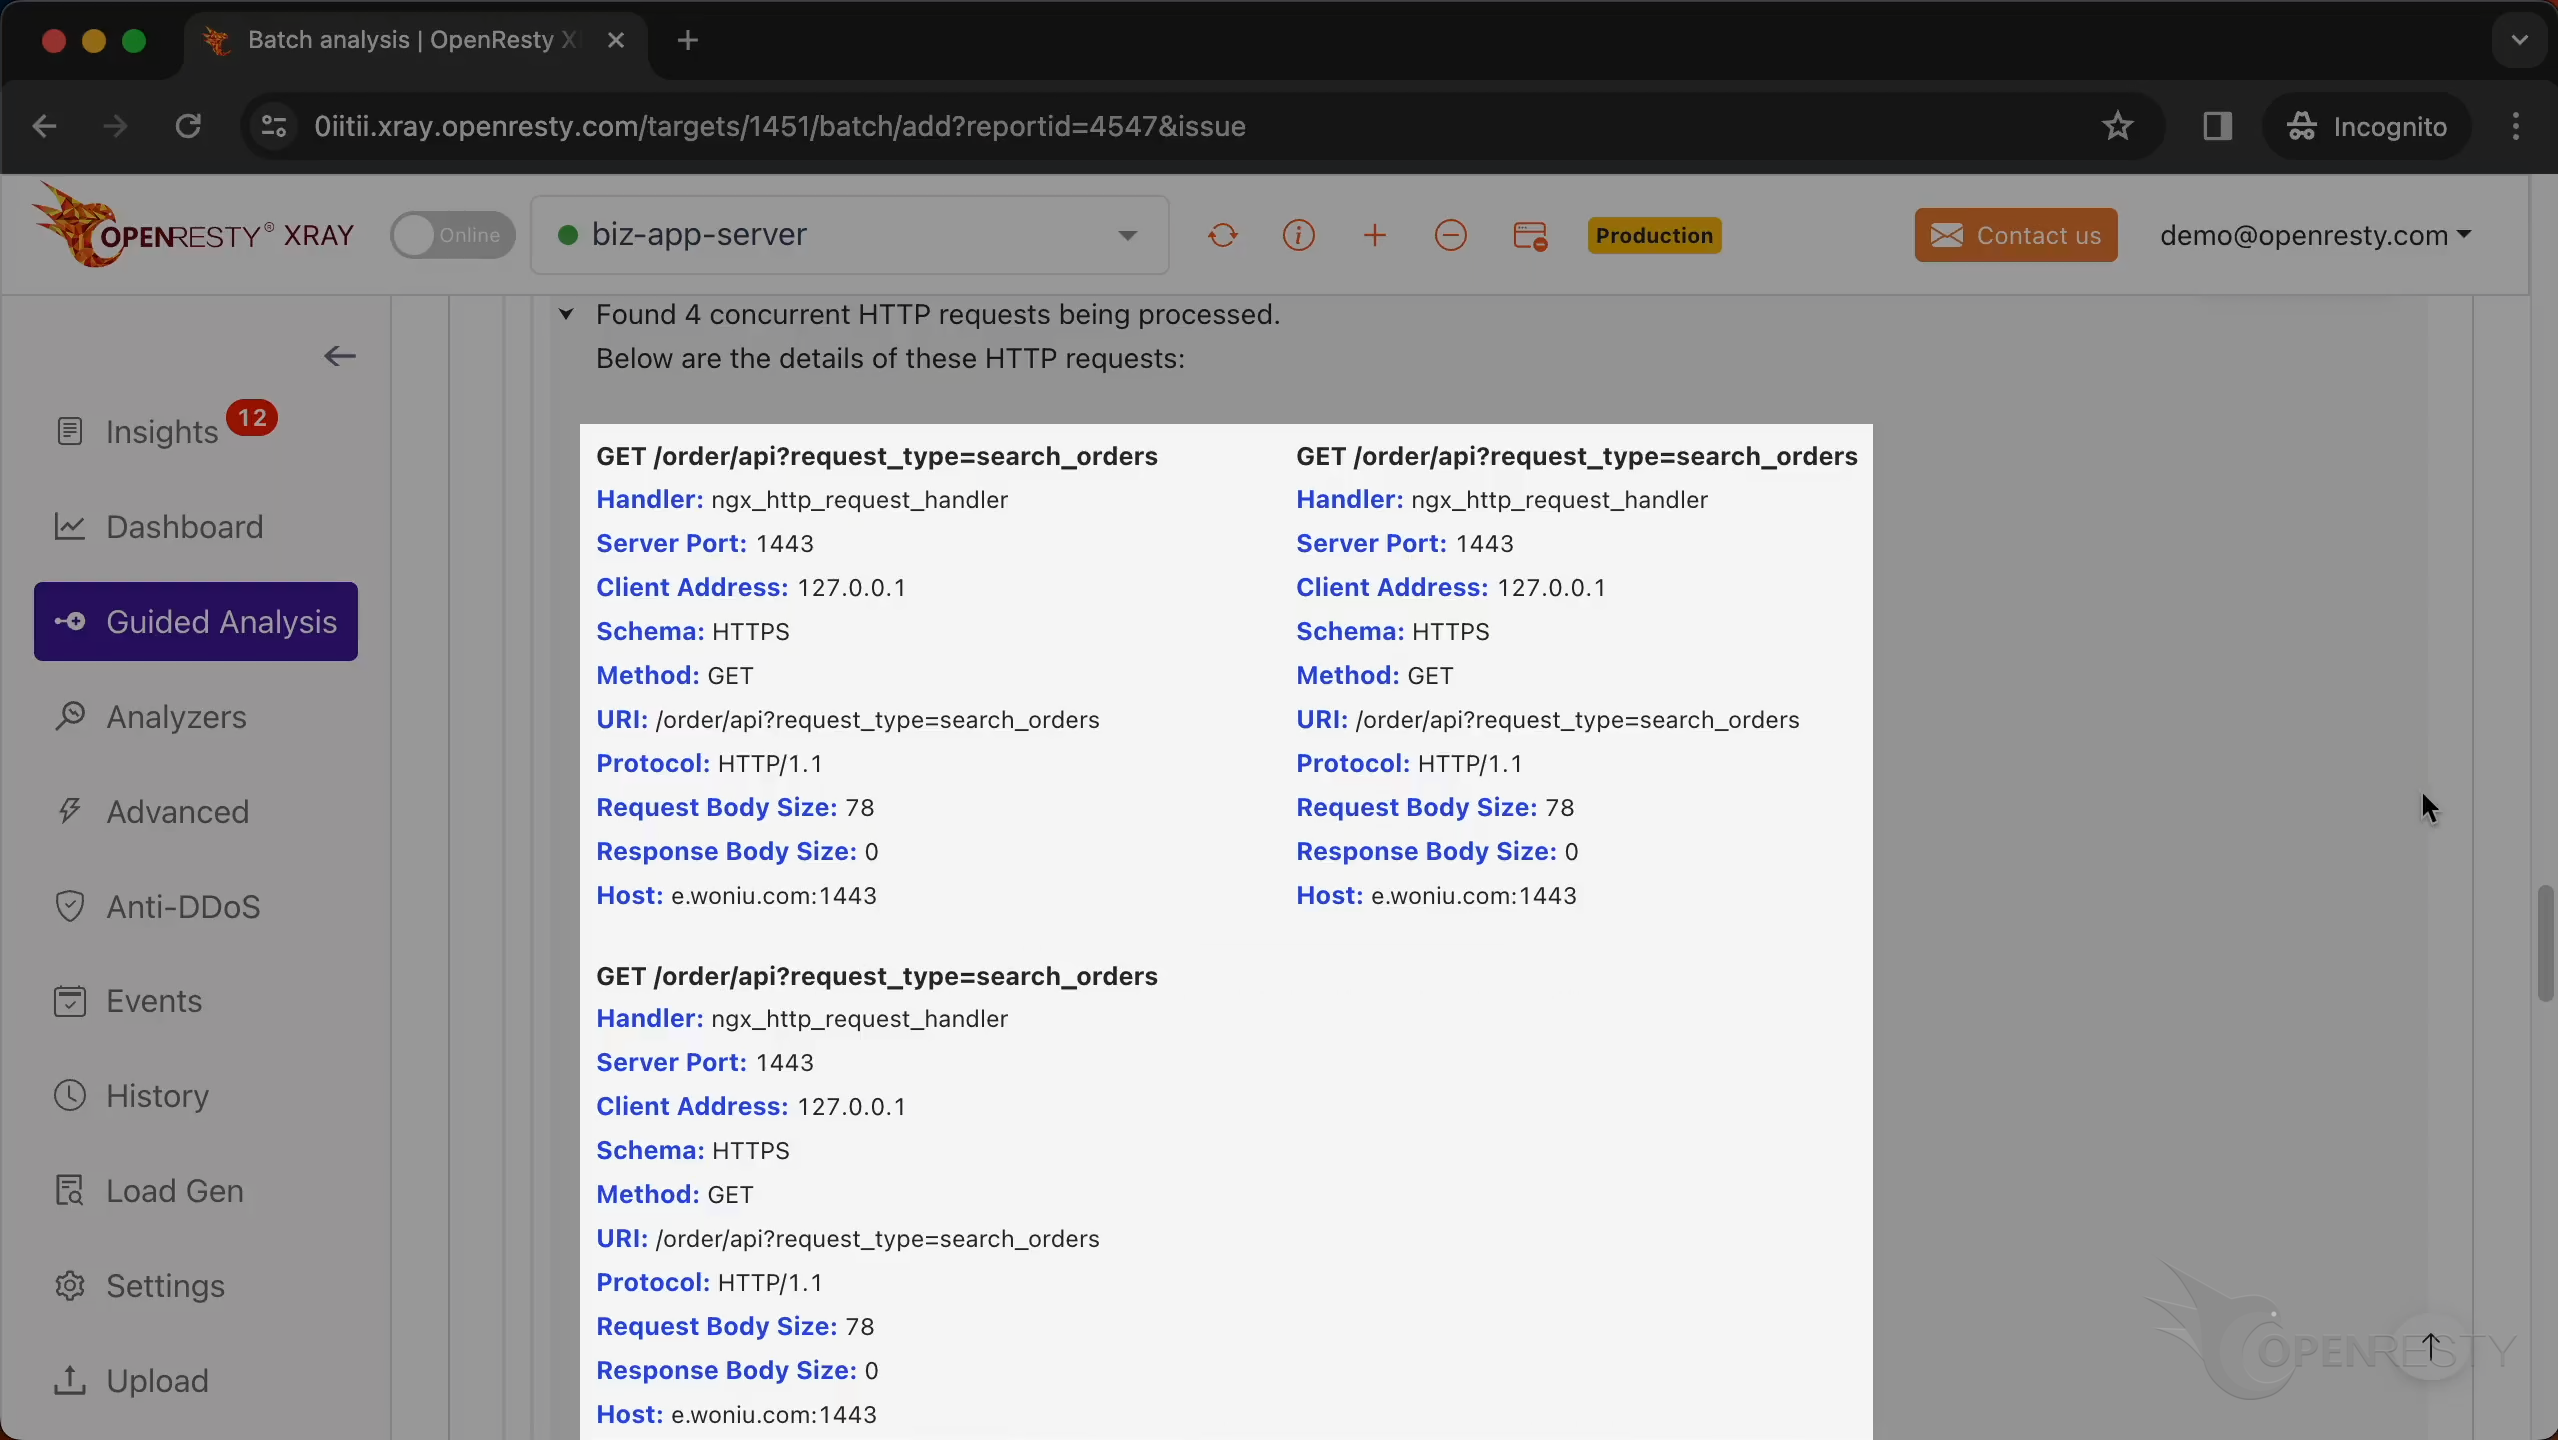
This shows the information of all HTTP requests running when the core dump occurred.
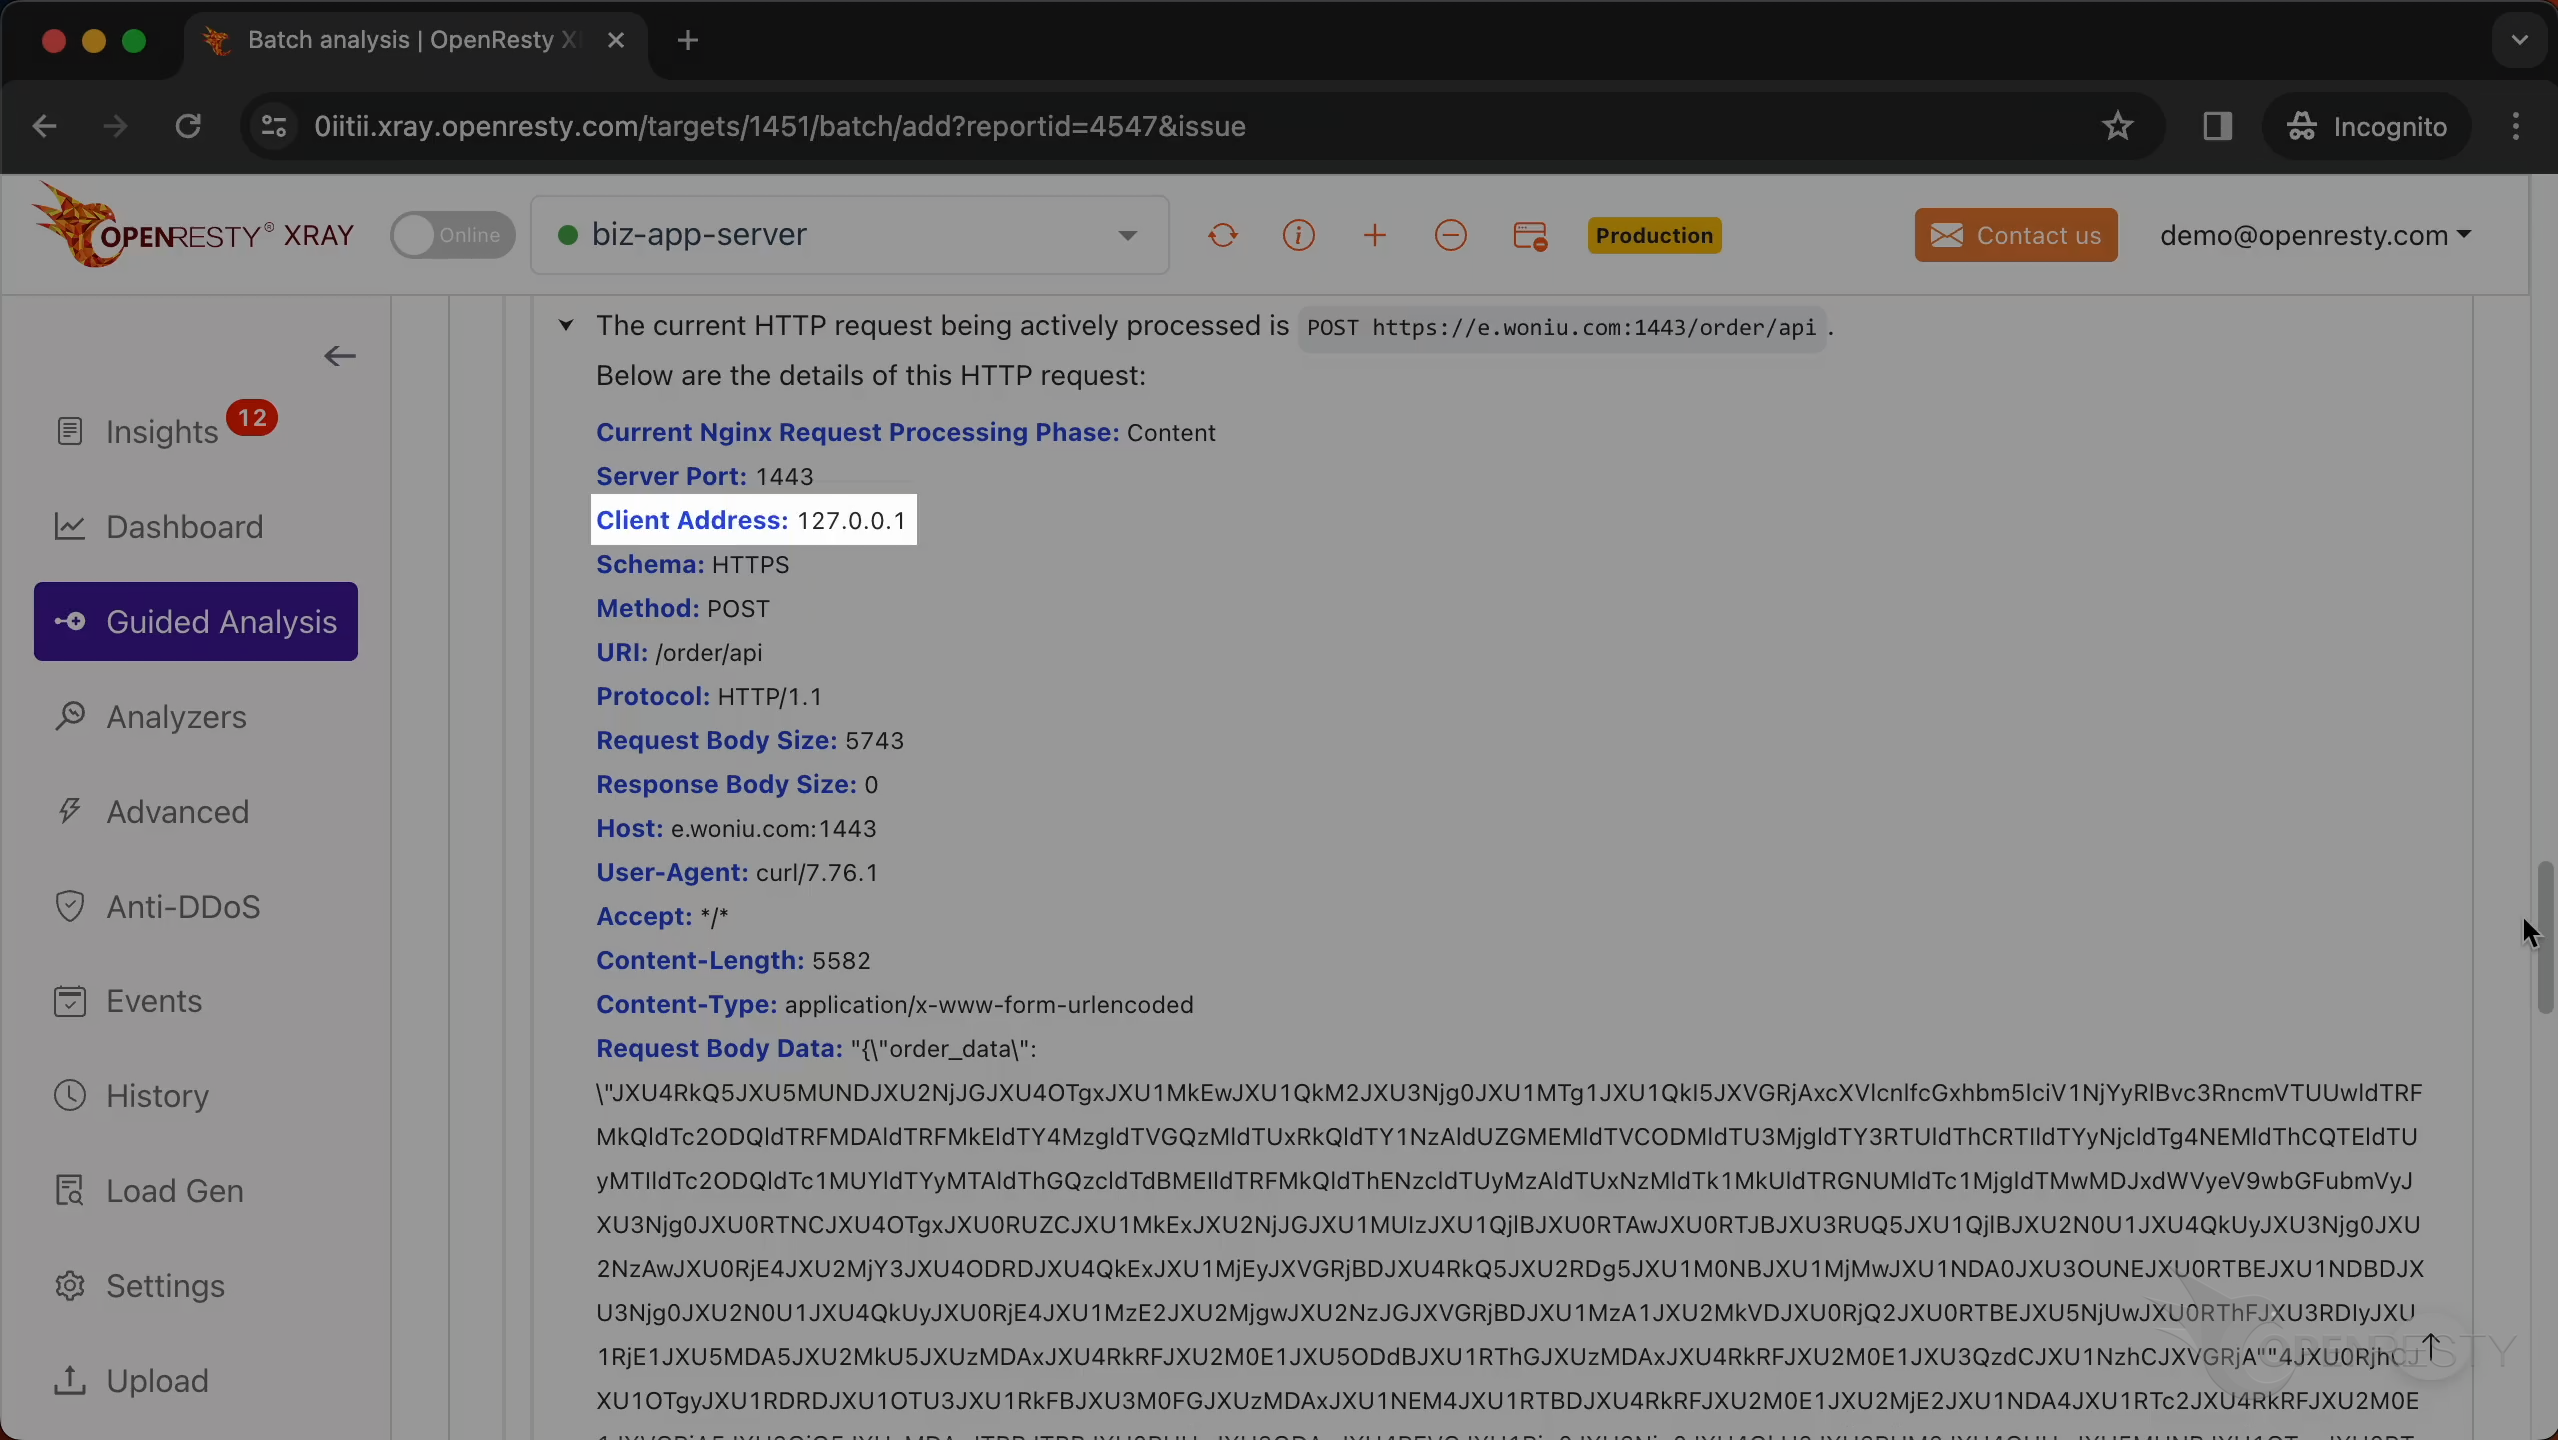
This is the information on the HTTP request that the Nginx process handled when the crash occurred.
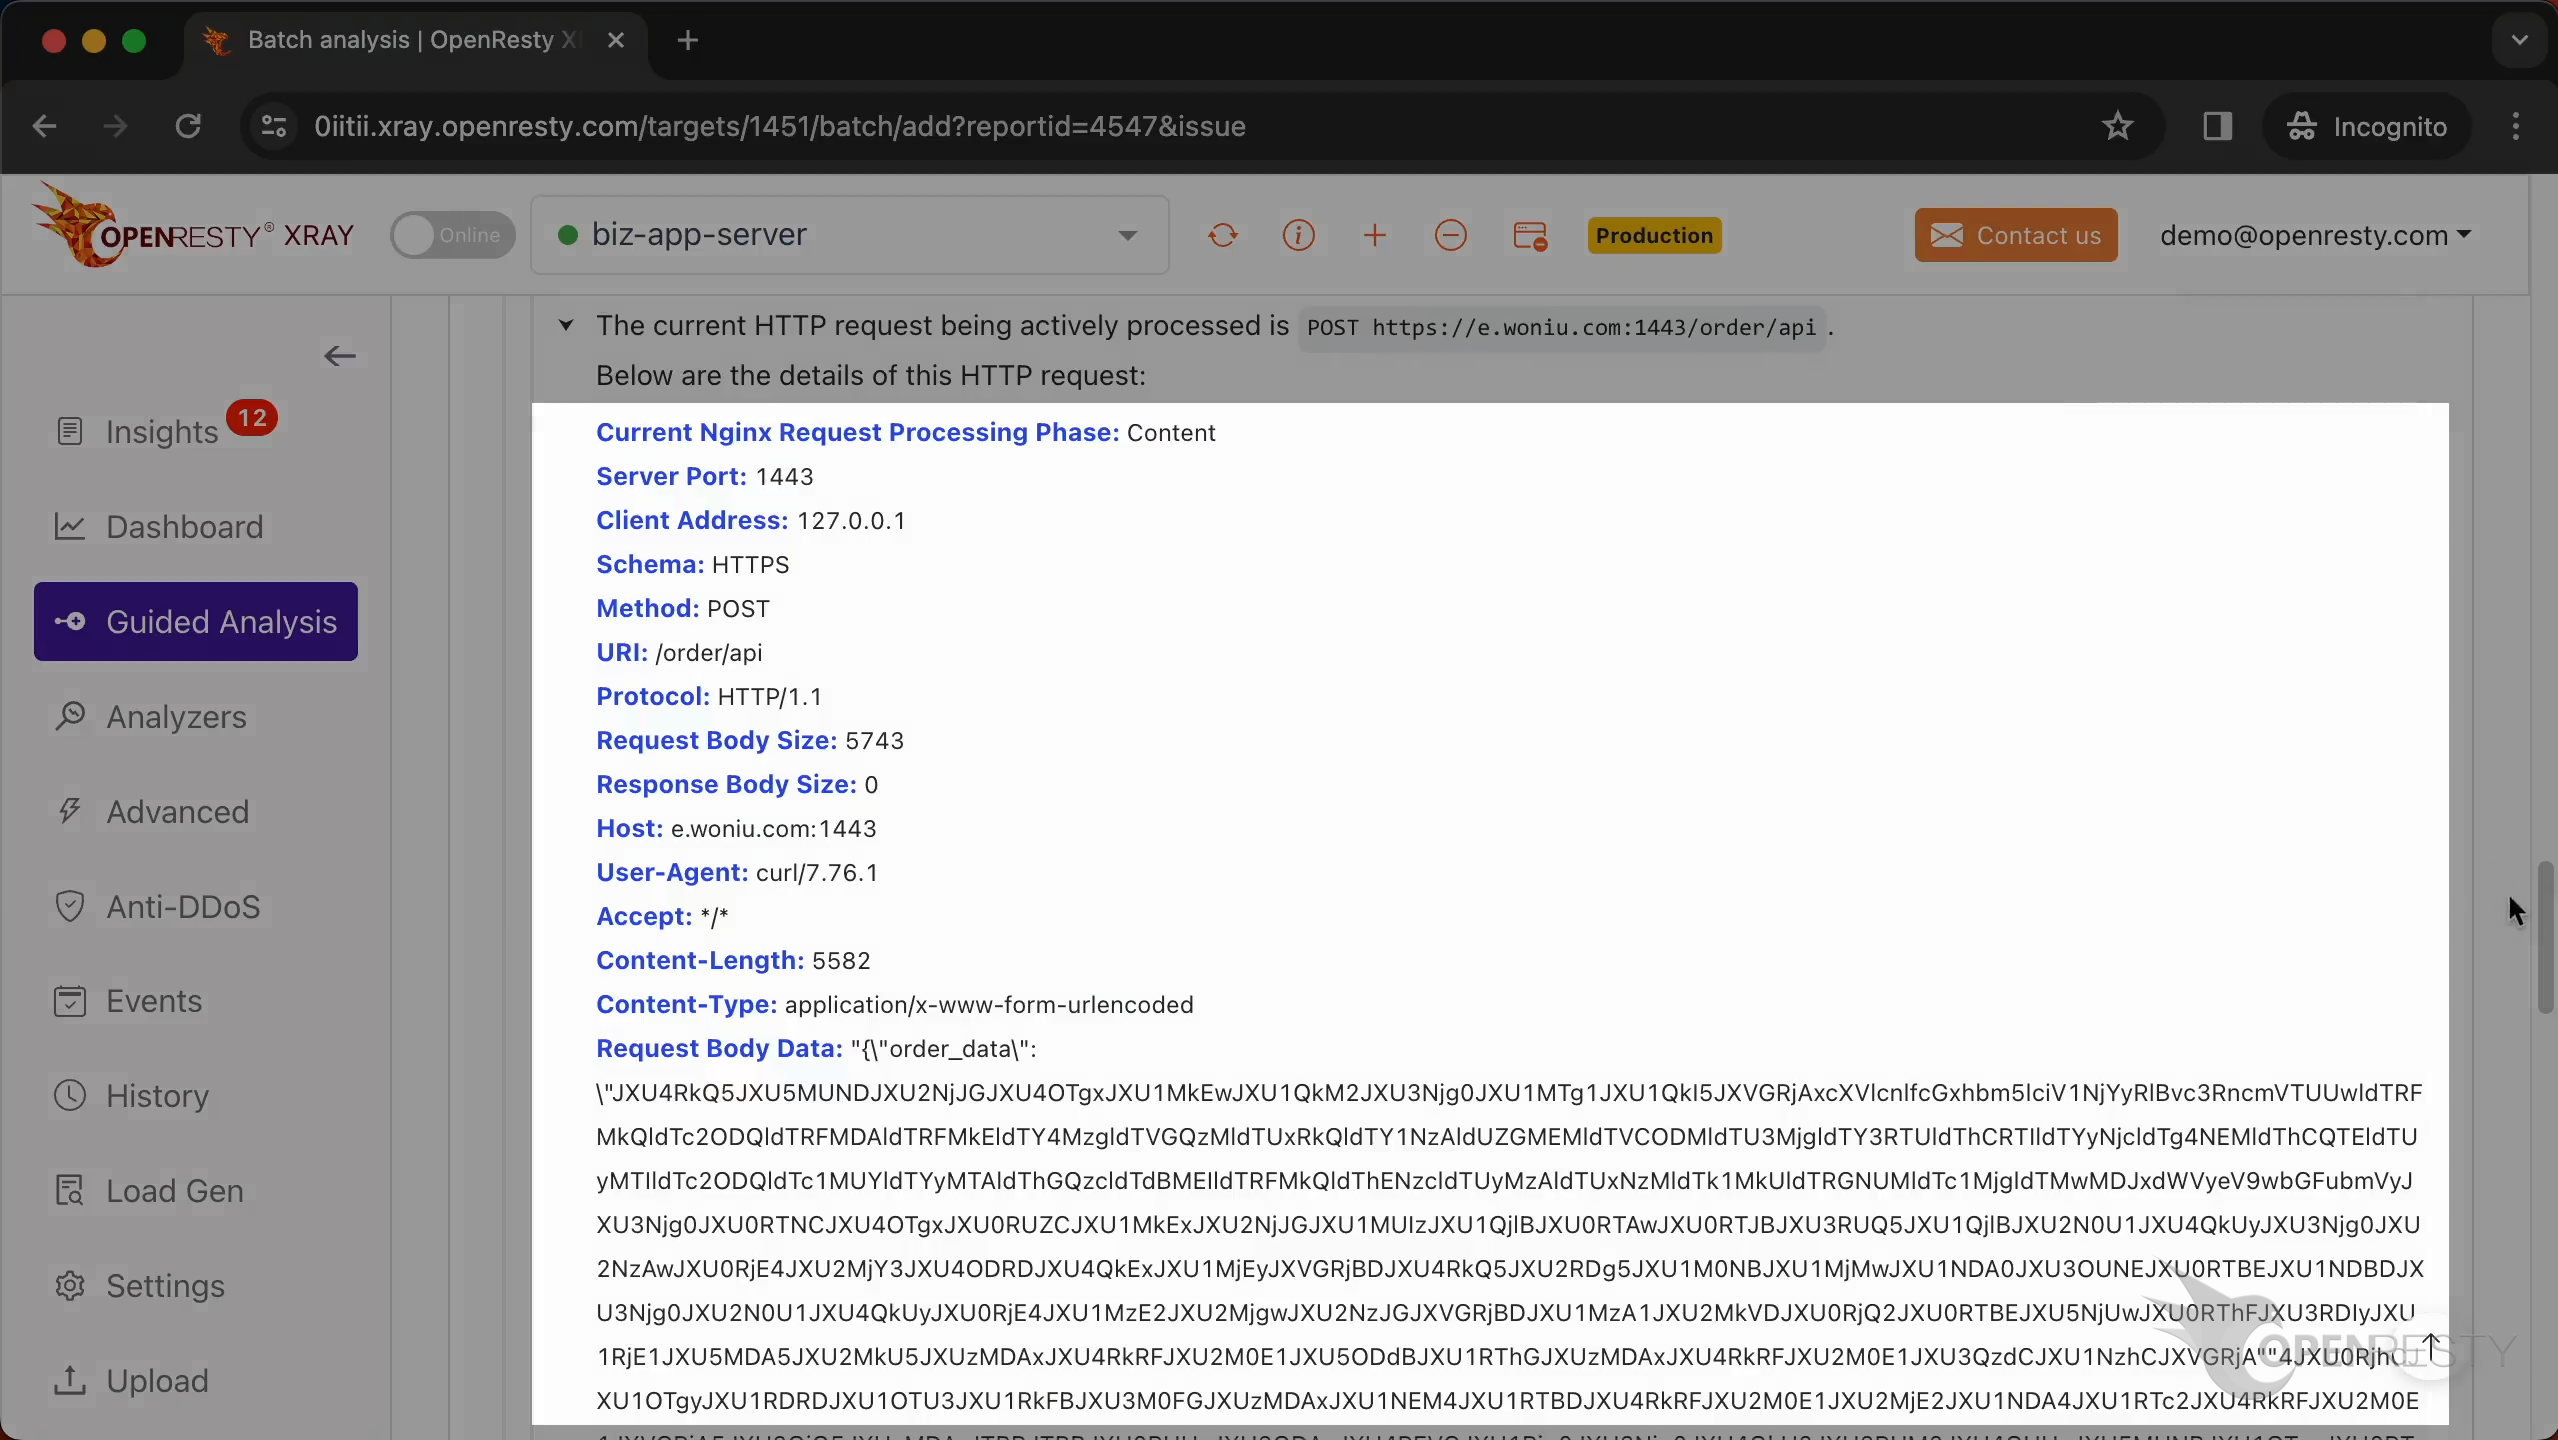
This displays the IP address of the client that initiated the request.
The request method is POST.
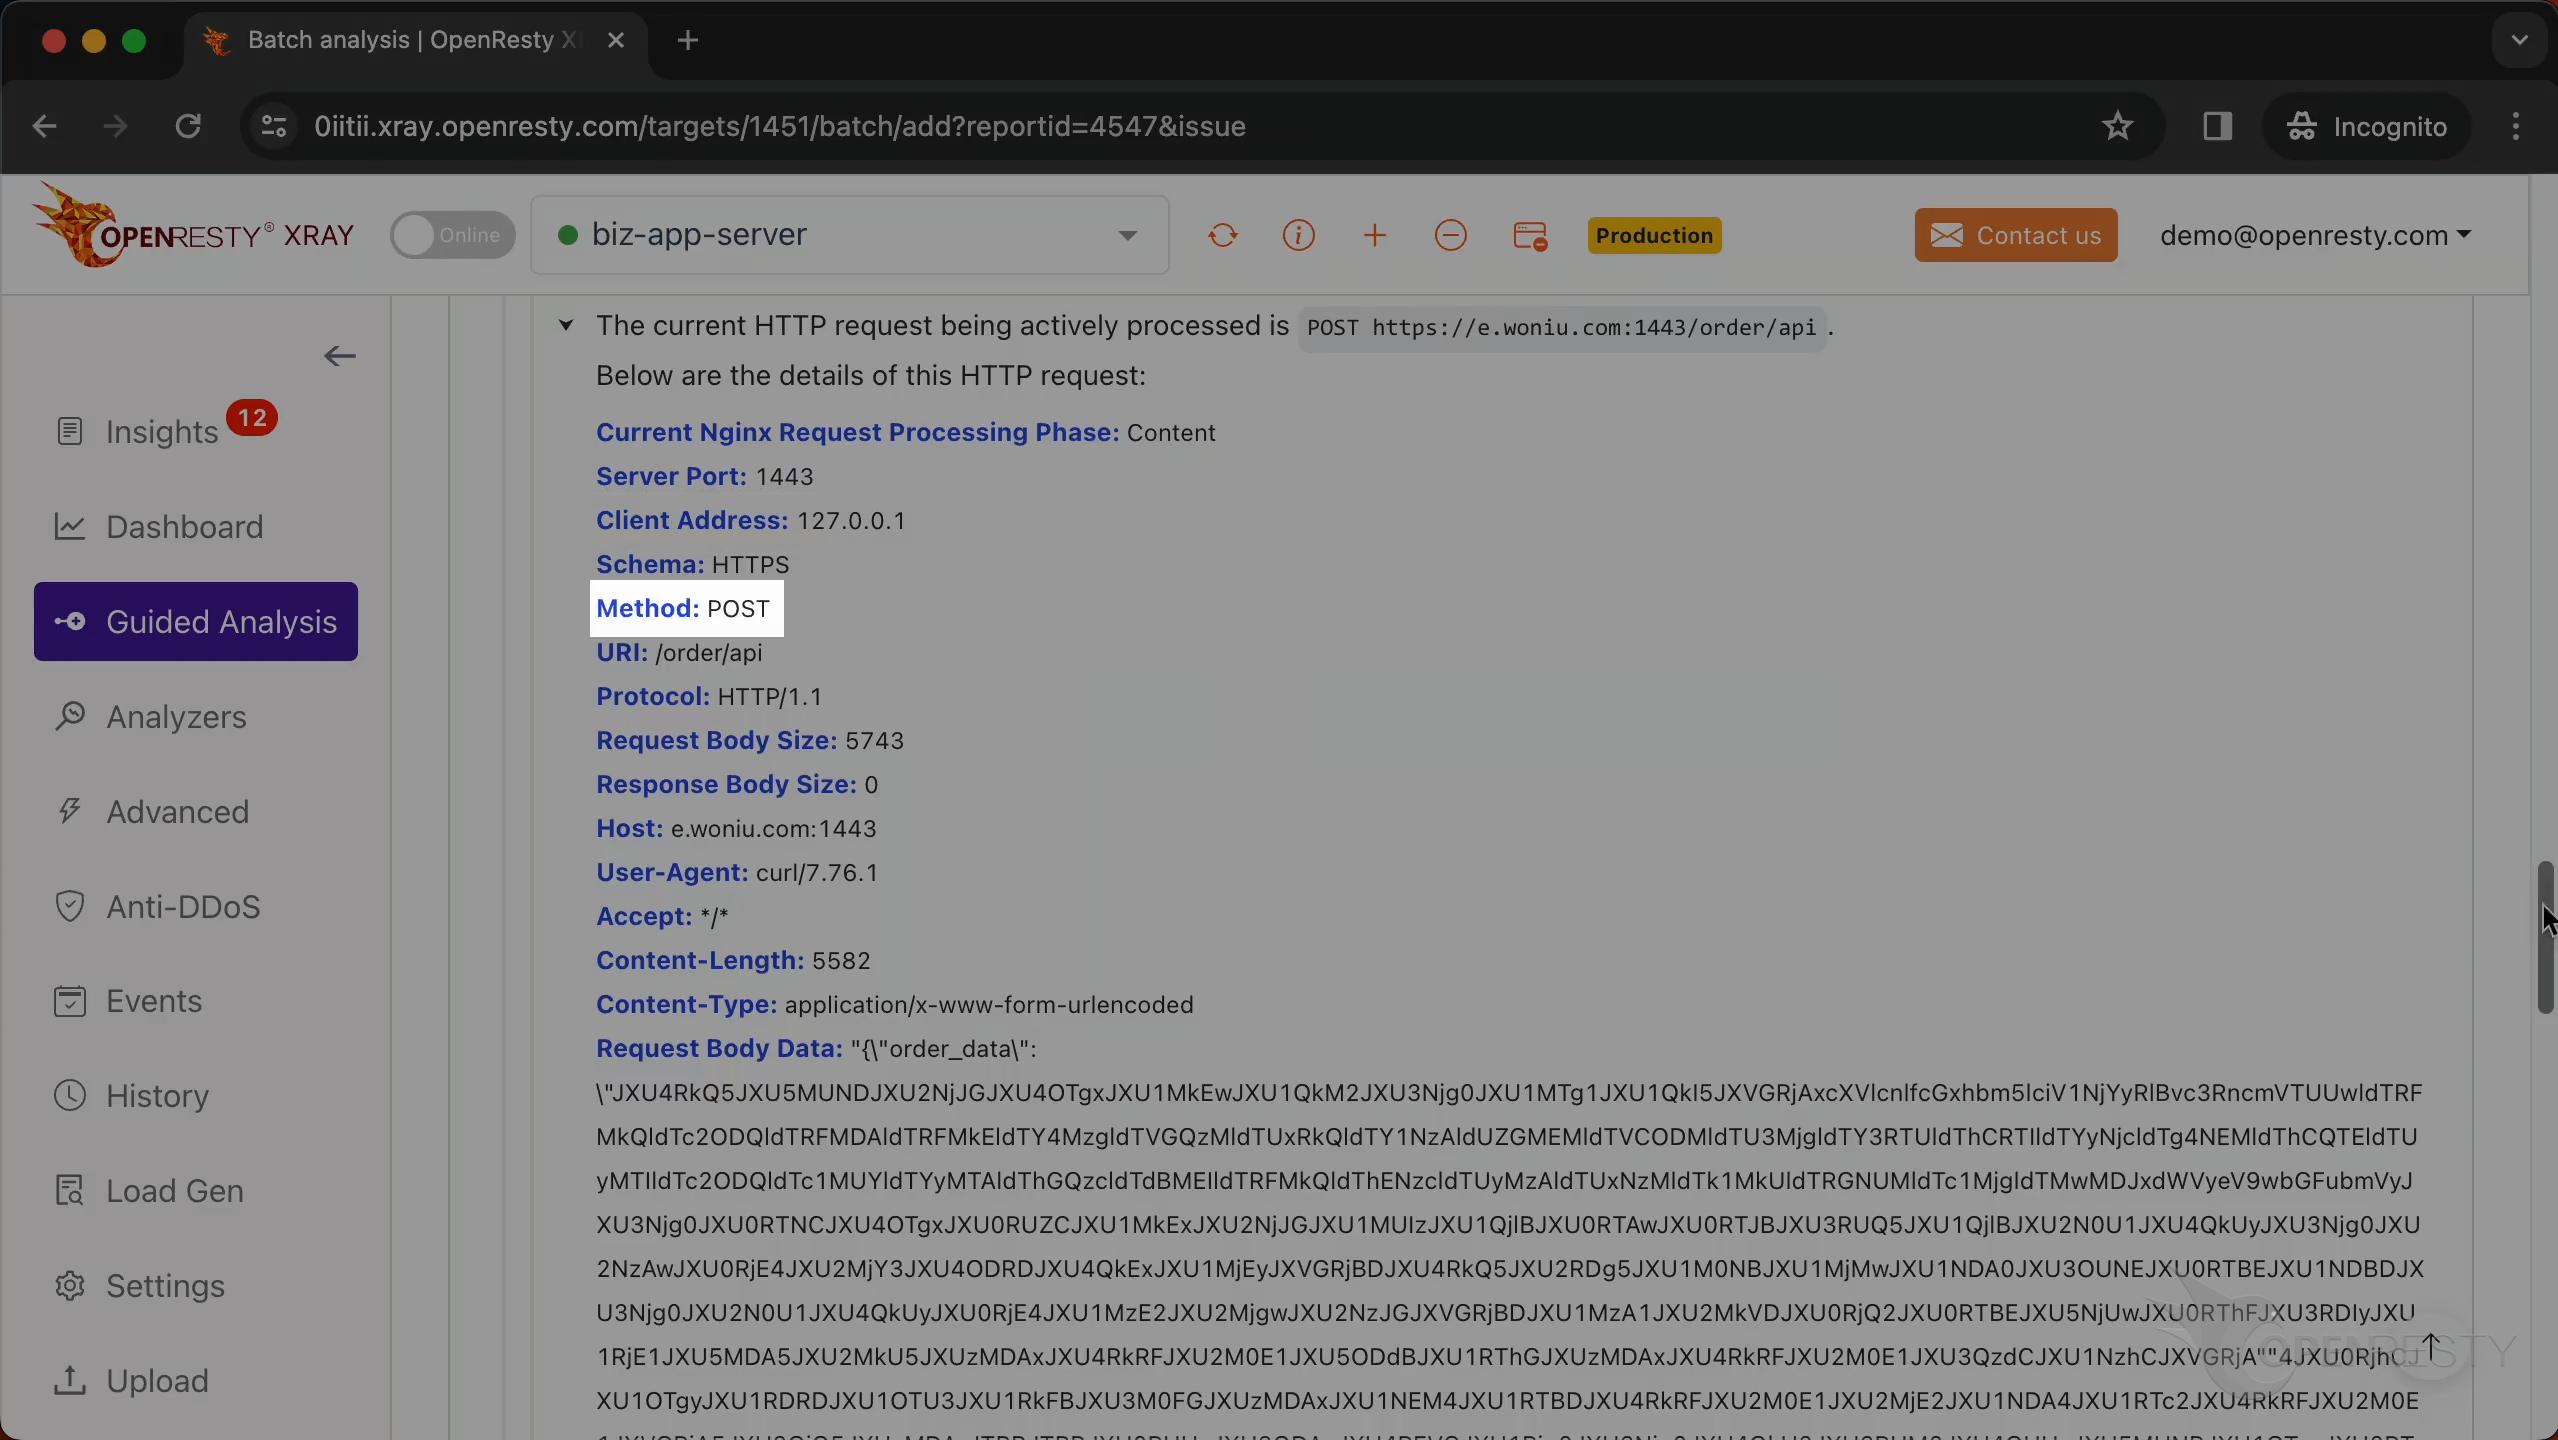
This is the URI of the request.
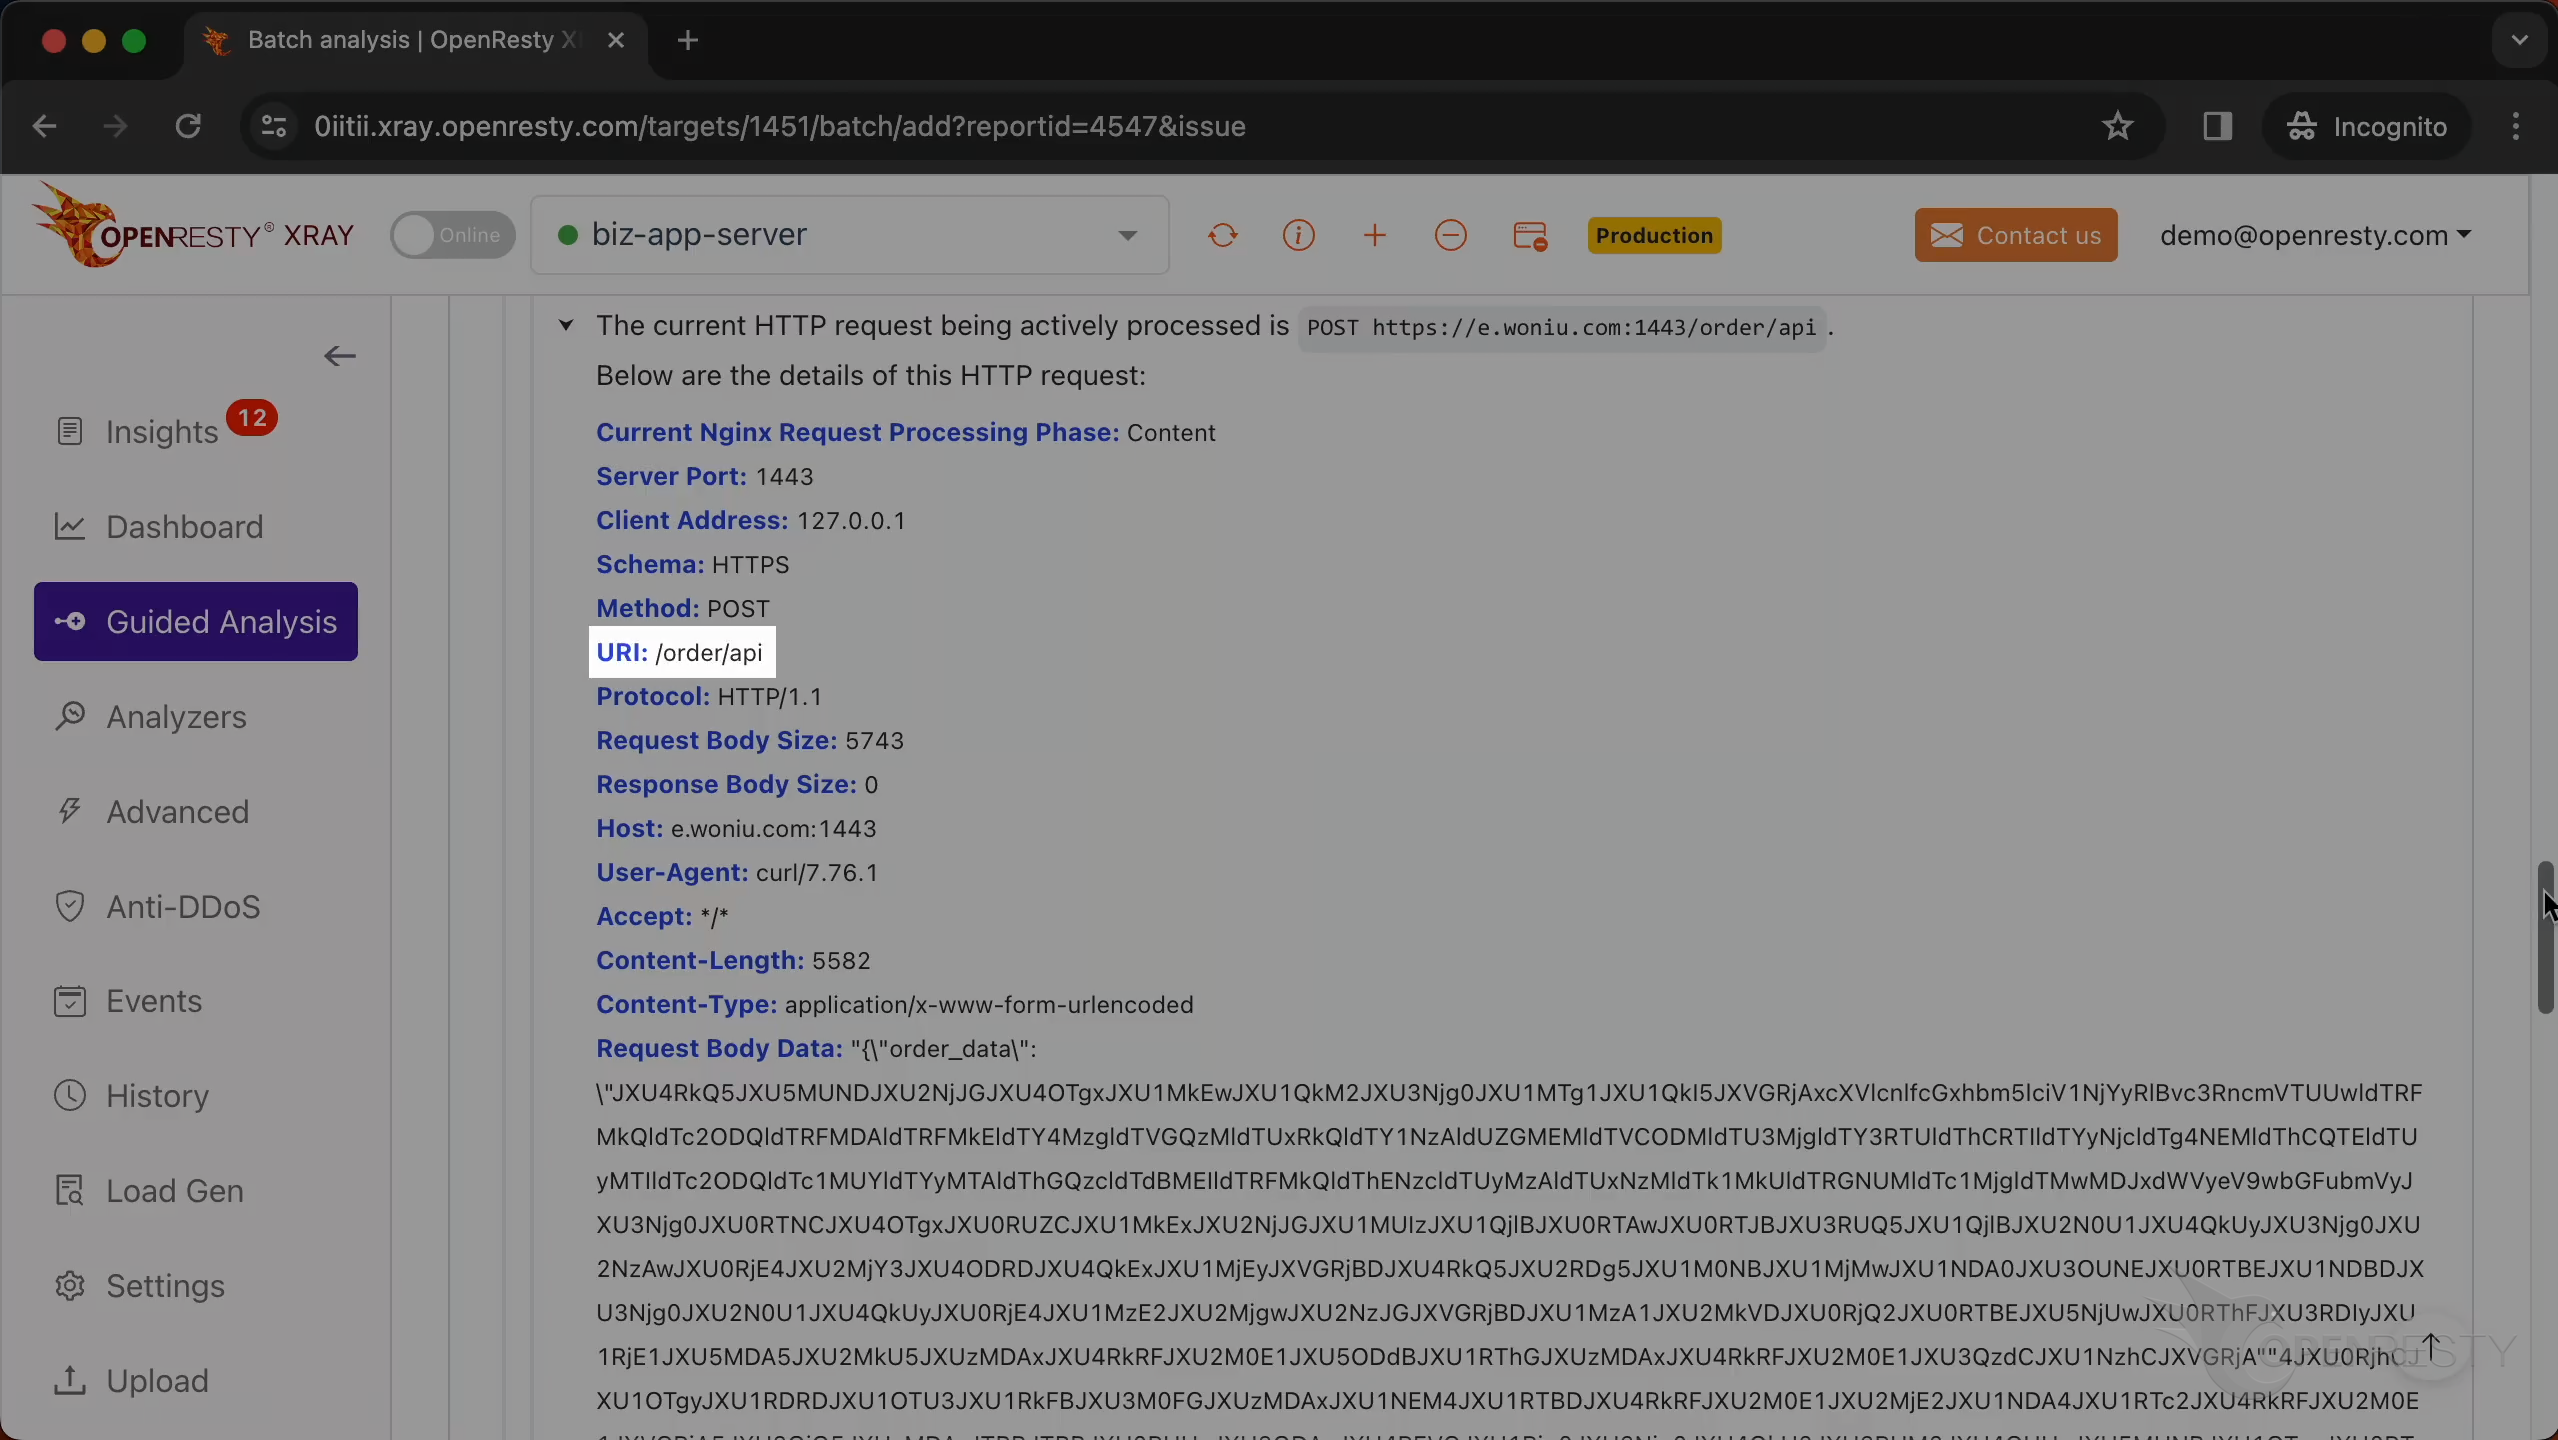
We can check out all the other concurrent HTTP requests being processed.
The report also contains memory analysis.
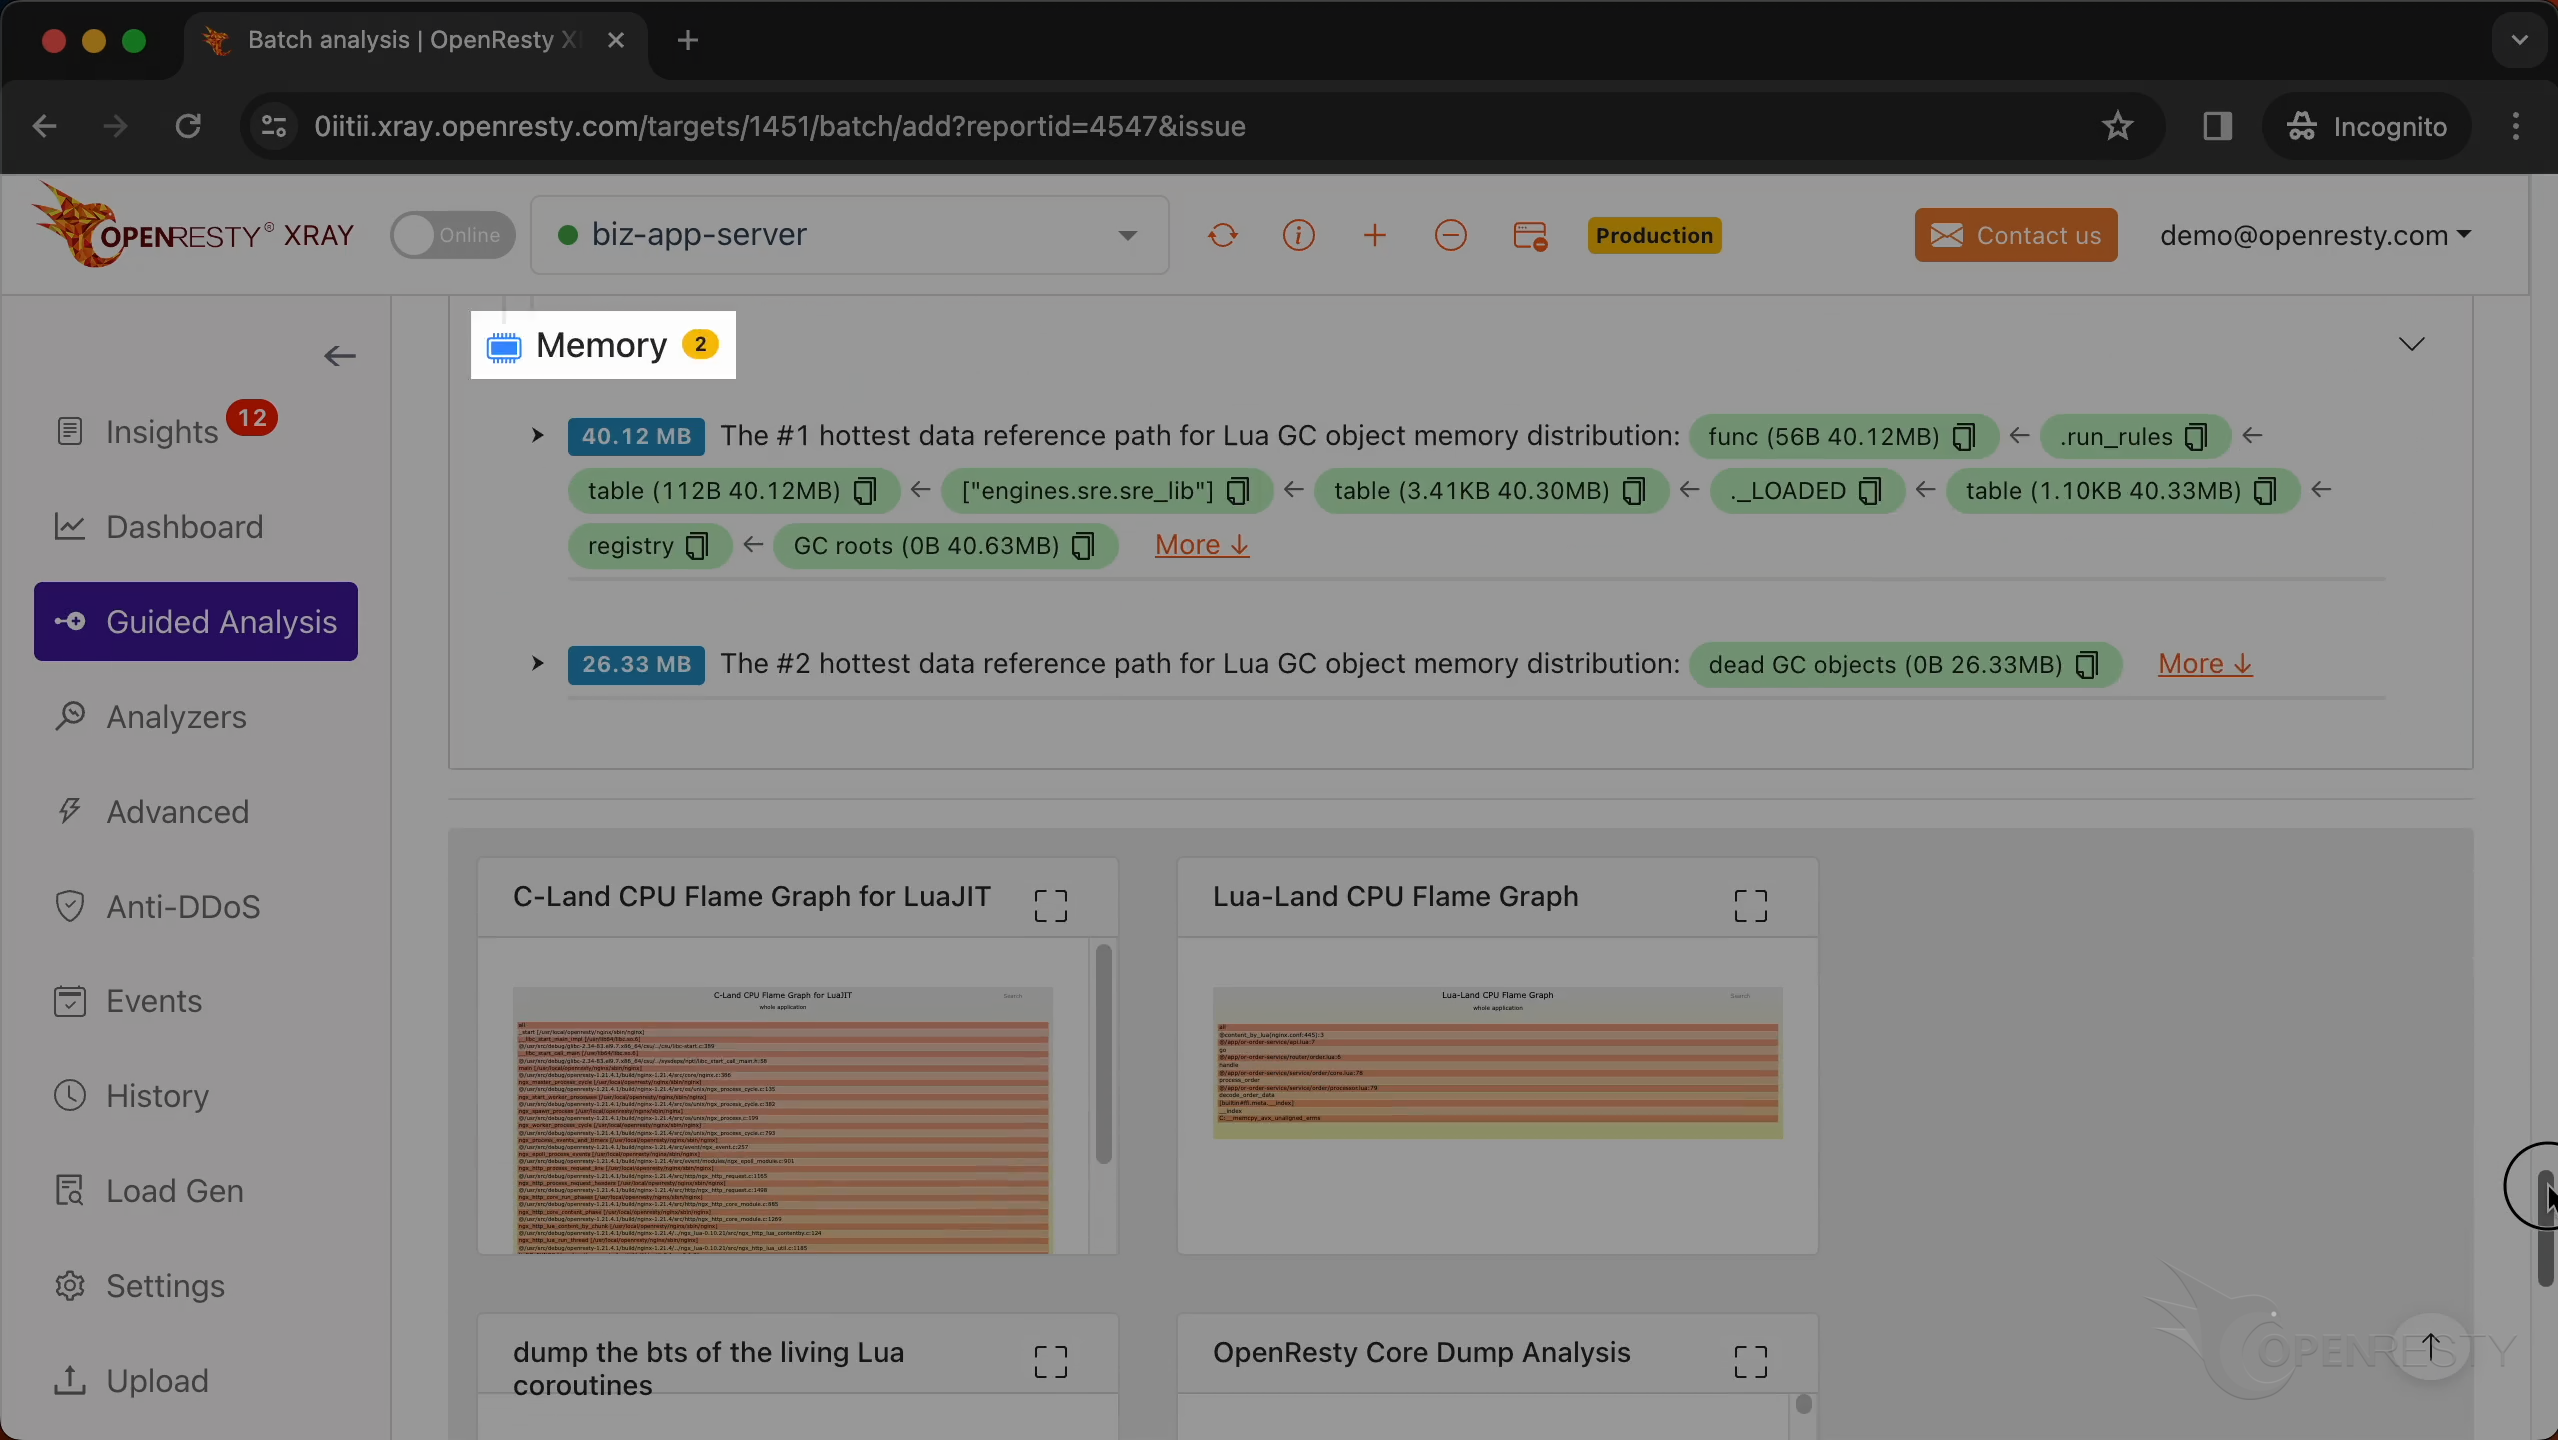
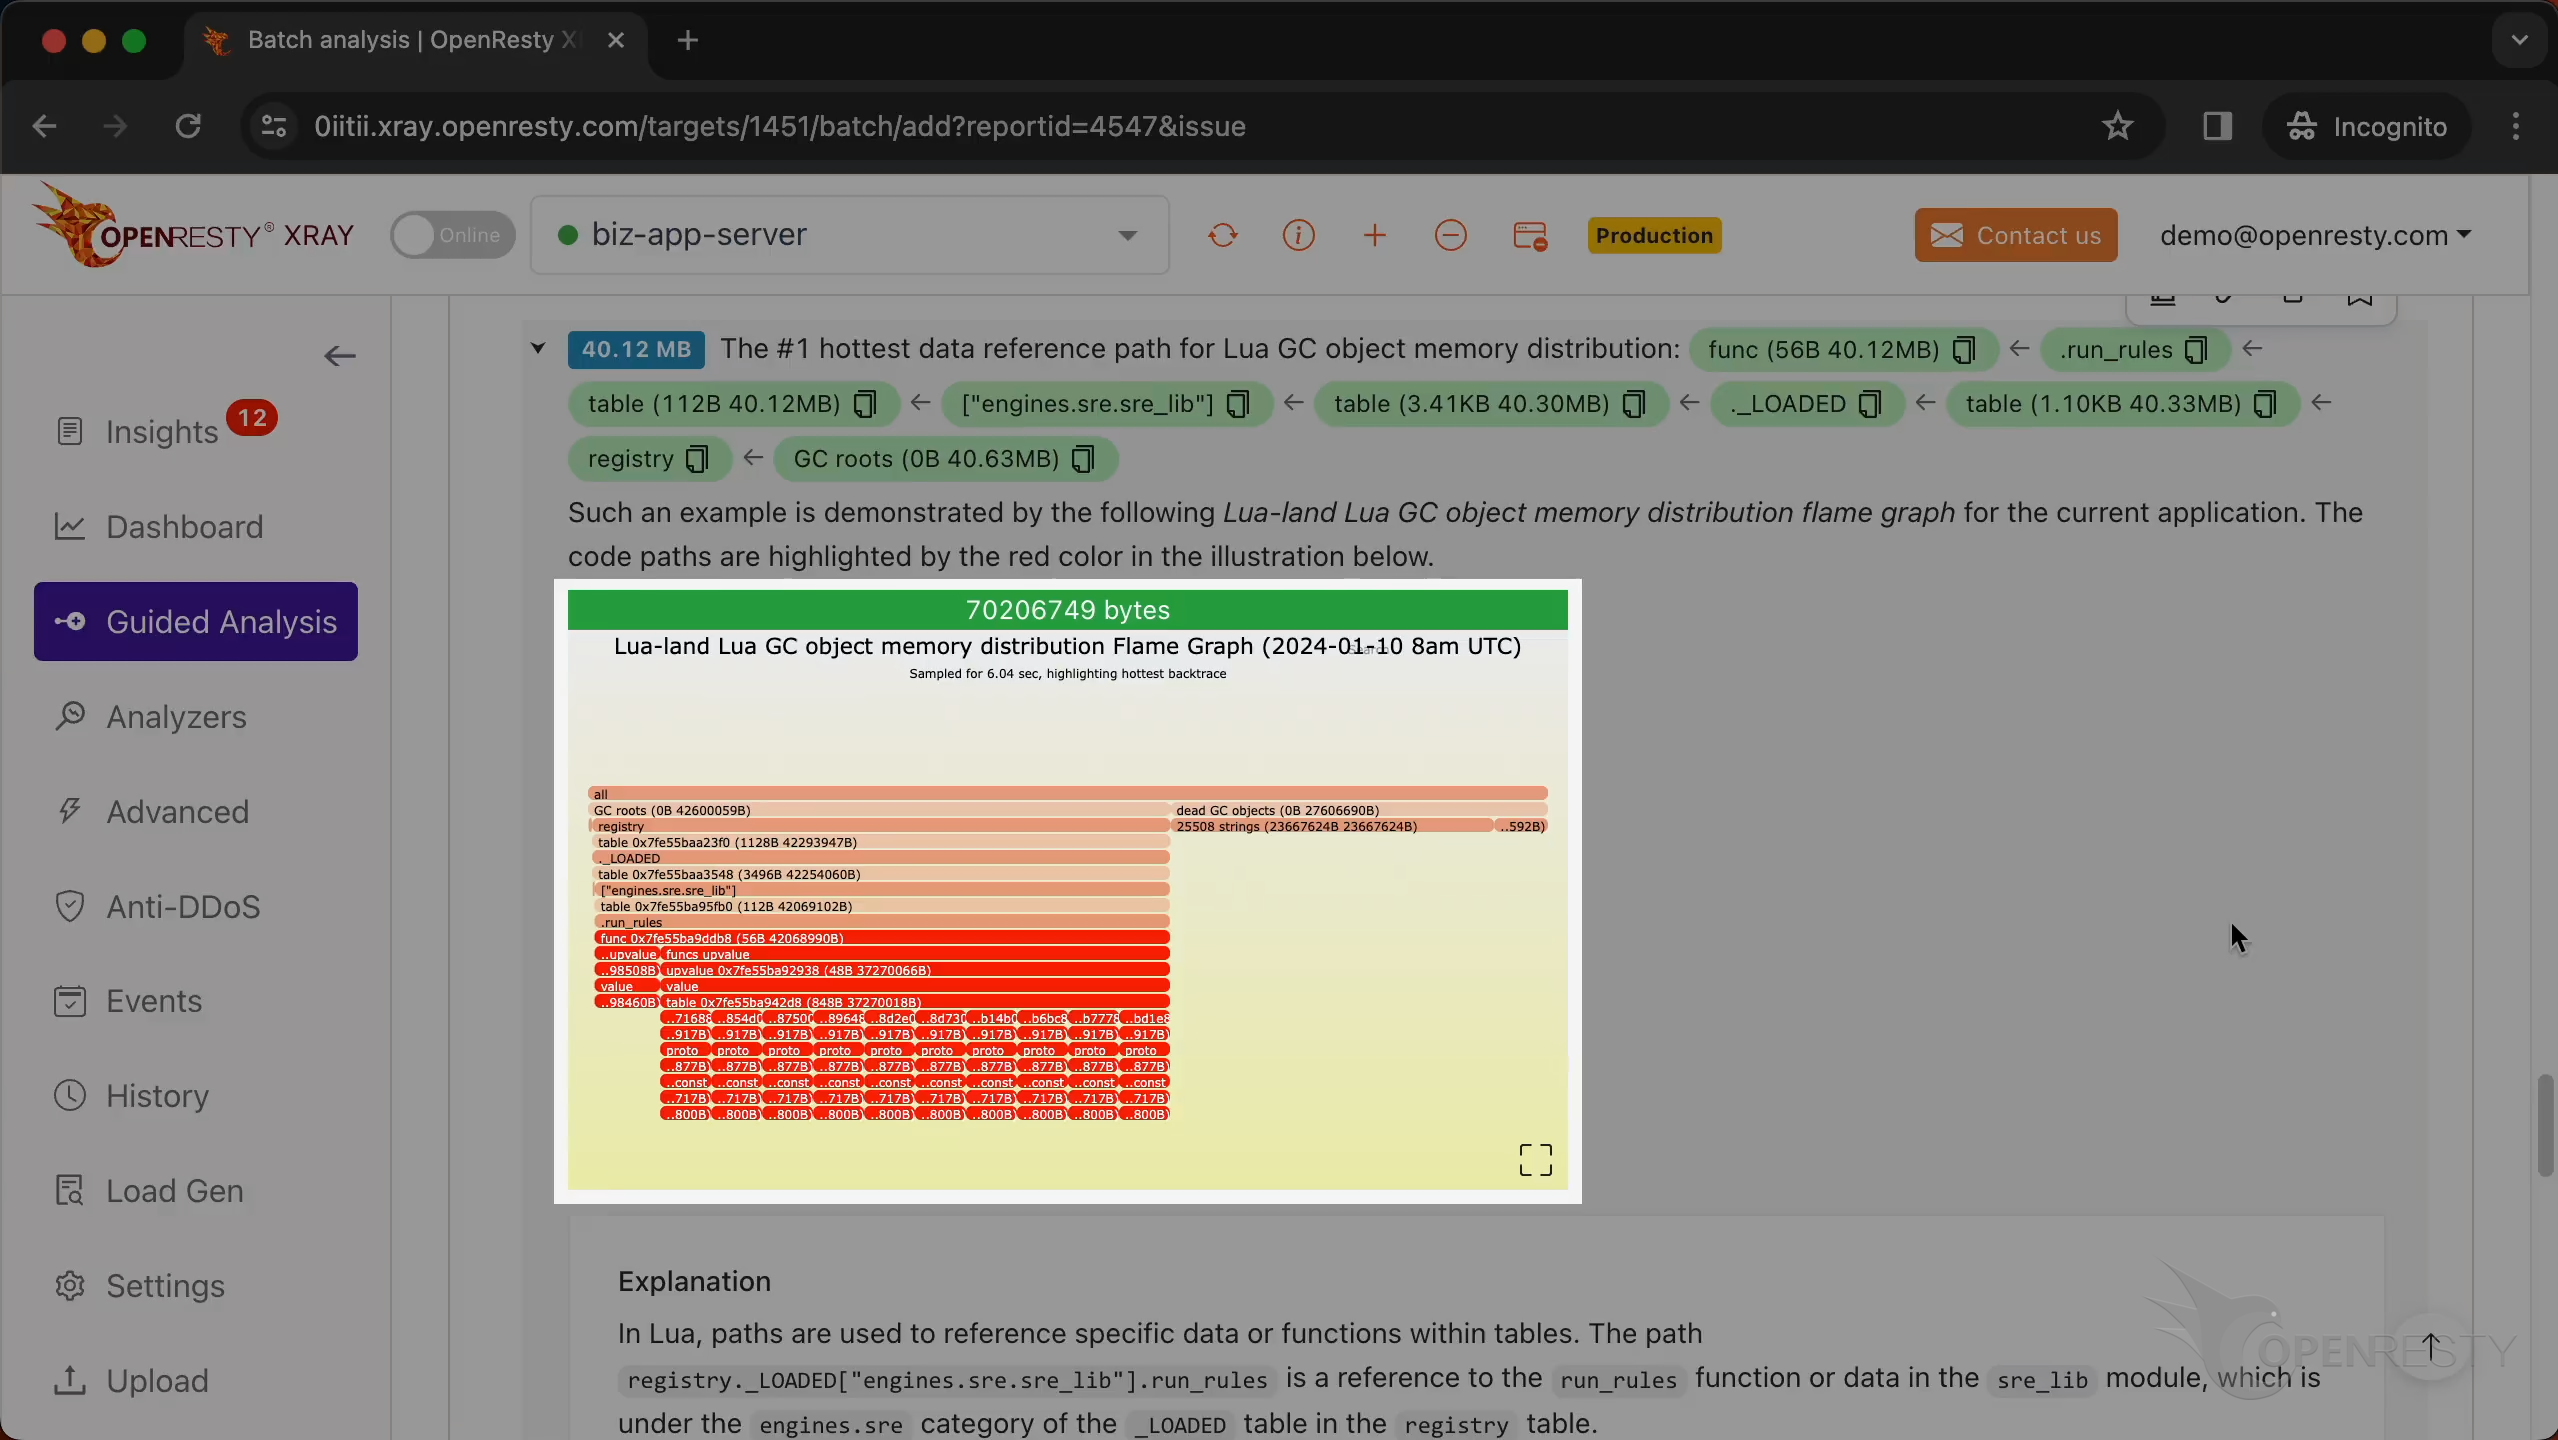
This is the #1 hottest data reference path for Lua GC object memory distribution.
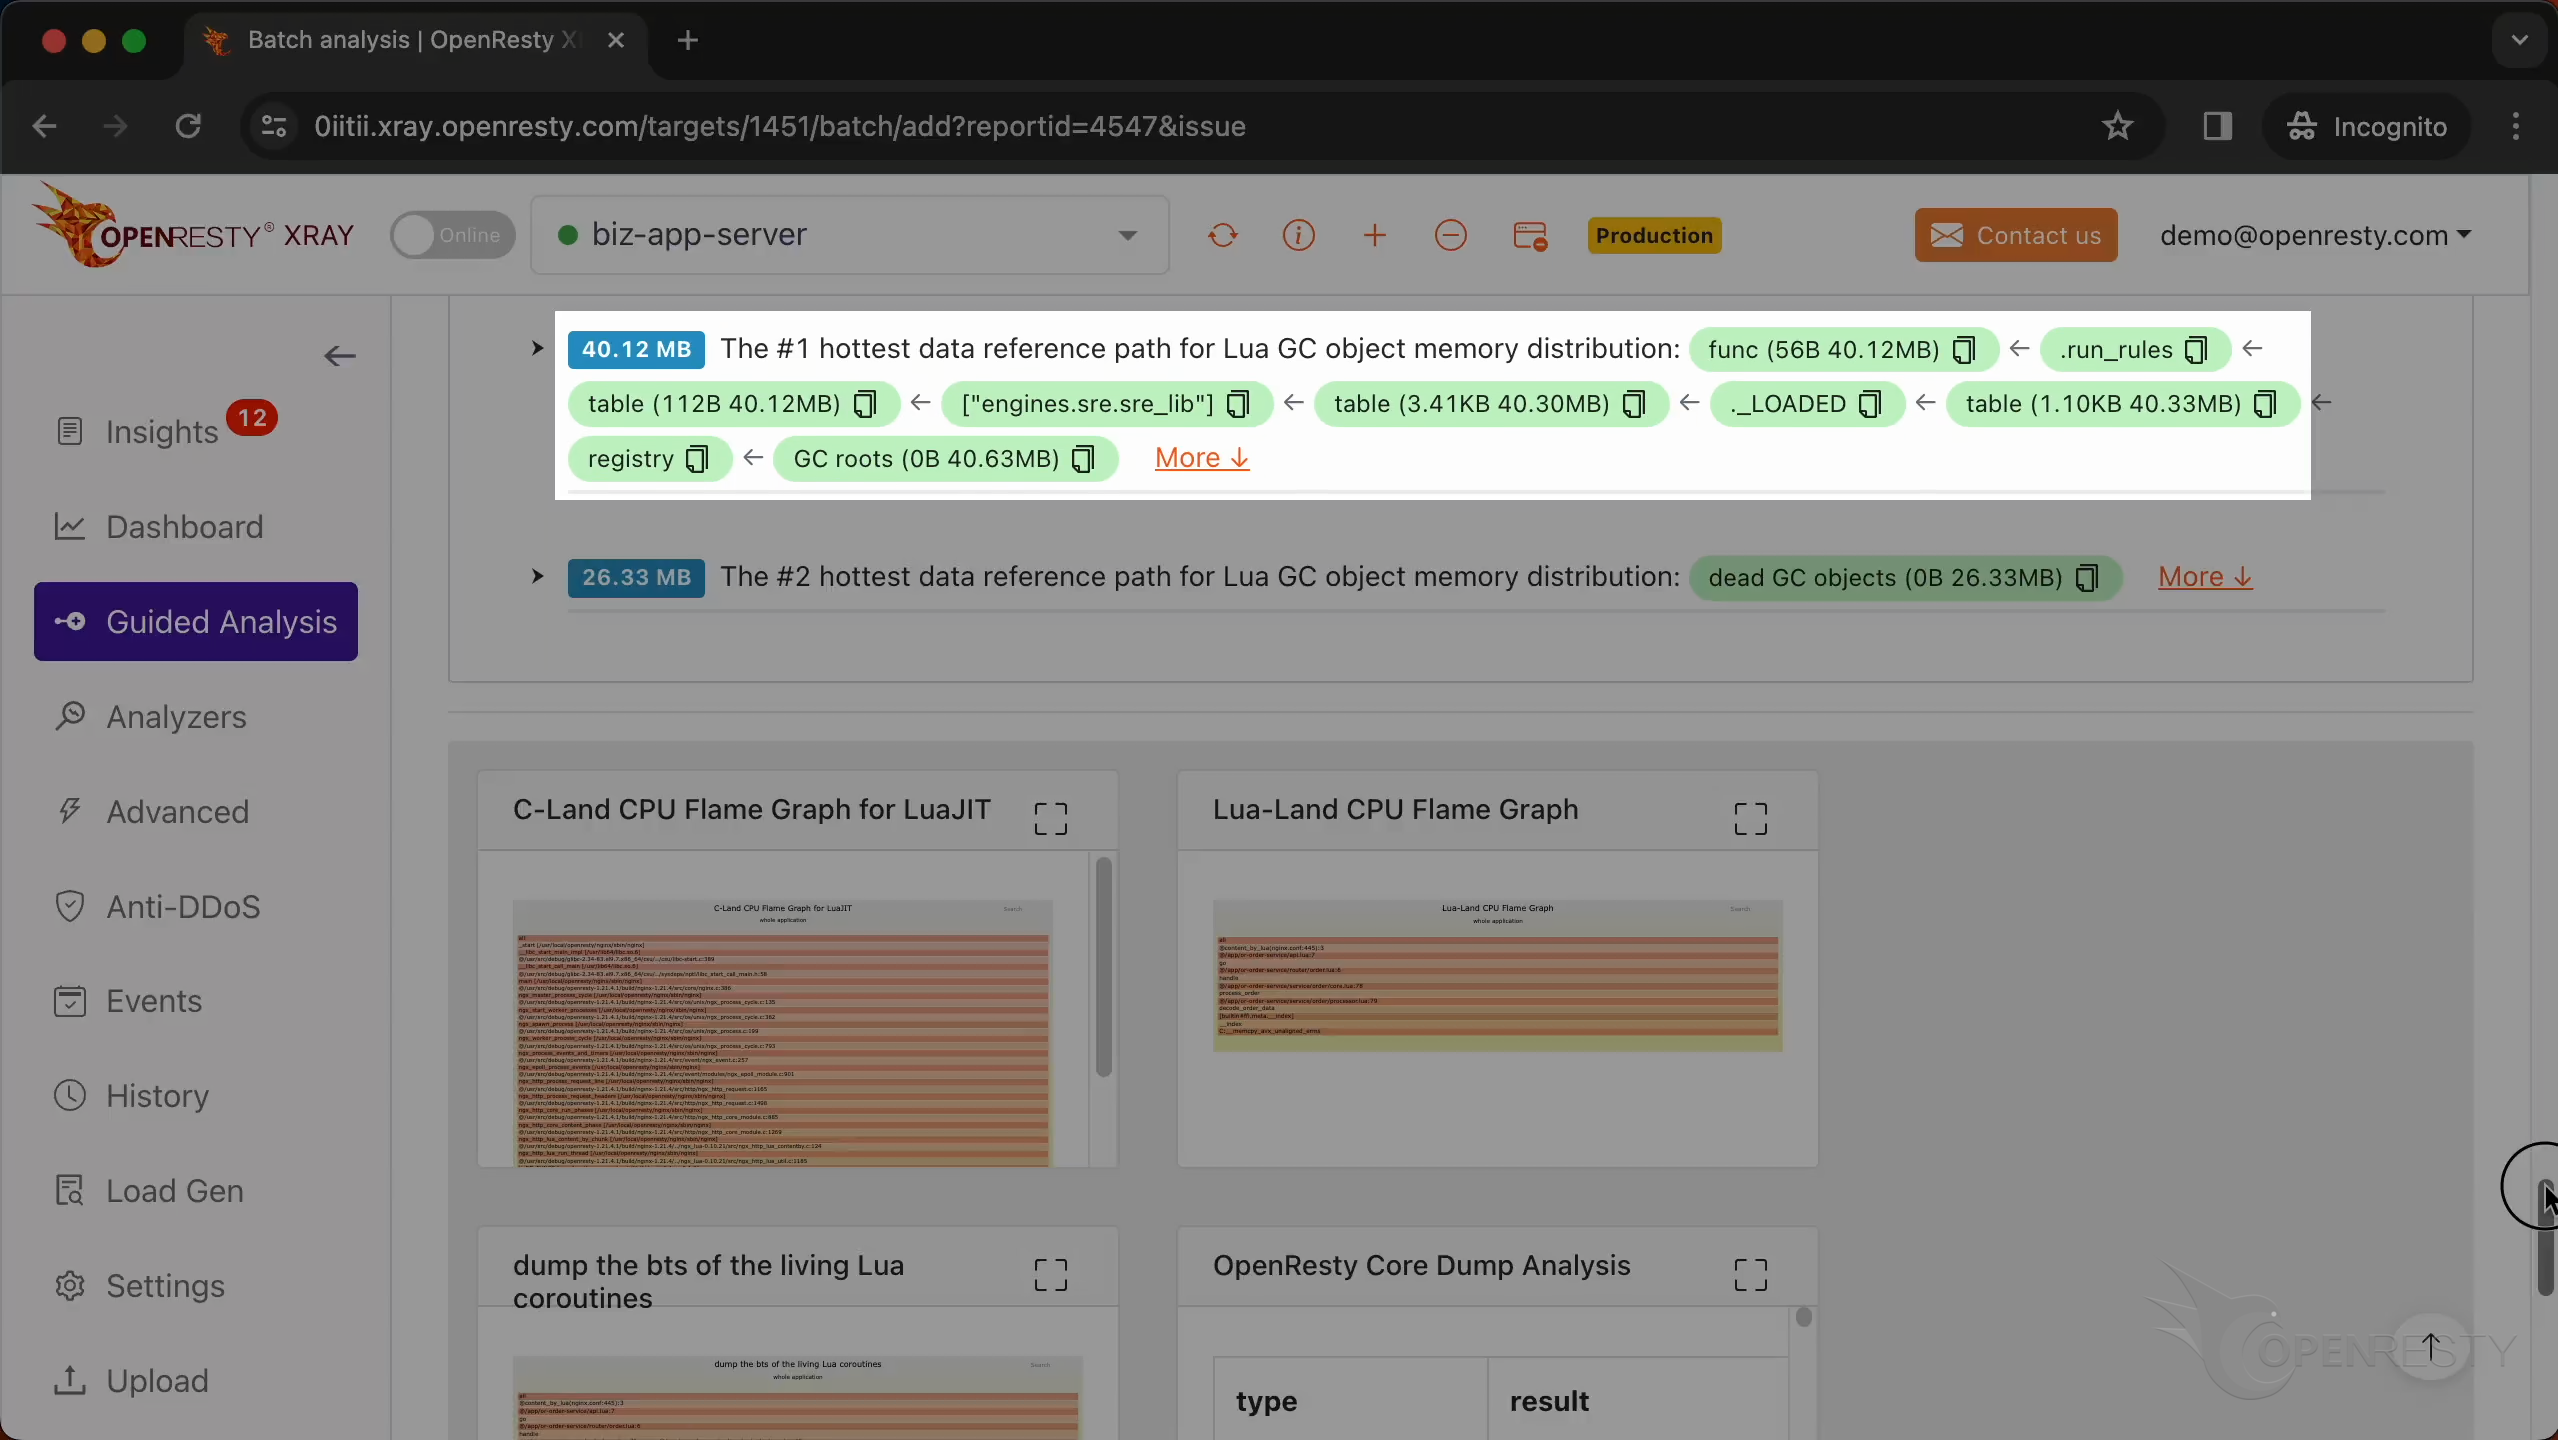
This path is essentially saying: Go to the registry table,
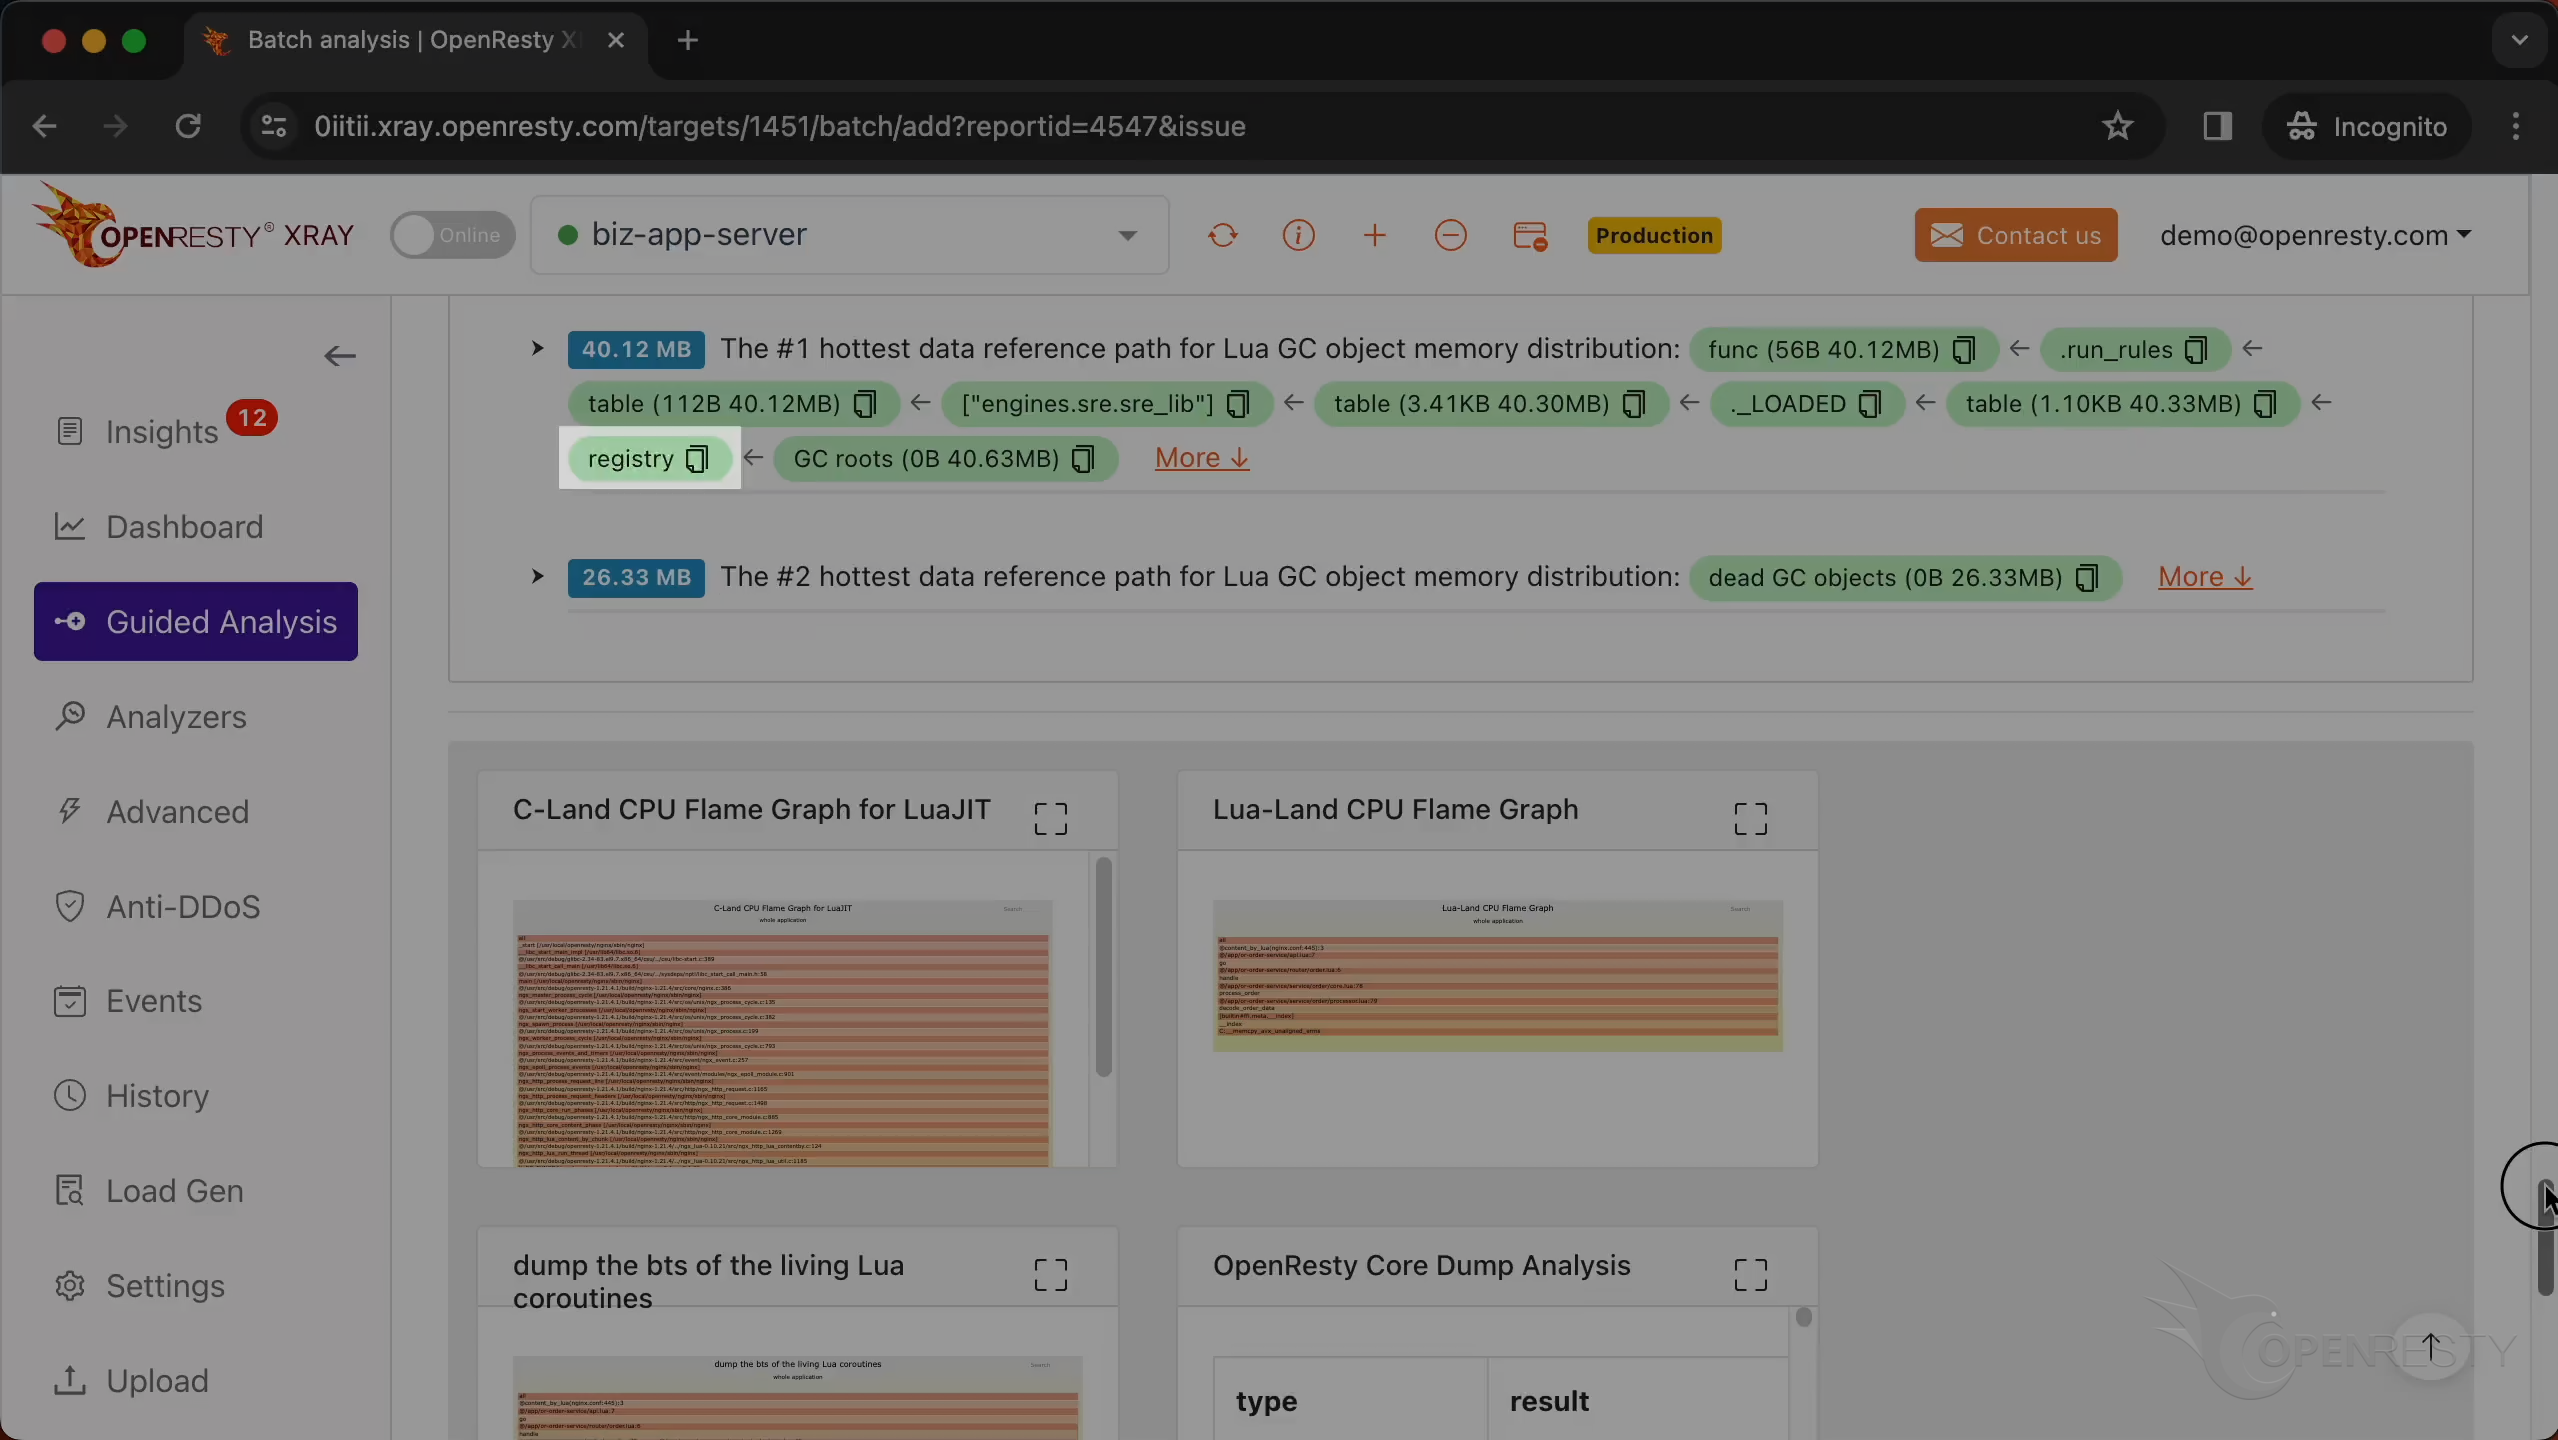
find the _LOADED table,
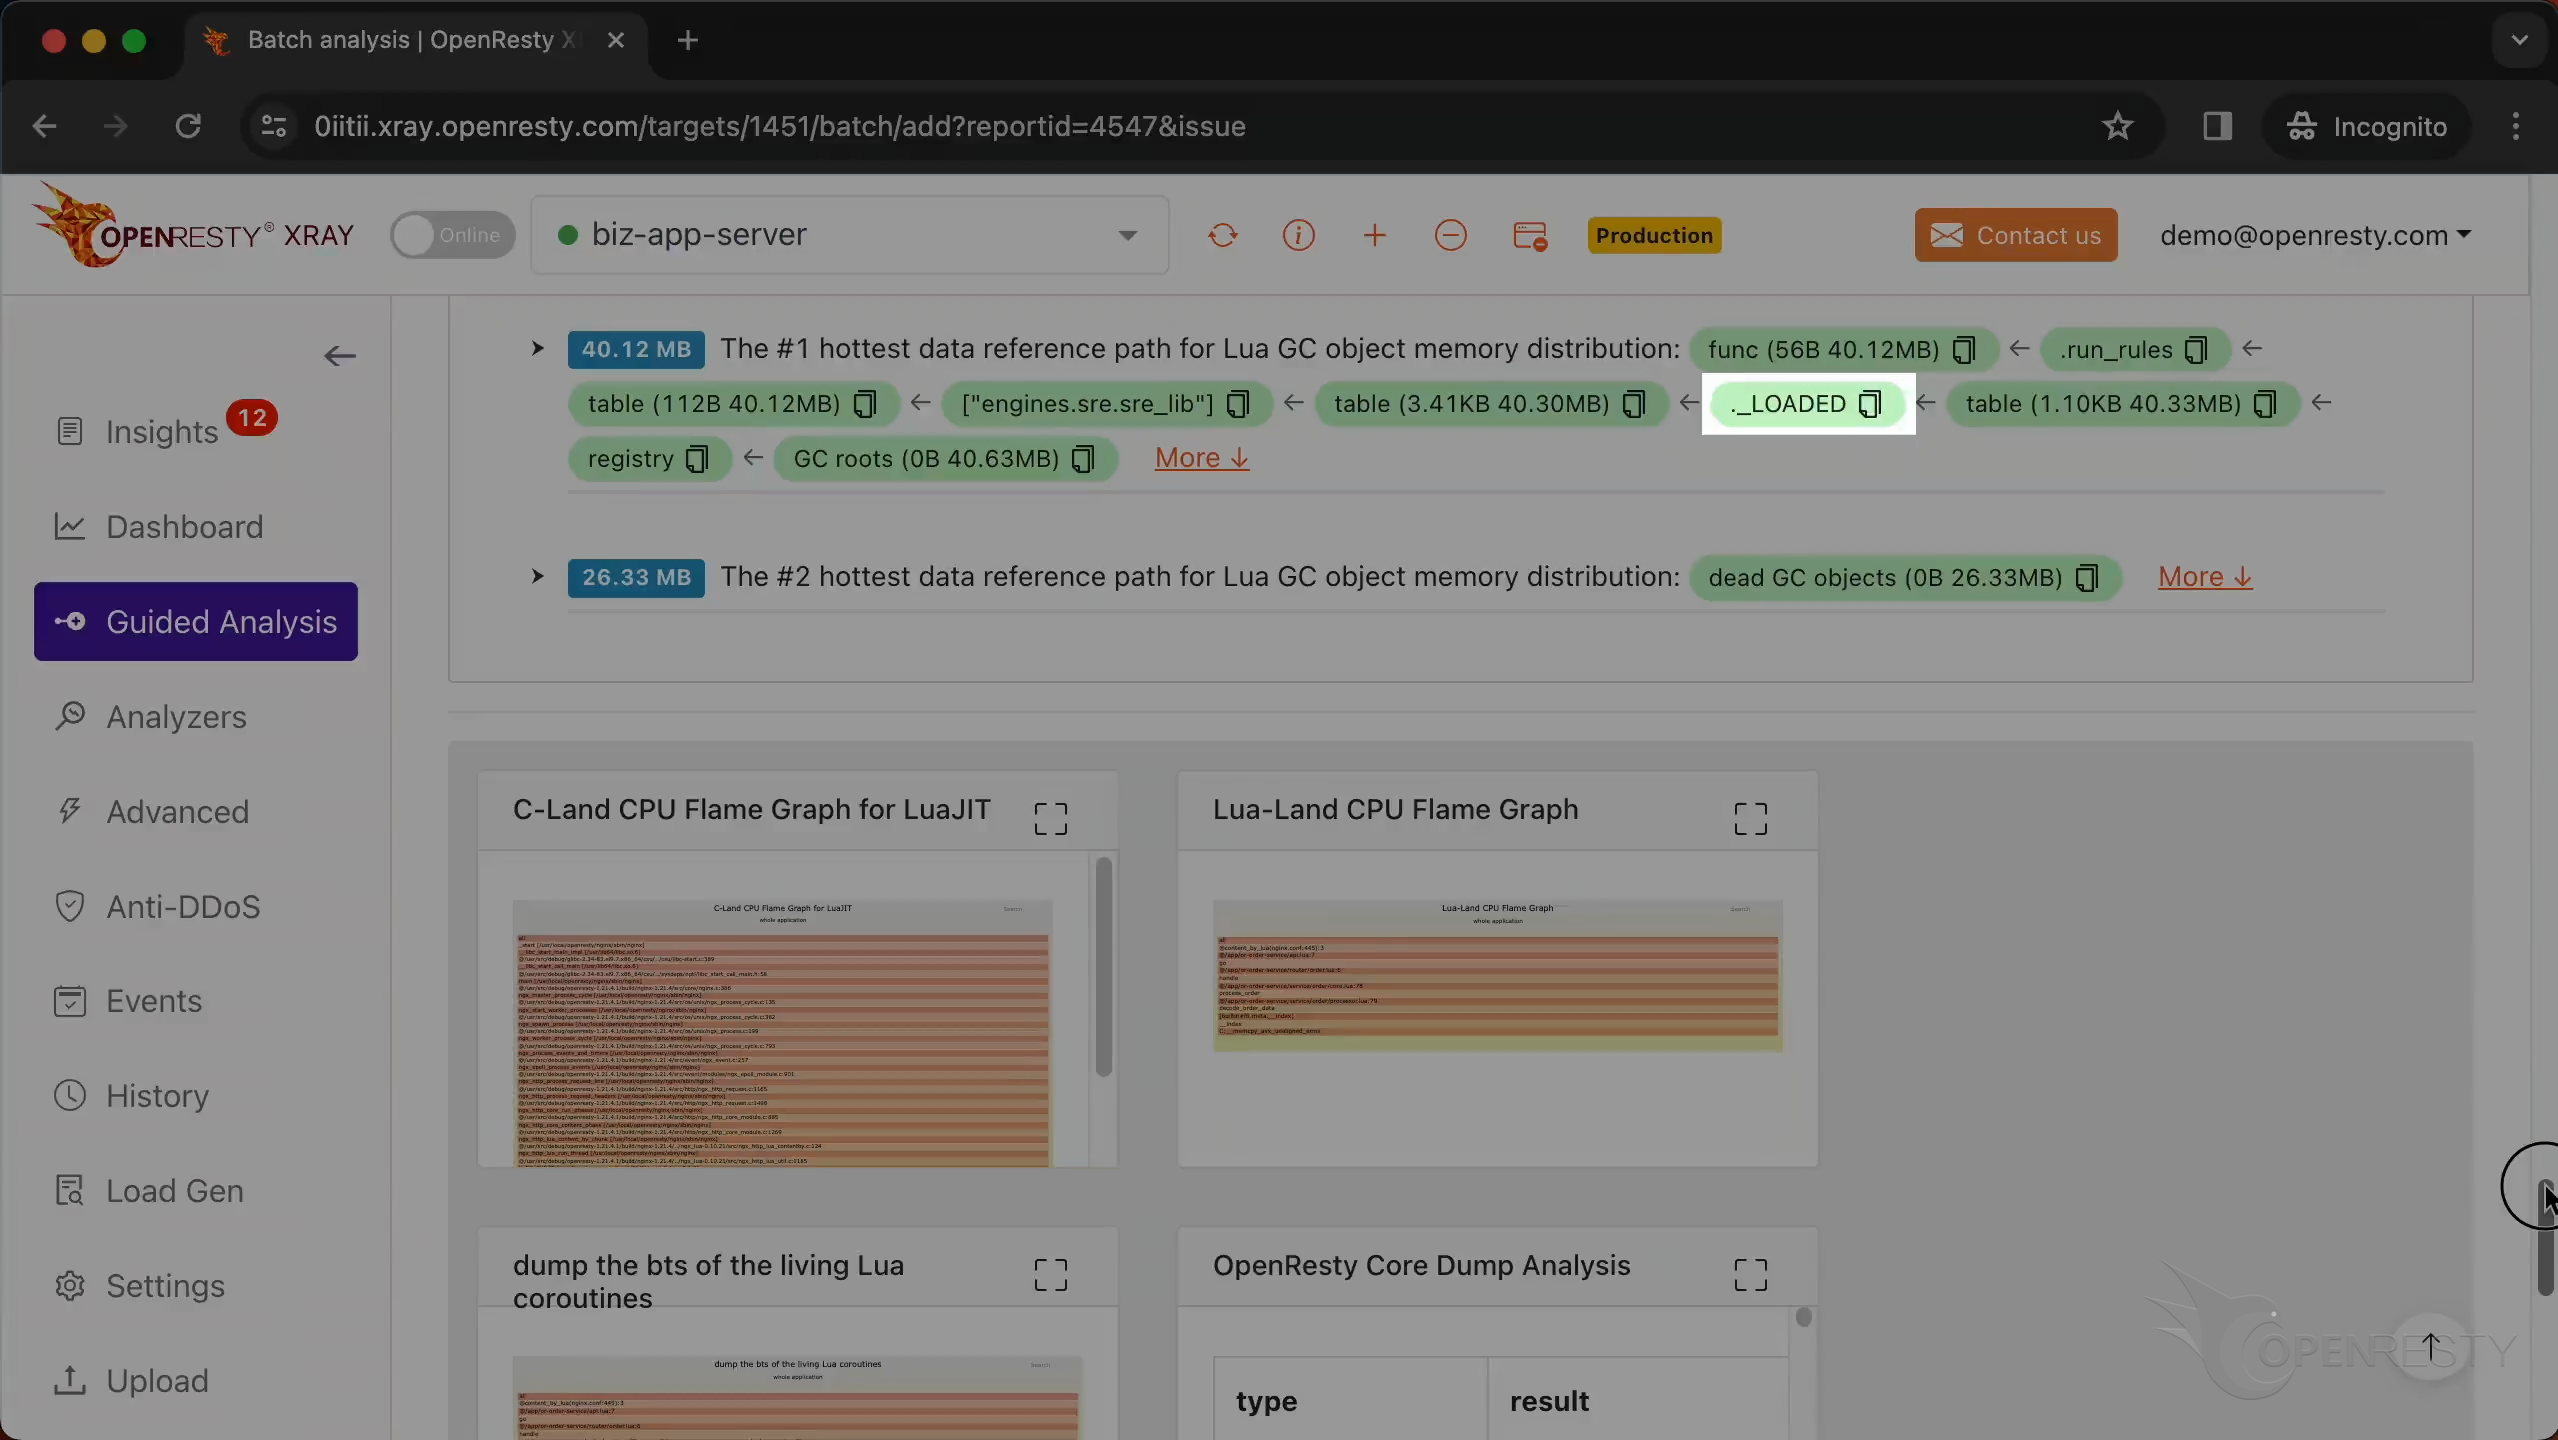
Within that, find the engines.sre.sre_lib module,
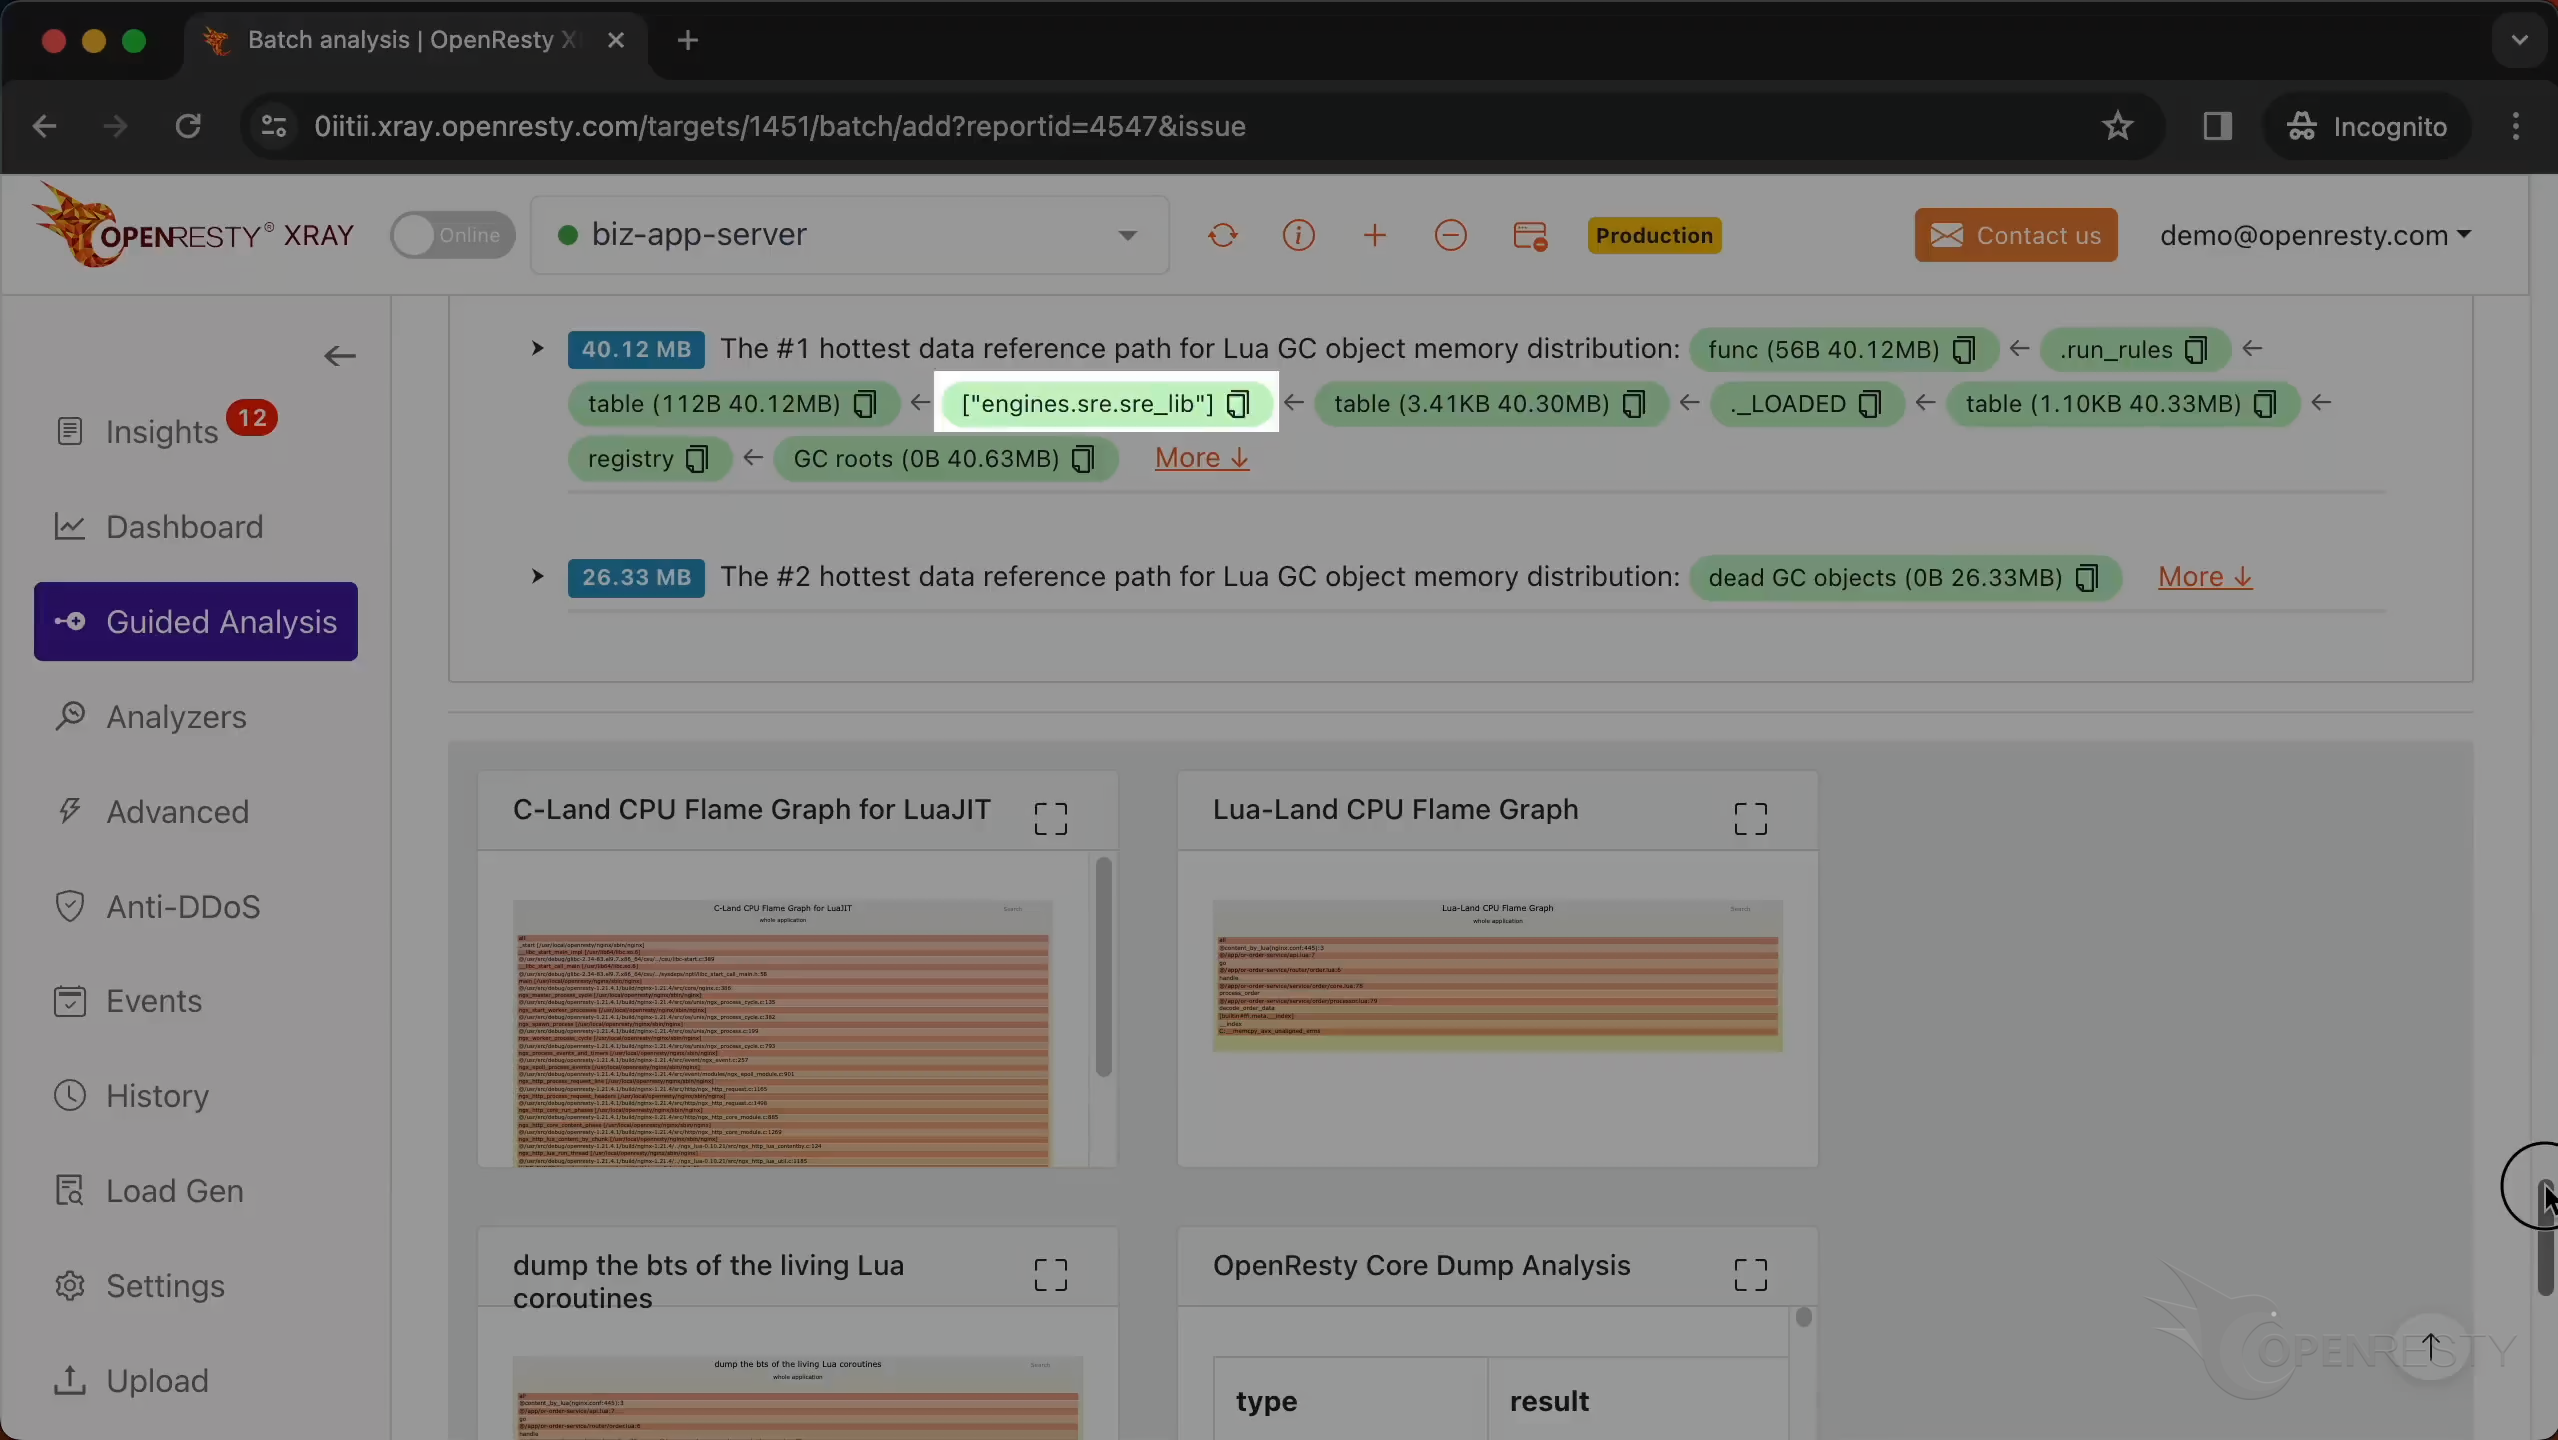
access the run_rules function or data.
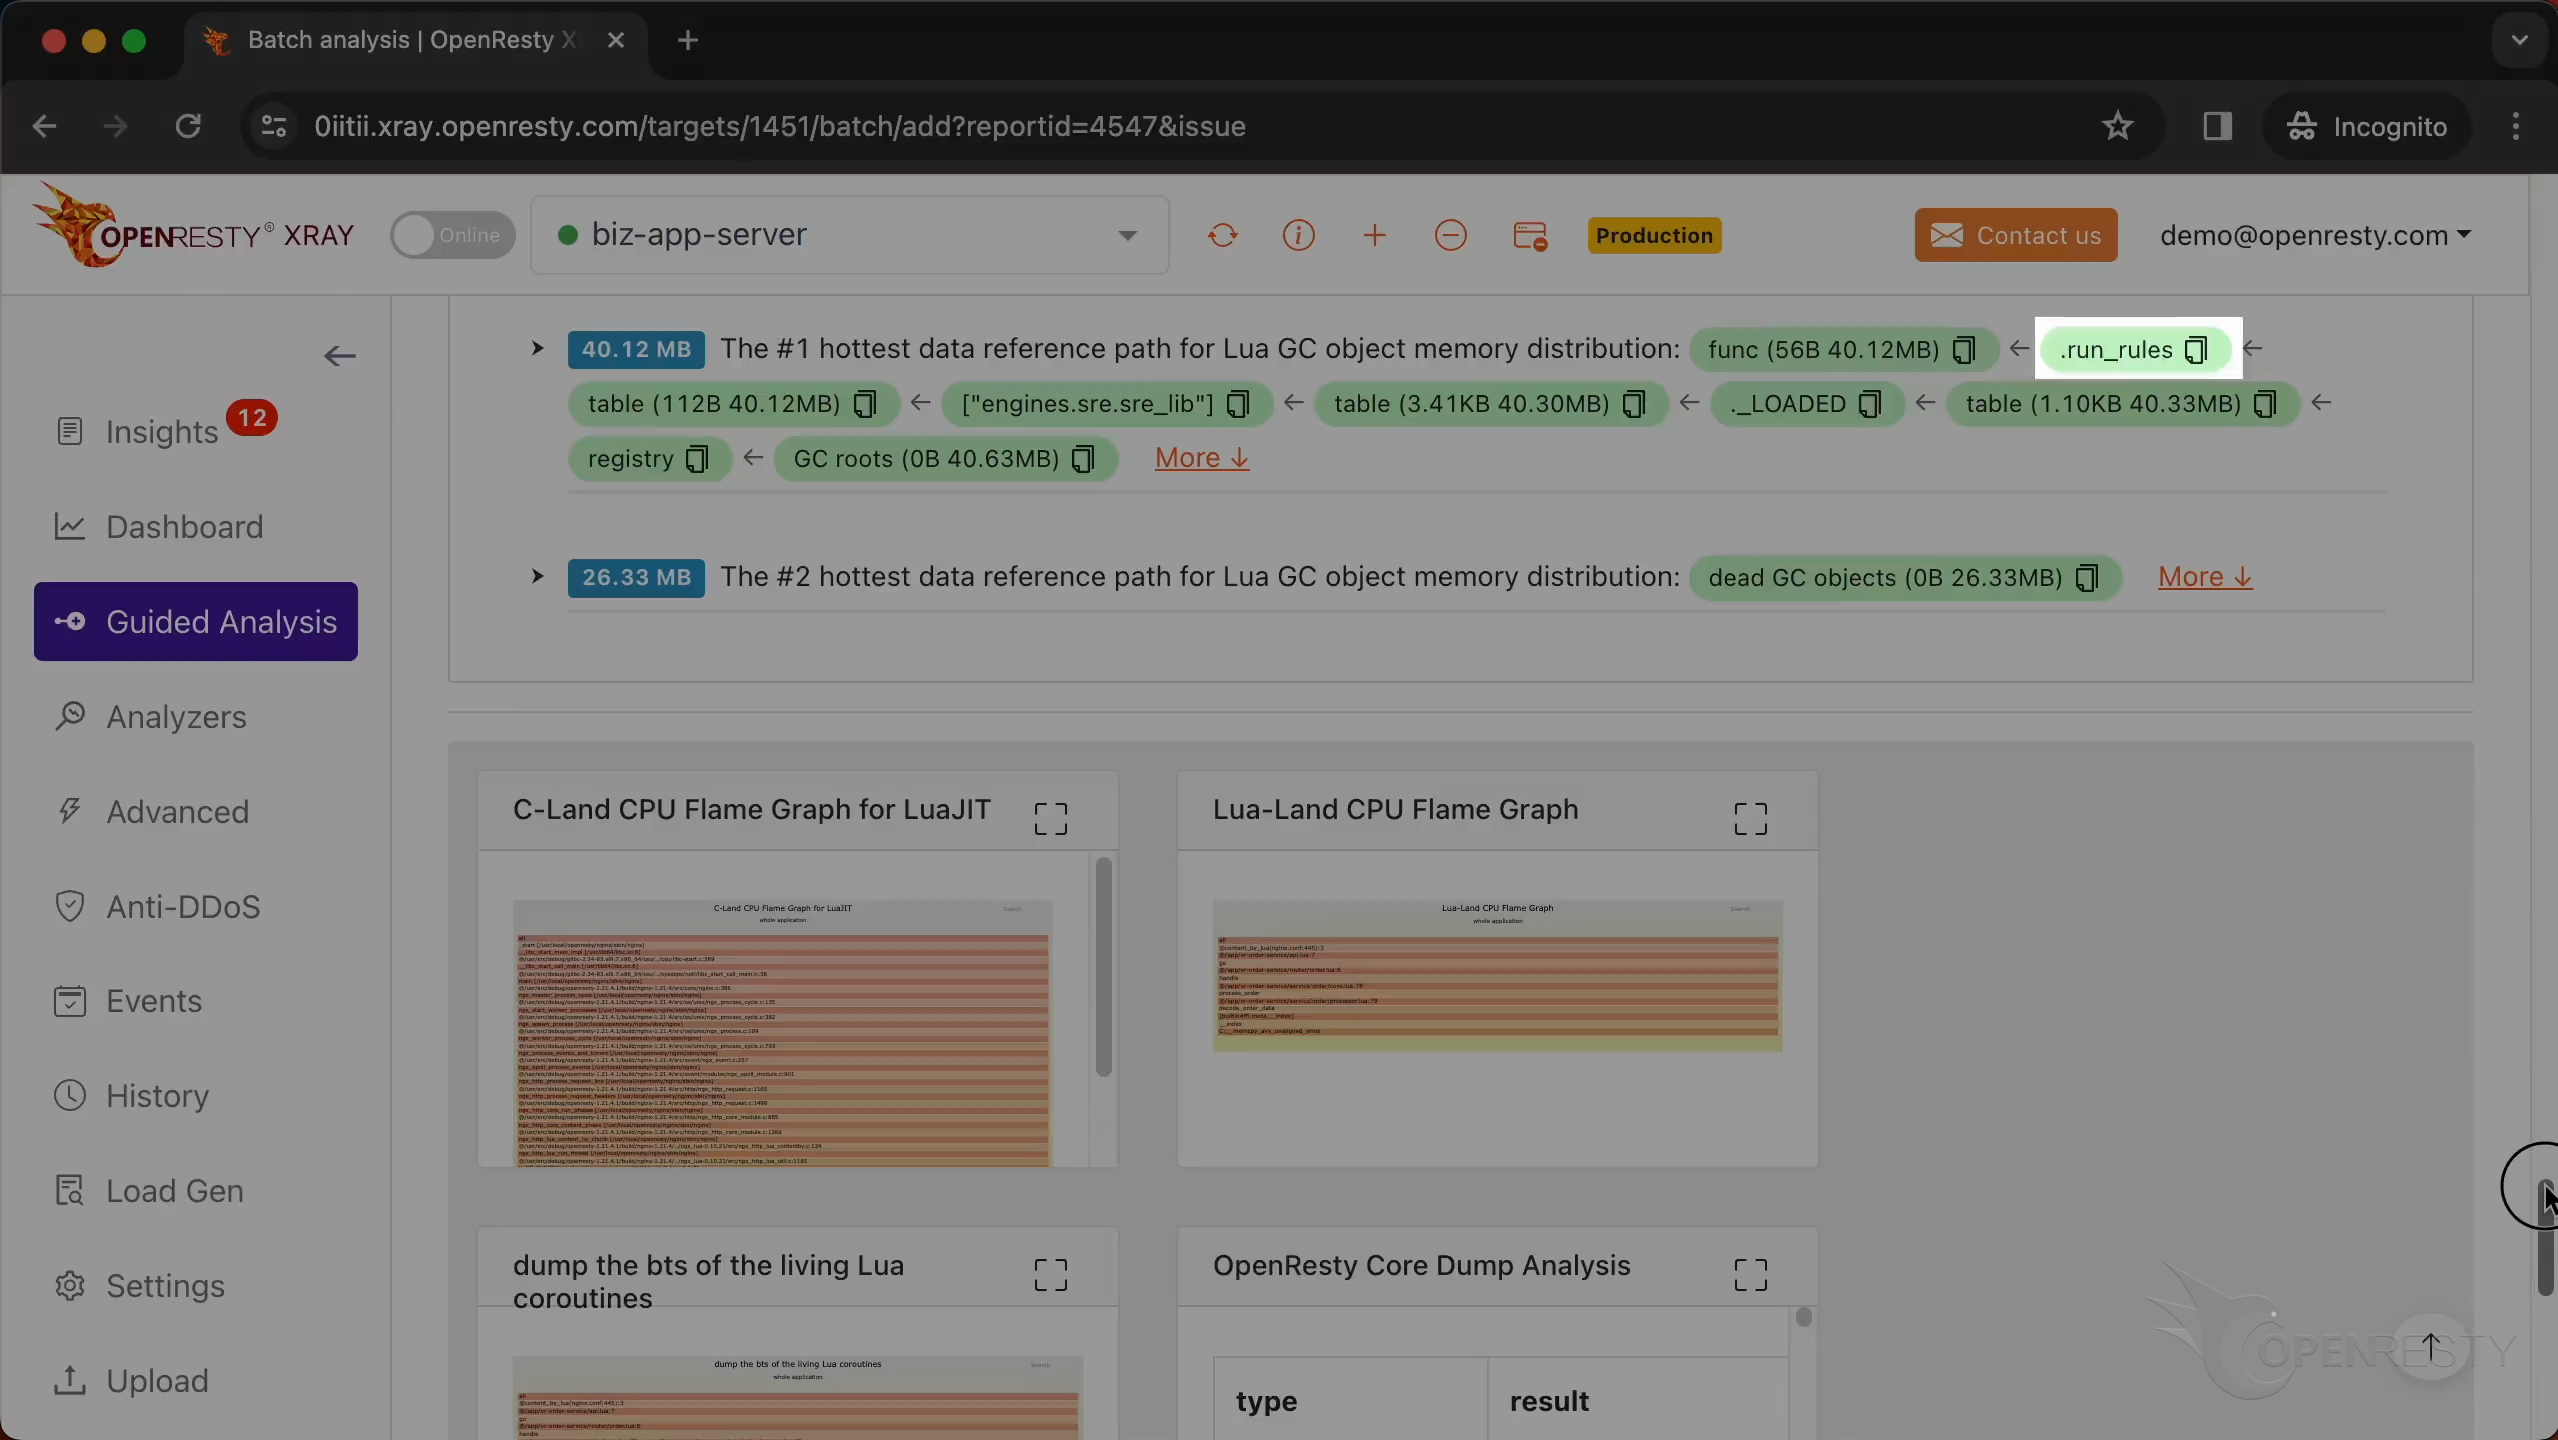
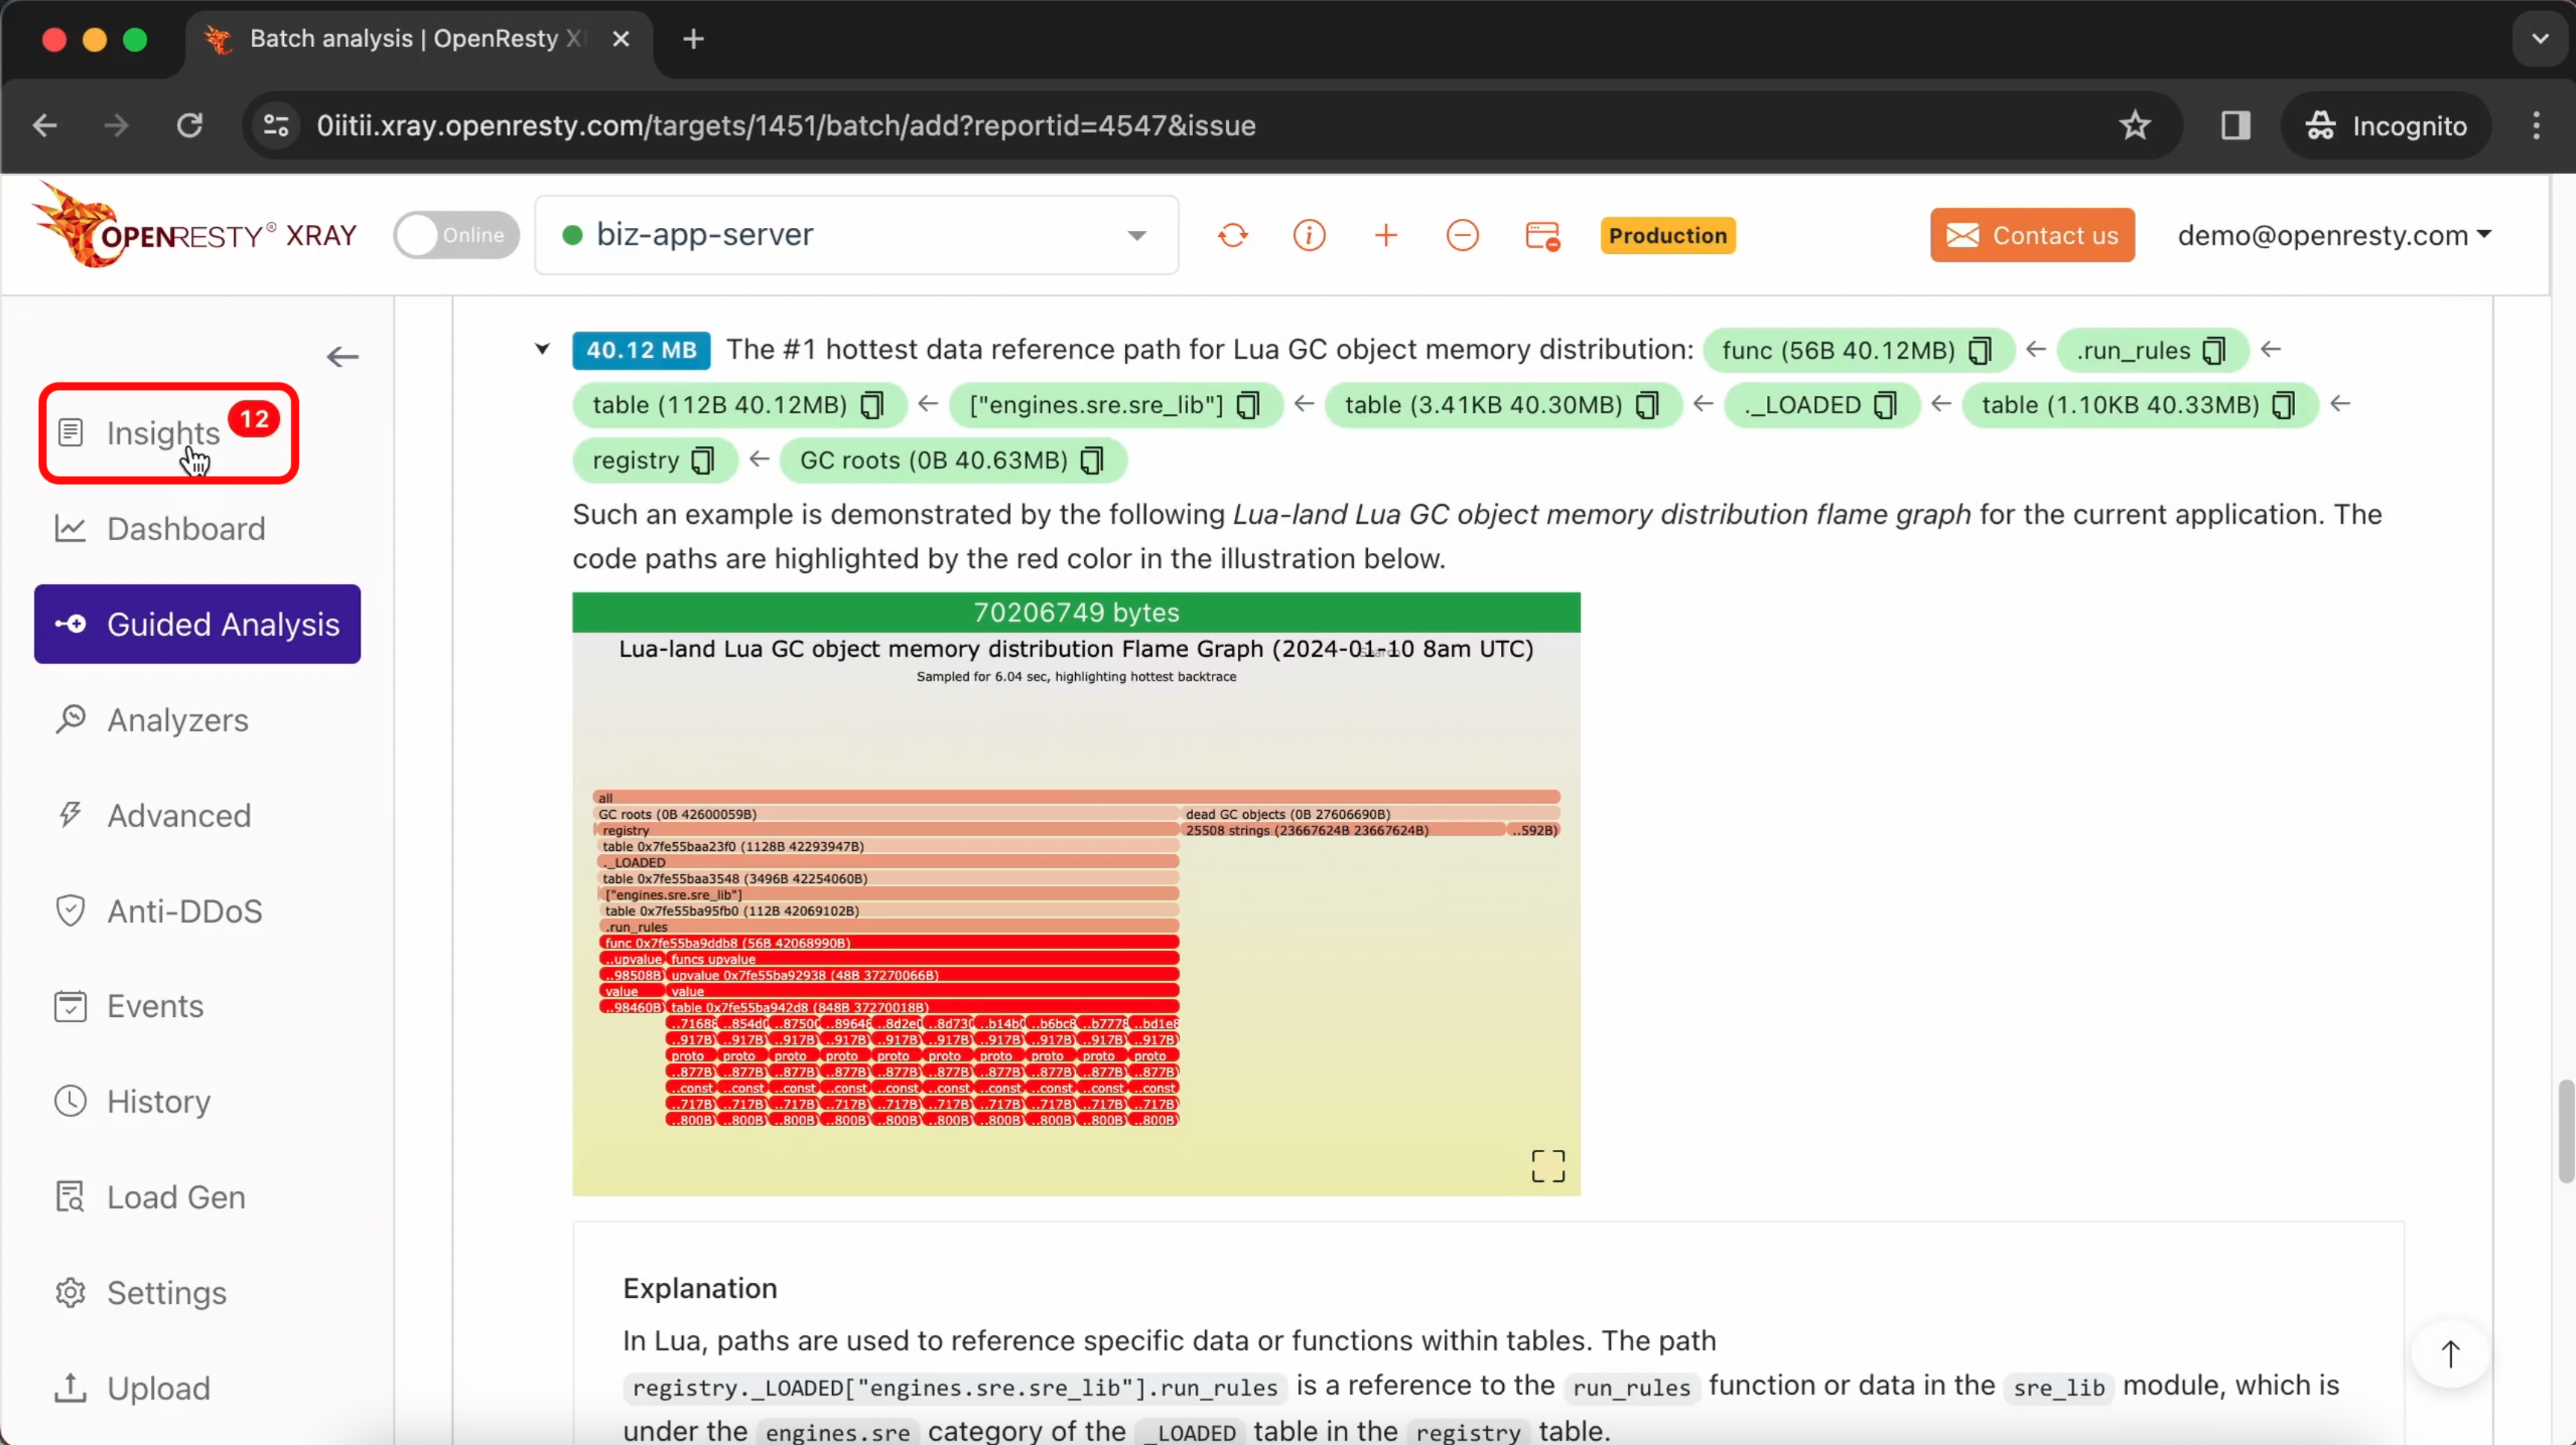
This path was automatically derived from this Lua GC object memory distribution flame graph.
Automatic analysis and reports
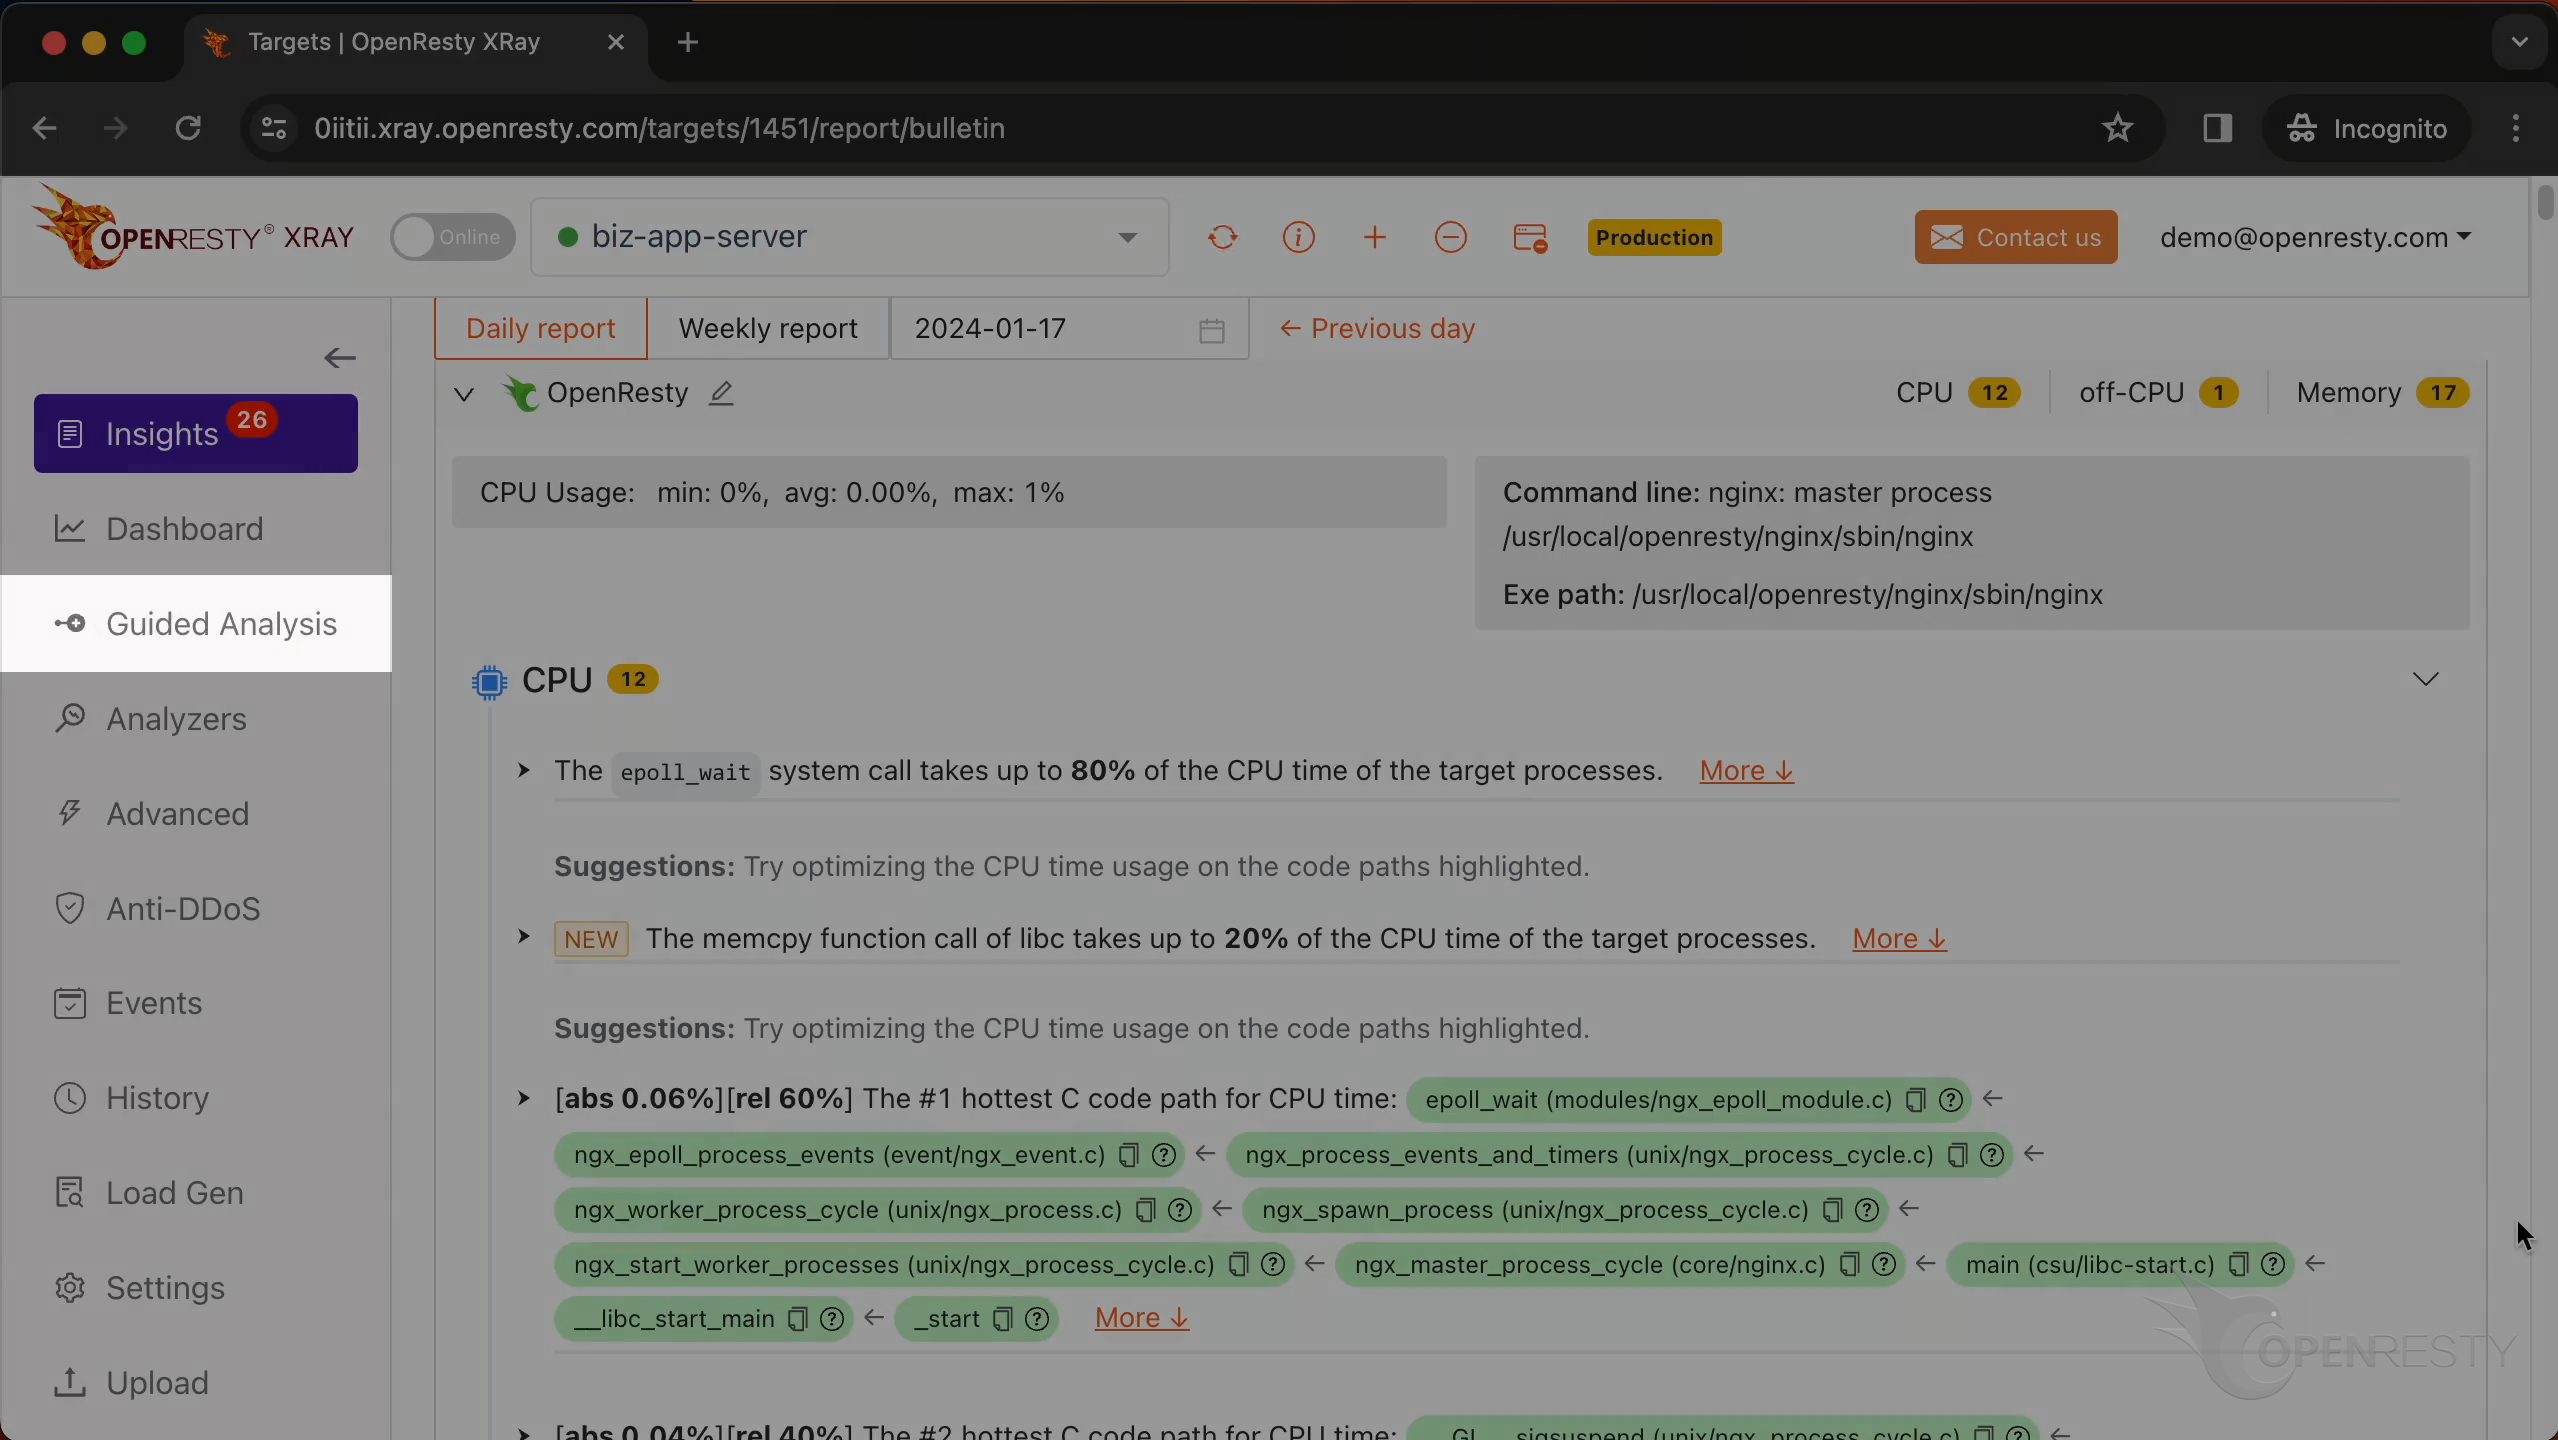
OpenResty XRay can also monitor any new core dumps generated from online applications. It can also automatically analyze the files and generate automatic analysis reports. Go to the “Insights” page.
You can find the automatic reports on the “Insights” page for daily and weekly periods.

For this reason, you don’t have to use the “Guided Analysis” feature. Guided analysis is useful for application development and demonstration purposes.
What is OpenResty XRay
OpenResty XRay is a dynamic-tracing product that automatically analyzes your running applications to troubleshoot performance problems, behavioral issues, and security vulnerabilities with actionable suggestions. Under the hood, OpenResty XRay is powered by our Y language targeting various runtimes like Stap+, eBPF+, GDB, and ODB, depending on the contexts.
If you like this tutorial, please subscribe to this blog site and/or our YouTube channel. Thank you!
About The Author
Yichun Zhang (Github handle: agentzh), is the original creator of the OpenResty® open-source project and the CEO of OpenResty Inc..
Yichun is one of the earliest advocates and leaders of “open-source technology”. He worked at many internationally renowned tech companies, such as Cloudflare, Yahoo!. He is a pioneer of “edge computing”, “dynamic tracing” and “machine coding”, with over 22 years of programming and 16 years of open source experience. Yichun is well-known in the open-source space as the project leader of OpenResty®, adopted by more than 40 million global website domains.
OpenResty Inc., the enterprise software start-up founded by Yichun in 2017, has customers from some of the biggest companies in the world. Its flagship product, OpenResty XRay, is a non-invasive profiling and troubleshooting tool that significantly enhances and utilizes dynamic tracing technology. And its OpenResty Edge product is a powerful distributed traffic management and private CDN software product.
As an avid open-source contributor, Yichun has contributed more than a million lines of code to numerous open-source projects, including Linux kernel, Nginx, LuaJIT, GDB, SystemTap, LLVM, Perl, etc. He has also authored more than 60 open-source software libraries.
Related Articles
OpenResty XRay Sep 5, 2024

OpenResty XRay Aug 12, 2024
")
OpenResty XRay Aug 4, 2024
")
OpenResty XRay Jul 26, 2024

OpenResty XRay May 24, 2024
")


")
")

")