Automatic Core Dump Analysis (using OpenResty XRay)
Automatic core dump analysis hands a crashed process’s core file to a tool that reconstructs what it was doing at the moment of the crash — instead of you digging through it by hand in GDB. OpenResty XRay does this for crashed OpenResty/Nginx applications: point it at the core file and it returns a full report — the C and Lua backtraces, the exact crashing source line, Lua coroutine analysis, Lua GC object reference graphs, libc allocator analysis, and the concurrent HTTP requests in flight — no manual GDB required. For the full step-by-step walkthrough, watch the video at the top of this post.
Locate the OpenResty/Nginx core dump file
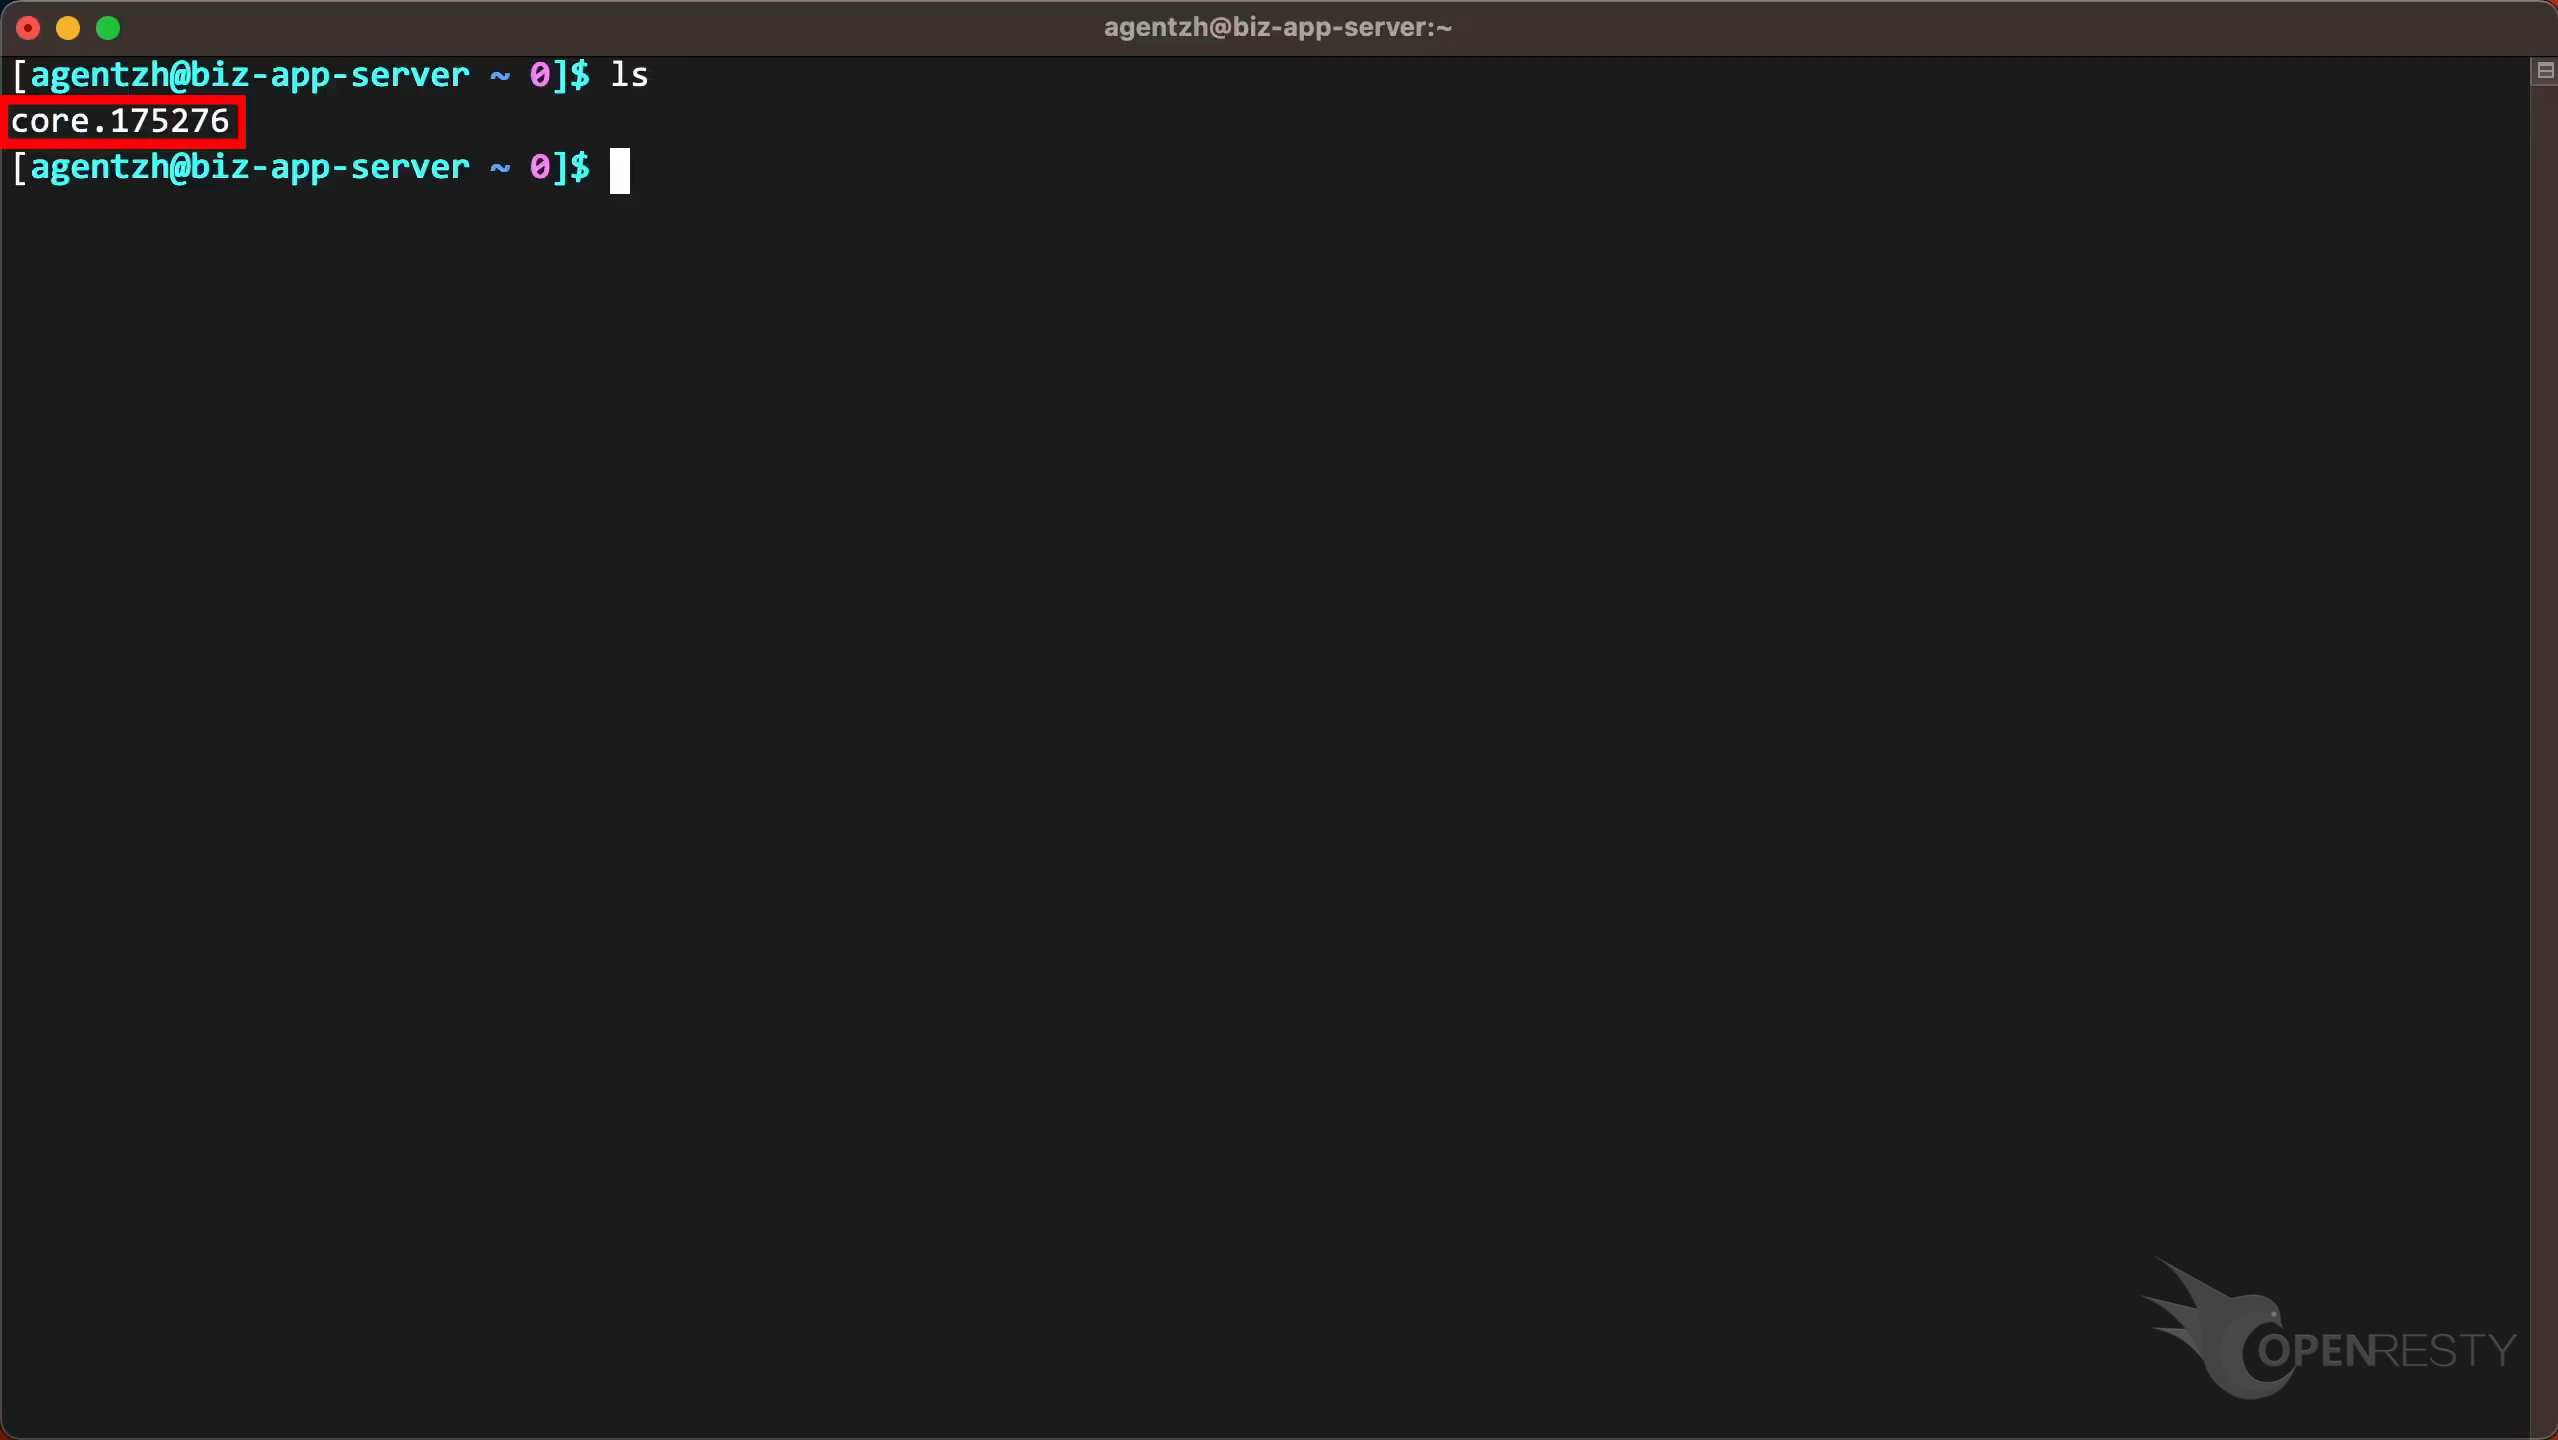
When a worker process of an OpenResty or Nginx application crashes, the Linux kernel writes a core dump file. On the crashed server here, the worker left a core.175276 file in the user’s home directory — an ls finds it, and readlink -f gives its absolute path. Copy that path; OpenResty XRay analyzes the file in place, so there is no need to move it or match libraries by hand.
Start guided core dump analysis in OpenResty XRay
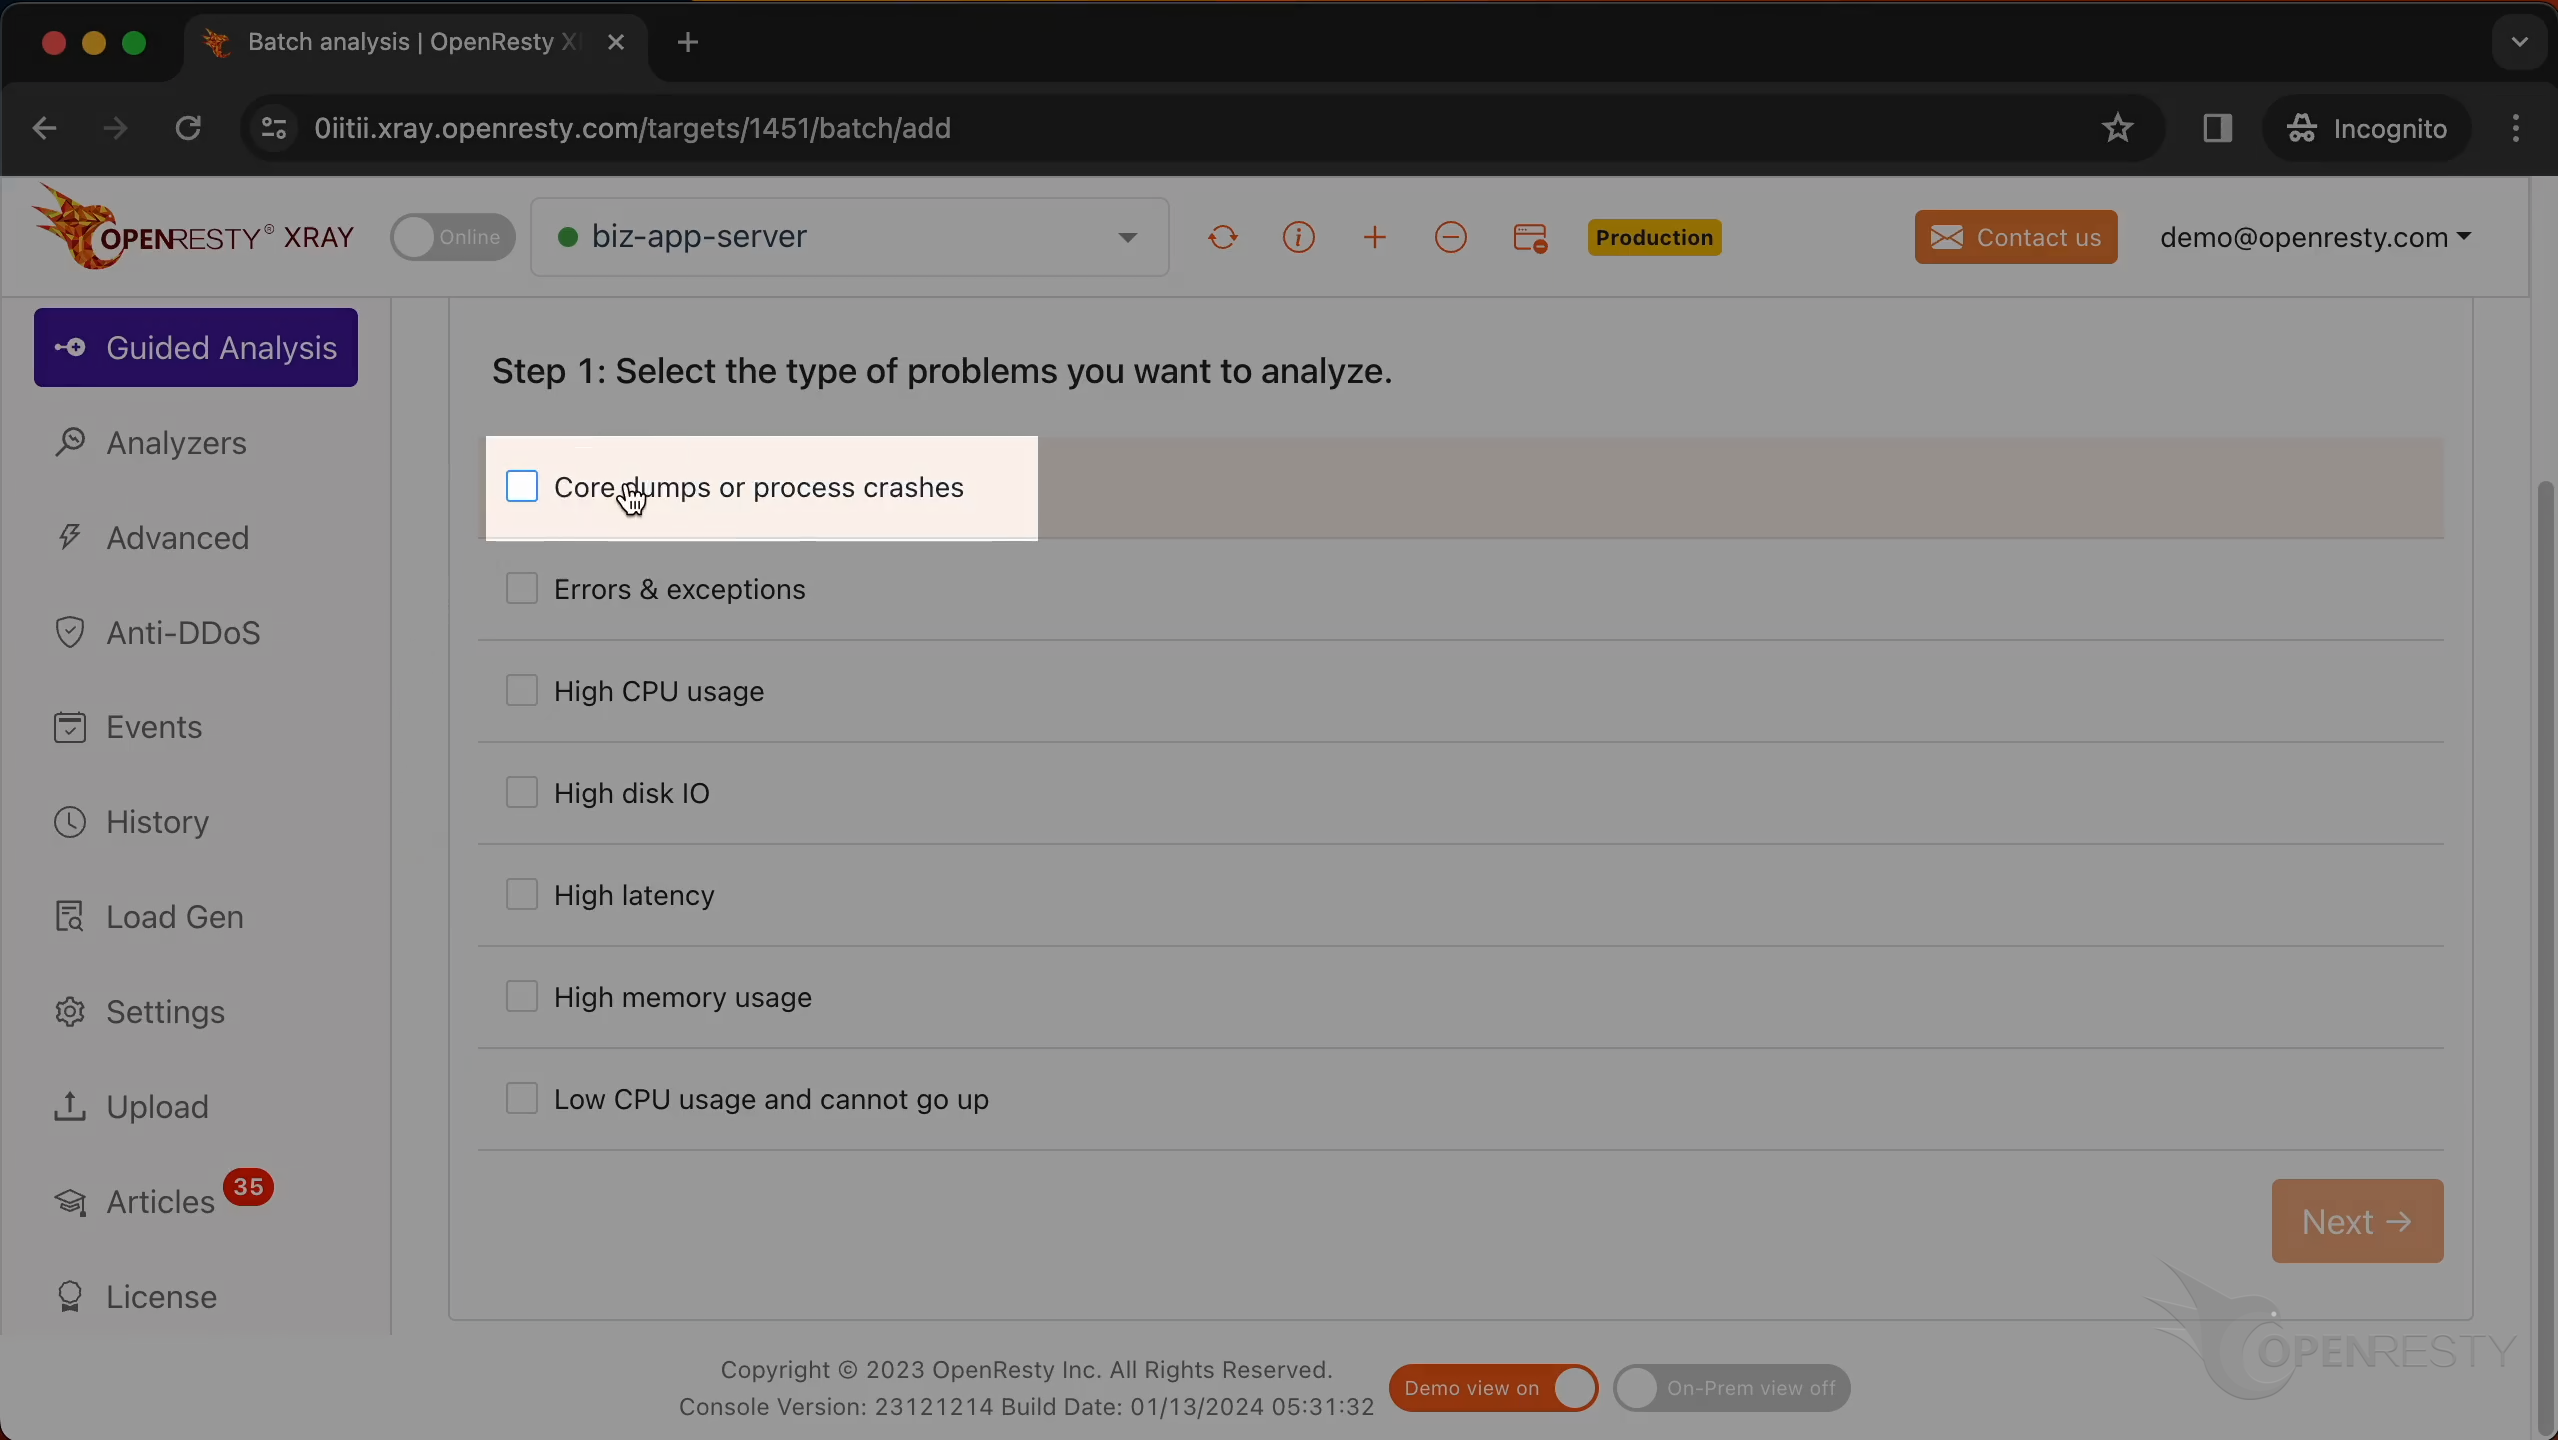
Open the OpenResty XRay web console, select the target machine (here biz-app-server), and open the Guided Analysis page. Choose Core dumps or process crashes as the problem type.
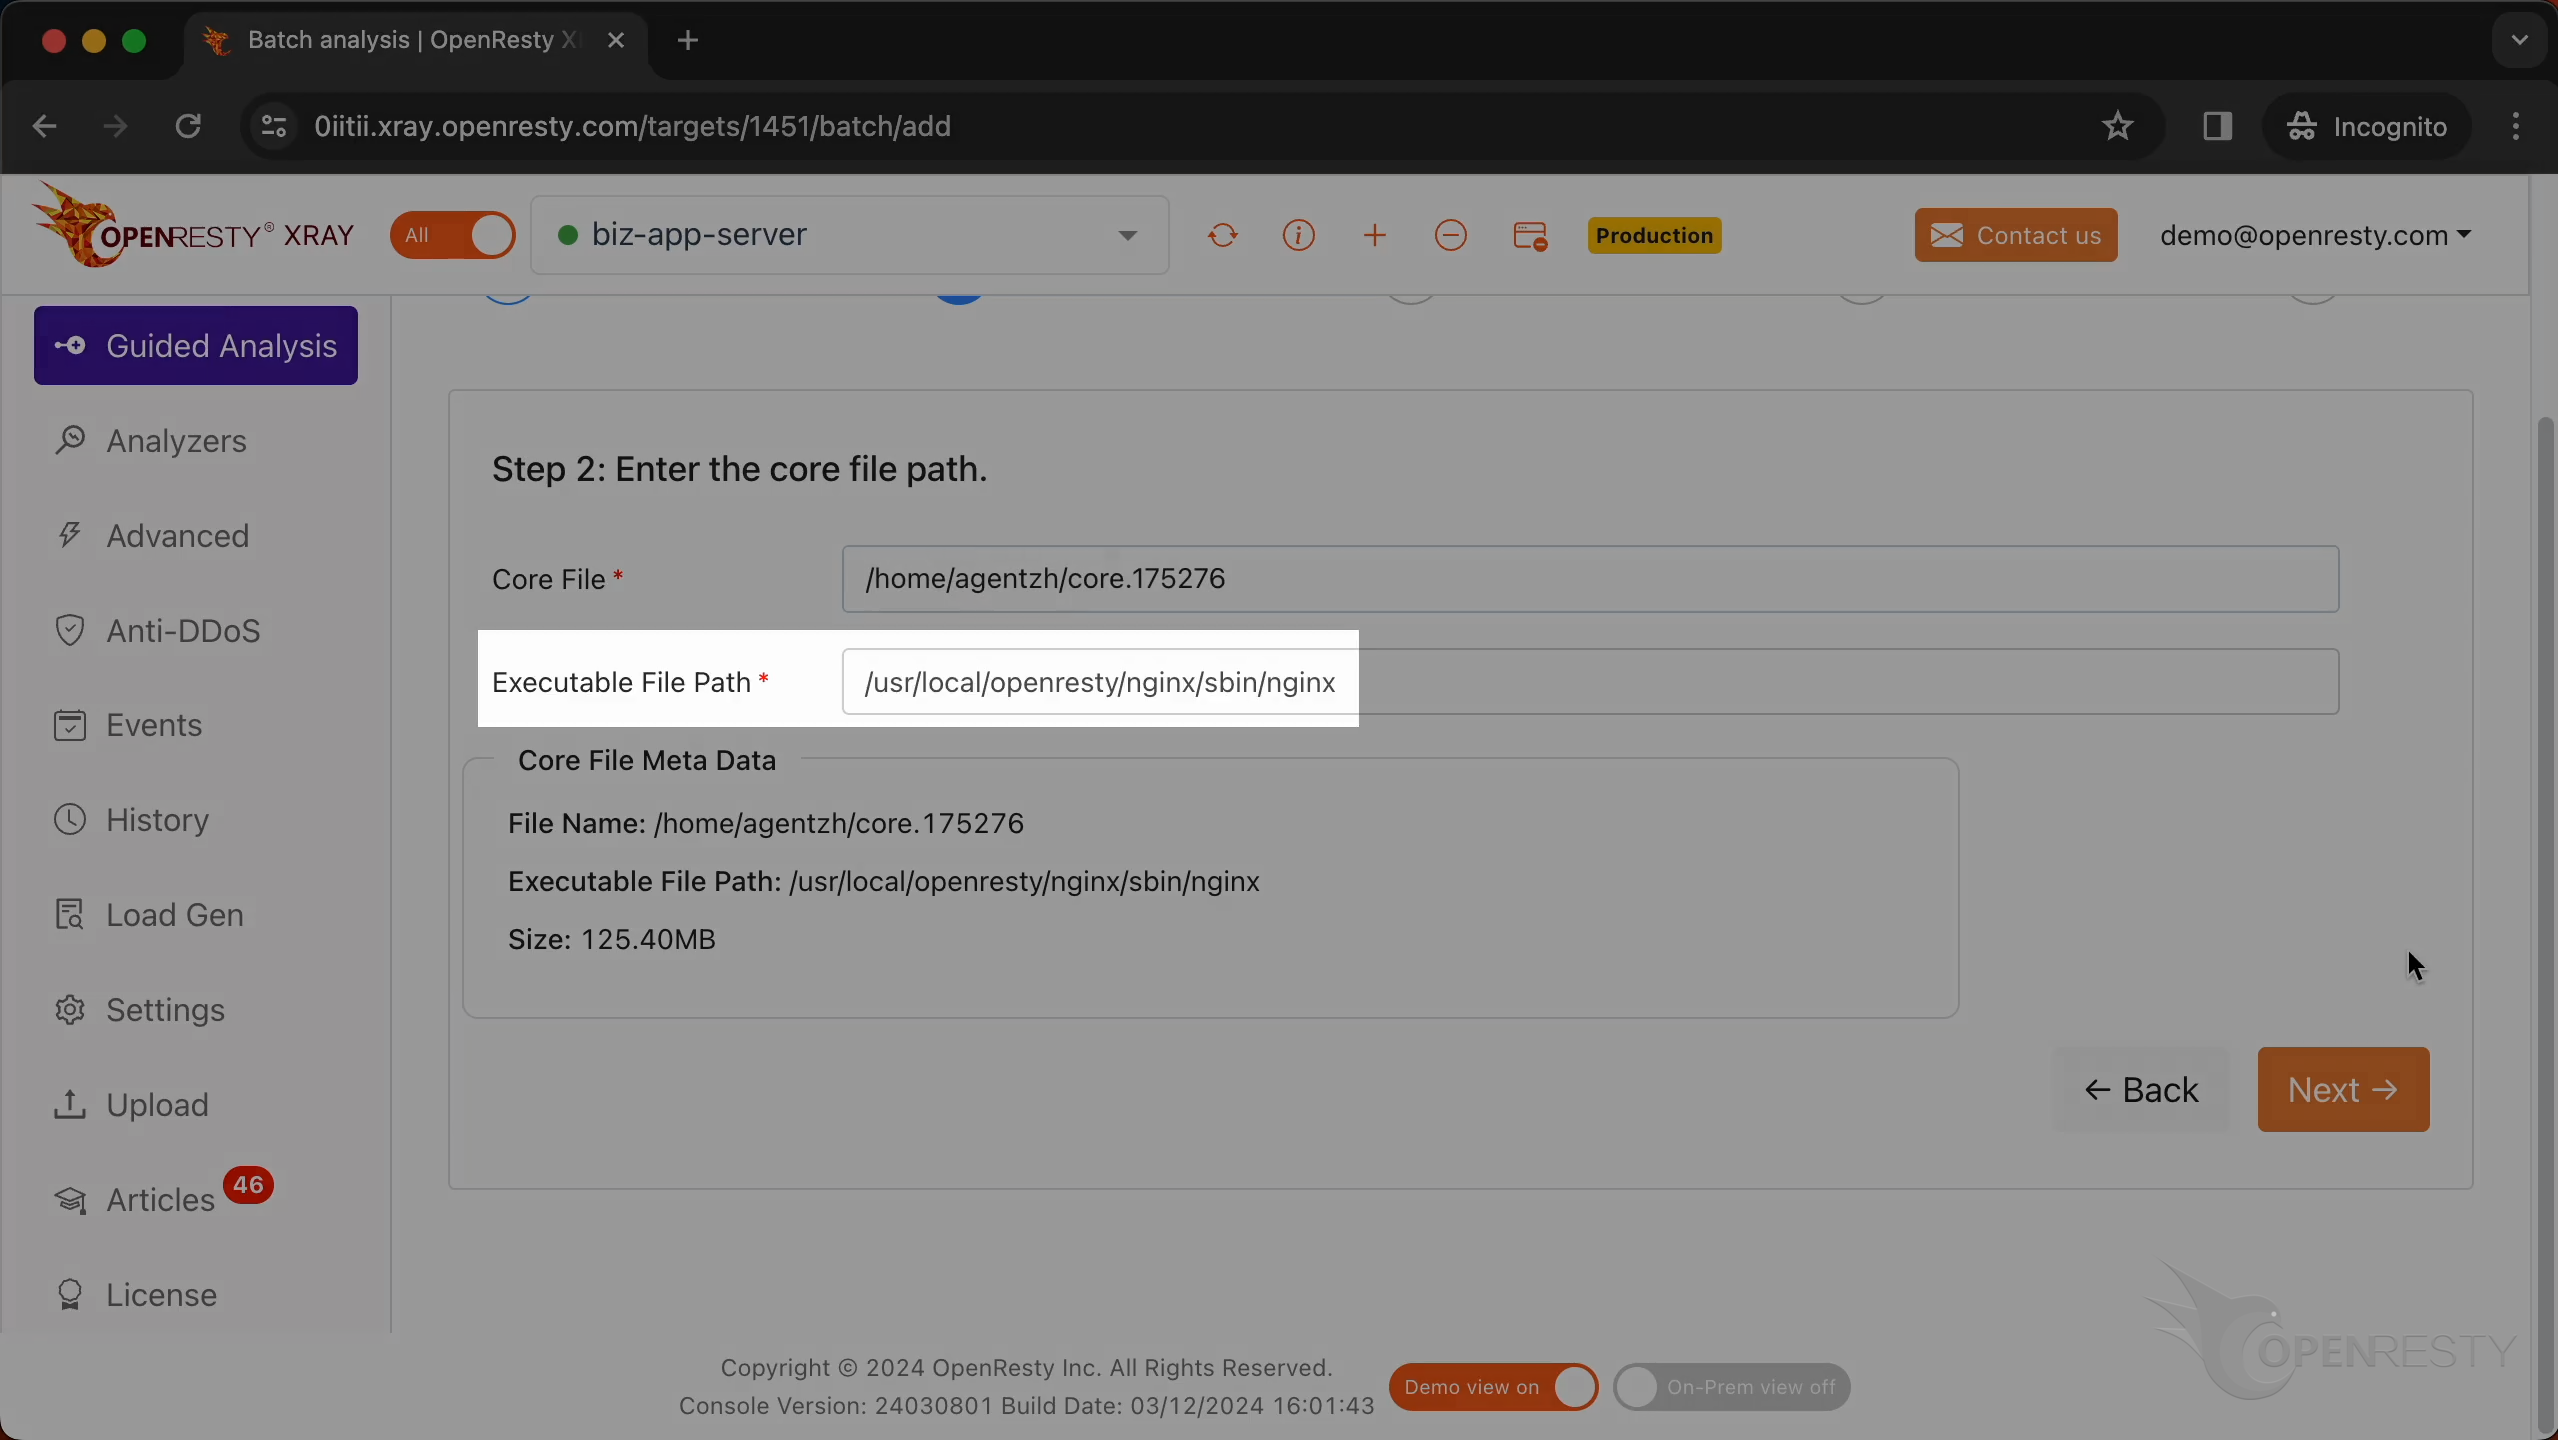
Paste the core file path. XRay reads the core dump, automatically extracts the executable path (/usr/local/openresty/nginx/sbin/nginx) and the application type (OpenResty), and starts analyzing. If the binary is stripped and its debug symbols are missing, XRay first rebuilds the missing debug symbols automatically — no nginx-dbg package or recompilation needed — so the crash report below still resolves to real function names and source lines.
Read the crash report: signal, registers, and C backtrace
The report opens with the execution context. The worker was terminated by the SEGV signal — short for “Segmentation Violation”, which usually indicates an illegal memory access.
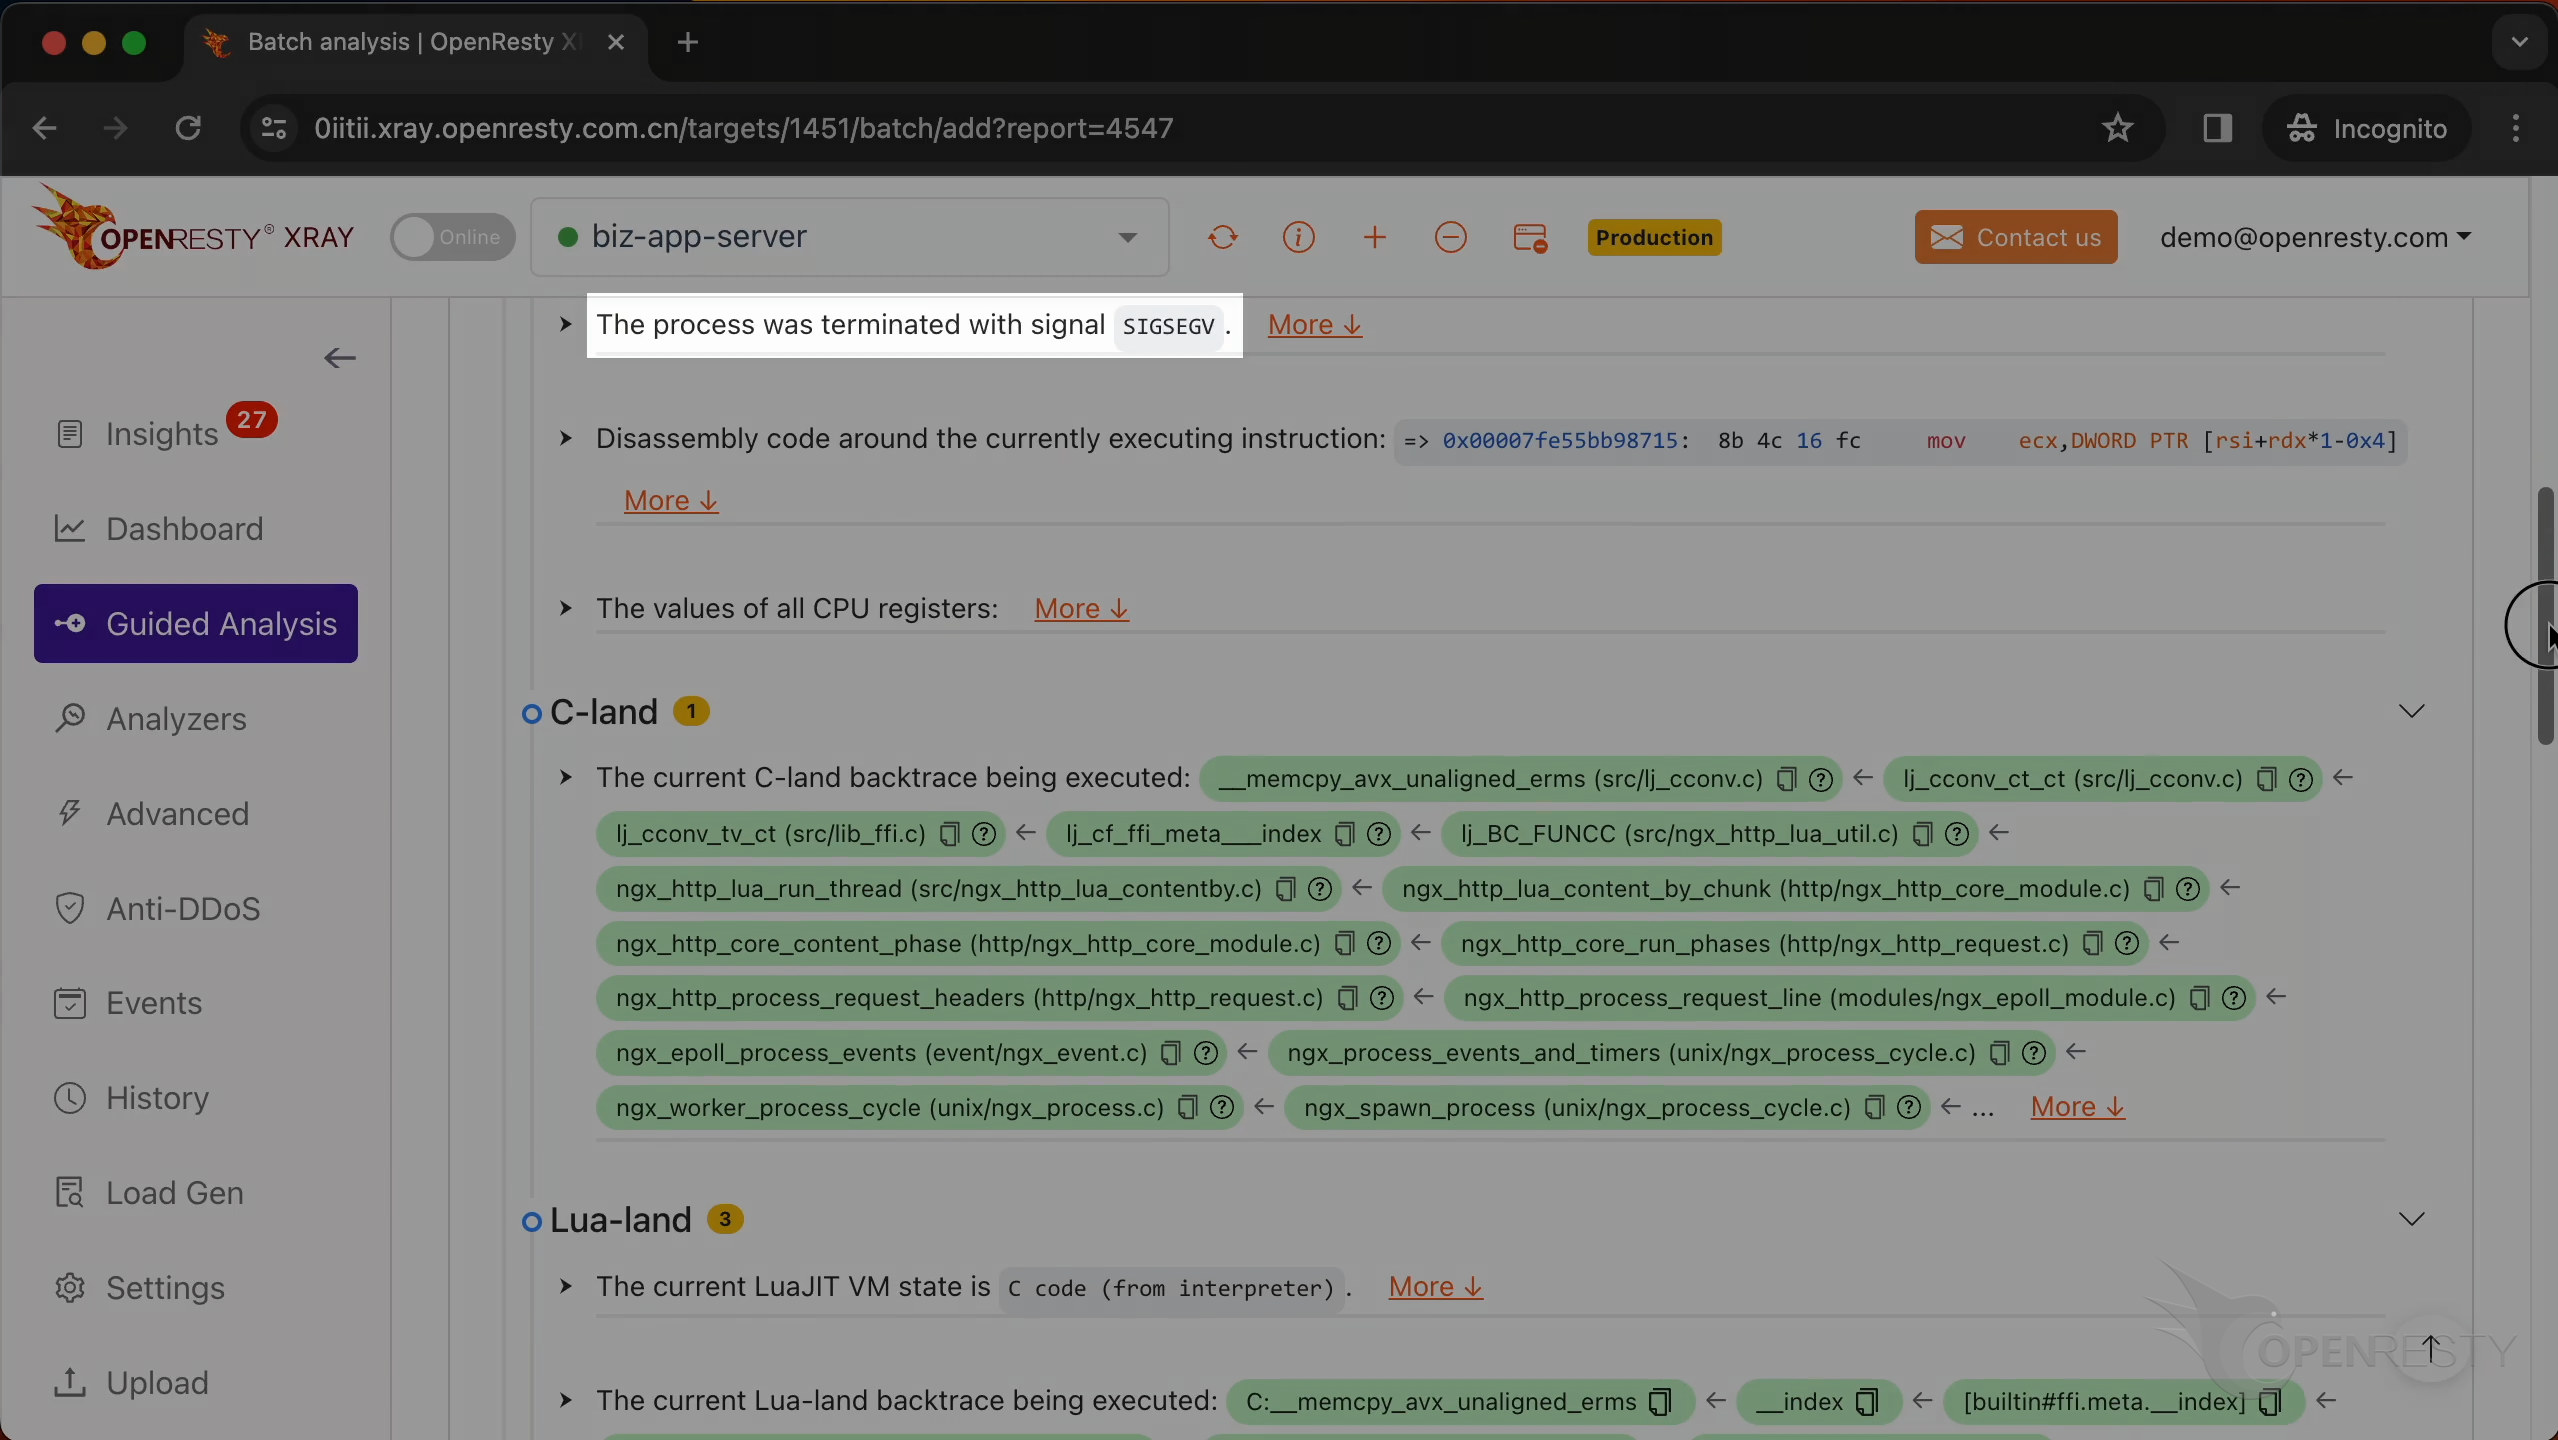
At the machine-code level, XRay marks the exact faulting instruction — mov ecx, DWORD PTR [rsi+rdx*1-0x4] — with a red arrow.
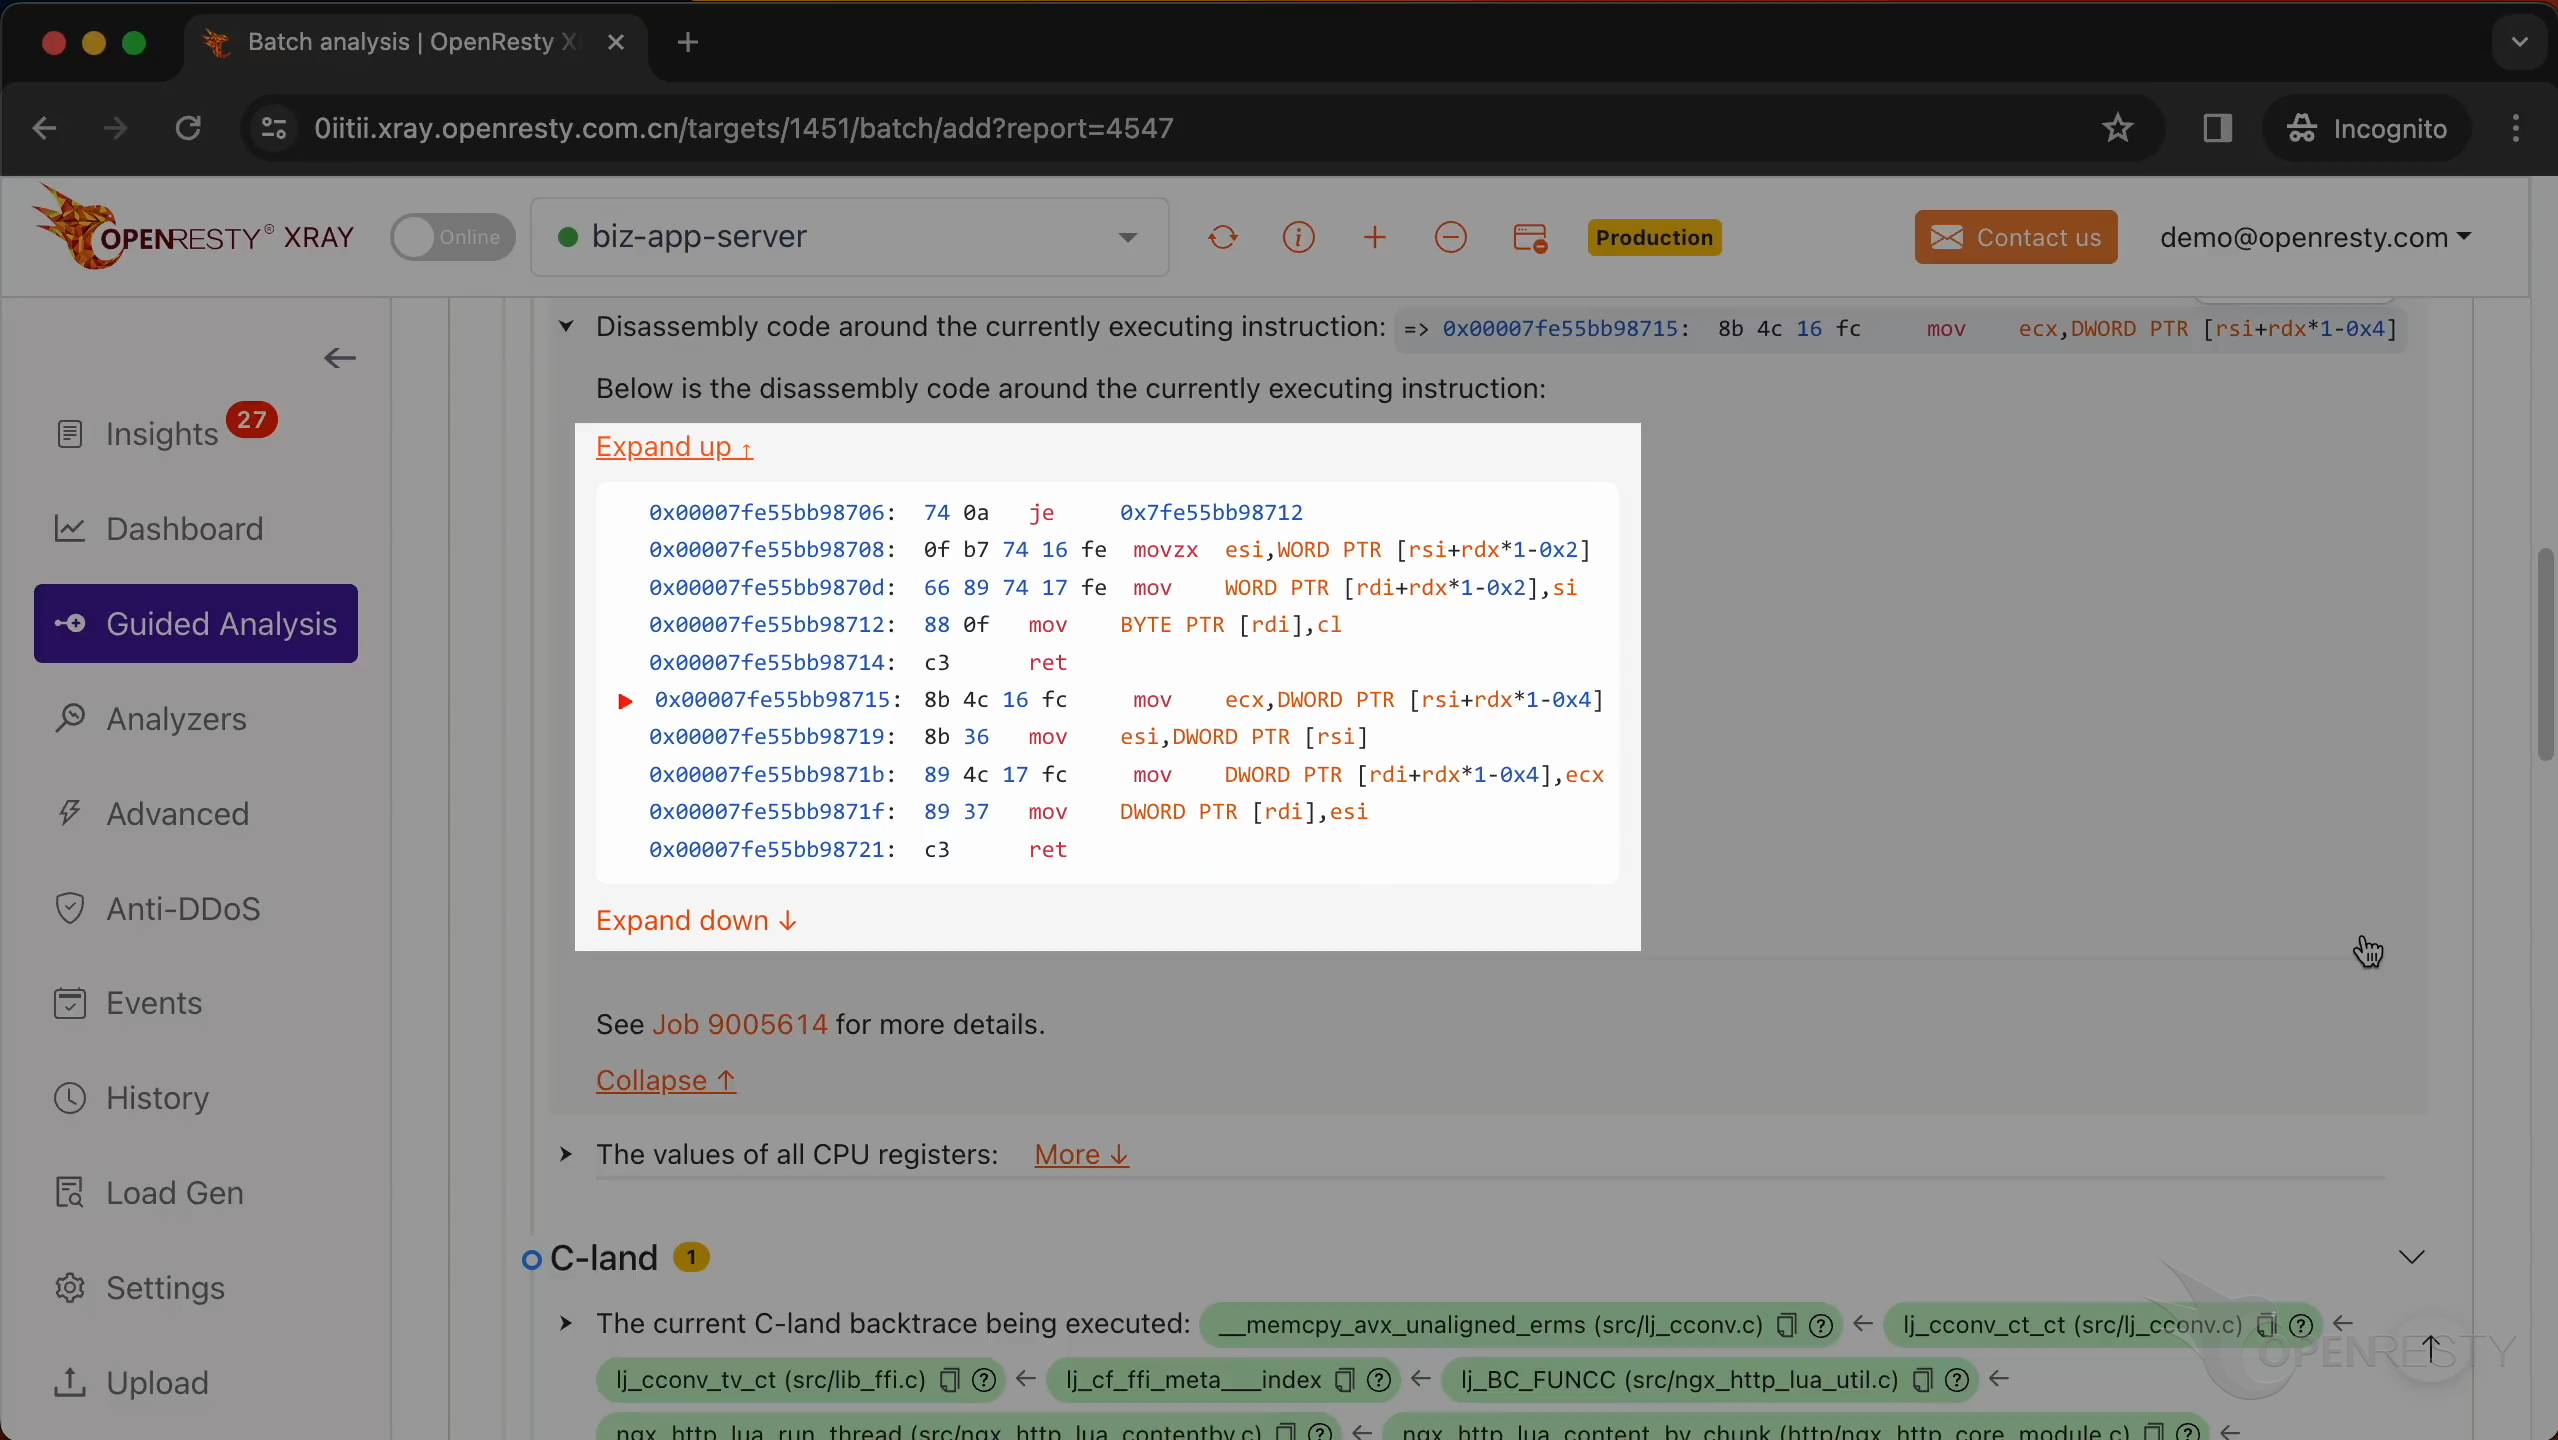
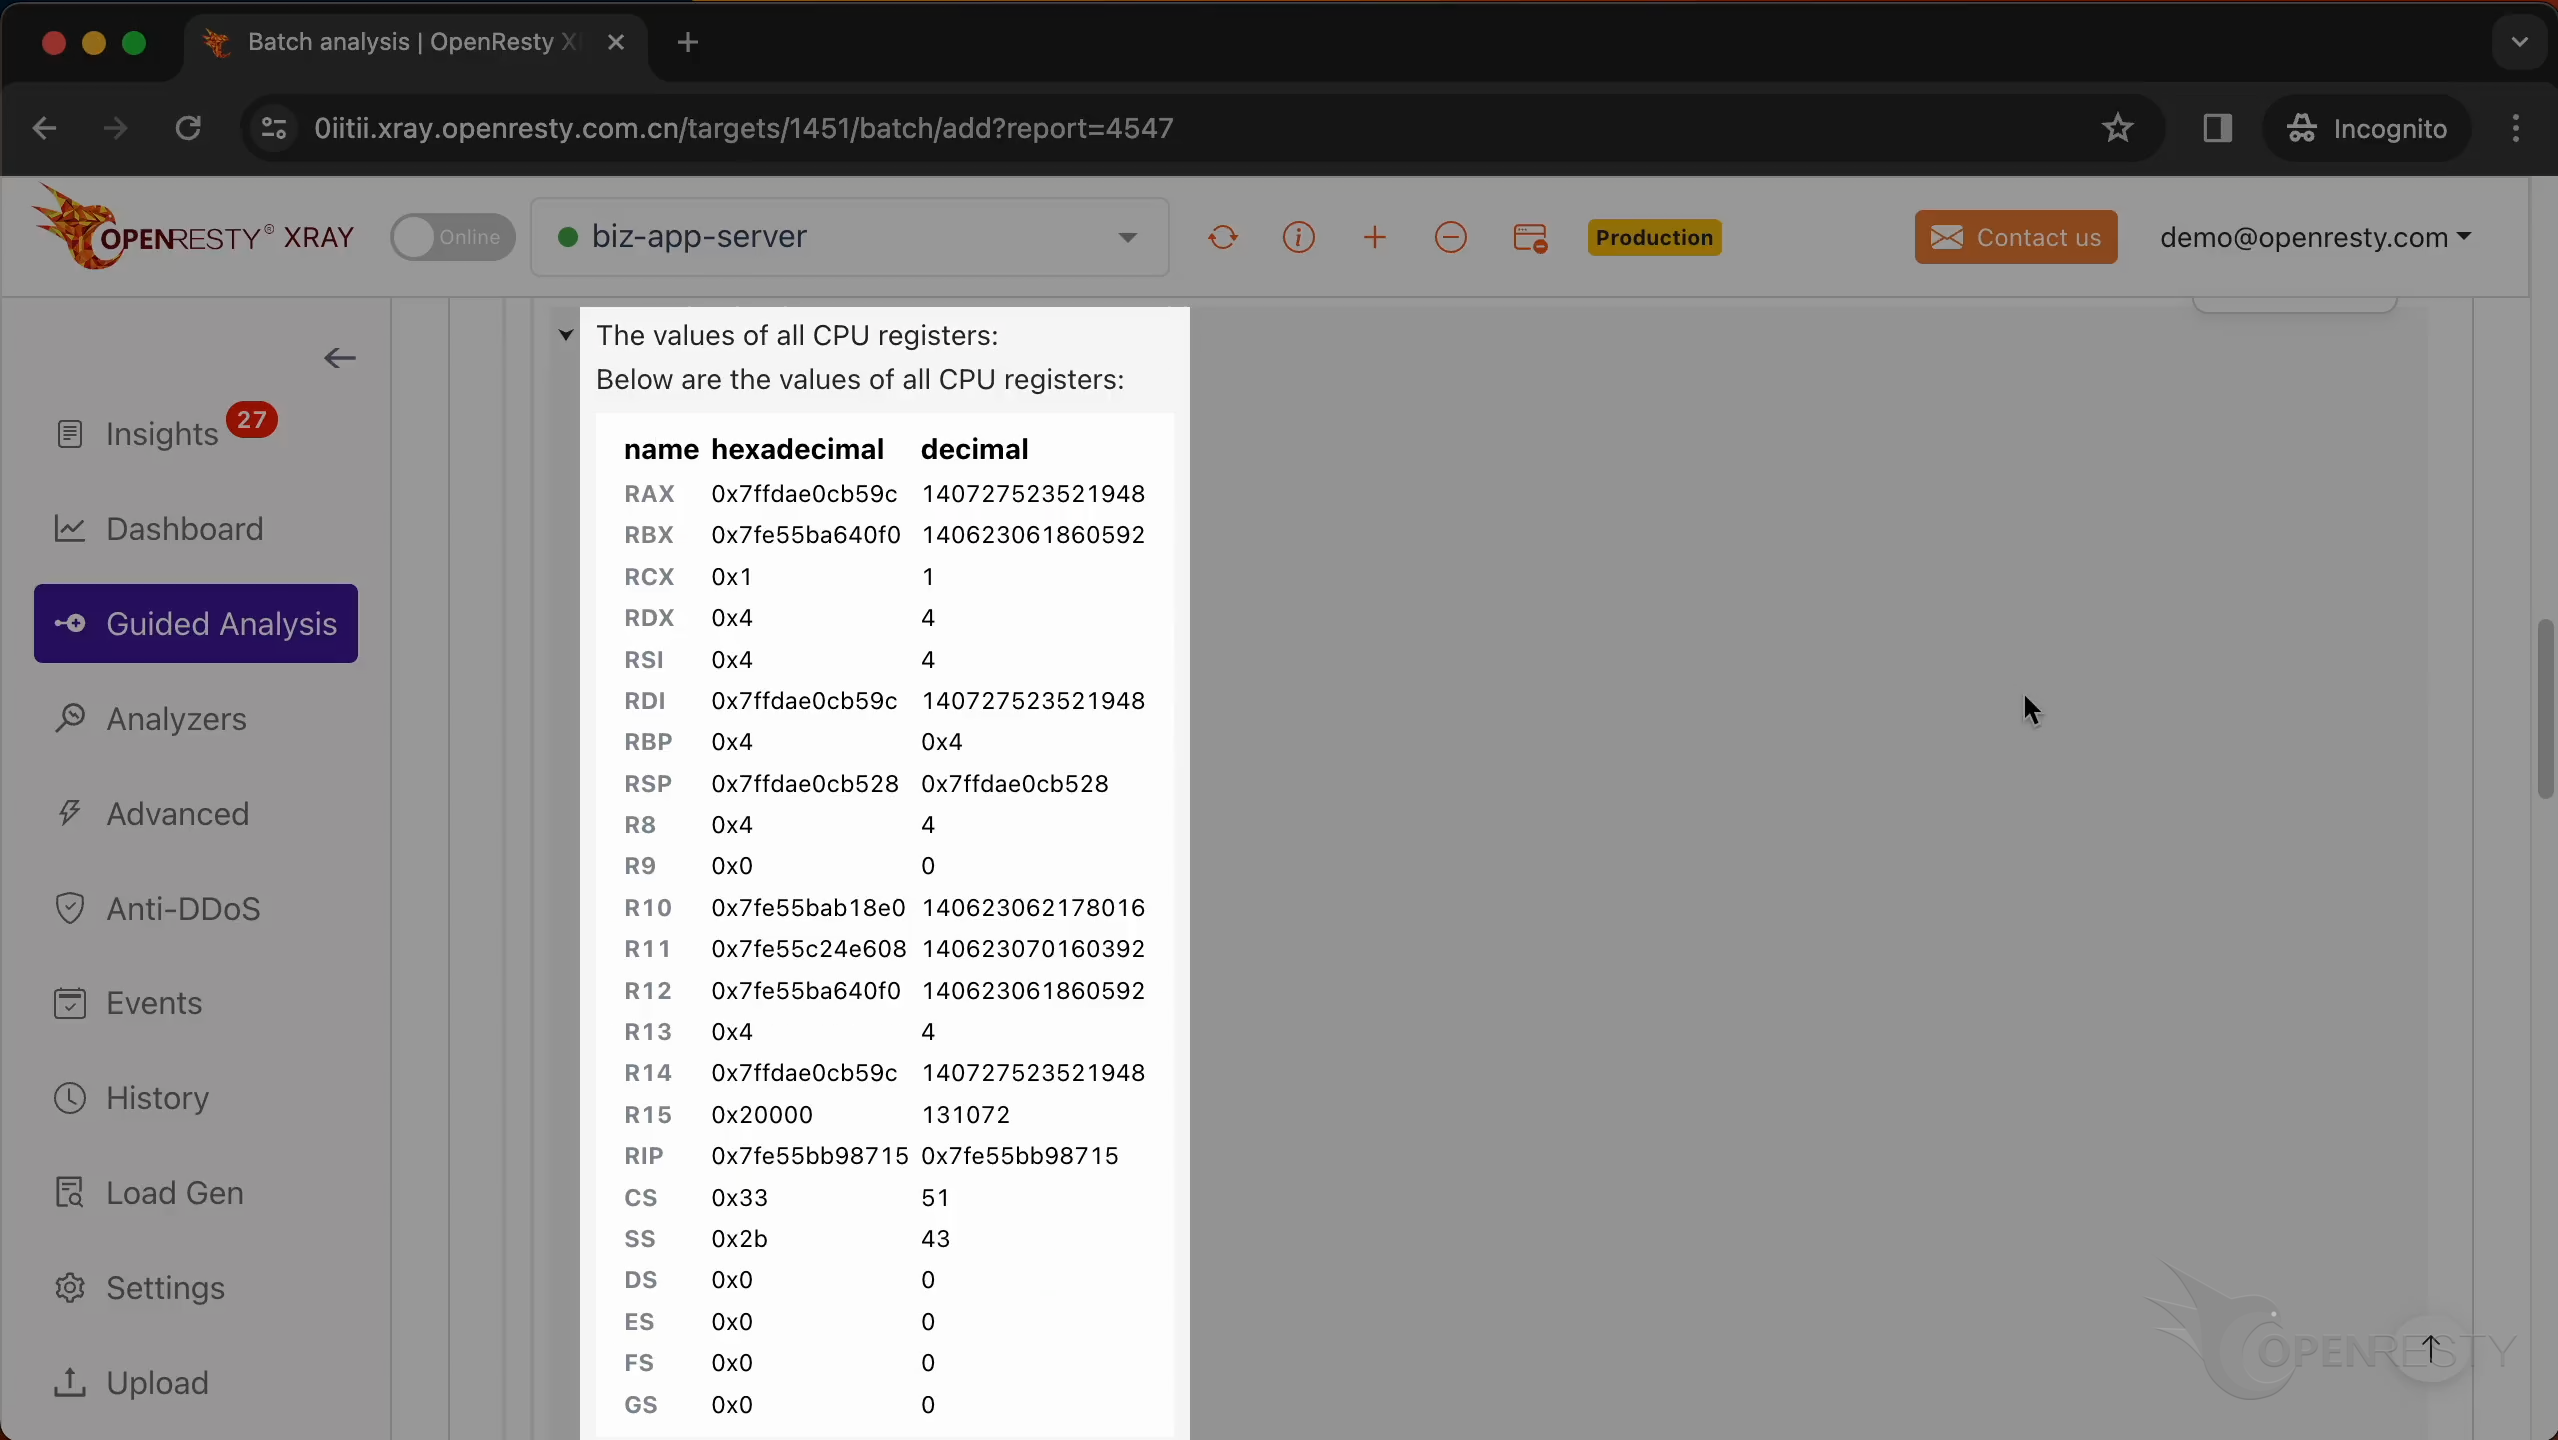
XRay also captures every CPU register at the moment of the crash. Both rsi and rdx hold 0x4, so the instruction’s source address [rsi+rdx*1-0x4] works out to 0x4 — an all-but-null address, the classic fingerprint of a null-pointer dereference.
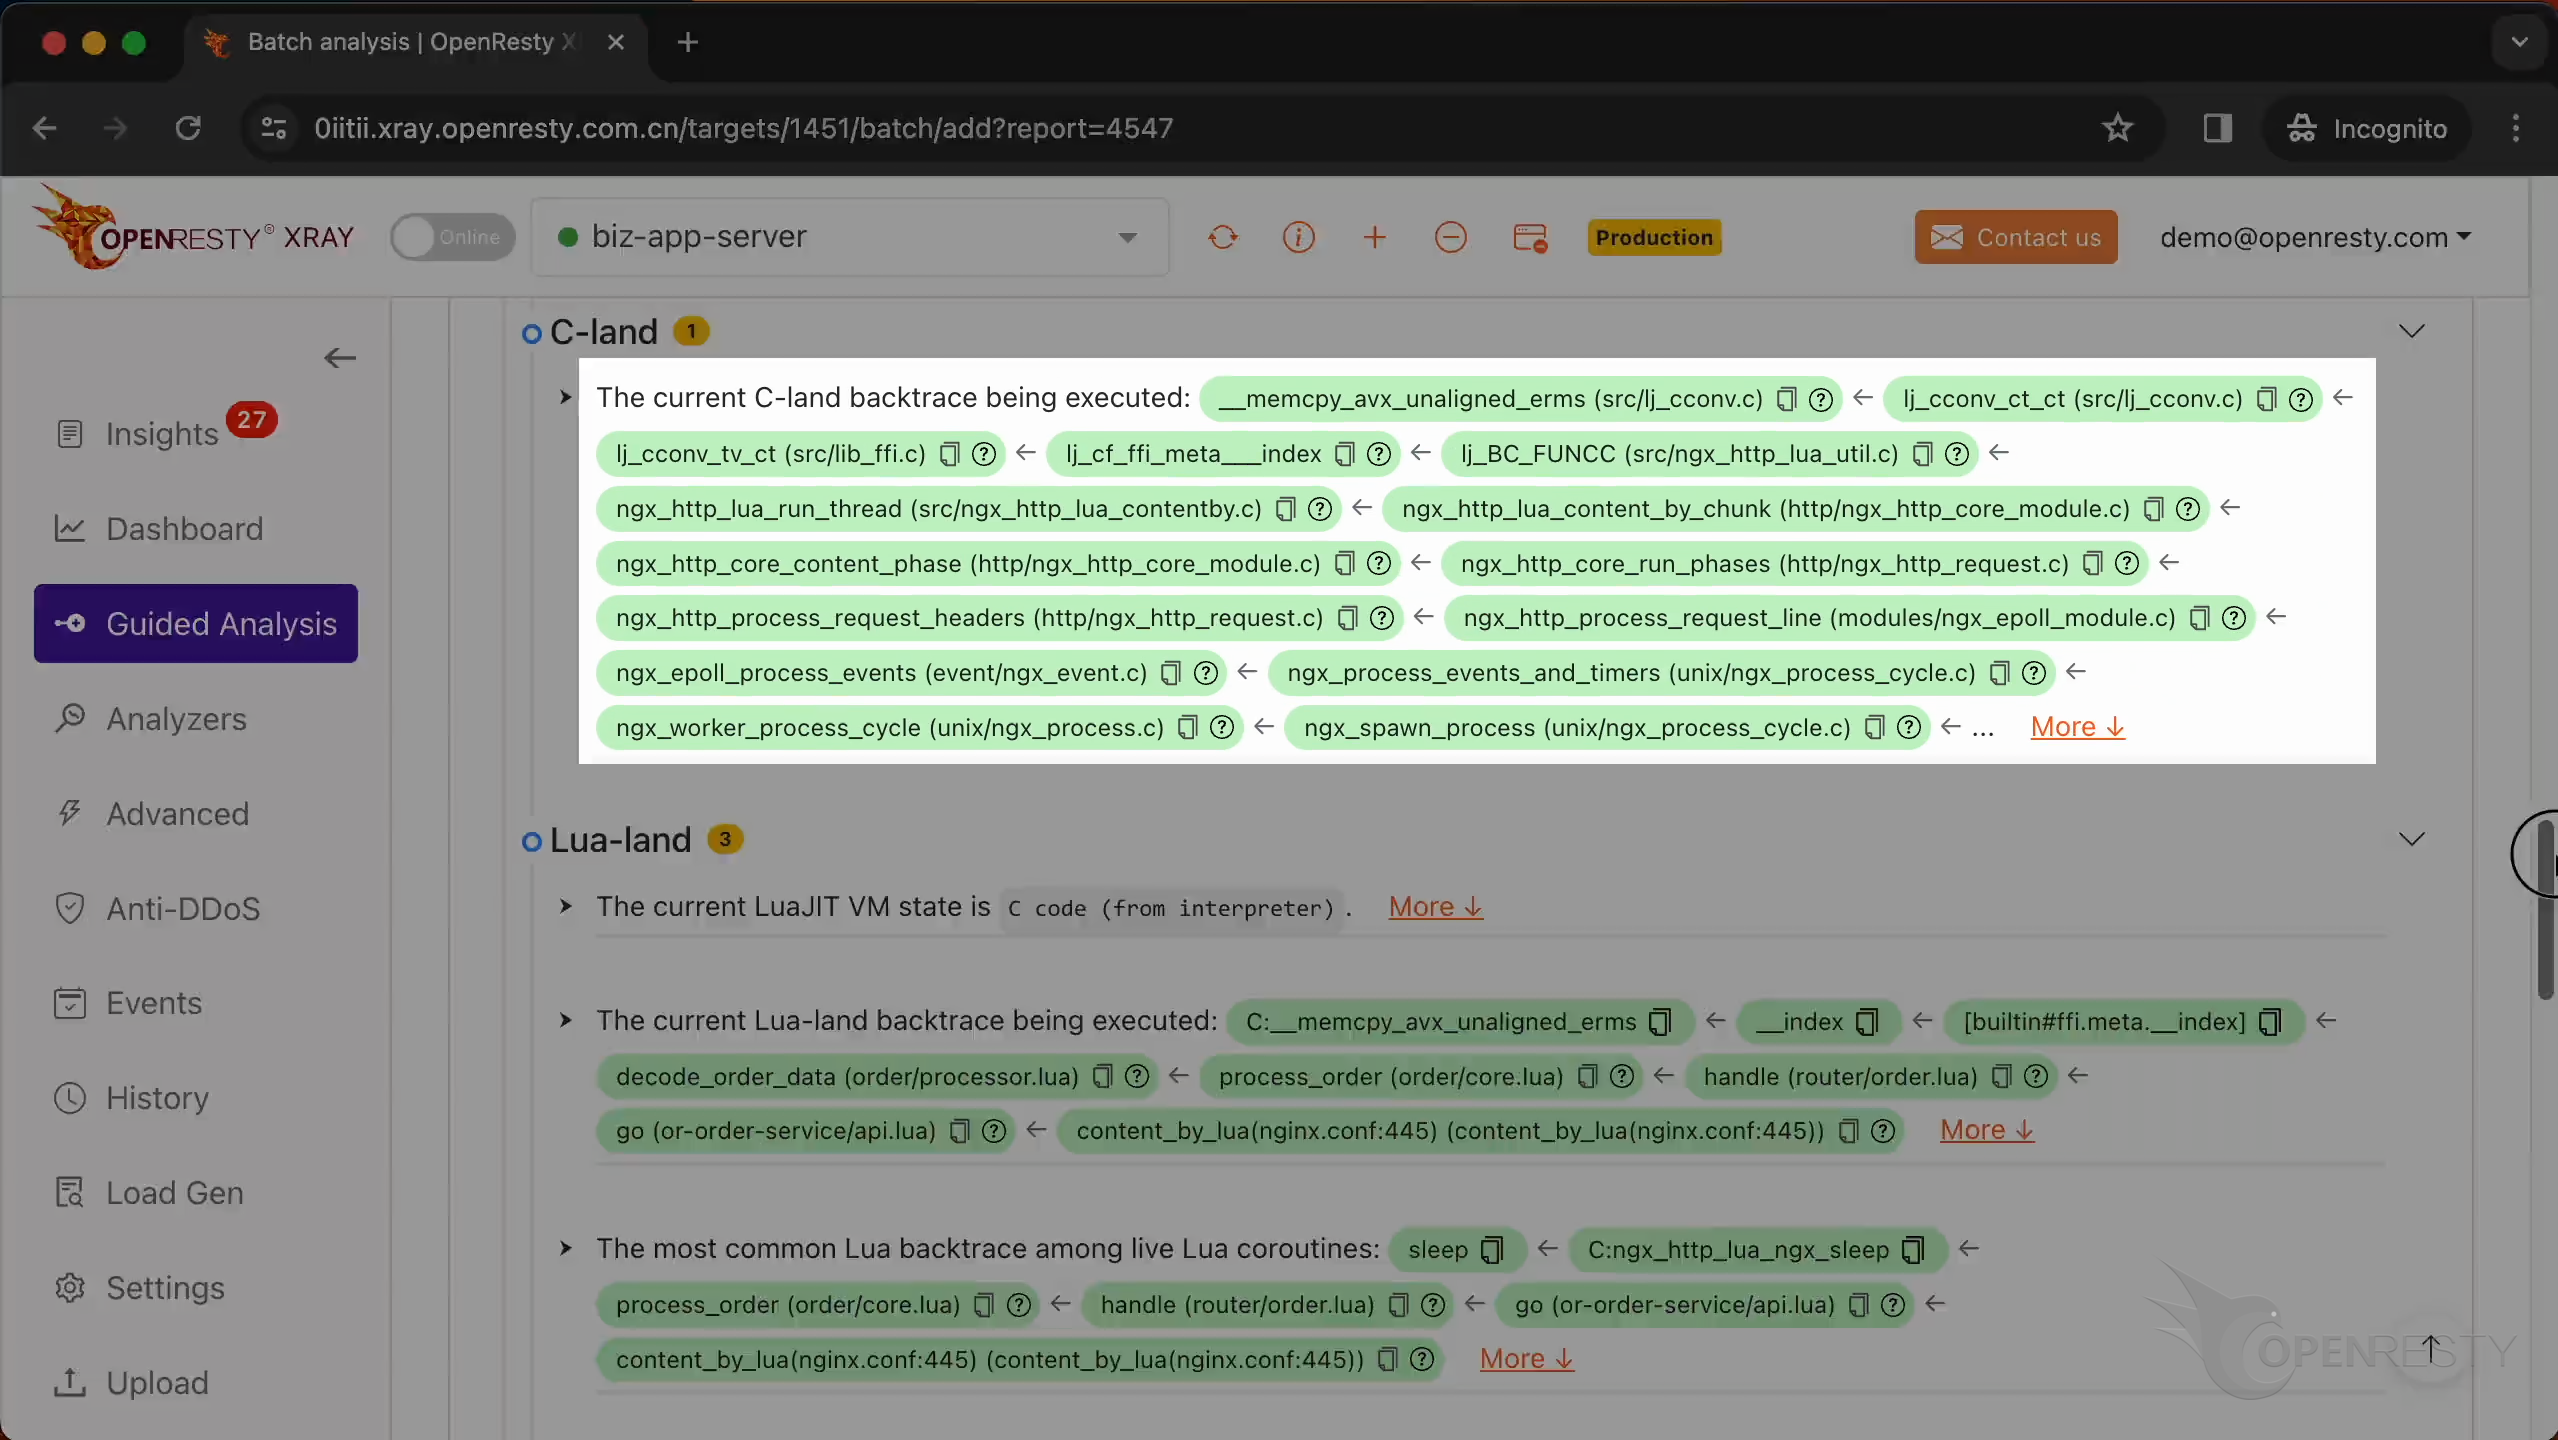
The C backtrace explains how execution reached that instruction. Nginx’s ngx_http_core_content_phase ran the Lua content handler through ngx_http_lua_run_thread; LuaJIT then dispatched the FFI __index metamethod for a cdata type, which went through LuaJIT’s C-type conversion and into glibc’s memcpy — where the segmentation fault fired.
From the Lua backtrace to the exact crashing line
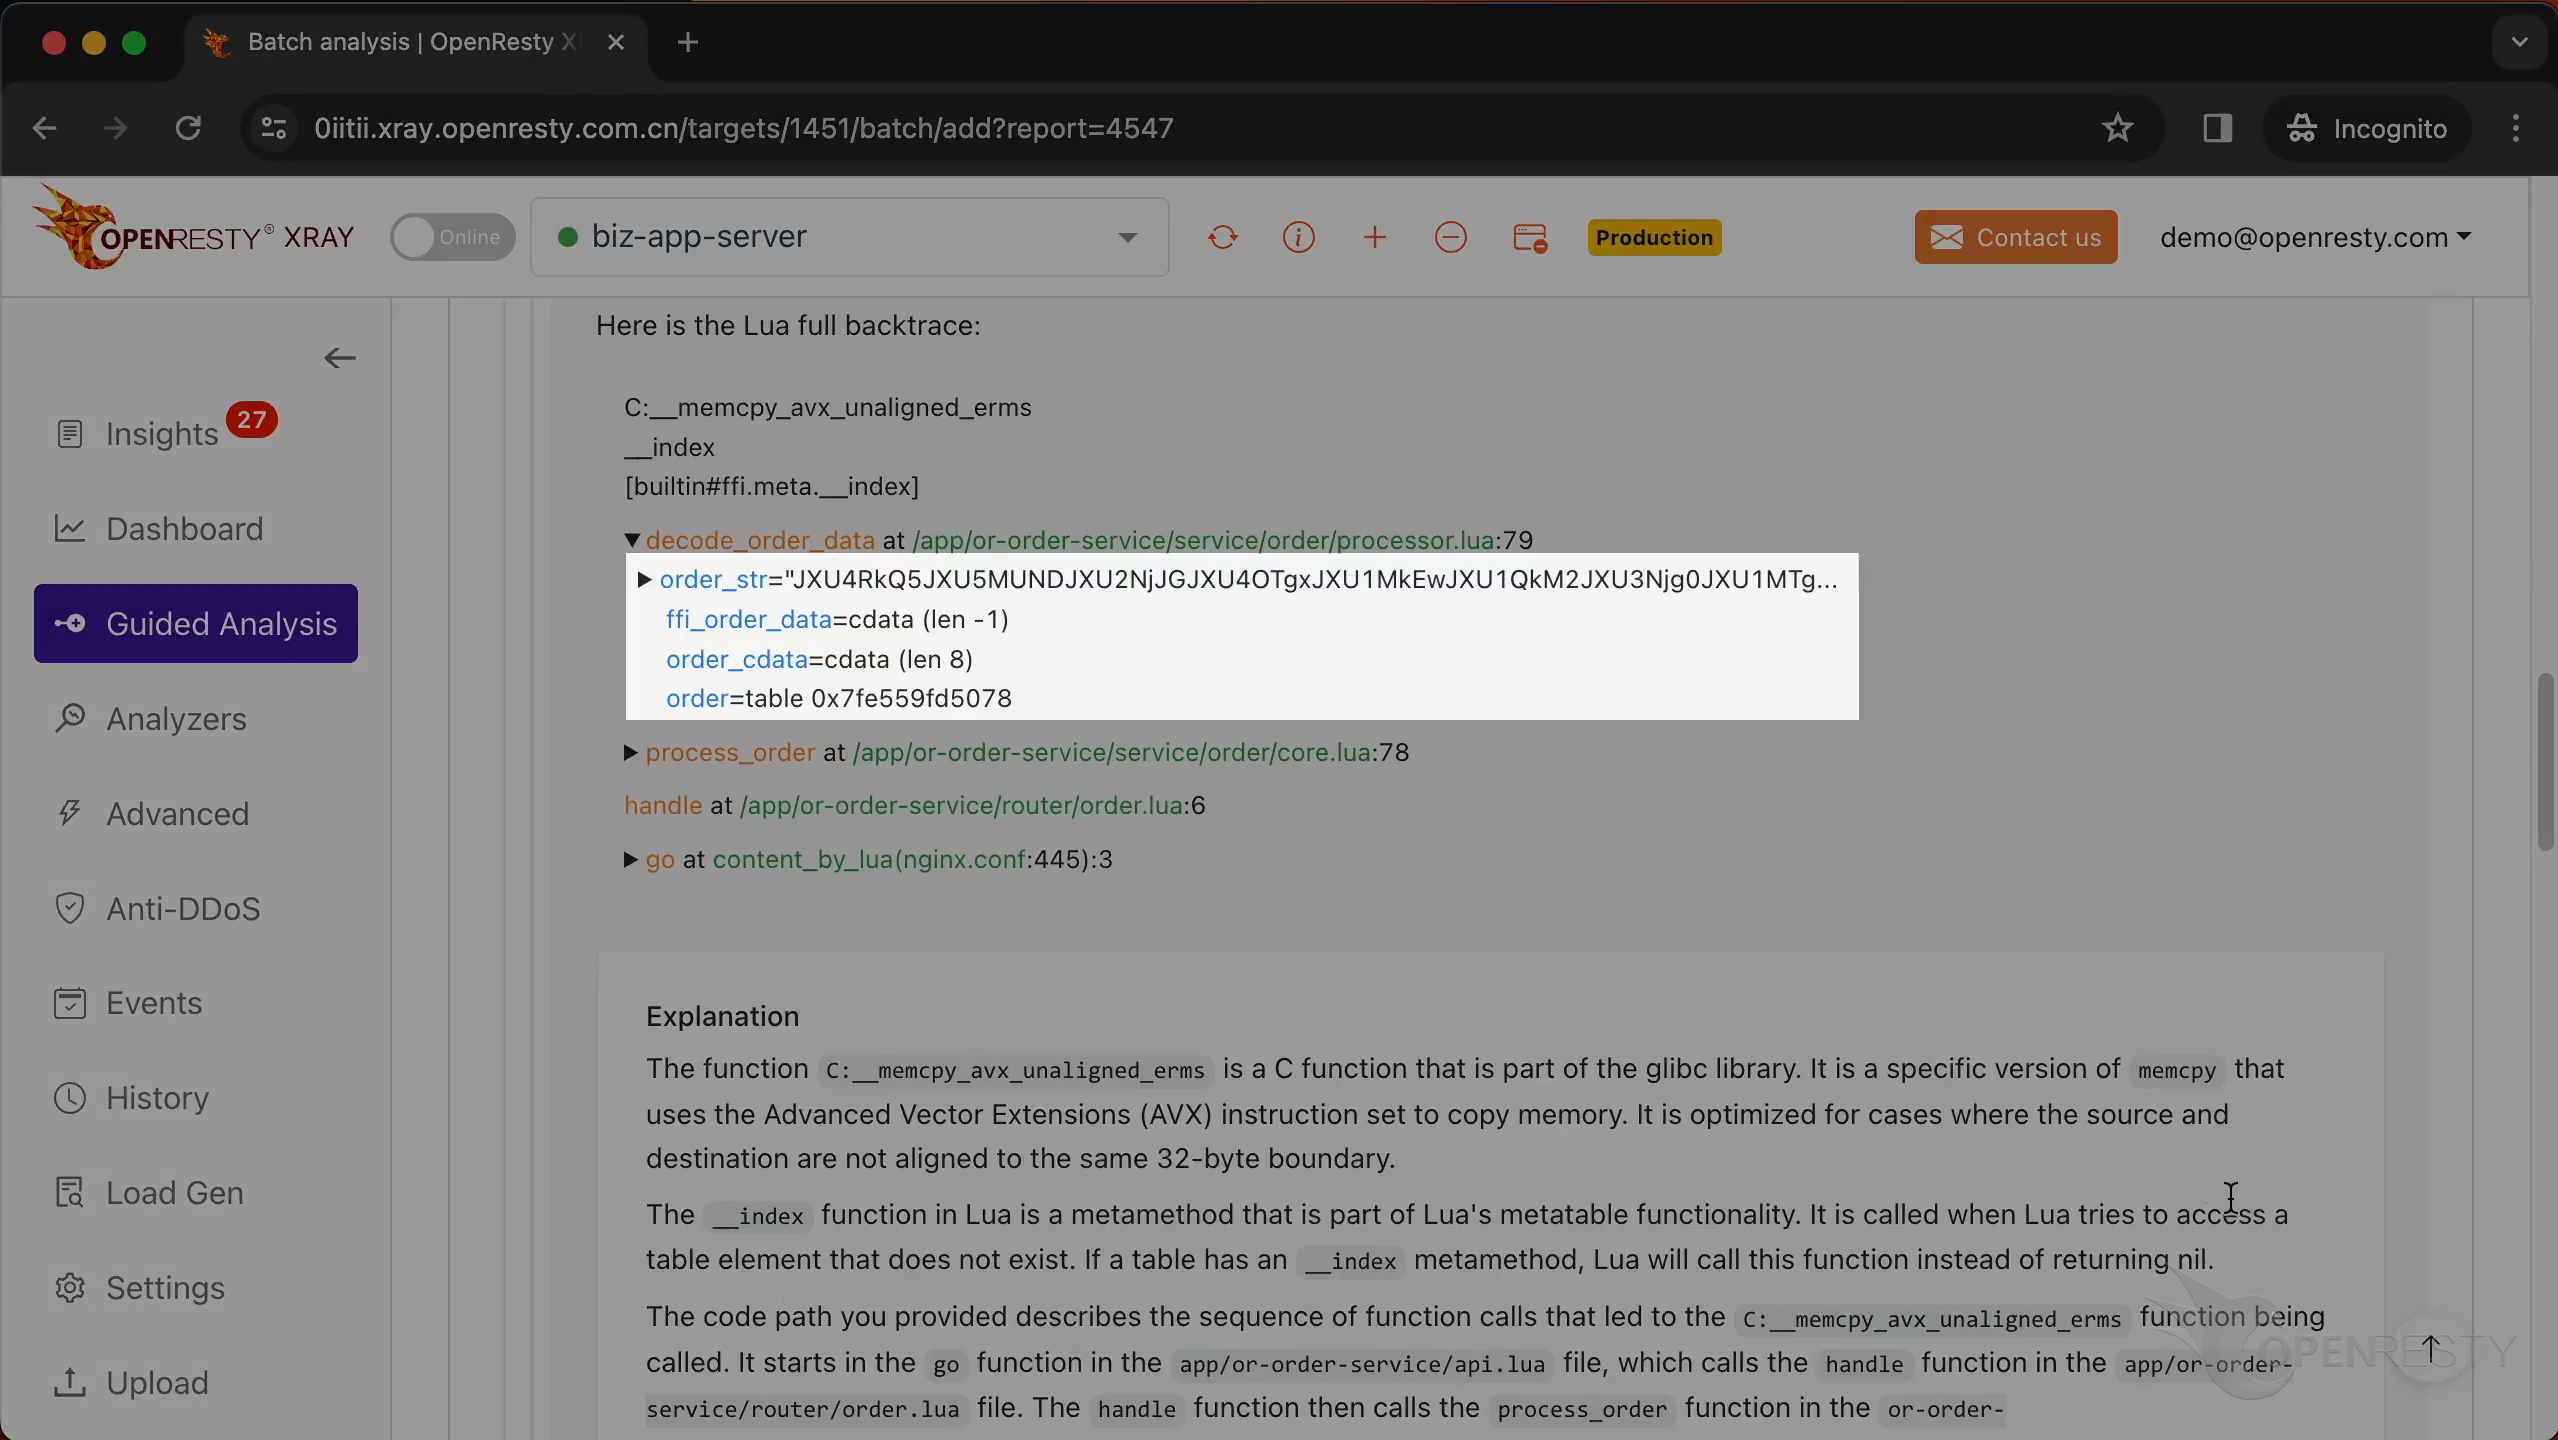
XRay reconstructs the Lua-level backtrace straight from the core dump, inferring it from the Lua CPU flame graph. The crash runs content_by_lua → go (api.lua) → handle (router/order.lua) → process_order (order/core.lua:78) → decode_order_data (order/processor.lua:79).
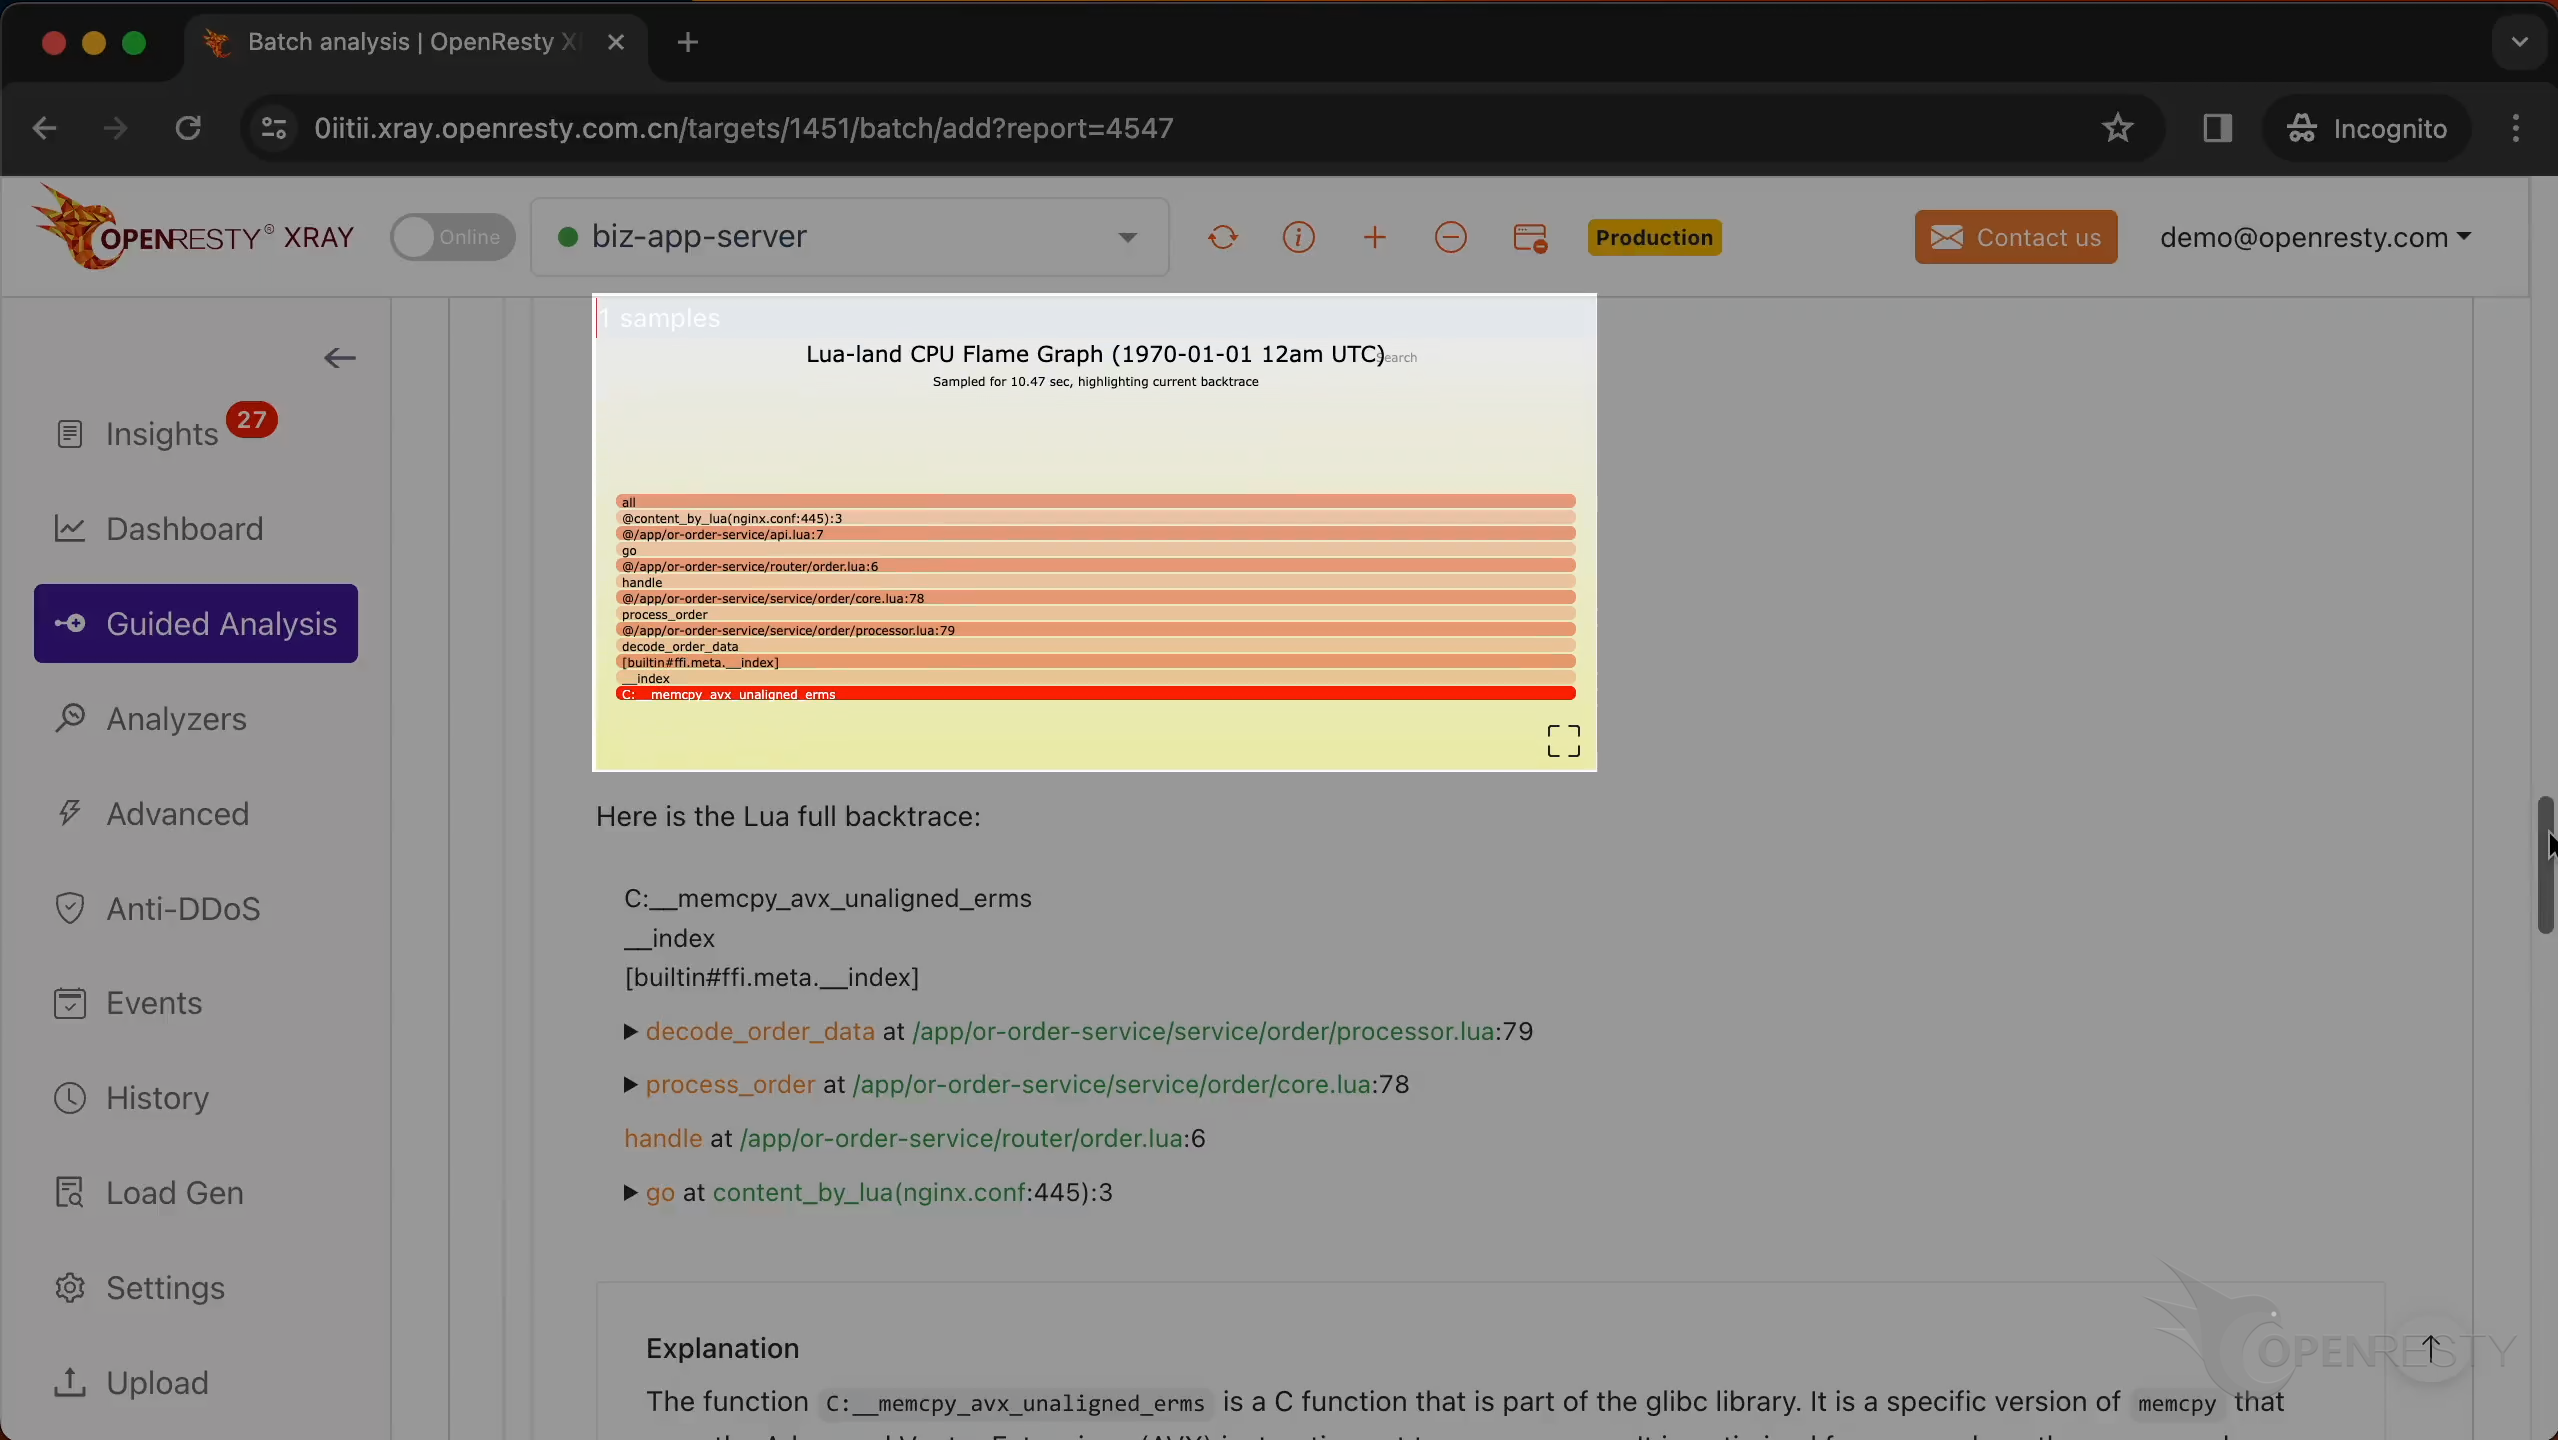
It also gives the full Lua call stack with the arguments and local variables of every function frame, so you can inspect the exact state at the crash without reproducing anything.
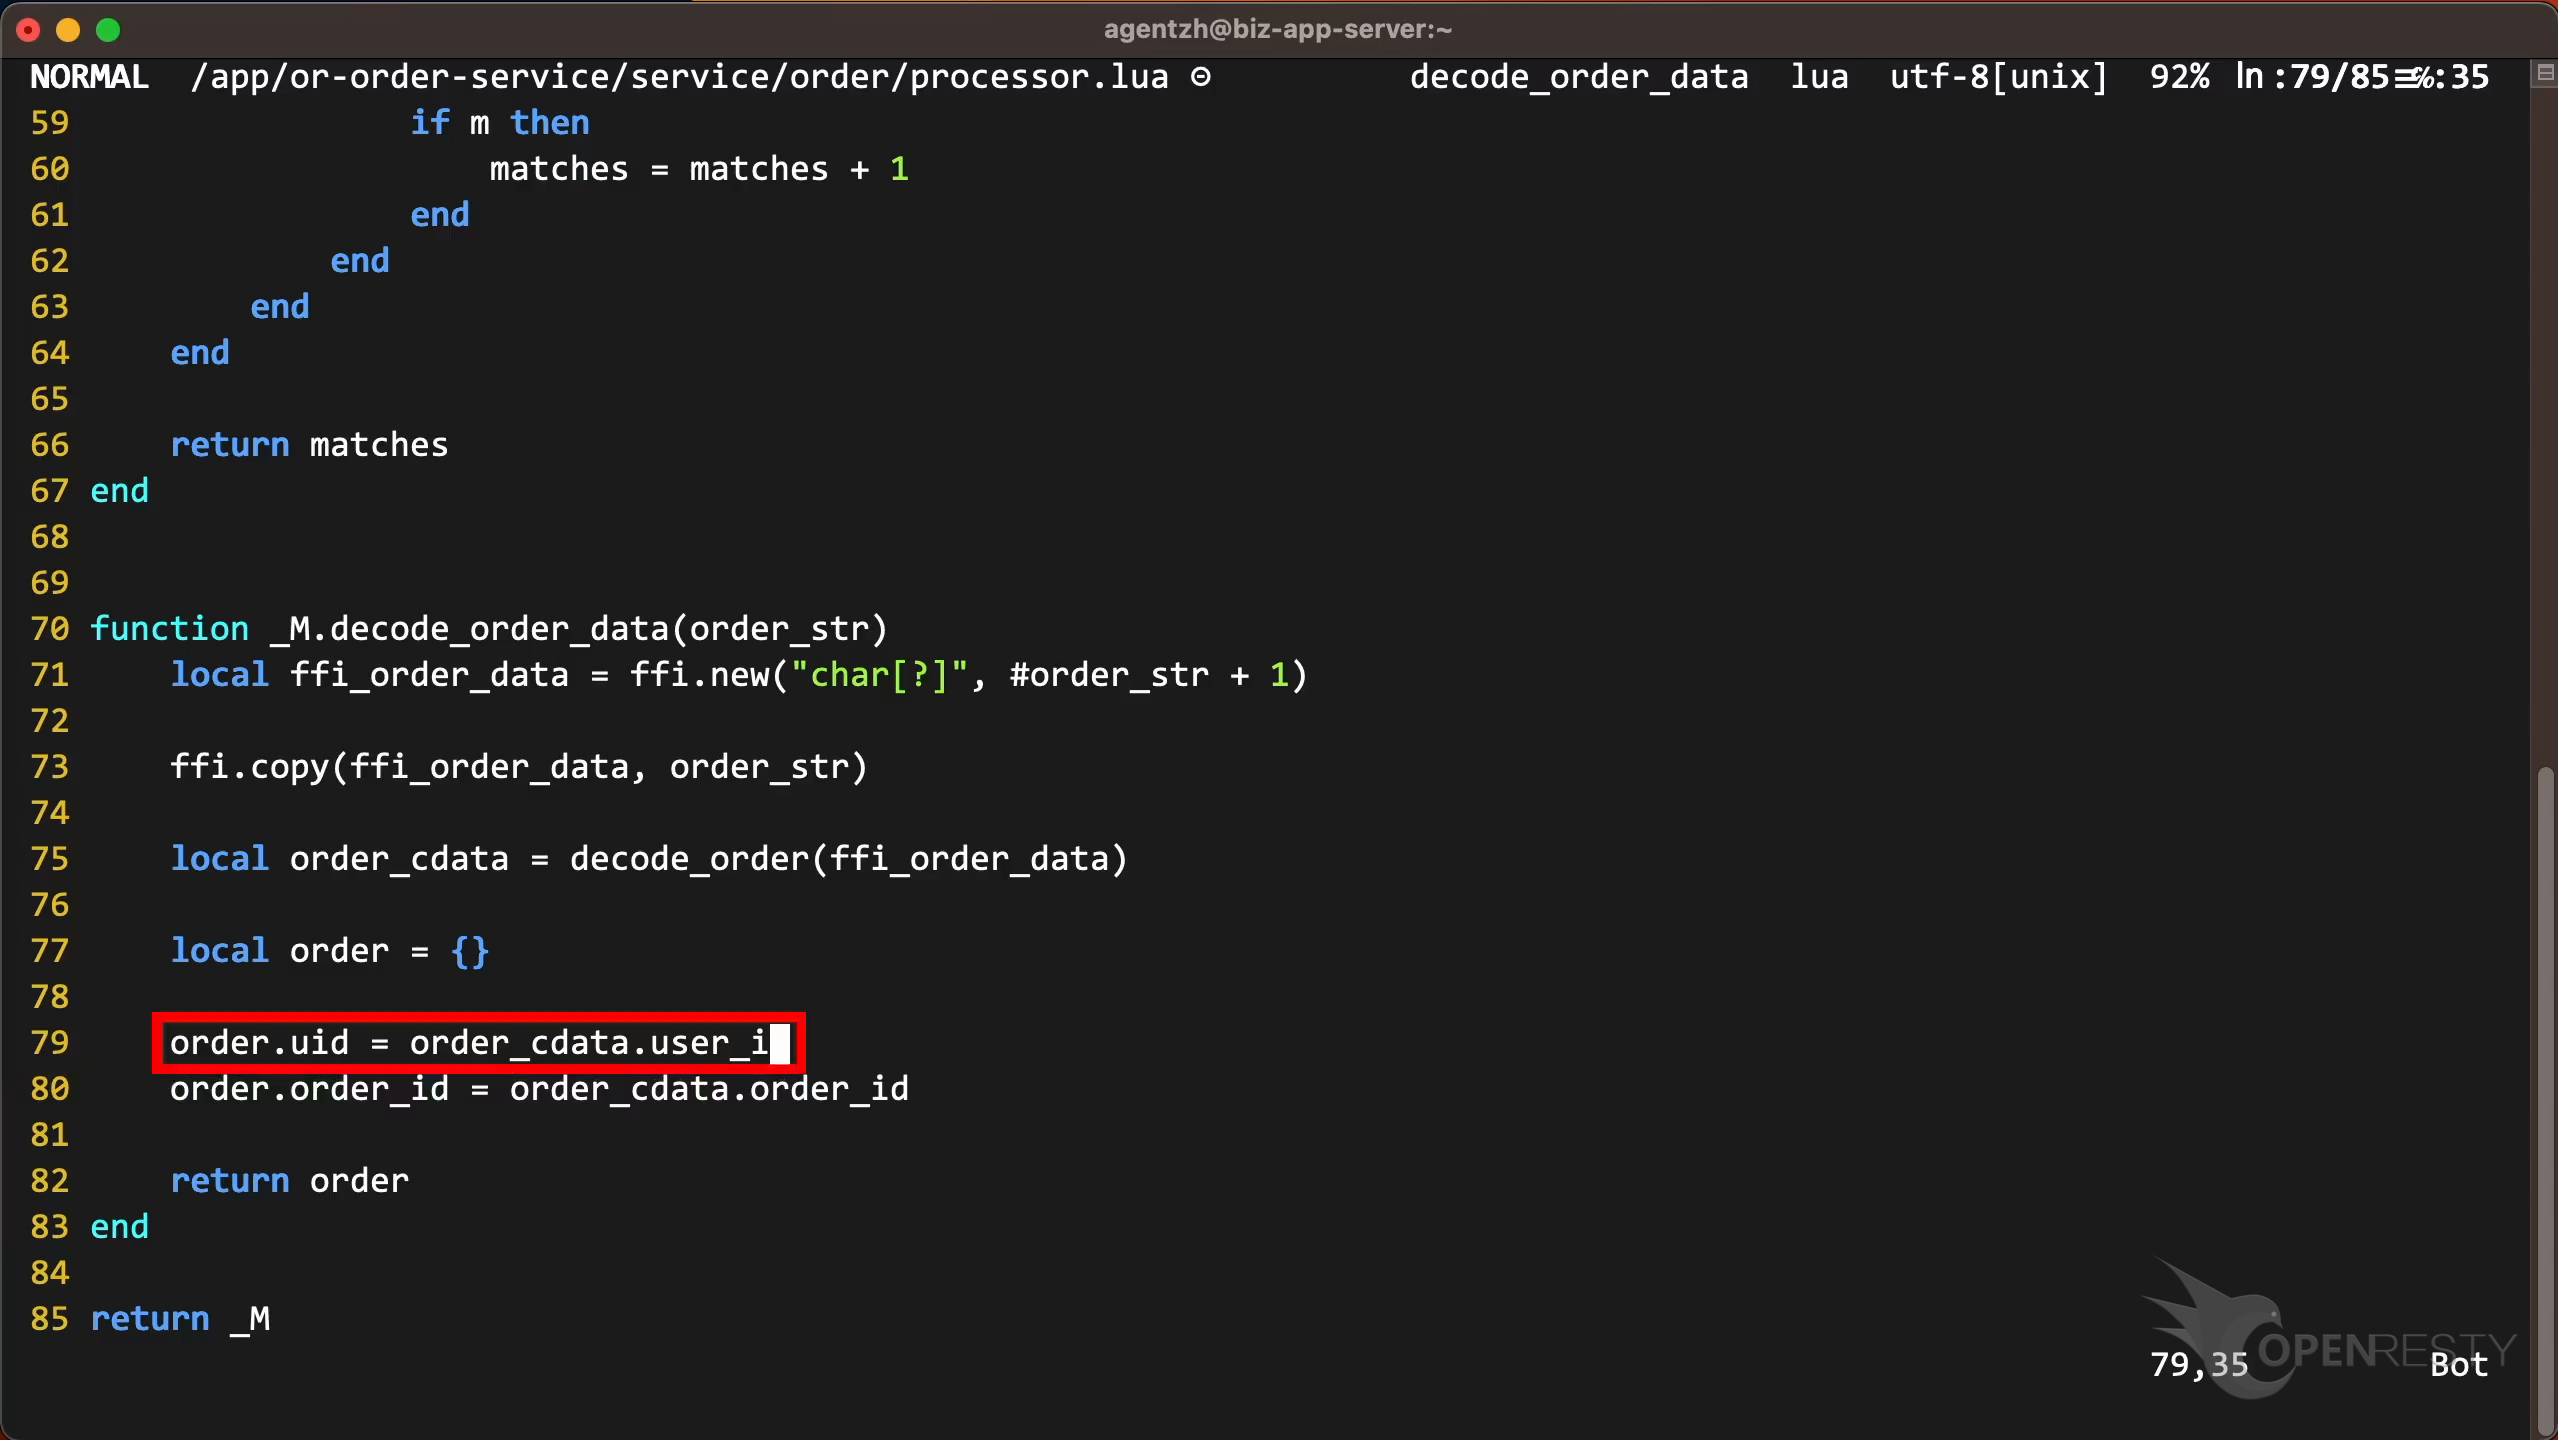
Opening processor.lua at line 79 reveals the offending statement, order.uid = order_cdata.user_id. The order_cdata value is itself a valid pointer-type cdata object, but the C pointer it holds is NULL. Reading order_cdata.user_id dereferences offset 4 off that NULL base, which is exactly why the fault address is 0x4. The fix is to check whether the pointer inside order_cdata is NULL — via order_cdata == nil — before accessing its fields.
This crash was a null-pointer dereference. For a different class of failure — a use-after-free crash tracked down with record-and-replay — see Nginx Core Dump Analysis: Catch a Worker Process Crash at the First Scene.
Lua coroutines, concurrent HTTP requests, and Lua GC memory at crash time
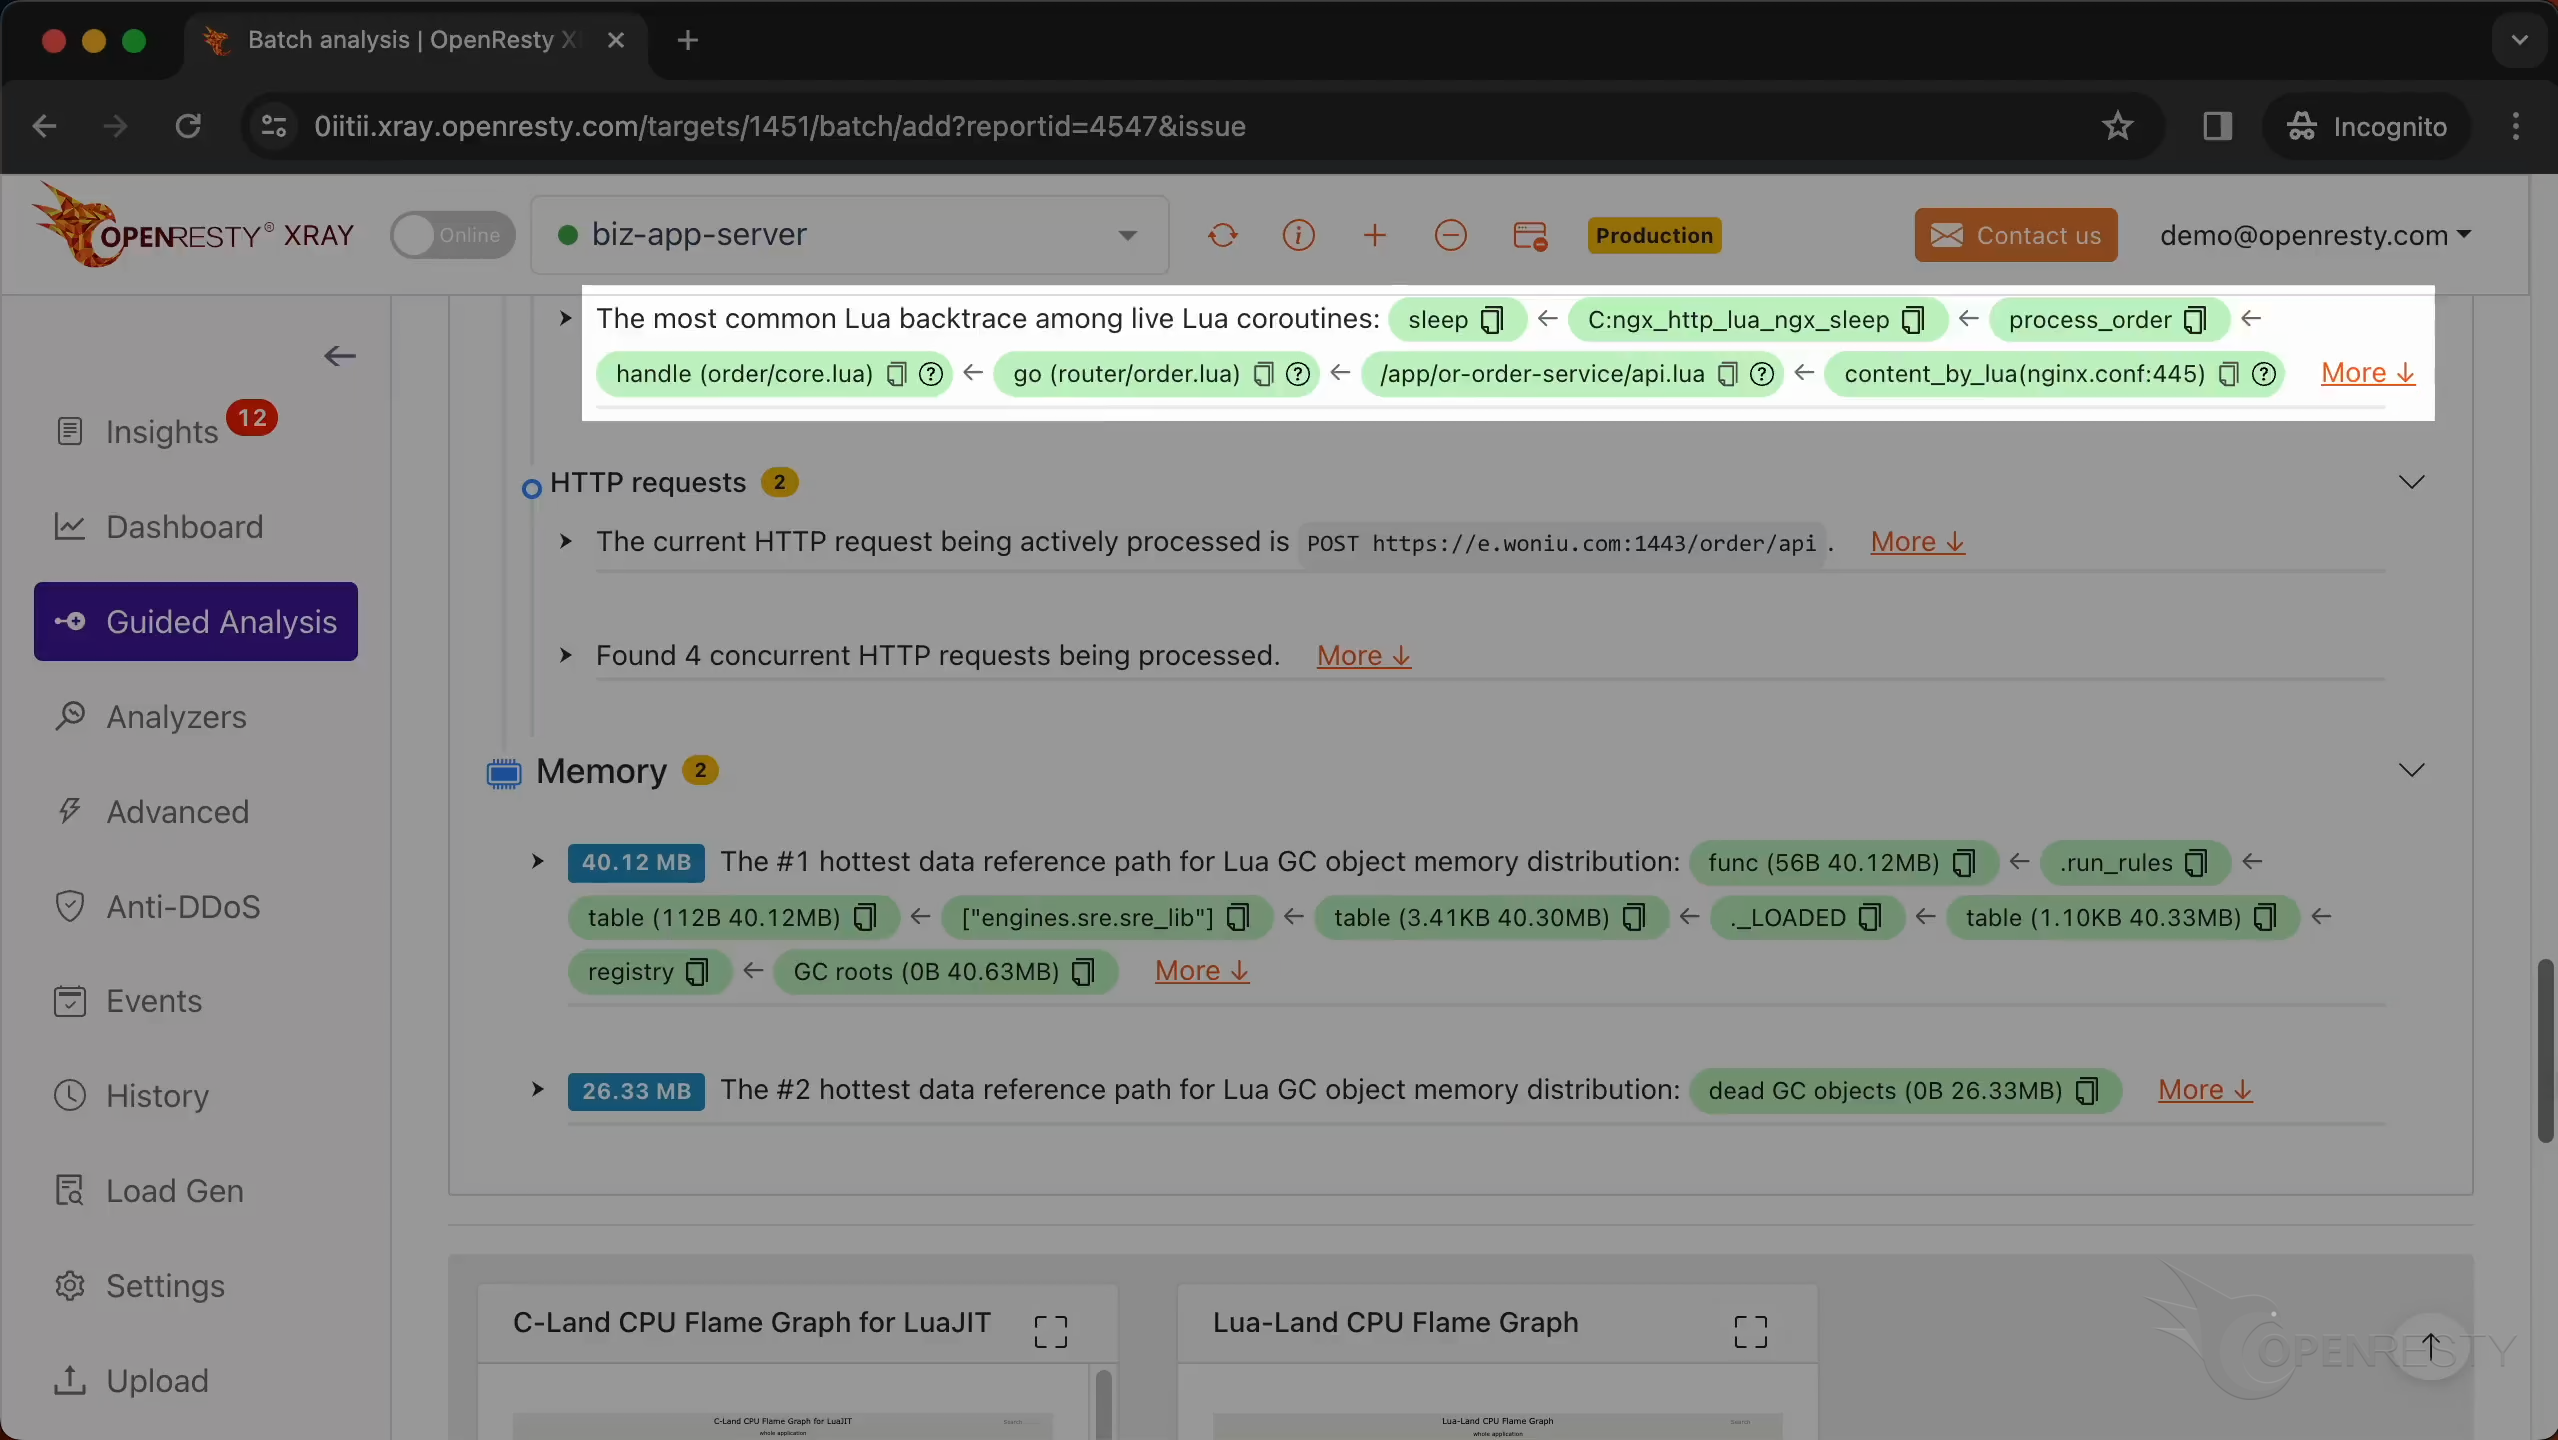
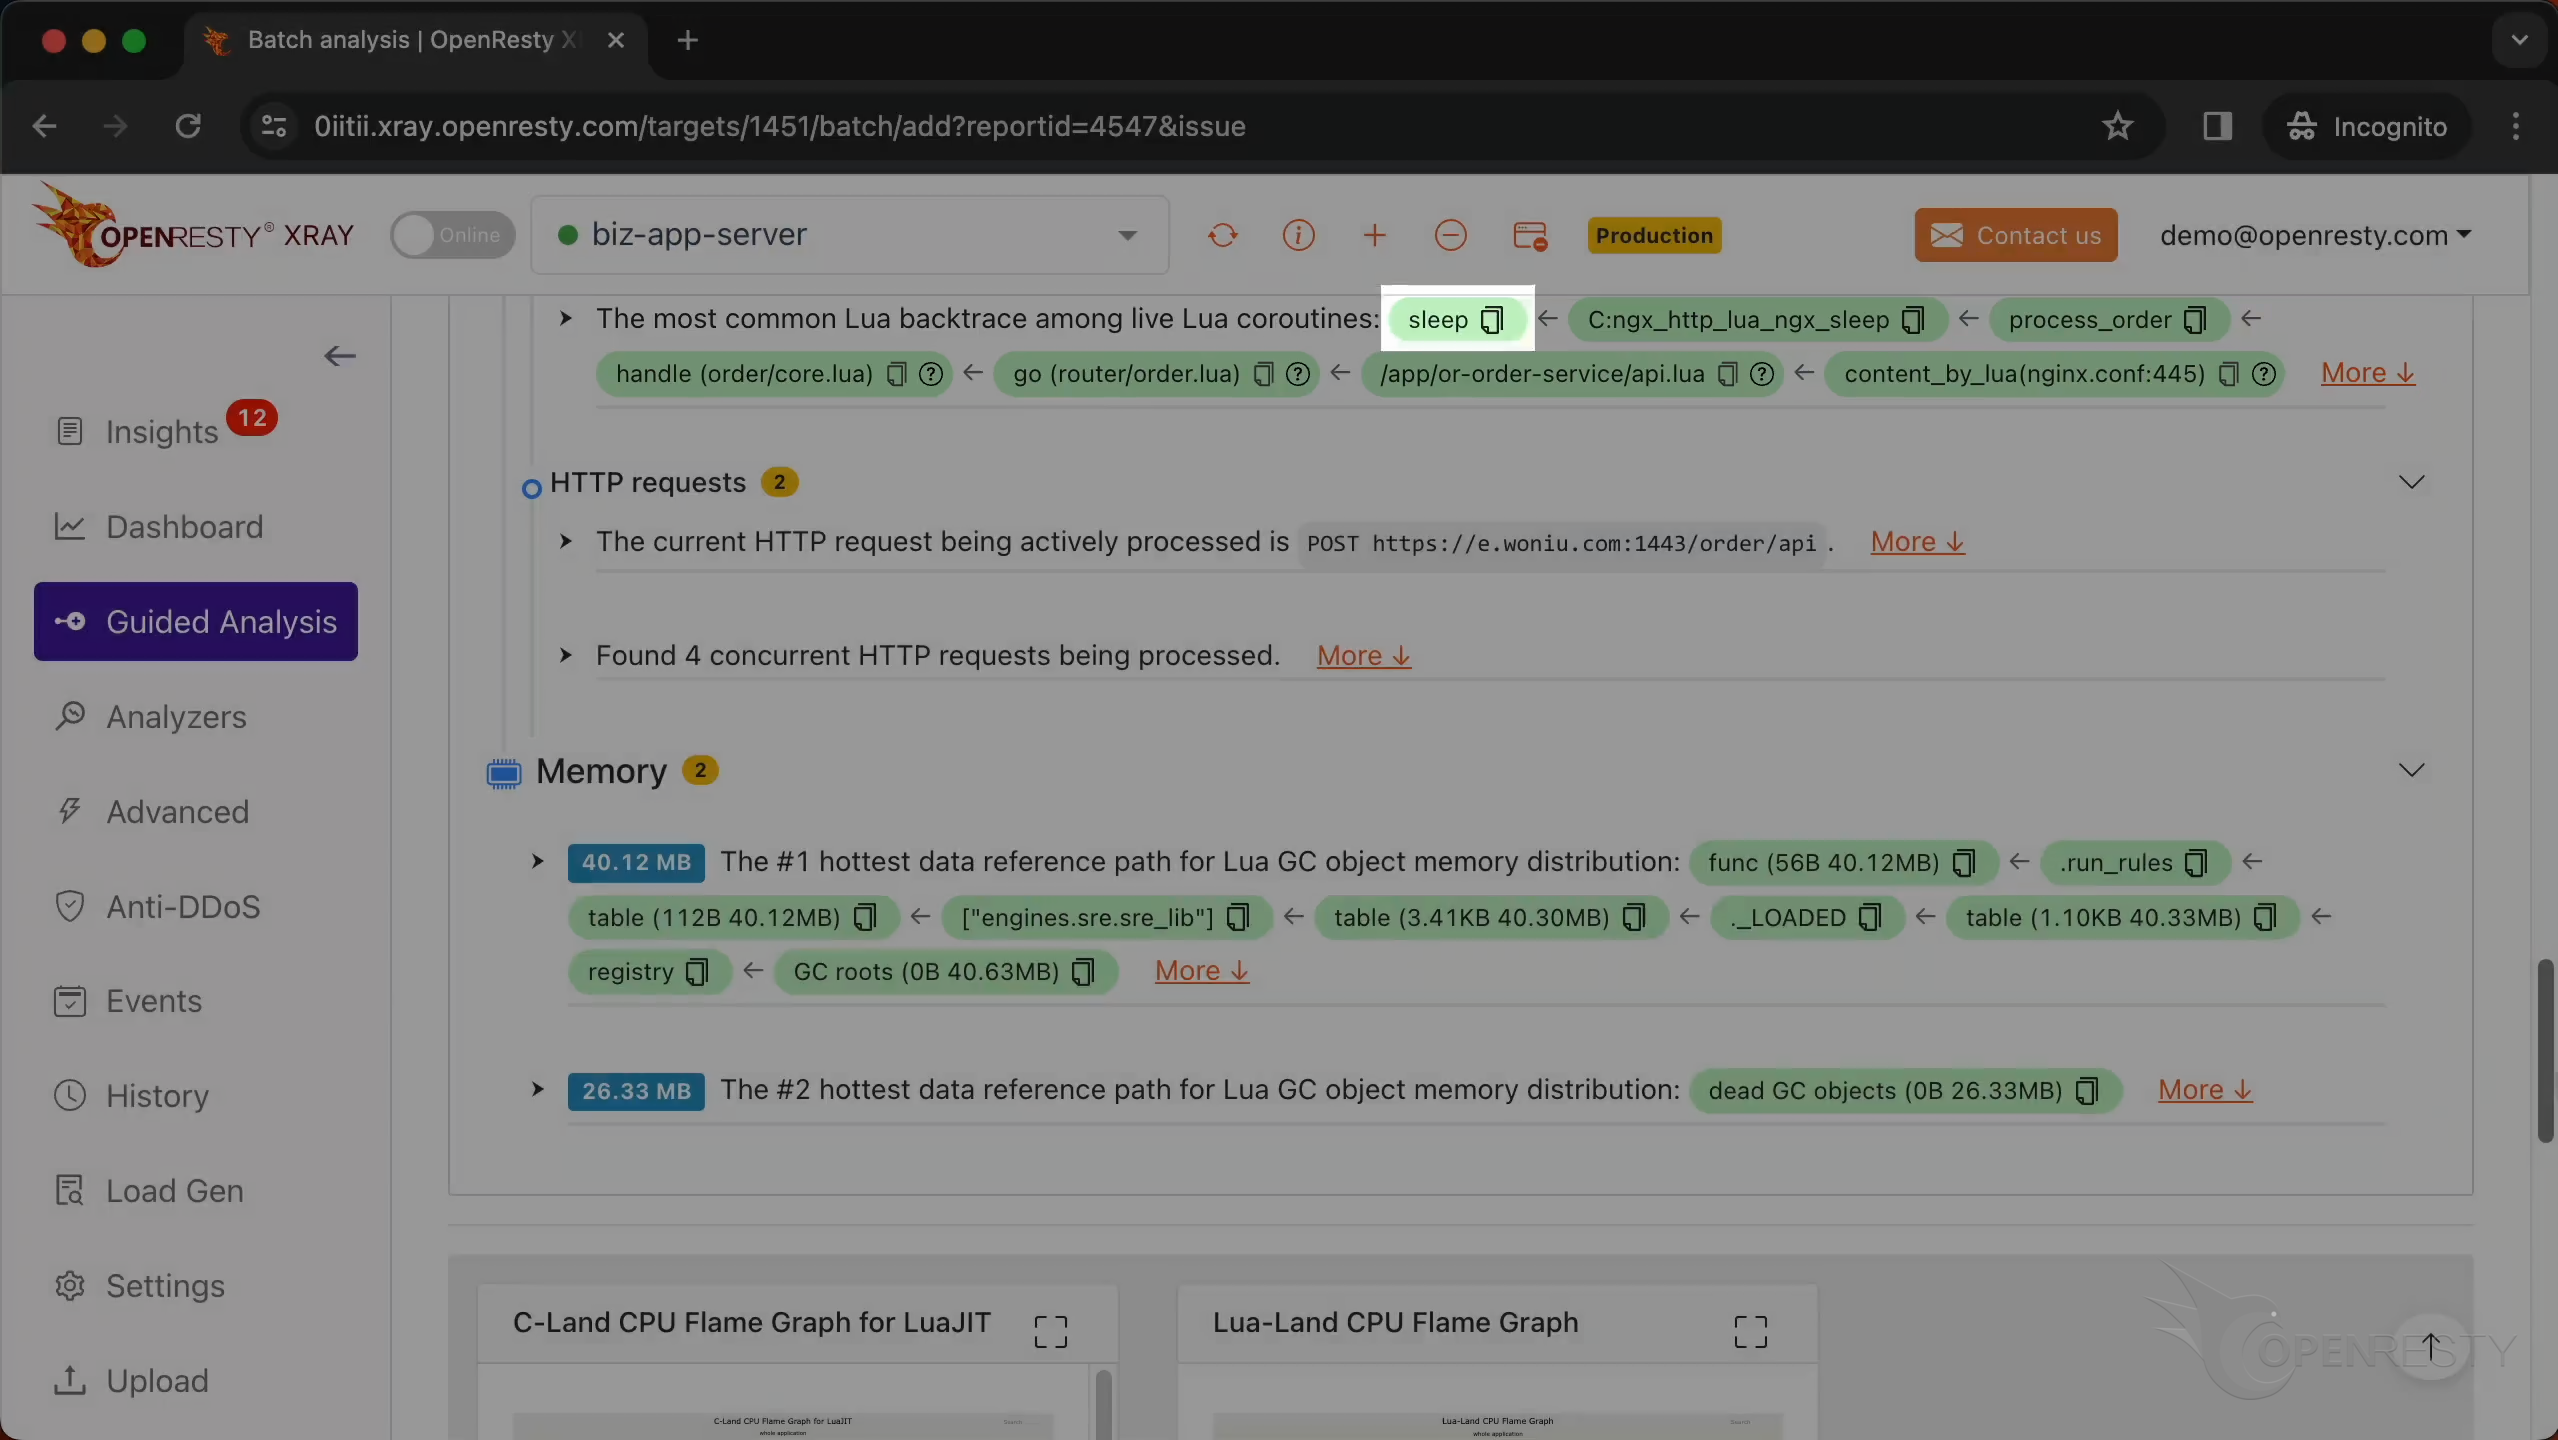
The crashing coroutine is not the only one XRay looks at. It also analyzes all the Lua coroutines alive in the core dump and surfaces the most common Lua backtrace among them — here, a code path parked in a sleep call: the same process_order business code, waiting inside ngx.sleep (ngx_http_lua_ngx_sleep).
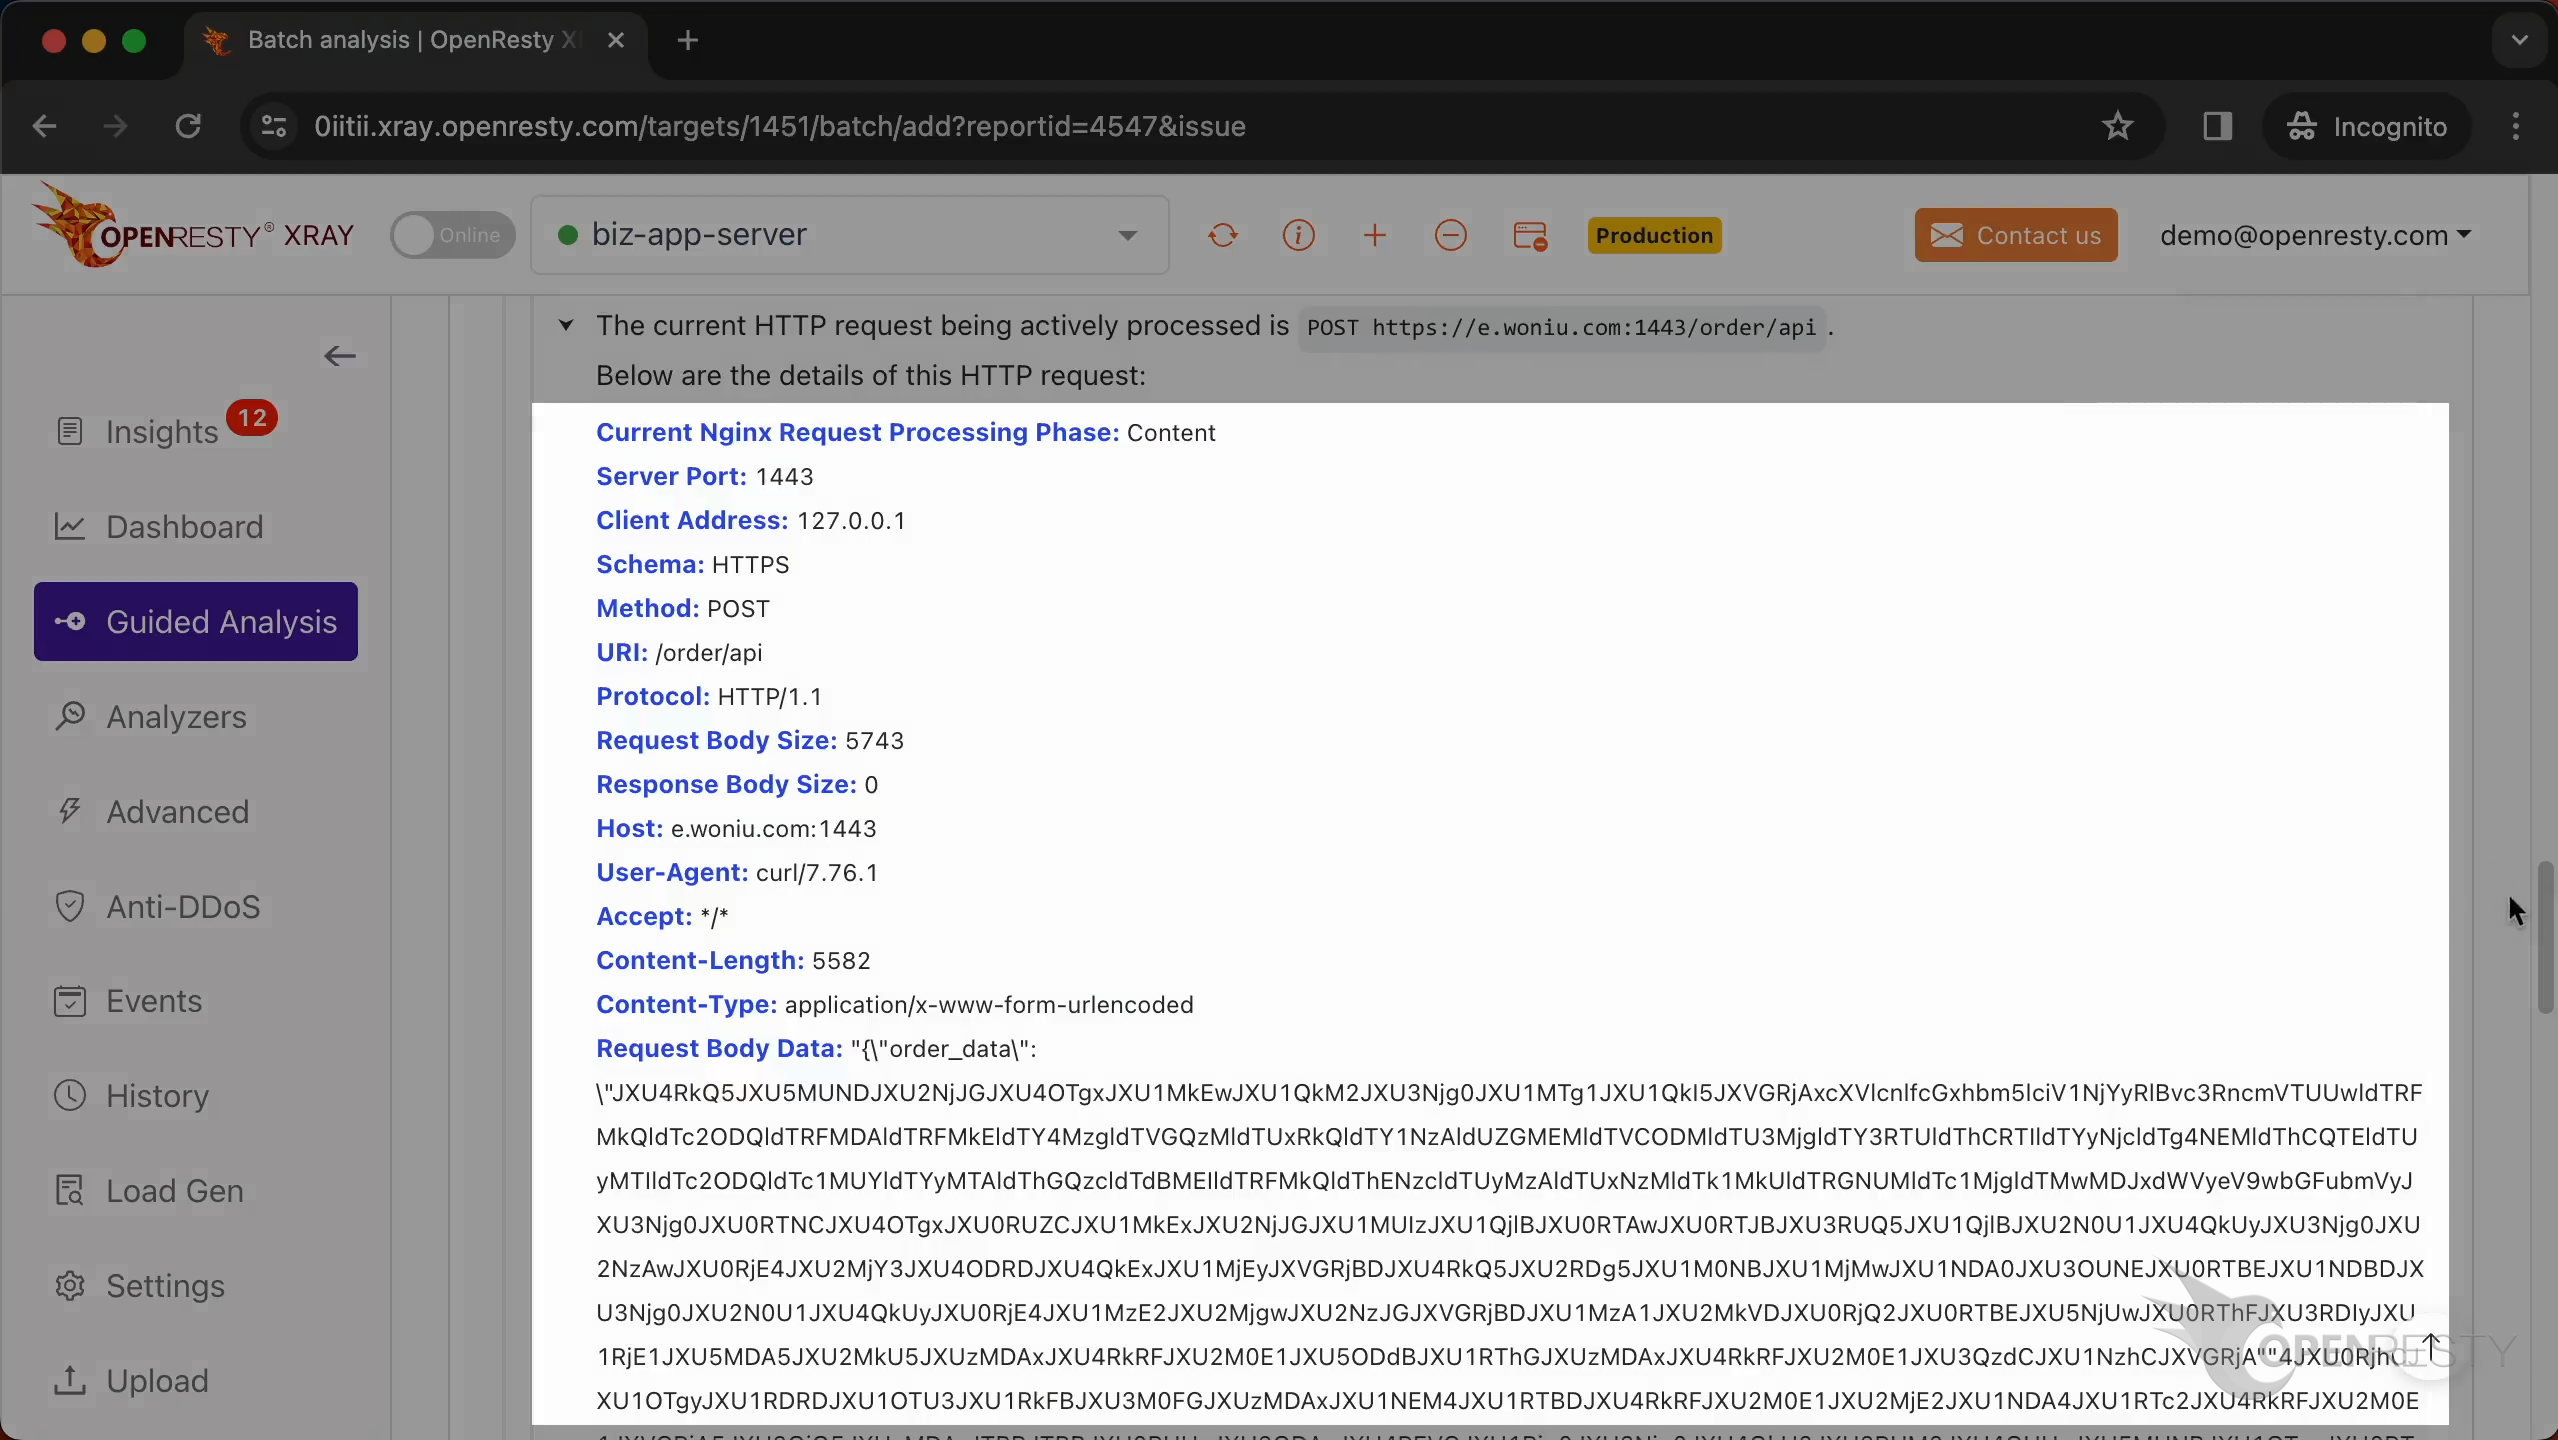
The report also captures every HTTP request in flight. The request the crashing worker was handling is a POST https://e.woniu.com:1443/order/api (client 127.0.0.1, curl/7.76.1), running alongside three concurrent GET /order/api?request_type=search_orders requests.
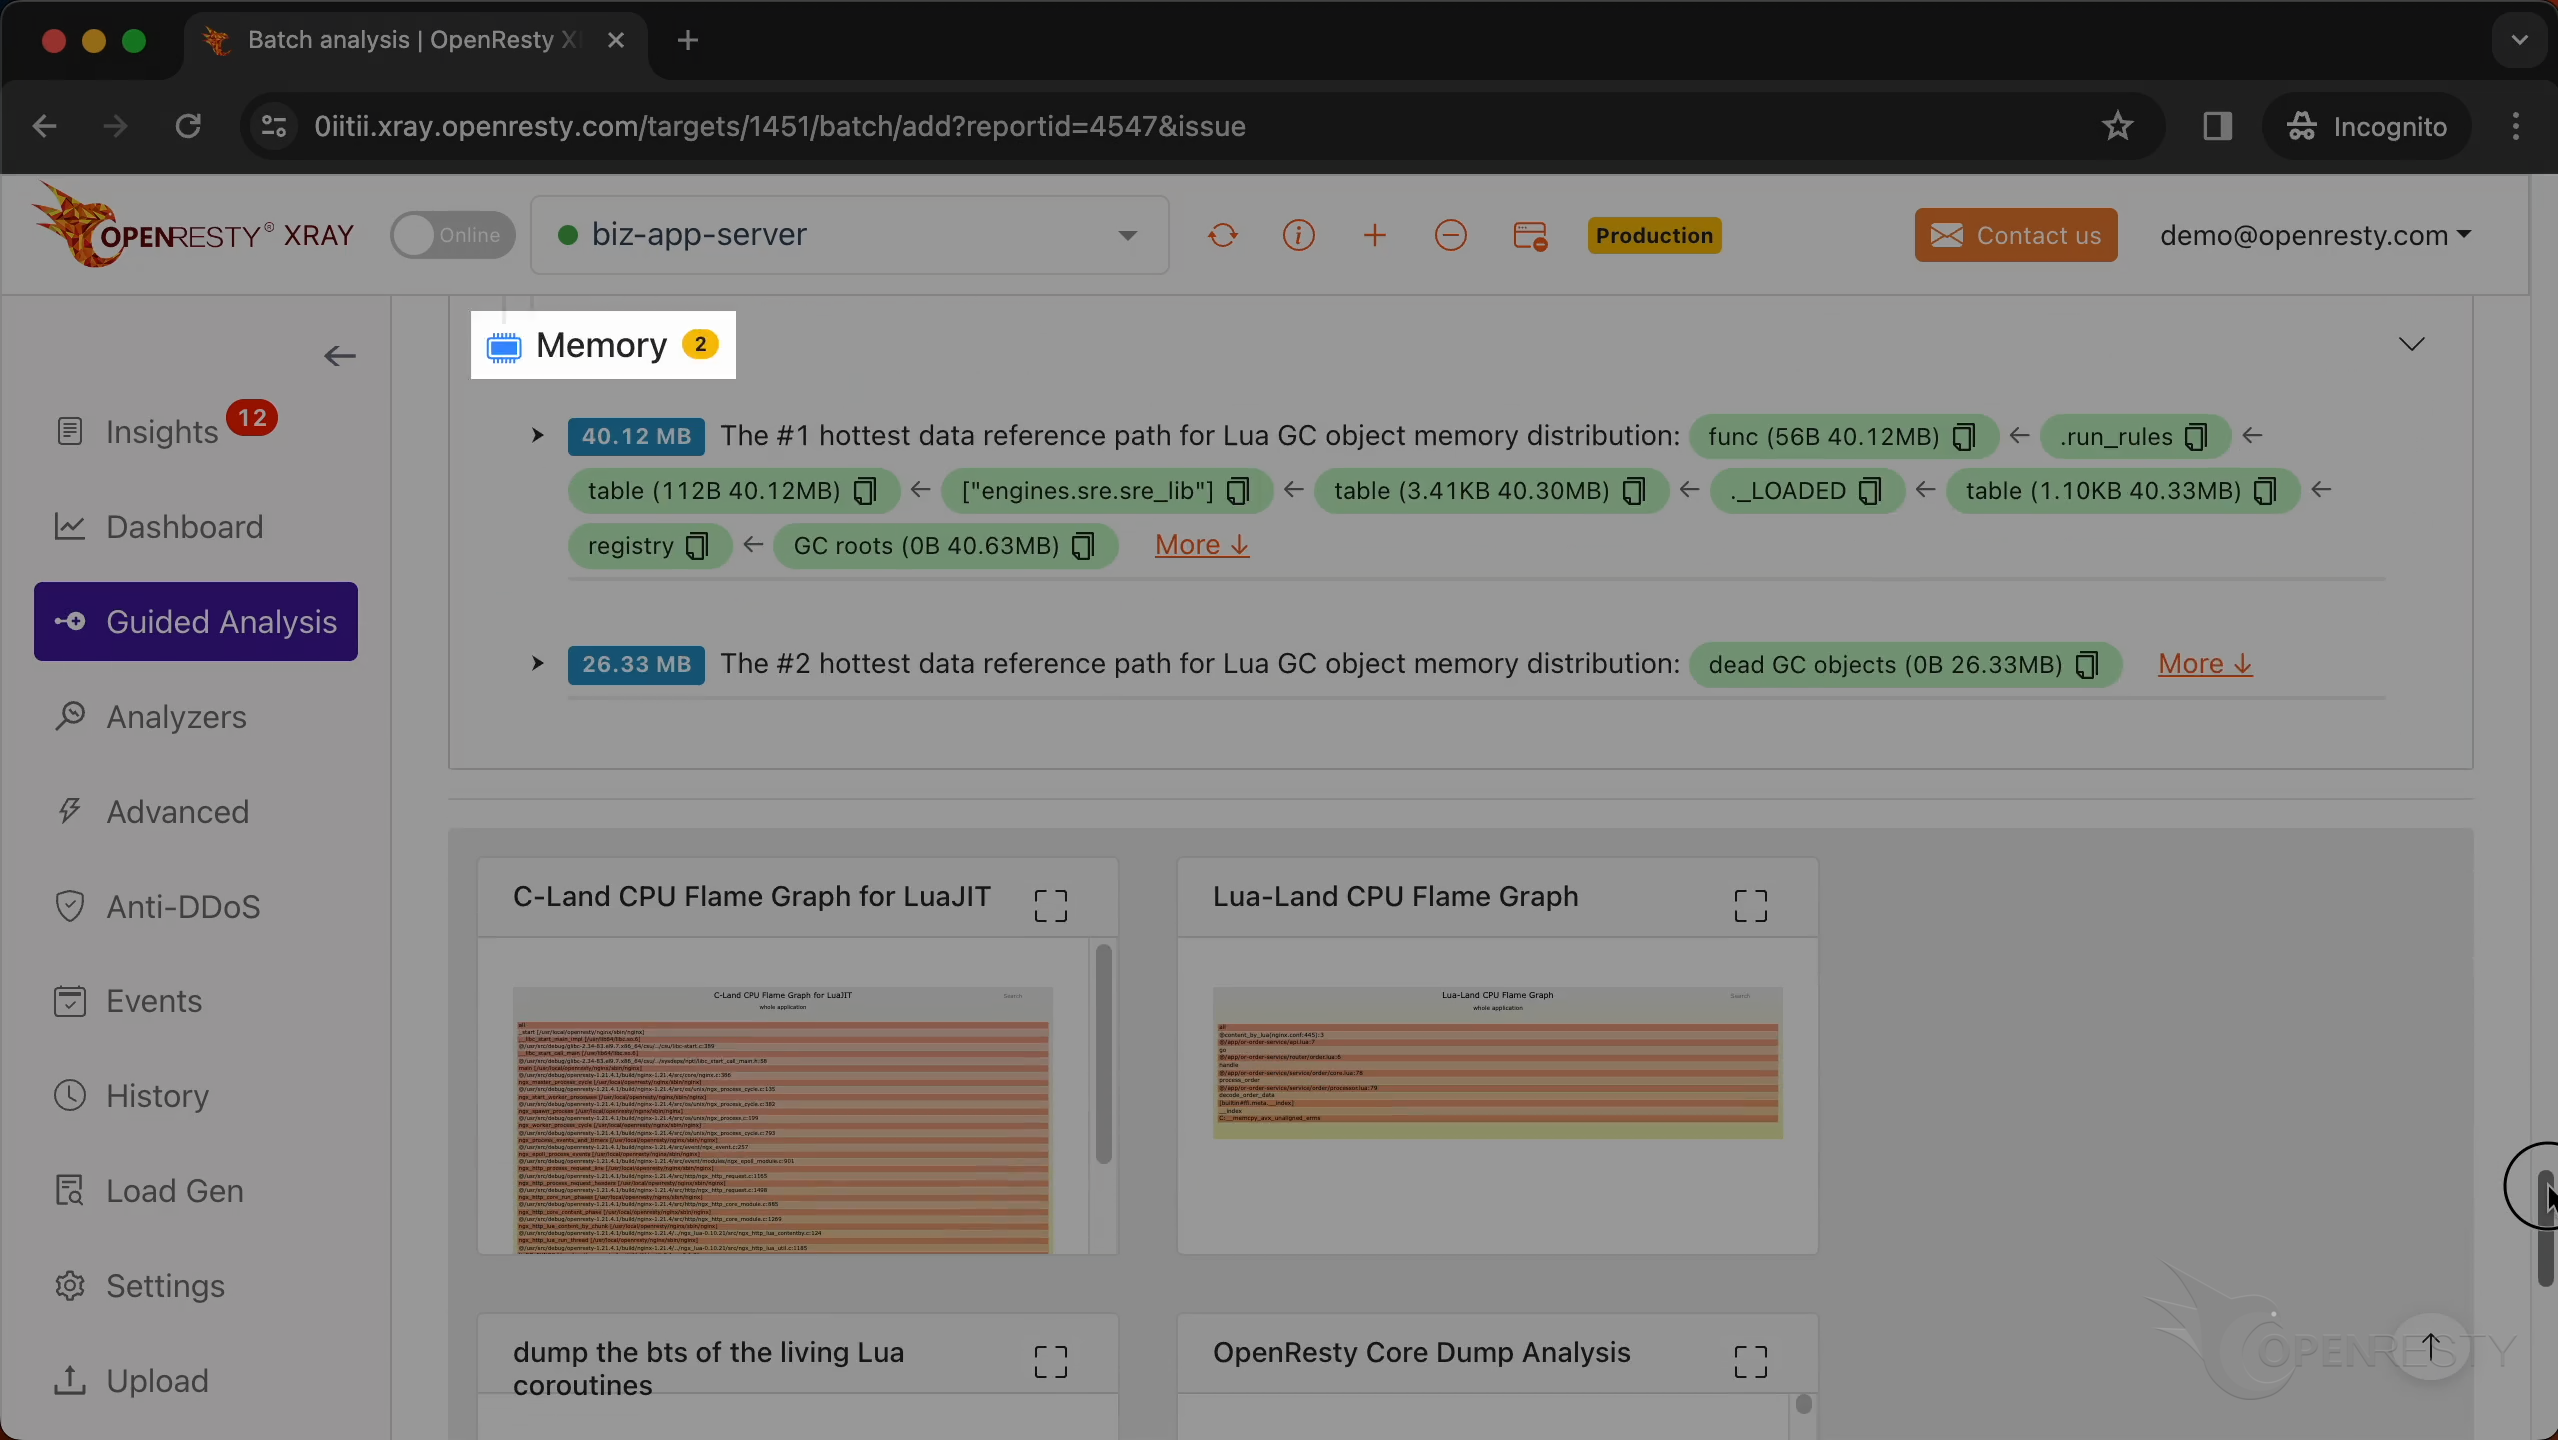
For memory, XRay ranks the hottest Lua GC object reference paths. The #1 path here is registry → _LOADED → engines.sre.sre_lib → run_rules, accounting for 40.12 MB of live Lua GC objects — derived automatically from the Lua GC object memory distribution flame graph.
Automatic core dump analysis and reports
You don’t have to run Guided Analysis by hand. OpenResty XRay monitors online applications for new core dumps, analyzes them automatically, and publishes the findings on the Insights page as daily and weekly reports.

For this reason, Guided Analysis is mostly useful for application development and demonstration; in production, the automatic reports surface new crashes for you. Crash forensics is one of several problem classes the product automates — see how the same non-invasive engine tackles performance and memory issues on live processes.
Frequently asked questions
How do you get a Lua backtrace from a core dump?
OpenResty XRay reconstructs the Lua-level backtrace directly from the core file, automatically inferring it from the Lua CPU flame graph. It shows the full call stack for each Lua coroutine, including every function frame with the values of its arguments and local variables — the same context you would otherwise dig out by hand in GDB.
Why does LuaJIT segfault on an FFI cdata?
Accessing a field on a pointer-type cdata whose underlying C pointer is NULL causes a segmentation fault. In this core dump, order_cdata is a valid cdata object but the pointer it wraps is NULL; decode_order_data reads its user_id field, dereferencing offset 4 off the NULL base (fault address 0x4), which triggers a SEGV and crashes the worker. The fix is to check whether the wrapped pointer is NULL — with order_cdata == nil — before dereferencing its fields.
What signal triggers an OpenResty or Nginx core dump?
In this crash the core dump was triggered by the SEGV signal. SEGV stands for “Segmentation Violation” and usually indicates an illegal memory access — the process touched a memory address it was not allowed to. OpenResty XRay reports the exact signal, the faulting instruction, and the CPU register values at the moment of the crash.
How do you find the exact Lua line that crashed?
The report links the crashing Lua function frame back to its source. Hovering over the function’s box reveals the source file and its full path, and the report gives the exact source line number. Here it points to line 79 of decode_order_data, the line that dereferences the NULL pointer wrapped inside the cdata.
Can you analyze a core dump without running GDB by hand?
Yes. OpenResty XRay monitors online applications for new core dumps and generates automatic analysis reports on the Insights page for daily and weekly periods, so you do not have to run guided analysis manually. Under the hood it uses the Y language over runtimes such as Stap+, eBPF+, GDB, and ODB, depending on the context.
What is OpenResty XRay
OpenResty XRay is a dynamic-tracing product that automatically analyzes your running applications to troubleshoot performance problems, behavioral issues, and security vulnerabilities with actionable suggestions. Under the hood, OpenResty XRay is powered by our Y language targeting various runtimes like Stap+, eBPF+, GDB, and ODB, depending on the contexts.
If you like this tutorial, please subscribe to this blog site and/or our YouTube channel. Thank you!
About The Author
Yichun Zhang (Github handle: agentzh), is the original creator of the OpenResty® open-source project and the CEO of OpenResty Inc..
Yichun is one of the earliest advocates and leaders of “open-source technology”. He worked at many internationally renowned tech companies, such as Cloudflare, Yahoo!. He is a pioneer of “edge computing”, “dynamic tracing” and “machine coding”, with over 22 years of programming and 16 years of open source experience. Yichun is well-known in the open-source space as the project leader of OpenResty®, adopted by more than 40 million global website domains.
OpenResty Inc., the enterprise software start-up founded by Yichun in 2017, has customers from some of the biggest companies in the world. Its flagship product, OpenResty XRay, is a non-invasive profiling and troubleshooting tool that significantly enhances and utilizes dynamic tracing technology. And its OpenResty Edge product is a powerful distributed traffic management and private CDN software product.
As an avid open-source contributor, Yichun has contributed more than a million lines of code to numerous open-source projects, including Linux kernel, Nginx, LuaJIT, GDB, SystemTap, LLVM, Perl, etc. He has also authored more than 60 open-source software libraries.
Related Articles
OpenResty XRay Apr 4, 2024

OpenResty XRay Aug 31, 2020

OpenResty XRay Jan 21, 2020

OpenResty XRay Feb 27, 2024

OpenResty XRay Mar 3, 2026