Application Lagging? OpenResty XRay: Instantly Uncover the Truth Behind 75ms Blockages
In the demanding landscape of high-concurrency web services, developers and operations teams frequently grapple with a perplexing challenge: their applications’ real-world performance consistently falls short of expectations. Consider this all-too-common scenario: a single Nginx worker process struggles to handle even 300 requests per second (RPS), yet your server’s system load is already pushing its logical CPU core limits. Delving deeper, you might uncover severe, multi-millisecond blockages within Nginx’s Event Loop. These issues are the “invisible performance killers,” silently eroding your system’s overall throughput and efficiency.
While traditional monitoring tools only surface symptoms, failing to pinpoint code-level blockages, OpenResty XRay offers a powerful, non-intrusive dynamic tracing solution purpose-built for precisely analyzing and resolving complex off-CPU issues, as we’ll demonstrate in this real-world case study.
Unraveling Performance Puzzles: CPU Resource Contention Comes to Light
Our initial step in the analysis involved using OpenResty XRay’s C-level off-CPU flame graph to investigate process wait events.
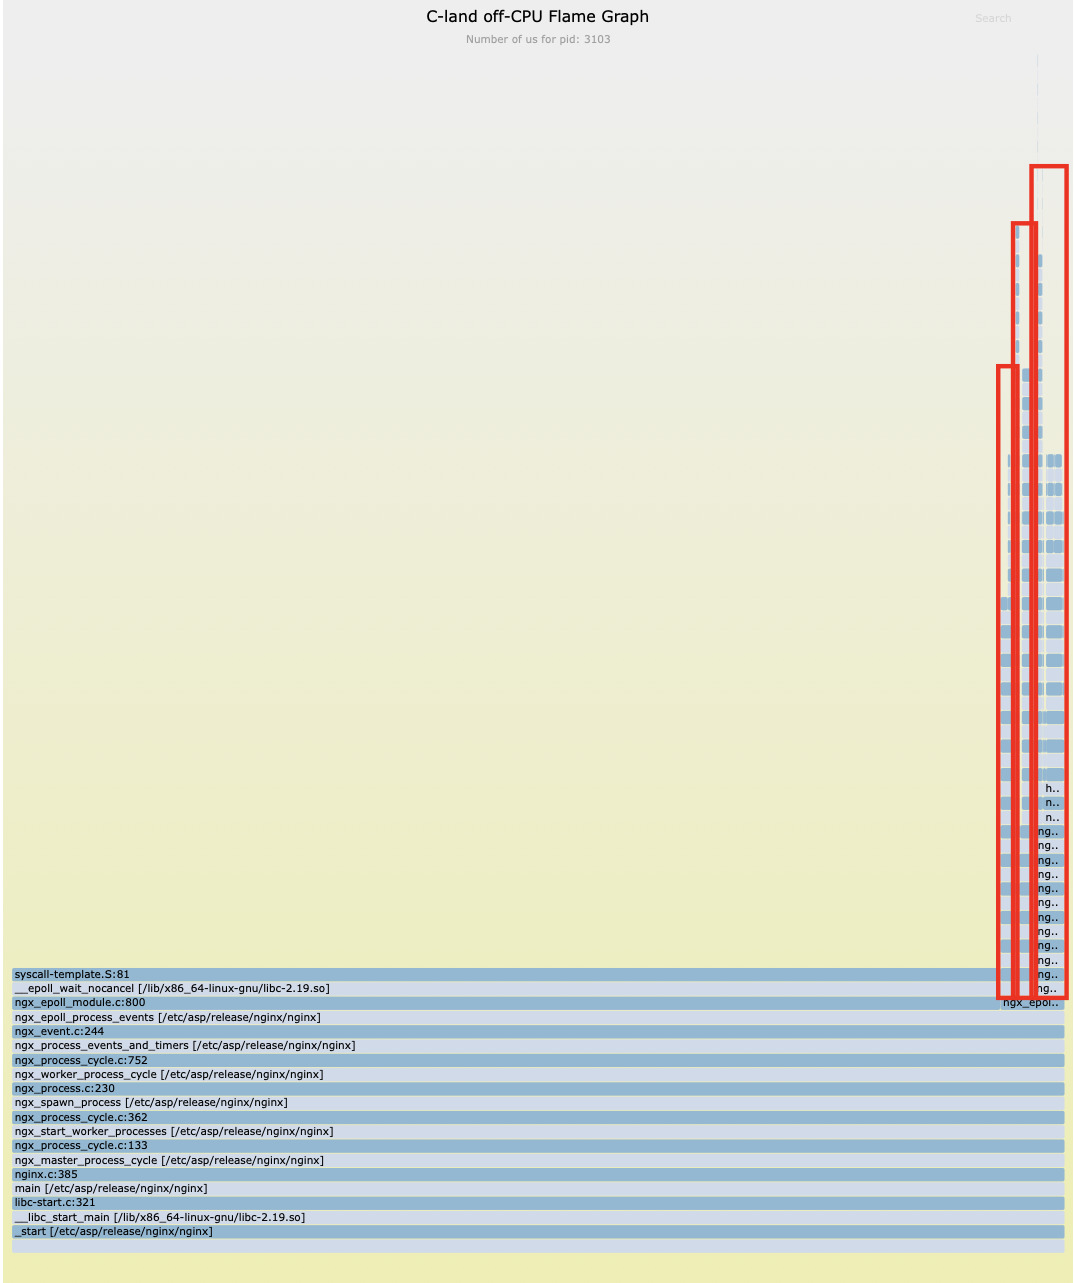
Our analysis revealed that, beyond the expected epoll_wait network I/O waits, a significant portion of off-CPU time was consumed by pure CPU computation-related functions such as mpi_mul_hlp and free.
This clearly indicated that the process was ready to run but failed to acquire CPU time slices promptly, a classic symptom of CPU resource contention.
Utilizing a specialized analyzer, we pinpointed the root cause of the issue: the worker_cpu_affinity directive was missing from the Nginx configuration file.
no cpu affinity set.
no cpu affinity set.
The absence of this specific configuration led to a significant issue: multiple nginx worker processes were frequently scheduled across different CPU cores by the Linux kernel. This resulted in unnecessary context switching overhead, ultimately reducing the effective utilization of your CPU resources.
The Real Culprit Revealed: Blocking Lua I/O Operations
Having addressed the CPU contention issue, we continued our analysis of off-CPU time.
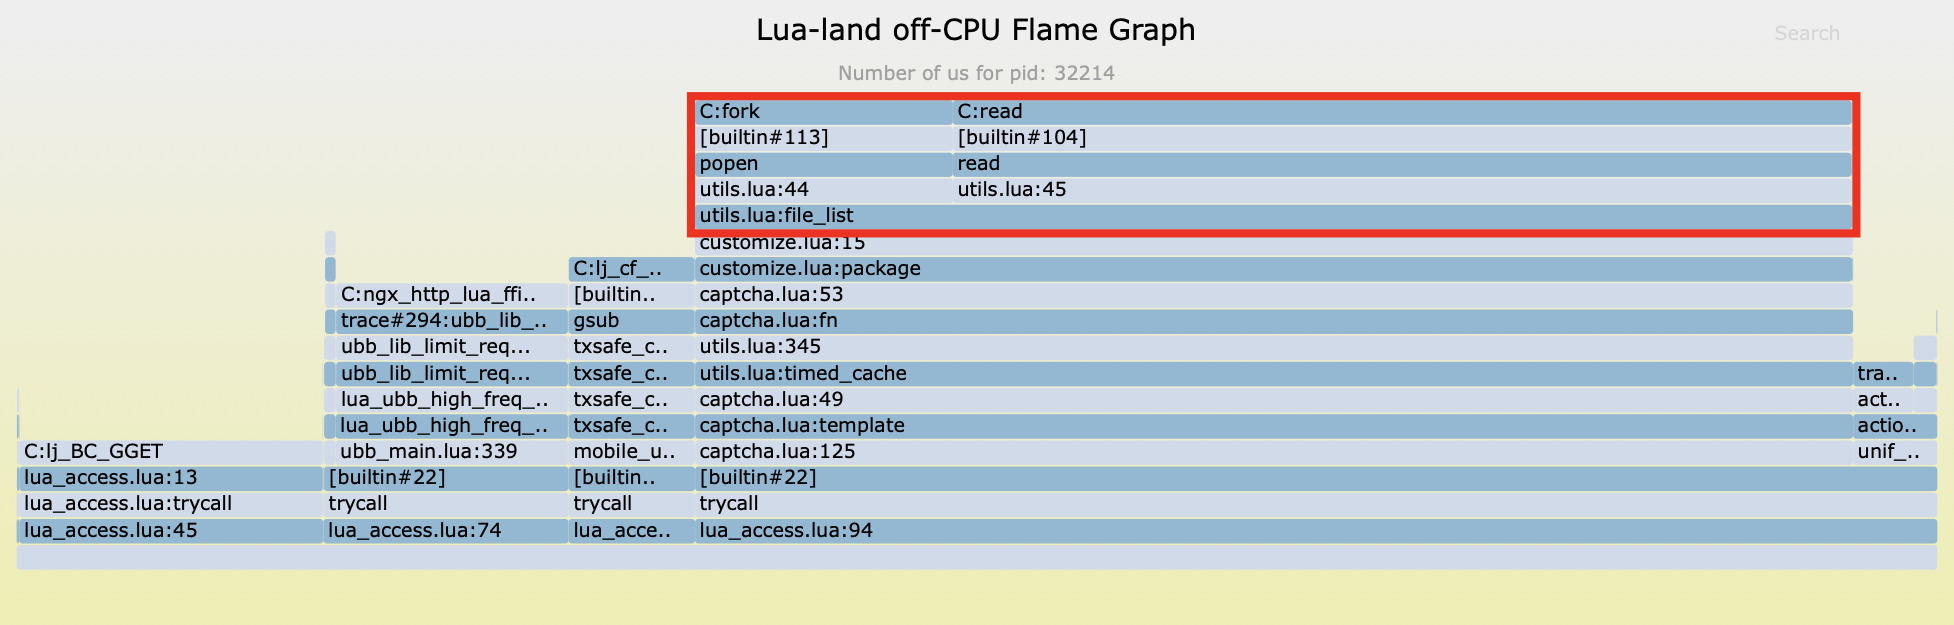
Upon further analysis, we discovered that the vast majority of off-CPU blocking time traced back to a single source: line 15 of a user-defined file, customize.lua.
This particular line of code invokes a function named file_list. Inside this function, we found the use of io.popen and read functions from the Lua standard library, which are employed to execute shell commands.
Crucially, these are synchronous blocking I/O operations. This means they halt the entire Nginx event loop, waiting until the external command fully executes and returns its results. This, right here, is a core reason behind the significantly reduced system throughput.
Quantitative Analysis: The Impact of File IO Performance
Understanding Blocking File IO Operations
Sample One
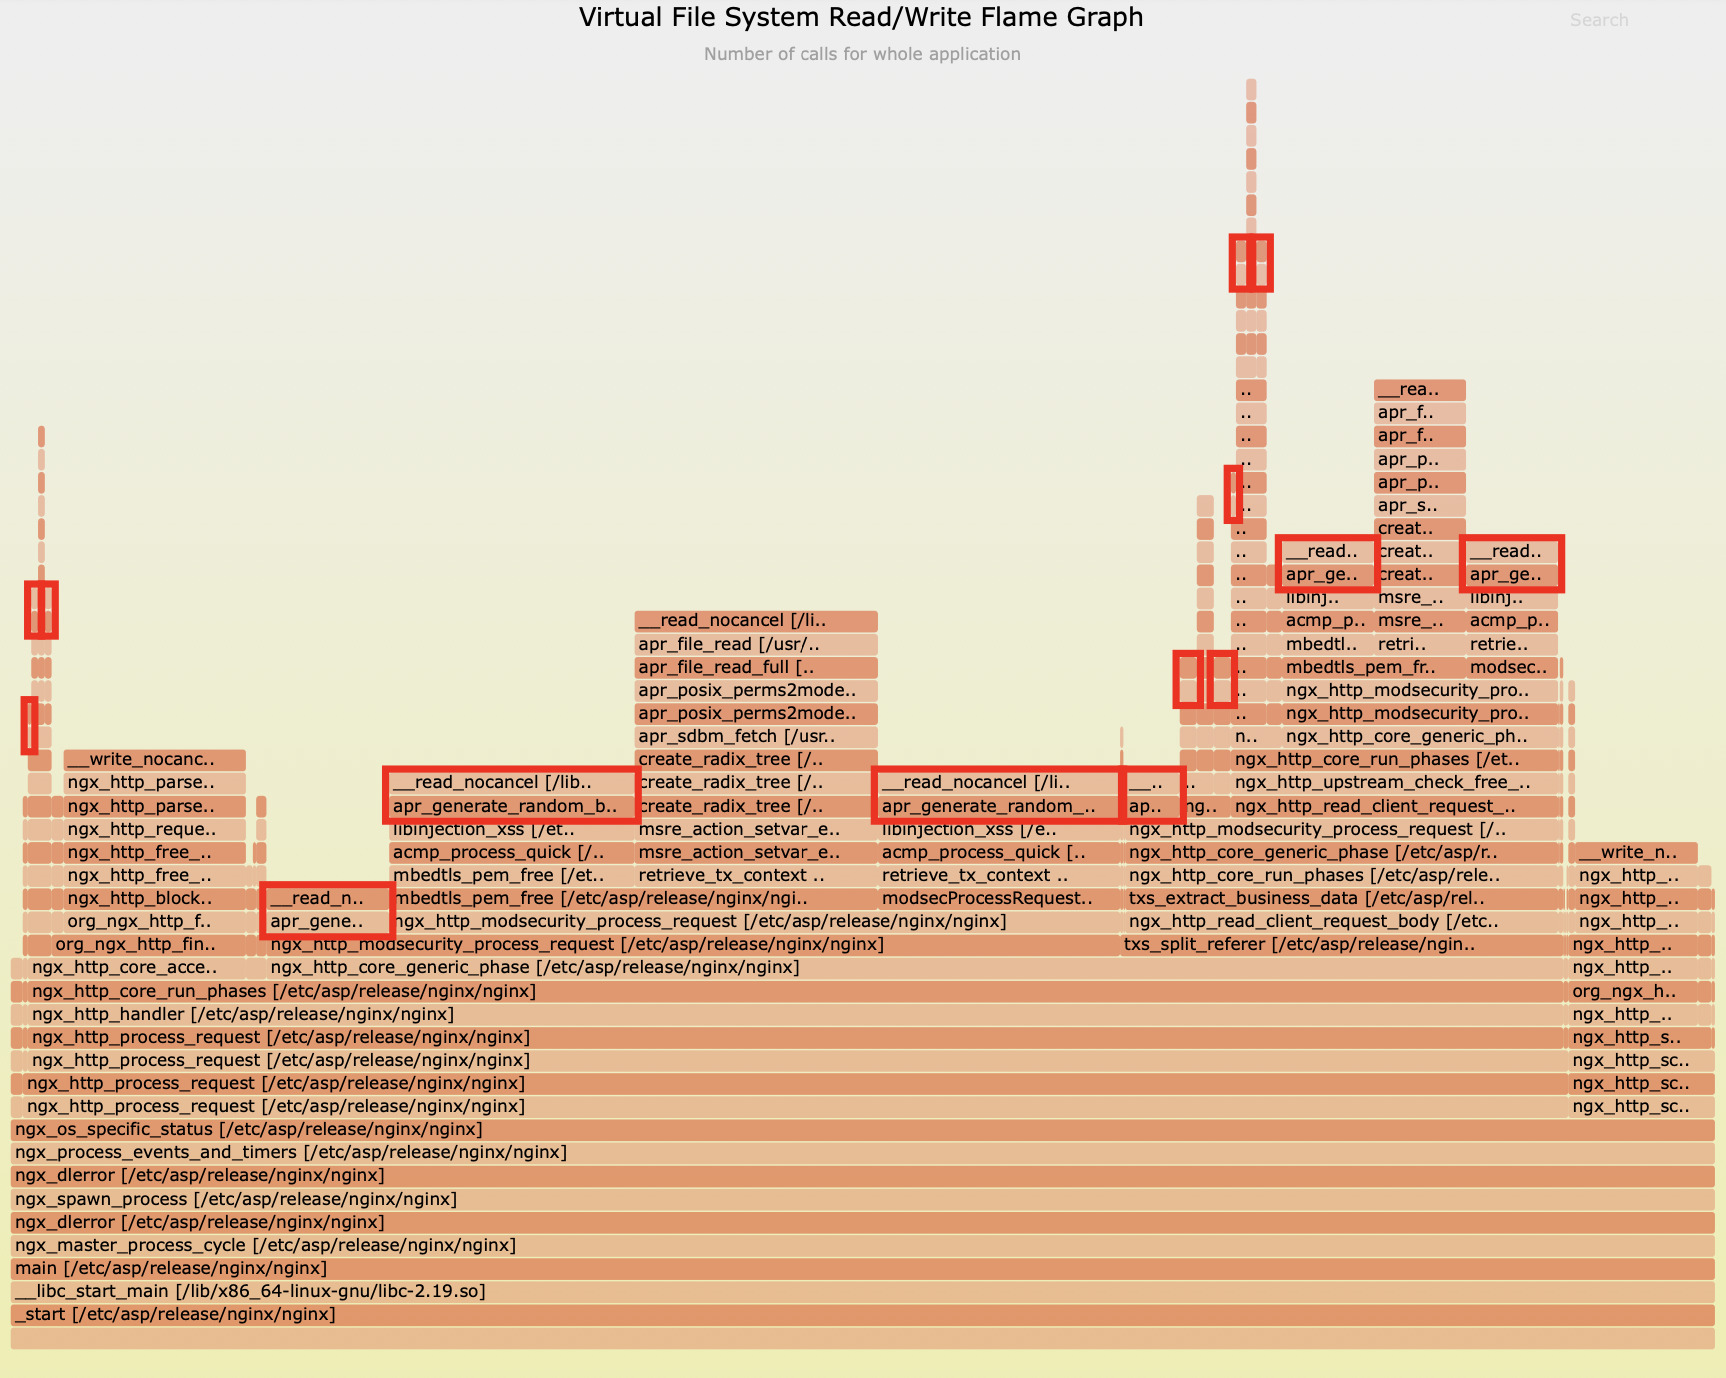
Beyond io.popen, our analysis using flame graphs that visualize C-level virtual file system read/write counts revealed two additional potential performance bottlenecks:
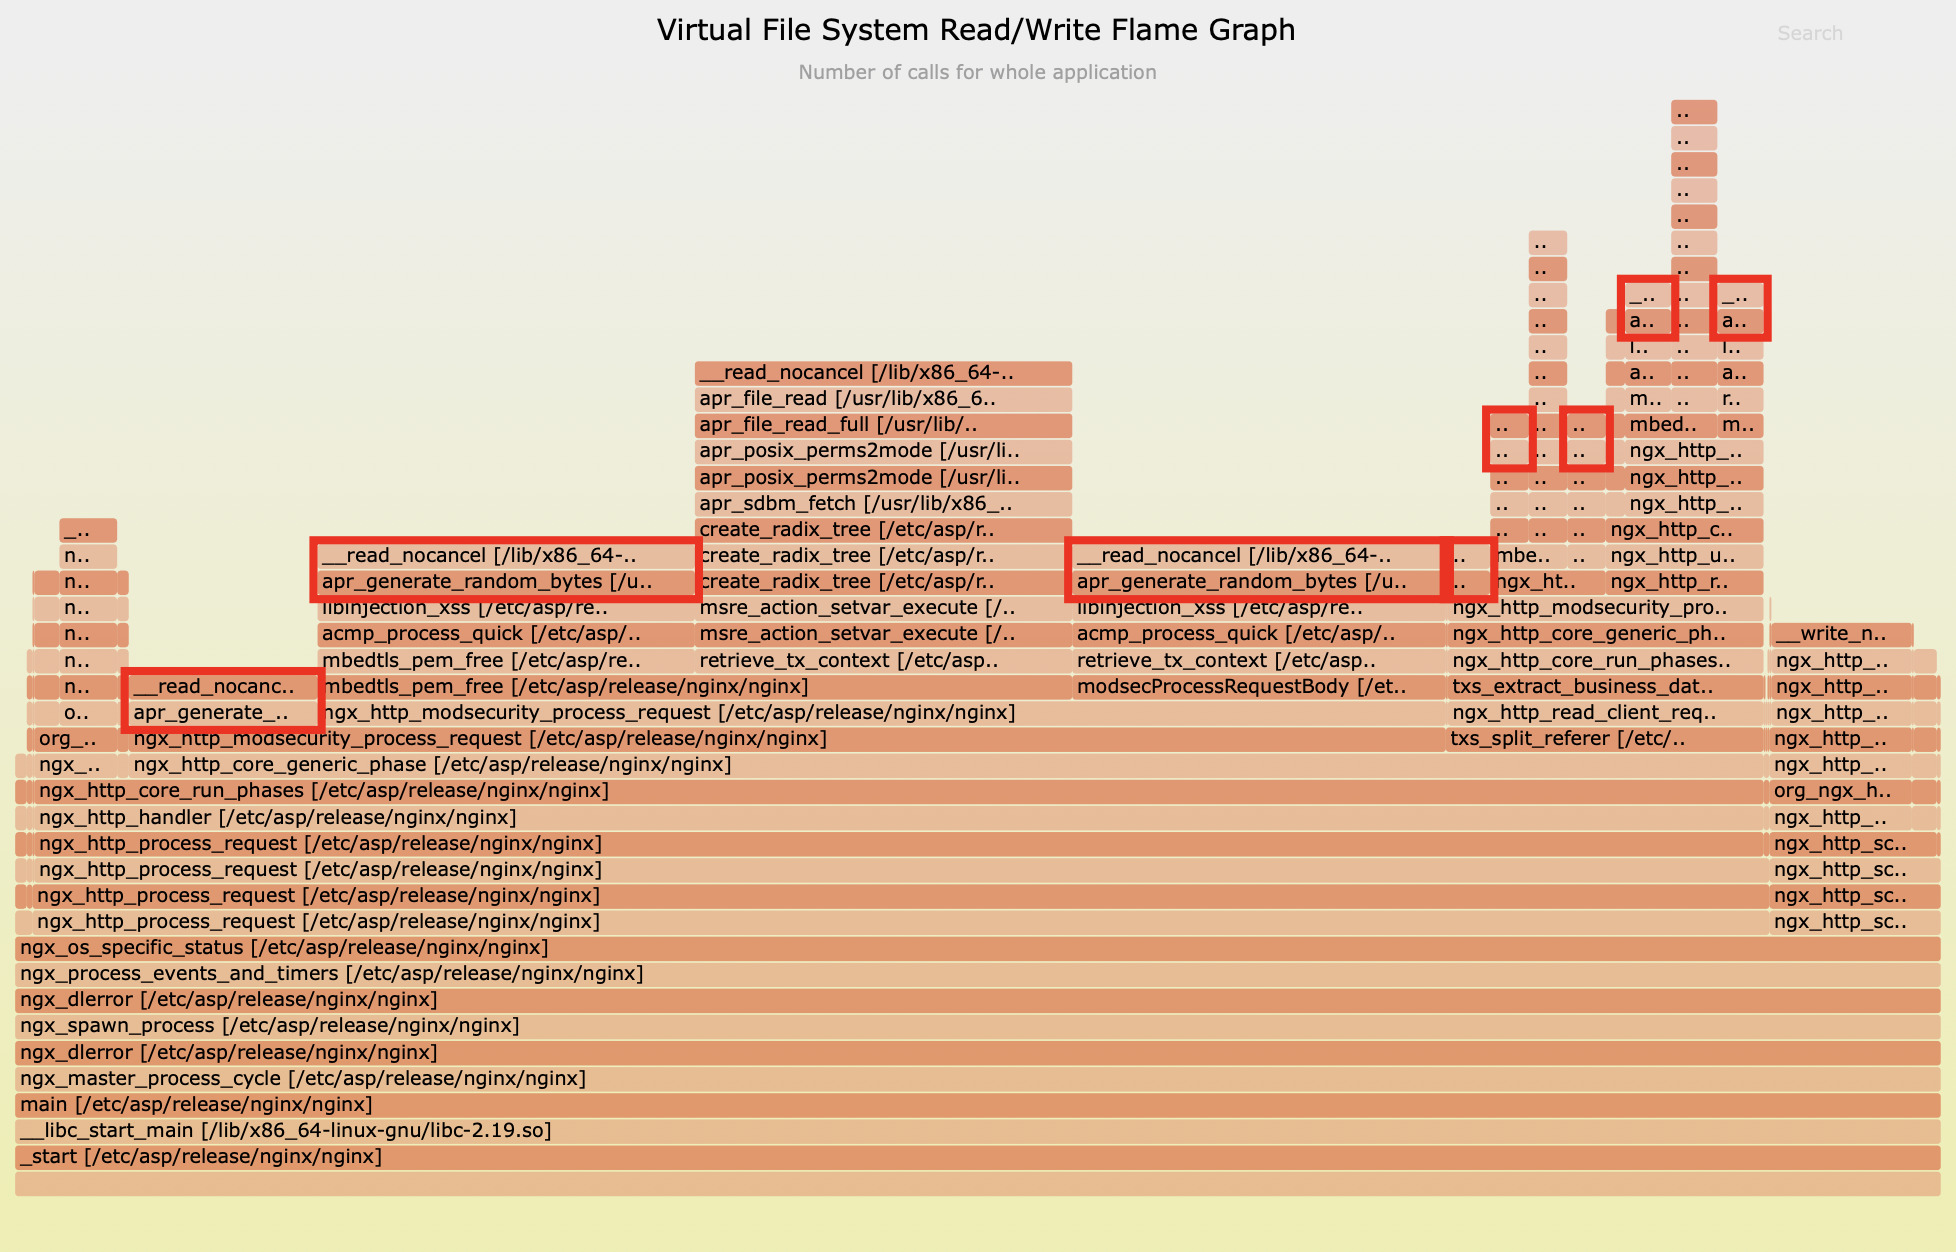
Looking at the flame graph above, it’s clear that the apr_generate_random_bytes function alone consumed a significant 59.8% of file read operations.
Meanwhile, the second flame graph highlights that the apr_sdbm_fetch function was responsible for 24% of file read operations.
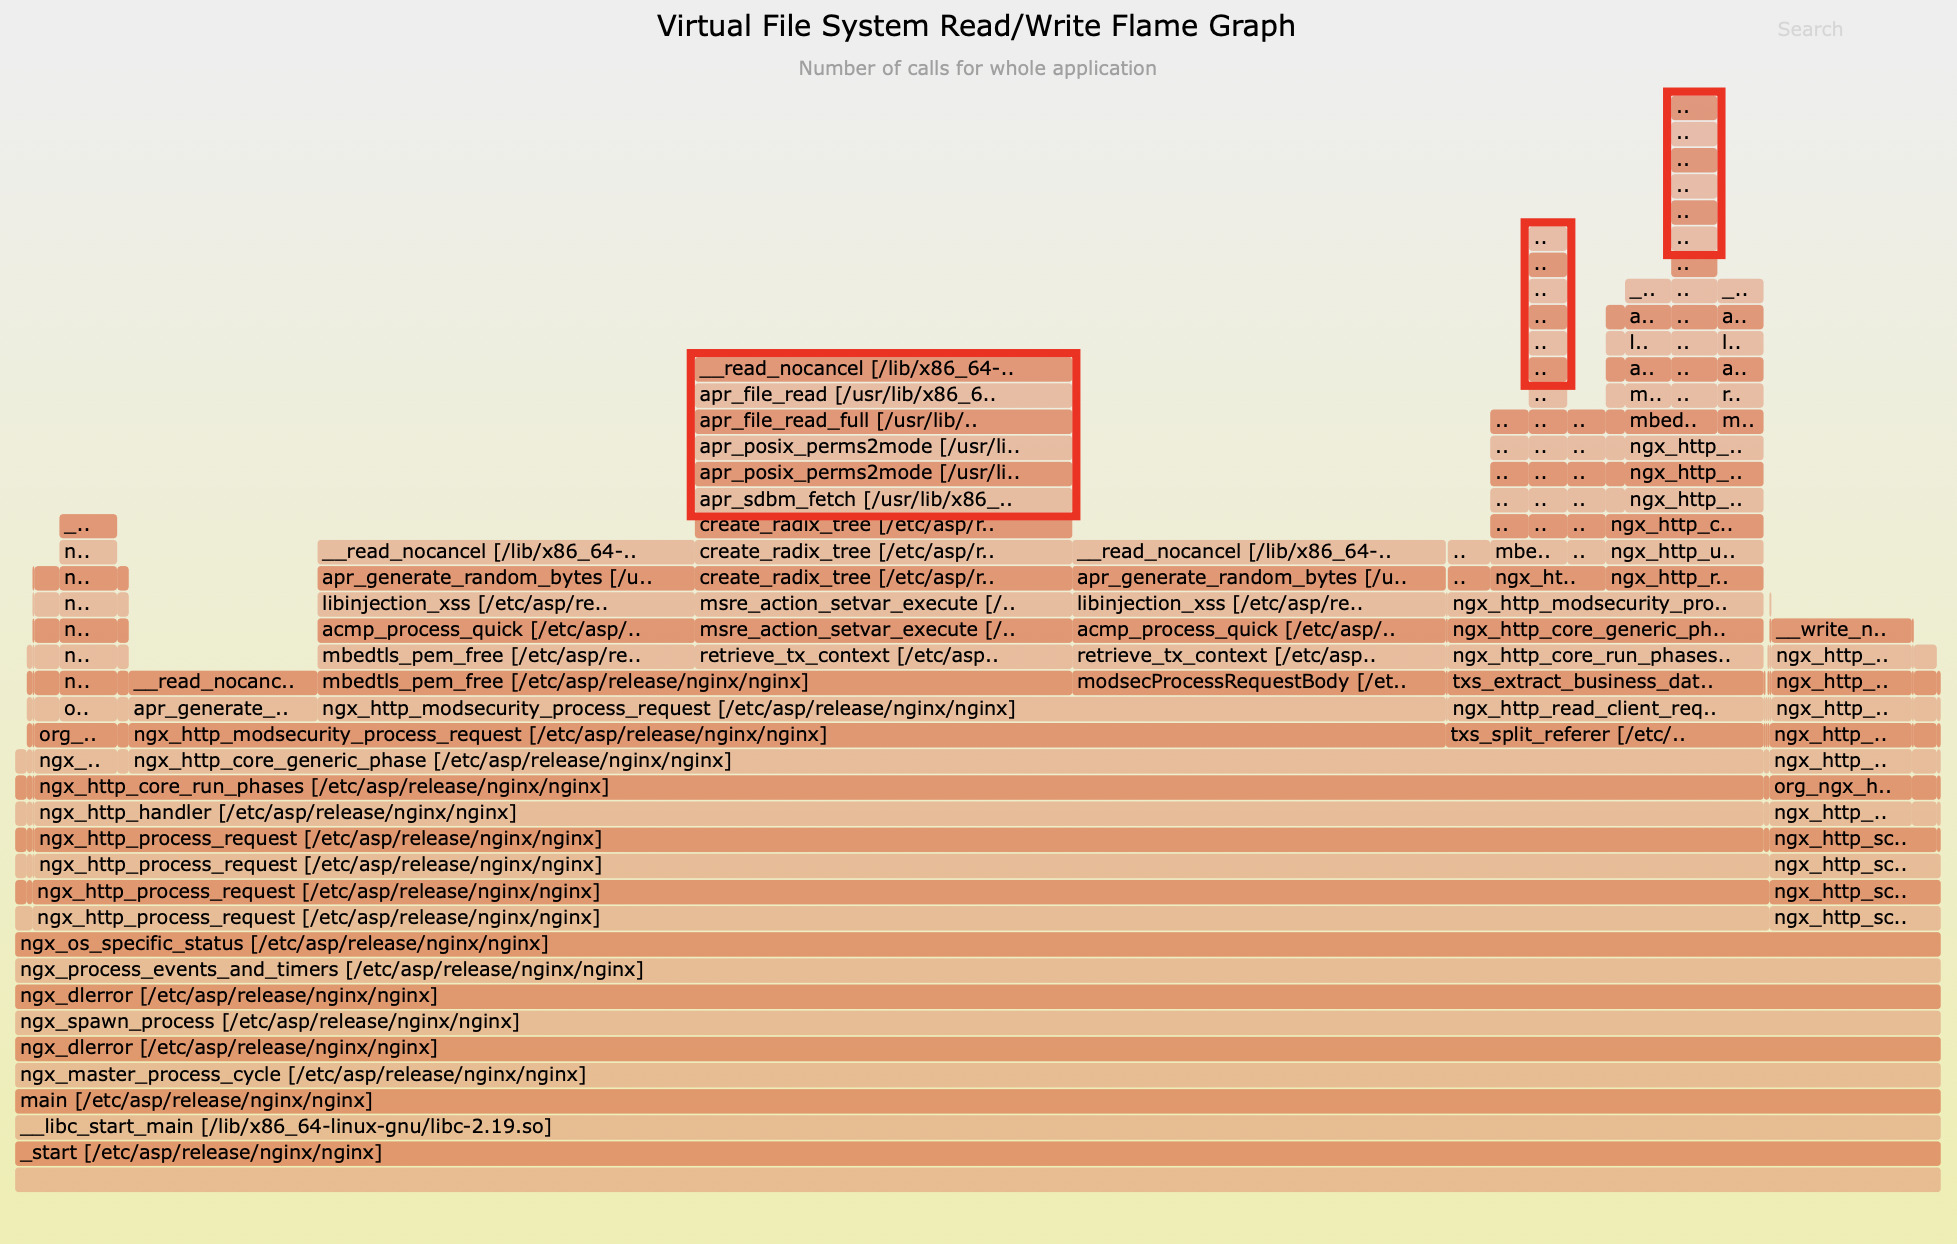
Sample Two
This graph clearly illustrates that during Apache runtime, the C function apr_generate_random_bytes alone accounted for 51.8% of file read operations.
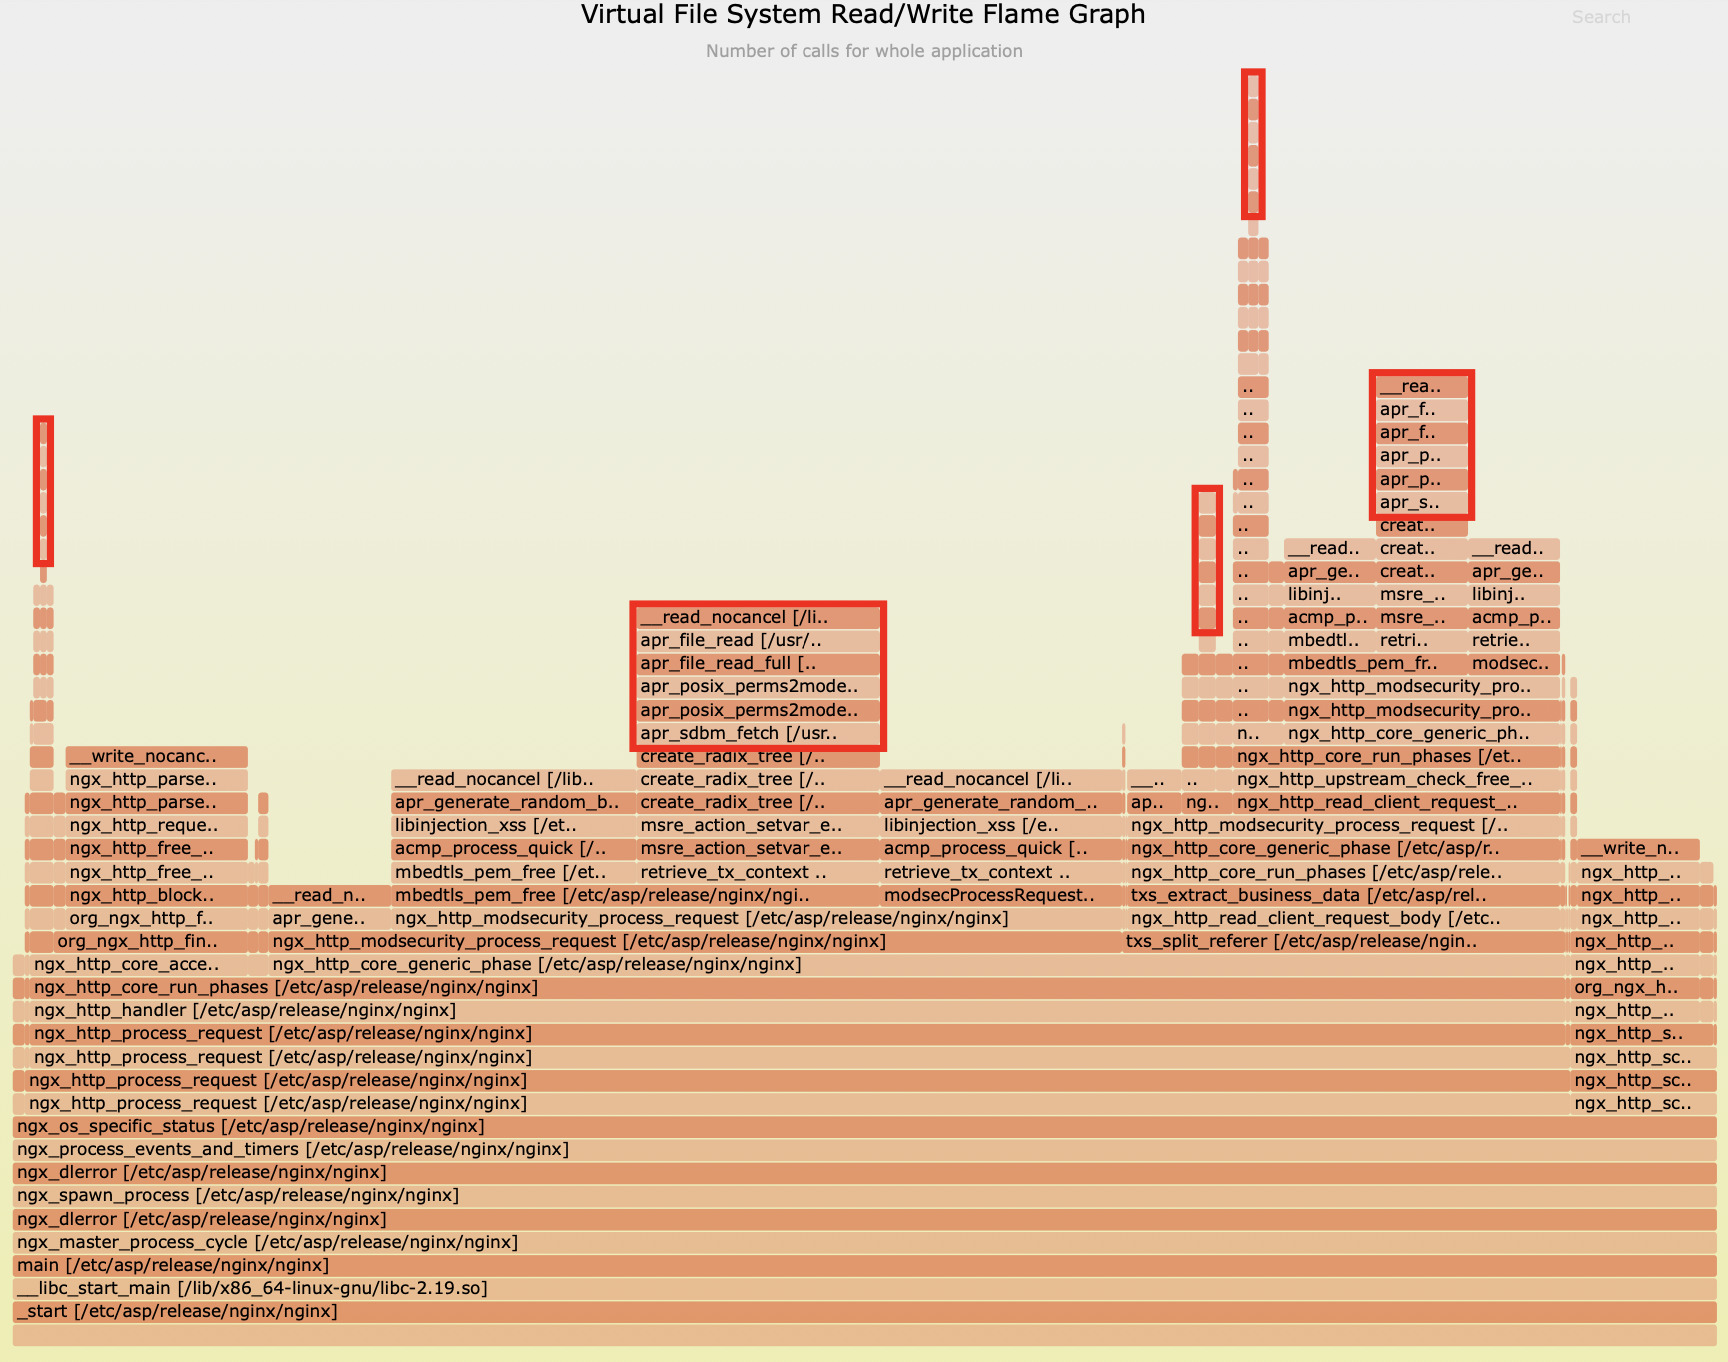
And the second graph further reveals that the apr_sdbm_fetch function collectively consumed 20.7% of file read operations.
Performance Assessment
To precisely evaluate the impact of these file I/O operations, we utilized specialized latency tools to meticulously measure the latency distribution of apr_generate_random_bytes:
3110 samples' latency: min=10, avg=17, max=1494 (us)
value |-------------------------------------------------- count
    2 |                                                      0
    4 |                                                      0
    8 |@@@@@@@@@@@@@@@@@@@@@@@@@@@@@@@@@@@@@@@@@@@@@@@@@  1540
   16 |@@@@@@@@@@@@@@@@@@@@@@@@@@@@@@@@@@@@@@@@@@@@@@@@   1499
   32 |@@                                                   64
   64 |                                                      4
  128 |                                                      1
  256 |                                                      1
  512 |                                                      0
 1024 |                                                      1
 2048 |                                                      0
 4096 |                                                      0
We observed that this function can reach a maximum latency of 1494 microseconds, or nearly 1.5 milliseconds, which is quite substantial. This can block the Nginx event loop, affecting the request latency for all current concurrent connections.
Similarly, for apr_sdbm_fetch, we’ve observed latencies occasionally approaching 1 millisecond:
1570 samples' latency: min=5, avg=10, max=953 (us)
value |-------------------------------------------------- count
    1 |                                                      0
    2 |                                                      0
    4 |@@@@@@@@@@@@@@@@@                                   383
    8 |@@@@@@@@@@@@@@@@@@@@@@@@@@@@@@@@@@@@@@@@@@@@@@@@@  1080
   16 |@@@@                                                100
   32 |                                                      4
   64 |                                                      2
  128 |                                                      0
  256 |                                                      0
  512 |                                                      1
 1024 |                                                      0
 2048 |                                                      0
For Nginx, a platform renowned for its high concurrency and low latency capabilities, even a single millisecond of synchronous blocking is a critical concern that simply cannot be overlooked.
Deep Dive: Understanding Event Loop Blocking in Nginx
To wrap things up, we conducted a thorough evaluation of the overall blocking behavior within the Nginx event loop.
Over a 20-second sampling period, we captured a staggering 43,952 blocking samples. What’s truly striking is that the maximum single blocking duration soared to 75,165 microseconds – that’s over 75 milliseconds.
distribution of epoll loop blocking latencies (us): 43952 samples: min/avg/max: 754/0/75165
 value |-------------------------------------------------- count
     0 |                                                      31
     1 |                                                     149
     2 |                                                      33
     4 |                                                     166
     8 |@@@@@@@@@@@@@@@@@@@@@@@@@@@@                        6094
    16 |@@@@@@@@@@@@@@@@@@@@@@@@@@@@@@@@@@@@@@@@@@@@@@@@@  10839
    32 |@@@@@@@@@@@@@@@                                     3278
    64 |@@@@@@@@@                                           2060
   128 |@@@@@@@@@@@                                         2530
   256 |@@@@@@@@@@@@@@@@@@@@@@@@@@@@@@@@@@@@@@@@@@@@@@     10082
   512 |@@@@@@@@@@@                                         2544
  1024 |@@@@@                                               1162
  2048 |@@@@@@@@@@                                          2343
  4096 |@@@@@@@@@@                                          2377
  8192 |                                                     199
 16384 |                                                      55
 32768 |                                                       8
 65536 |                                                       2
131072 |                                                       0
262144 |                                                       0
This data clearly illuminates why the application’s performance was so severely impacted. When the event loop is blocked for 75 milliseconds, it effectively means the worker process is completely incapacitated, unable to handle any new requests during that critical period.
Let’s put this into perspective by looking at a specific sample analysis:
found 3237 in reqs and 3238 done reqs in 3.103 sec (1043.07 r/s and 1043.39 r/s).
in reqs:
  pid 3101: 255.21 r/s
  pid 3102: 285.82 r/s
  pid 3103: 227.82 r/s
  pid 3106: 274.22 r/s
done reqs:
  pid 3102: 286.47 r/s
  pid 3103: 227.50 r/s
  pid 3101: 254.89 r/s
  pid 3106: 274.54 r/s
The Requests Per Second (RPS) for a single worker process hovered merely between 227-286. This RPS is exceptionally low, indicating that fewer than 300 requests were processed per second. Furthermore, the machine’s load was already nearing 4, which is equivalent to the number of logical CPU cores. This observation perfectly aligns with the severe blocking we identified.
Summary
In our in-depth analysis, we uncovered several critical issues significantly impacting system performance:
- CPU resource contention among
nginx workerprocesses led to extensive context switching, severely hindering effective CPU utilization. - Blocking Lua I/O operations, such as
io.popenandread, were frequently invoked within thecustomize.luafile, becoming the primary bottleneck for system performance. - File I/O operations from functions like
apr_generate_random_bytesandapr_sdbm_fetchalso caused significant blocking effects on the event loop. - A single Nginx event loop blockage lasted up to 75 milliseconds, directly resulting in a mere 227-286 RPS (Requests Per Second) per
workerprocess, far below expectations.
The presence of these issues was precisely the root cause of the system’s underperformance. Through OpenResty XRay’s precise diagnostics, we not only identified these bottlenecks but also provided clear directions for subsequent optimization.
Say Goodbye to Nginx Performance Nightmares with OpenResty XRay
OpenResty XRay is your ultimate weapon for solving complex performance challenges. With its unparalleled dynamic tracing capabilities, we don’t just pinpoint performance bottlenecks; we deliver profound value to your enterprise:
- Breakthrough Diagnostic Efficiency: Bid farewell to lengthy, traditional troubleshooting processes. OpenResty XRay slashes problem identification time from days to mere hours, ensuring your team is always a step ahead.
- Ultimate Hardware Resource Optimization: By eliminating performance bottlenecks, we can boost single-machine processing capacity severalfold, empowering you to handle larger business loads with fewer server resources.
- Seamless Business Continuity Assurance: Proactively identify and eliminate potential performance risks, ensuring stable system operation and preventing service interruptions caused by overload.
- Comprehensive Technical Debt Cleanup: Systematically uncover and resolve legacy performance issues, significantly enhancing code quality and the overall health of your system architecture.
In today’s digital economy, where success is often measured in milliseconds, application performance directly impacts user experience and business success. OpenResty XRay, with its advanced dynamic tracing technology, completely revolutionizes traditional performance optimization methods, providing a solid, scientific foundation for your technical decisions.
If your applications are grappling with performance challenges, OpenResty XRay will provide you with unparalleled precise insights, transforming performance into a powerful engine for your business growth.
What is OpenResty XRay
OpenResty XRay is a dynamic-tracing product that automatically analyzes your running applications to troubleshoot performance problems, behavioral issues, and security vulnerabilities with actionable suggestions. Under the hood, OpenResty XRay is powered by our Y language targeting various runtimes like Stap+, eBPF+, GDB, and ODB, depending on the contexts.
If you like this tutorial, please subscribe to this blog site and/or our YouTube channel. Thank you!
About The Author
Yichun Zhang (Github handle: agentzh), is the original creator of the OpenResty® open-source project and the CEO of OpenResty Inc..
Yichun is one of the earliest advocates and leaders of “open-source technology”. He worked at many internationally renowned tech companies, such as Cloudflare, Yahoo!. He is a pioneer of “edge computing”, “dynamic tracing” and “machine coding”, with over 22 years of programming and 16 years of open source experience. Yichun is well-known in the open-source space as the project leader of OpenResty®, adopted by more than 40 million global website domains.
OpenResty Inc., the enterprise software start-up founded by Yichun in 2017, has customers from some of the biggest companies in the world. Its flagship product, OpenResty XRay, is a non-invasive profiling and troubleshooting tool that significantly enhances and utilizes dynamic tracing technology. And its OpenResty Edge product is a powerful distributed traffic management and private CDN software product.
As an avid open-source contributor, Yichun has contributed more than a million lines of code to numerous open-source projects, including Linux kernel, Nginx, LuaJIT, GDB, SystemTap, LLVM, Perl, etc. He has also authored more than 60 open-source software libraries.
Related Articles
OpenResty XRay Dec 23, 2025

OpenResty XRay Feb 18, 2023

OpenResty XRay Jul 16, 2025

OpenResty XRay Jul 8, 2026

OpenResty XRay Jan 13, 2026


