How to Diagnose Java Memory Leaks in Production — Without Heap Dumps or Restarts
To diagnose a Java memory leak in production, you analyze the running JVM’s GC object reference chains to find which GC roots still hold objects that should have been freed—without pausing the application, exporting a heap dump, or restarting the process. This article shows how, walking through a real order-system case with OpenResty XRay.
We follow a top-down path in three steps:
- Pinpoint the leak: use GC object reference analysis to find the root causes of unexpected memory retention.
- Address performance fluctuations: use GC object allocation-frequency analysis to uncover code paths responsible for high-frequency object creation.
- Optimize memory footprint: use GC object allocation-size analysis to locate the origins of large-object creation.
Why Full GCs Didn’t Reclaim the Heap: A Production Java Memory Leak
During a performance regression test of a customer’s order system, we observed a typical memory anomaly: the application’s heap memory curve exhibited a continuous upward trend, and even after multiple Full GCs, the heap space usage did not significantly recede.
Based on engineering experience, this phenomenon usually points to two potential problems:
- Memory Leak: This occurs when objects that should have been reclaimed after losing their references are instead kept alive in memory due to unexpected GC Root reference chains.
- High-frequency object creation “churn” (Memory Churn) on specific business paths, resulting from the creation and destruction of a large number of short-lived objects, which leads to excessive Young GC pressure and, in turn, frequently triggers Full GC.
Traditional heap dump analysis methods, such as using jmap to export HPROF files and then performing offline analysis with tools like MAT, while powerful, face challenges in a production environment. Exporting a heap snapshot of several GBs can itself cause a long STW (Stop-the-World) event, which is unacceptable for online services.
To perform “online” diagnosis without interrupting services and without introducing significant performance overhead, we utilized OpenResty XRay to analyze the running JVM.
How to Diagnose a Java Memory Leak in Production Without a Heap Dump
We adopted a “top-down” diagnostic strategy, first confirming the presence of leaks, and then investigating issues related to allocation frequency and size.
Step 1: Locate the Leak Through GC Root Reference Analysis
The primary task is to confirm the existence of memory leaks and identify their source. We utilized OpenResty XRay’s GC Object Reference Graph Analyzer.
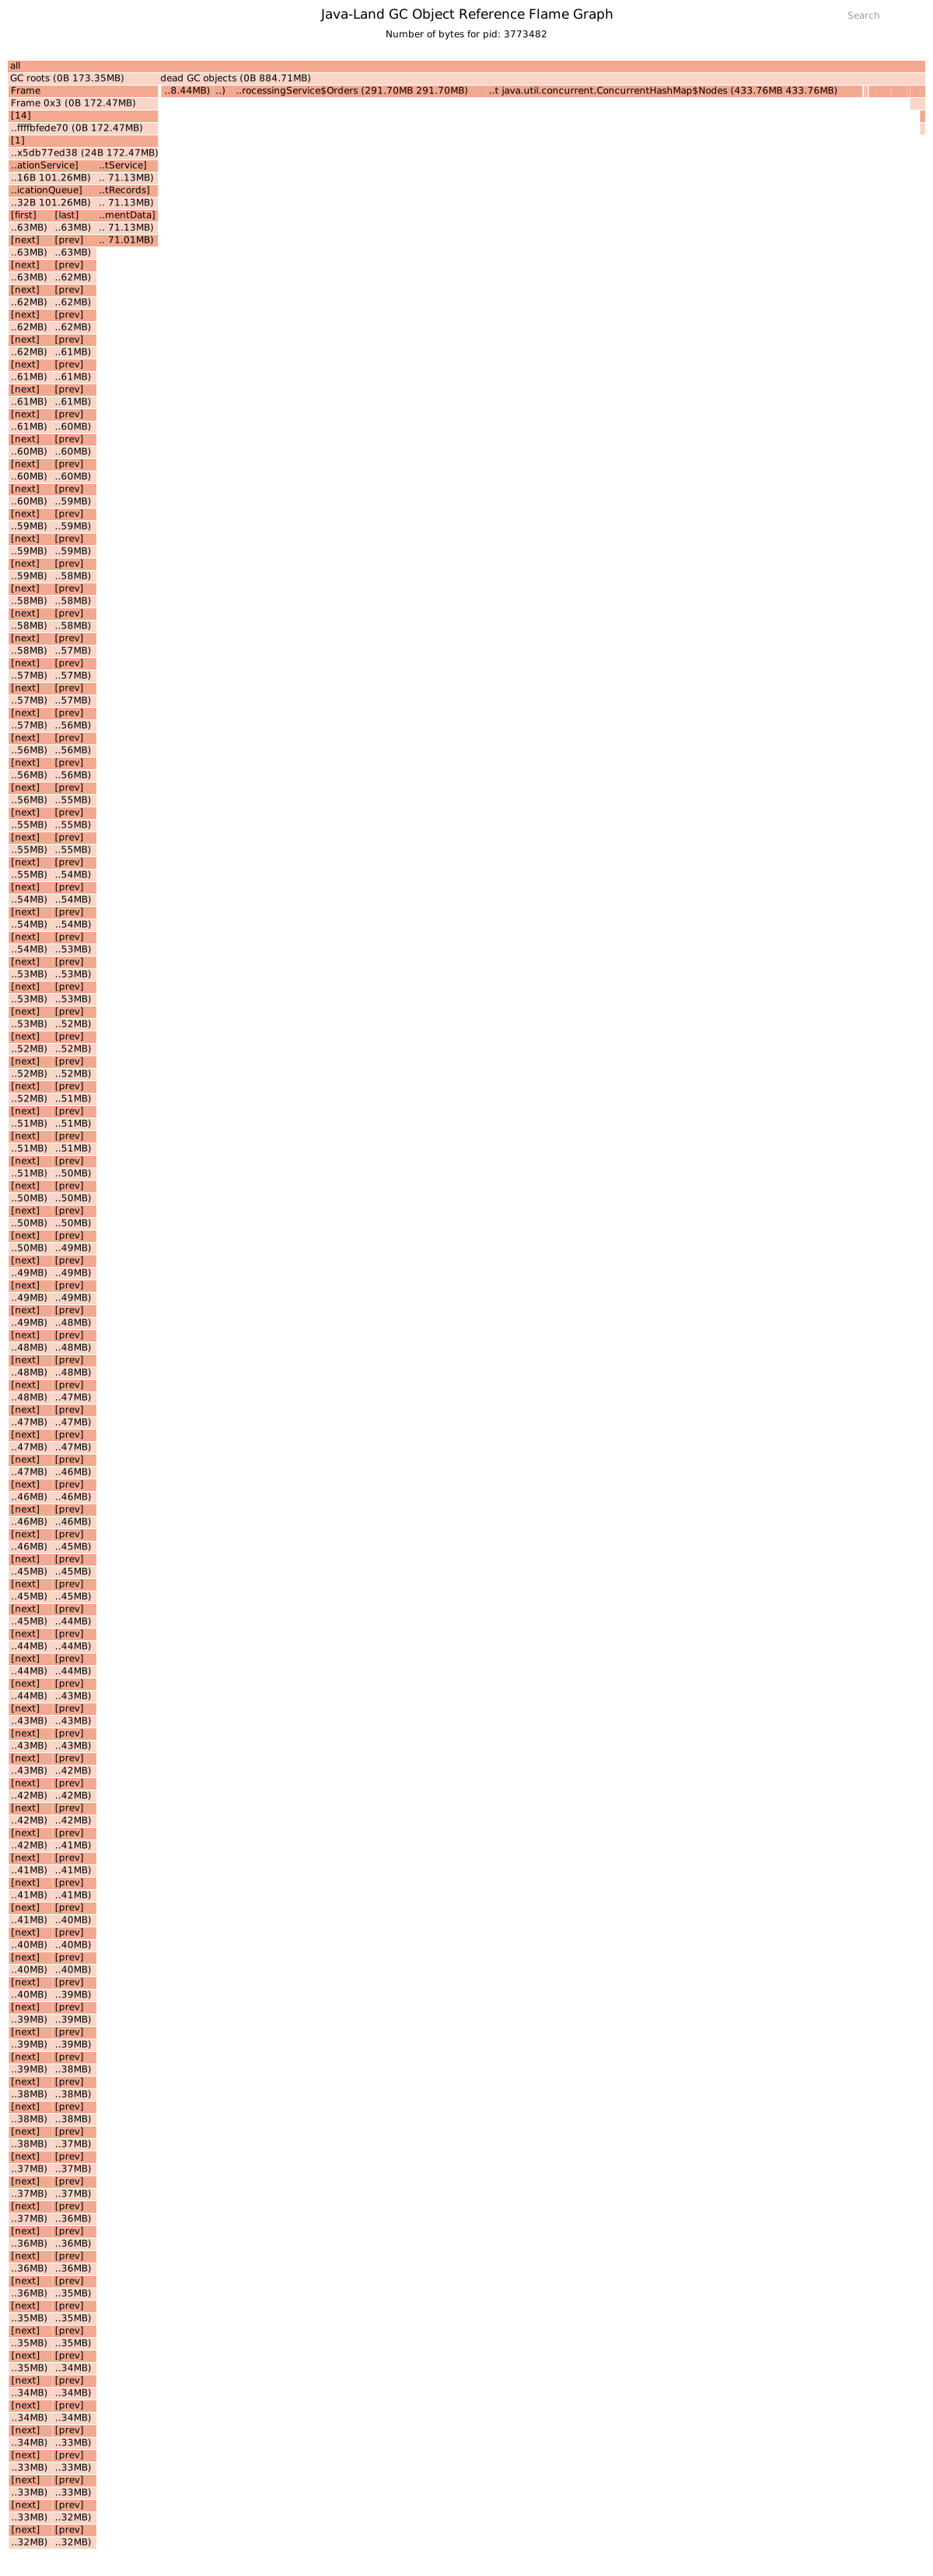
After initiating the analysis, the flame graph report clearly categorizes objects in memory into two types:
- Dead GC objects: Objects that have died and are awaiting garbage collection (can be ignored).
- Objects referenced by GC roots: Live objects (the focus of our investigation).
Our investigation focused on the latter. Iterating through the GC root reference chain, the analysis tool clearly identified the primary memory consumer: the OrderProcessingService$OrderService instance.
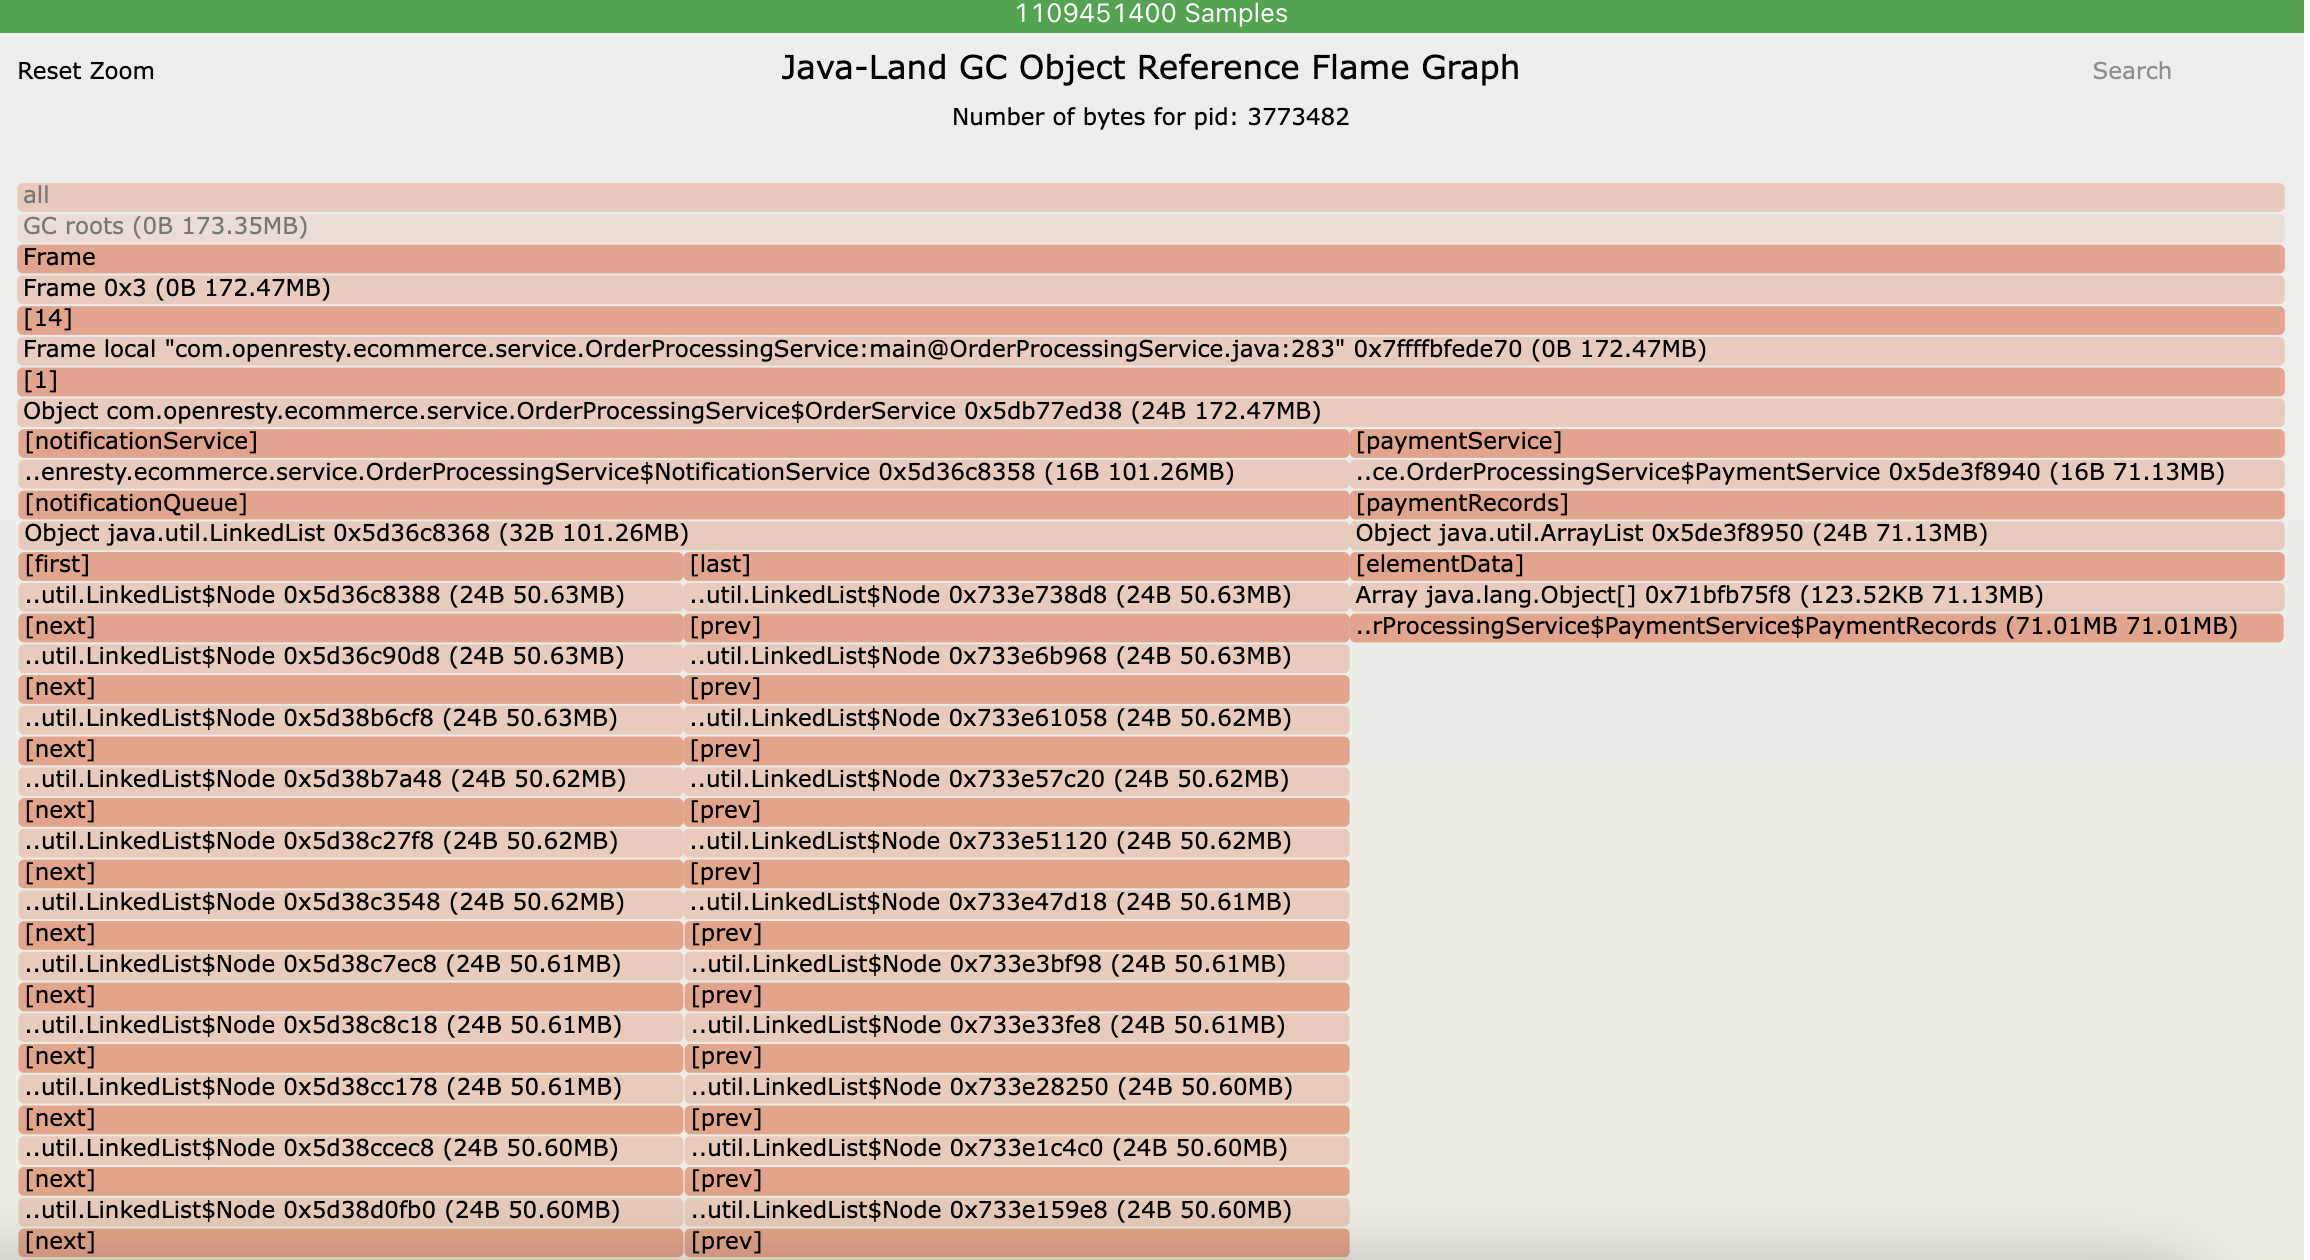
Upon deeper investigation, it was found that this instance’s memory footprint was largely attributed to two fields:
notificationQueue(a concurrent queue)paymentRecords(an array of payment records)
By analyzing the reference paths, we confirmed that objects within these collections were expected to be removed after the business process completed. However, due to a logic flaw, their lifecycle was prolonged beyond expectation, thereby confirming the presence of a memory leak.
Step 2: Detect Memory Churn via GC Allocation-Frequency Analysis
After identifying the leak point, the next question is whether there’s unnecessary memory churn. High-frequency memory allocation exacerbates GC pressure, and even without a leak, it can impair system throughput.
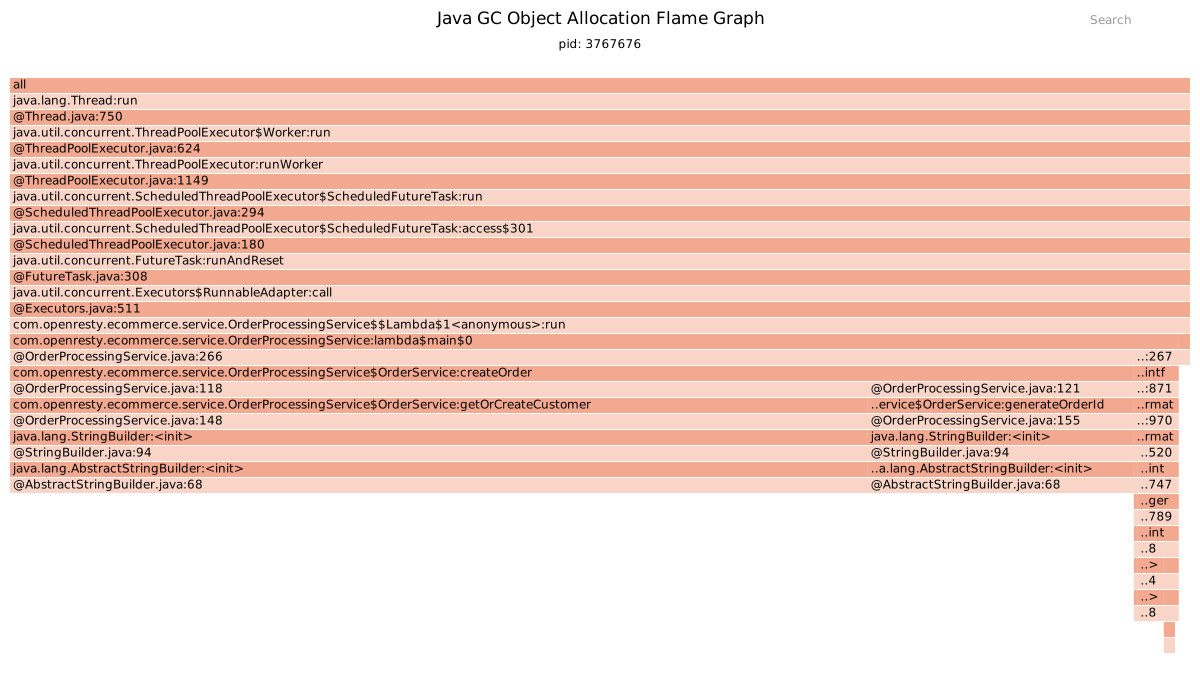
Using OpenResty XRay’s GC Object Allocation Profiler, we obtained a flame graph showing object creation frequency categorized by code path.
The report indicates that the createOrder method (@OrderProcessingService.java:118) exhibits a significantly higher number of object creations (represented by the width in the flame graph) compared to other business logic paths.
Frequent object creation, especially when objects are promoted to the old generation, can lead to frequent Young GC cycles and may accelerate the consumption of space in the old generation. This, in turn, increases Stop-The-World (STW) pause times, thereby negatively impacting P99 response latency.
Step 3: Pinpoint Large Objects with GC Allocation-Size Analysis
Finally, we investigated the “large object” problem, specifically identifying paths that frequently create voluminous objects.
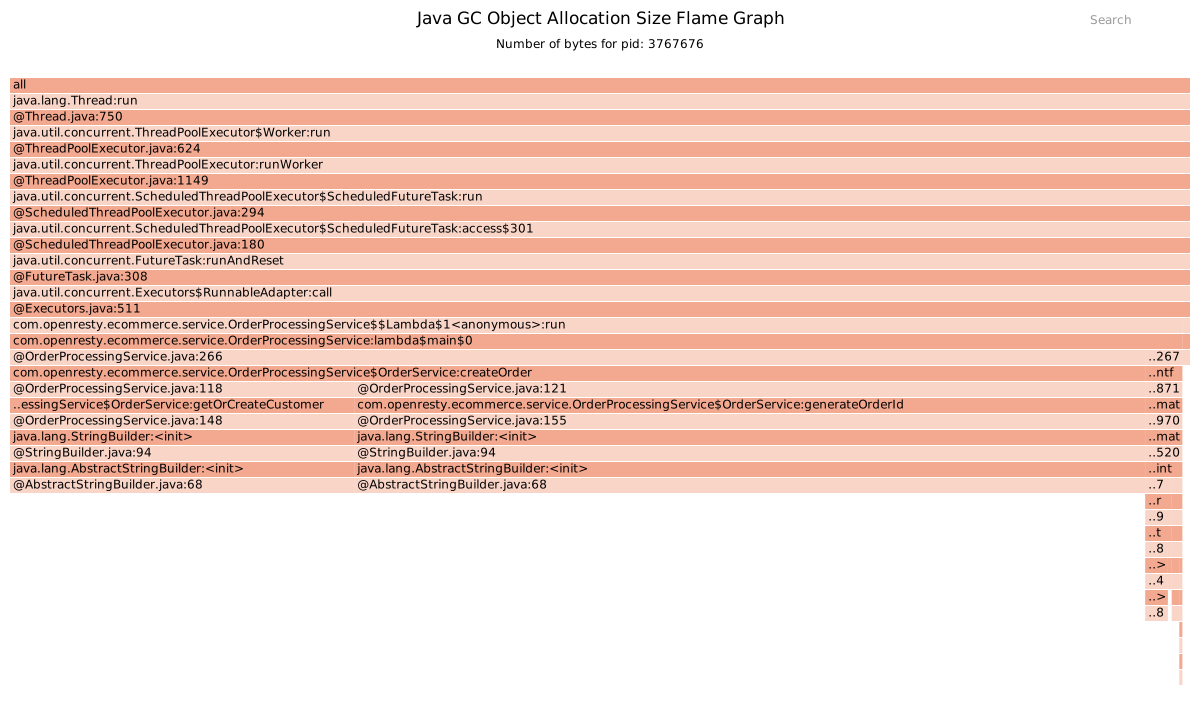
We switched to the GC Object Allocation Size Analyzer. The GC object allocation flame graph visualizes the total size of GC objects created within the sampling interval. The larger the total size of objects created, the more prominently it is represented on the graph.
The analysis report indicated that the generateOrderId method (@OrderProcessingService.java:155) and its downstream calls, while not high in frequency, exhibited a very significant memory footprint, primarily due to the frequent creation of large string objects.
Upon evaluation, this ID generation logic showed a high potential for redundant computation (or “high cacheability”), making it an ideal candidate for caching. By implementing caching for the string generation logic, we significantly reduced the peak heap usage for this execution path.
Results: Lower GC Overhead and Stable P99 Latency
Leveraging OpenResty XRay’s three analyzers, we rapidly achieved complete closed-loop root cause identification, from symptom to underlying issue.
- Enhanced Diagnostic Efficiency: Previously, relying on traditional heap dump tools necessitated repeated comparisons and manual tracing of reference chains. With XRay’s flame graph, we can now intuitively pinpoint problem hotspots in just minutes, significantly reducing diagnosis time.
- Improved System Performance: After resolving the issues, the GC time percentage notably decreased, application response under the same load became more stable, and the overall latency curve stabilized.
More importantly, this practice introduced a methodological shift. OpenResty XRay’s visual analysis empowers team members to directly understand the lifecycle and reference relationships of objects in memory. Tuning discussions transitioned from “guessing based on experience” to “evidence-based decision-making,” making performance optimization more predictable.
How to Find a Java Memory Leak: A Reusable 3-Step Method
The case above generalizes into a repeatable method. Whatever tooling you use, a Java memory leak is easiest to isolate by asking three questions in order, moving from object retention to object allocation:
- Which objects are being retained, and by what? Follow the GC object reference chains back to their GC roots. A leak appears as objects that should have been released but remain reachable through an unexpected reference—in the case study, the collections
notificationQueueandpaymentRecords, whose entries were expected to be removed after the business process completed but were not. - Which code paths allocate most frequently? High-frequency object creation (memory churn) raises Young GC pressure and can trigger frequent Full GCs even without a leak. Allocation-frequency analysis surfaces the hot paths—here, the
createOrdermethod. - Which code paths allocate the most memory? Some paths create few objects but very large ones. Allocation-size analysis pinpoints them—in the case study, the large string objects created in
generateOrderId.
Working from retention (step 1) to allocation frequency and size (steps 2 and 3) narrows the investigation from “is memory leaking?” to “exactly which code is responsible.”
Why Use OpenResty XRay to Find Java Memory Leaks on a Live JVM?
Traditional Java memory analysis heavily relies on Heap Dumps. This “offline post-mortem” approach has inherent limitations.
| Traditional Heap Dump Tools | Core Limitations |
|---|---|
| Requires Process Pause/Restart | 1. Exporting heap snapshots (jmap) typically triggers Stop-The-World (STW) events, leading to prolonged downtime for production services. |
| High Analysis Overhead | 2. Heap files are often massive (several GBs), requiring significant time for transfer and loading. |
| Lack of Real-time Data | 3. Only allows analysis of a static snapshot, making it impossible to observe real-time system changes. |
OpenResty XRay offers an alternative approach: non-intrusive “online analysis”. By design, it addresses the drawbacks of traditional tools.
Production-Ready Deployment OpenResty XRay eliminates the need to restart Java processes, modify code, or replace the JDK. It connects directly to the running JVM via a secure attach mechanism, operating completely transparently to your applications.
Ultra-Low Overhead and Non-Intrusive Approach This represents a core technological advantage of OpenResty XRay. It does not rely on the JVM Safepoint mechanism for data sampling. This capability allows it to analyze JVM memory, CPU, I/O, and other critical metrics without triggering any STW (Stop-the-World) events. Consequently, it stands out as one of the rare tools truly capable of performing deep diagnostics under live production traffic.
Intuitive Visual Analytics Its GC object reference flame graphs and memory reference path diagrams provide clear, visual answers to questions like “who is referencing what?” and “where has the memory gone?”, significantly lowering the barrier to analyzing complex memory issues.
Multi-Dimensional Performance Profiling
OpenResty XRay extends beyond just memory analysis. While this case study focuses on GC, users can seamlessly switch to CPU flame graphs, I/O analysis, and other views at any time to construct a comprehensive system performance profile within context.
This design positions OpenResty XRay as one of the few tools capable of real-time Java memory problem analysis directly in production environments. In the aforementioned order system case, it enabled the team to establish a “real-time diagnosis + rapid verification” loop, effectively mitigating the risks associated with downtime for analysis.
Key Takeaways: Diagnosing Java Memory Leaks Without Restarts or Downtime
In troubleshooting memory issues for the order system, OpenResty XRay helped us establish a systematic diagnostic process. This process progressed through several stages, narrowing down the investigation scope: from identifying “memory leaks” to analyzing “allocation frequency” and “object size”; and from examining “object reference chains” to understanding “allocation counts” and “allocated memory size.”
This analytical approach, based on real-time sampling and visualization, effectively replaces traditional heap dump and offline analysis methods. It not only significantly improves diagnostic efficiency but, more importantly, offers a safer and more efficient strategy for performance tuning high-concurrency, high-availability Java services in production environments.
Frequently Asked Questions
Can you find a Java memory leak without a heap dump?
Yes. Instead of exporting an HPROF heap snapshot with jmap and analyzing it offline, OpenResty XRay connects to the running JVM through a secure attach mechanism and analyzes GC object reference chains live. This avoids the large (multi-GB) heap files and the offline, static-snapshot workflow that traditional heap dump tools require.
Does analyzing Java memory in production cause Stop-the-World pauses?
Exporting a heap snapshot with jmap typically triggers a Stop-the-World (STW) event, which can mean prolonged downtime for production services. OpenResty XRay does not rely on the JVM Safepoint mechanism for data sampling, so it can analyze JVM memory without triggering STW events—making it usable under live production traffic.
How do you tell a memory leak apart from memory churn?
A memory leak happens when objects that should have been reclaimed stay alive because of unexpected GC Root reference chains. Memory churn is the high-frequency creation and destruction of short-lived objects, which raises Young GC pressure and can trigger frequent Full GCs. In this case study, the reference-graph analyzer confirmed the leak, while the allocation profiler exposed the churn on the createOrder path.
What are the three steps to diagnose a Java memory problem with OpenResty XRay?
The case study follows a top-down path using three analyzers: (1) the GC Object Reference Graph Analyzer to locate leaks via GC root reference chains; (2) the GC Object Allocation Profiler to find high-frequency object creation (memory churn); and (3) the GC Object Allocation Size Analyzer to pinpoint code paths that create large objects.
Why not just use jmap and MAT?
Traditional heap dump tools have three core limitations described in this article: exporting a snapshot with jmap usually triggers a Stop-the-World event and downtime; heap files are often several GBs and take significant time to transfer and load; and you can only analyze a static snapshot, making it impossible to observe real-time system changes.
What is OpenResty XRay
OpenResty XRay is a dynamic-tracing product that automatically analyzes your running applications to troubleshoot performance problems, behavioral issues, and security vulnerabilities with actionable suggestions. Under the hood, OpenResty XRay is powered by our Y language targeting various runtimes like Stap+, eBPF+, GDB, and ODB, depending on the contexts.
About The Author
Yichun Zhang (Github handle: agentzh), is the original creator of the OpenResty® open-source project and the CEO of OpenResty Inc..
Yichun is one of the earliest advocates and leaders of “open-source technology”. He worked at many internationally renowned tech companies, such as Cloudflare, Yahoo!. He is a pioneer of “edge computing”, “dynamic tracing” and “machine coding”, with over 22 years of programming and 16 years of open source experience. Yichun is well-known in the open-source space as the project leader of OpenResty®, adopted by more than 40 million global website domains.
OpenResty Inc., the enterprise software start-up founded by Yichun in 2017, has customers from some of the biggest companies in the world. Its flagship product, OpenResty XRay, is a non-invasive profiling and troubleshooting tool that significantly enhances and utilizes dynamic tracing technology. And its OpenResty Edge product is a powerful distributed traffic management and private CDN software product.
As an avid open-source contributor, Yichun has contributed more than a million lines of code to numerous open-source projects, including Linux kernel, Nginx, LuaJIT, GDB, SystemTap, LLVM, Perl, etc. He has also authored more than 60 open-source software libraries.
Related Articles
OpenResty XRay Sep 20, 2024

OpenResty XRay Dec 4, 2025

OpenResty XRay Oct 10, 2025

OpenResty XRay Sep 12, 2025

OpenResty XRay Jul 22, 2025