How to Pinpoint the Hidden Cost of Gzip Configuration with OpenResty XRay
In high-throughput, financial-grade business environments, performance optimization is far more challenging than one might imagine. We often encounter a critical paradox: while top-level system metrics (QPS, latency) meet expectations, high CPU costs become a critical bottleneck for throughput scalability. Recently, we conducted a performance evaluation for a client. Although initial stress test data appeared satisfactory, the analysis results after running OpenResty XRay were unexpected: the system’s CPU resources were not being utilized for core business logic as anticipated, but were heavily consumed by data decompression, accounting for over 50% of CPU usage.
This article will use this real-world case to demonstrate how OpenResty XRay accurately identified the “invisible killer” of CPU resources that everyone overlooked – an unreasonable Gzip compression configuration. It will also reveal how to transform performance optimization from guesswork into a precise, data-driven science.
Performance Issues Often Lurk in Unexpected Places
In modern web architecture, performance optimization is an ever-present topic. While we typically focus on database queries, business logic, or network I/O, true performance bottlenecks sometimes hide within foundational components we take for granted.
A financial industry customer, dealing with extremely high traffic in their business scenarios, had stringent requirements for system throughput and latency. Initial monitoring data suggested that system QPS and latency were within acceptable ranges, and overall performance seemed to meet expectations. However, the results from online dynamic tracing using OpenResty XRay revealed a surprising truth.
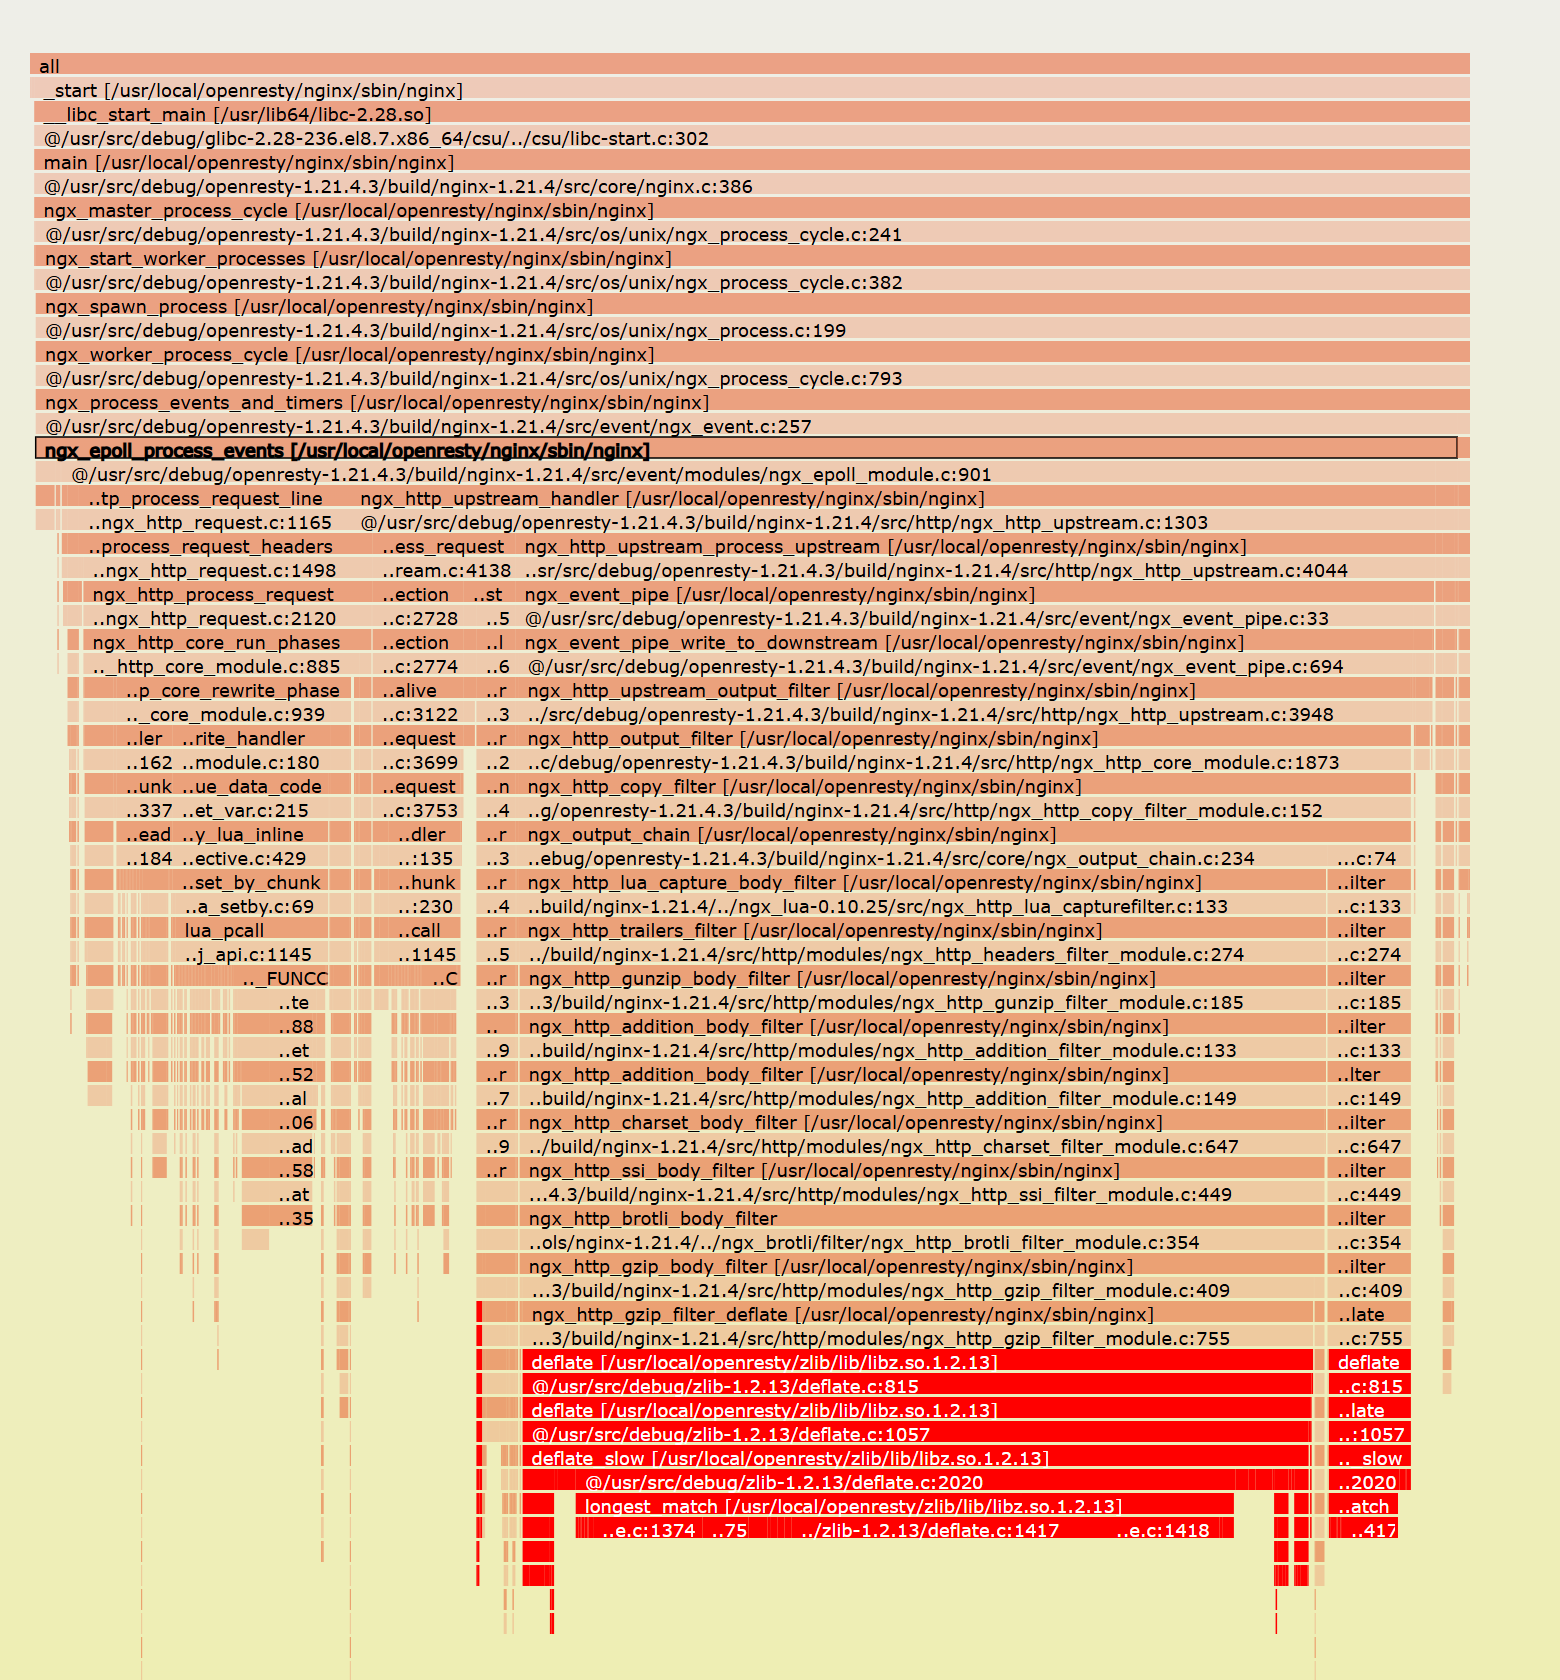
The flame graph clearly demonstrated that CPU resources were not primarily consumed by business logic as anticipated, but were largely dominated by compression and decompression processes. Key findings include:
- gzip compression accounted for as much as 54% of CPU time.
- gzip decompression alone consumed an even higher 61% of CPU.
- Even the more efficient brotli compression utilized 30.9% of the CPU.
In performance-critical environments, the substantial CPU overhead introduced by compression algorithms is a hidden, yet critical, performance drain that is often overlooked.
How OpenResty XRay Uncovers the “Root Cause” of Performance Bottlenecks
The limitation of traditional performance analysis tools lies in providing symptomatic information—for example, “gzip module consumes a lot of CPU”. For performance optimization, this level of insight offers limited value. We must answer the core question: “Why is it high?”
This is precisely where OpenResty XRay sets itself apart from all other tools on the market. By performing non-invasive dynamic tracing on live services, we accurately capture function-level CPU overhead and drill down into performance issues, moving beyond mere “symptoms” to “configuration” and “mechanism” levels:
- Gzip’s Diminishing Returns Pitfall: XRay reports clearly reveal configuration issues. The current
gzipcompression level is set to6. Engineering best practices have long proven that when thegziplevel exceeds4, marginal gains in compression ratio virtually halt, while CPU computation overhead shows exponential growth. This configuration represents a typical resource misallocation. - Brotli Efficiency Threshold: Similarly, tracing
brotlilevel5shows that its compression ratio improvement has entered the diminishing returns range. We observed unnecessary CPU consumption steadily rising in the data, which is entirely avoidable performance waste. - Implicit Cost of Kernel/User Mode Switching: Deeper analysis shows that on the decompression path, frequent exception handling triggered by data format issues, although elegantly captured in business logic, the frequent switching between kernel mode and user mode caused by the exception handling itself accumulates non-negligible additional CPU consumption.
The key differentiating capability of OpenResty XRay is its ability to directly trace macroscopic CPU consumption back to microscopic configuration parameters such as gzip_level. This fine-grained, parameter-level analysis of compression library internal behavior completely elevates performance optimization from empirical guesswork to precise, data-driven engineering. This is a depth of insight that traditional APM or Profiler architectures struggle to match.
Quantifying Performance Bottlenecks
Through in-depth analysis with OpenResty XRay, we transformed subjective “feelings” and “experience” into quantifiable data insights. This helped the team avoid the pitfalls of “blind tuning” or “experiential parameter adjustments.” Our key findings are summarized below:
| Component | Current Configuration | CPU Usage | Core Problem | Optimization Direction |
|---|---|---|---|---|
| Gzip Compression | level=6 | 54% | Compression level too high, leading to massive CPU overhead | Reduce to level=1 |
| Gzip Decompression | - | 61% | Frequent exceptions | Optimize data source to reduce exceptions |
| Brotli Compression | level=5 | 30.9% | Level exceeds the point of diminishing returns | Reduce to level=4 |
This table clearly illustrates the non-linear relationship between compression level and CPU overhead. It provided the entire technical team with an intuitive understanding that even subtle adjustments to configuration parameters can profoundly impact system resources.
Traditional performance analysis often focuses on “which module consumes the most time.” In contrast, OpenResty XRay goes further by revealing the precise mapping between specific parameters, such as gzip_level, and resource consumption, thereby answering “why is it consuming so much time.” This makes the optimization solutions highly actionable.
Leveraging the precise data insights from OpenResty XRay, the customer team saw immediate results after implementing the optimizations. Under the same stress test load, the system’s overall CPU utilization significantly decreased, freeing up CPU time for core business threads. This ultimately led to a substantial increase in QPS and a significant reduction in request latency.
This optimization established a perfect data-driven decision-making loop: Problem Discovery -> Quantitative Analysis -> Precise Optimization -> Results Verification. More importantly, this process and its conclusions can be documented, reused, and become a valuable engineering practice for the team.
From Experience to Methodology
This optimization prompted a deeper reflection: what kind of observability do we truly need?
Many expensive observability platforms often resemble “invasive surgery” on a system. They demand code modifications and agent injections, which inherently introduce unknown risks and additional performance overhead. They adopt a strategy of “blindly collecting everything,” leading enterprises to incur high costs for massive telemetry data, only to receive an extremely low signal-to-noise ratio in return. Engineers are left to wade through an ocean of data, yet still struggle to pinpoint the root cause of problems.
OpenResty XRay’s methodology, however, is fundamentally different. Through its non-invasive deep analysis technology, it helps users bypass the noise collection stage. It doesn’t overwhelm you with a million metrics for you to interpret; instead, it leverages intelligent inference engines and innovative sampling strategies to directly present analysis results. We provide not raw data, but actionable insights directly relevant to the problem’s root cause.
The three engineering insights derived from this practice perfectly embody this methodology:
- Higher compression levels are not always better: an optimal balance must be found between compression ratio and CPU cost.
- Exception handling should remain lightweight: exceptions on performance-sensitive paths should be avoided as much as possible.
- Performance optimization must be based on quantitative data: any tuning without data support is “gambling.”
Many performance issues have long been detected by traditional APM tools, but they couldn’t explain them. The core difference of OpenResty XRay is its ability to “explain” the causes of these problems – it doesn’t just tell you where CPU utilization is high, but also why it’s high, and provides clear optimization recommendations.
This transforms performance optimization from an “art” reliant on personal experience into a “science” that is evidence-based, repeatable, and verifiable. It ensures every tuning decision is built upon actionable insights, rather than being lost in an undifferentiated mass of data.
Extended Reading Recommendation: From Bottleneck Analysis to Frontier Speedup
If you are interested in the detailed analysis of compression performance and cutting-edge optimization techniques, please continue to refer to the following two in-depth articles:
In optimization practice, we must accurately quantify every potential bottleneck. Through OpenResty XRay’s C-level CPU flame graph, we are able to penetrate the application layer and directly see the true cost of Gzip compression. Analysis confirmed that the second largest performance bottleneck in the customer system application was caused by the overhead of Gzip. Welcome to read the following text to understand how we used OpenResty XRay to deeply explore the performance impact of Gzip compression.
Edge environments are extremely sensitive to latency and computing resources. Traditional Gzip has an inherent contradiction between “compression ratio” and “speed”, and can no longer meet the needs of modern edge architectures. For this reason, OpenResty Edge introduced the Zstandard (zstd) algorithm. zstd aims to solve Gzip’s engineering compromises, achieving better compression ratios with lower CPU overhead. Read the following blog to understand the advantages of zstd and how to apply zstd compression support in OpenResty Edge.
About OpenResty XRay
OpenResty XRay is a dynamic tracing product, which can automatically analyze running applications to solve performance problems, behavior problems and security vulnerabilities, and provide actionable suggestions. At the bottom layer, OpenResty XRay is driven by our Y language, and can support multiple different runtimes in different environments, such as Stap+, eBPF+, GDB and ODB.
What is OpenResty XRay
OpenResty XRay is a dynamic-tracing product that automatically analyzes your running applications to troubleshoot performance problems, behavioral issues, and security vulnerabilities with actionable suggestions. Under the hood, OpenResty XRay is powered by our Y language targeting various runtimes like Stap+, eBPF+, GDB, and ODB, depending on the contexts.
About The Author
Yichun Zhang (Github handle: agentzh), is the original creator of the OpenResty® open-source project and the CEO of OpenResty Inc..
Yichun is one of the earliest advocates and leaders of “open-source technology”. He worked at many internationally renowned tech companies, such as Cloudflare, Yahoo!. He is a pioneer of “edge computing”, “dynamic tracing” and “machine coding”, with over 22 years of programming and 16 years of open source experience. Yichun is well-known in the open-source space as the project leader of OpenResty®, adopted by more than 40 million global website domains.
OpenResty Inc., the enterprise software start-up founded by Yichun in 2017, has customers from some of the biggest companies in the world. Its flagship product, OpenResty XRay, is a non-invasive profiling and troubleshooting tool that significantly enhances and utilizes dynamic tracing technology. And its OpenResty Edge product is a powerful distributed traffic management and private CDN software product.
As an avid open-source contributor, Yichun has contributed more than a million lines of code to numerous open-source projects, including Linux kernel, Nginx, LuaJIT, GDB, SystemTap, LLVM, Perl, etc. He has also authored more than 60 open-source software libraries.
Related Articles
OpenResty XRay Jul 30, 2025

OpenResty XRay Dec 23, 2025

OpenResty XRay Nov 18, 2025

OpenResty XRay Nov 10, 2025

OpenResty XRay Sep 1, 2025


