Double Bottleneck Concurrency? OpenResty XRay Multi-dimensional Analysis Solves Performance Challenges
In high-concurrency business scenarios, system performance directly impacts user experience and business outcomes. Response latency, even at the millisecond level, can negatively affect user retention and business metrics. However, performance issues in production environments, especially intermittent bottlenecks, are challenging to locate and resolve due to their complexity and difficulty in reproduction.
This article will demonstrate how to troubleshoot a typical production performance issue through a real-world case. A customer’s online system experienced doubled average response times and sustained high CPU utilization during peak business periods. The technical team employed conventional methods such as log analysis, general performance profiling tools, and attempted reproduction in test environments, but failed to accurately identify the root cause.
To resolve this issue, the team adopted OpenResty XRay, a deep observability platform. OpenResty XRay is specifically designed for diagnosing performance issues in complex production environments. Based on dynamic tracing technologies (such as eBPF+ and Stap+), it enables in-depth analysis of online services without code modifications or service restarts, with minimal impact on system performance.
This article will detail the complete process of diagnosing this performance issue using OpenResty XRay. We will demonstrate step by step how to locate performance bottlenecks hidden deep within the code through multi-dimensional flame graph analysis.
Overall CPU Usage Analysis
OpenResty XRay automatically generated the following C-land CPU flame graph:
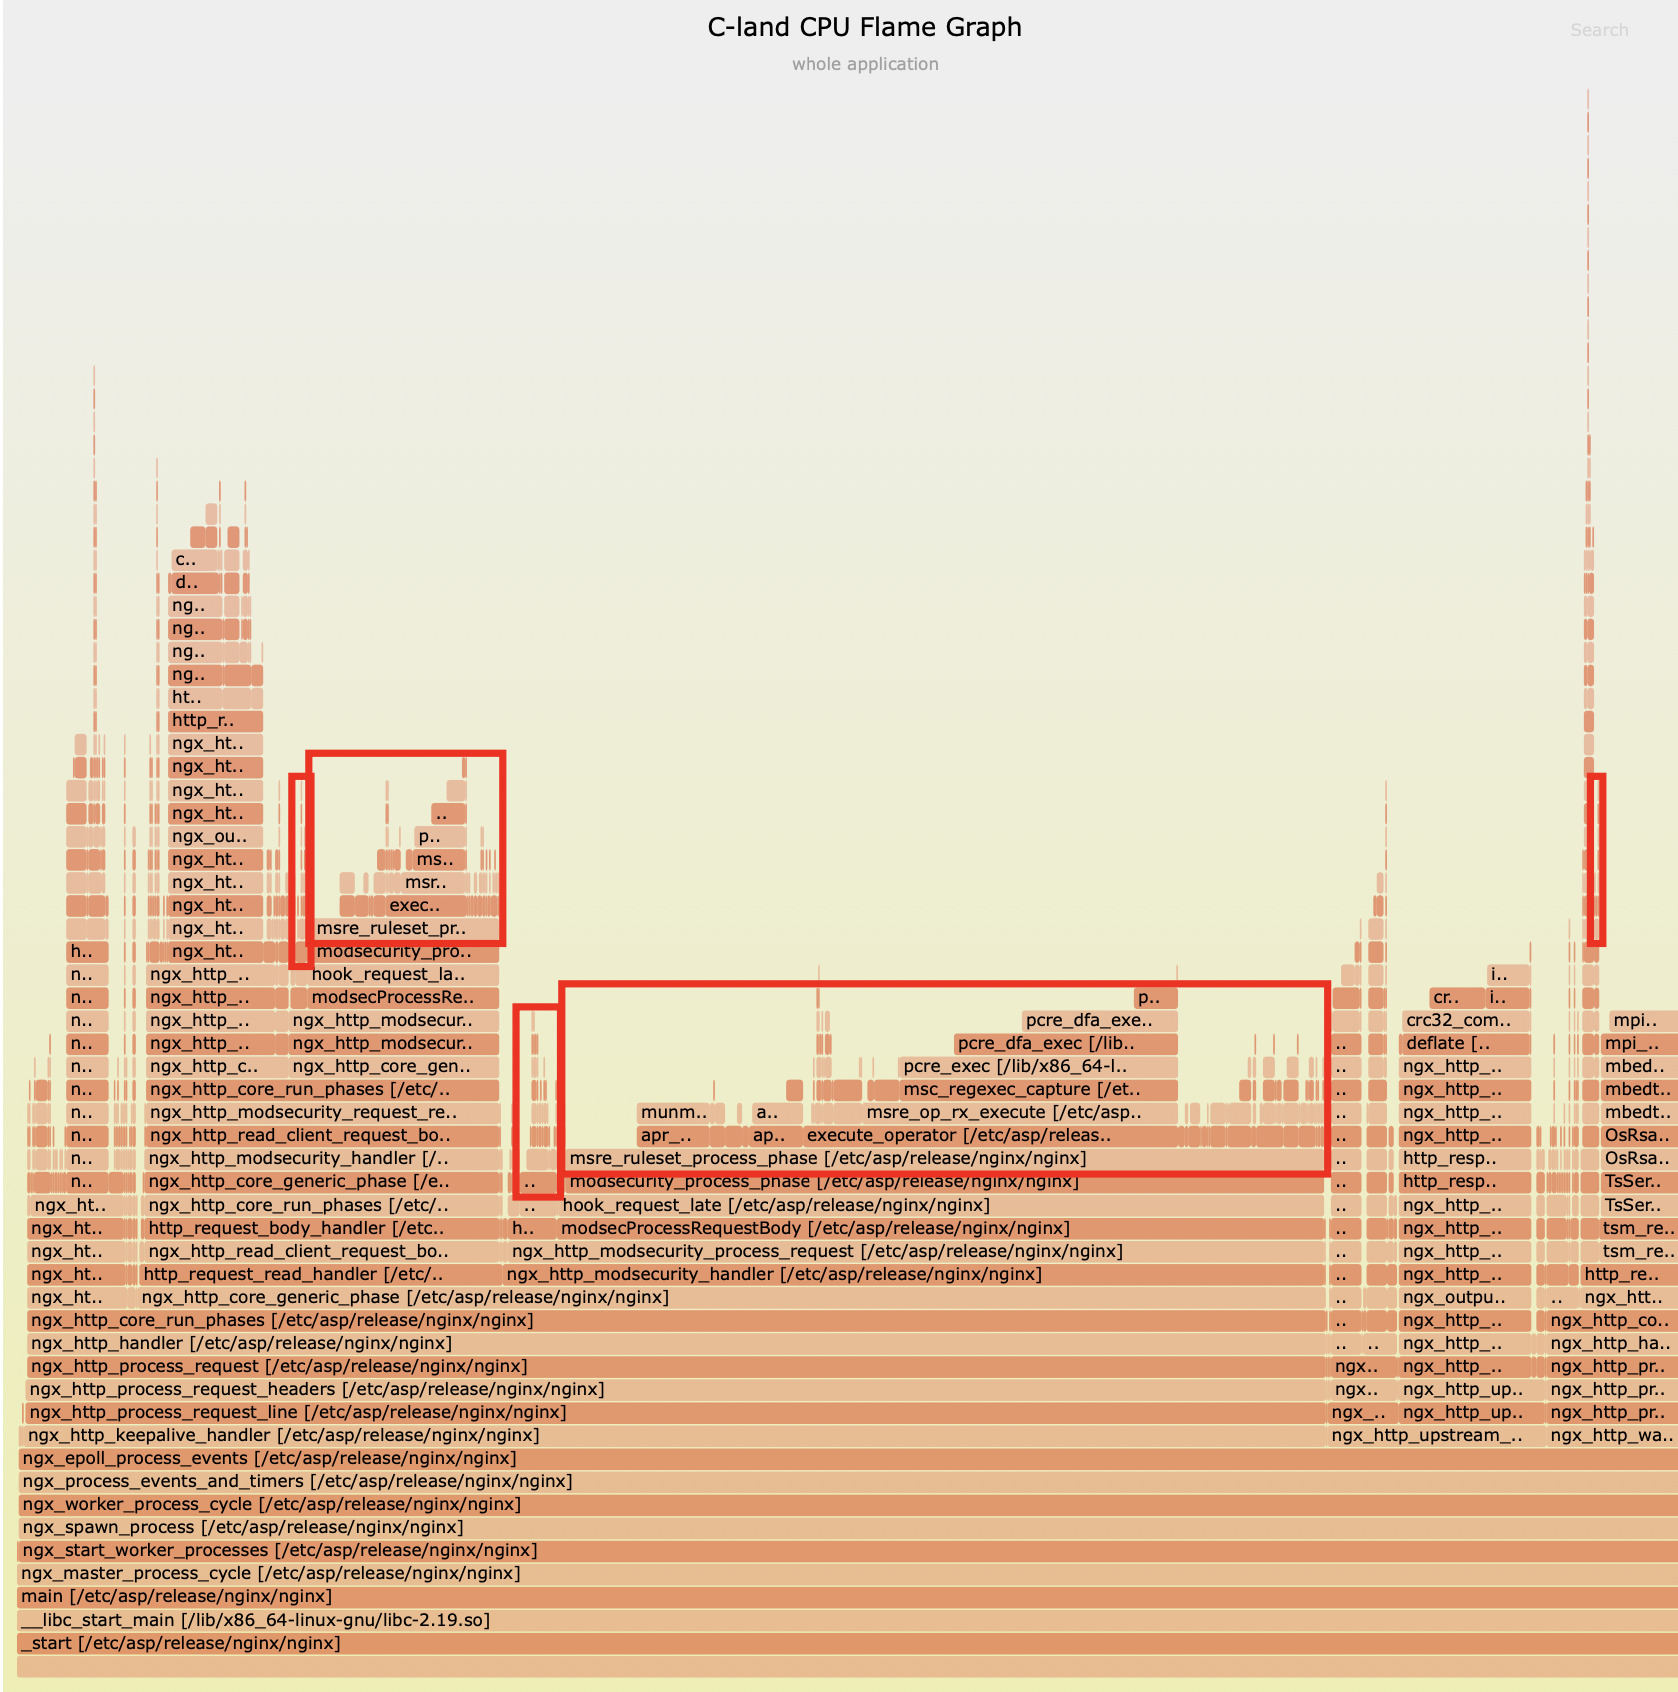
By analyzing this flame graph, the team quickly identified the core issue: the ModSecurity module is absolutely the primary performance bottleneck.
ModSecuritymodule CPU usage: 57.9%- Overall CPU bottleneck proportion: approximately 60%
In-depth Module Analysis
Further utilizing the fine-grained tracing capabilities of OpenResty XRay, the team discovered two major sources of CPU consumption:
1. PCRE DFA Regular Expression Matching Bottleneck
The C-land CPU flame graph below reveals the significant position of the PCRE’s DFA matching function in CPU resource consumption. The pcre_dfa_exec function accounts for 24.4% of CPU time in the overall application.
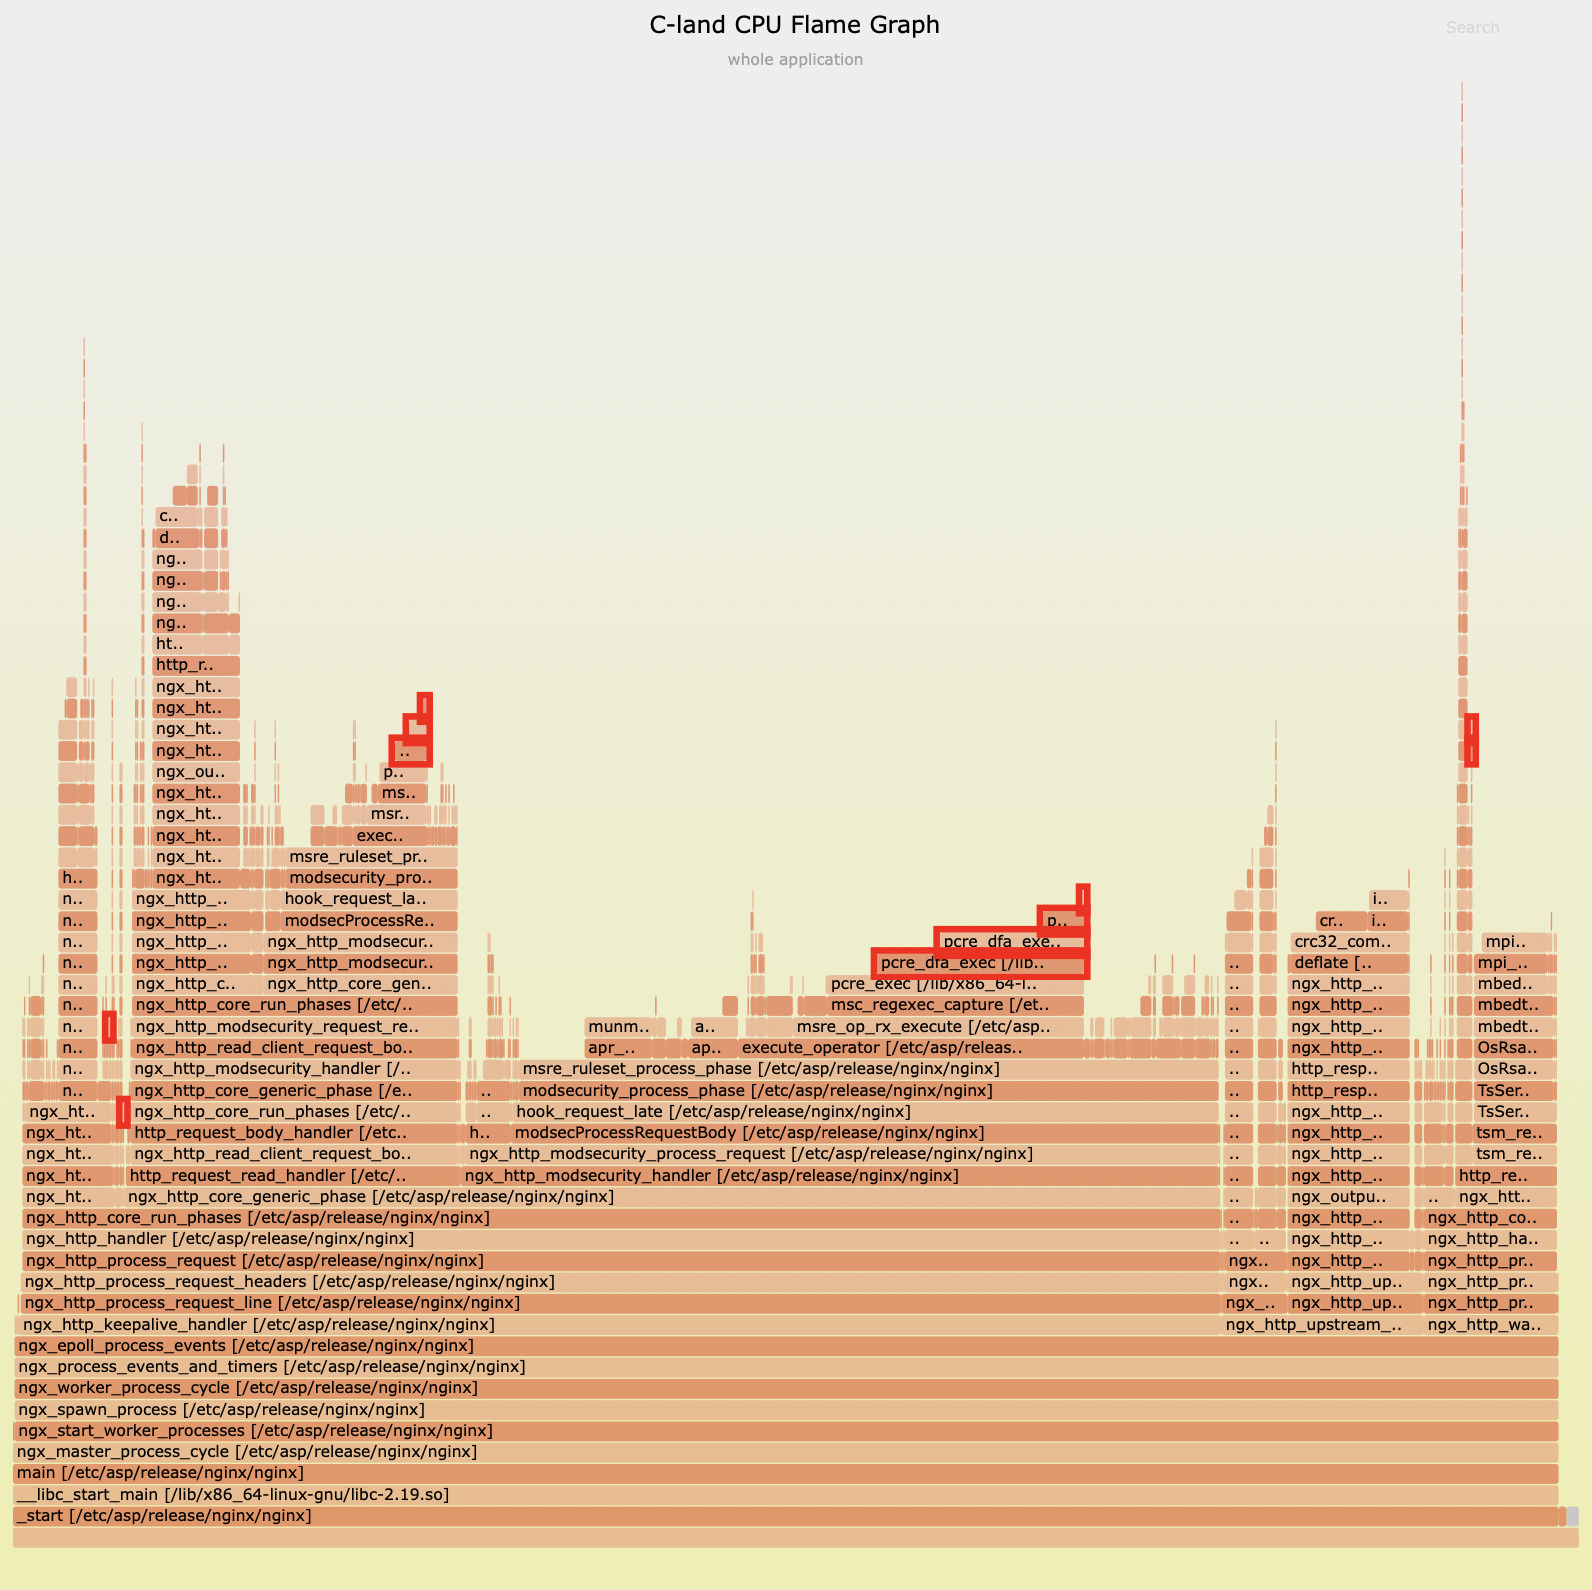
This finding clearly indicates that the nginx version of the ModSecurity module’s invocation is the main cause of this high consumption. Notably, the PCRE library’s DFA engine performs significantly worse than its backtracking engine with JIT compilation, which provides us with a direction and opportunity for optimization.
2. HTTP Response Body Gzip Compression Bottleneck
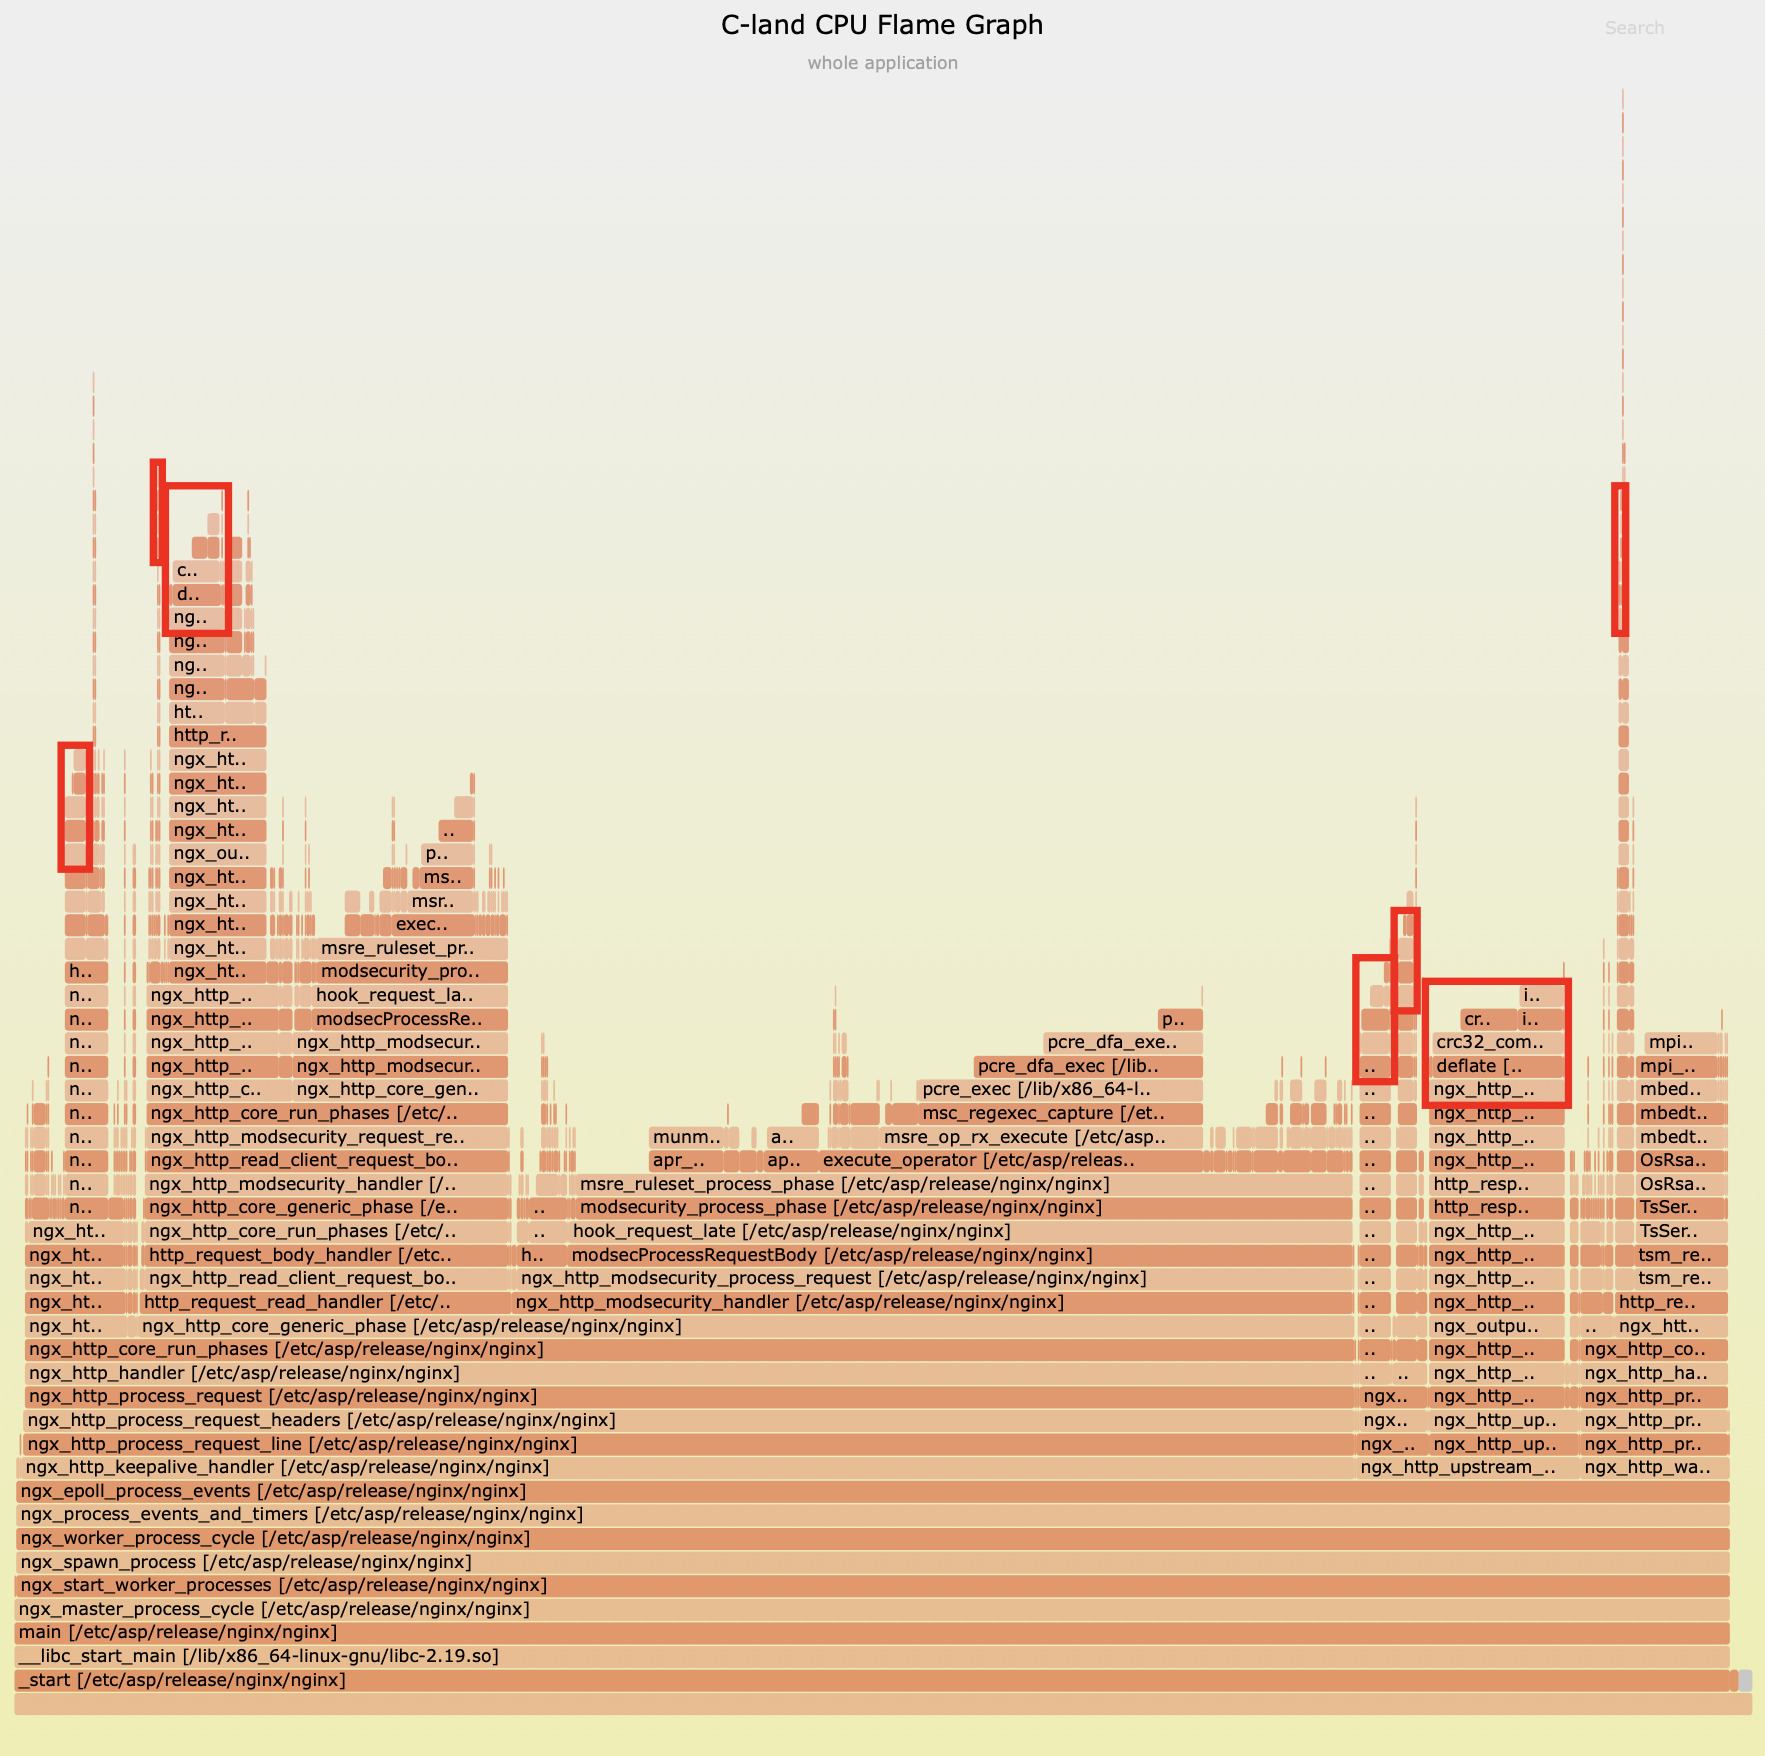
The multi-dimensional analysis capabilities of OpenResty XRay allowed us to further explore the second major bottleneck in system performance. By collecting multiple C-level CPU flame graph samples, the team systematically analyzed the impact of HTTP response body compression on system performance:
- Sample One Analysis: Initial sampling showed that the zlib library’s
deflatefunction accounted for 13.1% of CPU time allocation in the entire application. This data clearly indicates that Gzip compression is a non-negligible performance consumption point.
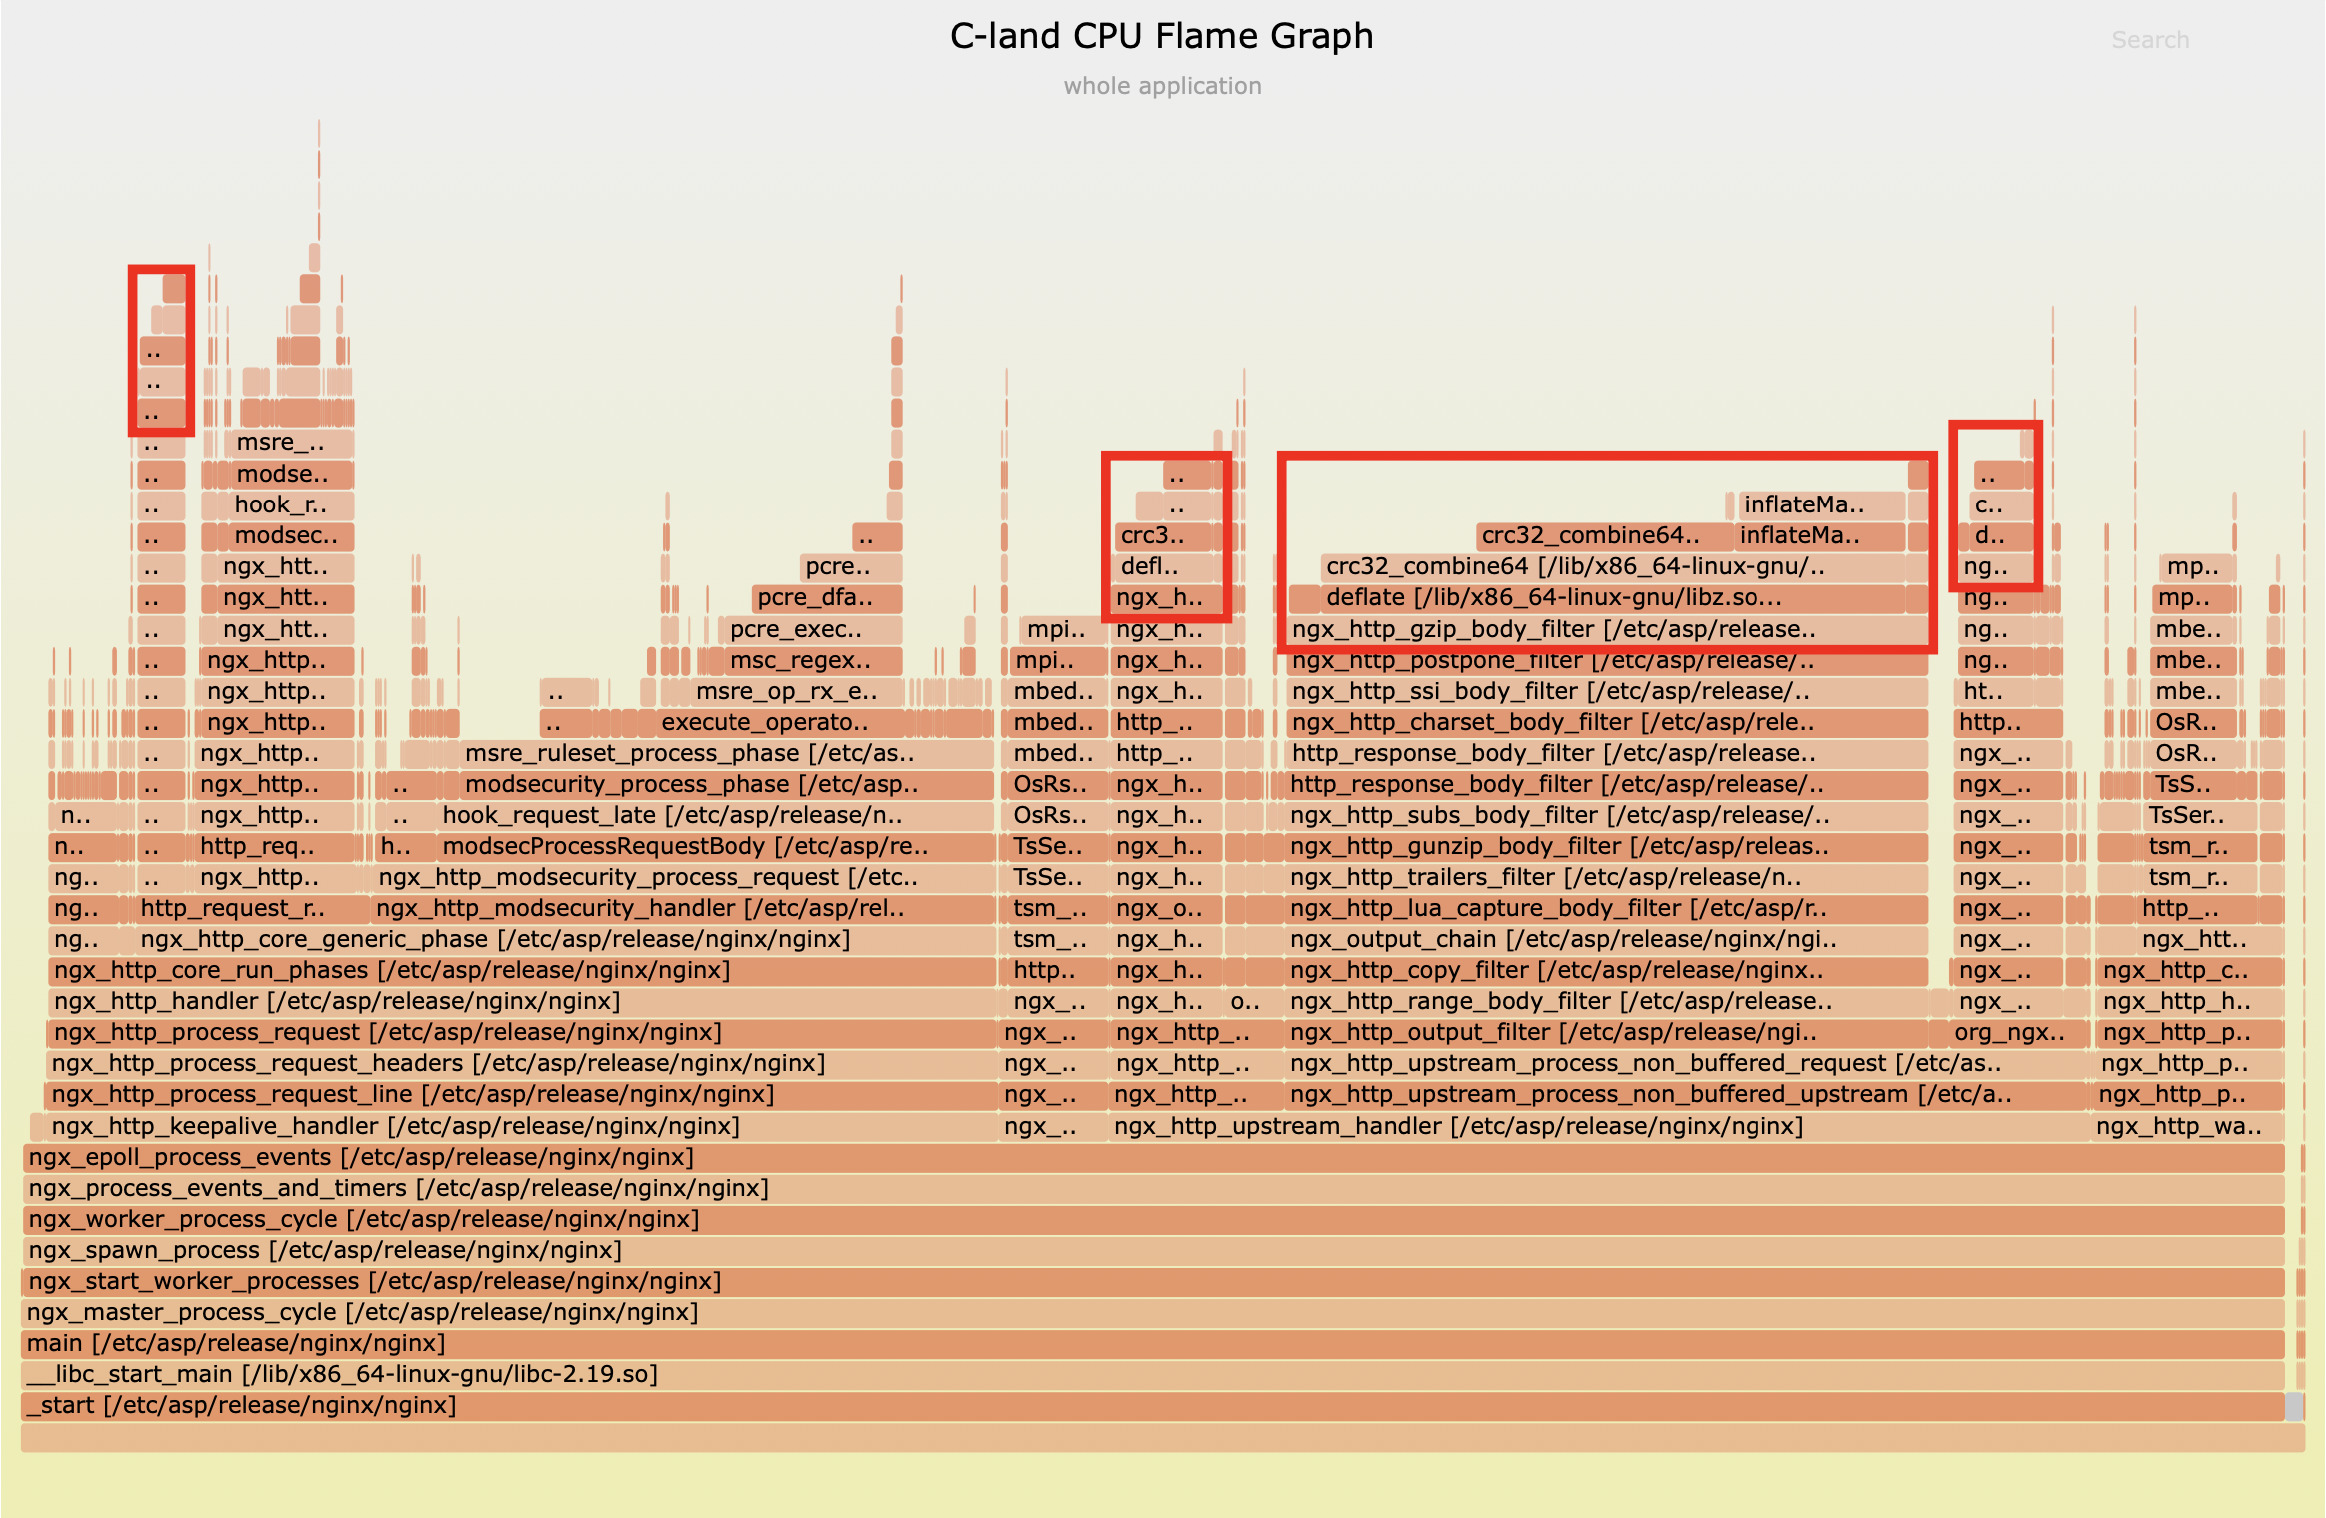
- Sample Two Verification: To ensure the accuracy of our findings, we conducted a second round of sampling. The results were even more significant—in this sample, the CPU usage of the
deflatefunction rose to 34.7%, further confirming the substantial impact of compression operations on system performance.
Analysis of Compression Strategies
After confirming that Gzip compression is the second largest performance bottleneck in the system, the specialized analytical capabilities of OpenResty XRay were fully utilized to help us explore various dimensions of compression strategies:
Compression Level Analysis
First, we conducted a comprehensive examination of compression levels through the dedicated analyzer in OpenResty XRay, with results that provoke thought:
found 561 response chunks not gzip'd
gzip levels: count=2000, min=1, avg=1, max=1
value |-------------------------------------------------- count
    0 |                                                      0
    1 |@@@@@@@@@@@@@@@@@@@@@@@@@@@@@@@@@@@@@@@@@@@@@@@@@@ 2000
    2 |                                                      0
    4 |                                                      0
This dataset reveals two key facts:
- There are 2000 response chunks in the system using compression, all at level 1, which is the lowest compression level
- Simultaneously, there are 561 uncompressed response chunks
This indicates that from a compression level perspective, the system configuration is already quite reasonable—level 1 provides the highest operational efficiency. However, compression operations still consumed significant CPU resources, which prompted us to further investigate: what types of content are consuming these resources?
MIME Type Distribution Analysis
To answer the above question, we once again activated the XRay analysis feature to accurately count the MIME types participating in Gzip compression:
found 557 response chunks not gzip'd
* gzip application/javascript: count=606
value |-------------------------------------------------- count
    0 |                                                     0
    1 |@@@@@@@@@@@@@@@@@@@@@@@@@@@@@@@@@@@@@@@@@@@@@@     606
    2 |                                                     0
    4 |                                                     0
* gzip text/html: count=212
value |-------------------------------------------------- count
    0 |                                                     0
    1 |@@@@@@@@@@@@@@@@@@@@@@@@@@@@@@@@@@@@@@@@@@         212
    2 |                                                     0
    4 |                                                     0
* gzip text/css: count=182
value |-------------------------------------------------- count
    0 |                                                     0
    1 |@@@@@@@@@@@@@@@@@@@@@@@@@@@@@@@@@@@@@@@@@@@@@      182
    2 |                                                     0
    4 |                                                     0
This dataset presents a more detailed picture:
- JavaScript files (606 instances) are the primary compression targets
- HTML files (212 instances) and CSS files (182 instances) follow closely behind
- These three types account for almost all compression operations
- Similarly, 557 response blocks remained uncompressed
Analysis Conclusions
Through this series of progressive analyses, we have drawn several key conclusions:
- The system has already adopted the most efficient compression level: Level 1
- Compression operations are primarily concentrated on static resources (JS, CSS) and dynamic content (HTML)
- Despite the optimized compression level, compression operations remain a significant performance bottleneck for the system
These findings point us toward optimization directions: not simply adjusting compression levels, but rethinking the overall compression strategy, especially implementing differentiated processing approaches for various types of resources.
Optimization Solutions
In response to the two major performance bottlenecks identified in this case, we provide the following optimization solutions:
1. Compression Performance Optimization: zstd Private Module
To address the Gzip compression bottleneck, we offer the zstd Private Module as a high-performance alternative. This module is based on Facebook’s open-source Zstandard compression algorithm, which can perform up to 5 times faster than zlib, significantly reducing the 34.7% CPU compression overhead identified in this case. As our proprietary library serving business needs, the zstd module has been deeply optimized specifically for high-concurrency scenarios, providing users with a more efficient compression solution.
2. WAF Performance Optimization: OpenResty Edge
To address the performance bottleneck of the ModSecurity module, our OpenResty Edge provides a higher-performance WAF solution.
In many scenarios, OpenResty Edge’s WAF performance is an order of magnitude higher than ModSecurity, effectively resolving the issue of ModSecurity consuming 60% CPU in this case, while providing users with more powerful security protection capabilities and superior performance.
Both solutions are available for users to reference and select according to their actual business requirements, helping them achieve superior performance while ensuring system security.
From “Firefighting” to “Fire Prevention”: The Core Value of OpenResty XRay
This case study epitomizes modern performance optimization. The root cause wasn’t a simple code bug, but rather a complex interplay between system configurations, library functions, and processing strategies hidden deep within the system. Traditional tools can only see the “smoke,” while OpenResty XRay with its deep analytical capabilities can pinpoint the exact “fire source.”
Through this real-world case, the core value of OpenResty XRay becomes clearly evident:
Precise Insights, No Guesswork: XRay transforms a vague “high CPU utilization” issue into clear, actionable optimization targets. The flame graph not only tells us that the system has slowed down also directly identifies the
ModSecuritymodule andpcre_dfa_execfunction, turning performance optimization from “guessing” into targeted action.Data-Driven Decision Support: When facing Gzip bottlenecks, the first reaction is often “downgrading.” However, XRay’s detailed analysis of compression levels and MIME types proves with data that the current configuration is already optimal, thus avoiding ineffective adjustments and redirecting optimization efforts toward higher-level strategies like “separating static and dynamic resource processing.” This marks the distinction between ordinary tuning and architectural optimization.
Non-Intrusive, Production-Ready: All in-depth analyses are performed in real-time in the production environment without code modifications or service restarts. For any serious enterprise application, this is the lifeline that ensures business continuity, achieving truly “imperceptible” diagnostics.
Behind all these capabilities lies the foundation of OpenResty XRay. Its core is based on our independently enhanced dynamic tracing technologies, such as eBPF+ and Stap+. These advanced technologies enable XRay to provide depth and precision far beyond traditional tools while maintaining extremely low system overhead. Notably, OpenResty XRay supports both the older 3.10 kernel in RHEL/CentOS 7 and newer 6.x kernels, offering broad compatibility and assurance for various system environments.
In today’s business competition, performance is no longer just a technical metric but a core business asset. What OpenResty XRay empowers technical teams with is the confidence to shift from reactive “firefighting” to proactive “fire prevention” – a powerful tool for ensuring long-term system stability and creating exceptional user experiences.
What is OpenResty XRay
OpenResty XRay is a dynamic-tracing product that automatically analyzes your running applications to troubleshoot performance problems, behavioral issues, and security vulnerabilities with actionable suggestions. Under the hood, OpenResty XRay is powered by our Y language targeting various runtimes like Stap+, eBPF+, GDB, and ODB, depending on the contexts.
If you like this tutorial, please subscribe to this blog site and/or our YouTube channel. Thank you!
About The Author
Yichun Zhang (Github handle: agentzh), is the original creator of the OpenResty® open-source project and the CEO of OpenResty Inc..
Yichun is one of the earliest advocates and leaders of “open-source technology”. He worked at many internationally renowned tech companies, such as Cloudflare, Yahoo!. He is a pioneer of “edge computing”, “dynamic tracing” and “machine coding”, with over 22 years of programming and 16 years of open source experience. Yichun is well-known in the open-source space as the project leader of OpenResty®, adopted by more than 40 million global website domains.
OpenResty Inc., the enterprise software start-up founded by Yichun in 2017, has customers from some of the biggest companies in the world. Its flagship product, OpenResty XRay, is a non-invasive profiling and troubleshooting tool that significantly enhances and utilizes dynamic tracing technology. And its OpenResty Edge product is a powerful distributed traffic management and private CDN software product.
As an avid open-source contributor, Yichun has contributed more than a million lines of code to numerous open-source projects, including Linux kernel, Nginx, LuaJIT, GDB, SystemTap, LLVM, Perl, etc. He has also authored more than 60 open-source software libraries.
Related Articles
OpenResty XRay Oct 27, 2025

OpenResty XRay Dec 23, 2025

OpenResty XRay Nov 18, 2025

OpenResty XRay Nov 10, 2025

OpenResty XRay Sep 1, 2025


