Performance Overhead of OpenResty XRay when Tracing Go Apps
In this tutorial, we’ll show the actual performance impact of OpenResty XRay when tracing Go applications. We will watch CPU, memory, load average, traffic throughput, latency, etc. when OpenResty XRay is actively sampling and analyzing the target system. OpenResty XRay is a non-invasive diagnostic system based on our own dynamic tracing technology. It has minimal performance overhead. It can analyze running applications in real-time to help pinpoint the root causes of various issues.
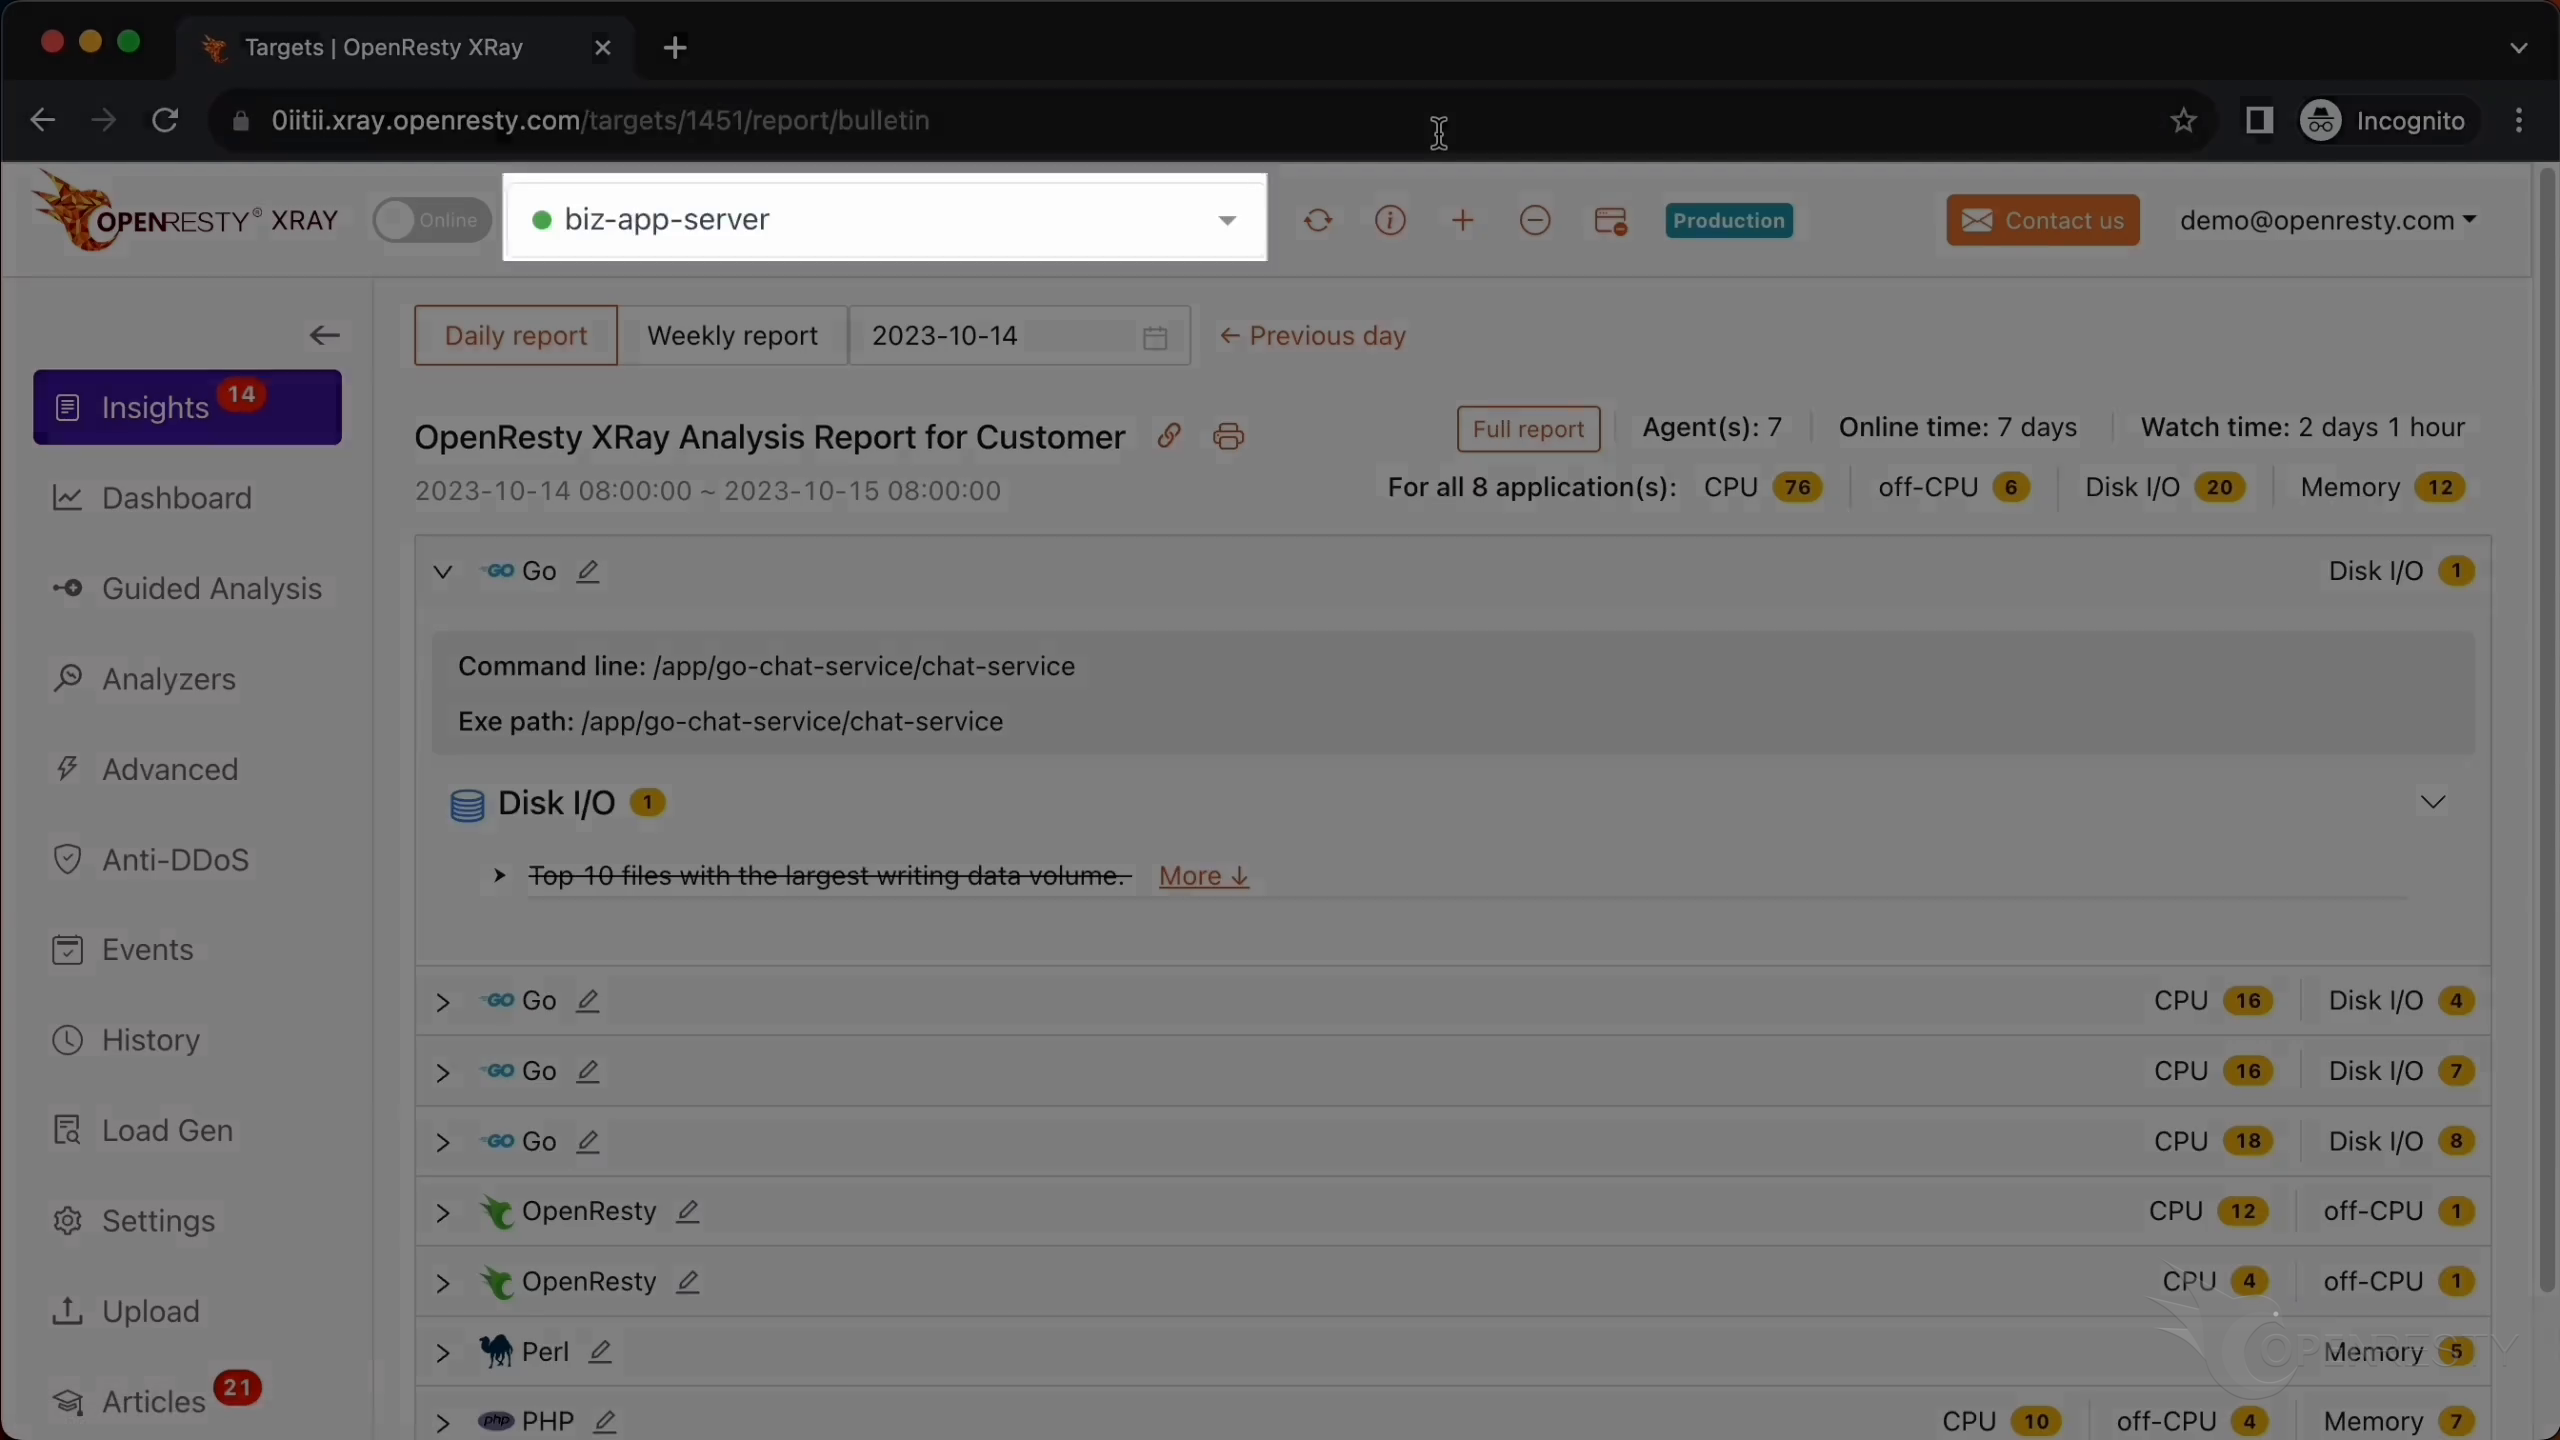
Process Performance Before Running Analysis
How will OpenResty XRay’s Agent affect a target Go application’s performance? Let’s find out in this video.
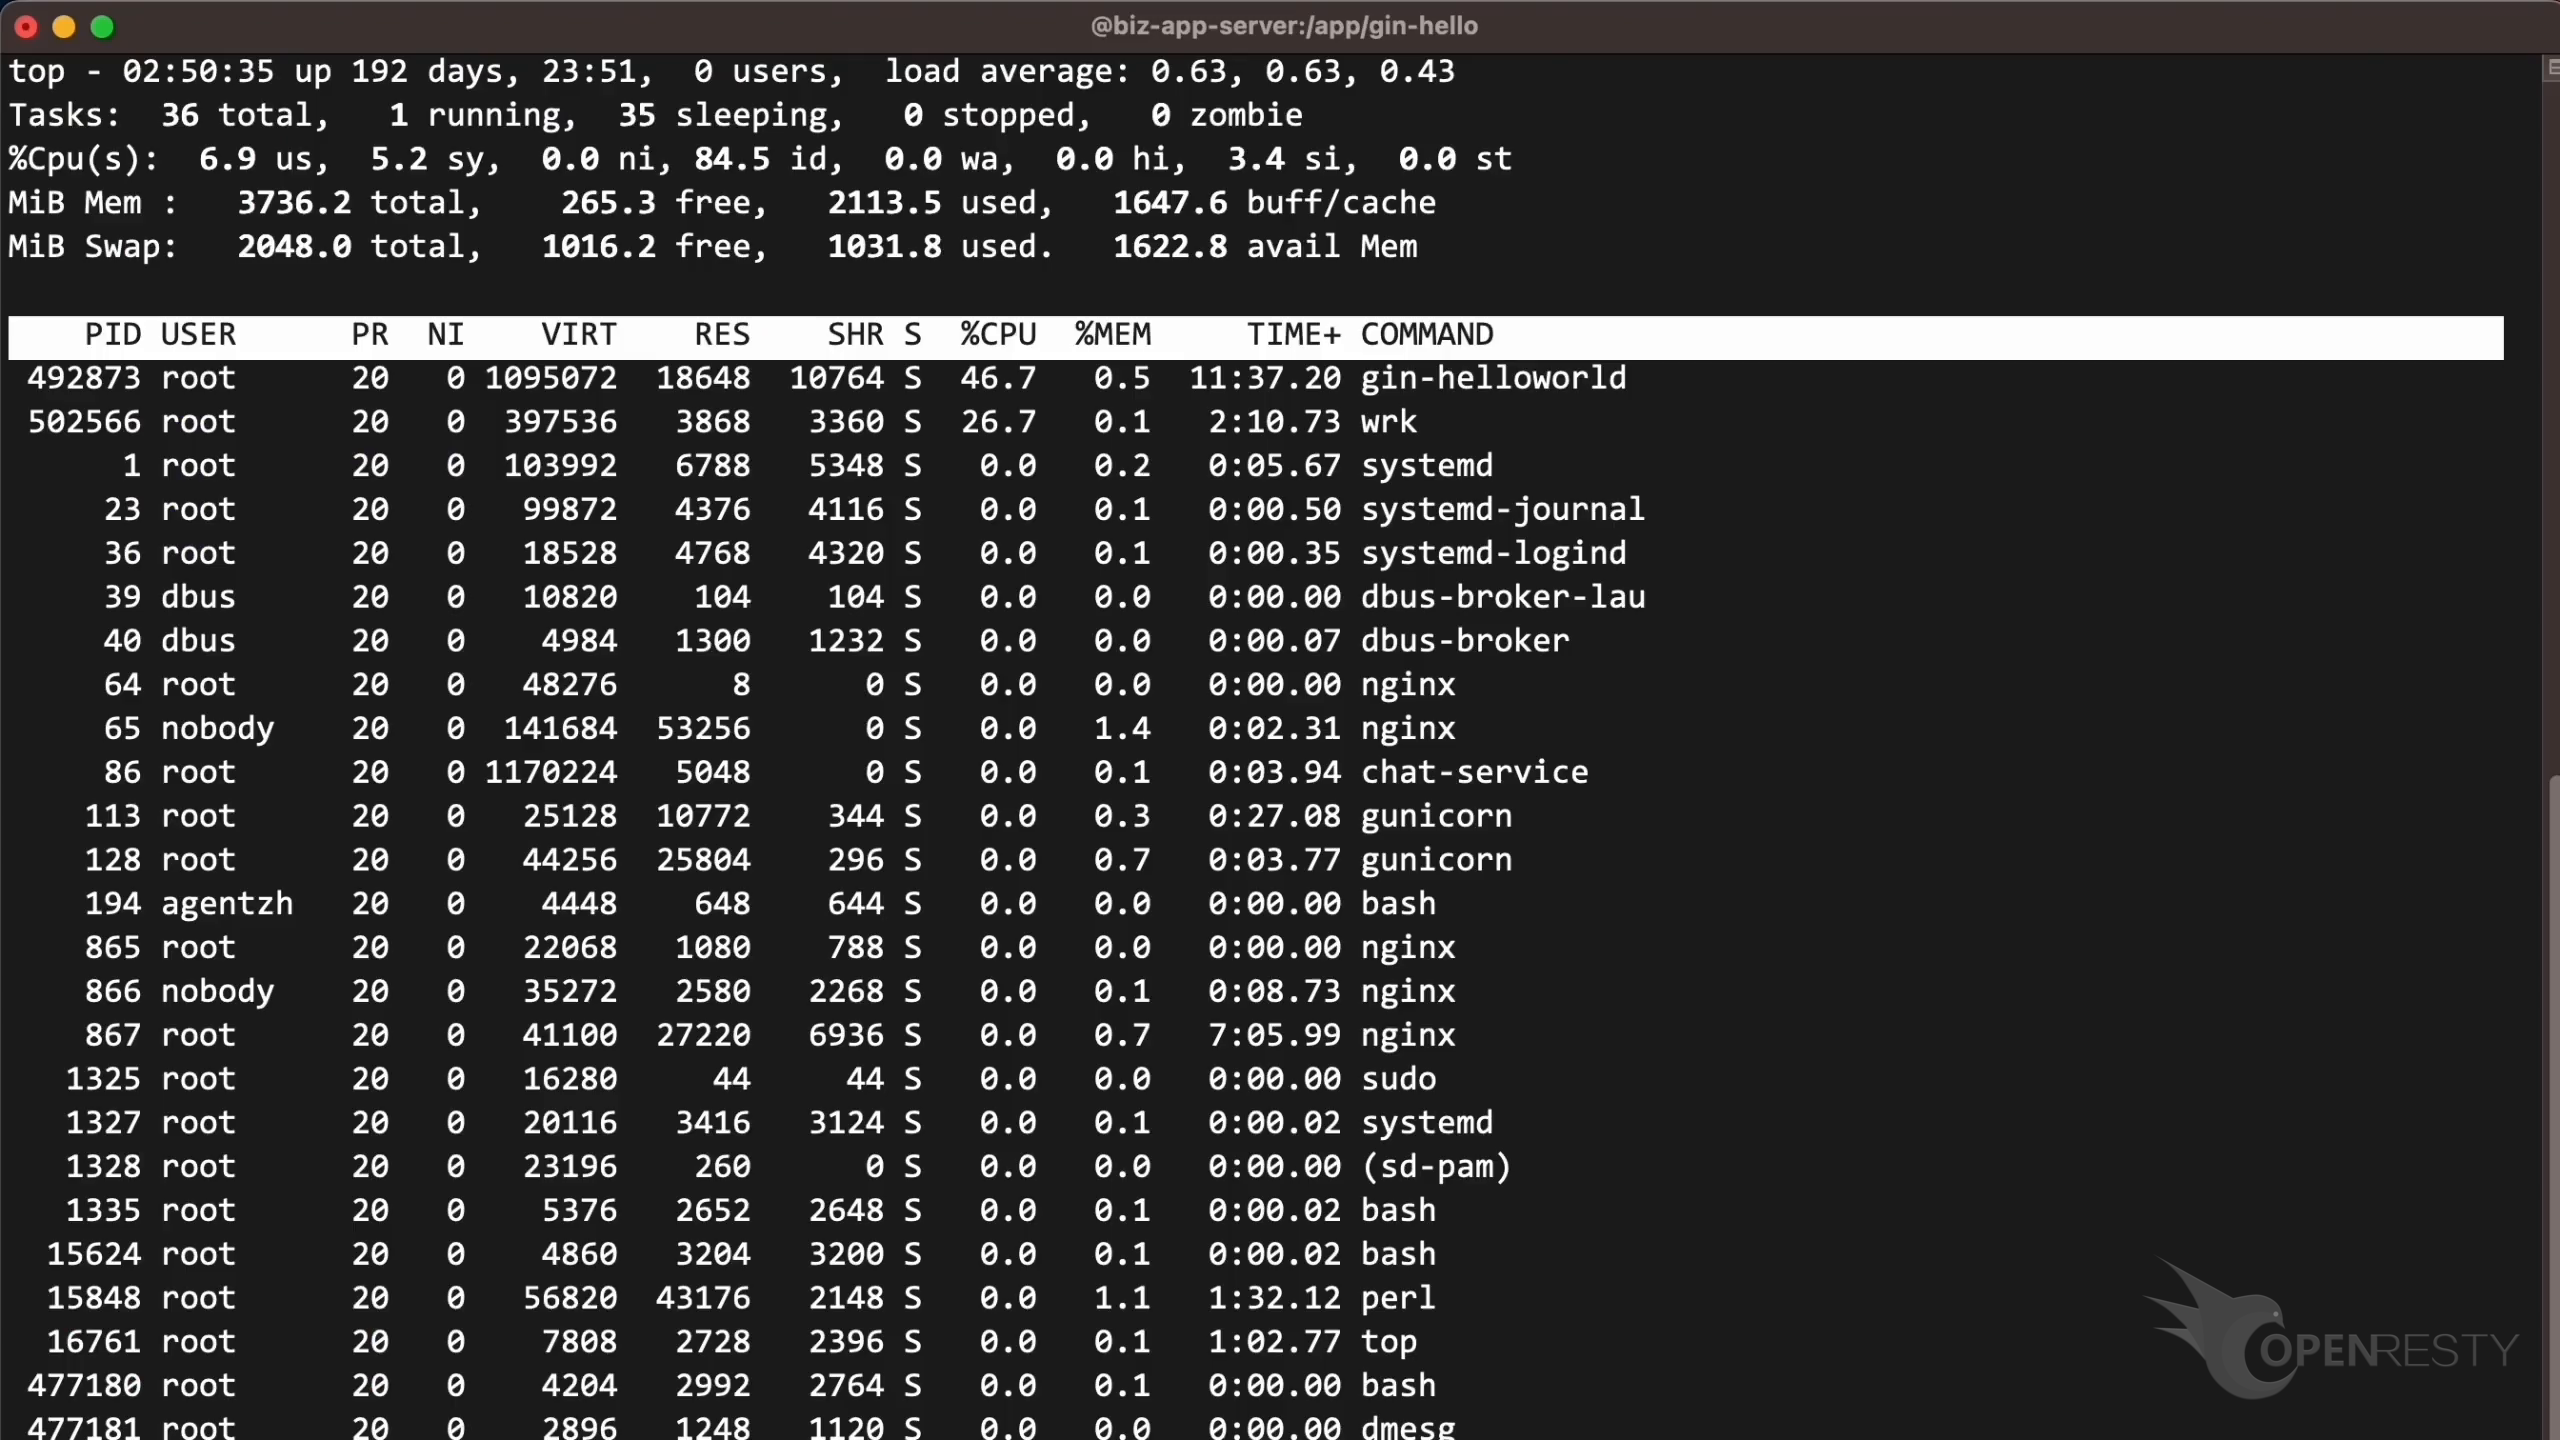
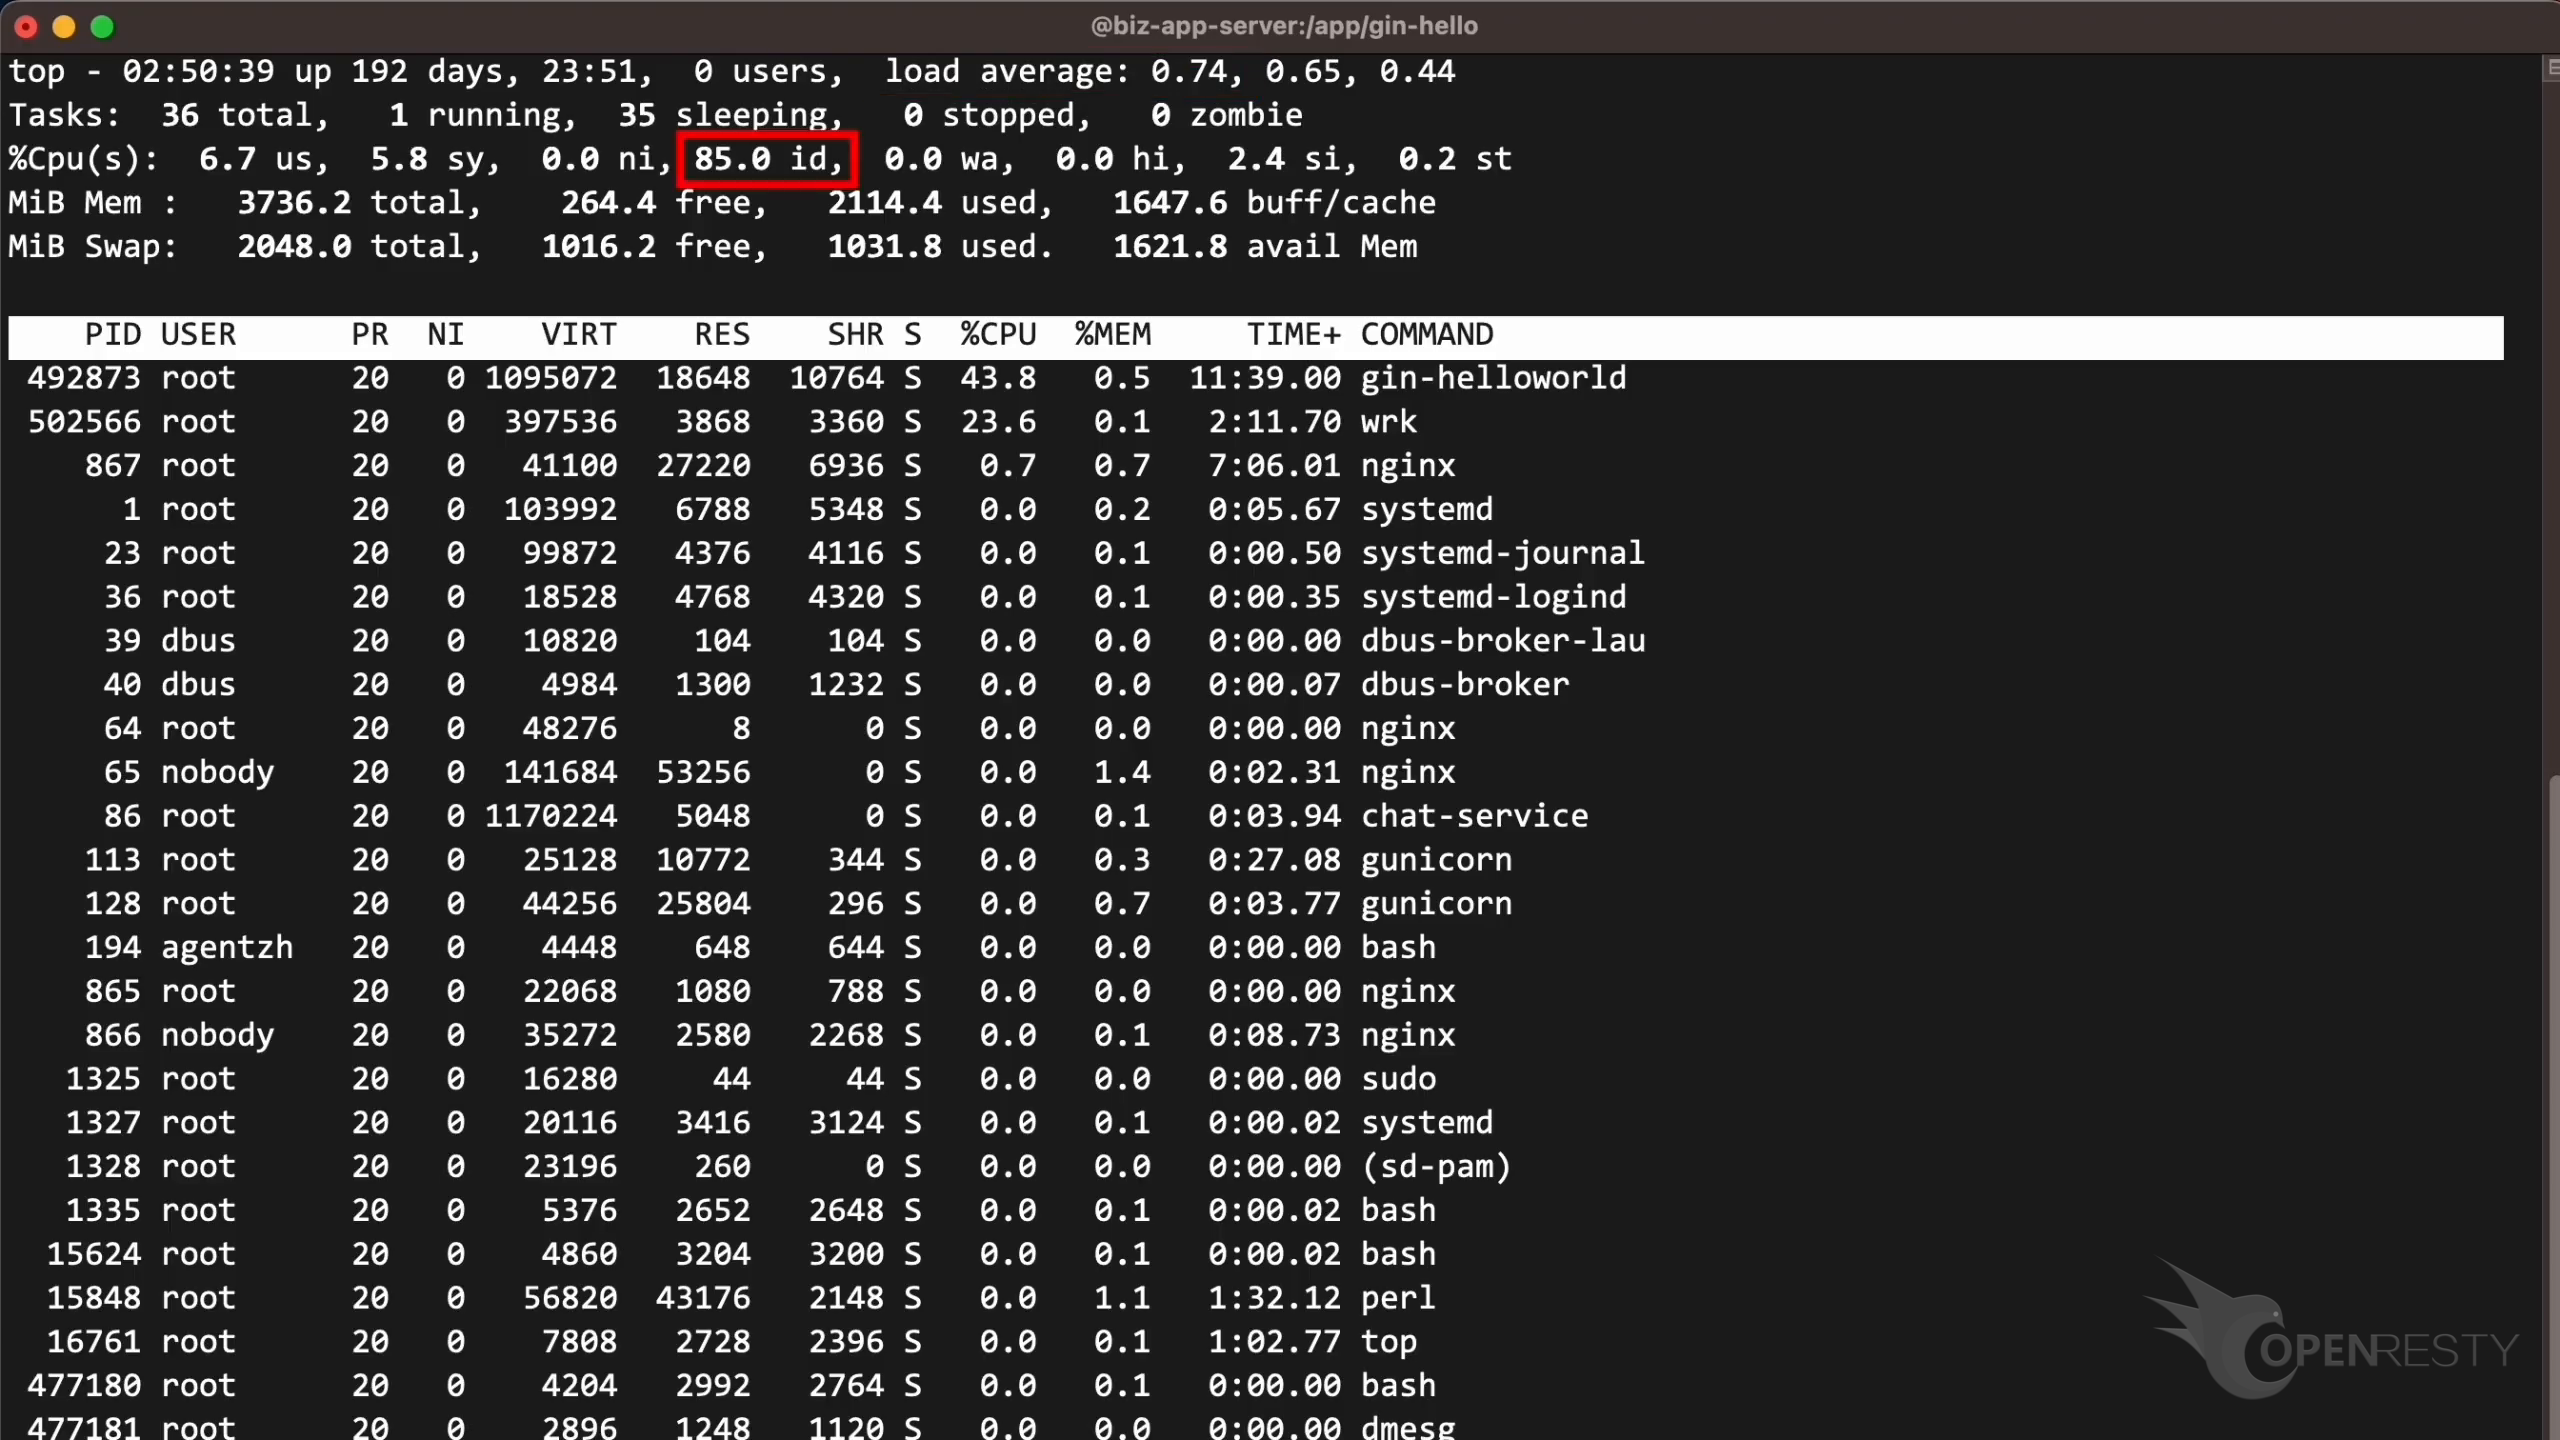
First, let’s run the top command to check the process list.
Right now, the Agent of OpenResty XRay is not running any analysis. So its performance impact on the target process are strictly zero. Thanks to dynamic-tracing technologies. It never modifies the target processes in any way.
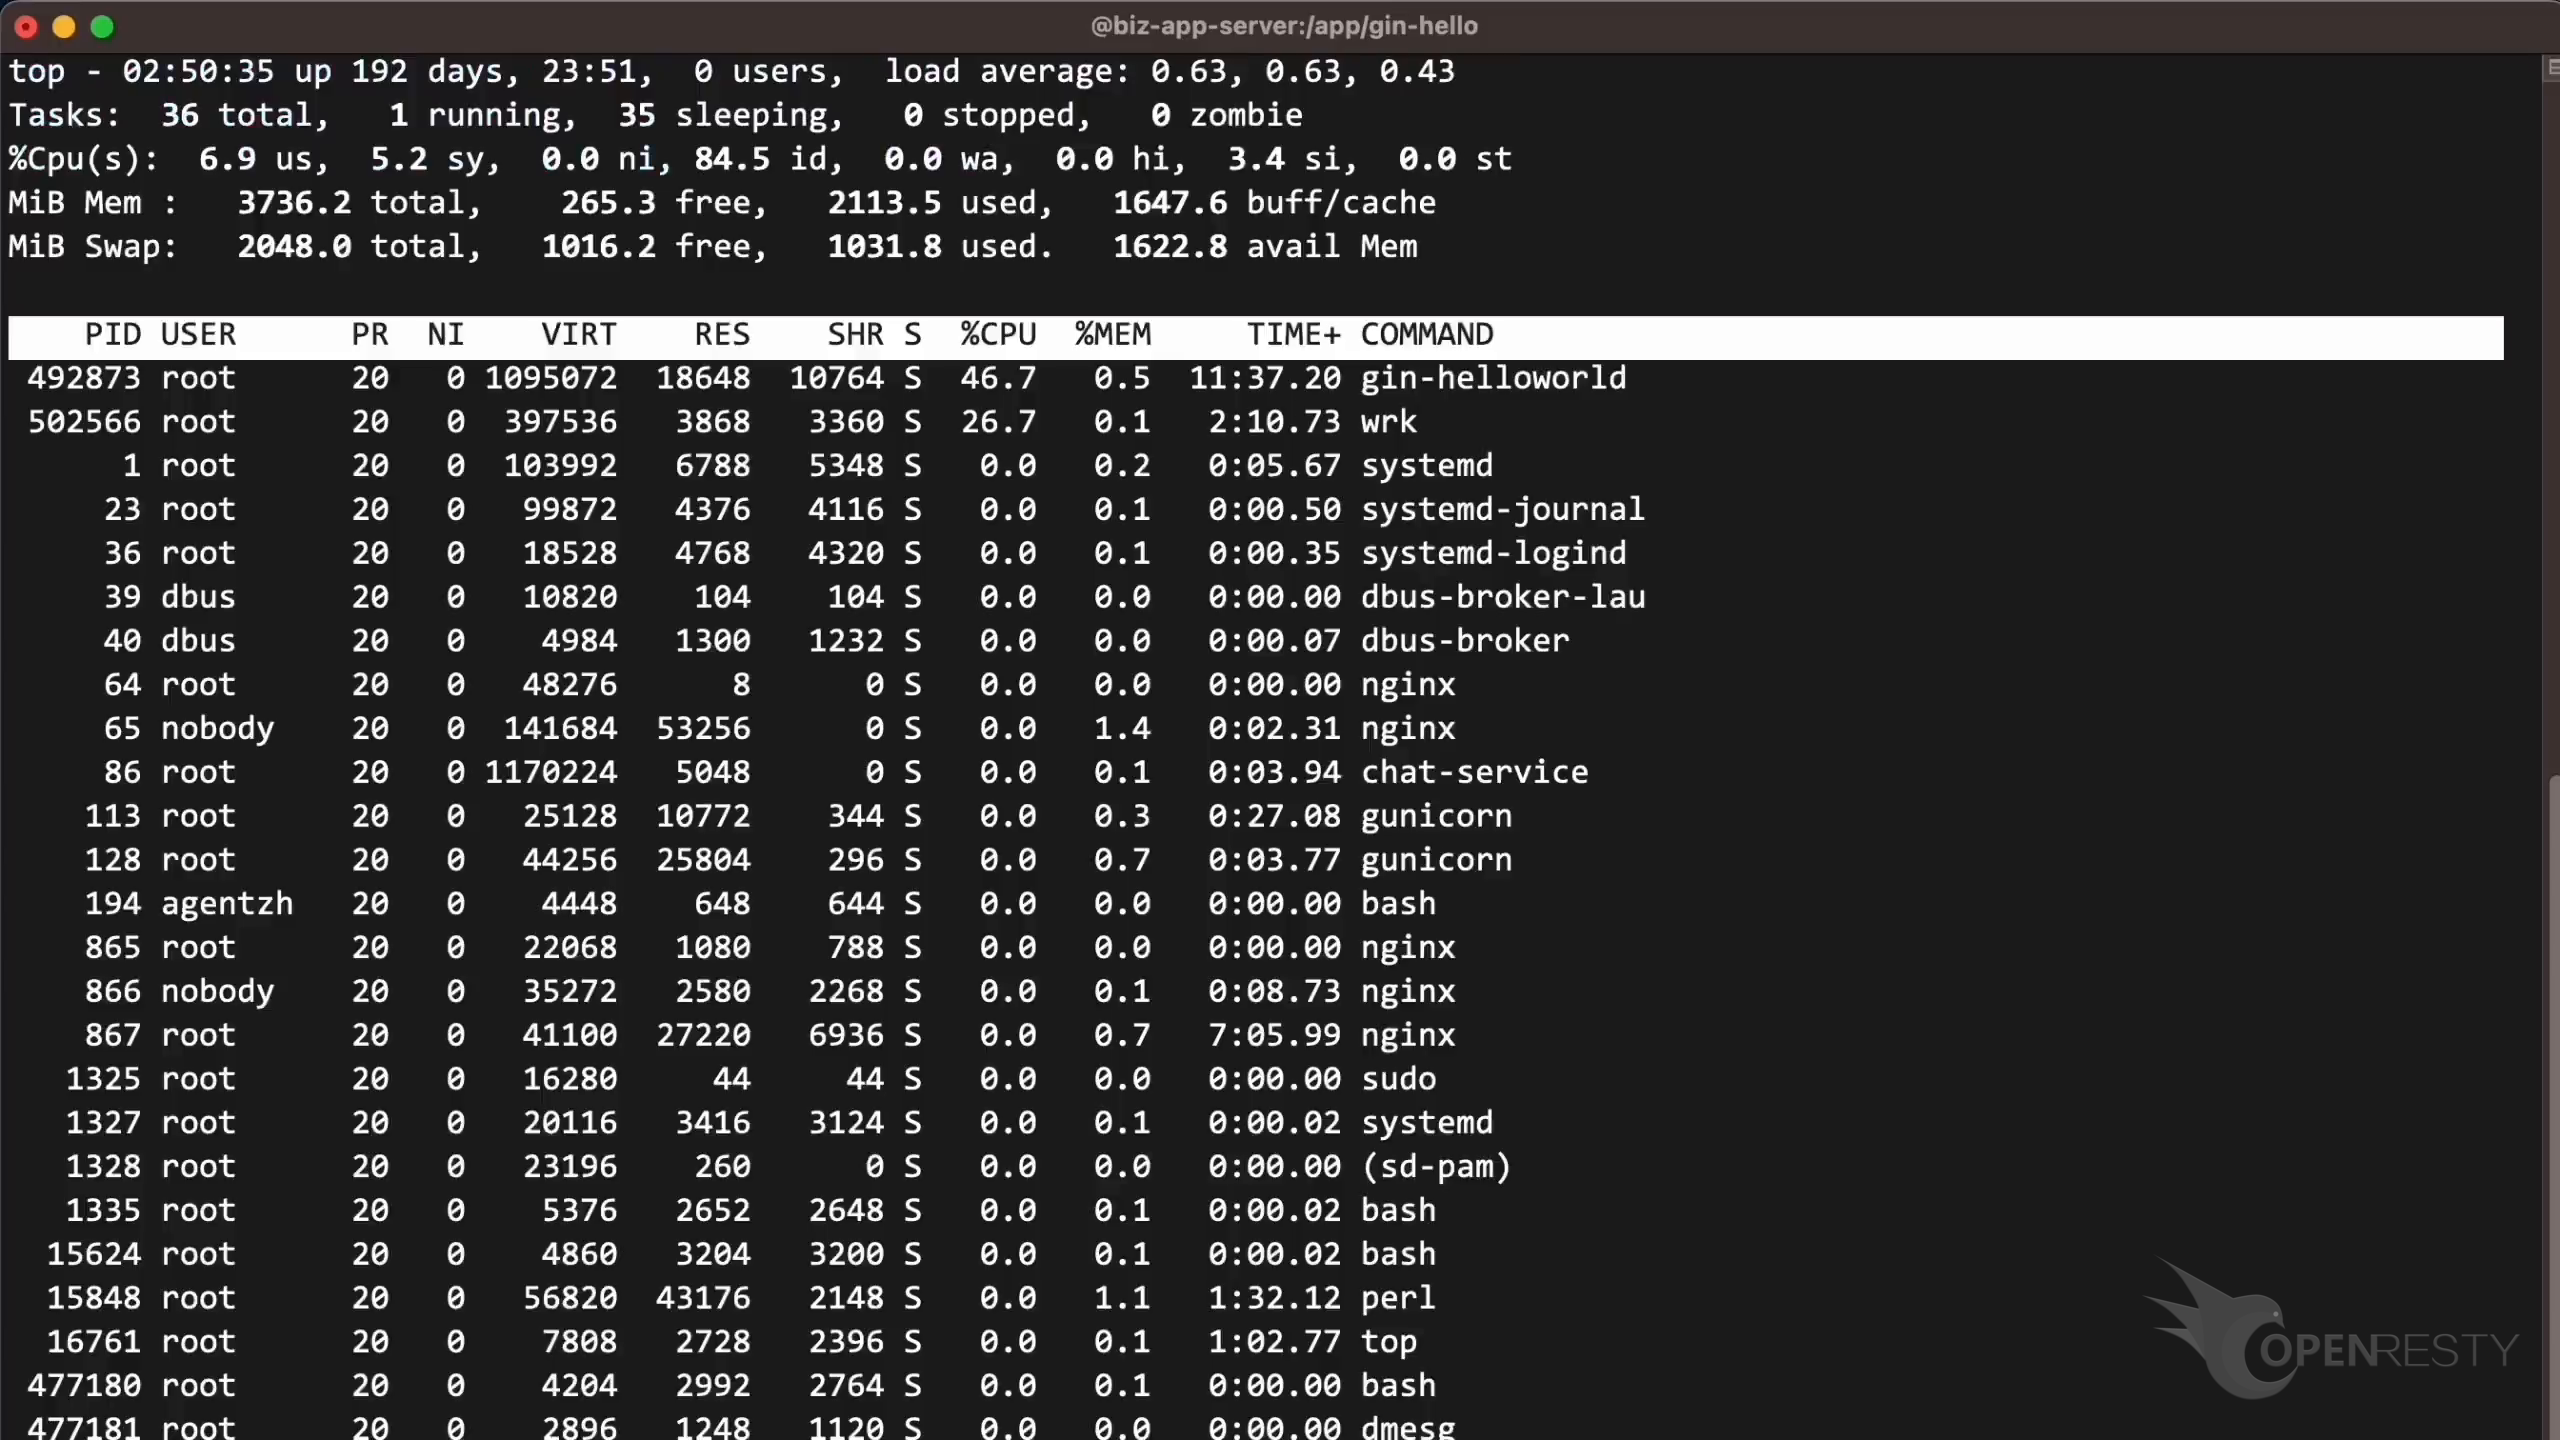
Look at this process named ‘gin-helloworld’. We already know it is written in Go.
Its CPU utilization fluctuates around 43%.
The load average of the last minute is 0.62.
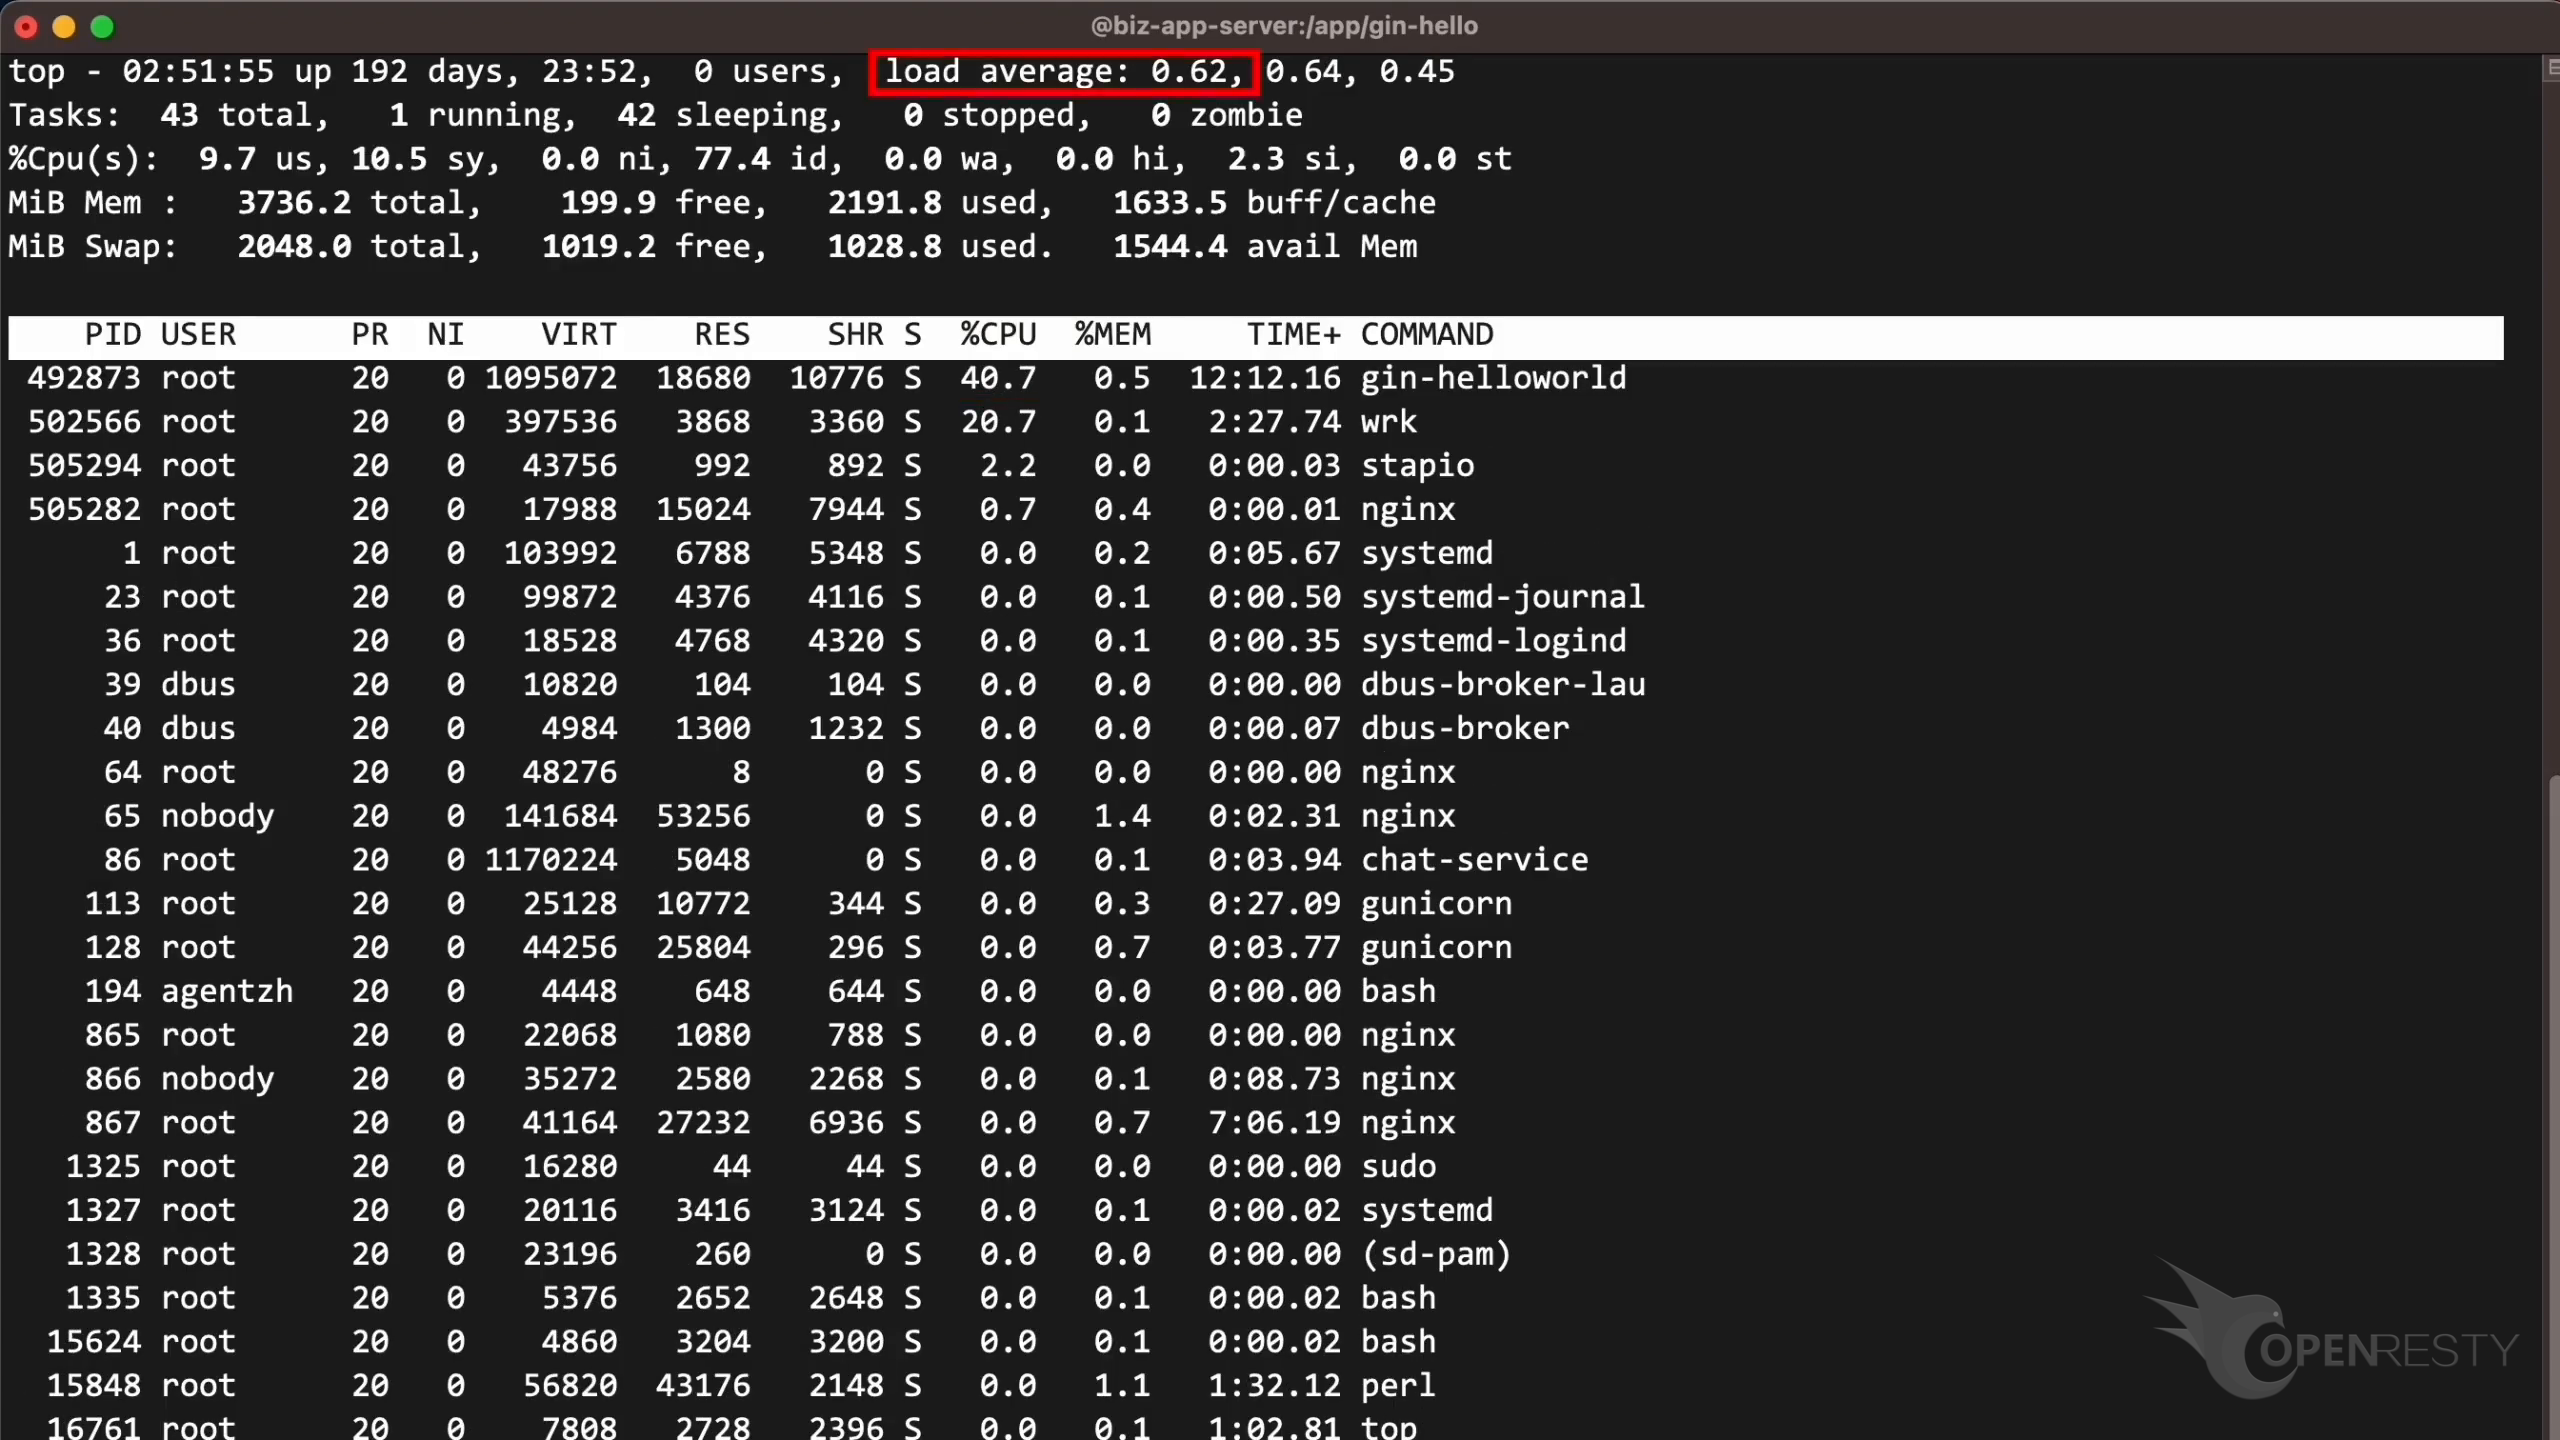
The current CPU idle percentage is about 84%.

The current available memory is about 1546MB.
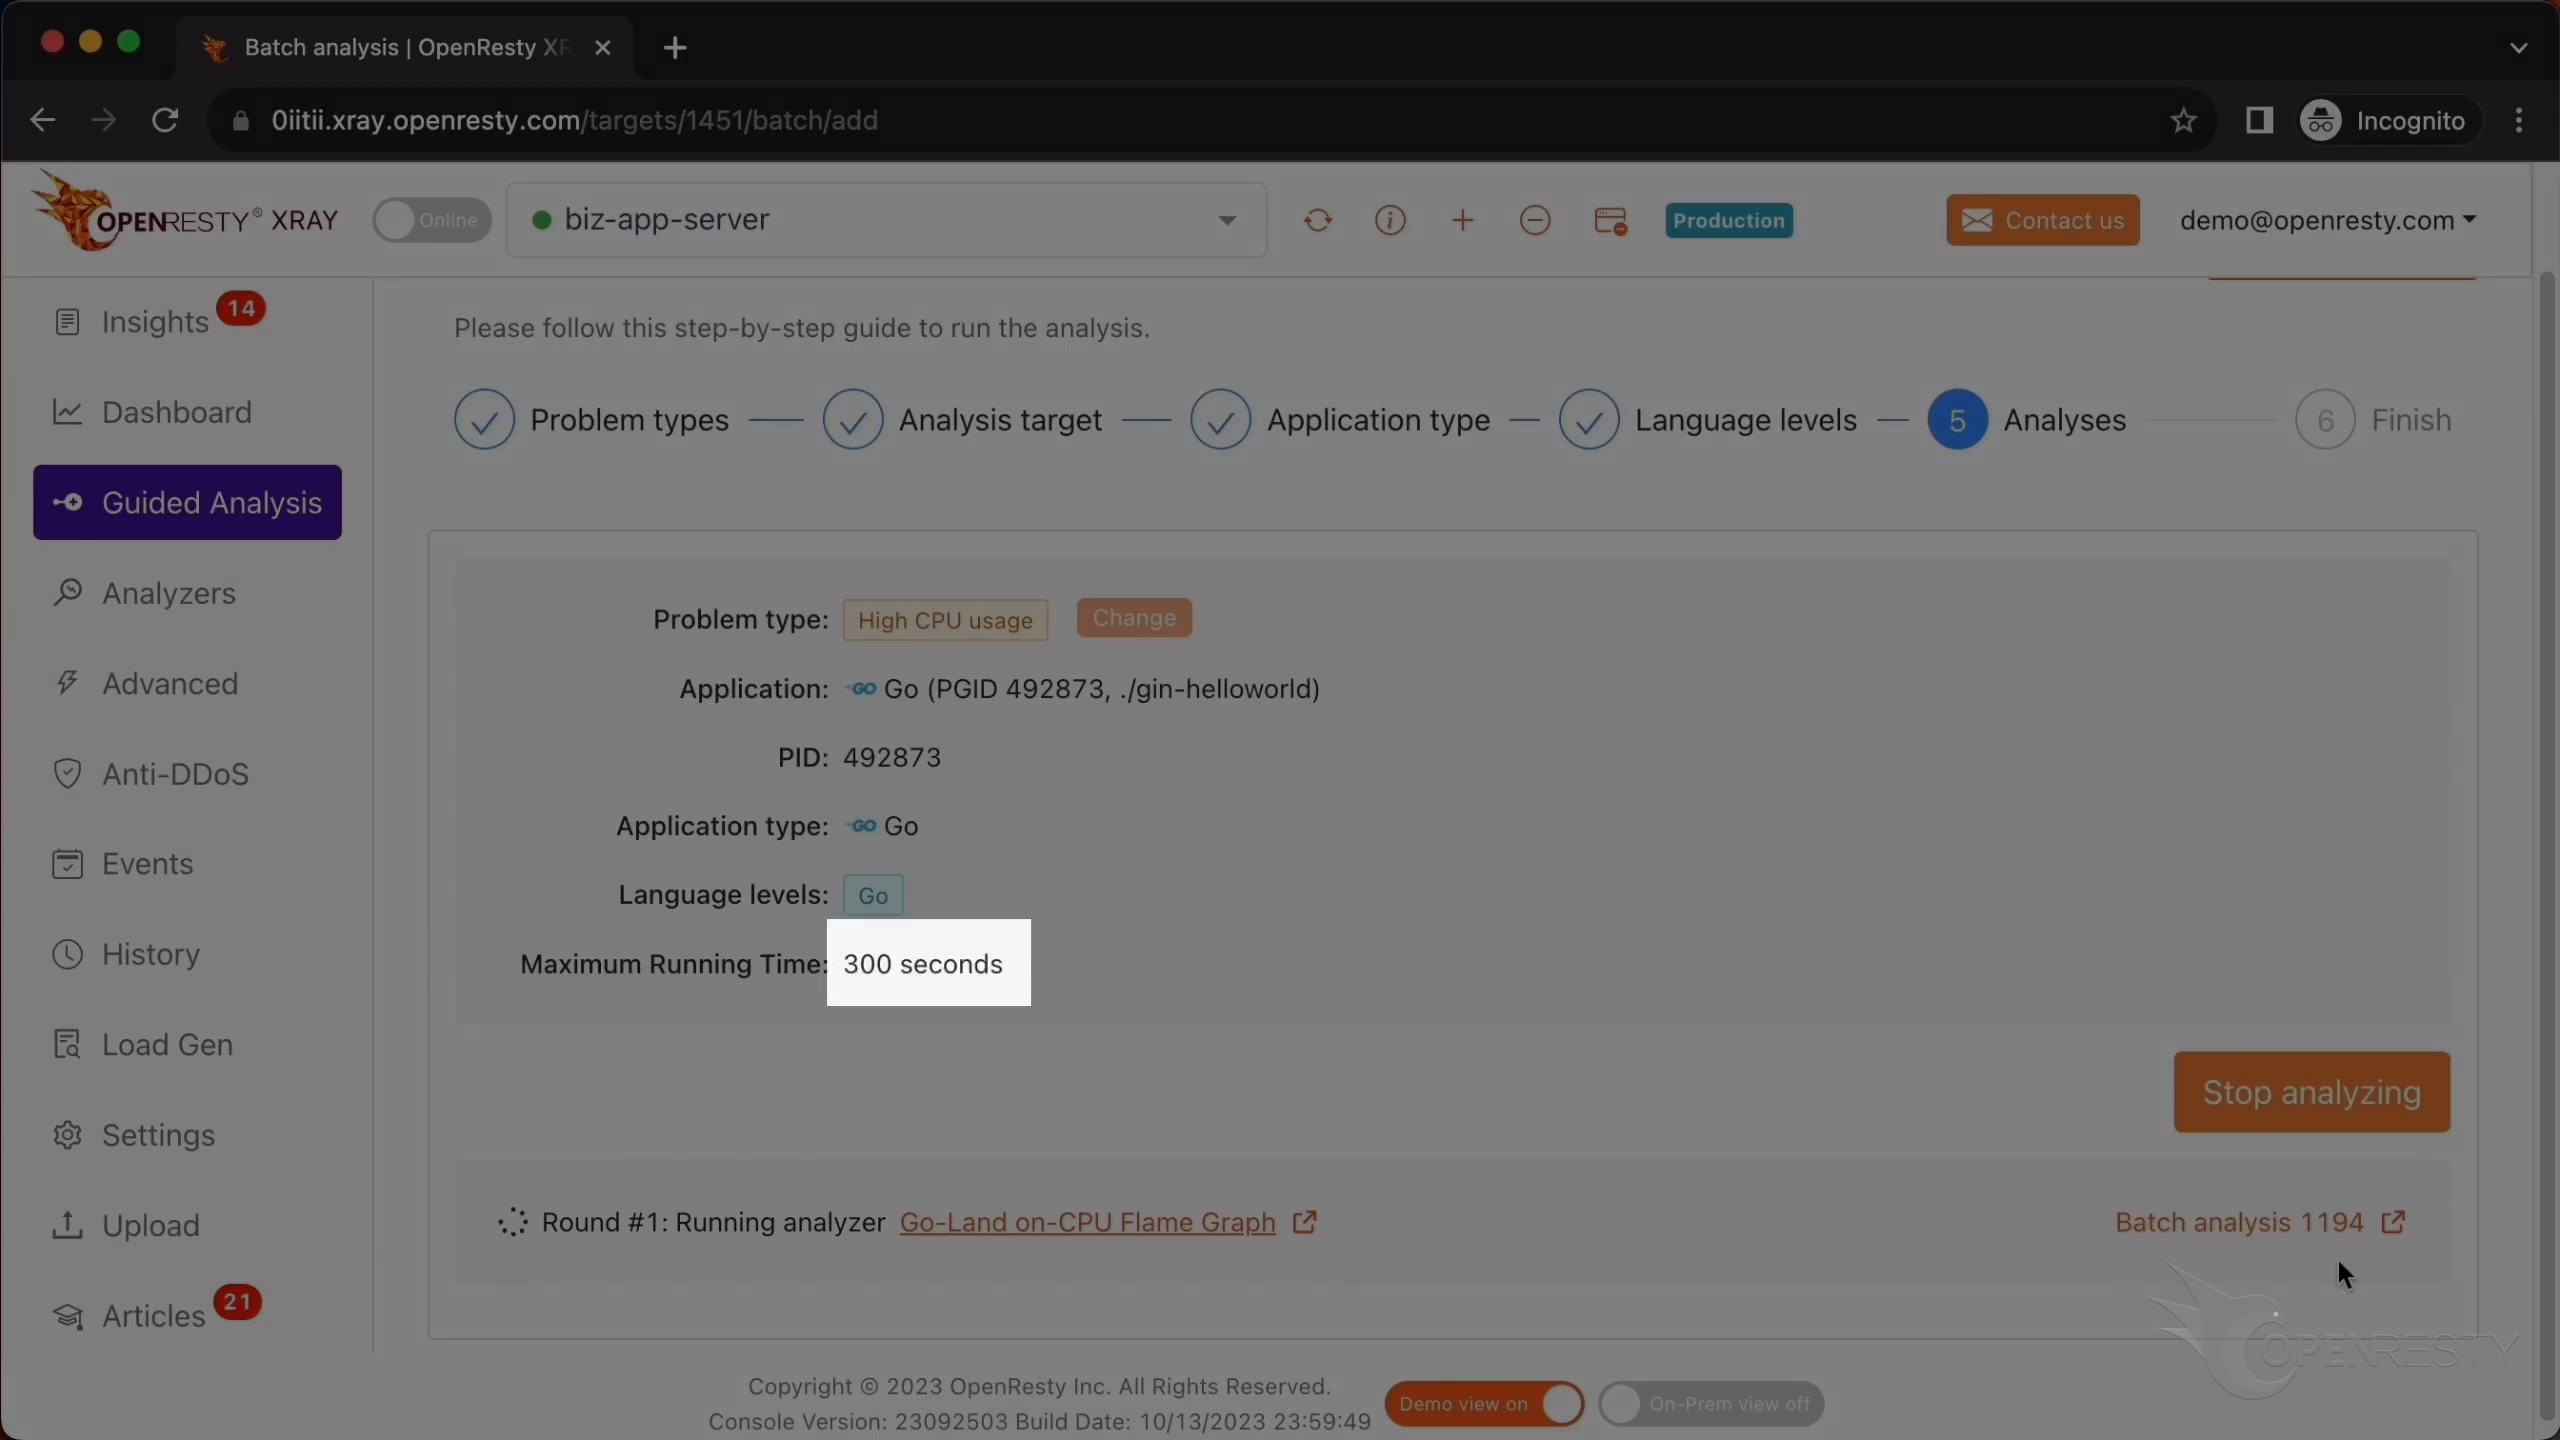
Let’s instruct OpenResty XRay to actively analyze that Go process. Then we can see its perfomance impact on the target.
Performance Impact When the Analyzer is Running
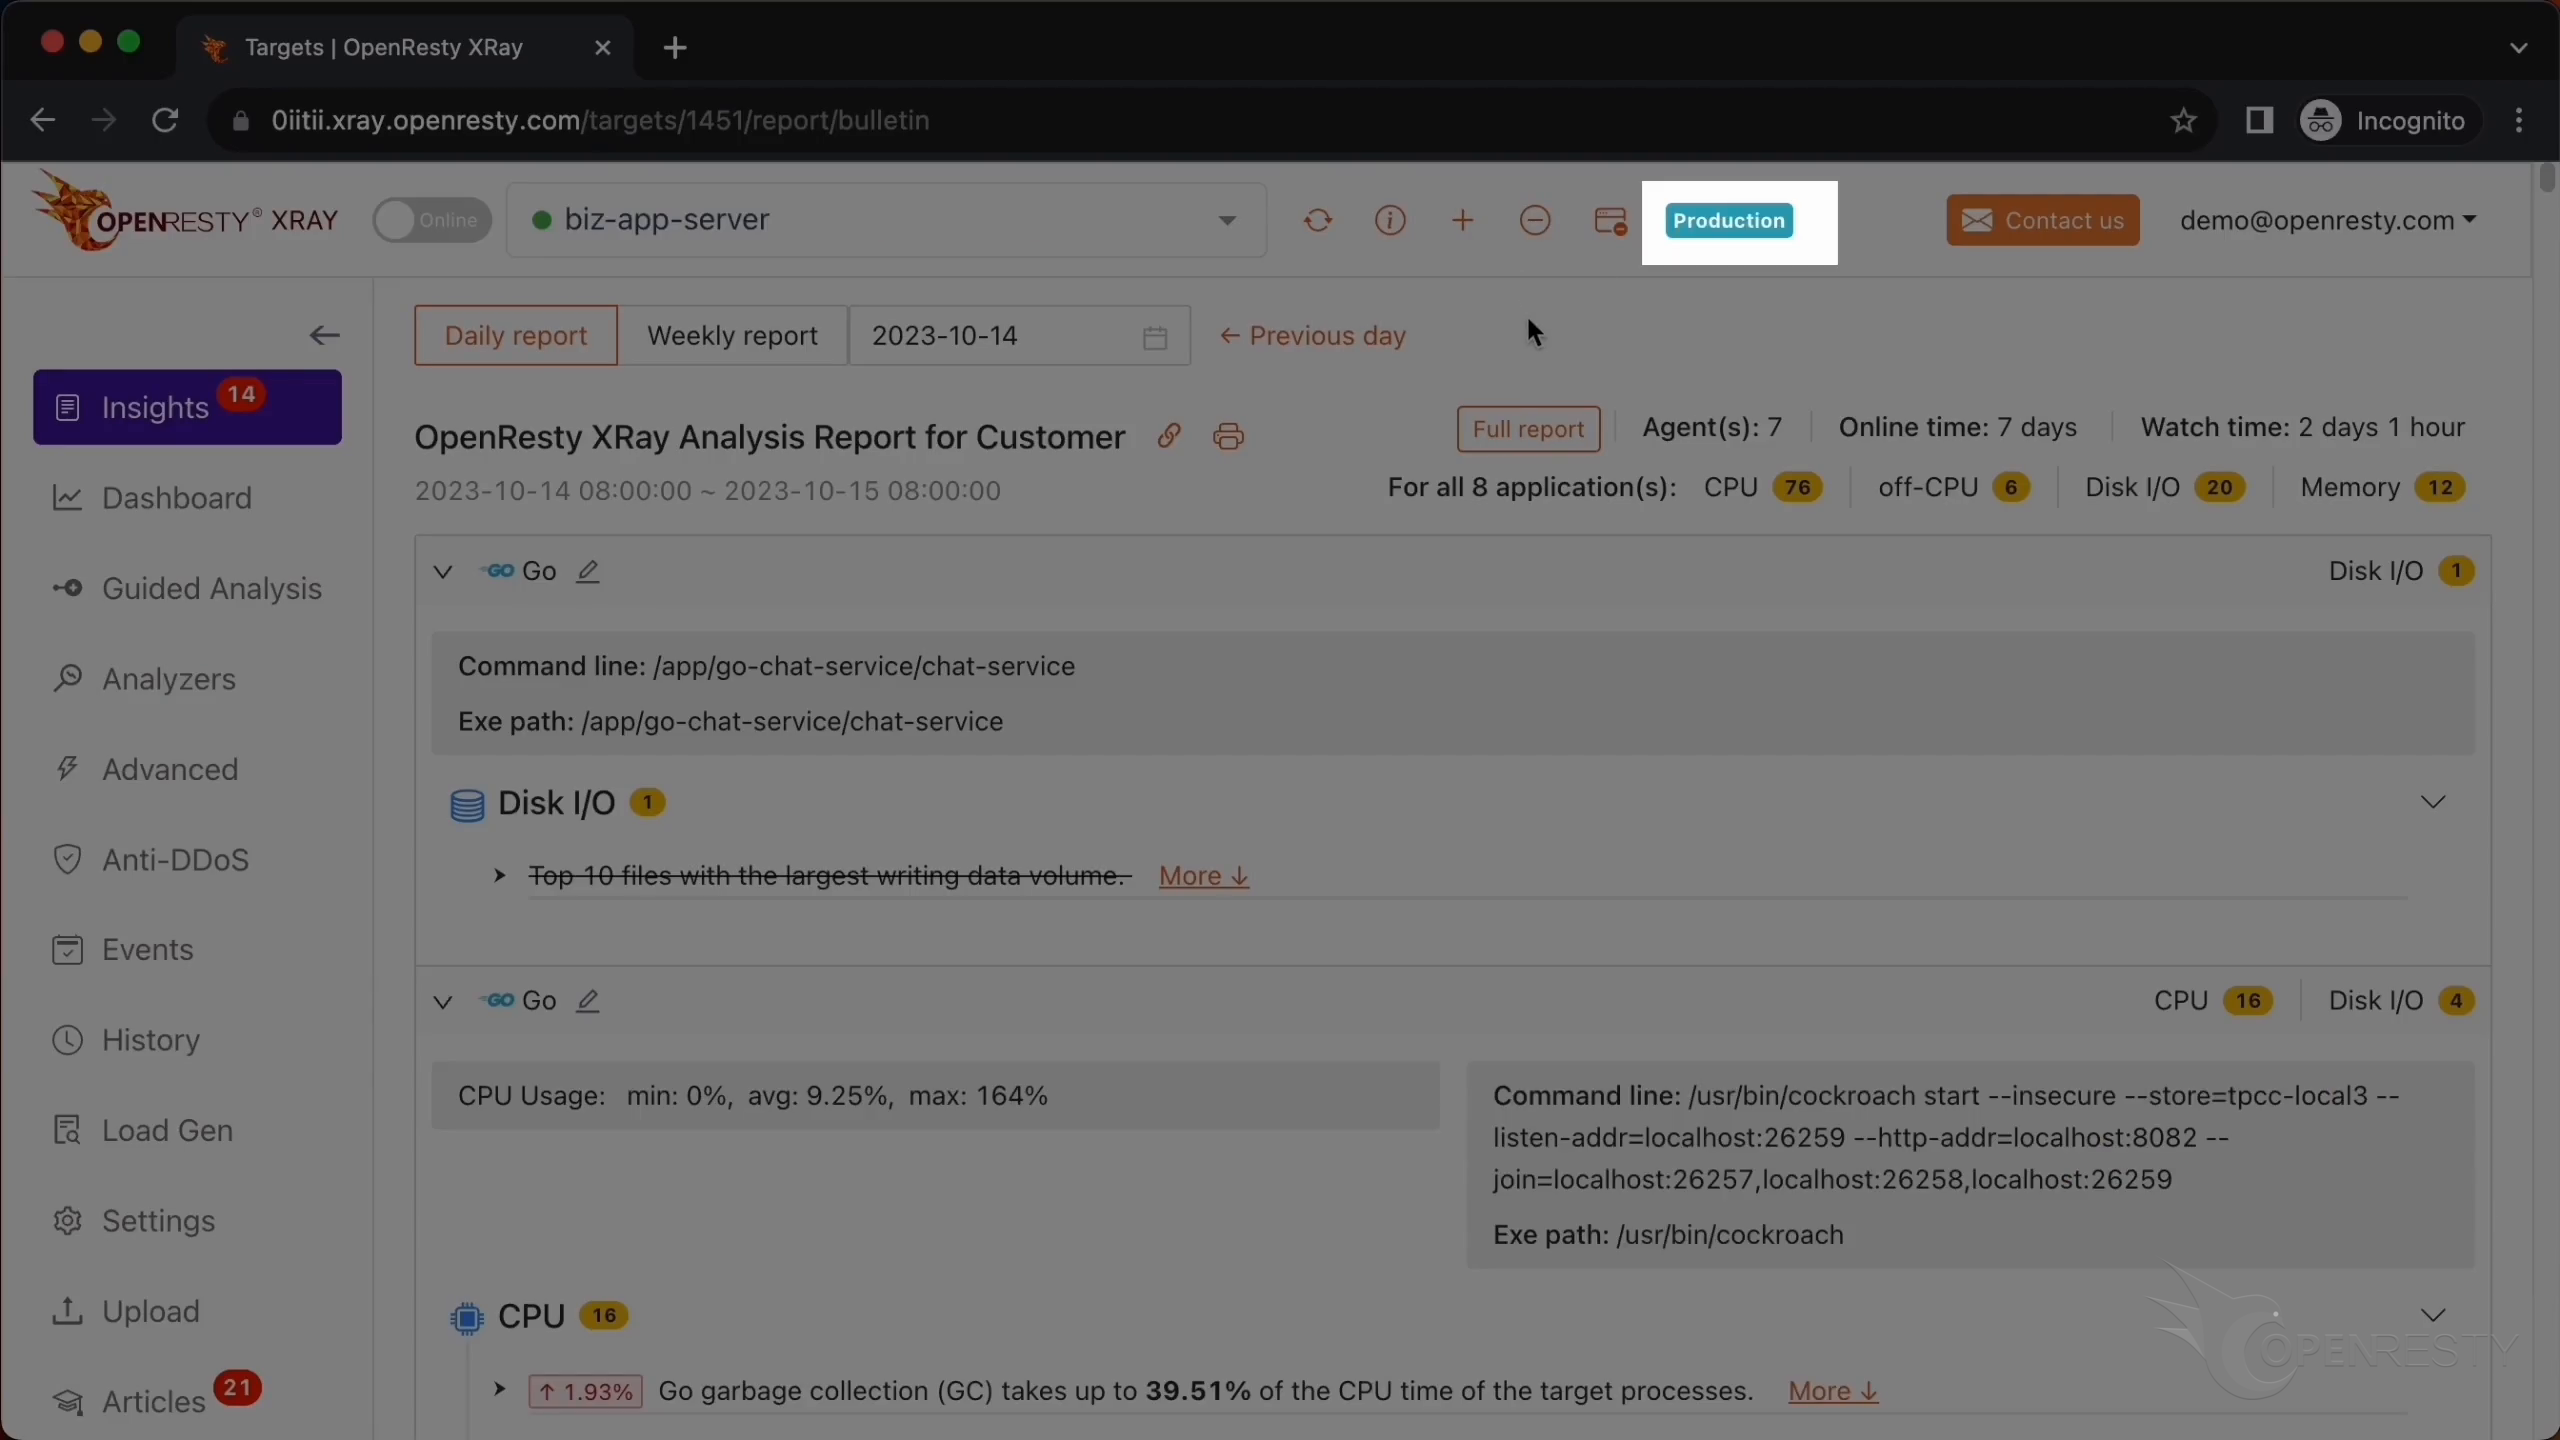
Open the OpenResty XRay Web console in the web browser.
Make sure it is the right machine you are watching.
The production mode is for analyzing online production environments. It tries hard to minimize the performance impact on the target applications and servers. It may take longer to analyze though.
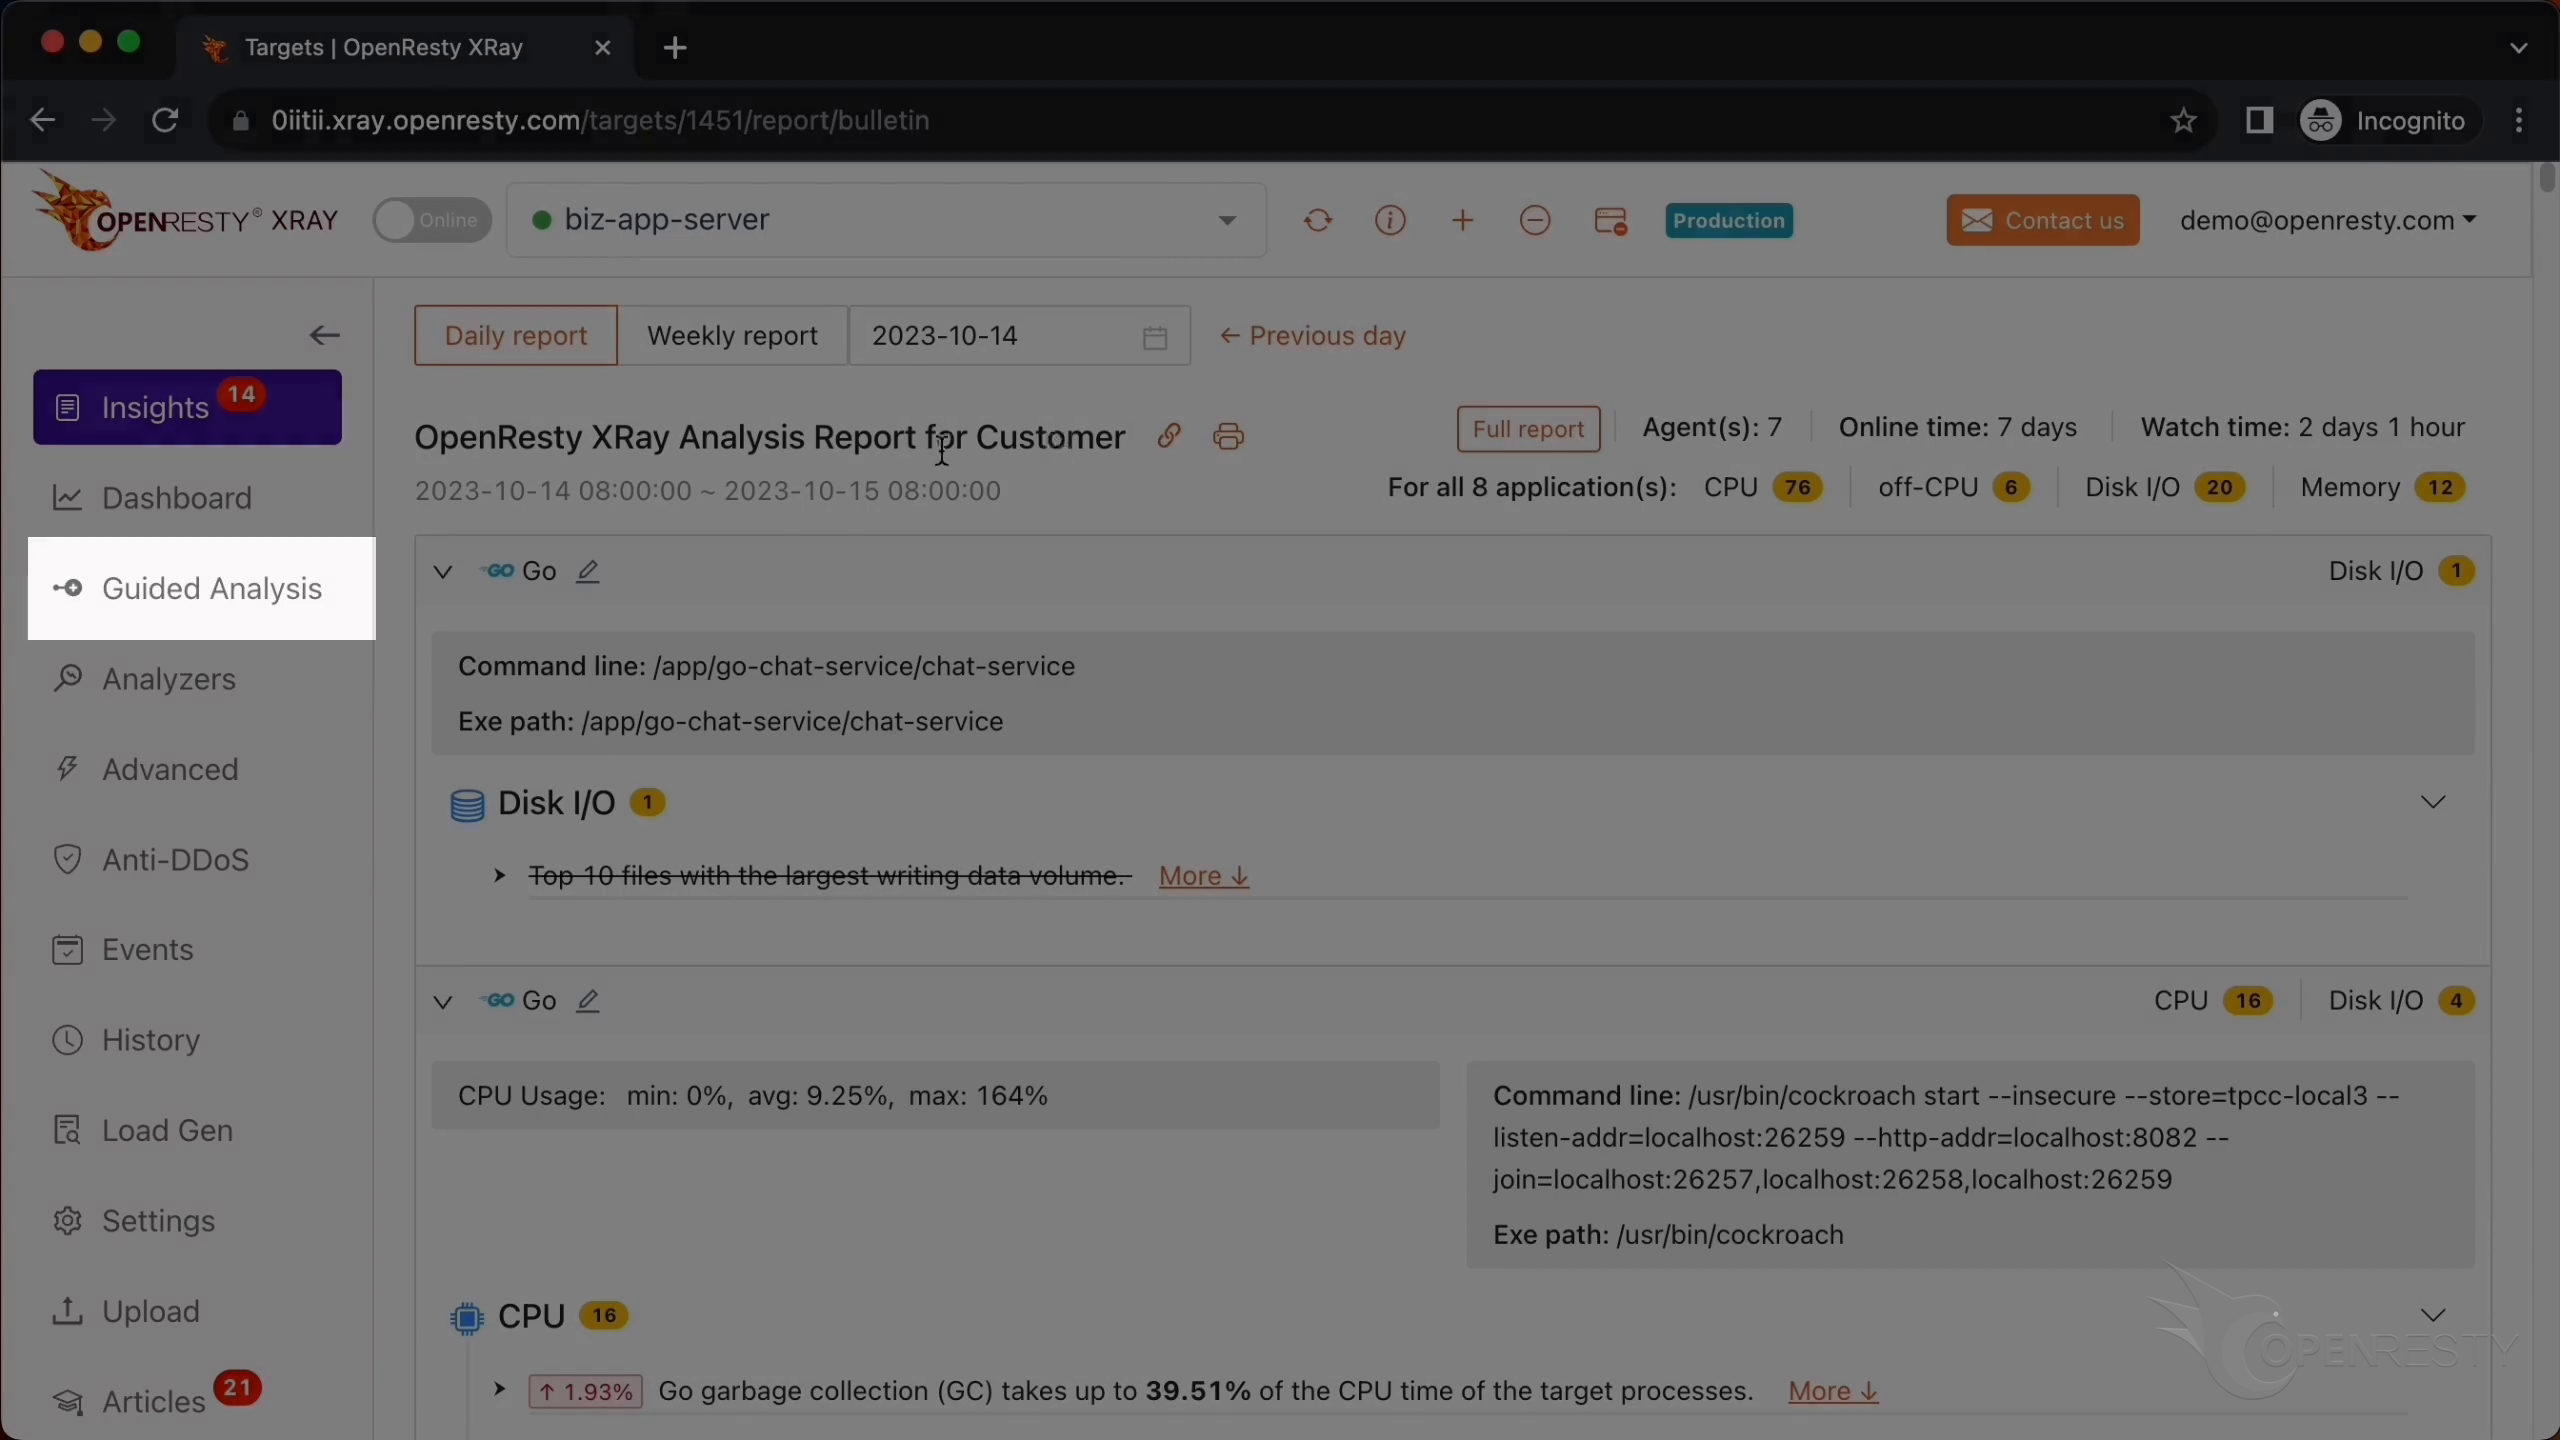
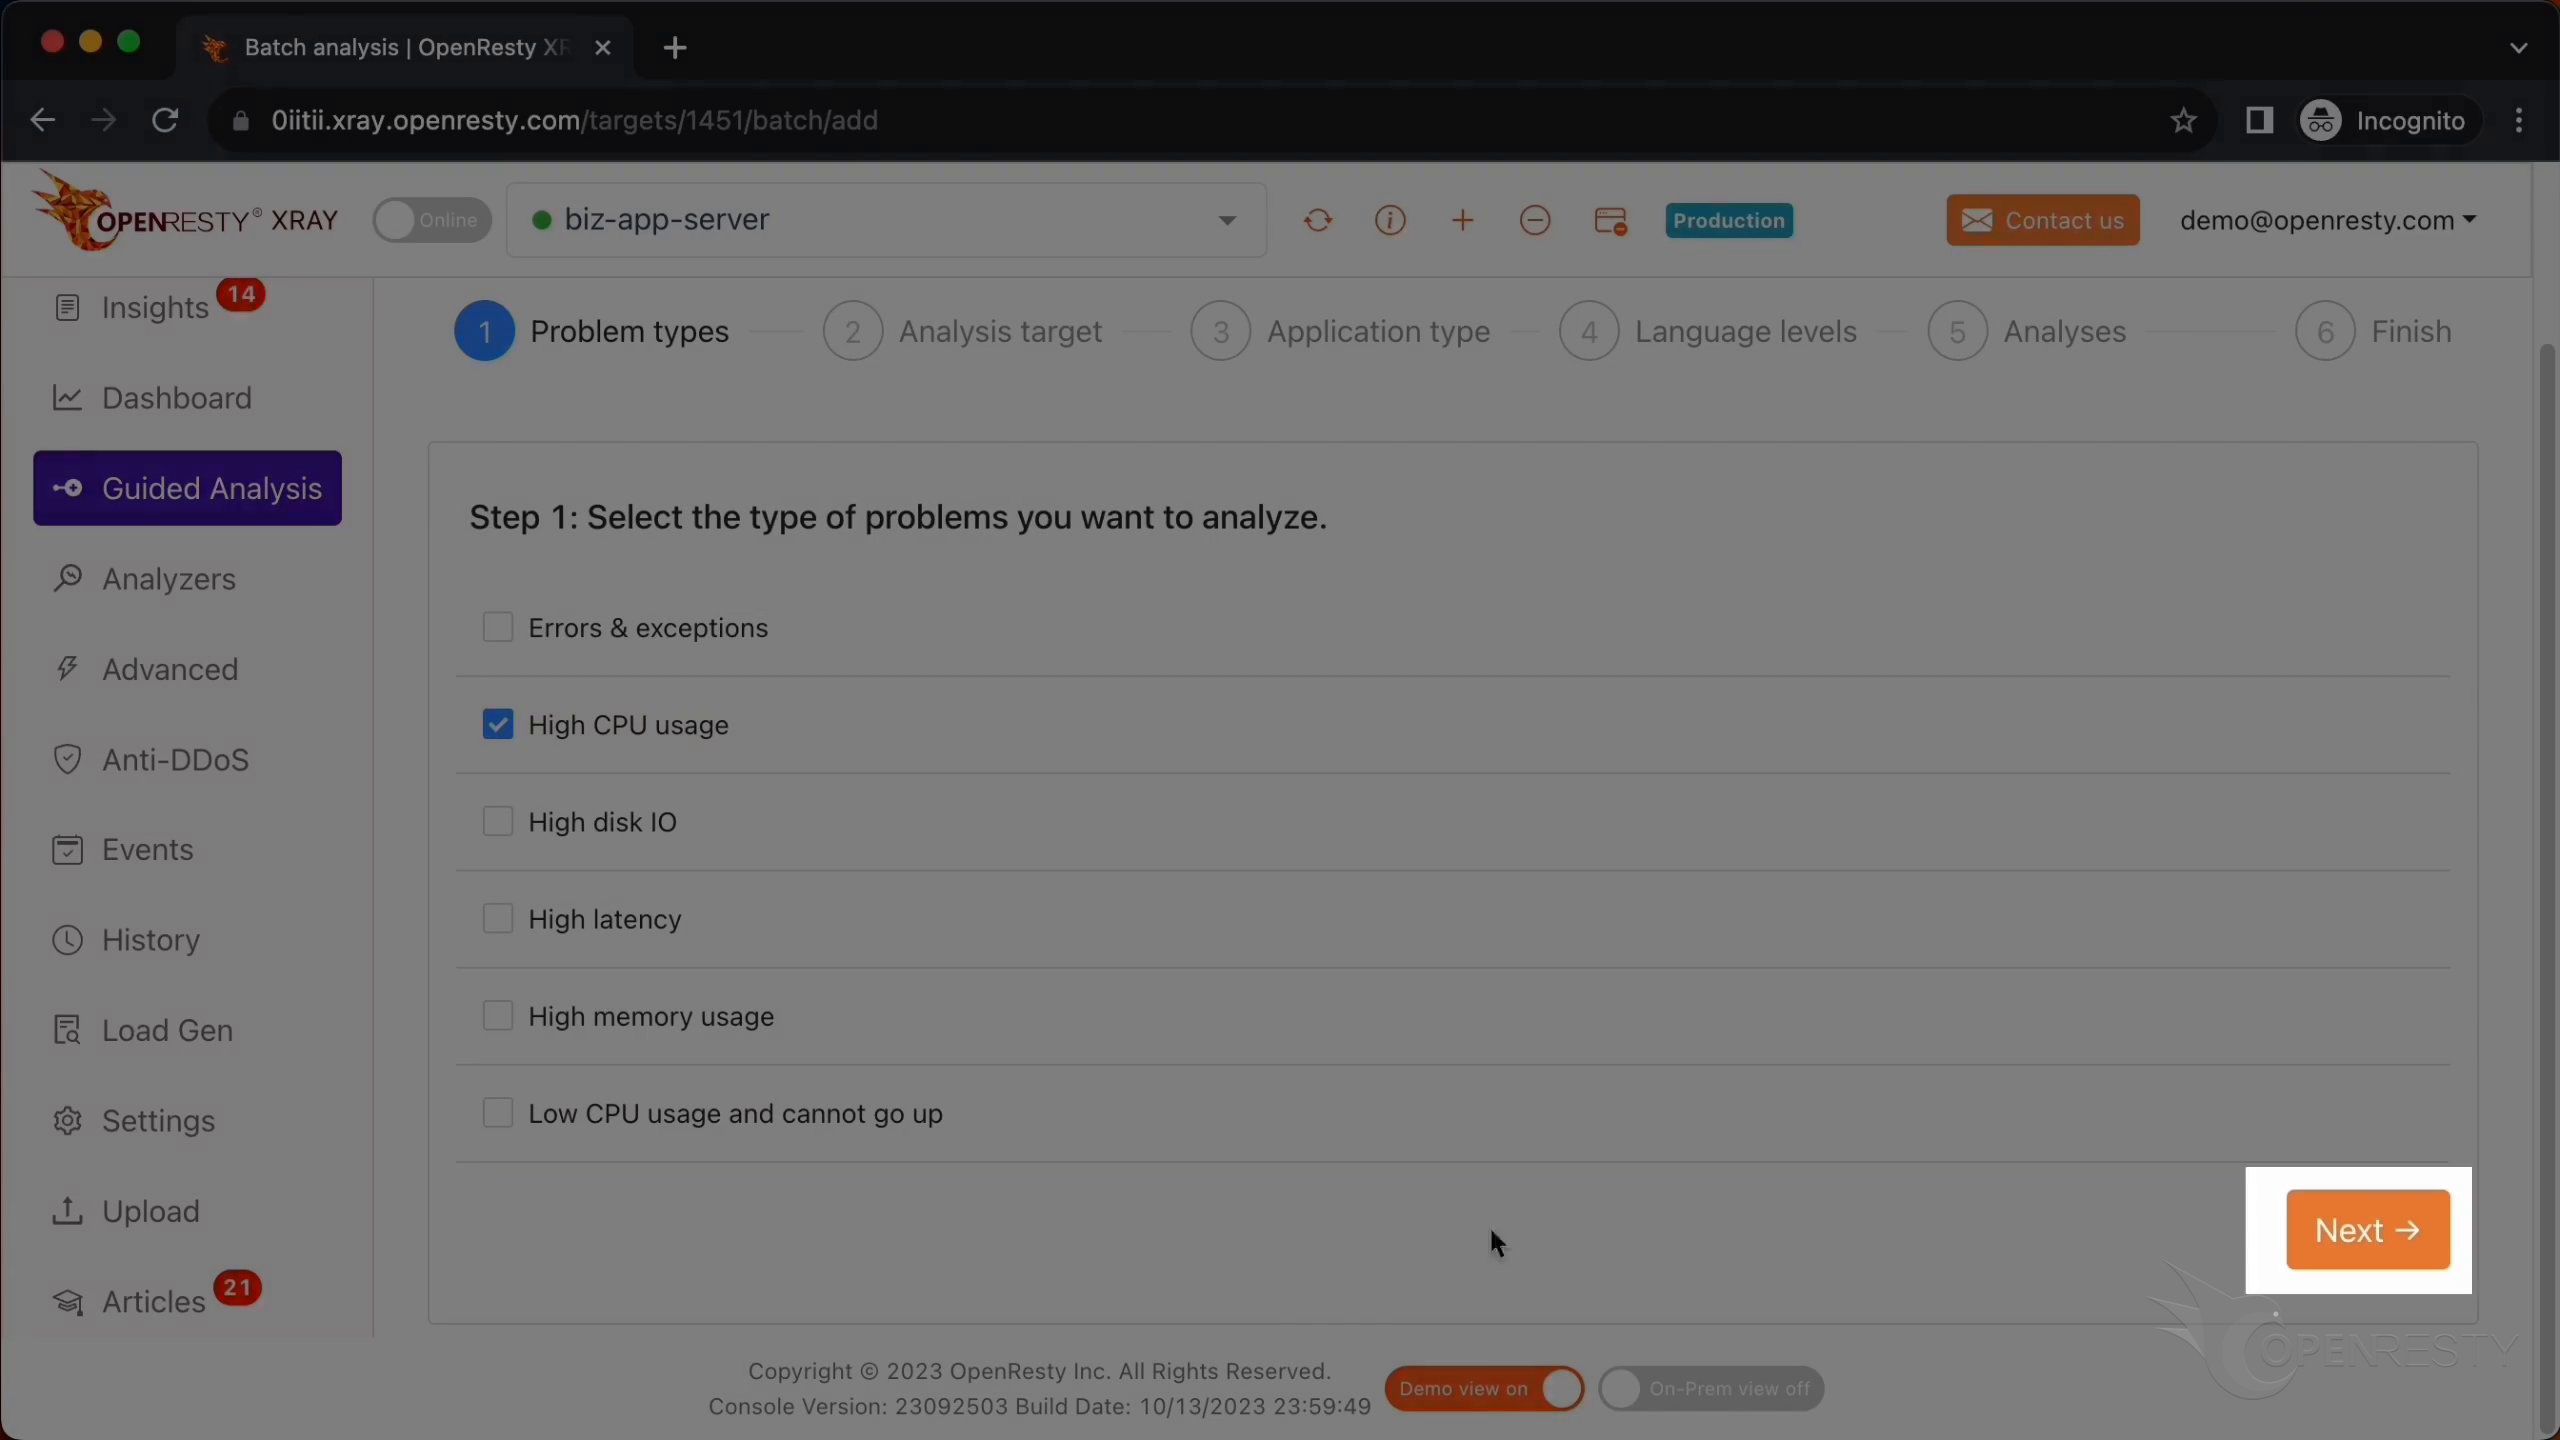
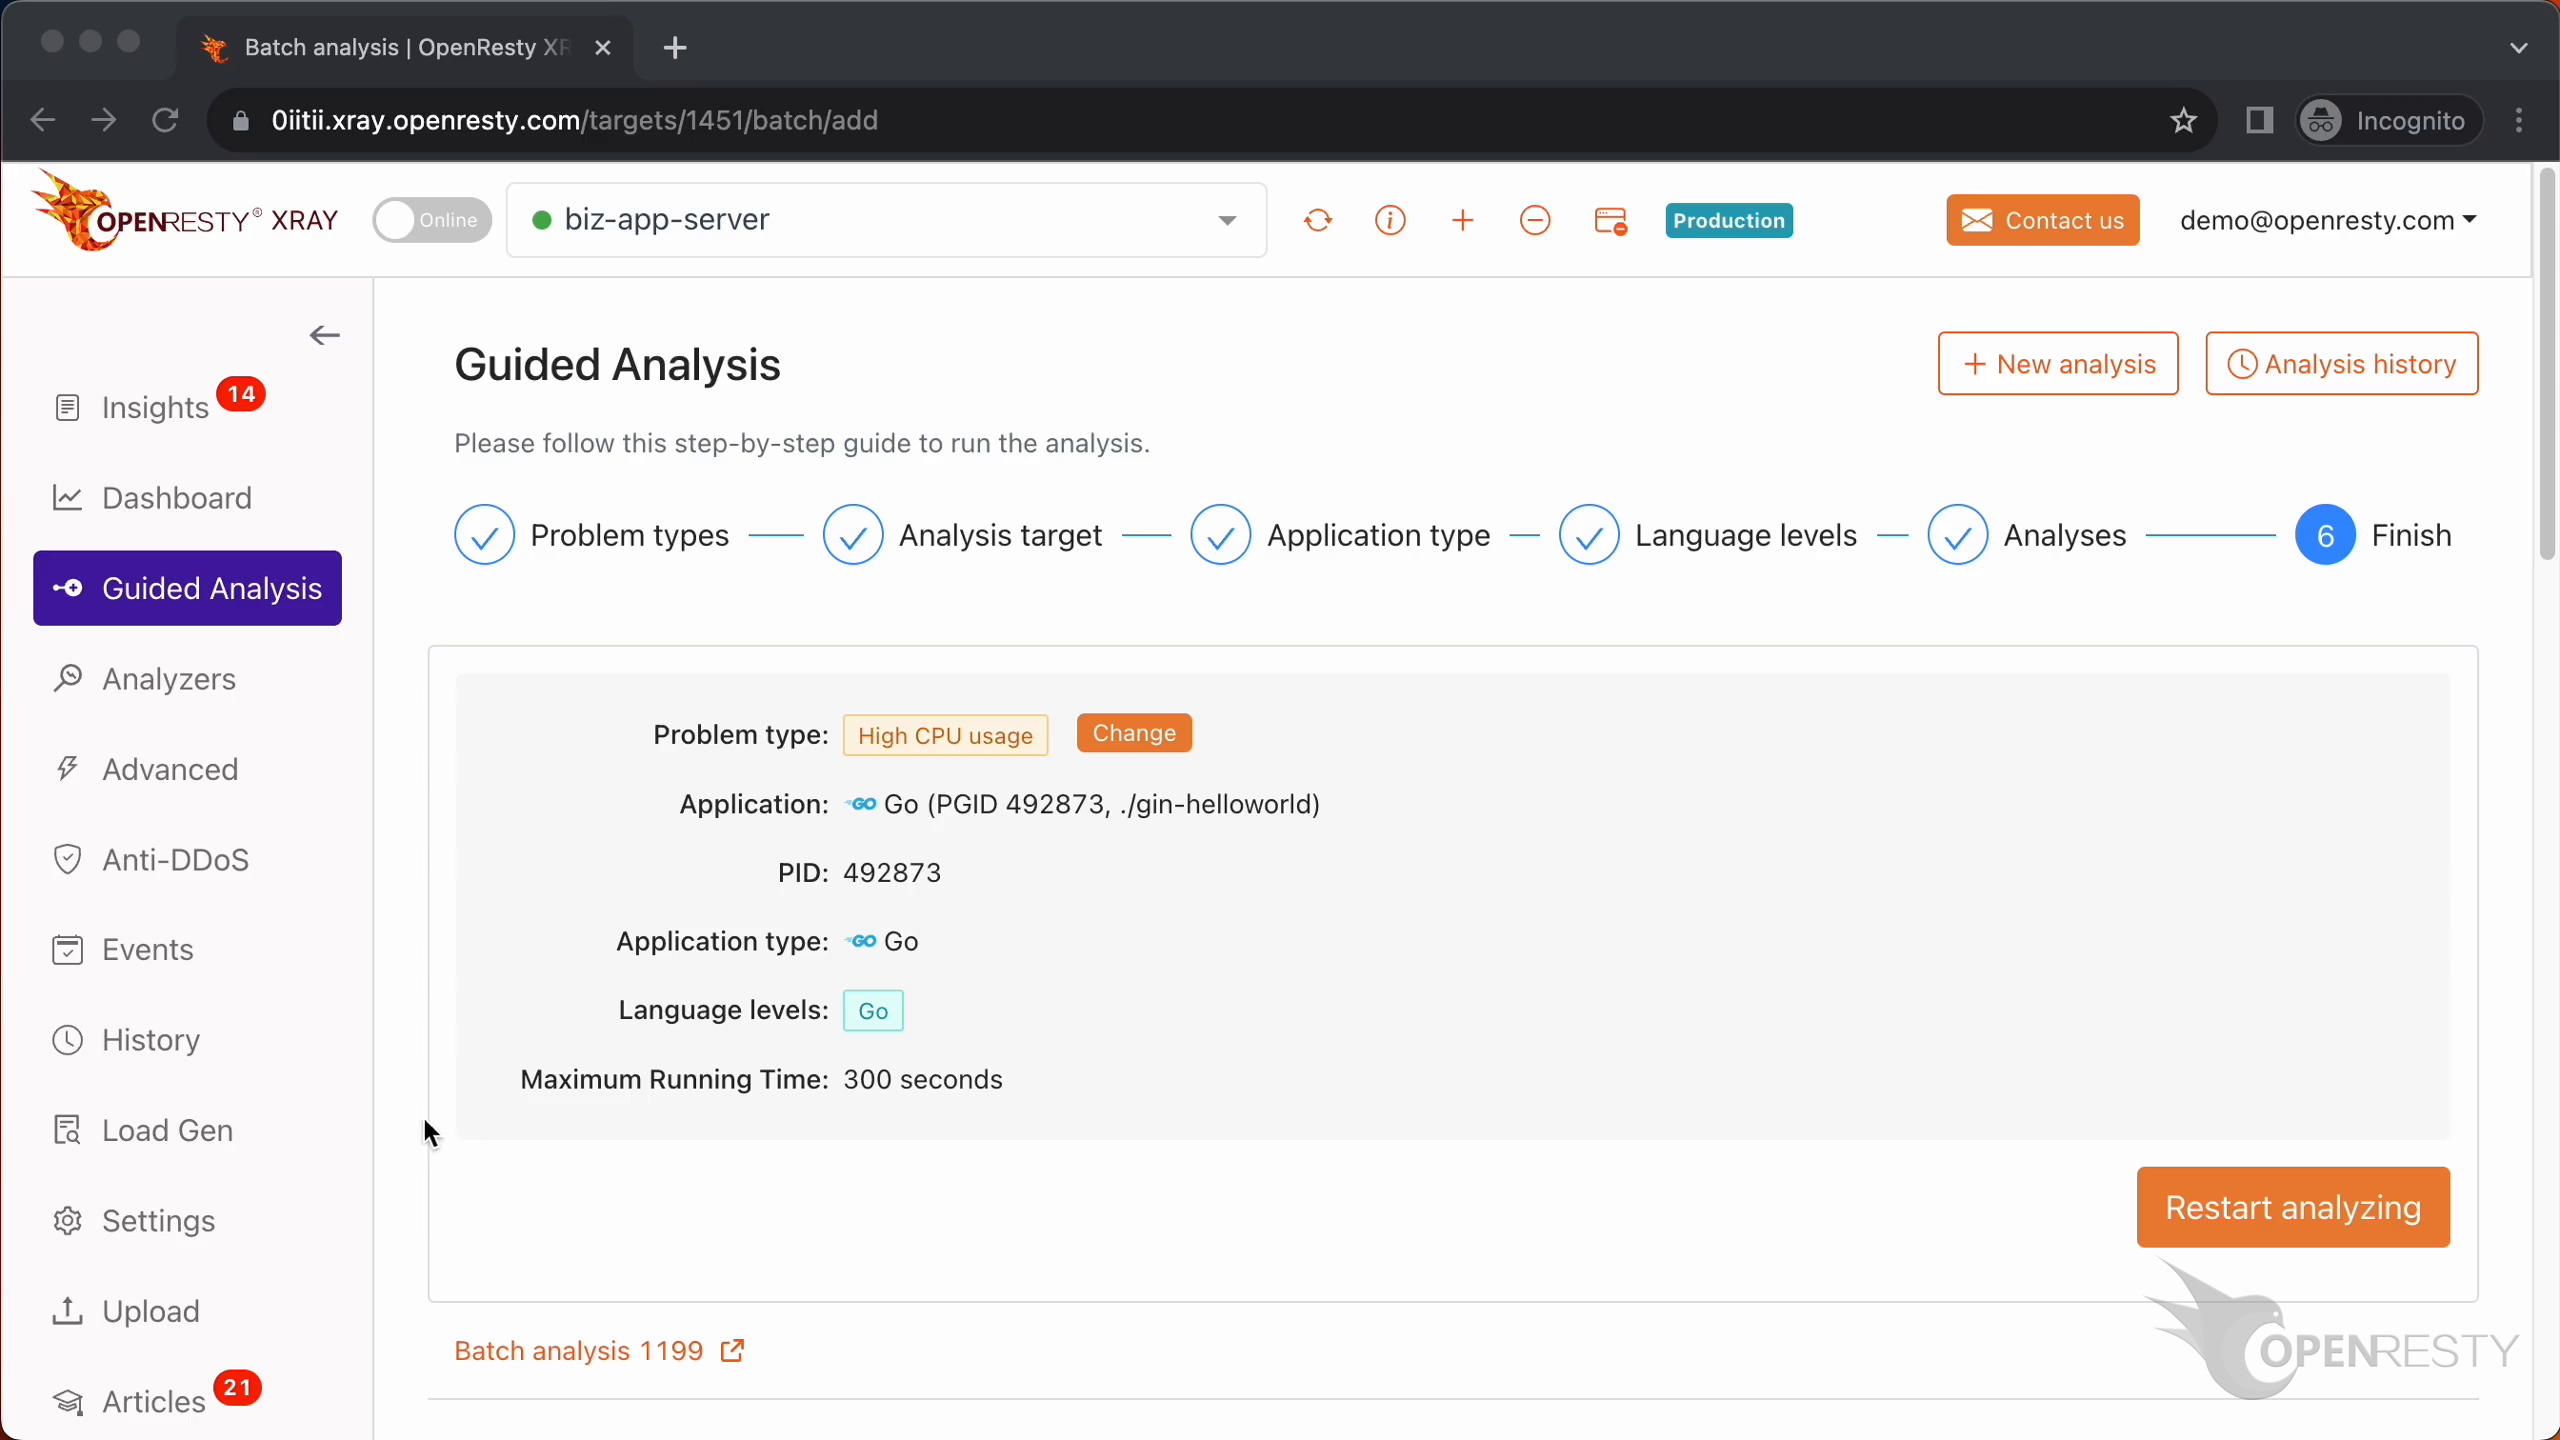
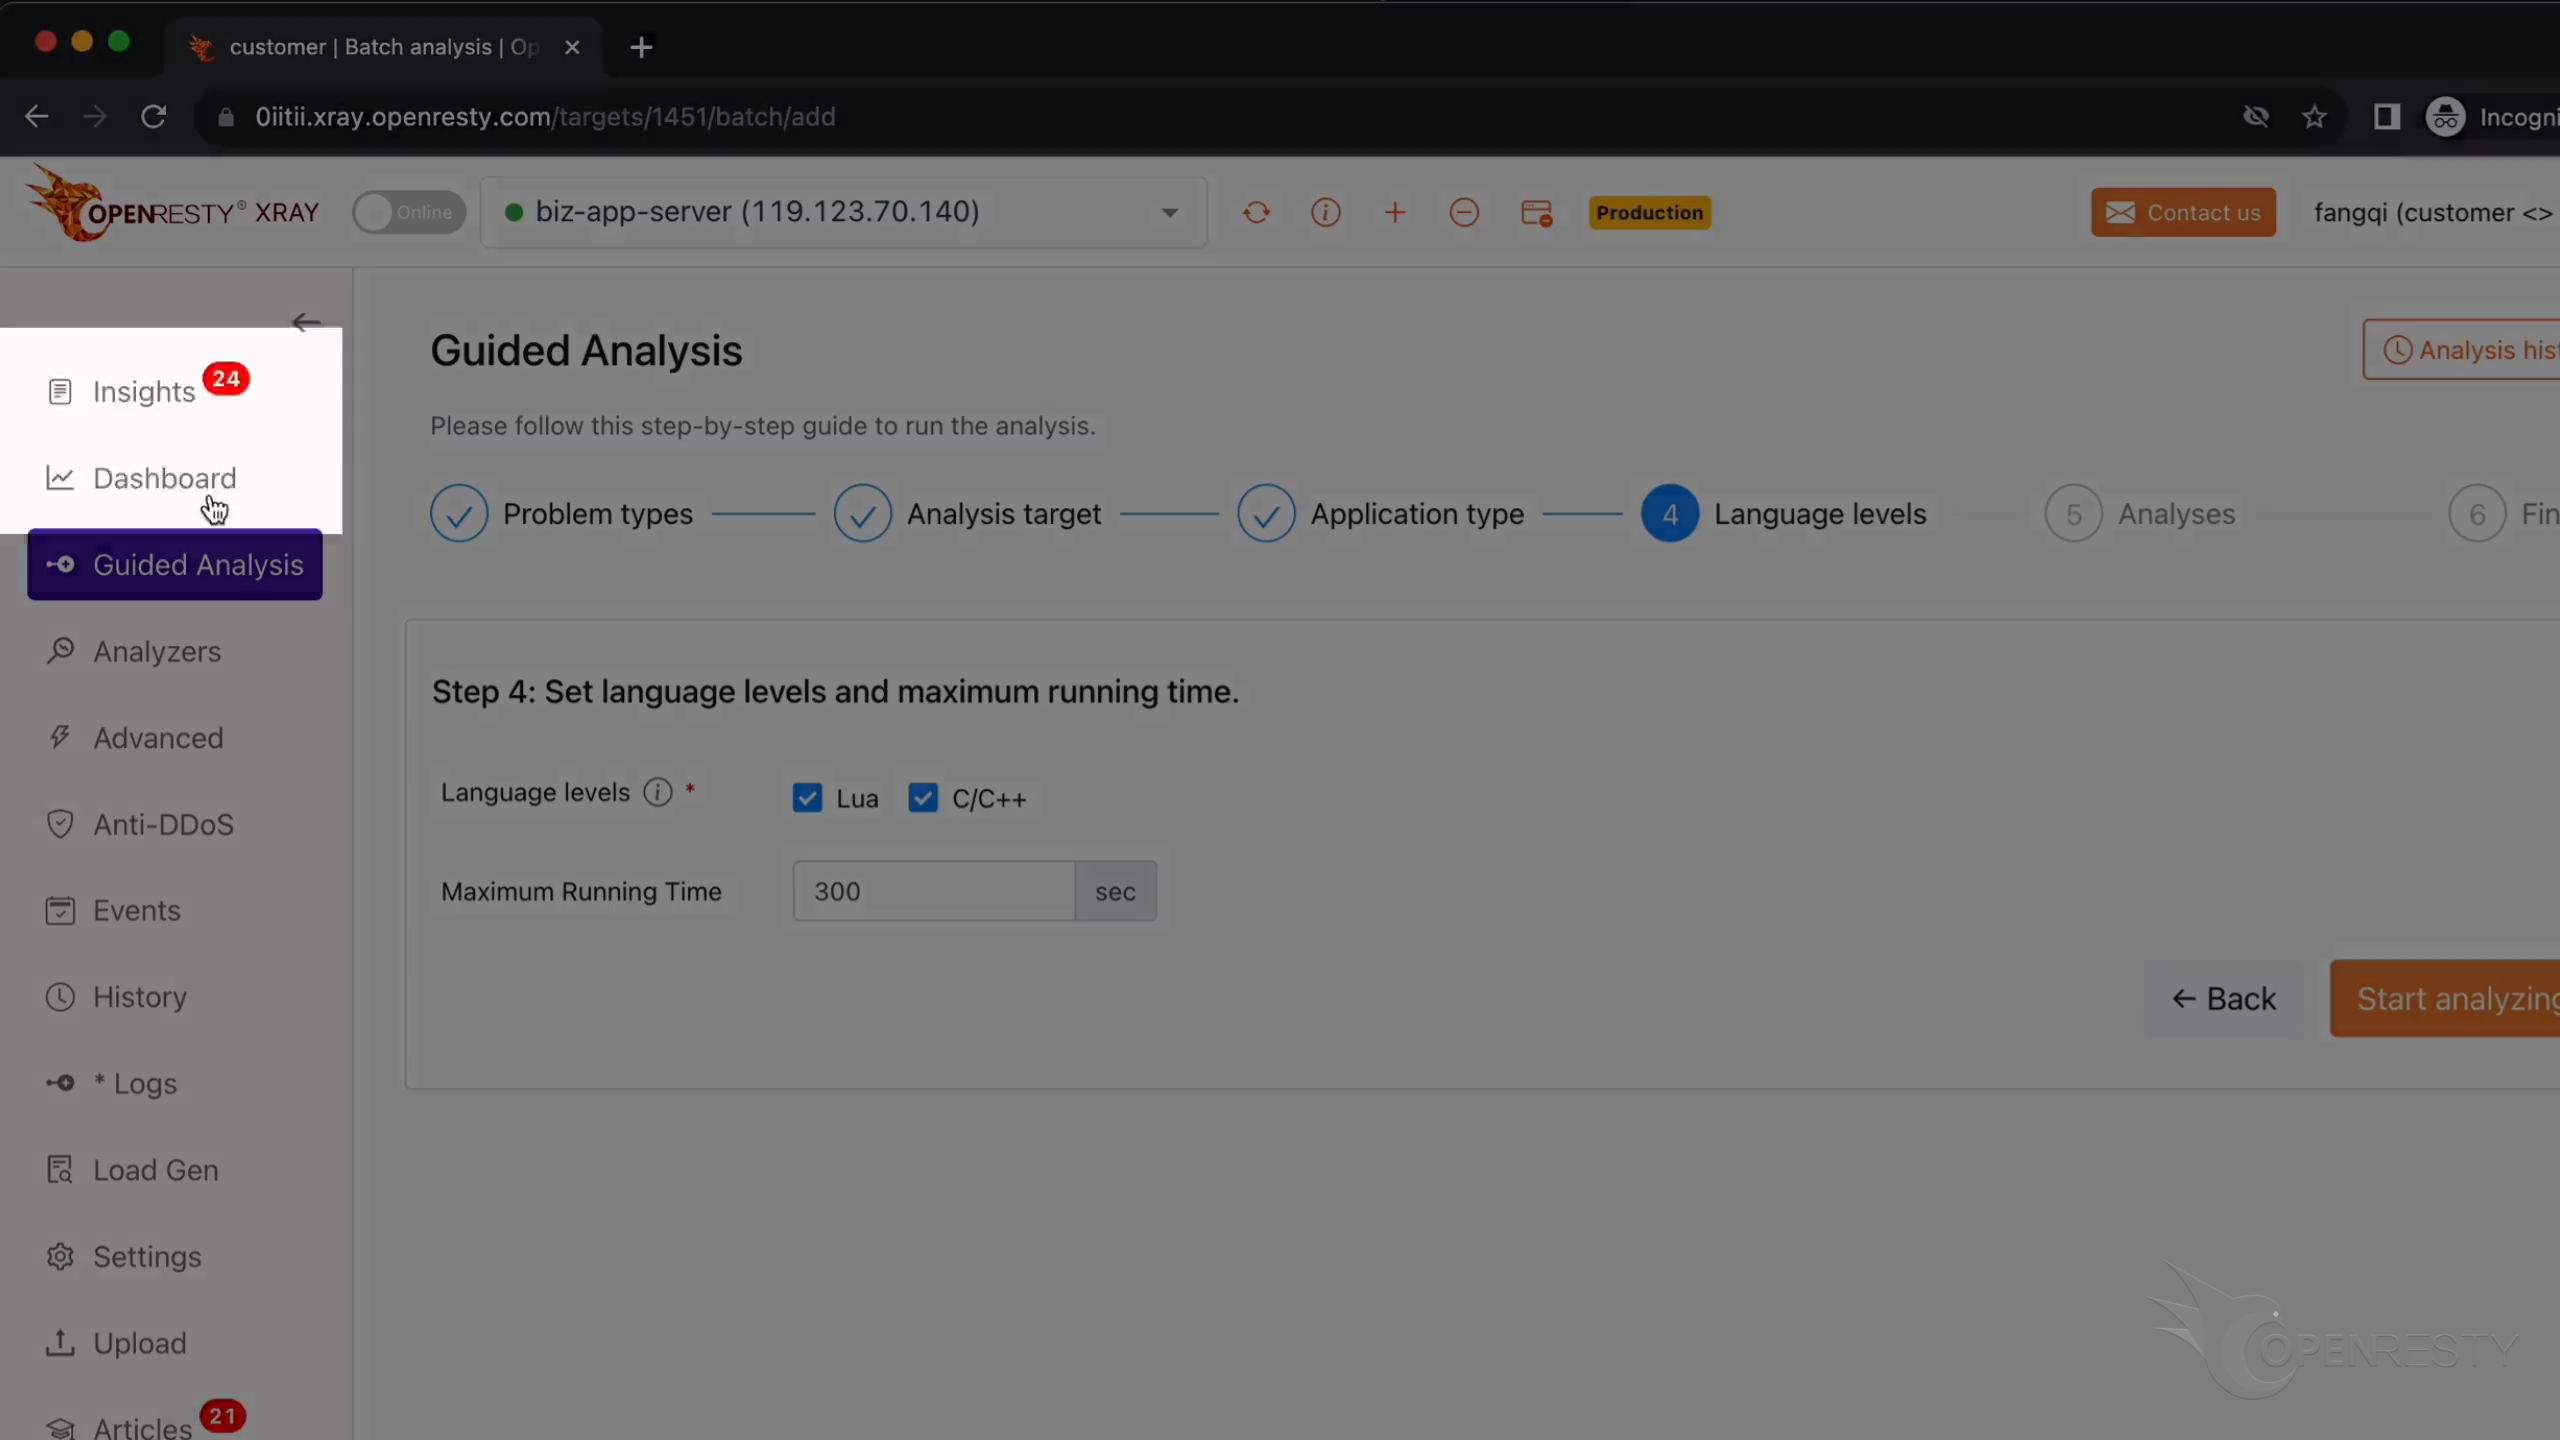
Go to the “Guided Analysis” page.
Let’s select “High CPU usage”.
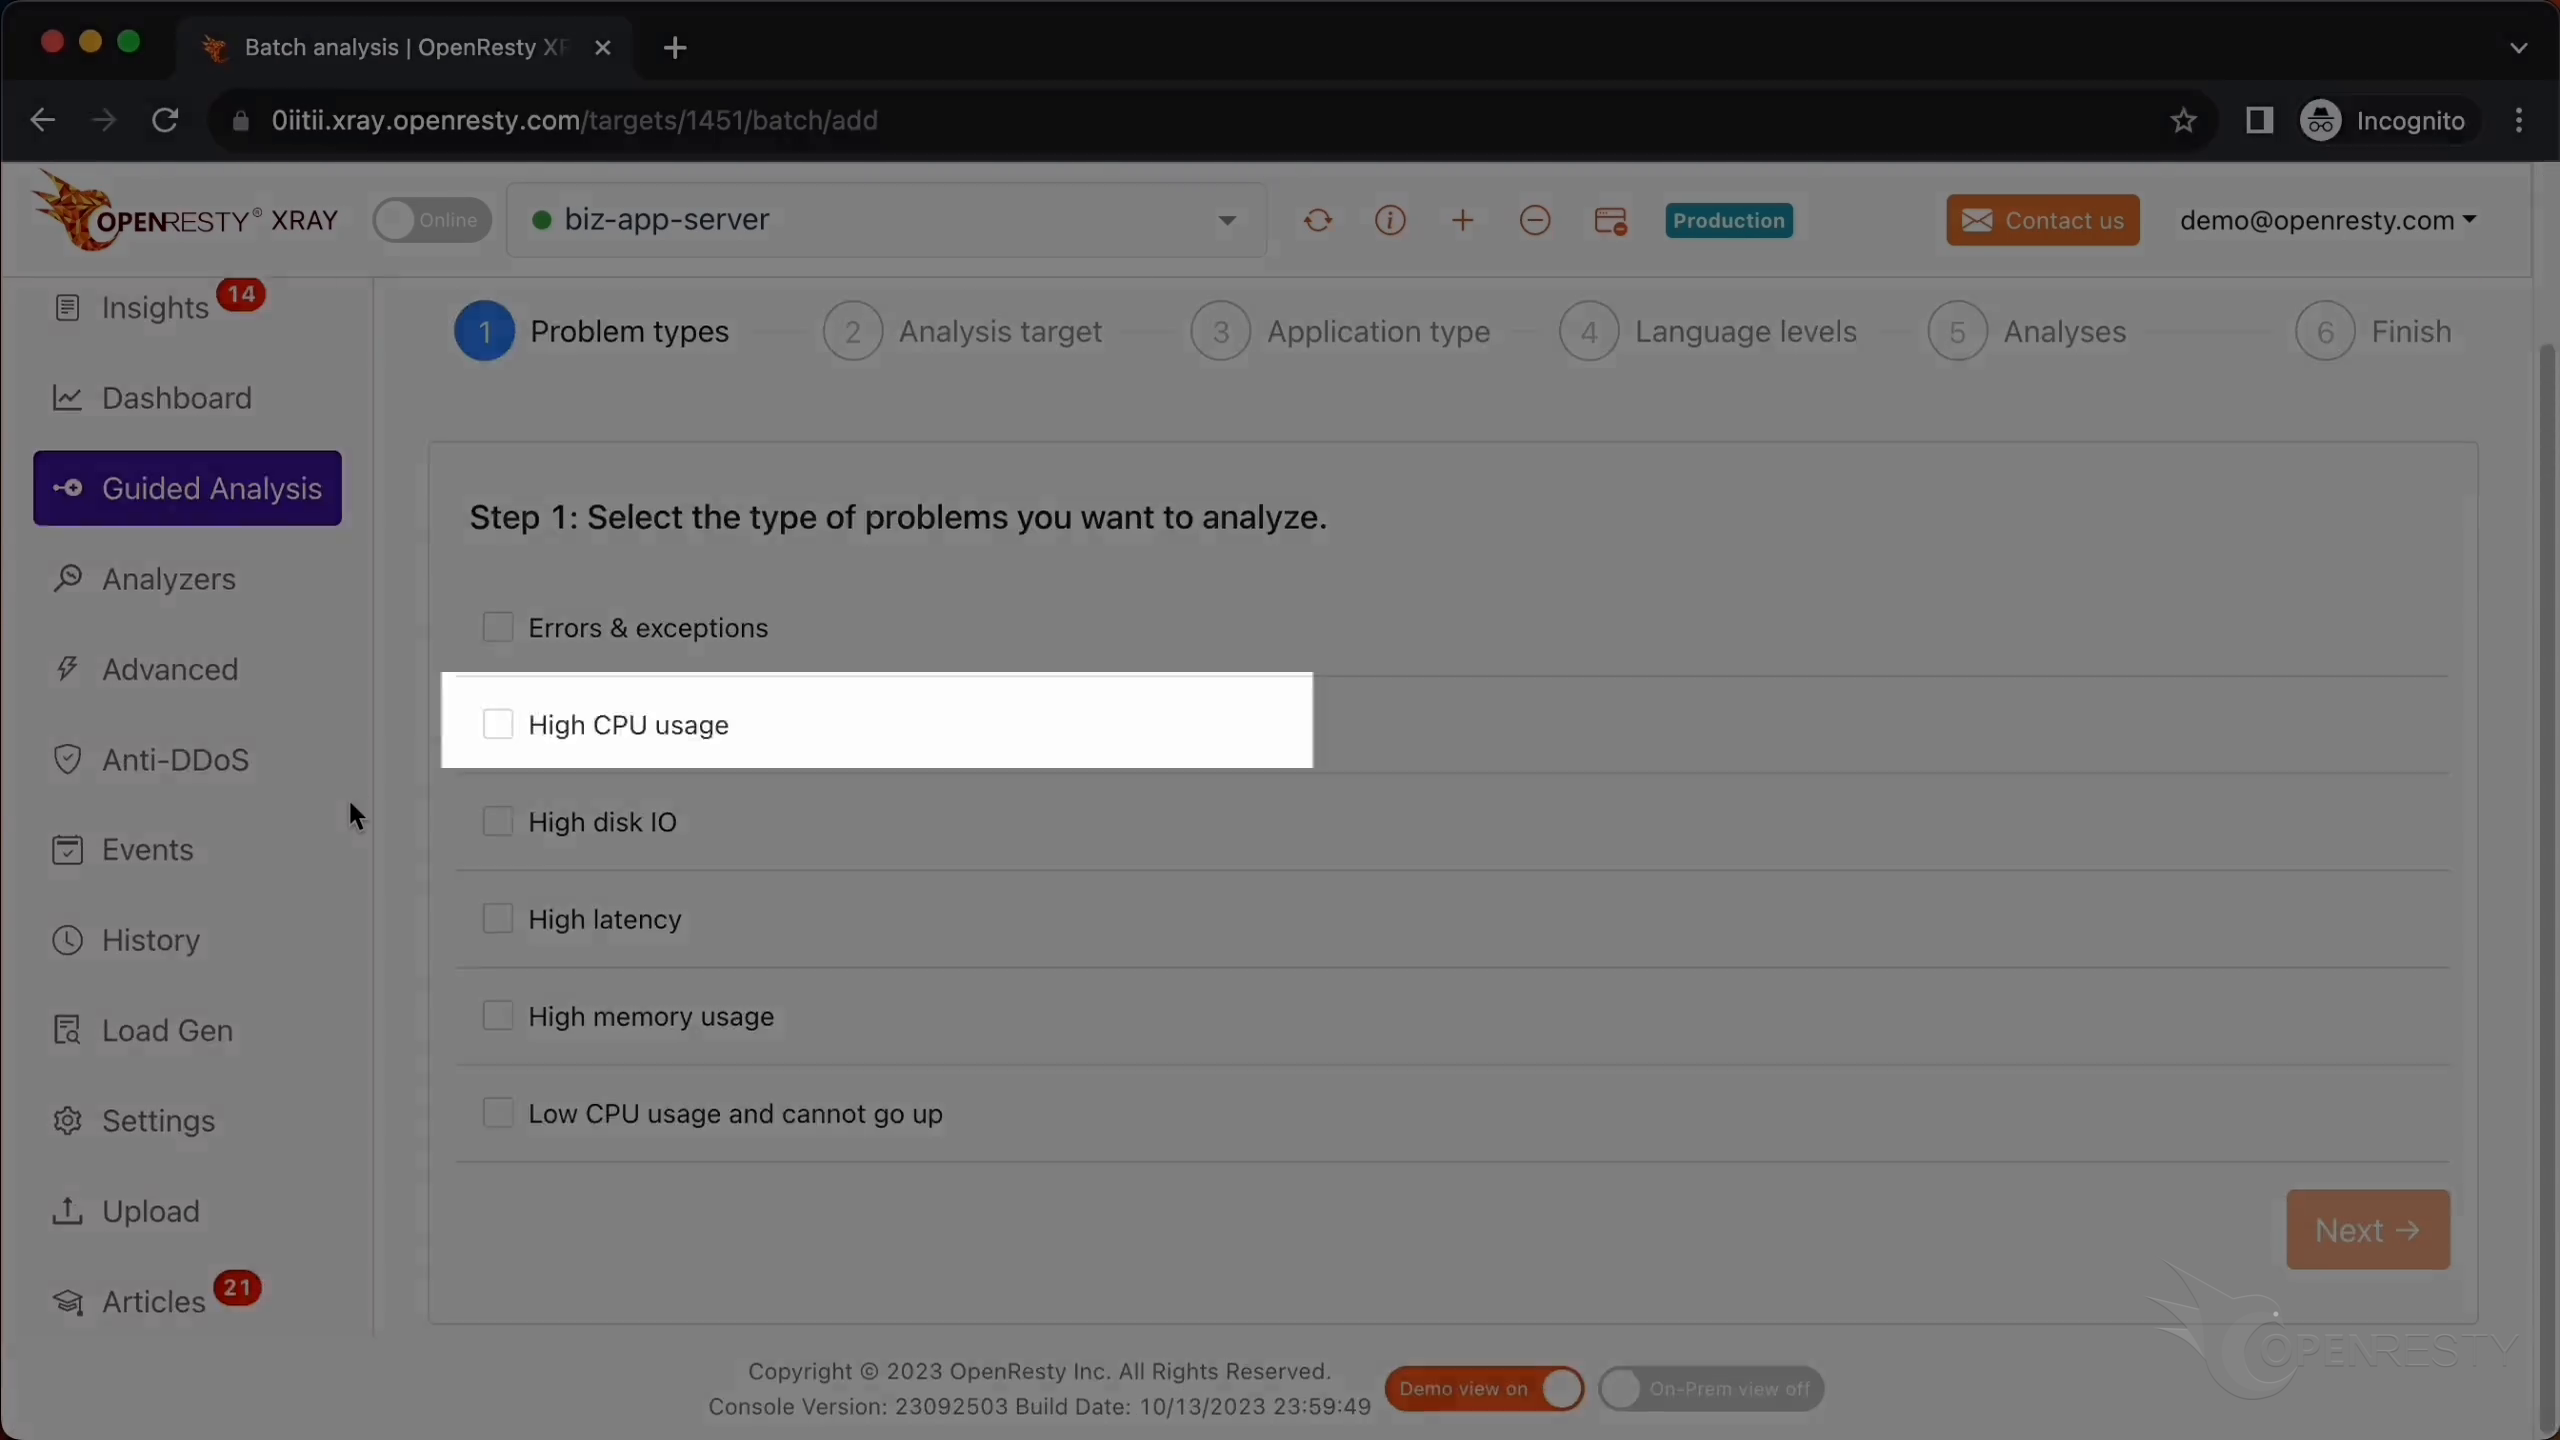
Click on “Next”.
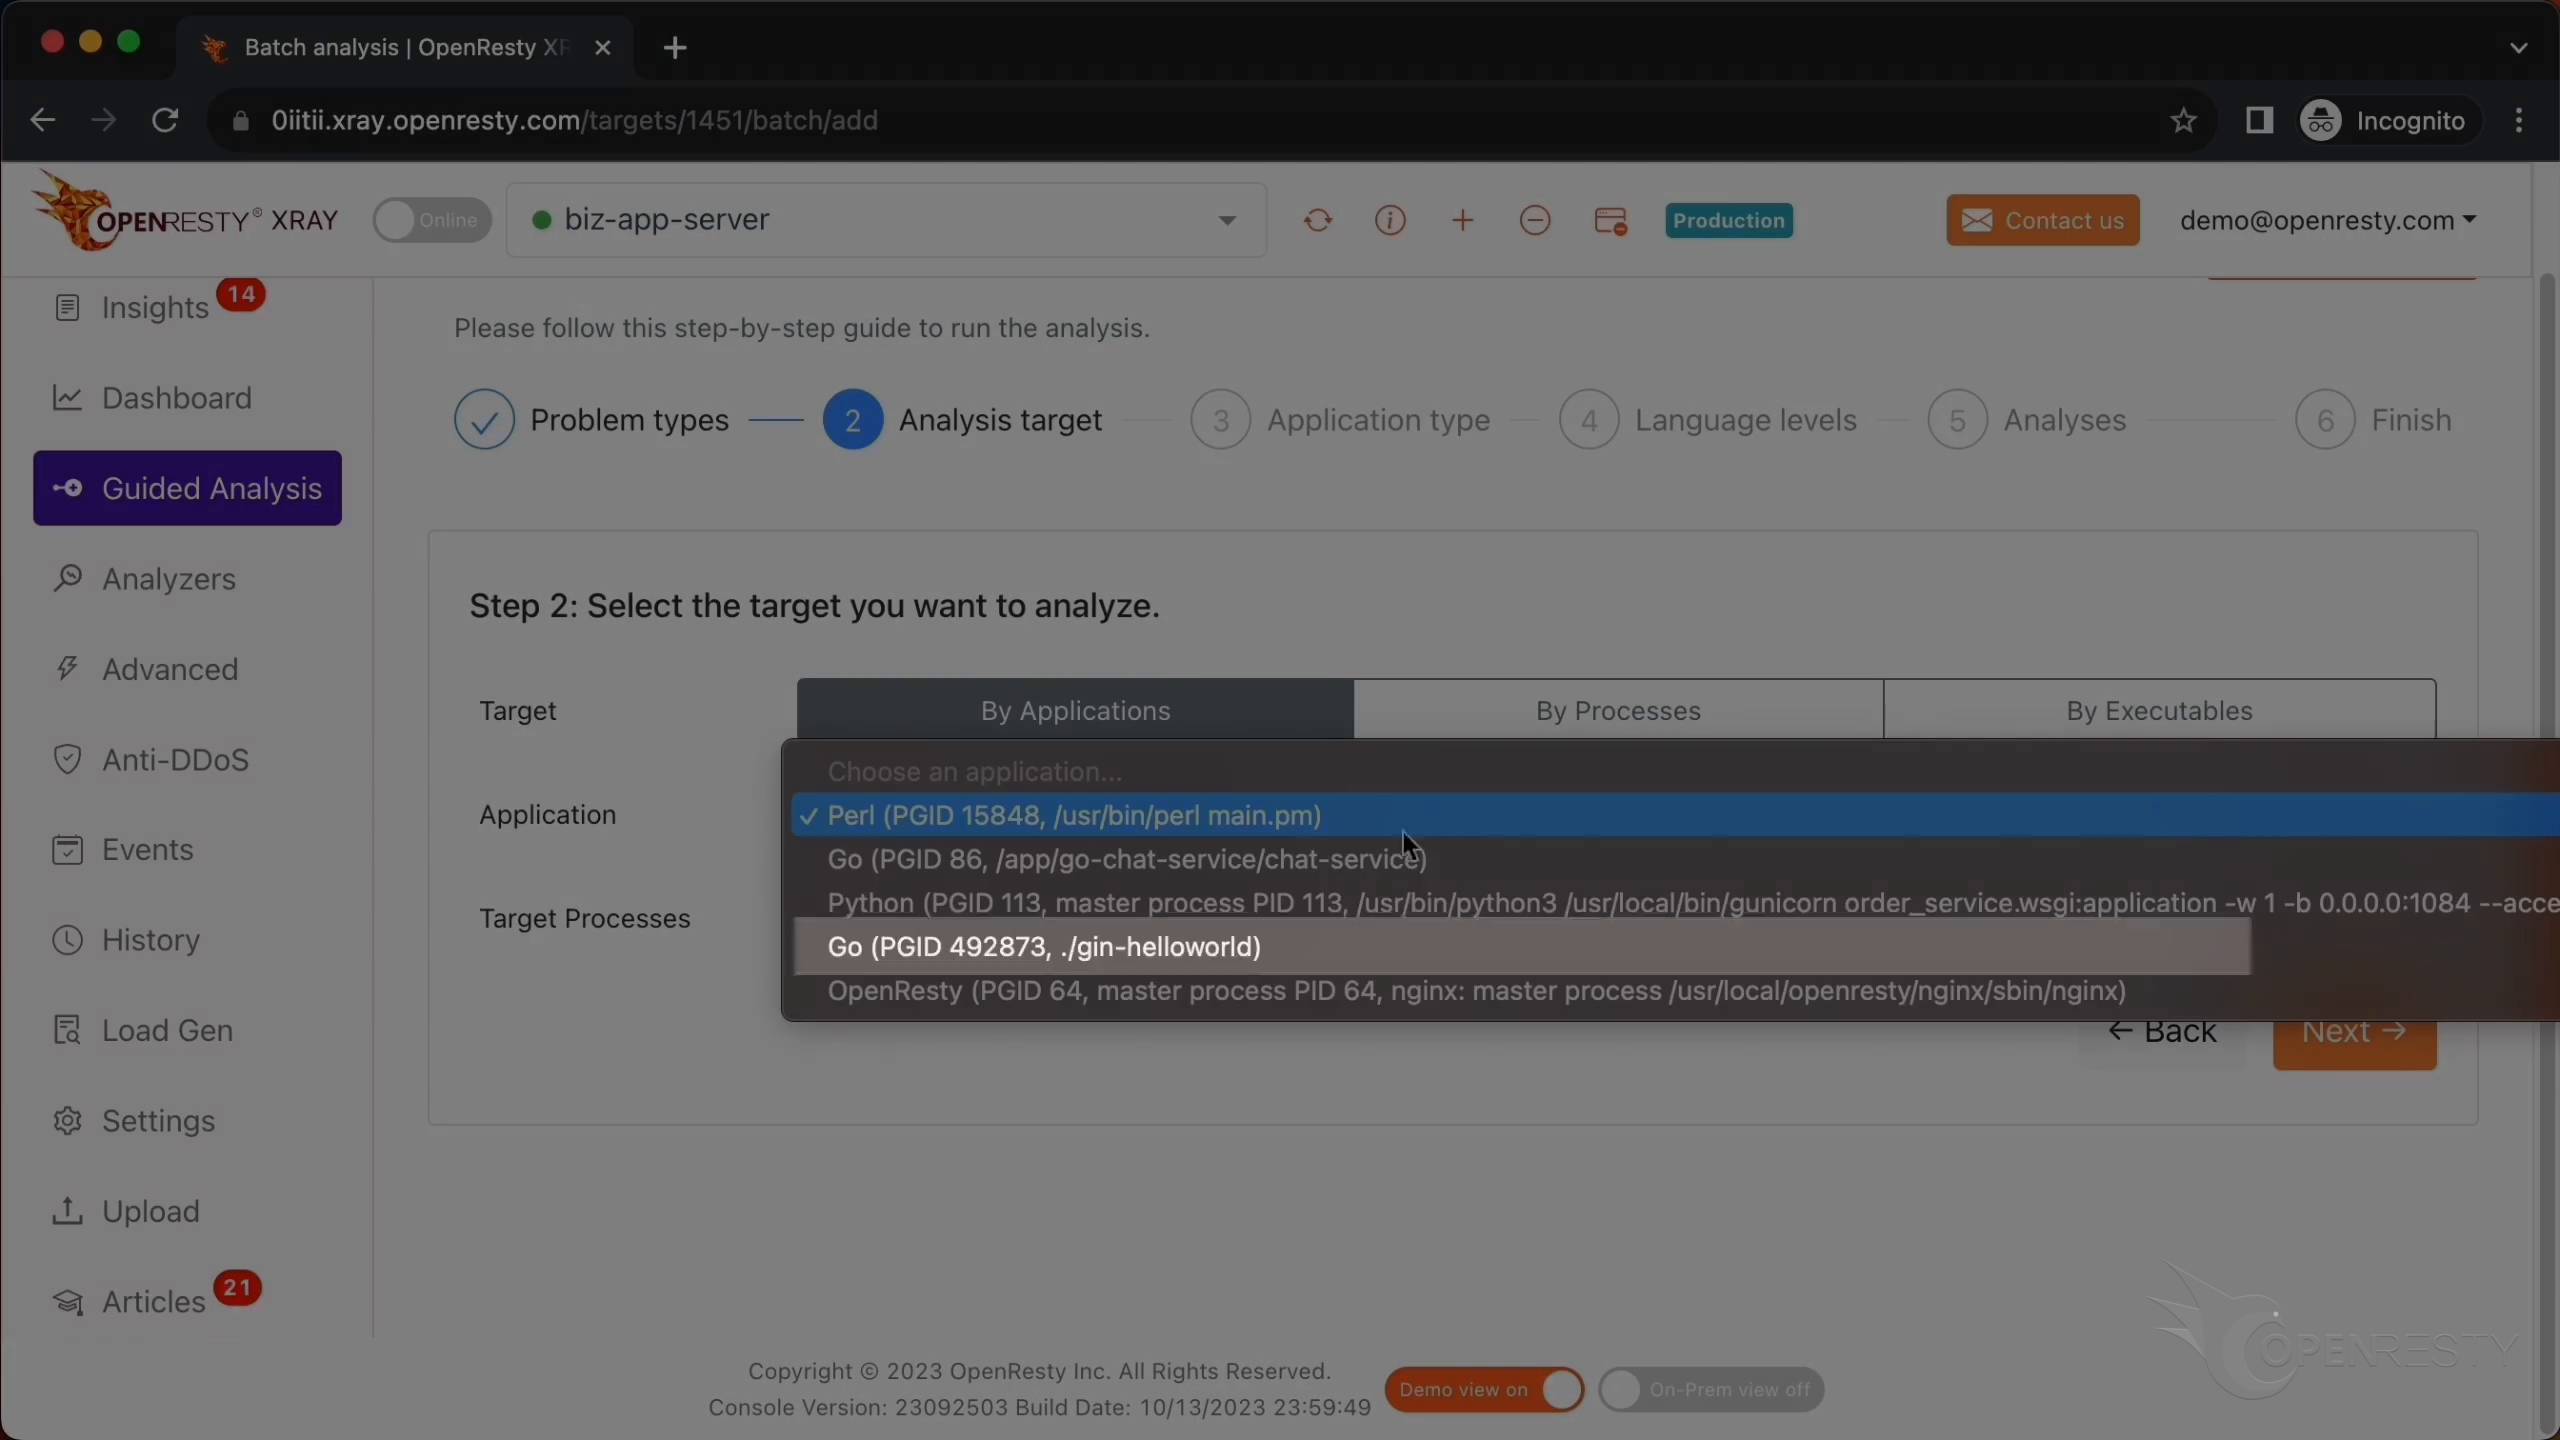
Select the Go application.
Let’s start analyzing.
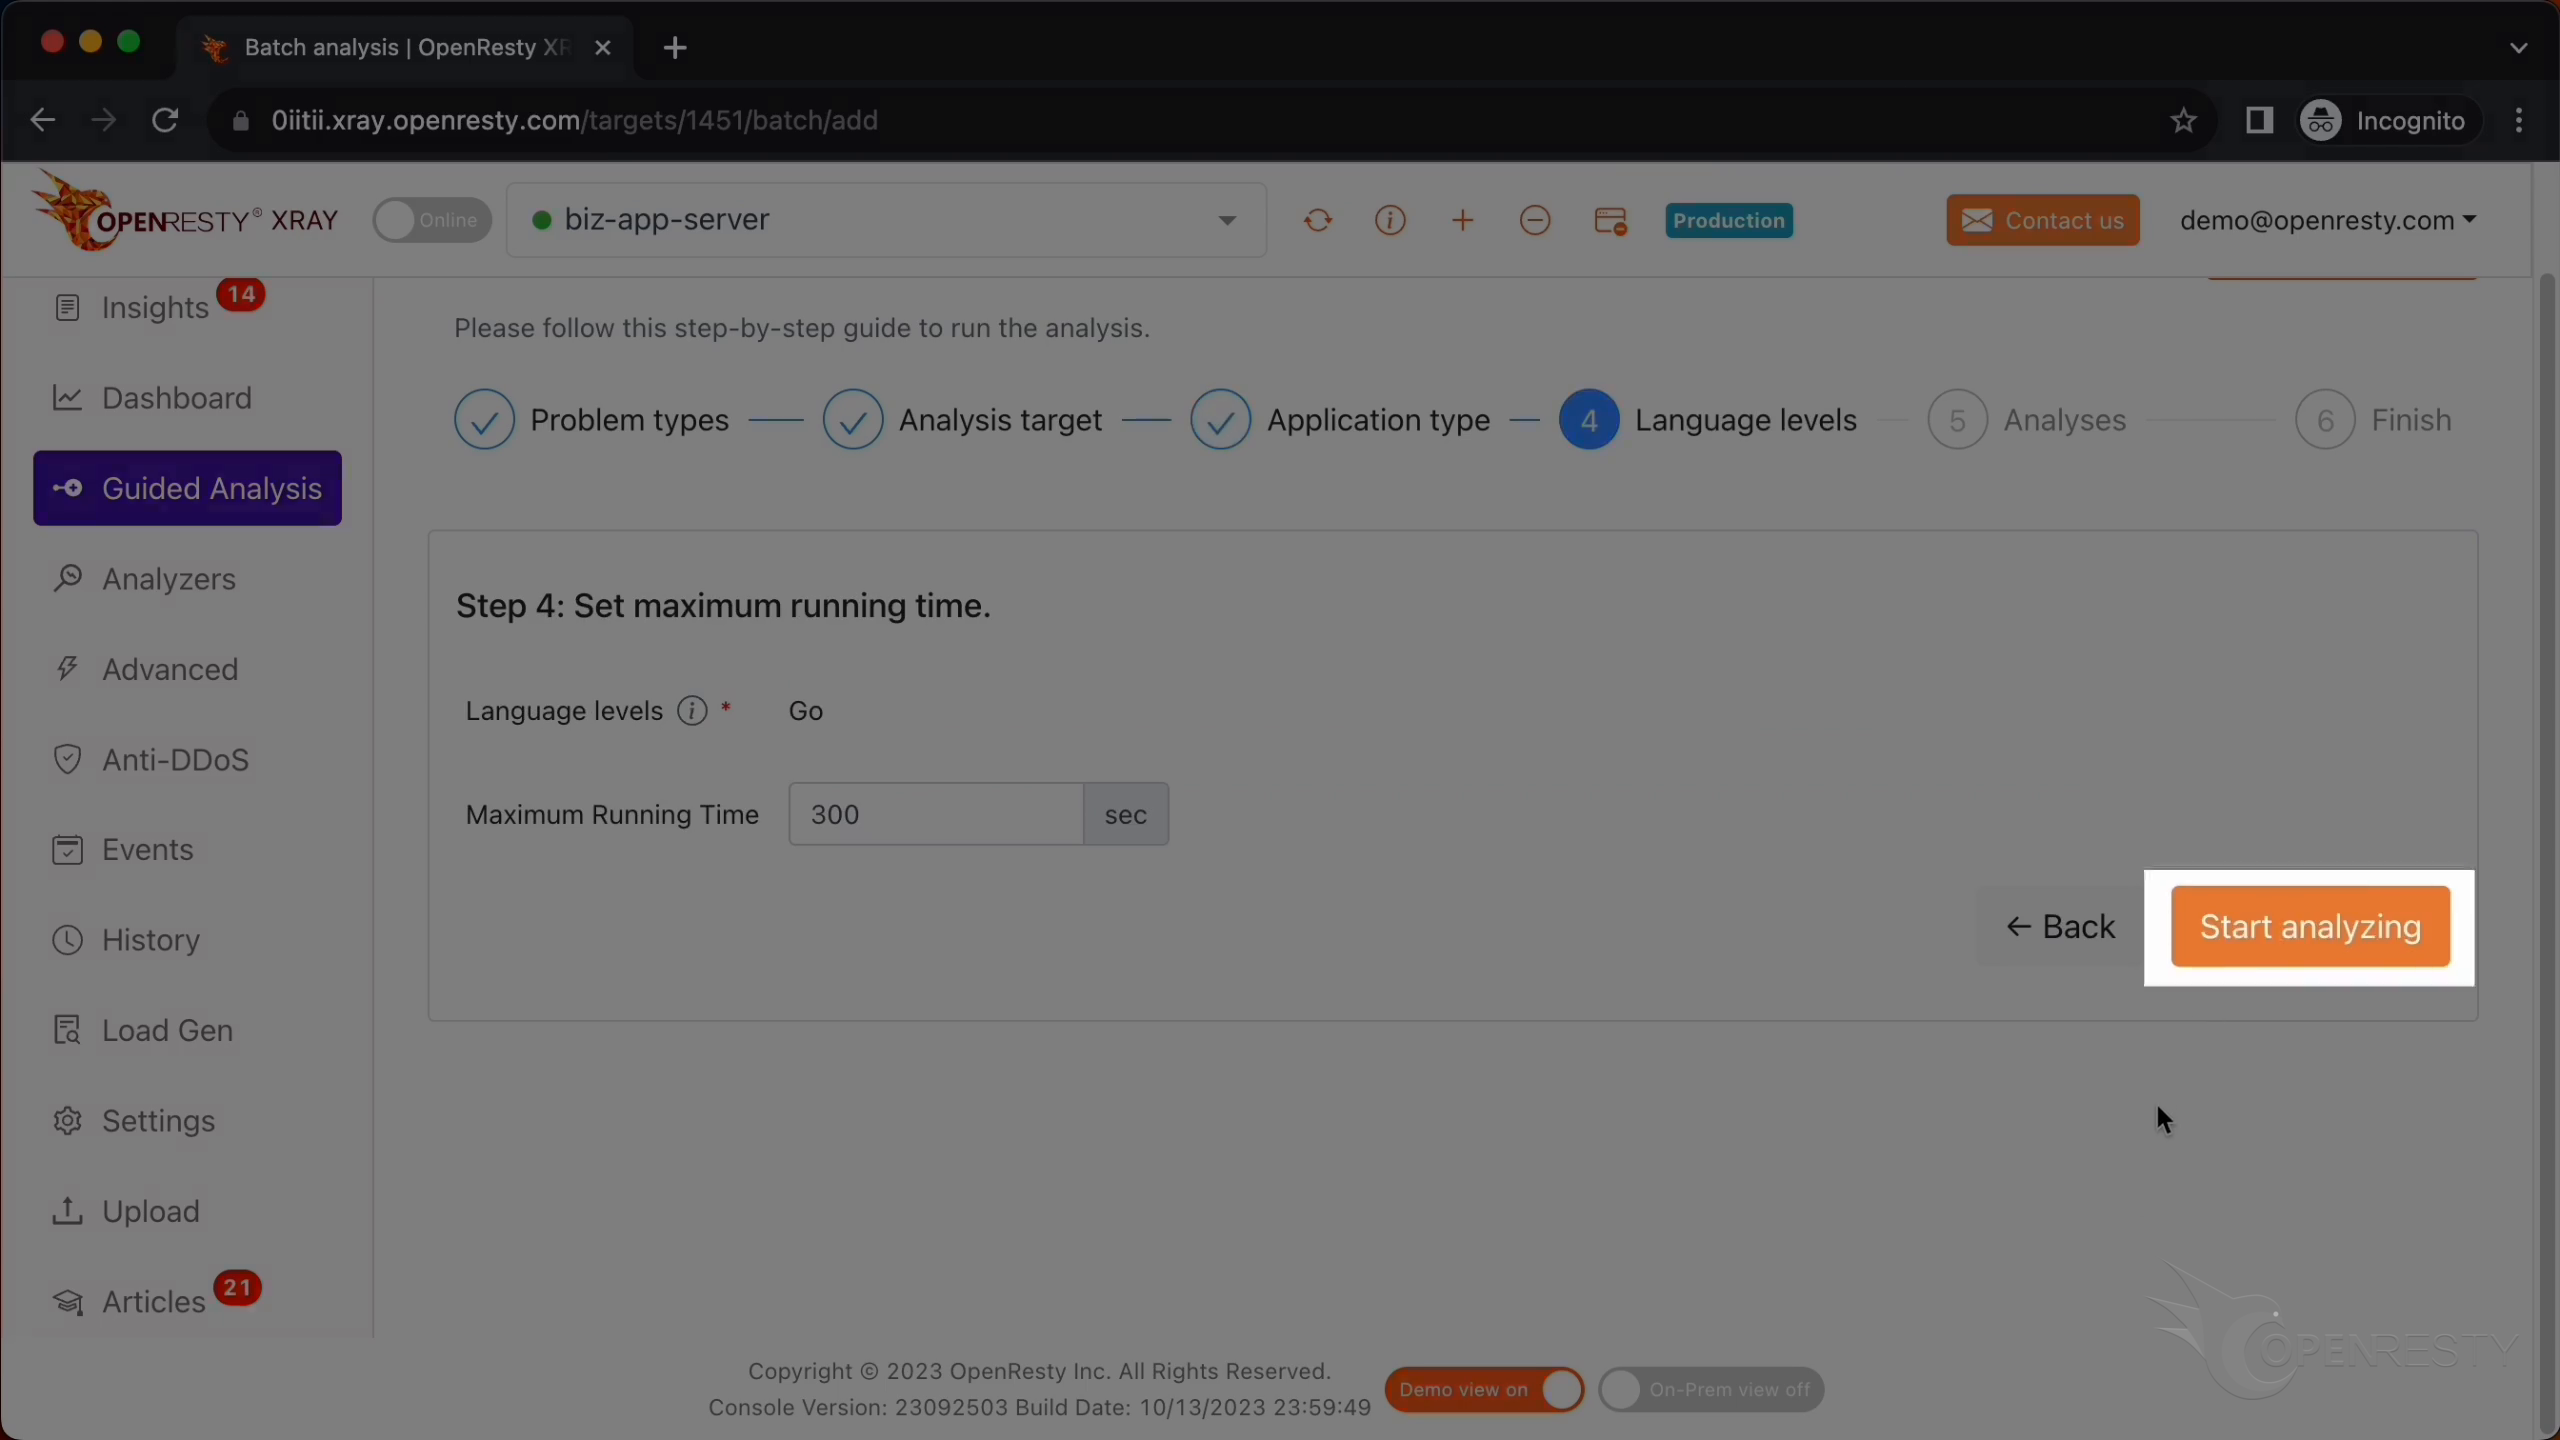
The system will keep performing different rounds of analysis.
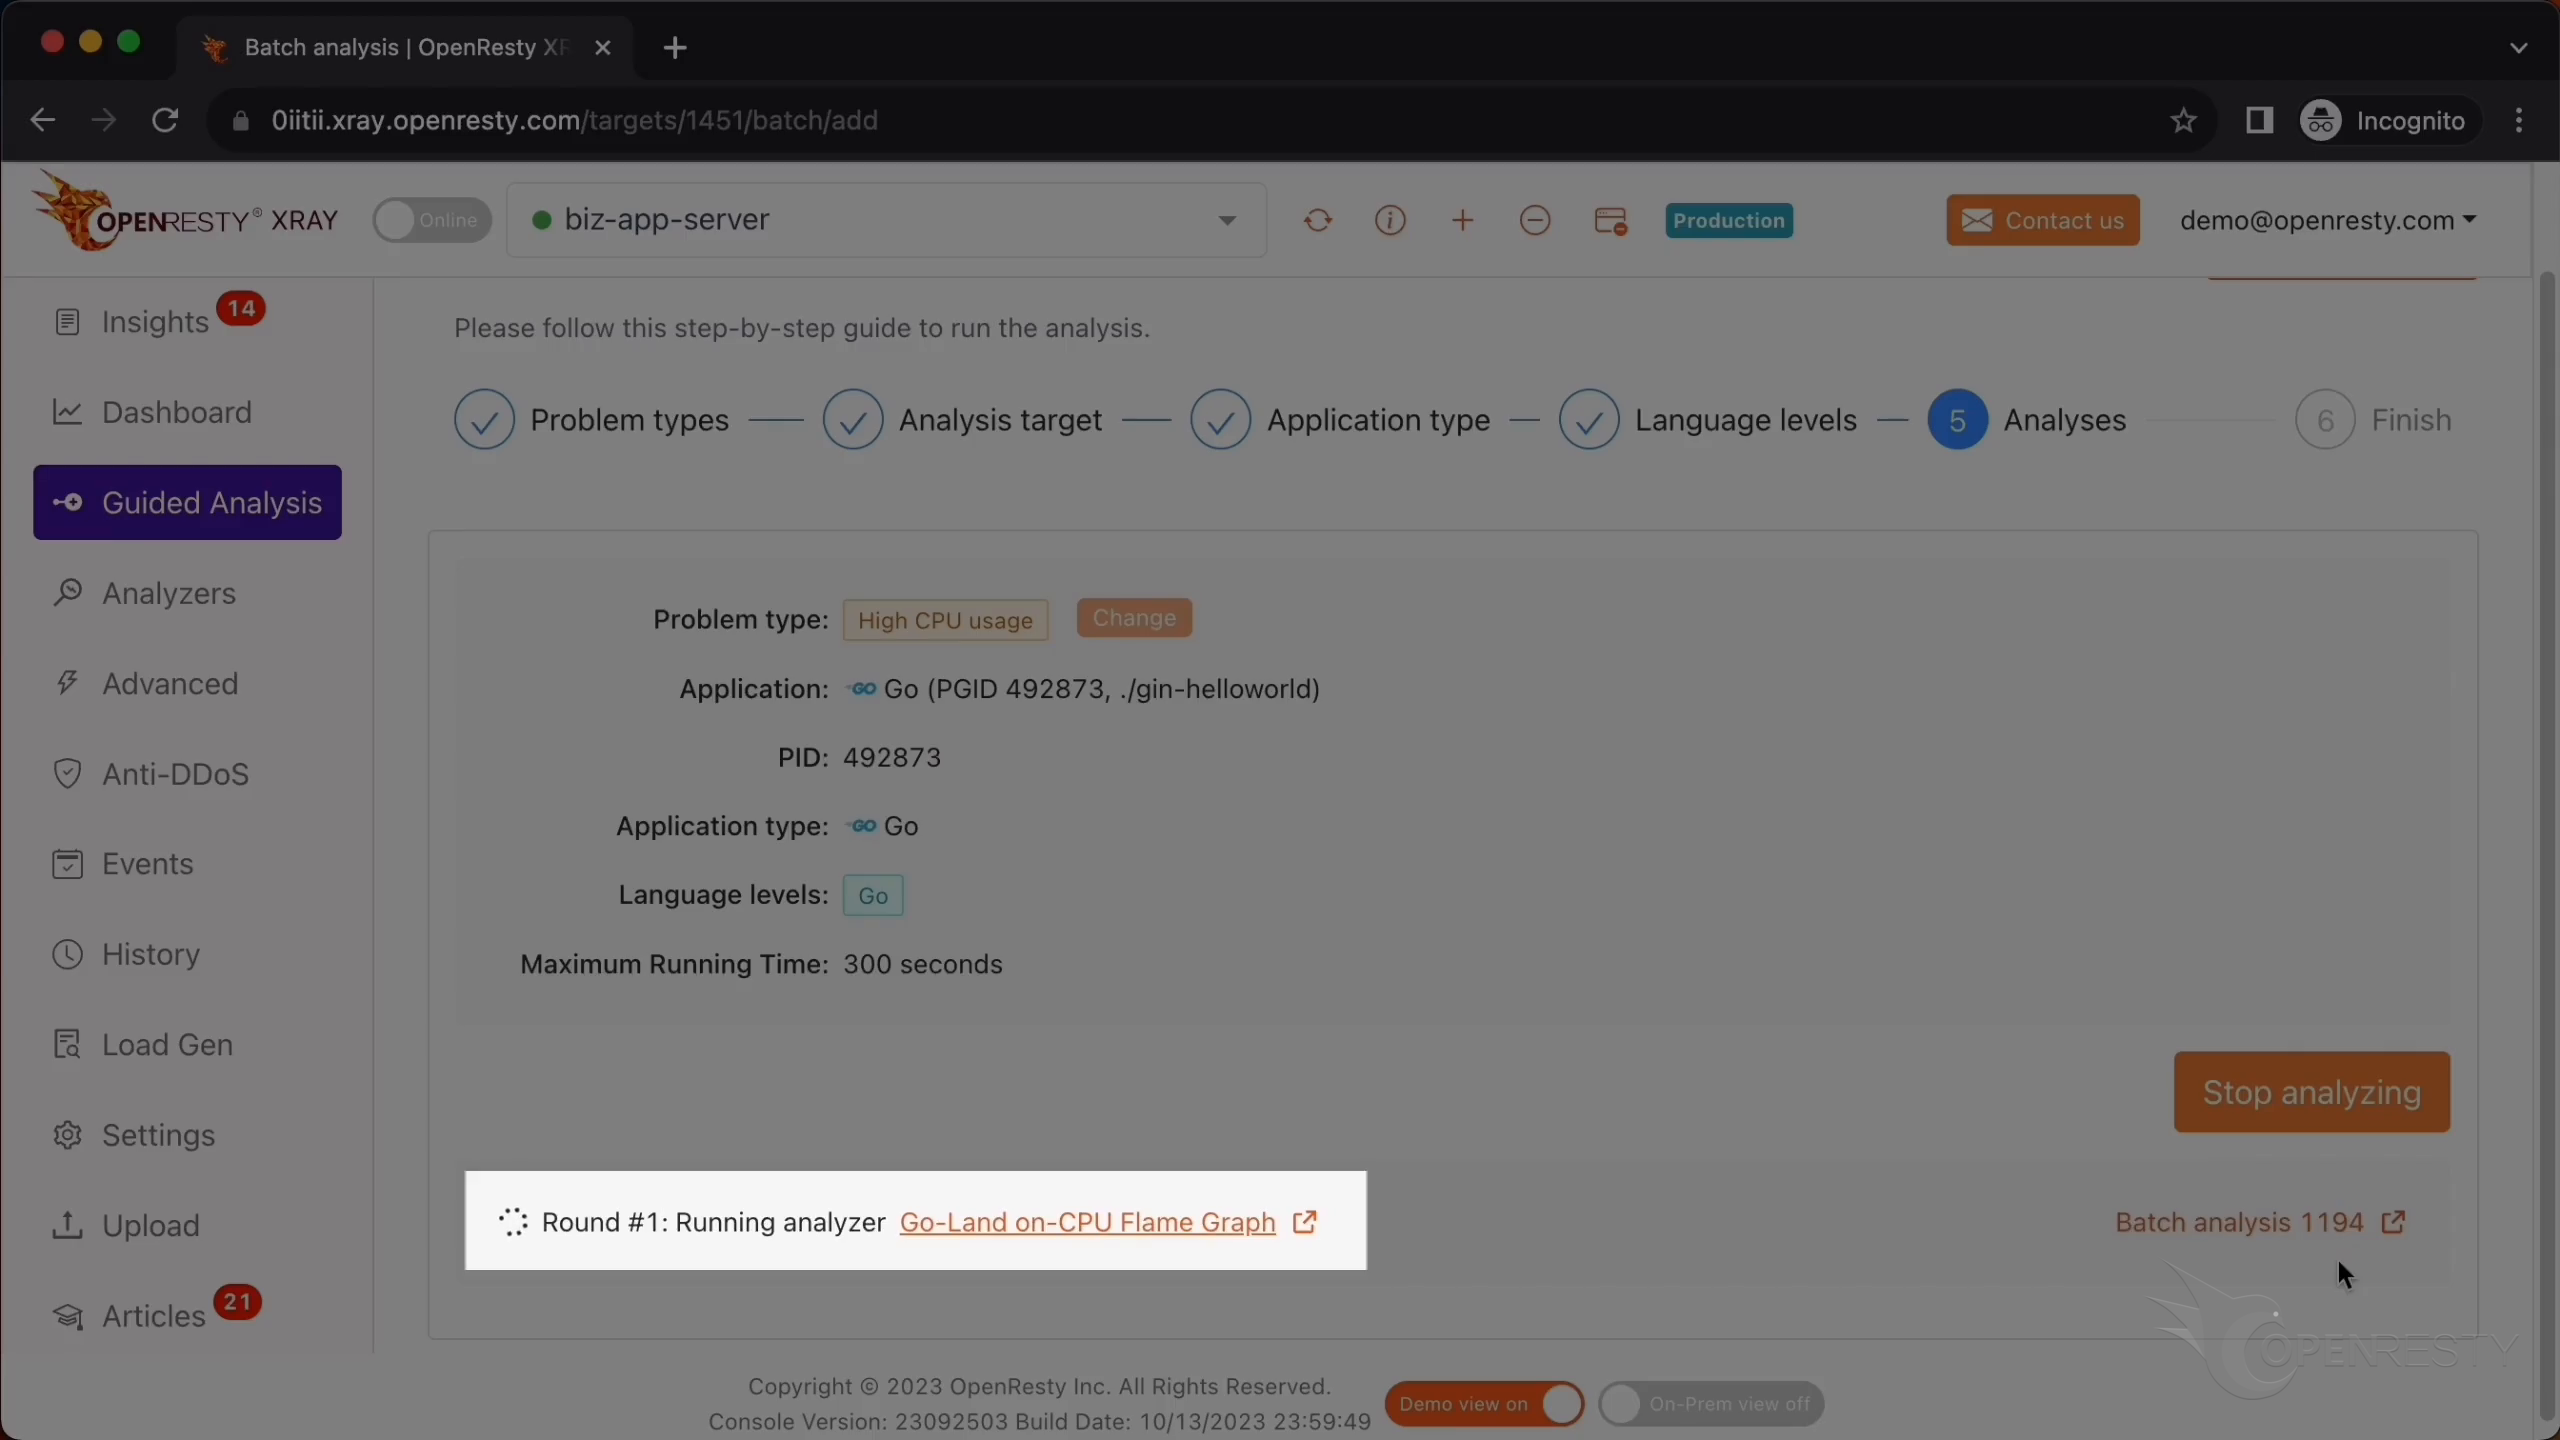
It will keep sampling for 300 seconds, or 5 minutes.
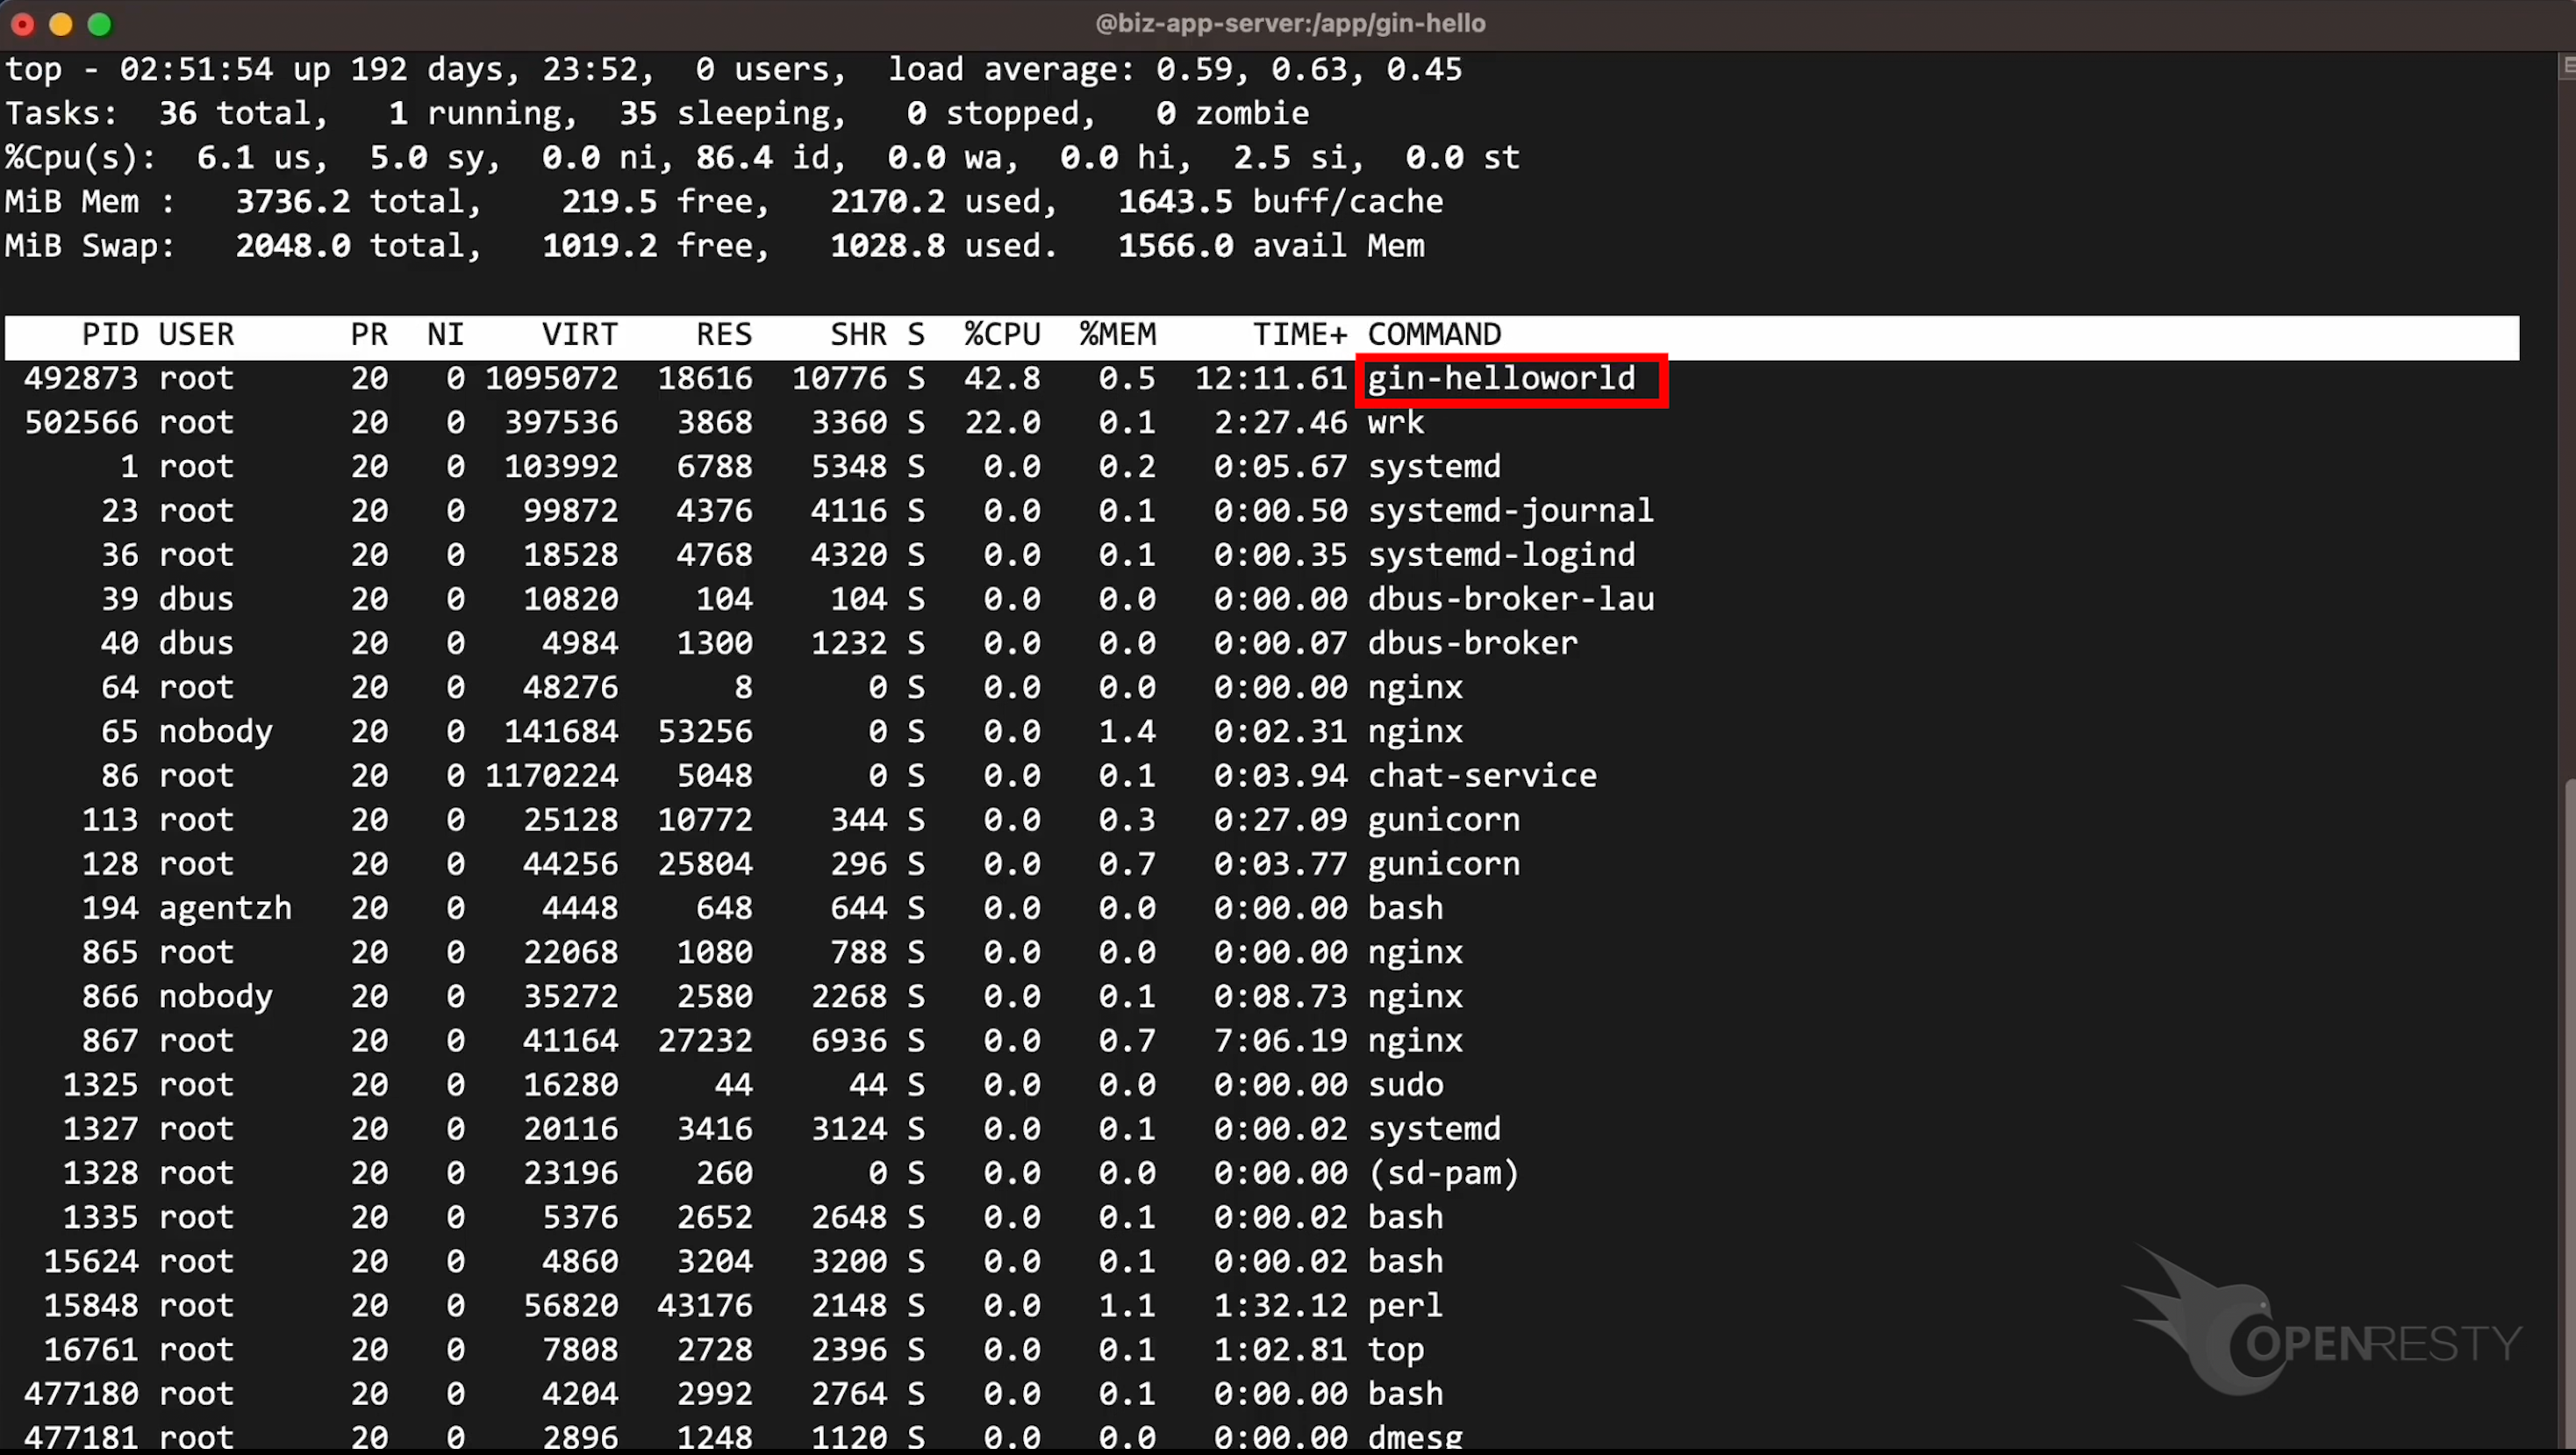
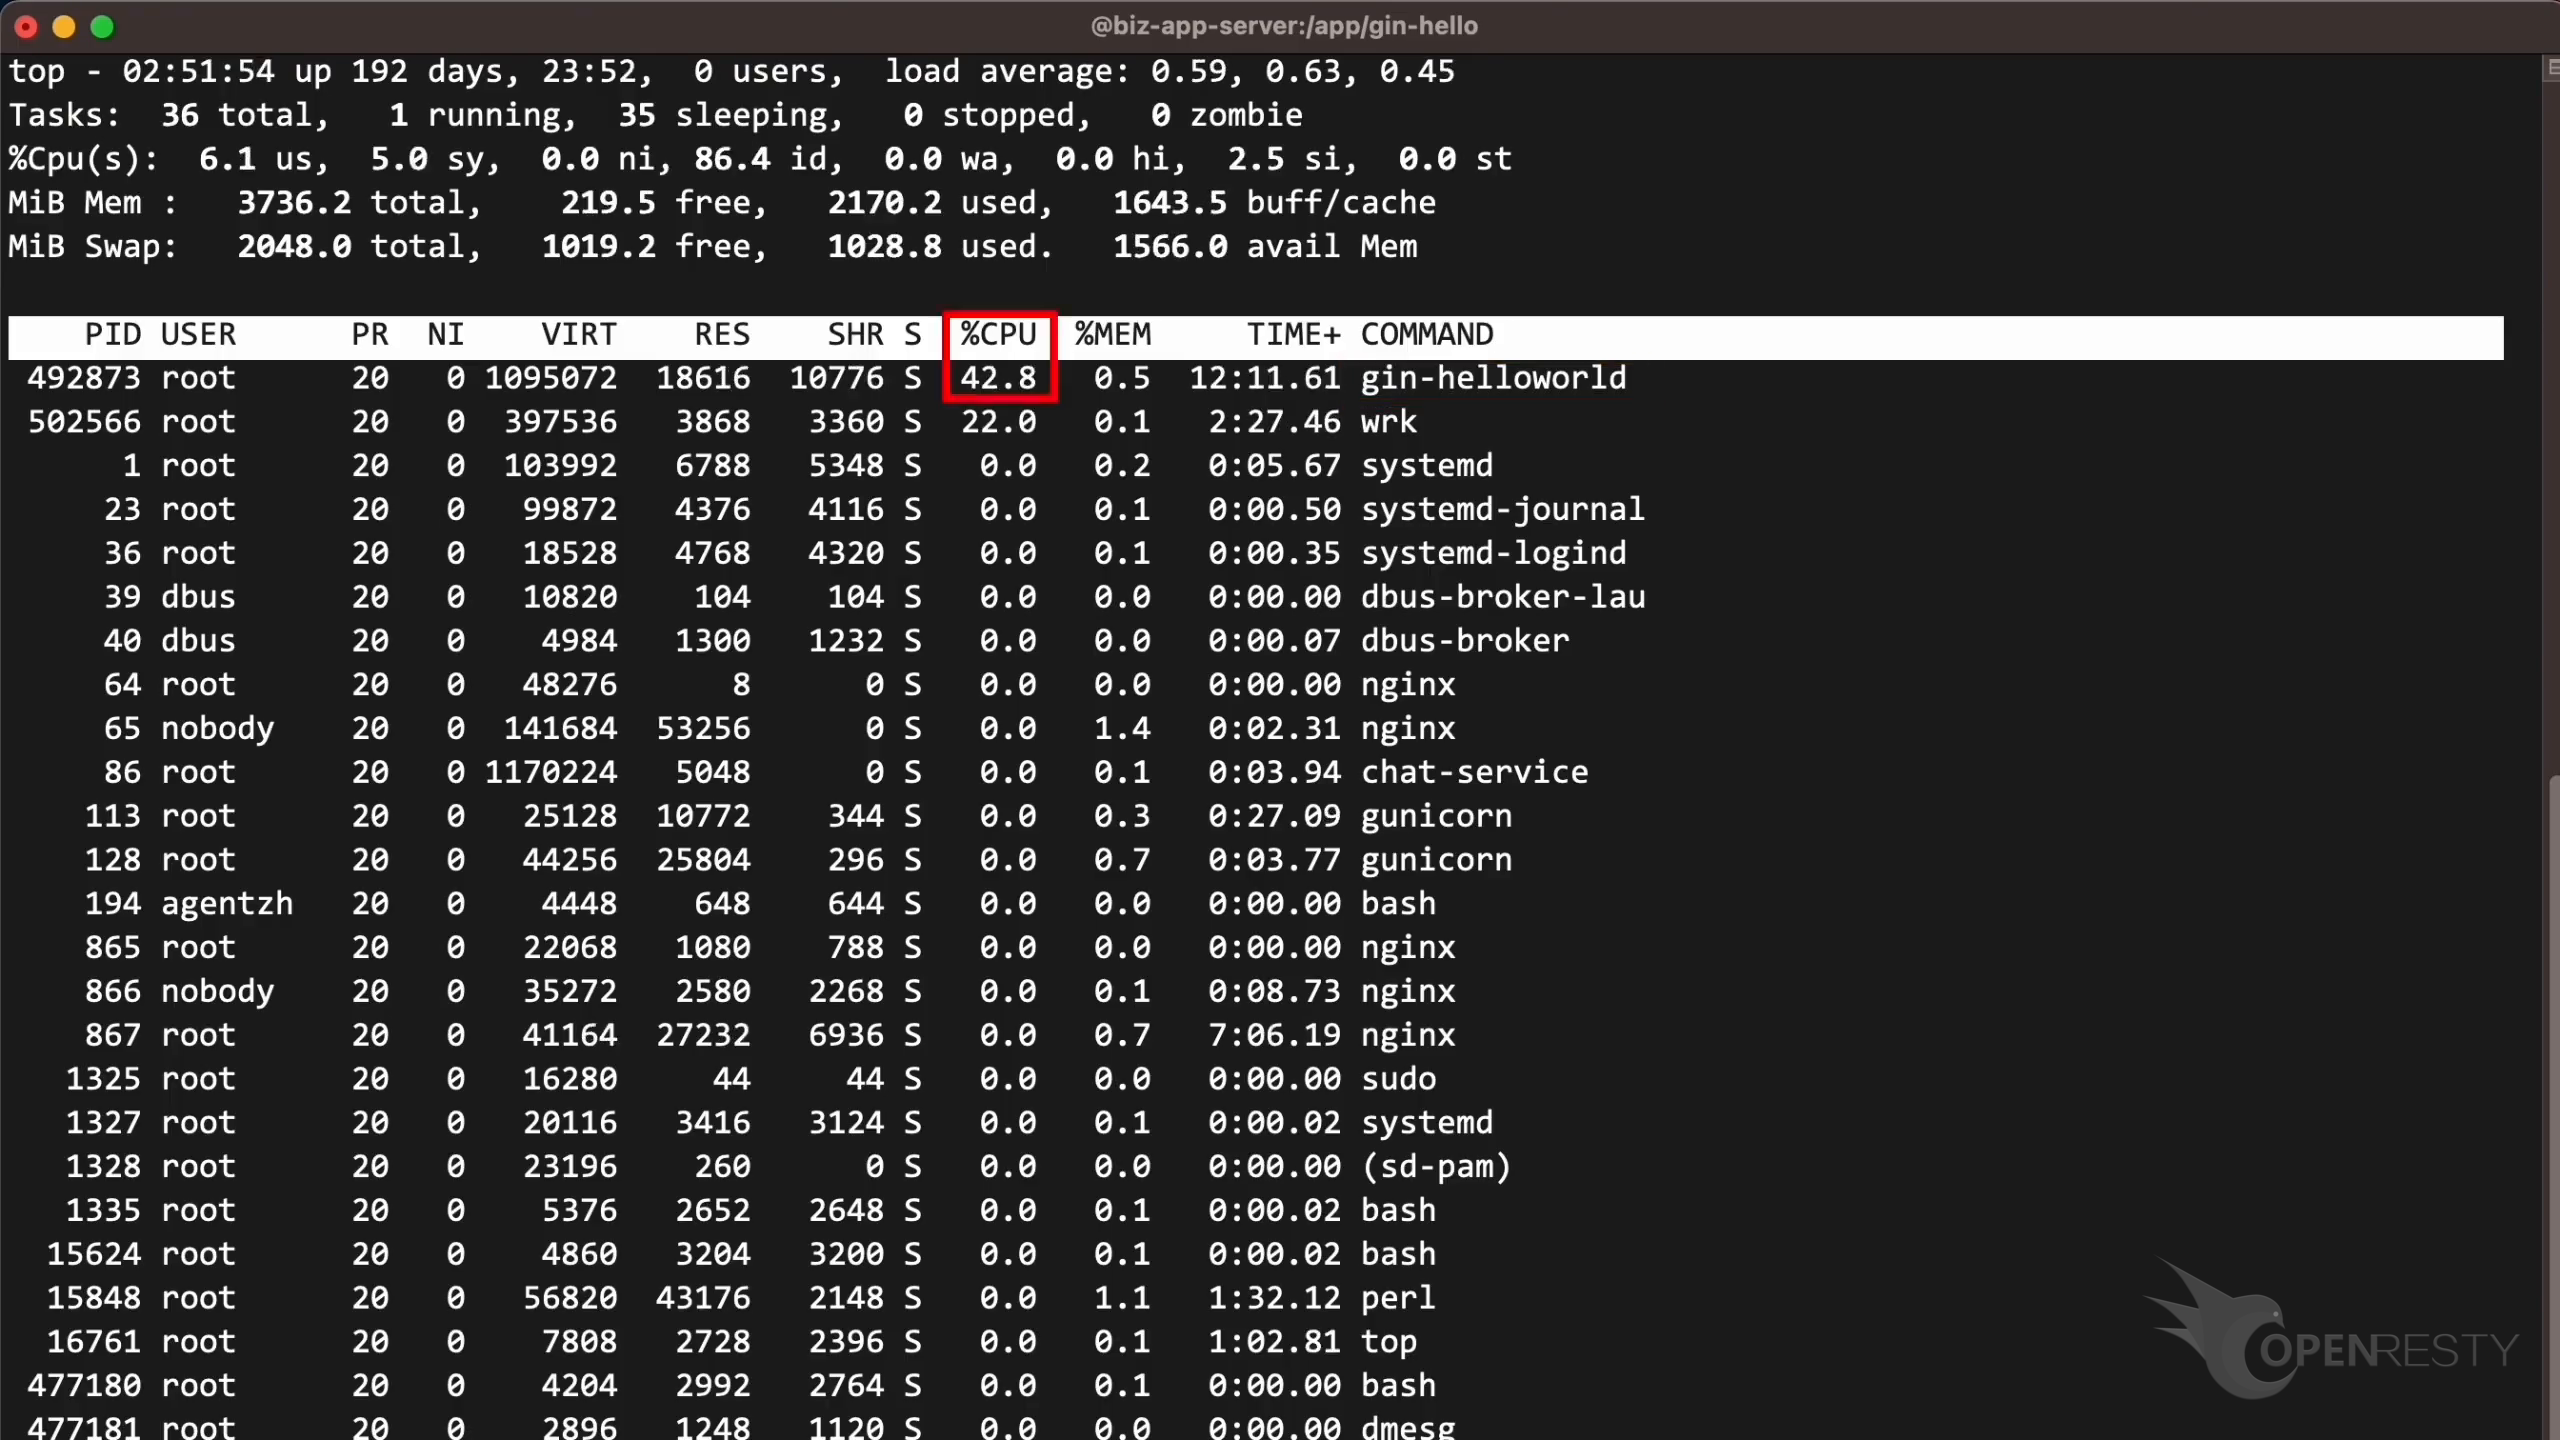
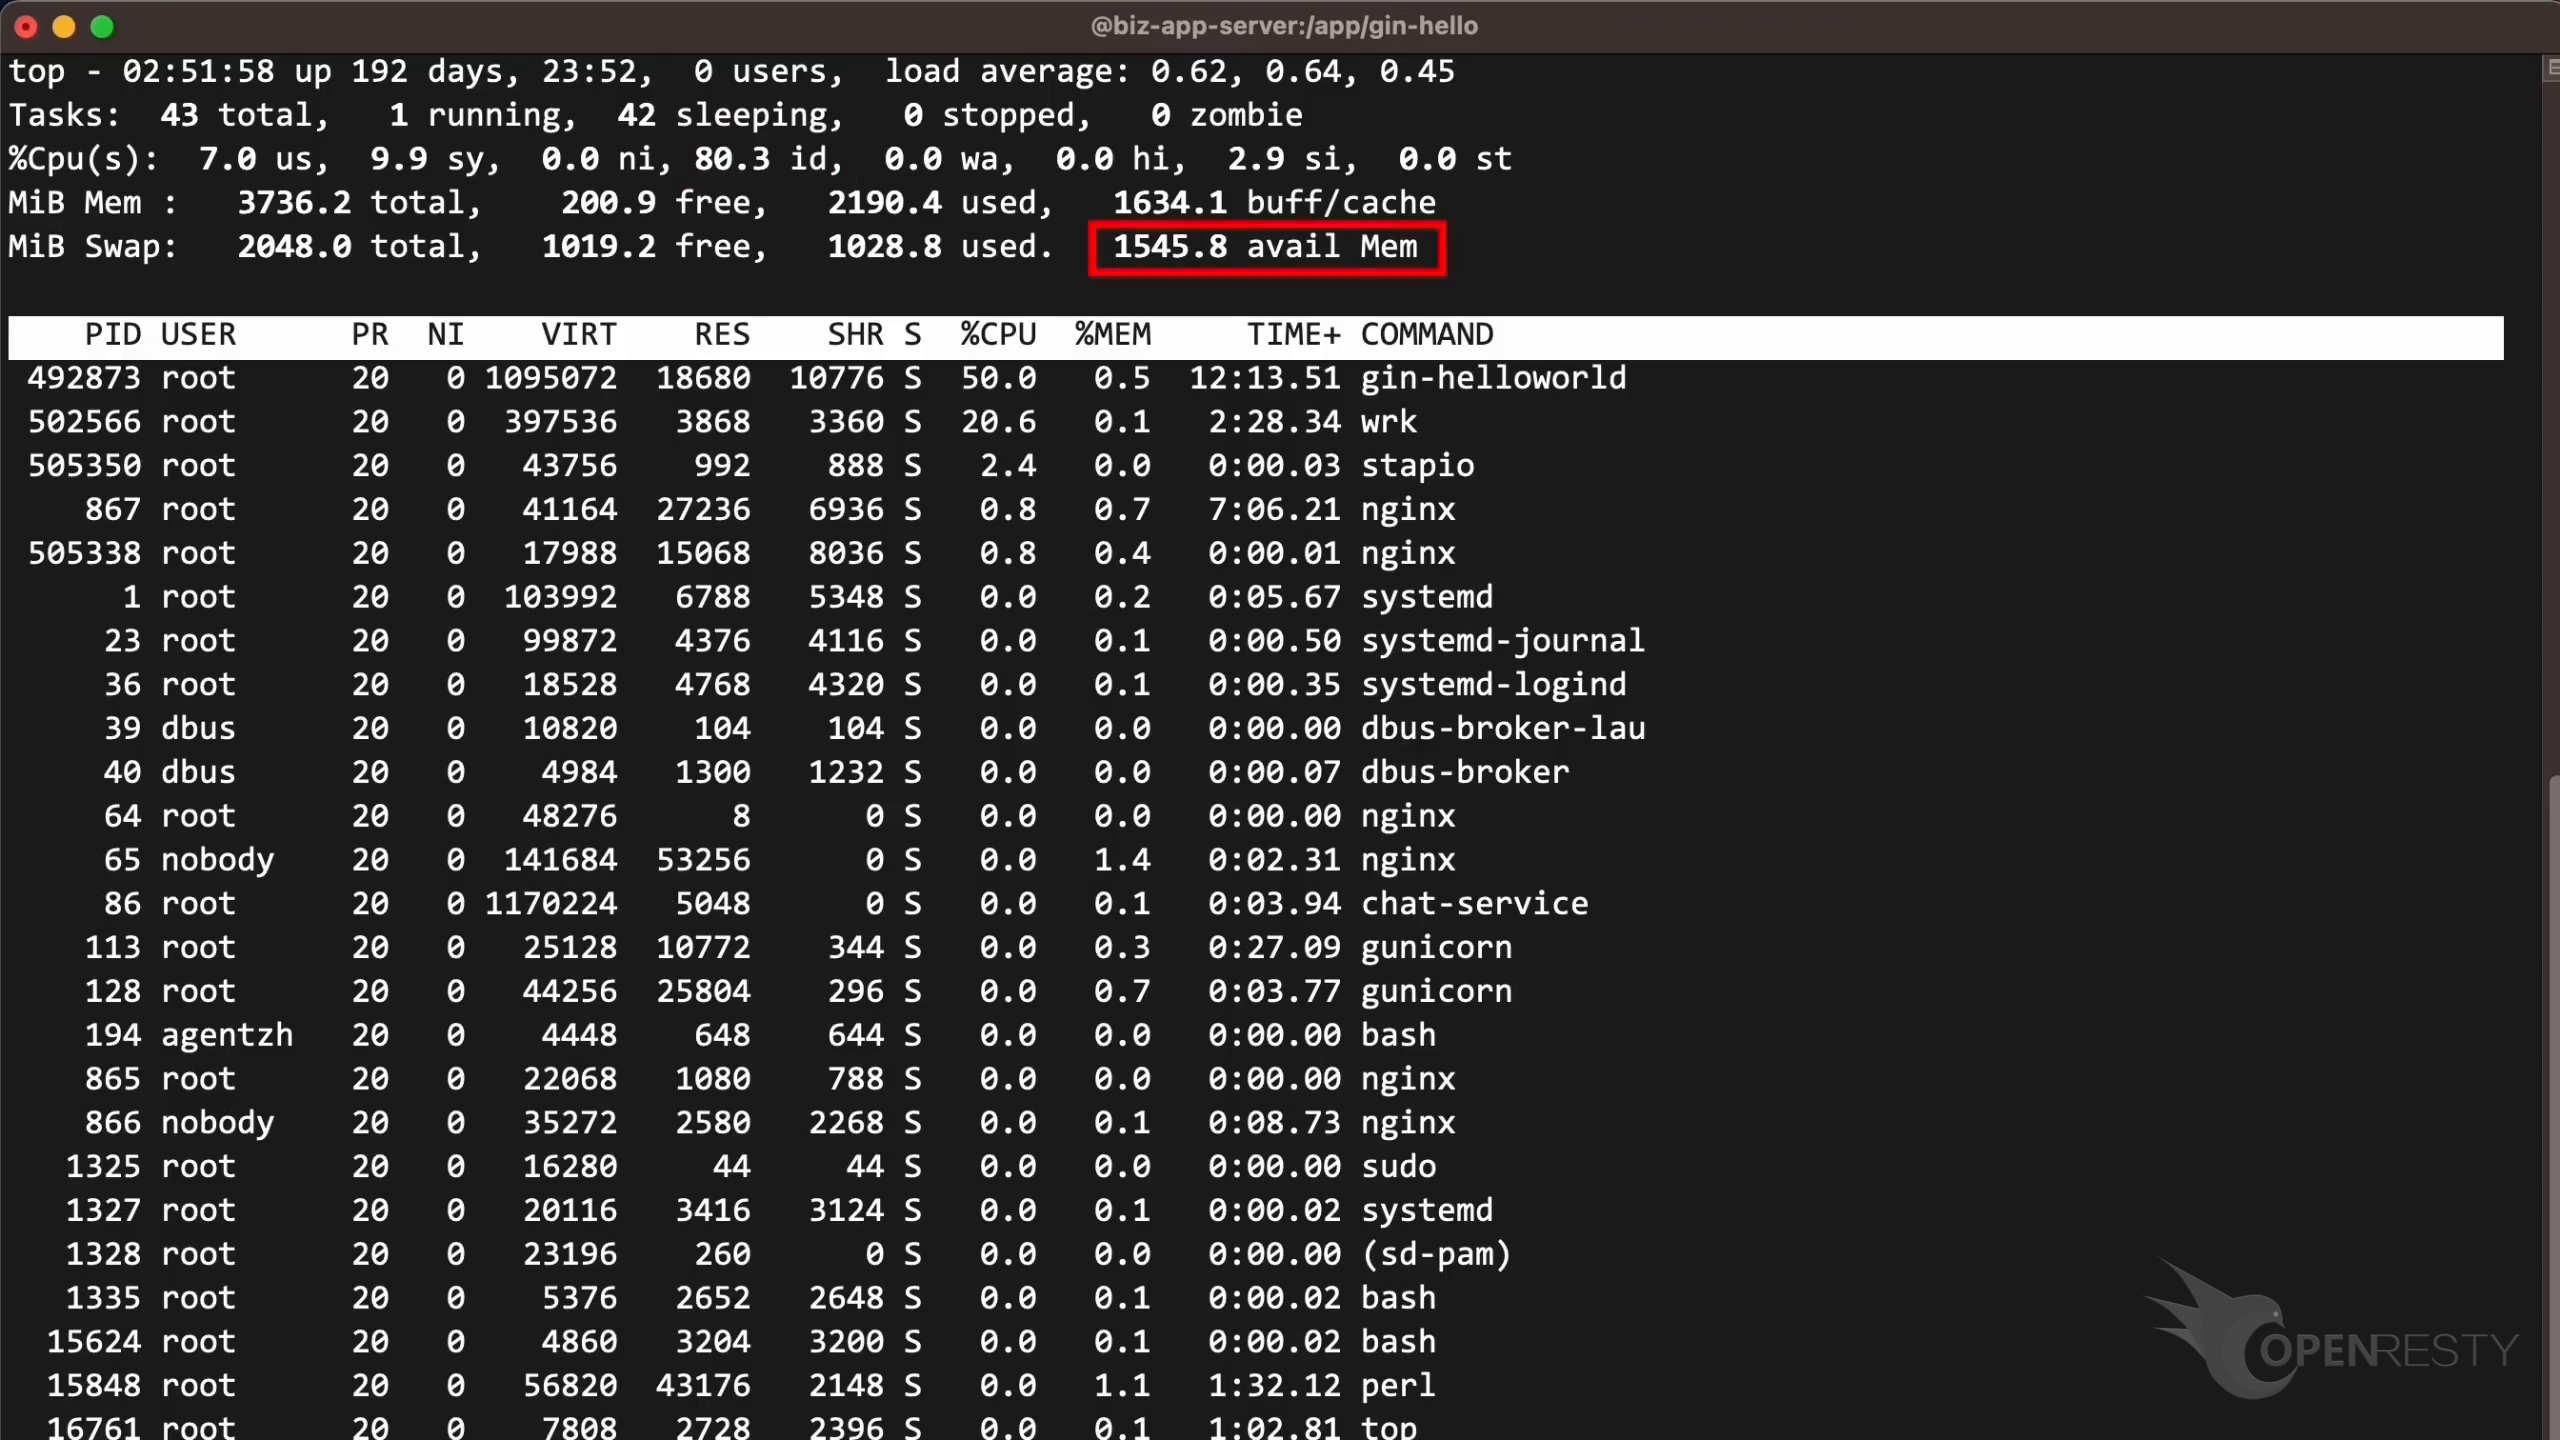
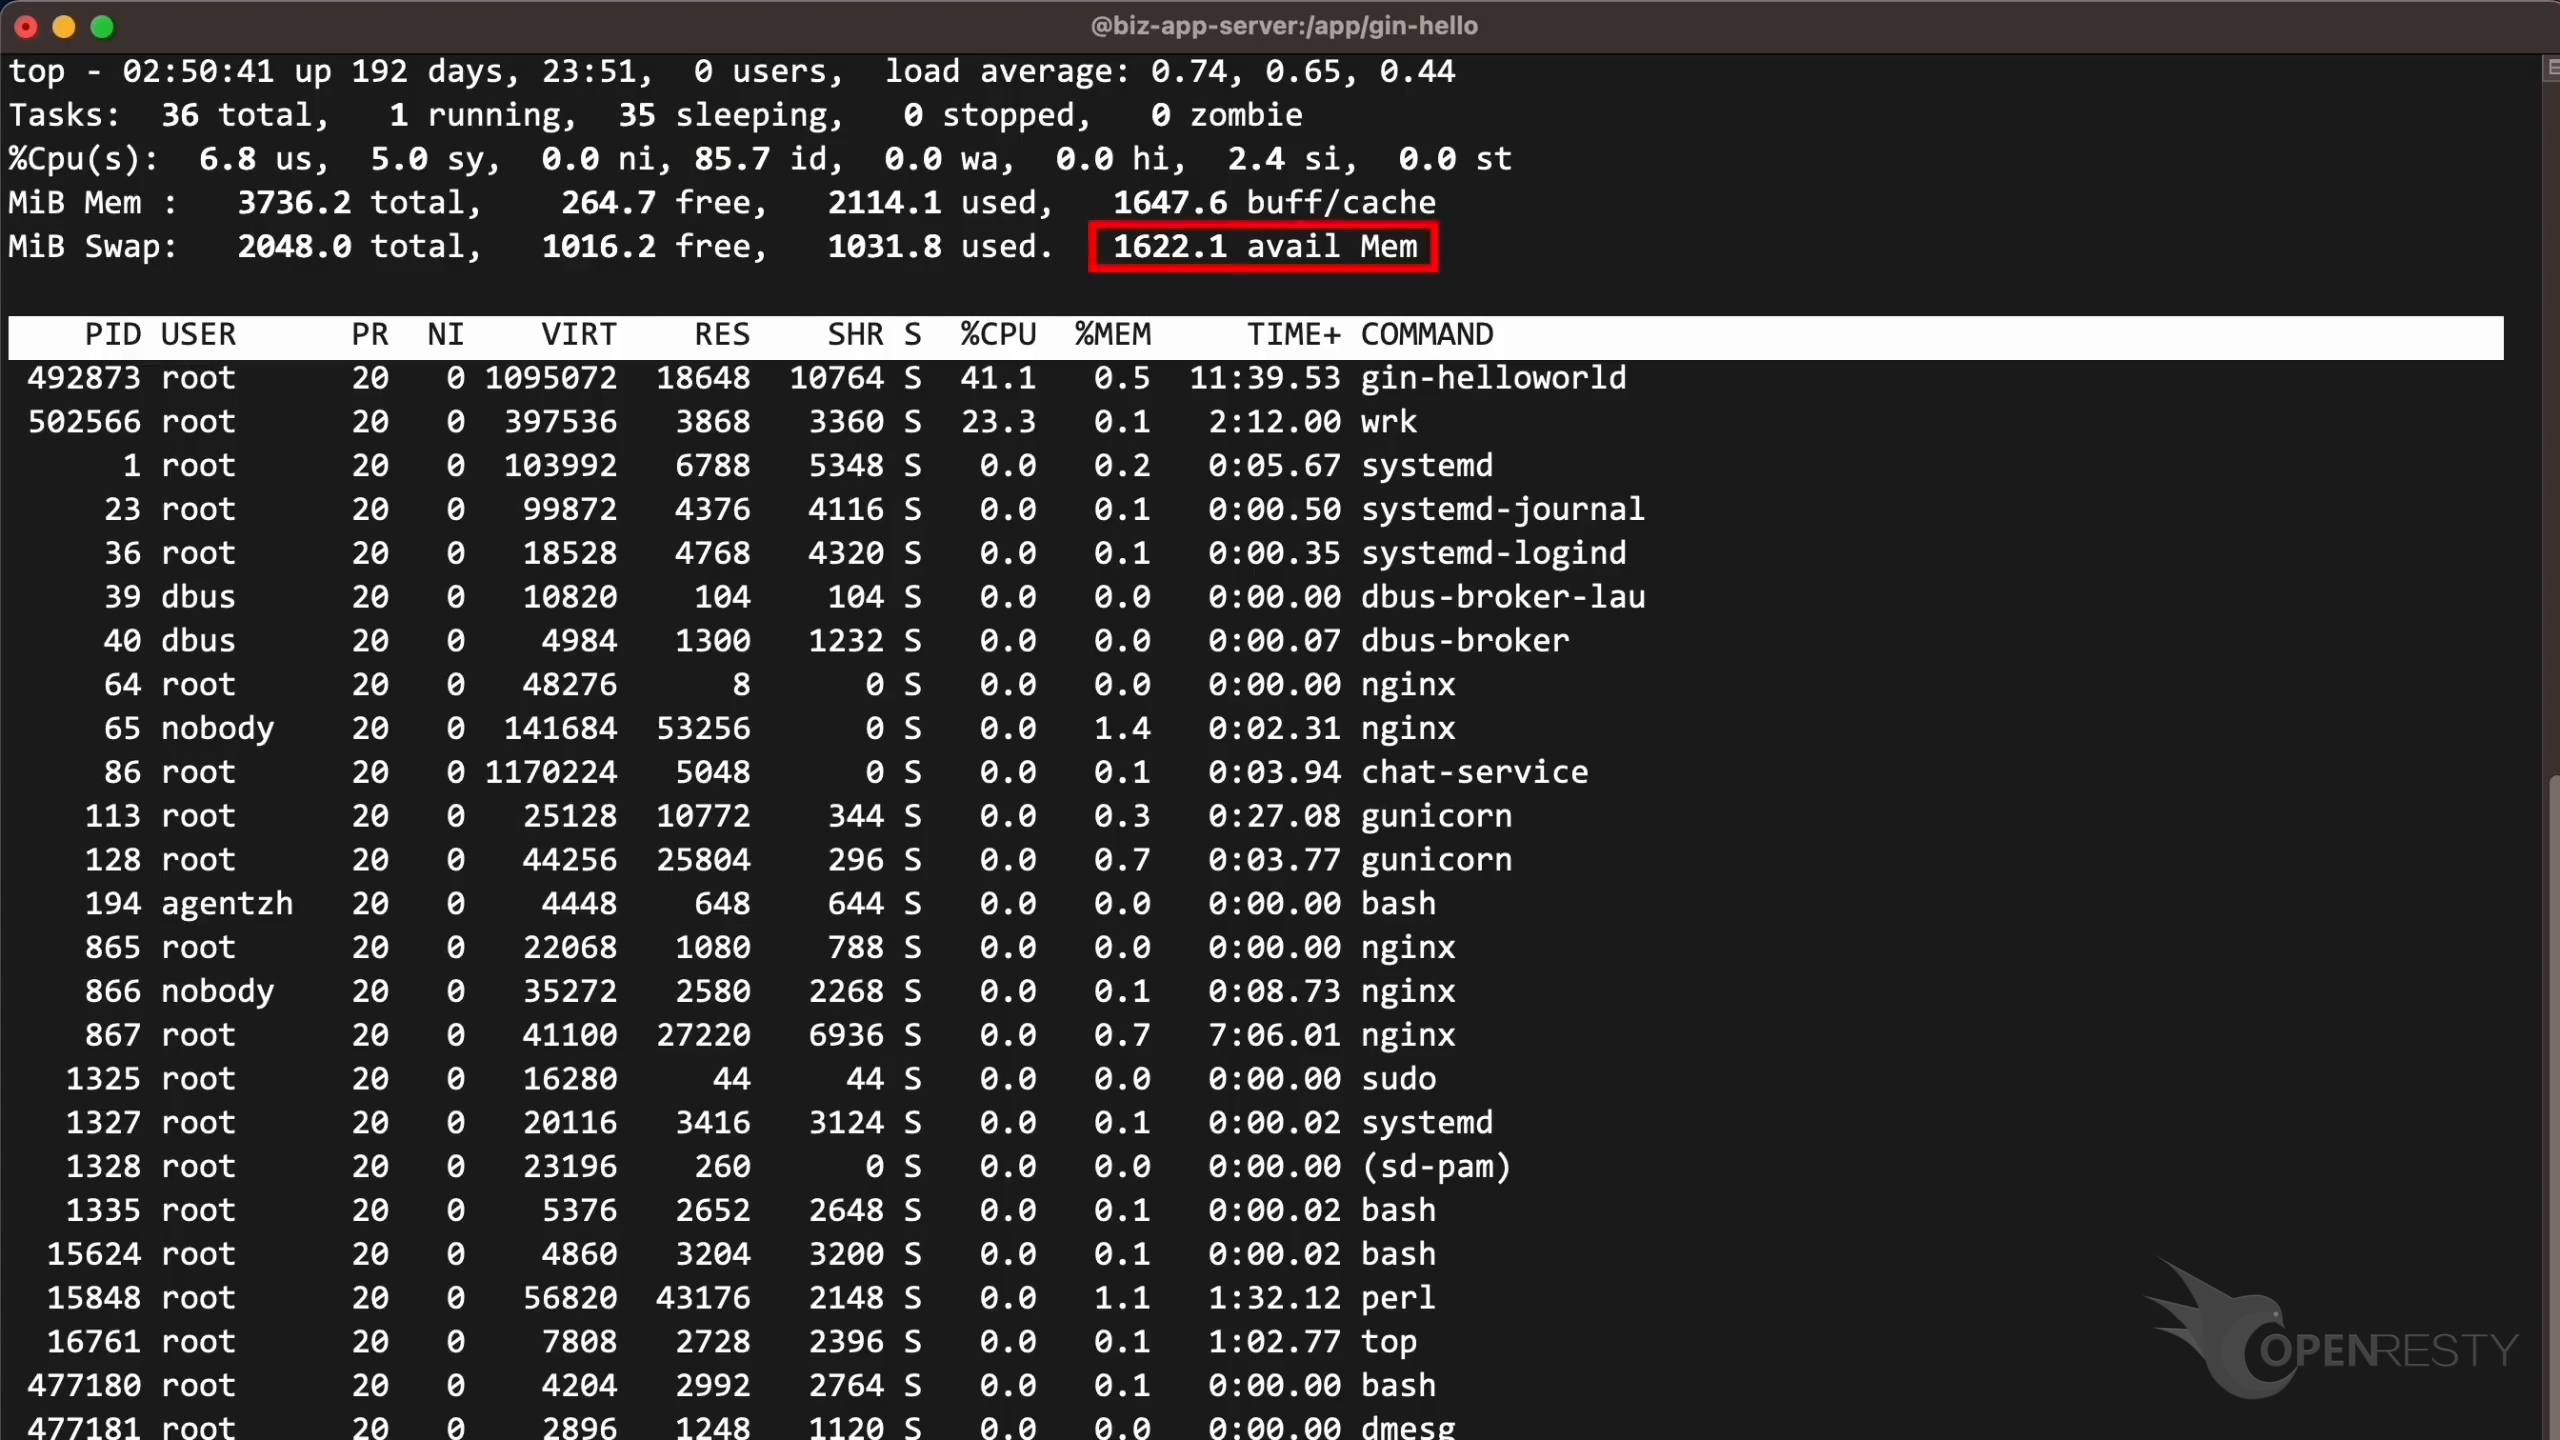
Let’s return to the previous terminal window.
We can see the CPU utilization is around 47%. It’s a bit higher than 43% we saw before sampling. So there is no measurable impact on the target process’s CPU usage.
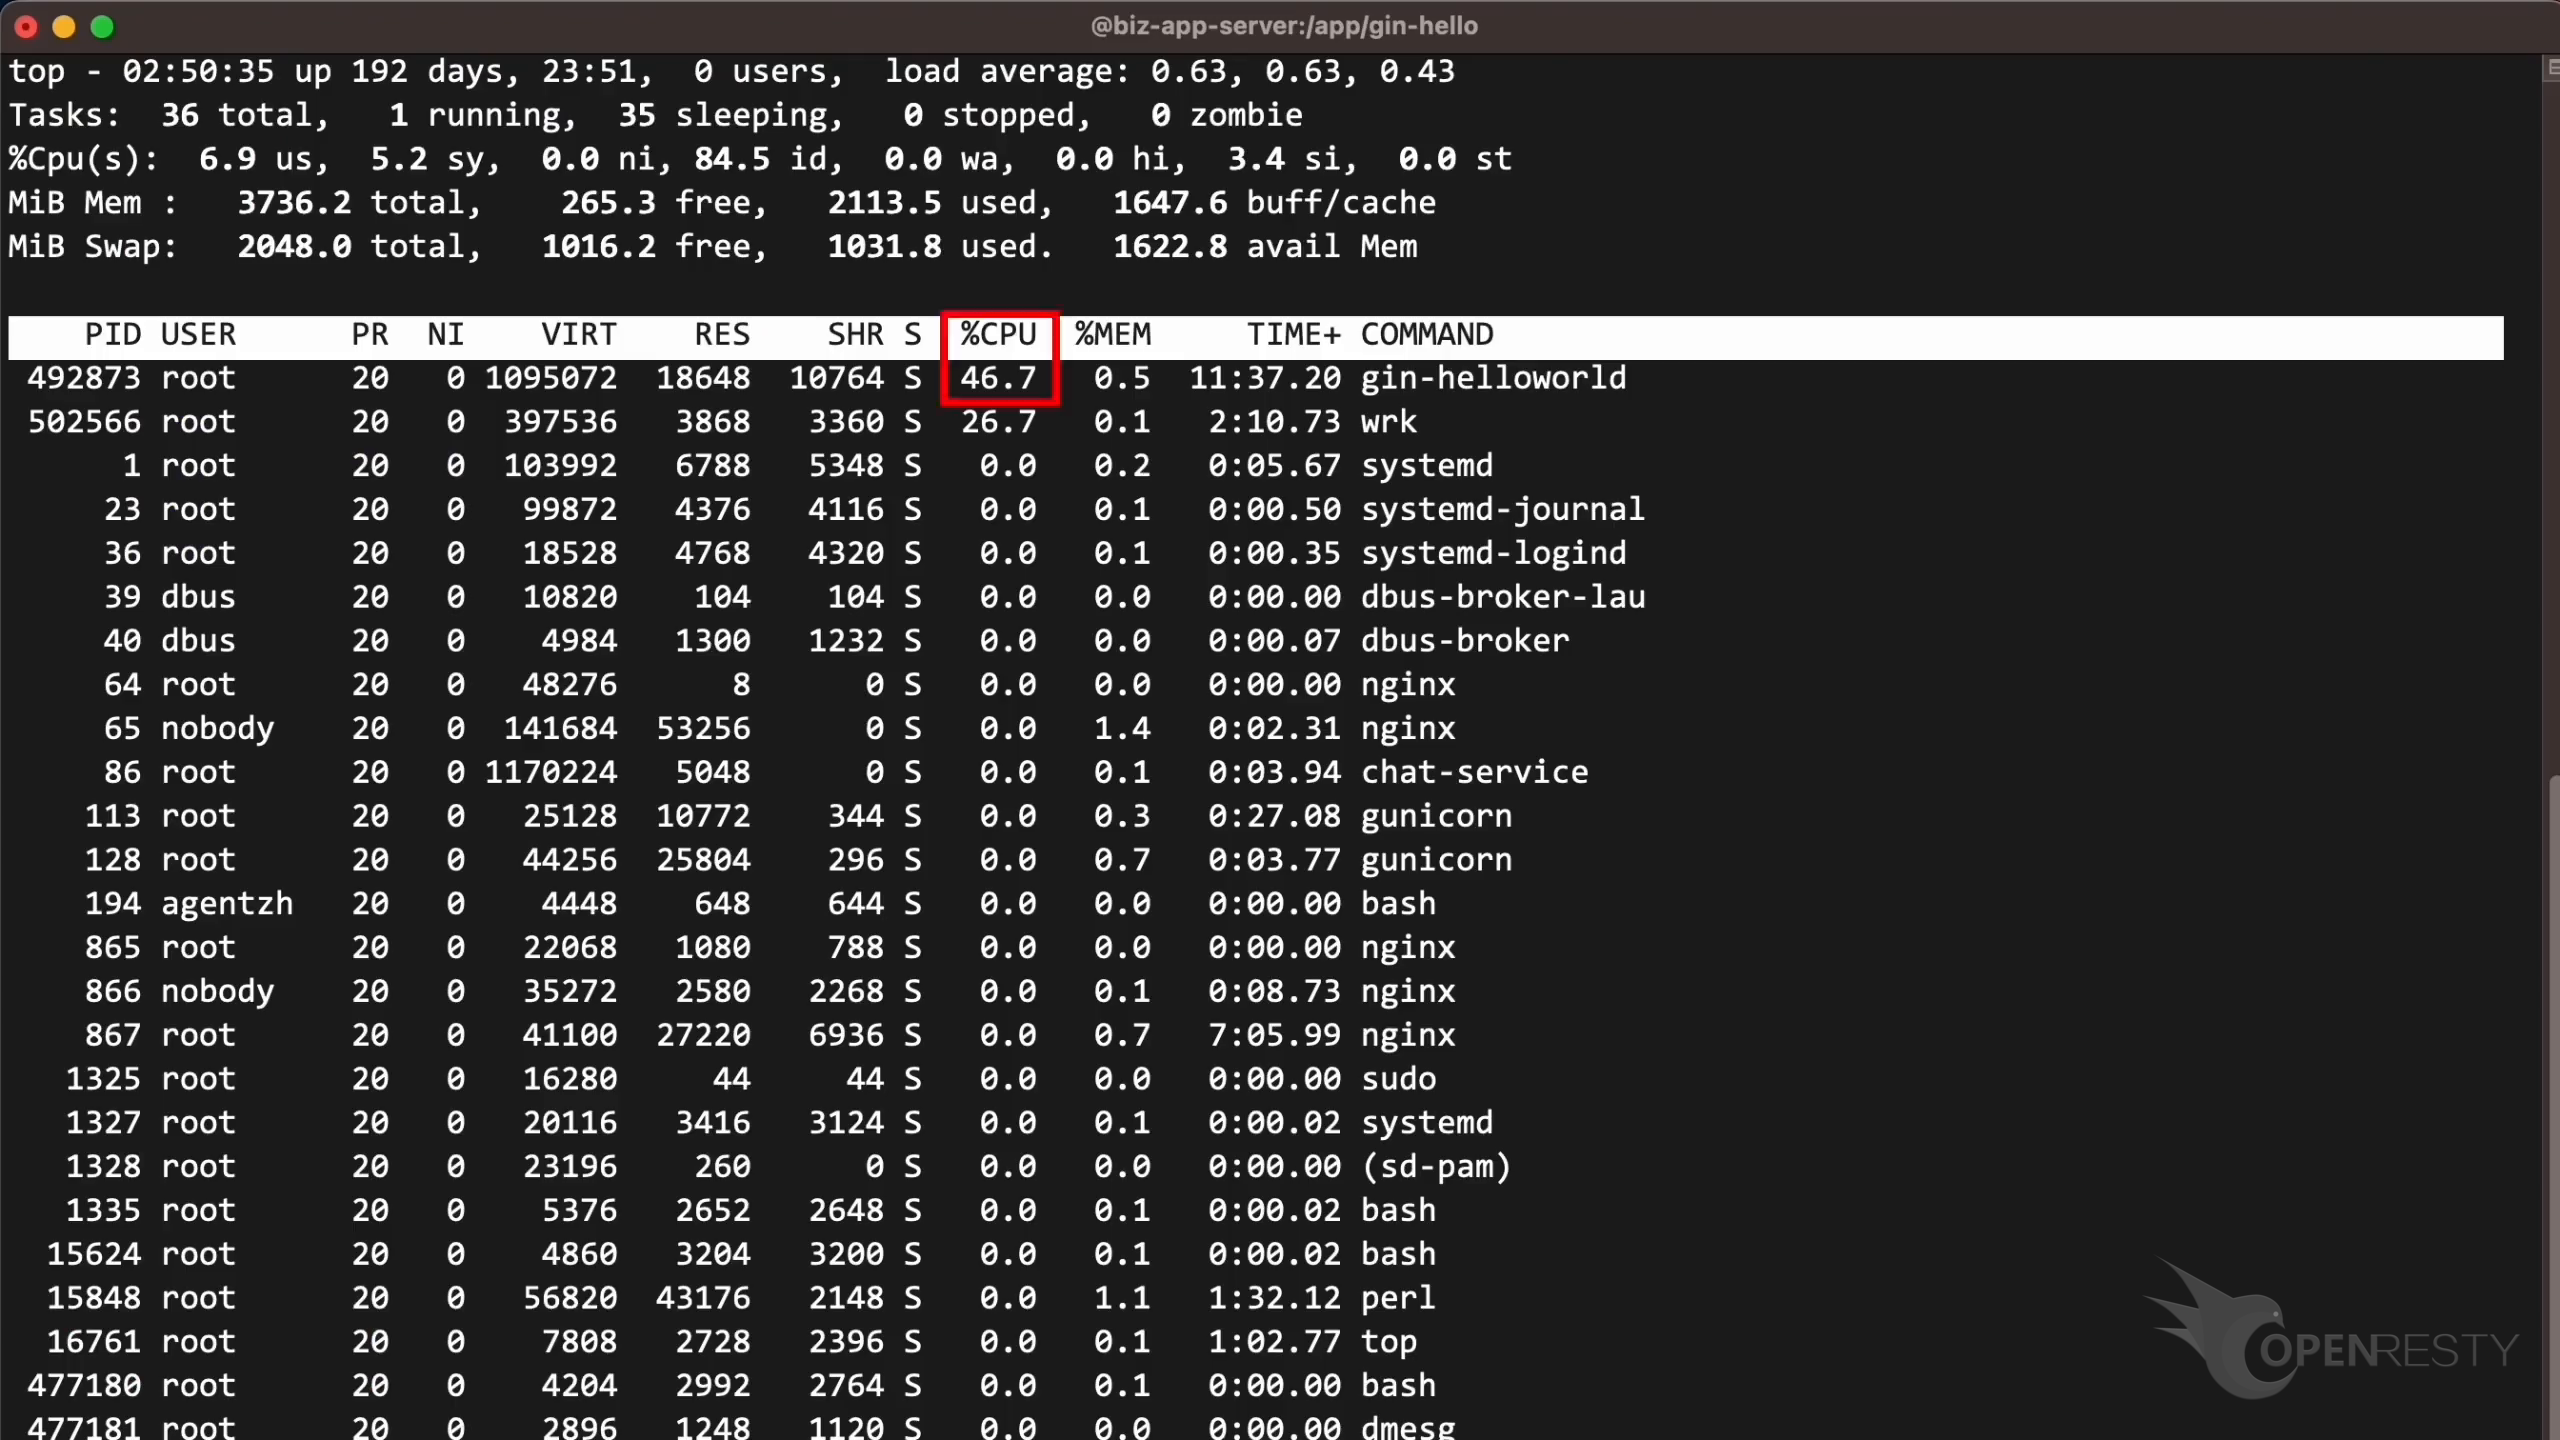
And the load average of the last minute is 0.63, nearly the same as the previous value, 0.62.
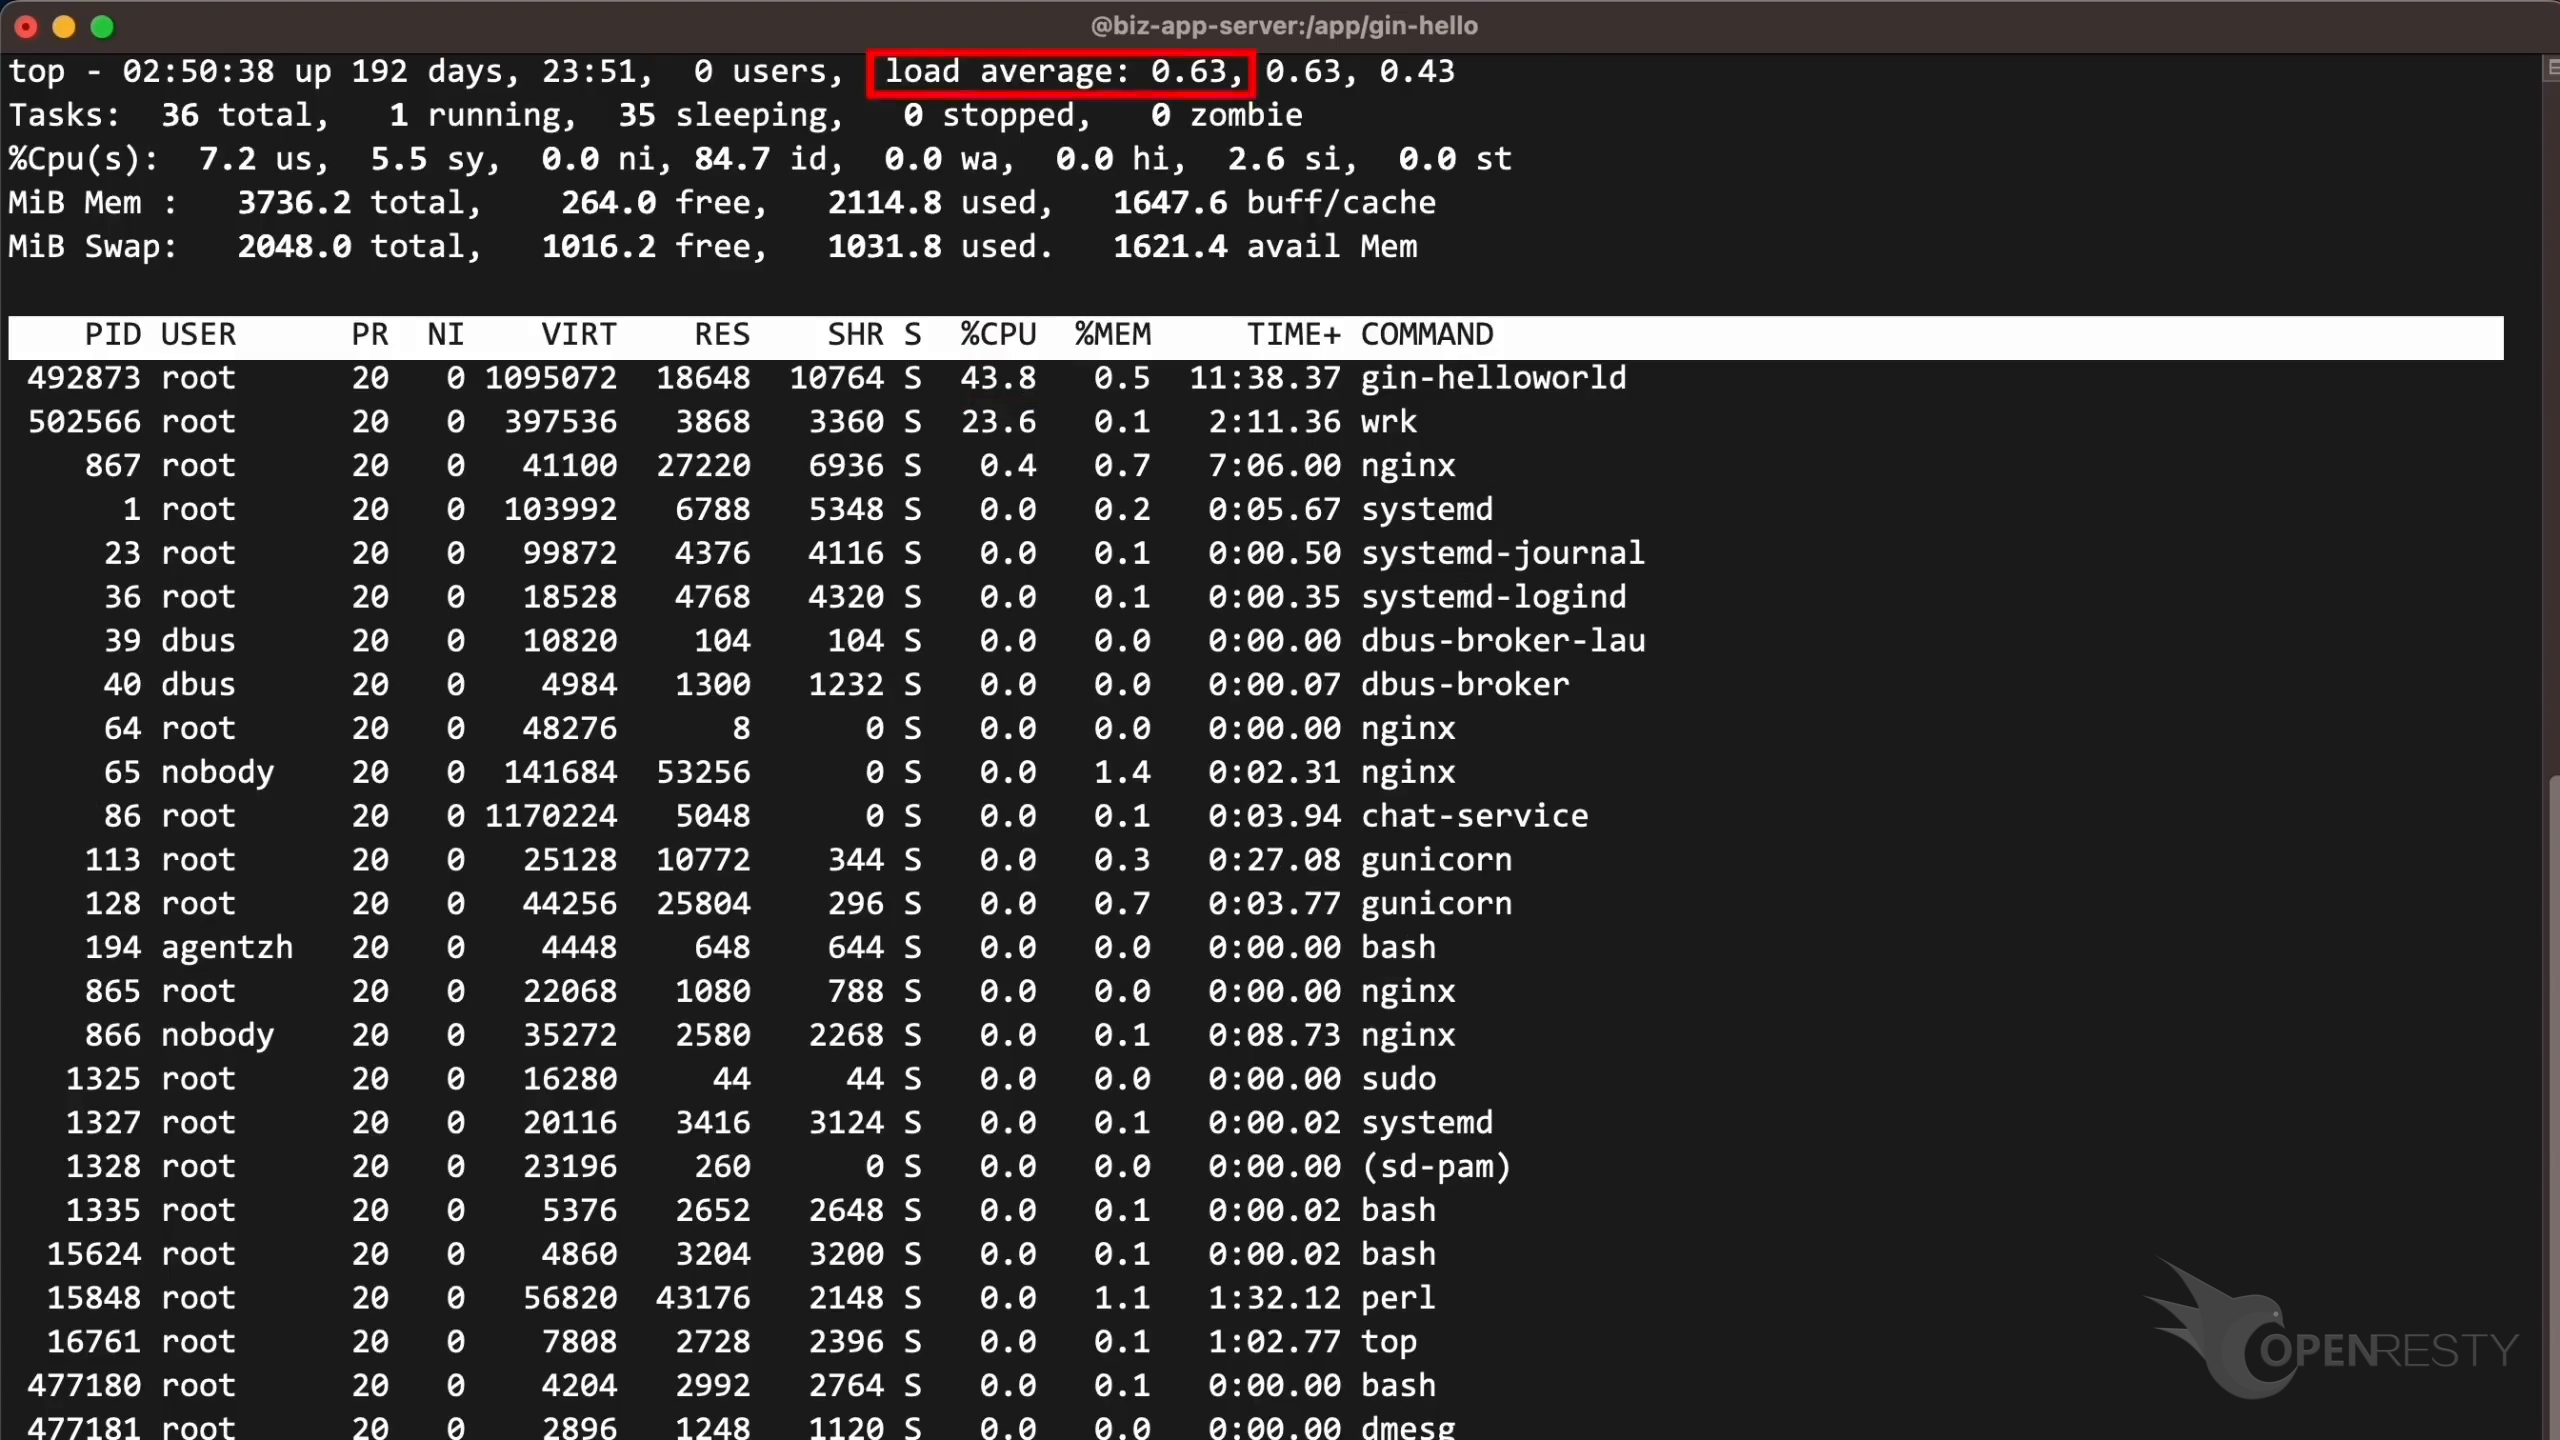
The CPU idle percentage is 85%, nearly the same as the previous value 84%.
The current available memory is about 1622MB, an increase of 76MB from before.
Impact Measurement on Throughput and Latency
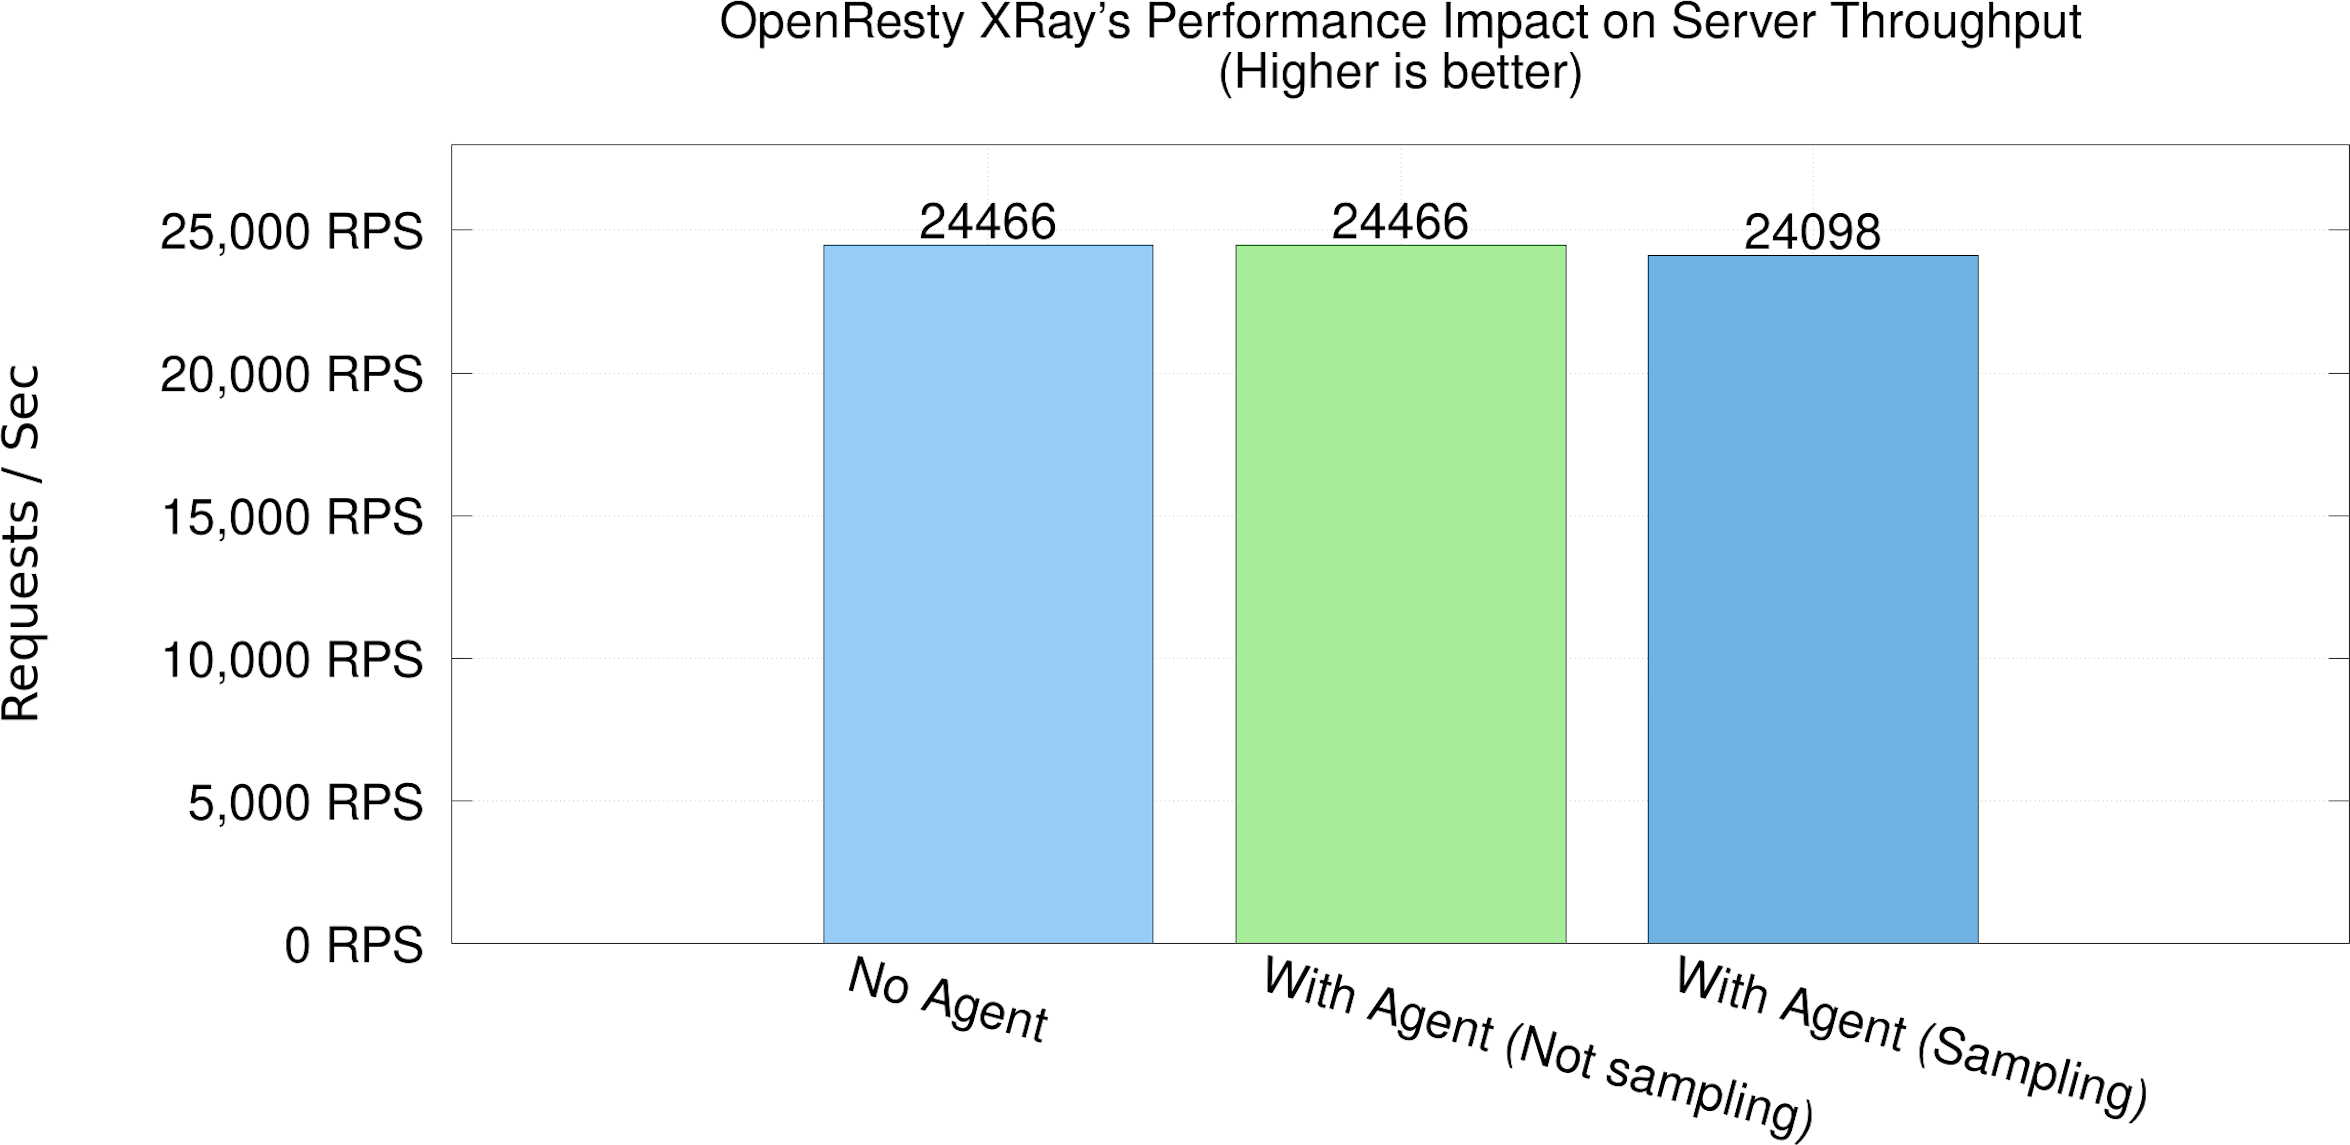
We measured the maximum server throughput in different cases. Here is what we found.
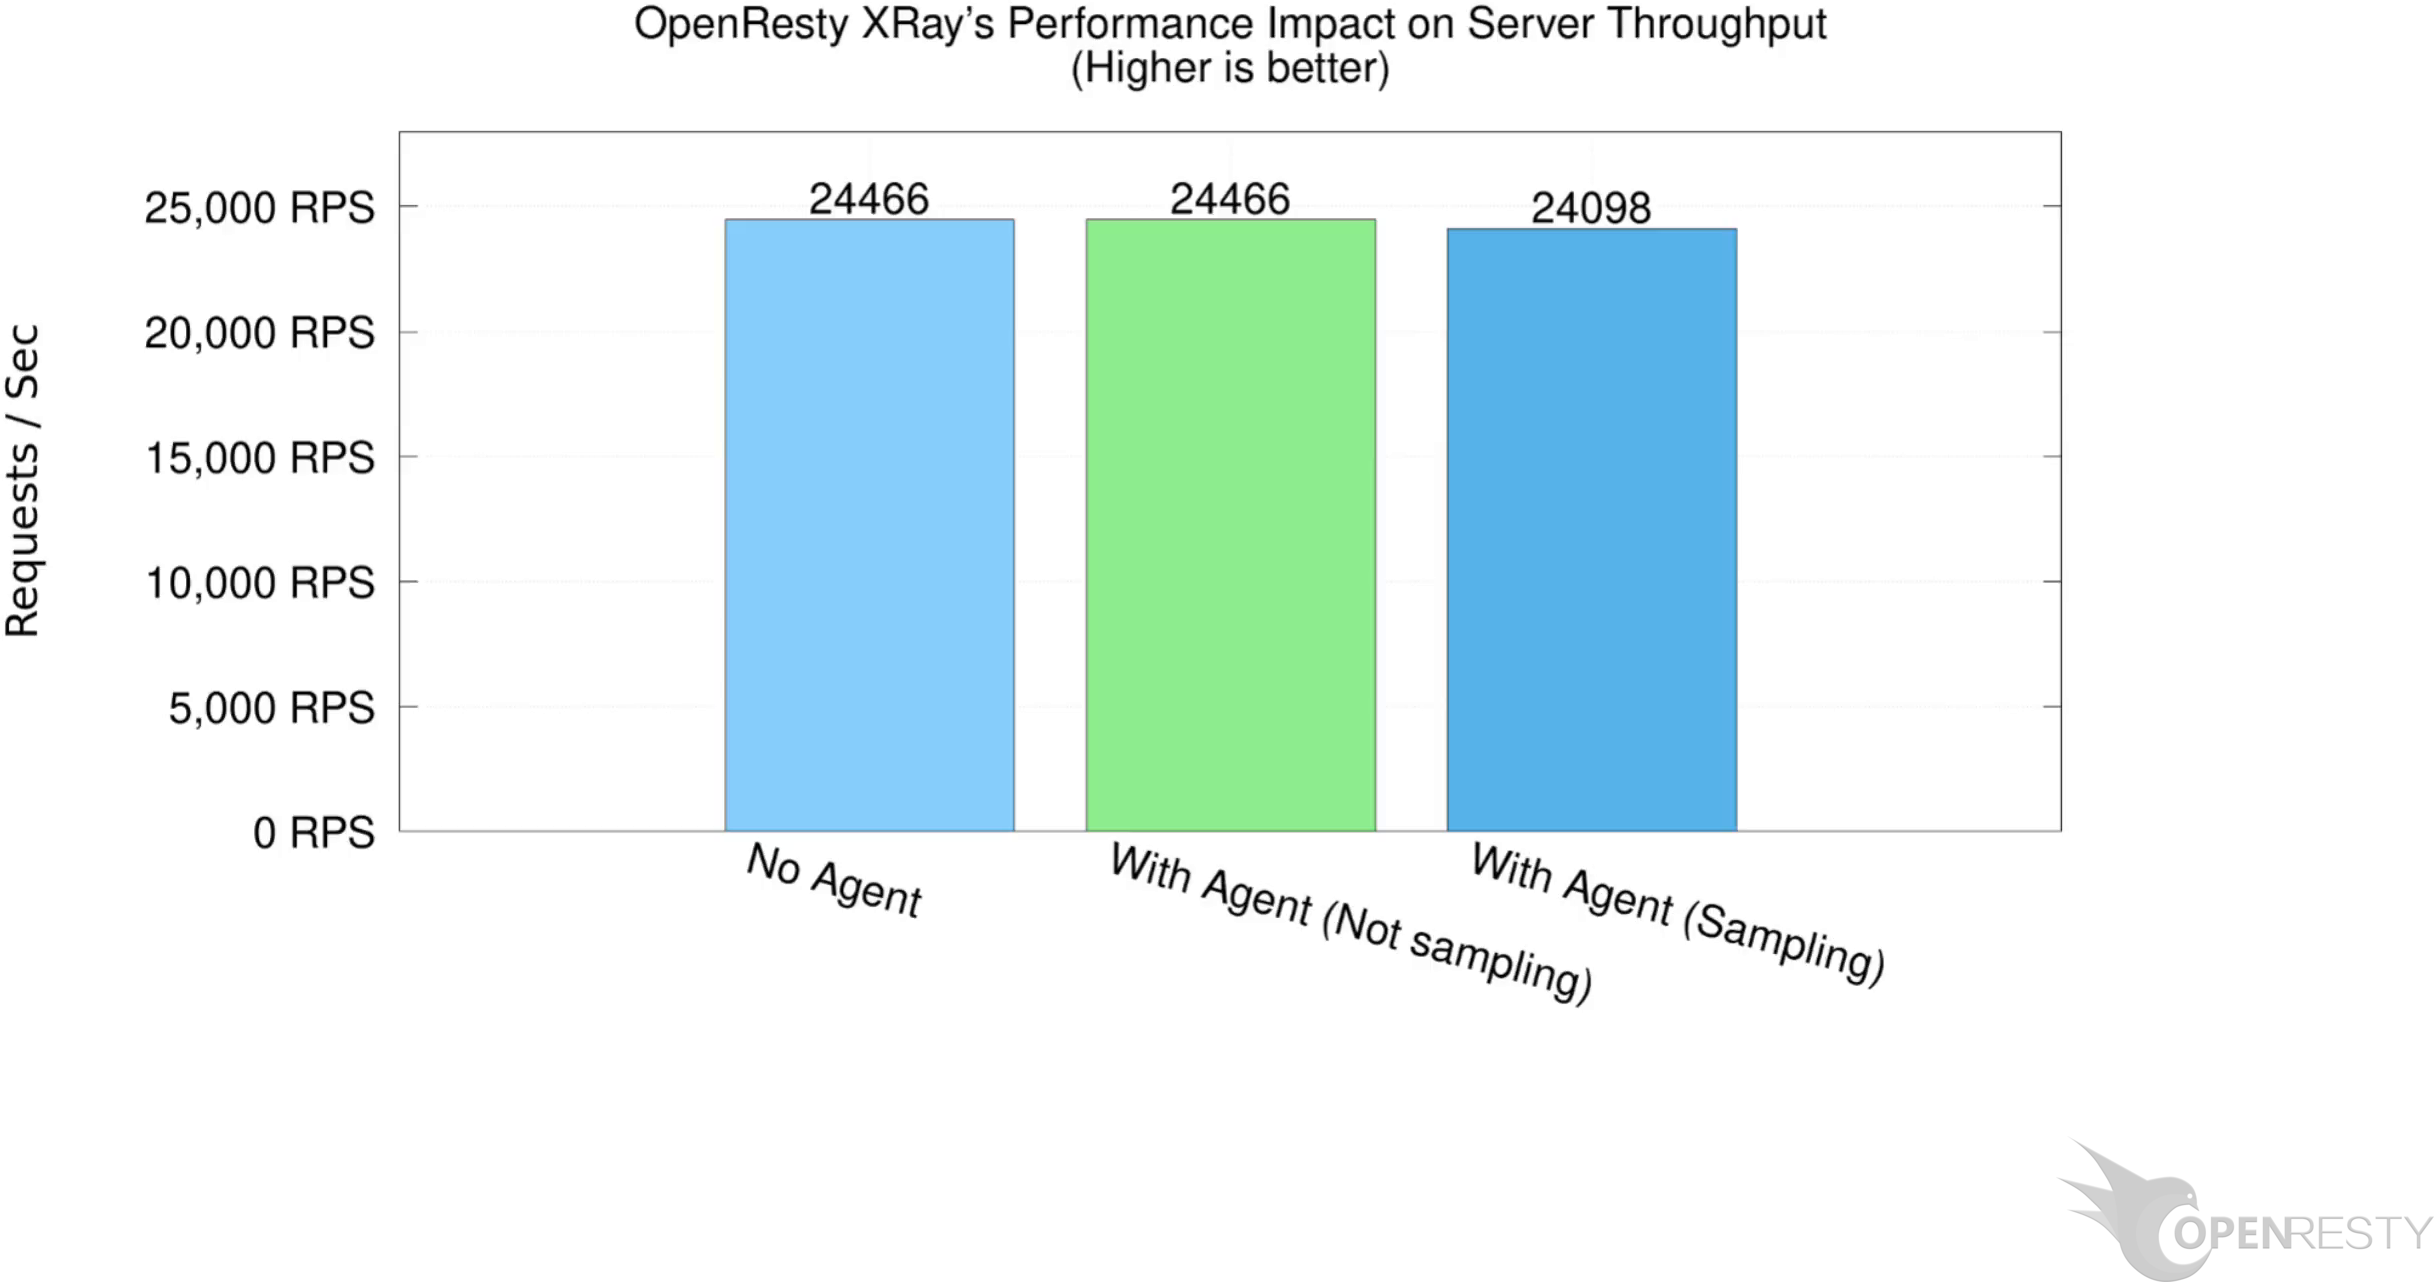
Without installing the OpenResty XRay Agent, the maximum throughput is about 24500 requests per second.
When the OpenResty XRay agent is installed but not running the analyzers, the request rate remains the same.
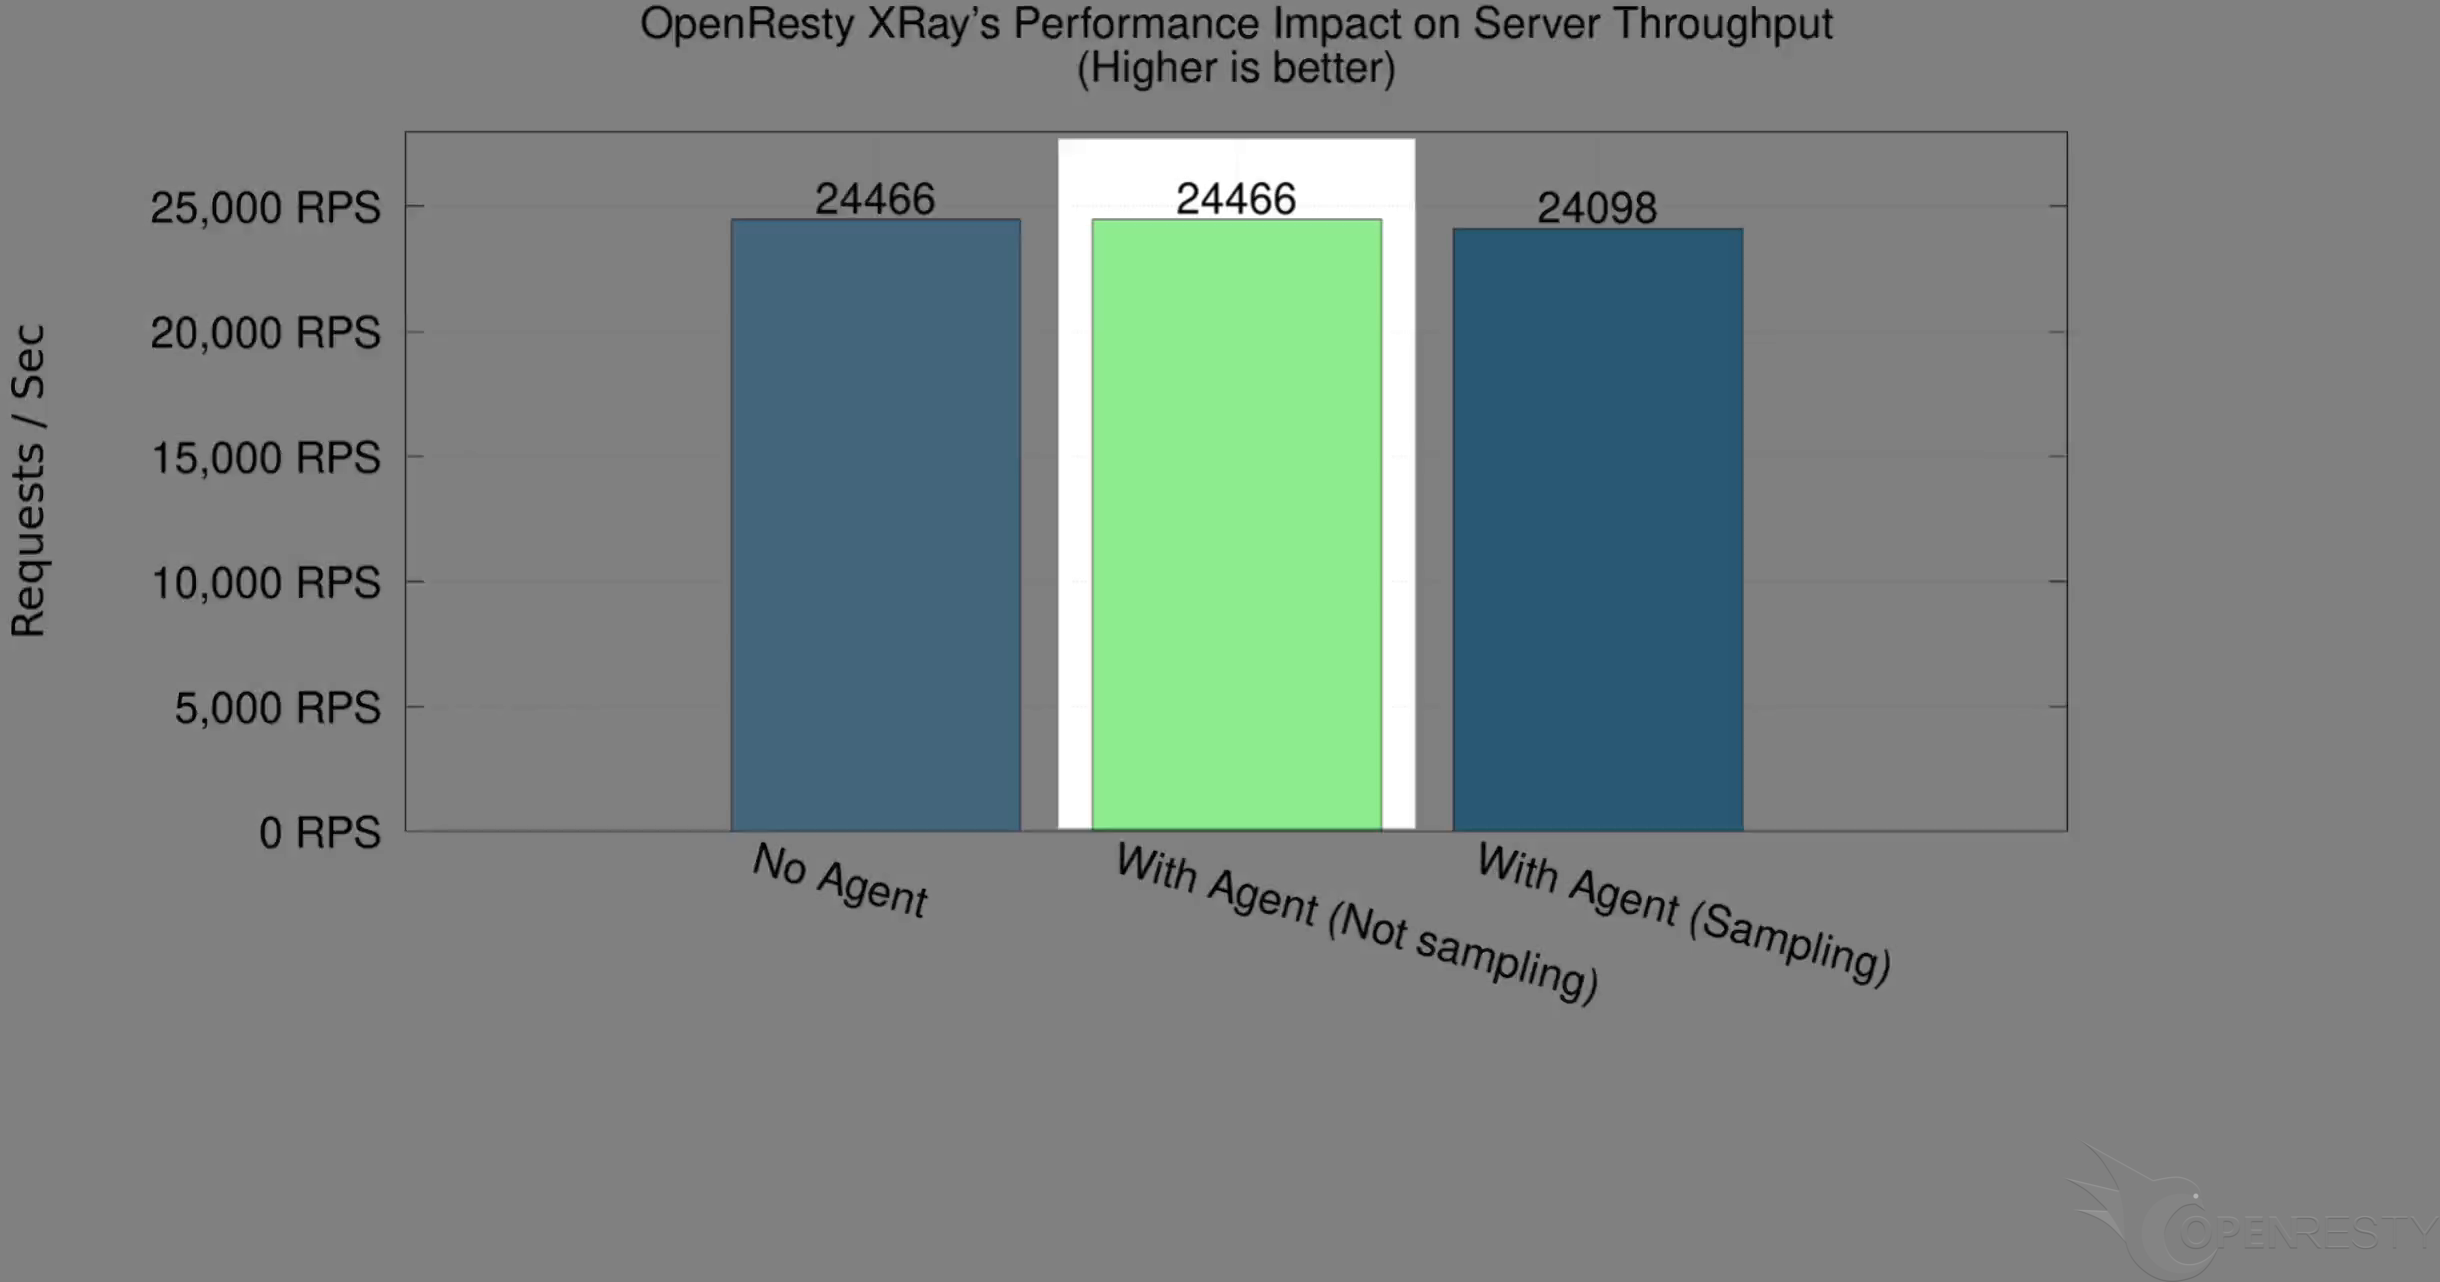
When analyzers are sampling, the request rate is about 24100 requests per second, merely 1.5% lower than when not doing analysis.
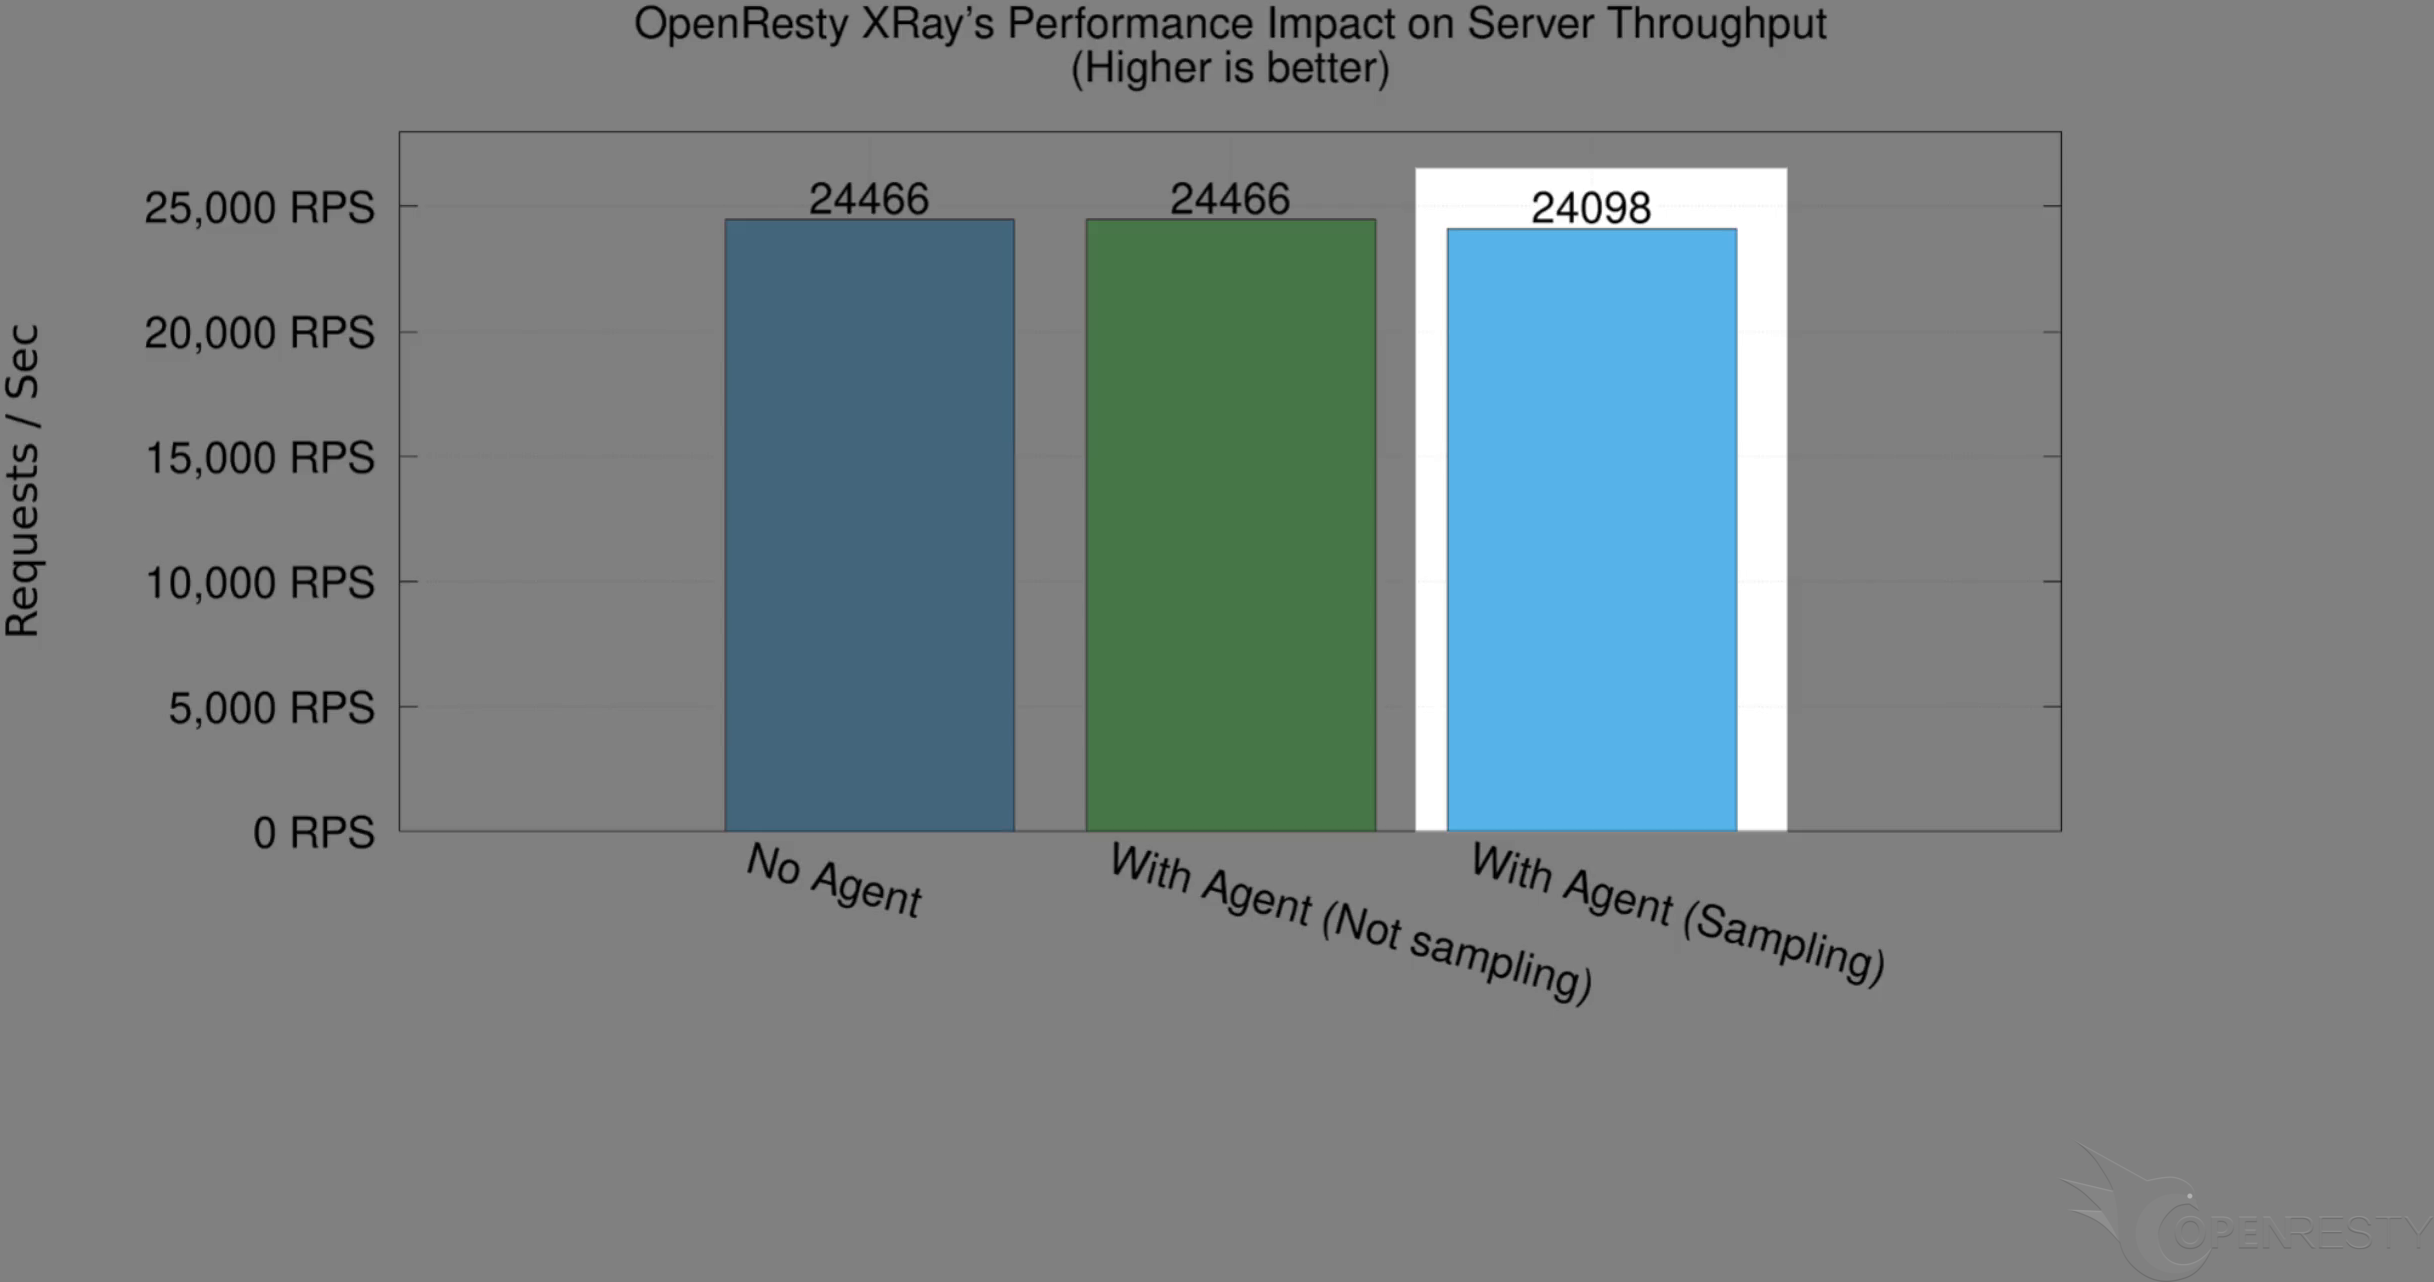
It can be seen that running the analyzers for performance analysis has minimal impact on the maximum throughput of the target process.
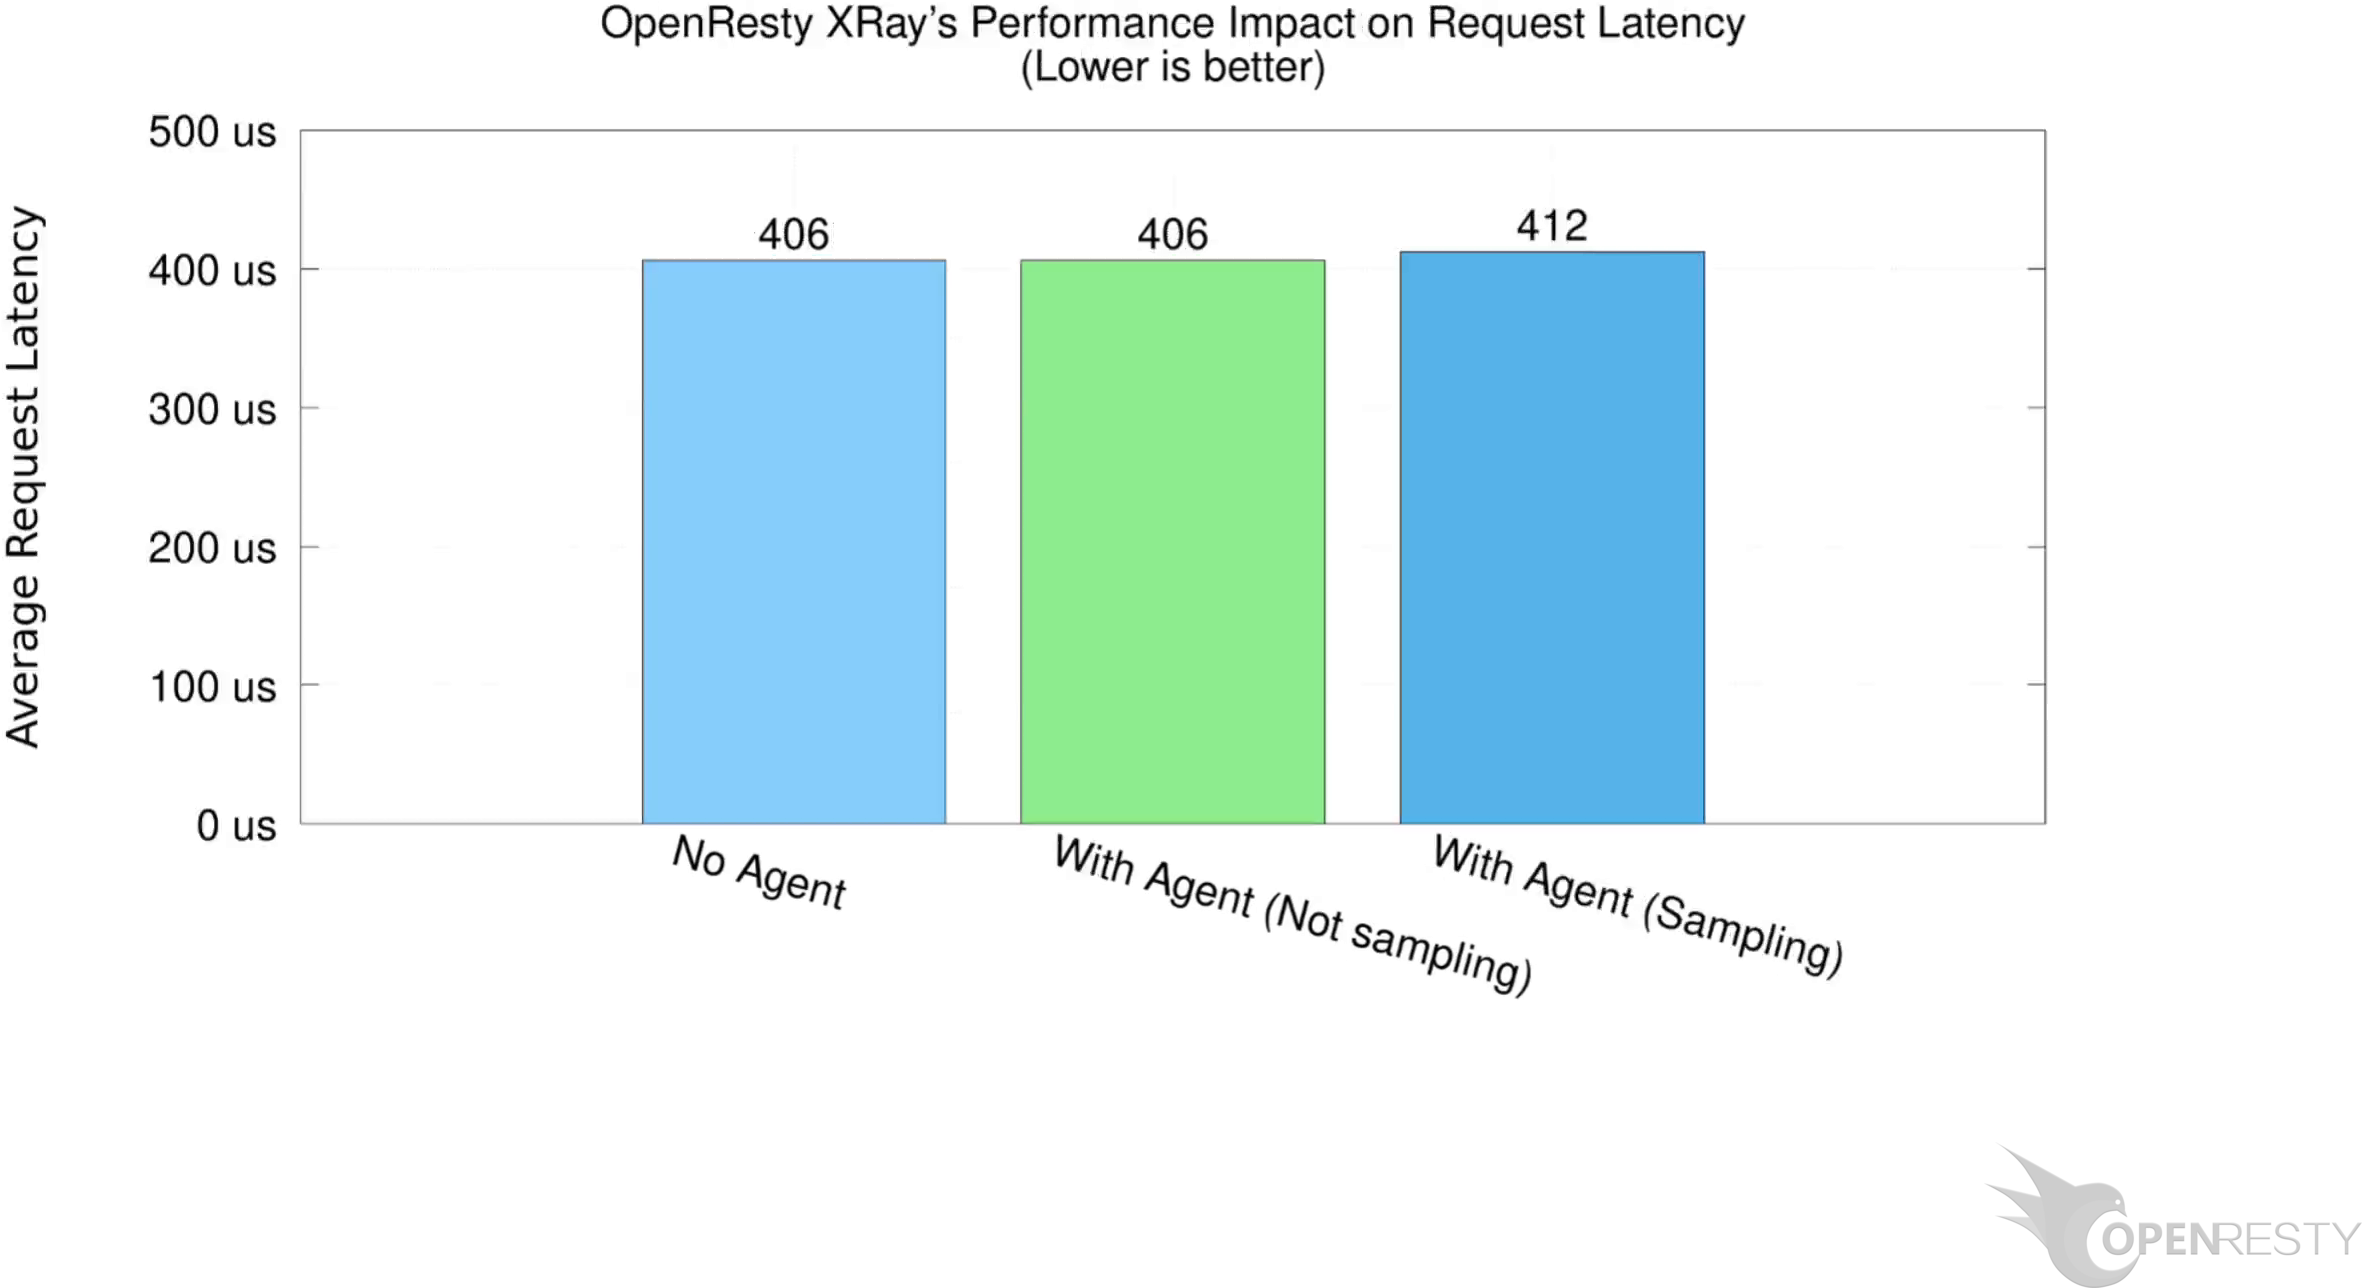
Here is the benchmark showing the impact on request latency during the sampling process. And this is what we found in comparison.

Without installing the OpenResty XRay agent, the average request latency is 406 microseconds.
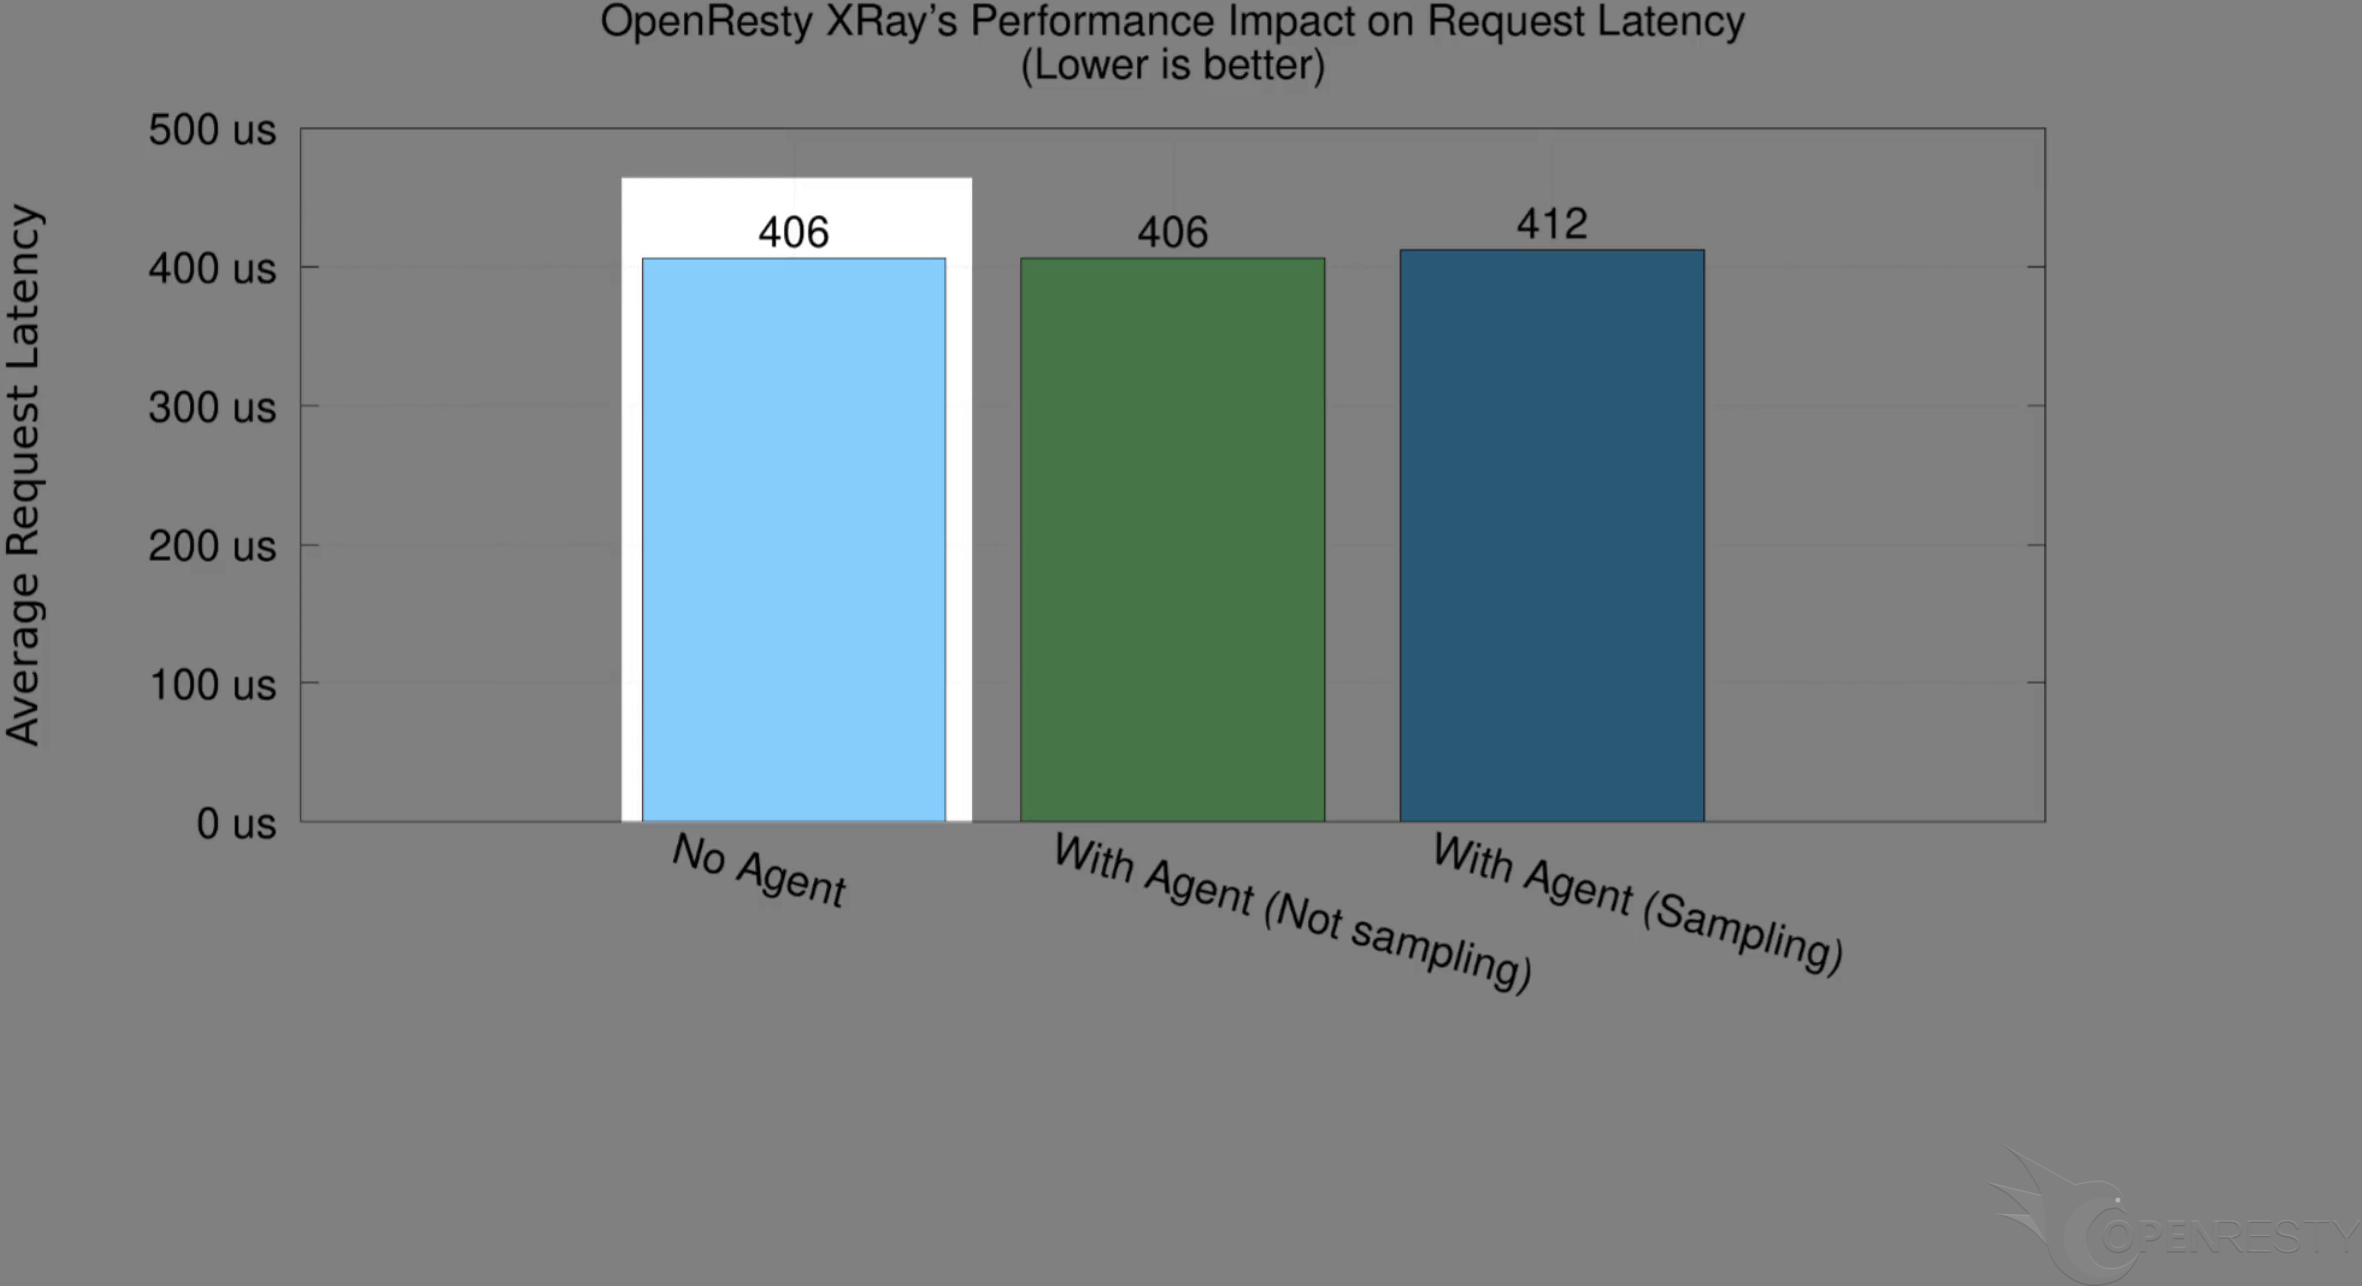
When the agent is installed but the analyzers are not running, the average latency remains unchanged.
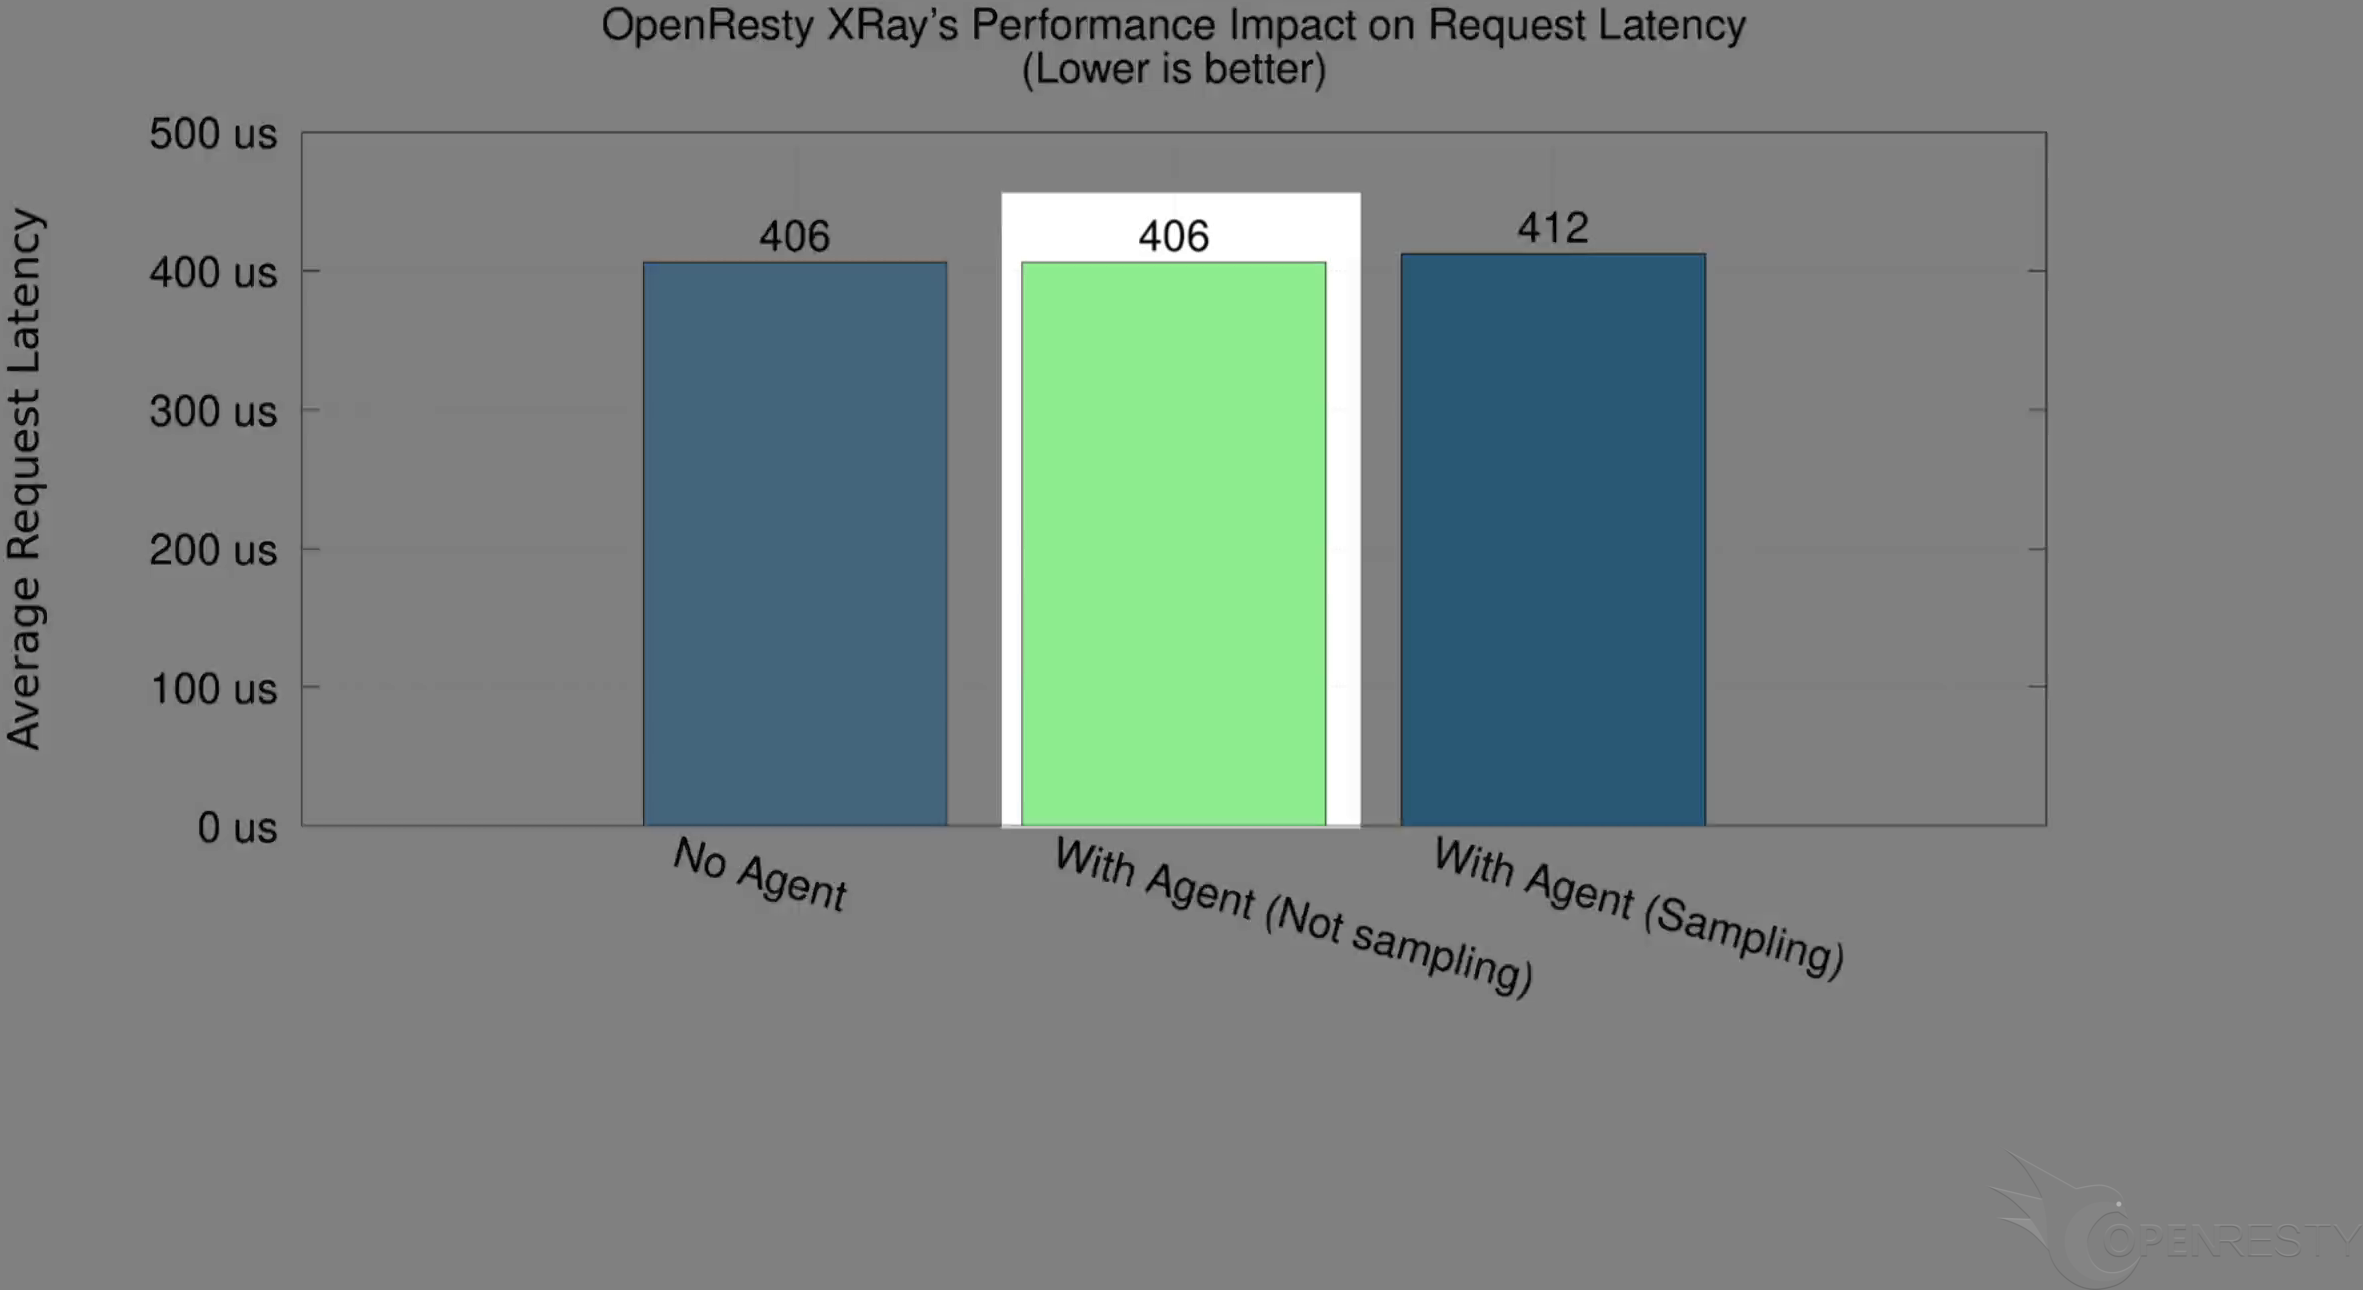
When the analyzers are sampling, the latency is 412 microseconds. An increase of only 6 microseconds.
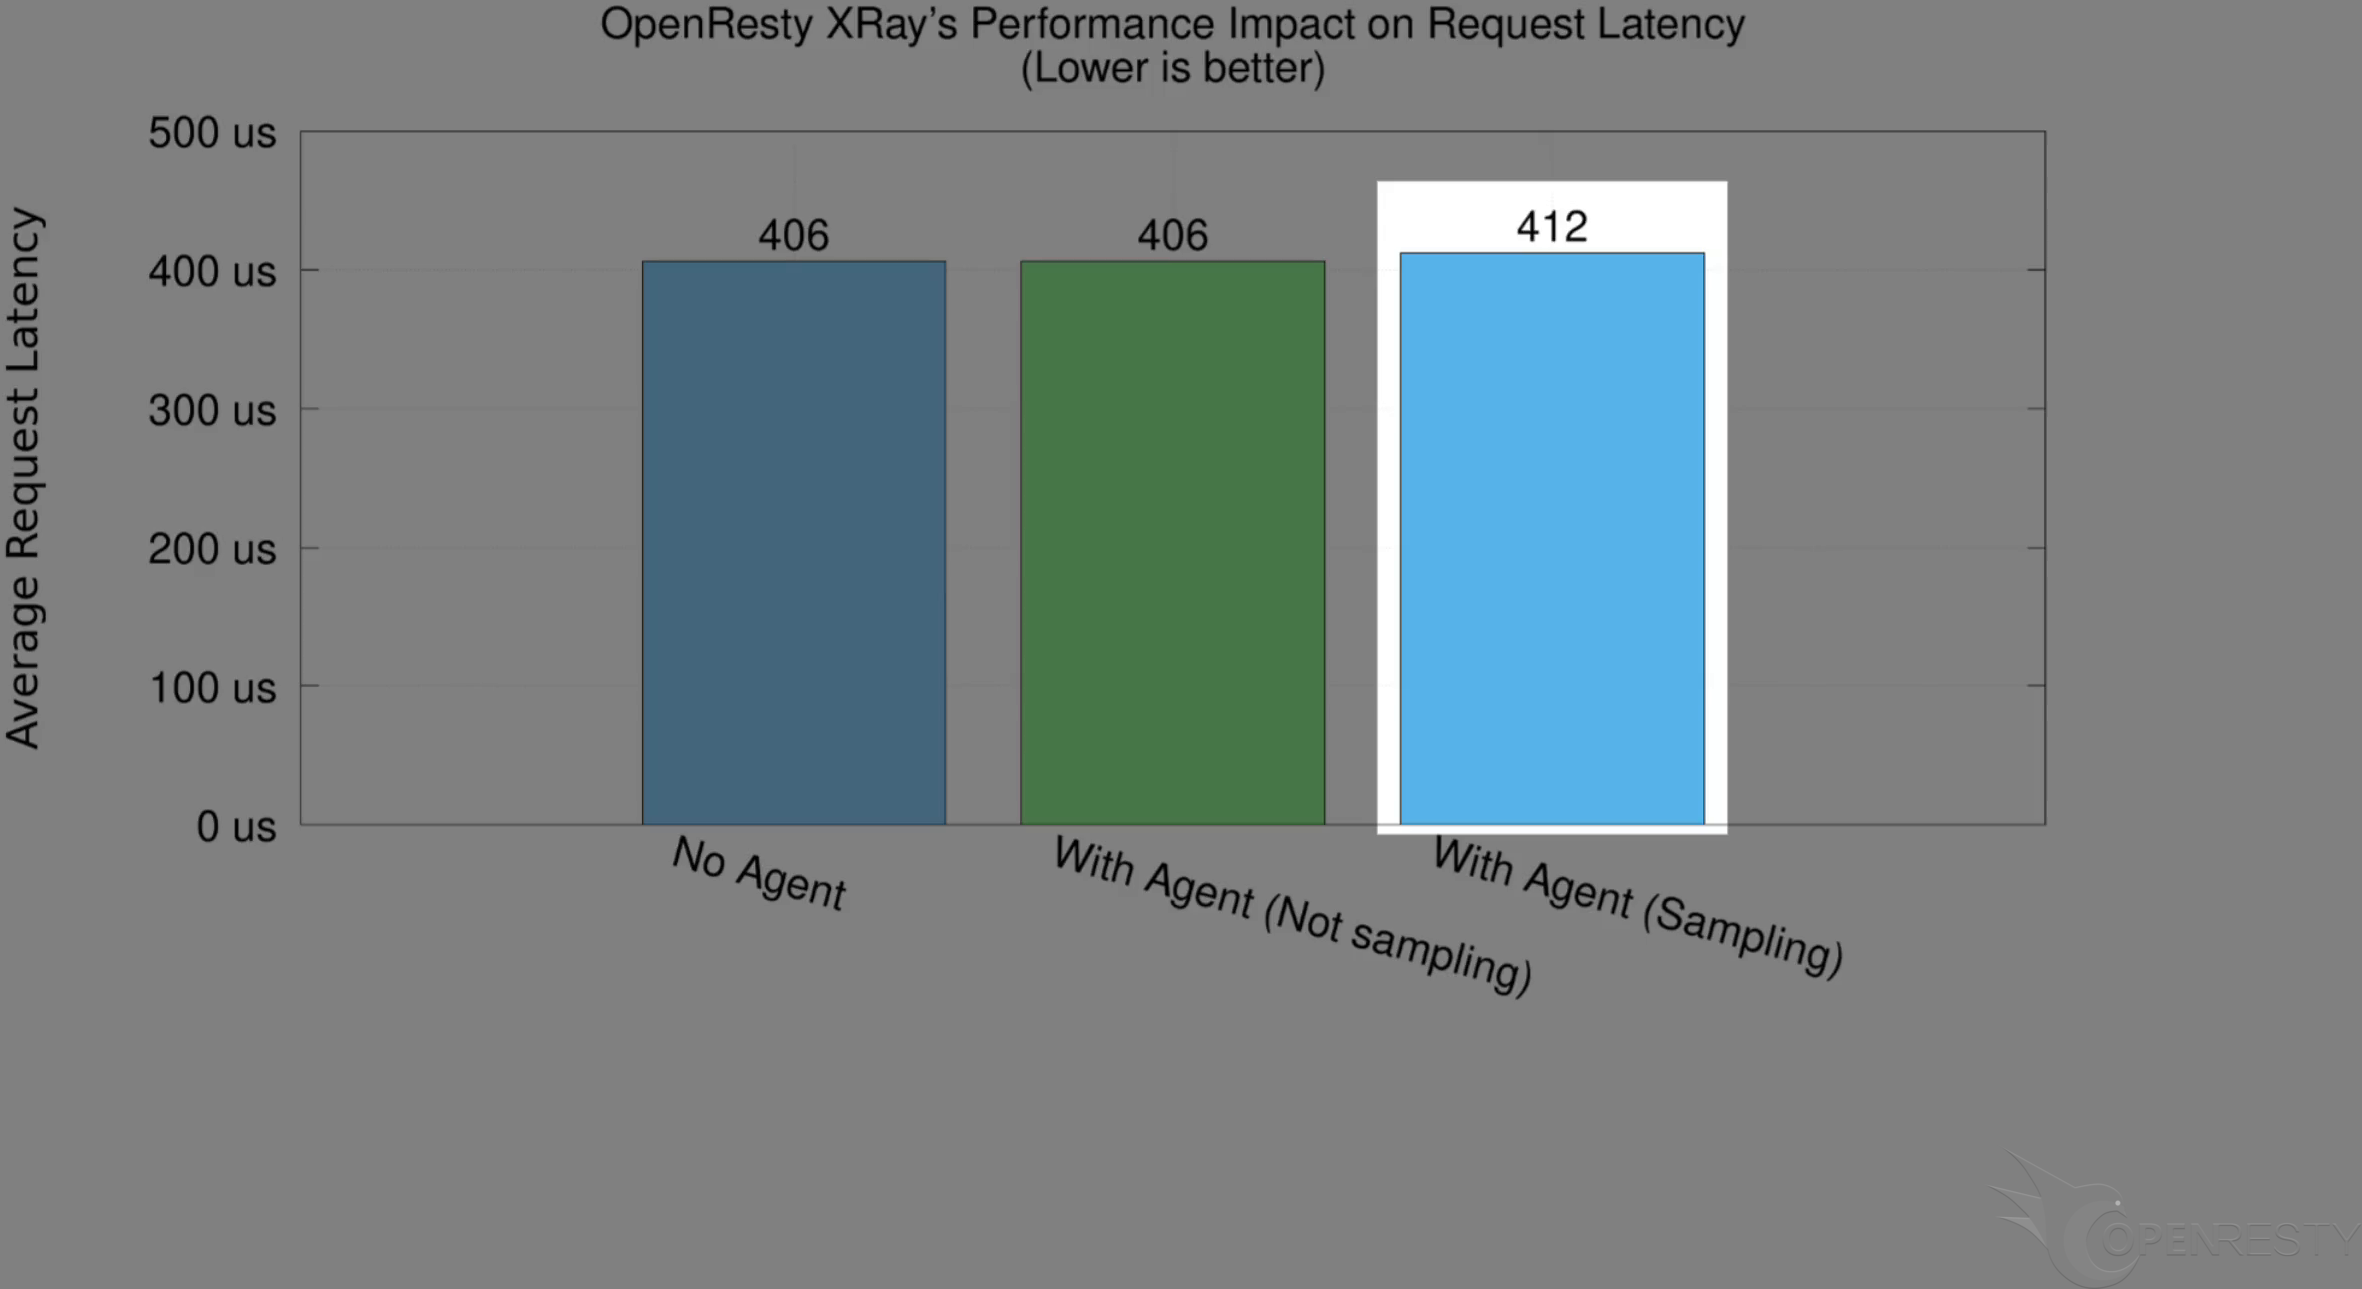
Running the analyzers for performance analysis has a minimal impact on the latency.

Let’s go back to the OpenResty XRay Web console.
The overhead of automatic analysis in the “Insights” page and “Dashboard” page is similarly small and tiny.
What is OpenResty XRay
OpenResty XRay is a dynamic-tracing product that automatically analyzes your running applications to troubleshoot performance problems, behavioral issues, and security vulnerabilities with actionable suggestions. Under the hood, OpenResty XRay is powered by our Y language targeting various runtimes like Stap+, eBPF+, GDB, and ODB, depending on the contexts.
If you like this tutorial, please subscribe to this blog site and/or our YouTube channel. Thank you!
About The Author
Yichun Zhang (Github handle: agentzh), is the original creator of the OpenResty® open-source project and the CEO of OpenResty Inc..
Yichun is one of the earliest advocates and leaders of “open-source technology”. He worked at many internationally renowned tech companies, such as Cloudflare, Yahoo!. He is a pioneer of “edge computing”, “dynamic tracing” and “machine coding”, with over 22 years of programming and 16 years of open source experience. Yichun is well-known in the open-source space as the project leader of OpenResty®, adopted by more than 40 million global website domains.
OpenResty Inc., the enterprise software start-up founded by Yichun in 2017, has customers from some of the biggest companies in the world. Its flagship product, OpenResty XRay, is a non-invasive profiling and troubleshooting tool that significantly enhances and utilizes dynamic tracing technology. And its OpenResty Edge product is a powerful distributed traffic management and private CDN software product.
As an avid open-source contributor, Yichun has contributed more than a million lines of code to numerous open-source projects, including Linux kernel, Nginx, LuaJIT, GDB, SystemTap, LLVM, Perl, etc. He has also authored more than 60 open-source software libraries.
Related Articles
OpenResty XRay Dec 25, 2023

OpenResty XRay Dec 1, 2023
")
OpenResty XRay Nov 27, 2023
")
OpenResty XRay Nov 27, 2023
")
OpenResty XRay Sep 27, 2023
")


")
")
")
")