How OpenResty XRay Solved P99 Latency Jitter in a D-lang Order Service
An order service, built with D and vibe.d, which had been running stably for months, began to show periodic P99 response time jitter.
Symptoms:
- P99 Response Time: During peak traffic, latency spiked from a 120ms baseline to 350ms, creating a noticeable impact for some users.
- Standard Monitoring: Key metrics like error rate, throughput, average response time, and slow query logs were all normal.
- External Dependencies: All health checks passed, and the latency breakdown across the call chain showed no anomalies.
- Service Status: No OOM errors or panics occurred.
This is one of the trickiest performance issues to diagnose: the service appears healthy externally but suffers from internal problems. Standard monitoring alerts you to a problem but doesn’t tell you where it is. We investigated all the usual suspects based on experience—database, external dependencies, concurrency settings—but the P99 latency saw no improvement. When all reasonable hypotheses are proven false, it suggests the problem lies not with an external component, but within the service’s own runtime behavior.
To pinpoint the root cause without disrupting the production environment, we used OpenResty XRay. As a non-invasive tool, it leverages dynamic tracing to analyze running binary processes directly. This means we could sample the application without modifying a single line of code, recompiling, or restarting the service, and automatically generate flame graphs to identify performance hotspots.
Analyzing GC Traps and Business Hotspots in the Flame Graph
Upon opening the flame graph automatically generated by OpenResty XRay, two wide blocks immediately stood out:
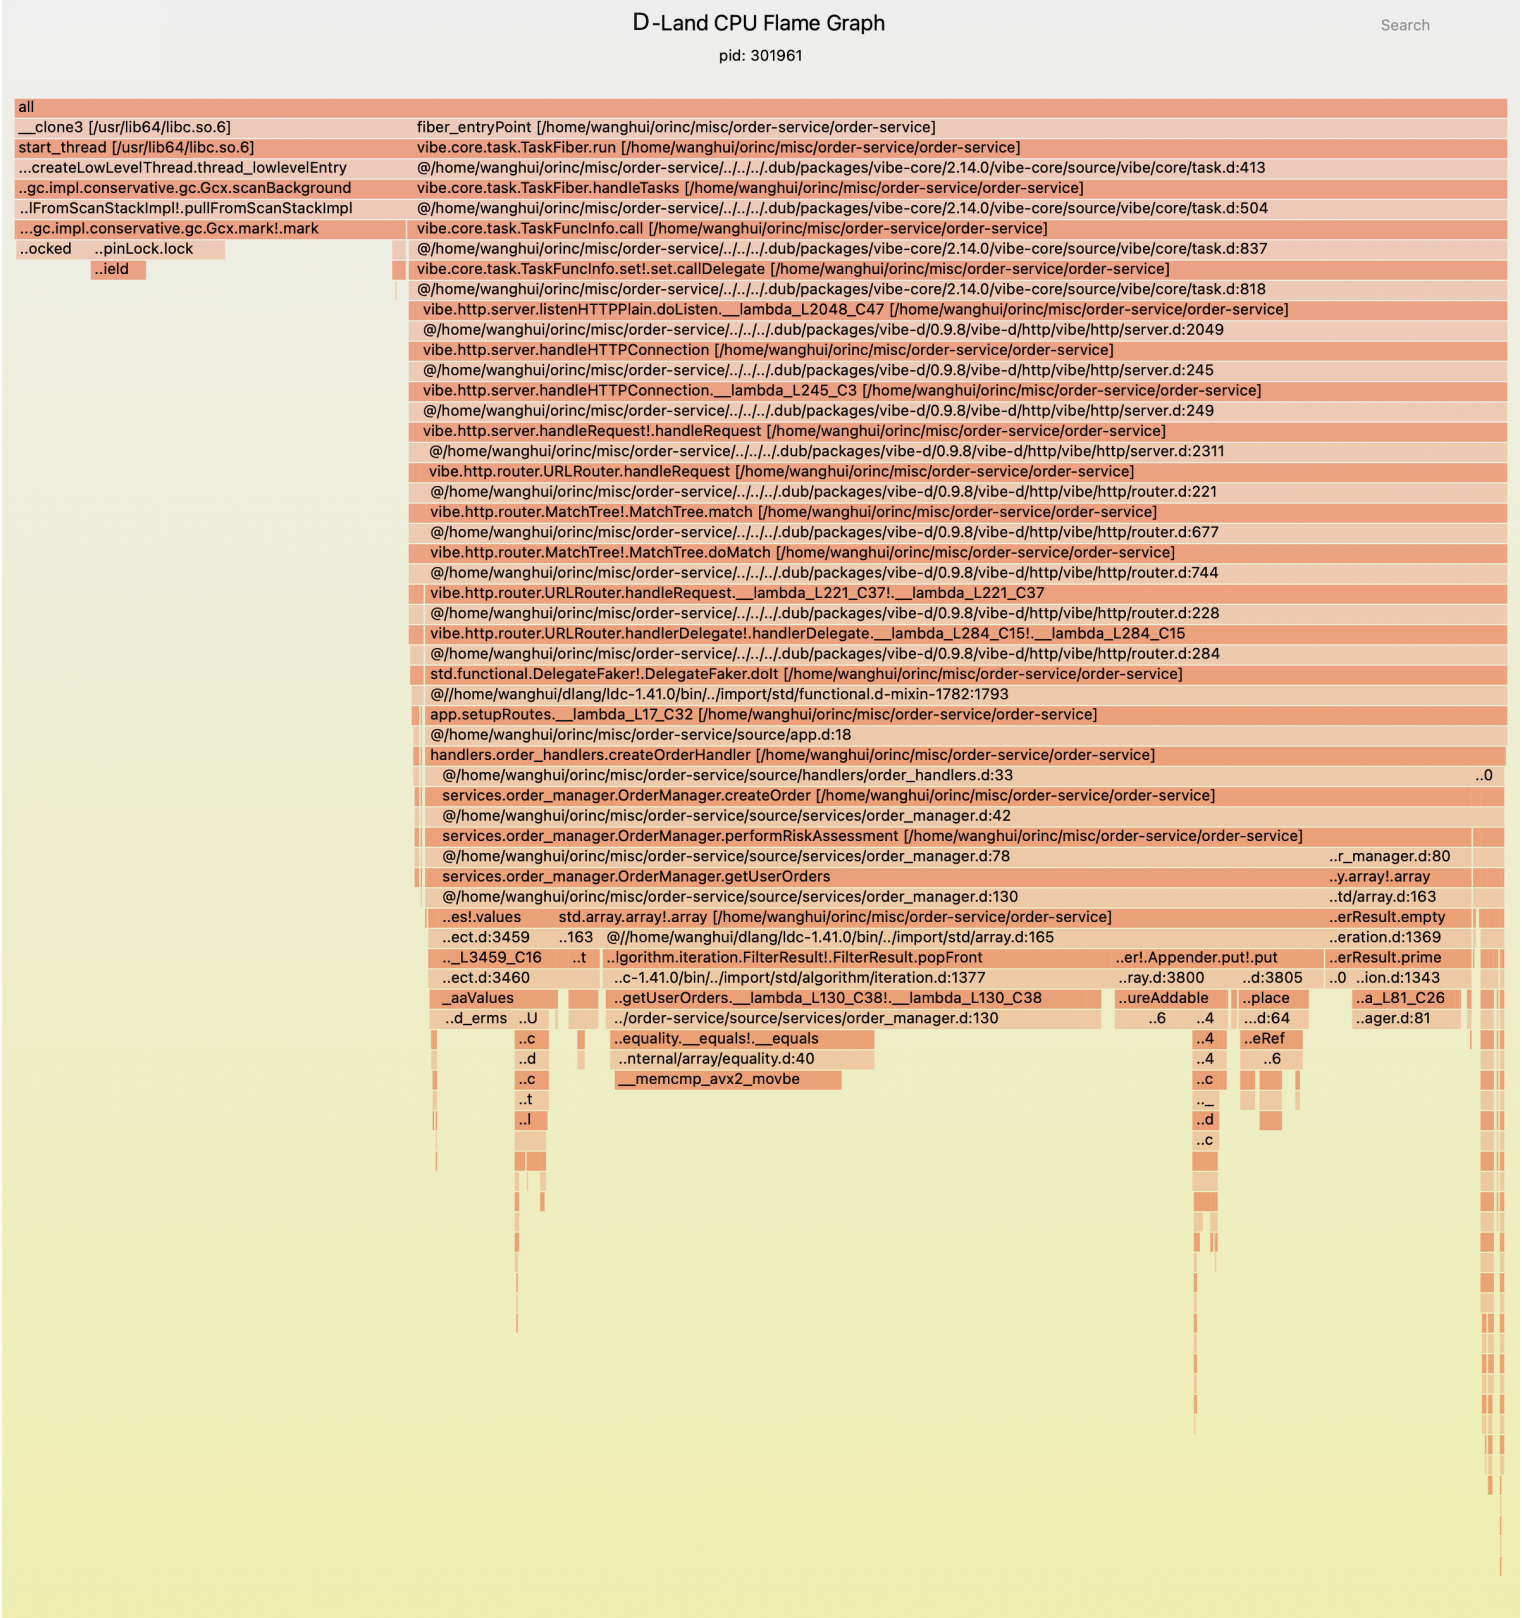
- Business Logic Call Stack (related to
OrderManager): ~73% - GC Call Stack (related to
Gcx.scanBackground): ~26%
The Intuition Trap: Most engineers would instinctively focus on the 73% consumed by business logic, assuming that if they optimize the application code, the GC performance will naturally improve.
Why This Intuition Is Wrong:
GC pauses extend the sampling window for business code. When the garbage collector scans memory, application threads are paused. If a GC cycle runs while business logic is executing, that logic gets “over-sampled”—not because the code itself is slow, but because the GC pause artificially lengthens its perceived execution time.
The key is to understand the GC’s behavior first. It’s a system-level process that affects the interpretation of all business hotspots. You can’t simply add the two percentages together, nor can you prioritize them based on their magnitude alone.
First Hotspot: GC at 26.4%—More Than Just a “Slow GC”
In the flame graph, the top of the GC call stack is core.internal.gc.impl.conservative.gc.Gcx.scanBackground. The keyword here is conservative.
D’s garbage collector is conservative, which differs from the precise GCs found in the JVM or Go:
- Precise GC: Knows exactly which values in memory are pointers and which are simple integers, allowing it to reclaim memory with certainty.
- Conservative GC: Cannot distinguish between a true pointer and an integer that happens to have a value resembling a memory address. When faced with this ambiguity, it must be “conservative” and assume it’s a pointer, leaving the memory it seemingly points to untouched.
Example:
// A timestamp or ID whose value in memory might look like a valid pointer address.
ulong id = 0x7f8a4c001234;

// A conservative GC might see this value and mistake it for a pointer
// to address 0x7f8a4c001234, preventing the memory at that location
// (if any) from being reclaimed.
In scenarios with high-frequency allocations, this creates a dangerous positive feedback loop: Frequent allocation of temporary objects → More “pseudo-pointers” are created → More memory is prevented from timely reclamation → The heap grows larger → The next GC scan takes longer → Positive feedback loop
In JVM, increasing the heap size can reduce the frequency of Young GCs, but at the cost of longer individual Full GC pauses—this itself is a tuning decision that requires a trade-off. In contrast, under D’s conservative mark-and-sweep GC, the situation is worse: the GC cannot accurately identify pointers and must scan the entire heap exhaustively. The larger the heap, the longer the scan time, and the pause time is almost linearly related to the heap size.
Under vibe.d’s fiber model, each concurrent request generates a large number of heap allocations (e.g., request closures, dynamic buffers, string concatenations). These objects steadily accumulate, not only increasing the GC scanning overhead but also making GC trigger times less predictable. The “enlarging the heap” optimization strategy, which is already debatable in JVM, is almost counterproductive in D.
The optimization direction: Reduce the GC’s workload, don’t try to optimize the GC itself.
| Priority | Method | Use Case | Example |
|---|---|---|---|
| High | Annotate hot paths with @nogc | For critical functions that can be written to avoid heap allocations entirely. | @nogc void processOrderFast(...) |
| Medium | Use object pools | For short-lived, frequently allocated objects. | auto order = orderPool.acquire(); |
| Low | Pre-allocate buffers | For I/O or serialization where the output size is predictable. | appender.reserve(4096); |
Largest Hotspot: getUserOrders at 59.4%, with the Root Cause in the Data Structure
The flame graph shows services.order_manager.OrderManager.getUserOrders is the single largest performance hotspot, consuming 59.4% of all CPU time.
At first glance, the function name suggests a slow order query. But how should it be optimized? To find out, we must drill down into the call stack.
getUserOrders (59.4%)
  └─ std.algorithm.iteration.FilterResult   ← Array filtering
       └─ __memcmp_avx2_movbe (15.2%)       ← Memory comparison instruction
This clarifies the root cause:
getUserOrdersperformed an O(n) linear scan by iterating through the entire list of orders.- For each order, it performed a string comparison (
__memcmp_avx2_movbe) on theuserIdfield. - It then copied the matching orders into a new result array.
This kind of issue is nearly impossible to spot during a code review because the function body is simple and the logic is straightforward. The O(n) cost only becomes a major problem under a high-concurrency production load, where a large n (total orders) magnifies the CPU cost to a staggering 59.4%.
The Solution: Trade Space for Time by Building an Index
// Before: O(n) linear scan that iterates through all orders on every query.
auto getUserOrders(string userId) {
    return allOrders.filter!(o => o.userId == userId).array;
}

// After: O(1) hash lookup.
private Order[][string] userOrdersIndex;

auto getUserOrders(string userId) {
    if (auto orders = userId in userOrdersIndex) {
        return *orders; // Directly return the pre-built list of orders.
    }
    return [];
}
Trade-off Analysis:
- Benefit: The query complexity drops from O(n) to O(1). We expect this to reduce the hotspot’s CPU consumption from 59.4% to under 5%.
- Cost:
- Memory Overhead: Additional memory is required to store and maintain the
userOrdersIndex. - Write Synchronization: The index must be updated in sync with every order creation and modification.
- Memory Overhead: Additional memory is required to store and maintain the
- Applicability: For read-heavy workloads like this one (with a read-to-write ratio of ~100:1), this trade-off is almost always worthwhile.
Production Implementation Notes:
- Ensure concurrent write safety for the index, likely by using locks or D’s
sharedtype. - Implement logic to synchronize the index when an order’s status changes.
- Plan a cold-start strategy for populating the index when the service restarts.
Other Hotspots: 14.2% from Appender and ~8% from JSON
std.array.Appender: An Overlooked Memory Allocation Amplifier
The flame graph shows that calls related to std.array.Appender account for 14.2% of the profile. However, its true impact extends far beyond its own execution time.
Key Insight: While Appender and GC appear as two separate hotspots on the flame graph, they are in fact different manifestations of the same underlying issue.
Cause-and-Effect Chain:
Frequent appends of small data chunks using Appender
  ↓
Capacity becomes insufficient, triggering dynamic resizing
  ↓
A new, larger memory block is allocated, and old data is copied over
  ↓
The old memory block becomes garbage awaiting collection
  ↓
GC scanning and collection pressure increases (contributing to the 26.4% hotspot)
Optimization Path: For scenarios where the data size is predictable, pre-allocate capacity by calling reserve() to eliminate dynamic resizing at runtime.
JSON Serialization: A Scattered ~8% Cost
The overhead from JSON processing is scattered across multiple functions, such as parseJson and serializeToJson, adding up to approximately 8% of the total cost. Because this cost is distributed, it doesn’t form a single, prominent hotspot on the flame graph, making it easy to overlook. However, its cumulative impact is significant. When optimization resources are limited, this issue should be addressed after resolving higher-priority bottlenecks.
Optimization Roadmap: Why Sequence Is More Important Than Action
Once all hotspots are identified, the critical question is: which one do we optimize first? Following the wrong sequence isn’t just inefficient; it can lead to earlier optimizations being negated by subsequent changes.
| Priority | Hotspot | CPU Share | Rationale |
|---|---|---|---|
| High | GC + getUserOrders | 26.4% + 59.4% | These two are causally linked and must be optimized together to achieve an order-of-magnitude improvement. |
| Medium | Appender | 14.2% | Its true performance impact can only be assessed by resampling after the GC is optimized. |
| Low | JSON Serialization | ~8% | The potential performance gain is limited, and the engineering cost to implement an alternative is high. |
Resampling is mandatory after each optimization.
A flame graph is a snapshot of a system under a specific load. Any optimization will alter the system’s hotspot distribution. A common mistake is to plan all subsequent steps based on the initial flame graph. For instance, once GC pressure is reduced, the sampling percentage for Appender—previously inflated by GC pauses—will decrease, allowing for an accurate assessment of its true performance cost.
Through the analysis and optimizations described, we achieved the following significant performance improvements:
| Metric | Before | After | Improvement |
|---|---|---|---|
| P99 Response Time | 350ms | 95ms | ↓ 73% |
| GC CPU Share | 26.4% | 6.2% | ↓ 76% |
| getUserOrders CPU Share | 59.4% | 3.1% | ↓ 95% |
| Appender CPU Share | 14.2% | 4.8% | ↓ 66% |
Conclusion: From Code Logic to Runtime Reality
Reflecting on this case, the most valuable lesson isn’t the O(n) algorithmic mistake itself, but rather the answer to this question: Why did the problem remain hidden for months, even with thorough code reviews and comprehensive monitoring in place?
This uncovers a core blind spot in modern software engineering: static code quality is not equivalent to dynamic runtime performance.
The logic of getUserOrders was perfectly valid in unit tests and under low load. Even the high-level metrics on standard monitoring dashboards masked the microscopic performance jitters. However, under the pressure of real-world traffic, a quantitative shift in data volume coupled with the D language’s GC mechanism to trigger a qualitative performance degradation. Complex issues like this, arising from the interaction of code, data, and the runtime environment, are beyond the reach of static analysis and traditional, instrumentation-based monitoring.
In this case, OpenResty XRay demonstrated two key technical values:
- Non-intrusive, End-to-End Visibility: It eliminates the need for developers to add manual instrumentation (which is often based on subjective assumptions) and requires no code changes or service restarts. It dynamically traces running processes directly in the production environment, revealing the code’s microsecond-level execution path under real-world load.
- Providing “Certainty” for Optimization: The highest cost in performance troubleshooting is often the trial-and-error resulting from pursuing the wrong optimization path. In this case, without the precise data from the flame graph, the team could have easily fallen into the common trap of blindly increasing heap memory. Given the D language’s conservative GC, this would have been counterproductive. OpenResty XRay transforms a vague P99 jitter metric into precise, function-level latencies and GC CPU share, enabling technical decisions to be driven by data, not guesswork.
Performance optimization is fundamentally about reallocating system resources. OpenResty XRay cuts through the surface of business logic to observe the underlying runtime behavior directly. For today’s increasingly complex distributed systems, this enables engineering teams to establish an evidence-based performance governance capability.
What is OpenResty XRay
OpenResty XRay is a dynamic-tracing product that automatically analyzes your running applications to troubleshoot performance problems, behavioral issues, and security vulnerabilities with actionable suggestions. Under the hood, OpenResty XRay is powered by our Y language targeting various runtimes like Stap+, eBPF+, GDB, and ODB, depending on the contexts.
If you like this tutorial, please subscribe to this blog site and/or our YouTube channel. Thank you!
About The Author
Yichun Zhang (Github handle: agentzh), is the original creator of the OpenResty® open-source project and the CEO of OpenResty Inc..
Yichun is one of the earliest advocates and leaders of “open-source technology”. He worked at many internationally renowned tech companies, such as Cloudflare, Yahoo!. He is a pioneer of “edge computing”, “dynamic tracing” and “machine coding”, with over 22 years of programming and 16 years of open source experience. Yichun is well-known in the open-source space as the project leader of OpenResty®, adopted by more than 40 million global website domains.
OpenResty Inc., the enterprise software start-up founded by Yichun in 2017, has customers from some of the biggest companies in the world. Its flagship product, OpenResty XRay, is a non-invasive profiling and troubleshooting tool that significantly enhances and utilizes dynamic tracing technology. And its OpenResty Edge product is a powerful distributed traffic management and private CDN software product.
As an avid open-source contributor, Yichun has contributed more than a million lines of code to numerous open-source projects, including Linux kernel, Nginx, LuaJIT, GDB, SystemTap, LLVM, Perl, etc. He has also authored more than 60 open-source software libraries.
Related Articles
OpenResty XRay Oct 10, 2024

OpenResty XRay Jul 3, 2026
OpenResty XRay Jun 30, 2026
OpenResty XRay Jun 5, 2026
OpenResty XRay May 25, 2026


