Performance Breakthrough: 60% DNS Optimization Success with OpenResty XRay
In this era of the Internet of Everything, the stability of DNS services is directly linked to the survival of businesses. However, when systems encounter complex performance issues such as uneven CPU usage and soaring response delays, traditional monitoring methods often only scratch the surface and fail to delve into the code level to find the true “culprit.”
Today, we will explore a real customer case where, when the DNS service faced performance bottlenecks and traditional monitoring was at a loss, we used OpenResty XRay to accurately pinpoint the root cause within minutes and achieve over a 60% performance improvement.
When the “Lifeline” DNS Service Faces a Performance Crisis
The DNS service system operated by our client is experiencing a severe imbalance in CPU usage. Some Nginx worker processes have excessively high CPU utilization, while others remain relatively idle. Additionally, the overall system response latency has increased, particularly under high load conditions. This imbalance not only affects the stability of the service but also leads to inefficient resource utilization, thereby increasing operational costs.
Traditional performance analysis methods have struggled to pinpoint the root cause precisely, as the issue involves complex interactions across multiple layers. In this situation, the client requested support from the OpenResty XRay team. We immediately conducted a comprehensive performance analysis of the system using OpenResty XRay.
How to Investigate the Culprit Step by Step with OpenResty XRay
Using the OpenResty XRay analyzer, we conducted an in-depth analysis of the target system and identified the following key issues:
1. Uneven CPU Usage Distribution
First, we checked the Nginx configuration status:
use_accept_mutex: 0
listening on: 0.0.0.0:8090, reuseport: 0
listening on: 0.0.0.0:3581, reuseport: 0
listening on: 0.0.0.0:8081, reuseport: 0
listening on: 0.0.0.0:8088, reuseport: 0
listening on: 0.0.0.0:11080, reuseport: 0
listening on: 0.0.0.0:8080, reuseport: 0
listening on: 0.0.0.0:9000, reuseport: 0
listening on: 0.0.0.0:9090, reuseport: 0
listening on: 0.0.0.0:1935, reuseport: 0
listening on: 0.0.0.0:80, reuseport: 0
We found that none of the listening ports had the reuseport option enabled, leading to uneven request distribution.
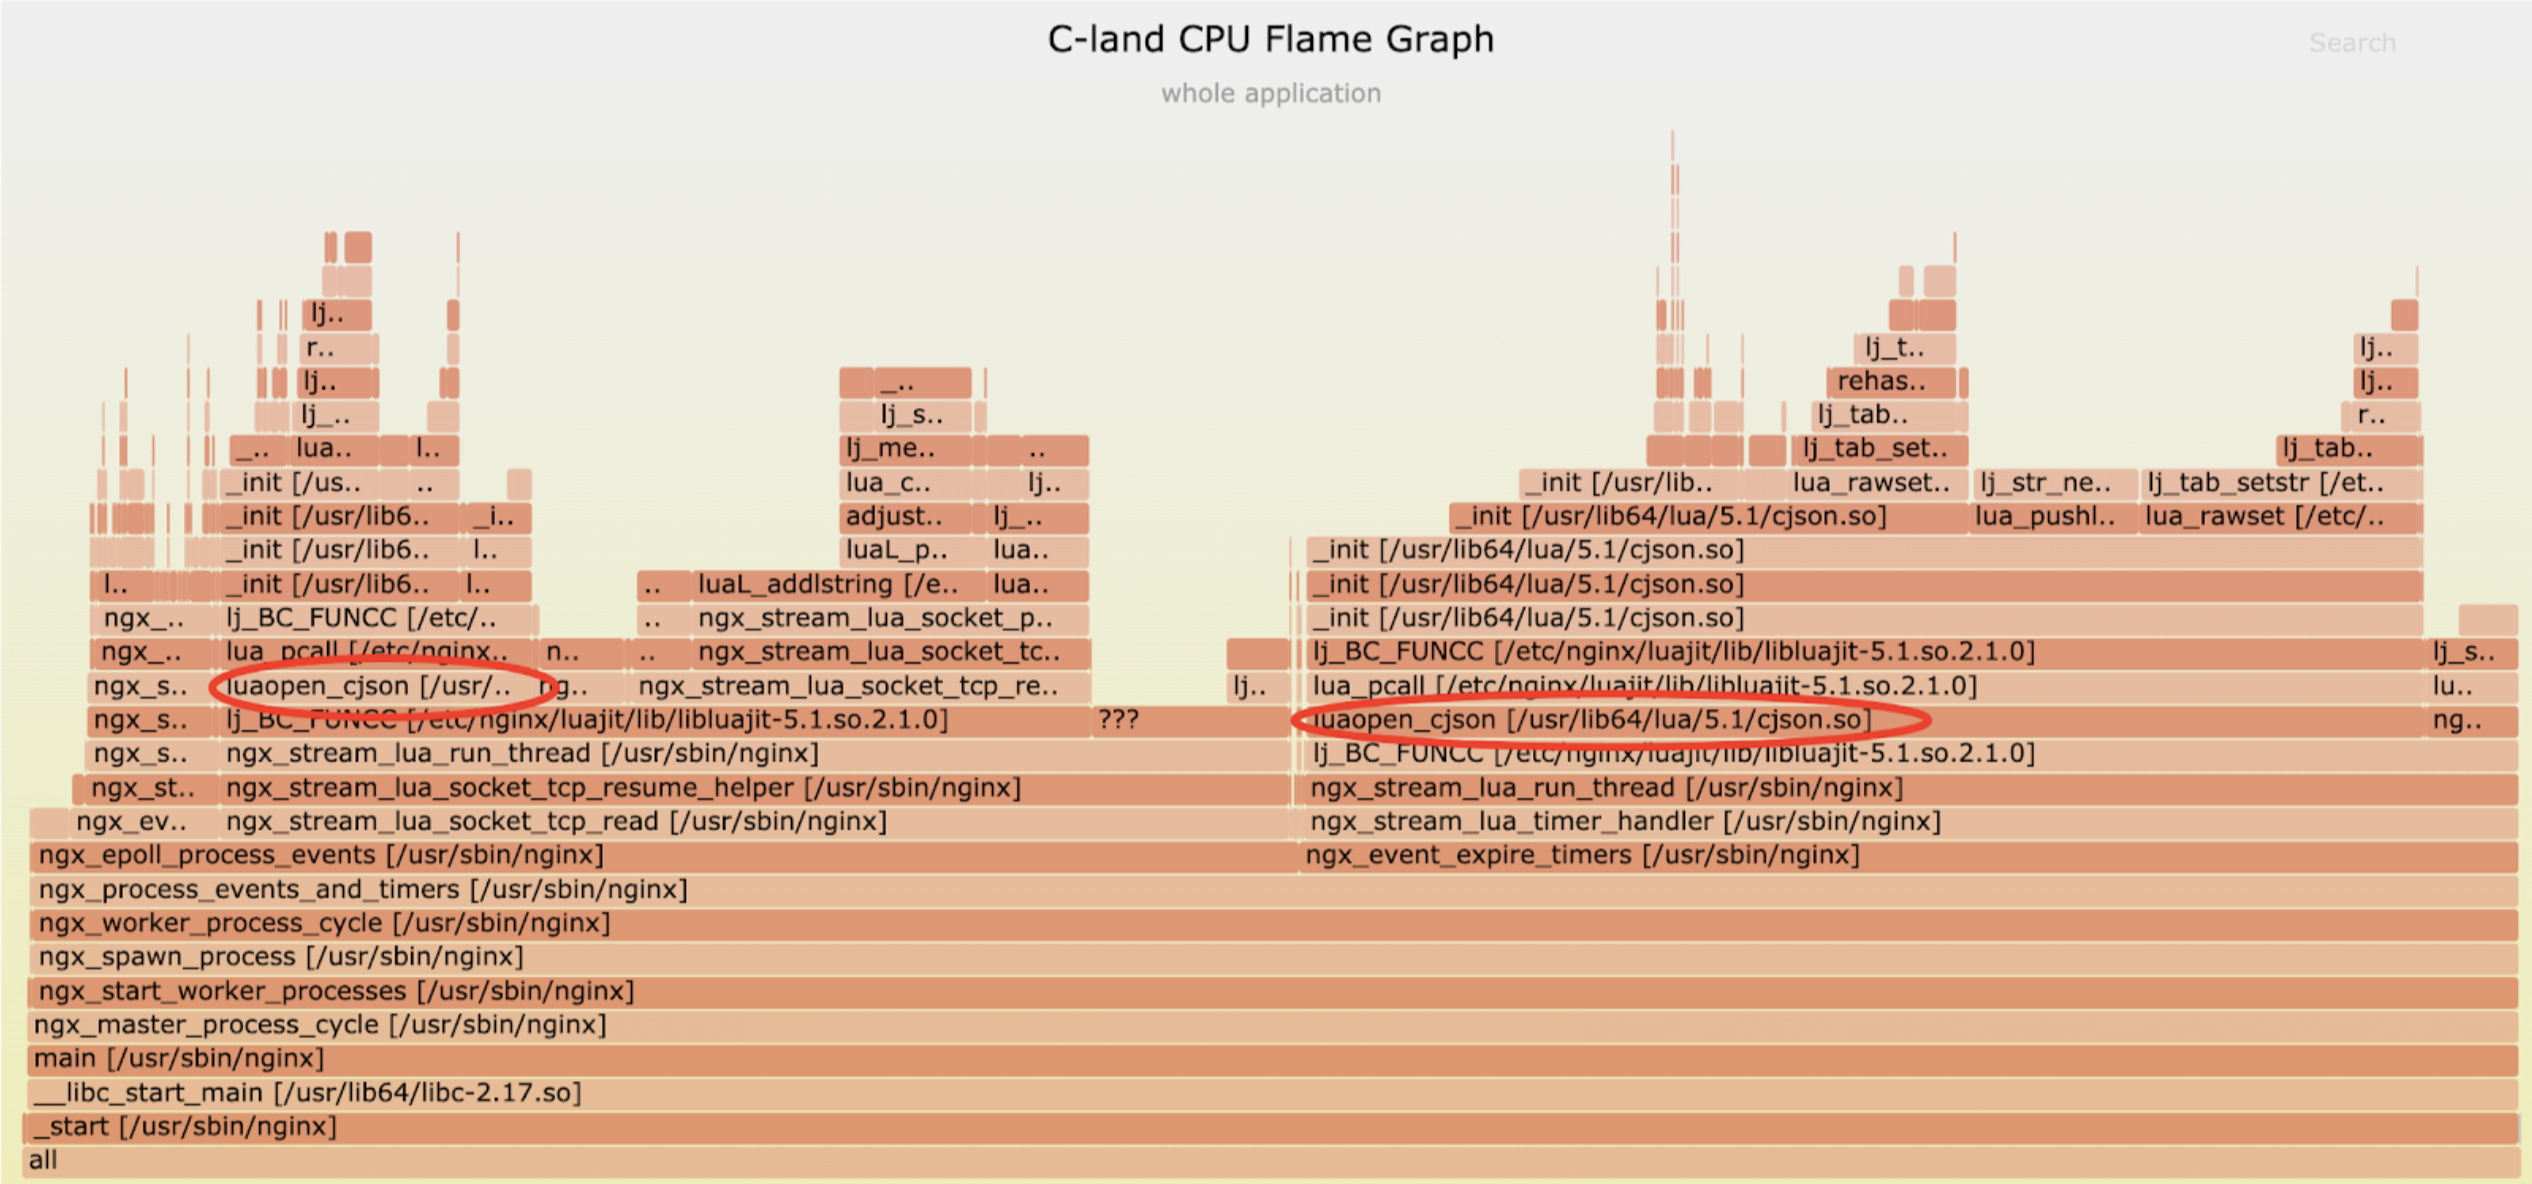
2. The Truth Behind 60% CPU Being “Stolen”
Through C flame graph analysis, we discovered that approximately 60% of CPU time was consumed by the cjson module.
From the Lua flame graph, about 60% of the time was spent on cjson_decode operations, around 30% on shcache.lua:load, and only about 5% on the core business logic in dns_server.lua.
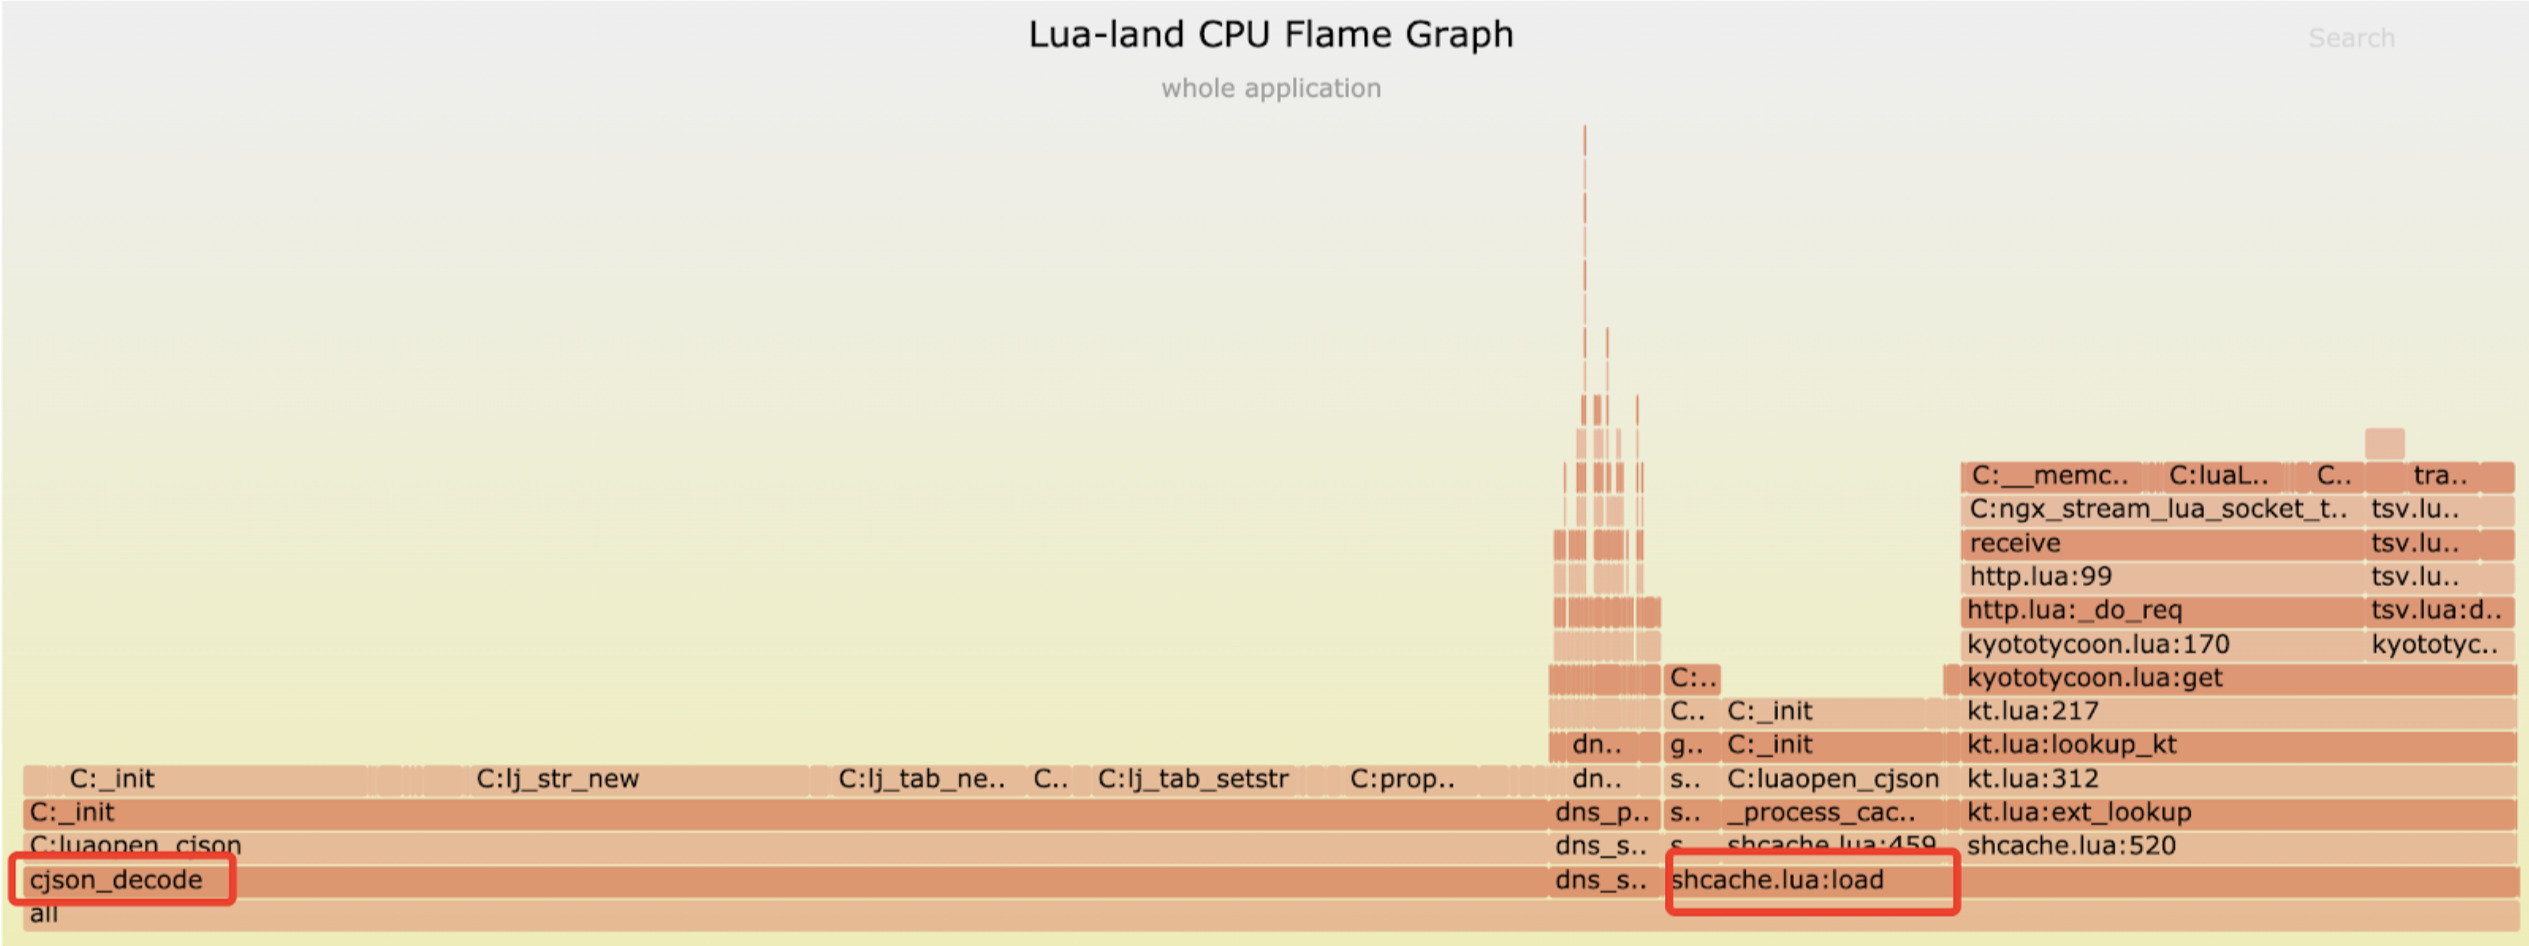
This indicates that JSON parsing has become the absolute performance bottleneck.
3. Cosocket Performance Issues
Another significant CPU consumption point was the cosocket receive operation, which took up about 16% of CPU time:
ngx_stream_lua_socket_tcp_receive
  -> ngx_stream_lua_socket_tcp_receive_retval_handler
  -> ngx_stream_lua_socket_push_input_data
  -> luaL_addlstring [/etc/nginx/luajit/lib/libluajit-5.1.so.2.1.0]
Analysis showed that the customer was using an older version of LuaJIT, while the latest version has optimized this issue.
Precision “Treatment”: Three Steps to Rebirth
Based on the in-depth analysis results from OpenResty XRay, our technical team has developed a targeted optimization plan for our clients:
1. Load Balancing Optimization
By fine-tuning the configuration, we resolved the issue of uneven load distribution among worker processes, significantly improving system resource utilization efficiency and enhancing overall performance by 20-30%.
2. Core Performance Bottleneck Resolution
For the identified JSON processing performance bottleneck, we provided a multi-layered optimization strategy:
- Reconstructed data processing workflows to reduce unnecessary computational overhead
- Designed an intelligent caching mechanism to significantly lower the cost of repetitive operations
- Optimized configuration management to enhance system response efficiency
Through these optimizations, CPU consumption for the core bottleneck was reduced by over 60%, and system throughput saw a significant increase.
3. Runtime Environment Optimization
Based on version compatibility analysis, we planned a technology stack upgrade path for our clients, further optimizing the performance of underlying components and achieving an additional 5-10% performance improvement.
This case demonstrates the powerful capabilities of OpenResty XRay in diagnosing complex performance issues, accurately pinpointing performance bottlenecks down to the code level, and providing clear directions for optimization.
Summary: What We Achieved in Just a Few Minutes
- Quickly and accurately identified all performance bottlenecks
- Discovered issues at the code level that traditional monitoring tools cannot detect
- Reduced core CPU usage by over 60%, improving overall system performance by 20% to 30%
- Identified that
JSONparsing was consuming up to 60% of CPU resources, directly addressing the performance bottleneck - Found severe imbalances in
workerconfiguration, leading to highly inefficient load distribution - Detected outdated components dragging down overall performance, allowing for timely upgrades and adjustments
- Significantly improved operational efficiency, saving clients considerable manpower and cost
- Utilized flame graph visualization throughout the process, making performance issues clear and optimization directions quantifiable
In today’s era of complex system architectures and high-concurrency business environments, performance issues are often not just surface phenomena. Traditional monitoring tools struggle to identify the true root causes. OpenResty XRay, as an industry-leading dynamic tracing platform, helps technical teams quickly delve into the core of problems and formulate precise, actionable optimization plans.
If you also want your system to run more stably, faster, and more cost-effectively, or if you wish to experience a deep performance optimization in advance, we invite you to apply for a product trial. Let OpenResty XRay become the most trusted tool in your team’s arsenal.
What is OpenResty XRay
OpenResty XRay is a dynamic-tracing product that automatically analyzes your running applications to troubleshoot performance problems, behavioral issues, and security vulnerabilities with actionable suggestions. Under the hood, OpenResty XRay is powered by our Y language targeting various runtimes like Stap+, eBPF+, GDB, and ODB, depending on the contexts.
If you like this tutorial, please subscribe to this blog site and/or our YouTube channel. Thank you!
About The Author
Yichun Zhang (Github handle: agentzh), is the original creator of the OpenResty® open-source project and the CEO of OpenResty Inc..
Yichun is one of the earliest advocates and leaders of “open-source technology”. He worked at many internationally renowned tech companies, such as Cloudflare, Yahoo!. He is a pioneer of “edge computing”, “dynamic tracing” and “machine coding”, with over 22 years of programming and 16 years of open source experience. Yichun is well-known in the open-source space as the project leader of OpenResty®, adopted by more than 40 million global website domains.
OpenResty Inc., the enterprise software start-up founded by Yichun in 2017, has customers from some of the biggest companies in the world. Its flagship product, OpenResty XRay, is a non-invasive profiling and troubleshooting tool that significantly enhances and utilizes dynamic tracing technology. And its OpenResty Edge product is a powerful distributed traffic management and private CDN software product.
As an avid open-source contributor, Yichun has contributed more than a million lines of code to numerous open-source projects, including Linux kernel, Nginx, LuaJIT, GDB, SystemTap, LLVM, Perl, etc. He has also authored more than 60 open-source software libraries.
Related Articles
OpenResty XRay Dec 23, 2025

OpenResty XRay Nov 10, 2025

OpenResty XRay Oct 27, 2025

OpenResty XRay Sep 12, 2025

OpenResty XRay Sep 1, 2025


