Pinpointing leaked Lua tables with OpenResty XRay's command-line tools
Lua is a lightweight, concise, and extensible scripting language. It has a relatively simple C API and is easy to embed in applications. Many applications use Lua as their embedded scripting language to achieve configurability and extensibility. This includes our OpenResty.
In this post, we will demonstrate how to use the command-line utilities of OpenResty XRay to quickly pinpoint leaked Lua tables in a running OpenResty Lua application.
How LuaJIT manages memory
LuaJIT has a garbage collector (GC) that is part of its memory management. It is an incremental GC based on the mark-sweep algorithm that aims to release unused memory objects. It periodically collects all Lua GC objects that are not reachable from GC roots. GC roots are special objects that serve as starting points for the GC to trace and mark the live objects in the memory graph. In Lua, GC roots include the registry, global string tables, global variables, among other things. In other words, Lua GC objects that are not reachable from GC roots are processed by the GC. In Lua’s world, if a Lua GC object has direct or indirect references from GC roots, then it is in the “alive” state; otherwise, it is in the “dead” state. As GC works, this object will eventually be cleaned up and released. Lua participates in GC objects such as tables, functions, modules, threads (coroutines), strings, etc.
In LuaJIT, the following are considered “GC Objects”:
- string: Lua strings
- upvalue: Lua Upvalues
- thread: Lua threads (i.e., Lua coroutines)
- proto: Lua function prototypes
- function: Lua functions (Lua closures) and C functions
- cdata: cdata created by the FFI API in Lua.
- table: Lua tables
OpenResty XRay’s command-line tools
OpenResty XRay has a command line tool called orxray. If you haven’t installed it yet, you can follow the steps in the Installation section of the OpenResty XRay(tm) CLI User Manual.
When you face memory issues, OpenResty XRay has a set of integrated analysis solutions for you. In this article, we’ll show you how to analyze the scenario where OpenResty Nginx Worker uses a lot of memory because of creating too many Lua objects in Lua.
An leaking example
We’ll use a simple OpenResty Lua module to demonstrate how OpenResty Lua’s memory keeps growing, causing the Nginx Worker process to occupy a lot of memory. The source code of the demo.lua module we’ll use is as follows:
local _M = {}

local foo = {}

function _M.go(self)
    foo[#foo + 1] = "hello " .. #foo
end

return _M
The nginx.conf configuration file snippet is as follows.
location = /t {
    content_by_lua_block {
        local demo = require("demo")
        demo:go()
        ngx.say("ok")
    }
}
The module has a demo:go() method that increases the size of the foo table in the module every time it is invoked.
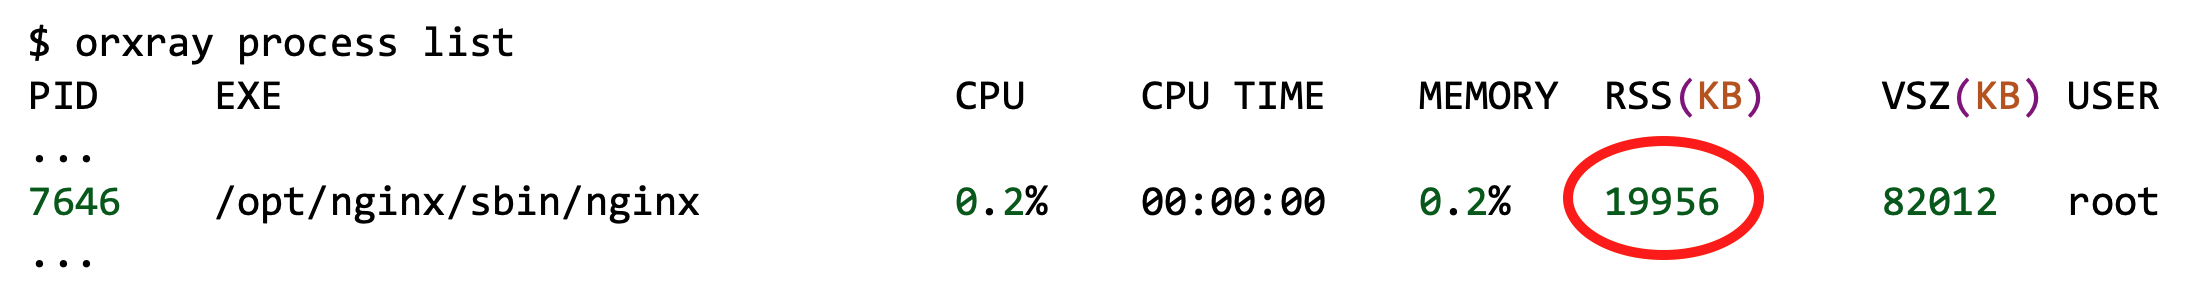
Process memory snapshot before benchmarking:
Process memory snapshot after benchmarking with wrk for 30 seconds:
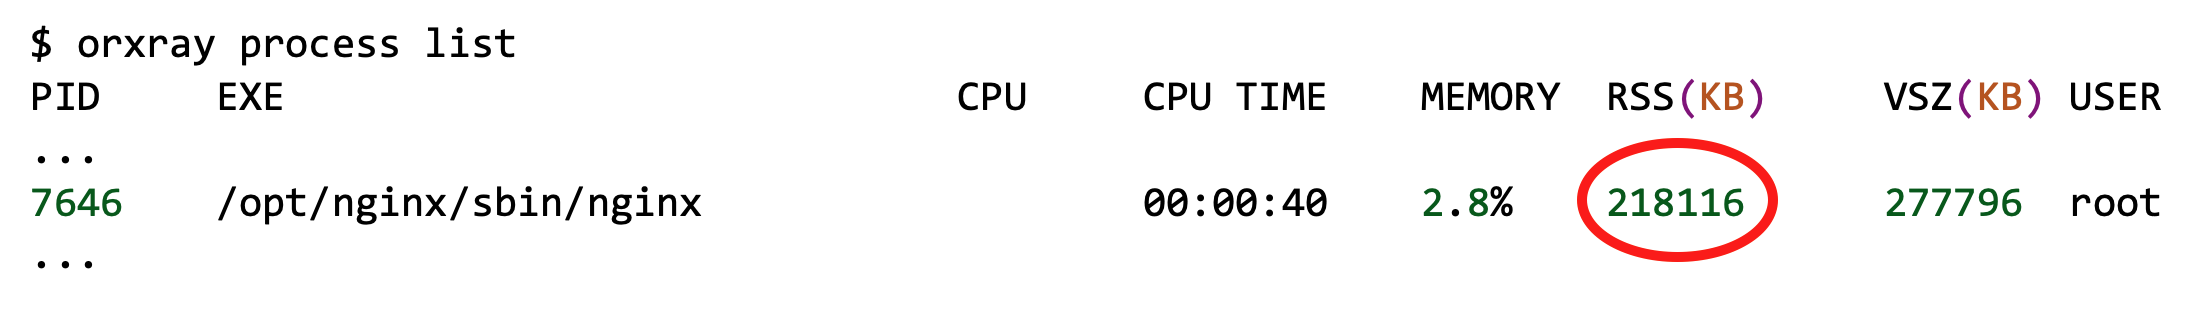
The Nginx worker process memory footprint increased to 213MB. To identify the cause of the high memory consumption, the OpenResty XRay command line tool was used to analyze the Nginx Worker process memory.
Analysis procedure
The resty-memory analyzer was run on the process with the following command (assuming the target process has the PID 7646):
$ orxray analyzer run resty-memory -p 7646
Goto https://8pu4z6.xray.openresty.com/targets/1355/history/4375500223 for charts
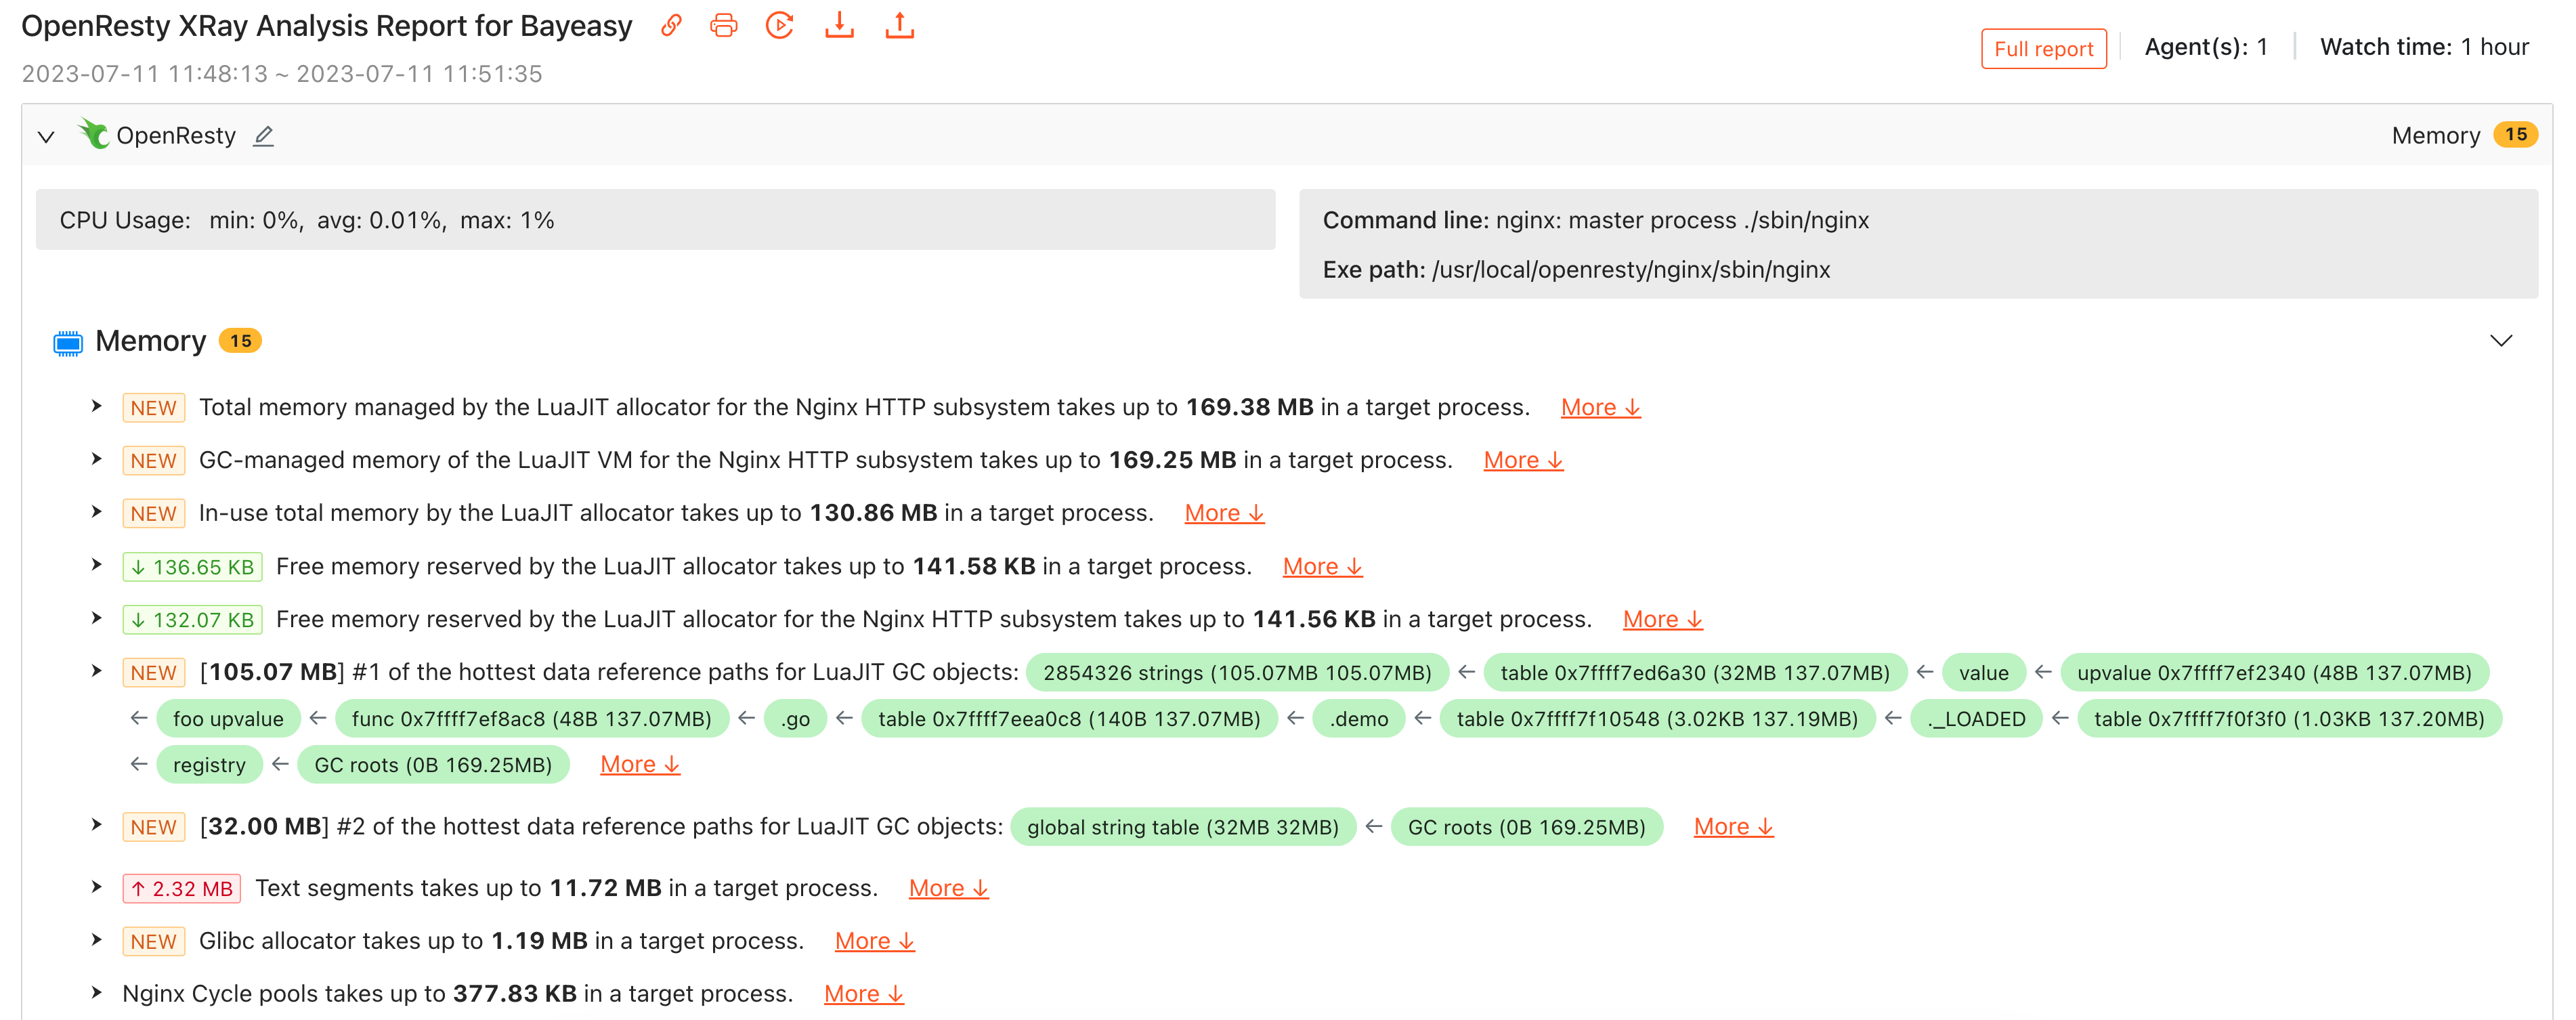
The URL output by the command was opened in a browser to view the analysis results.
The application memory usage breakdown showed that HTTP LuaJIT Allocator memory occupied 169.89MB (85.3%) of the total memory.
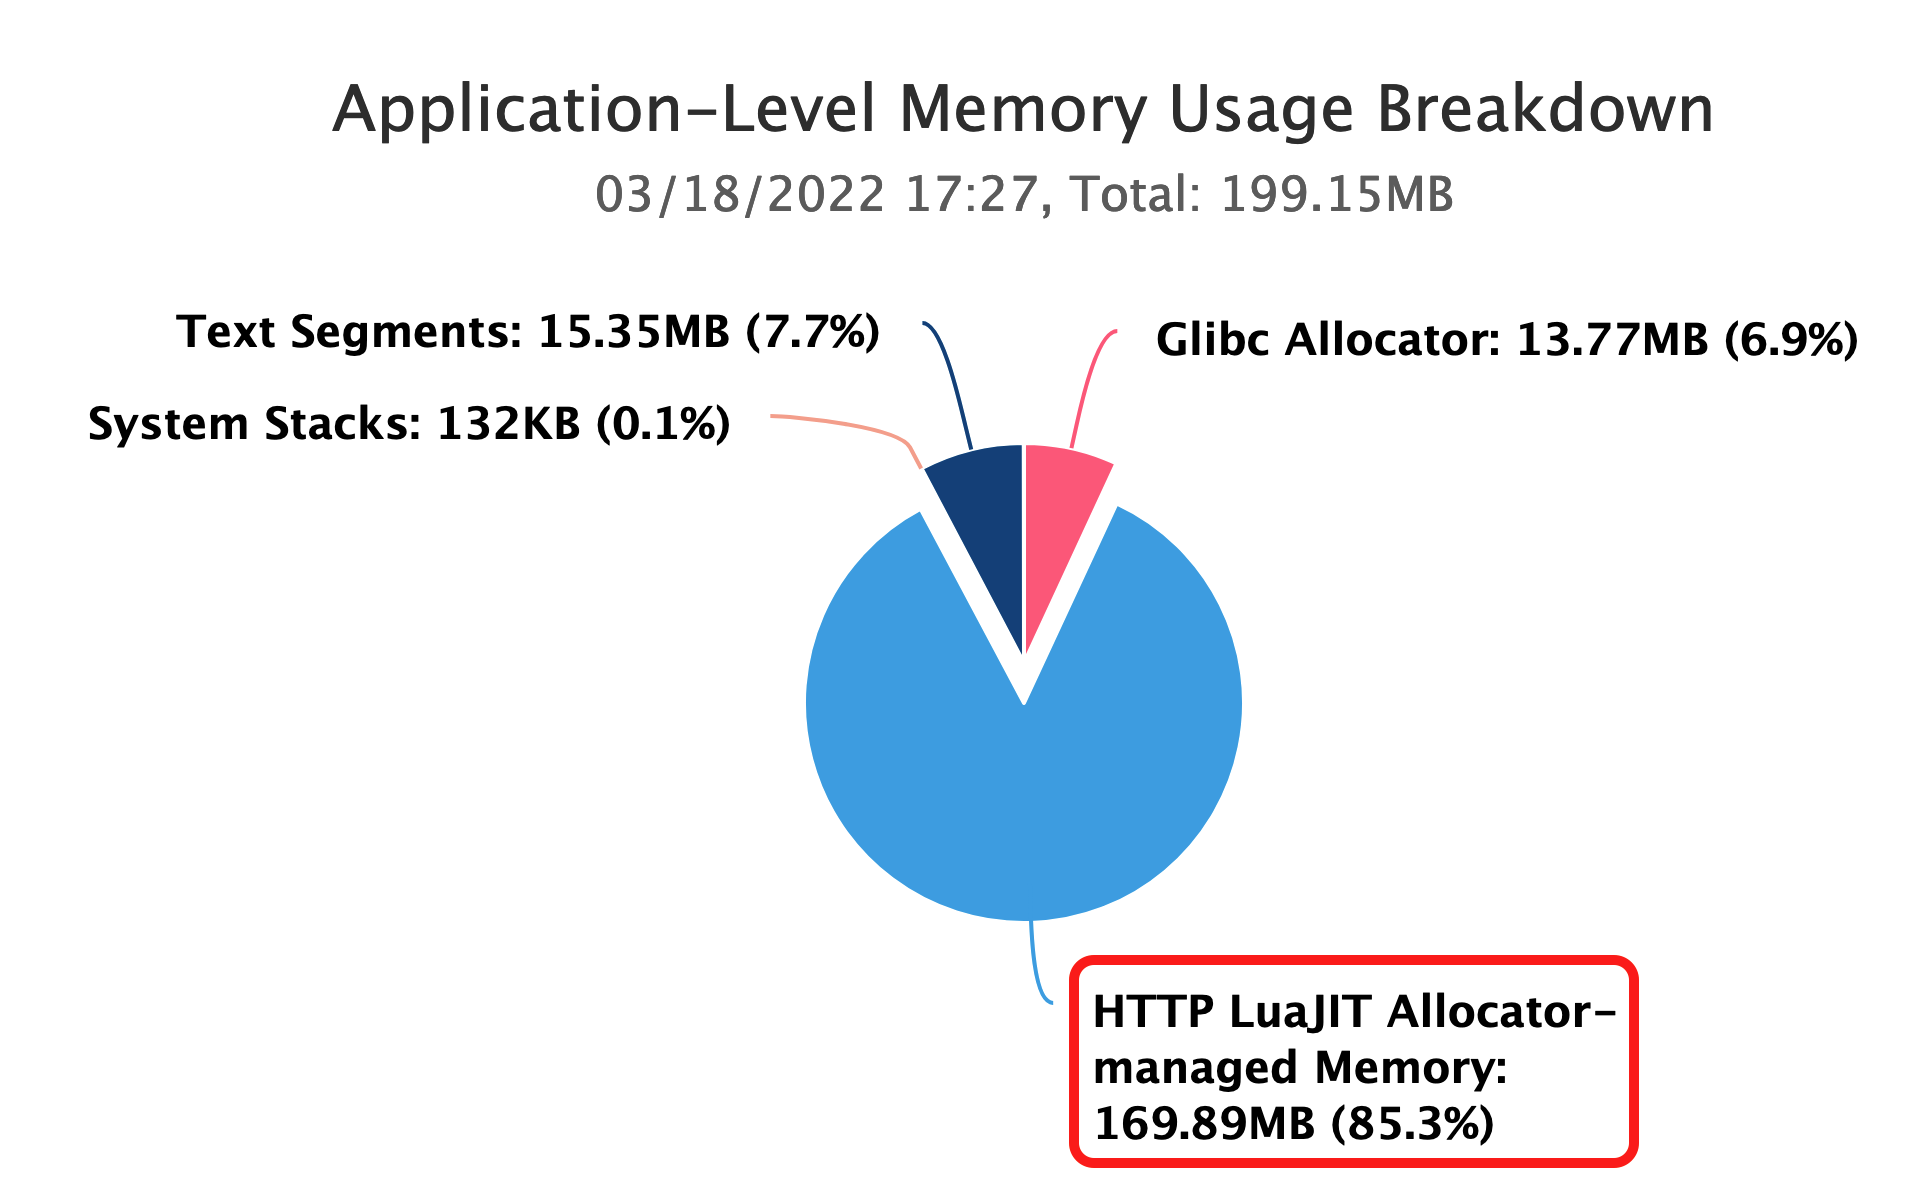
The “HTTP LuaJIT Allocator managed Memory” pie chart was clicked to reveal the following details:
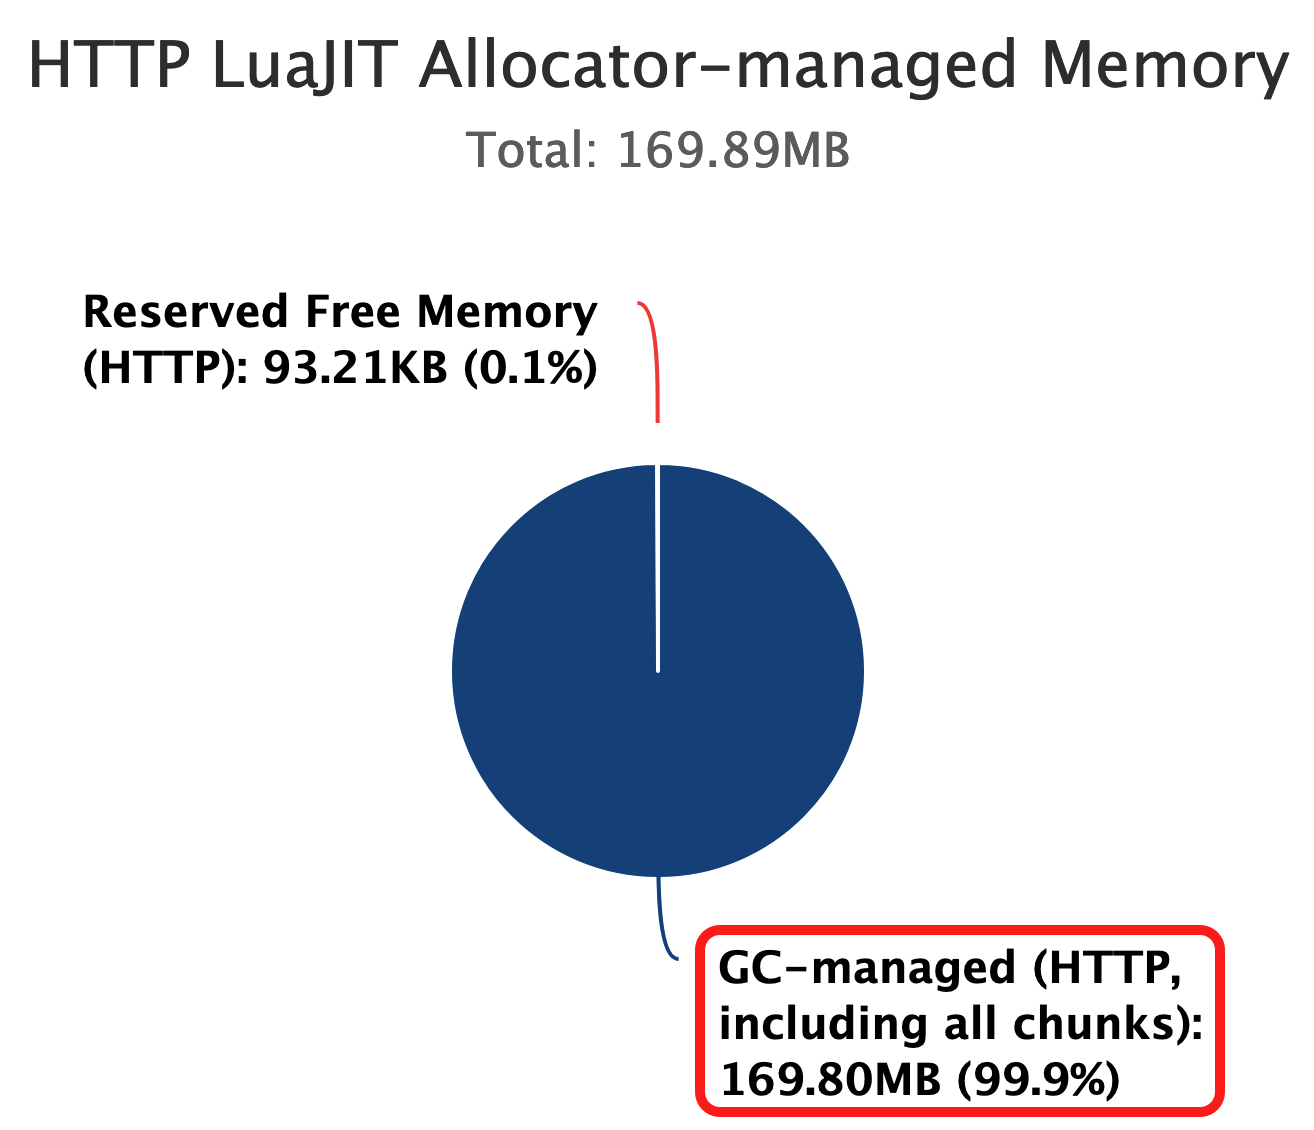
The “GC-managed (HTTP including all chunks)” segment accounted for 169.80MB of the memory. Further inspection showed the following distribution of LuaJIT GC objects:
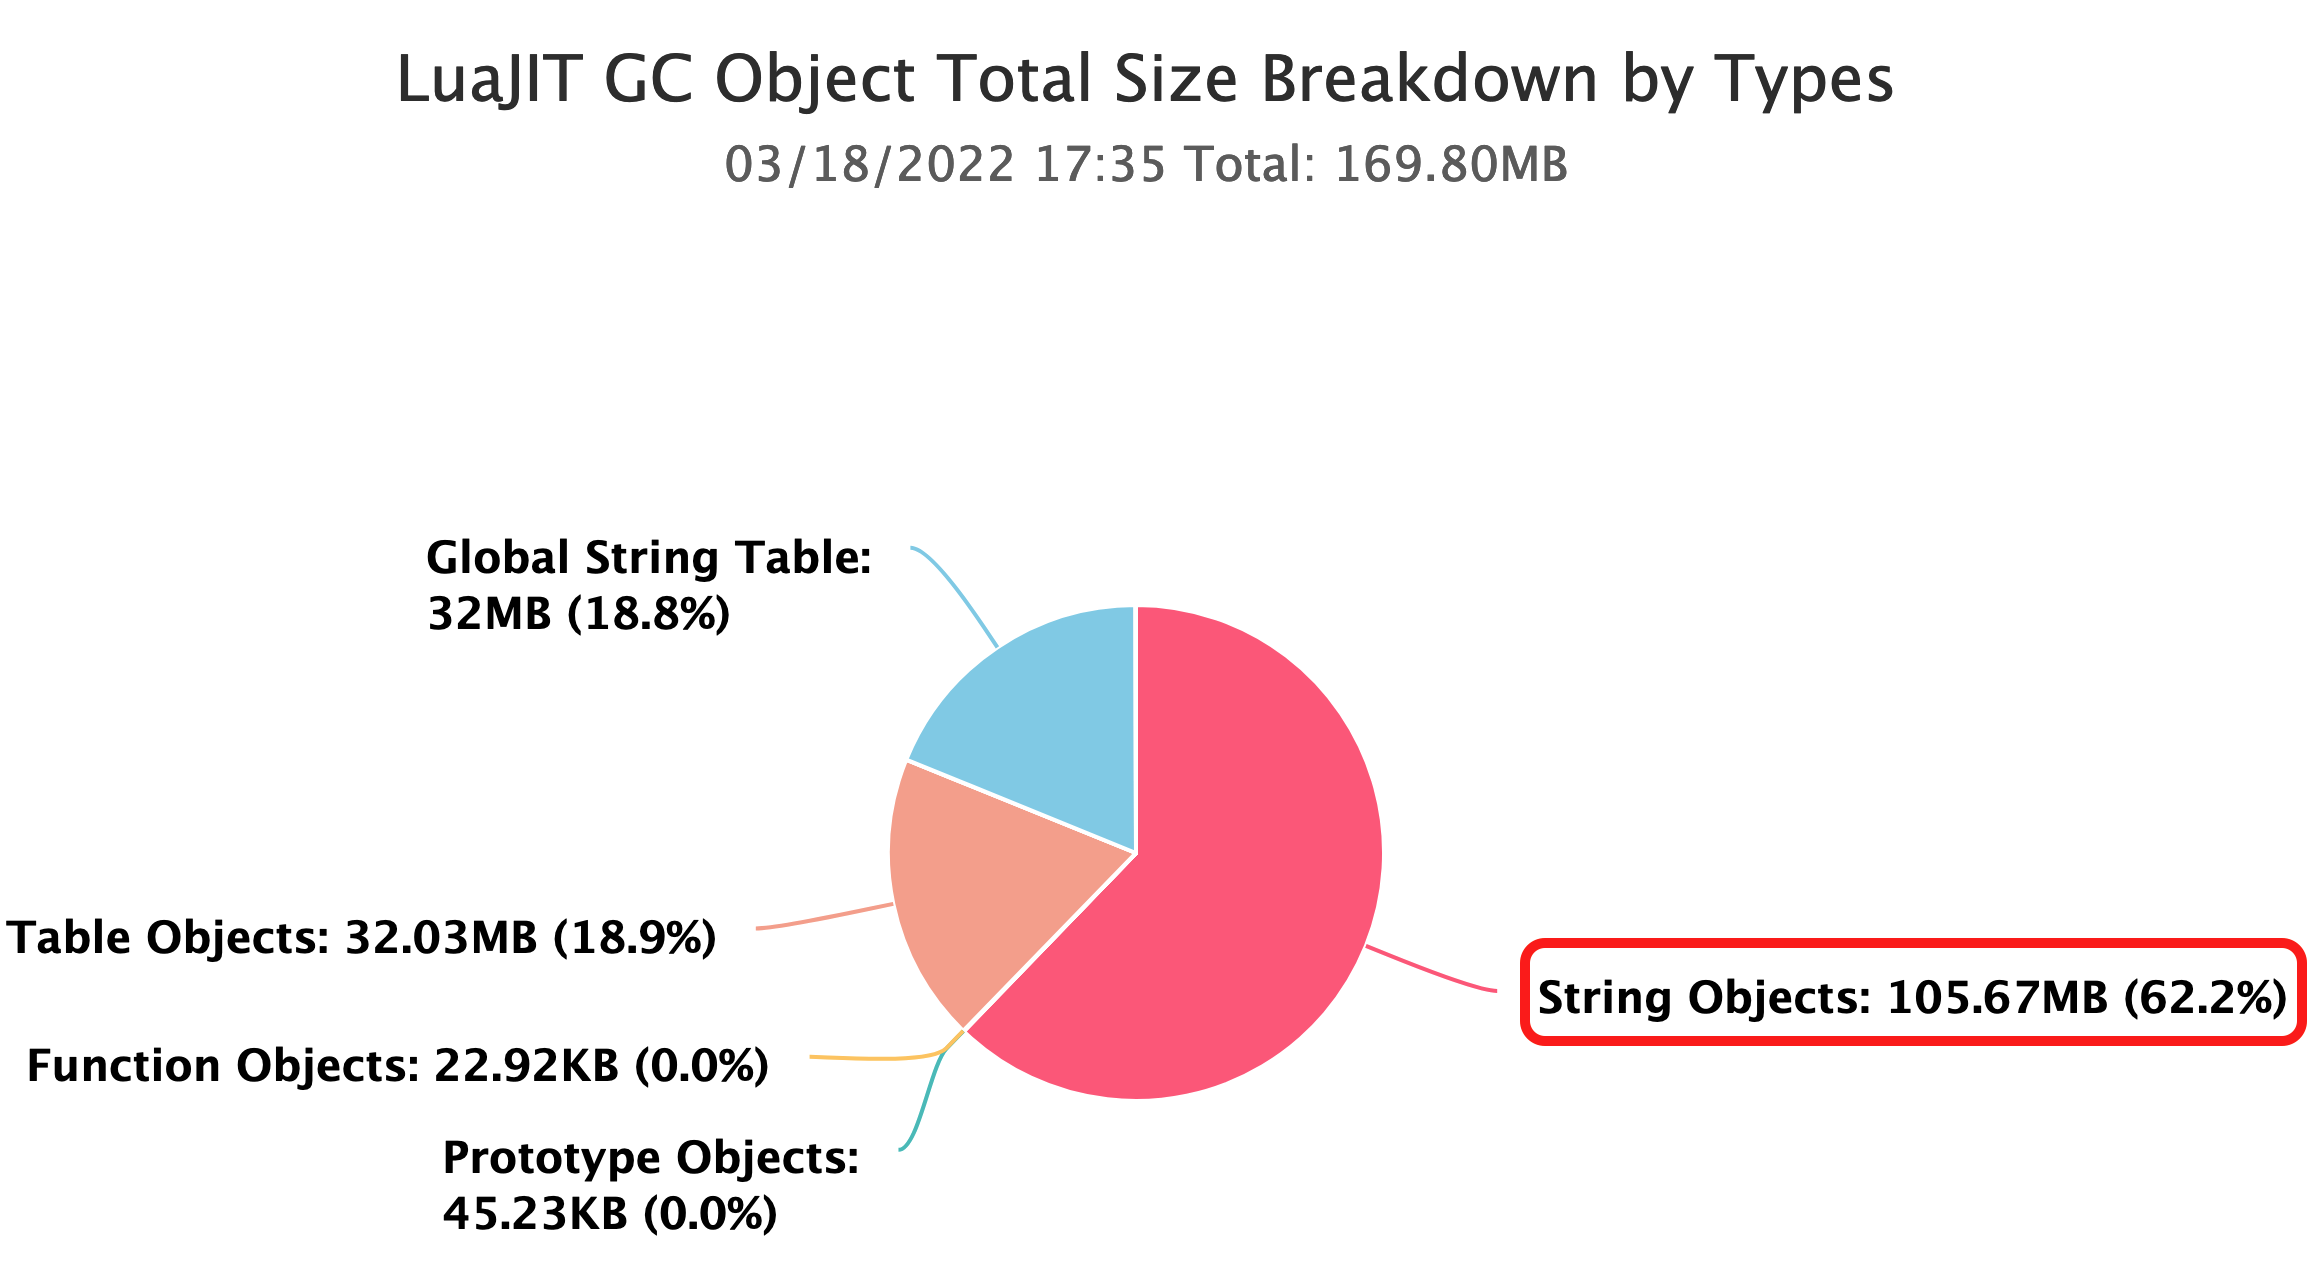
The analysis results indicated that String Objects were the largest memory consumers with 105.67MB (62.2%), followed by Table Objects with 32.03MB(18.9%), and Global String Table with 32MB (18.8%).
lj-gco-ref analyzer
OpenResty XRay provides the lj-gco-ref analyzer, which is used to dynamically analyze the embedded LuaJIT program process, such as the Lua objects dumped in the OpenResty Nginx Worker process, and quickly locate the path of the Lua objects that occupy a large amount of memory.
The lj-gco-ref analyzer is very suitable for finding the largest Lua objects in a bloated embedded LuaJIT process. We can run it like this (assuming the PID of the nginx worker target process is 7646):
$ orxray analyzer run lj-gco-ref -p 7646
Goto https://8pu4z6.xray.openresty.com/targets/1355/history/4375500985 for charts
Open the URL prompted here in a browser to view the corresponding flame graph:
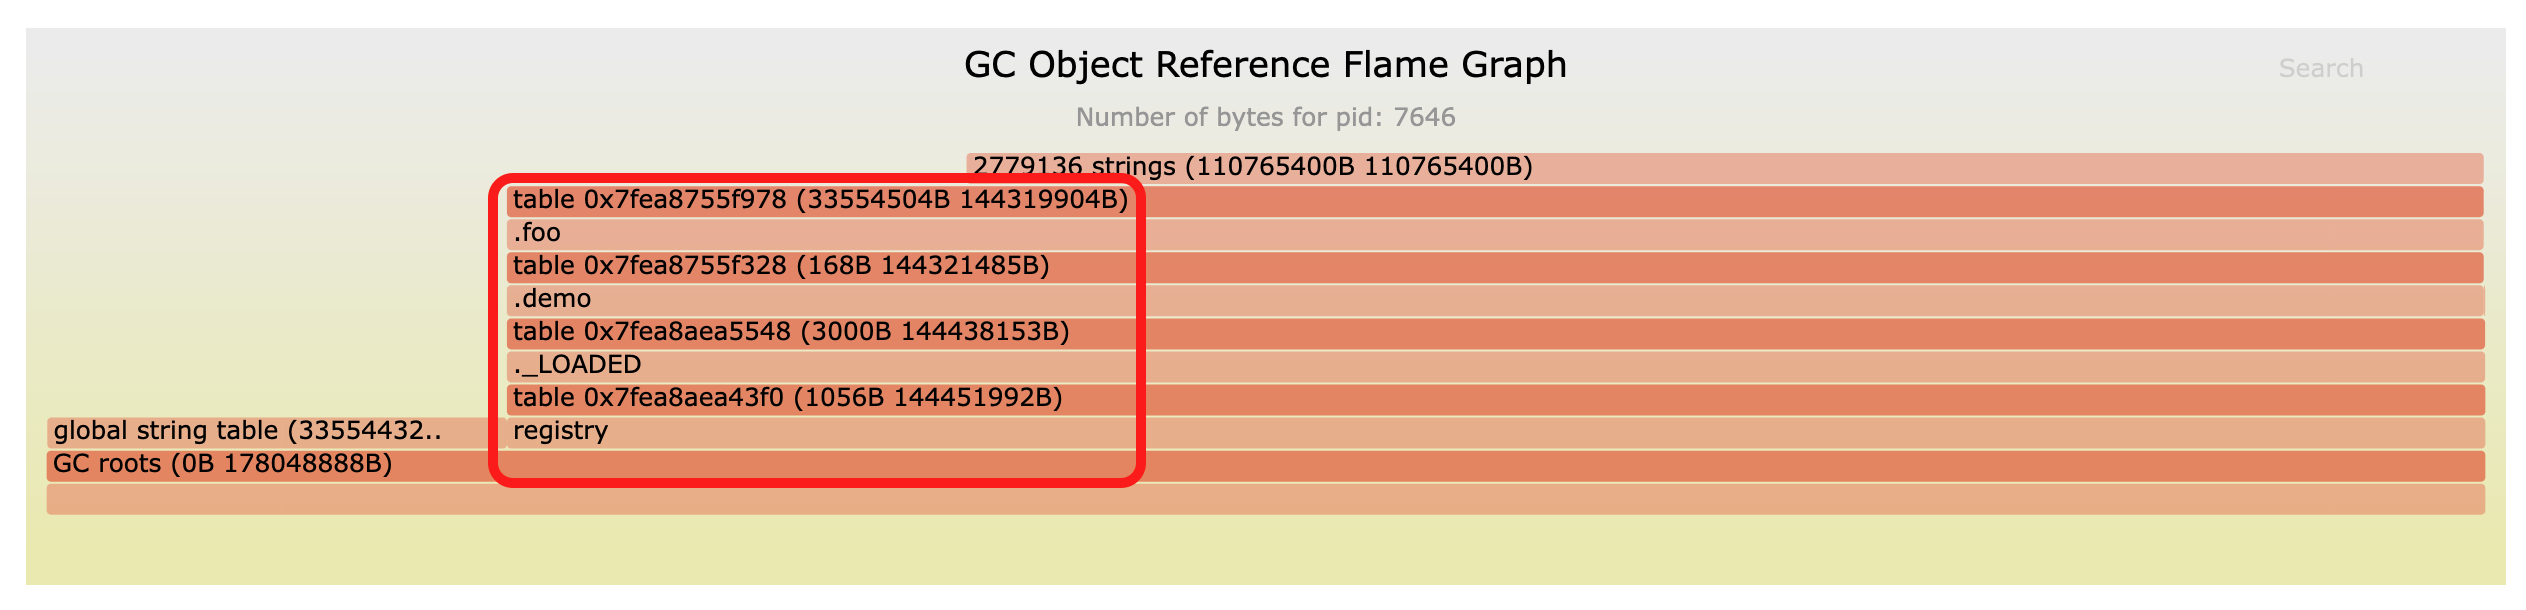
As shown by the data in the flame graph, the largest memory object is Lua strings.
Tracing from the bottom to the top of the flame graph, we get this path:
GC roots => registry => ._LOADED => .demo => .foo
The corresponding Lua pseudo code:
debug.getregistry()._LOADED.demo.foo
Where debug.getregistry()._LOADED corresponds to the package.loaded table, and the lua modules loaded by require() are cached in the package.loaded table.
Converted to Lua source code:
package.loaded.demo.foo
Finally, we get that the foo table in the demo module holds too many memory objects. Based on this result, we can do targeted optimization next.
Fully-automated analysis
Above we demonstrated how to manually invoke the lj-gco-ref analyzer on the command line to analyze LuaJIT GC related memory usage issues. In fact, OpenResty XRay can automatically invoke this analyzer as needed to sample the target process, and automatically analyze the generated flame graph, and finally get the data reference paths of those GC objects with the highest memory usage, and provide the conclusions in a human-readable form in the automatic analysis report. This greatly liberates our users, who do not have to wait for memory problems to occur at the server, or manually run the appropriate analyzer, or even interpret the results sampled by the analyzer themselves.
Conclusion
We have explained in the above text how Lua GC and Lua object growth cause high memory usage in processes, and used OpenResty XRay command line tool for analysis. We also introduced how to use the lj-gco-ref analyzer separately.
About The Author
Yichun Zhang (Github handle: agentzh), is the original creator of the OpenResty® open-source project and the CEO of OpenResty Inc..
Yichun is one of the earliest advocates and leaders of “open-source technology”. He worked at many internationally renowned tech companies, such as Cloudflare, Yahoo!. He is a pioneer of “edge computing”, “dynamic tracing” and “machine coding”, with over 22 years of programming and 16 years of open source experience. Yichun is well-known in the open-source space as the project leader of OpenResty®, adopted by more than 40 million global website domains.
OpenResty Inc., the enterprise software start-up founded by Yichun in 2017, has customers from some of the biggest companies in the world. Its flagship product, OpenResty XRay, is a non-invasive profiling and troubleshooting tool that significantly enhances and utilizes dynamic tracing technology. And its OpenResty Edge product is a powerful distributed traffic management and private CDN software product.
As an avid open-source contributor, Yichun has contributed more than a million lines of code to numerous open-source projects, including Linux kernel, Nginx, LuaJIT, GDB, SystemTap, LLVM, Perl, etc. He has also authored more than 60 open-source software libraries.
Related Articles
OpenResty XRay Oct 11, 2025

OpenResty XRay Aug 31, 2020

OpenResty XRay Aug 10, 2020

OpenResty XRay Aug 4, 2020

OpenResty XRay Jan 21, 2020


