Case Study: How to Trace a Memory Leak Caused by an LRU Cache Using OpenResty XRay
In modern web applications, memory leaks are a common yet frustrating problem. Even applications with low traffic can suffer from resource waste and system instability due to improper memory management. This article presents a real-world case study, demonstrating how to accurately diagnose and resolve memory leak issues using the OpenResty XRay.
The Silent Killer: How Invisible Memory Leaks Threaten Business Stability
A customer’s OpenResty application, despite having low business traffic, experienced a continuous and unexpected increase in the memory usage of its worker processes over time. This classic memory leak scenario not only caused significant resource waste but also posed a major threat to the stability of their online services. Lacking effective analysis tools, the customer was unable to identify the root cause of the leak. The OpenResty XRay team stepped in, leveraging its powerful dynamic tracing and analysis capabilities to perform a non-invasive diagnosis of the live OpenResty processes.
A Deep Dive into a Memory Leak Investigation
Step 1: Capturing the Leak’s Timeline
We first used the process memory trend chart in OpenResty XRay to visually confirm the customer’s report.
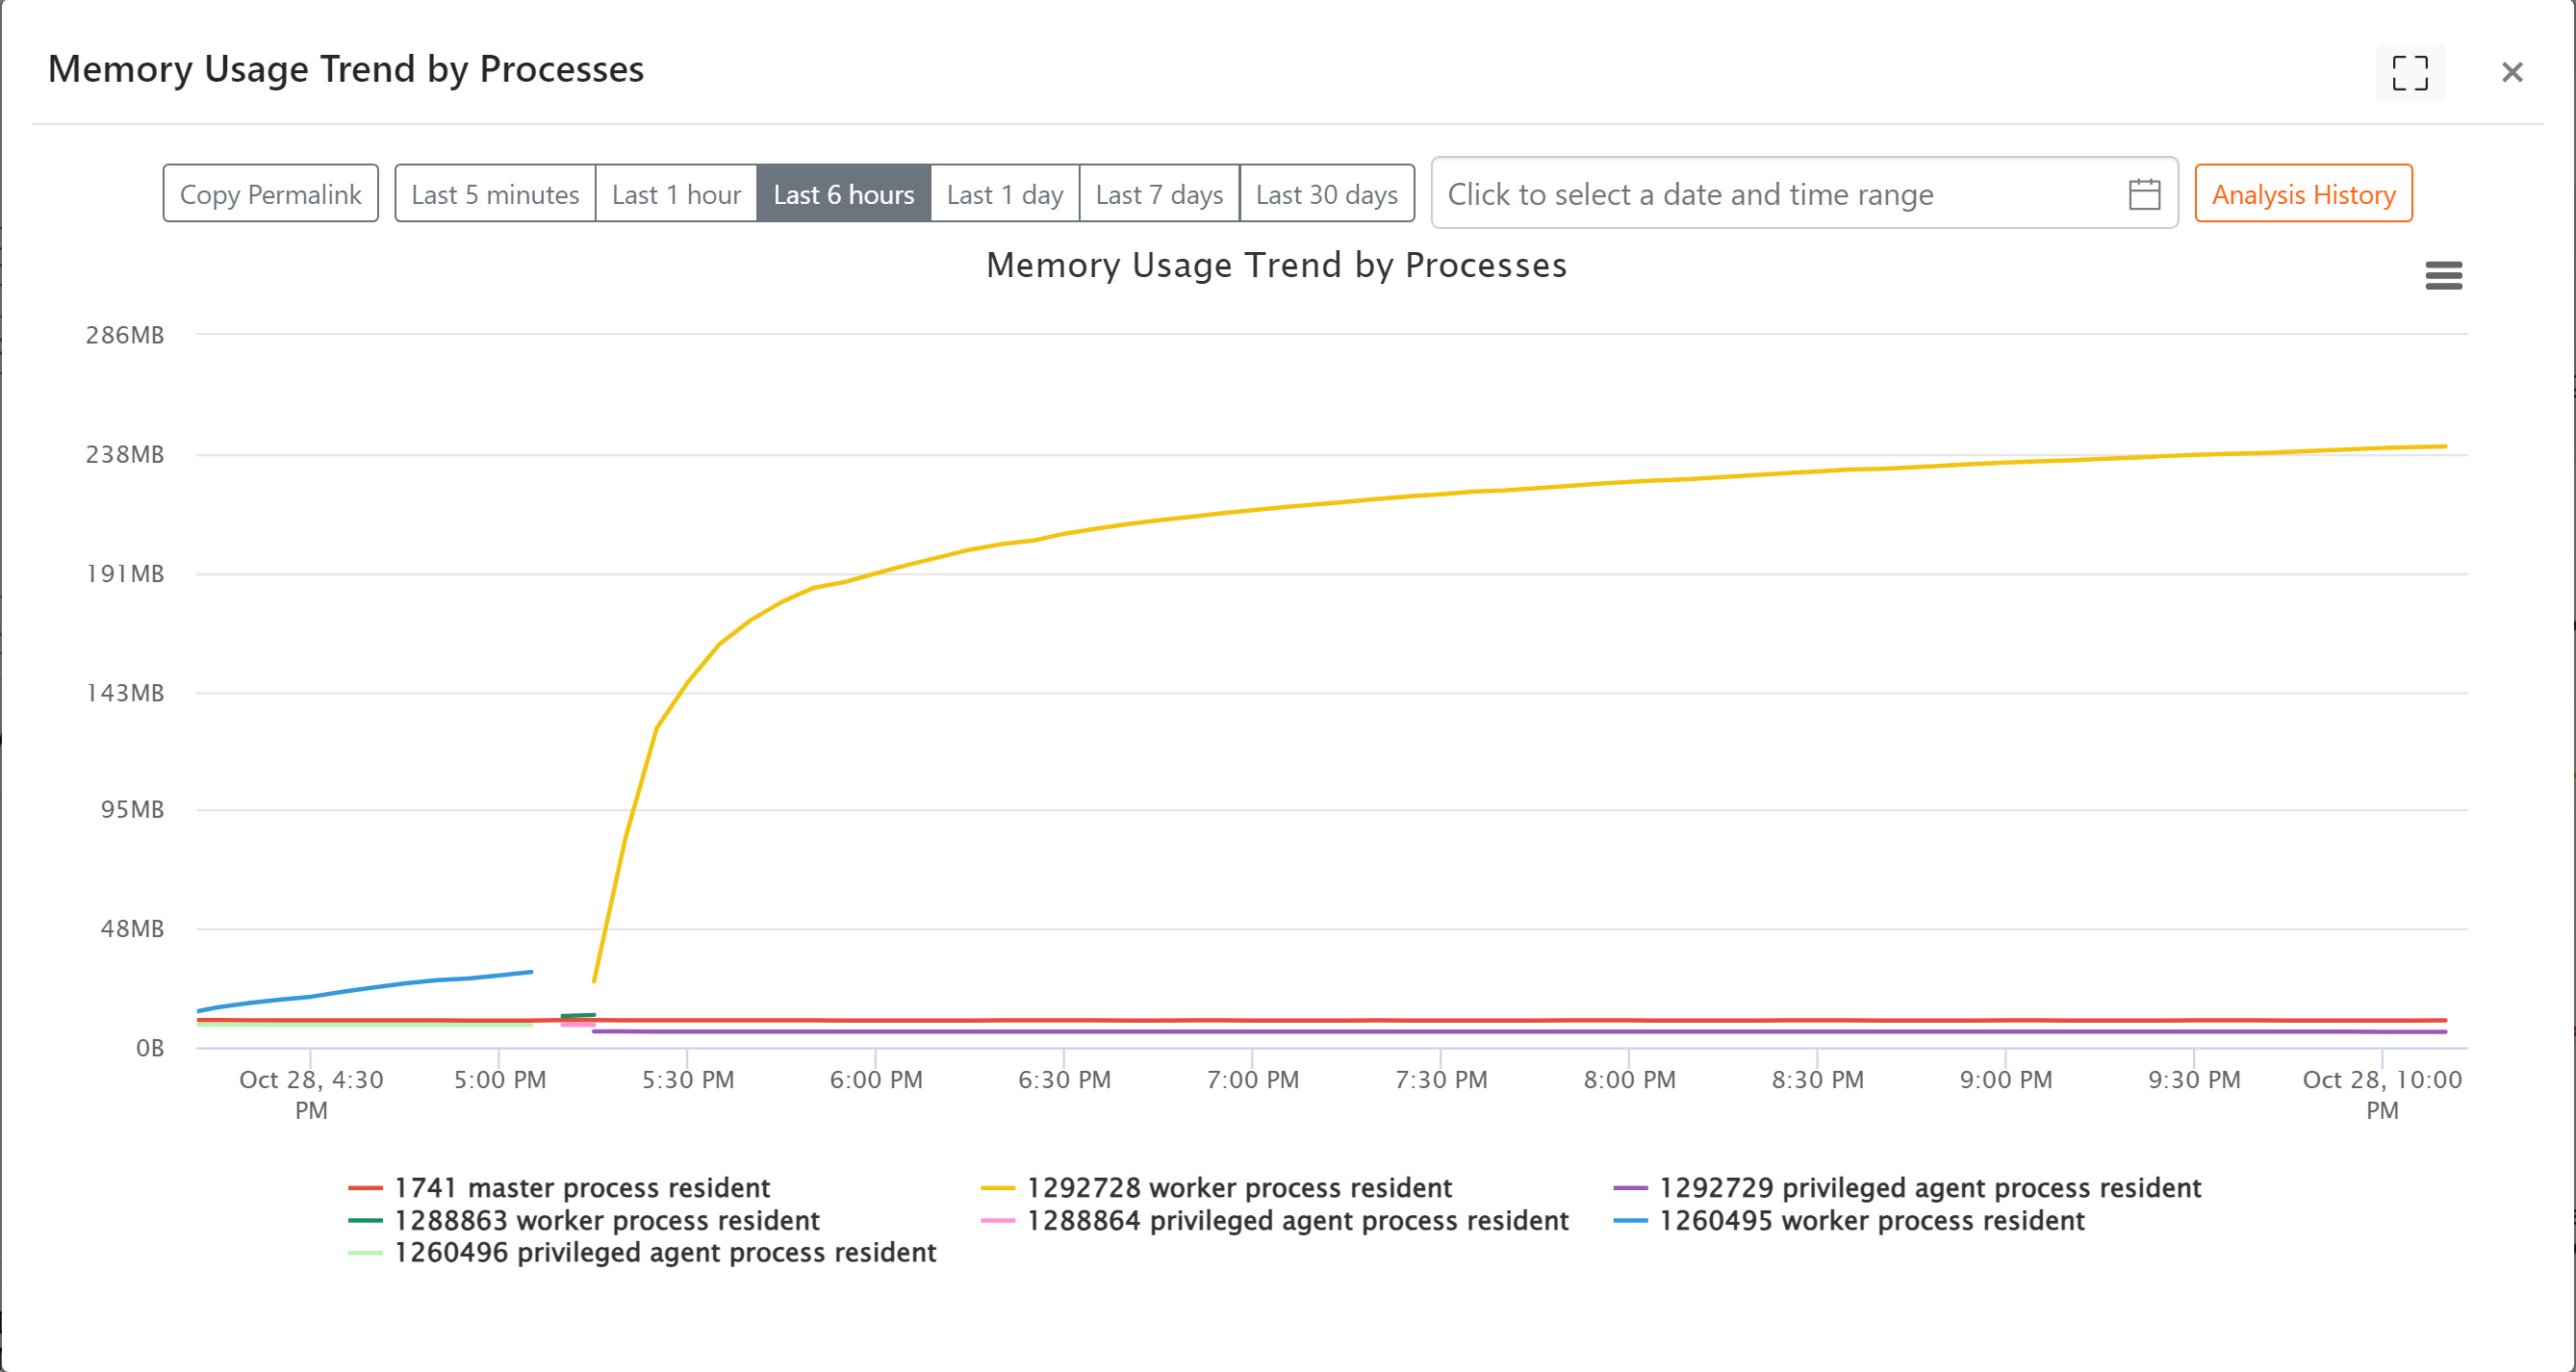
The monitoring data revealed that the RSS (Resident Set Size) memory of the OpenResty process was growing in a clear linear fashion—a classic symptom of a memory leak.
Step 2: Tracking Down the Prime Suspects
To pinpoint the source of the problem, we turned to the memory analysis feature in OpenResty XRay. The automatic analysis report revealed:
- Glibc memory allocations accounted for about 93% of the total memory, making it the primary source of consumption.
- LuaJIT memory allocations only took up about 2.4%.
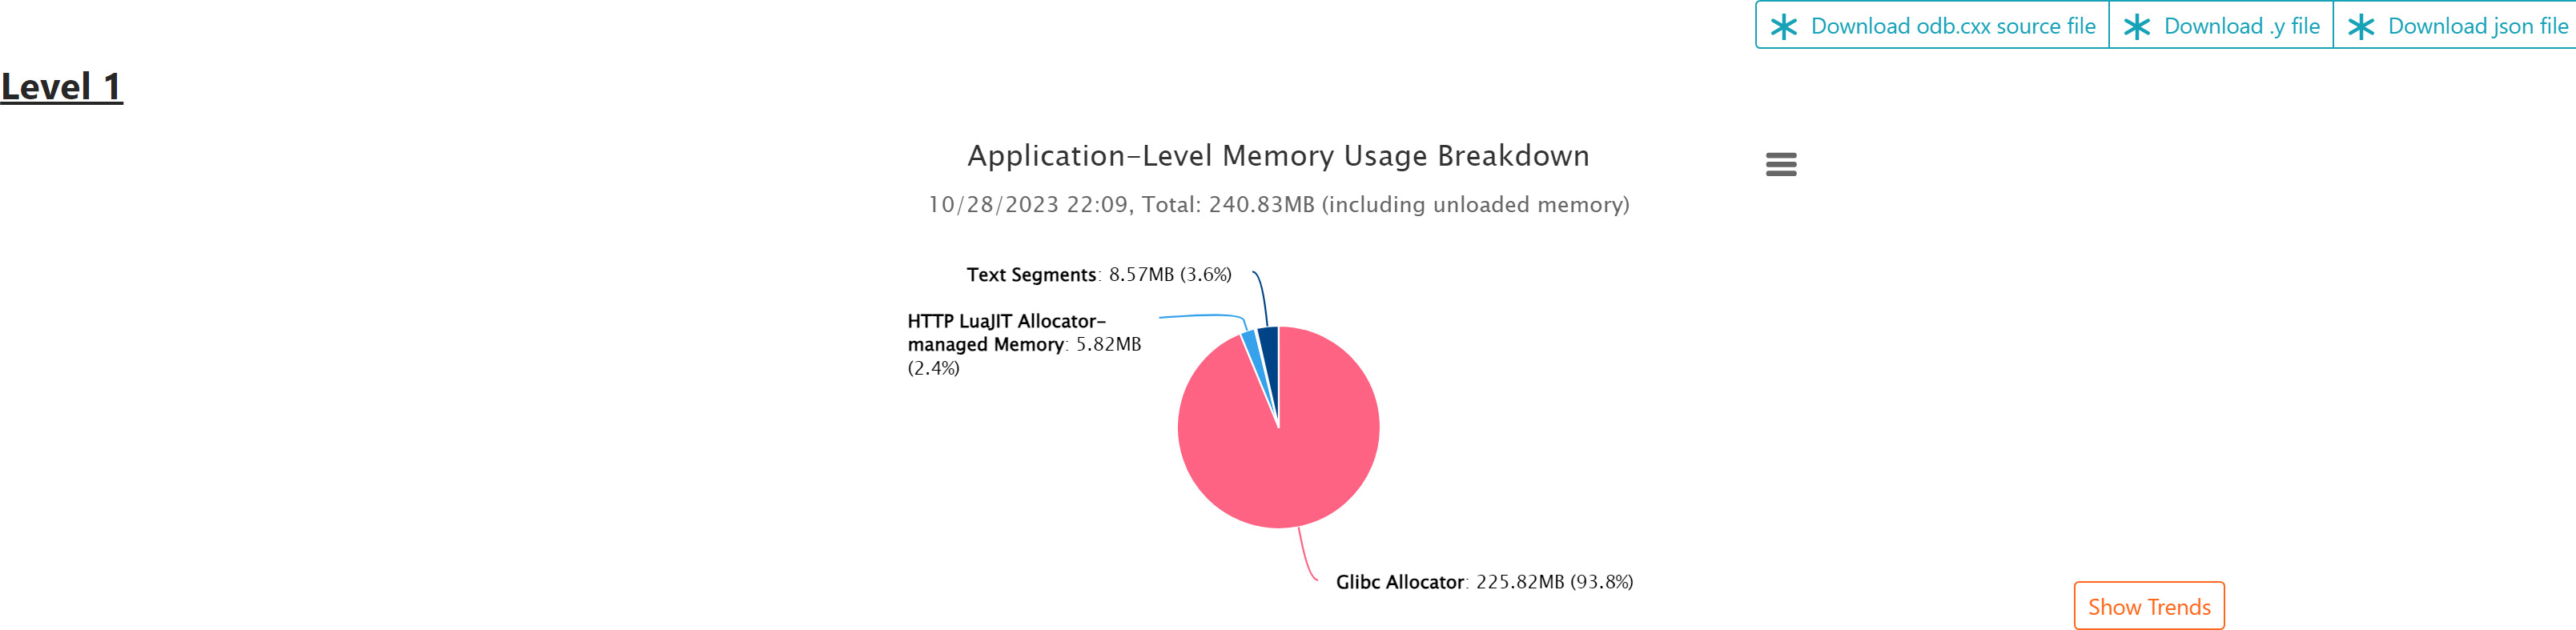
Diving deeper into Glibc’s memory usage with the resty-memory breakdown chart, we discovered that the growth originated entirely from the Glibc Arena.
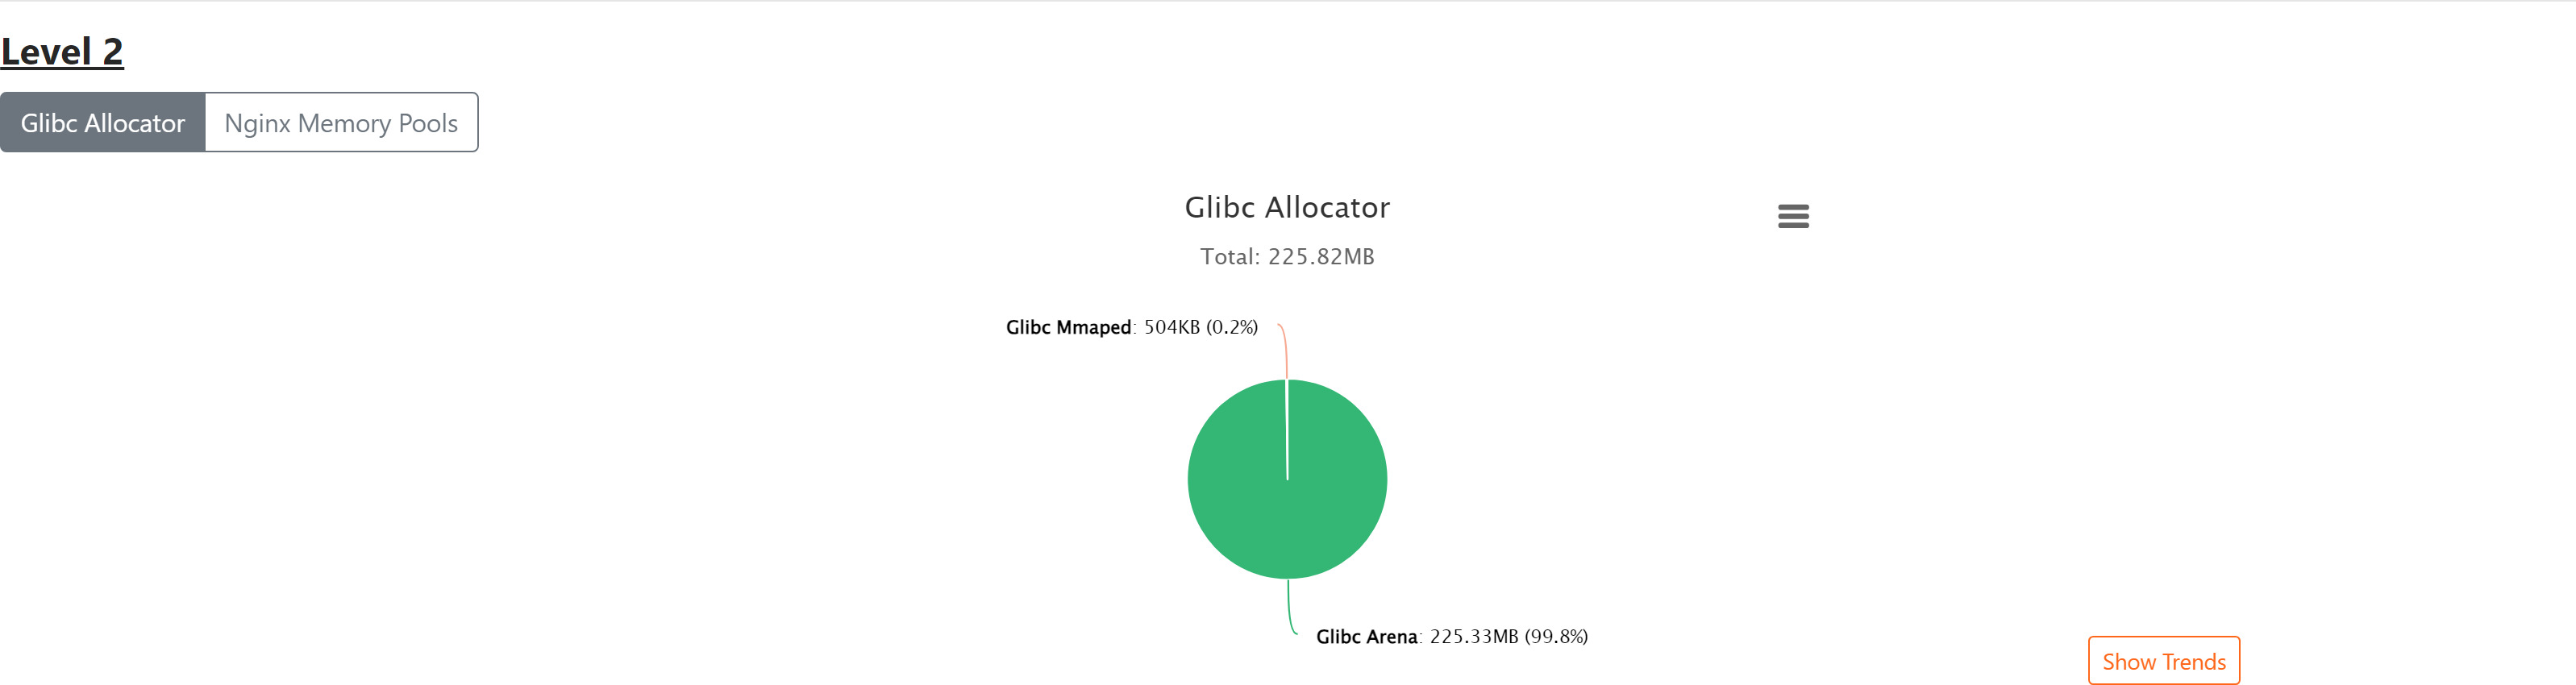
Typically, Nginx’s own Nginx memory pool allocates memory from the Arena. However, we observed that the Nginx memory pool’s usage was both minimal and stable.
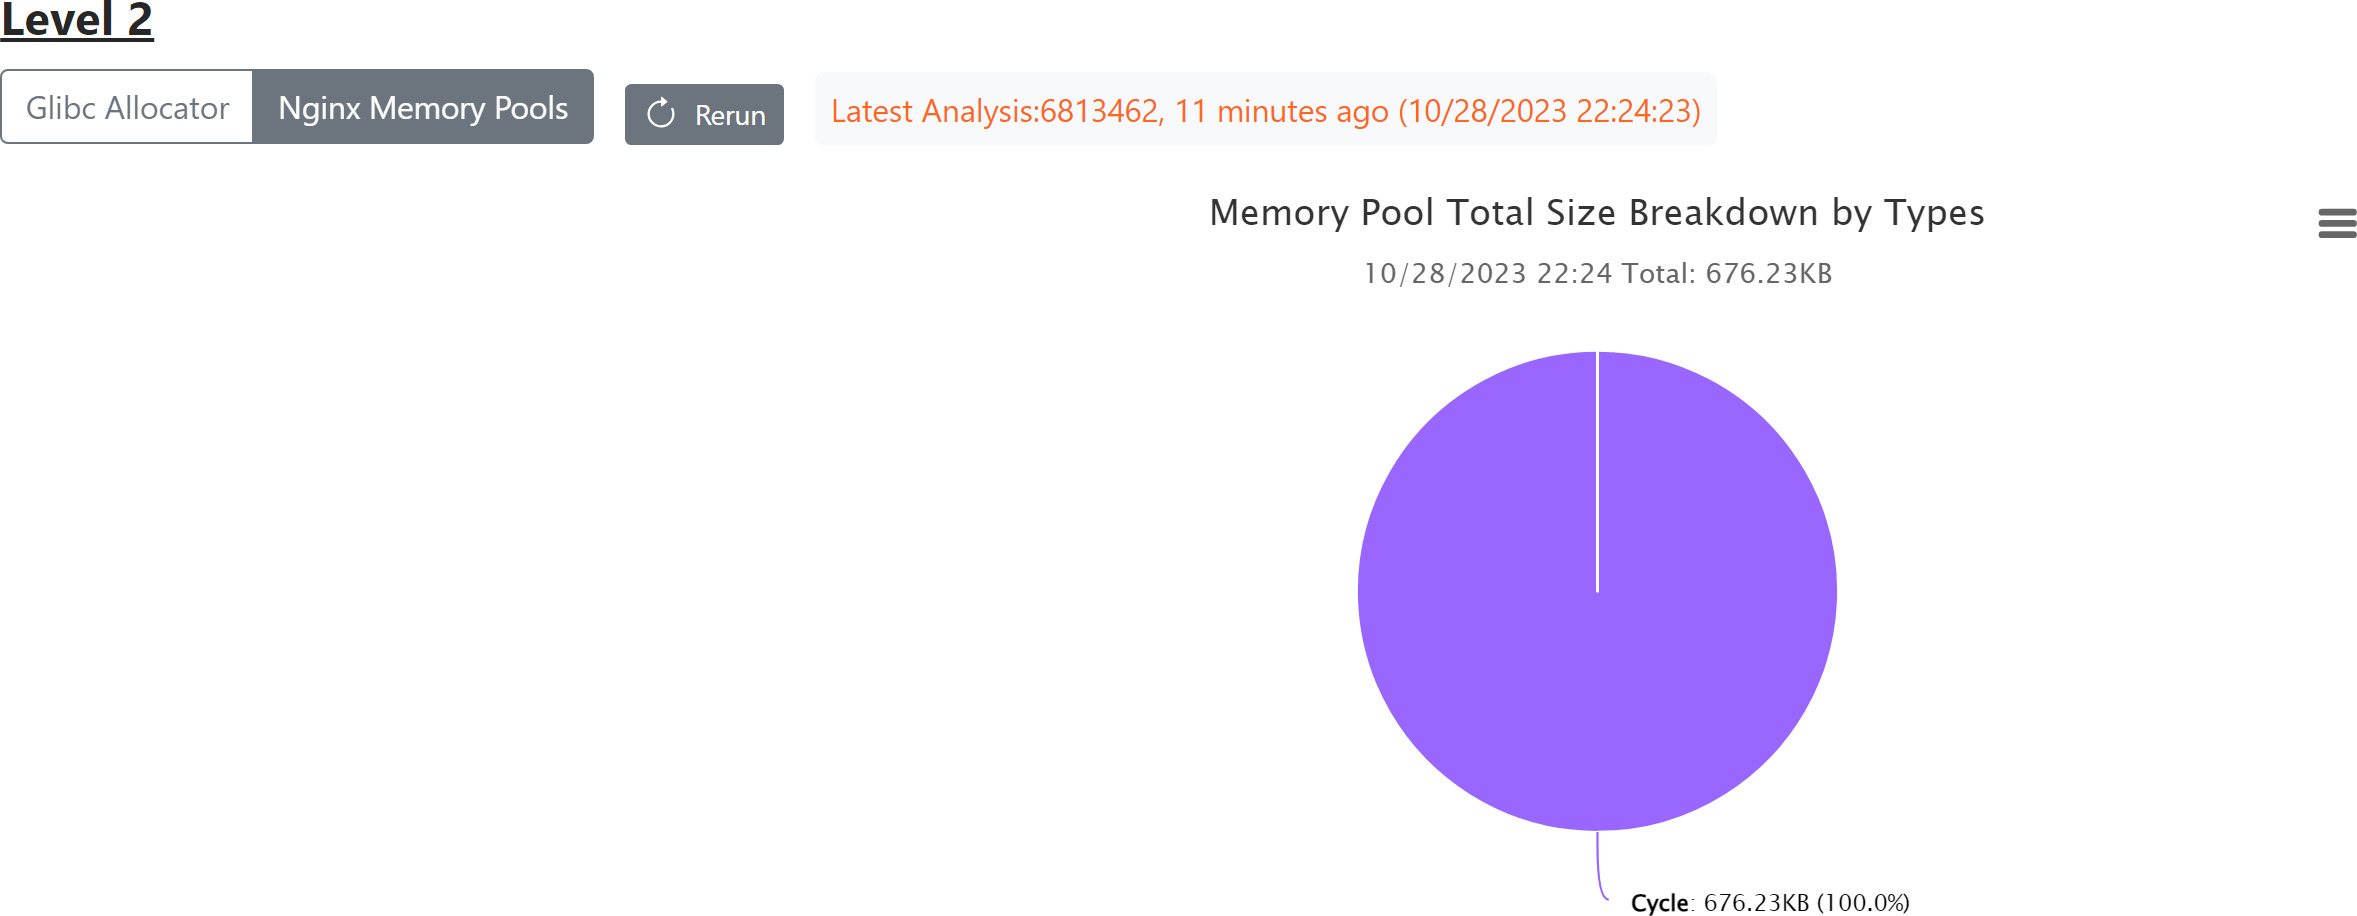
As you can see, the memory allocated by Glibc grows linearly over time, while the Nginx memory pool usage remains negligible.
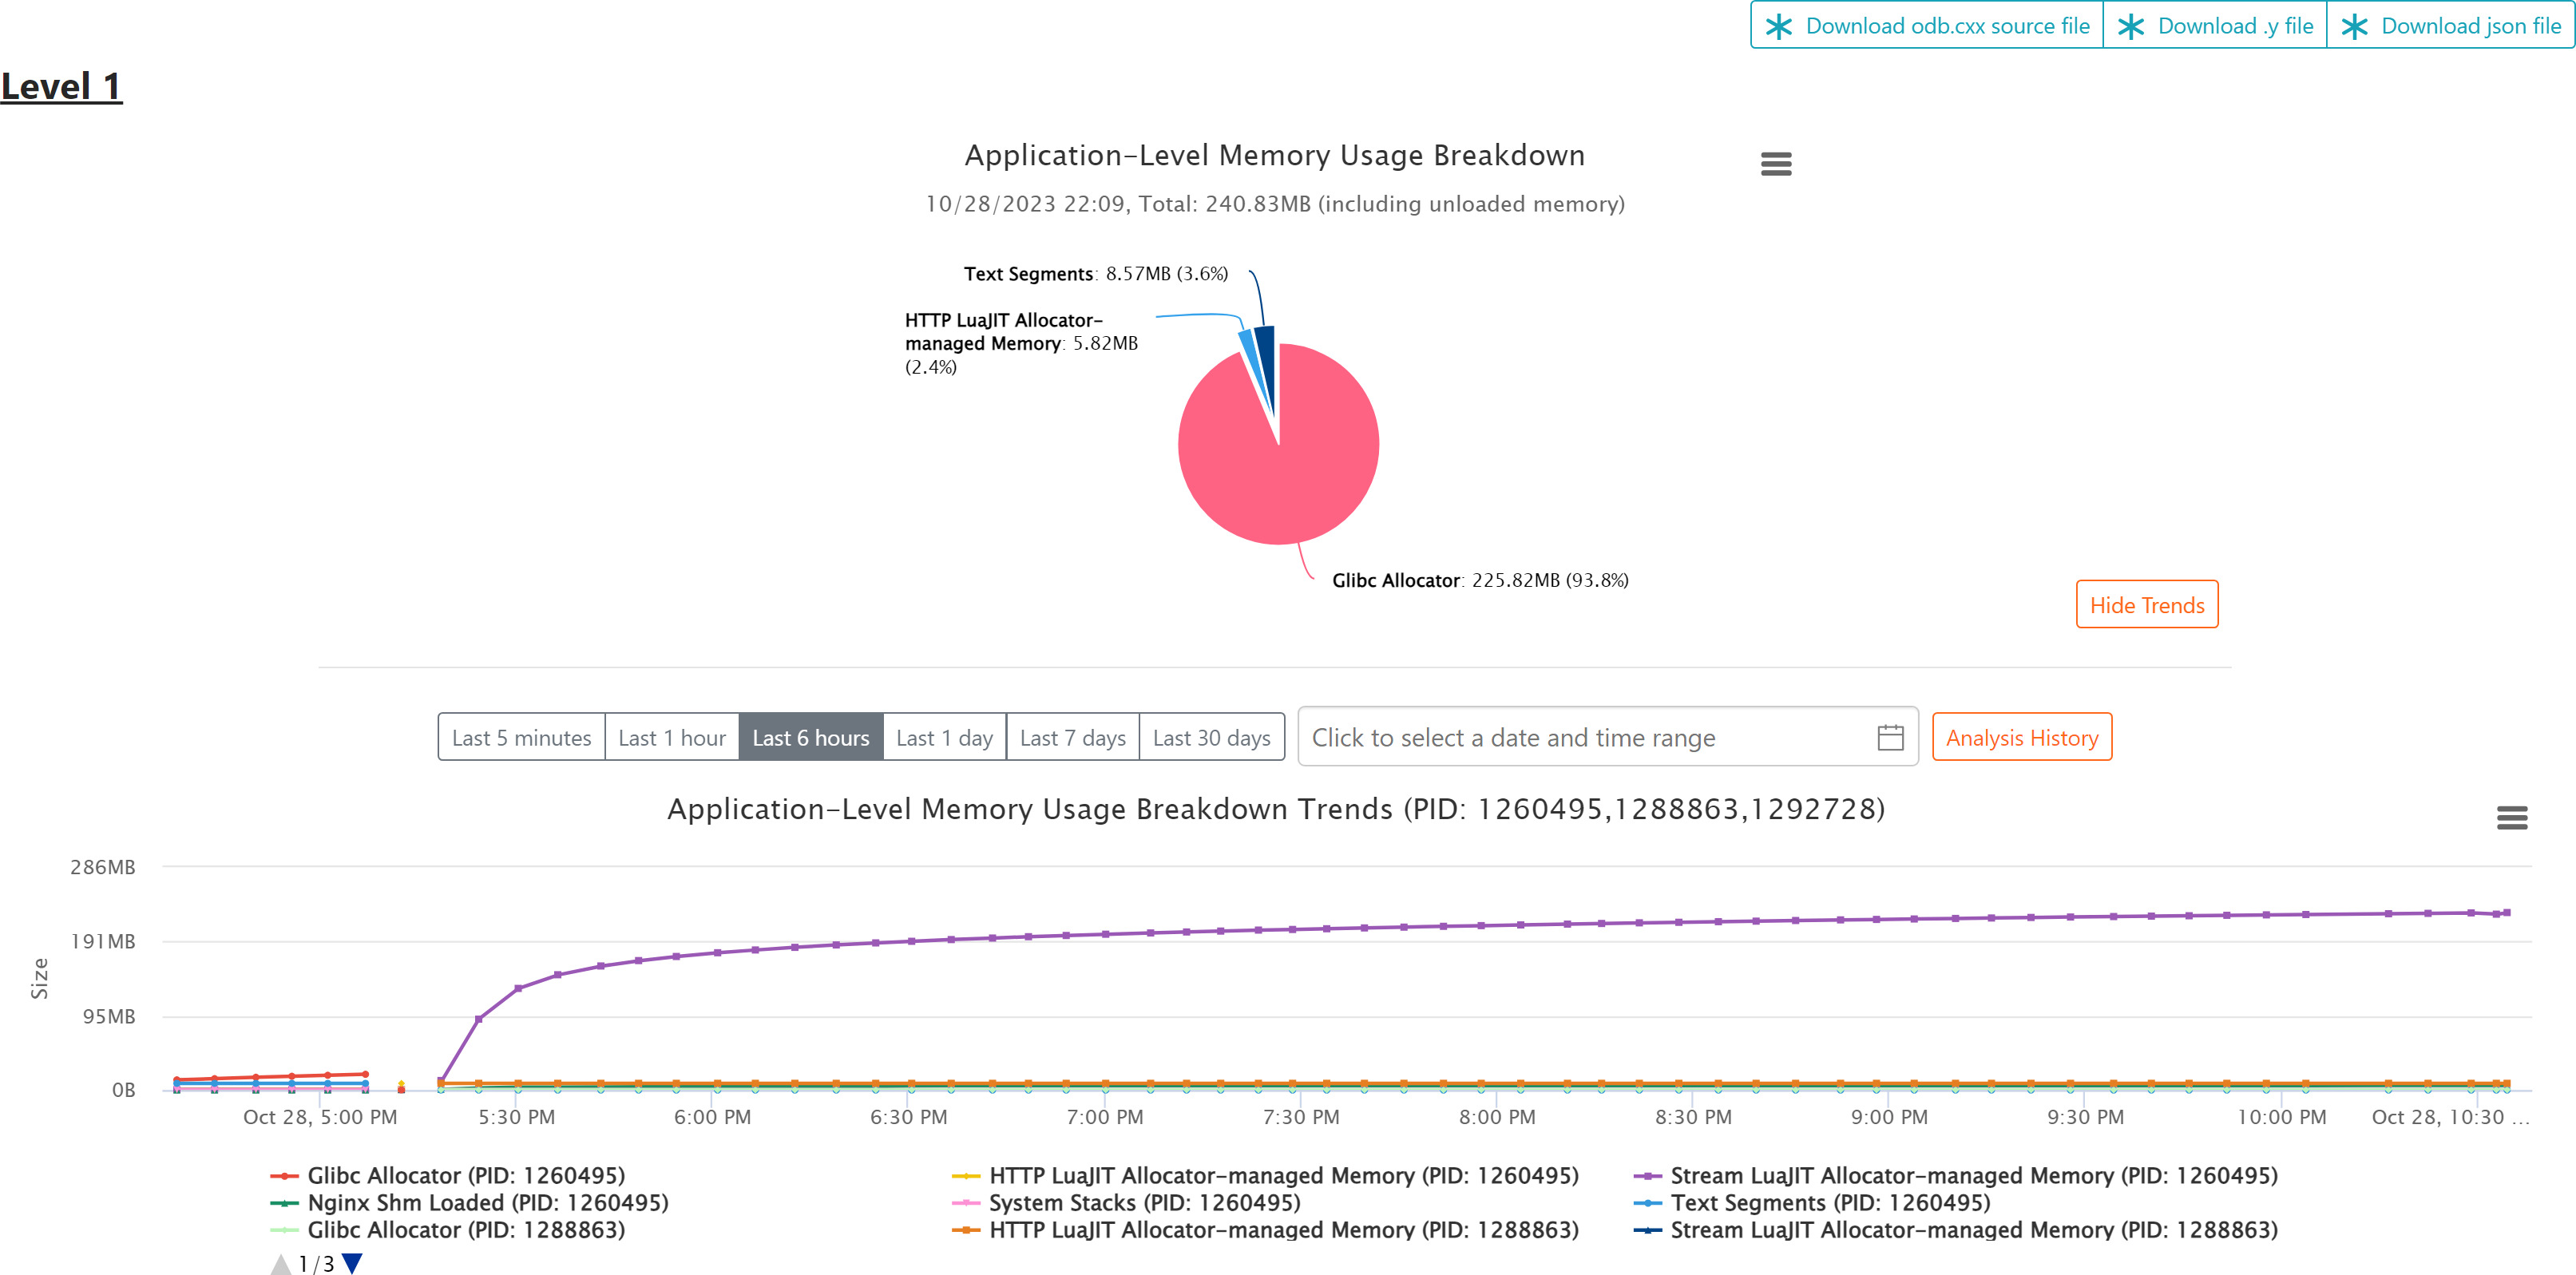
This indicated that the leak wasn’t caused by standard request processing, but rather by memory being allocated directly through Glibc by other modules.
Step 3: From Flame Graphs to the Root Cause
So, what code is constantly allocating Arena memory without ever freeing it? The answer lies in OpenResty XRay’s Memory Leak Flame Graph.
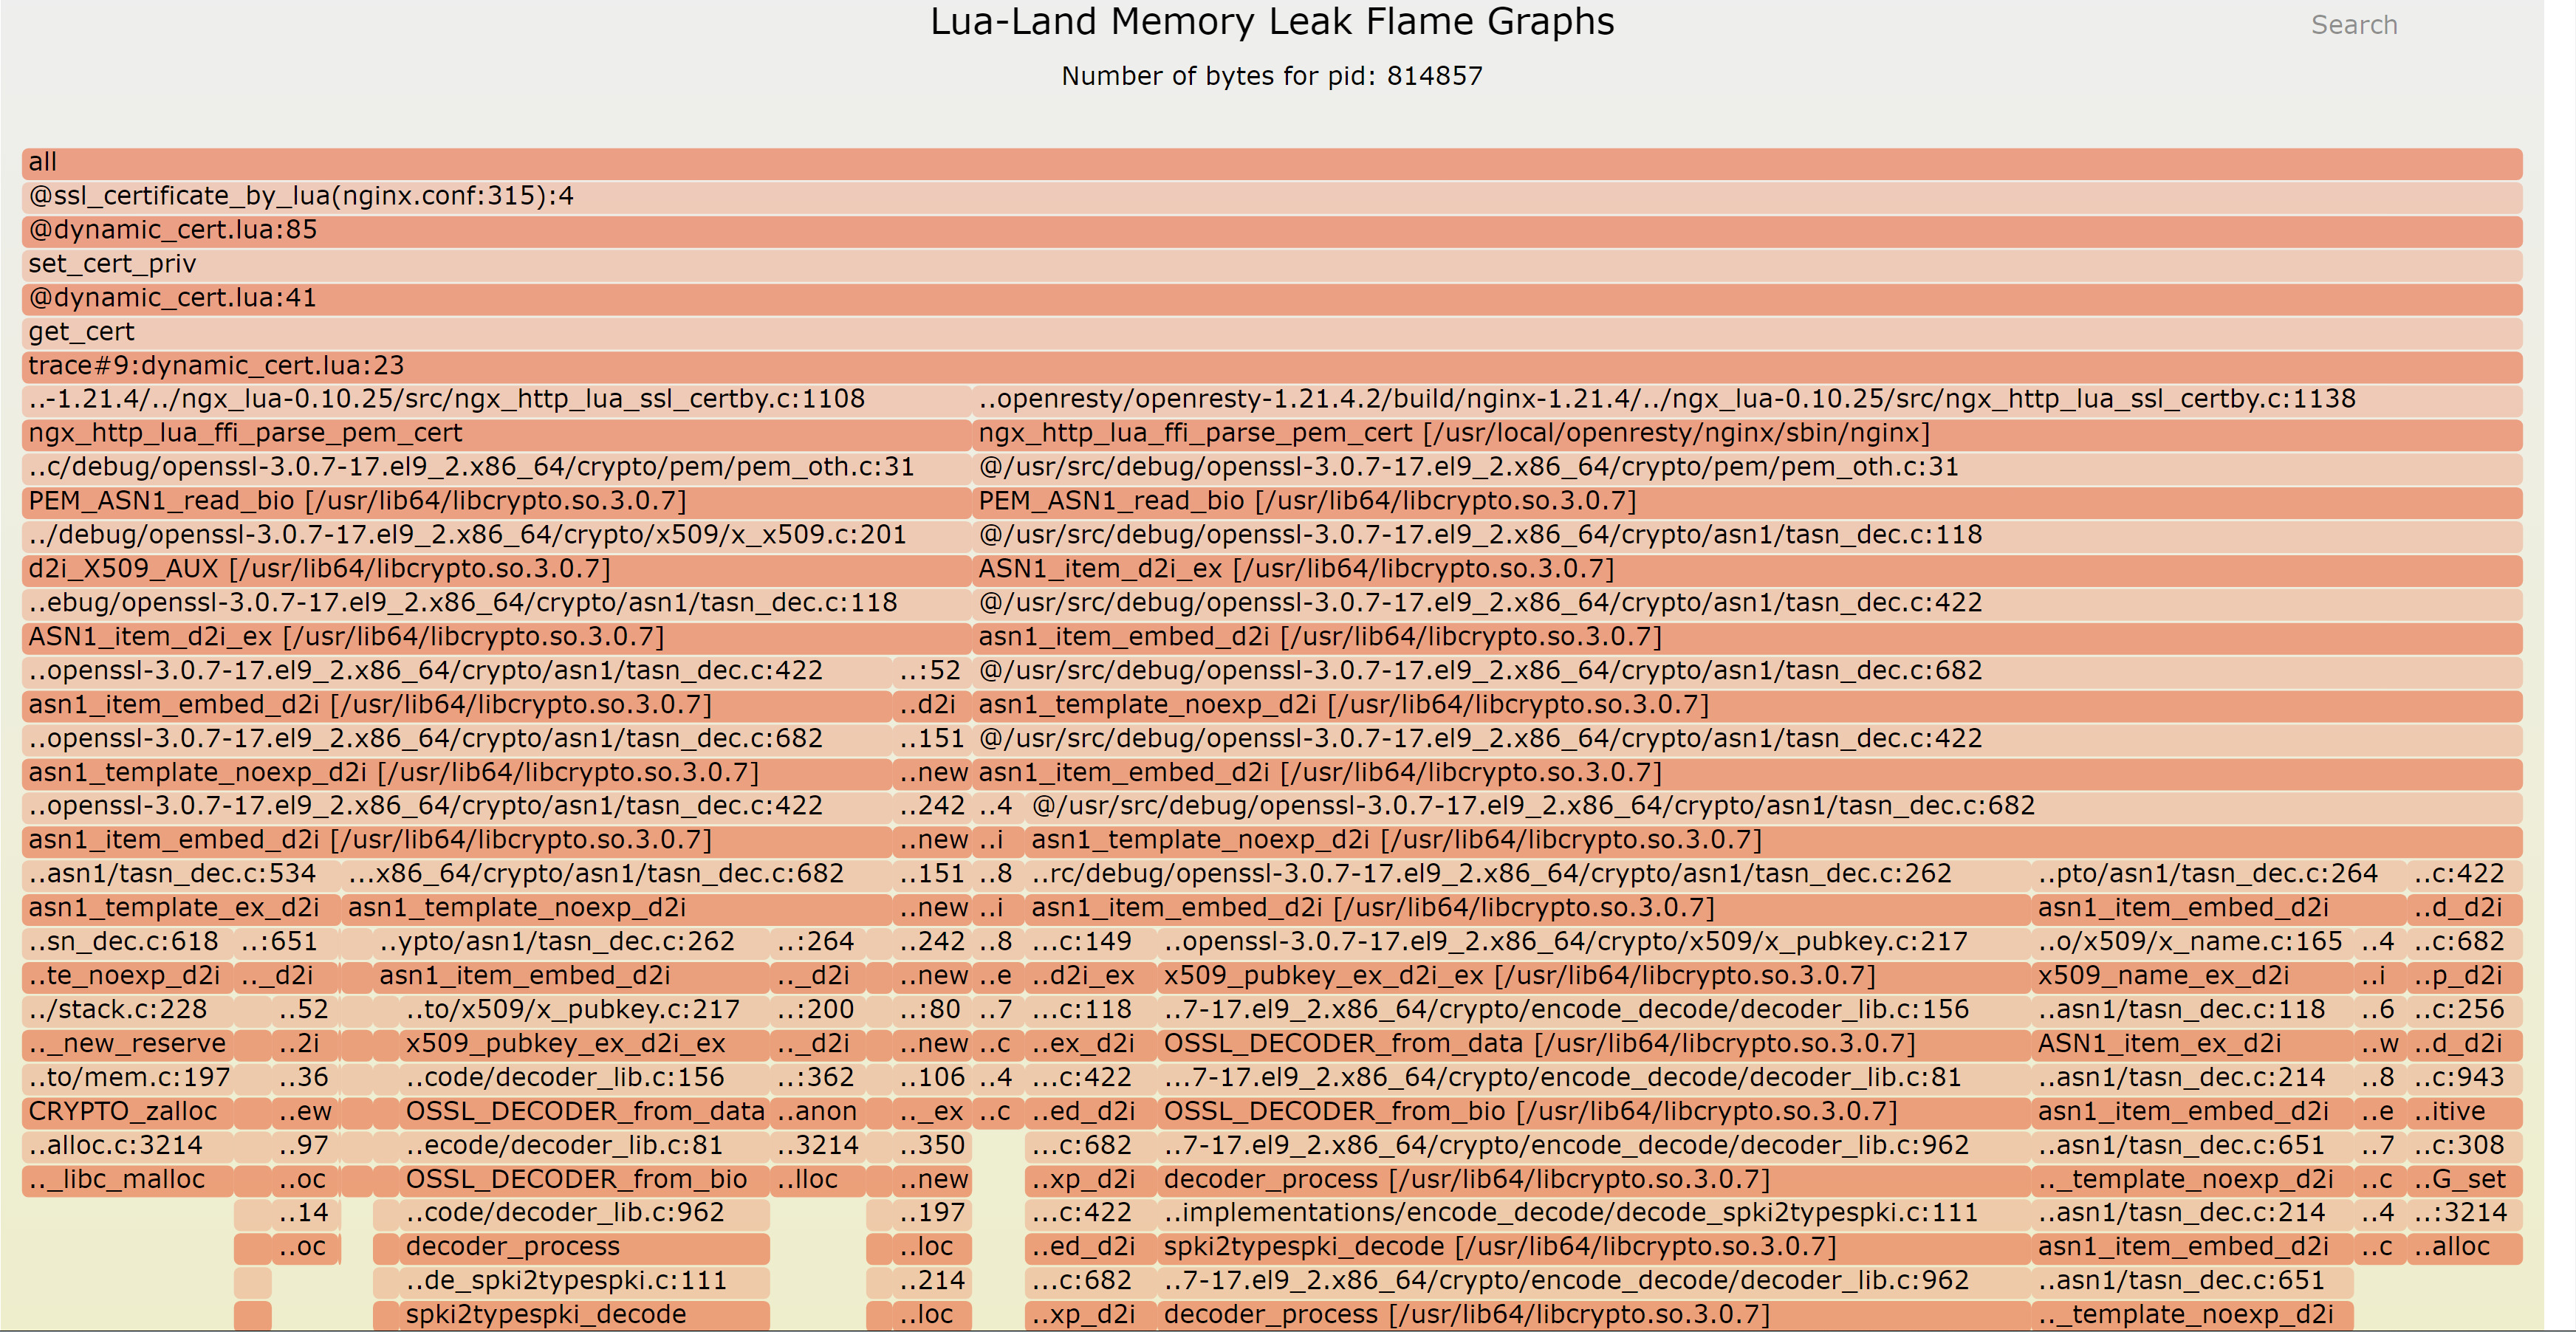
The memory leak flame graph reveals that the leak happens when parsing SSL/TLS certificates and private keys.
But why does it leak? To find out, we switched to the Lua GC Object Flame Graph to analyze object reference relationships at the Lua level.
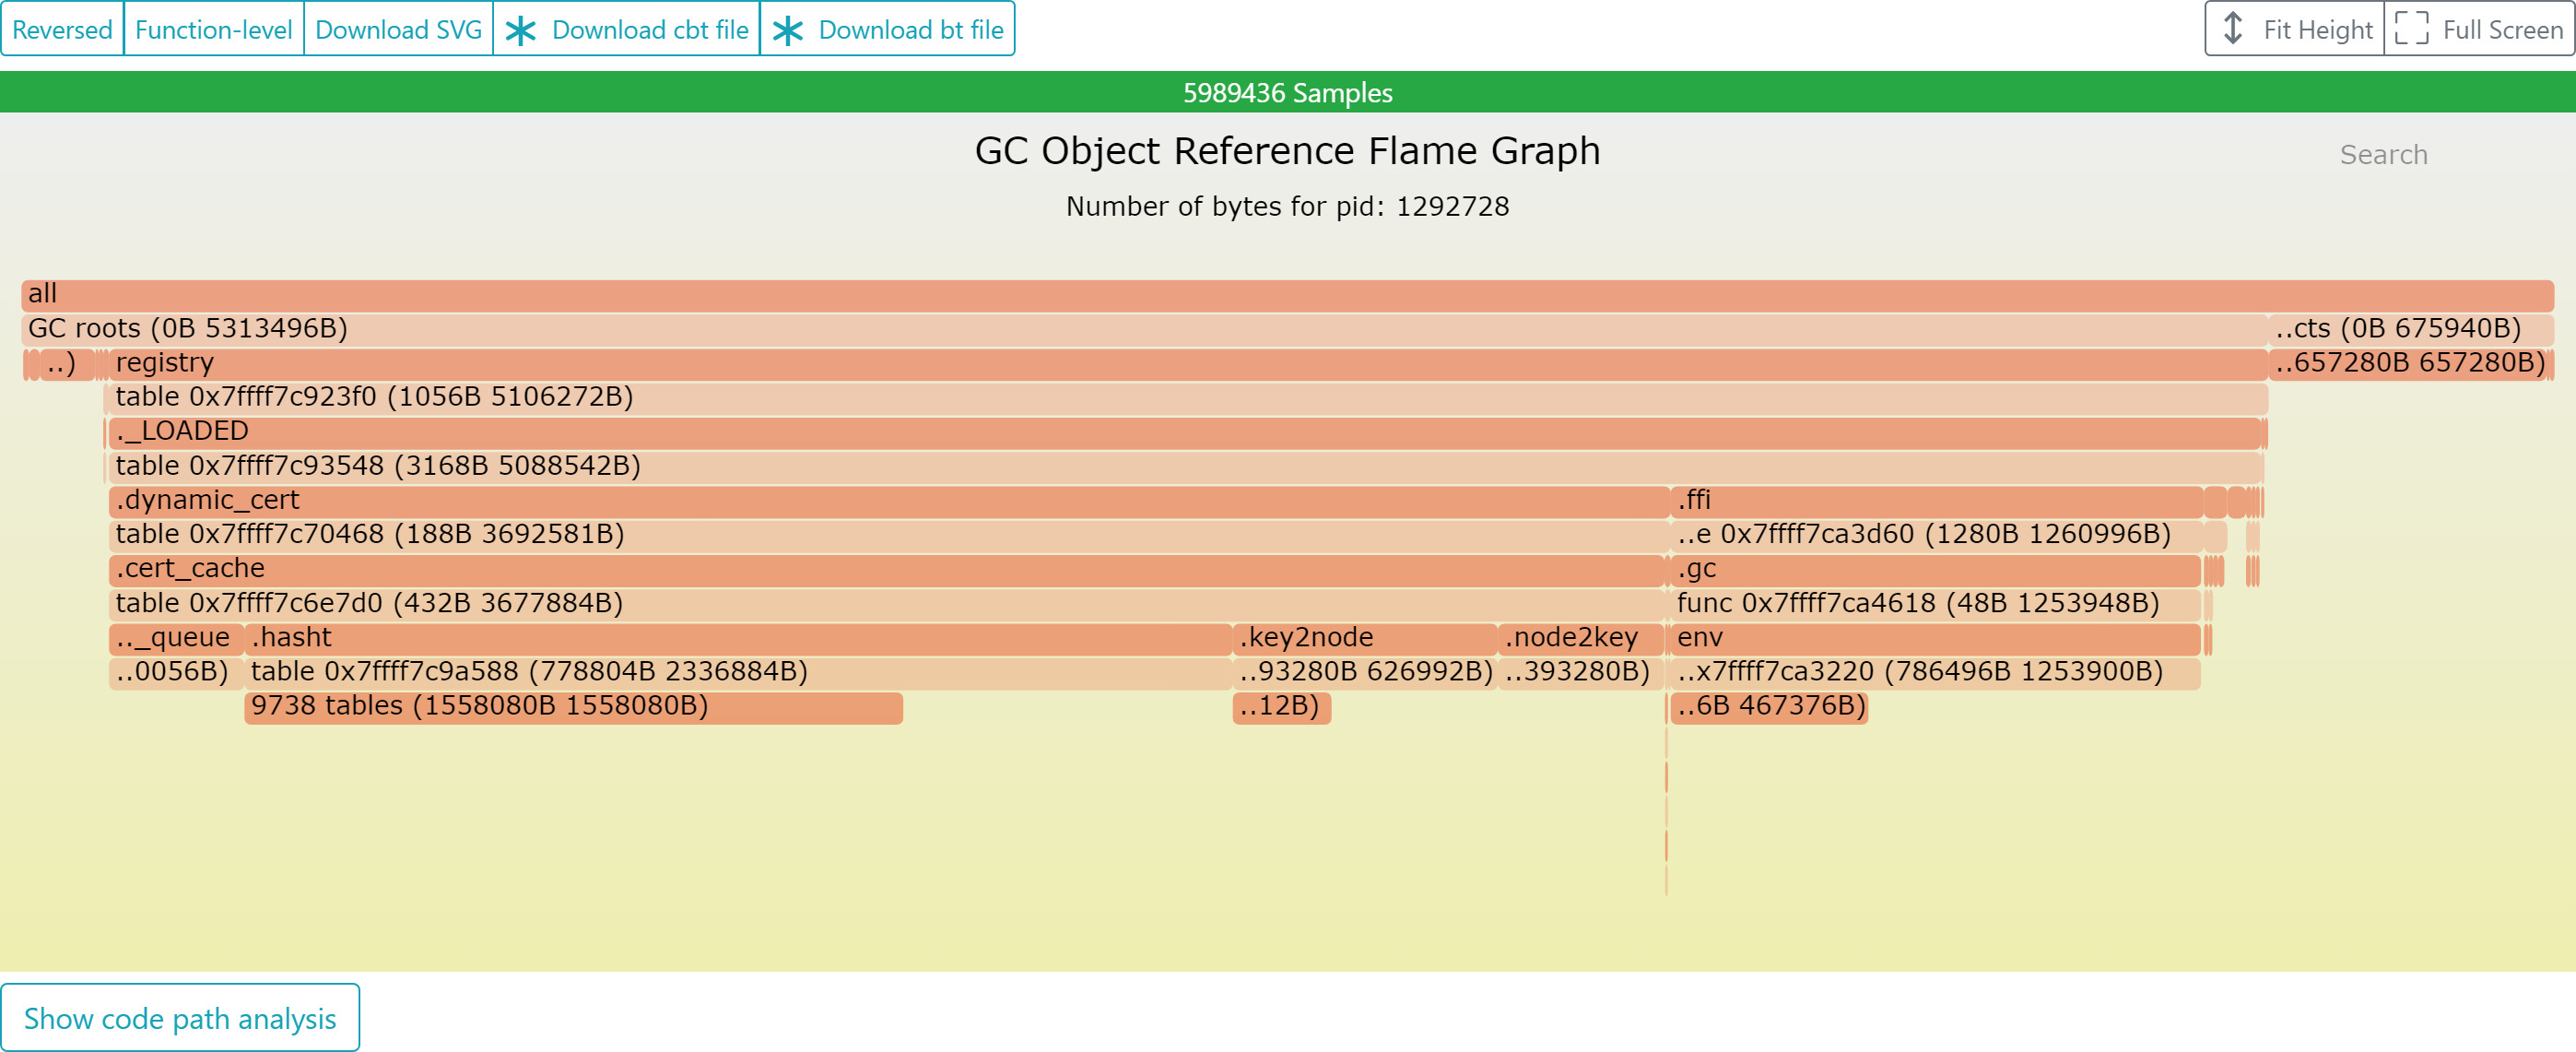
According to the flame graph, a Lua table named _LOADED.dynamic_cert.cert_cache is consuming the vast majority of the memory.
Given its internal structure, which includes fields like .free_queu, .hashht, .key2node, and .node2key, we identified it as a lua-resty-lrucache object.
Connecting the table name cert_cache with the memory leak flame graph, we deduced that the user was caching the results from ssl.parse_pem_cert and ssl.parse_pem_priv_key into an lru cache.
At this point, the entire sequence of events became crystal clear:
- To optimize performance, the customer cached the parsed results of dynamically loaded SSL certificates and private keys into an LRU cache called
cert_cache. - The problem was that this LRU cache was created with such a large capacity that it almost never evicted any items.
- Consequently, every time a new domain’s certificate was parsed, its resulting object was stored “permanently” in the LRU cache. Because these objects were referenced by the cache, Lua’s garbage collector couldn’t reclaim them, leading to a leak of the memory occupied by the underlying OpenSSL certificate structures.
- Over time, as more and more certificates were parsed, memory consumption grew linearly.
From Predicament to Breakthrough: A Pinpoint Diagnosis
Many companies face a common struggle: system memory usage climbs relentlessly, but the root cause remains elusive. It might seem like a small issue, but it can easily lead to a production service outage.
With just a single analysis, OpenResty XRay helped a client solve a persistent memory leak that had plagued them for a long time.
Pinpoint Accuracy, First Time: OpenResty XRay drills down to the heart of the problem through memory trend graphs, memory breakdown analysis, and its unique memory leak flame graphs. The entire process, from symptom to root cause, is clearly visualized, eliminating the guesswork and repetitive trial-and-error of traditional methods.
Non-Invasive & Production-Safe: It requires no code changes, no service restarts, and adds no overhead to your system. This ensures safe, stable, and real-time analysis, even in high-concurrency production environments.
The Business Value We Delivered:
- Drastically reduced memory usage, turning relentless growth into stable, predictable behavior.
- Eliminated the risk of potential outages caused by memory exhaustion.
- Improved overall system performance and responsiveness.
- Significantly cut down on operational stress and wasted resources, saving the company real money.
This case study shows that even a seemingly simple memory leak can become a major roadblock for a technical team without the right professional tools. With its powerful observability and analytical capabilities, OpenResty XRay quickly gets to the core of the issue, providing clients with a clear path to a solution and seamlessly converting technical value into tangible business value.
What is OpenResty XRay
OpenResty XRay is a dynamic-tracing product that automatically analyzes your running applications to troubleshoot performance problems, behavioral issues, and security vulnerabilities with actionable suggestions. Under the hood, OpenResty XRay is powered by our Y language targeting various runtimes like Stap+, eBPF+, GDB, and ODB, depending on the contexts.
If you like this tutorial, please subscribe to this blog site and/or our YouTube channel. Thank you!
About The Author
Yichun Zhang (Github handle: agentzh), is the original creator of the OpenResty® open-source project and the CEO of OpenResty Inc..
Yichun is one of the earliest advocates and leaders of “open-source technology”. He worked at many internationally renowned tech companies, such as Cloudflare, Yahoo!. He is a pioneer of “edge computing”, “dynamic tracing” and “machine coding”, with over 22 years of programming and 16 years of open source experience. Yichun is well-known in the open-source space as the project leader of OpenResty®, adopted by more than 40 million global website domains.
OpenResty Inc., the enterprise software start-up founded by Yichun in 2017, has customers from some of the biggest companies in the world. Its flagship product, OpenResty XRay, is a non-invasive profiling and troubleshooting tool that significantly enhances and utilizes dynamic tracing technology. And its OpenResty Edge product is a powerful distributed traffic management and private CDN software product.
As an avid open-source contributor, Yichun has contributed more than a million lines of code to numerous open-source projects, including Linux kernel, Nginx, LuaJIT, GDB, SystemTap, LLVM, Perl, etc. He has also authored more than 60 open-source software libraries.
Related Articles
OpenResty XRay Jul 16, 2025

OpenResty XRay Nov 10, 2025

OpenResty XRay Nov 10, 2025

OpenResty XRay Oct 27, 2025

OpenResty XRay Sep 12, 2025


