Automatic Analysis Reports in OpenResty XRay
After months of hard work by our engineering team, OpenResty XRay can finally generate human-readable analysis reports without human intervention. OpenResty XRay now looks more like a super personal doctor who keeps watching your online software’s health 24x7, diagnosing any issues or changes, and writing detailed reports with actionable suggestions and deep insights. We’ll look at what the current reporting system can do and what it will be able to do soon
OpenResty XRay is a dynamic-tracing product that automatically analyzes your running applications to troubleshoot performance problems, behavioral issues, security vulnerabilities with actionable suggestions. Under the hood, OpenResty XRay is powered by our Y language targeting various runtimes like Stap+, eBPF+, GDB, and ODB, depending on the contexts.
The Past
Let’s look at the past first. We’ll look at the common problems for our users when using the old version of OpenResty XRay in the past. We’ll also briefly mention how the new version improves things.
The Problem of Too Many Analyzers
OpenResty XRay has provided hundreds of advanced analyzers based on dynamic-tracing technologies. And it’s still growing quickly. It’s a good thing that our users have so many analyzers under their belts, but it also has quite a learning curve for most of the users. The users must learn how to use a particular analyzer and personally run the tools against the right processes at the right time. The latter is especially tricky for online production servers where some interesting events happen intermittently, especially when the users sleep.
OpenResty XRay did support running a handful of essential analyzers periodically or upon exciting events (like CPU spikes or memory growth) by itself. However, it never ran more advanced analyzers automatically based on the current contexts and problems.
Fortunately, OpenResty XRay is now much smarter in choosing what analyzers to run against what processes and when to run them. It can also automatically analyze the results of analyzers and tools and extract useful information to decide what to do next. For example, it can determine what more specialized tools need to run in the current situation to narrow down the root cause of a problem for a particular process at a specific time. In other words, it can now do complex decision-making and problem troubleshooting independently.
The Problem of Too Many Charts and Data
OpenResty XRay collects a lot of data over time. Even though the data volume is significantly smaller than most of the monitoring systems, logging systems, and traditional APM products, it is still a lot for any human to digest daily or even hourly. All the data results in many charts, tables, and textual reports as the analyzer outputs, which can easily overwhelm humans, including ourselves. It created a bad situation where humans may feel frightened whenever they try to look at all the analyzer reports in our web console.
The new version of OpenResty XRay now gains new capabilities. It can automatically interpret an enormous amount of charts and data, combine similar ones, pick up the most typical or extreme examples, and write concise but still juicy reports that an average human user can read.
Interpreting Flame Graphs
Believe it or not, even though flame graphs are conceptually simple, we’ve found that most of the users have trouble interpreting such graphs. Even for those who believe they can, they may often miss the real clues in the graphs. This even happened often in our own engineering team!
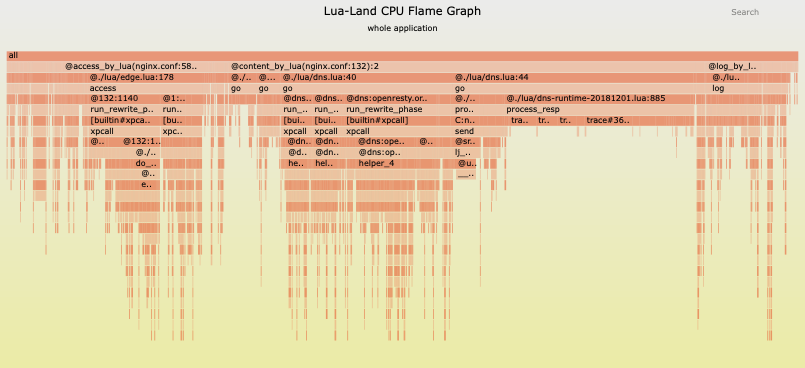
The new version of OpenResty XRay can now automatically analyze flame graphs:
- finding the hottest code paths or GC object reference path (from GC roots), recognizing common code paths on the semantic level, and
- explaining the findings (the hot spots) to a human.
The Present
OpenResty XRay now revolutionizes online software applications’ monitoring, profiling, and troubleshooting. For most of our users, all they need to do is to install the agent daemon service of OpenResty XRay and keep it running on their servers. And then, the users just read the hourly-updated daily reports or weekly reports to see any conclusions and suggestions to make their applications more efficient, stable, reliable, and secure. Our OpenResty XRay mobile apps for iPhone and Android can even push notifications for new reports or issues!
Bulletin Reports
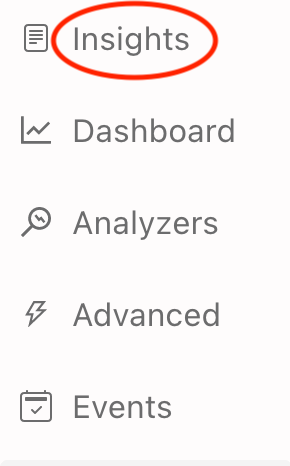
The users can check out their bulletin reports on the “Insights” page of the OpenResty XRay web console (or mobile apps).
Daily Reports
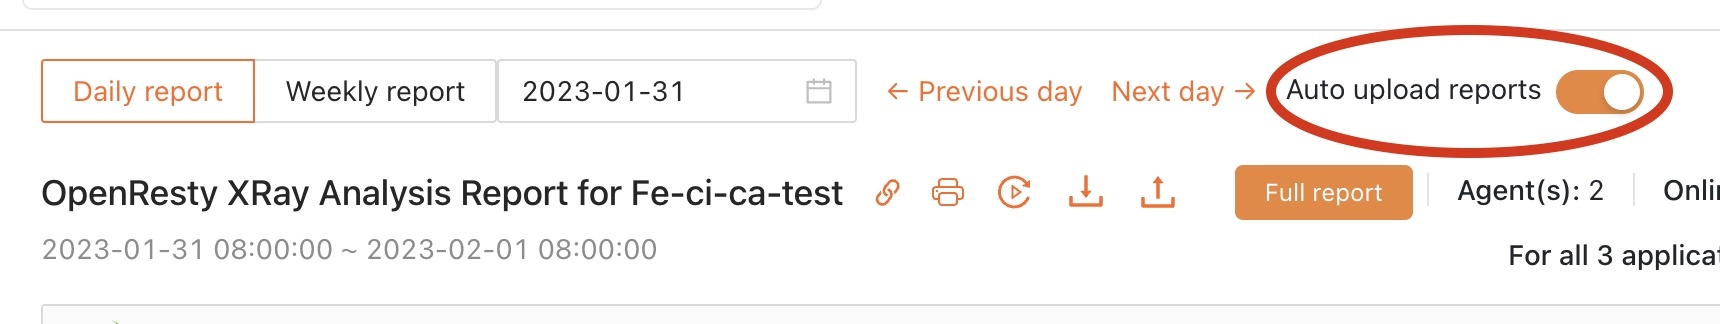
The default report shown is today’s daily report updating hourly. One can also choose a previous date’s daily report easily. Daily reports cover the time frame of a calendar day.
Each bulletin report is organized by two levels of titles. The first level is the user applications. Applications with different executable binaries and different command lines are considered different ones. And the second level is the problem types like CPU, off-CPU, Memory, and Errors & Exceptions.
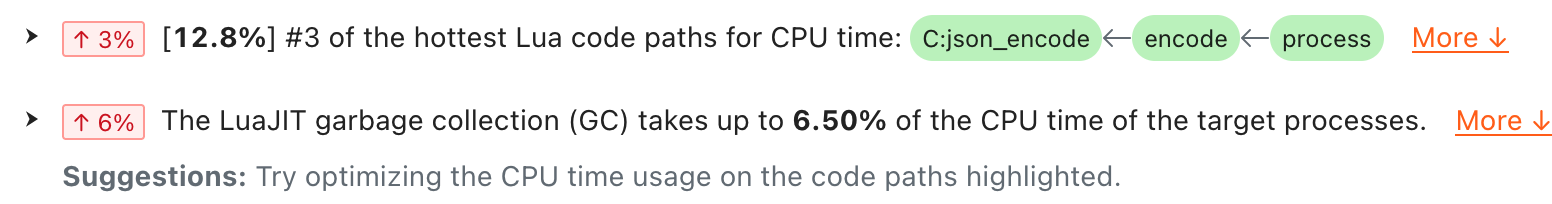
CPU Time Issues
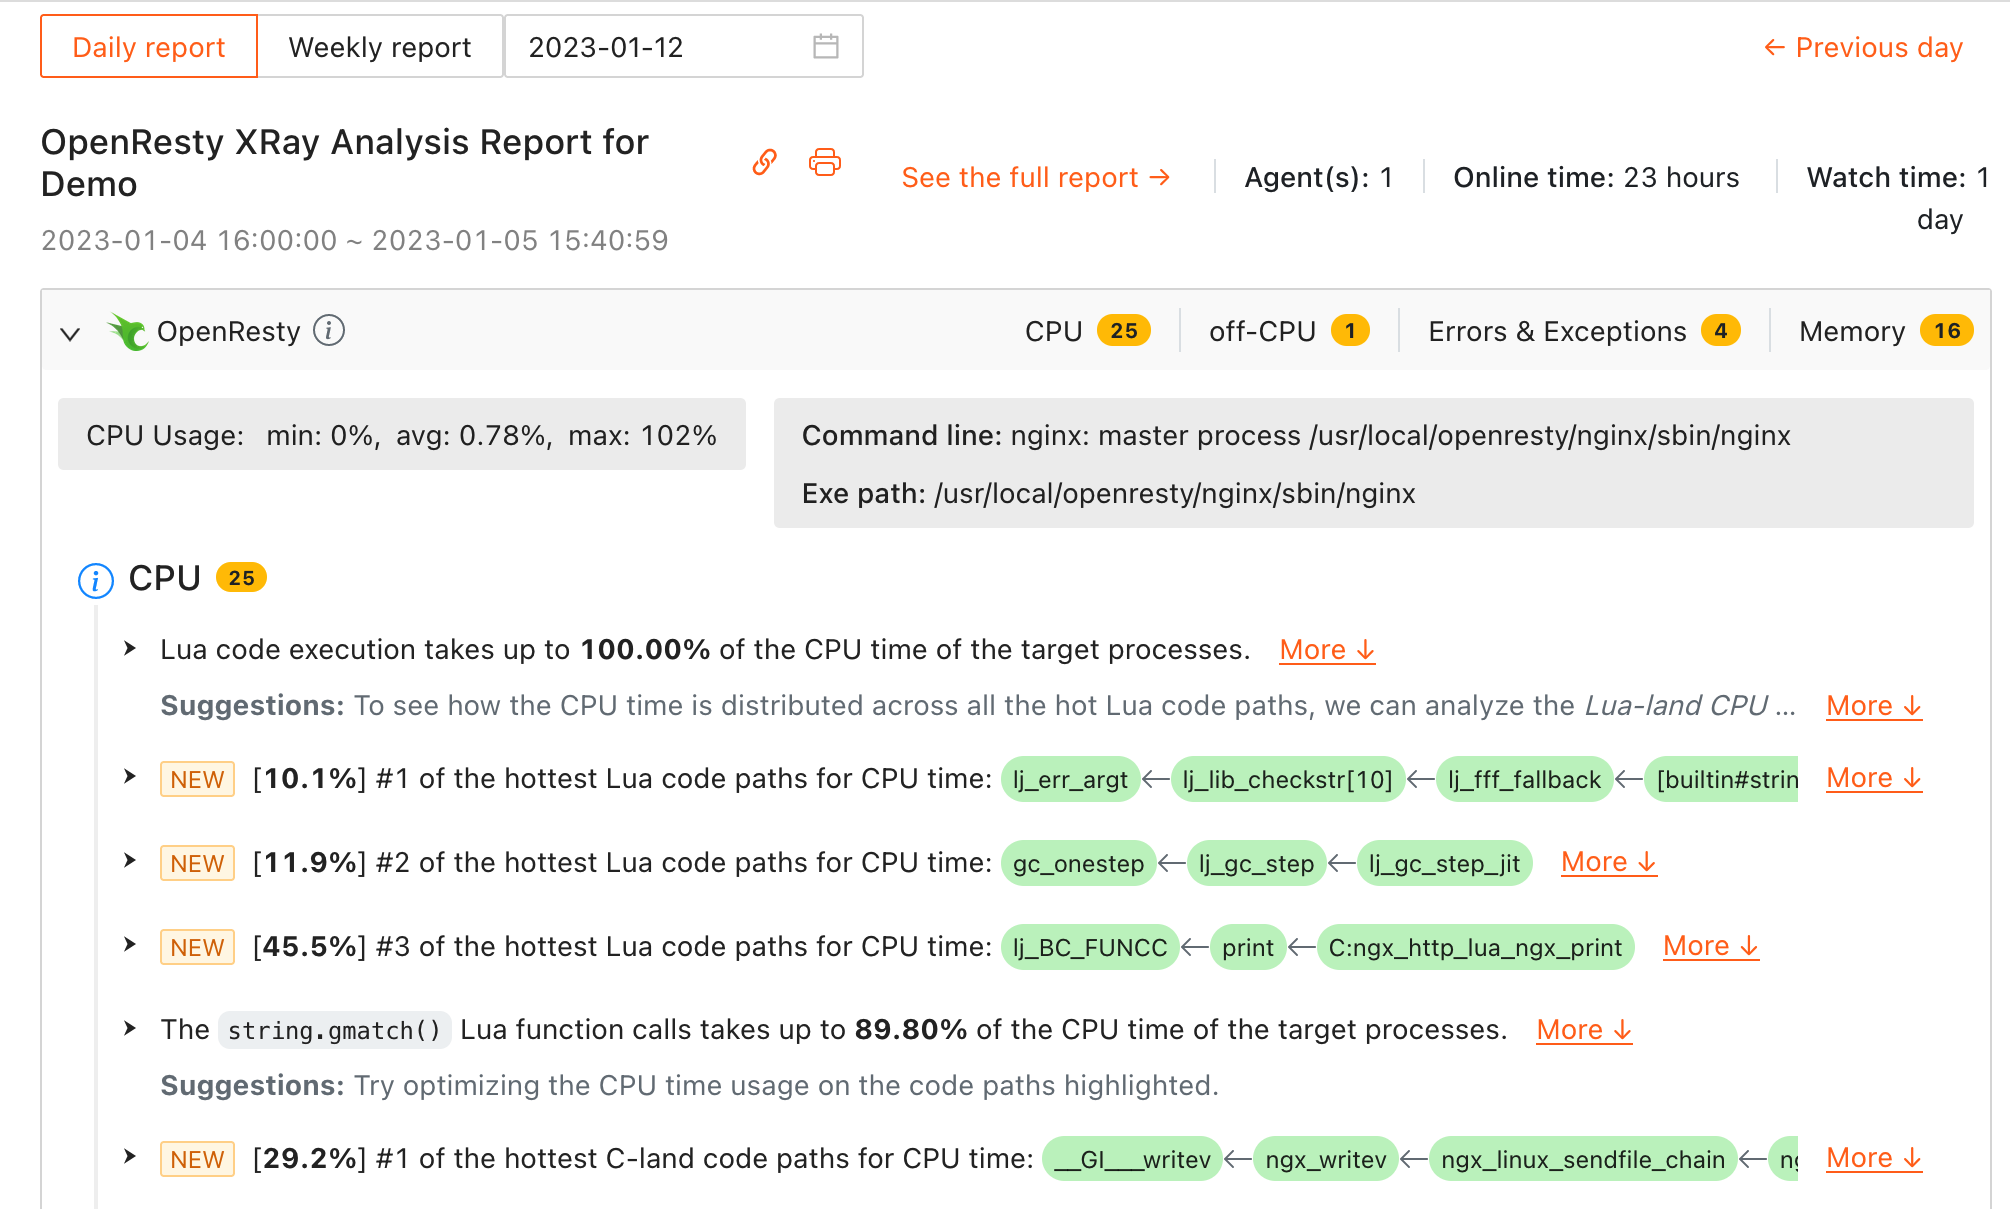
The sample report above shows some source-code-level bottlenecks in the CPU resource category. Just as most of our users already know, OpenResty XRay can quickly pinpoint deep issues on the source code level without accessing our users’ source code. Like those green boxes connected by arrows above are Lua or C code paths represented by function call chains. It is also the beauty of dynamic tracing technologies.
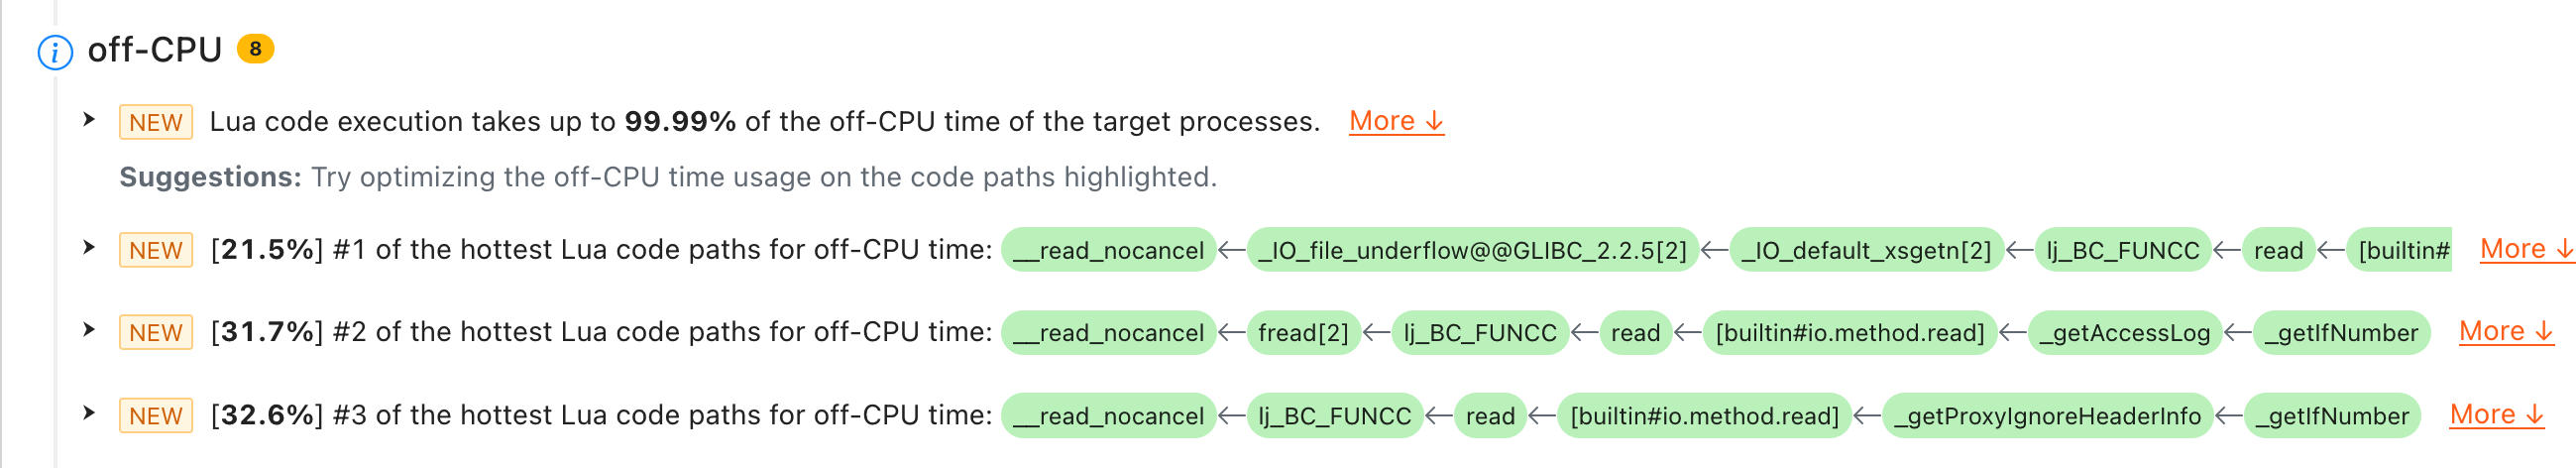
off-CPU Time Issues
Some sample bulletin issues in the off-CPU (or blocking/sleeping) problem type:
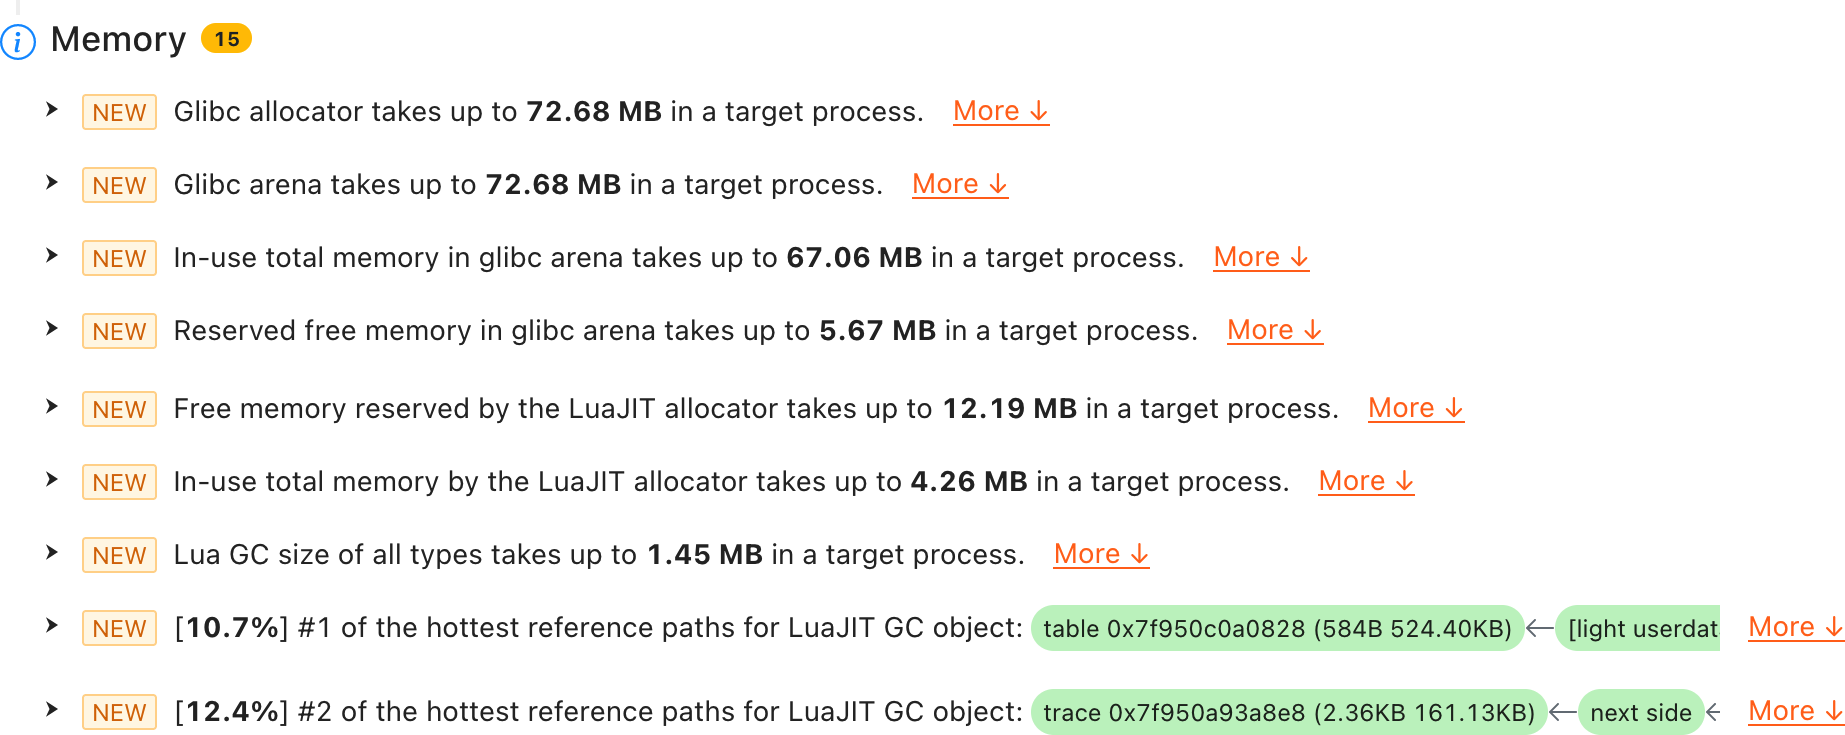
Memory Usage Issues
Do you want to know how your target application processes use your memory in production? And why are they eating up so much? We can get you covered in this Memory problem type section in the bulletin report. For OpenResty or Nginx applications, we can cover the libc (glibc or jemalloc), the Nginx memory pools, the Nginx shared memory zones, and the LuaJIT memory managed by its garbage collector (GC). Below is an example:
Errors & Exceptions
Want to know what exceptions and errors are thrown in your production machines? We get you covered under this problem type. Even those exceptions caught internally inside the target applications will show up here! Below are some samples for Lua exceptions:

More Issue Types
We’re still adding coverage for disk I/O, network I/O, latency, and security problem categories (or issue types). We’ll keep you posted.
Report Comparison & Differences
OpenResty XRay automatically computes differences or changes for each report compared to the previous one of the same time granularity. So each daily report also shows if an issue is new or gone or how its quantity value has changed since the last daily report. Note the “NEW” tags shown in the screenshot above.
Issues’ quantity value changes (up and down) as follows.

Value differences less than 5% of the previous quantity would deem equal.
Weekly Reports
Weekly reports are in the same format as daily reports. The only difference is that it spans the time range of a whole calendar week. The system automatically generates a new weekly report every time a calendar week is over.

Full Reports
The full reports are much more thorough as compared to the bulletins. The user can click the “See full report” link on a bulletin report to see the corresponding full one. Average users can skip checking full reports.
Uploading Reports for On-Prem Users
For customers using on-premise deployments of OpenResty XRay, there is also an option to automatically upload reports to the OpenResty XRay team for human expert review. Our expert team can review the machine-generated reports and schedule meetings with our customers to discuss outstanding issues in more detail. We’re still polishing the report generation engine and the knowledge base of various technical stacks, and there might still be missing bits in the automatic reports.
Automatic Inference
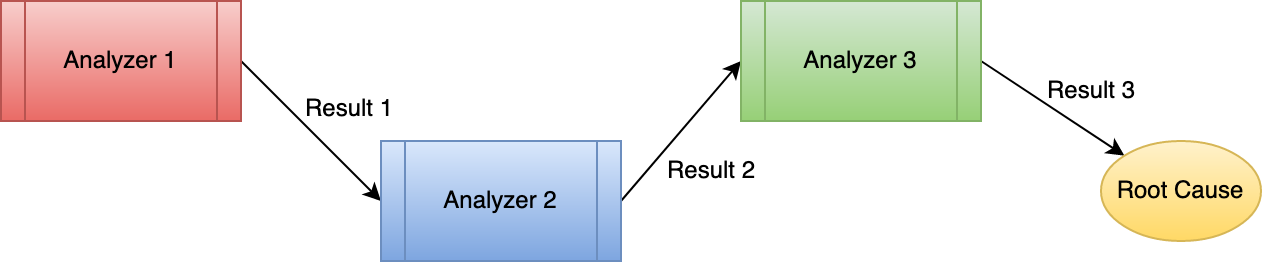
OpenResty XRay can now perform automatic inference regarding many problem types, like CPU usage, blocking or sleeping time (off-CPU), errors or exceptions, and memory usage. It first runs broader tools to get a big picture and then more specialized tools to pursue various findings in the big picture. For example, when the system sees that Gzip compression takes much CPU time. The system will then run more tools to narrow down the root causes like whether the Gzip compression level is too high or trying to compress binary resources unfriendly to Gzip compression algorithms.
When to Run What Analyzers against What Processes
OpenResty XRay uses an automatic sampling approach guided by events, timers, and system metrics. When OpenResty XRay is not sampling a running application, there is strictly zero overhead for that application (thanks to the true noninvasive nature of dynamic tracing). Even when sampling, the overhead is usually very low (below 5% or even unmeasurable).
OpenResty XRay has intelligent policies to determine when to run what tools against what application processes. It carefully chooses the appropriate analyzers to run next based on system metrics or results of other analyzers already run. The goal is to collect the right amount and the right kind of data at the first “crime scene” when something happens. It would make little sense to analyze the target processes when the problem is already gone.
Some advanced analyzers do incur much more overhead than others. OpenResty XRay also tries to minimize the overhead by reducing the execution frequency of such tools (or not running at all) or limiting the scope of the target applications (like only analyzing a single process instead of the whole process group). Such overhead control only applies to machines marked as “production” in the OpenResty XRay console. For non-production servers, getting results sooner at all costs is more convenient.
For on-Prem Users
For users of the on-premise version of OpenResty XRay, remember to enable automatic report uploading so that the OpenResty Inc. team can review the reports in time.
The Future
At present, OpenResty XRay’s automatic report generator only supports the Nginx and OpenResty applications (including those higher-level applications based on OpenResty, like Kong). However, we already have concrete analyzers and tools designed for other technical stacks like PostgreSQL, Redis, Python, and Perl. We’ll extend the support to more application types soon.
Furthermore, we’re covering more problem types or resource types like disk I/O, network I/O, latency, and security vulnerabilities.
If you are a customer, let us know if you want our reports to cover specific features sooner, and we will consider prioritizing our work.
About The Author
Yichun Zhang (Github handle: agentzh), is the original creator of the OpenResty® open-source project and the CEO of OpenResty Inc..
Yichun is one of the earliest advocates and leaders of “open-source technology”. He worked at many internationally renowned tech companies, such as Cloudflare, Yahoo!. He is a pioneer of “edge computing”, “dynamic tracing” and “machine coding”, with over 22 years of programming and 16 years of open source experience. Yichun is well-known in the open-source space as the project leader of OpenResty®, adopted by more than 40 million global website domains.
OpenResty Inc., the enterprise software start-up founded by Yichun in 2017, has customers from some of the biggest companies in the world. Its flagship product, OpenResty XRay, is a non-invasive profiling and troubleshooting tool that significantly enhances and utilizes dynamic tracing technology. And its OpenResty Edge product is a powerful distributed traffic management and private CDN software product.
As an avid open-source contributor, Yichun has contributed more than a million lines of code to numerous open-source projects, including Linux kernel, Nginx, LuaJIT, GDB, SystemTap, LLVM, Perl, etc. He has also authored more than 60 open-source software libraries.
Related Articles
OpenResty XRay Feb 14, 2023

OpenResty XRay Dec 29, 2023

OpenResty XRay Dec 25, 2023
")
OpenResty XRay Dec 25, 2023

OpenResty XRay Dec 15, 2023
")


")

")