From AI Flame Graph Analysis to Verified Fixes: A Coding-Agent Optimization Loop with OpenResty XRay
Check out how OpenResty XRay helps organizations troubleshoot issues and optimize the performance of their applications.
 Learn More
LIVE DEMO
Learn More
LIVE DEMOThe core ask in performance optimization has always been clear: turn complex CPU sampling data into a clear diagnosis and a verifiable fix. With the OpenResty XRay AI Assistant Skill, AI coding agents such as Claude Code, Codex, and Cursor can talk directly to OpenResty XRay—automatically identifying the target process, triggering an analyzer, performing AI flame graph analysis on real runtime samples, and mapping each hot spot precisely to a specific source file and line number.
For teams that have already deployed OpenResty XRay on their target machines, the real value of this combination is that it fills in the runtime context coding agents have been missing. The AI no longer relies on vague guesses about static code; it locates bottlenecks and proposes refactorings from real samples collected through dynamic tracing. Using a production-like Checkout edge service, this article shows how a coding agent, driven by real OpenResty XRay data, lifts throughput from about 336 RPS to nearly 30,000 RPS across three rounds of small, incremental refactoring.
Your coding agent isn’t short on intelligence—it’s short on runtime visibility
Coding agents like Claude Code, Codex, and Cursor are already very good at reading and refactoring code. But when you ask one to “optimize this service’s performance,” its field of view is confined to the static source files: all it can do is guess where the hot spots are based on general experience, and those guesses usually turn into inconsequential micro-optimizations.
This blind spot grows even larger in vibe-coding scenarios. When most of an application’s code is generated directly by a coding agent and the developer mainly describes requirements and reviews results, performance anti-patterns like the “repeated serialization” and “repeated scanning” we demonstrate later can quietly pile up round after round of rapid generation—the code is functionally correct and the tests pass, yet it runs far below the performance level it should reach, and the very agent that generated it has no way to notice.
For engineers who have chased performance problems by hand, the other half of the pain is just as familiar: getting a CPU flame graph often takes only a few seconds; what really eats up time is the analysis and verification that come after:
- Which piece of business code does this hot spot correspond to?
- Is it a flaw in the business logic, LuaJIT failing to JIT-compile, C-library overhead, or just network I/O?
- Should the next step be OpenResty XRay’s Lua analyzer or its native C analyzer?
- After changing the code, how do you quickly prove the hot spot really disappeared rather than moving somewhere else?
In traditional troubleshooting, an engineer has to keep switching between the terminal, the monitoring platform, the analyzer pages, and the code editor, mentally aligning the stack frames in the flame graph with the code in the editor line by line.
The OpenResty XRay AI Assistant Skill connects these two disconnected worlds: real sampling data flows through the Skill into the coding agent’s context, and “explain the flame graph → change the code → verify with a re-run” all comes together in a single terminal session, with each part playing its own role:
[ Target machine ]
  └─ OpenResty XRay Agent: non-invasive dynamic-tracing sampling
        │  real sampling reports / flame graphs
        ▼
[ OpenResty XRay AI Assistant Skill ] (MCP bridge)
        │  structured stacks + source line-number mapping
        ▼
[ coding agent ] (Claude Code / Codex / Cursor)
  └─ interpret hot spots → propose a minimal change → re-test under the same load
[ engineer ]
  └─ pose the problem, confirm the business contract, approve state-changing operations
What Is the OpenResty XRay AI Assistant Skill?
This past July we launched the AI Assistant (Beta) built into the OpenResty XRay console—so you can interpret reports and flame graphs right in the web UI. The OpenResty XRay AI Assistant Skill is another outlet for that same capability: it brings it into the coding agent you write code with every day. The console AI Assistant is good for “asking a quick question while looking at a report in the browser”; the Skill is good for “closing the entire optimization loop inside your editor and terminal”—analysis data and source code finally live in the same context.
Prerequisite: the OpenResty XRay Agent must already be installed on the target machine
Let’s be clear up front about the scope of this article: the OpenResty XRay AI Assistant Skill is not a standalone tool; it is one of the ways to connect to OpenResty XRay. All of its value rests on OpenResty XRay’s non-invasive dynamic tracing of your target application—the target application needs no code changes and no restart, but the OpenResty XRay Agent daemon that collects the data must be deployed on the target machine first. Without the Agent collecting data in the background, the Skill has nothing to read and cannot create analysis jobs.
In other words, this article is written for developers who “already have OpenResty XRay on the machine and a coding agent in the editor.” If you’re not yet an OpenResty XRay user, you can request a trial first, install the Agent, and then follow along with the hands-on steps here.
Describe the diagnostic goal in natural language
Once the Skill is installed, your conversation with the coding agent can rest directly on OpenResty XRay’s real data. The engineer poses the problem:
Check OpenResty XRay Agent 973, and confirm the current Checkout Edge OpenResty workers, load, and available analyzers.

Under the same wrk load, run a short lj-lua-on-cpu on the worker you just confirmed, and find the hottest source-code call chain.

Read the report you just finished, map the hot spot to audit.lua, and give me the minimal fix that changes only one assumption.
Through the Skill, the coding agent turns these requests into diagnostic actions aimed at OpenResty XRay, and when it returns results it preserves the full context as evidence:
- The actual target machine and PID/process;
- The worker/master process relationship;
- The analyzer name;
- The number of samples and the sampling duration;
- The source file, line number, and full call chain;
- Cross-layer stack information across LuaJIT, OpenResty, C libraries, and more.
A second confirmation for state changes: control stays with the engineer
For operations that change OpenResty XRay’s state—such as creating an analysis job—the system pops up an interactive confirmation. Before submitting the job, the Skill returns a confirmation request like this:
Confirmation required before changing XRay state.

Create a new jobs resource.

choices: approve | reject
Only after the engineer explicitly replies approve does the coding agent go on to submit the job; a reply of reject declines the operation. In other words, the coding agent will not start an analysis job on its own without authorization, while reading reports, cross-checking code, and asking follow-up questions can all happen continuously within the same conversation.
Demo case: a production-like Checkout edge service
To demonstrate this workflow, we built a Checkout Edge service close to a real project and deliberately planted several classes of performance anti-patterns commonly found in real systems (we’ll uncover them one by one below). Instead of a single simple Lua handler, it contains several typical edge-business stages:
request
 ├─ context.lua   extract request, tenant, account, and feature flags
 ├─ catalog.lua   product lookup, quoting, discounts, and recommendations
 ├─ risk.lua      User-Agent risk rules and risk decisions
 ├─ audit.lua     audit-event construction and JSON serialization
 └─ app.lua       orchestrate the request flow and emit the response
The directory structure:
demo/
├── nginx.conf
└── lua/
    ├── app.lua
    └── lib/
        ├── audit.lua
        ├── catalog.lua
        ├── context.lua
        └── risk.lua
To make it easy to reproduce, the example uses a local product catalog and in-memory rule data, with no external database; the request orchestration, auditing, risk-control, and serialization paths keep the complexity you’d expect from a production system.
Start the service and fix the load-test parameters
After entering the demo directory, start OpenResty:
cd /path/to/demo
mkdir -p logs
openresty -t -p "$PWD" -c nginx.conf
openresty -p "$PWD" -c nginx.conf -g 'daemon off;'
Send a request to verify the service is working:
curl -s \
  'http://127.0.0.1:18080/v1/checkout/quote?tenant=acme-eu&sku=edge-cache&quantity=2'
Next, use a fixed wrk command to generate the test load. In every optimization stage that follows, we keep the URL, thread count, and connection count exactly the same:
wrk -t2 -c50 -d60s --latency \
  'http://127.0.0.1:18080/v1/checkout/quote?tenant=acme-eu&sku=edge-cache&quantity=2'
Note: the throughput figures in this article’s comparison table all come from wrk runs with the same URL, thread count, and connection count; to fit the online analysis jobs, the run durations vary slightly across stages, and the data is meant to show the direction and order-of-magnitude trend of the optimizations. OpenResty XRay’s flame-graph sampling uses a separate, longer-running load so that the time spent on confirmations and analysis doesn’t affect the wrk comparison data. The two sets of experiments answer different questions: sampling answers “where is the CPU going,” and the load test answers “how does the service perform under a fixed load.” A more rigorous benchmark should also fix the load-test duration, pin CPUs, fix the worker count, and repeat over multiple rounds.
Baseline investigation: the coding agent pinpoints the 99.3% of CPU spent repeatedly serializing the audit object
The baseline code wraps the full request context, quote, risk-control result, and debug trace into a deeply nested object, then JSON-encodes it repeatedly to simulate multiple audit sinks—this is the first anti-pattern we planted:
-- Baseline: demo/lua/lib/audit.lua
local payload
for _ = 1, 120 do
    payload = cjson.encode(record)
end
return payload
On the surface, the HTTP request throws no errors and the response comes back normally. The investigation starts from the three natural-language instructions above: rather than blindly guessing at the code first, the engineer has the coding agent directly inspect the running worker and, after an approve confirmation, start the lj-lua-on-cpu analyzer to collect a Lua CPU flame graph.
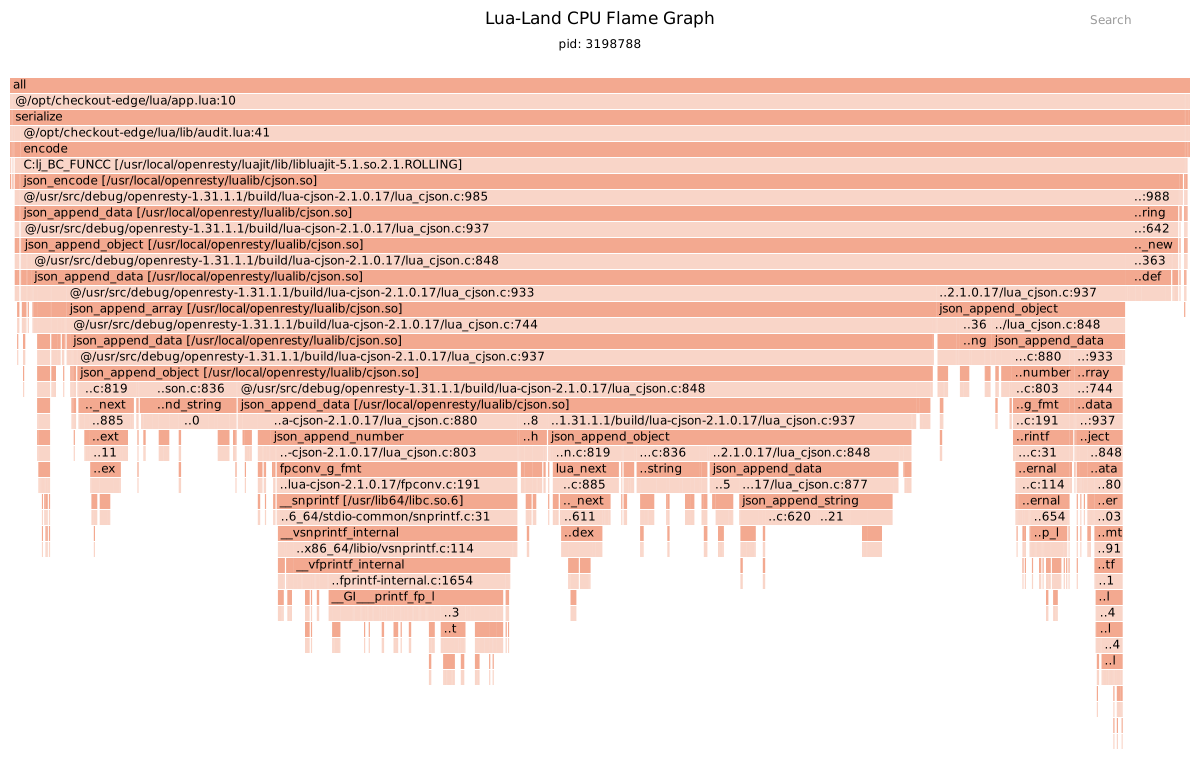
The baseline report captured in this demo:
OpenResty XRay collected 1,000 samples in about 3.5 seconds, and the CPU hot spot is highly concentrated:
| Hot spot | Inclusive CPU |
|---|---|
audit.serialize called at app.lua:10 | 99.3% |
encode at audit.lua:41 | 98.6% |
json_encode in cjson | 98.2% |
the JSON traversal path at lua_cjson.c:985 | 94.1% |
After reading the report, the coding agent reconstructs the call chain as:
app.lua
  → audit.serialize
    → cjson.encode
      → cjson recursively walks the audit object and arrays
and maps the hot spot precisely to a specific source file and line—the encode call on line 41 of audit.lua. Unlike throwing code or a screenshot at a general-purpose chatbot, the conclusion the coding agent gives here doesn’t come from static guesses about the code; it comes from reading the current worker’s real OpenResty XRay samples directly, with the sample count, process, and source line numbers all in the chain of evidence.
Of course, a flame graph can prove where the CPU samples concentrate, but it can’t decide for the engineer which fields in the audit protocol are required. This is the first decision point that a human must own.
Cut #1: trim the audit data structure (336 → 4,457 RPS)
The coding agent’s proposal and the engineer’s contract confirmation
Combining the flame graph with the audit.lua source, the coding agent’s judgment is: the audit object is too large—the full request context, the list of recommended products, and the debug trace are all stuffed into every audit record, when all the audit downstream really needs are the stable business facts (request ID, tenant, user, quote amount, currency, region, and risk-control result).
Which fields can be removed is a business contract, confirmed by the engineer. The first change, once confirmed, only shrinks the object’s size and leaves the number of serializations untouched—following the principle of “verify only one assumption at a time”:
-- Stage 1: switch to an allowlist DTO
local record = {
    schema = "checkout.audit.v2",
    event = "quote_generated",
    request_id = context.request.id,
    tenant = context.account.tenant,
    user_id = context.account.user_id,
    region = quote.region,
    currency = quote.currency,
    total = quote.total,
    risk = {
        score = risk.score,
        decision = risk.decision,
    },
    flags = {
        checkout_v2 = context.flags.checkout_v2,
        risk_v3 = context.flags.risk_v3,
    },
    emitted_at = ngx.now(),
}
Re-test under the same load; the coding agent interprets the new flame graph
The audit object shrinks from about 5.8 KB (including the debug trace) to about 281 bytes. Re-running the load test with the same wrk parameters, the service’s throughput jumps from 336 RPS / p99 182.86 ms straight to 4,457 RPS / p99 14.13 ms.
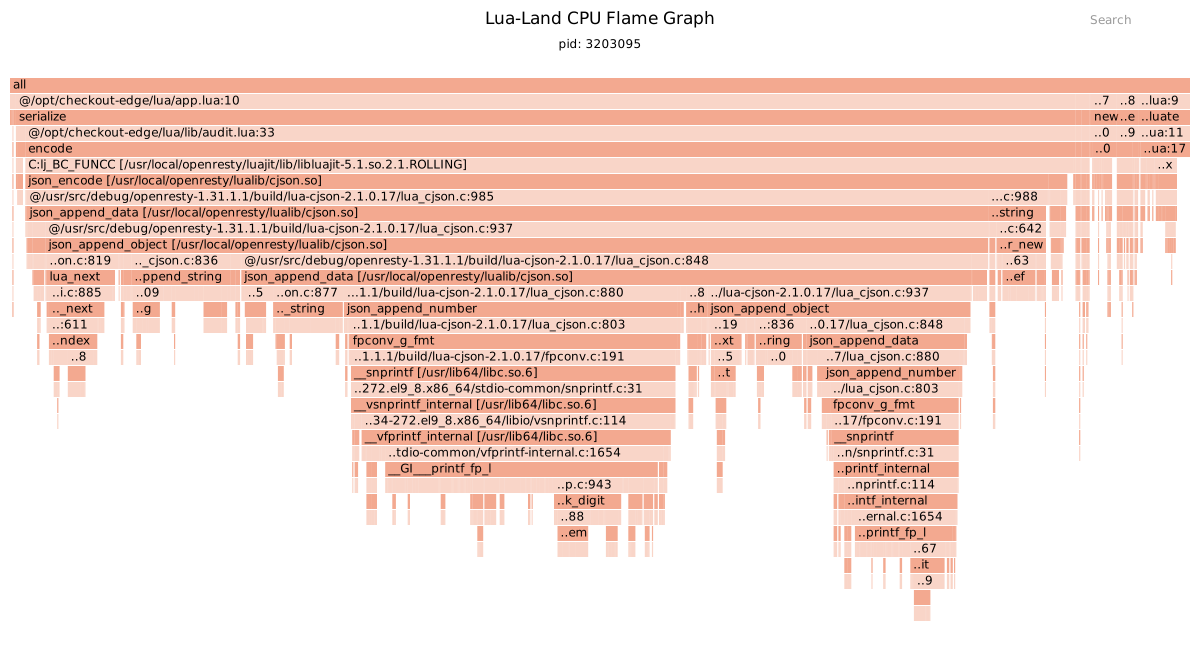
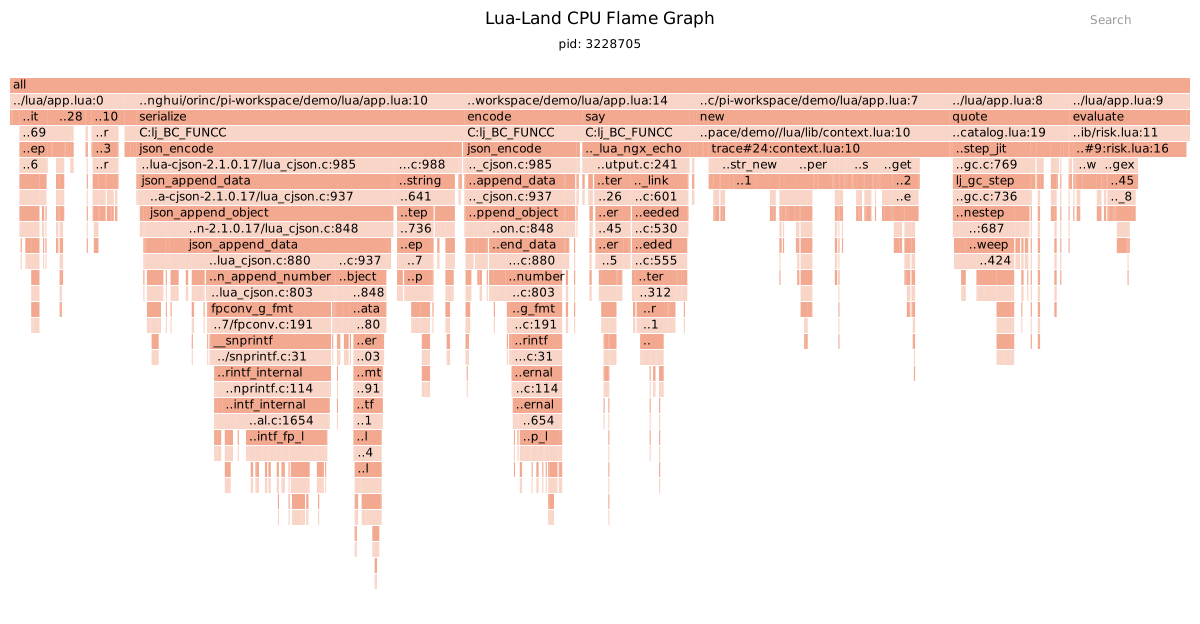
After the change, we have the coding agent pull an OpenResty XRay Lua flame graph again:
The flame graph shows that serialize still takes up 89.8% inclusive CPU, but the internal hot-spot details have shifted:
json_append_number: 28.3%;fpconv_g_fmt: 27.8%;- the libc floating-point formatting path: 23.1%.
The conclusion the coding agent draws from this is clear: shrinking the data structure delivered an order-of-magnitude gain, but “repeated serialization” is still structural waste—“did the change work” is now clearly advanced to “what should we change next.” For why JSON encoding so often becomes the bottleneck in services like this, see our earlier analysis: lua-cjson Too Slow? jit.cjson Speeds Up JSON Encoding in OpenResty 18x.
Cut #2: encode the same data only once (→ 26,028 RPS)
Since all the audit sinks consume the same data, there’s no need to re-walk the Lua table for each sink. The second change keeps only a single encode:
-- Stage 2: keep the DTO, encode to JSON only once
function _M.serialize(context, quote, risk)
    local record = build_audit_record(context, quote, risk)
    return cjson.encode(record)
end
This step doesn’t swap out the JSON library; it simply removes 119 rounds of entirely redundant work.
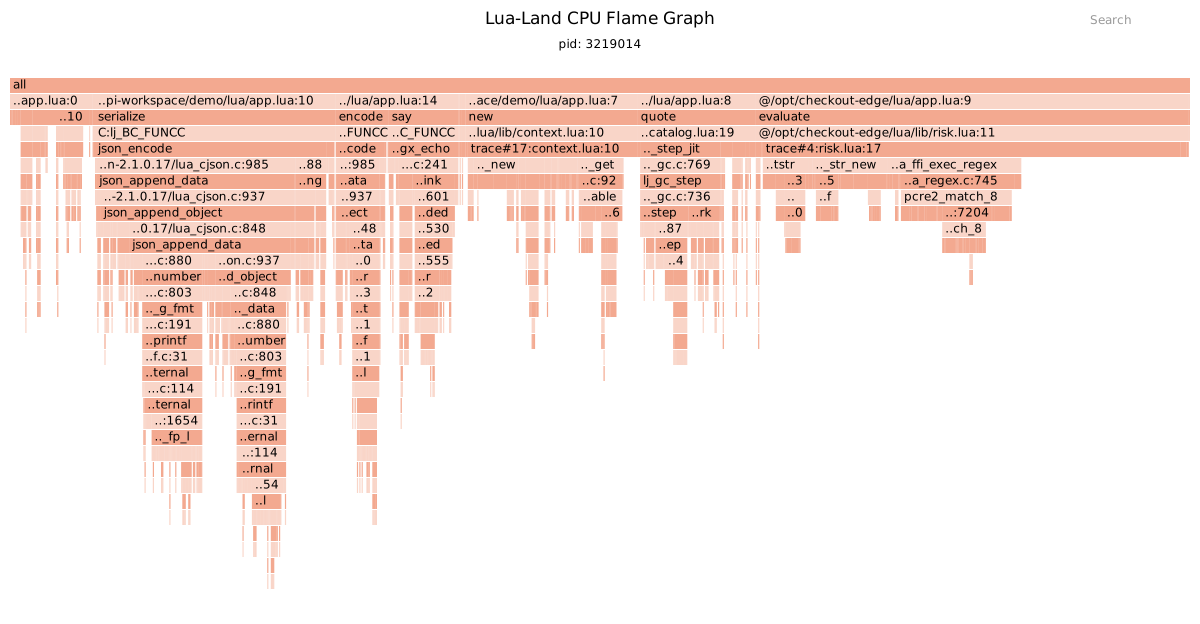
Re-testing Stage 2, throughput shoots up to 26,028 RPS / p99 13.96 ms. When we then have the coding agent read the next round’s Lua flame graph, the audit-serialization cost no longer dominates the screen:
OpenResty XRay’s sampling exposes the business paths hiding one layer down:
- Request-context creation: 14.4% inclusive CPU;
- The risk-rule call chain accounts for about 36.7% inclusive, of which the
pcre2_match_8sub-path is about 9.4%; - Product quoting and the LuaJIT GC path account for about 6.6%.
This is a common phenomenon in performance tuning: it’s not that a second hot spot suddenly appeared, but that once the first major bottleneck is removed, the secondary bottleneck finally gets a chance to surface.
Switching between the Lua and C perspectives: writev looks wide, but it isn’t the business bottleneck
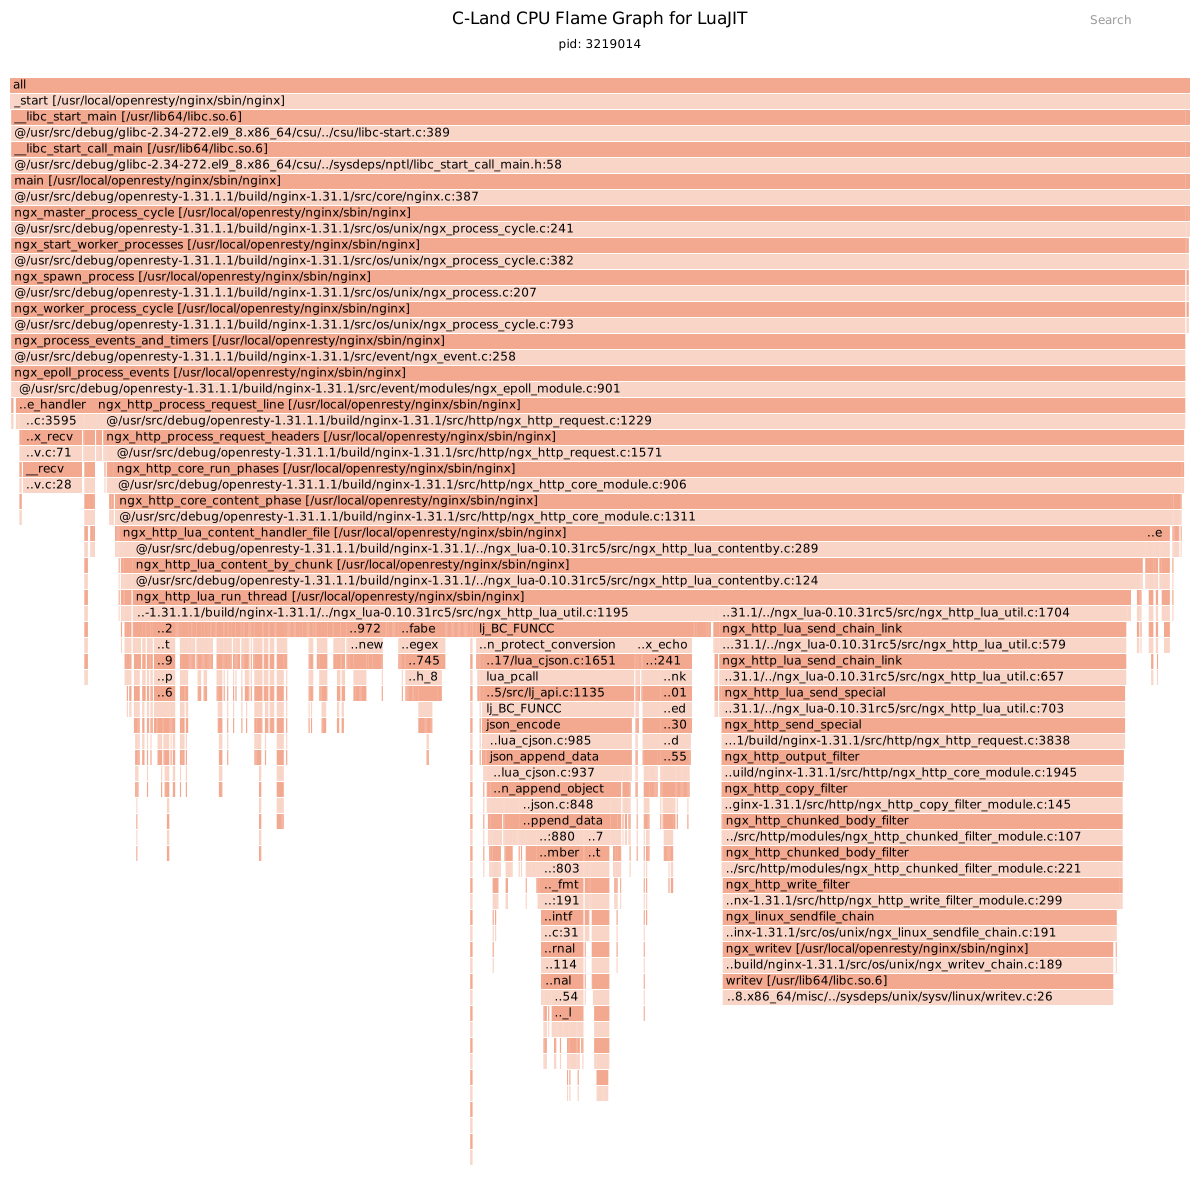
From the OpenResty XRay Lua flame graph just above, the risk-control module is worth analyzing further, but it mixes Lua loops, string handling, Nginx regex FFI, and the native matcher. Based on the native paths that actually appear in the report, the coding agent suggests switching perspective: start OpenResty XRay’s LuaJIT-aware C on-CPU analyzer on the same Stage 2 worker—rather than mechanically following a fixed troubleshooting checklist:
The C-level flame graph vividly shows the value of cross-layer analysis:
pcre2_match_8is only 3.1% inclusive CPU;writevaccounts for 33.0% inclusive, with a self weight of 330 / 1,000 = 33.0%—the denominator is this flame graph’s total weight, not the end-to-end request count;json_append_objectis about 10.4%.
Here the coding agent gives a key hint: writev is mostly the cost of writing out the response data and of the network transport layer, not the root cause in the Checkout risk-control business logic. You shouldn’t rush to change business code just because it looks wide in the C flame graph—response size, the load-test client, and network bottlenecks should be evaluated separately.
This is exactly the strength of OpenResty XRay’s combined Lua/C two-perspective analysis:
- The Lua flame graph helps us pinpoint the business code and call chains precisely;
- The C flame graph helps us confirm the real execution cost at the native layer;
- Together, the two avoid both mistaking network-transport overhead for a business bottleneck and pinning all the repeated Lua-side logic on PCRE.
Cut #3: eliminate the equivalent 12x repeated scan (→ 29,968 RPS)
The coding agent locates the risk-control anti-pattern
Following the risk-control call chain in the Lua flame graph, the coding agent reads the risk.lua source and finds that the baseline risk-control code scans 8 User-Agent patterns 12 times over—this is the second anti-pattern we planted:
for _ = 1, 12 do
    for i = 1, #suspicious_agents do
        local from = ngx.re.find(agent, suspicious_agents[i], "ijo")
        if from then
            score = score + 1
        end
    end
end
You can’t simply delete the outer loop here, because the baseline logic accumulates 12 points for every rule that matches—the risk score is part of the business contract. This is another decision point owned by the engineer: the scoring semantics must stay unchanged.
Keep the scoring logic, trim the number of scans
The Stage 3 change: hoist the stable regex options to module level so that each rule runs only once per request, while preserving the original weight of 12 points:
-- Stage 3
local RULE_OPTIONS = "ijo"

for i = 1, #suspicious_agents do
    local pattern = suspicious_agents[i]
    local from = ngx.re.find(agent, pattern, RULE_OPTIONS)
    if from then
        -- keep the existing risk-score contract
        score = score + 12
        hits[pattern] = true
    end
end
The “equivalence” here has explicit preconditions: agent, the rule array, and the rule options don’t change within a single request; ngx.re.find hasn’t been replaced by business code with a side-effecting function; hits[pattern] = true is an idempotent write; and there’s no other logic in the loop that depends on intermediate state. Under these preconditions, the baseline’s “add 1 point per matching rule, repeated 12 times” is equivalent to the final version’s “add 12 points at once per matching rule.” If a real project’s risk-control rules modify the context, depend on counting order, or have other side effects, you can’t apply this transformation directly—you must add regression cases for the decision result and the reason codes.
This change achieves:
- Keeping the rule set, matching options, risk decision, and audit result completely unchanged;
- Removing the equivalent 12x repeated scan, greatly reducing the number of Lua control-flow, string-handling, and regex-FFI calls;
- Using
ngx.re’sooption (once-compilation) to reuse the compiled regex pattern.
If you suspect your service’s bottleneck really is in a particular regex itself, you can pinpoint the specific pattern using the method in Nginx Regex Performance: Find Slow Patterns with Dynamic Tracing.
After the change, have the coding agent pull the final OpenResty XRay report:
At this point the CPU hot-spot distribution inside the application has been reshuffled:
- JSON response serialization: 27.8%;
- Request-context creation: 21.4%;
- The product-quoting path: 10.2% (of which LuaJIT GC is about 6.6%);
- The risk-assessment module’s cost has dropped to 9.9%.
By this point, the marginal return from further optimizing the risk-control regex is low. If the next round of optimization proceeds, it should first evaluate the response schema, context-object allocation, and the product catalog’s data structure—and that decision, too, still comes from OpenResty XRay’s sampling data rather than from the coding agent’s imagination about the code.
Comparing the data across three optimization rounds, and the limits of the method
| Version | Main change | RPS | p99 latency | Hot spot observed by OpenResty XRay |
|---|---|---|---|---|
| Complex baseline | Full audit object, encoded 120 times | 336 | 182.86 ms | audit.serialize at 99.3% |
| Stage 1 | Audit object switched to an allowlist DTO | 4,457 | 14.13 ms | serialize down to 89.8%, floating-point formatting emerges |
| Stage 2 | Encode the same DTO only once | 26,028 | 13.96 ms | Context creation, risk control, and catalog paths emerge |
| Stage 3 | Run each risk rule once, reuse the compiled regex | 29,968 | 2.97 ms | Risk-assessment cost down to 9.9% |
Once more, to be clear: the load tests in this article’s examples have slightly different run durations across stages to fit the online analysis jobs, and the table’s data is meant to show the direction and order-of-magnitude trend of the optimizations. Before changing an actual production service, we recommend verifying with fixed-duration load tests and a full regression suite.
At the same time, we need to be clear-eyed about the limits of this workflow:
- Business decisions are owned by the engineer. Whether an audit field can be removed, and how the risk-score contract should be defined—the coding agent can only propose hypotheses based on the code and the samples; the final call still depends on the engineer’s understanding of the business protocol and on test verification.
- The coding agent gives evidence-backed inferences, not absolute truth. For every optimization suggestion, the engineer should go back to OpenResty XRay’s original report and cross-check—which is exactly why the OpenResty XRay AI Assistant Skill always includes report links and sample counts when it returns results.
- It depends heavily on an environment with the OpenResty XRay Agent already deployed. Without the Agent collecting data in real time in the background, this automated troubleshooting loop can’t run.
- This article only validated two analyzers. What was actually run and verified are
lj-lua-on-cpuandlj-c-on-cpu. The capability list for this target machine shows more directions—Lua off-CPU (lj-lua-off-cpu); memory- and GC-related diagnostics (lj-err-mem,lj-lua-newgco-size,lj-lua-tab-resize,lj-free-stats); LuaJIT runtime inspections (collect-luajit-ffnames,lj-func-events,lj-jit-state); and more—but those are not the same as having been run in this article’s experiments. Whether a specific analyzer is available also depends on the target runtime, the Agent version, OS dependencies, permissions, and whether the current process is correctly discovered; nor should you treat on-CPU results as off-CPU, memory, or GC conclusions. - On the coding-agent side, only the current Skill was validated. See the official docs for how Claude Code, Codex, Cursor, and other MCP-compatible clients connect, but this article can’t substitute for per-version compatibility testing of each client. In addition, short sampling, an offline target, a finished load, or insufficient samples will all leave a report unable to support strong conclusions.
Try the OpenResty XRay AI Assistant Skill
If your team already uses MCP-capable AI coding agents like Claude Code, Codex, or Cursor in day-to-day development, and OpenResty XRay is already installed on the target machine, you can log in to the OpenResty XRay web console at any time and get the connection configuration and installation guide from the MCP Server & Agent Skill entry.
Once configured, whether in development, testing, or live troubleshooting, you can interact in natural language right inside the coding agent:
- “Which OpenResty worker is consuming the most CPU?”
- “Pull a Lua flame graph and help me confirm whether this really is a business-code hot spot.”
- “If the Lua-side cost isn’t obvious, use the C analyzer to check the native-layer cost too.”
- “Map the hot spots in the OpenResty XRay report straight to the source code, and give me the smallest, easiest-to-roll-back fix.”
For teams building applications quickly with vibe coding, this loop means even more. The two anti-patterns we planted in the demo—repeated serialization and repeated scanning—are exactly the kind of invisible performance debt AI-generated code accumulates: functionally correct, tests green, yet running far below its potential. When the one writing the code and the one verifying performance are the same coding agent, every hot-path snippet can be checked on the spot against OpenResty XRay’s real samples—so optimizing the performance of vibe-coded code happens during development, rather than surfacing as performance debt only after launch. This is exactly how “writing fast with AI” and “writing higher-performance applications” can be had at the same time.
The OpenResty XRay AI Assistant is currently in Beta, and we warmly welcome your feedback on the diagnostic experience in real use and on the additional data scenarios you’d like us to support.
If you haven’t installed OpenResty XRay yet, you’re welcome to request a free trial and run through the entire optimization flow shown in this article in your own environment.
FAQ
What are the prerequisites for the AI Assistant Skill?
The OpenResty XRay Agent daemon must already be installed and running on the target machine, and the AI coding agent you use must support the MCP protocol (such as Claude Code, Codex, or Cursor). The Skill itself collects no data—what it reads is the runtime samples OpenResty XRay collects through non-invasive dynamic tracing. The target application needs no code changes and no restart.
How does it relate to the AI Assistant in the OpenResty XRay console?
They are two outlets for the same AI Assistant capability. The console AI Assistant is built into the web console and is good for asking questions directly while reading a report; the AI Assistant Skill plugs into your coding agent, bringing analysis data and source code into the same context, which suits completing the full “interpret → change code → verify with a re-run” loop. Both are currently in Beta.
Will the AI run an analysis job on my machine without authorization?
No. Creating an analysis job is an operation that changes OpenResty XRay’s state and requires an explicit confirmation gate. Only reading existing reports, cross-checking code, and asking follow-up questions can happen directly in the conversation.
How is this different from pasting a flame-graph screenshot into ChatGPT?
A general-purpose chatbot can only see the image or text you paste, and its conclusion is essentially a guess about the code. The AI Assistant Skill reads the sampling-level data OpenResty XRay collects directly: the actual process, sample count, source files, line numbers, and cross-layer call chains are all in the chain of evidence, and the conclusions can be cross-checked line by line against the original report.
Can an AI coding agent analyze a flame graph accurately?
Yes—when the analysis is grounded in real sampling data rather than a screenshot. Through the OpenResty XRay AI Assistant Skill, the coding agent works from the samples OpenResty XRay actually collected: it knows which worker it profiled, how long the sampling ran, and which source line each hot stack frame maps to, so every conclusion can be cross-checked against the original report. It still produces evidence-backed hypotheses rather than absolute truth—business decisions stay with the engineer.
How do I optimize the performance of vibe-coded (AI-generated) code?
If the application runs on a machine where OpenResty XRay is already deployed, connect the coding agent that generated the code to OpenResty XRay’s real runtime samples through the AI Assistant Skill. AI-generated code is often functionally correct with passing tests yet quietly slow—anti-patterns like repeated serialization and repeated scanning pile up unnoticed. Reading real flame-graph data during development lets the same agent catch its own performance debt before launch. Note the Skill is not a standalone tool: without the OpenResty XRay Agent collecting samples on the target machine, it has nothing to read.
What is OpenResty XRay
OpenResty XRay is a dynamic-tracing product that automatically analyzes your running applications to troubleshoot performance problems, behavioral issues, and security vulnerabilities with actionable suggestions. Under the hood, OpenResty XRay is powered by our Y language targeting various runtimes like Stap+, eBPF+, GDB, and ODB, depending on the contexts.
If you like this tutorial, please subscribe to this blog site and/or our YouTube channel. Thank you!
About The Author
Yichun Zhang (Github handle: agentzh), is the original creator of the OpenResty® open-source project and the CEO of OpenResty Inc..
Yichun is one of the earliest advocates and leaders of “open-source technology”. He worked at many internationally renowned tech companies, such as Cloudflare, Yahoo!. He is a pioneer of “edge computing”, “dynamic tracing” and “machine coding”, with over 22 years of programming and 16 years of open source experience. Yichun is well-known in the open-source space as the project leader of OpenResty®, adopted by more than 40 million global website domains.
OpenResty Inc., the enterprise software start-up founded by Yichun in 2017, has customers from some of the biggest companies in the world. Its flagship product, OpenResty XRay, is a non-invasive profiling and troubleshooting tool that significantly enhances and utilizes dynamic tracing technology. And its OpenResty Edge product is a powerful distributed traffic management and private CDN software product.
As an avid open-source contributor, Yichun has contributed more than a million lines of code to numerous open-source projects, including Linux kernel, Nginx, LuaJIT, GDB, SystemTap, LLVM, Perl, etc. He has also authored more than 60 open-source software libraries.
Related Articles
OpenResty XRay Jul 14, 2026

OpenResty XRay Sep 21, 2023

OpenResty XRay Jul 28, 2023

OpenResty XRay Jul 15, 2023

OpenResty XRay Jul 15, 2023