Install OpenResty XRay’s Agents on Kubernetes cluster
When your applications run in Kubernetes containers, OpenResty XRay Agent can be directly deployed in your K8s environment. This article will guide you step-by-step on how to install the OpenResty XRay Agent service on a Kubernetes cluster, enabling automated analysis and diagnostics for various applications and containers within your systems.
Logging in to the Console
Let’s log in.
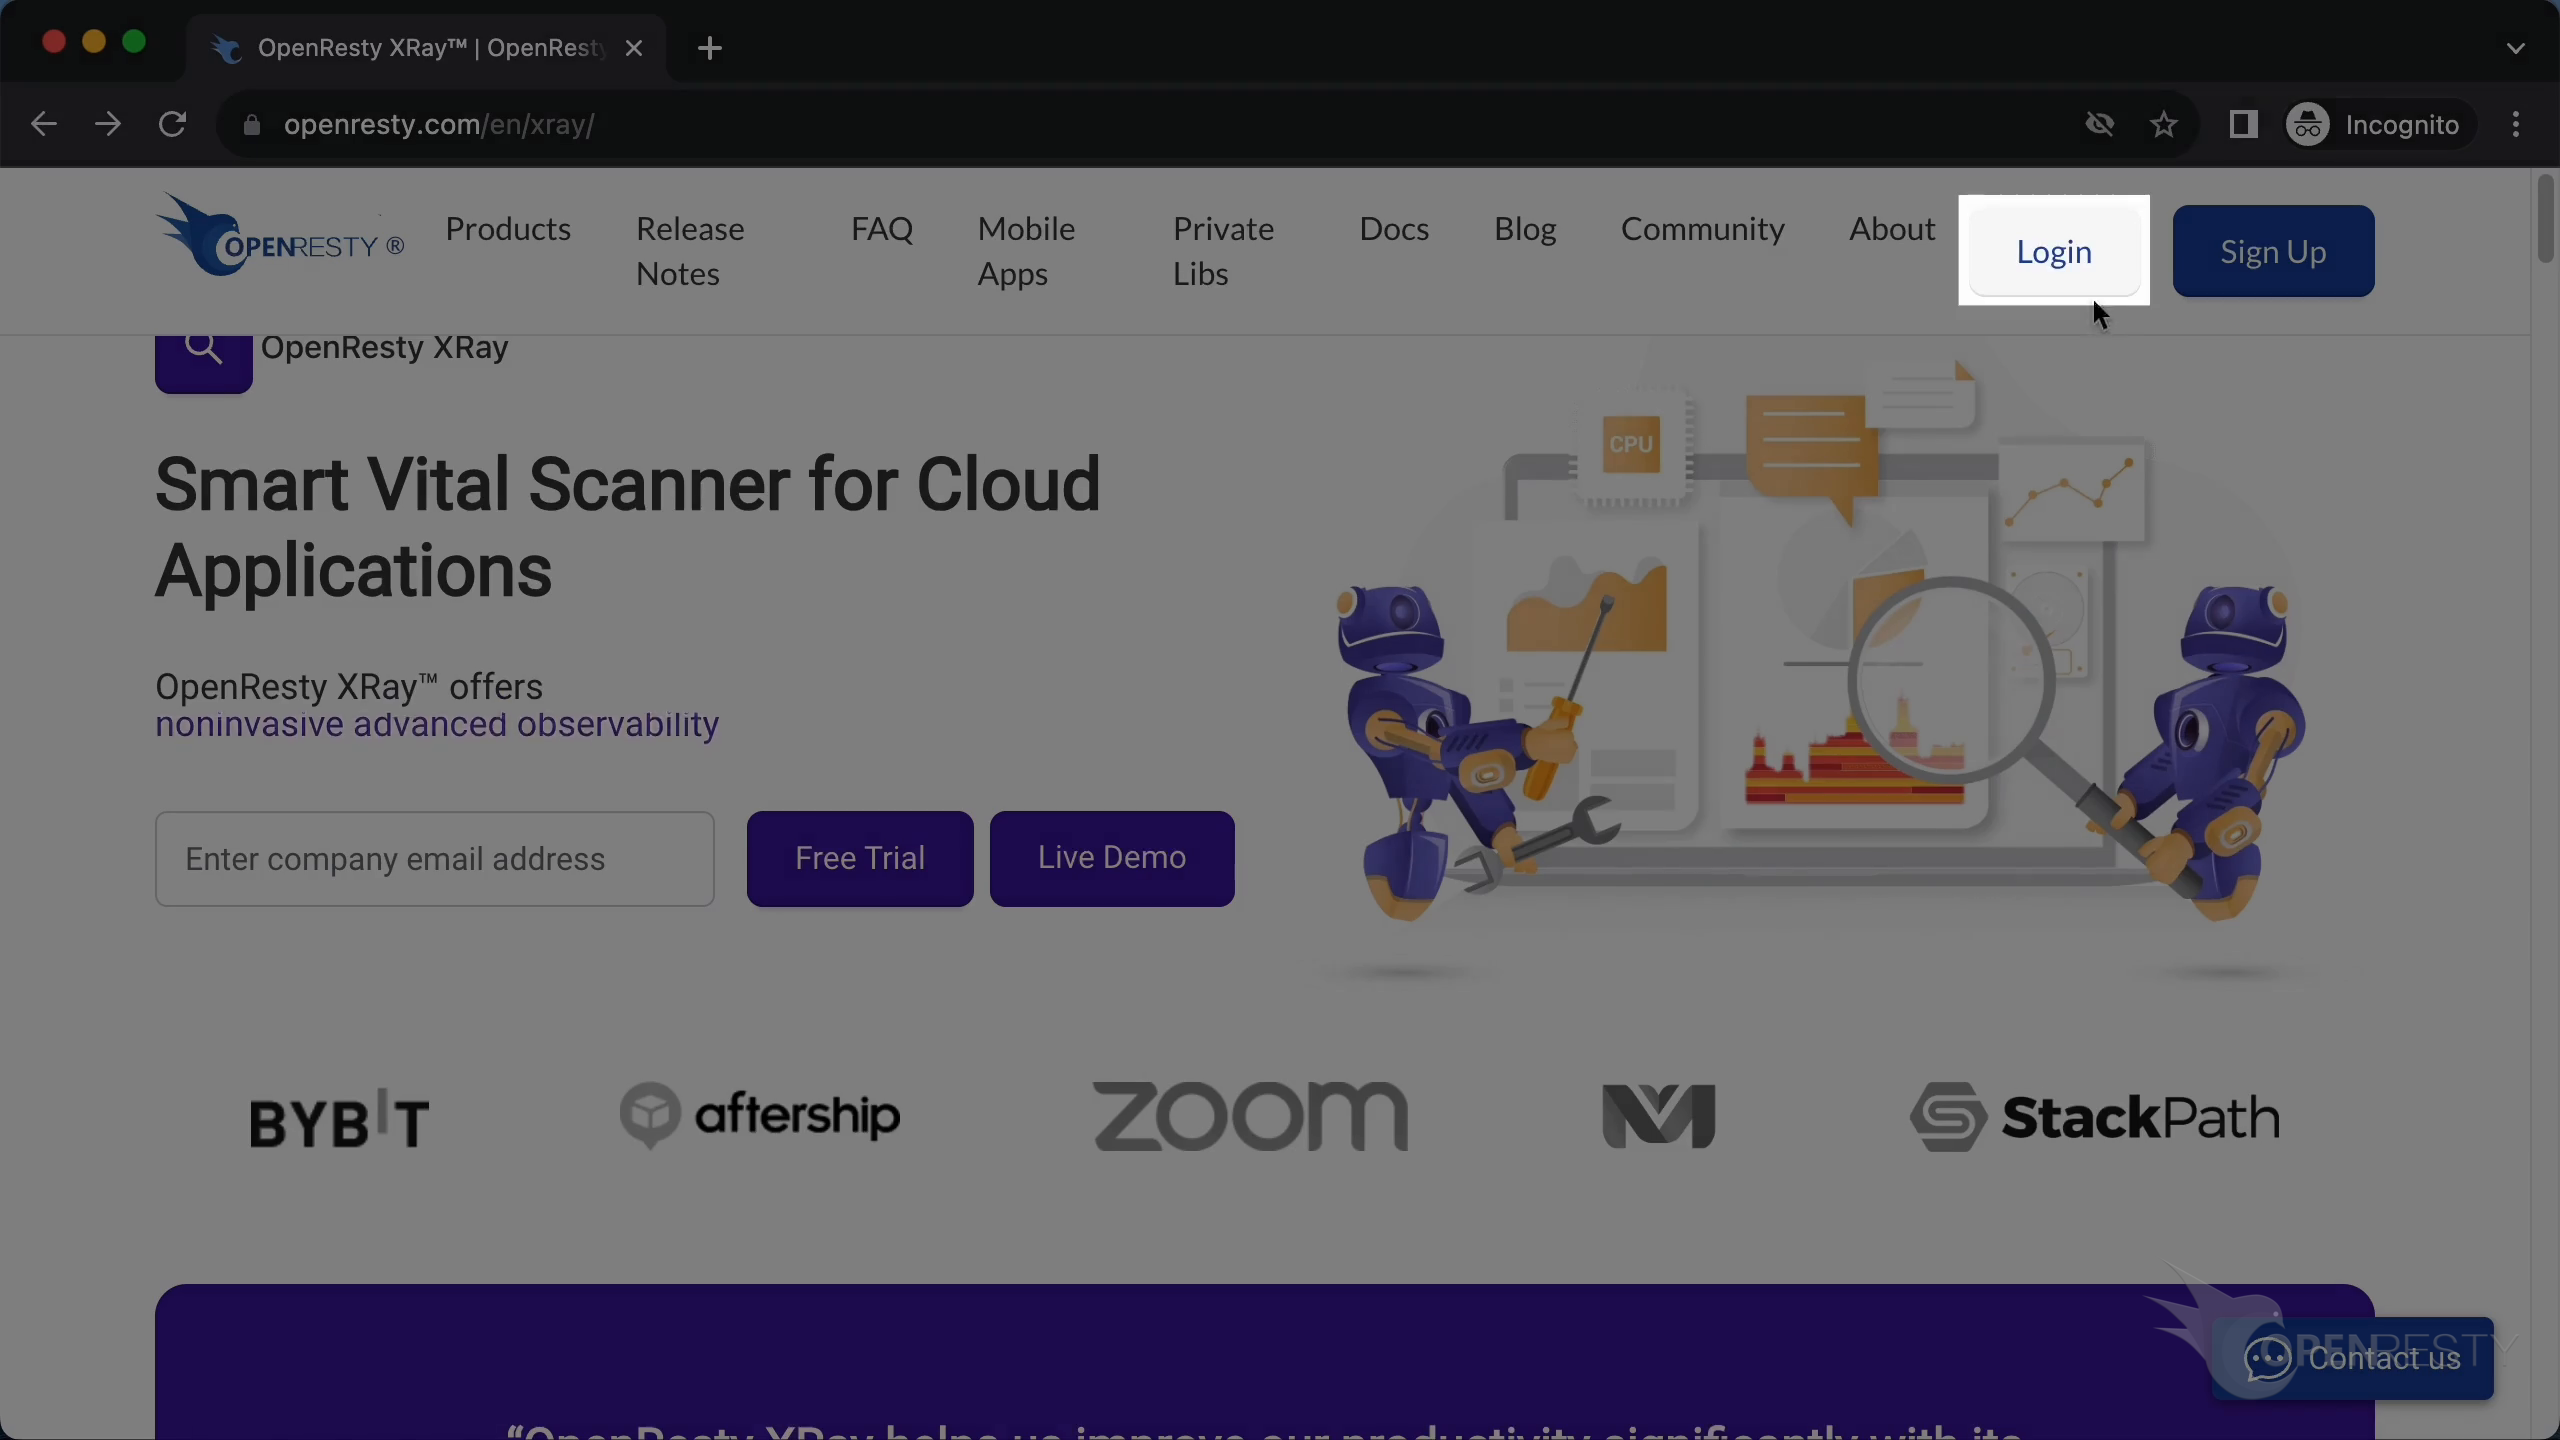
Click on “Go to console”.
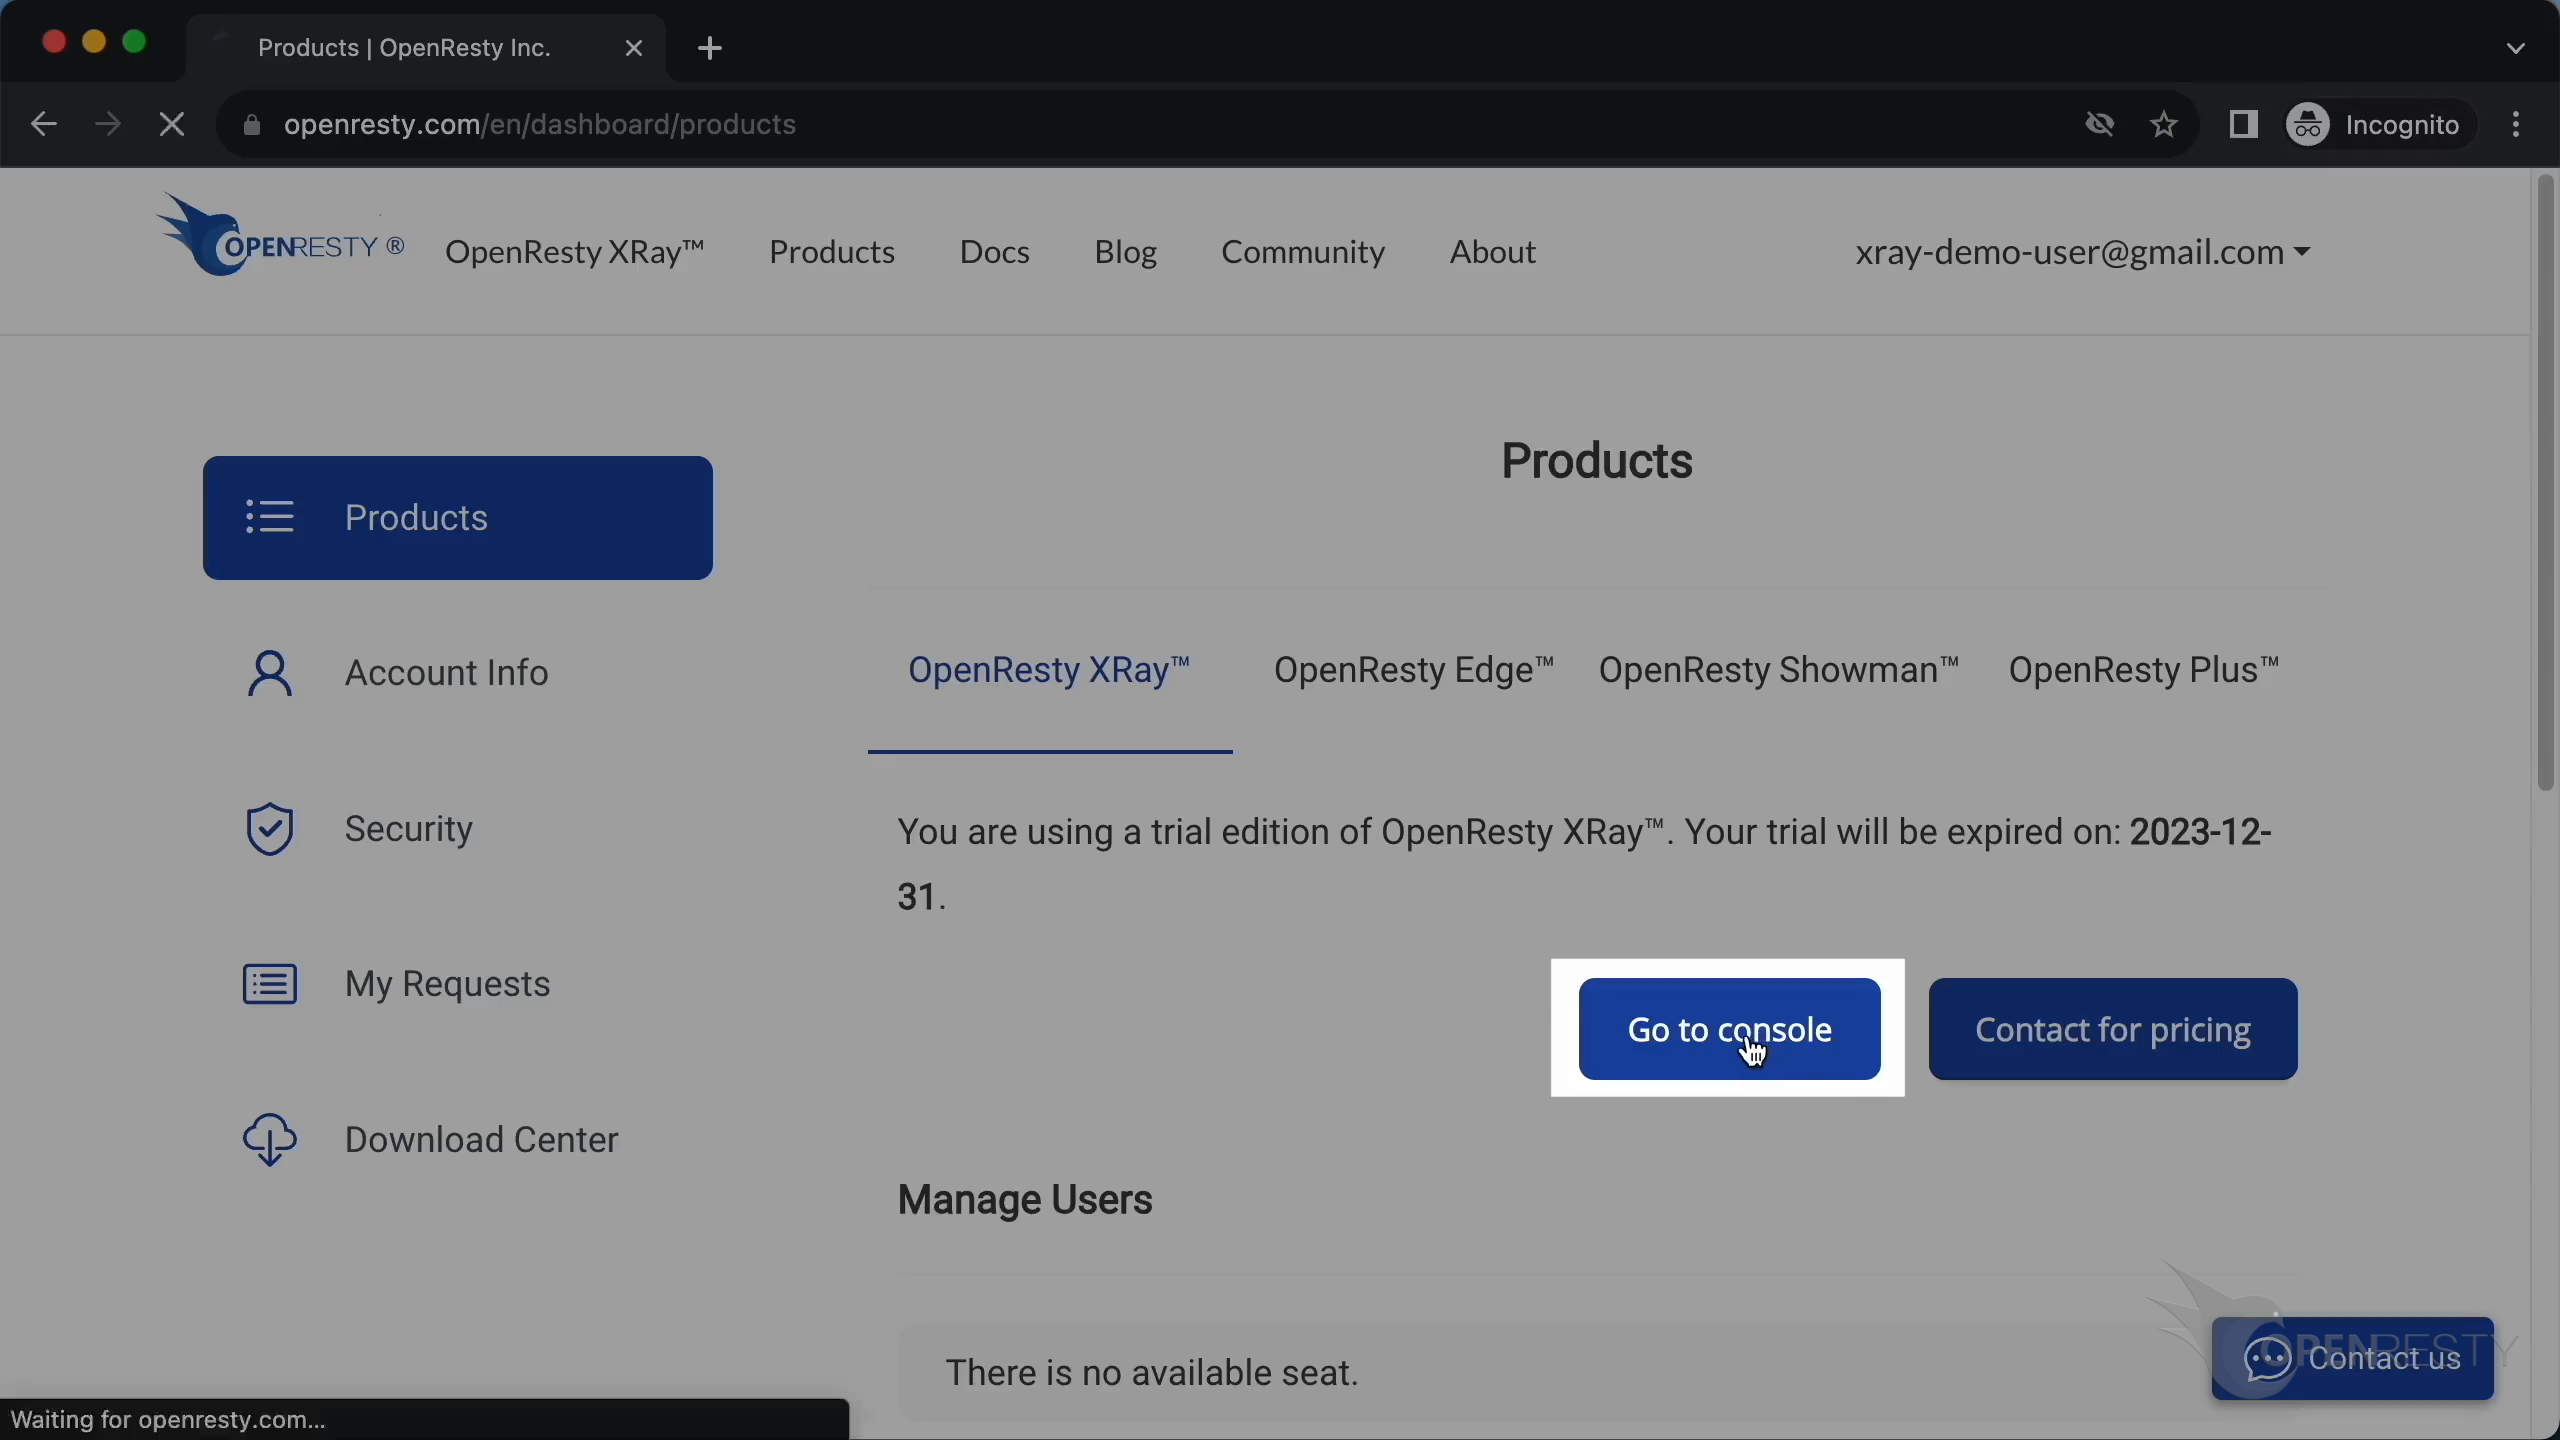
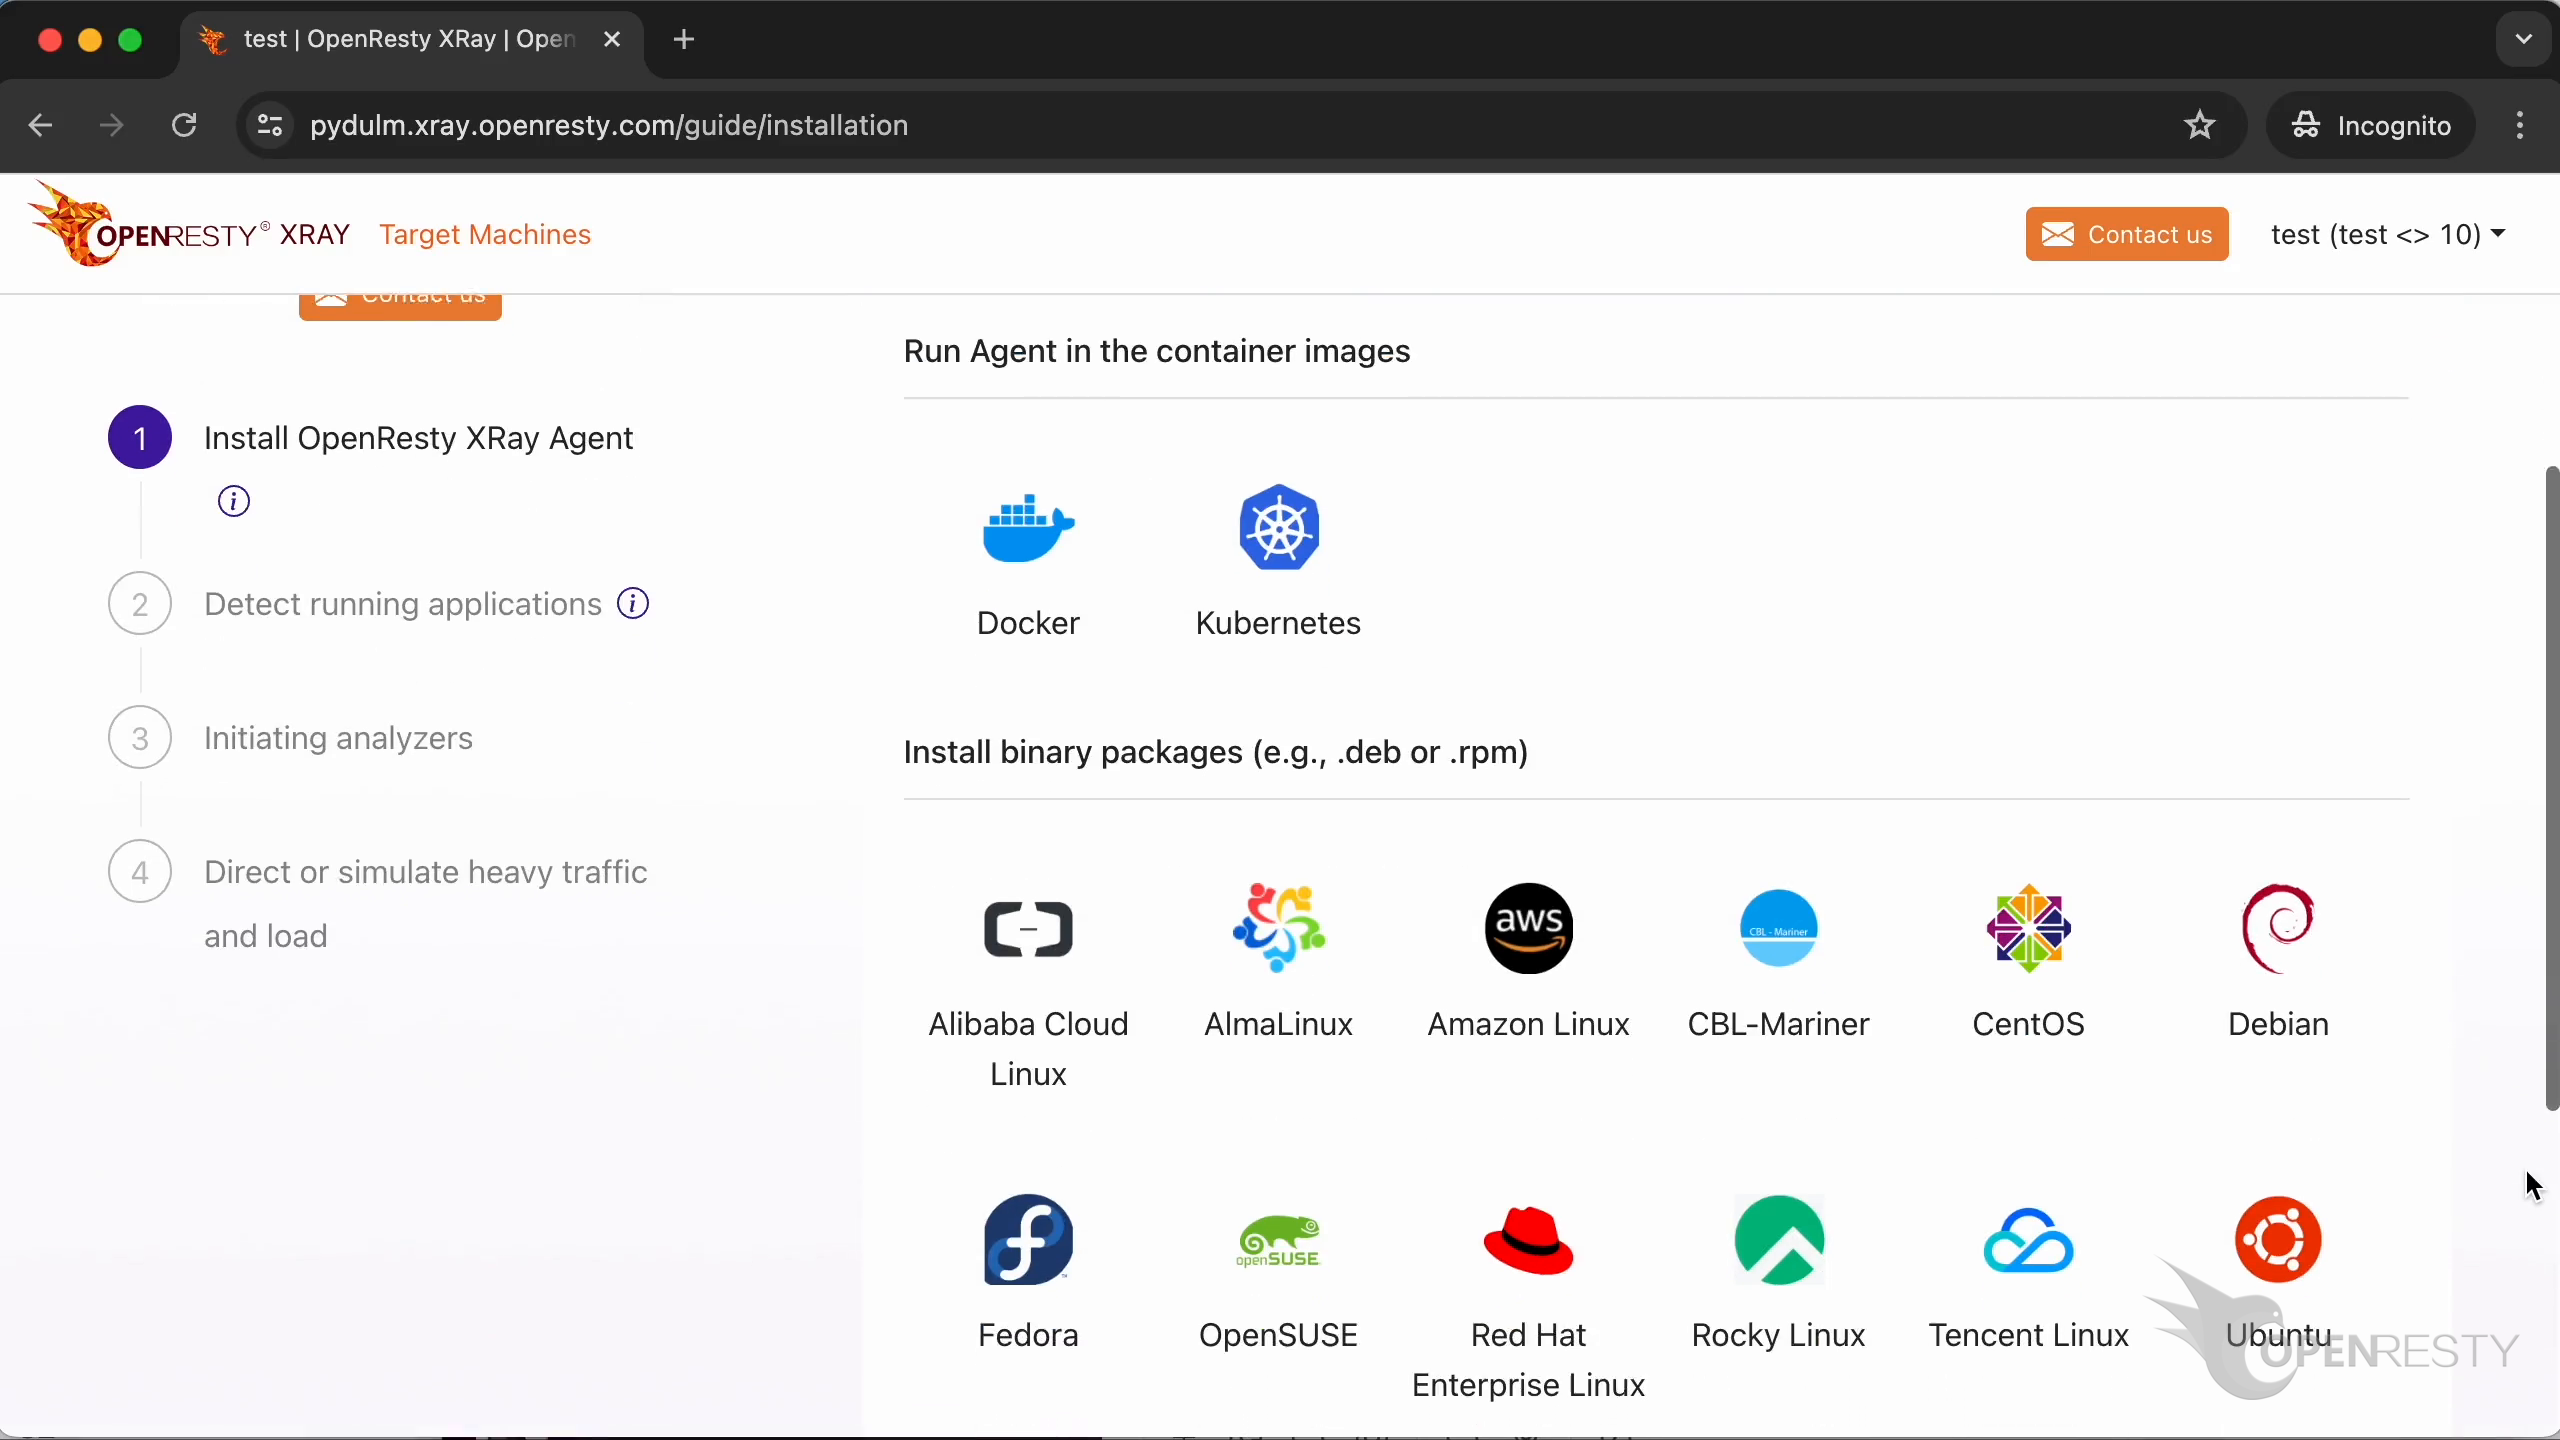
It’ll take you to the guide for the Agent installation. Let me show you how to install it in the container.
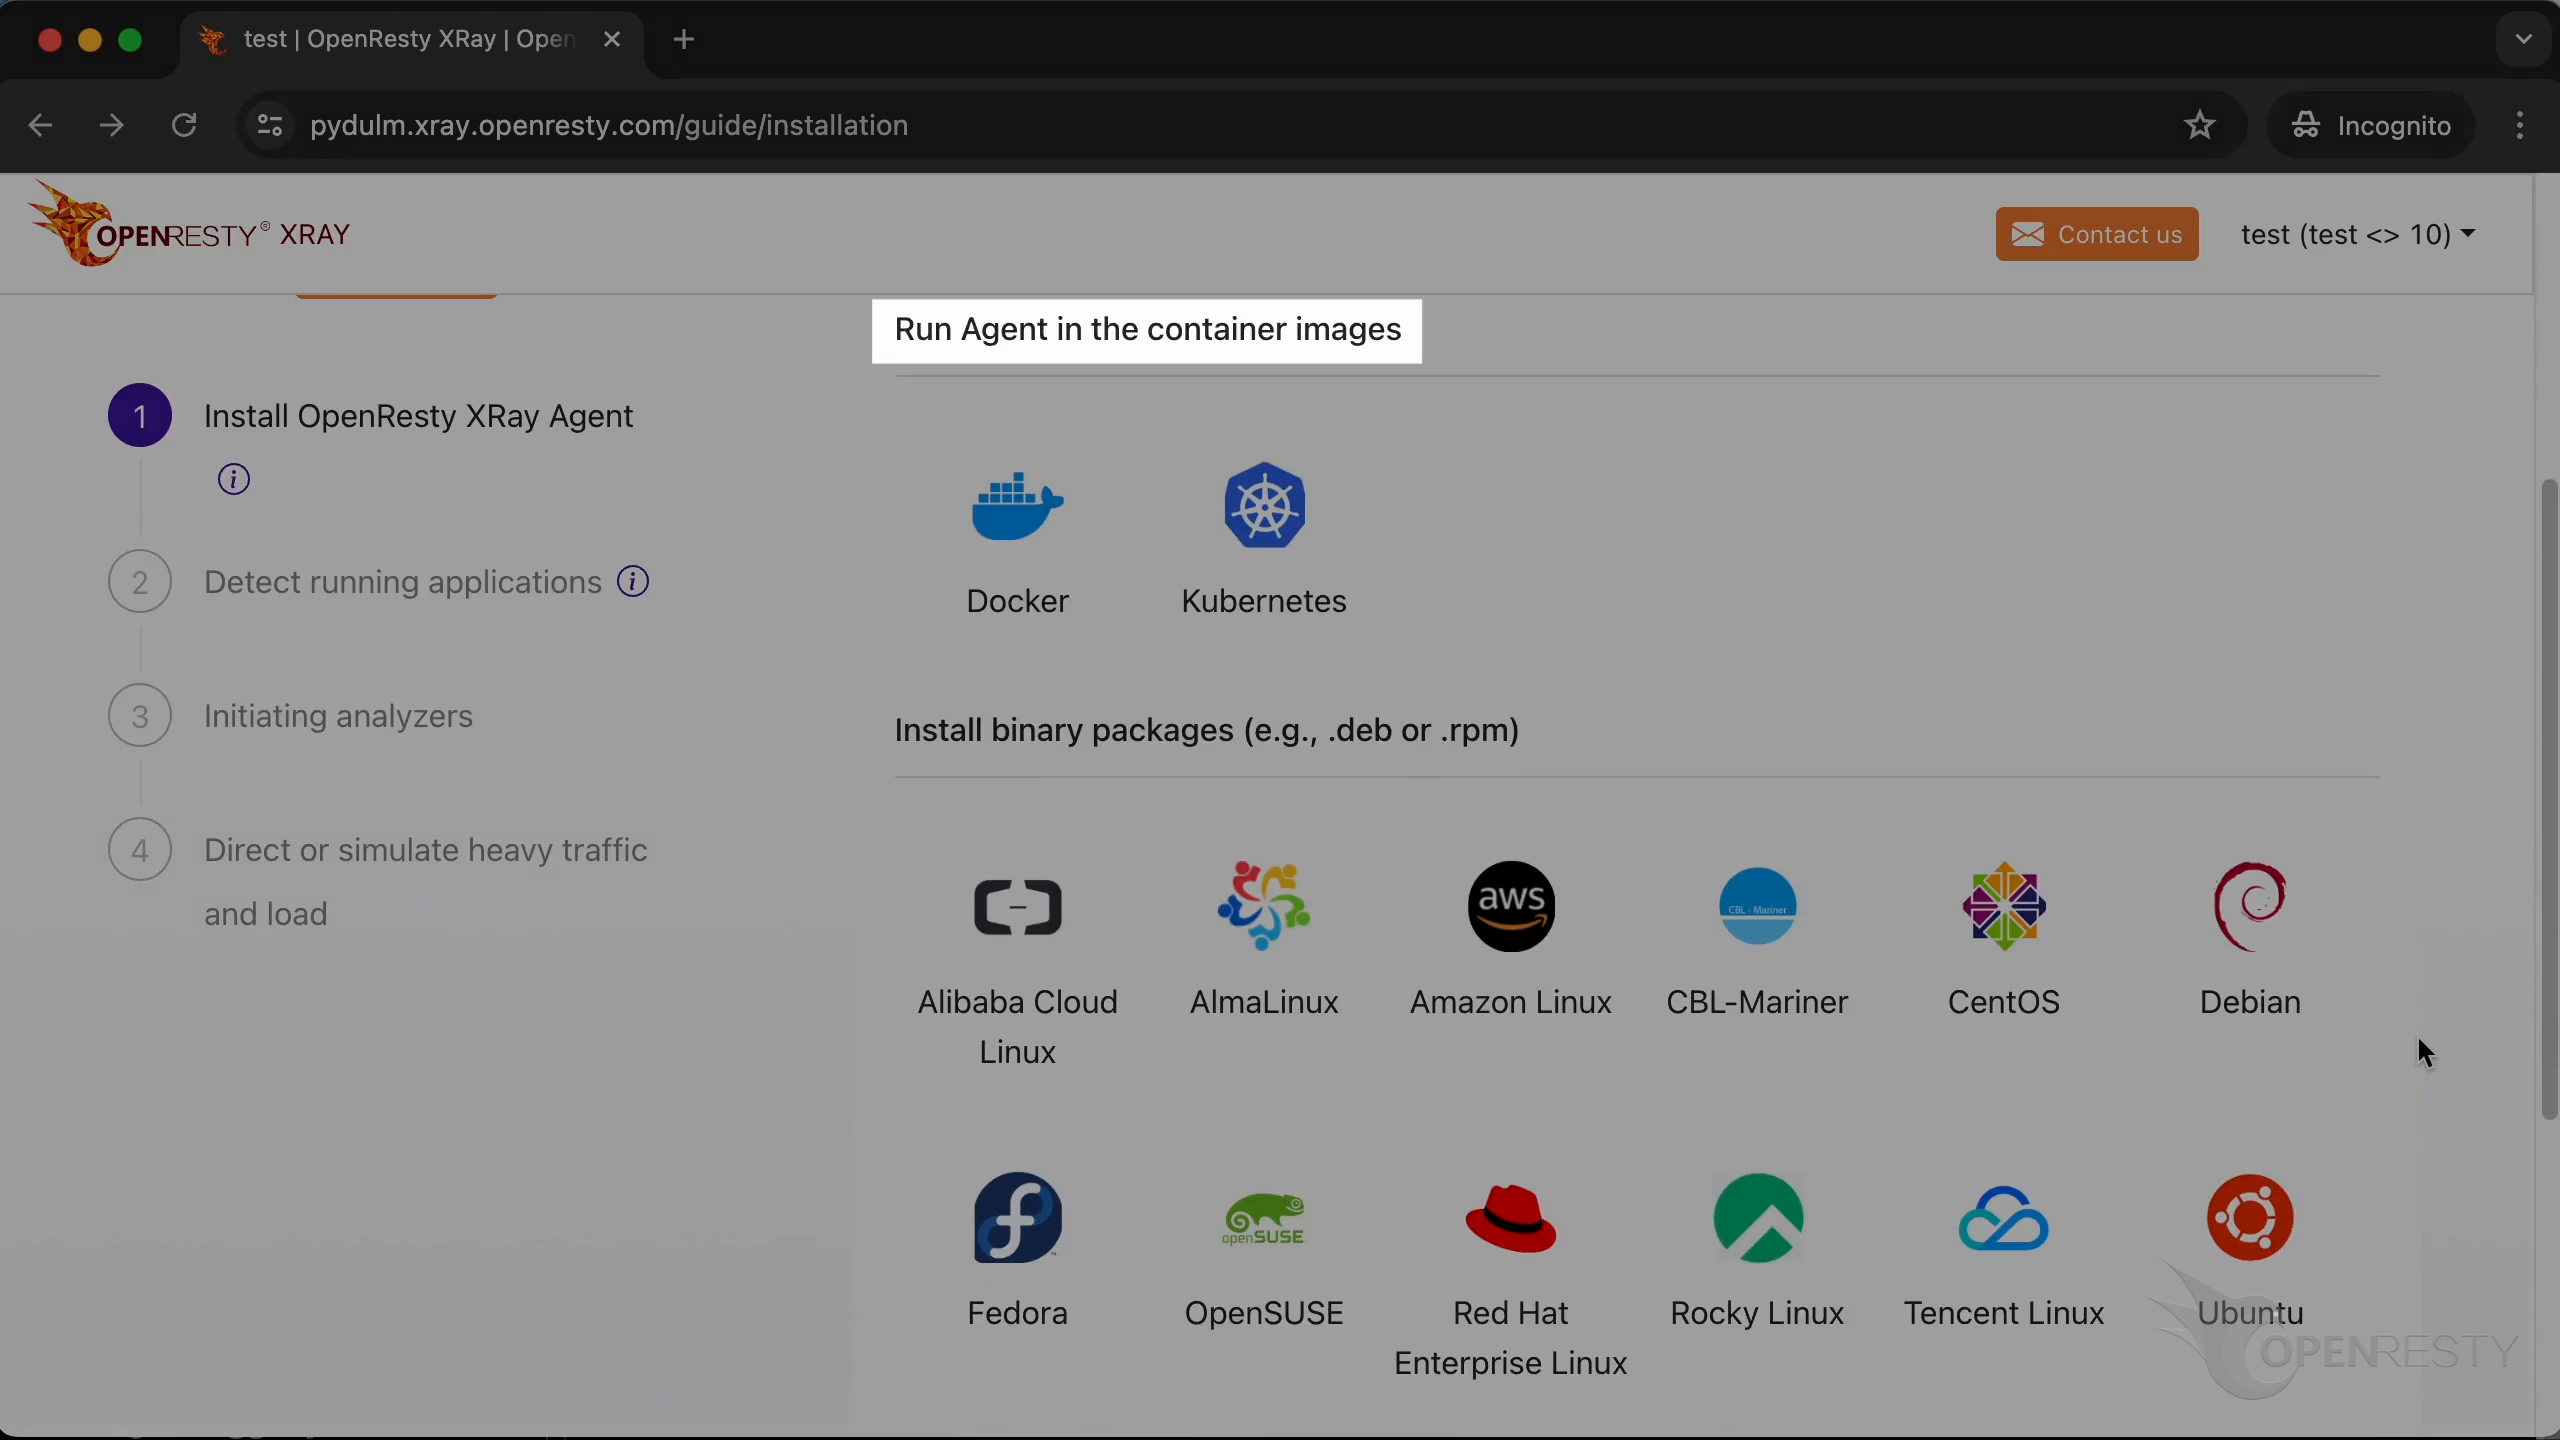
It is “Kubernetes” in this case.
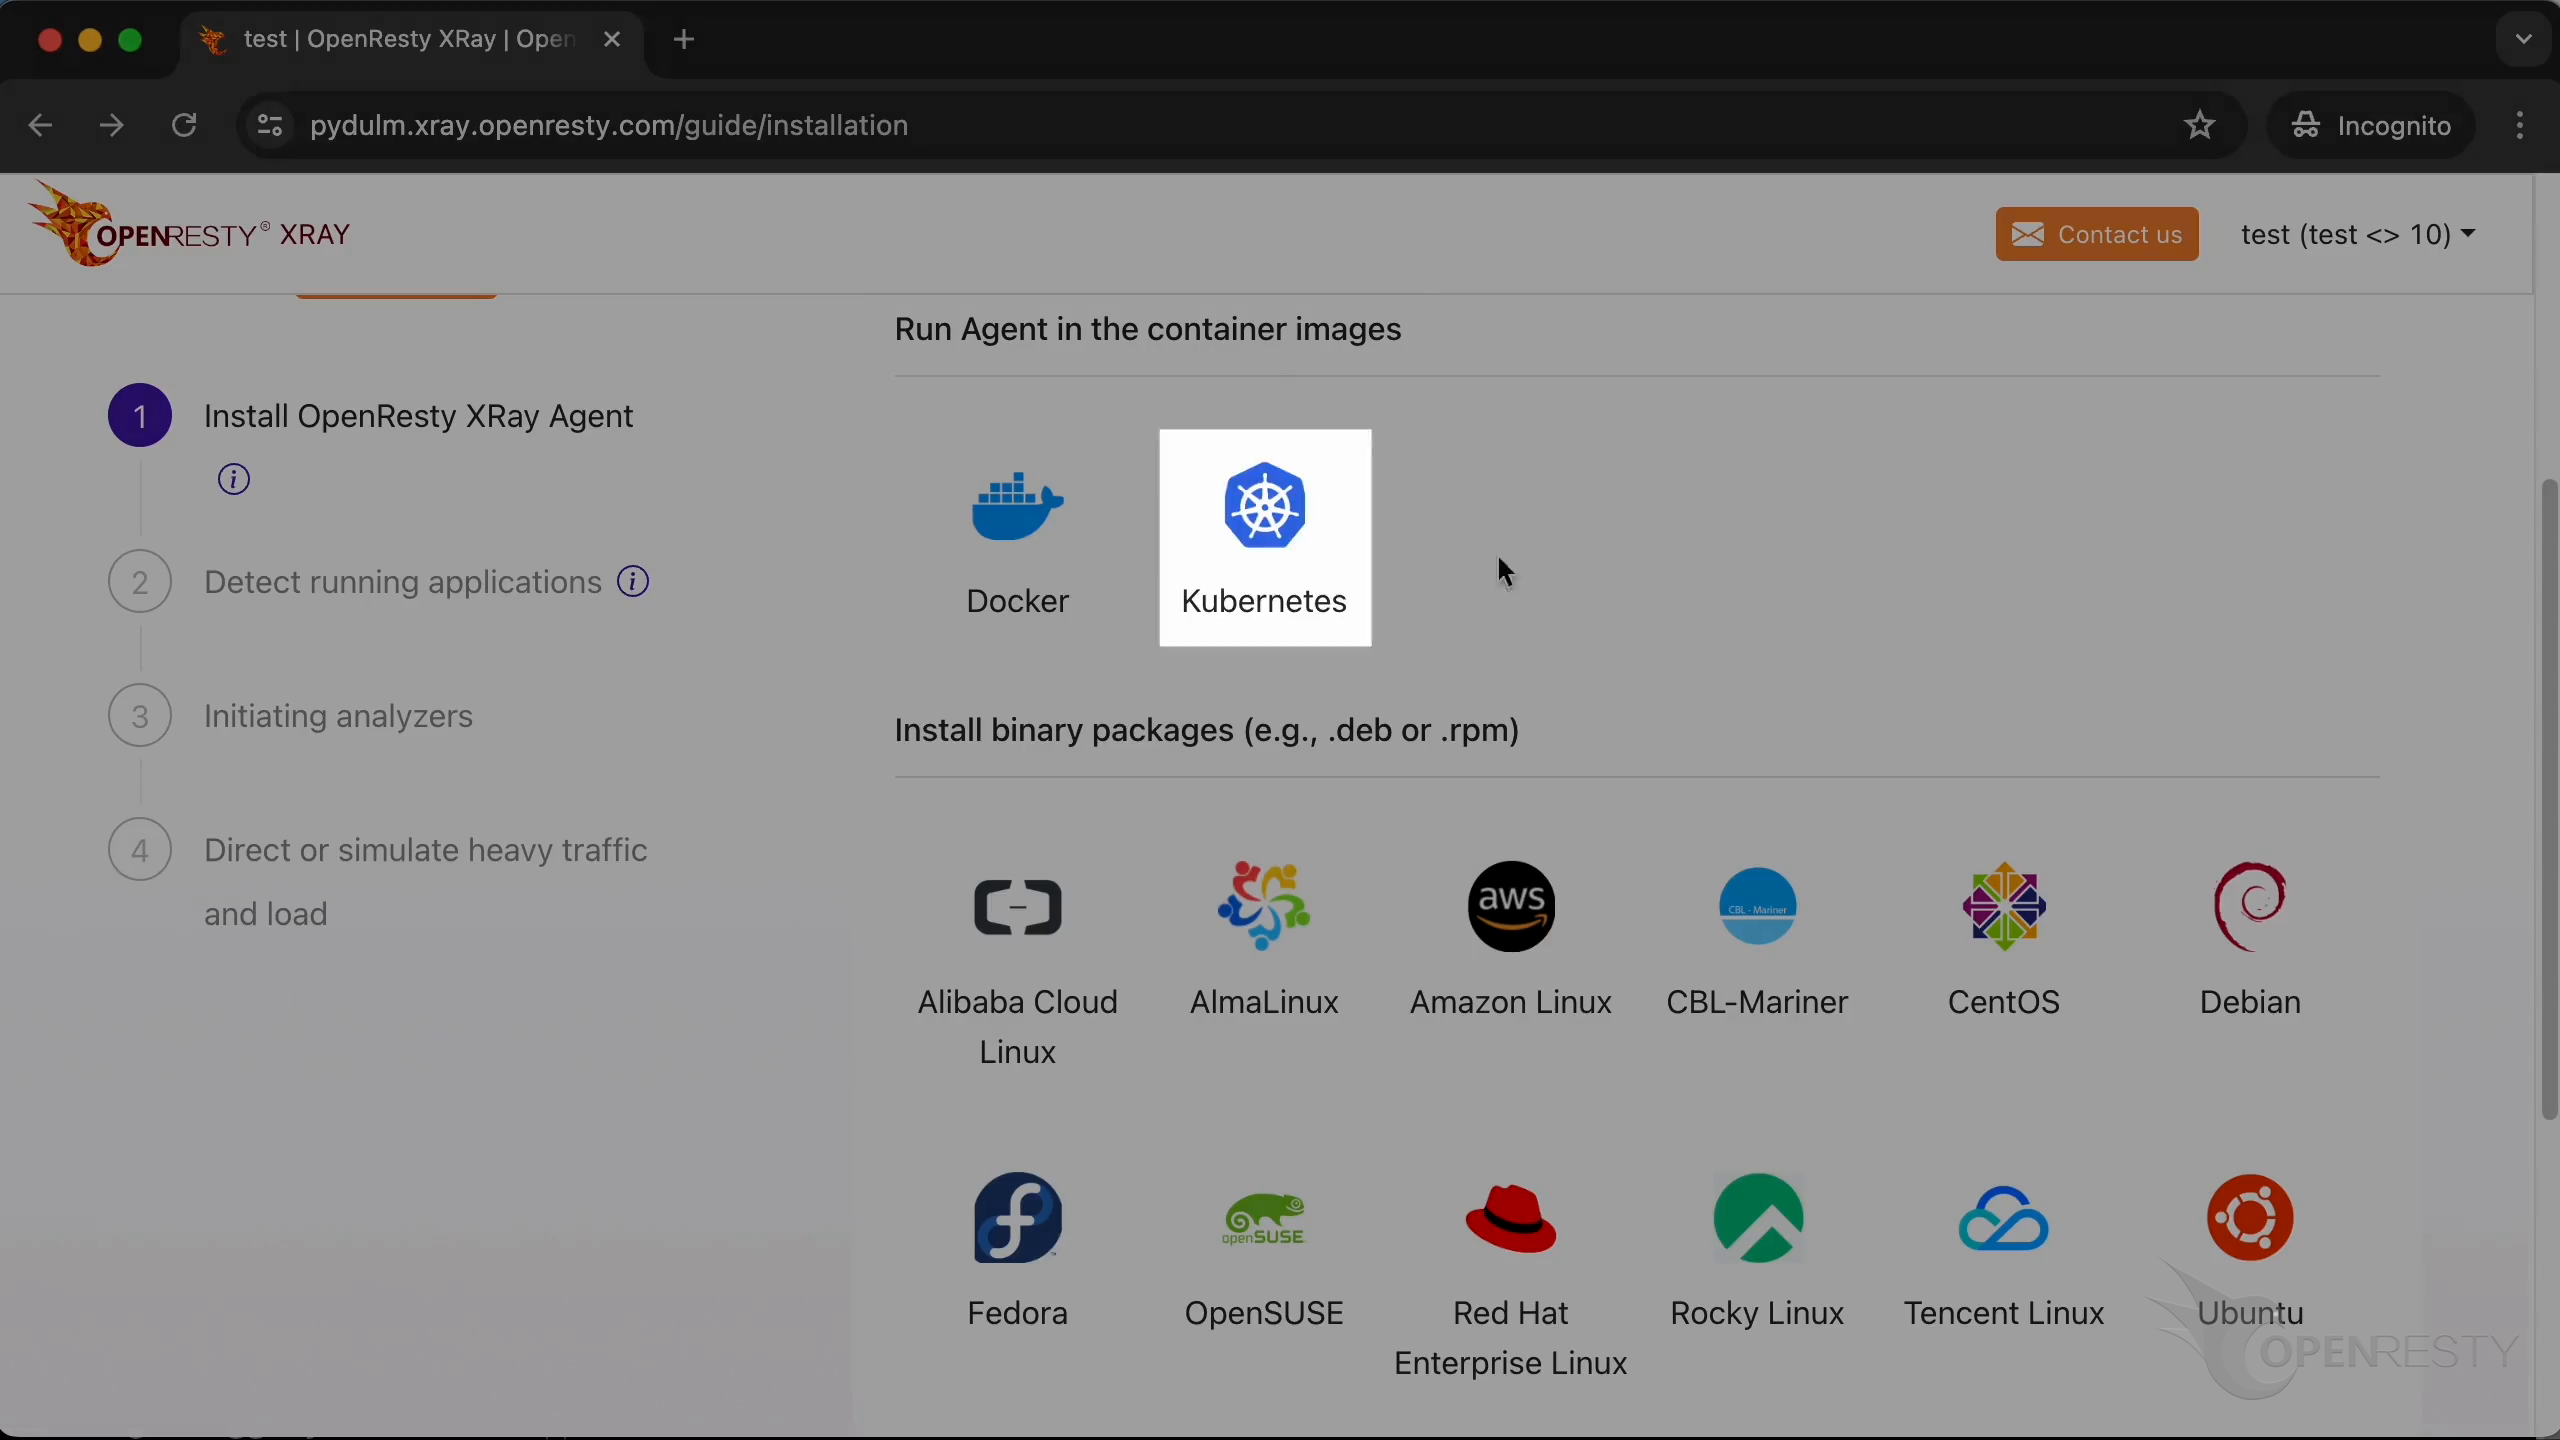
Installing the Agent on Kubernetes cluster
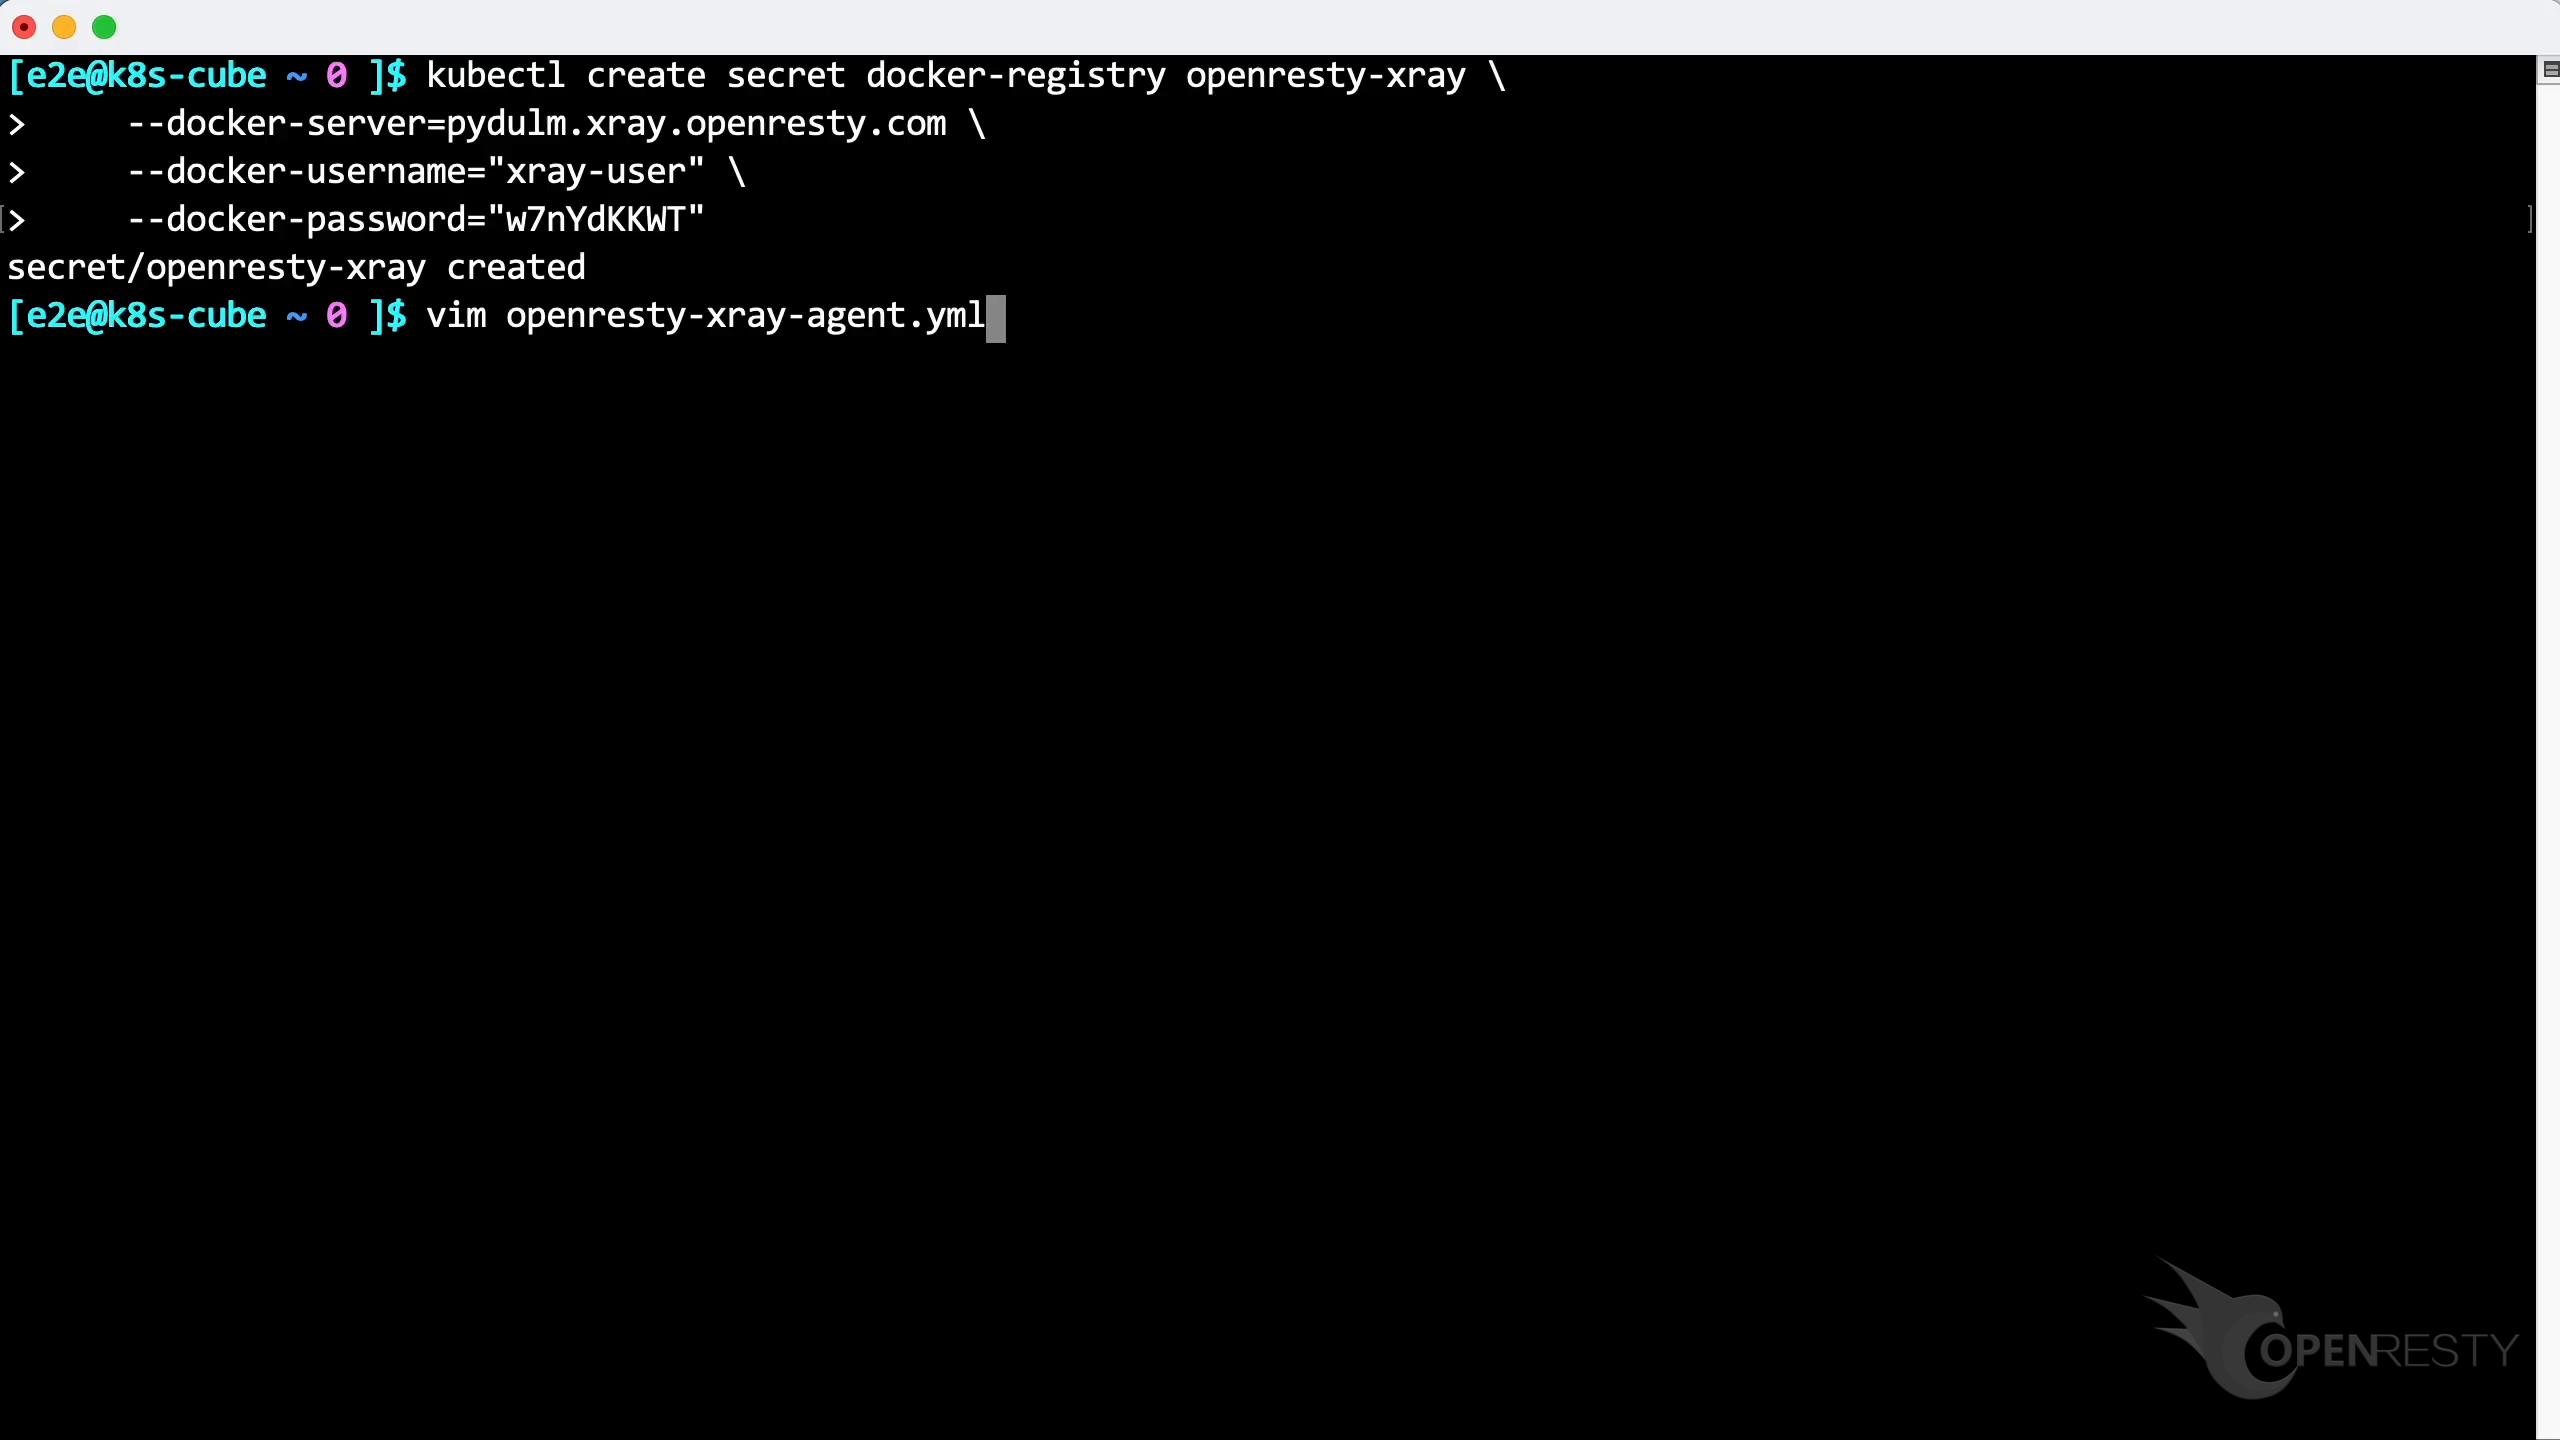
Firstly, create a docker registry secret in the k8s environment with this command.
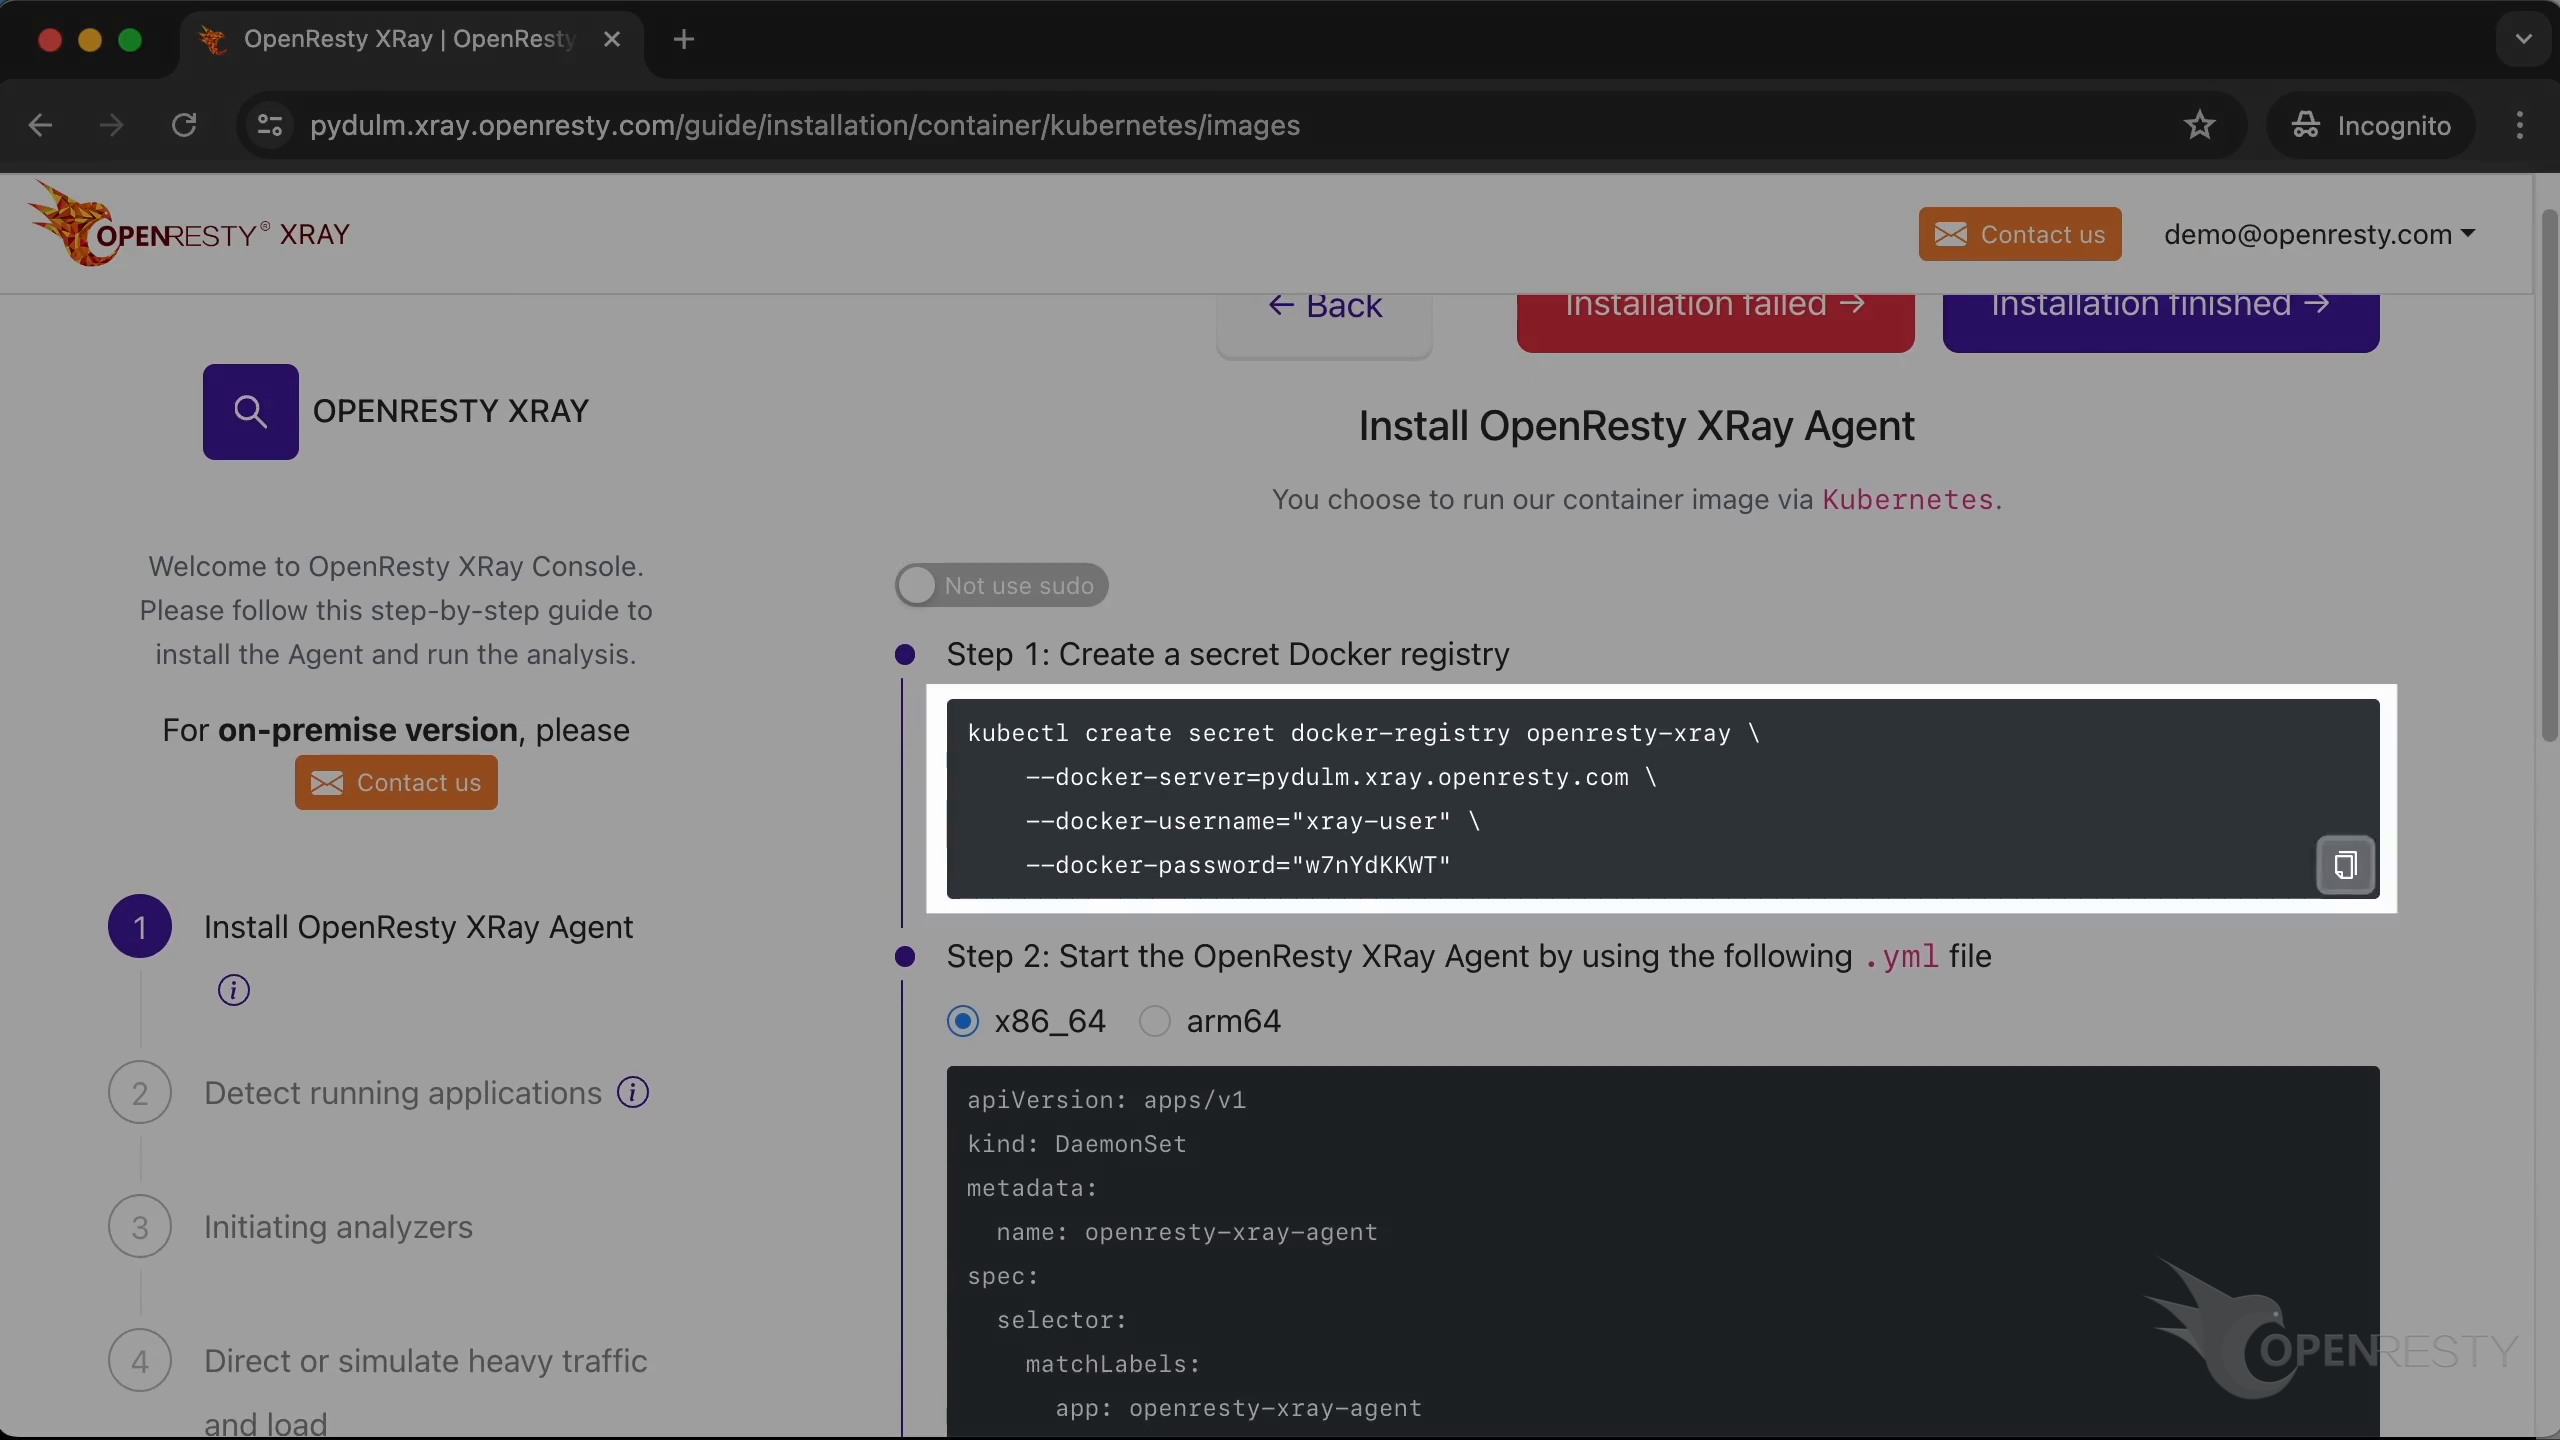
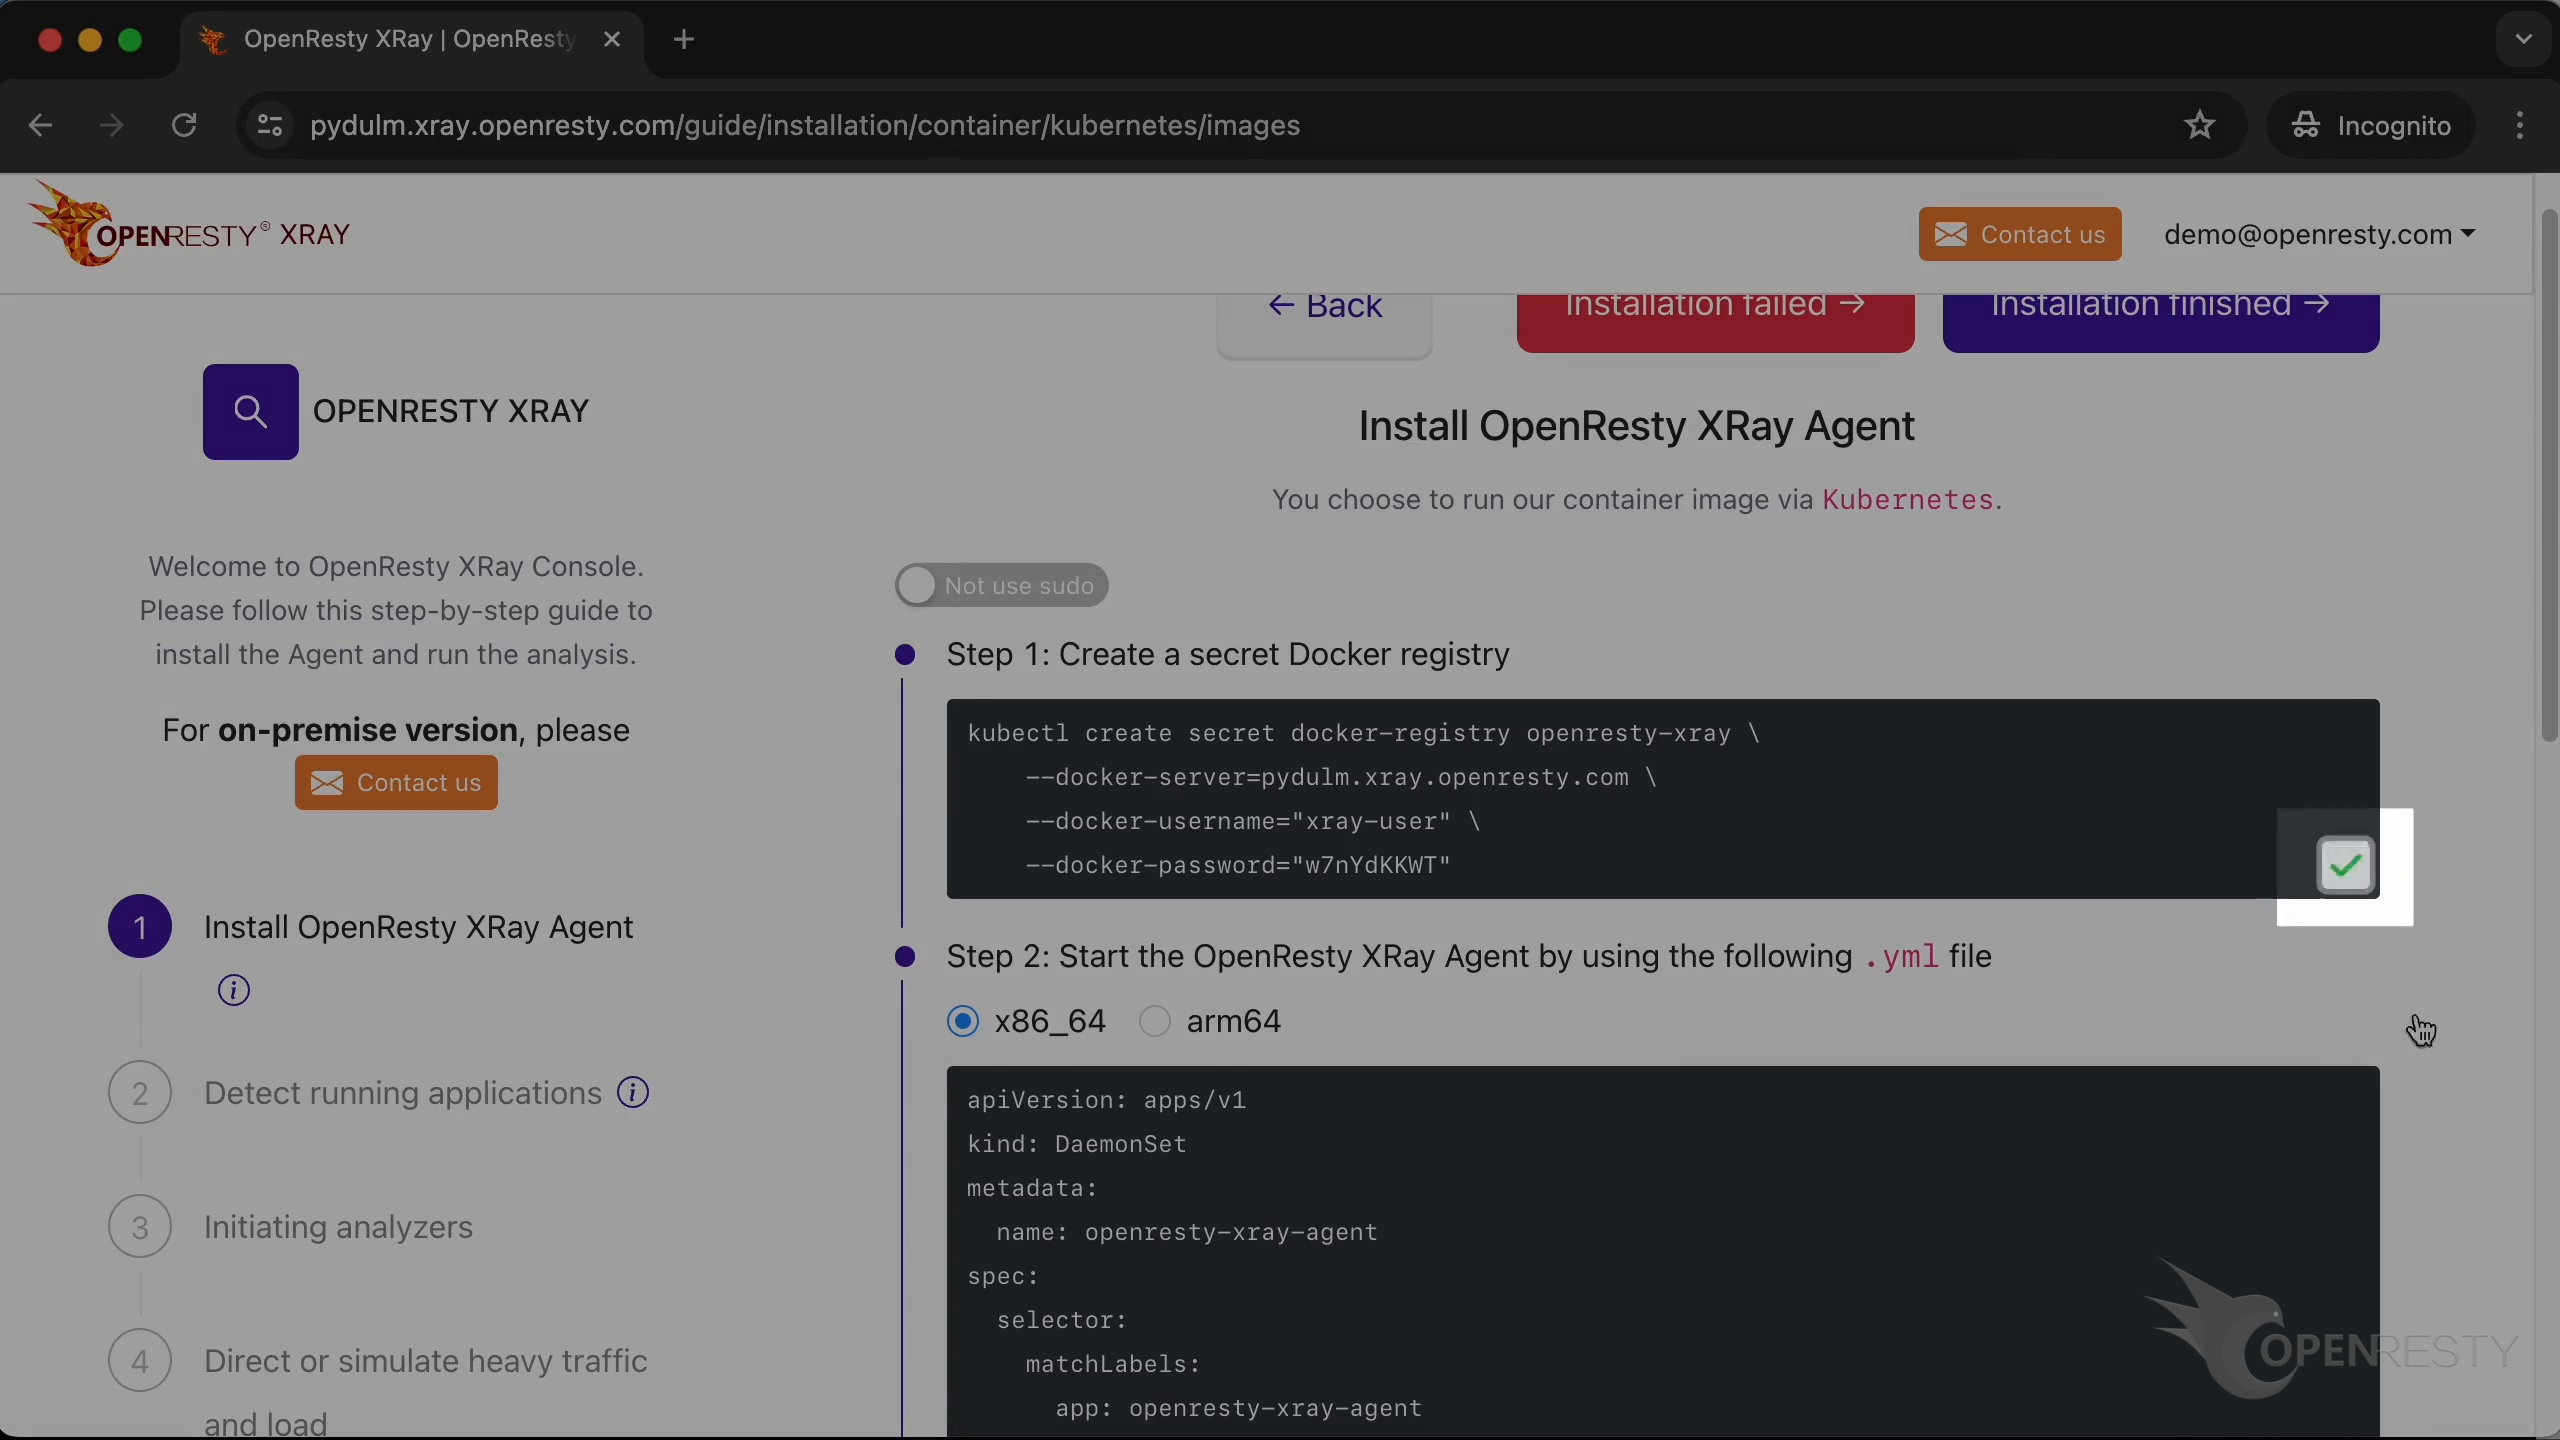
Click to copy it.
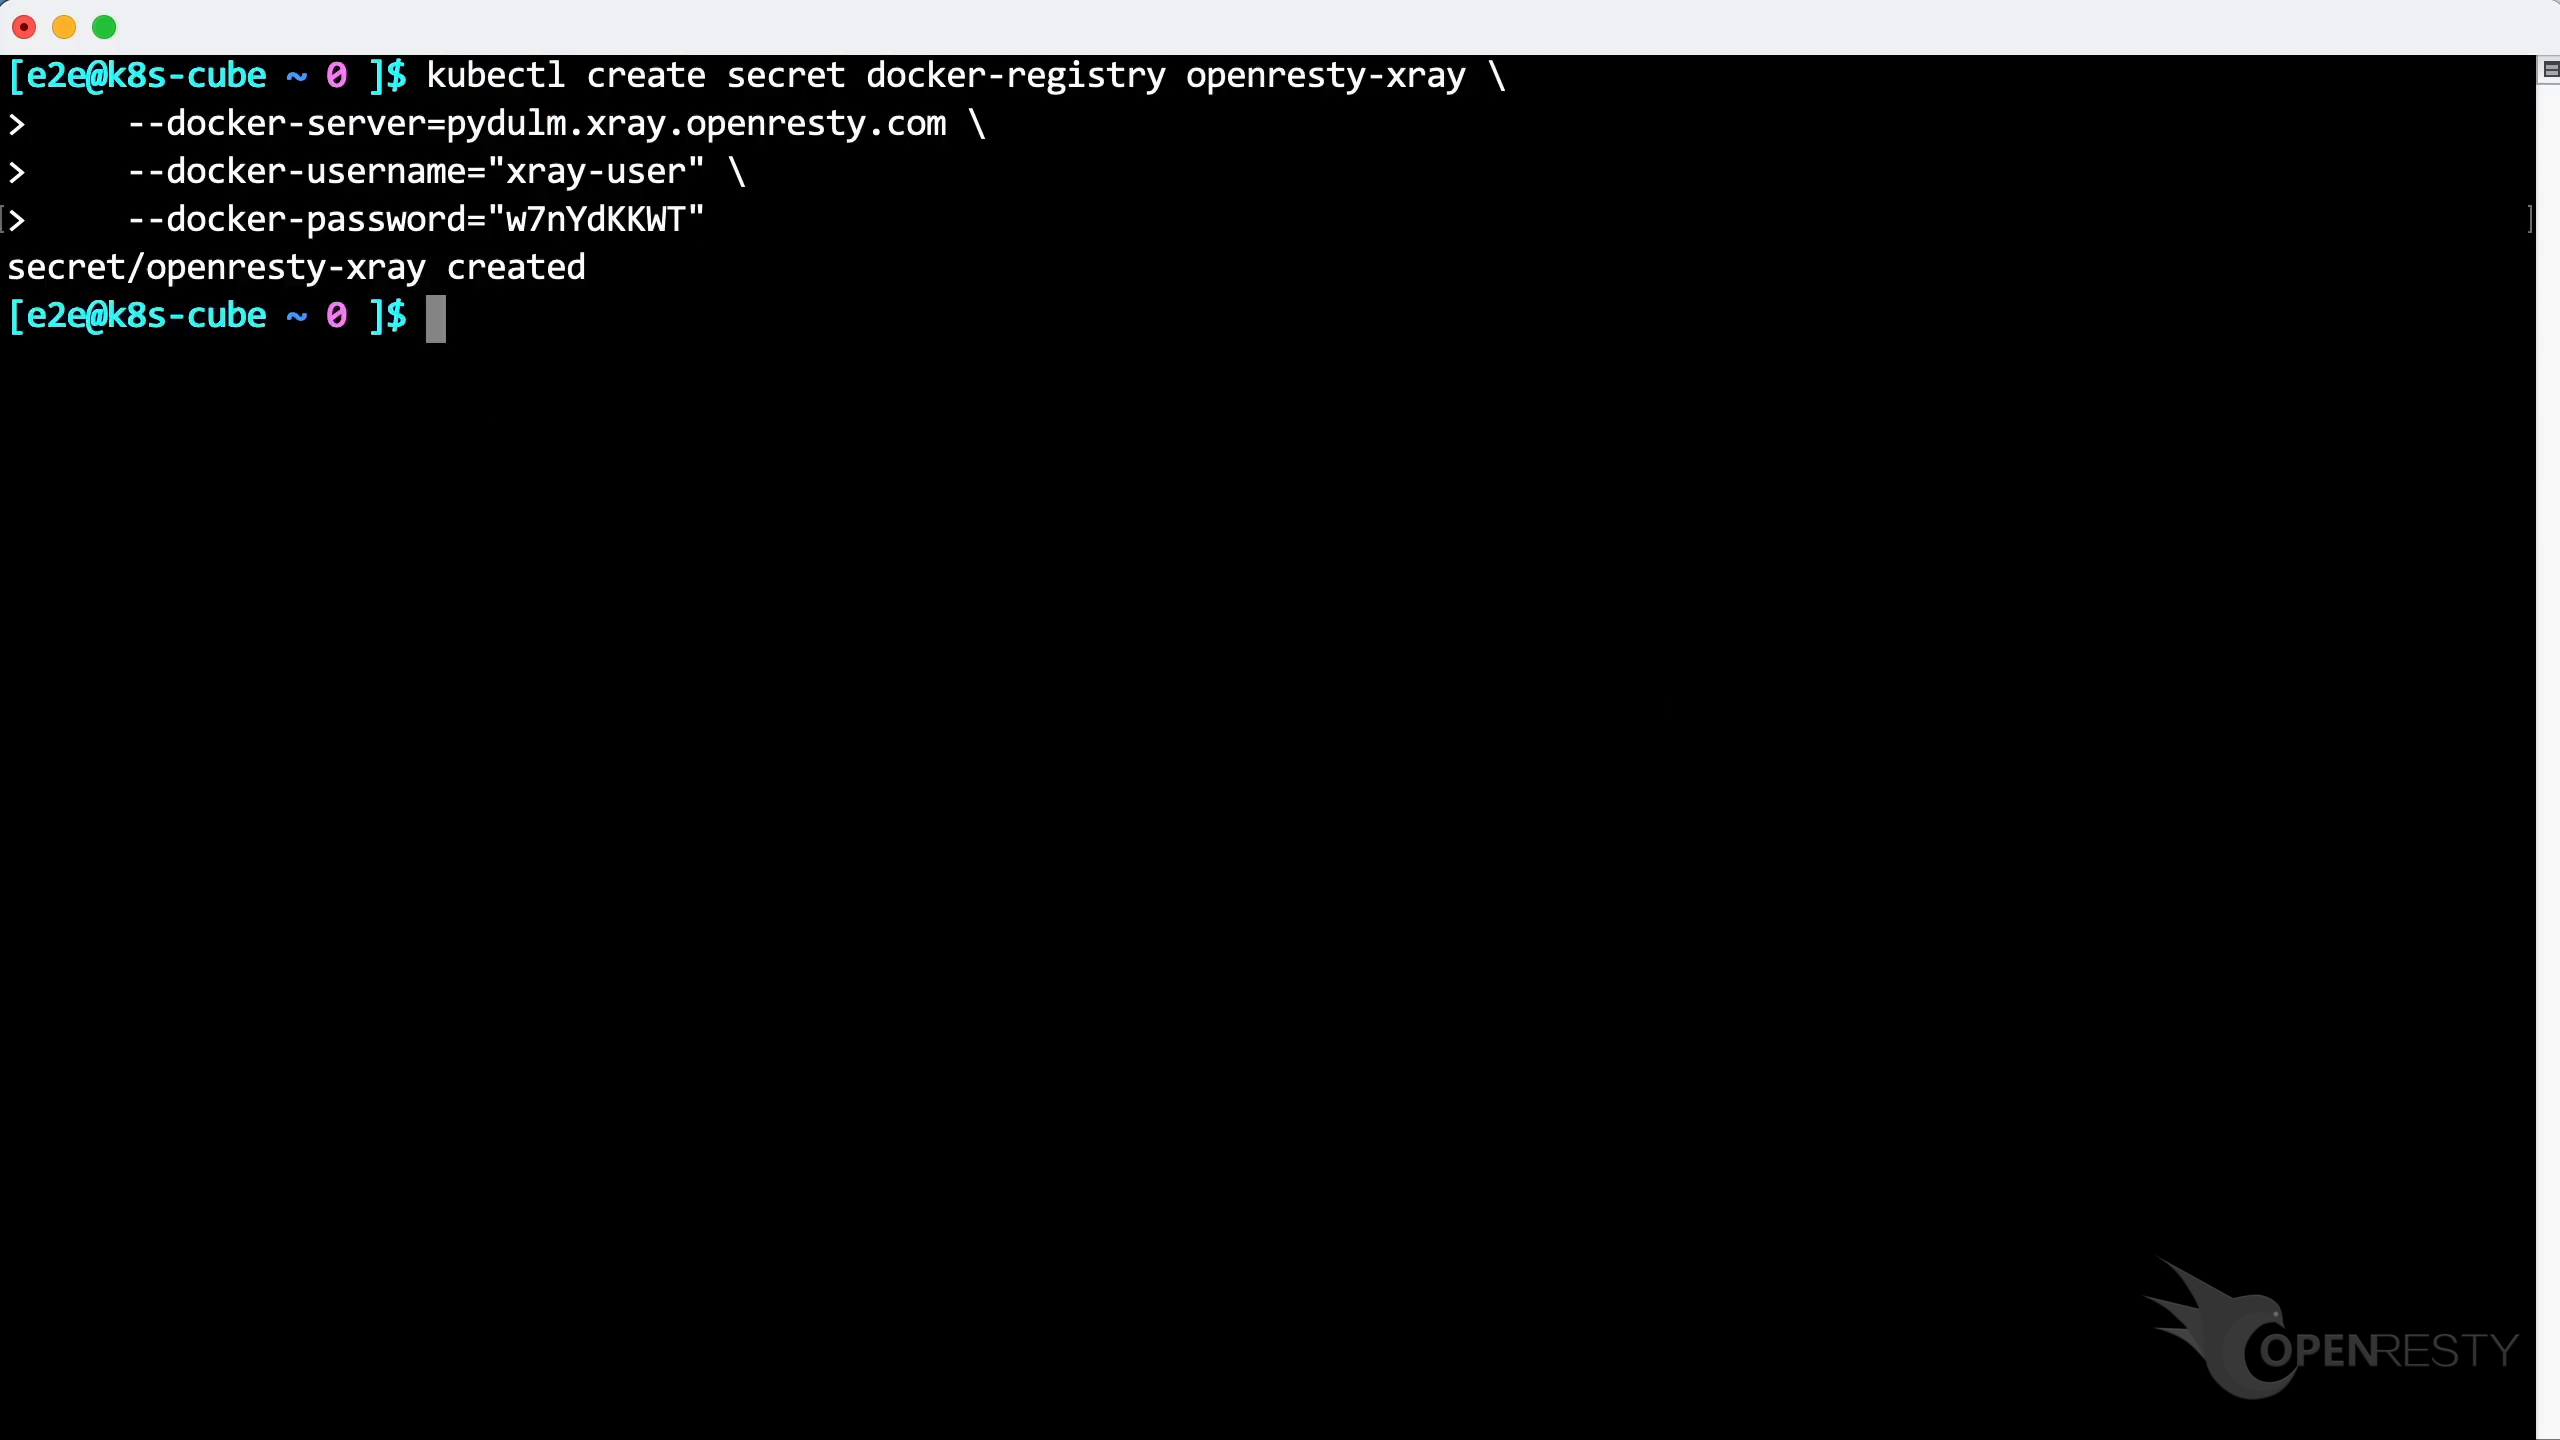
Paste and execute the command.
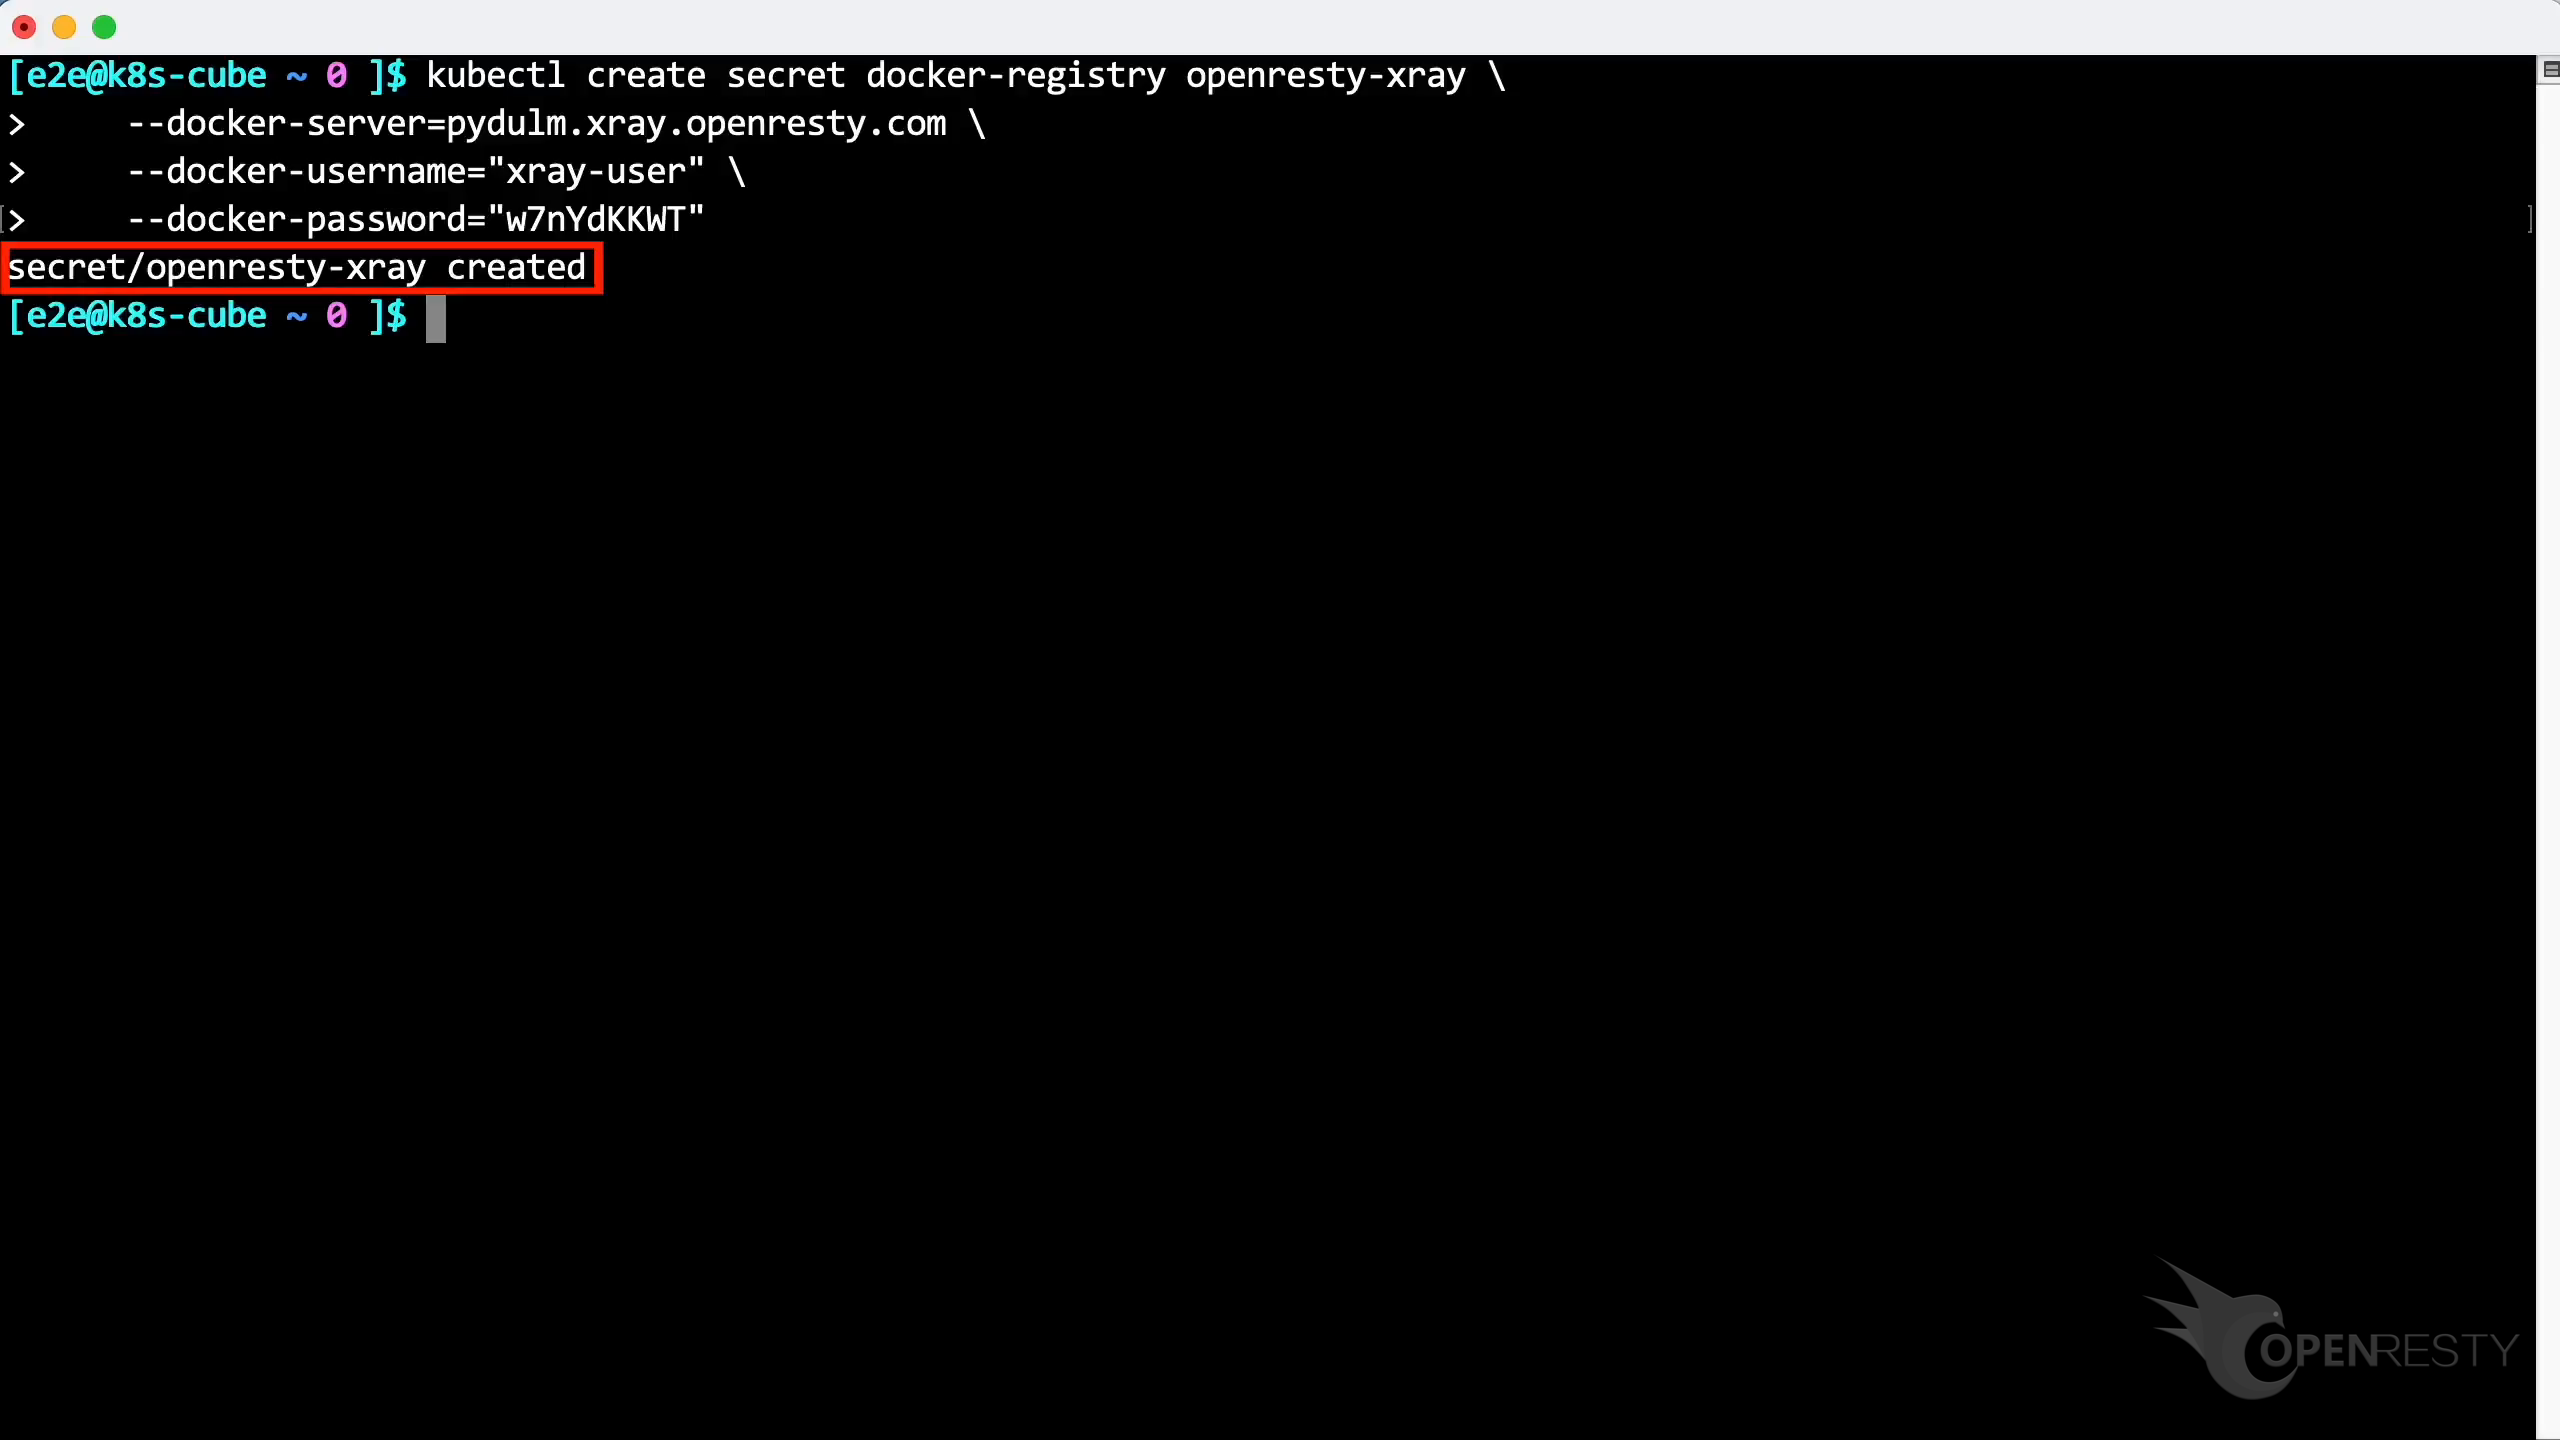
The secret has been created successfully.
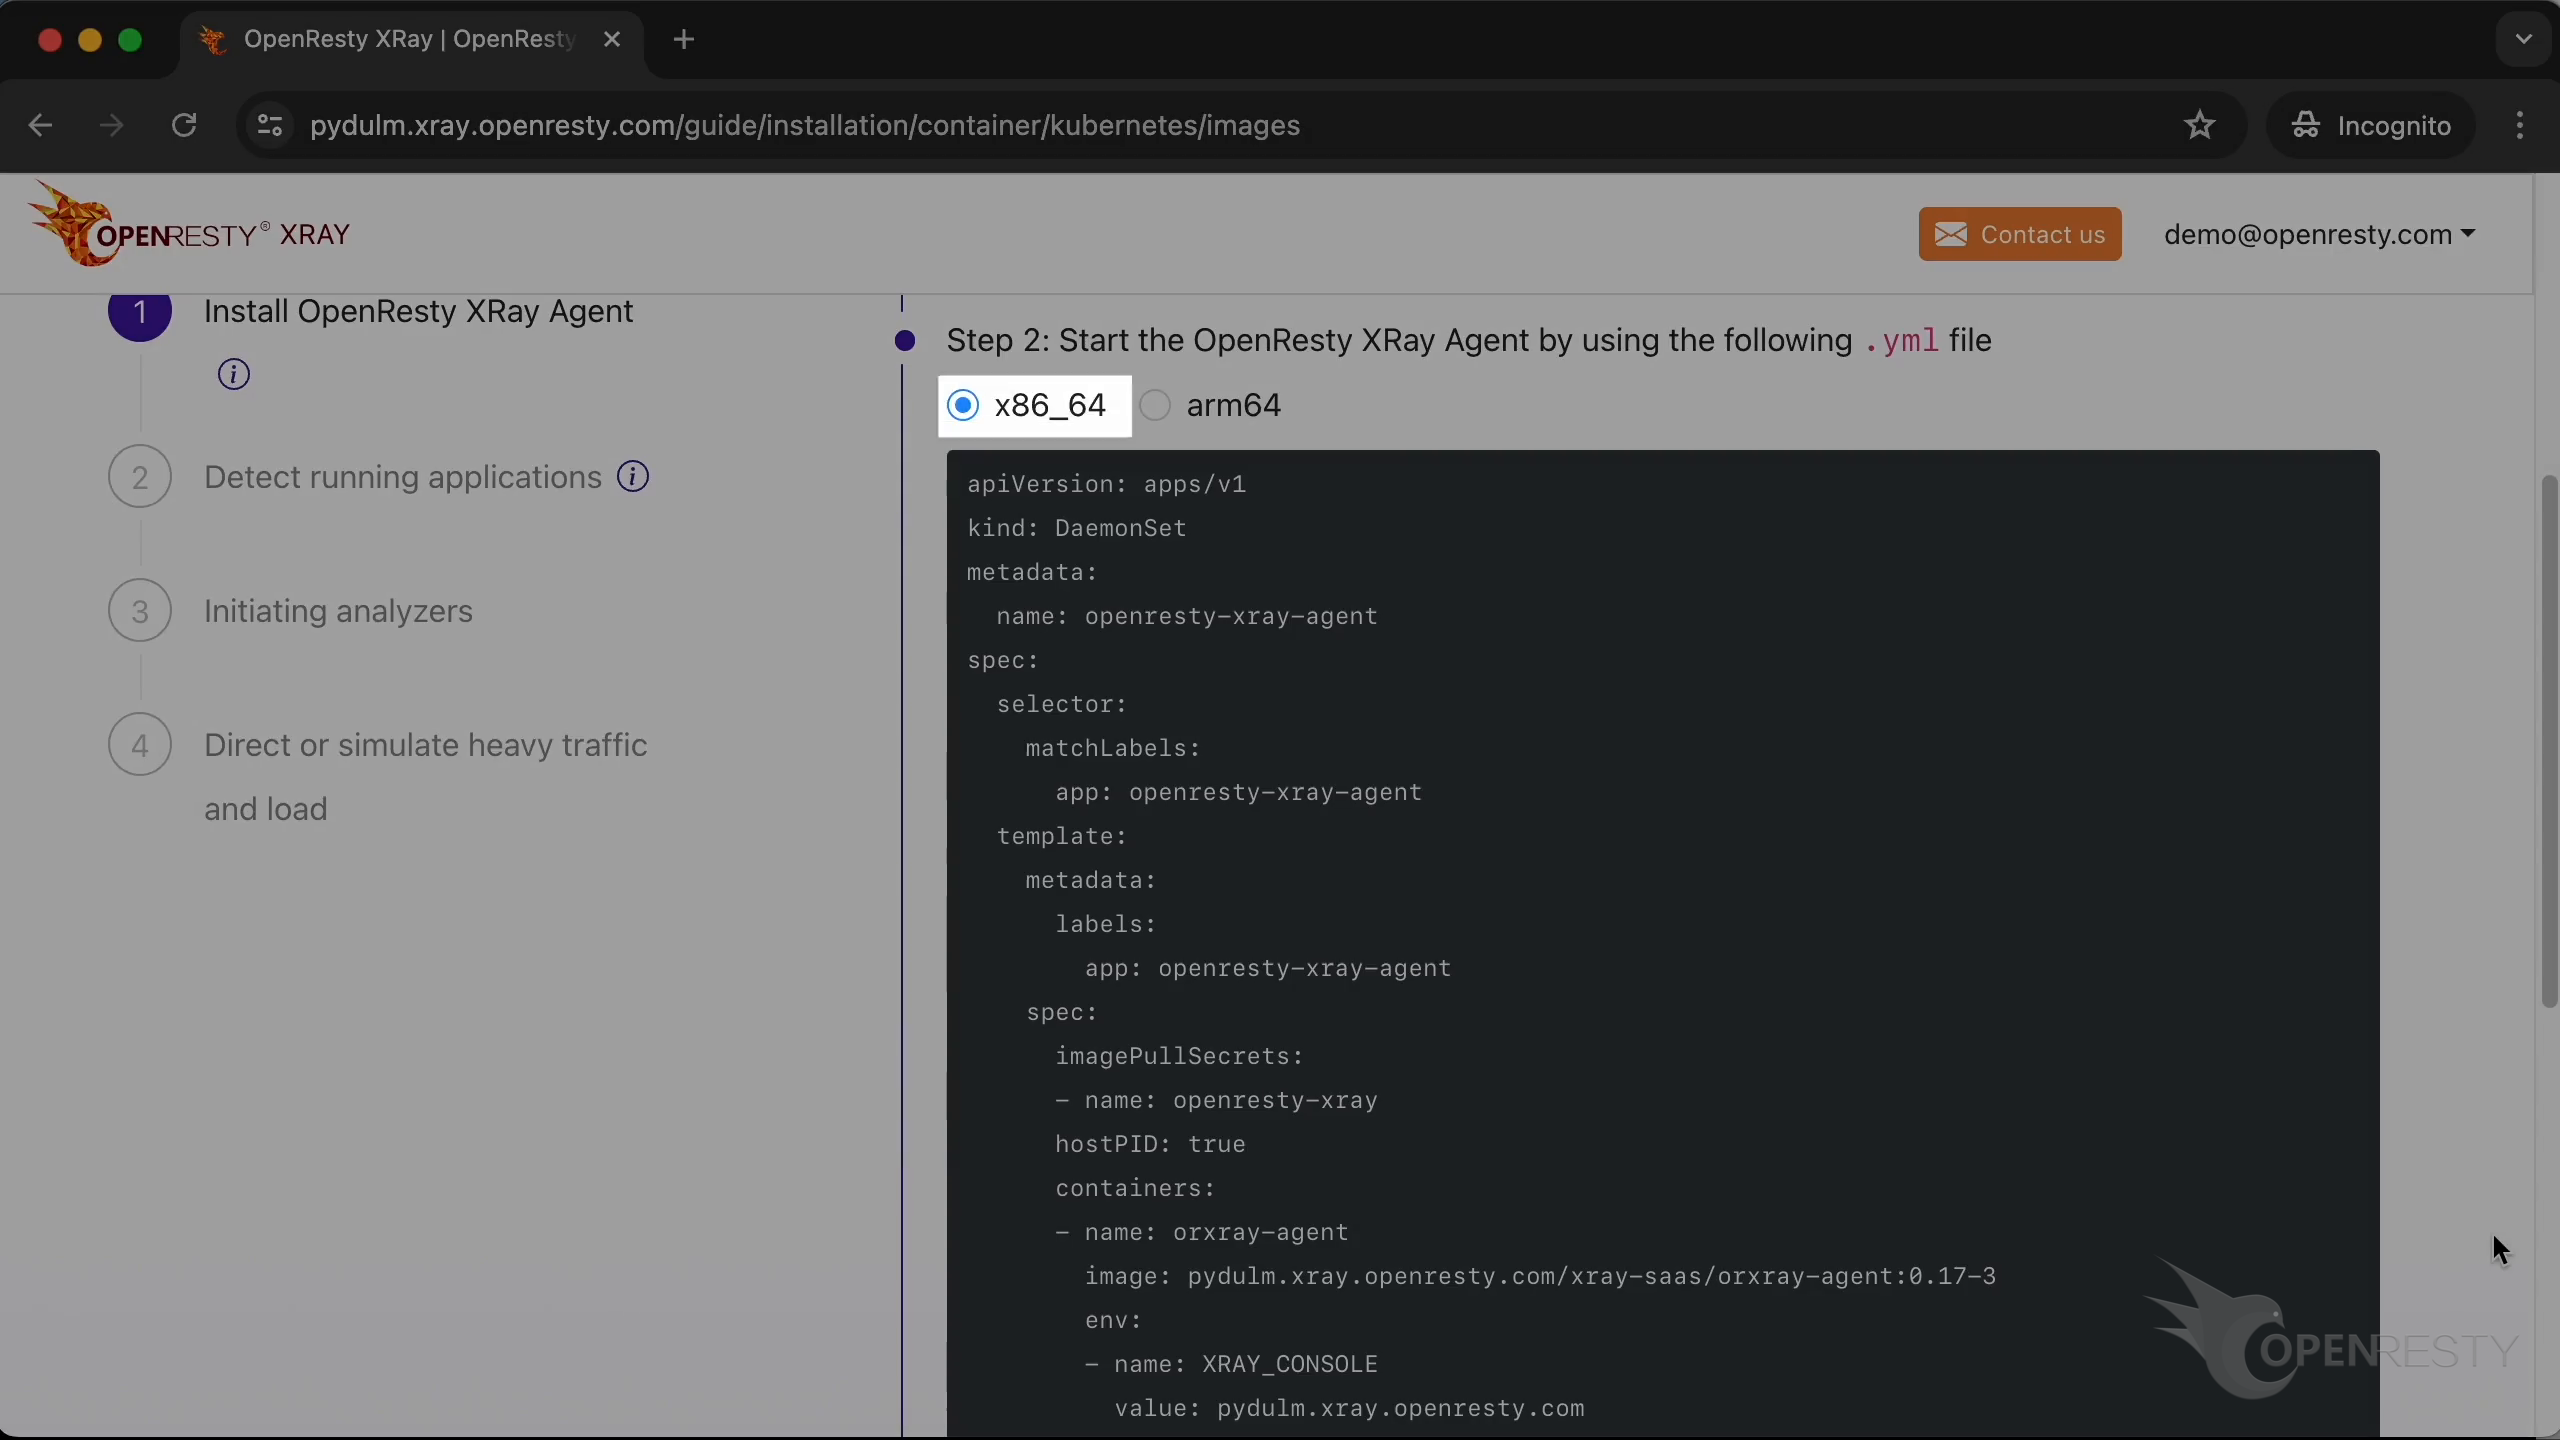
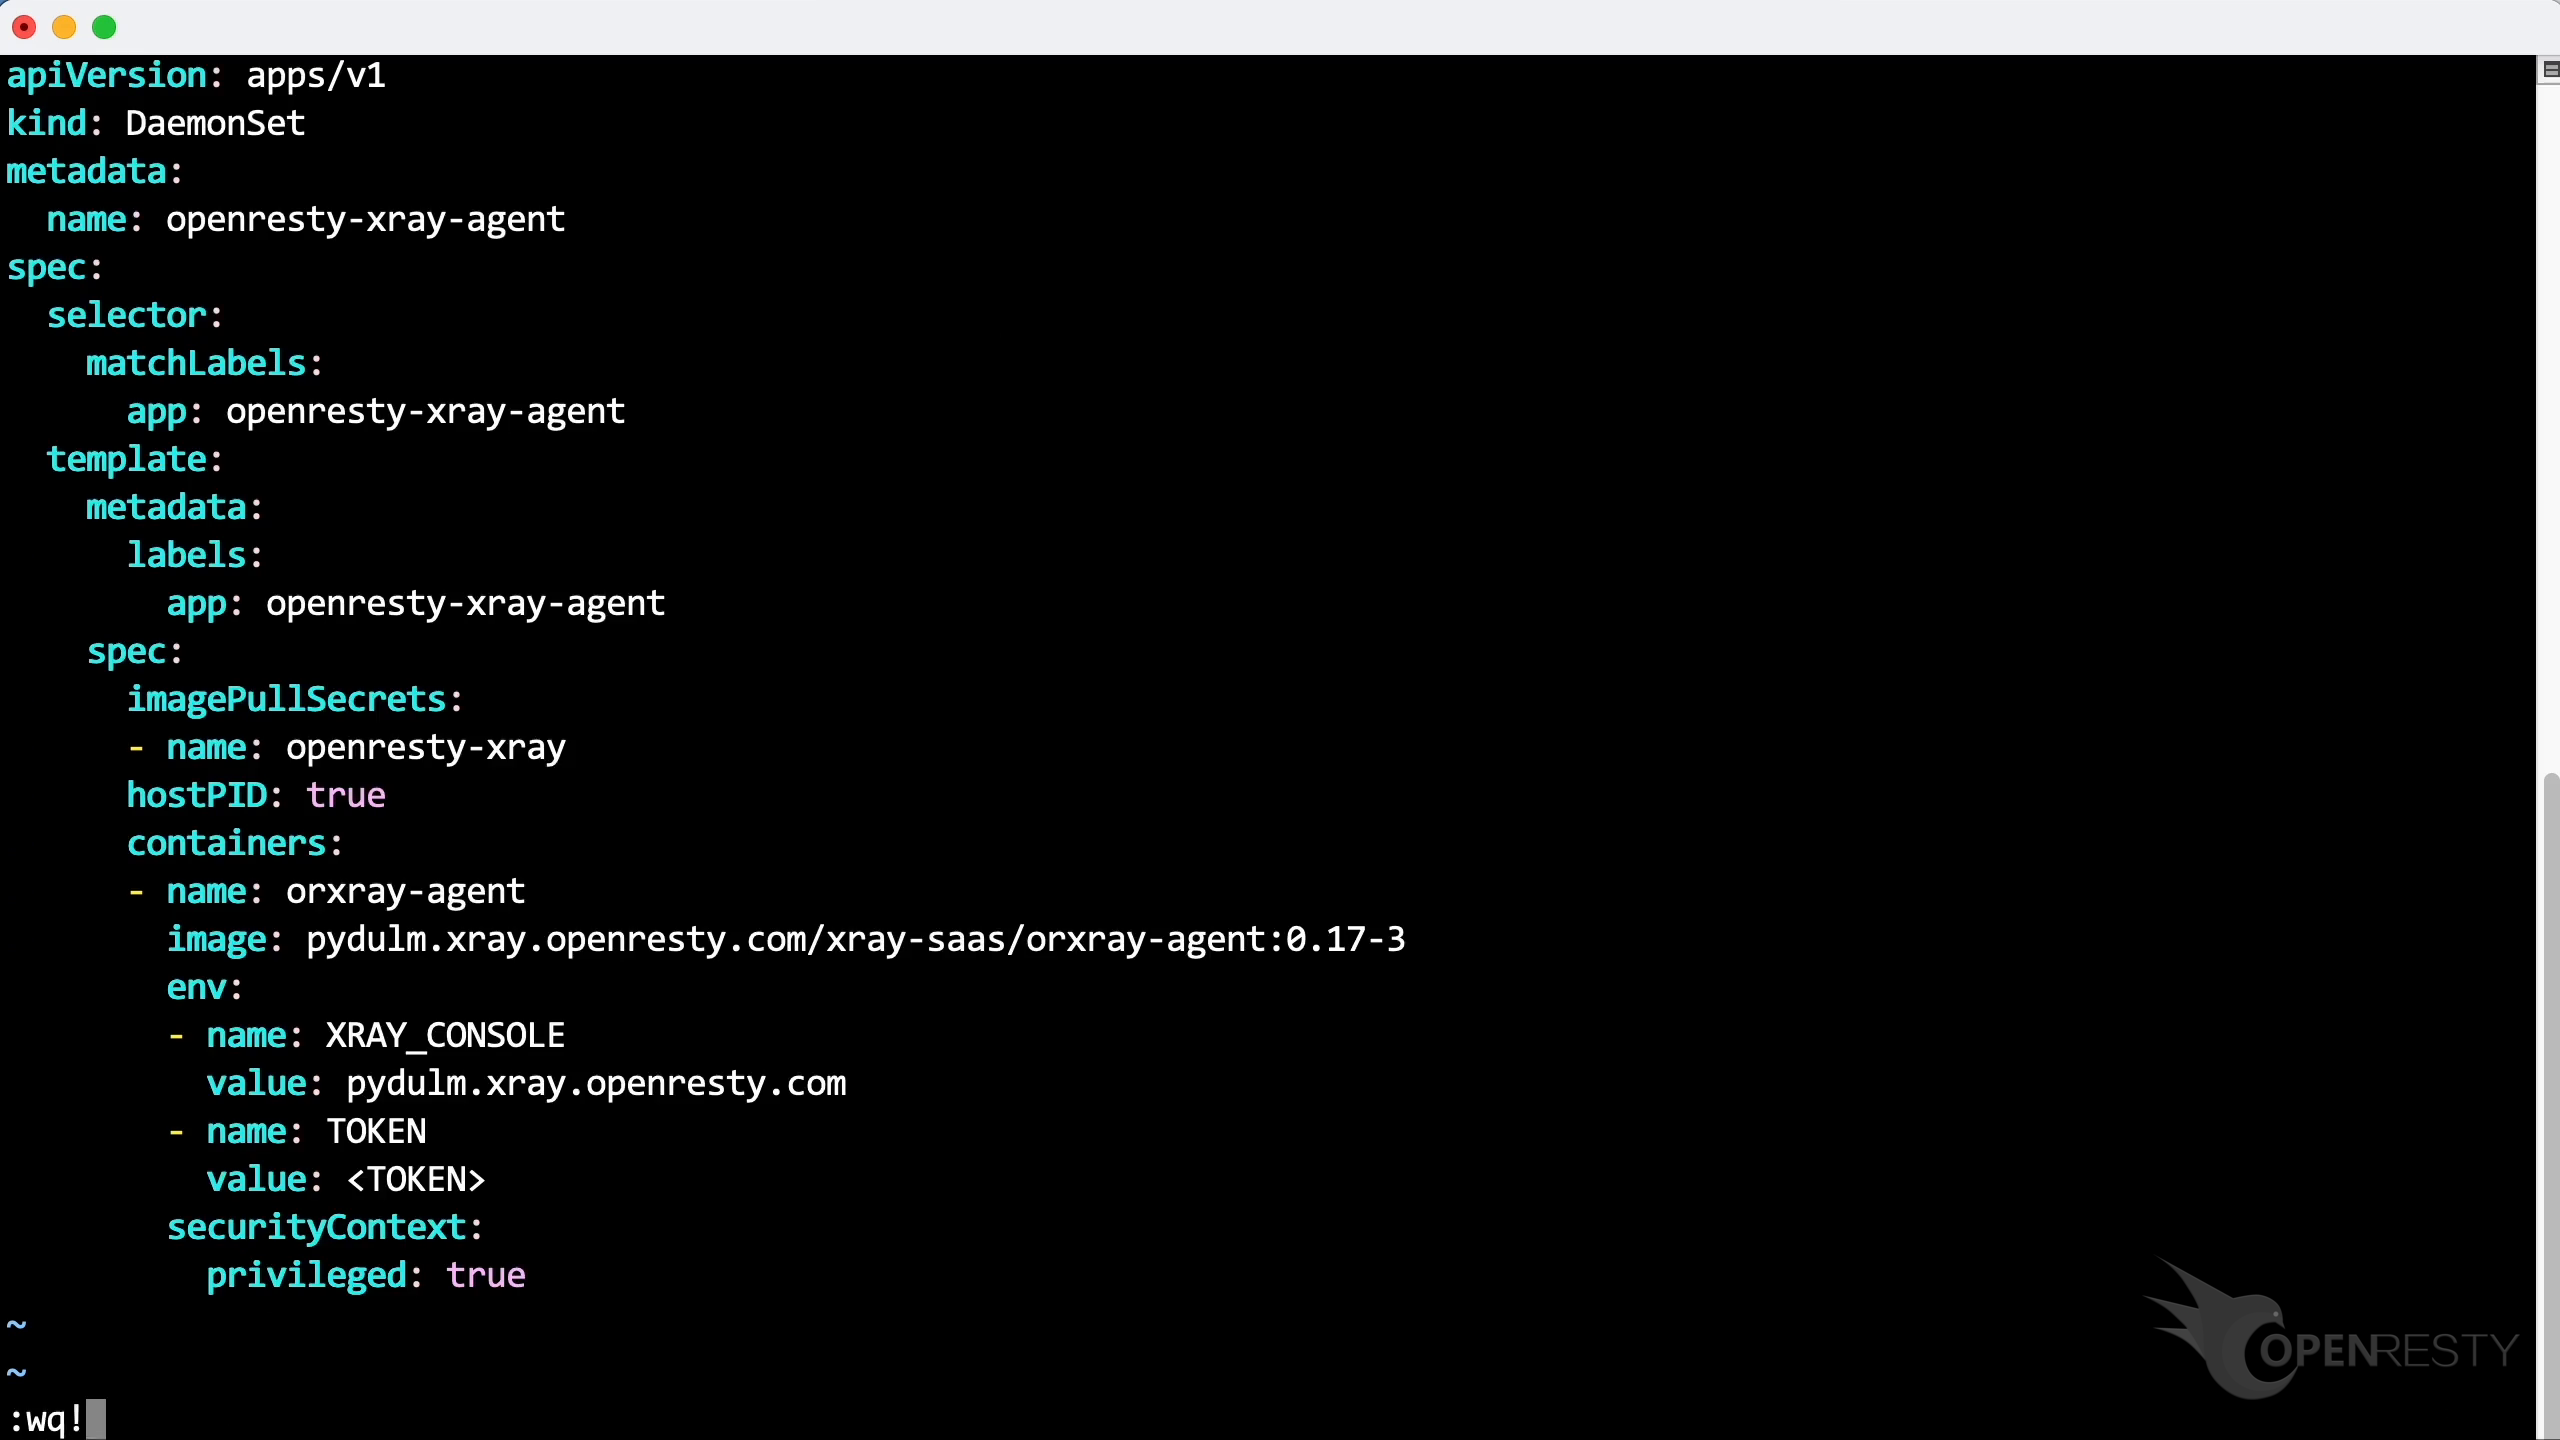
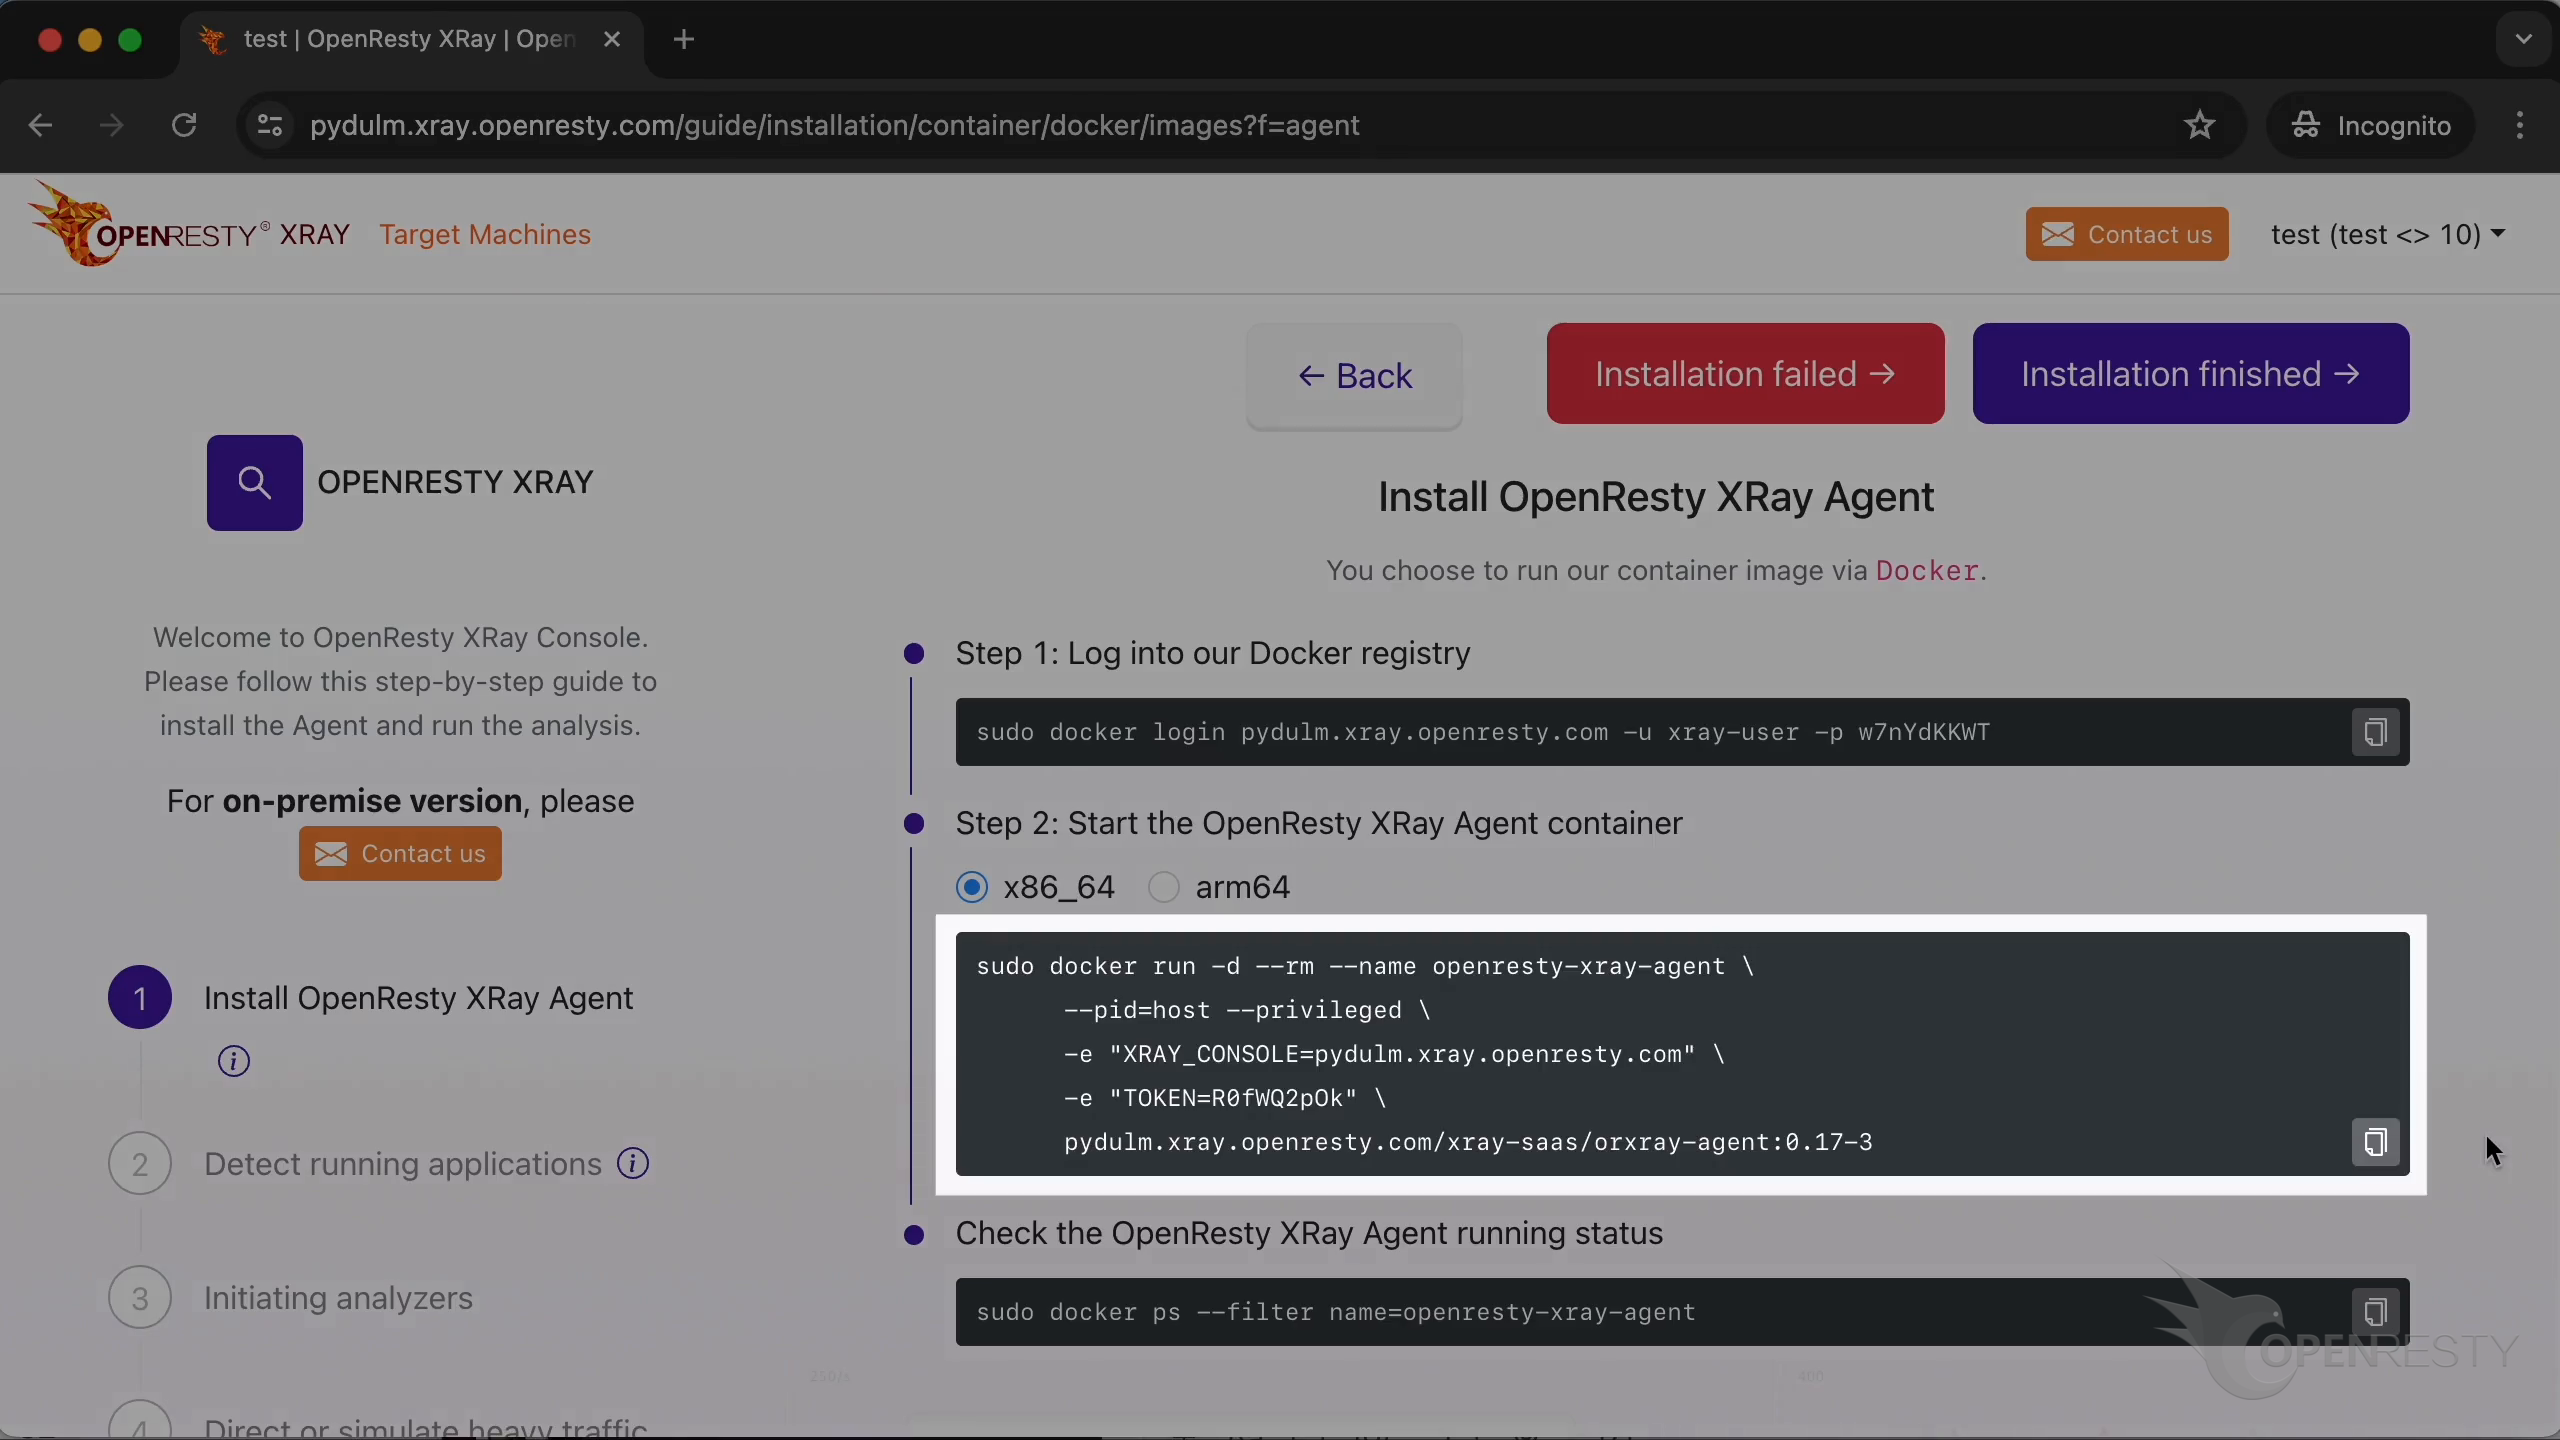
Deploy the Agent with this yaml file.
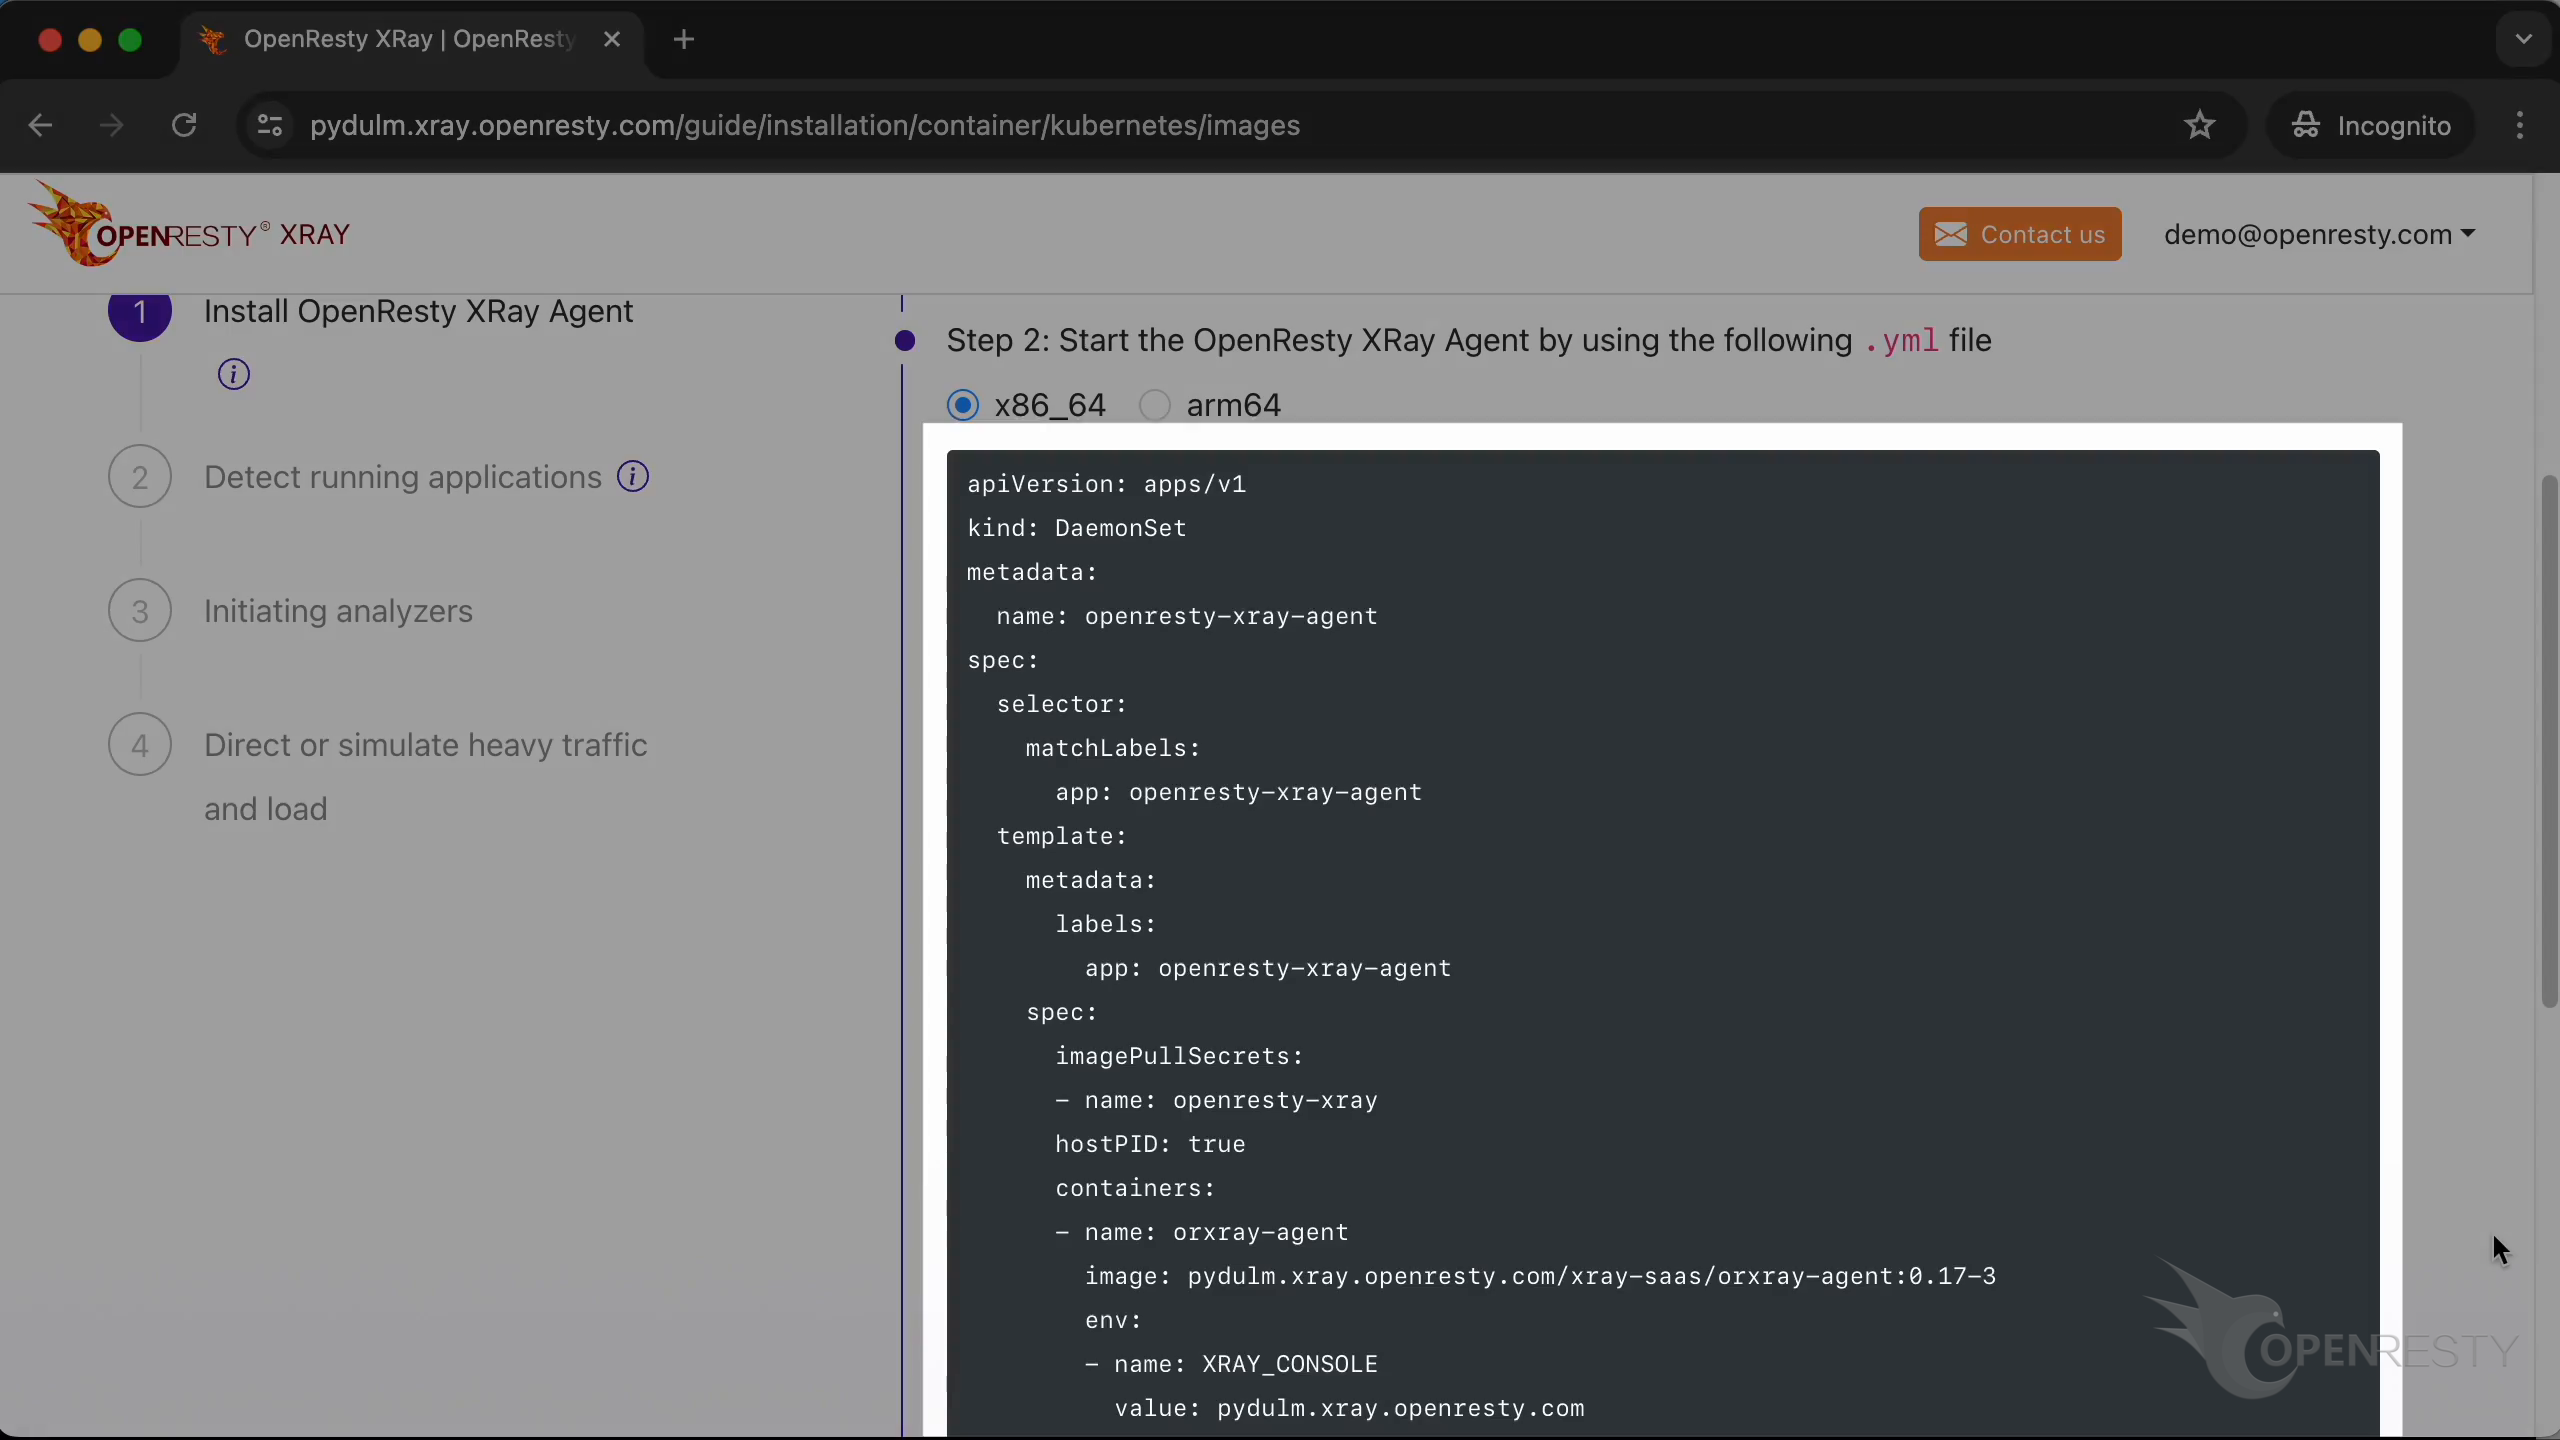
You can choose x86_64 or arm64, depending on the CPU architecture of the target machine. In this example, we choose x86_64.
Create a new yaml file using the vim editor. Save it locally with the filename openresty-xray-agent.yml.
Copy the content of the file.
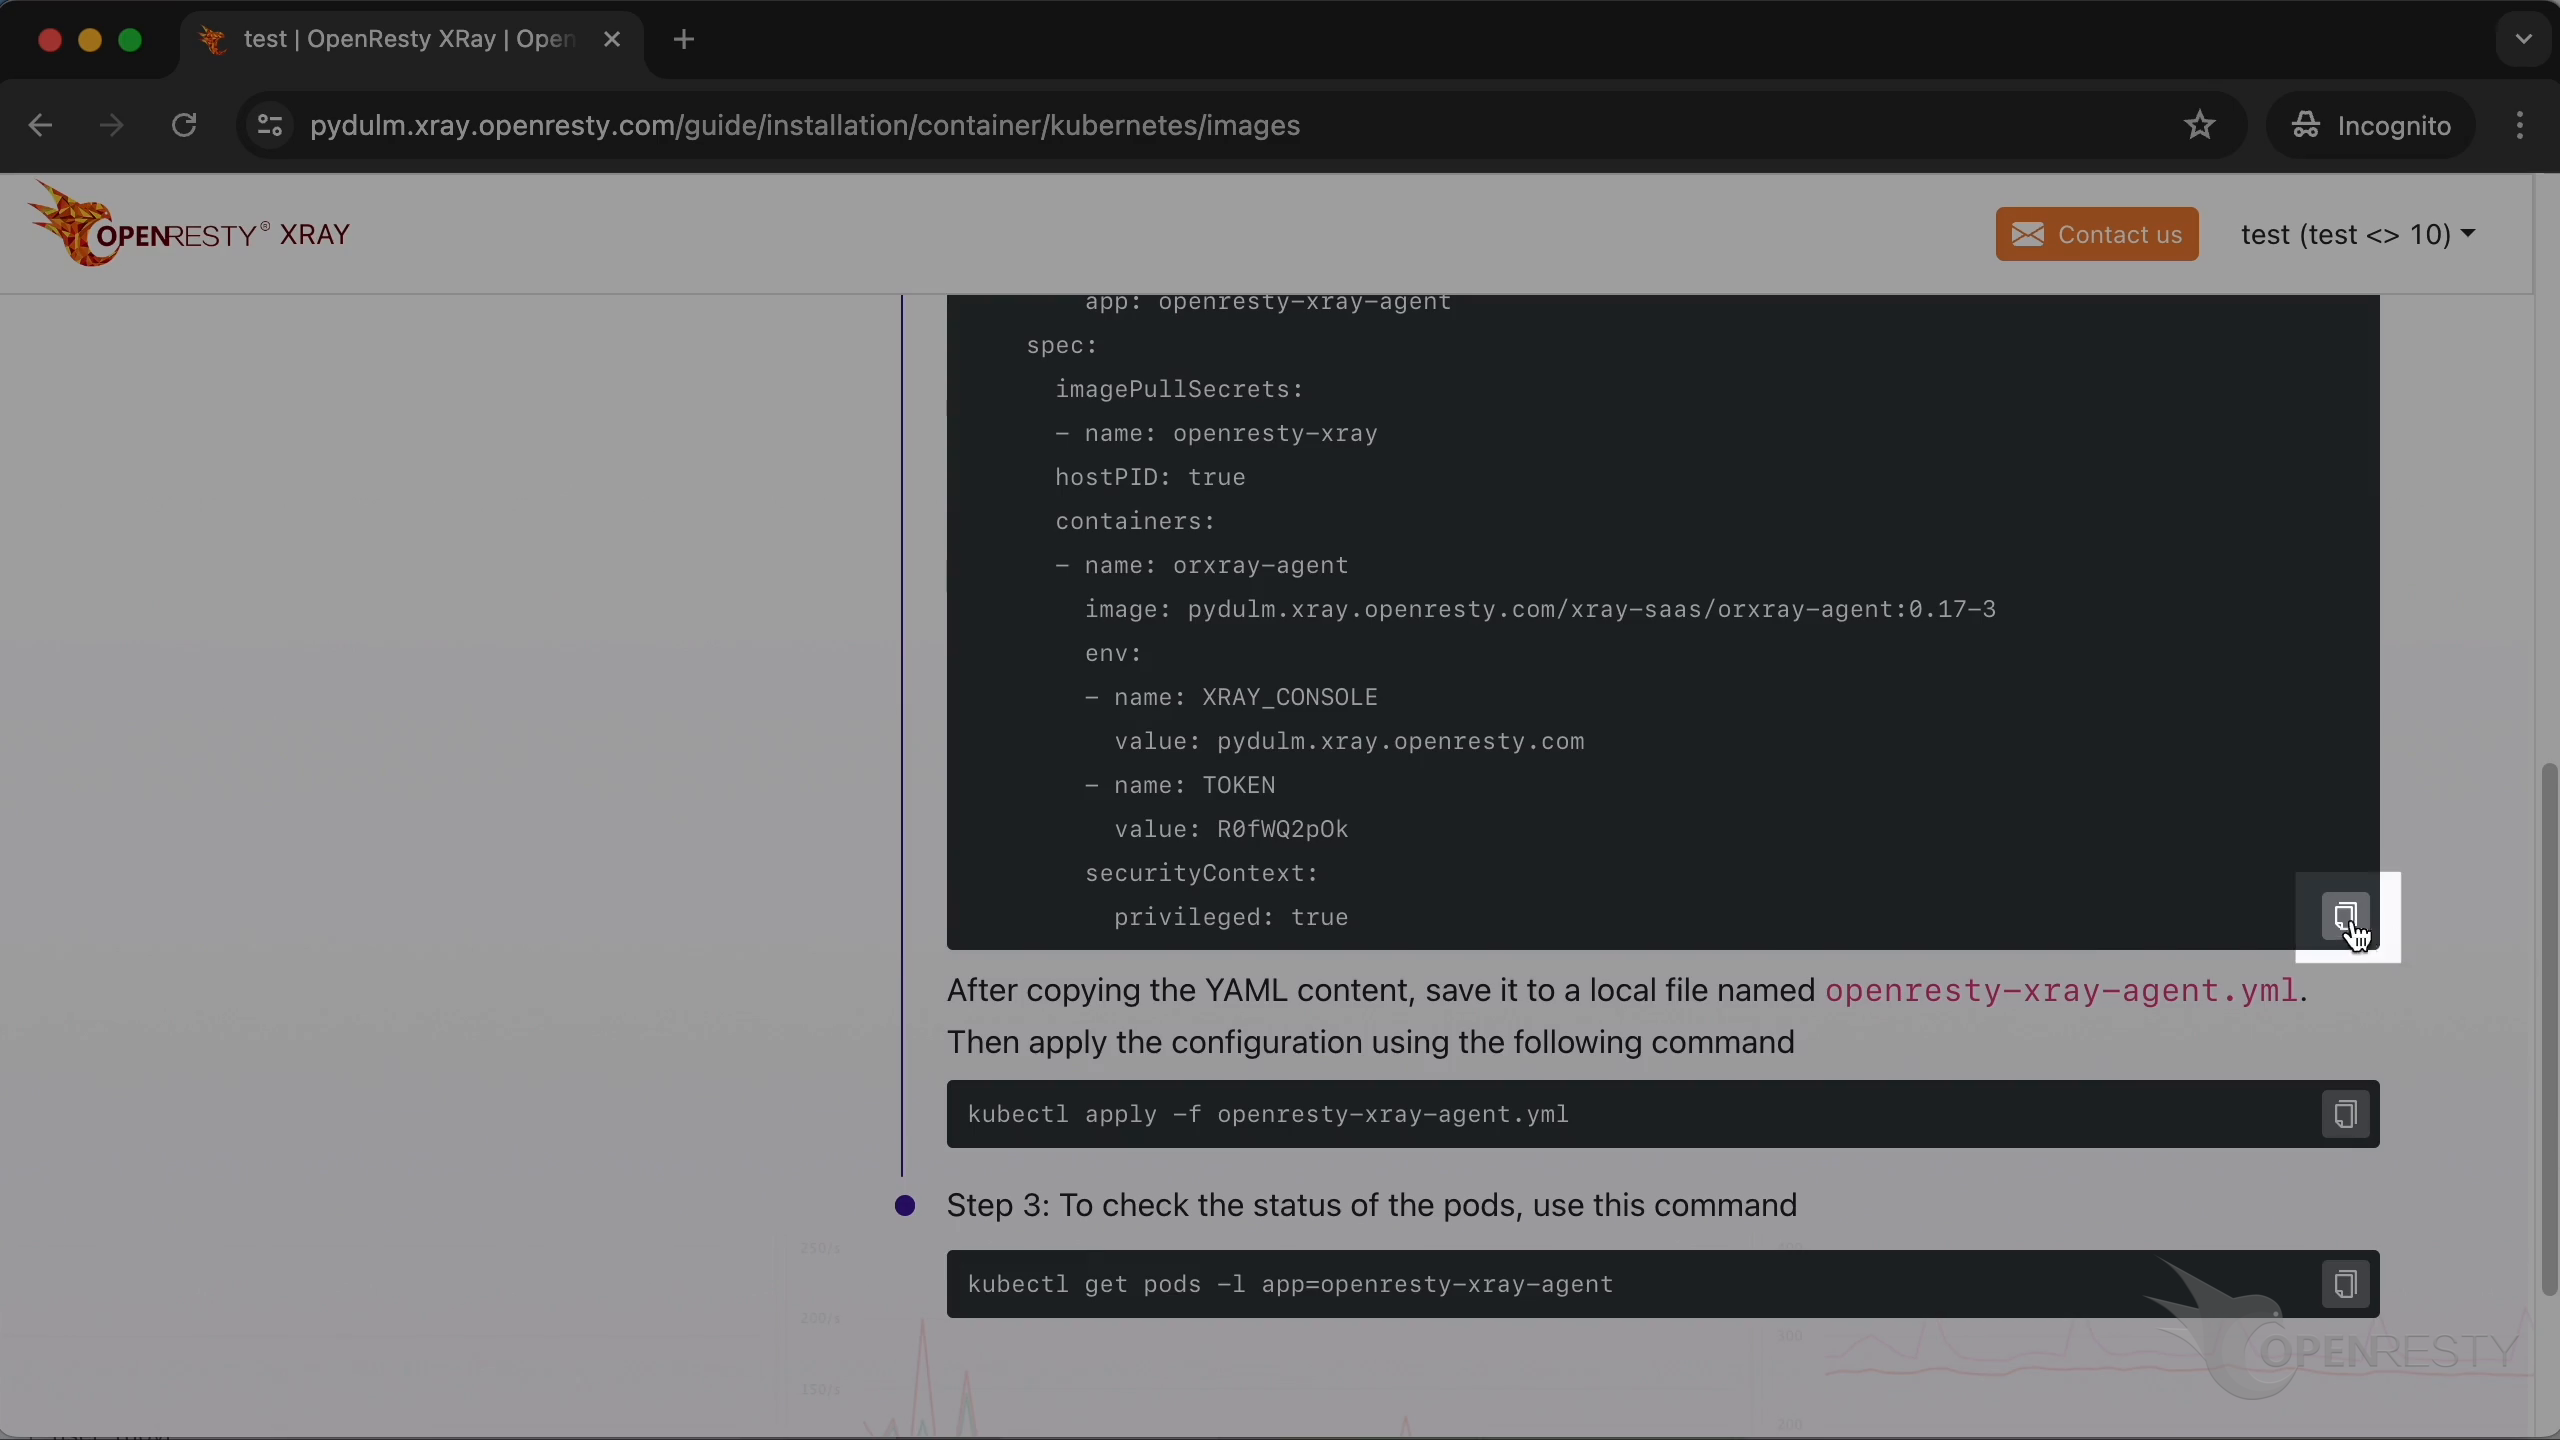
Paste it. Save the file.
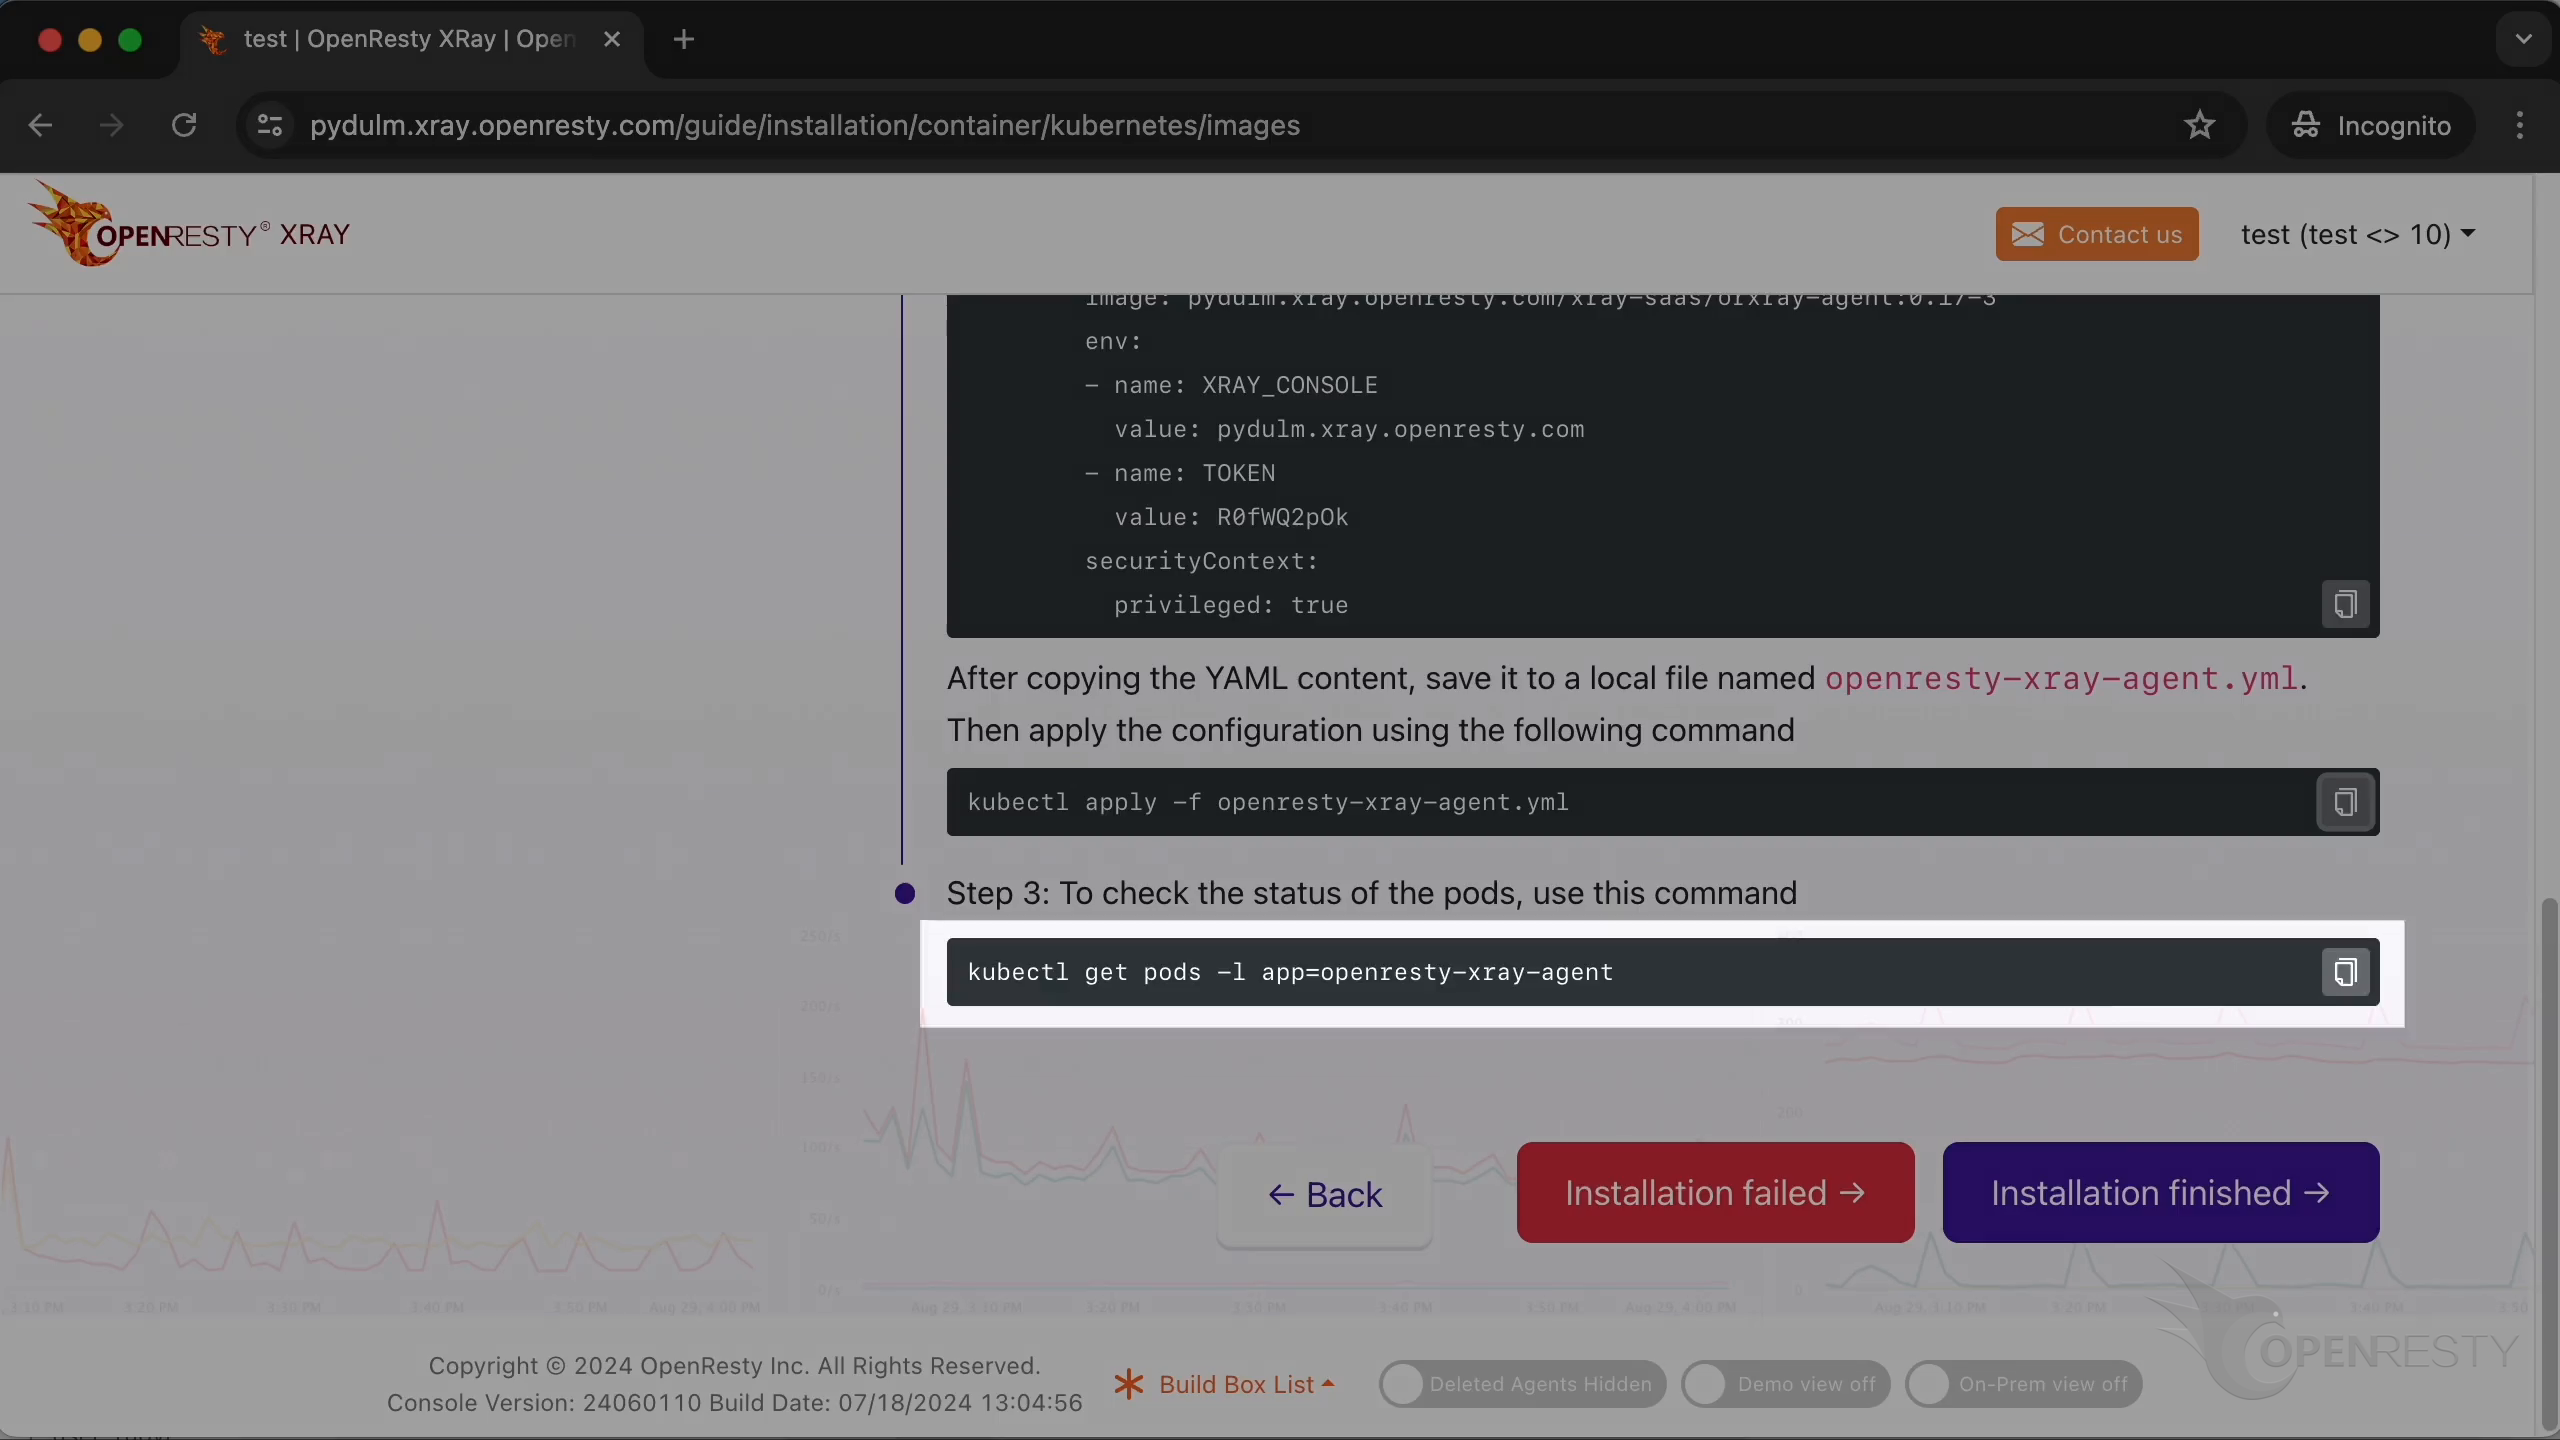
We can apply the configuration using the following command.
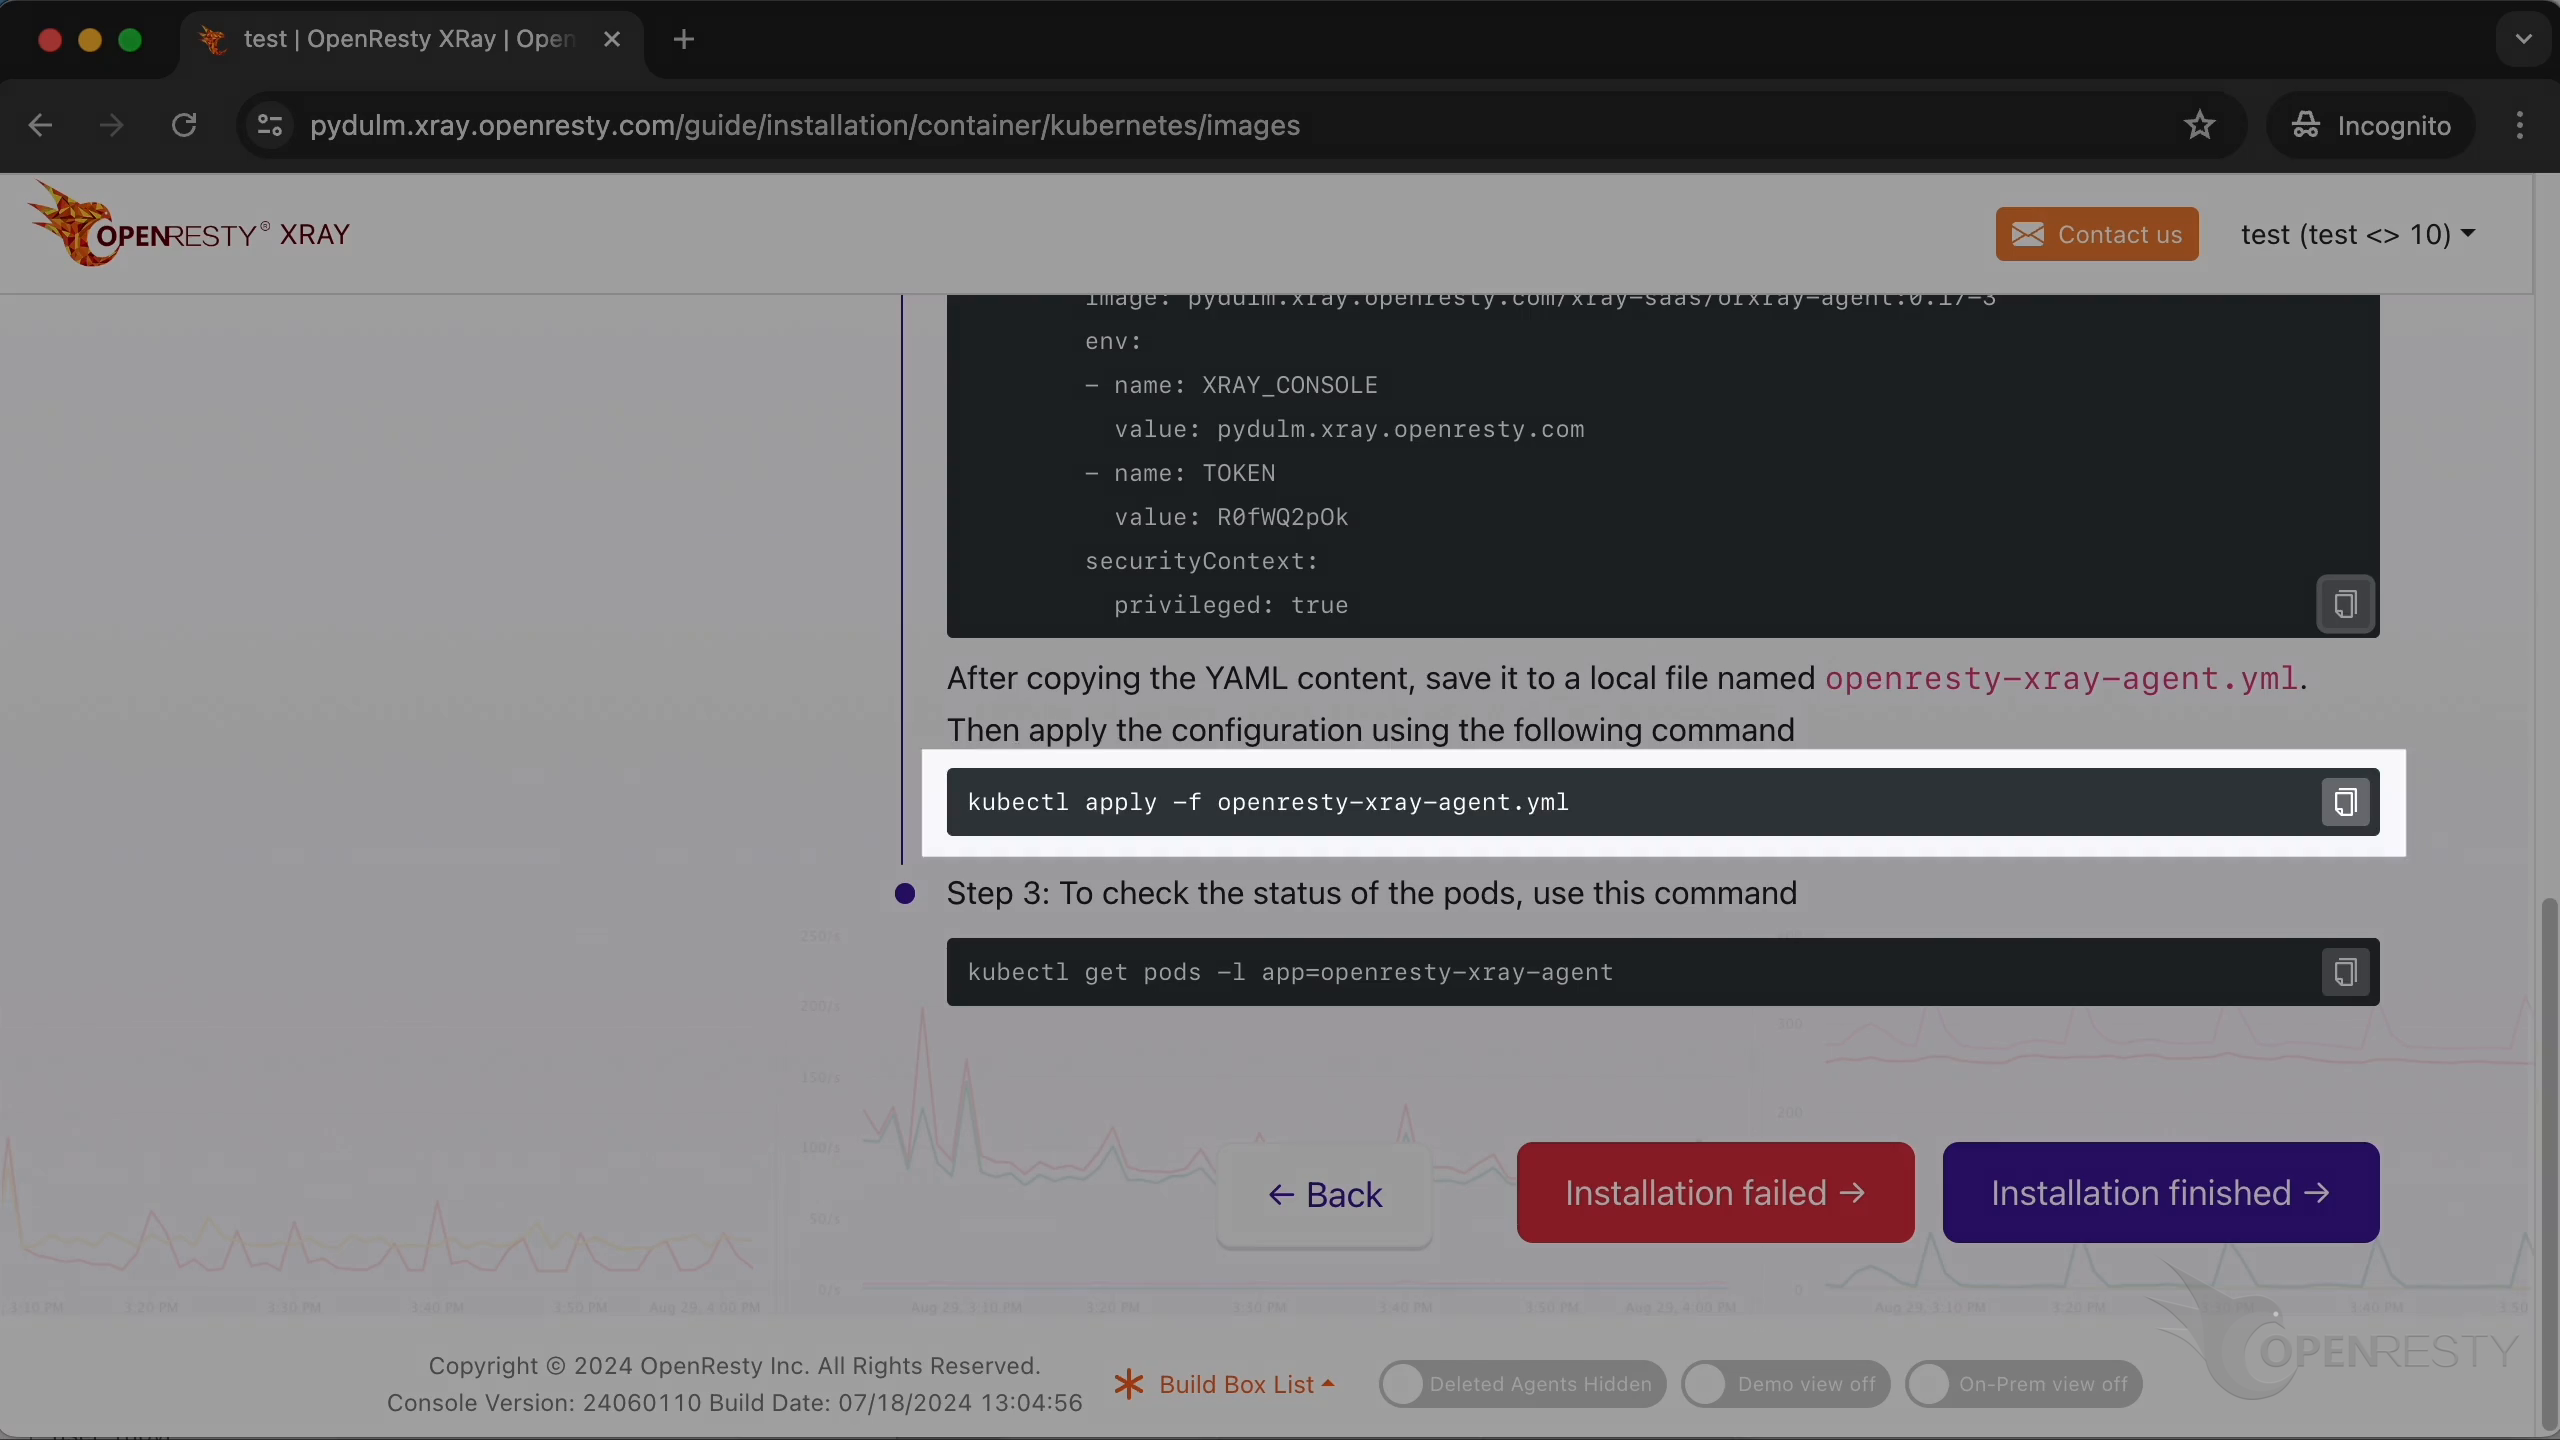
Copy it.

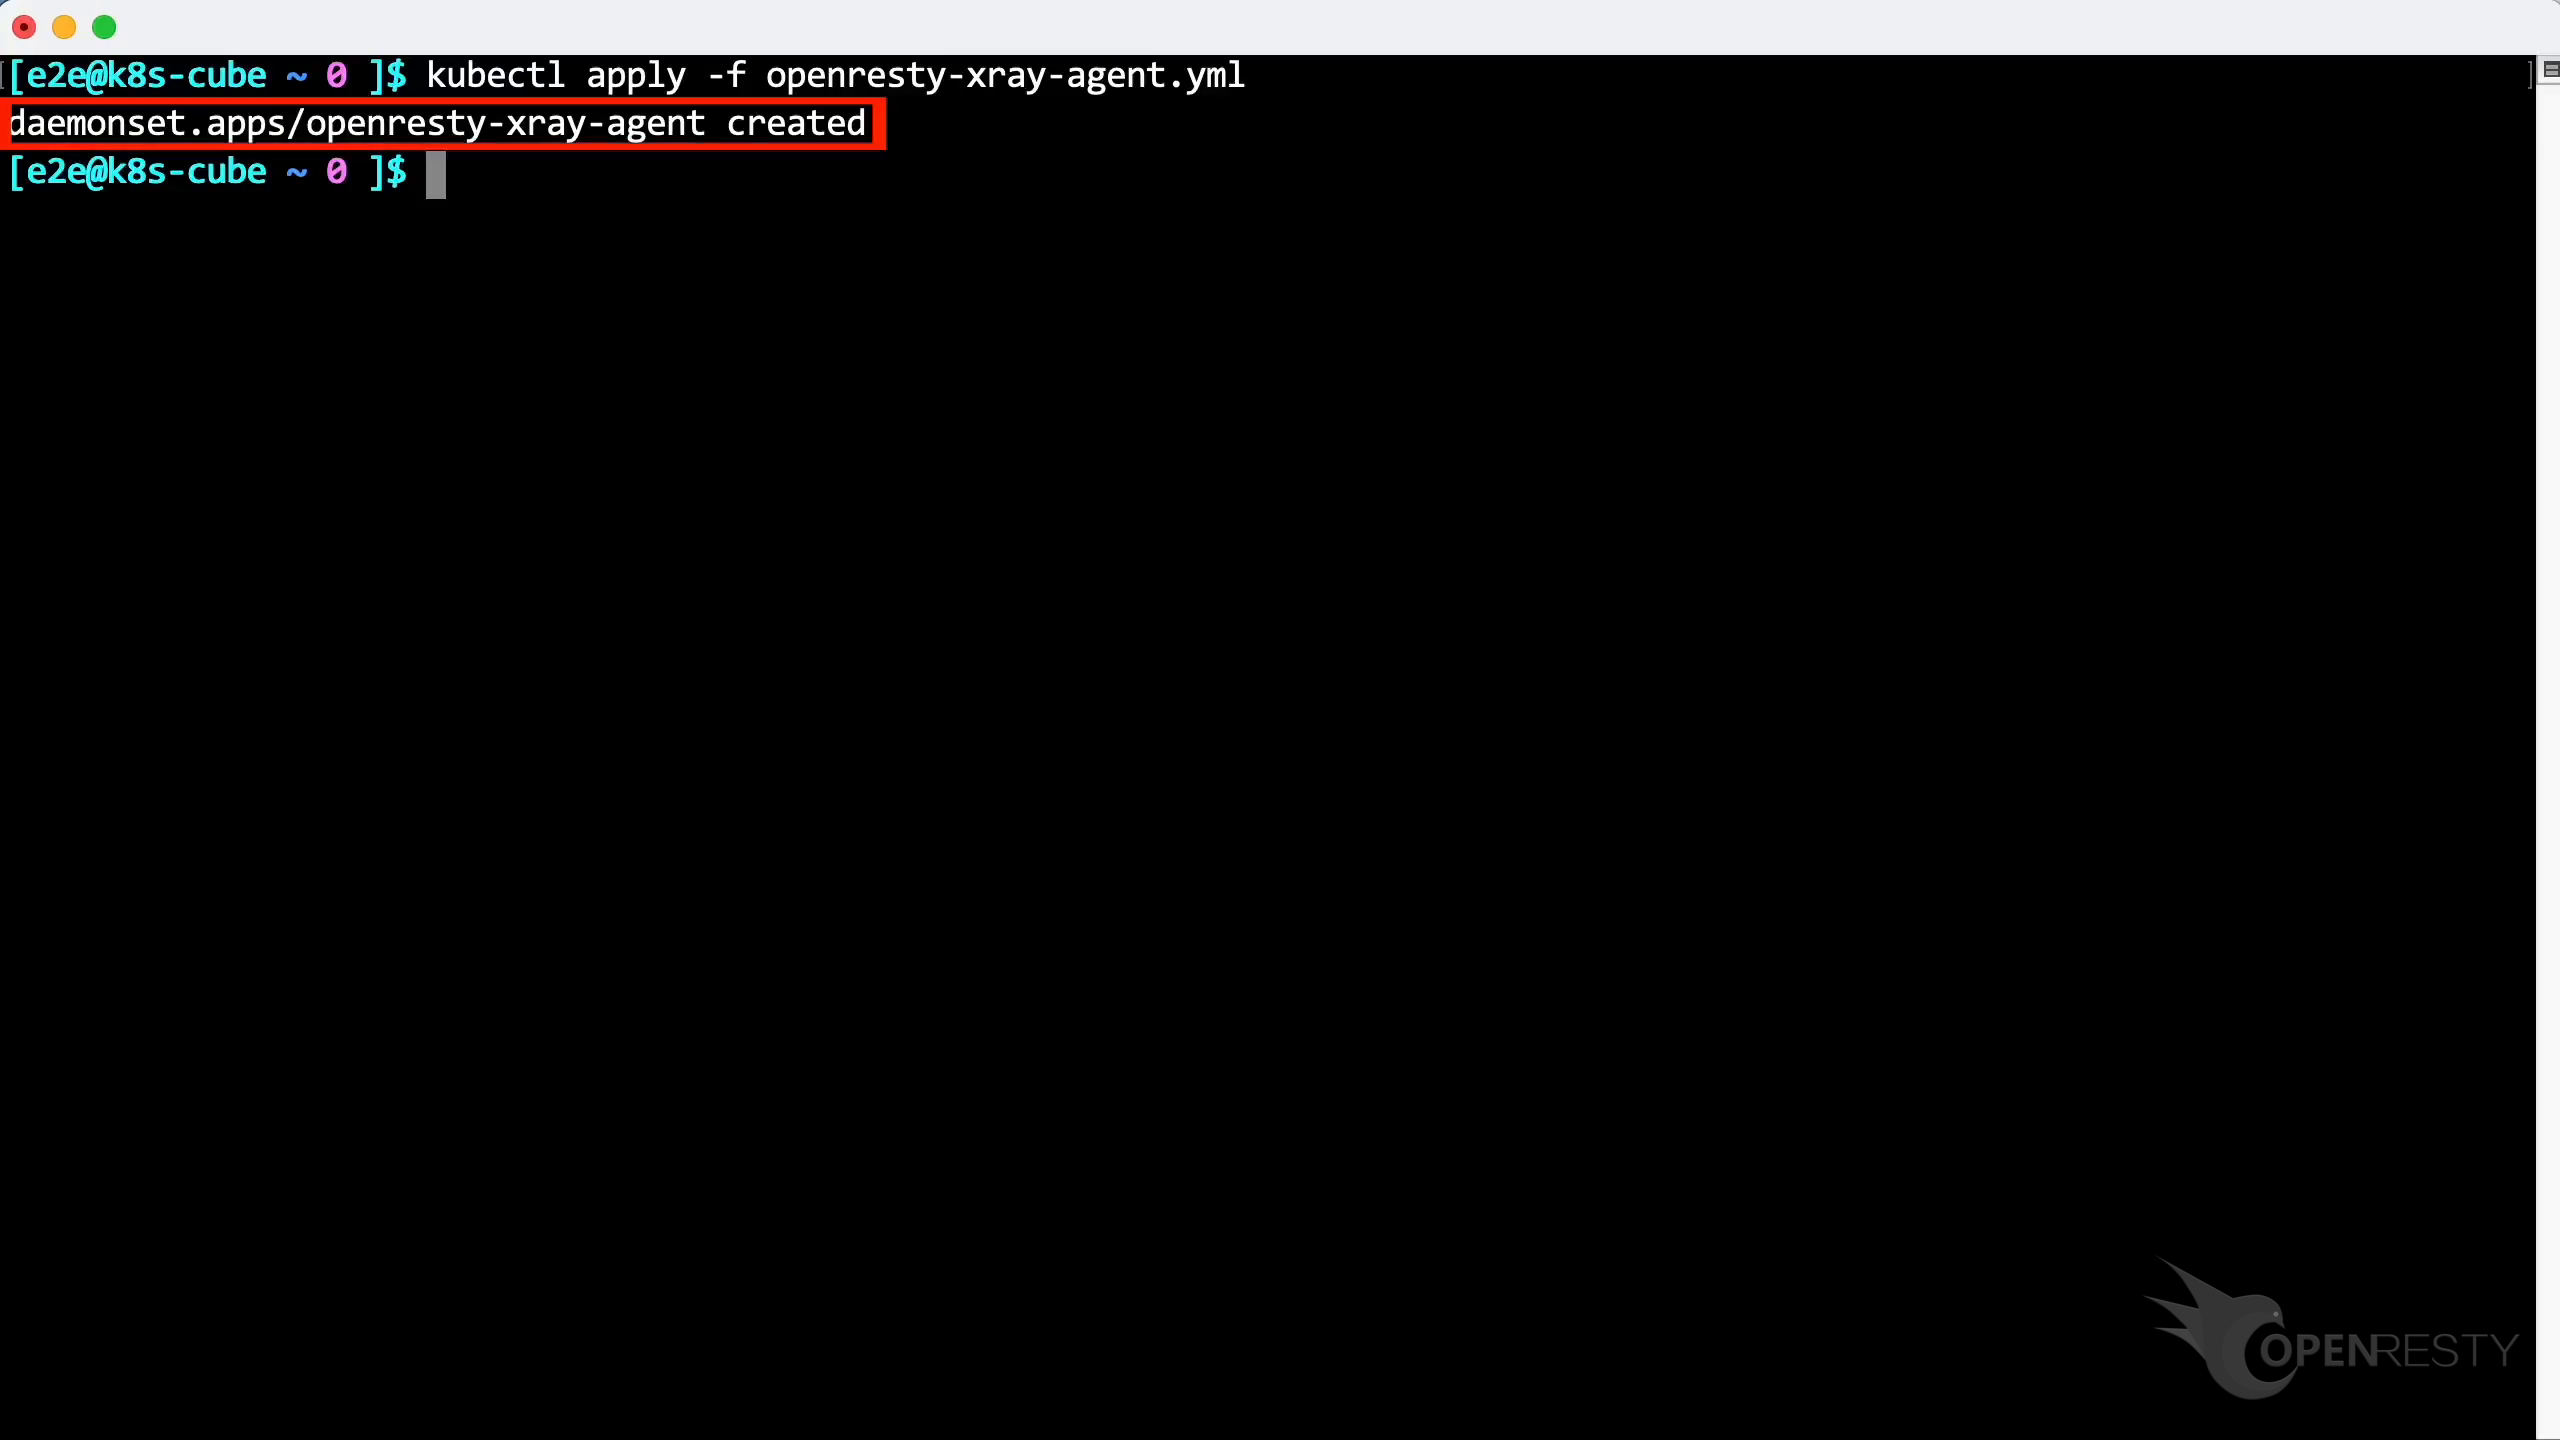
Paste and execute this command.
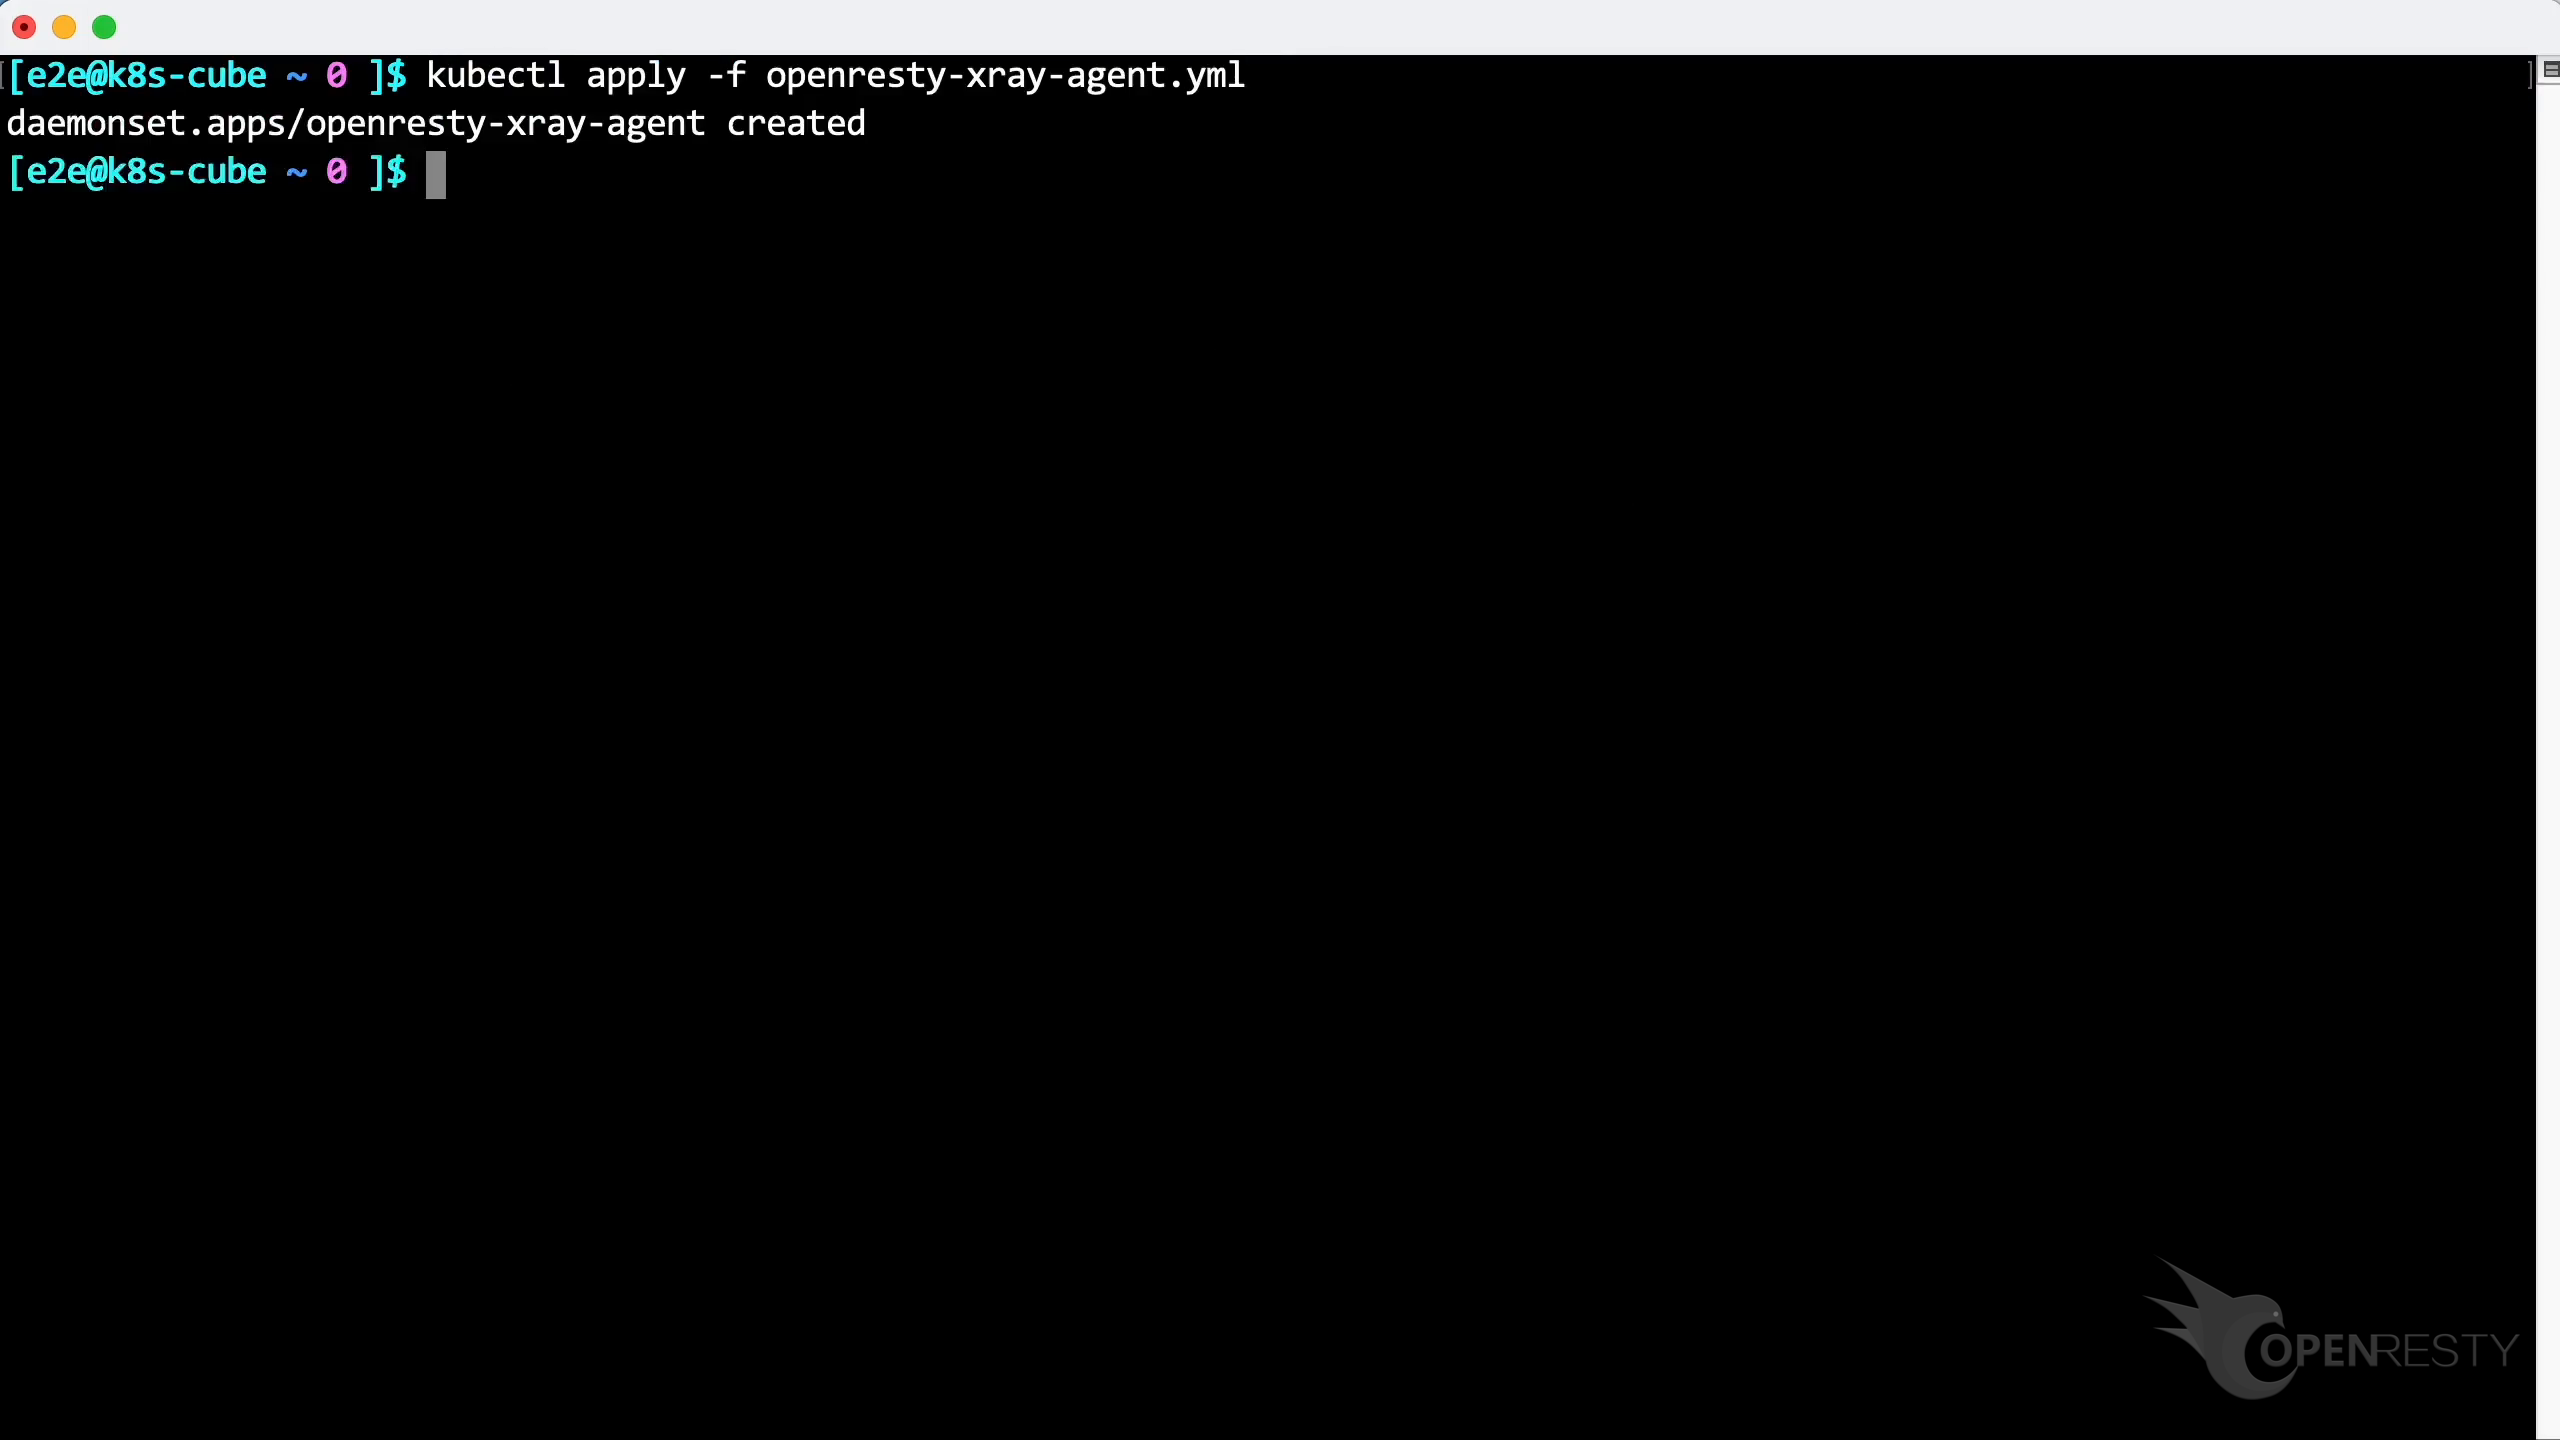
Agent has been successfully deployed.
Then check the status of the pods with this command.
Let’s copy it.
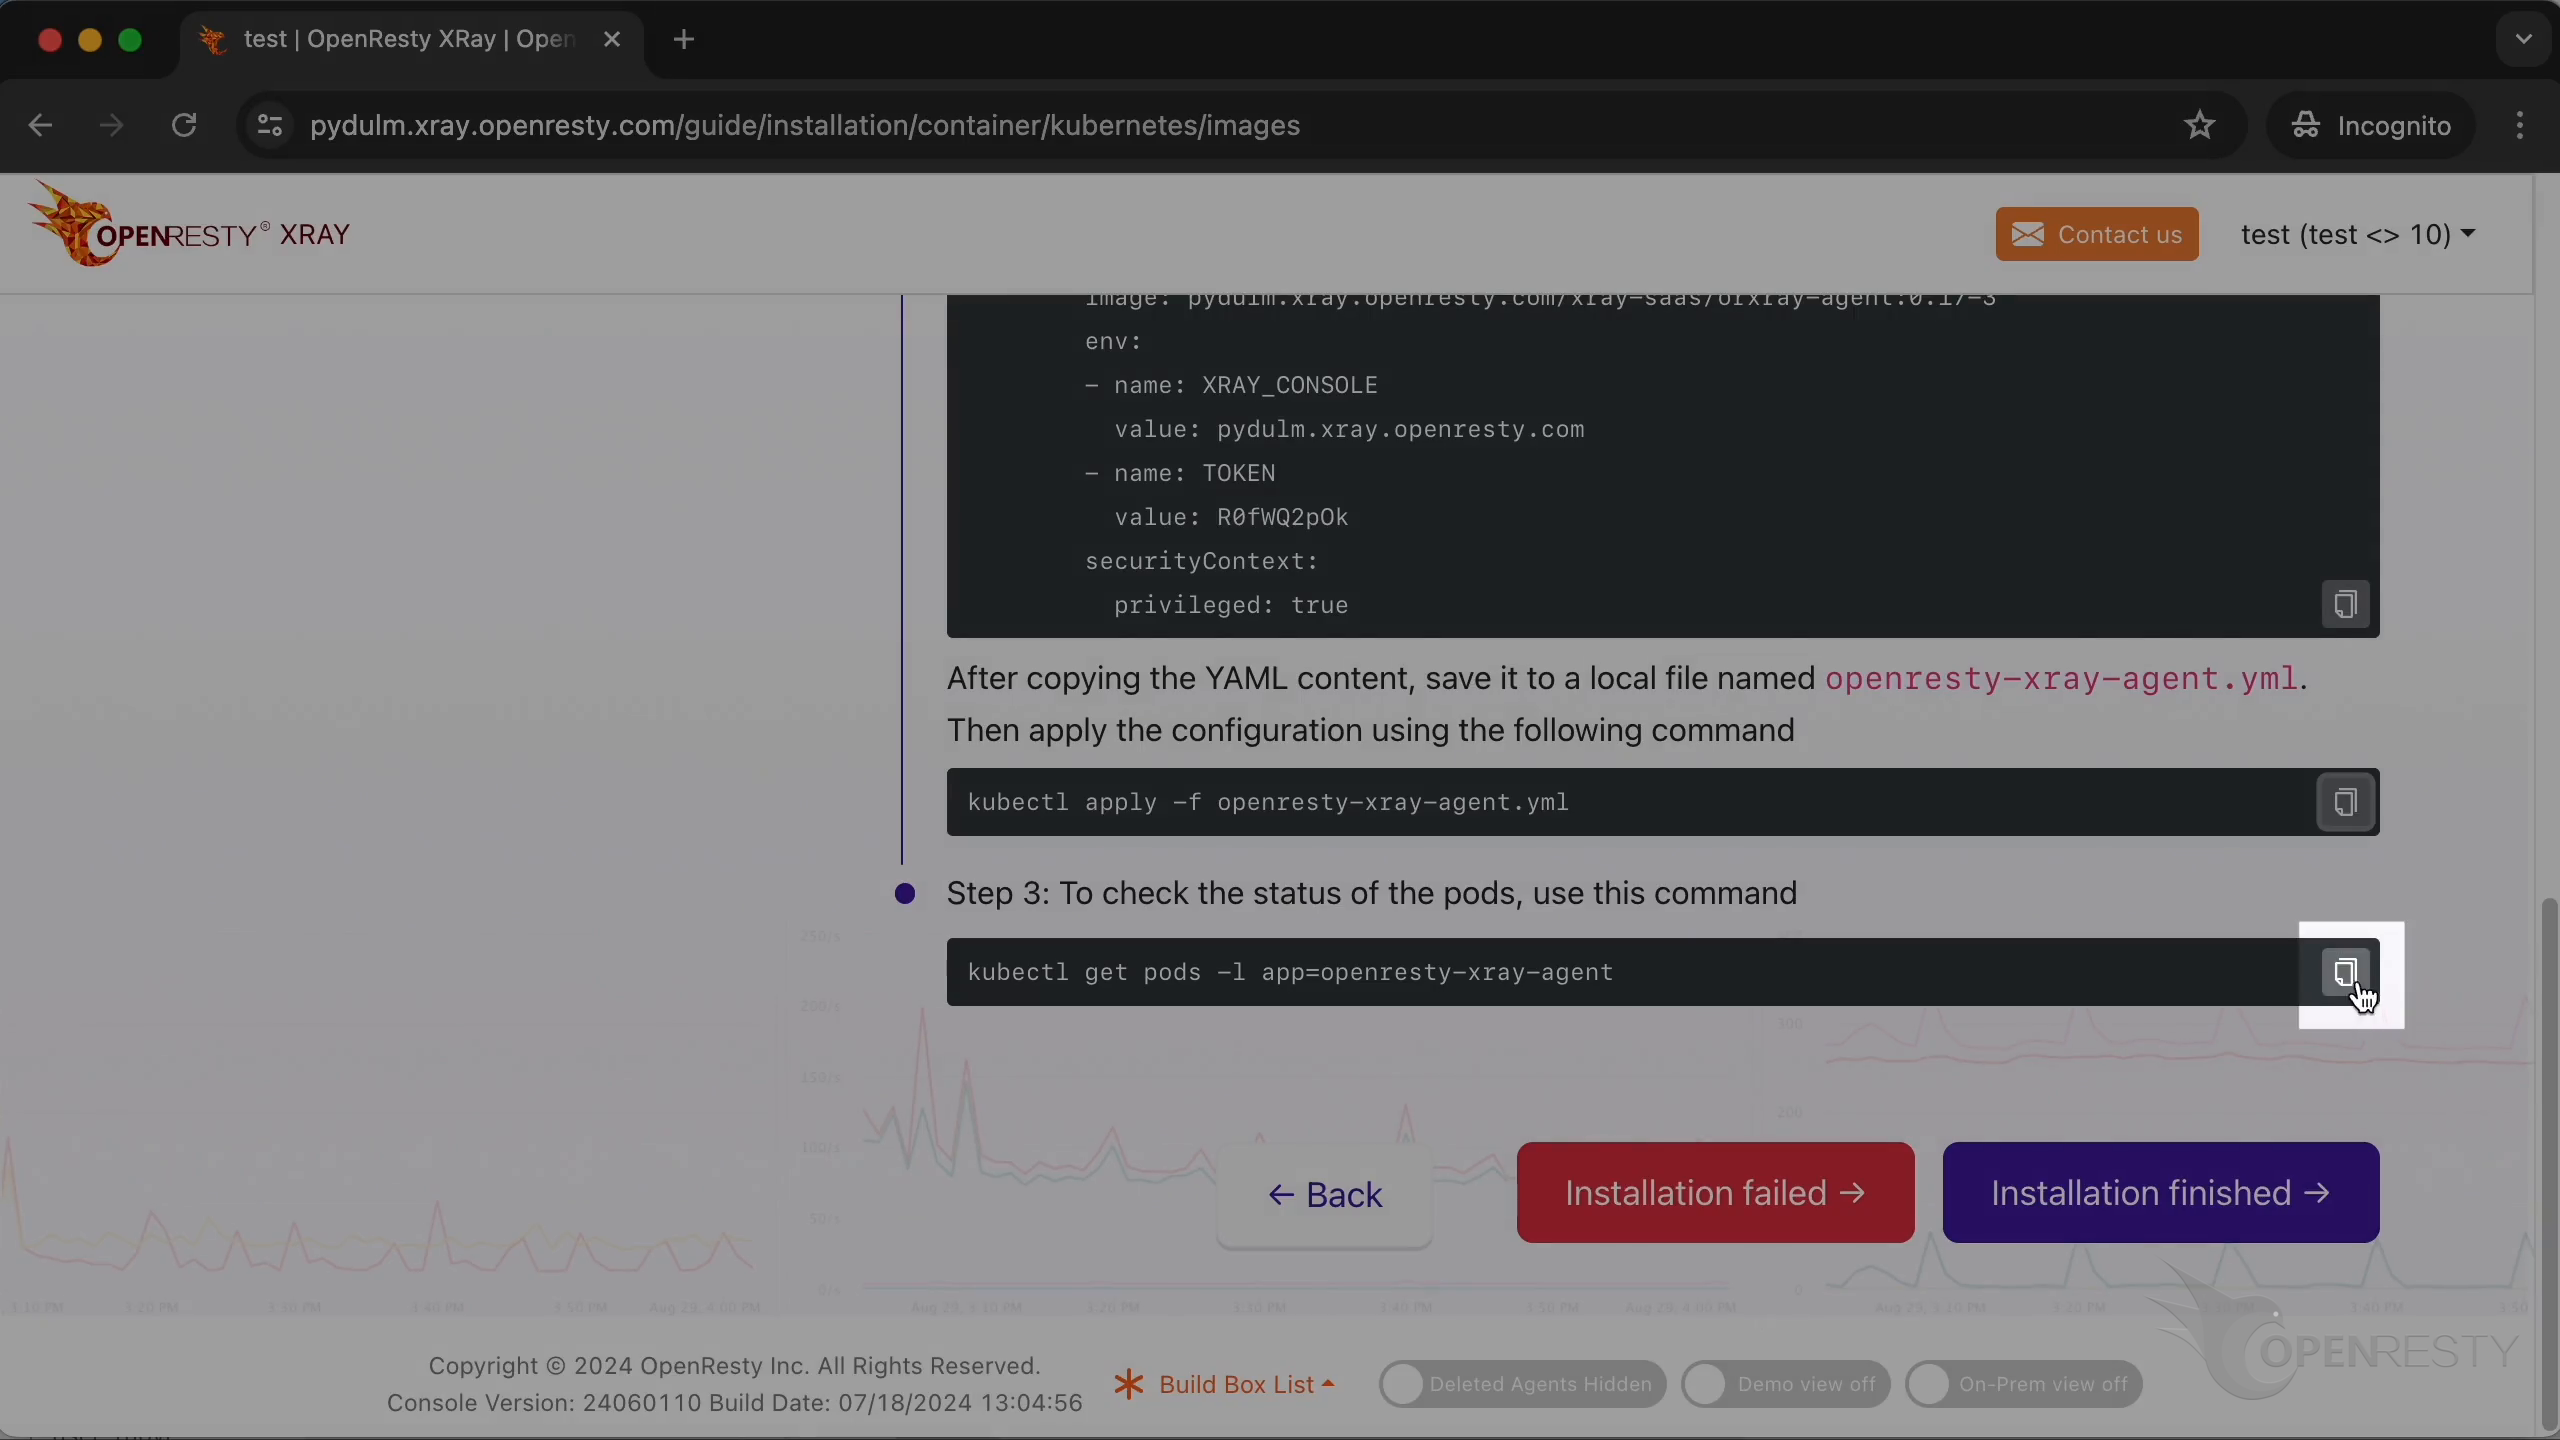
Paste and run the command.
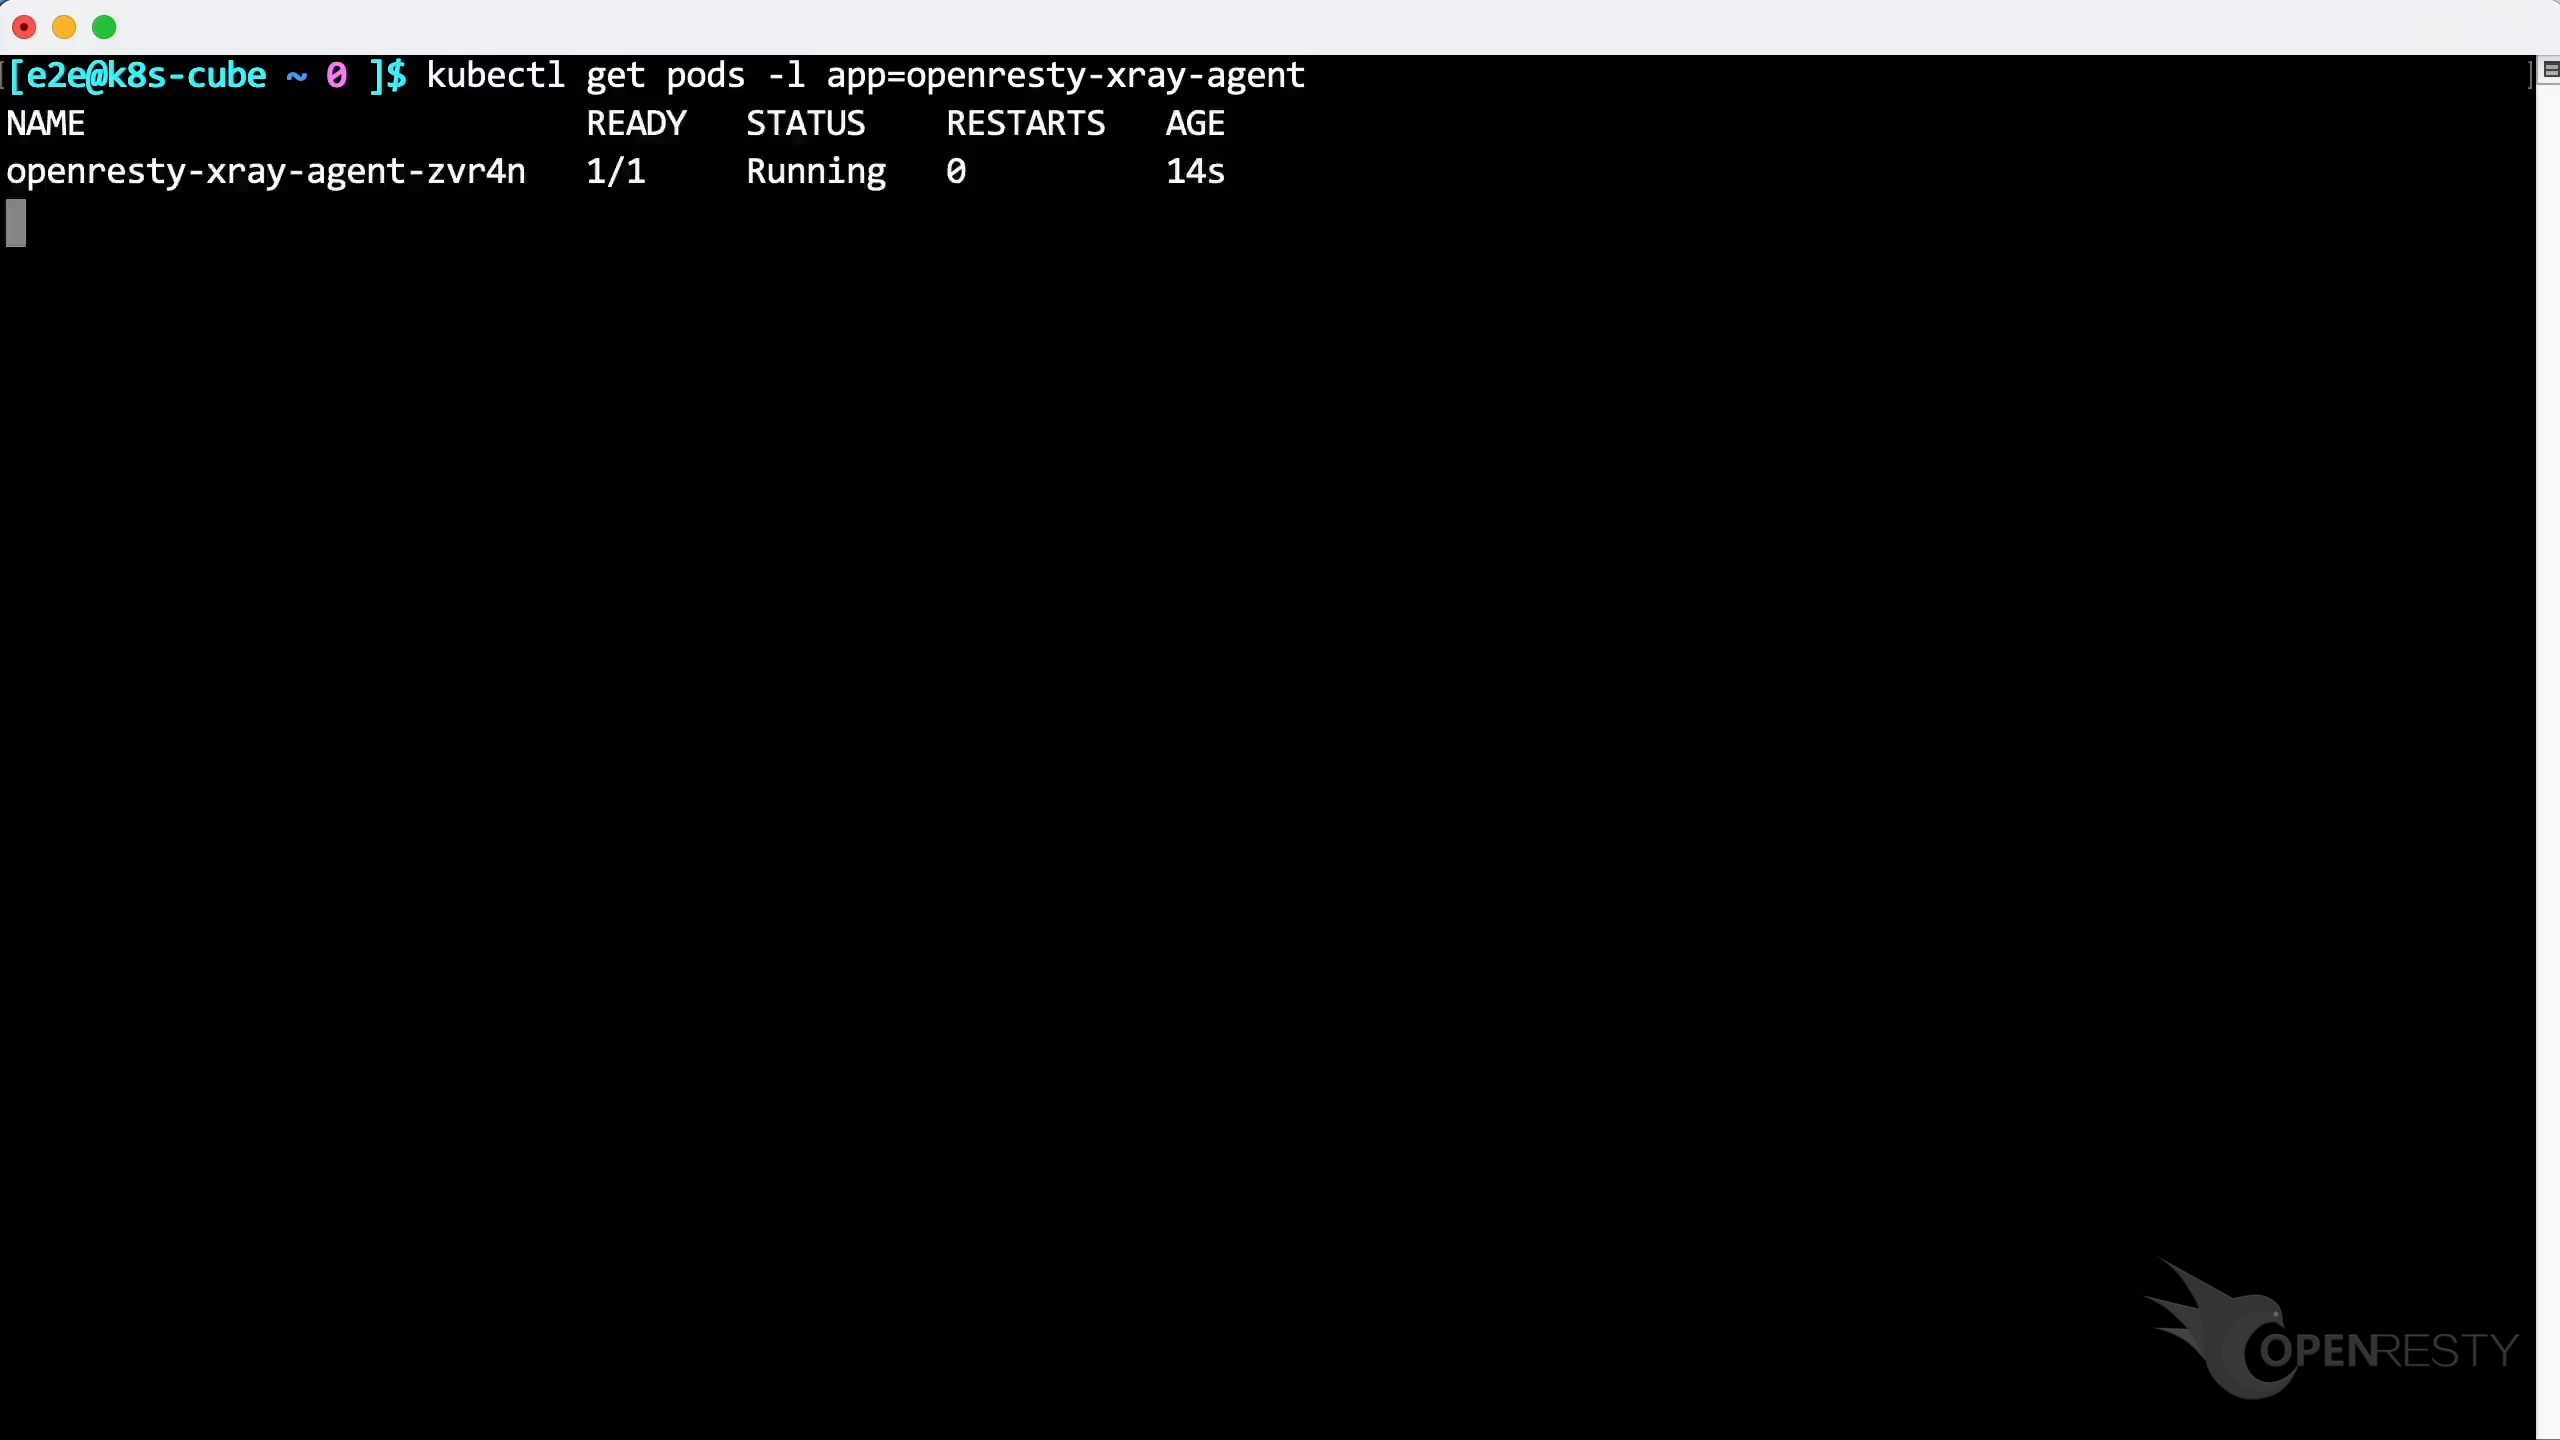
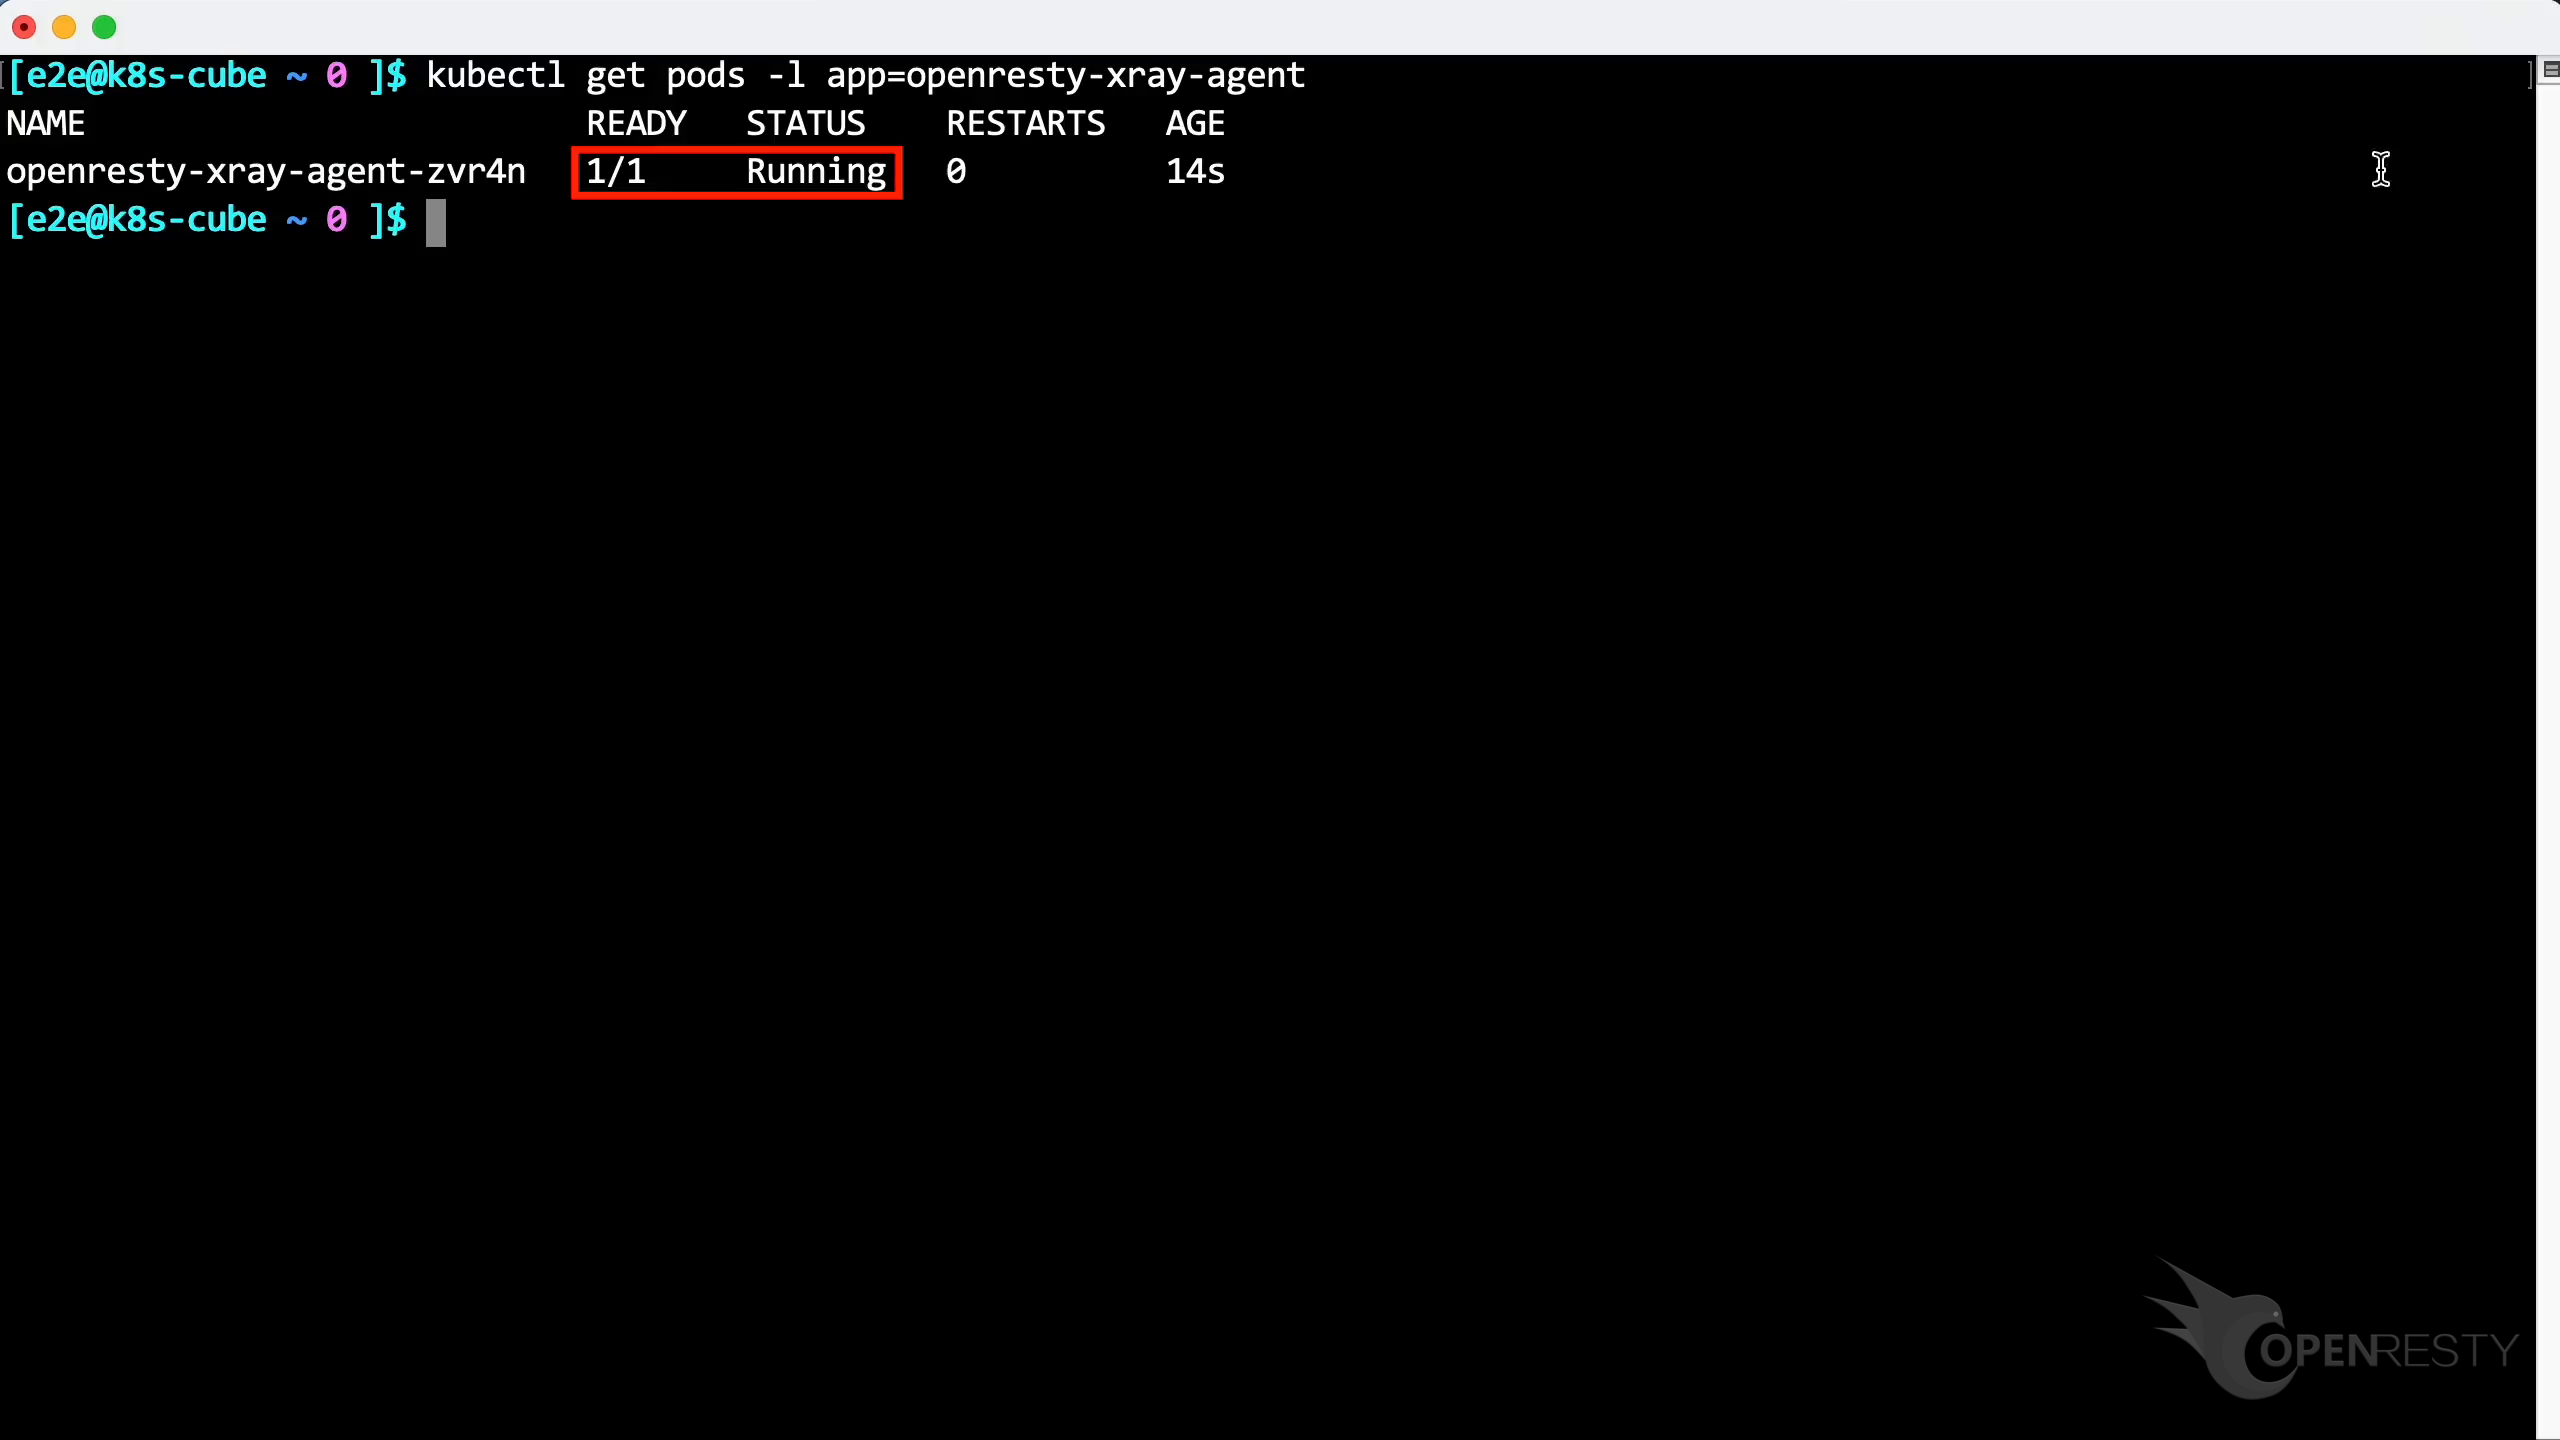
The Agent has been successfully installed and is running.
Configuring and Detecting Applications
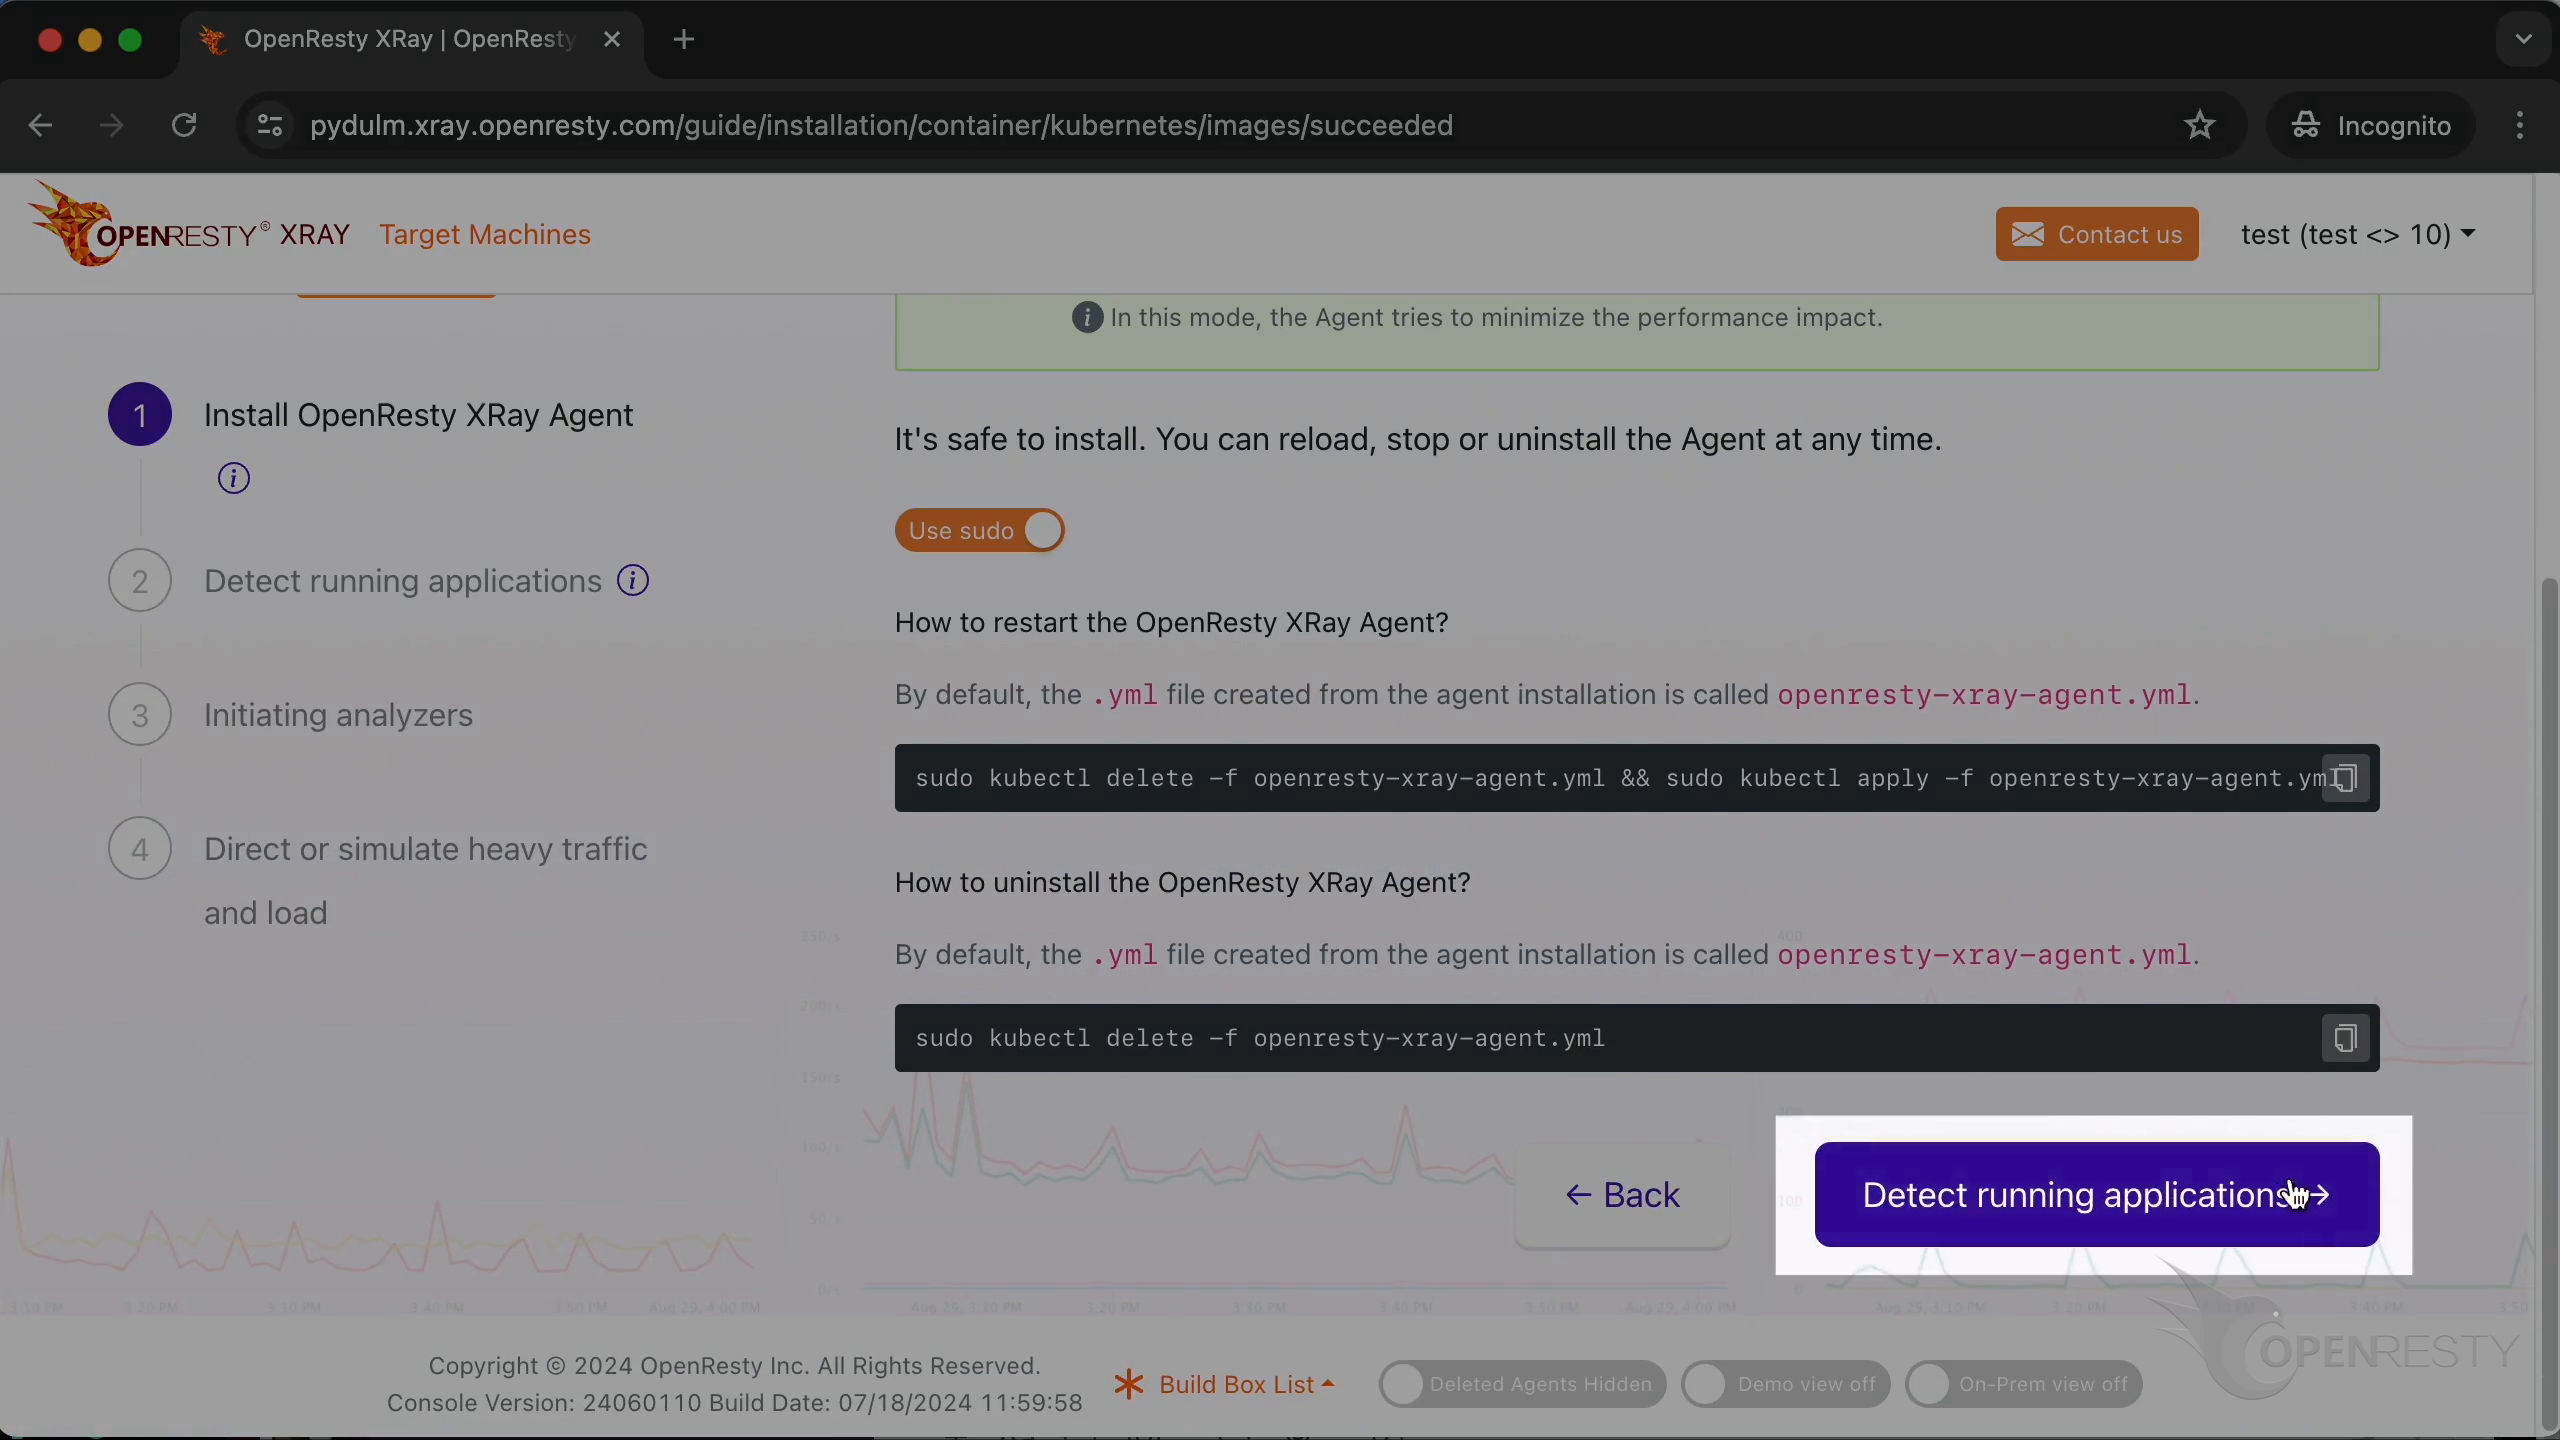
Let’s go back to the wizard page.
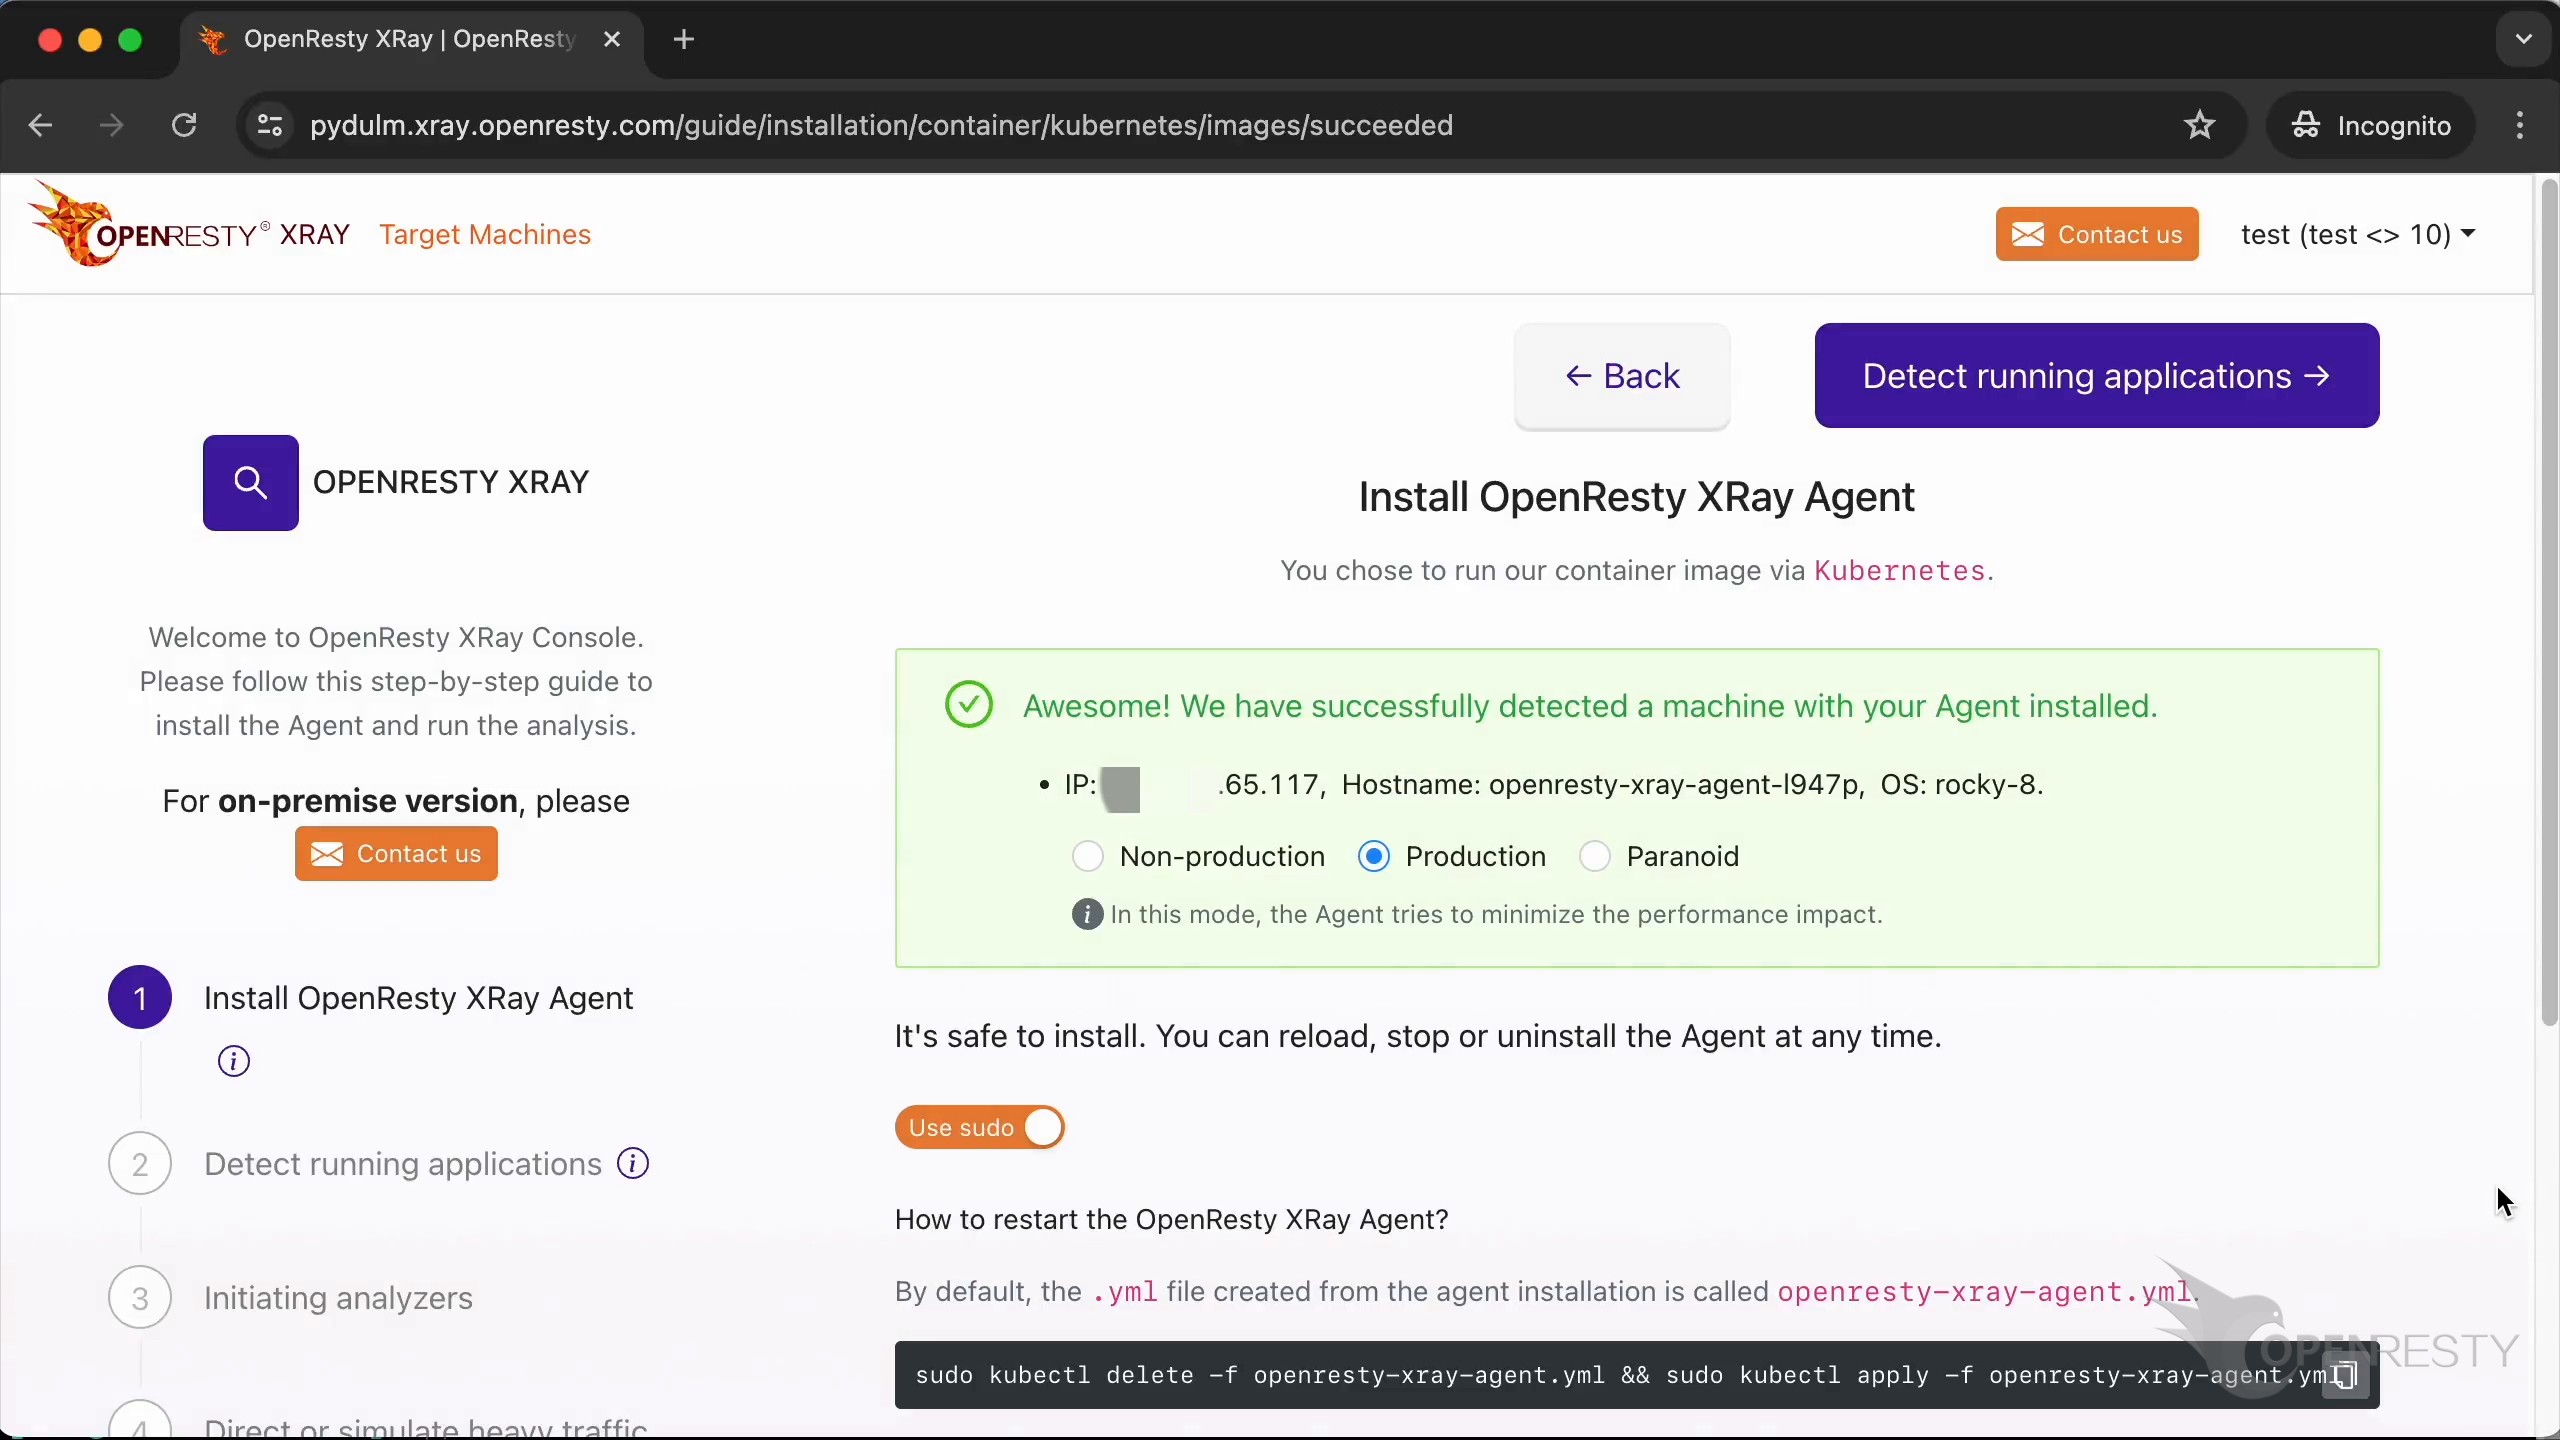
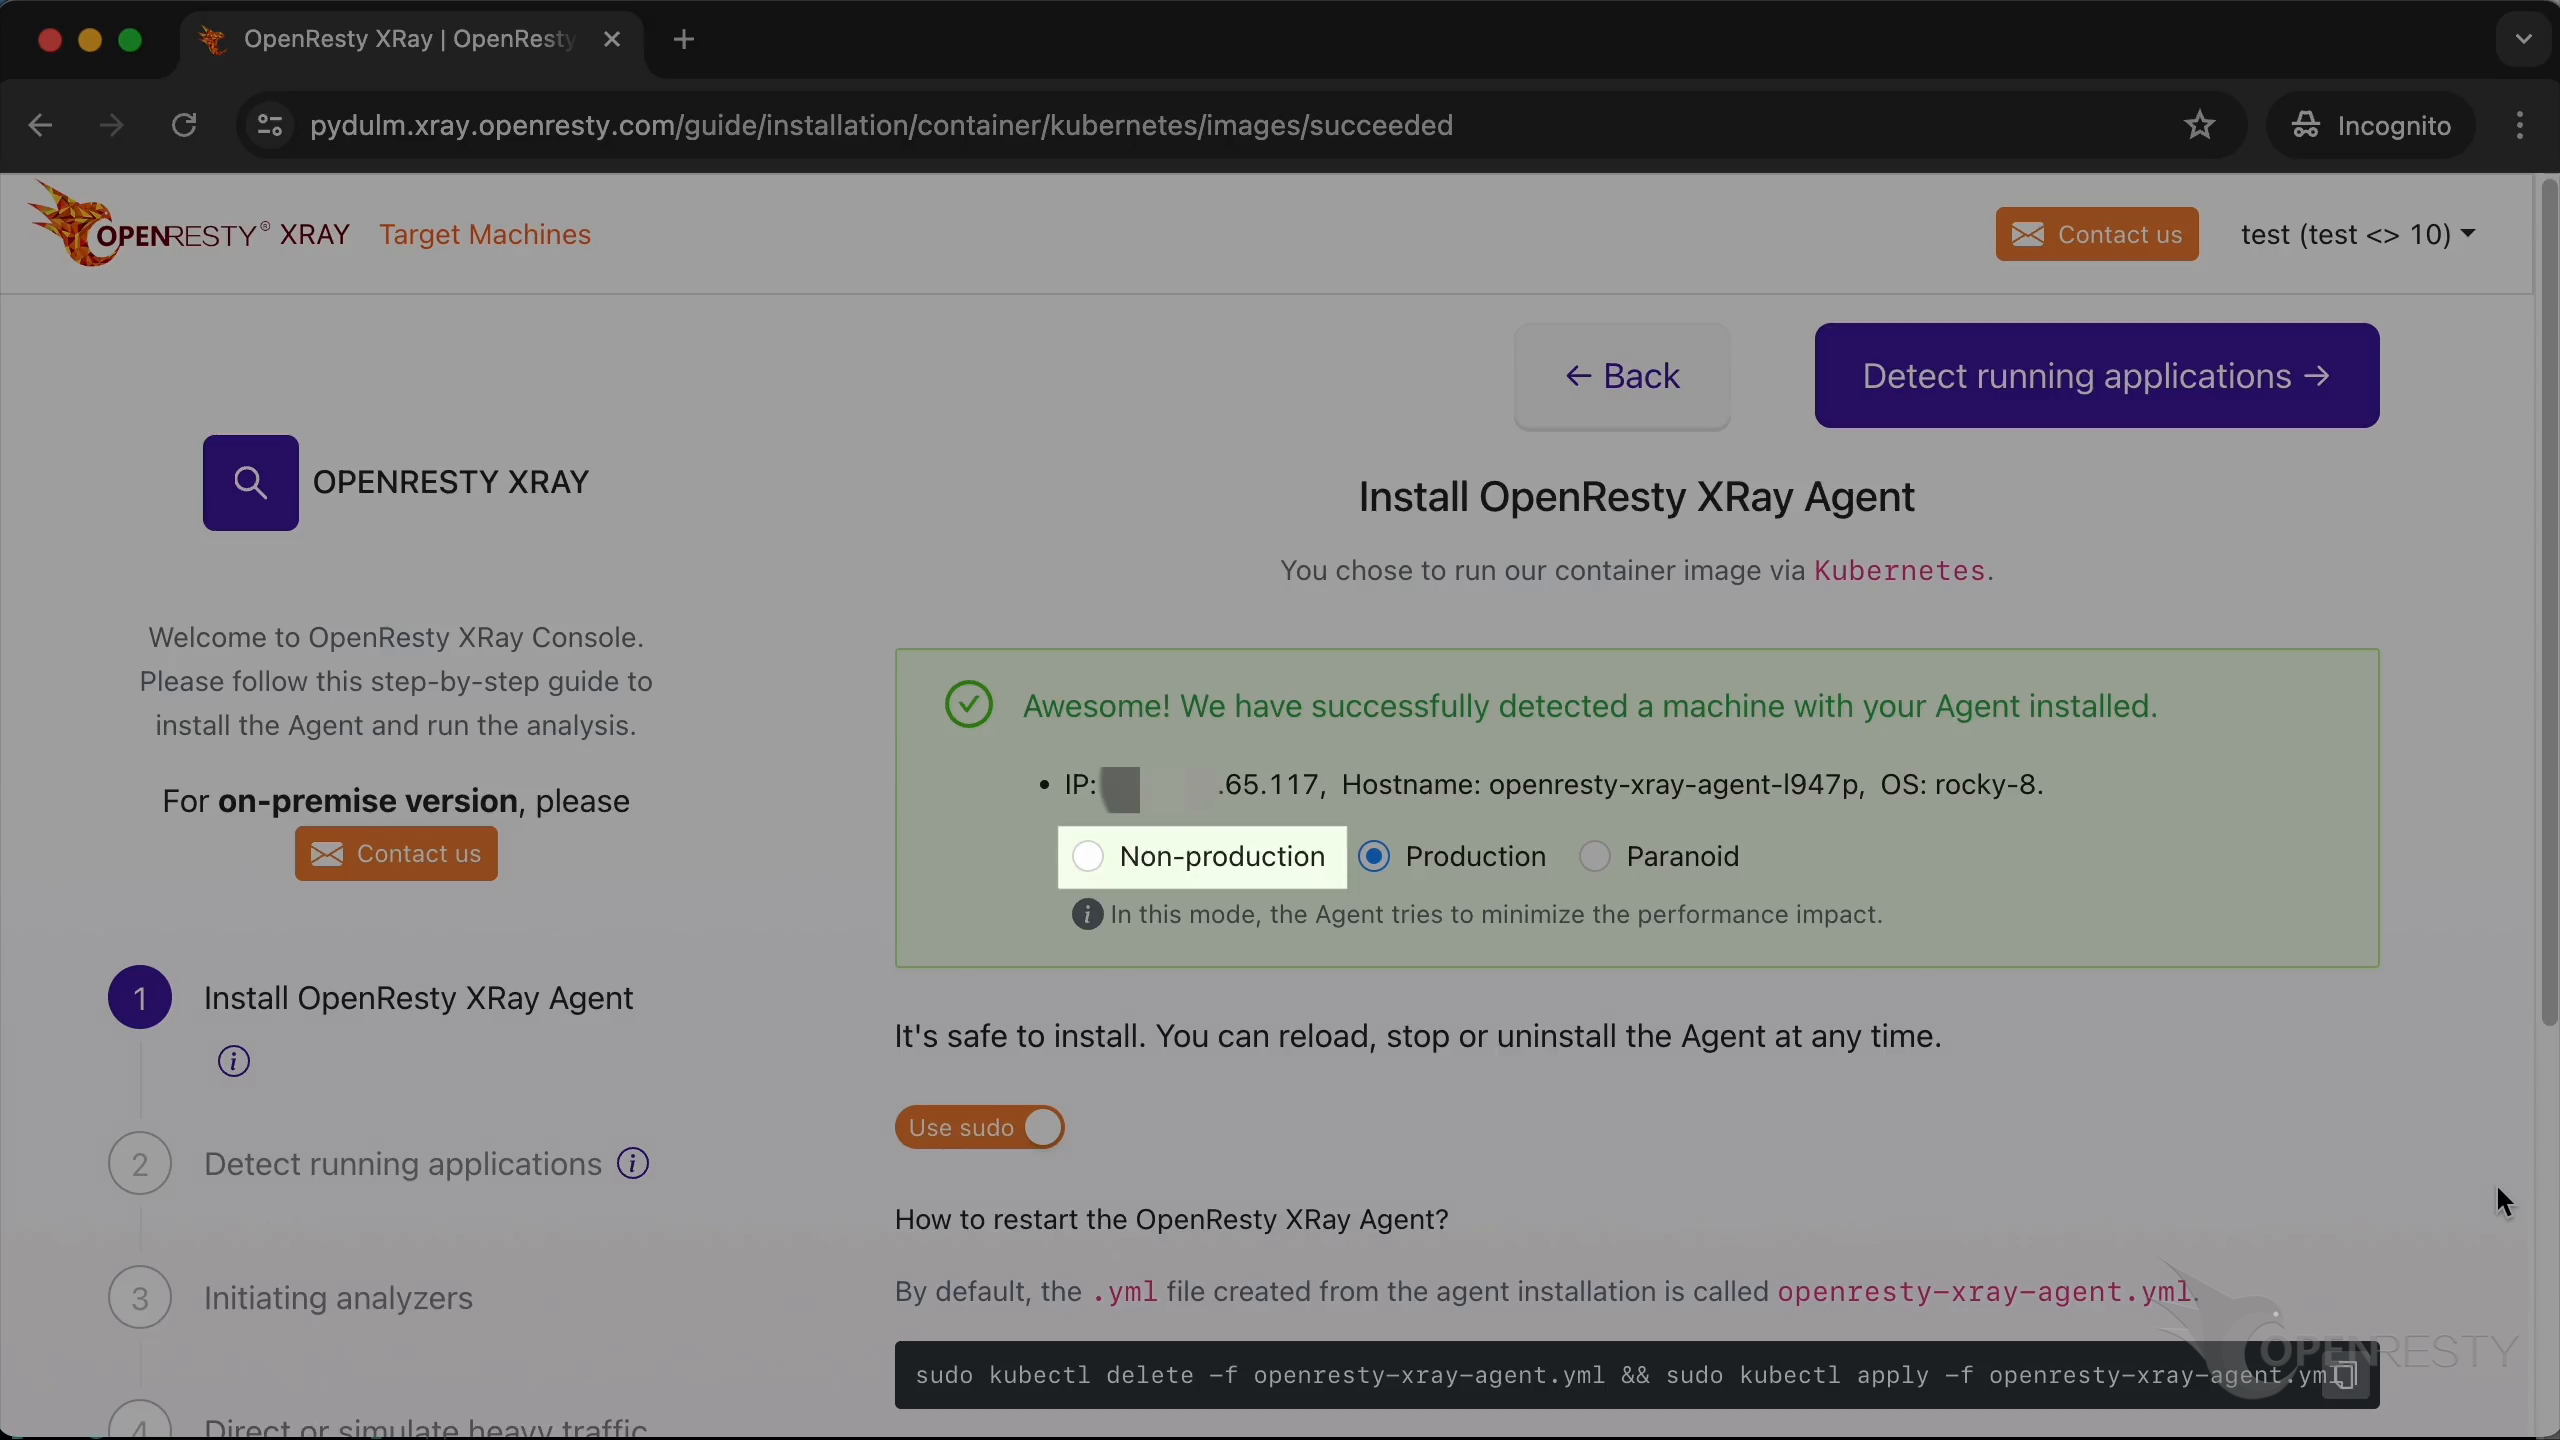
In non-production mode, the system will take a more aggressive approach to analysis to get results faster.
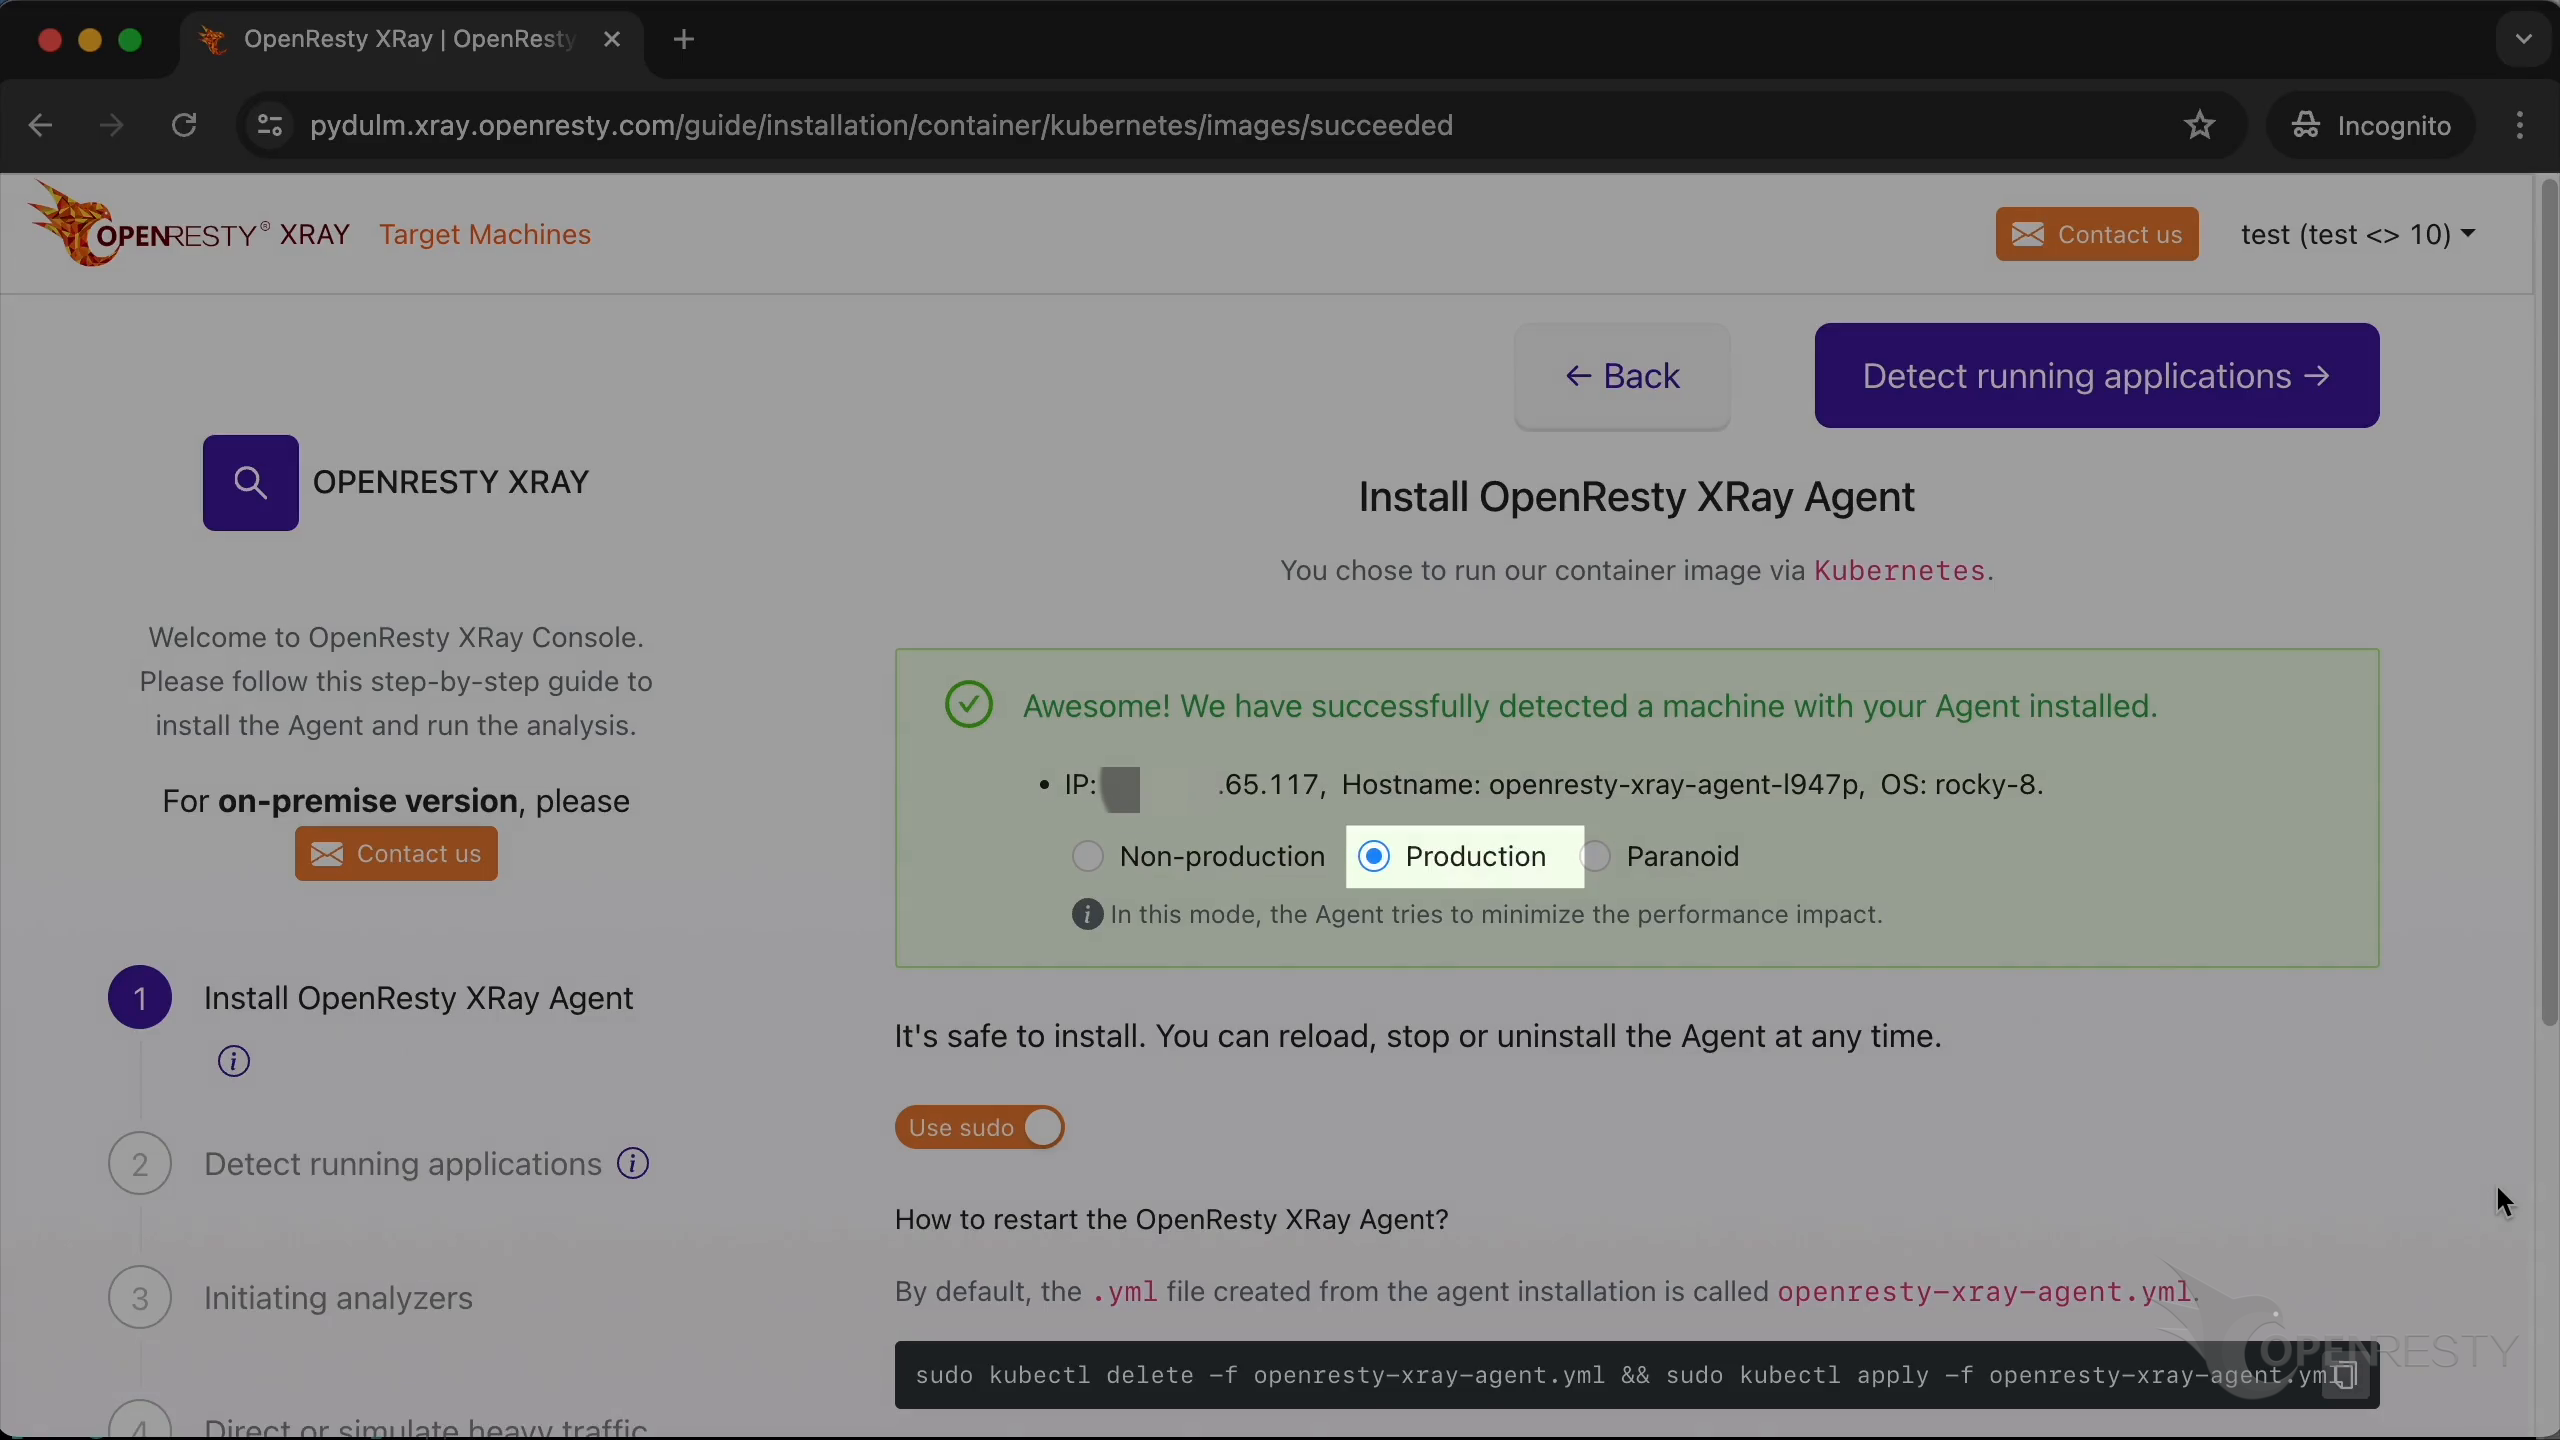
The production mode is for analyzing online production environments. It tries hard to minimize the performance impact on the target applications and servers. It may take longer to analyze though.
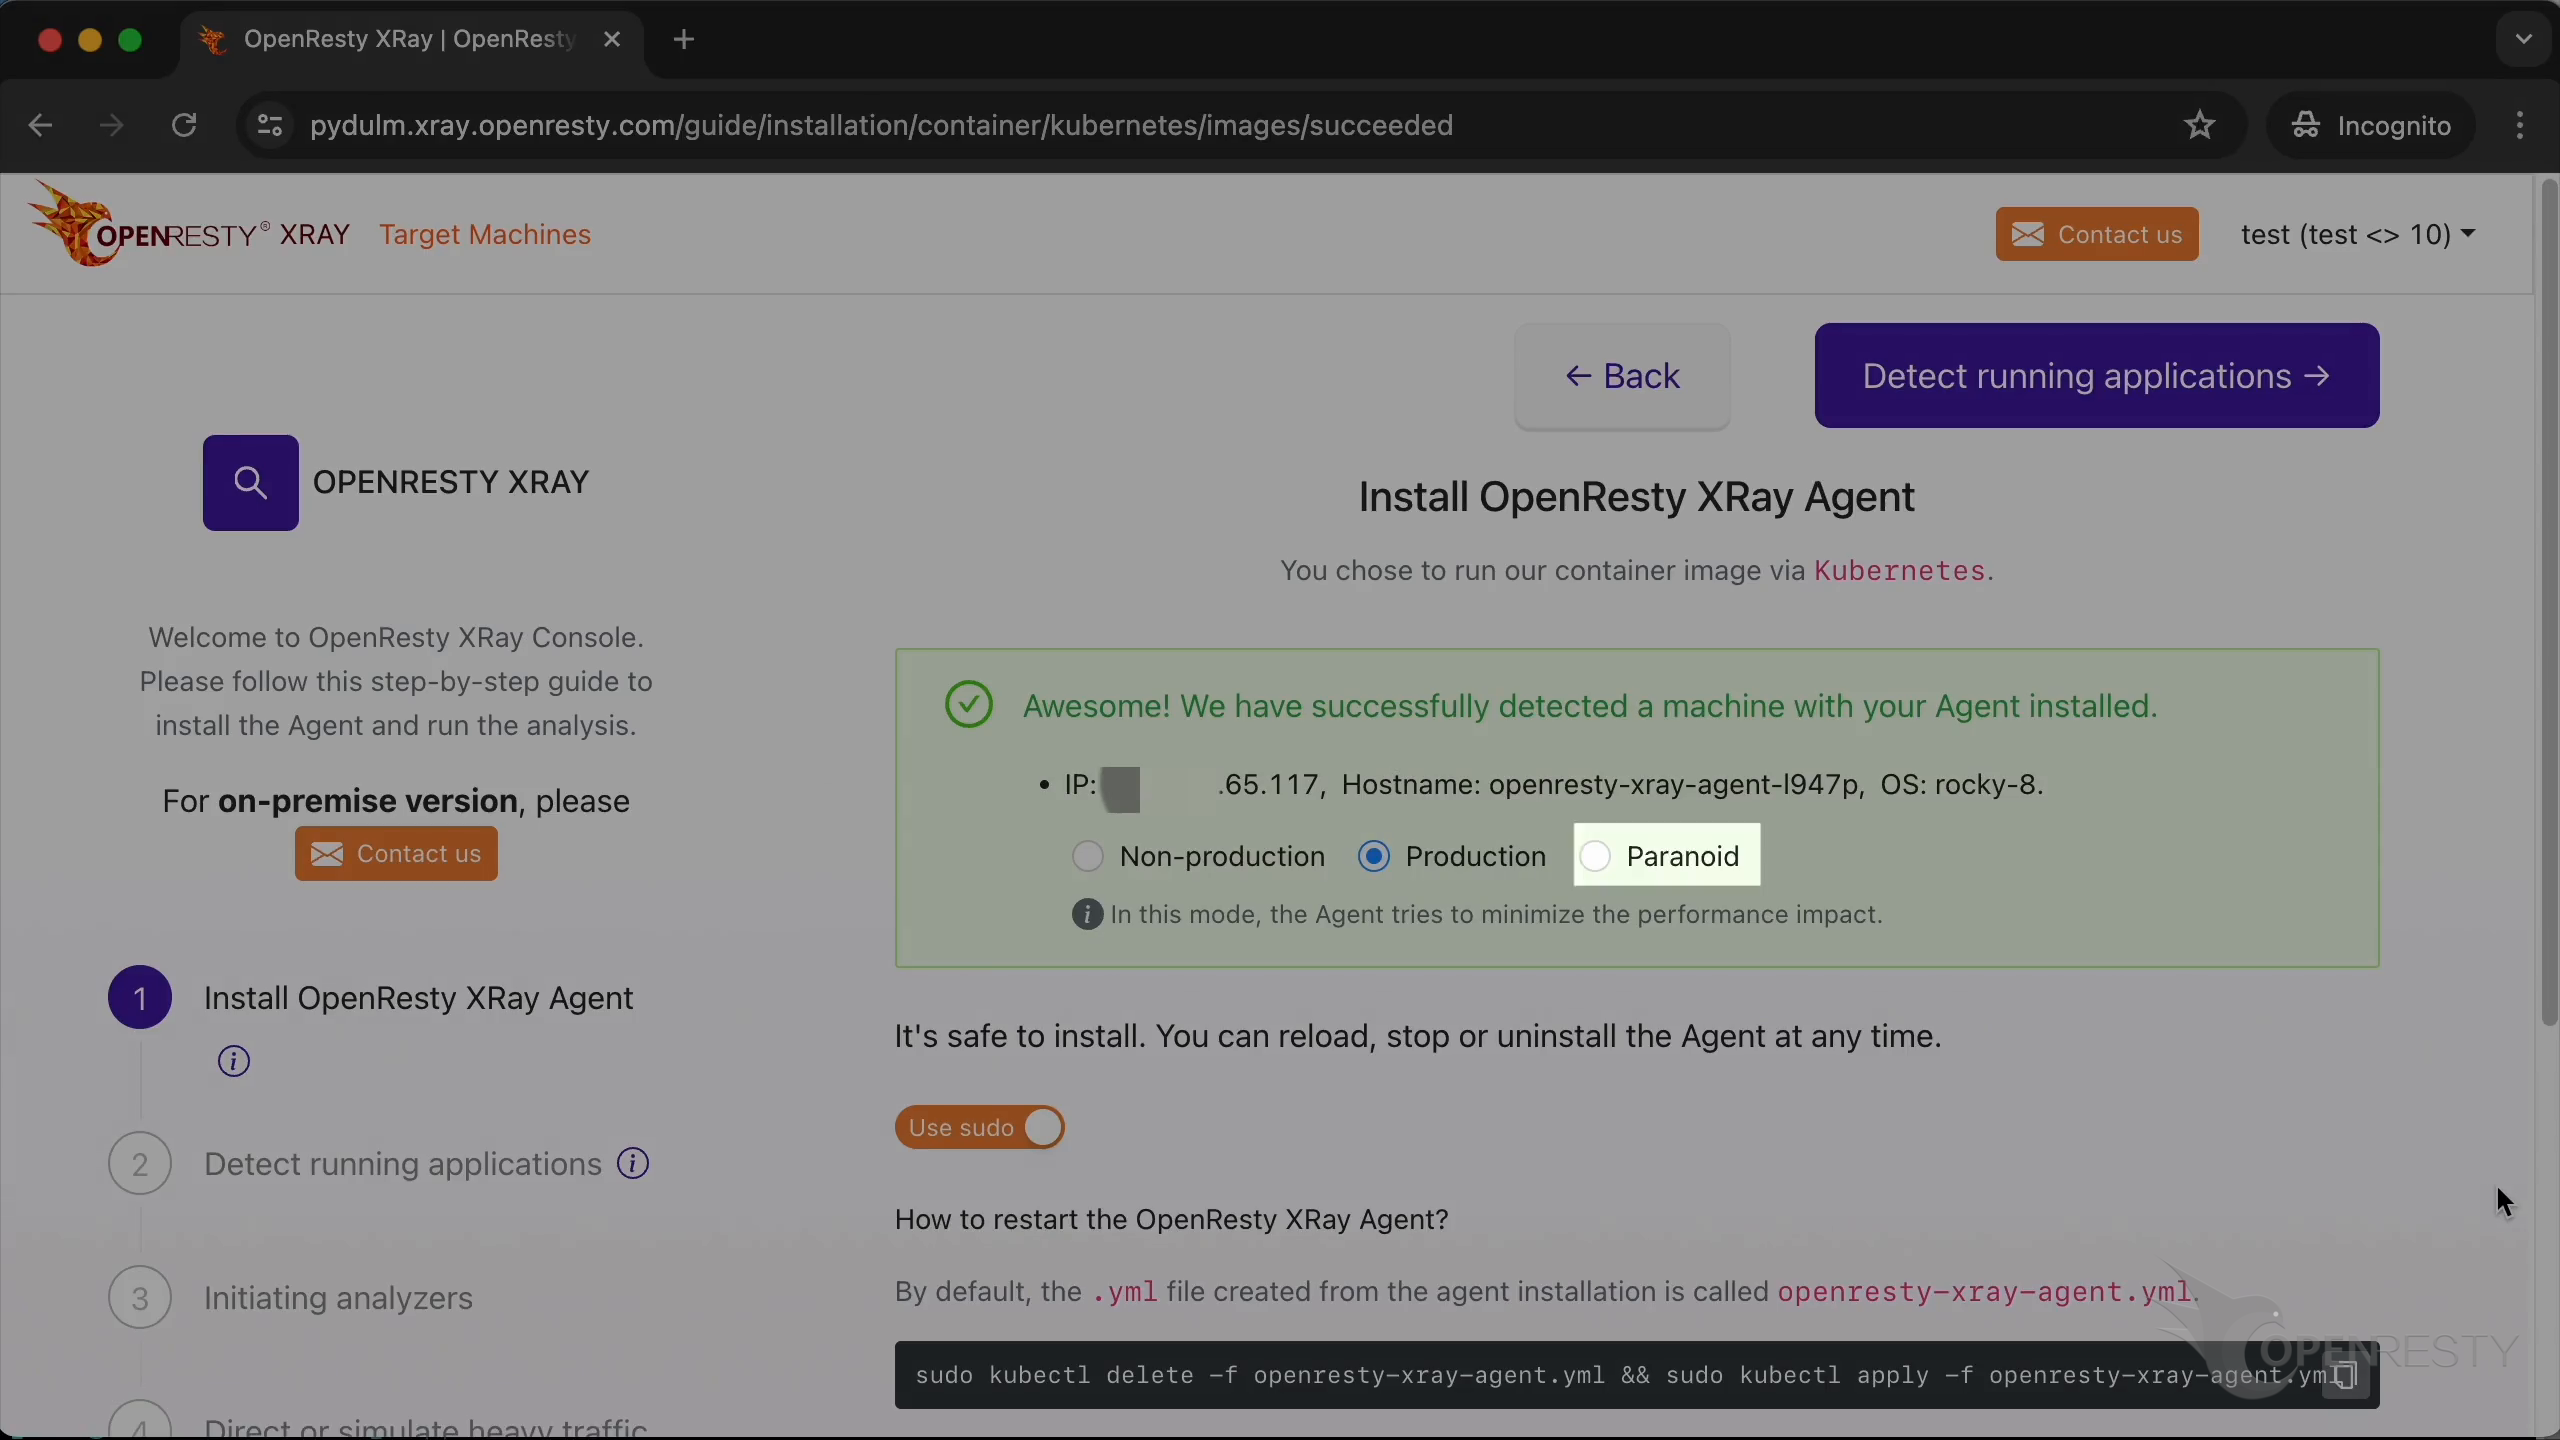
The paranoid mode is similar to the production mode, but it will try to further reduce the performance impact on the target servers’ request latency. Accordingly, it will take longer to sample.
Let’s automate the detection of running applications and containers on the target system.
These are the target applications that are automatically detected.
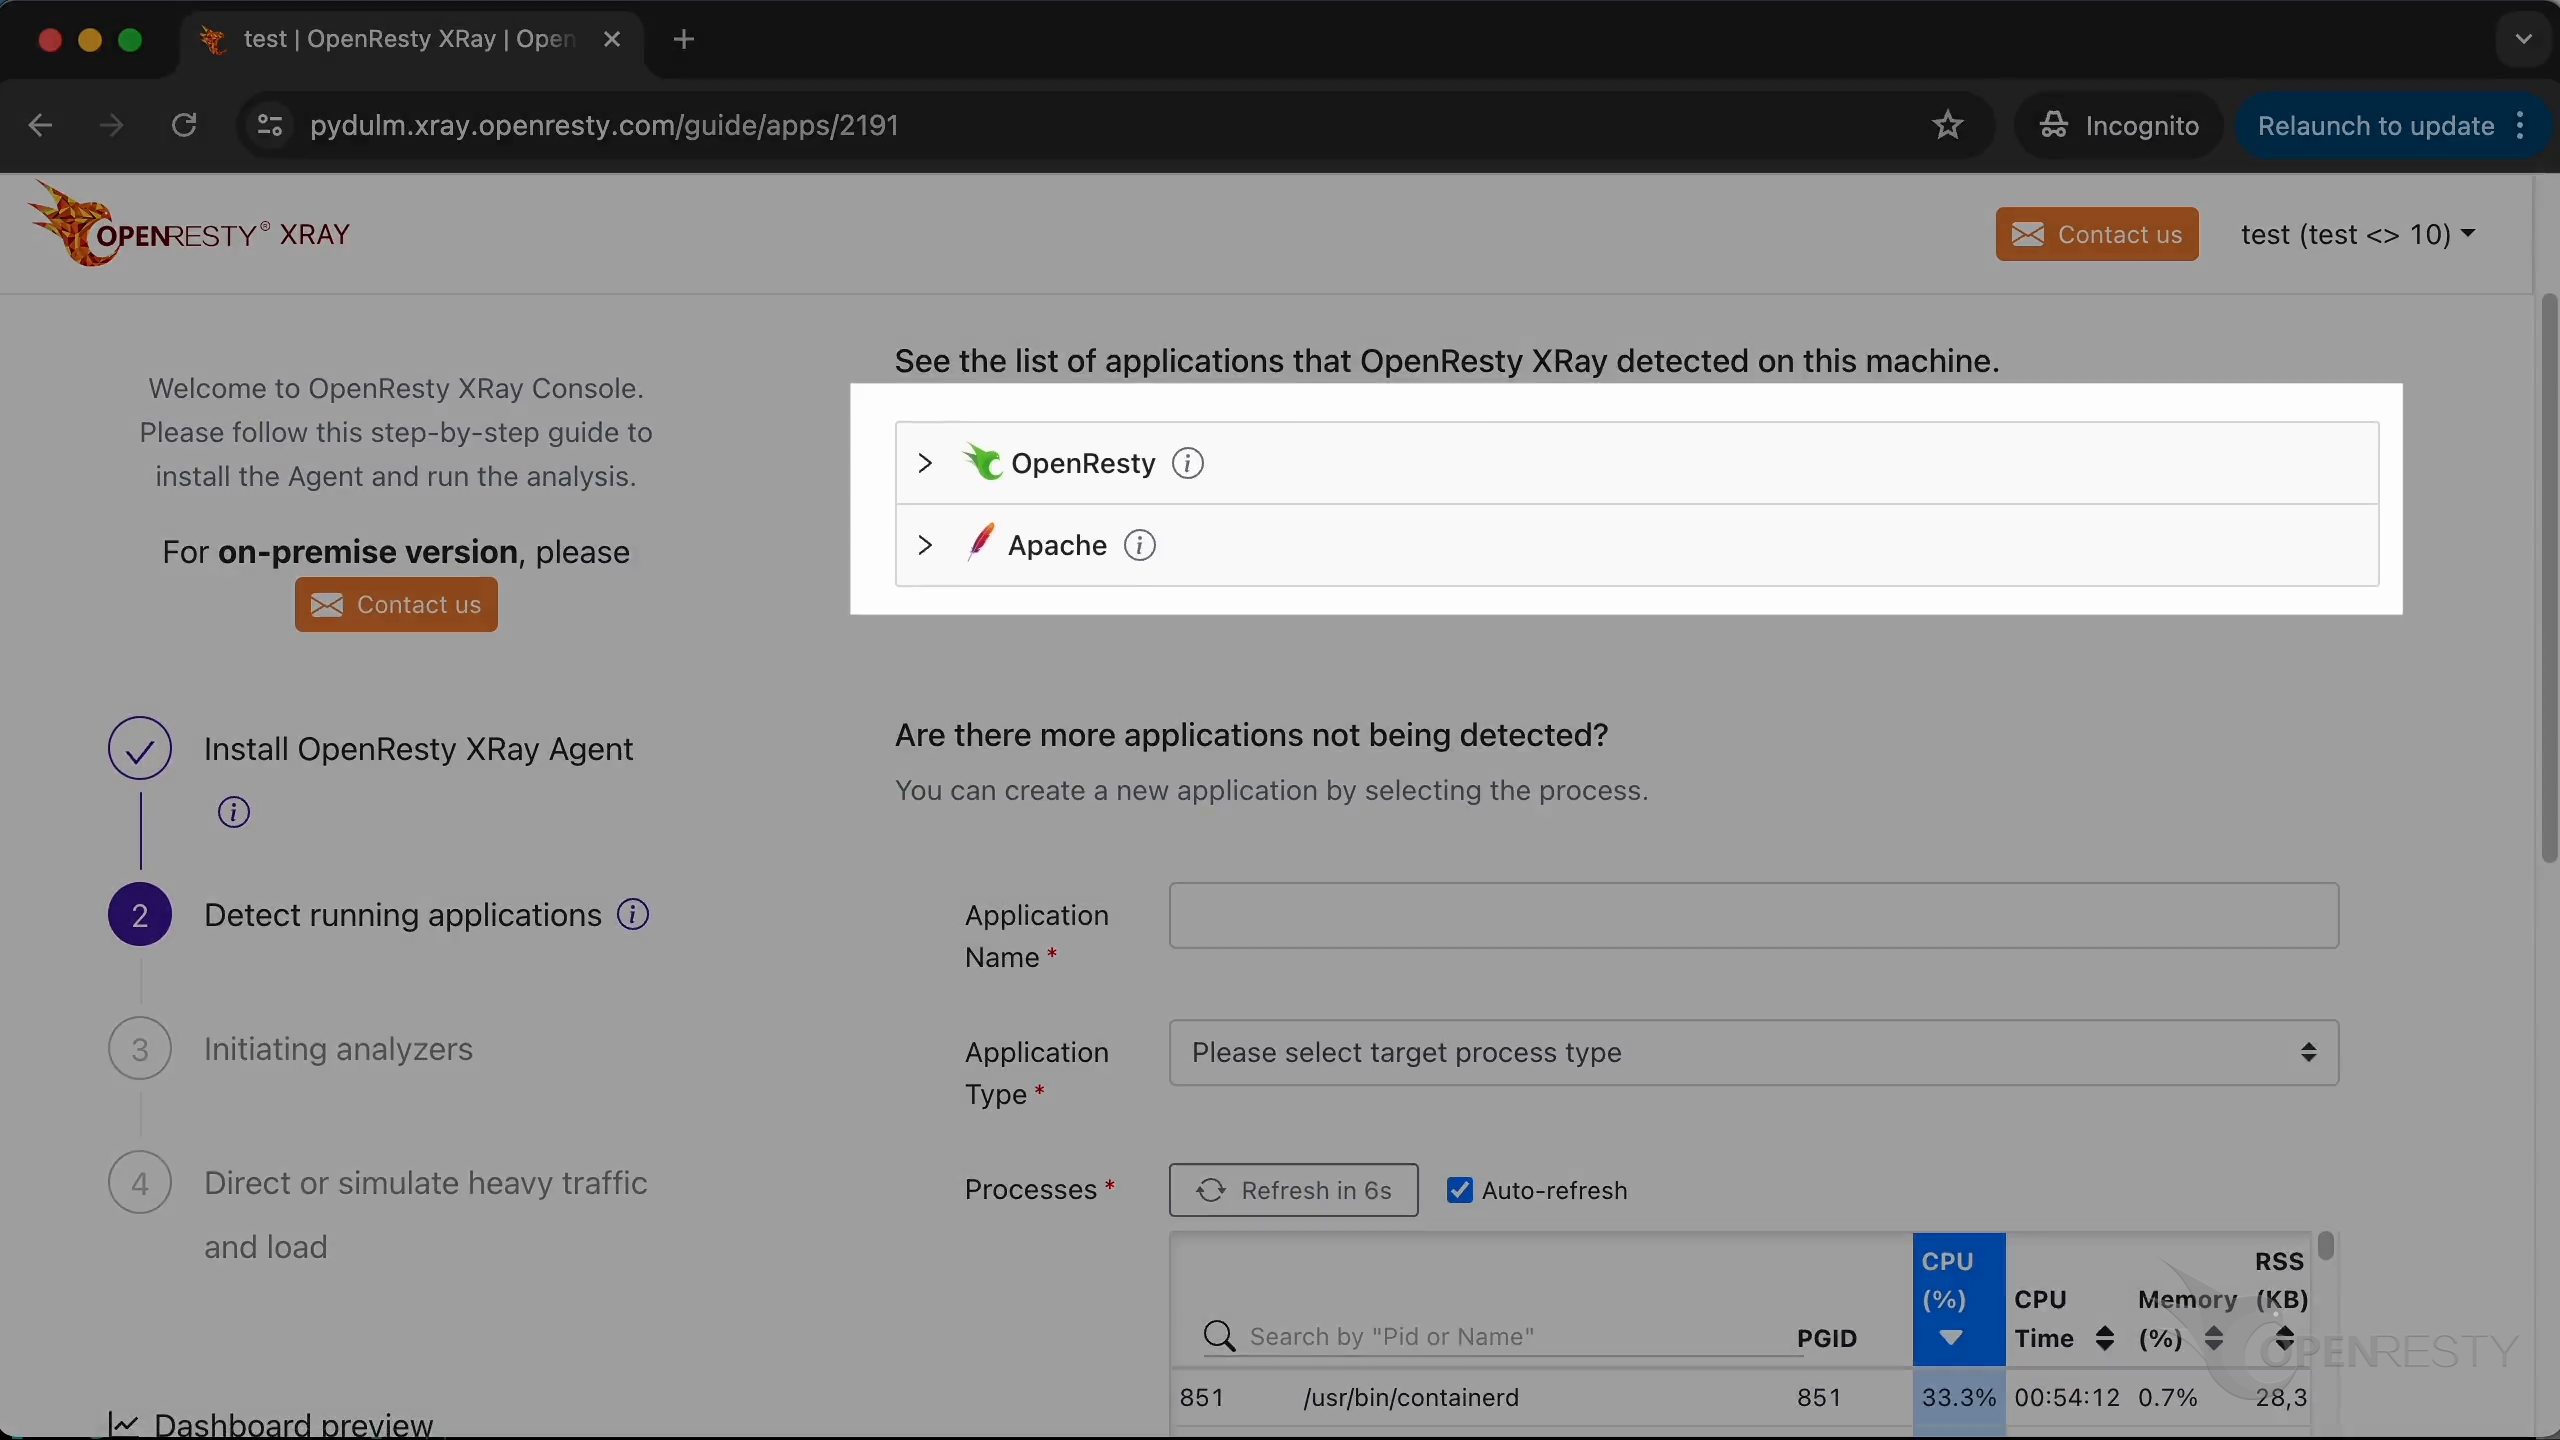
If you need to add a new application to detect, you can customize the configuration.
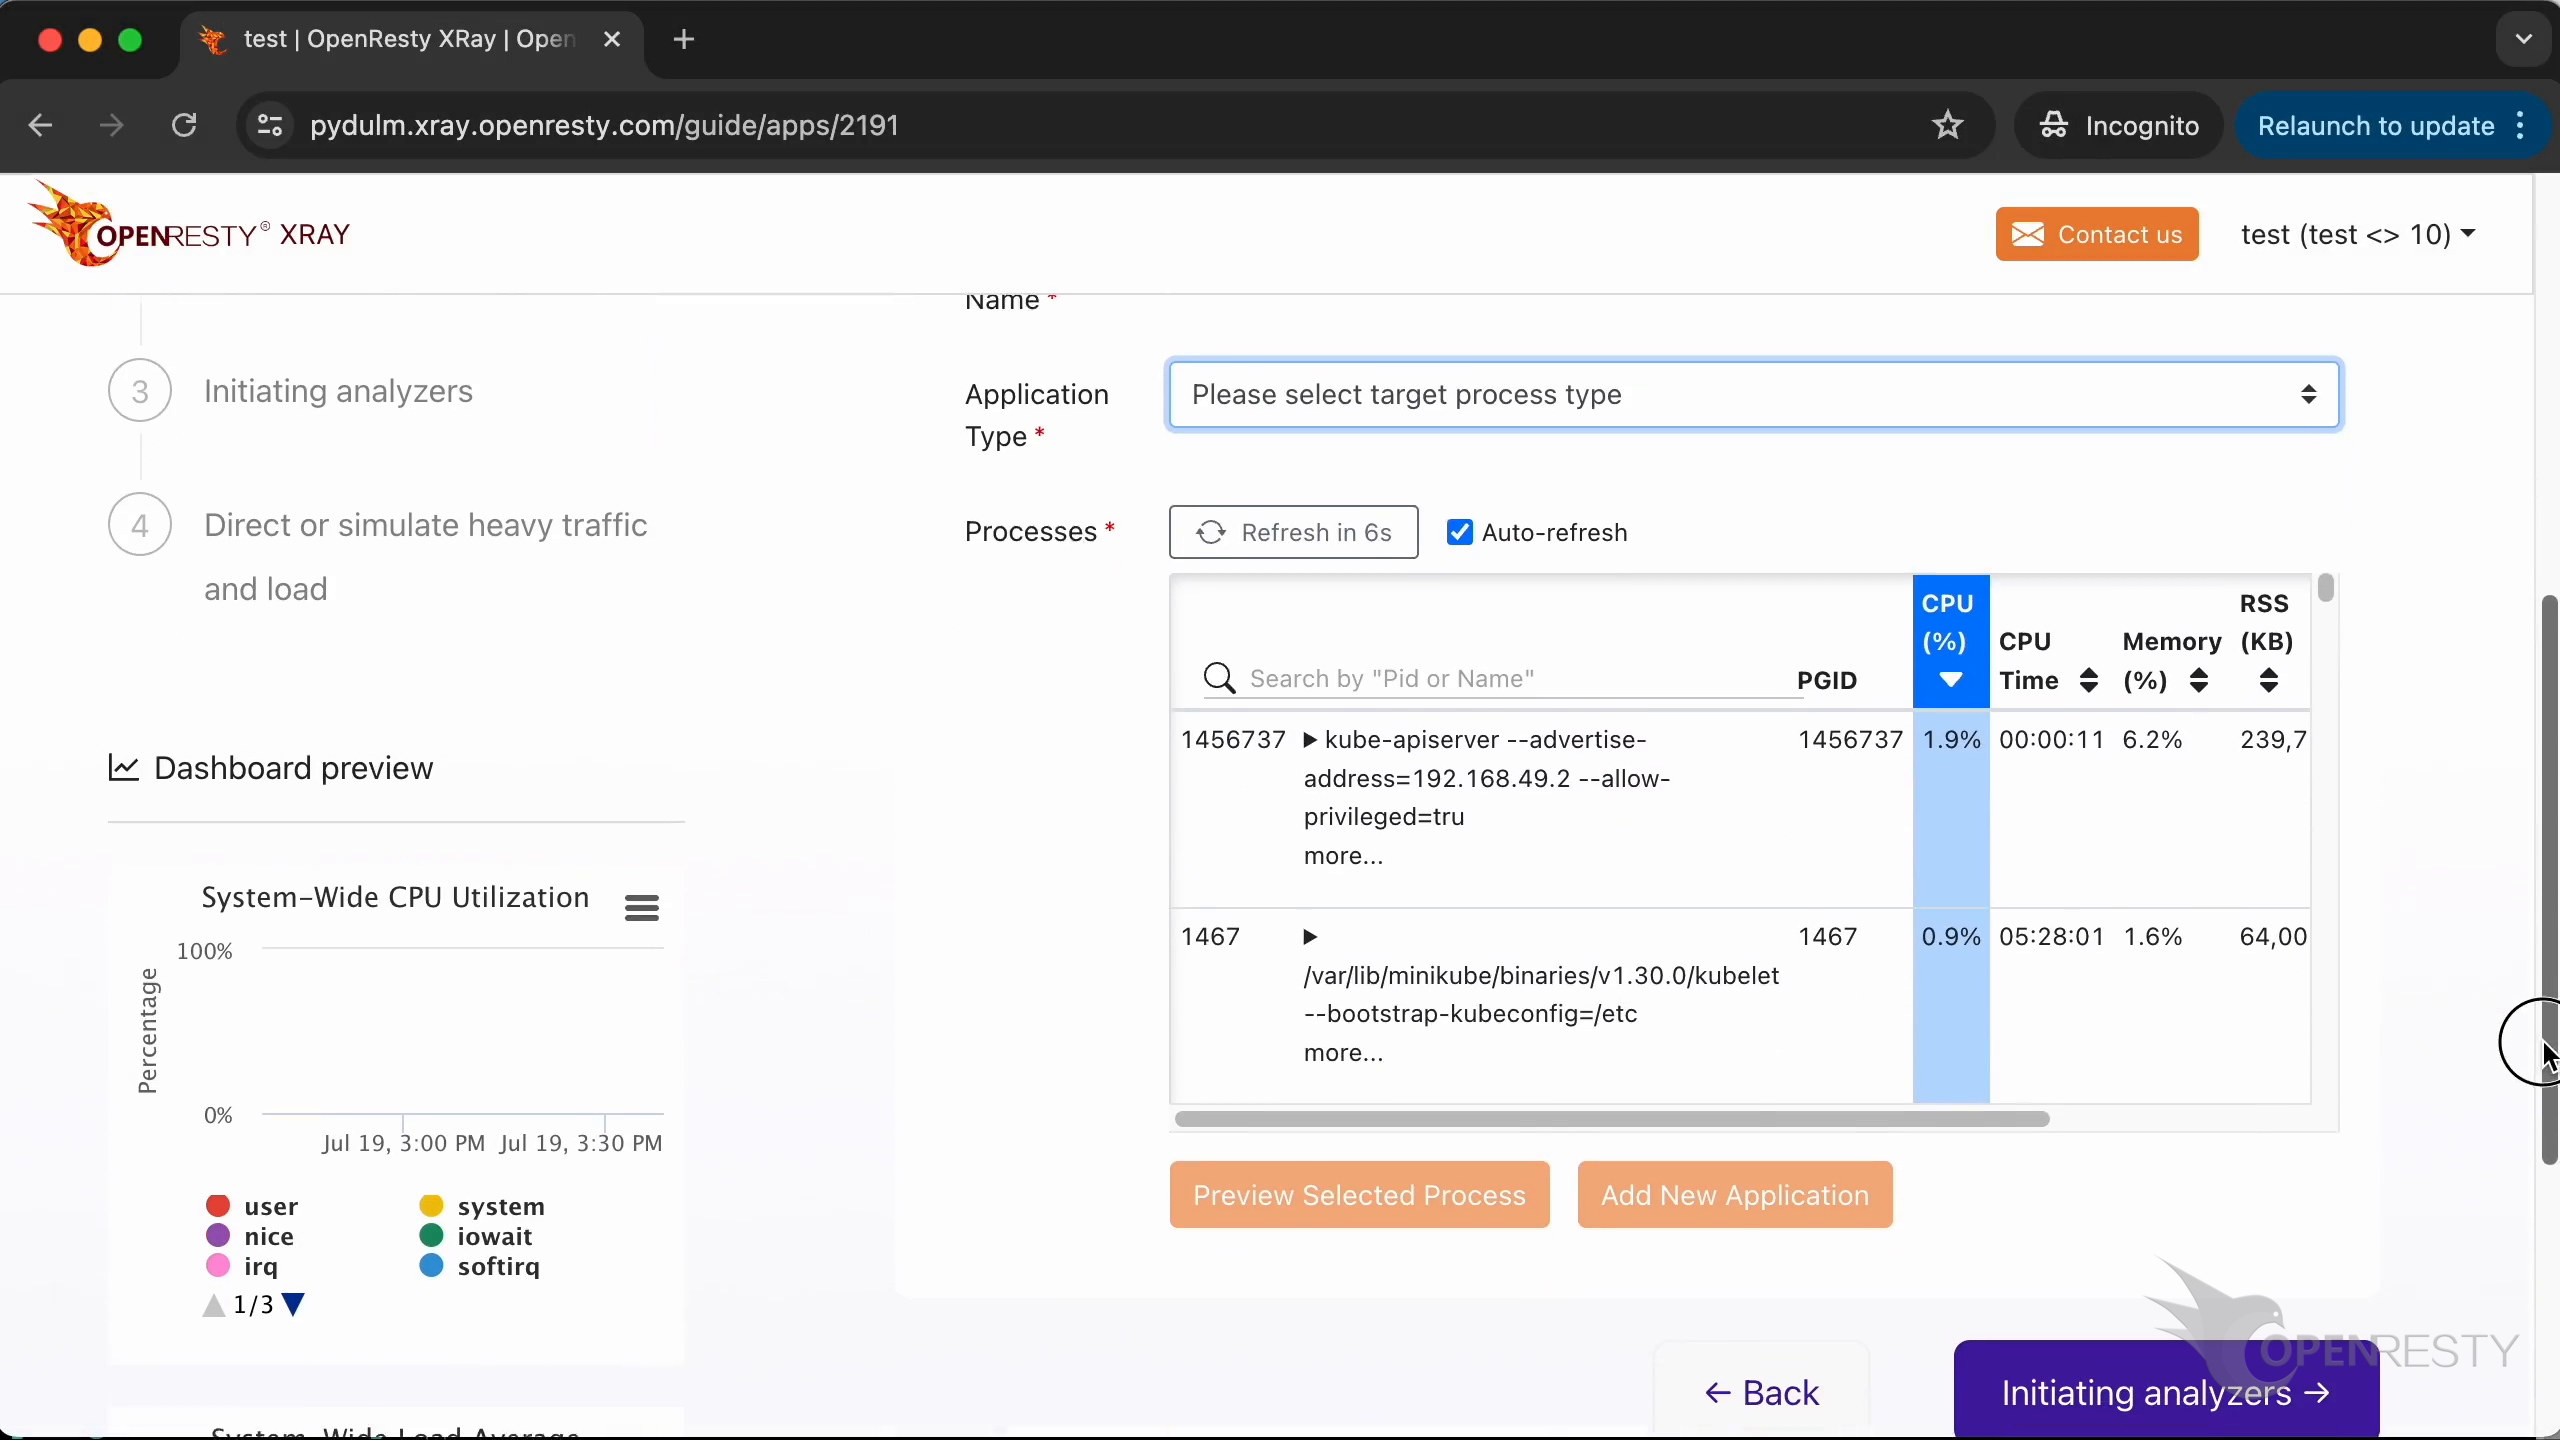
You can type in the new application name.
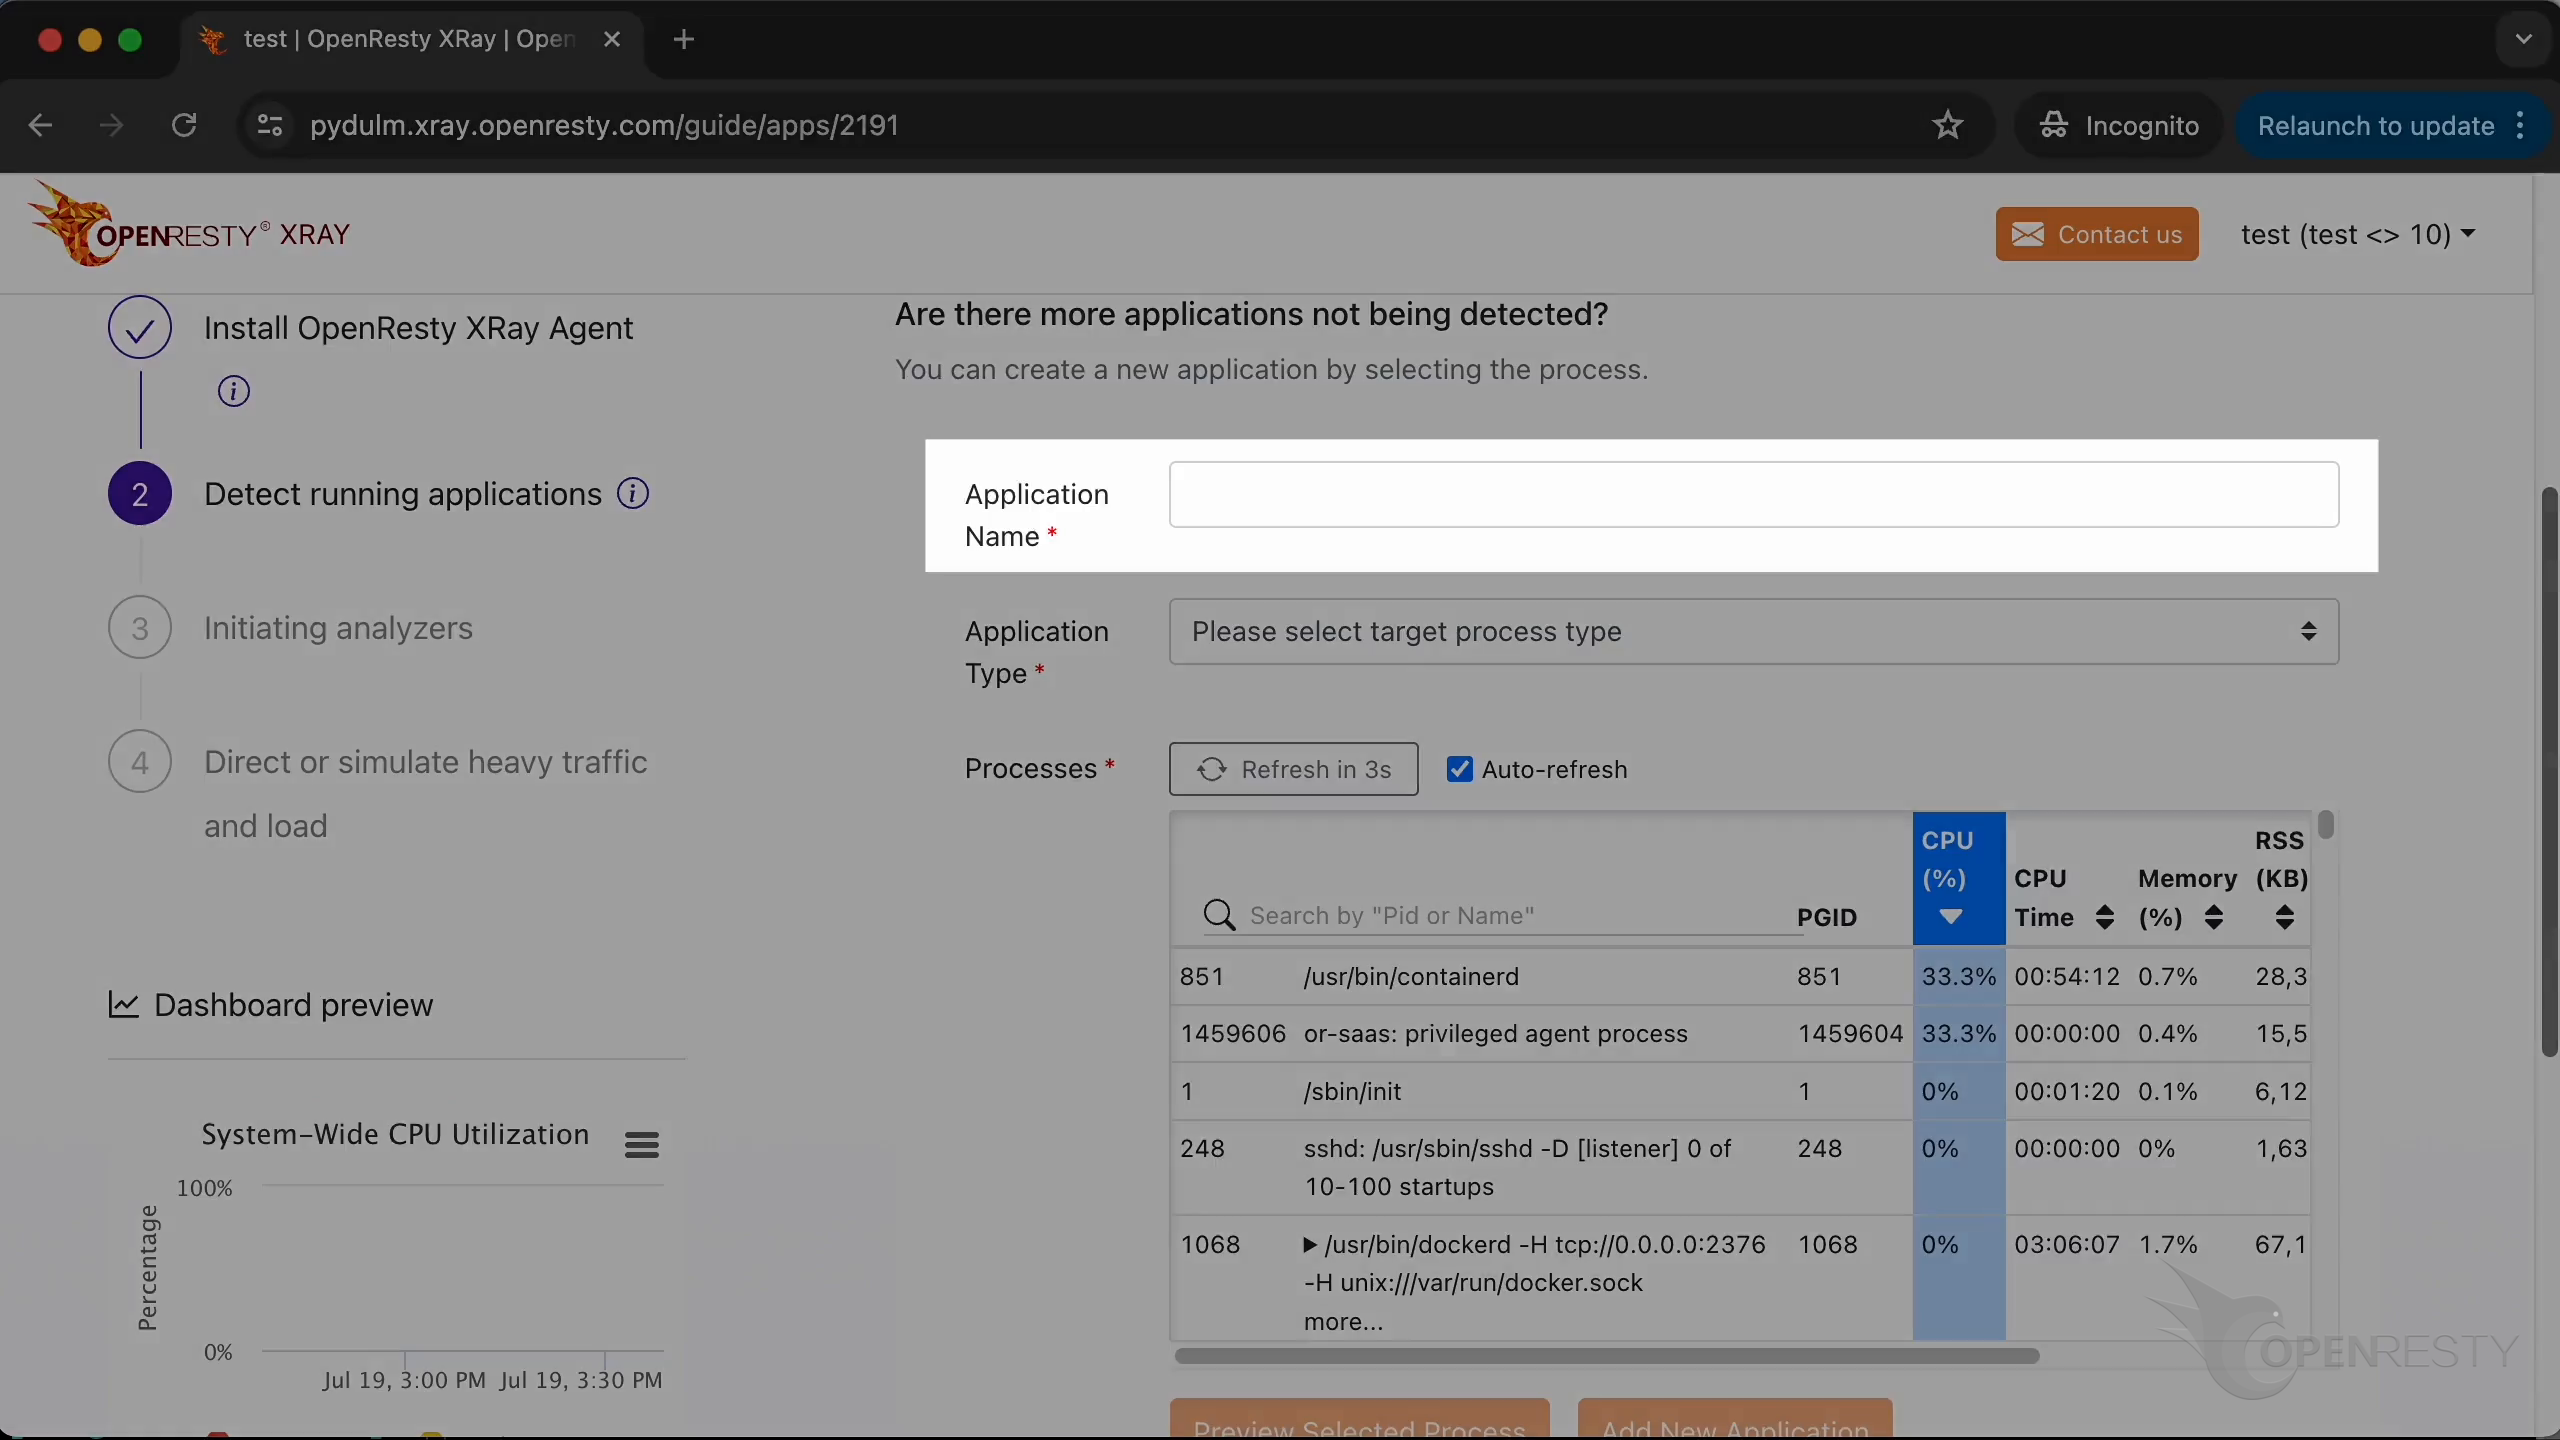
Select the type of application.
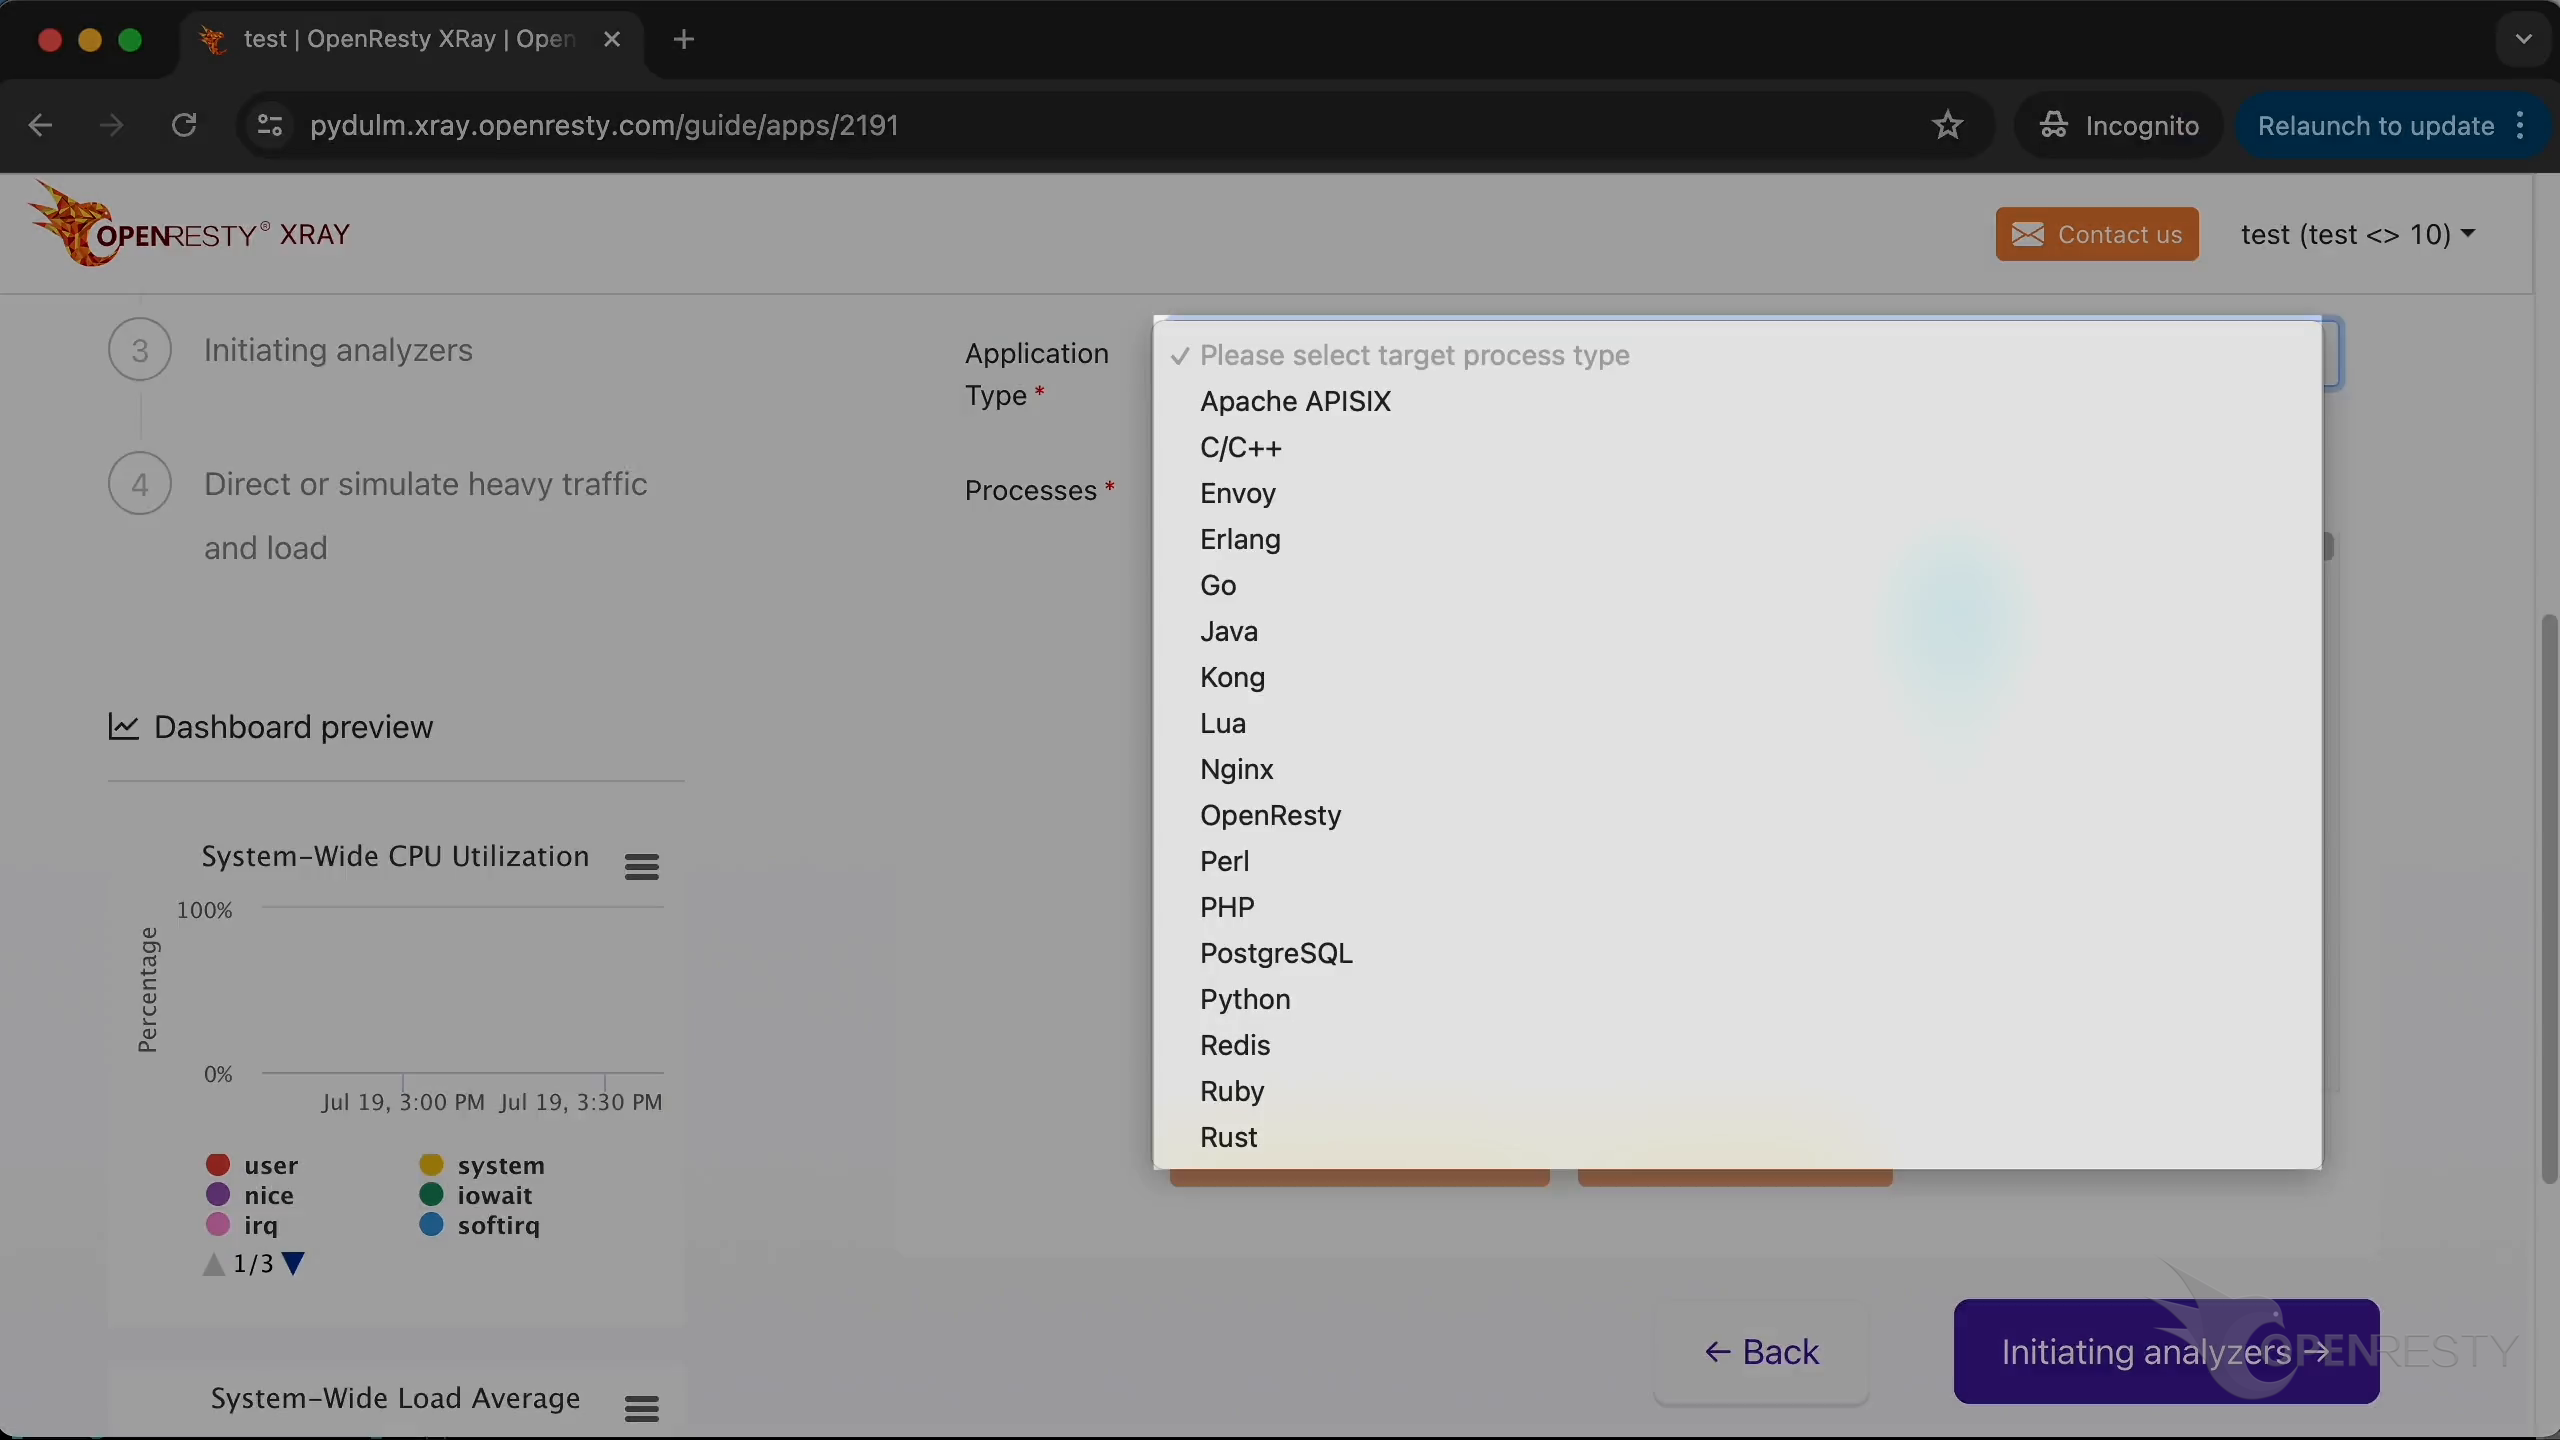
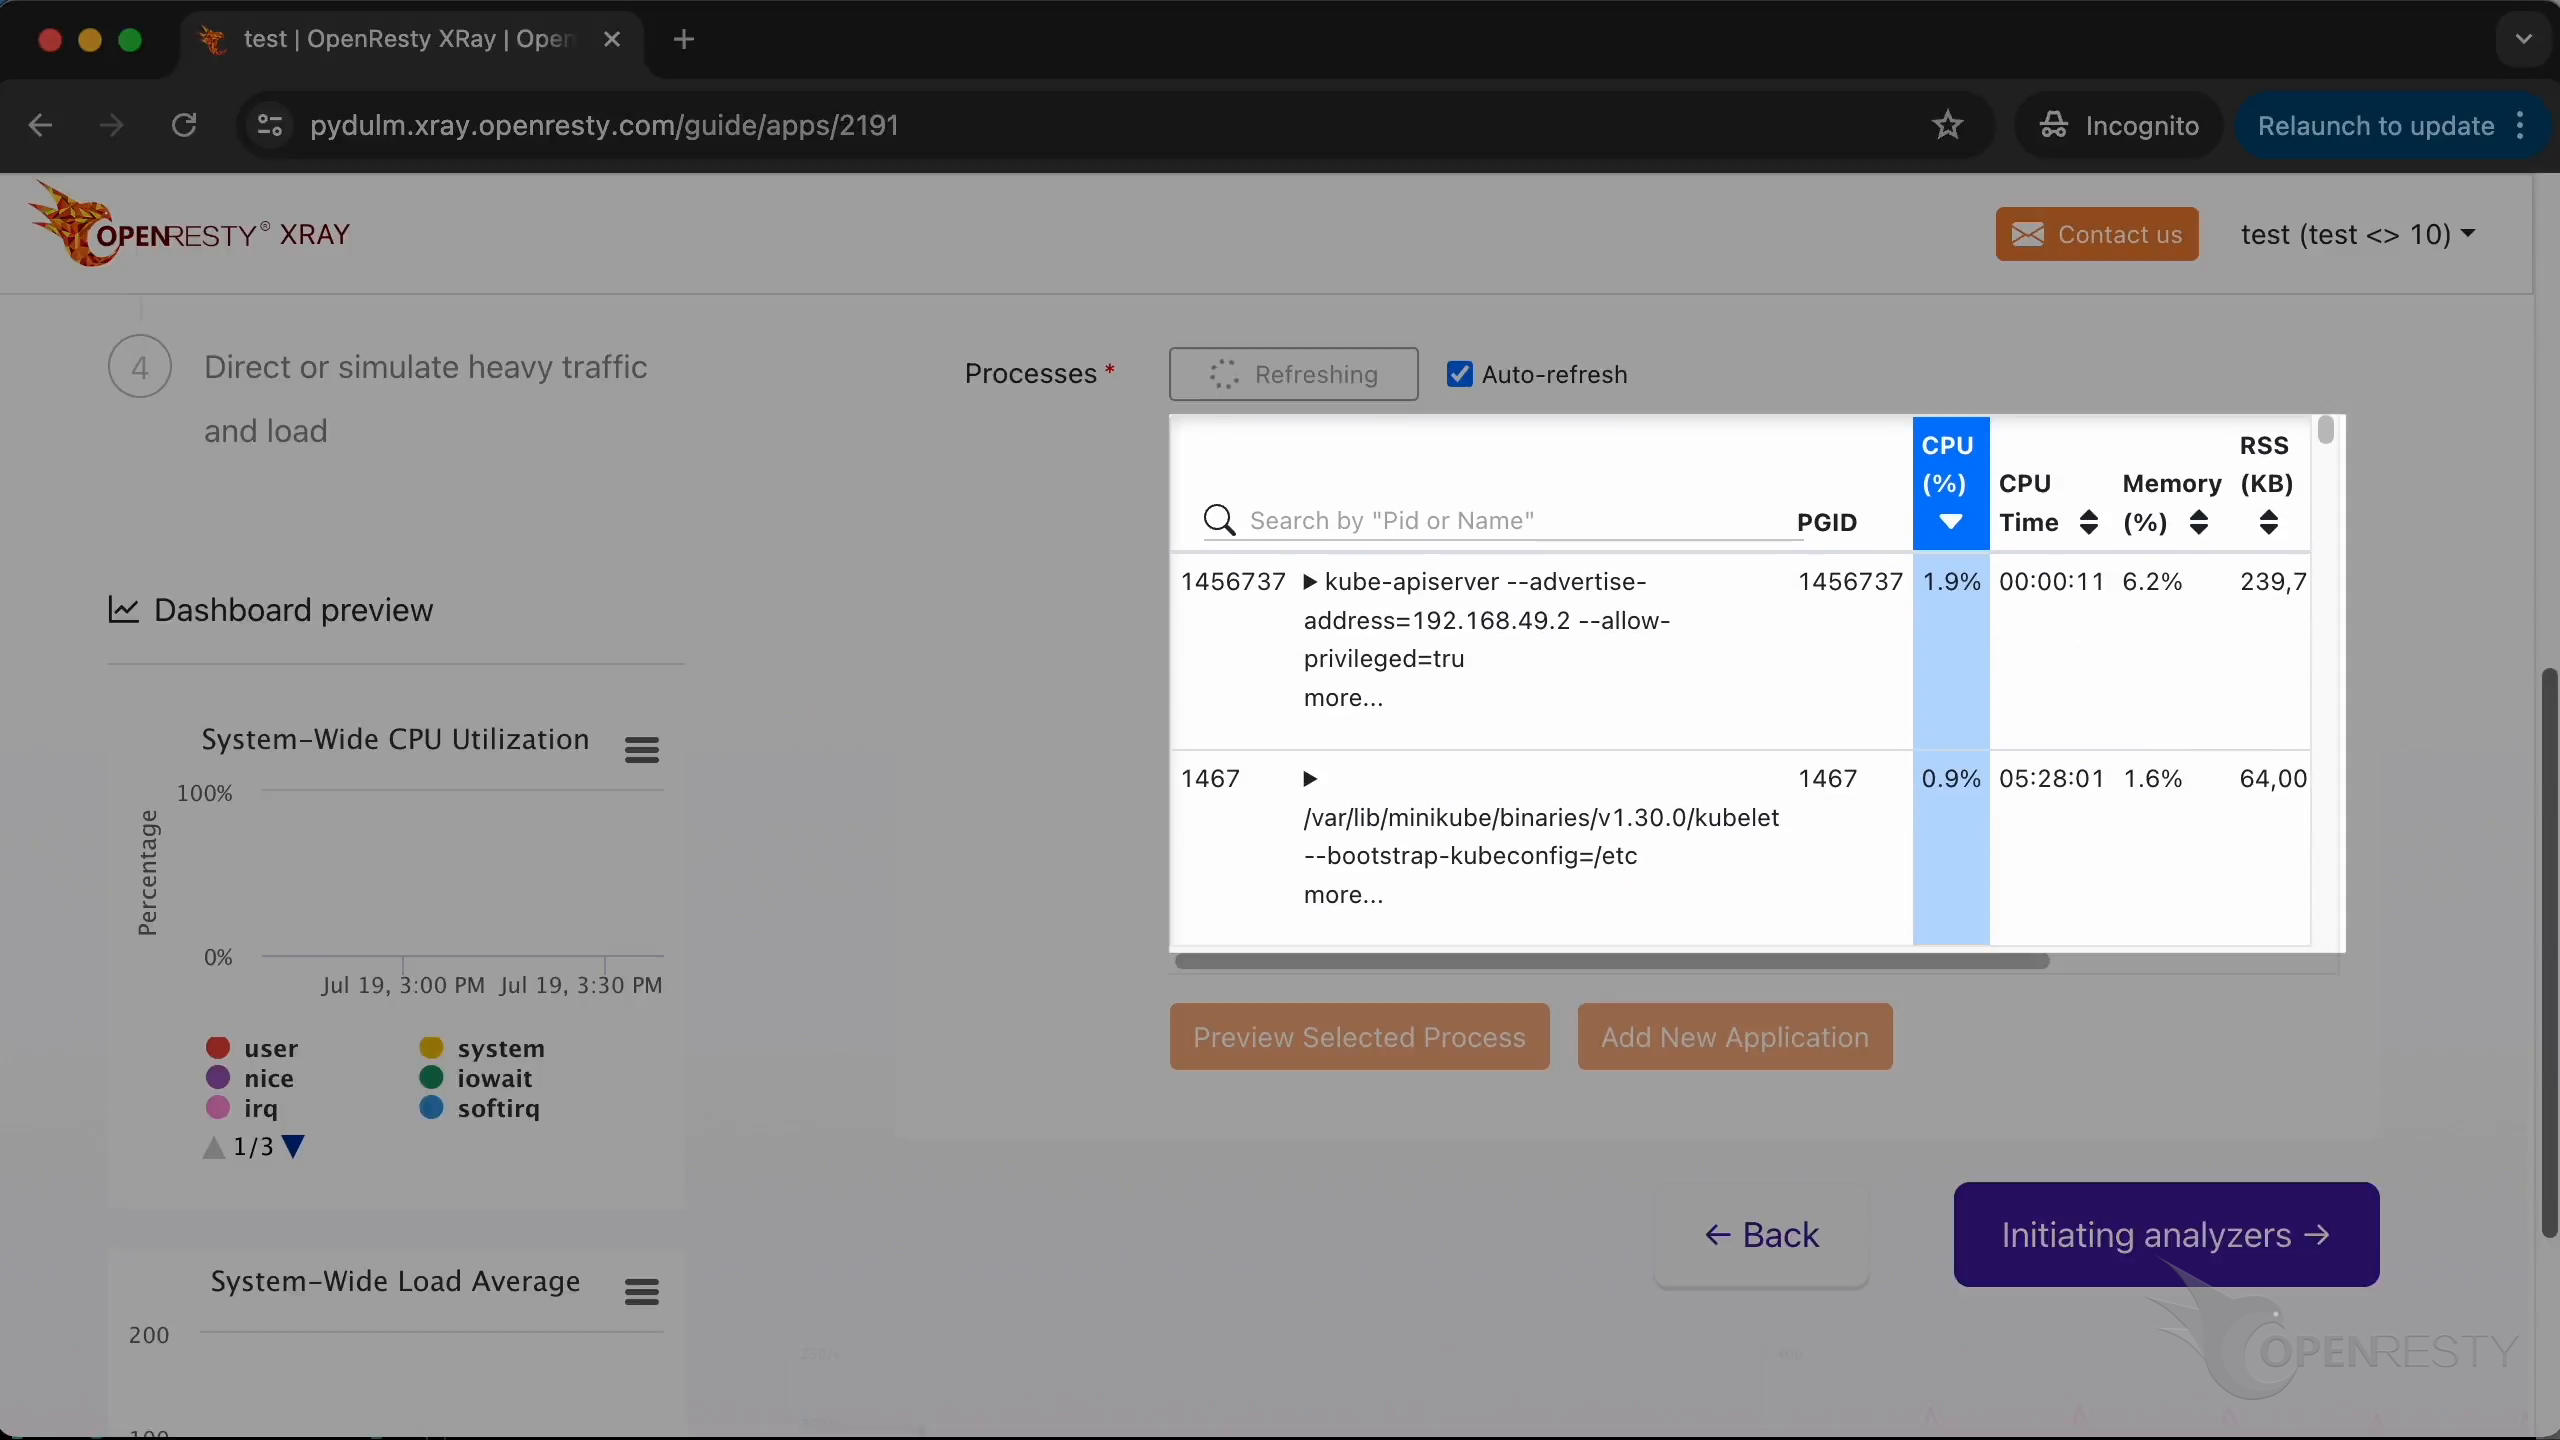
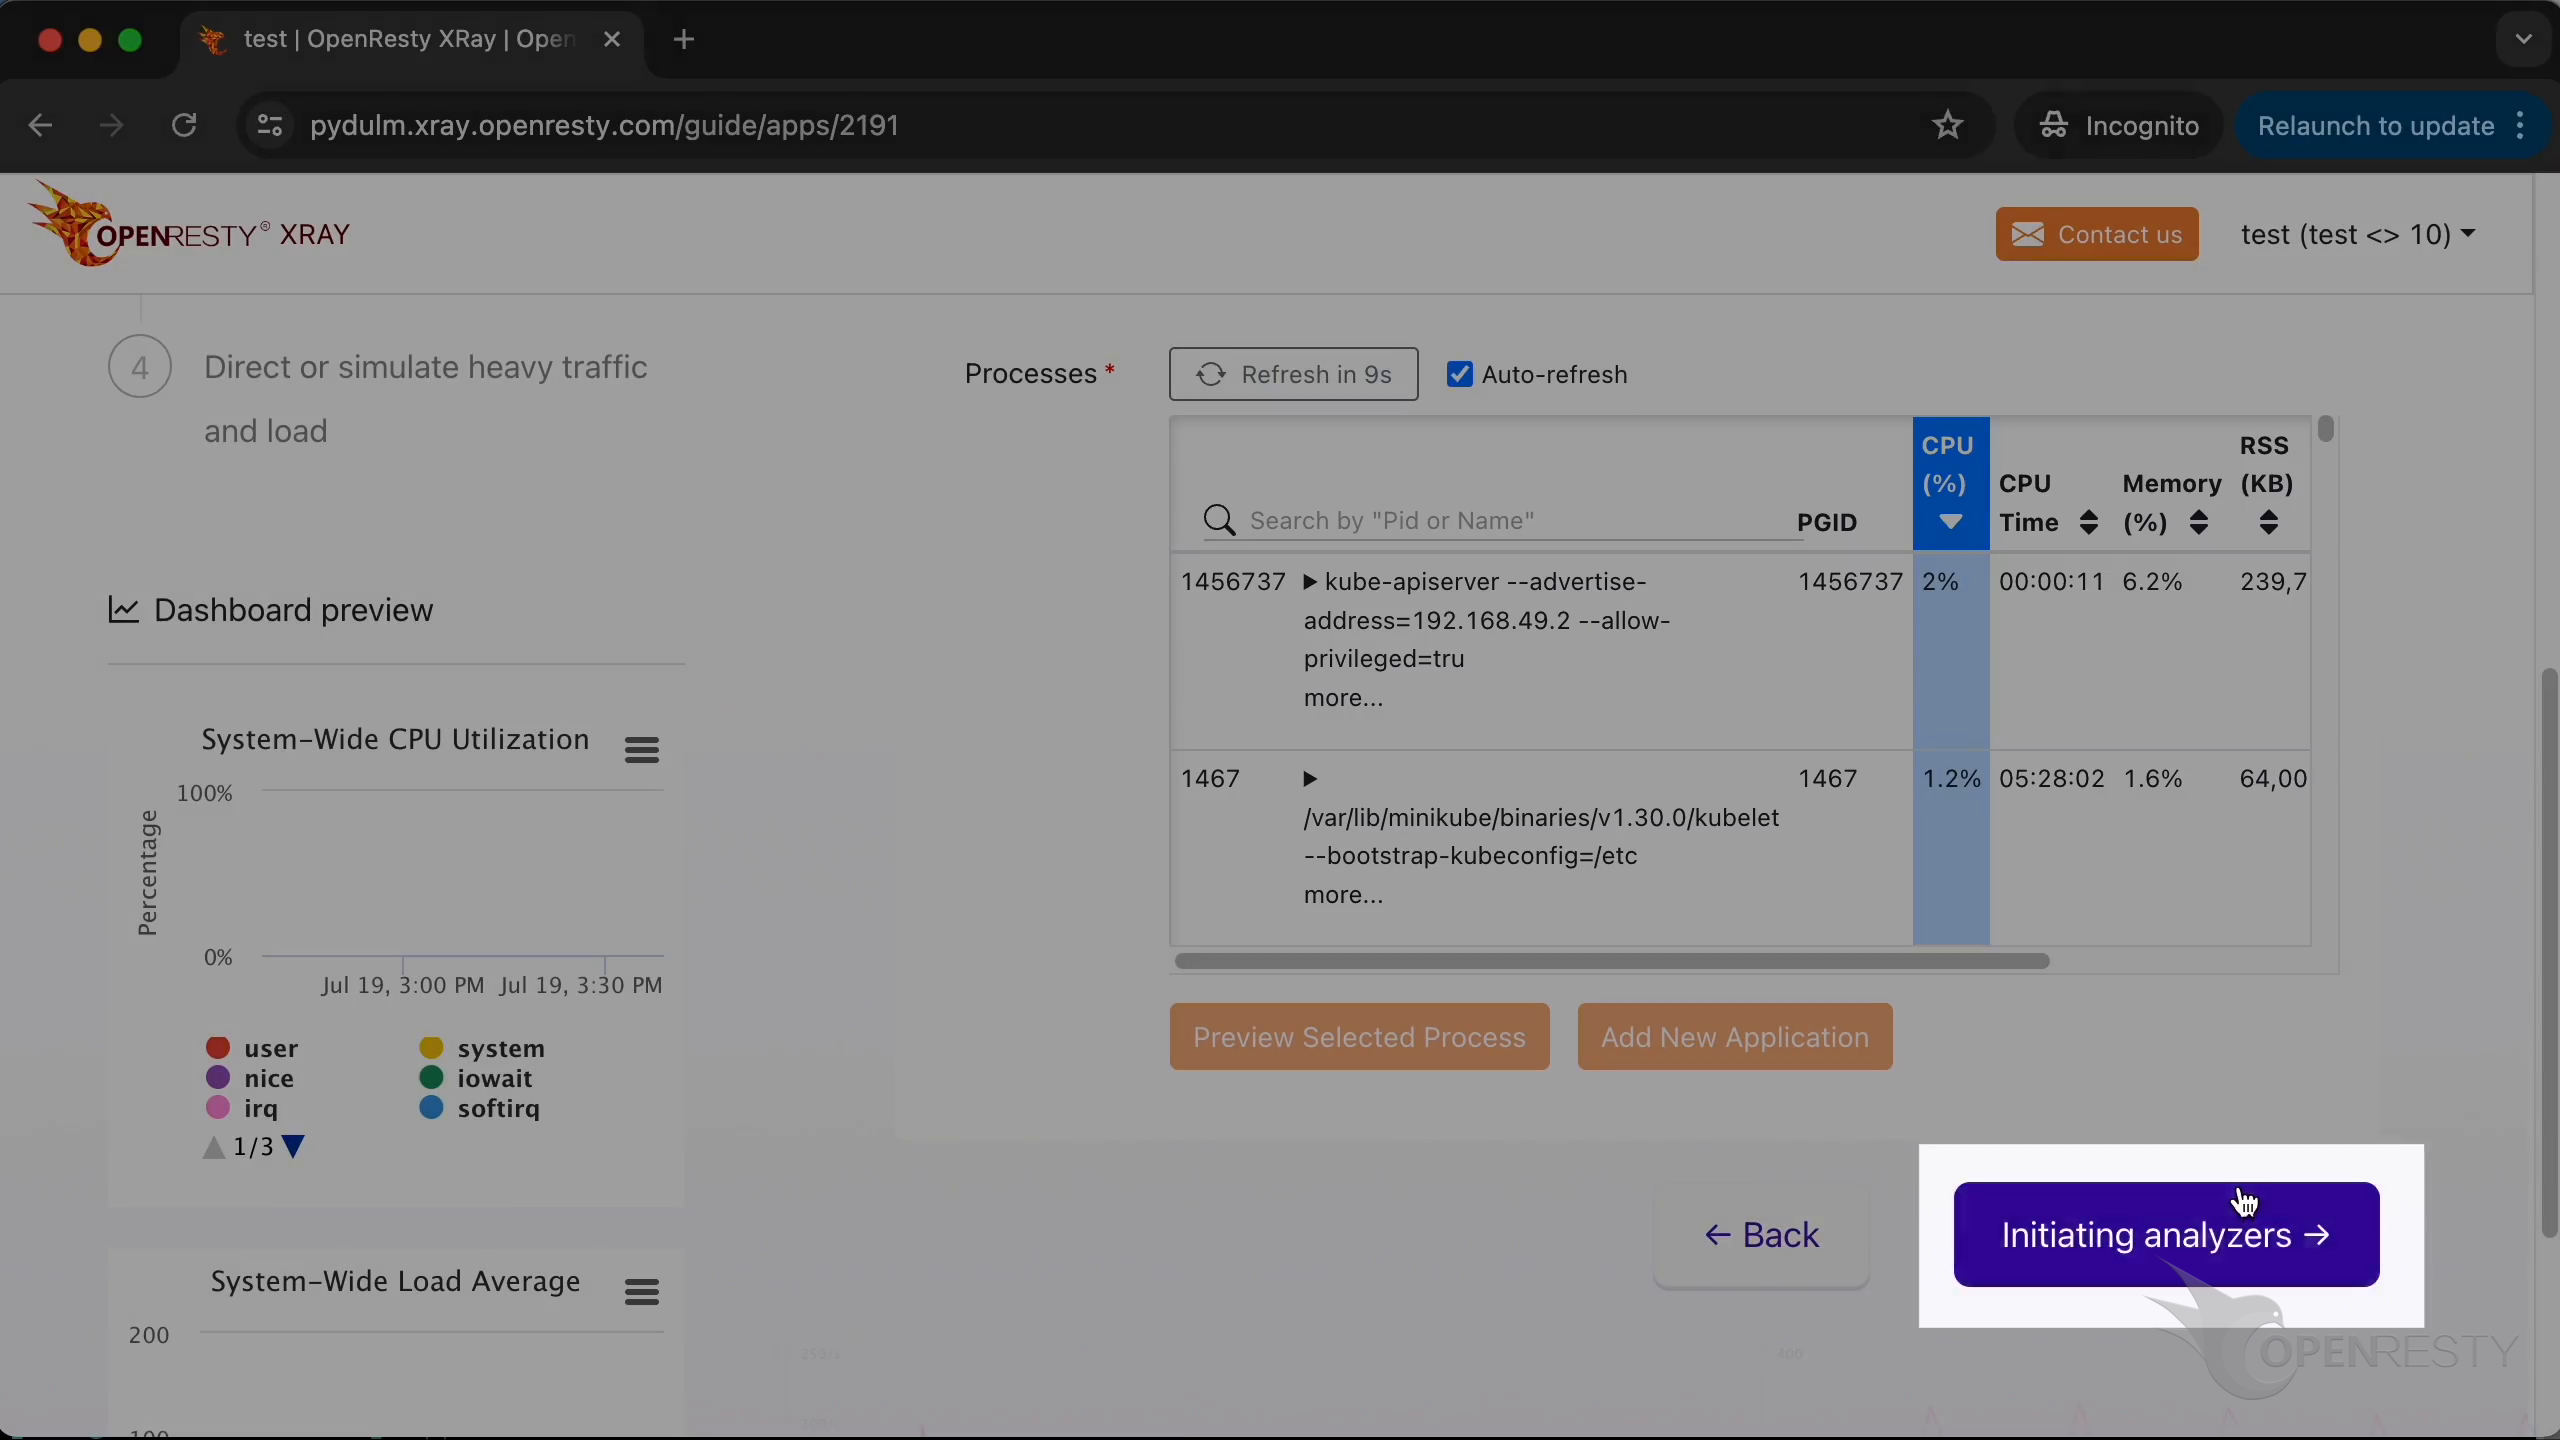
You can select the process corresponding to the new application from the list here.
Initiating Analyzers and Viewing Insights
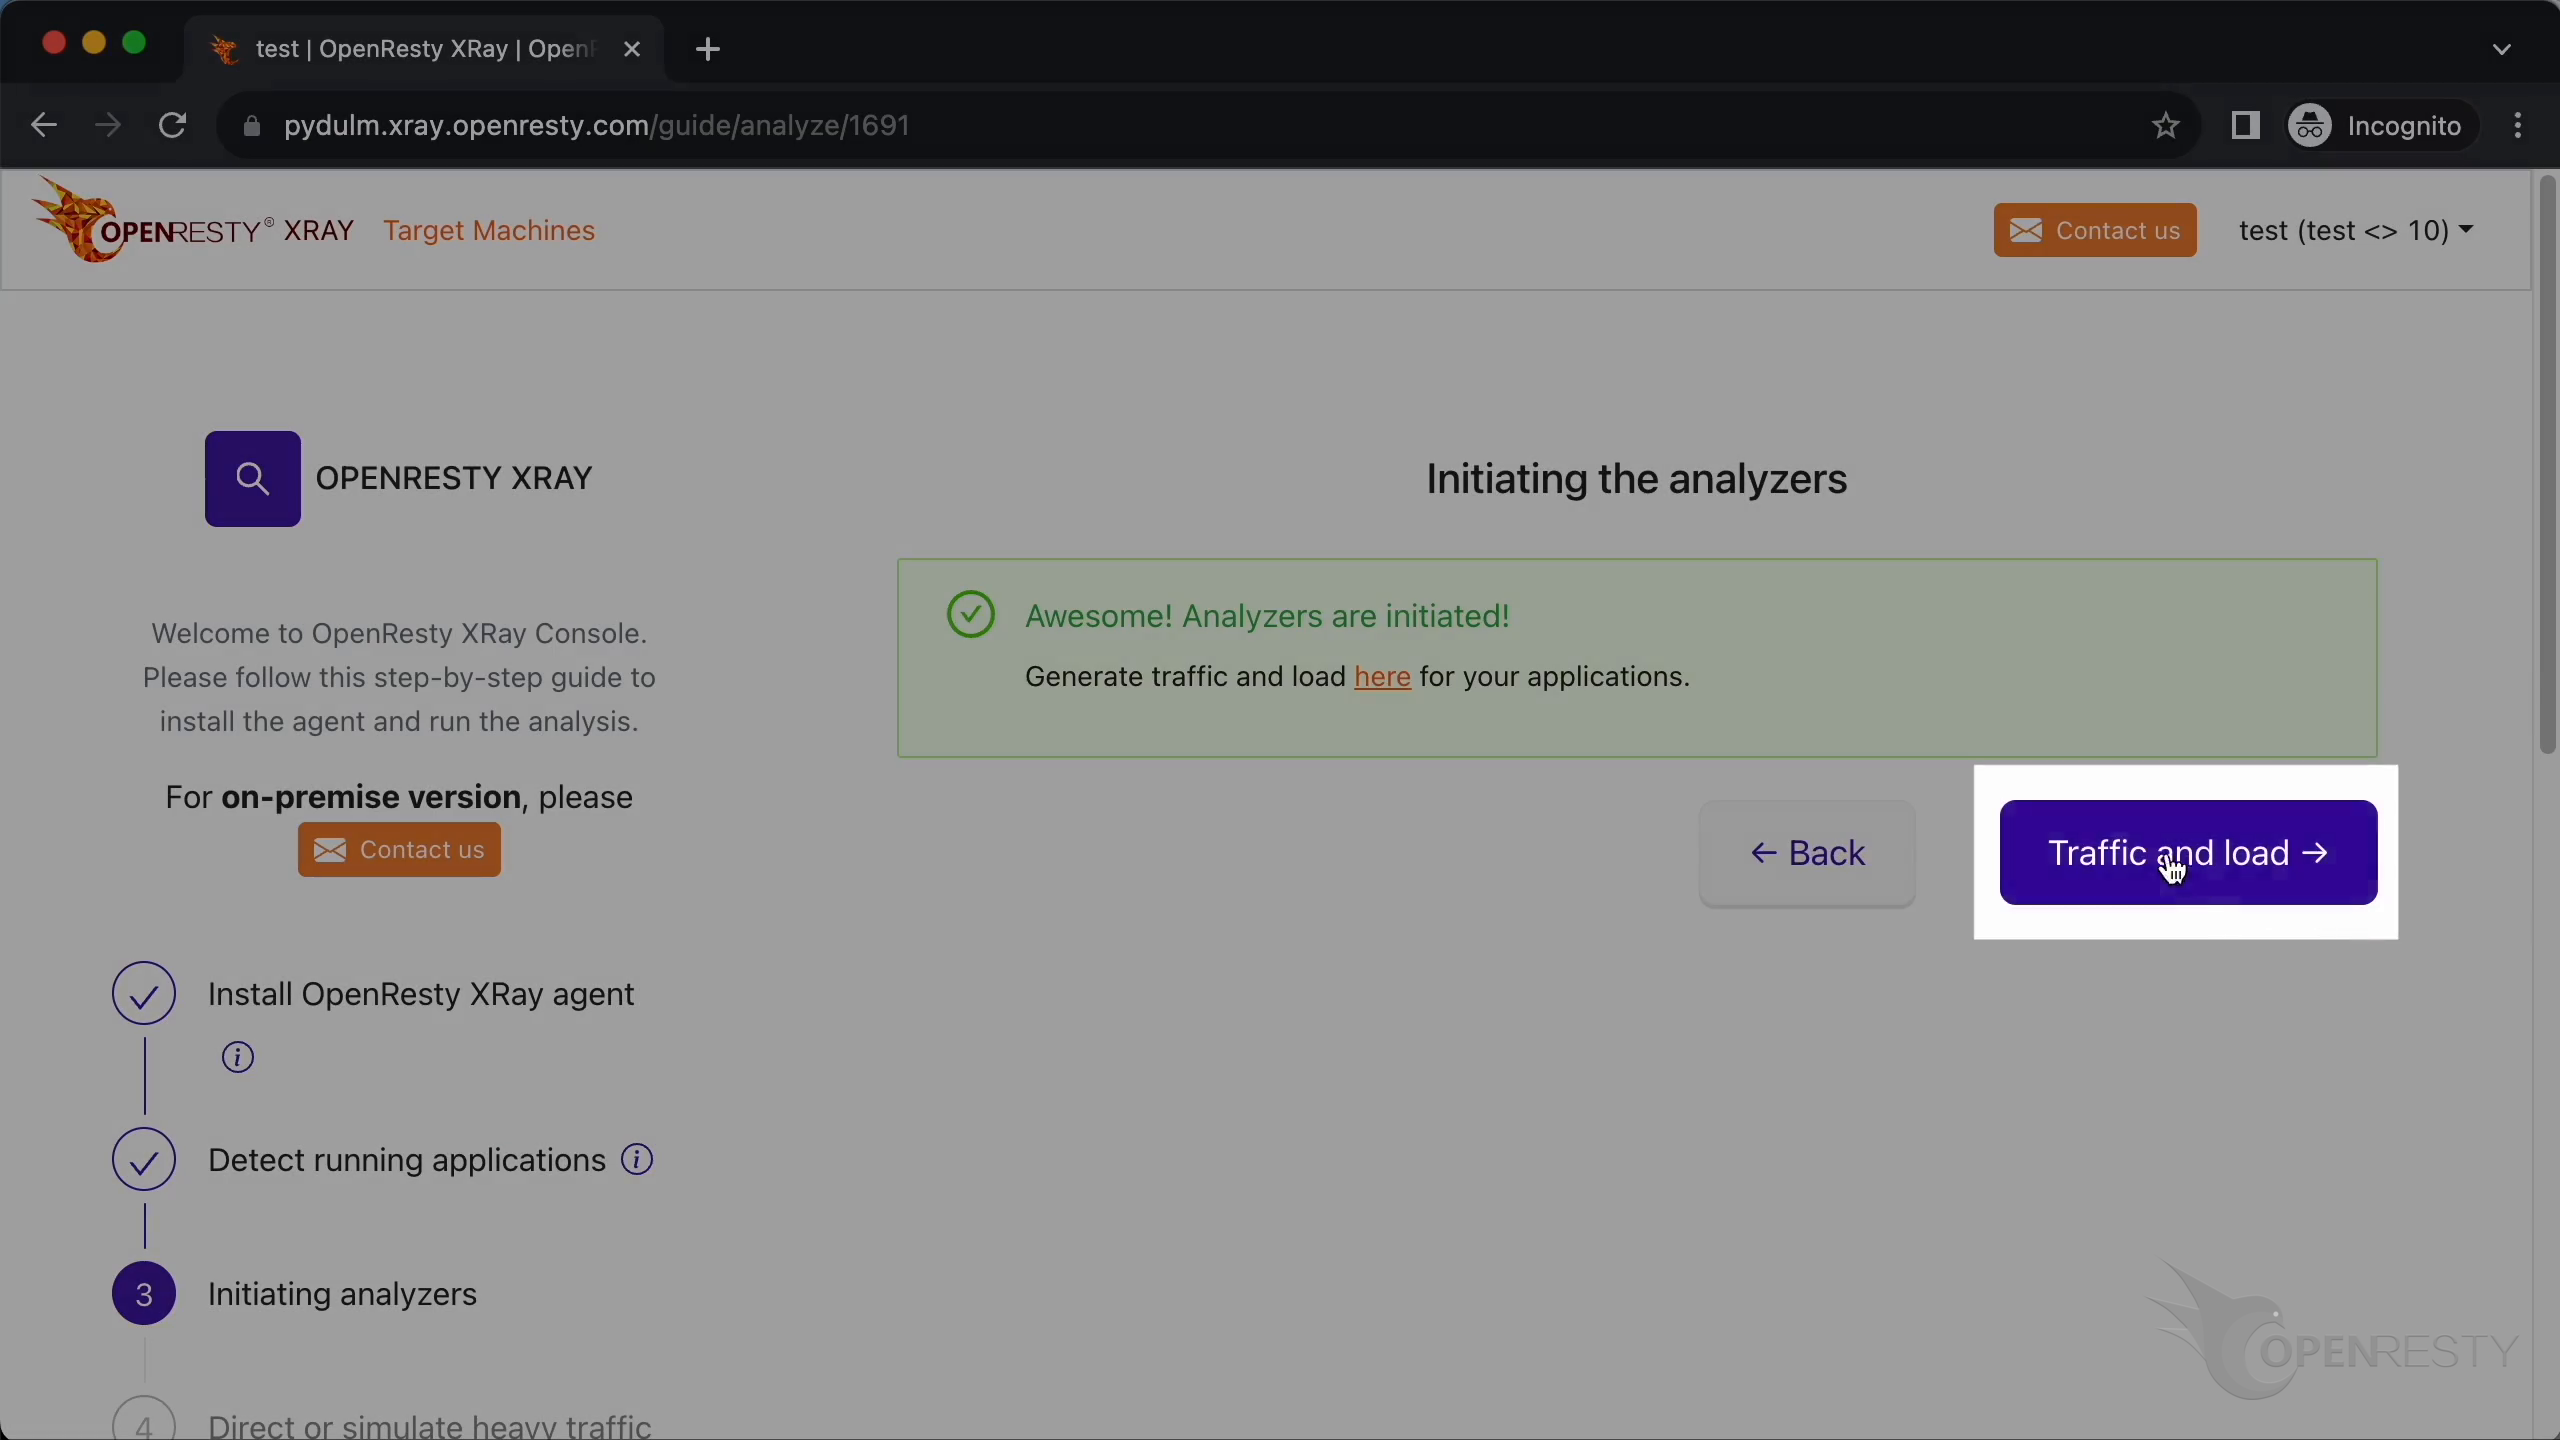
Click to initiate analyzers.
The analyzers just started running.
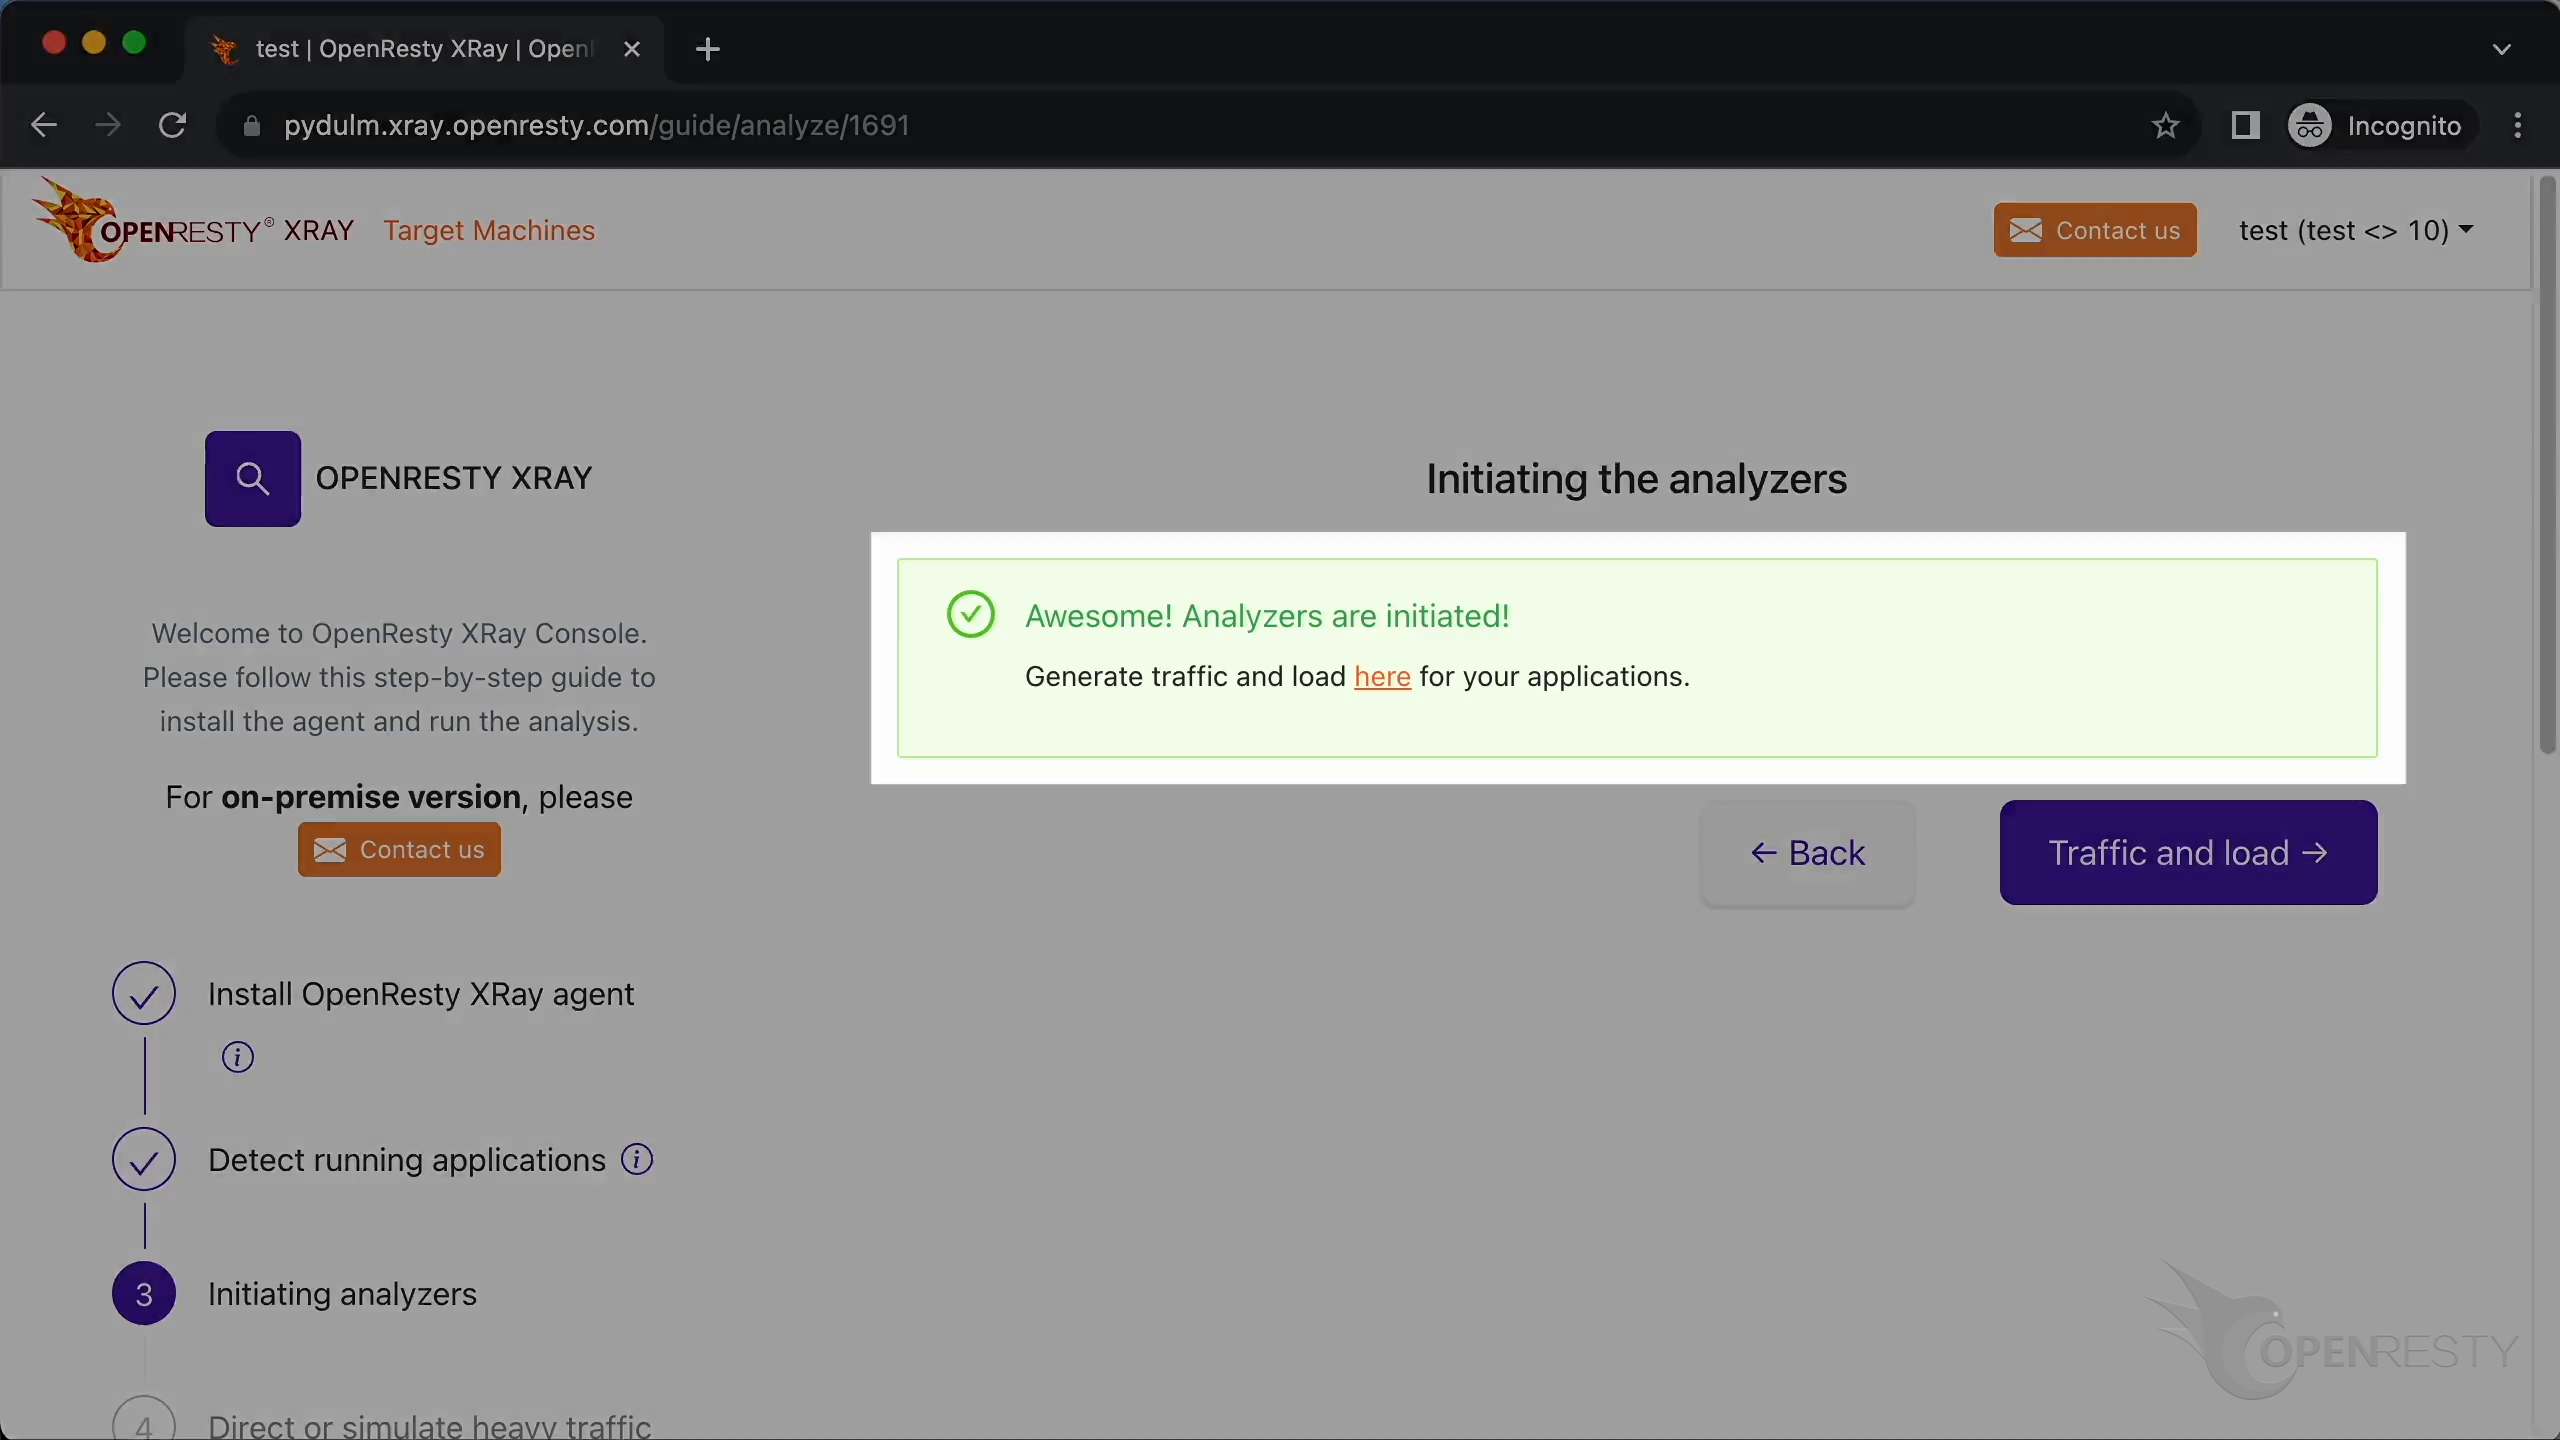
Click on “Traffic and Load”.
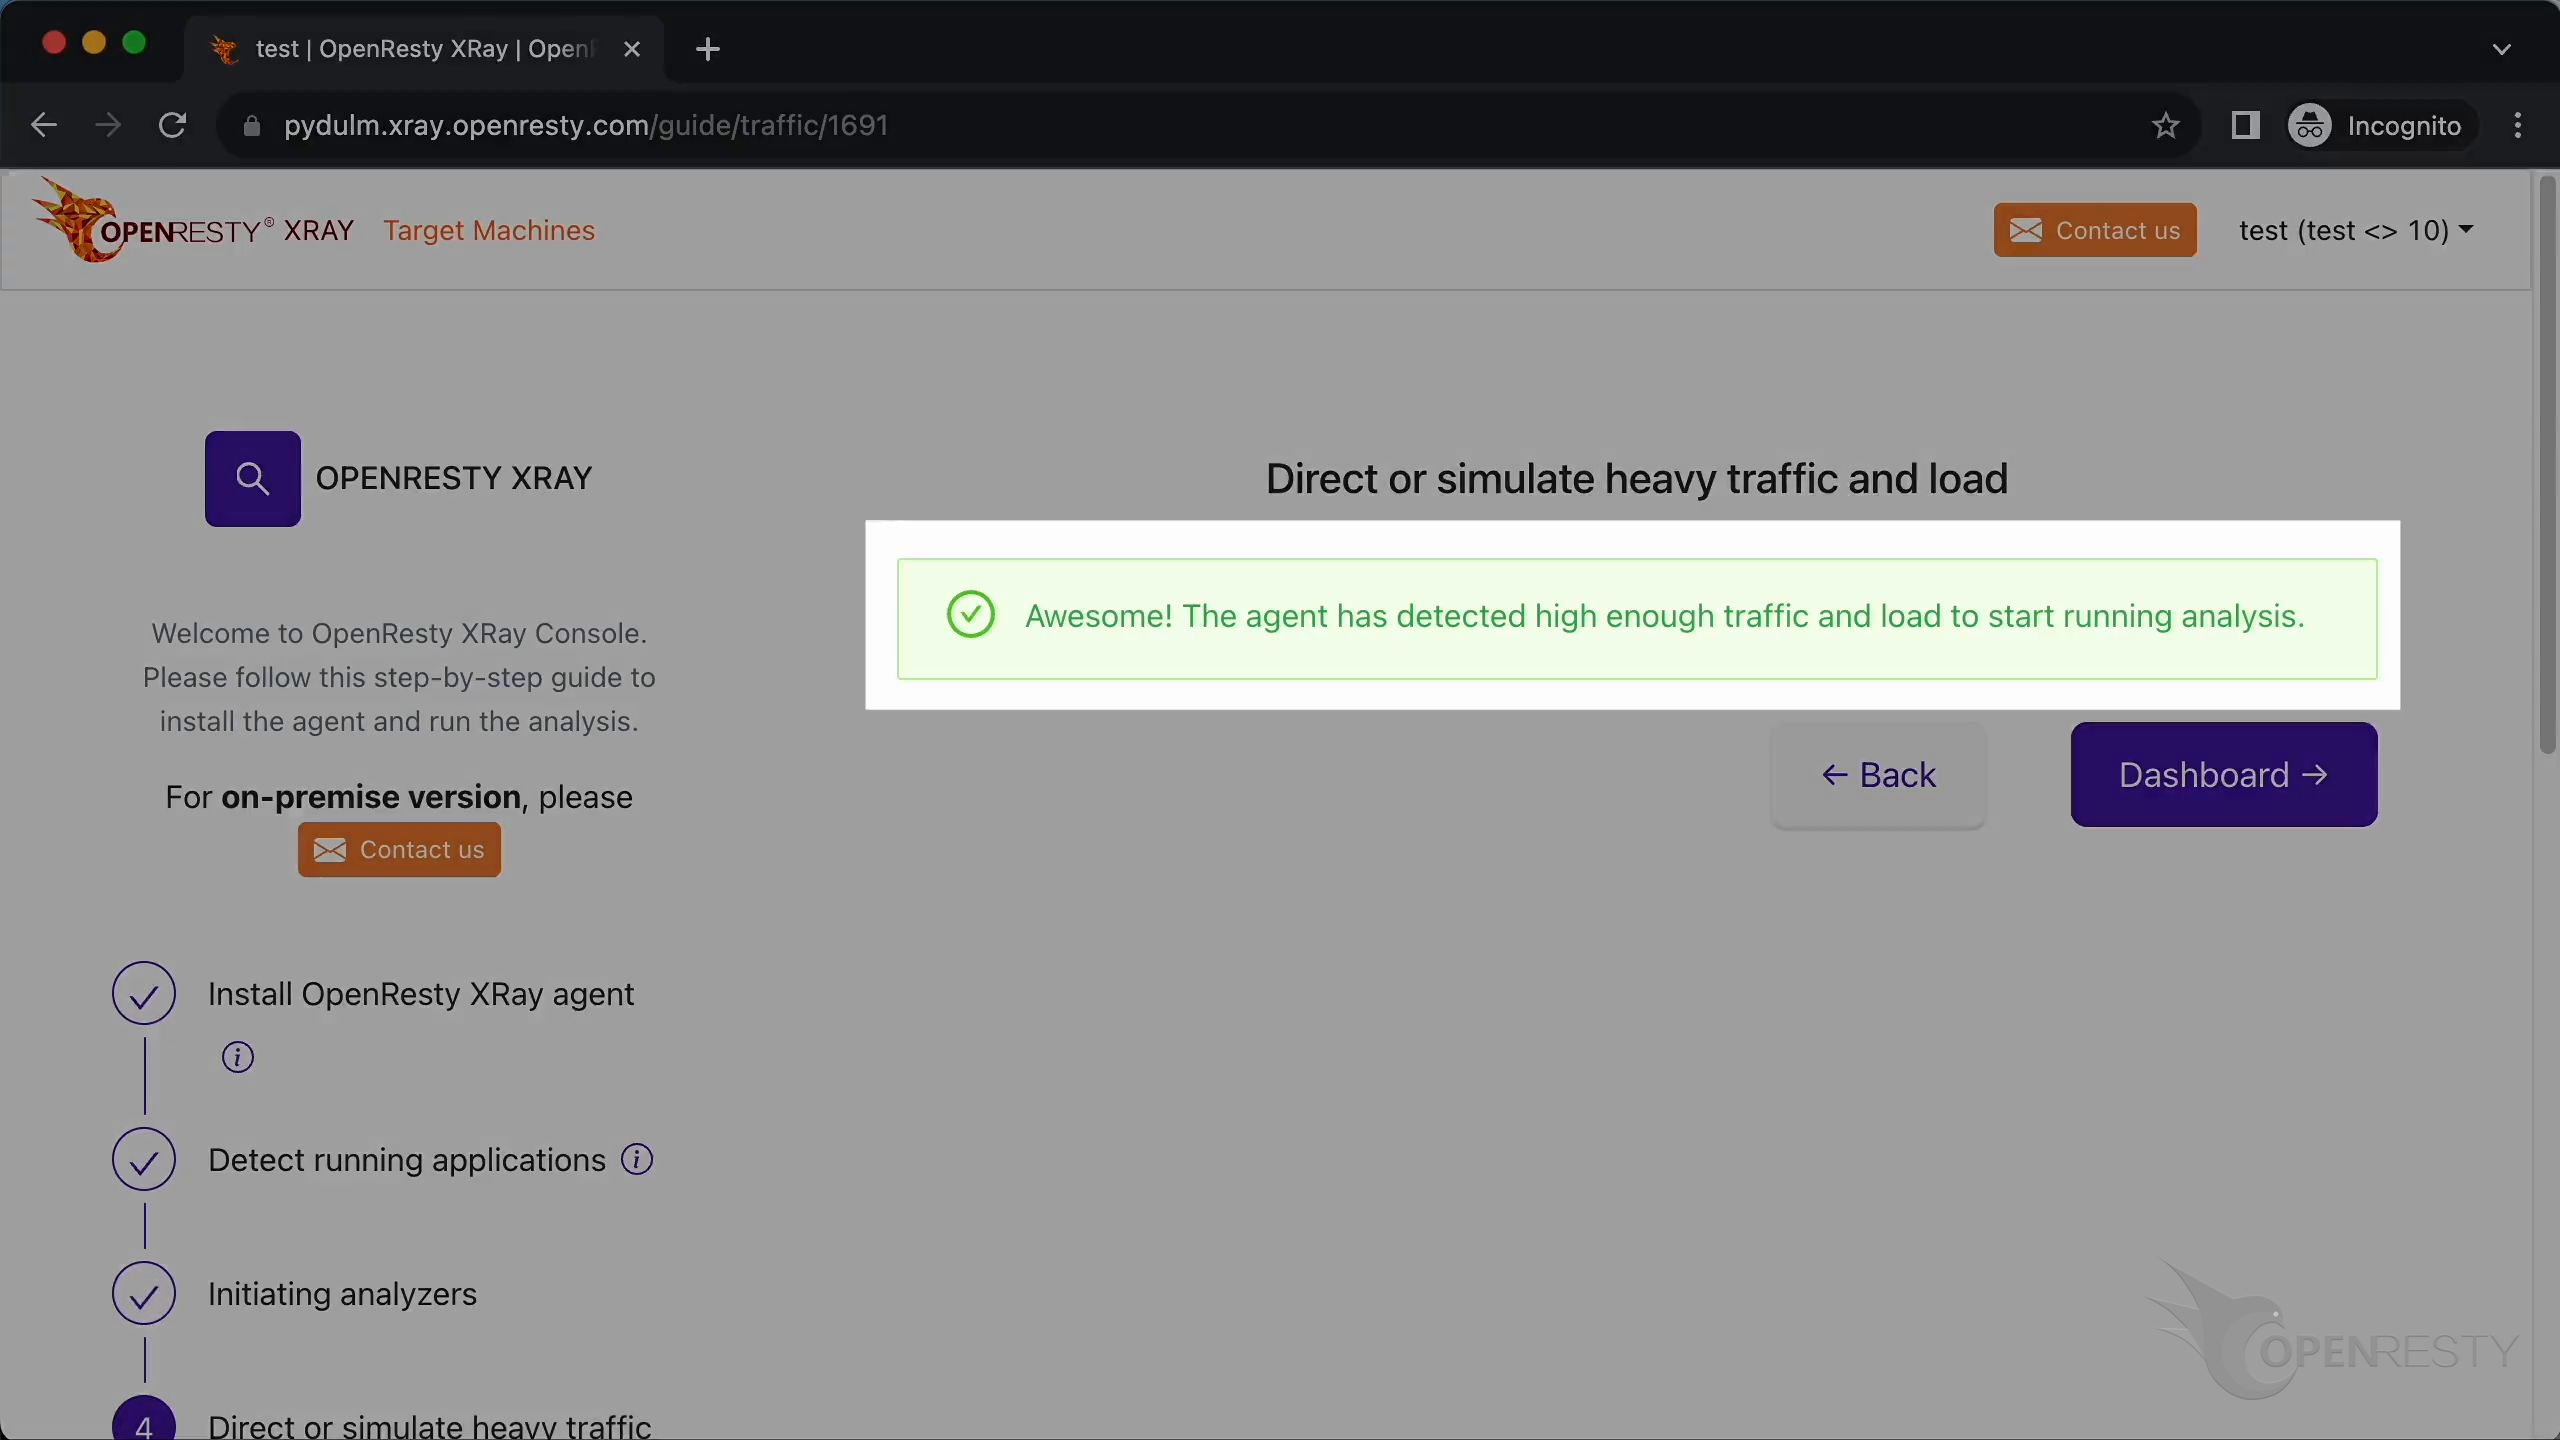
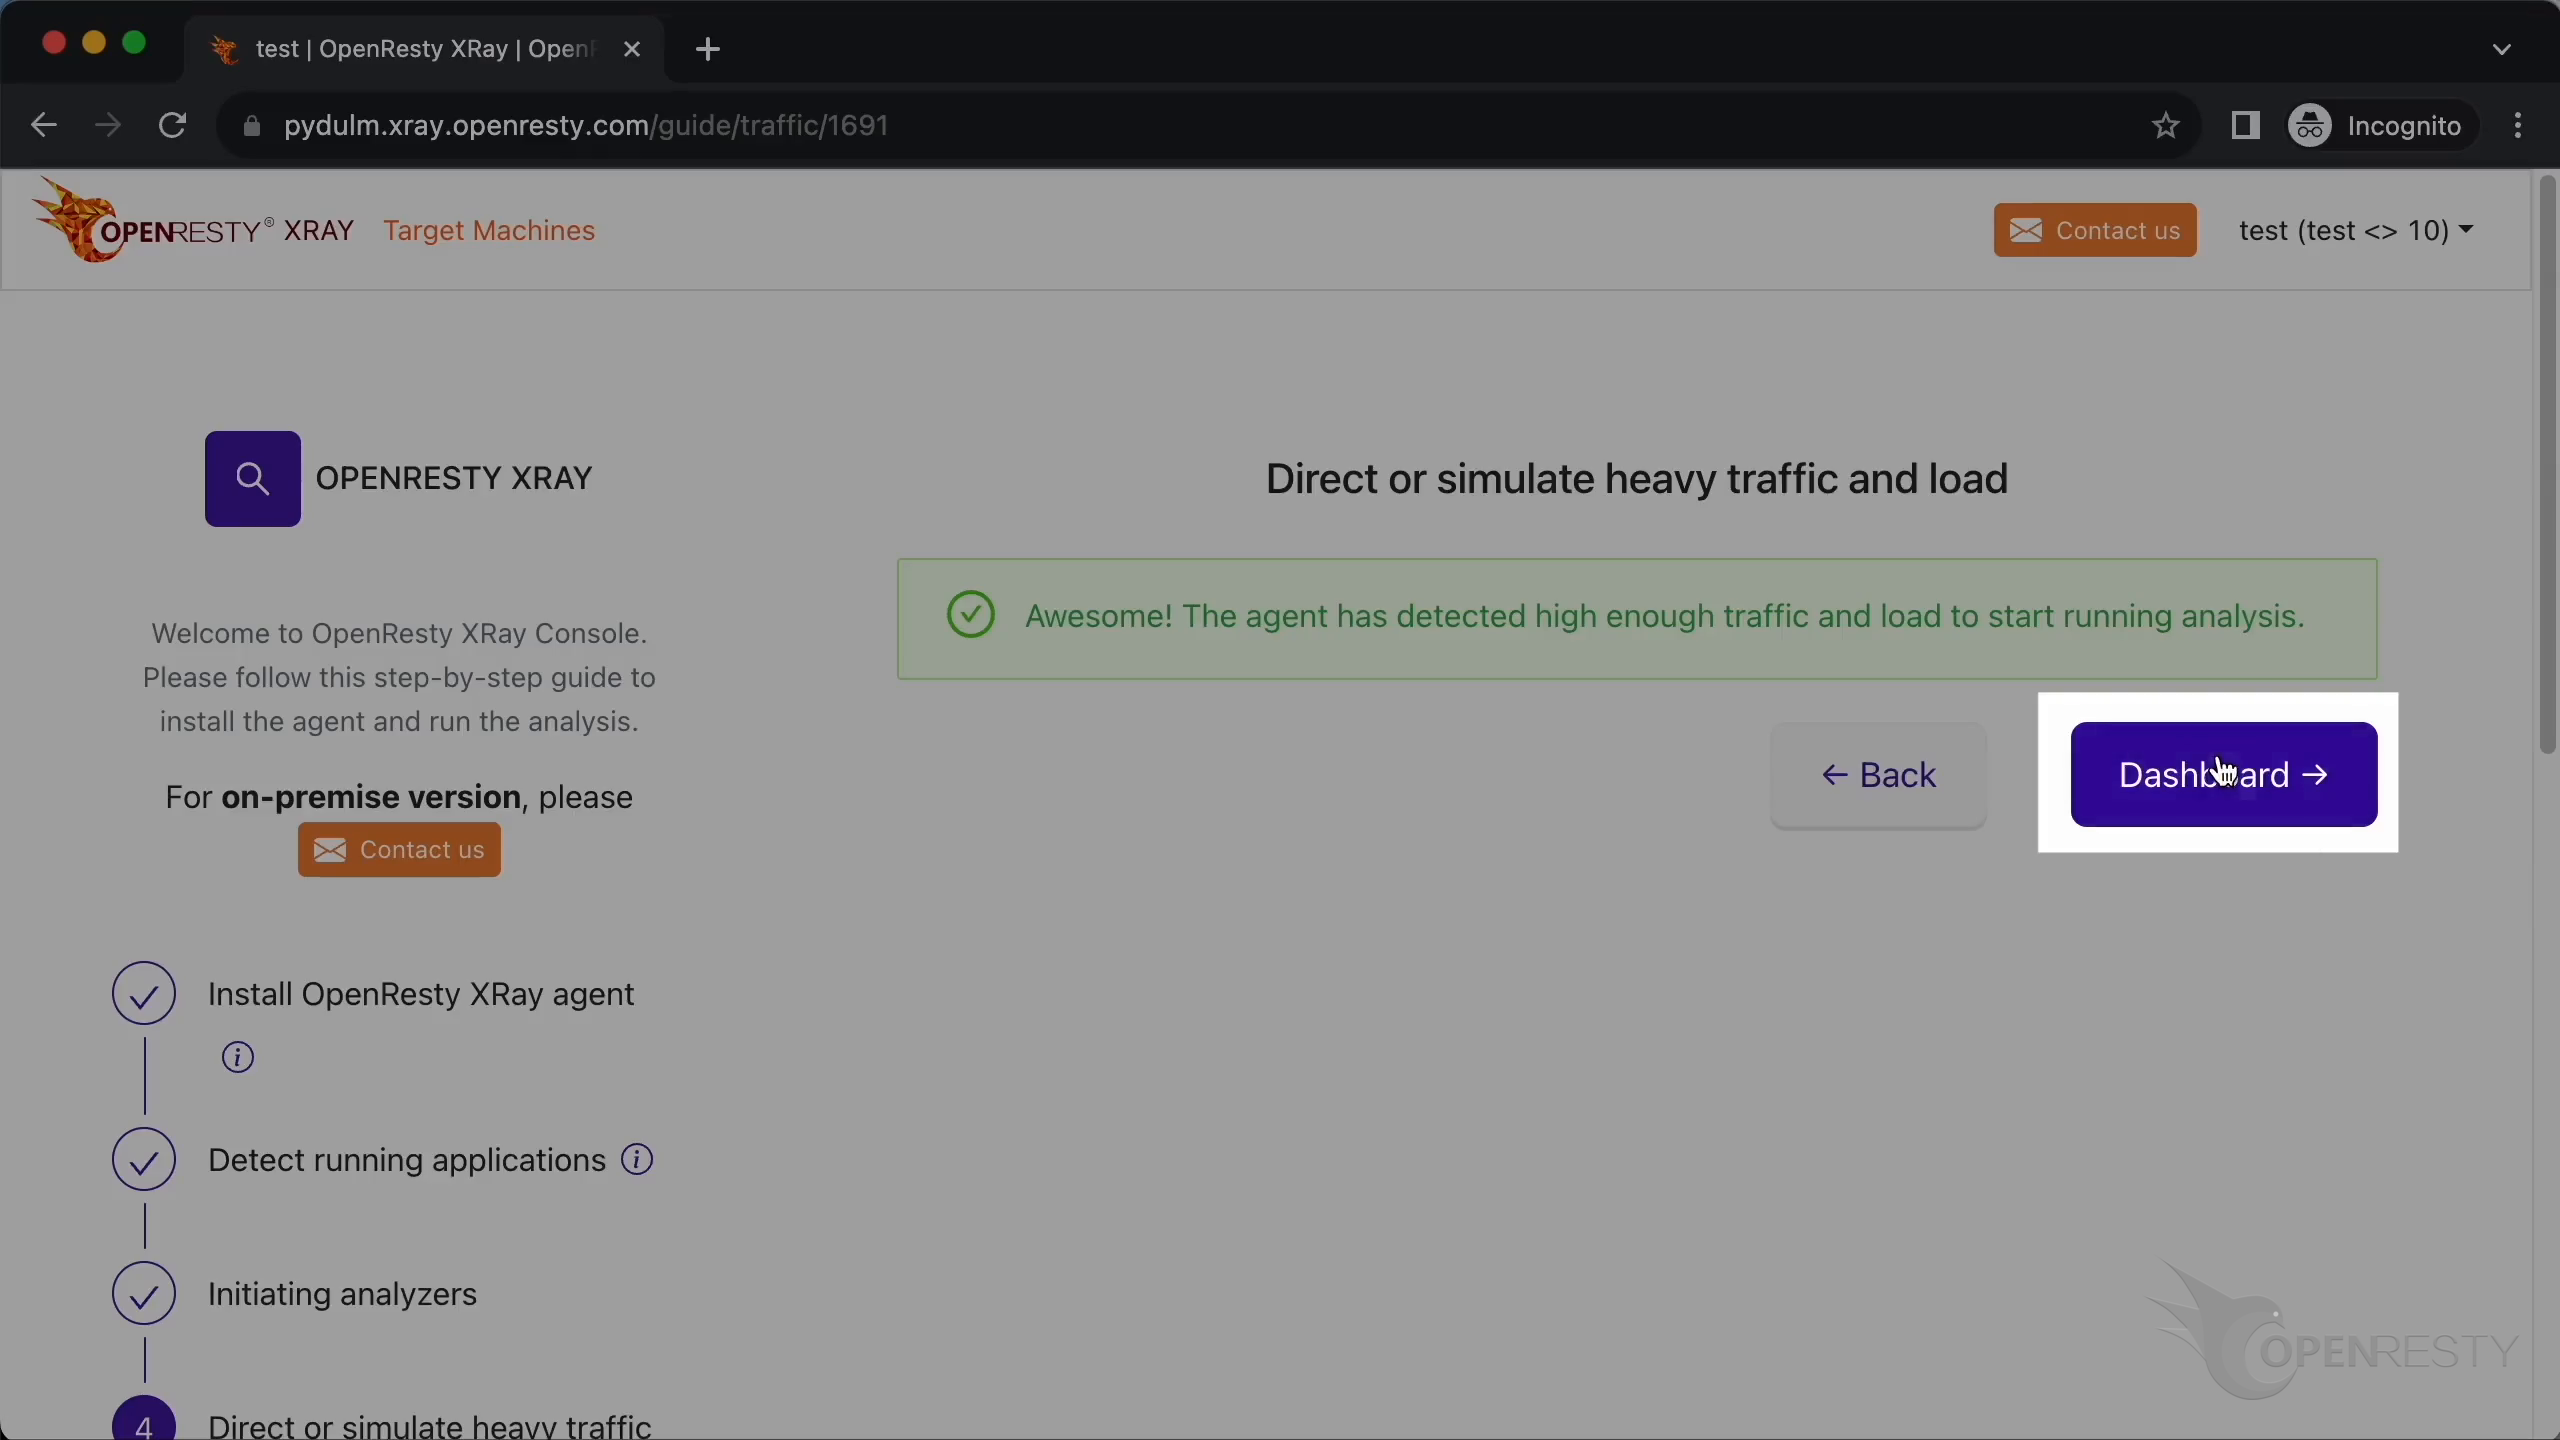
The system has detected there’s sufficient traffic and load on the machine. It can only conduct meaningful analysis when the target applications has traffic and load.
Let’s enter the console.
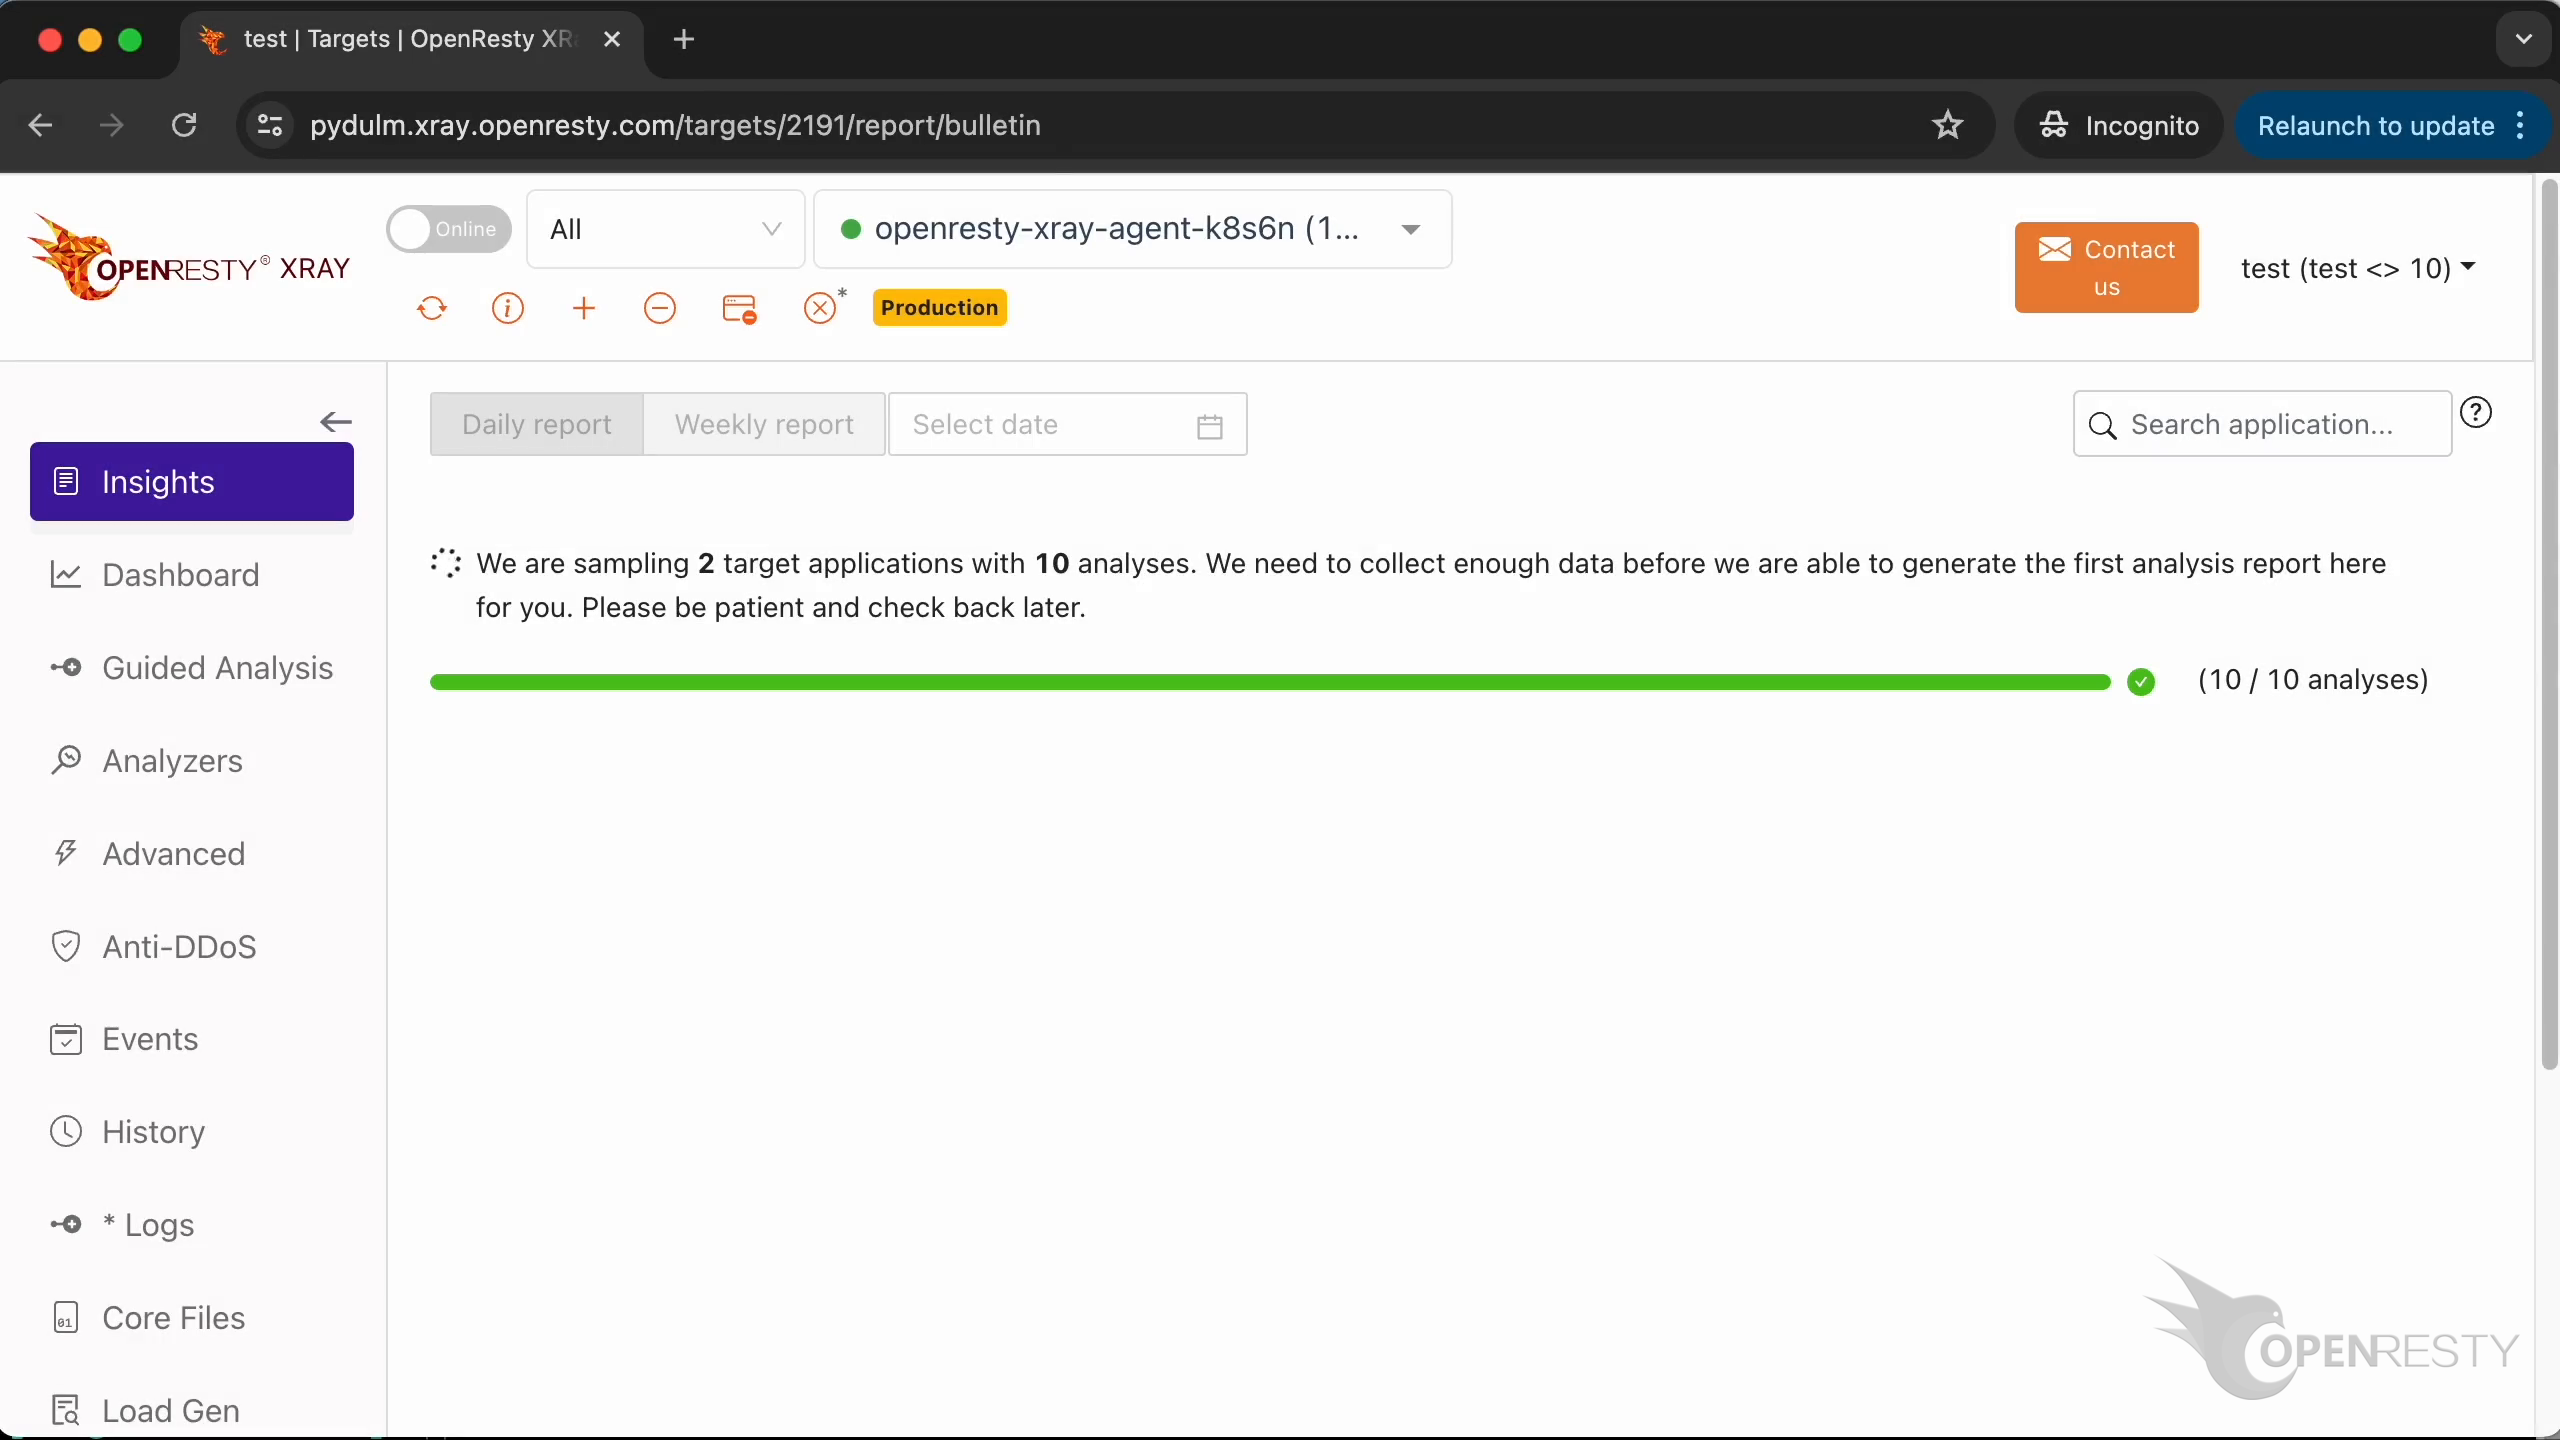
Wait for the first analysis report since the first Agent was just installed. The report in the “Insights” page is generated by aggregating all applications on all Agents.
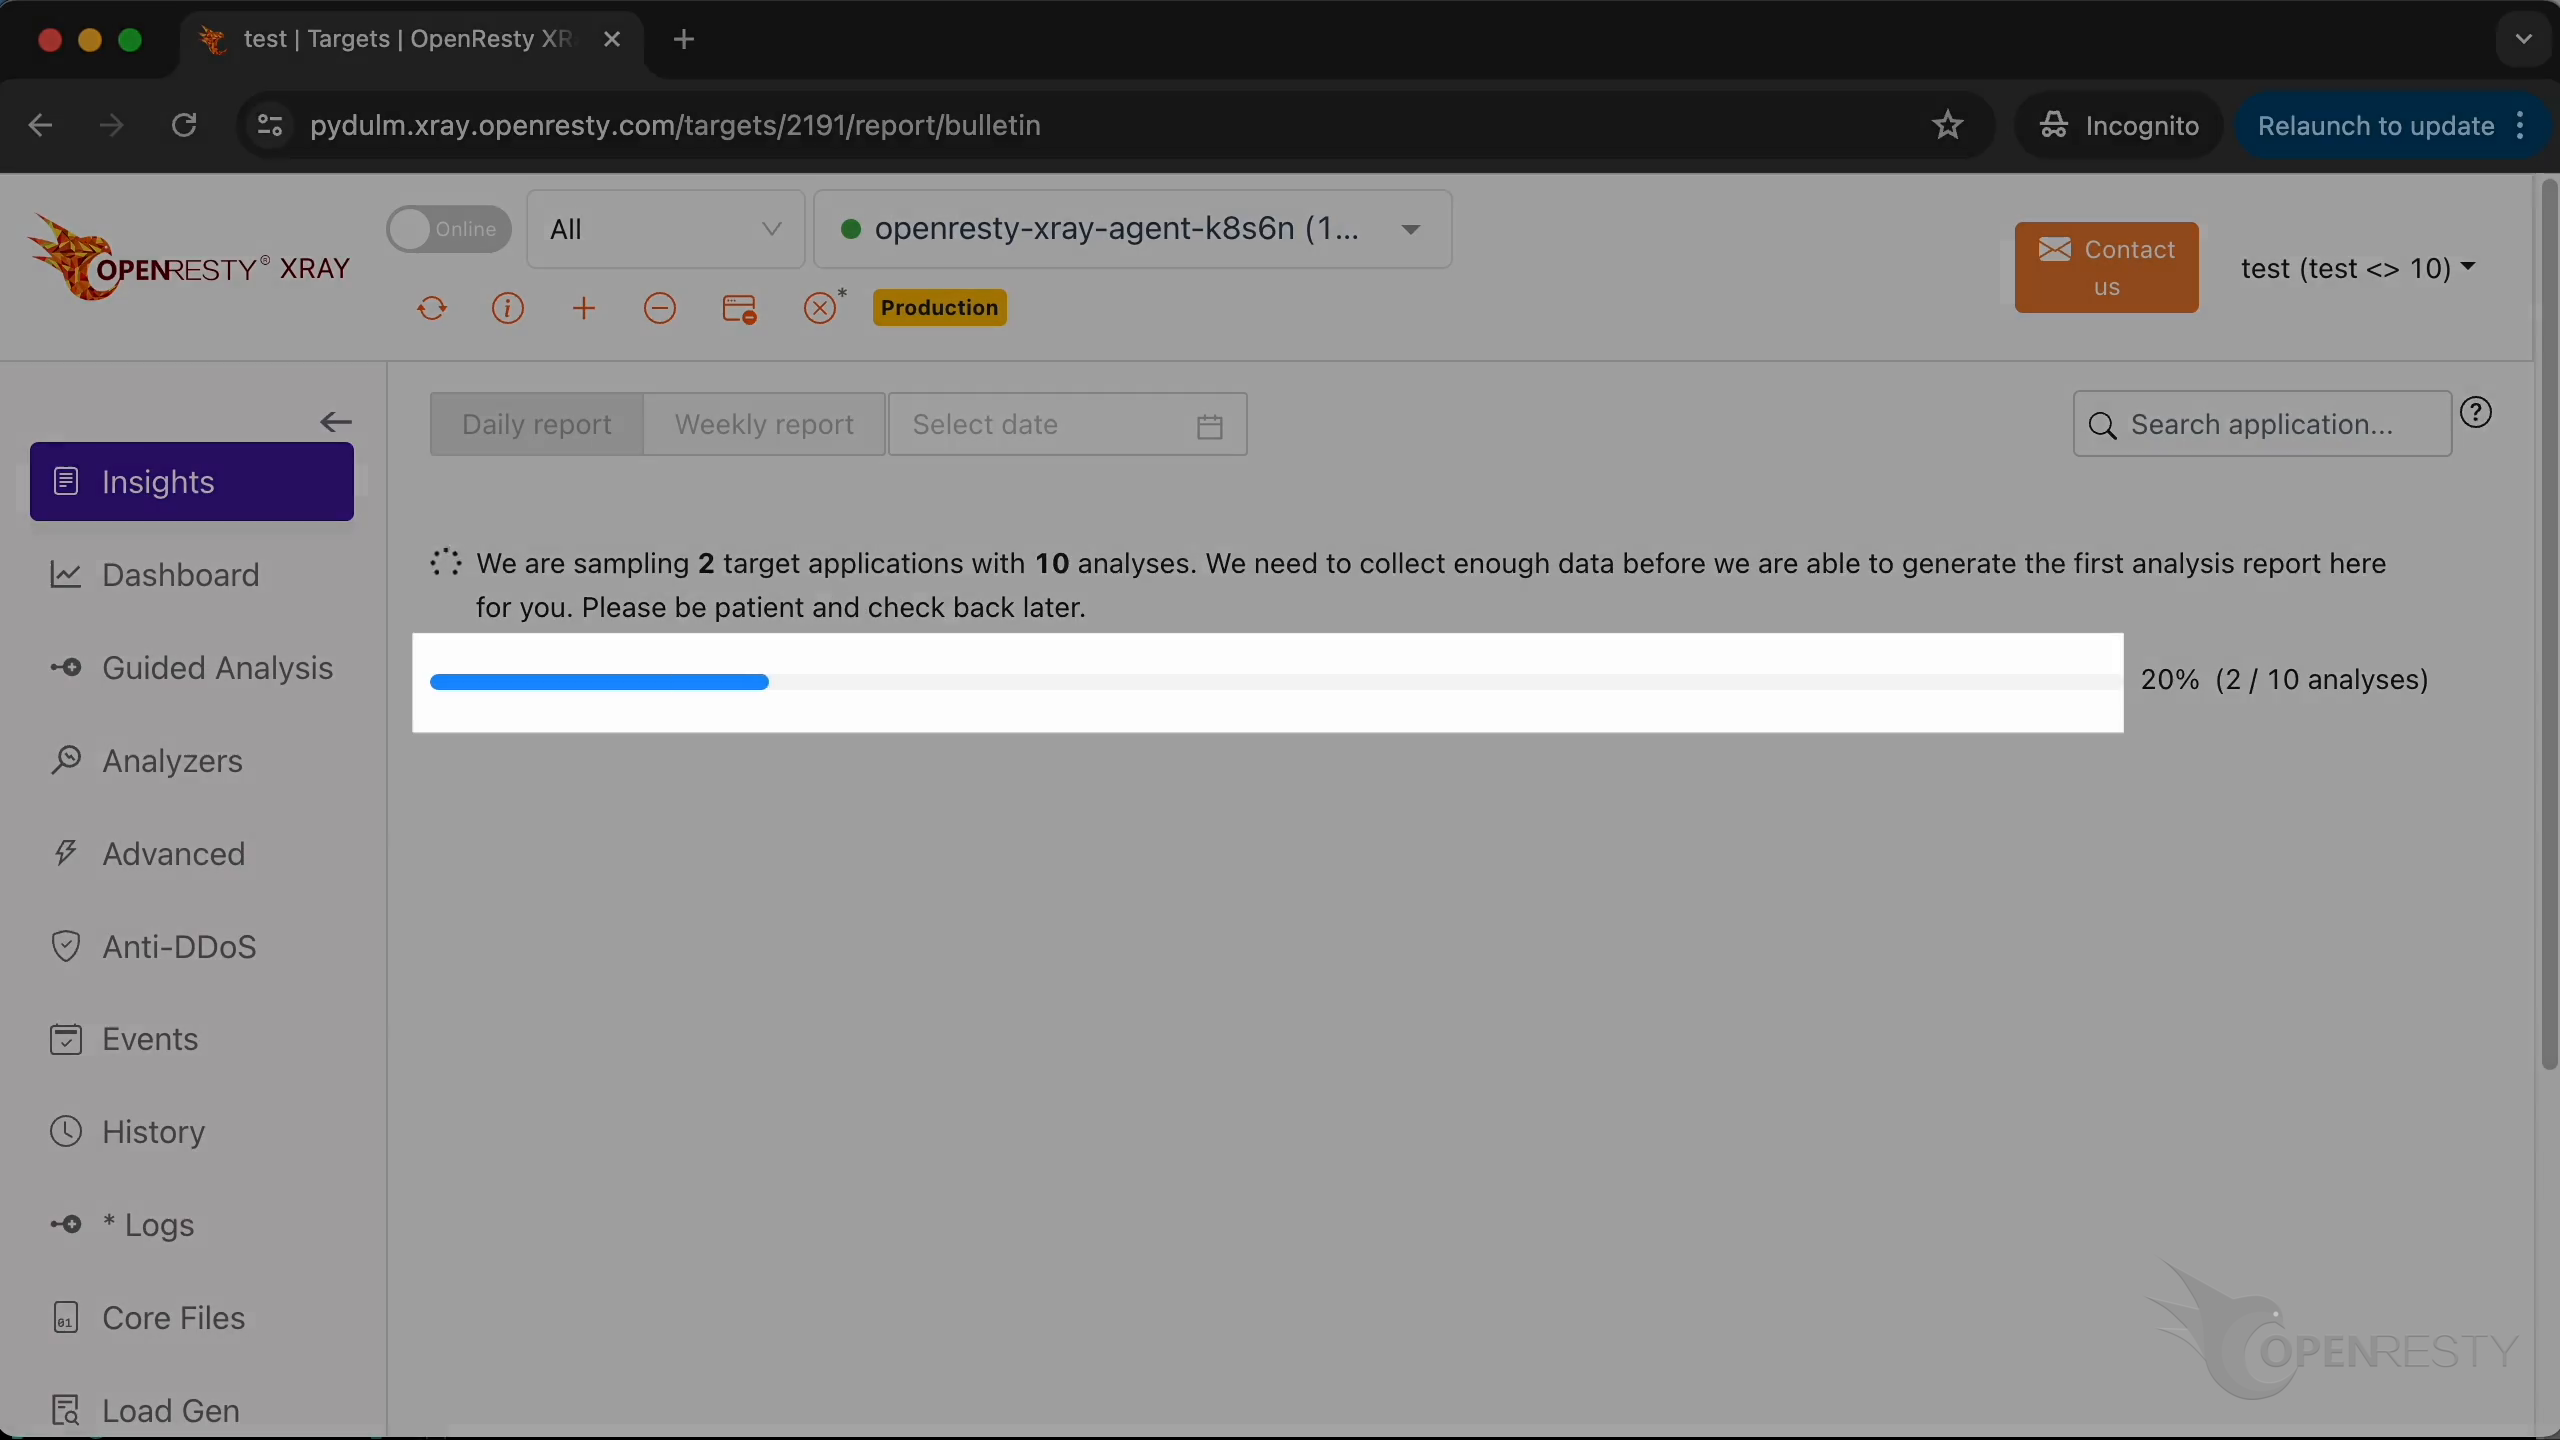
You can watch the progress in real-time.
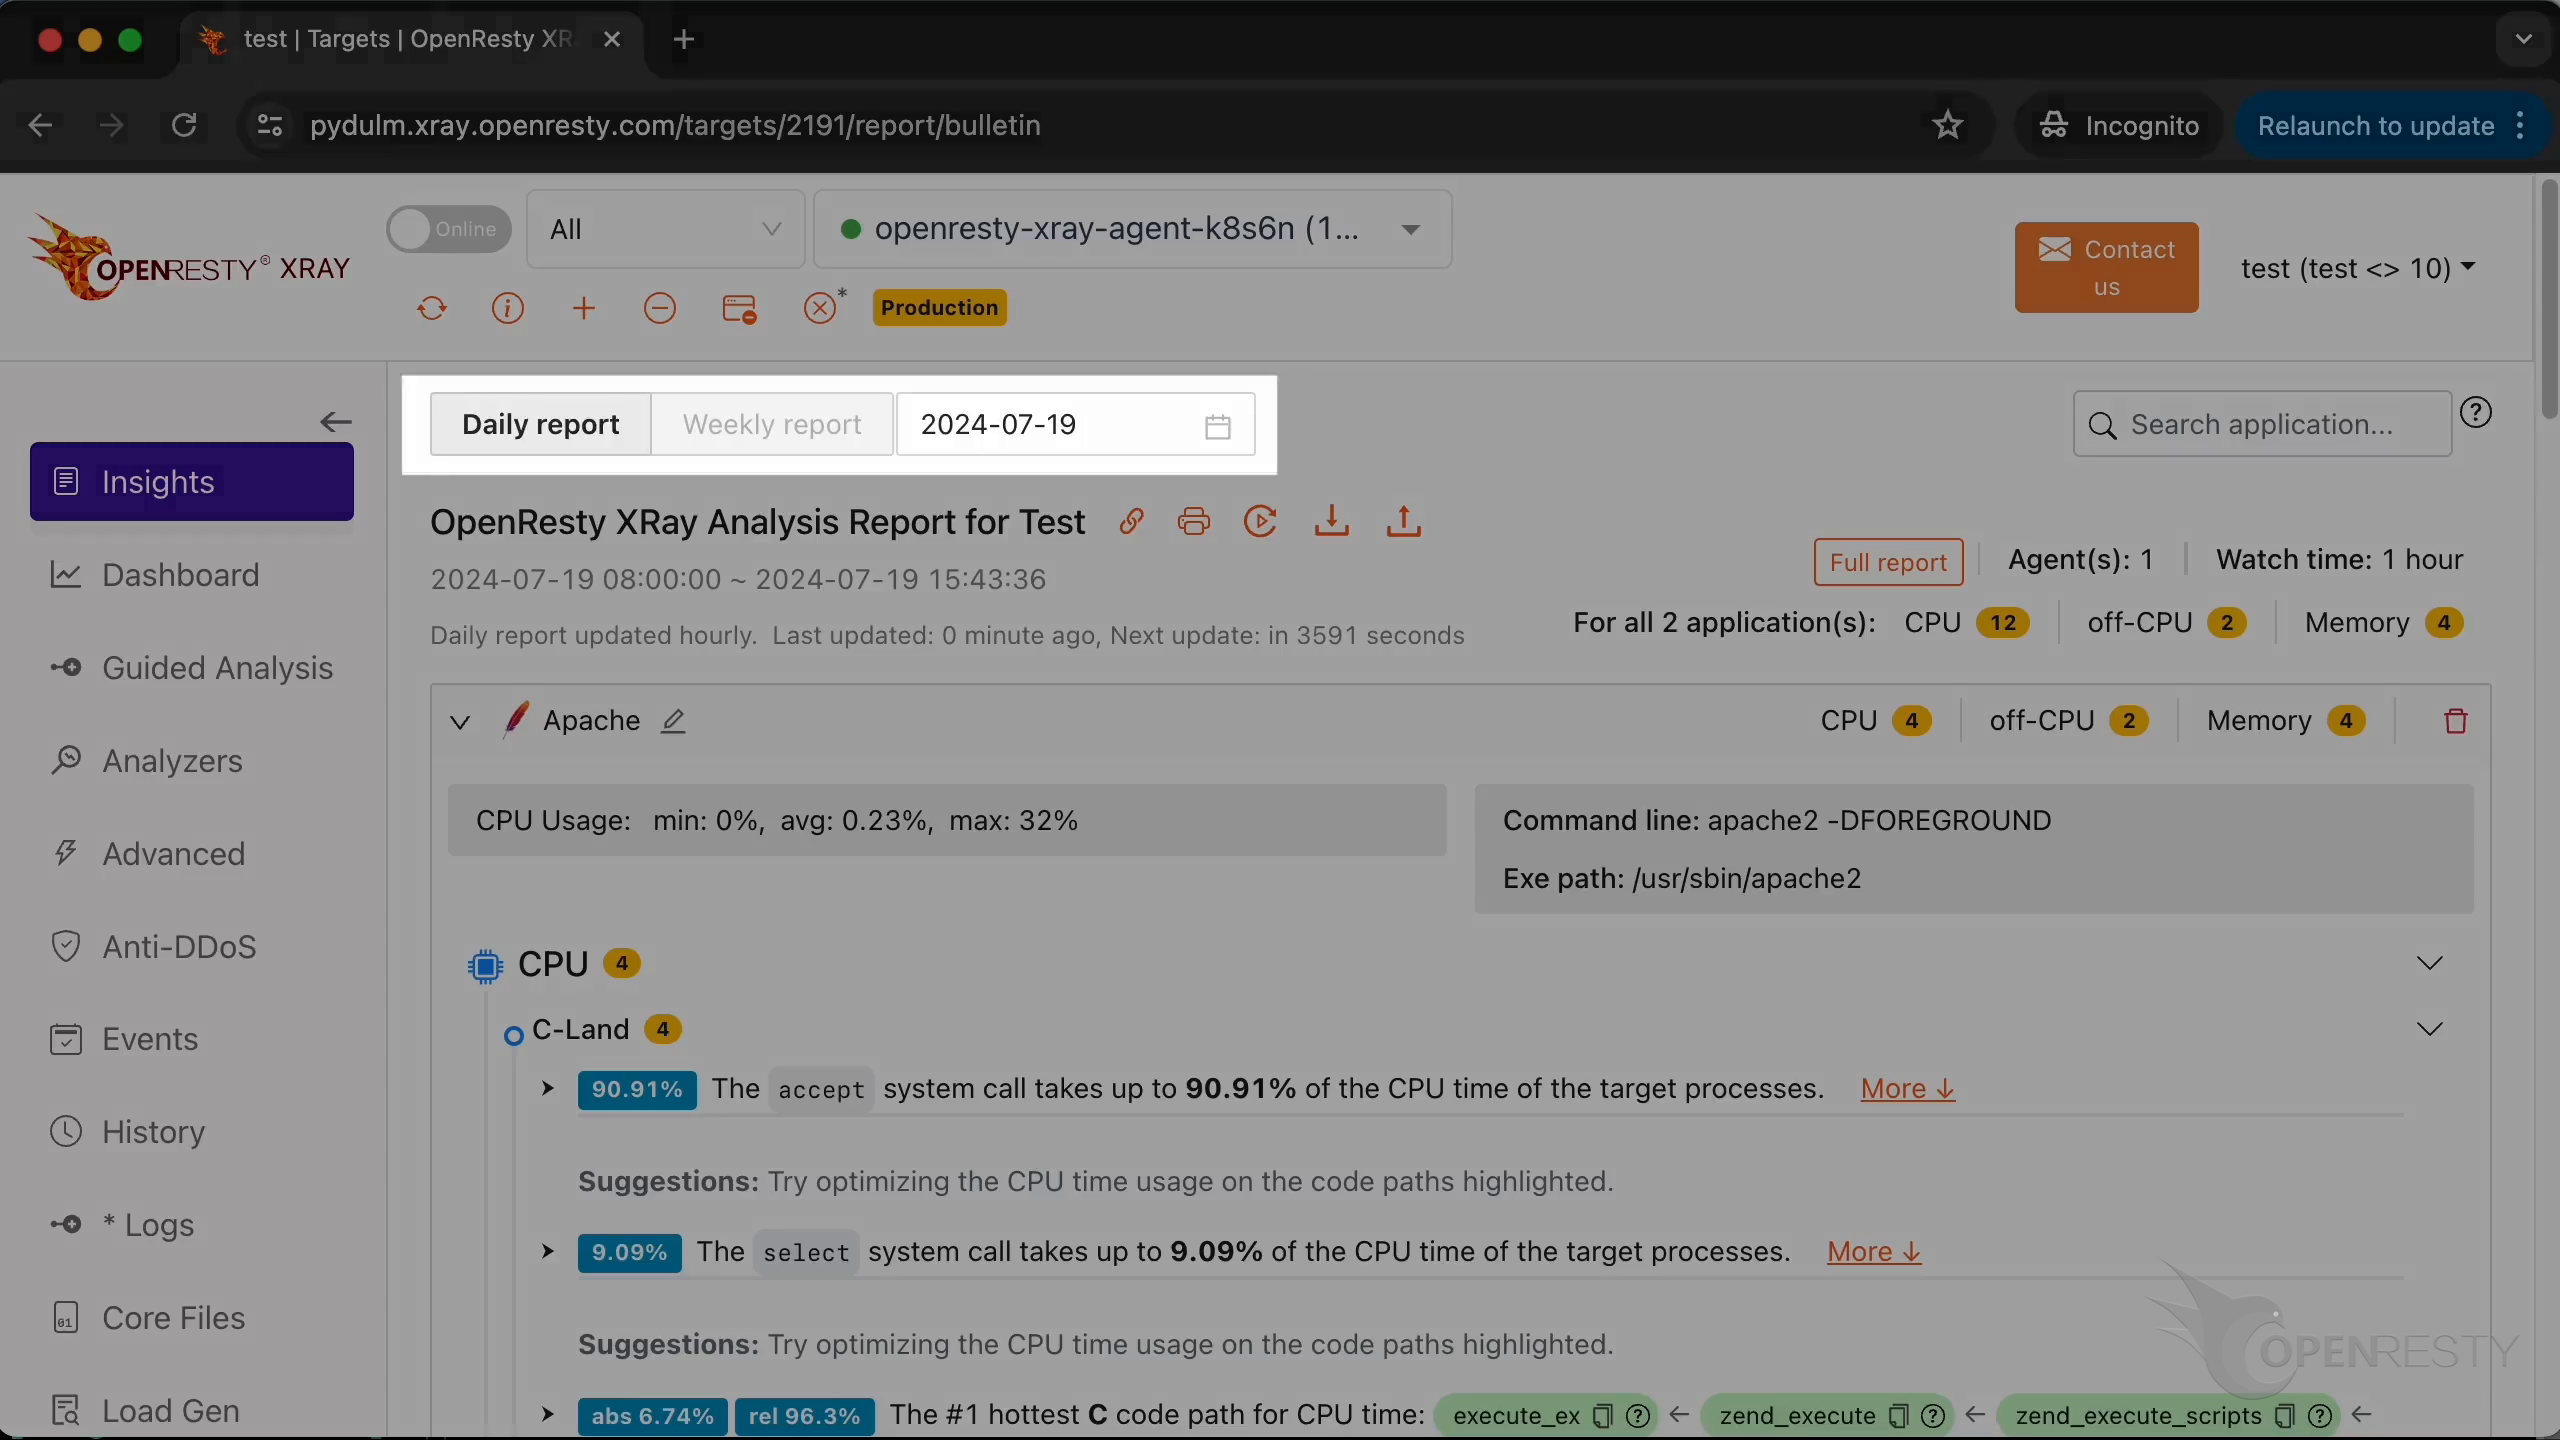
We can see that the first fully automated analysis report has already been generated.
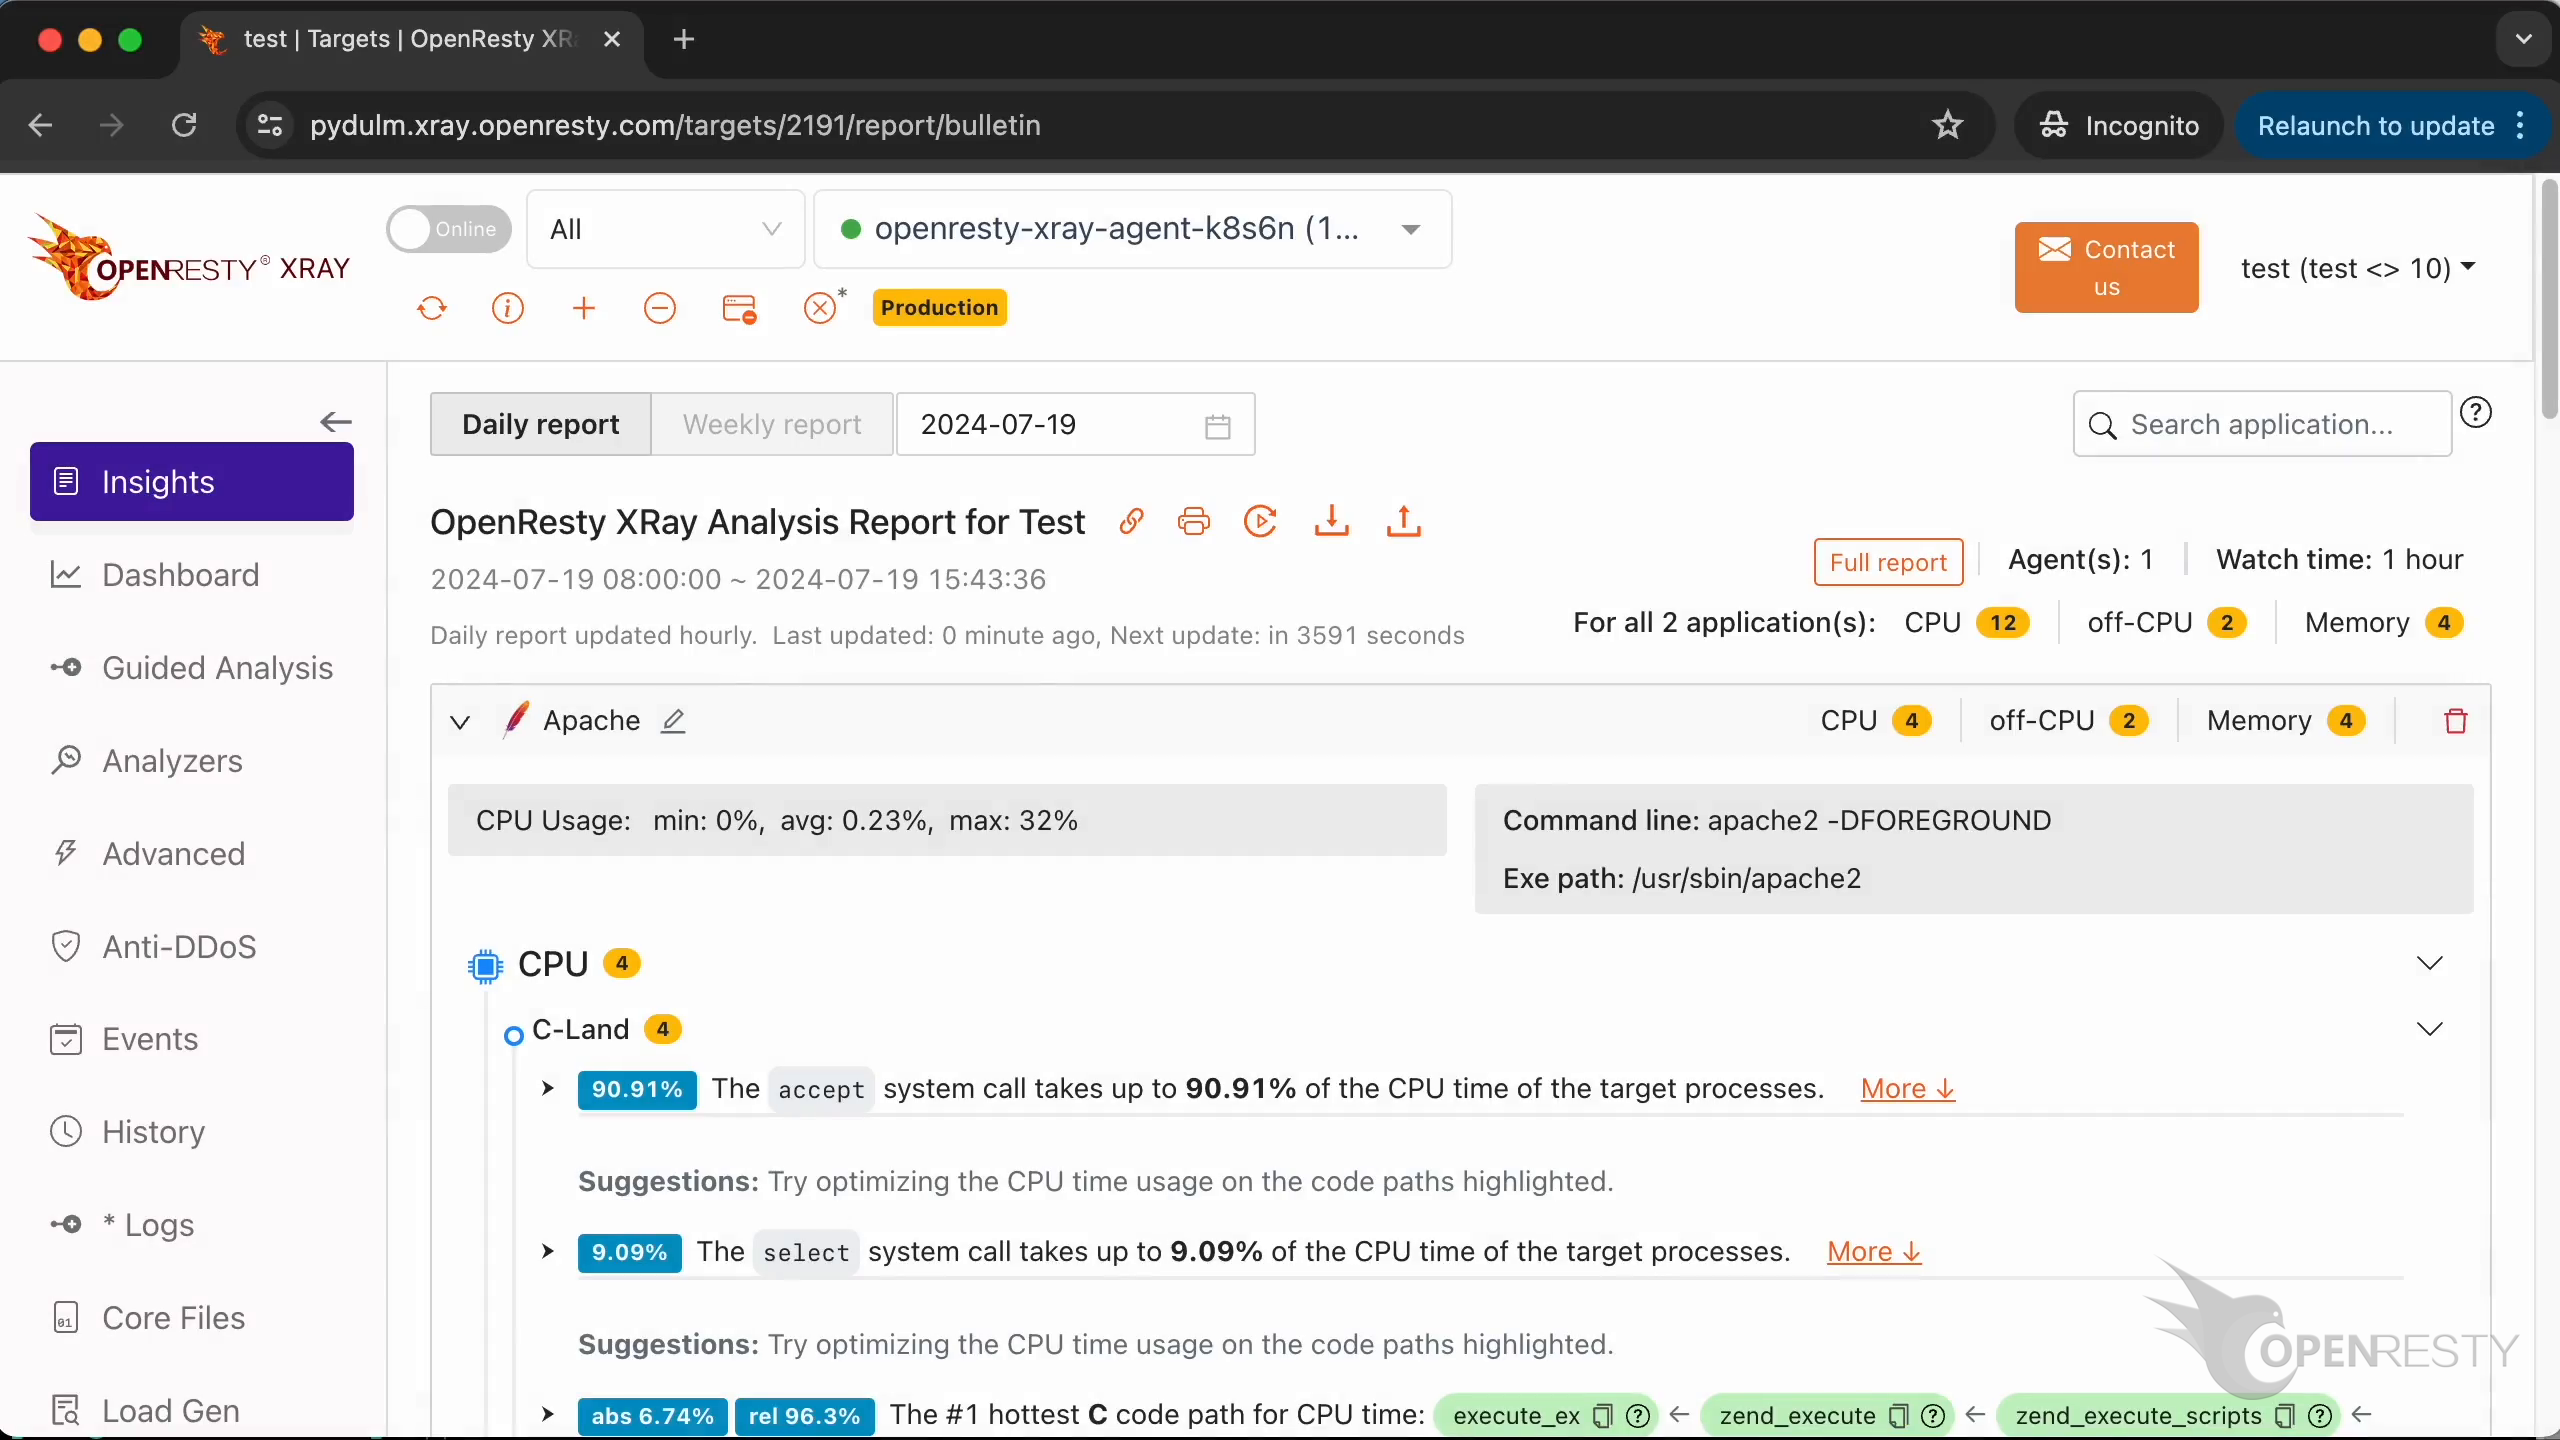
Daily and weekly reports will be automatically generated regularly in the future.
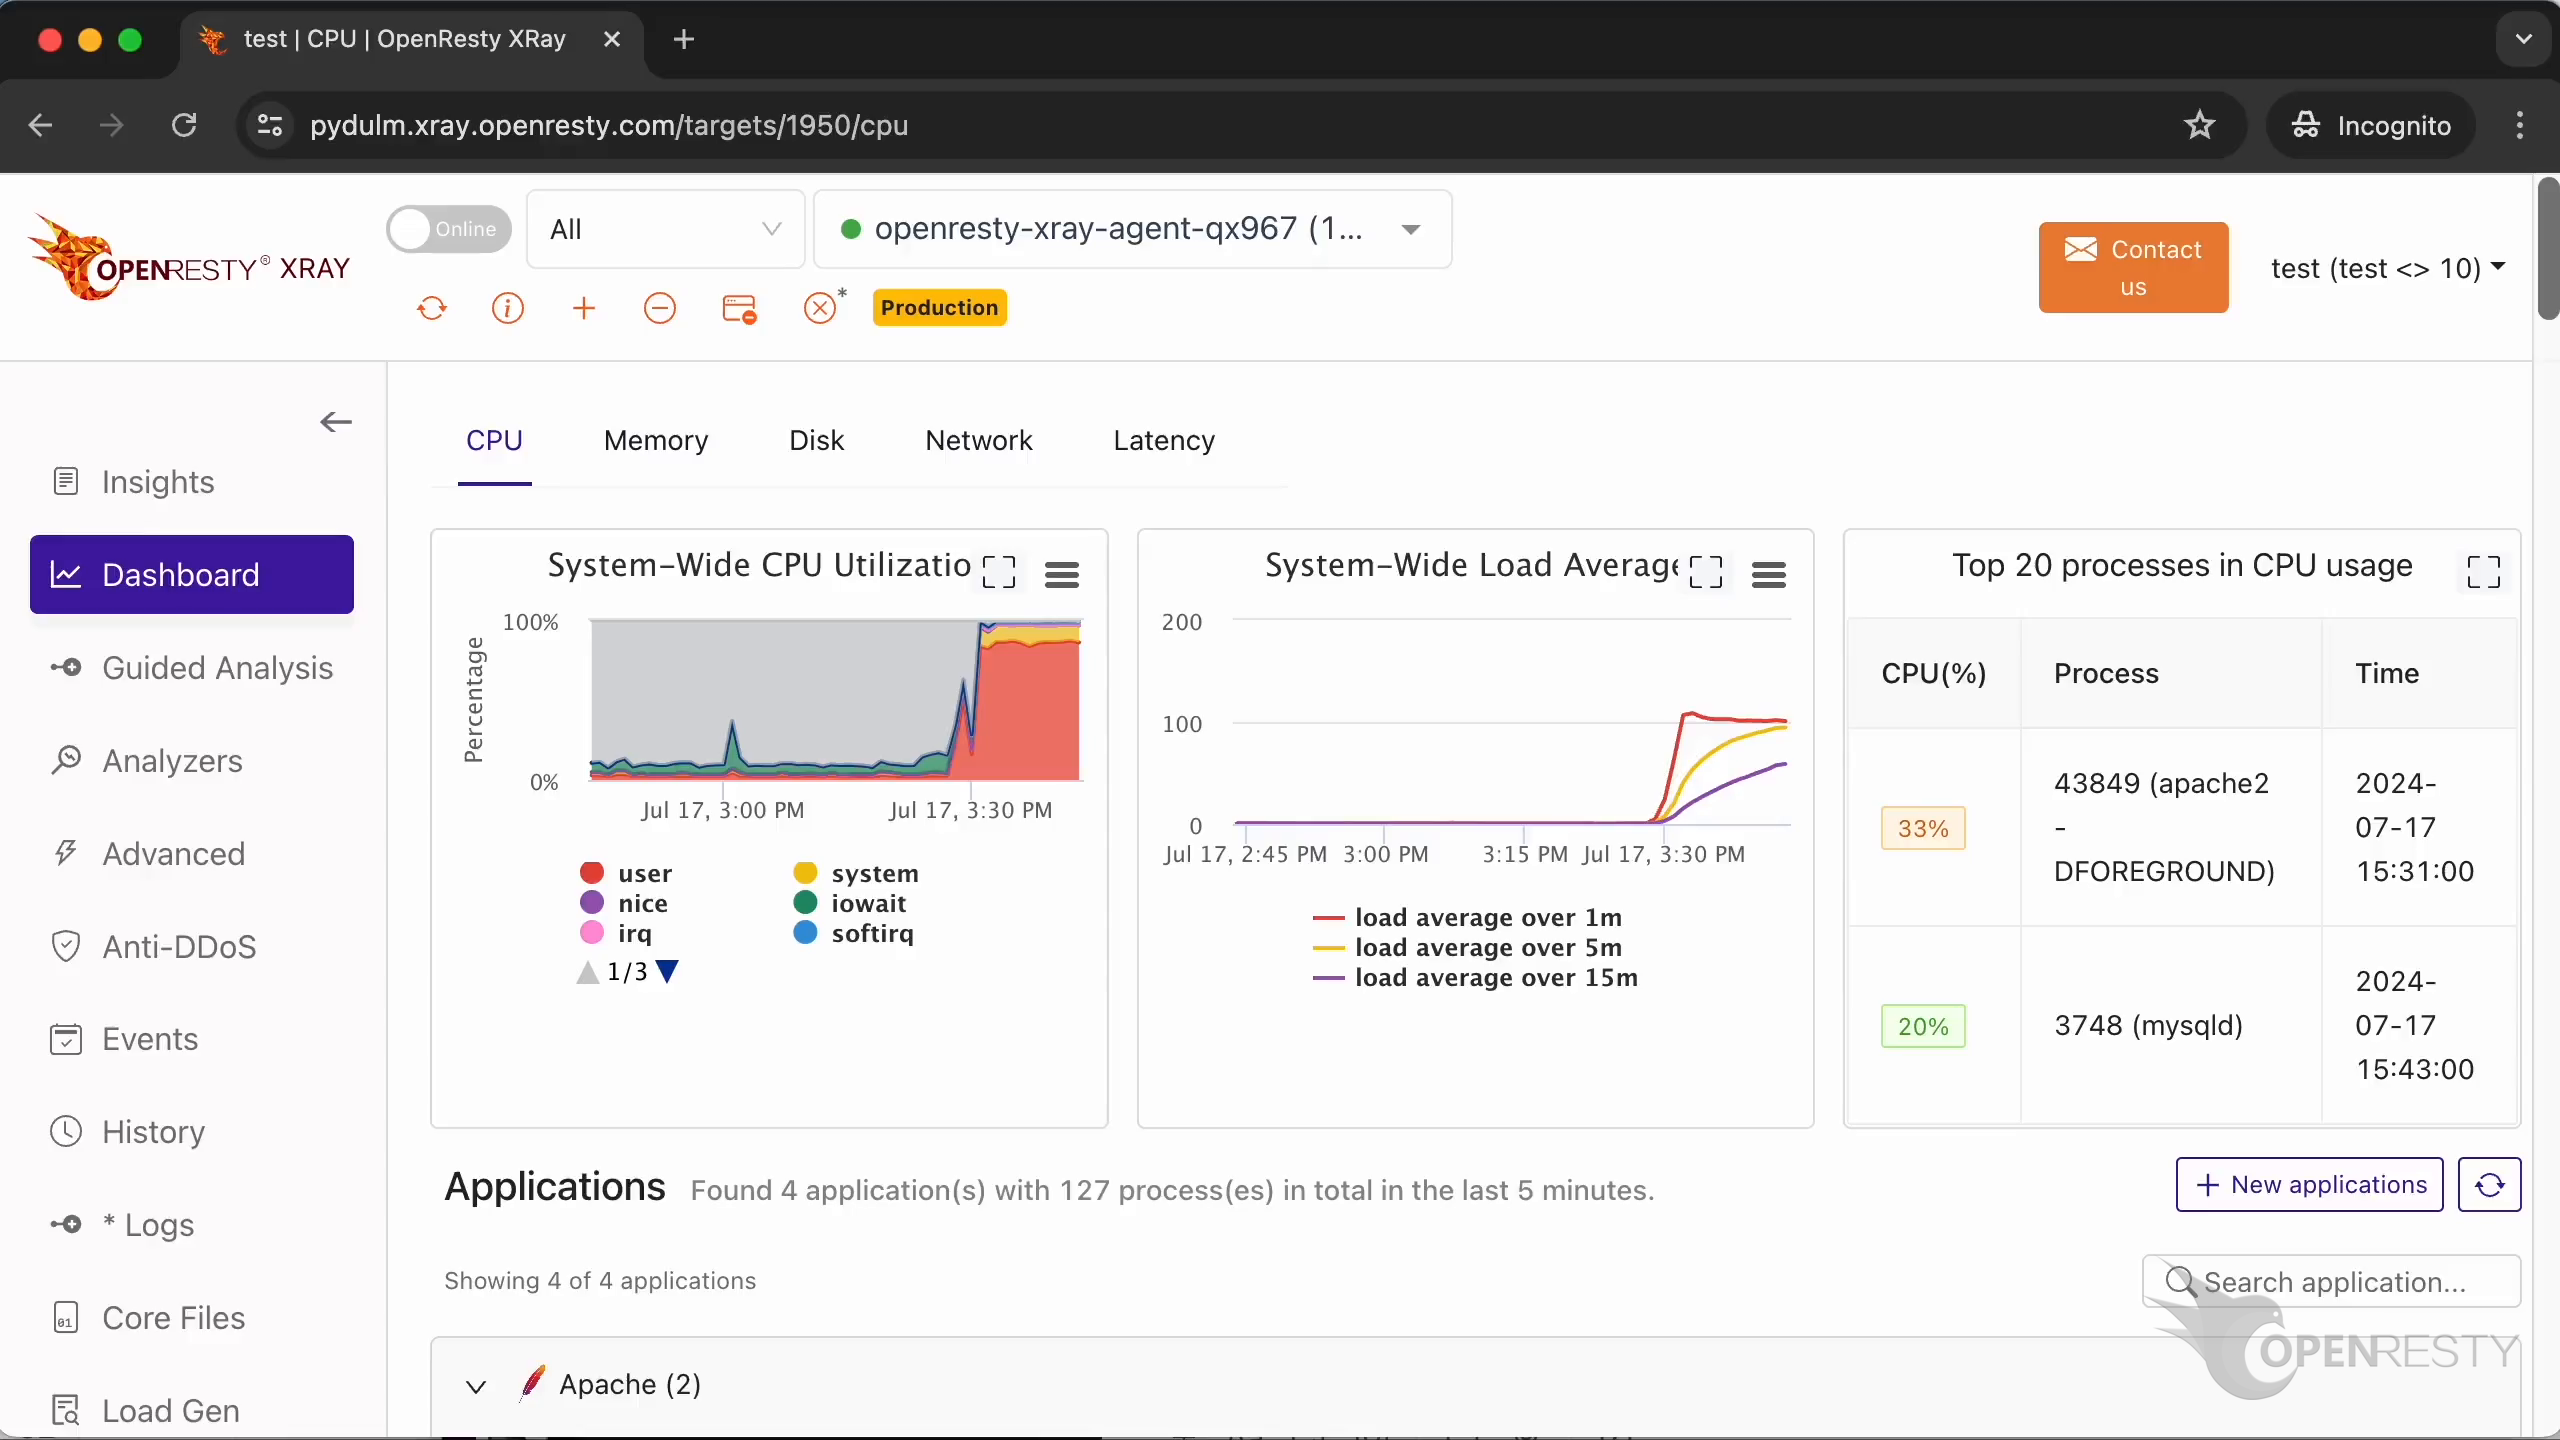
Go to the “Dashboard” page.
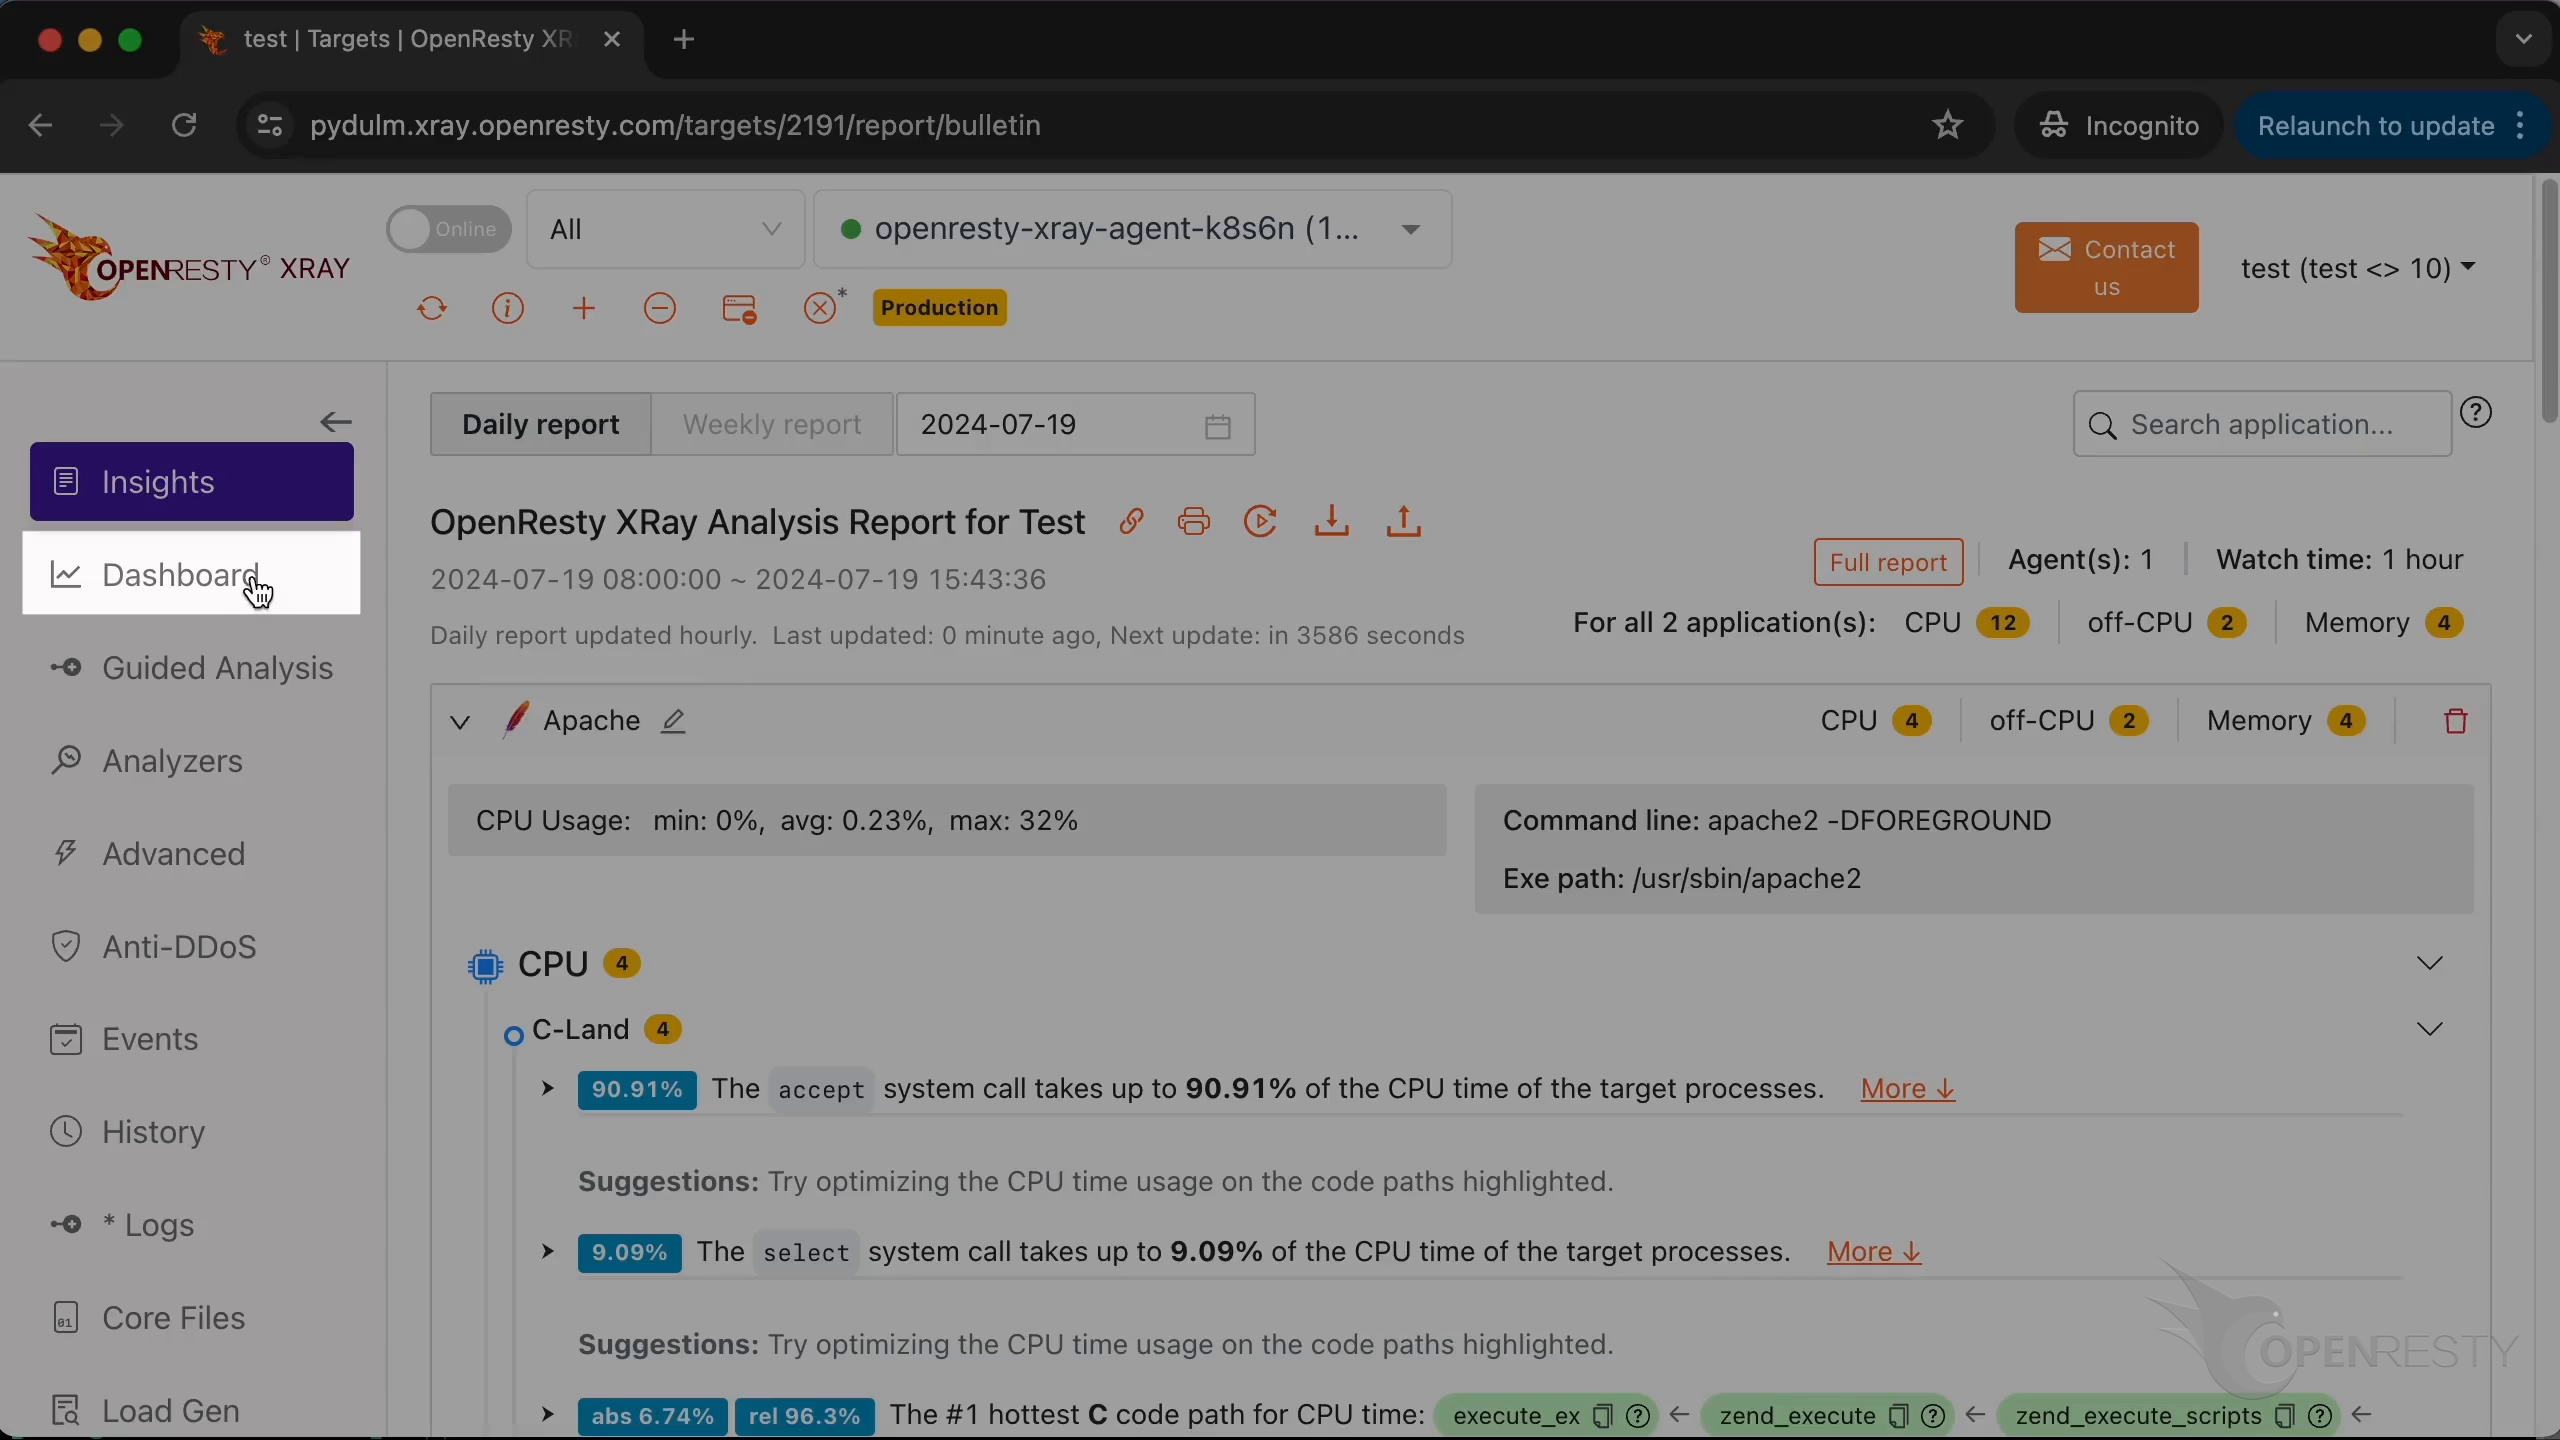
We can see flame diagrams and charts for various kinds of applications. Such as Apache and OpenResty applications.
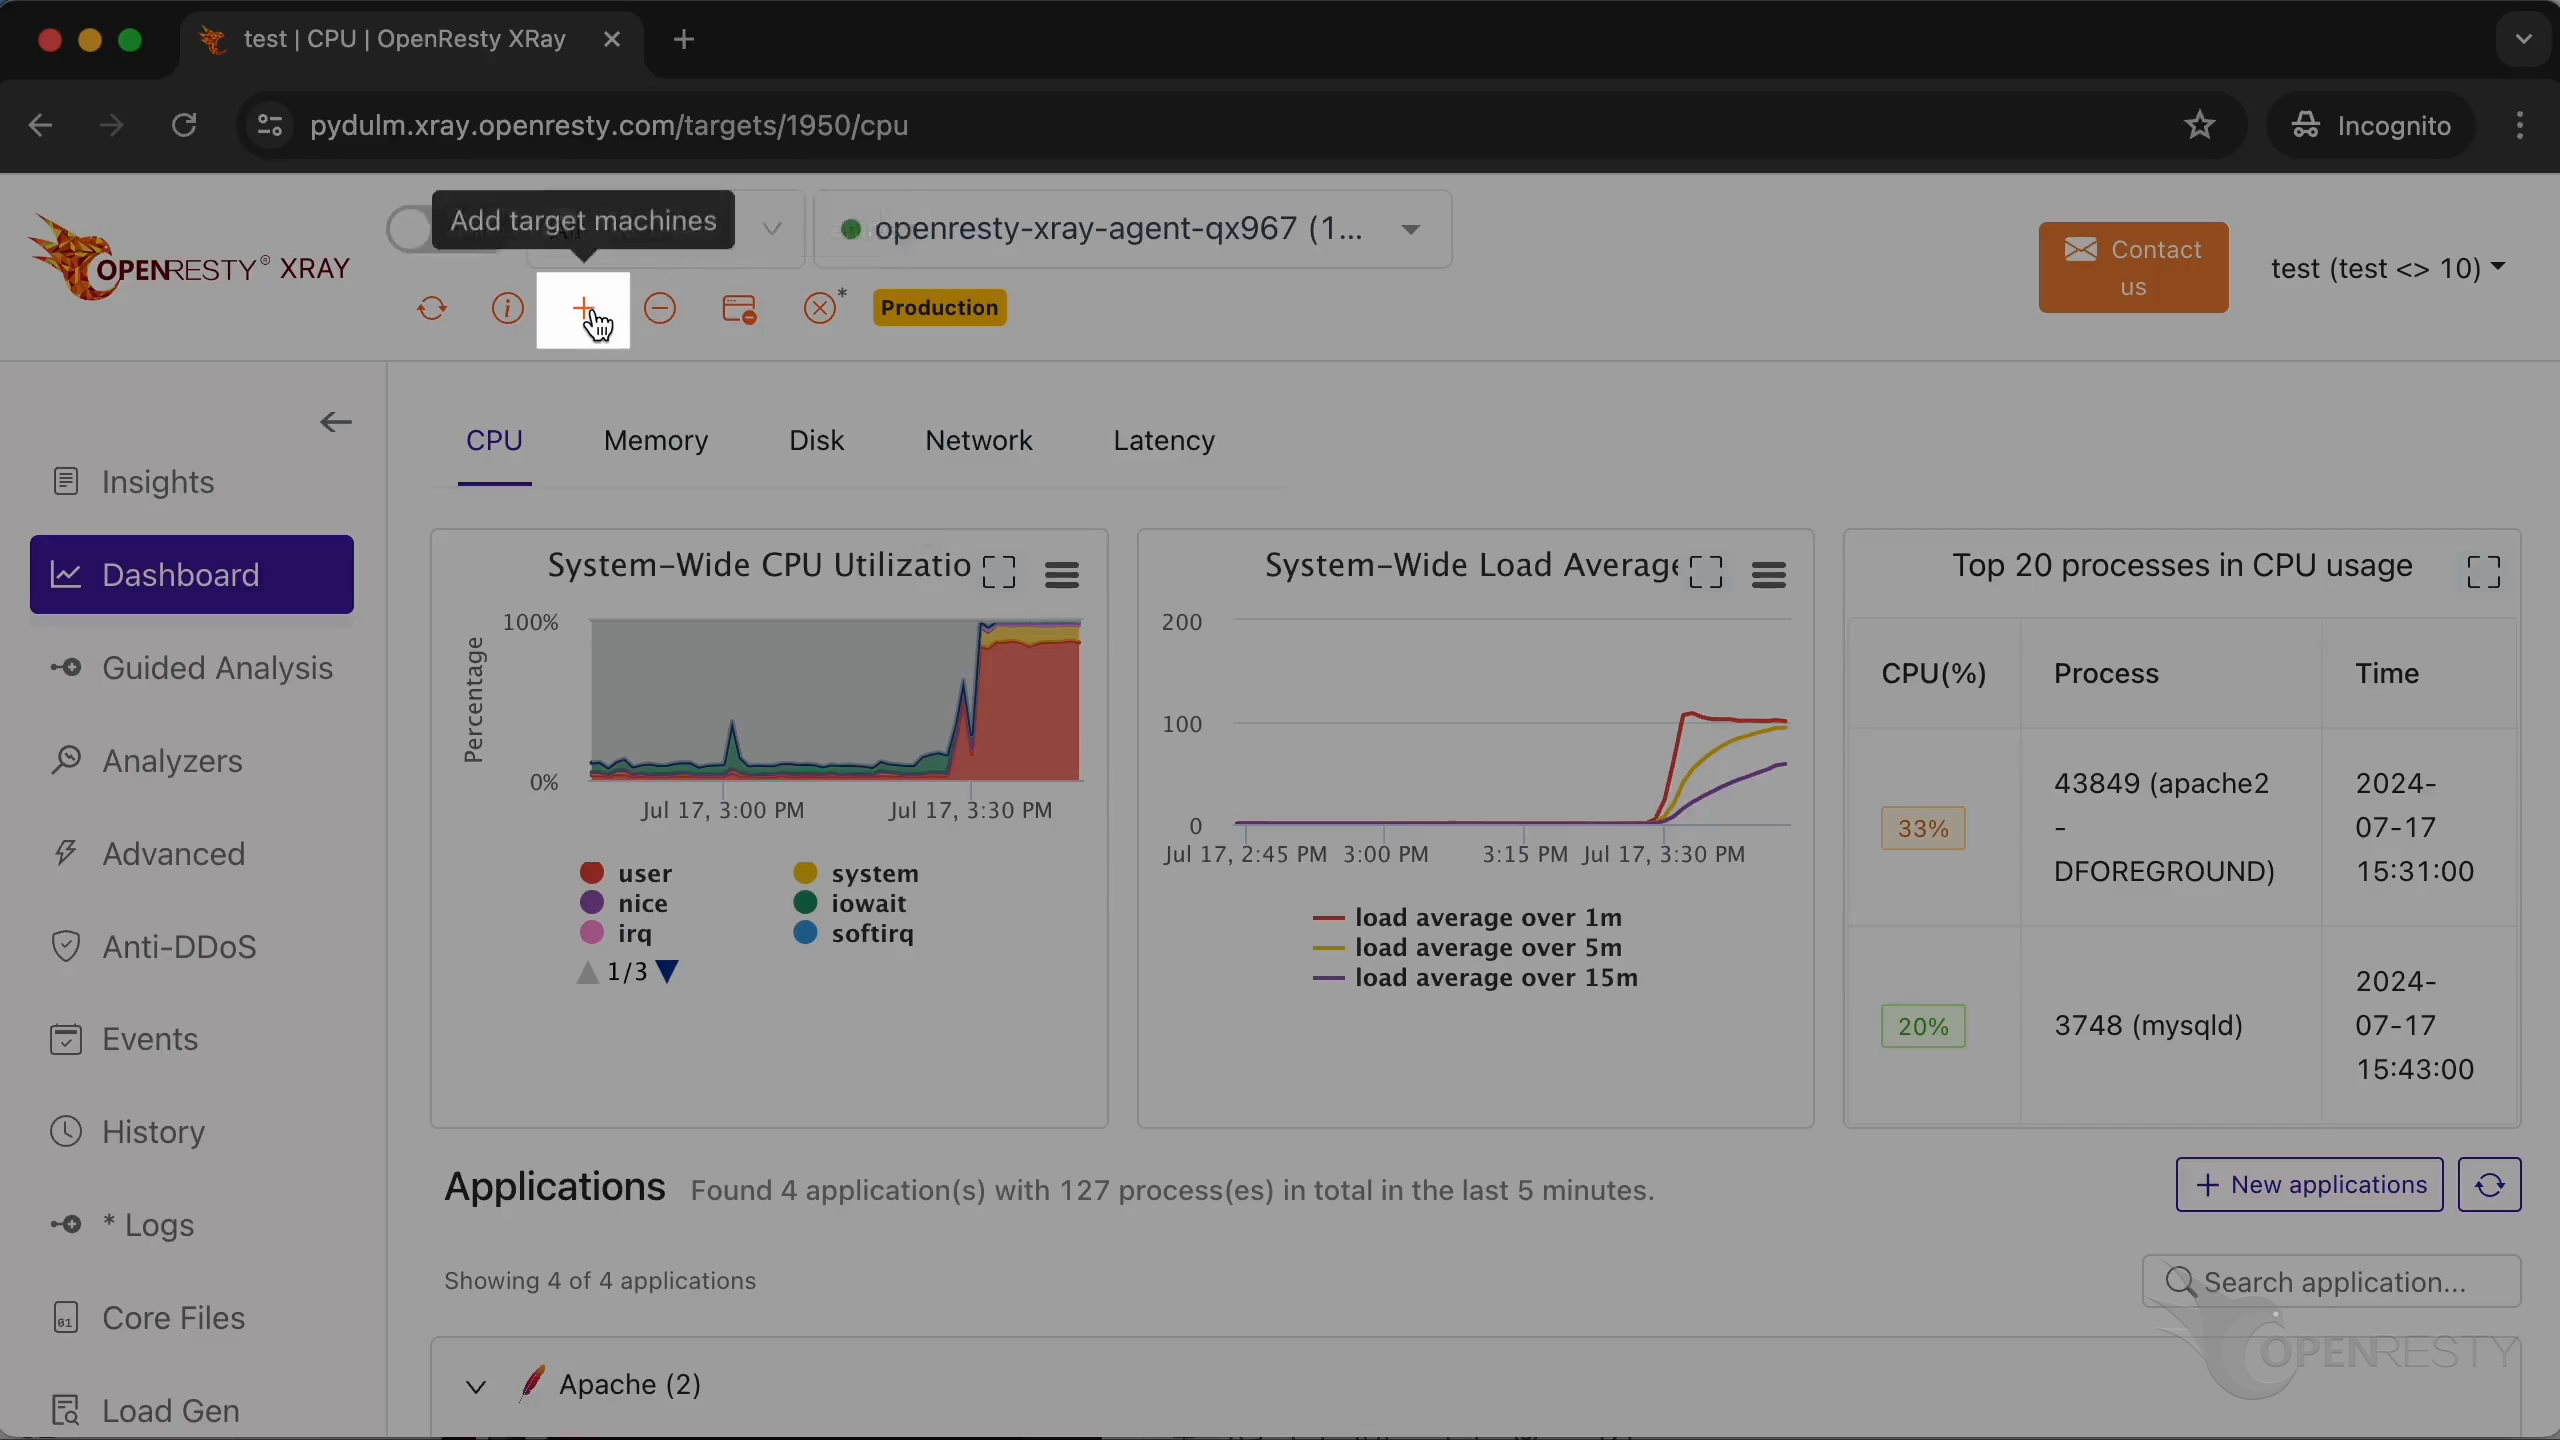
Install Another Agent
To install another Agent, just click here.
It’s still the same step as we did earlier, to install the Agent on a Kubernetes cluster.
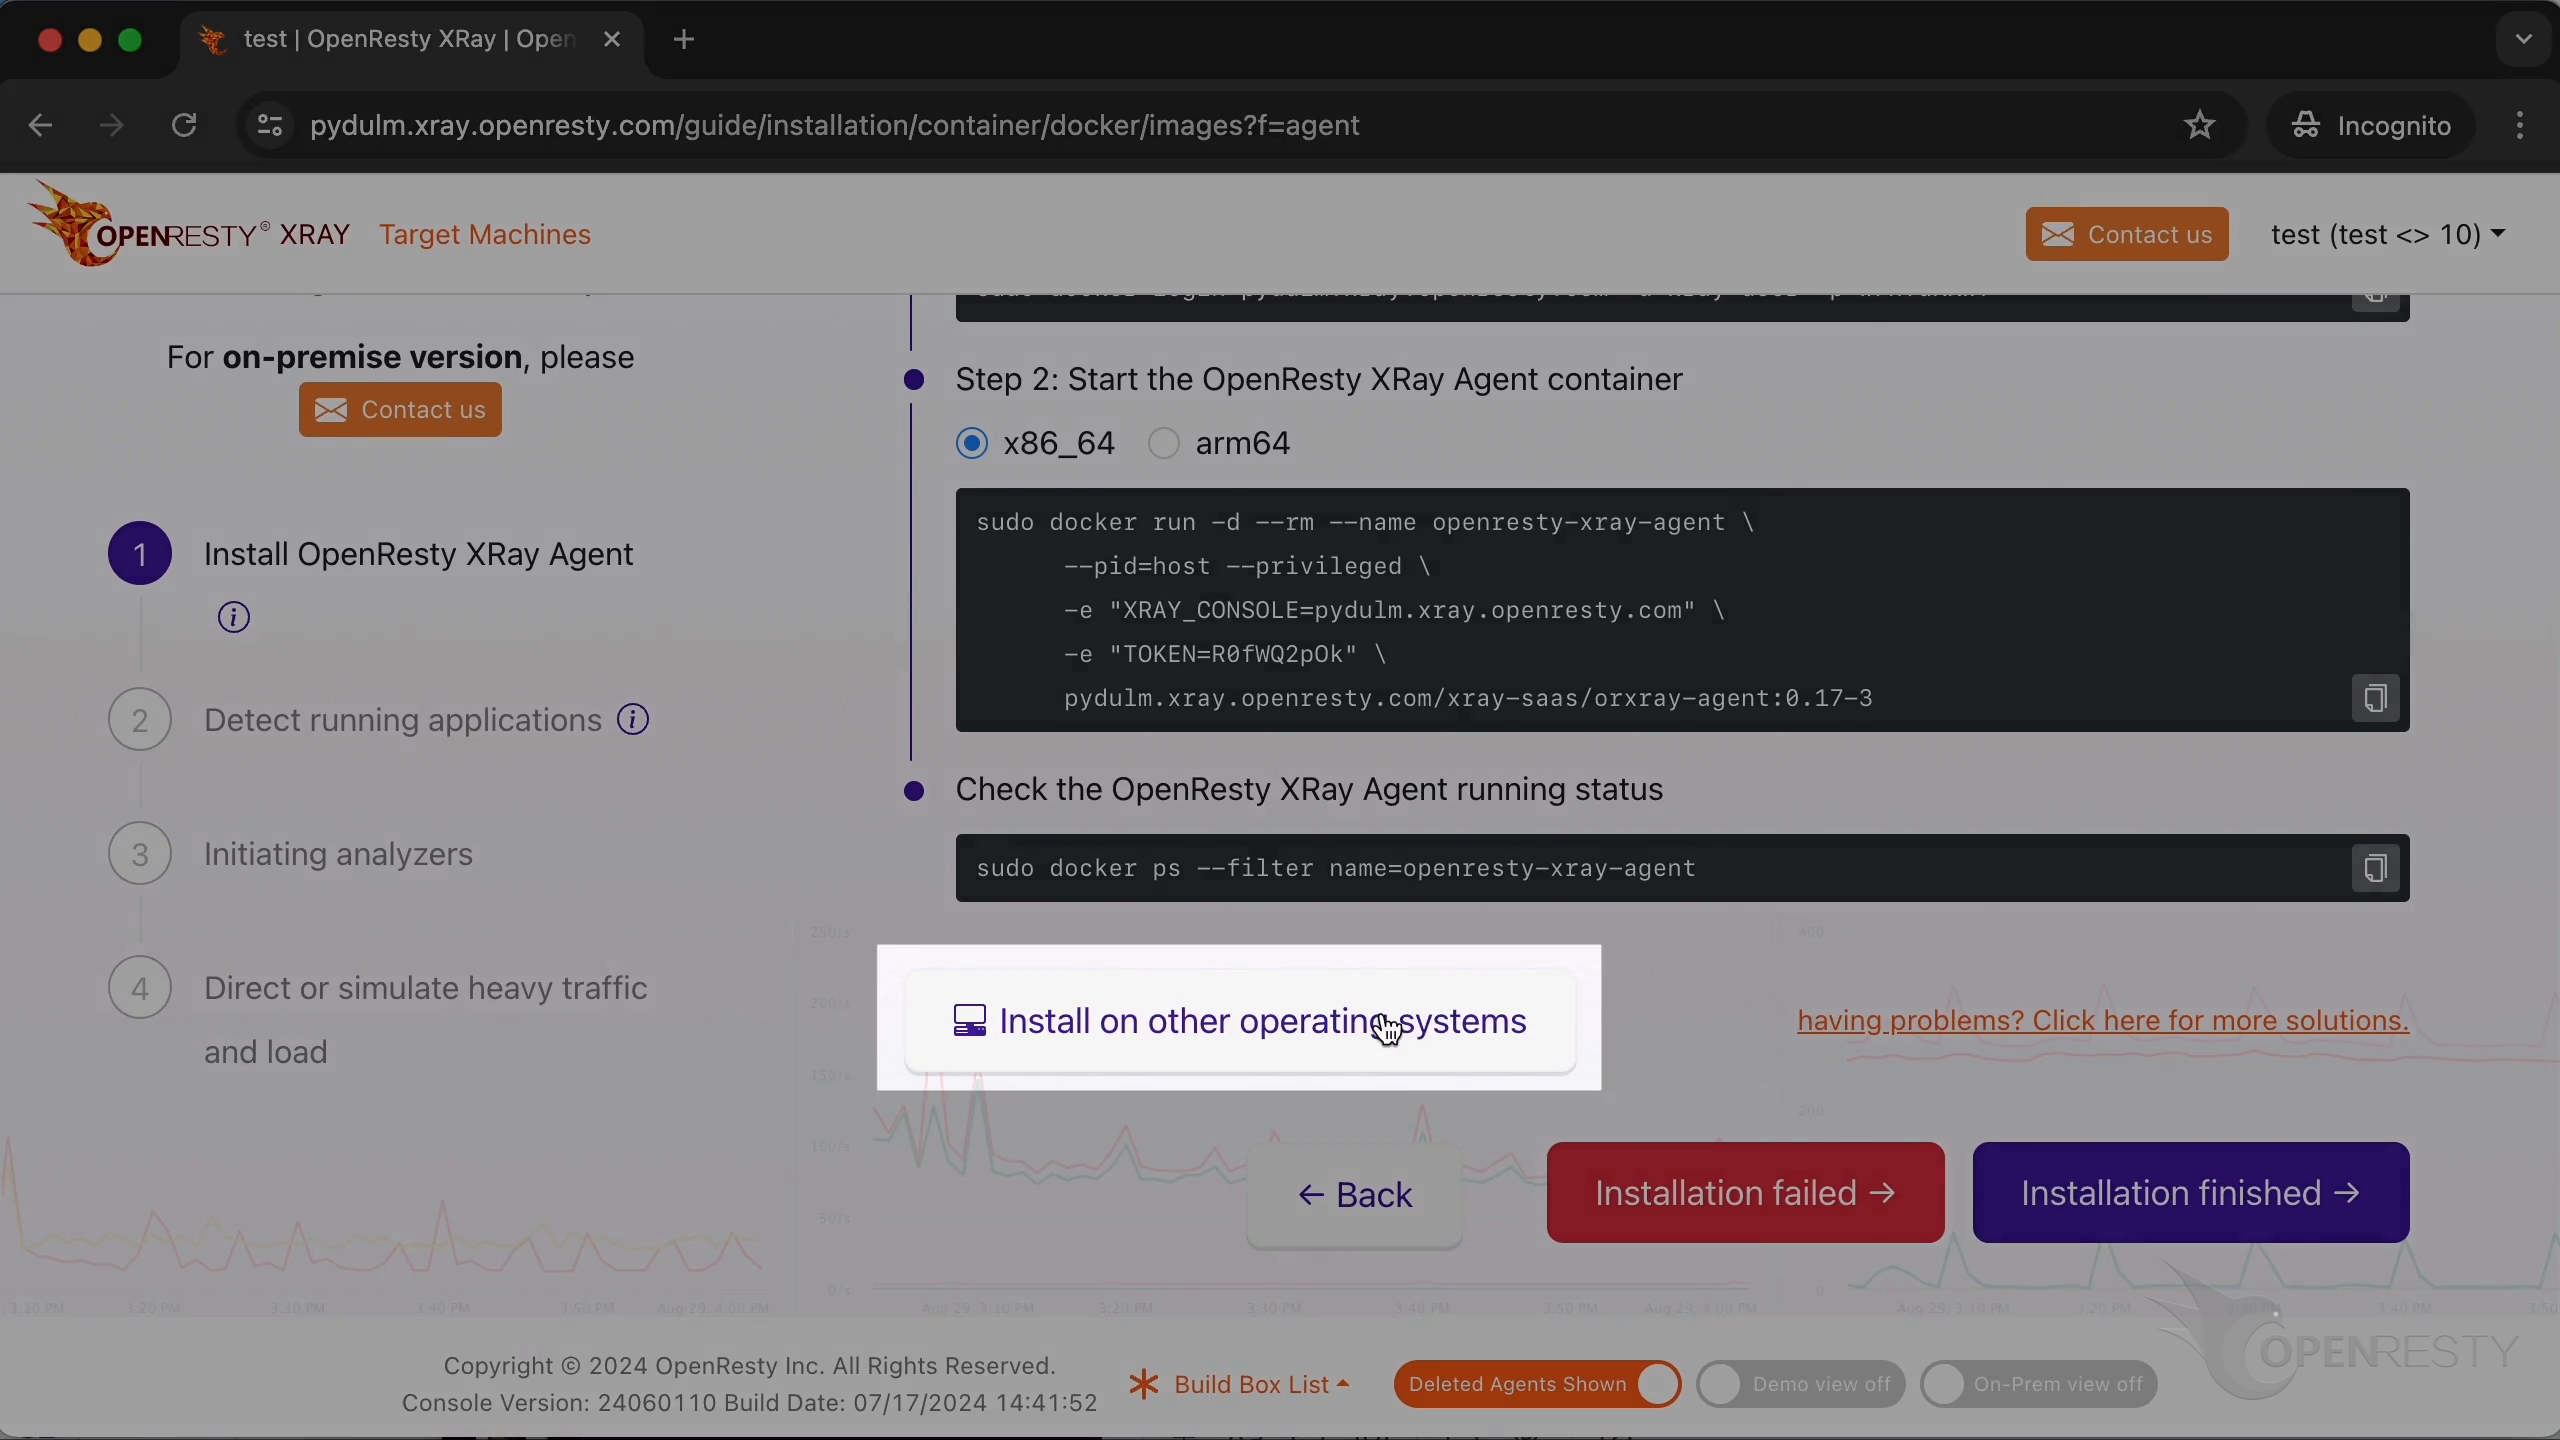
To install it on other operating systems or use installation methods like RPM packages. Just click here.
We’re back to the wizard page we saw previously. Here, we can choose different installation options or operating systems.
What is OpenResty XRay
OpenResty XRay is a dynamic-tracing product that automatically analyzes your running applications to troubleshoot performance problems, behavioral issues, and security vulnerabilities with actionable suggestions. Under the hood, OpenResty XRay is powered by our Y language targeting various runtimes like Stap+, eBPF+, GDB, and ODB, depending on the contexts.
If you like this tutorial, please subscribe to this blog site and/or our YouTube channel. Thank you!
About The Author
Yichun Zhang (Github handle: agentzh), is the original creator of the OpenResty® open-source project and the CEO of OpenResty Inc..
Yichun is one of the earliest advocates and leaders of “open-source technology”. He worked at many internationally renowned tech companies, such as Cloudflare, Yahoo!. He is a pioneer of “edge computing”, “dynamic tracing” and “machine coding”, with over 22 years of programming and 16 years of open source experience. Yichun is well-known in the open-source space as the project leader of OpenResty®, adopted by more than 40 million global website domains.
OpenResty Inc., the enterprise software start-up founded by Yichun in 2017, has customers from some of the biggest companies in the world. Its flagship product, OpenResty XRay, is a non-invasive profiling and troubleshooting tool that significantly enhances and utilizes dynamic tracing technology. And its OpenResty Edge product is a powerful distributed traffic management and private CDN software product.
As an avid open-source contributor, Yichun has contributed more than a million lines of code to numerous open-source projects, including Linux kernel, Nginx, LuaJIT, GDB, SystemTap, LLVM, Perl, etc. He has also authored more than 60 open-source software libraries.
Related Articles
OpenResty XRay Mar 11, 2024

OpenResty XRay Dec 5, 2023

OpenResty XRay Oct 8, 2023

OpenResty XRay Sep 5, 2024

OpenResty XRay Aug 12, 2024
")


")