← Back
Performance

Flame Graphs: How to Read a CPU Flame Graph and Find the Code Burning Your CPU

  • What is a flame graph: definition, axes, and the four rules
  • How to read a flame graph: plateaus, towers, hair, and self vs total
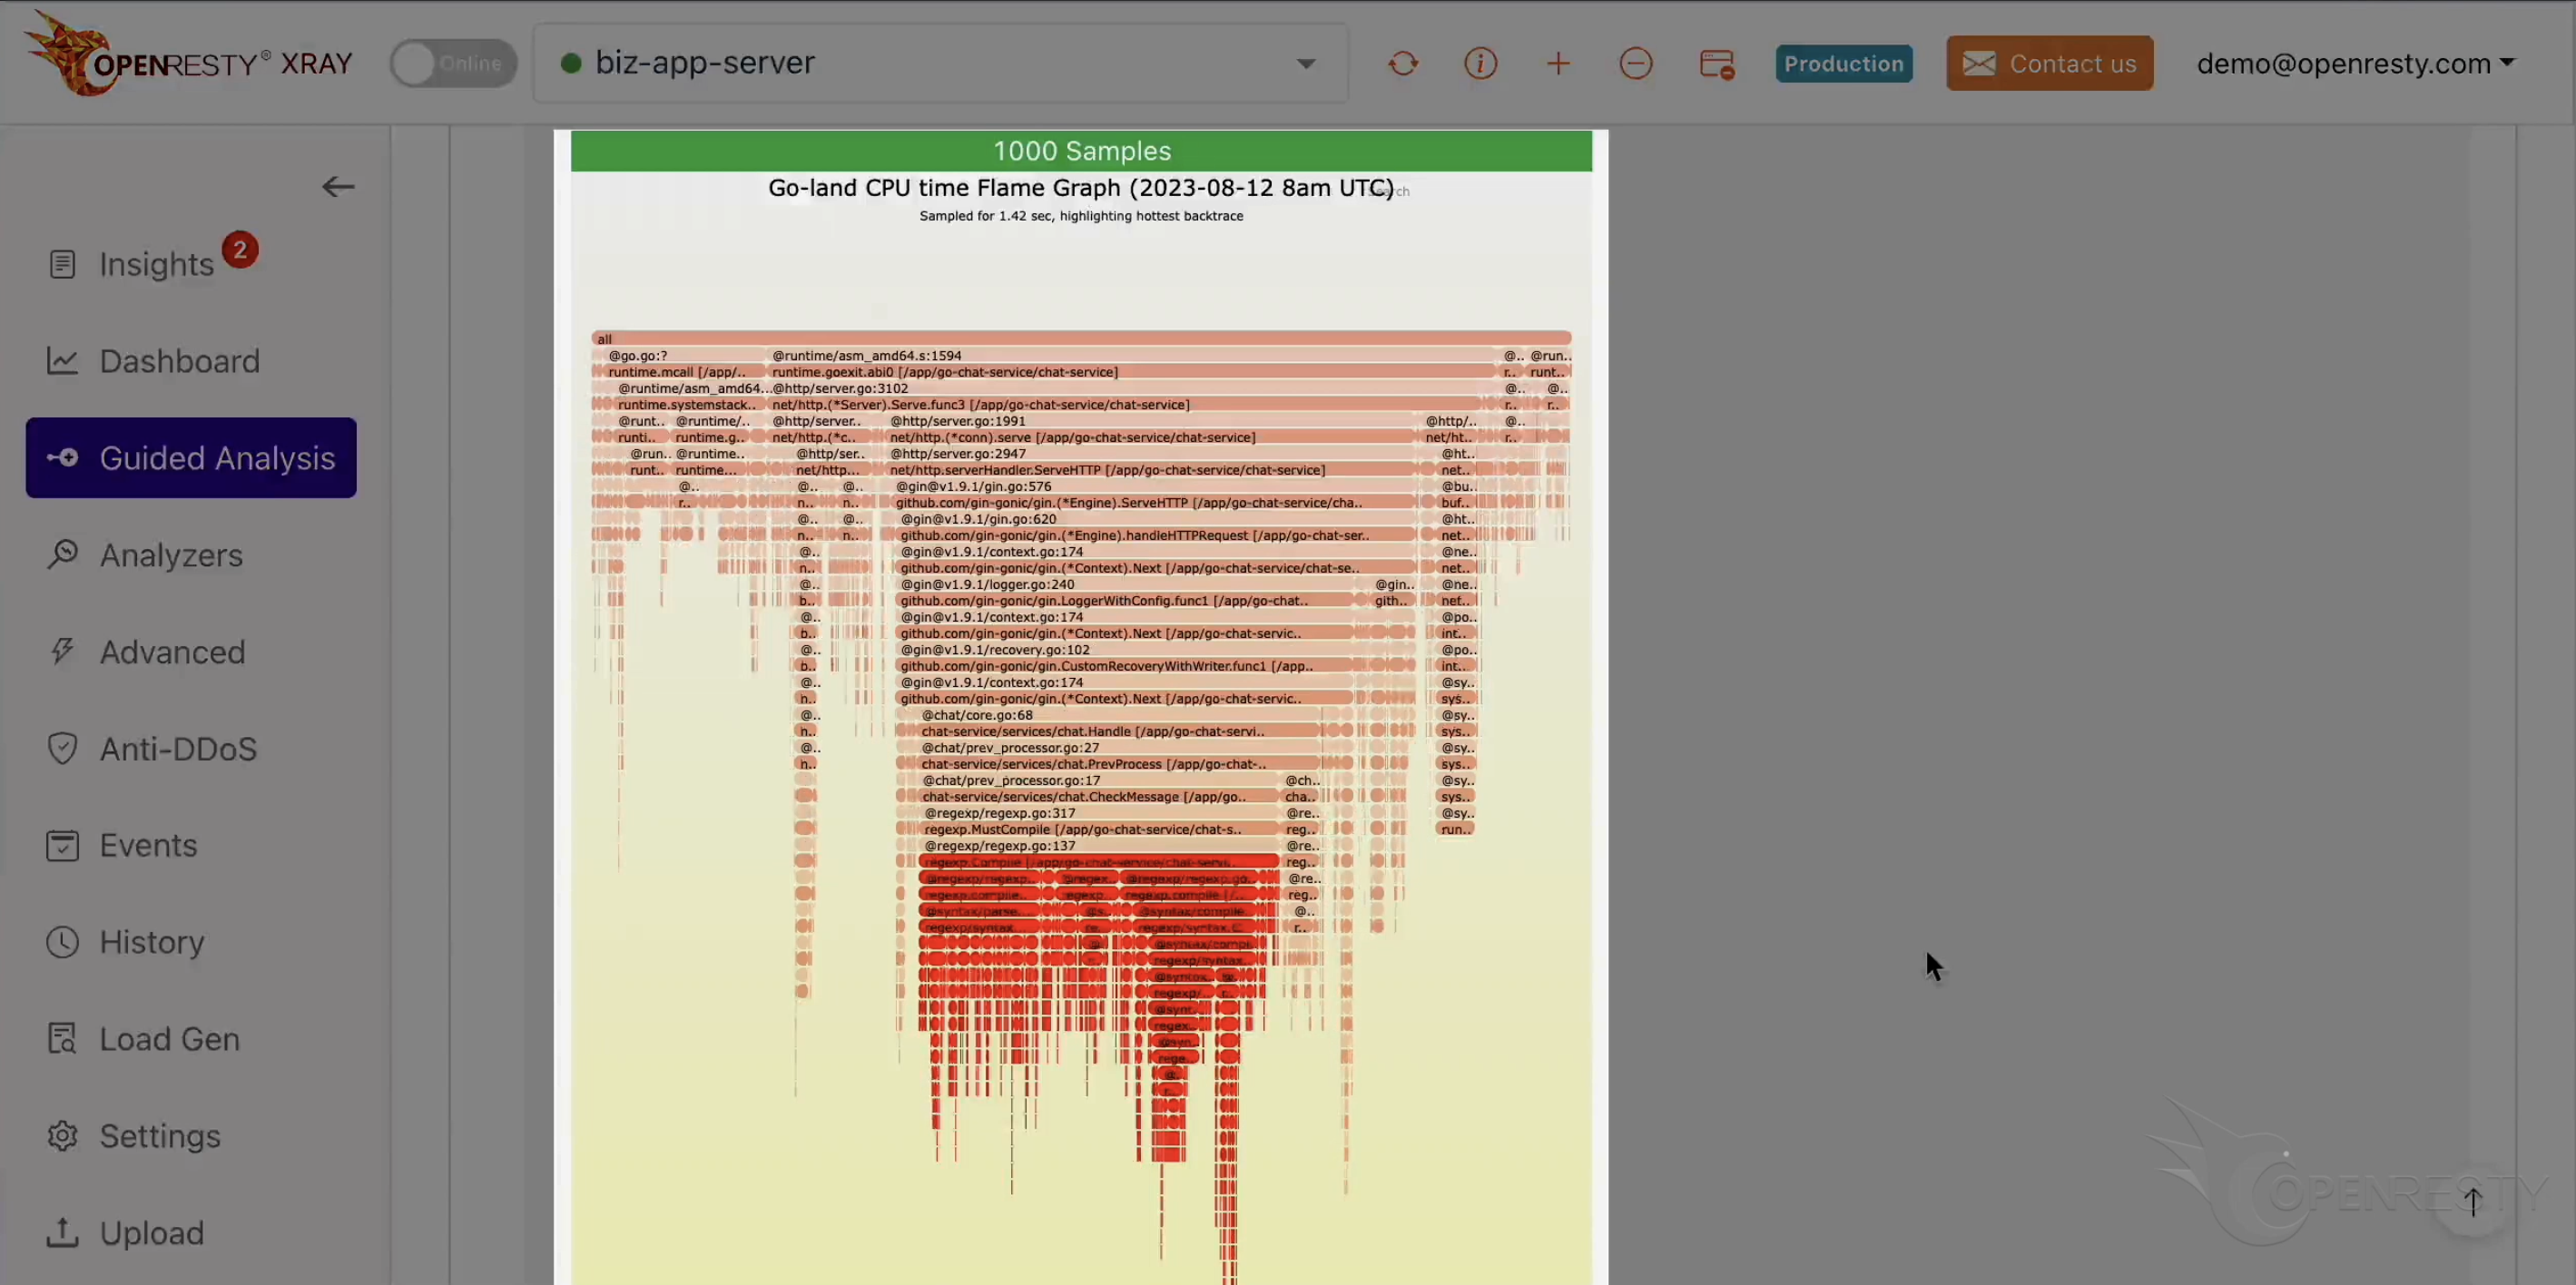
  • Three real production flame graphs: PHP preg_match, Go regexp.MustCompile, Erlang erts_pcre_exec
  • From 100% CPU to the culprit line: a four-step workflow with a per-stack routing table
  • How to get a flame graph for your stack
  • Icicle graphs, flame charts, and other variants
  • Can AI read flame graphs for you?
  • What is a flame graph: definition, axes, and the four rules
  • How to read a flame graph: plateaus, towers, hair, and self vs total
  • Three real production flame graphs: PHP preg_match, Go regexp.MustCompile, Erlang erts_pcre_exec
  • From 100% CPU to the culprit line: a four-step workflow with a per-stack routing table
  • How to get a flame graph for your stack
  • Icicle graphs, flame charts, and other variants
  • Can AI read flame graphs for you?

P99 Latency: Why Averages Lie, and How to Diagnose the Slowest 1%

  • What is P99 latency?
  • P50 vs P95 vs P99: what each percentile tells you
  • Why average latency lies
  • Why is P99 latency high? A root-cause spectrum
  • How to diagnose high P99 latency
  • How to reduce P99 latency: fix what you found
  • Summary
  • Frequently Asked Questions
  • What is P99 latency?
  • P50 vs P95 vs P99: what each percentile tells you
  • Why average latency lies
  • Why is P99 latency high? A root-cause spectrum
  • How to diagnose high P99 latency
  • How to reduce P99 latency: fix what you found
  • Summary
  • Frequently Asked Questions

P99 Latency in a D Service Cut 73%: Conservative GC Meets an O(n) Query Under Load

  • Analyzing GC Traps and Business Hotspots in the Flame Graph
  • Optimization Roadmap: Why Sequence Is More Important Than Action
  • Conclusion: From Code Logic to Runtime Reality
  • Analyzing GC Traps and Business Hotspots in the Flame Graph
  • Optimization Roadmap: Why Sequence Is More Important Than Action
  • Conclusion: From Code Logic to Runtime Reality

Java Tomcat Slow Response Time: Pinpoint the Exact Slow Request with PCAP

  • Diagnose Tomcat slow response time by catching the exact slow request
  • Selective packet capture: filter by duration, status, and path
  • Per-request PCAP download for one specific slow request
  • Tell server-side latency from network delay
  • Works for Spring Boot apps with embedded Tomcat
Photo by Yichun Zhang
  • Diagnose Tomcat slow response time by catching the exact slow request
  • Selective packet capture: filter by duration, status, and path
  • Per-request PCAP download for one specific slow request
  • Tell server-side latency from network delay
  • Works for Spring Boot apps with embedded Tomcat
Contact us

Love to hear from you, Get in touch 👋

Message was sent successfully!

Our Team will get back to you within 24 hours.
x