← Back
dynamic-tracing

Use C++ to Dynamic-Trace C++ Applications

  • Setting Up the Target C++ Program
  • Crafting the C++ (or Y++) Analyzer
  • Operationalizing the Target and Analyzer
  • Advancing Support for Complex C++ Applications
  • About the Debug Symbols
Photo by Yichun Zhang
  • Setting Up the Target C++ Program
  • Crafting the C++ (or Y++) Analyzer
  • Operationalizing the Target and Analyzer
  • Advancing Support for Complex C++ Applications
  • About the Debug Symbols

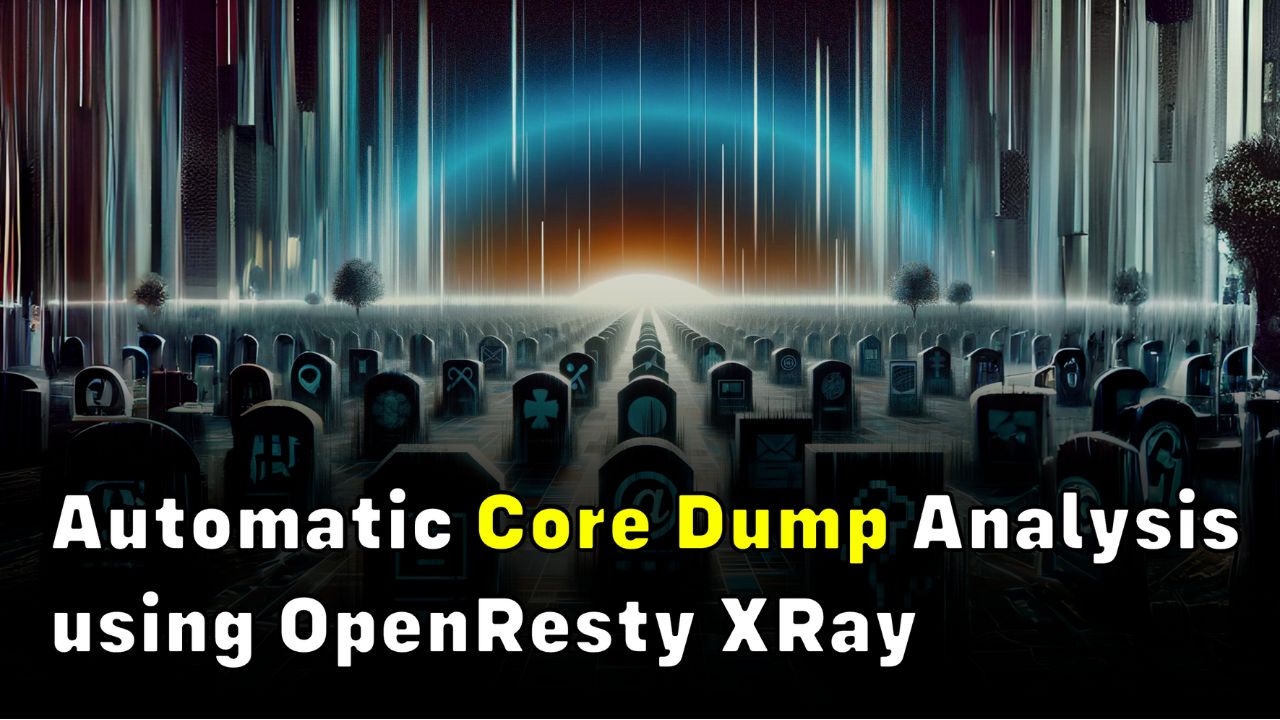
Automatic Core Dump Analysis (using OpenResty XRay)

  • Check the core dump file
  • Use the guided analysis feature of OpenResty XRay to analyze the core file
  • Automatic analysis and reports
  • What is OpenResty XRay
  • Check the core dump file
  • Use the guided analysis feature of OpenResty XRay to analyze the core file
  • Automatic analysis and reports
  • What is OpenResty XRay

Two bugs in Linux kernels' tracing subsystem (found by OpenResty XRay)

  • Kernel deadlocks in user-space memory reading
  • Data races in x86 breakpoint insertion of the kernel
  • What is OpenResty XRay
Photo by Yichun Zhang
  • Kernel deadlocks in user-space memory reading
  • Data races in x86 breakpoint insertion of the kernel
  • What is OpenResty XRay

The Wonderland of Dynamic Tracing (Part 1 of 3)

  • Dynamic Tracing
  • What It Is
  • Too Good to be True?
  • How it Works
  • Still Having Doubts?
  • The Advantages of Dynamic Tracing
  • DTrace
  • SystemTap
  • DTrace and SystemTap
  • Applications of SystemTap in Production
Photo by Philip Brown
  • Dynamic Tracing
  • What It Is
  • Too Good to be True?
  • How it Works
  • Still Having Doubts?
  • The Advantages of Dynamic Tracing
  • DTrace
  • SystemTap
  • DTrace and SystemTap
  • Applications of SystemTap in Production

The Wonderland of Dynamic Tracing (Part 2 of 3)

  • Flame Graphs
  • Methodology
  • Knowledge Is Power
  • Open-Source and Debug Symbols
  • Flame Graphs
  • Methodology
  • Knowledge Is Power
  • Open-Source and Debug Symbols

The Wonderland of Dynamic Tracing (Part 3 of 3)

  • Dynamic Tracing Support in Linux Kernels
  • Hardware Tracing
  • Analyze Remains of Dead Process
  • Traditional Debugging Technologies
  • A Messy World of Debugging
  • OpenResty XRay
Photo by L N
  • Dynamic Tracing Support in Linux Kernels
  • Hardware Tracing
  • Analyze Remains of Dead Process
  • Traditional Debugging Technologies
  • A Messy World of Debugging
  • OpenResty XRay

Resolving Bilibili’s major site incident with OpenResty XRay

  • The incident
  • Process of resolution
  • Hardening after the incident
  • OpenResty XRay Services
Photo by Yichun Zhang
  • The incident
  • Process of resolution
  • Hardening after the incident
  • OpenResty XRay Services

Tracing the Slowest PCRE Regular Expressions in OpenResty or Nginx Processes

  • System Environment
  • Narrowing Down the Culprit without Guessing
  • Limiting the execution overhead of PCRE
  • Non-Backtracking Regular Expression Engines
  • Lua’s Builtin Patterns
  • Tracing Applications inside Containers
  • How The Tools are Implemented
  • The Overhead of the Tools
  • System Environment
  • Narrowing Down the Culprit without Guessing
  • Limiting the execution overhead of PCRE
  • Non-Backtracking Regular Expression Engines
  • Lua’s Builtin Patterns
  • Tracing Applications inside Containers
  • How The Tools are Implemented
  • The Overhead of the Tools

Listing Loaded Lua Modules in OpenResty or Nginx Processes

  • System Environment
  • Names of Loaded Lua Modules
  • Running Directly in the Web Console
  • Tracing Applications inside Containers
  • How The Tools are Implemented
  • The Overhead of the Tools
Photo by Yichun Zhang
  • System Environment
  • Names of Loaded Lua Modules
  • Running Directly in the Web Console
  • Tracing Applications inside Containers
  • How The Tools are Implemented
  • The Overhead of the Tools

Ylang: Universal Language for eBPF, Stap+, GDB, and More (Part 4 of 4)

  • Transparent Container Tracing
  • Efficient Stack Unwinding
  • Analyzing Dead Processes (Core Dumps)
  • Very Low Tracing Overhead
  • Standard Ylang Libraries & Tools
  • Network Filtering & Control
  • The Ylang Compiler’s Implementation
  • Operating System Support
  • Contributions to Open-Source Communities
Photo by Yichun Zhang
  • Transparent Container Tracing
  • Efficient Stack Unwinding
  • Analyzing Dead Processes (Core Dumps)
  • Very Low Tracing Overhead
  • Standard Ylang Libraries & Tools
  • Network Filtering & Control
  • The Ylang Compiler’s Implementation
  • Operating System Support
  • Contributions to Open-Source Communities

Ylang: Universal Language for eBPF, Stap+, GDB, and More (Part 3 of 4)

  • The Language Syntax (Continued)
    • String Literals
    • Built-in Regex Support
    • Full Control-Flow Support
    • Floating-Point Number Support
    • Compared to Open-Source Toolchains
  • Transparent Debug Symbol Handling
    • Debug Symbols: No Runtime Overhead
    • Centralized Package Database
    • Fuzzy Matching Debug Symbols
Photo by Yichun Zhang
  • The Language Syntax (Continued)
    • String Literals
    • Built-in Regex Support
    • Full Control-Flow Support
    • Floating-Point Number Support
    • Compared to Open-Source Toolchains
  • Transparent Debug Symbol Handling
    • Debug Symbols: No Runtime Overhead
    • Centralized Package Database
    • Fuzzy Matching Debug Symbols

Ylang: Universal Language for eBPF, Stap+, GDB, and More (Part 2 of 4)

  • The Language Syntax (Continued)
    • Macros with Extensions
    • Tracer and Tracee Spaces
    • Probes
    • Extended Variable Types
Photo by Yichun Zhang
  • The Language Syntax (Continued)
    • Macros with Extensions
    • Tracer and Tracee Spaces
    • Probes
    • Extended Variable Types

Ylang: Universal Language for eBPF, Stap+, GDB, and More (Part 1 of 4)

  • What is Dynamic Tracing
  • Why the “Y” Name
  • Getting Started
  • Various Backends and Runtimes
  • Why a Unified Frontend Language
  • The Language Syntax
Photo by Yichun Zhang
  • What is Dynamic Tracing
  • Why the “Y” Name
  • Getting Started
  • Various Backends and Runtimes
  • Why a Unified Frontend Language
  • The Language Syntax

Introduction to Lua-Land CPU Flame Graphs

  • What is a Flame Graph
  • Simple Lua samples
  • Complicated Lua applications
  • Sampling overhead
  • Safety
  • Compatibility
  • Other types of Lua-land Flame Graphs
Photo by Guido Jansen
  • What is a Flame Graph
  • Simple Lua samples
  • Complicated Lua applications
  • Sampling overhead
  • Safety
  • Compatibility
  • Other types of Lua-land Flame Graphs

Memory Fragmentation in OpenResty and Nginx's Shared Memory Zones

  • An empty zone
  • Filling entries of similar sizes
  • Deleting odd-numbered keys
  • Deleting the keys in the first half
  • Mitigating Fragmentation
Photo by Elena Mozhvilo
  • An empty zone
  • Filling entries of similar sizes
  • Deleting odd-numbered keys
  • Deleting the keys in the first half
  • Mitigating Fragmentation

How OpenResty and Nginx Shared Memory Zones Consume RAM

  • Slabs and pages
  • What is allocated is not what is paid for
  • Fake Memory Leaks
  • HUP reload
Photo by Jose G. Ortega Castro
  • Slabs and pages
  • What is allocated is not what is paid for
  • Fake Memory Leaks
  • HUP reload

How OpenResty and Nginx Allocate and Manage Memory

  • On The System Level
  • On The Application Level
  • For Traditional Nginx Servers
Photo by Harrison Broadbent
  • On The System Level
  • On The Application Level
  • For Traditional Nginx Servers
Contact us

Love to hear from you, Get in touch 👋

Message was sent successfully!

Our Team will get back to you within 24 hours.
x