Rust CPU Profiling: Find the Hottest Code Paths in Sled with OpenResty XRay
Our in-house cache service built on Sled, an embedded key-value database written in Rust, was consuming more than 100% CPU. Rust CPU profiling with OpenResty XRay traced the load to two hot code paths — sled::tree::Tree::insert and get_inner (almost 40% of the CPU time) — down to the exact source line, without changing any code or recompiling.
In this tutorial, we walk through the whole analysis step by step. The hot code paths shown below were obtained by OpenResty XRay automatically analyzing and interpreting Rust language-level CPU flame graphs.
The Problem: A Sled-Based Cache Service Using Over 100% CPU
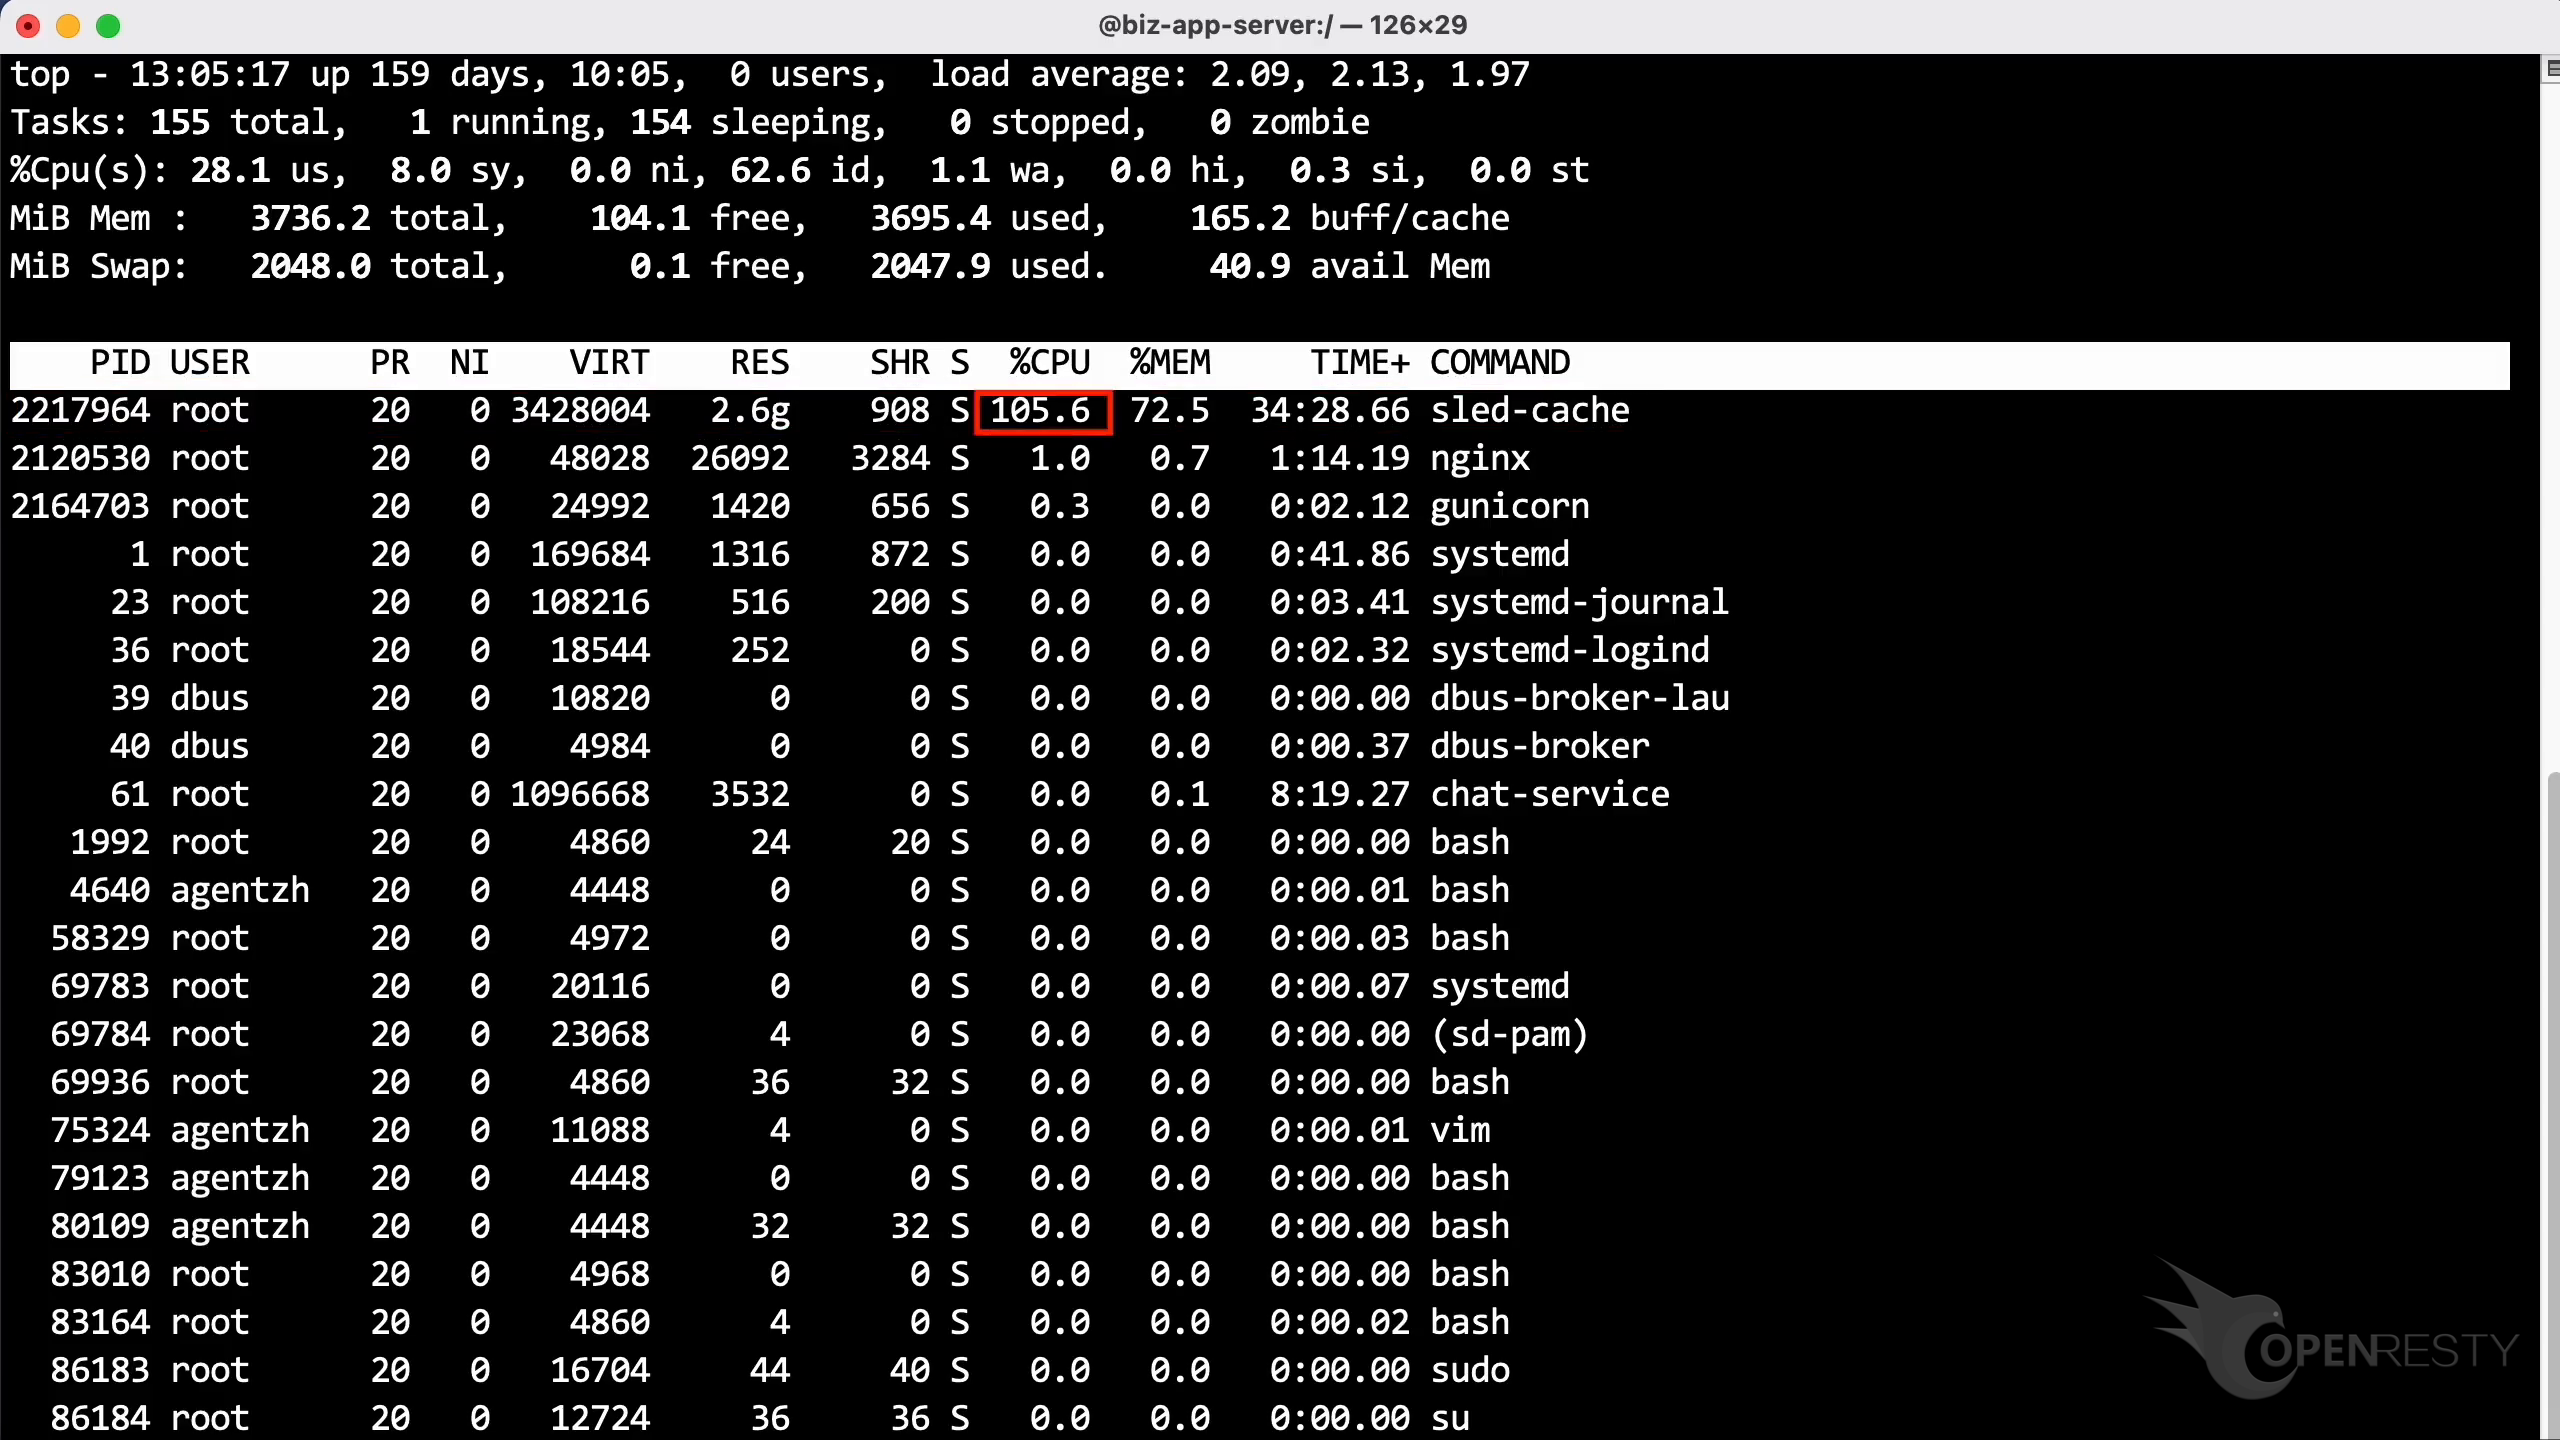
Sled is an embedded KV database written in Rust, and our in-house cache service is built on top of it. In top, the process’s CPU usage stayed above 100%.
Profile the Running Rust Process with Guided Analysis
Let’s use OpenResty XRay to check this unmodified process. You can analyze it in real time and figure out what is happening, with no code changes and no recompilation. The runtime overhead of this kind of analysis is very low, as we measured in OpenResty XRay’s overhead on Rust applications.
Open the OpenResty XRay web console, make sure you are watching the right machine, and go to the “Guided Analysis” page. Here you can see the different types of problems that you can diagnose.
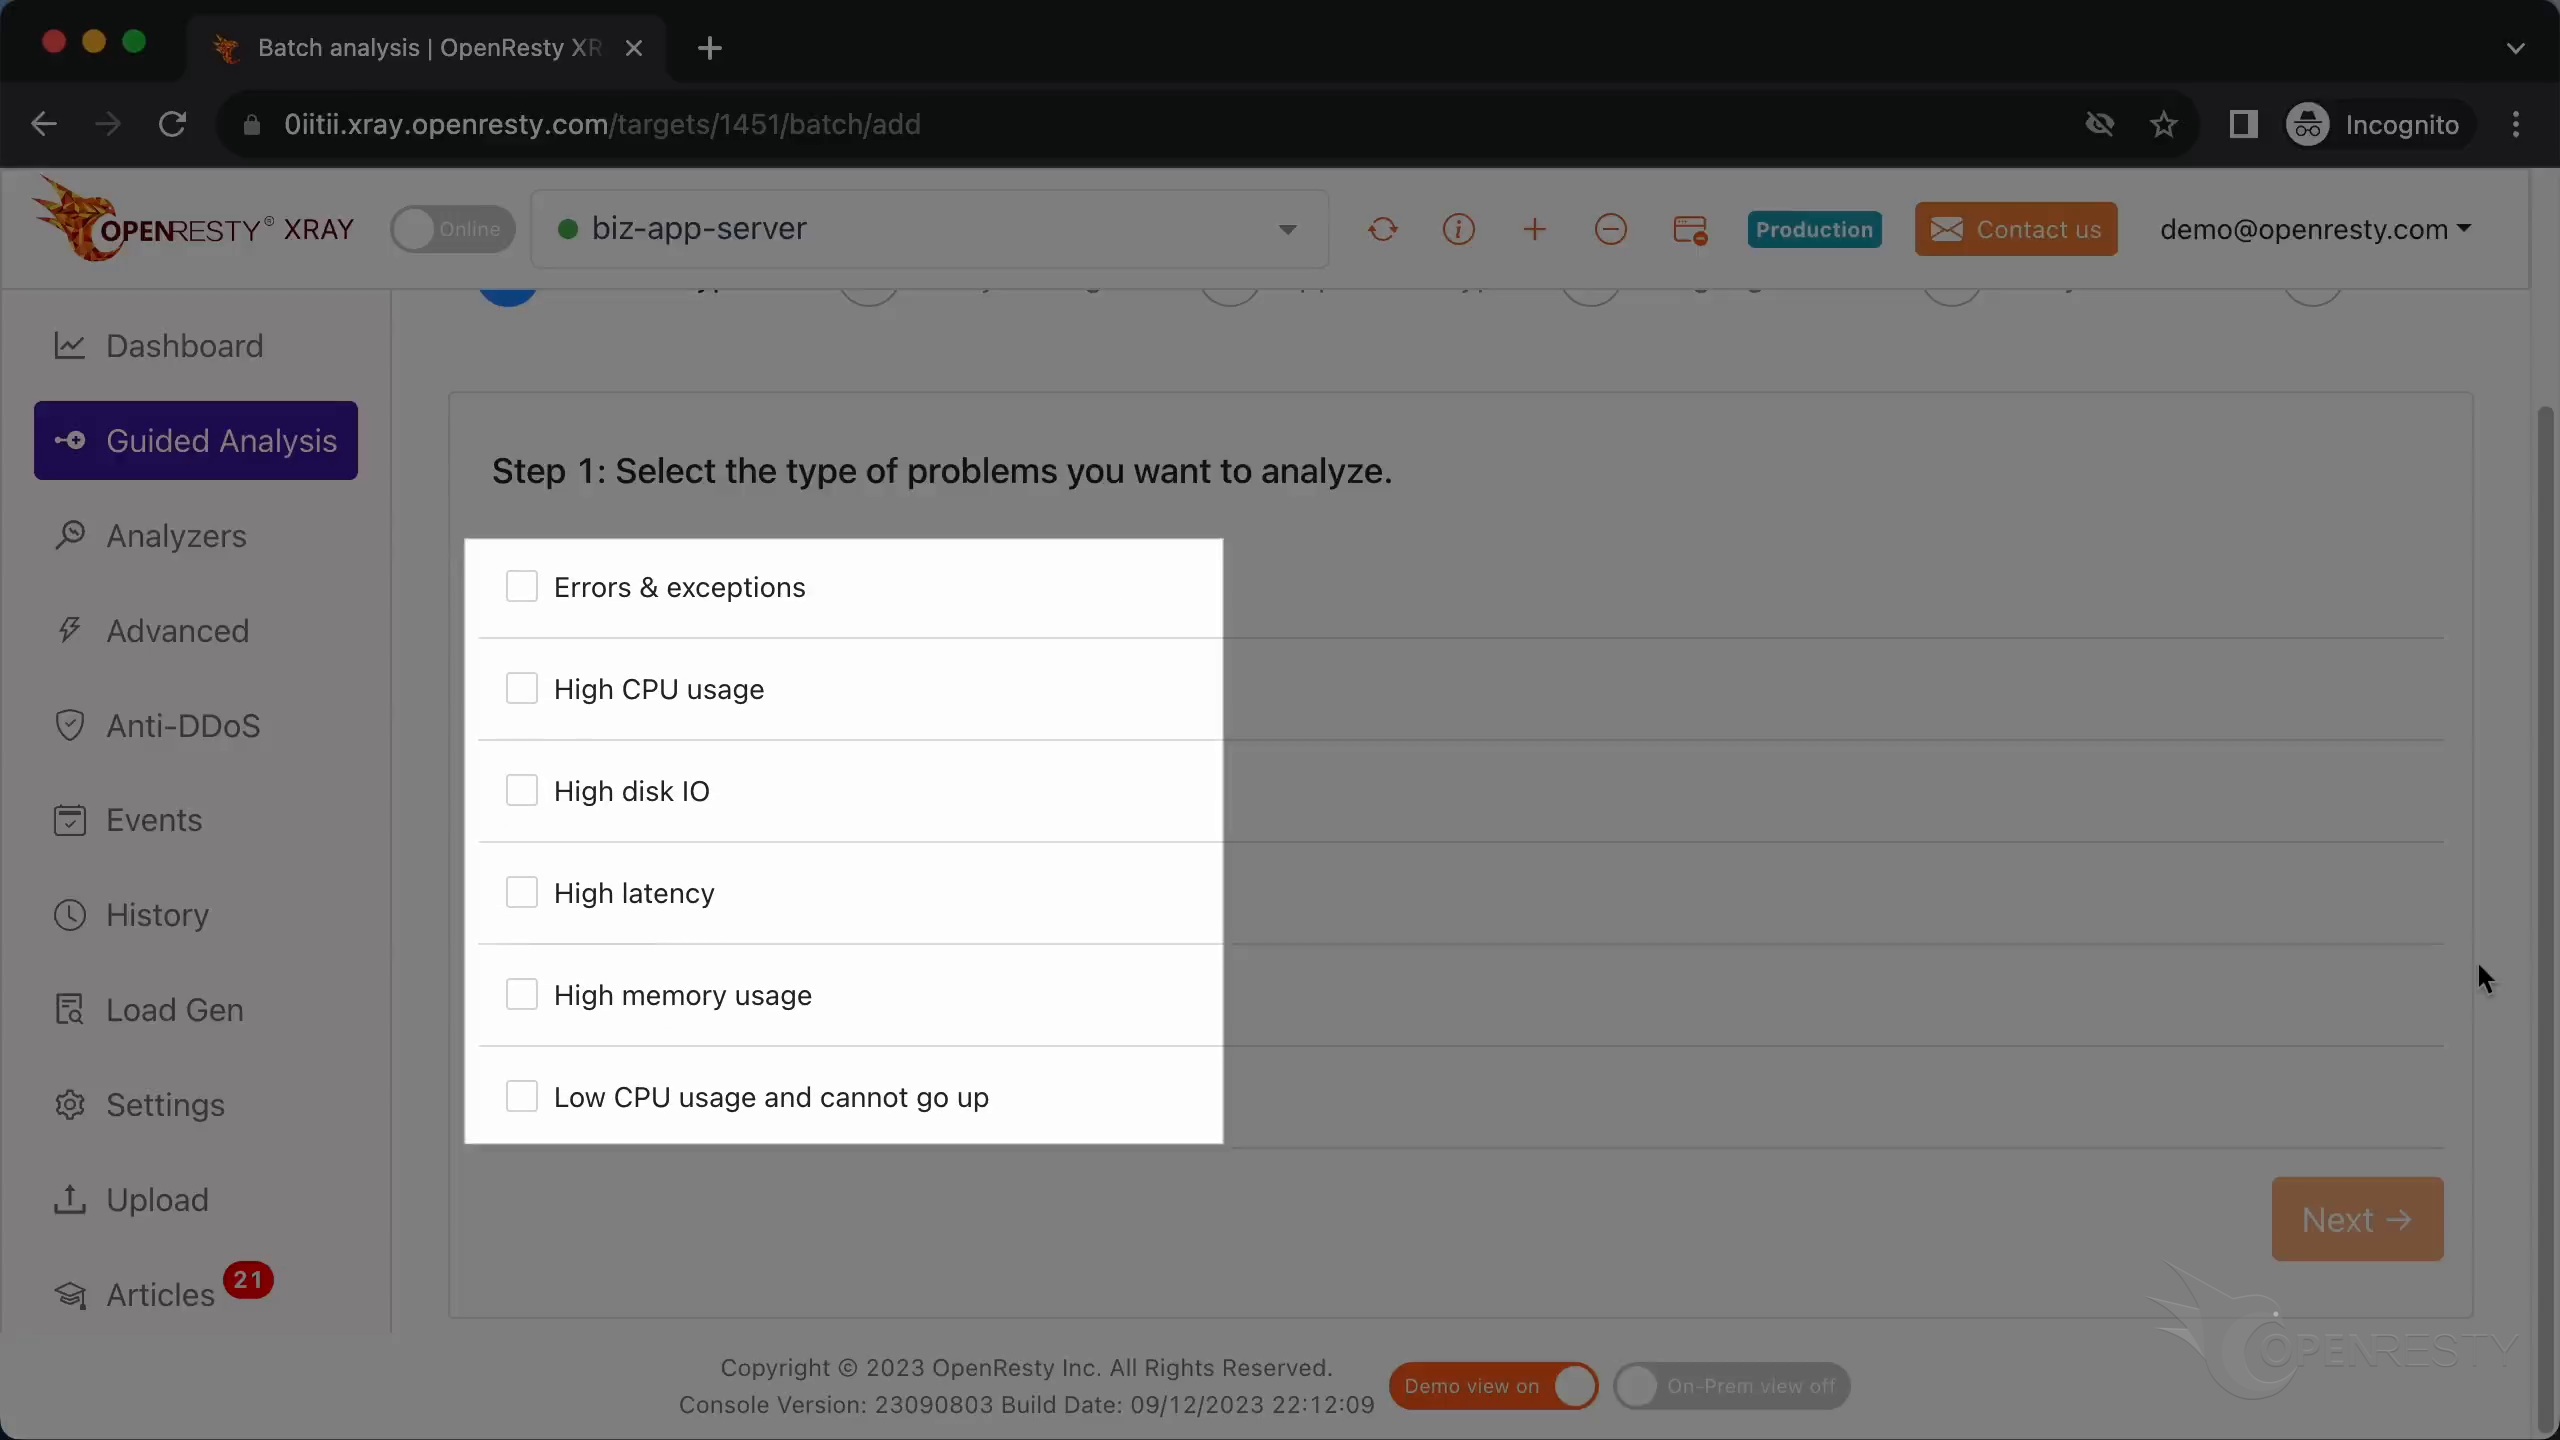
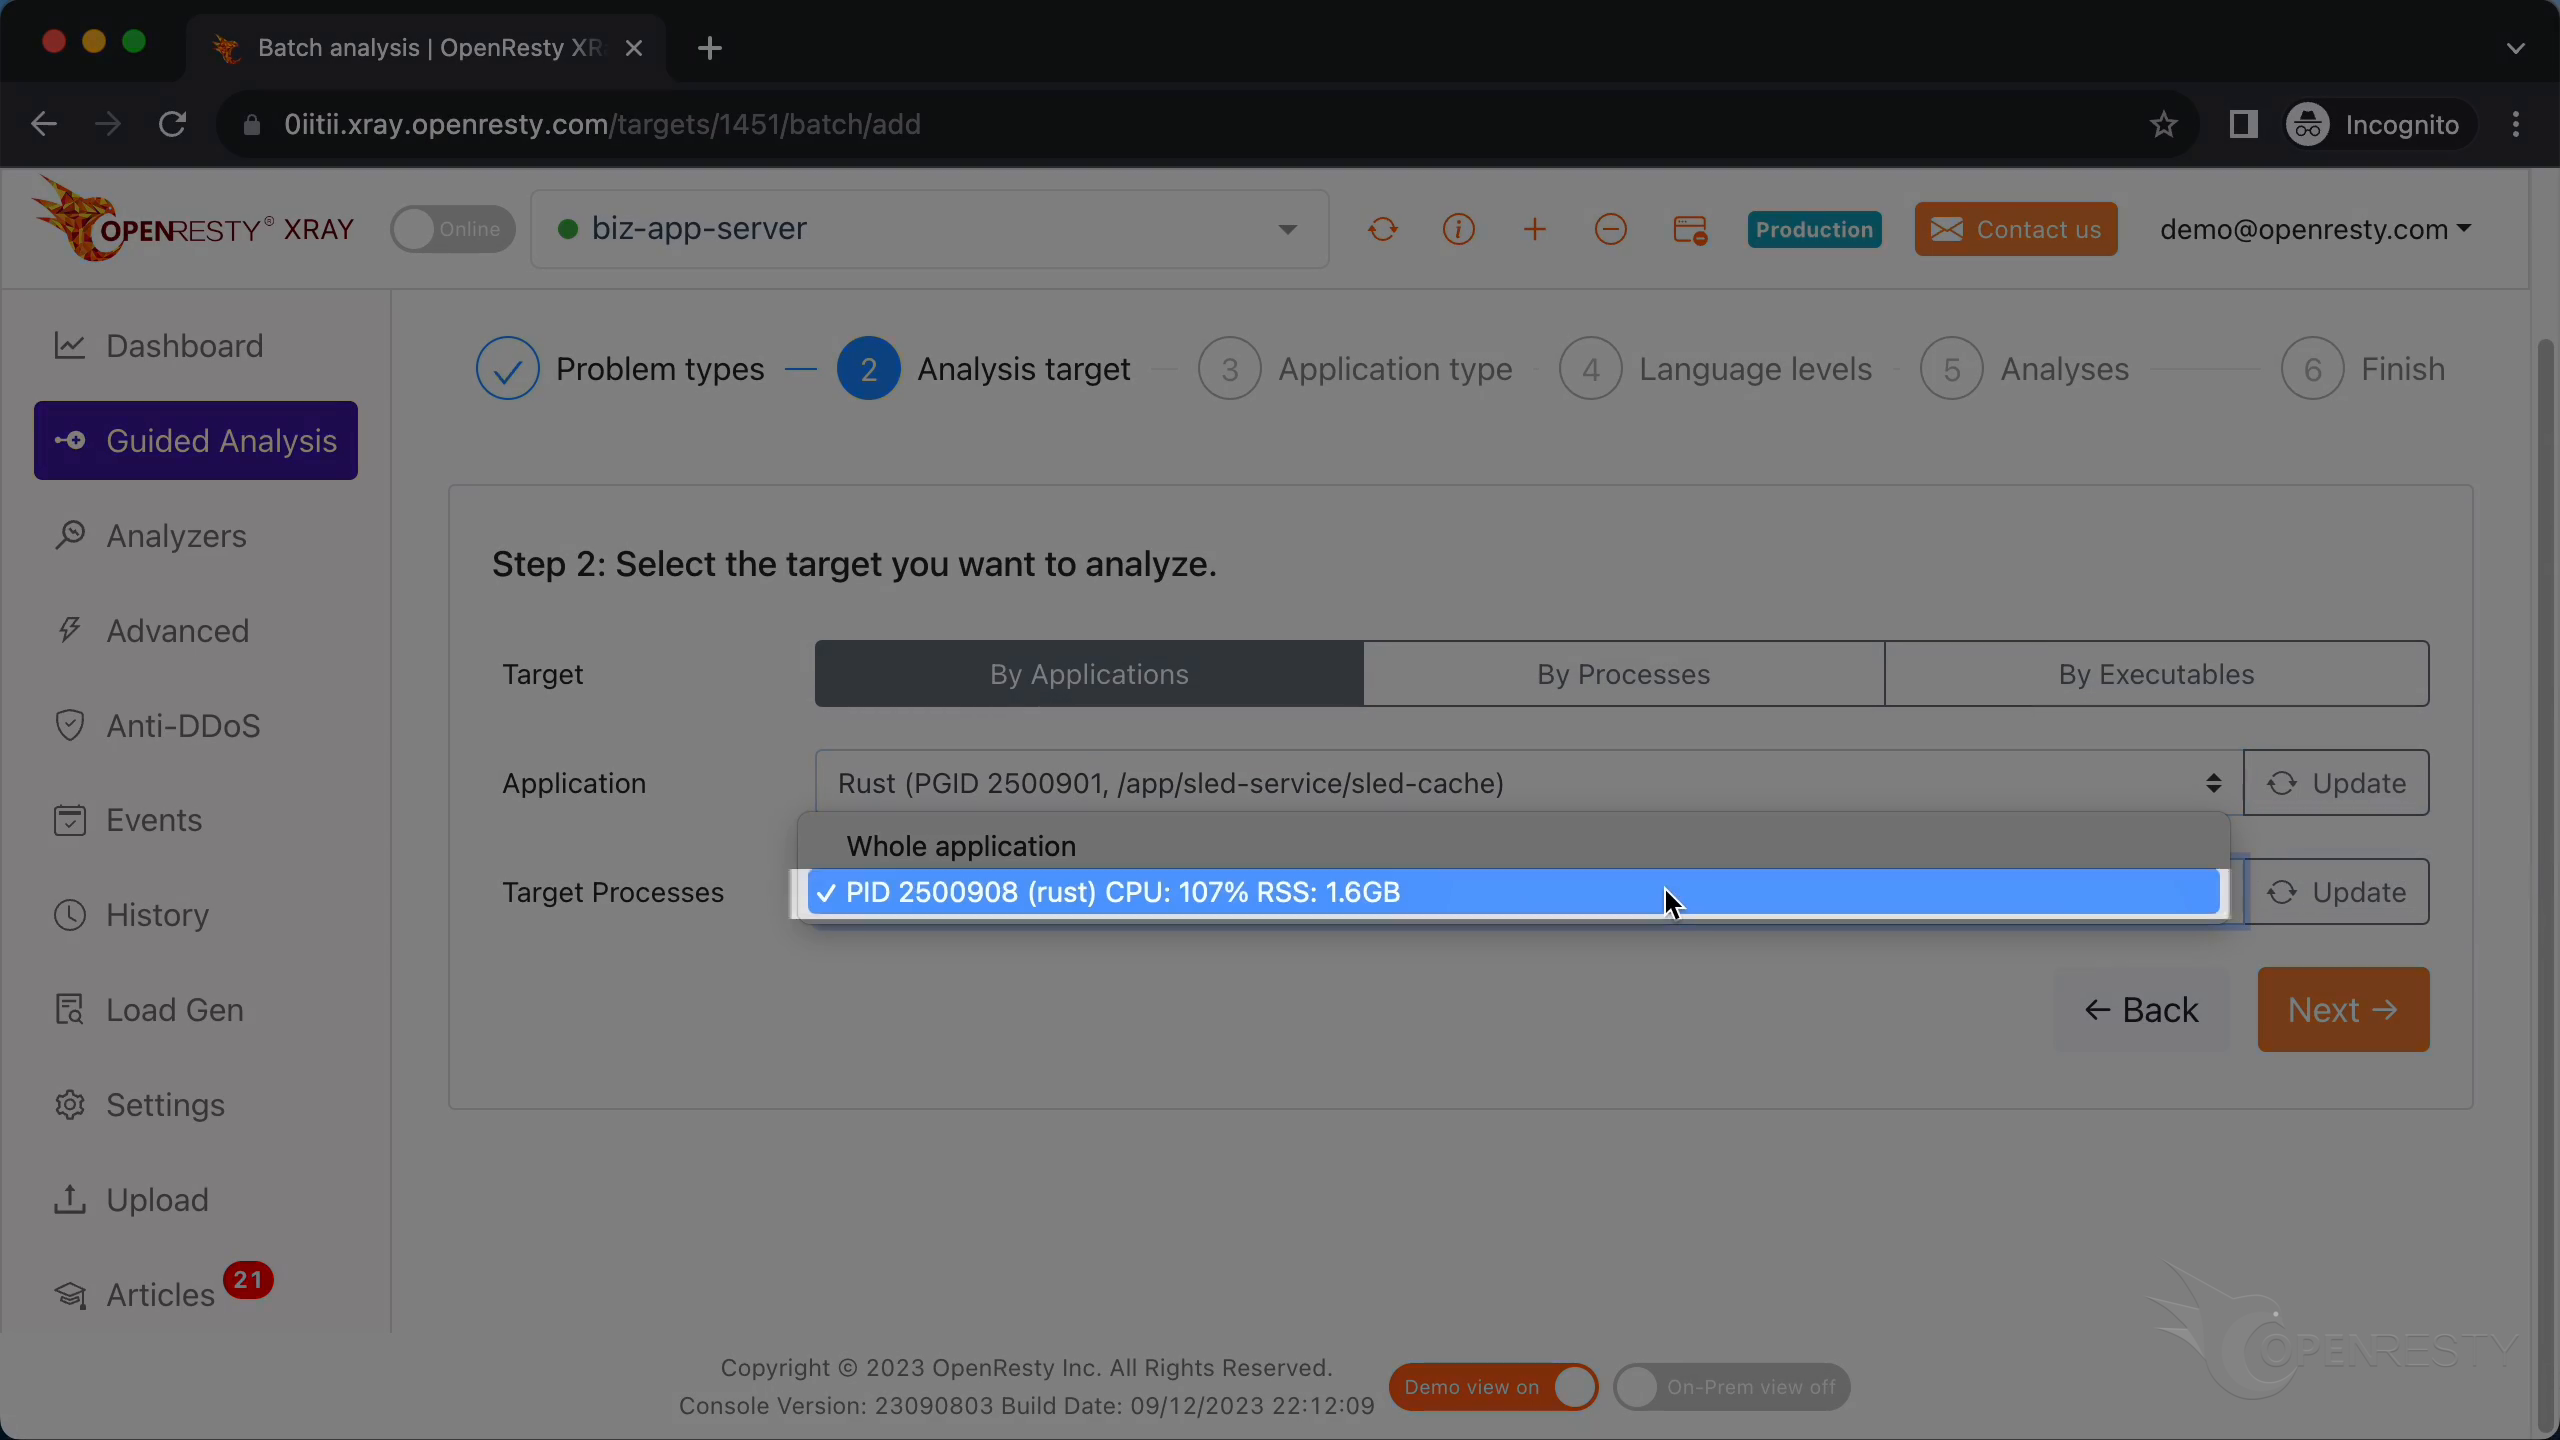
Select “High CPU Usage”, then select the Sled application and the process that consumes more than 100% of the CPU resources — the one we saw previously in top.
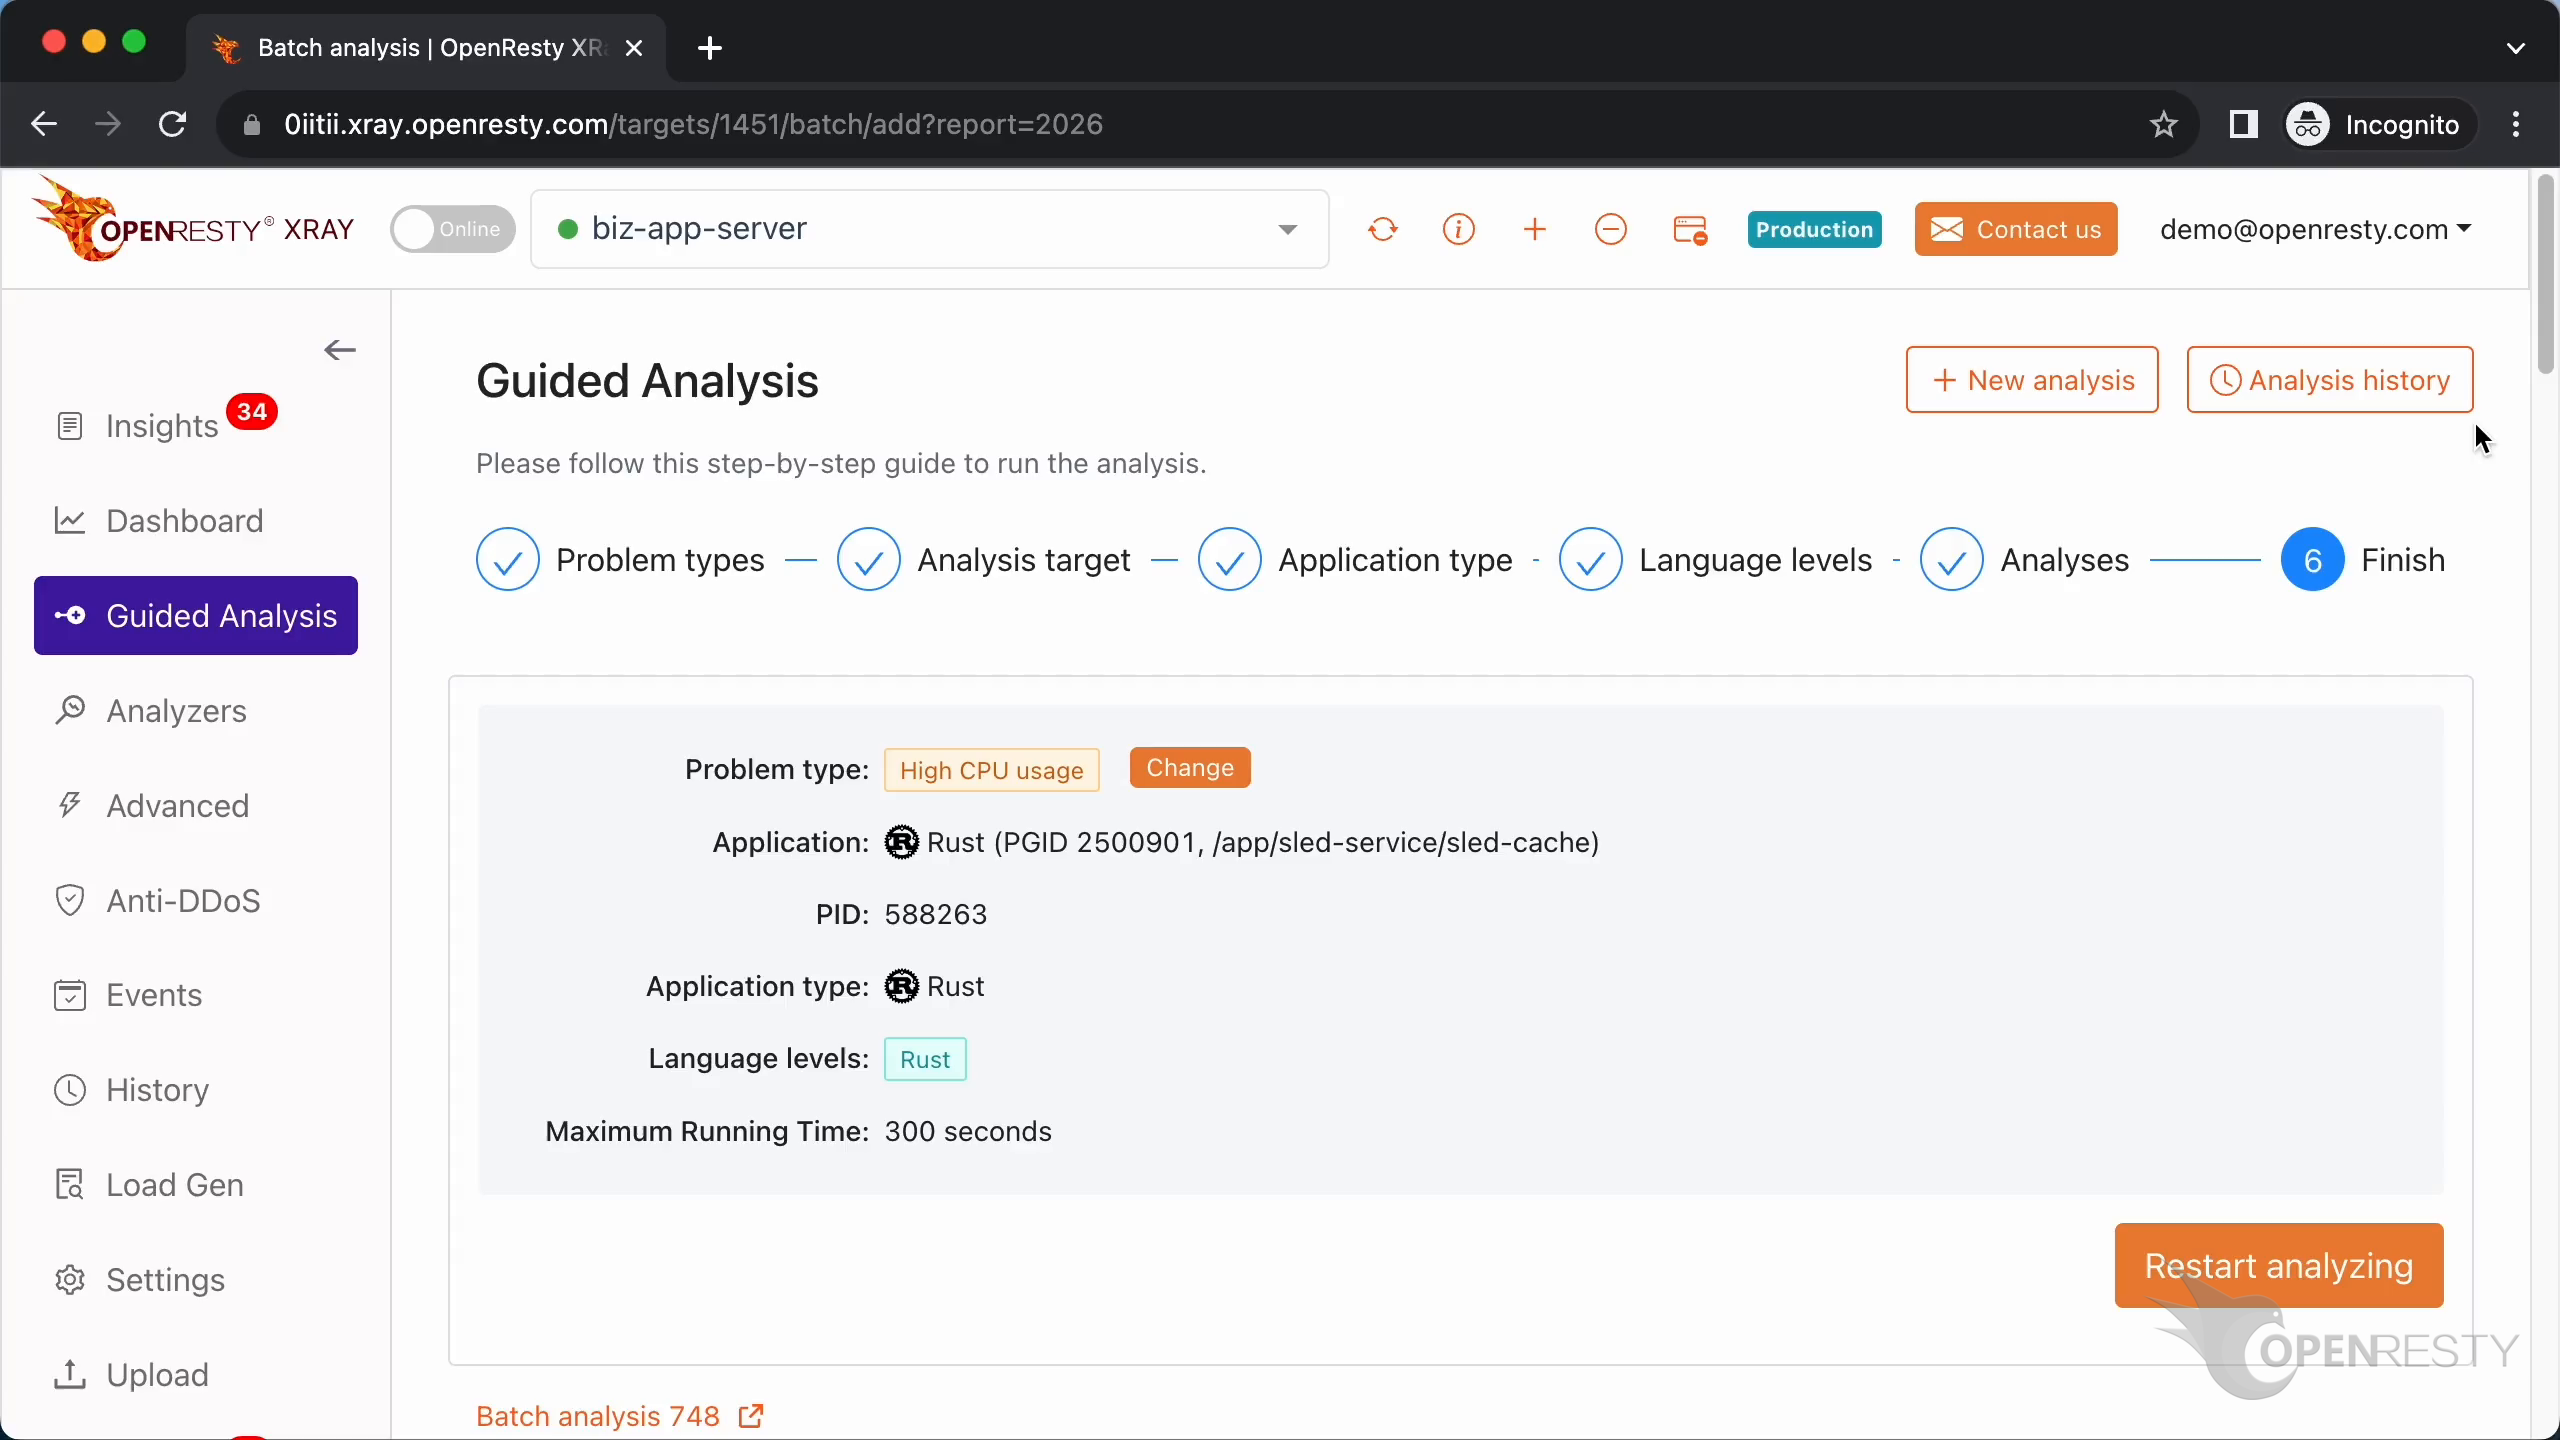
The application type defaults to Rust, and the language level here is just “Rust”. We leave the maximum analyzing time at its default of 300 seconds and start analyzing. The system keeps performing different rounds of analysis; once the first round is done, that’s already enough for this case, so we stop the analysis and it automatically generates an analysis report.
Read the Rust CPU Flame Graph: The #1 Hottest Code Path
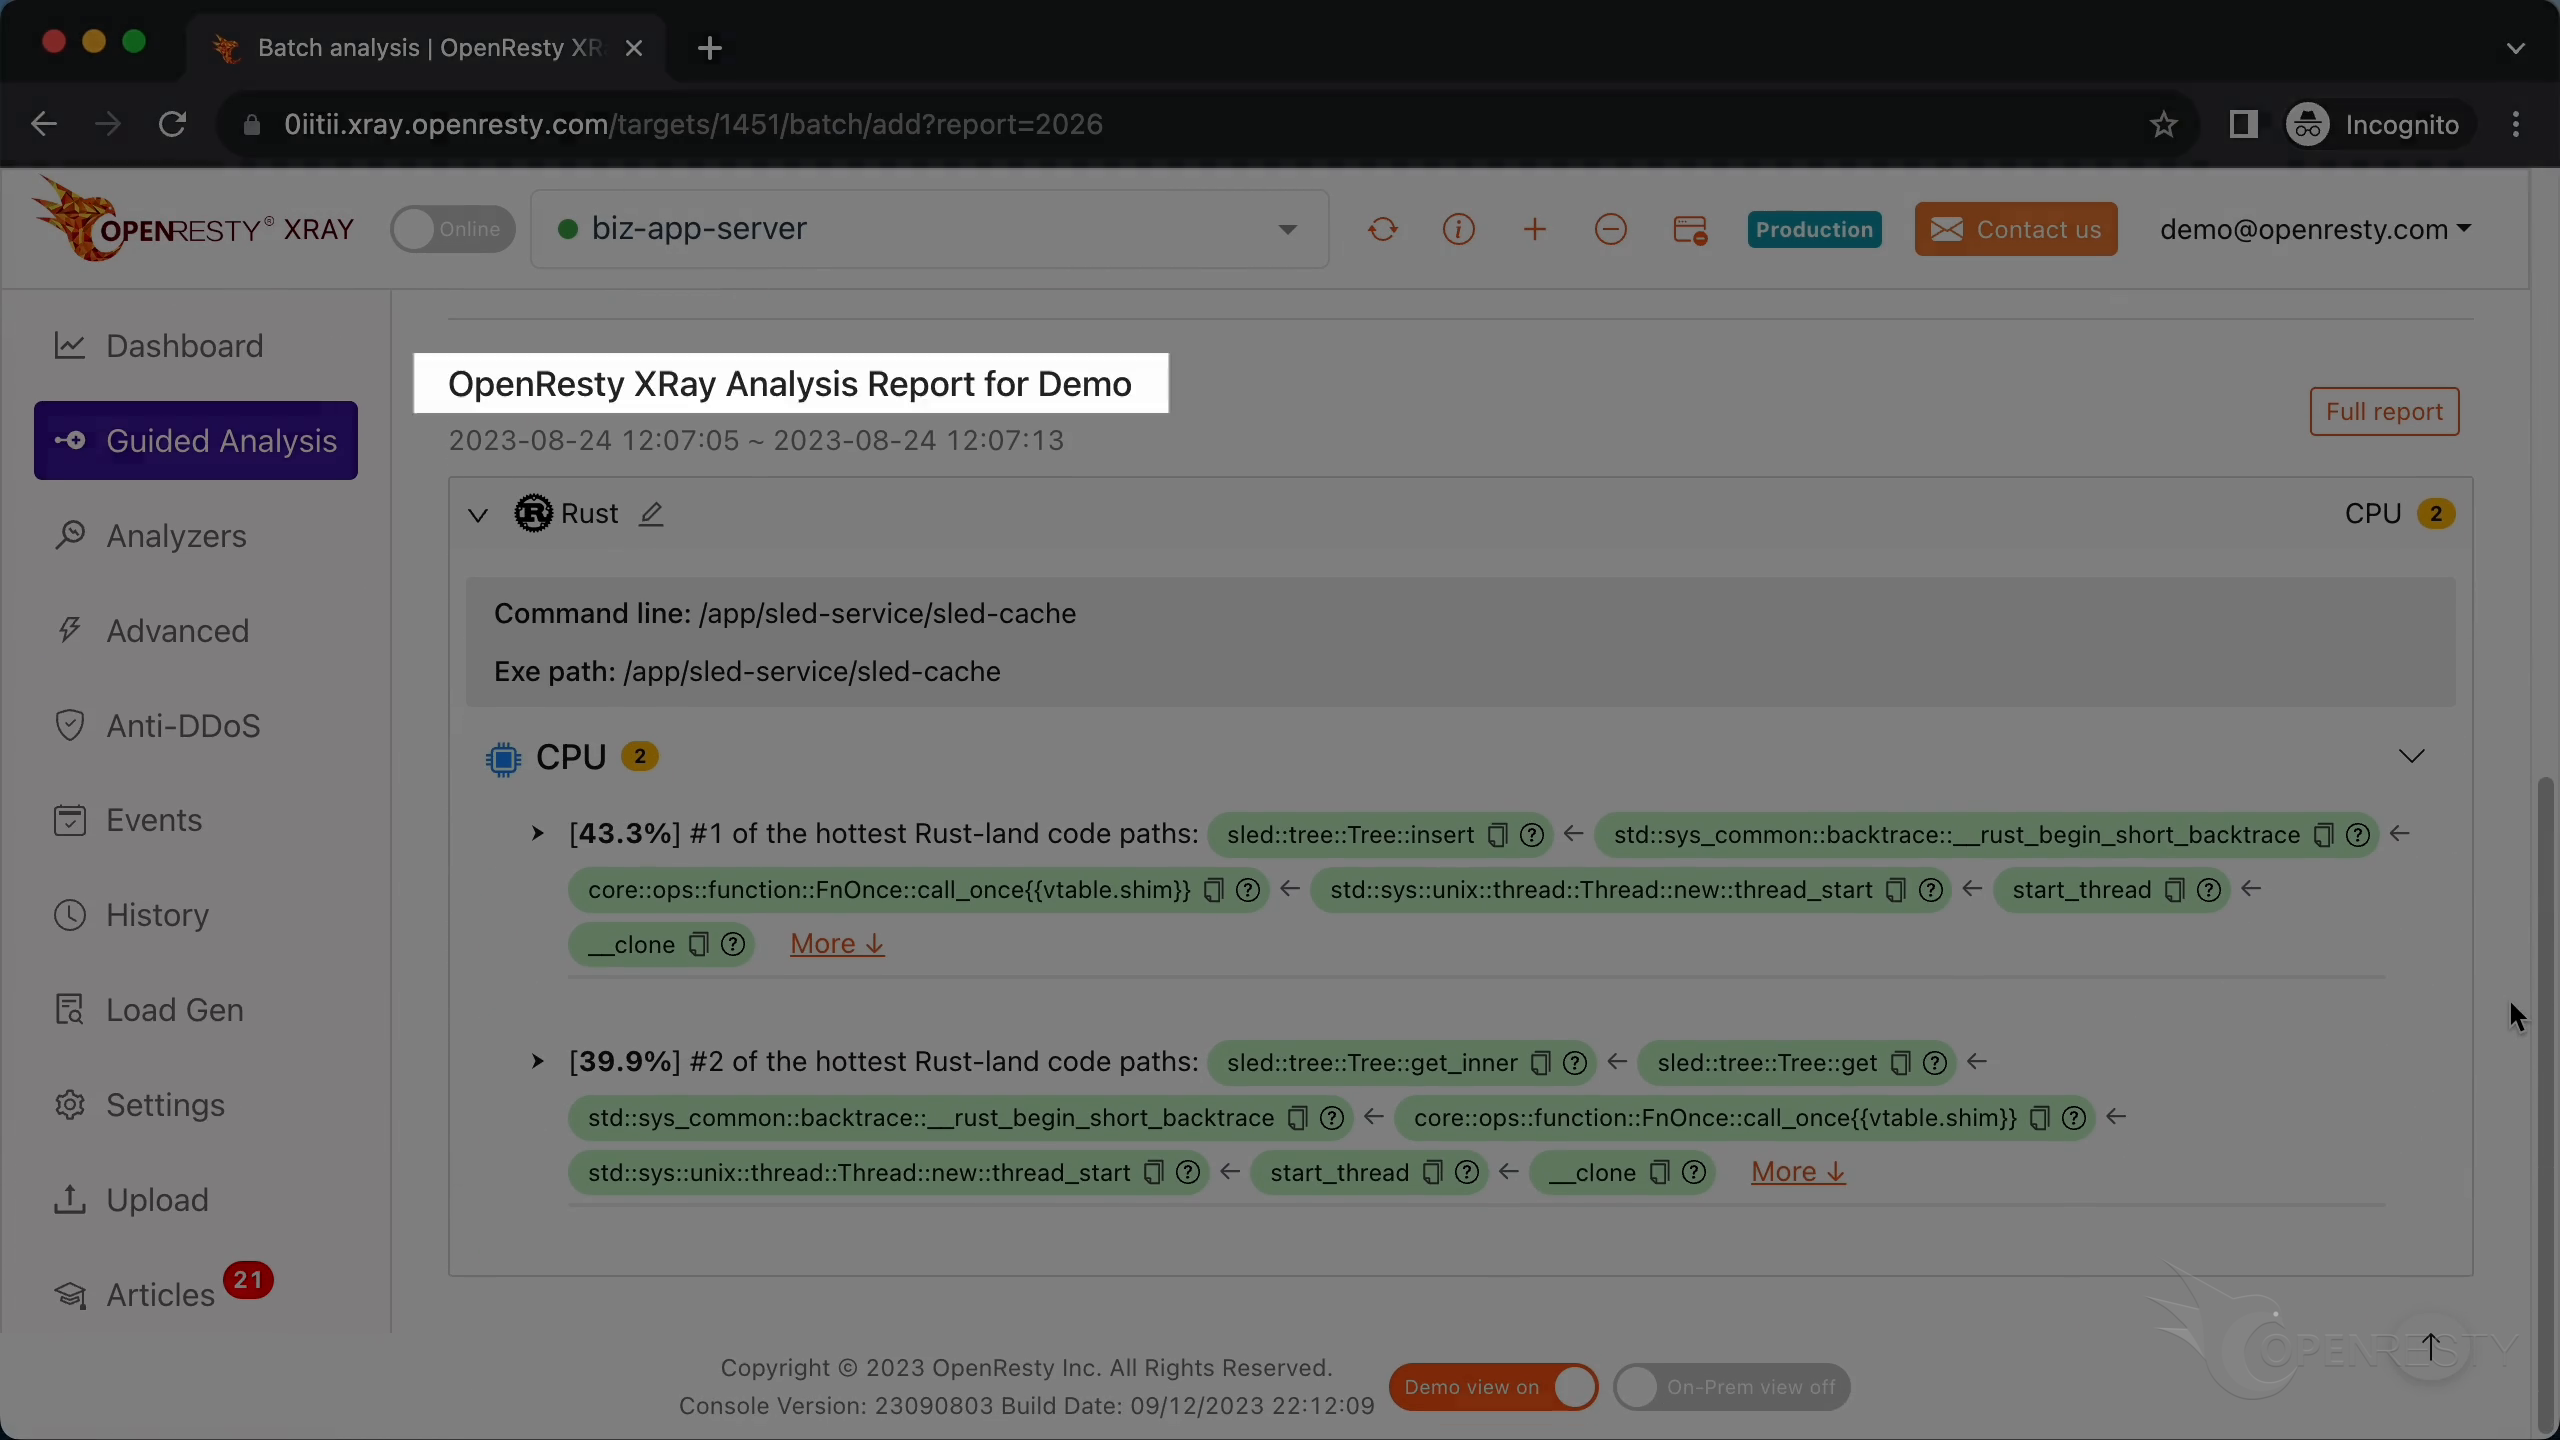
The report shows the #1 hottest Rust-land code path for the CPU time.
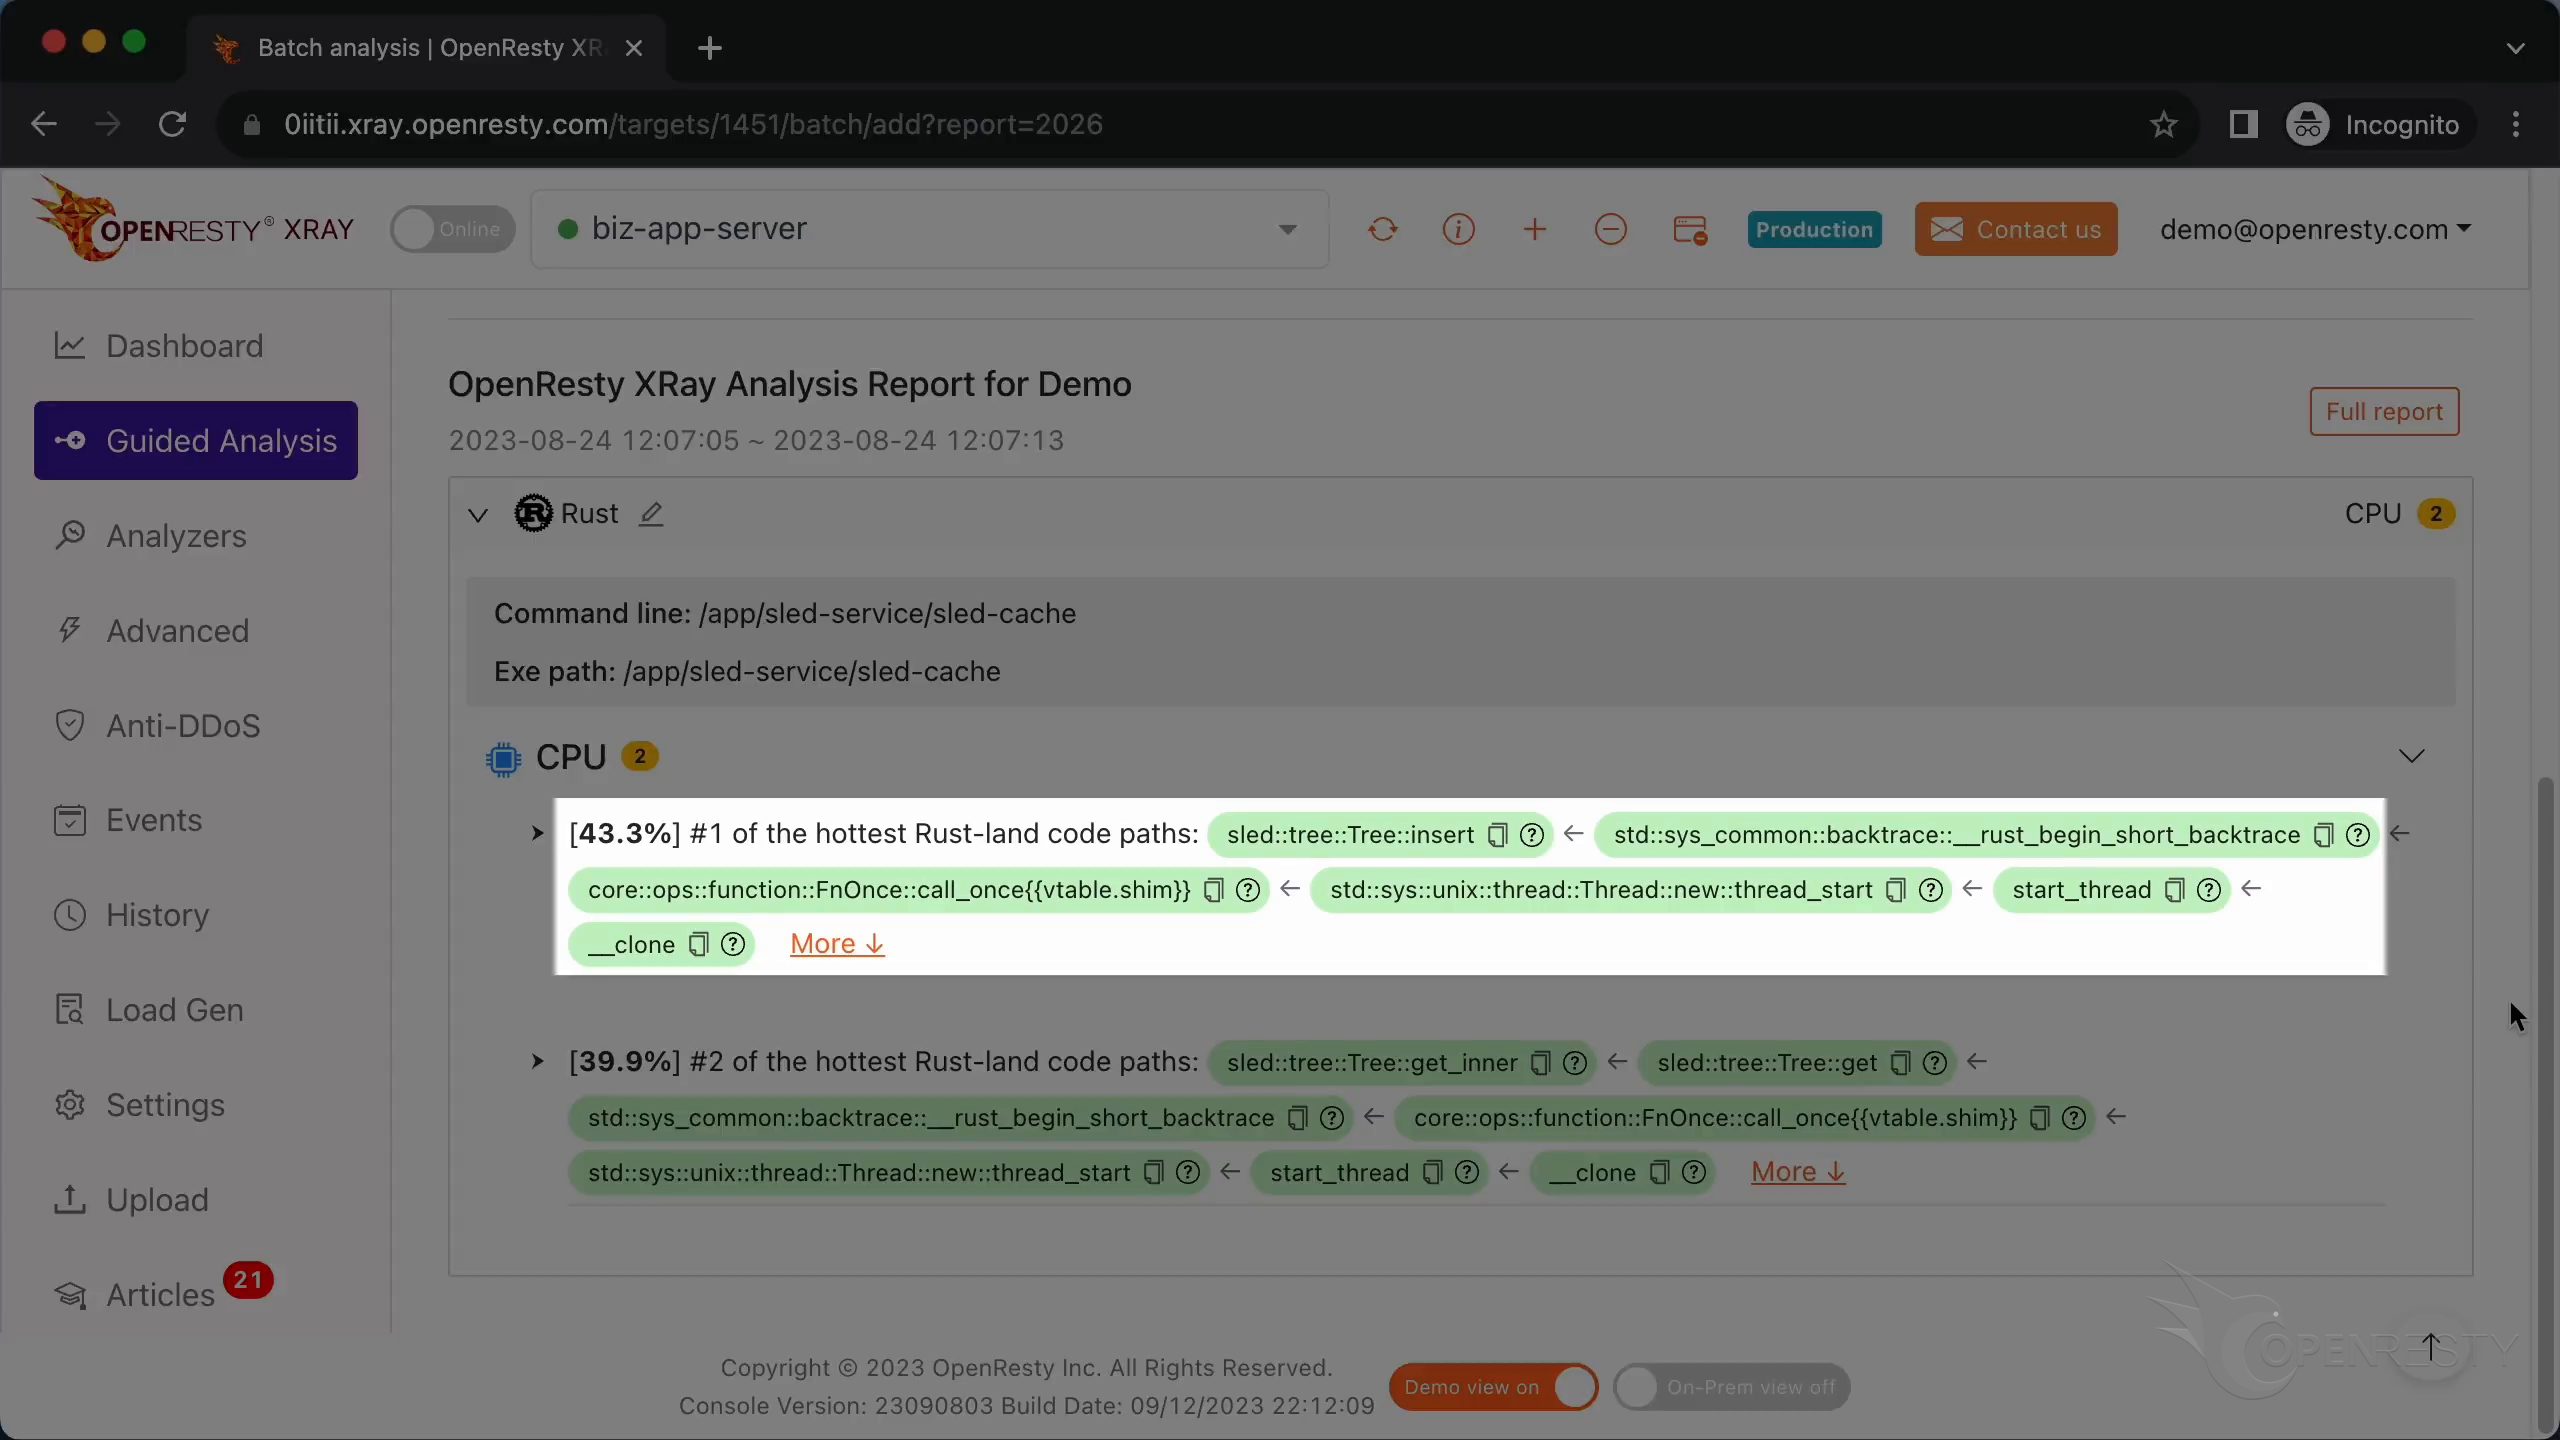
The first function, sled::tree::Tree::insert, is used in Sled for data insertion.
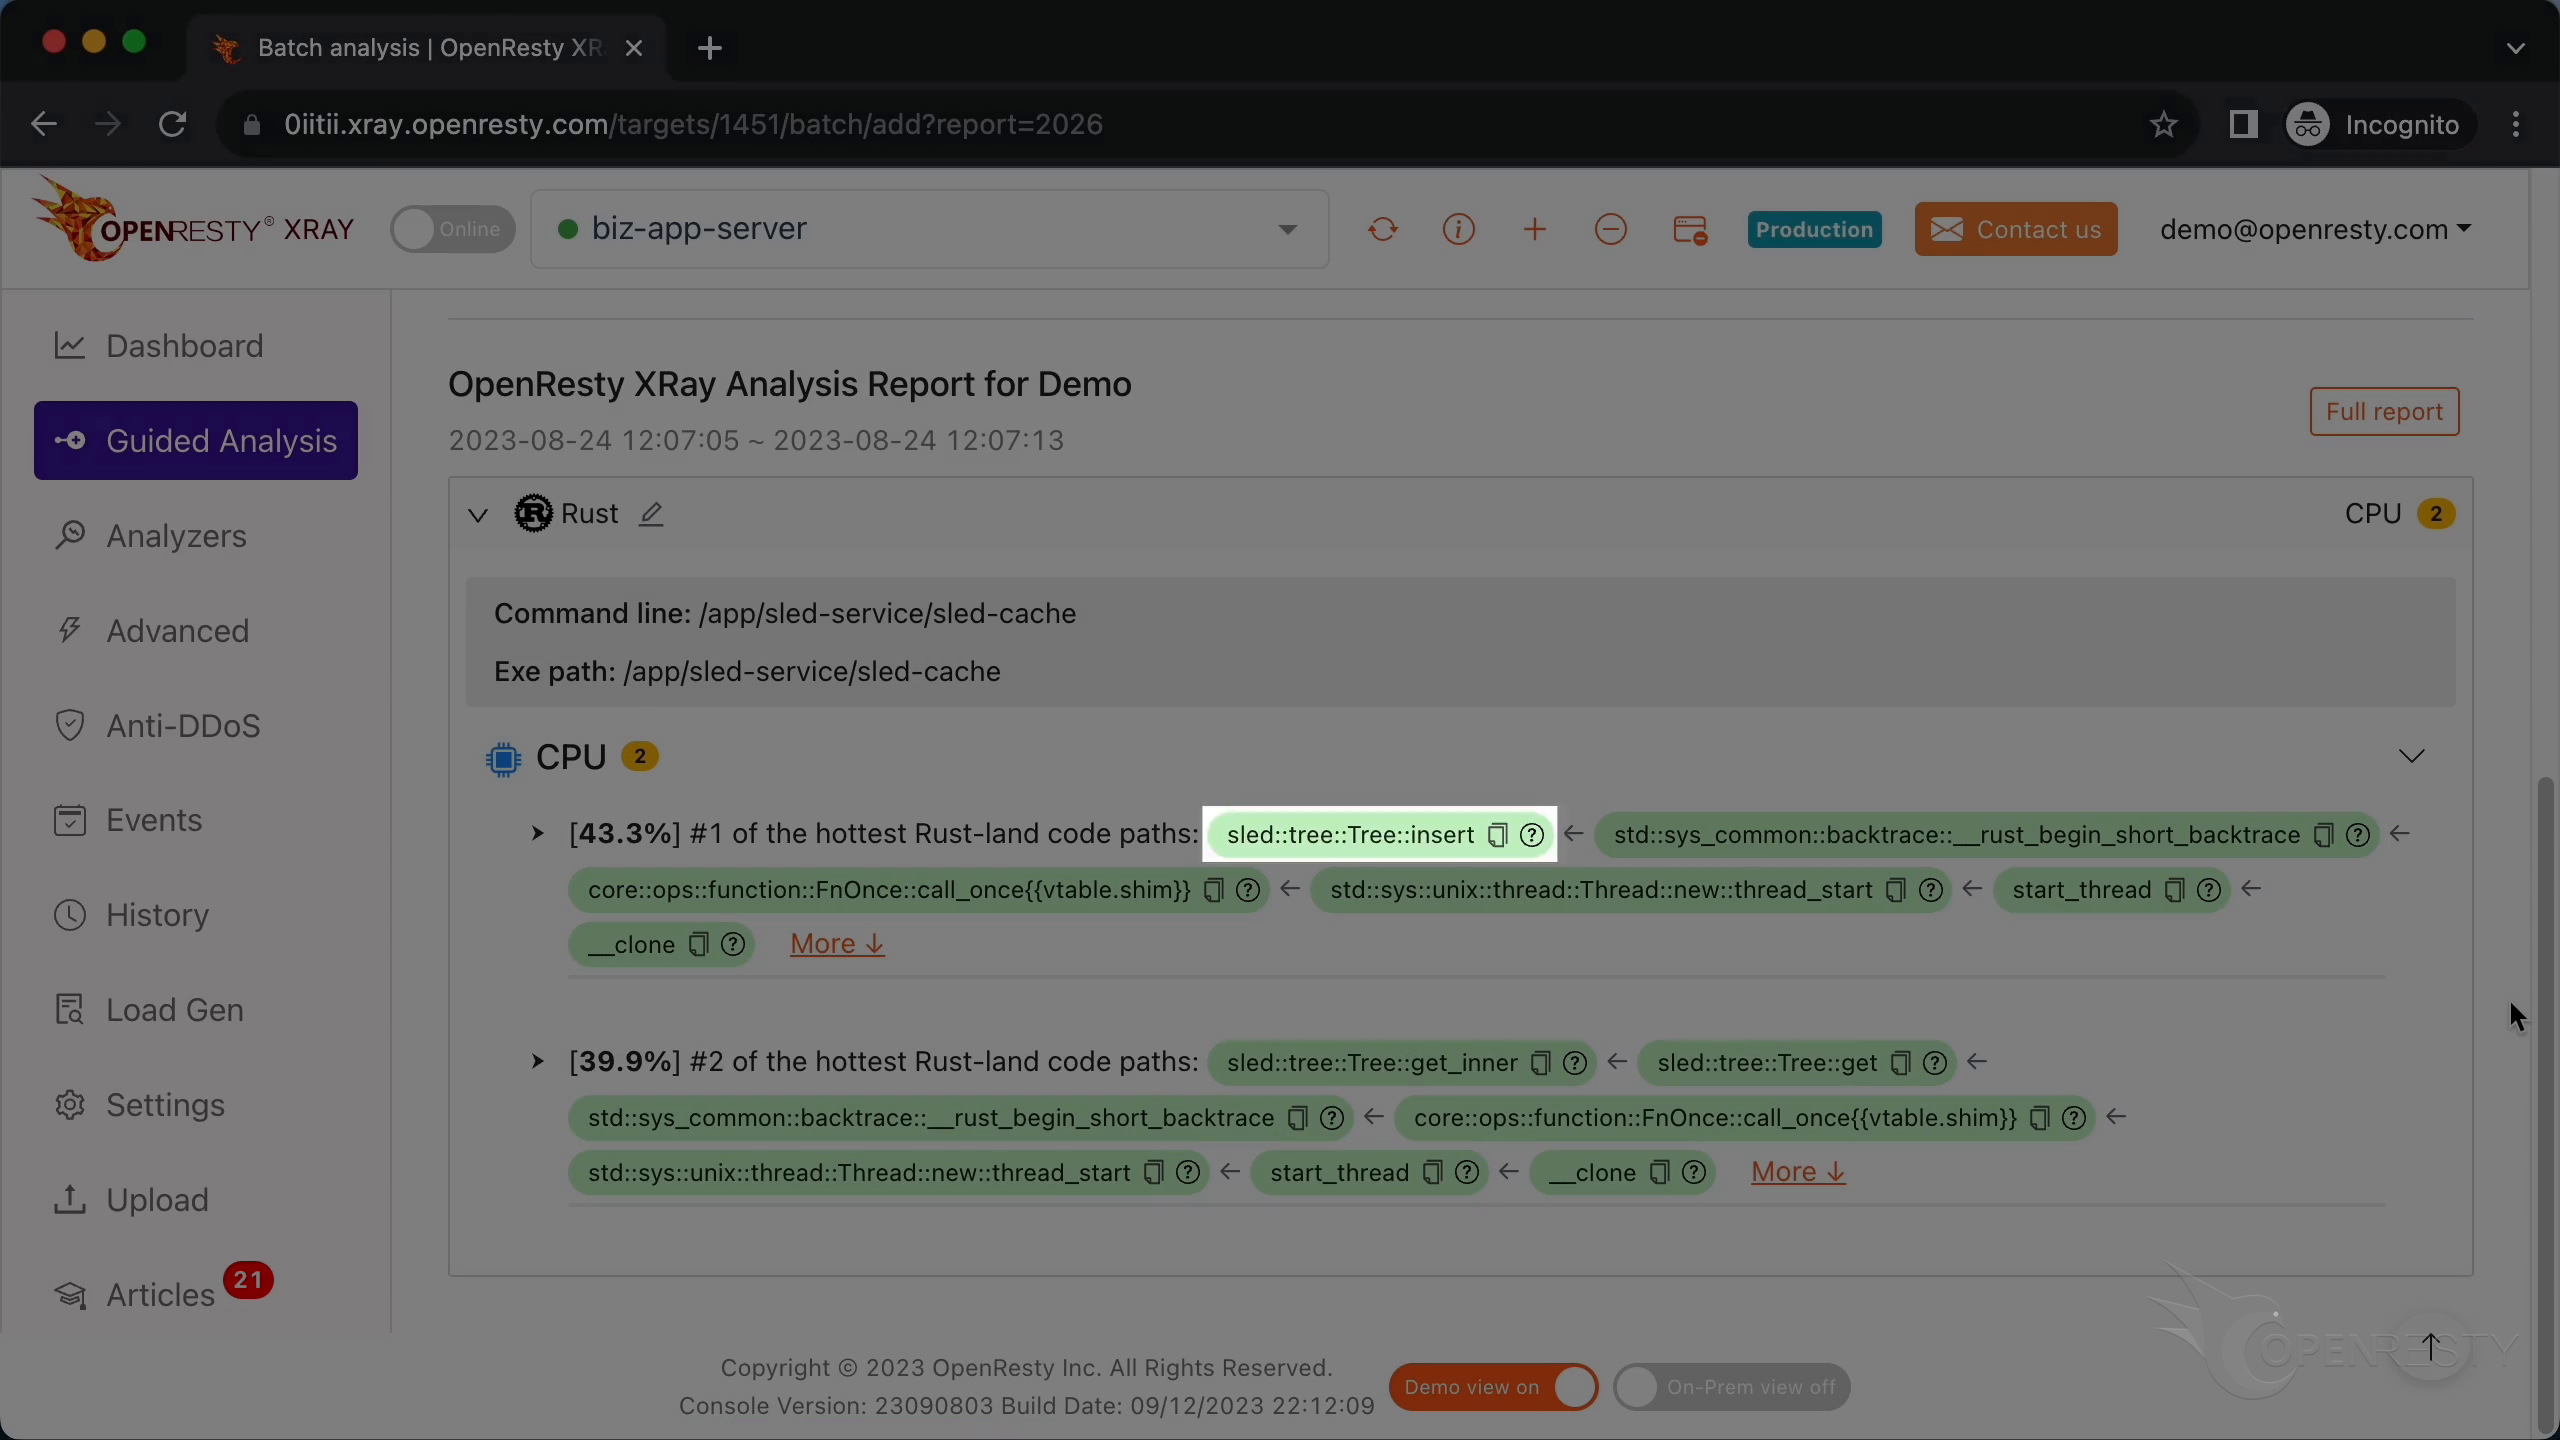
Click “More” to see the details.
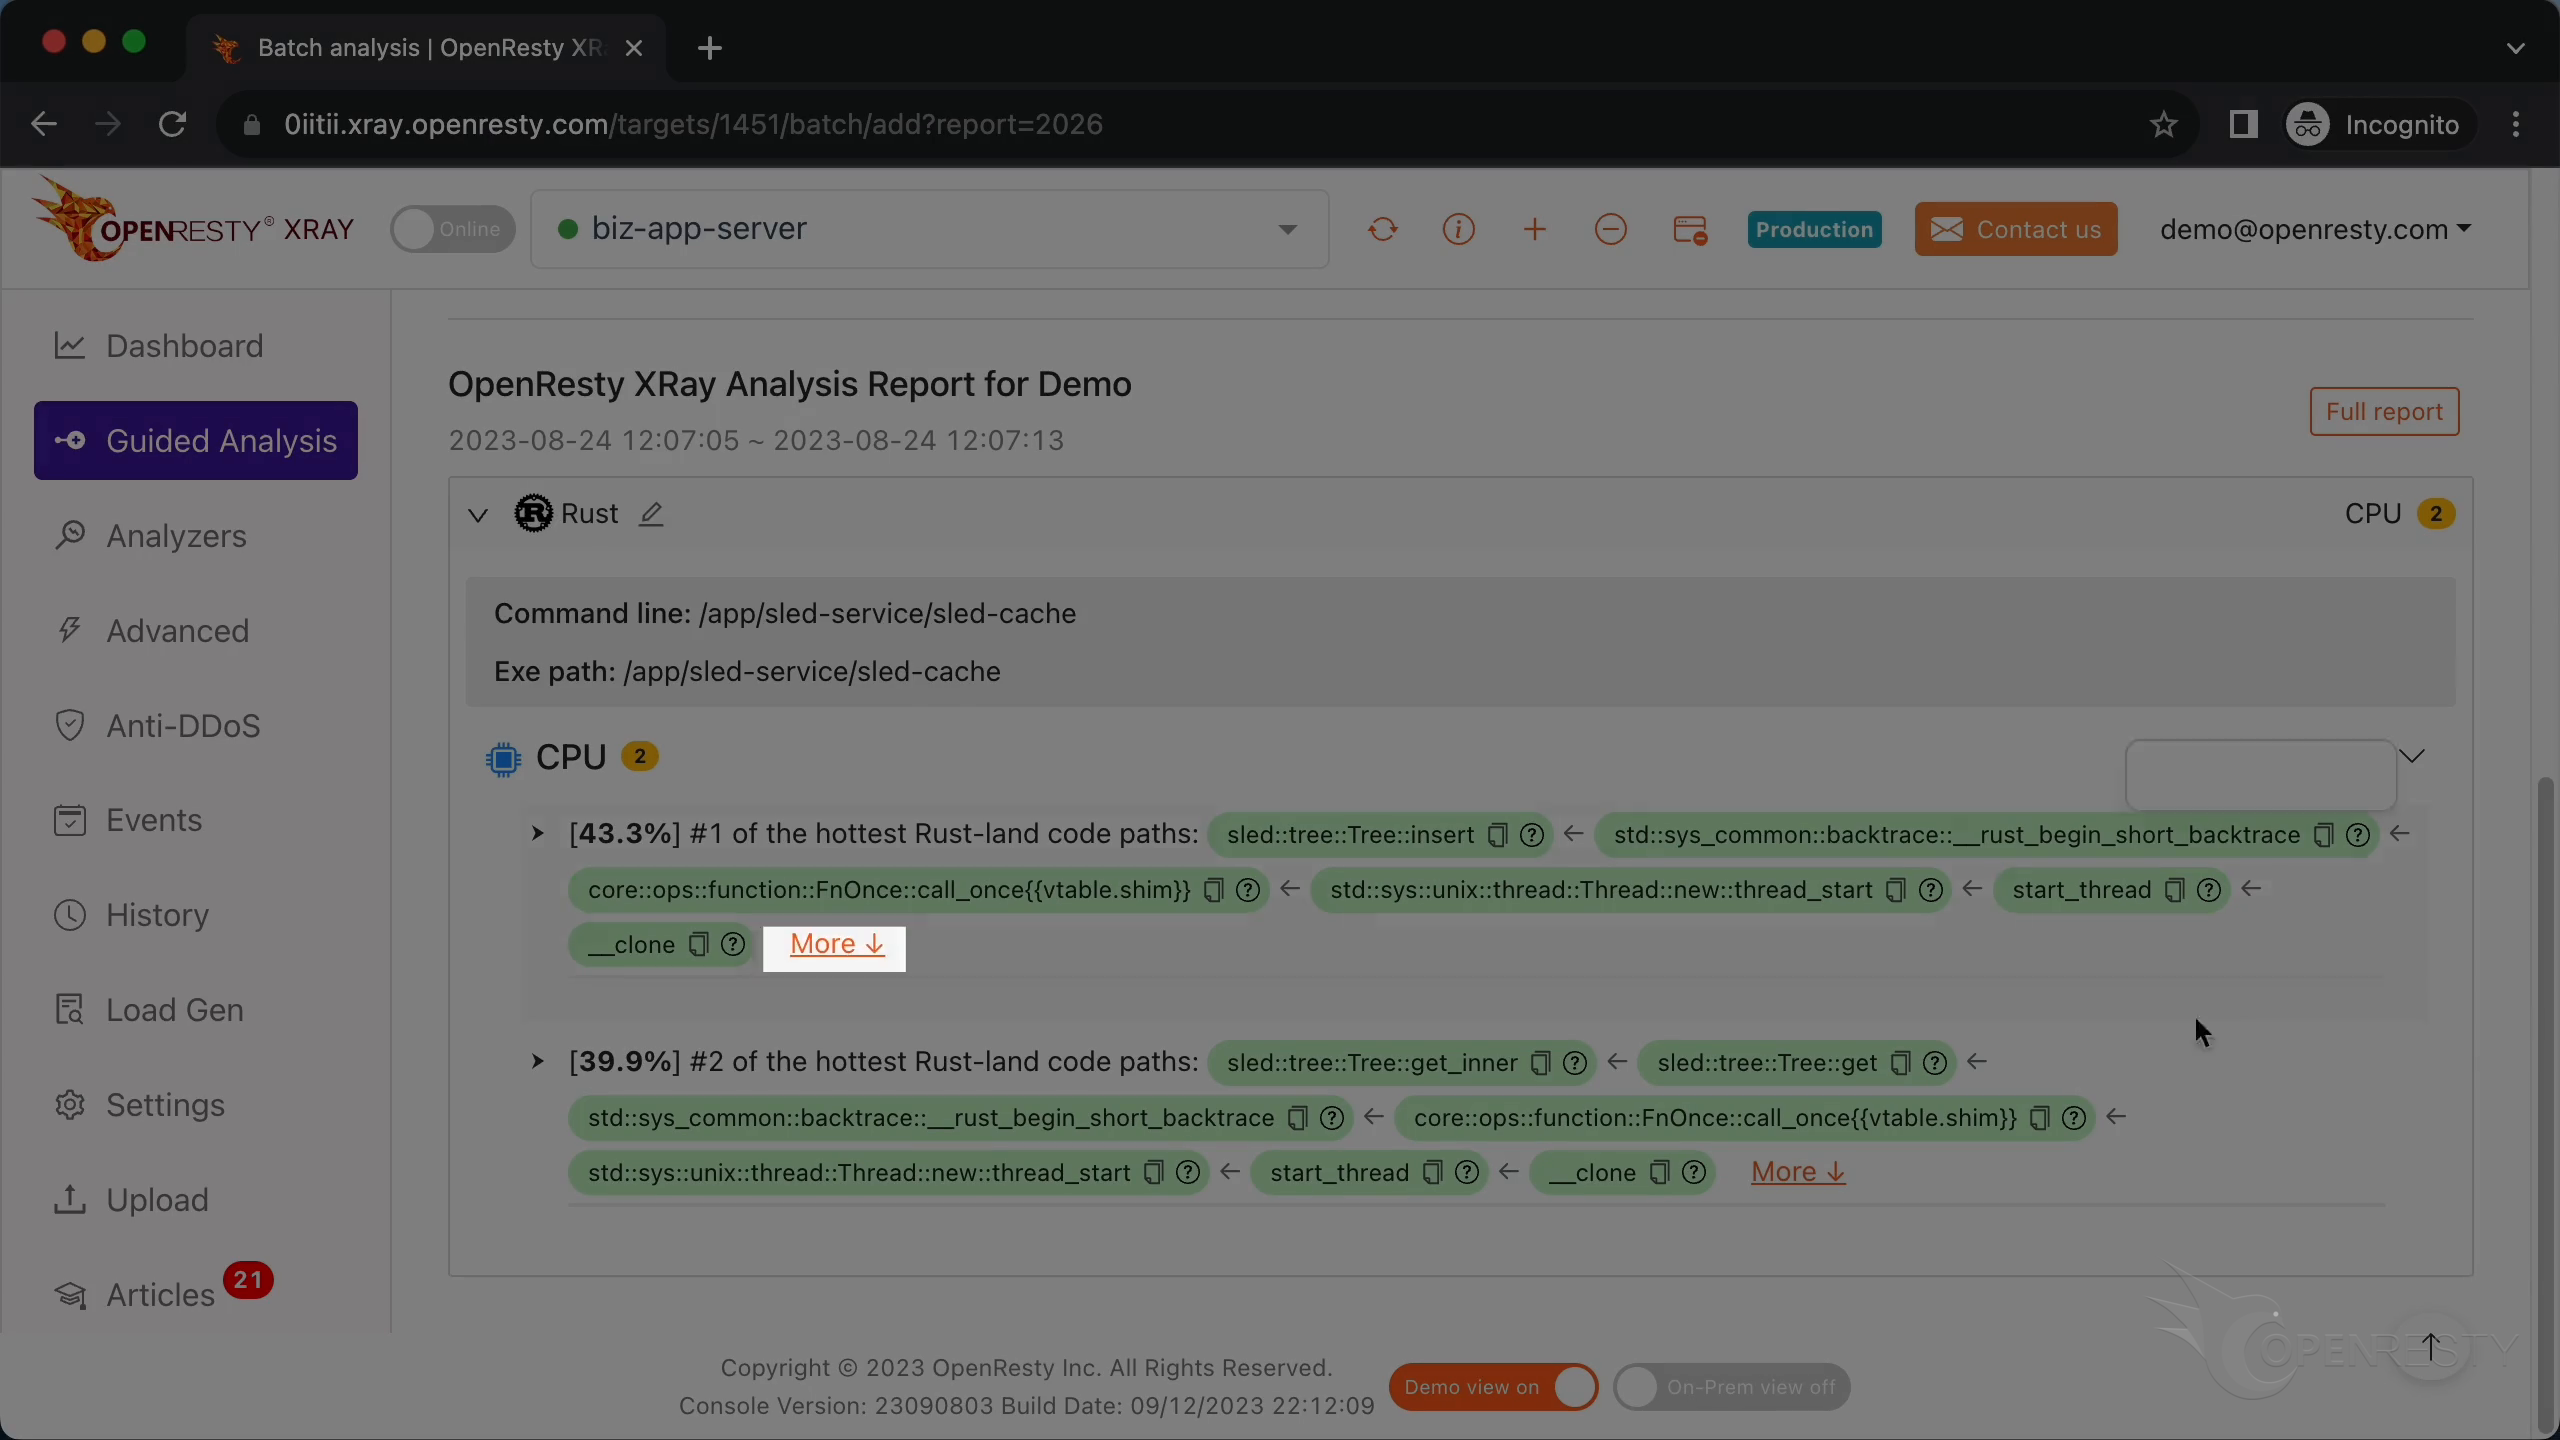
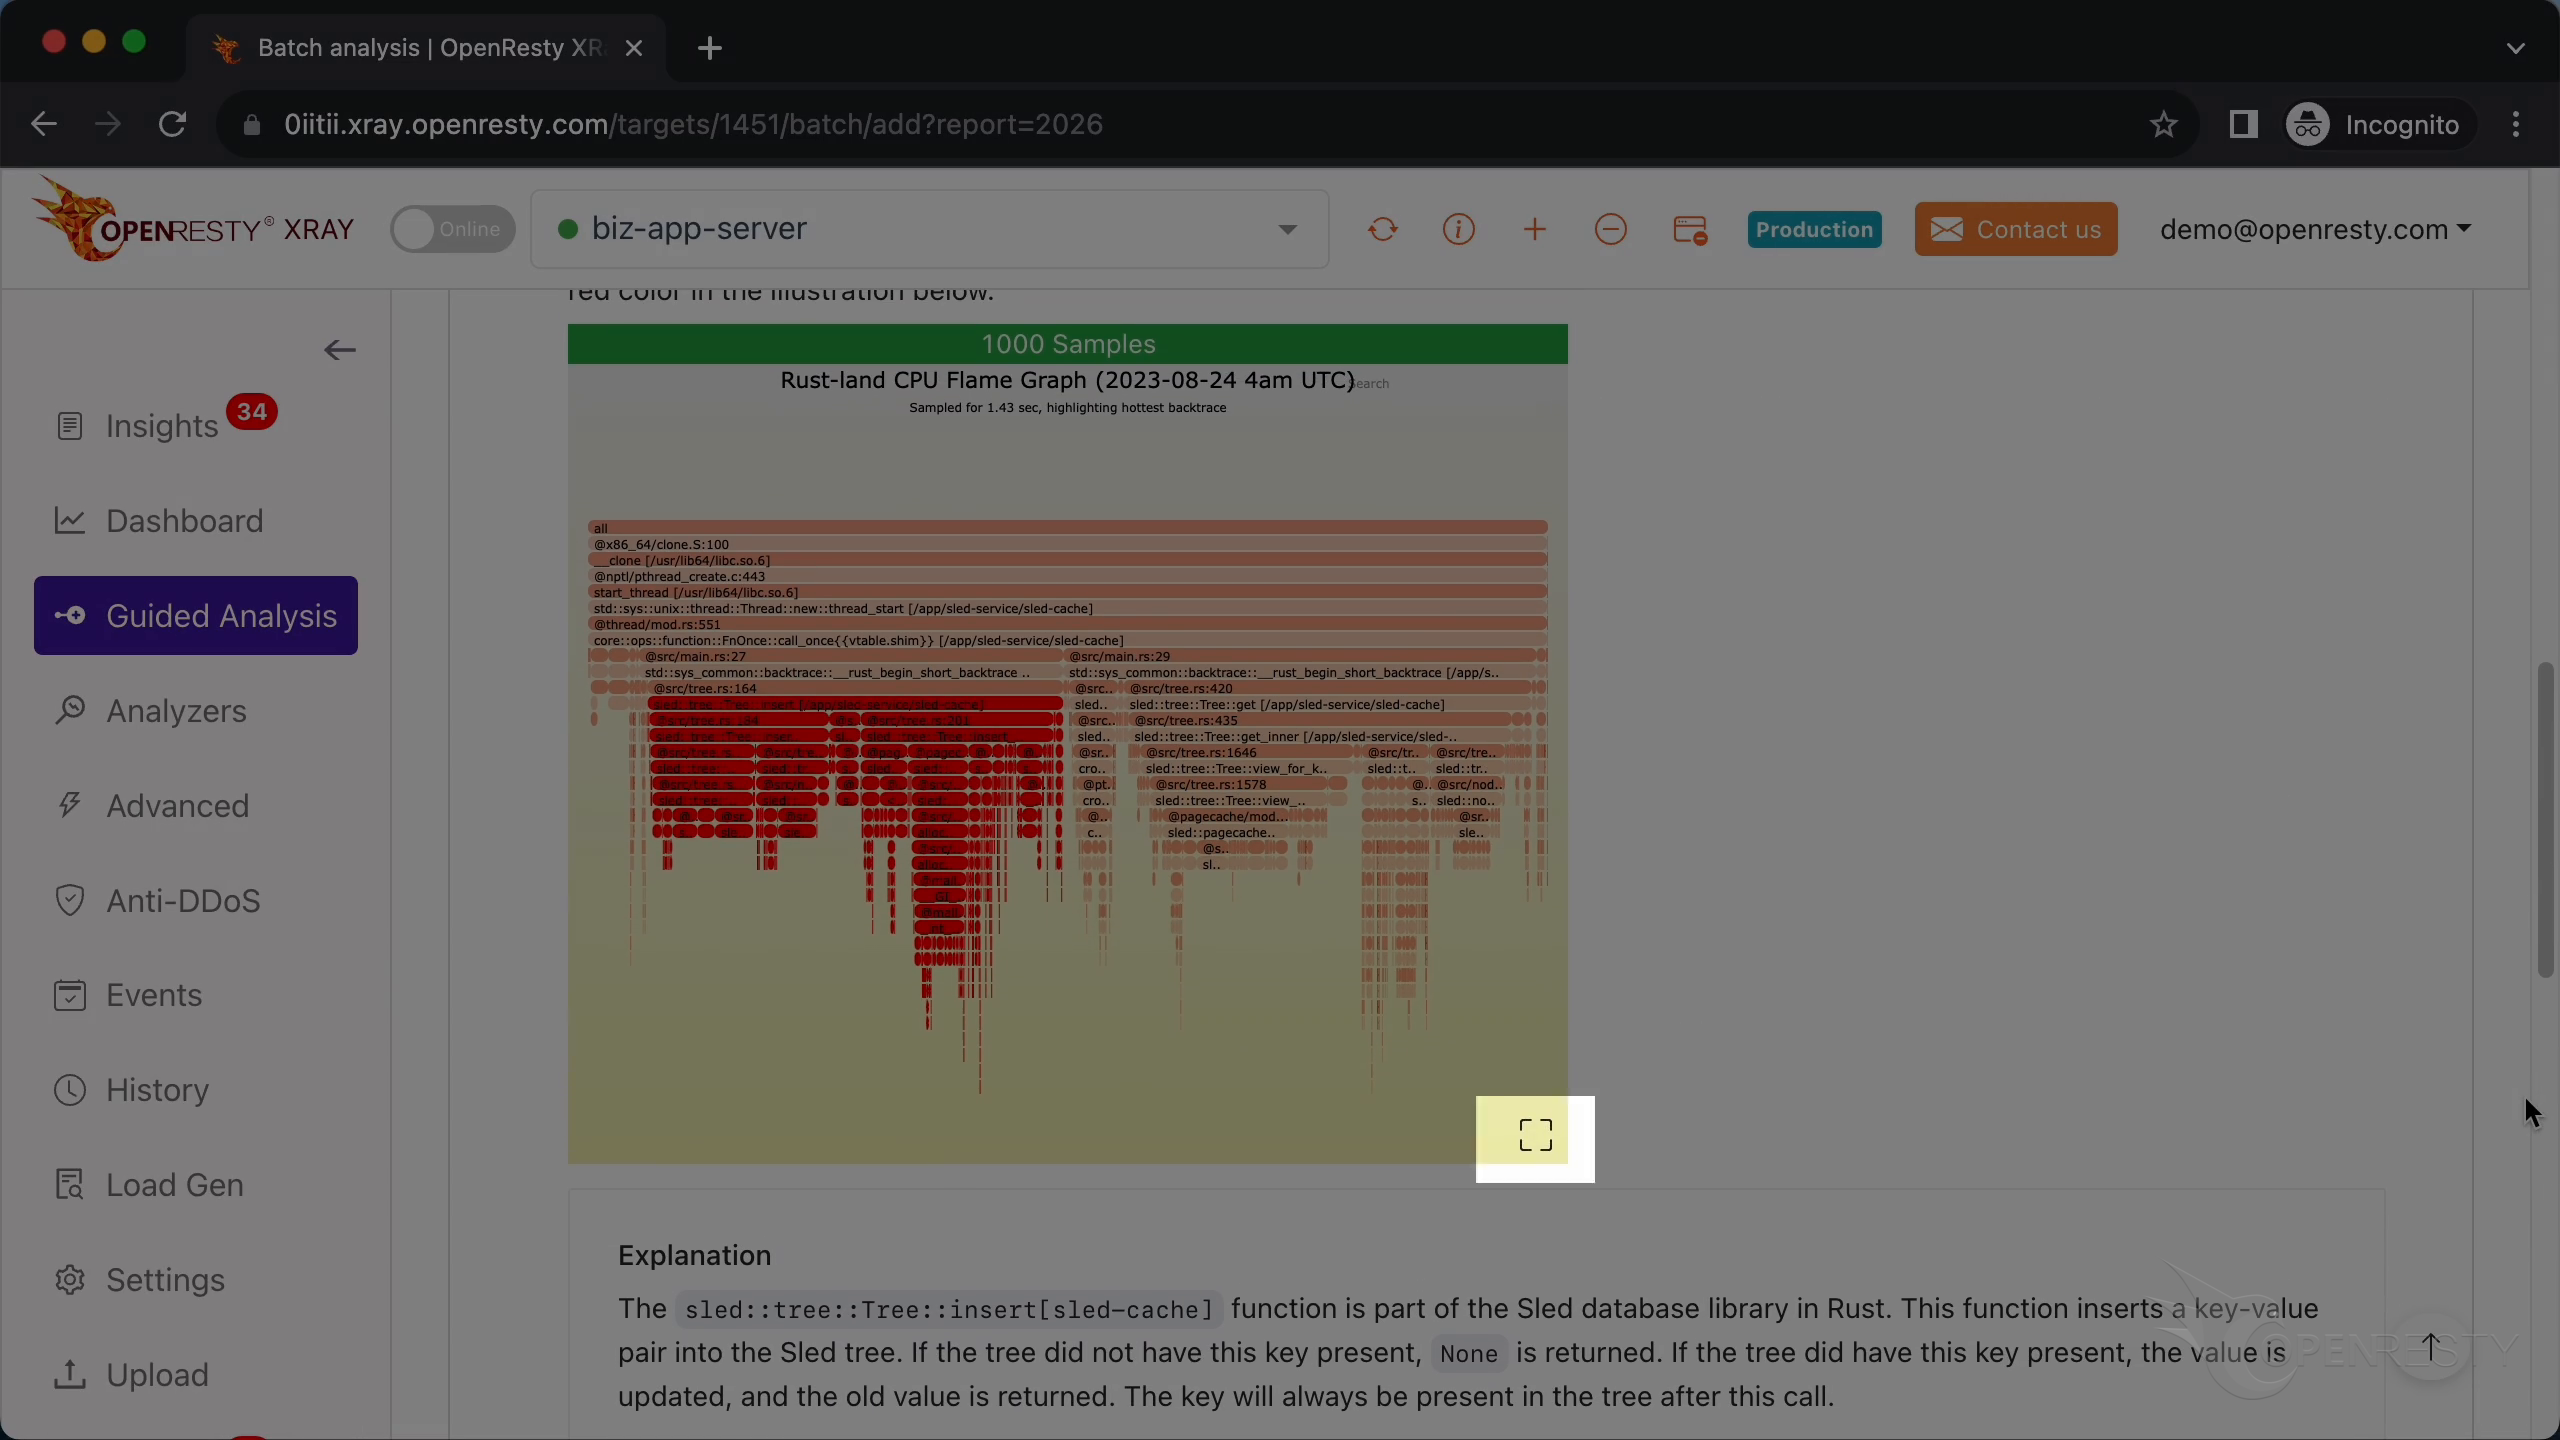
The hot code path above was automatically inferred from the Rust-land CPU flame graph below.
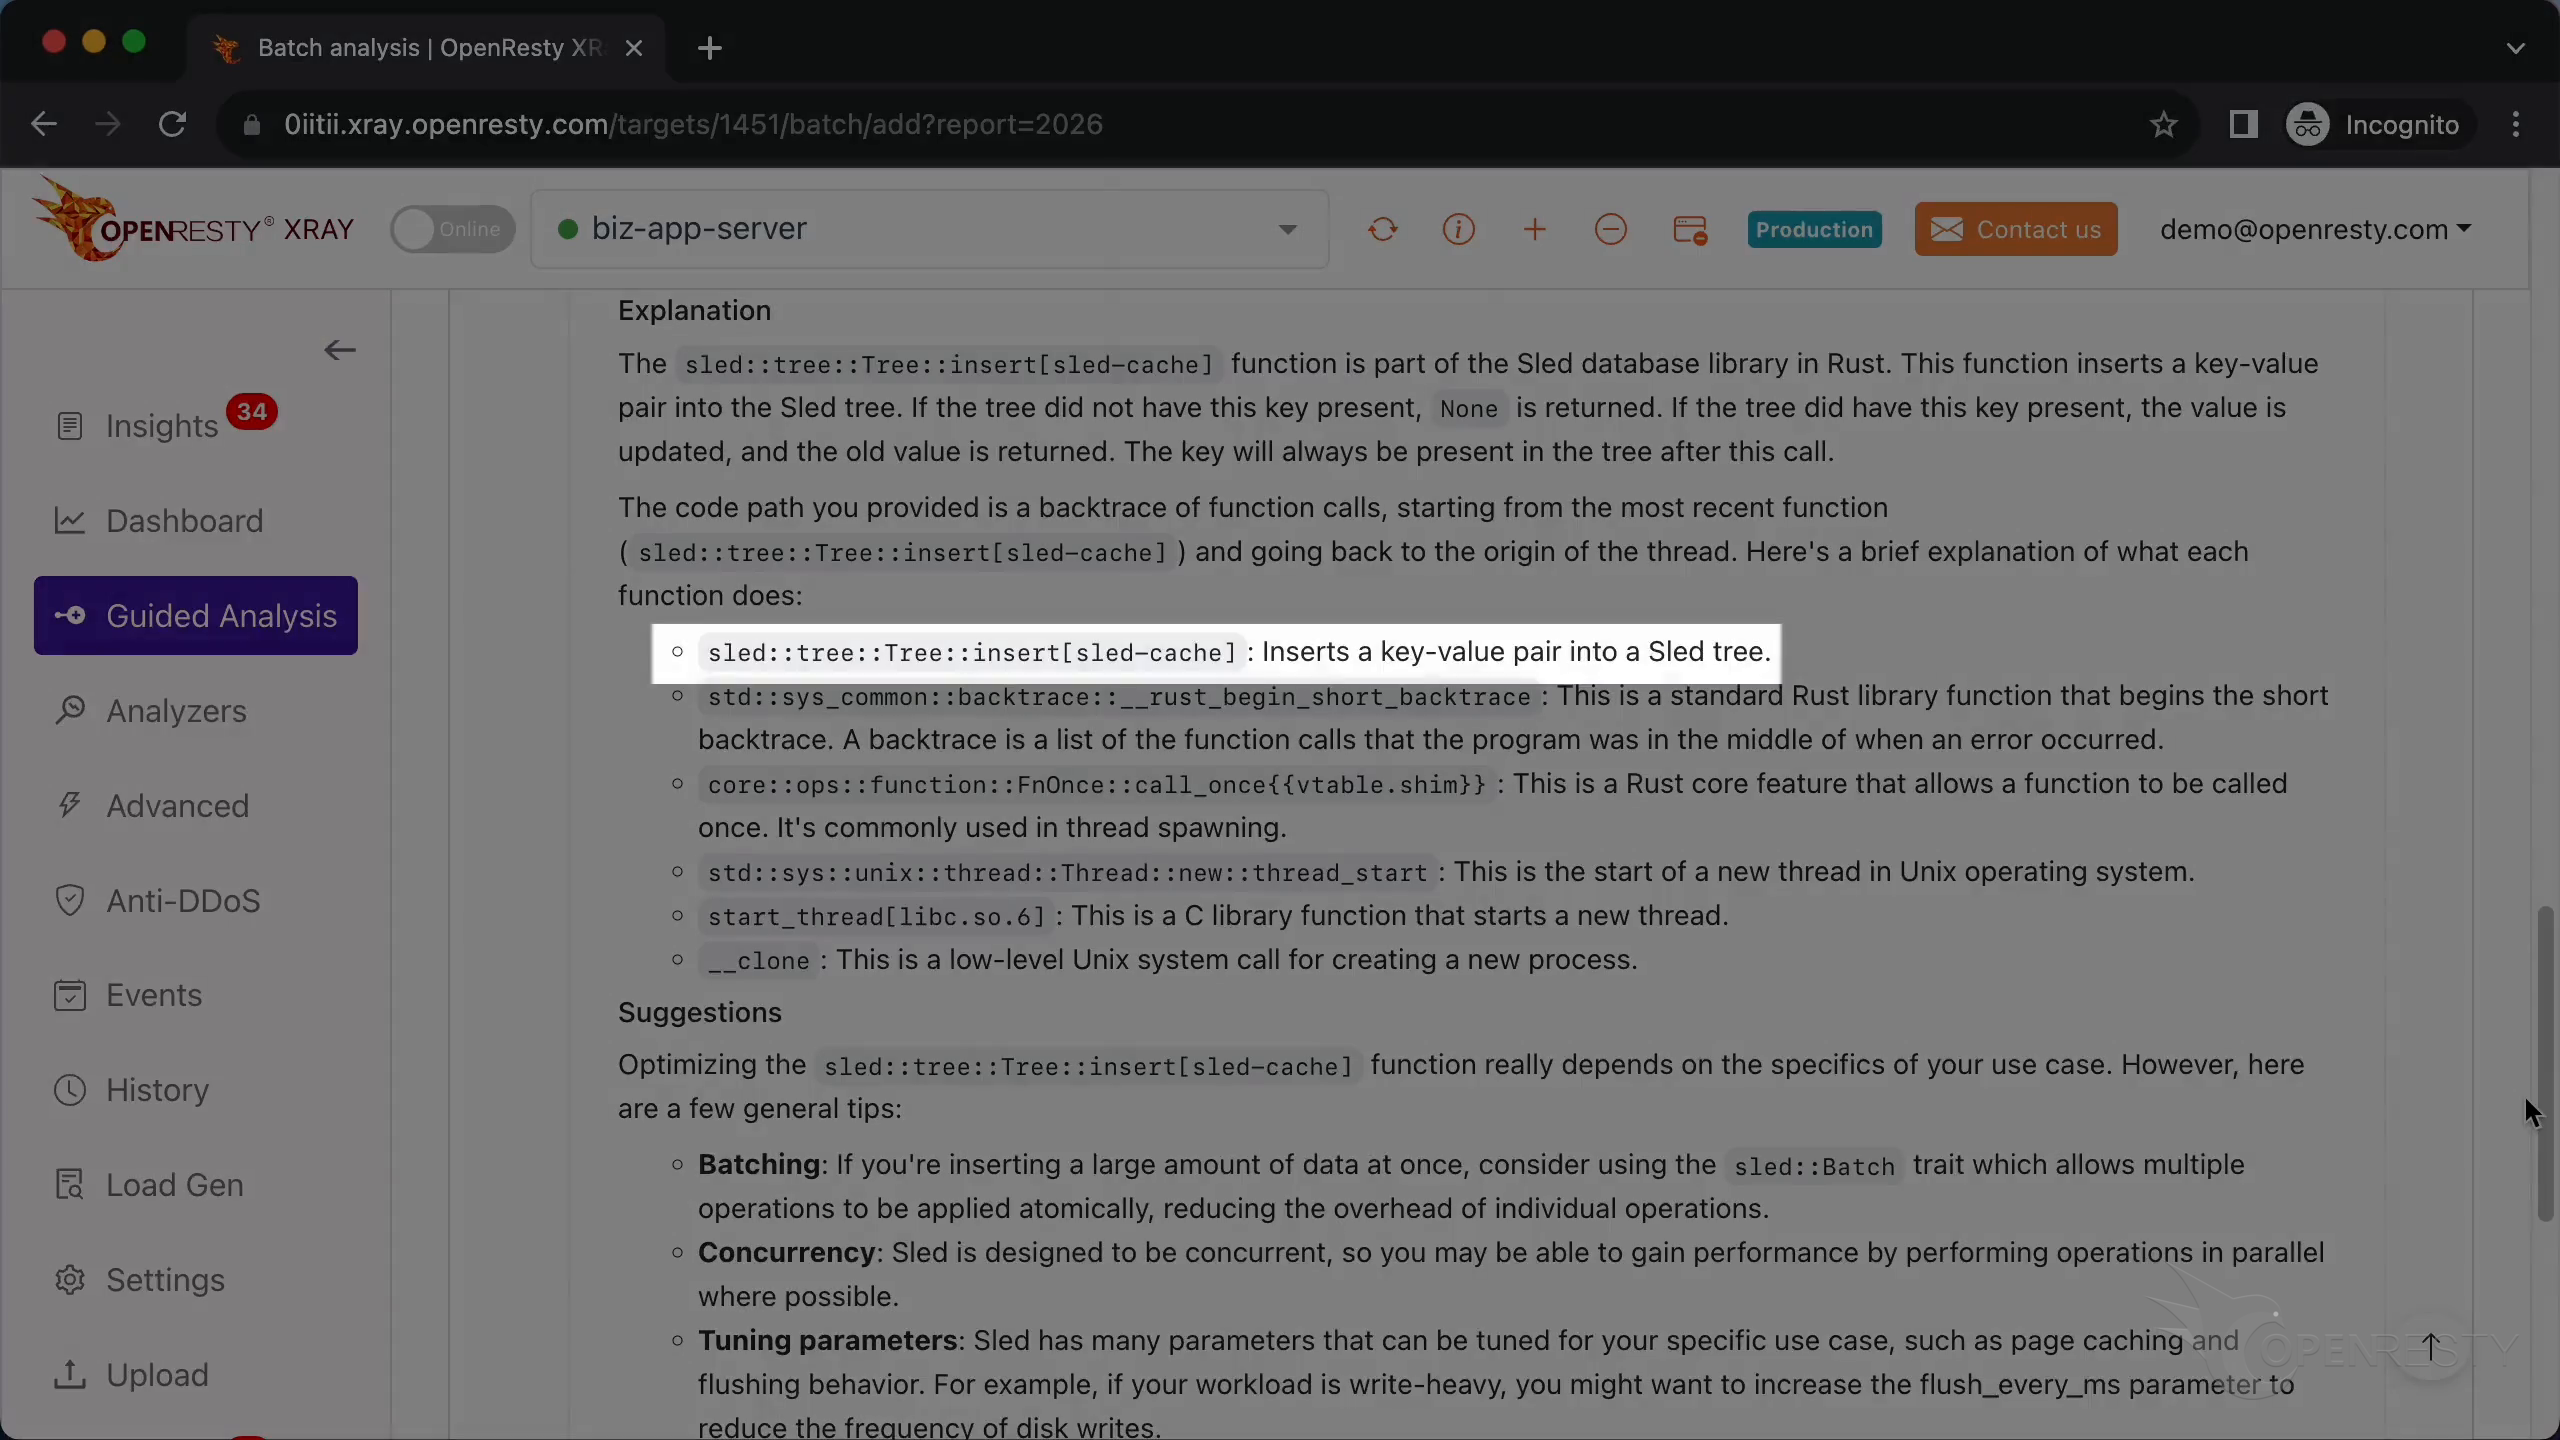
Below are the more detailed explanations and suggestions that the report gives for the problem: the Explanation section describes insert and each function along its call chain, while the Suggestions section points to optimizations such as batched writes (sled::Batch), concurrency, and parameter tuning.
Click this icon to enlarge the flame graph.
Click the insert function frame to see more details.
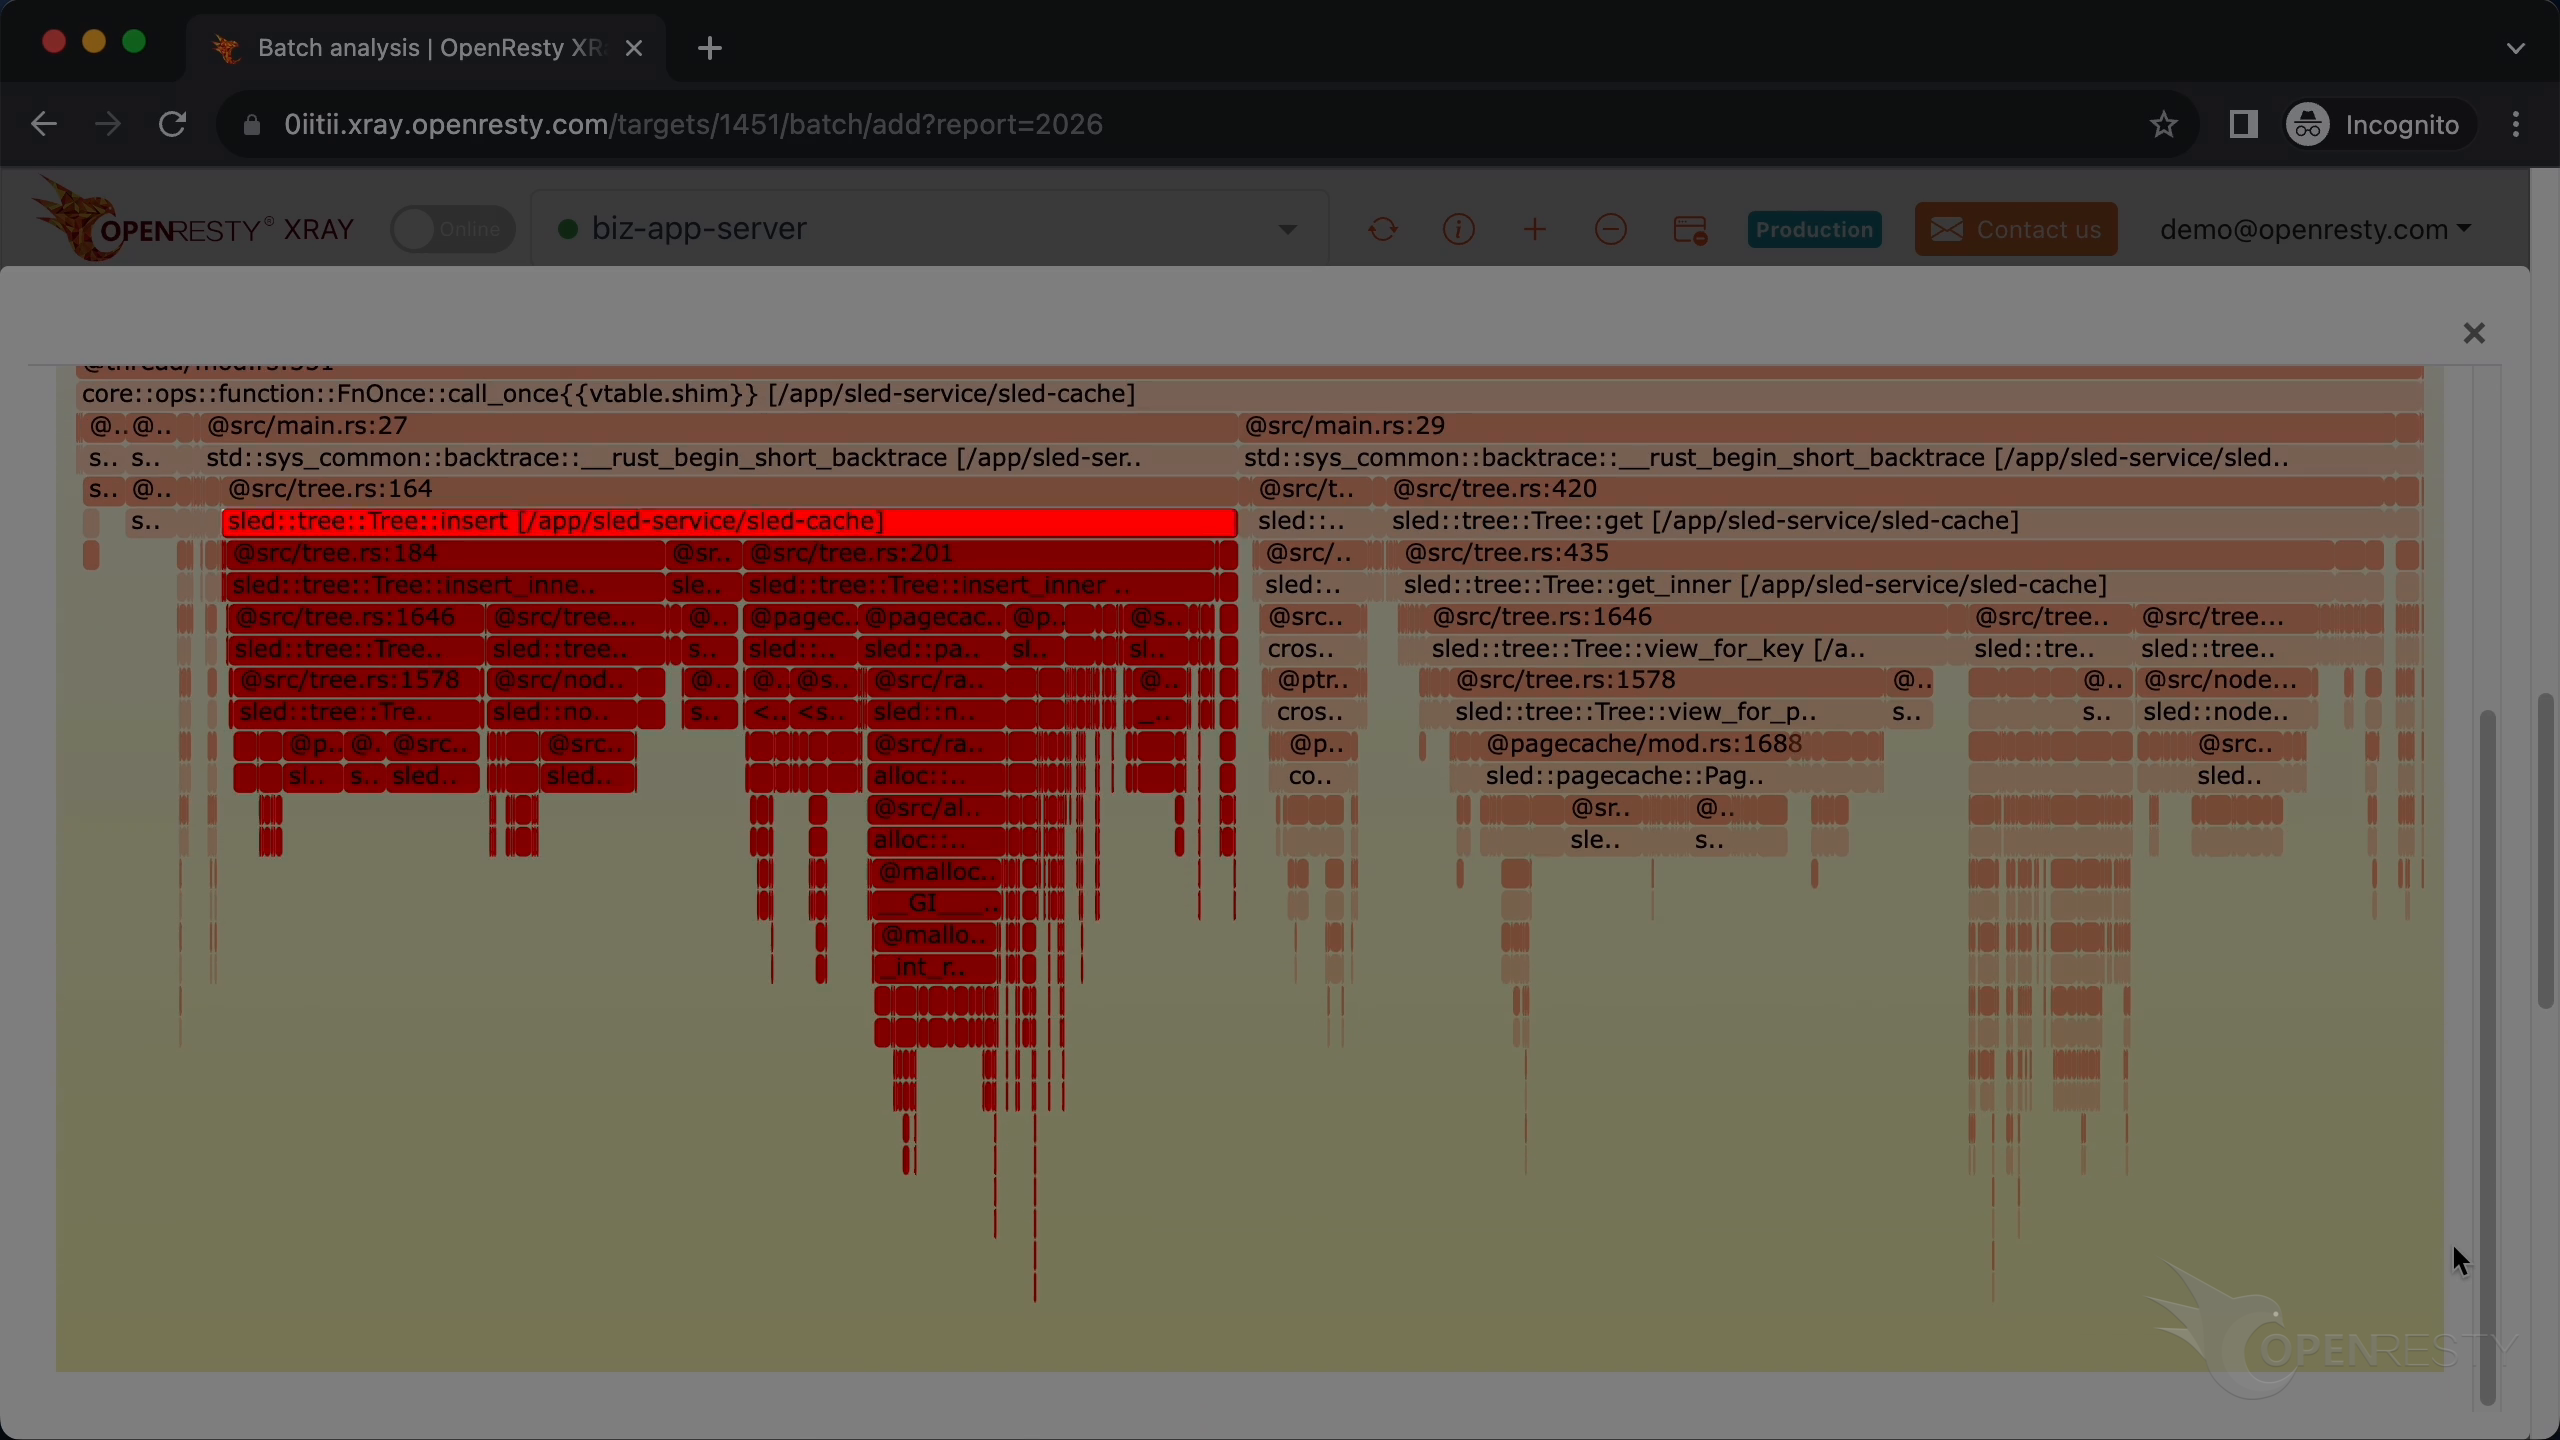
On the left side, the view_for_key function takes a large portion — this is the function in the Sled library that gets a snapshot view for a given key.
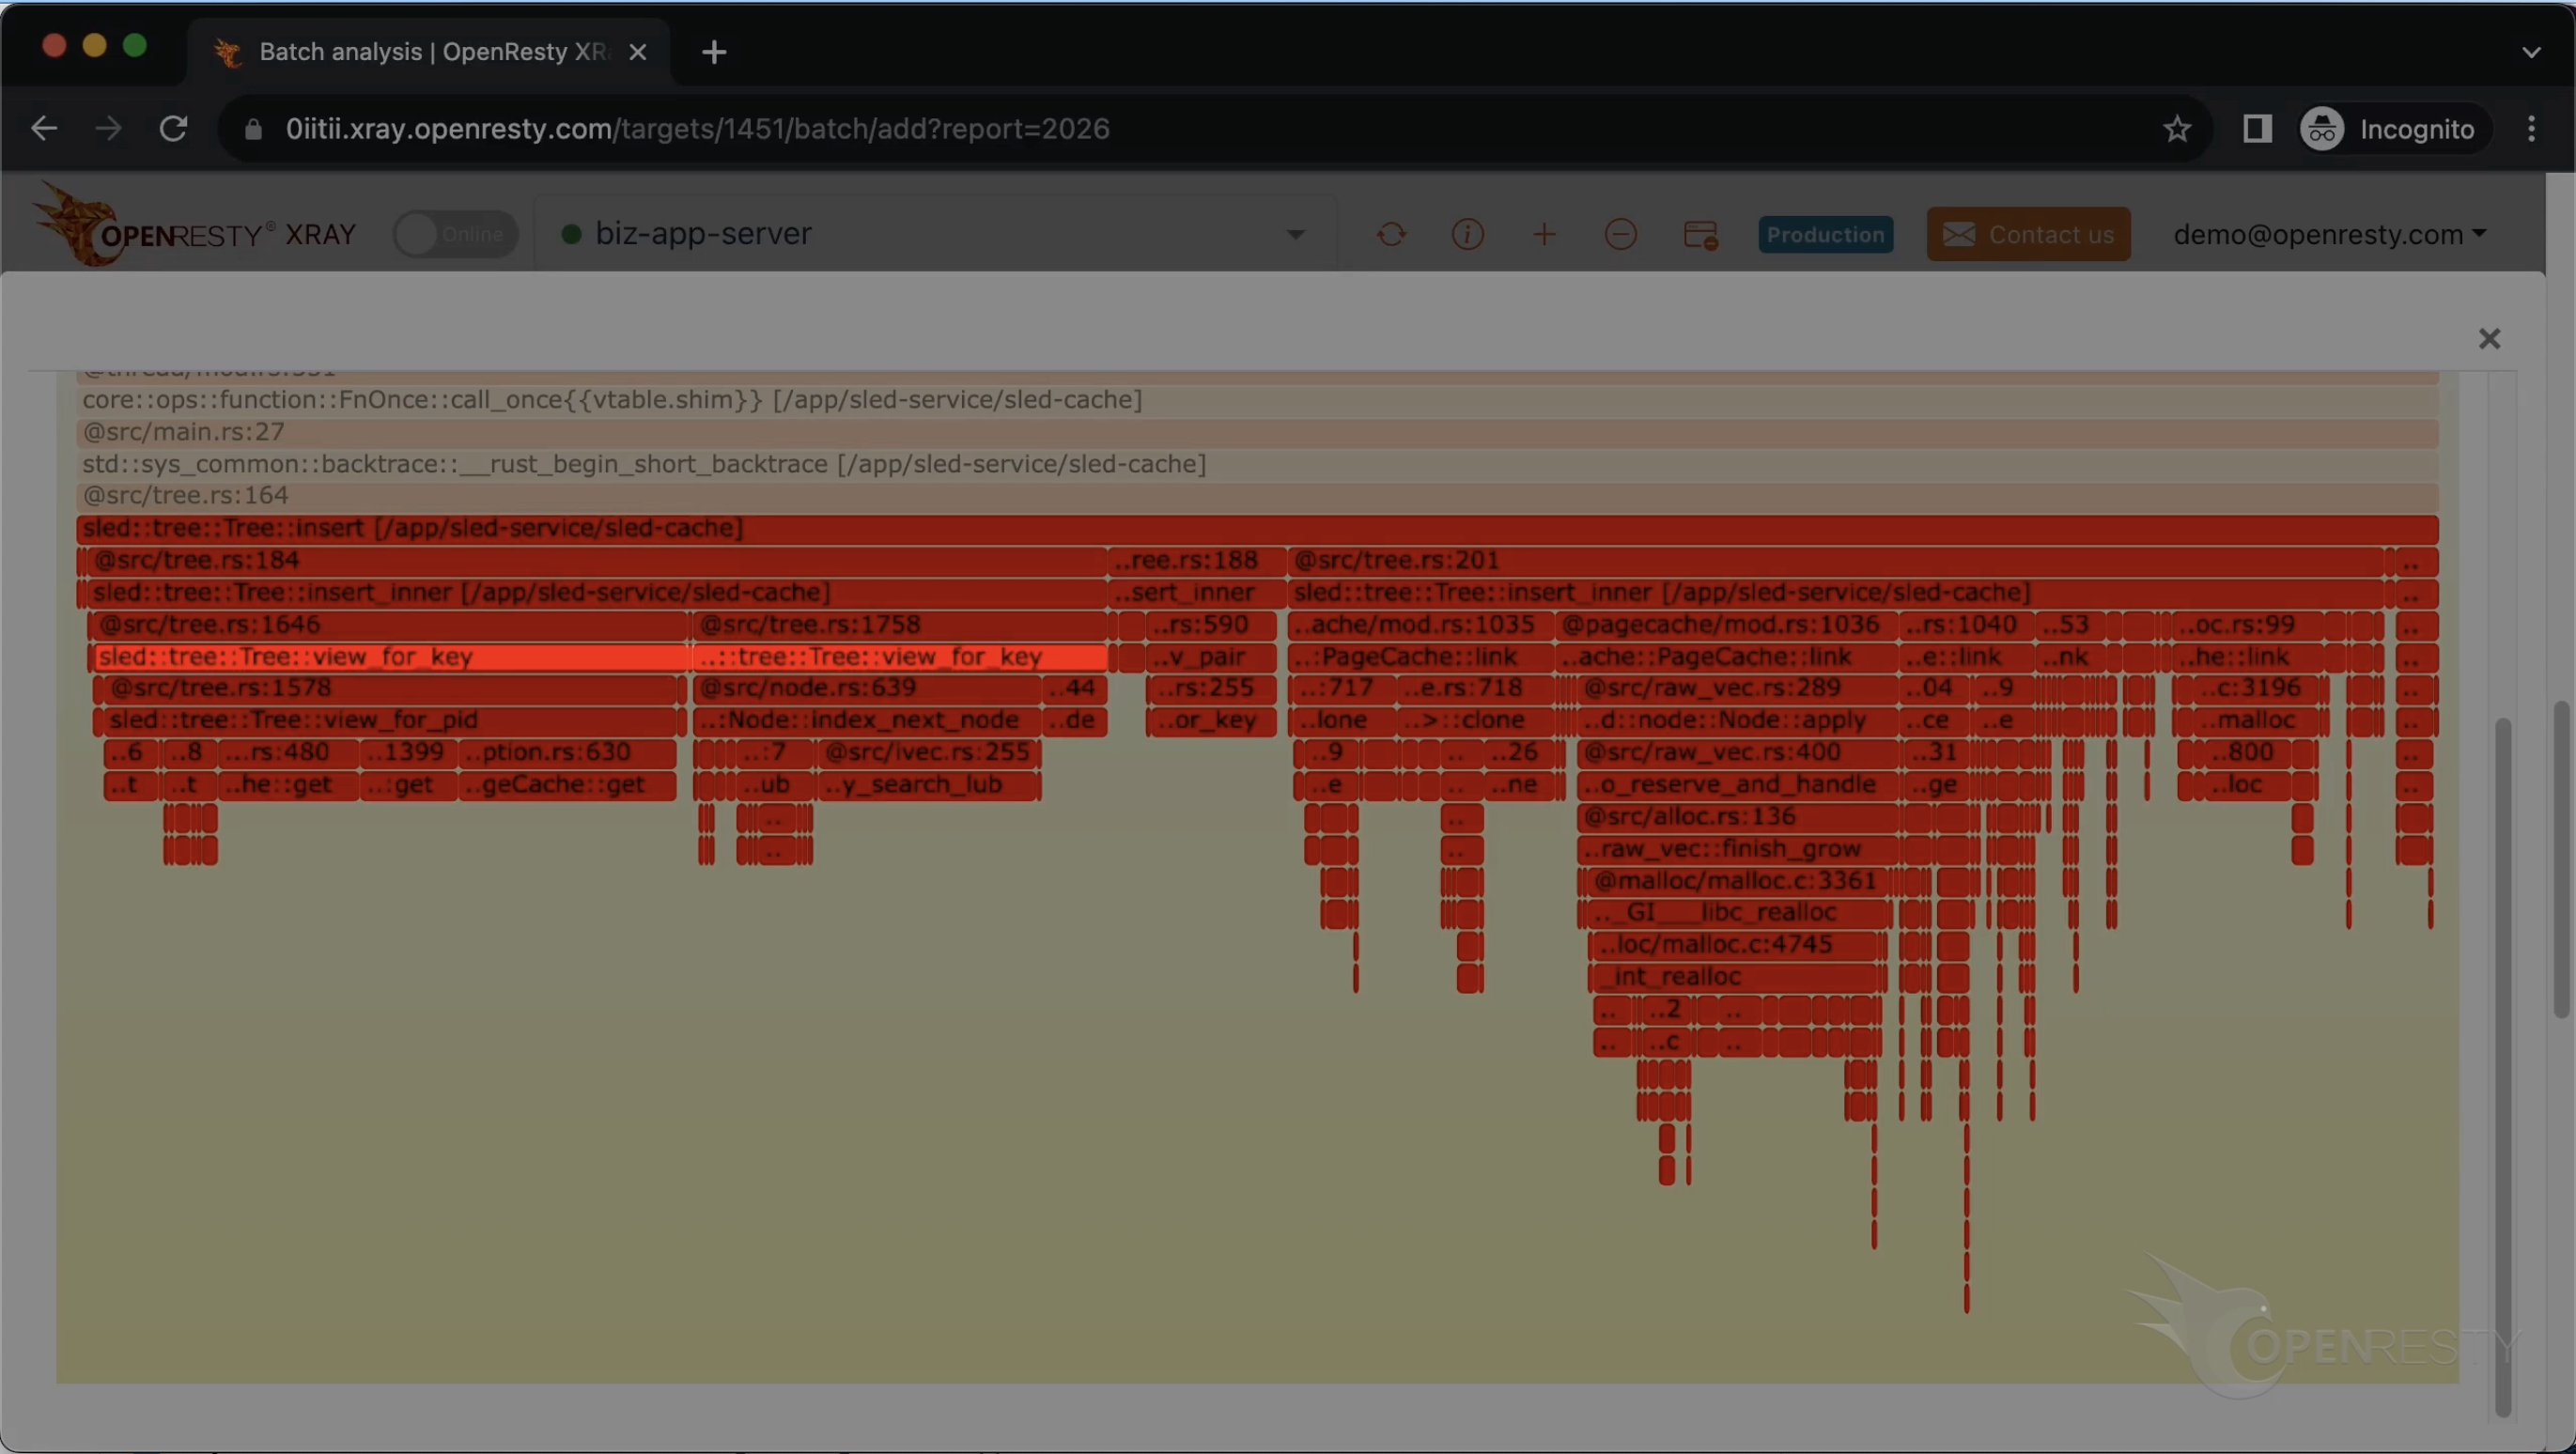
On the right, pagecache is a component of Sled used to manage data on a page-by-page basis. Writes are first stored in the pagecache’s memory page, then persisted by flushing to disk when the batch is full.
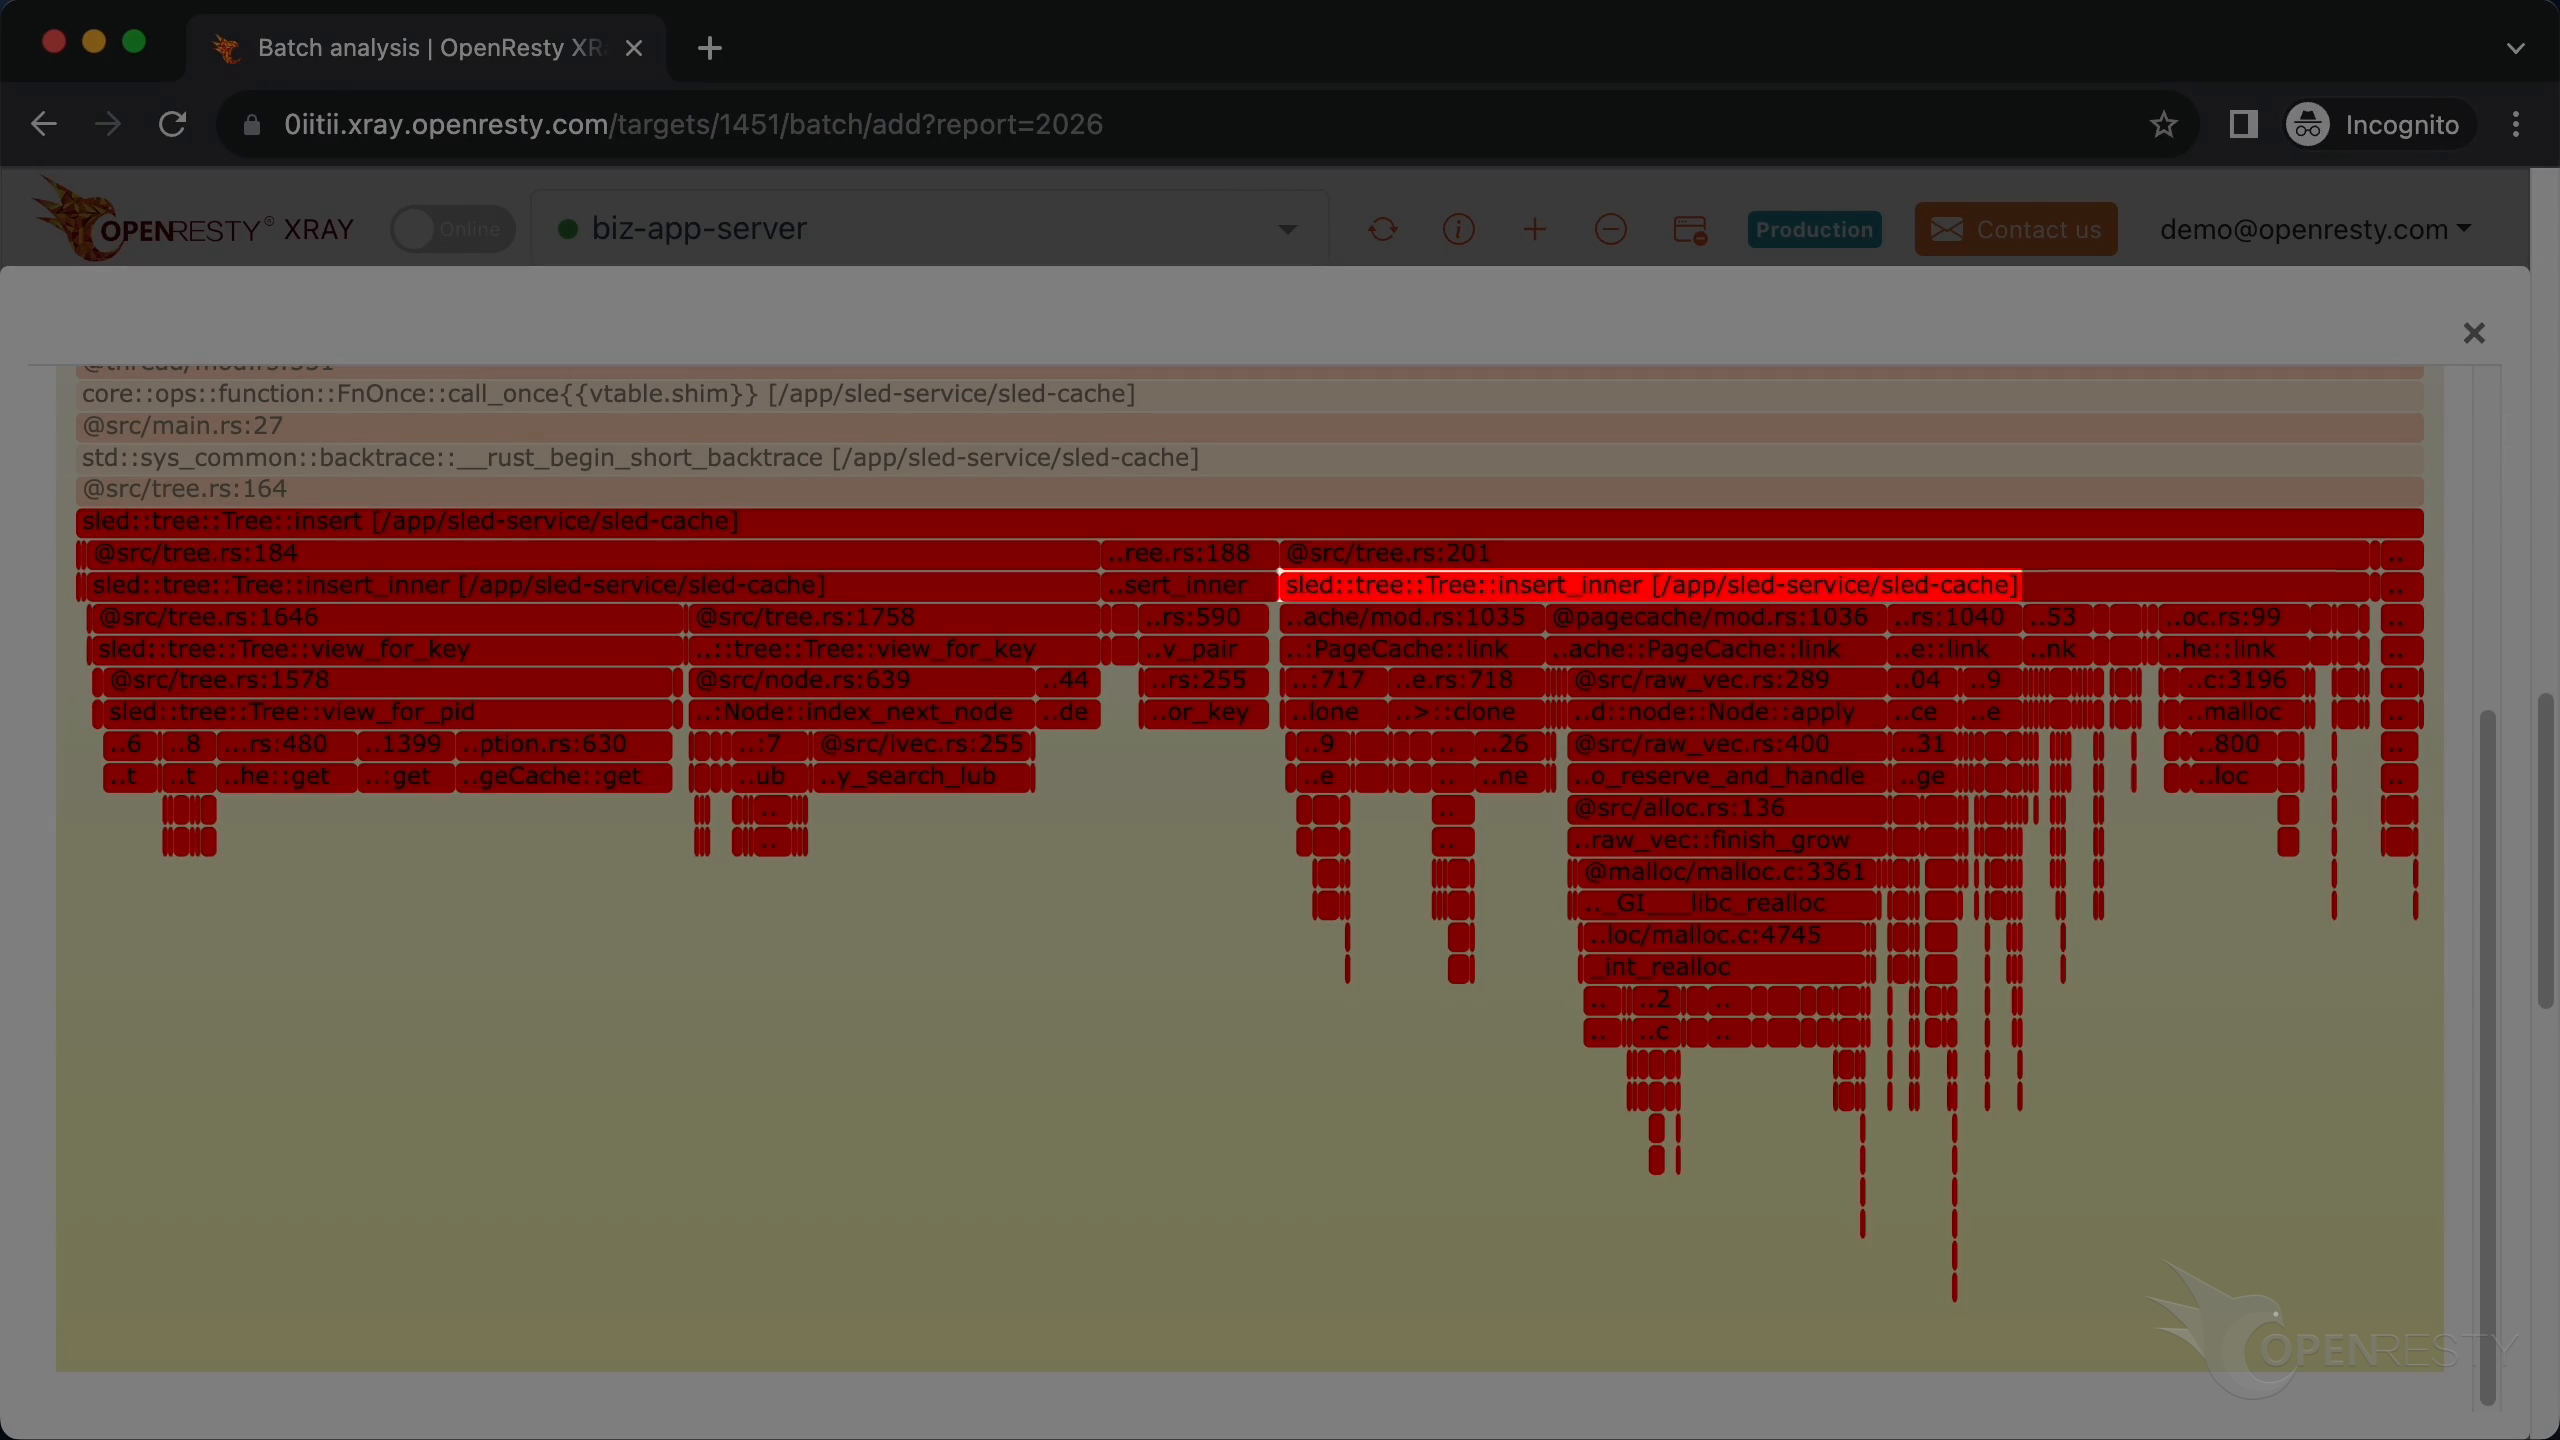
Keep zooming in.
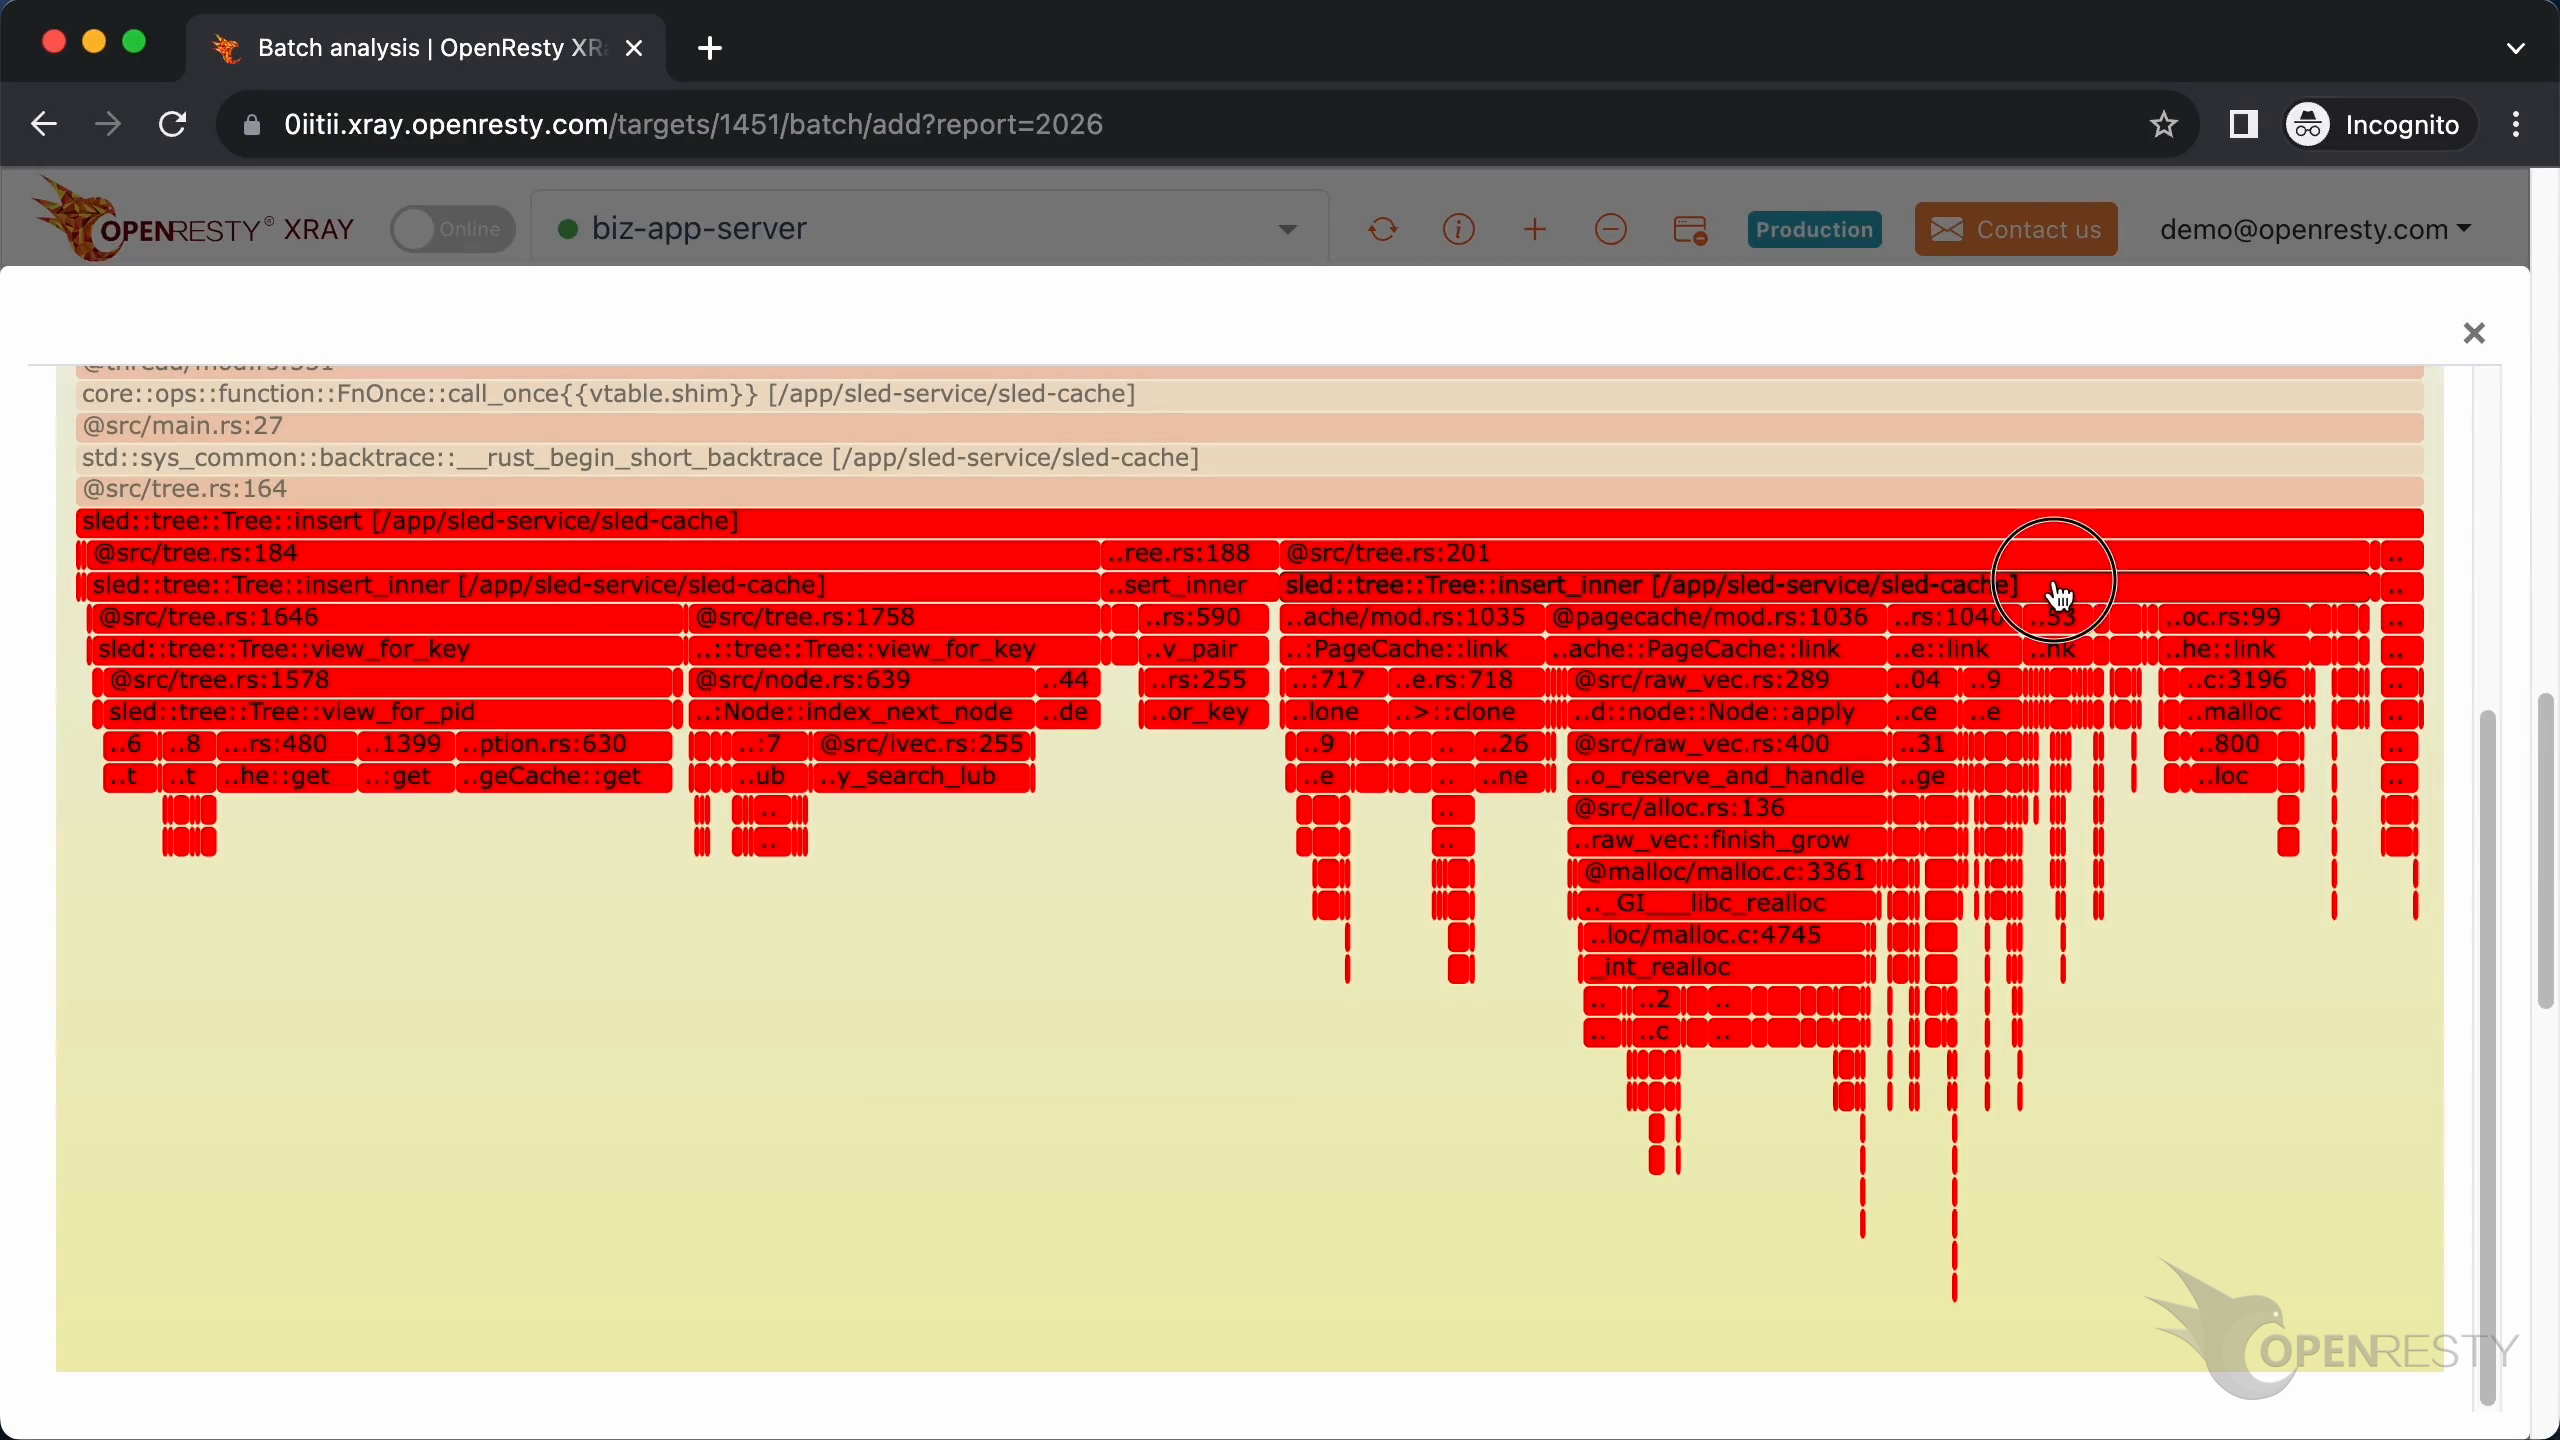
You can see the realloc function in glibc — libc’s memory allocation functions are hot in this workload.
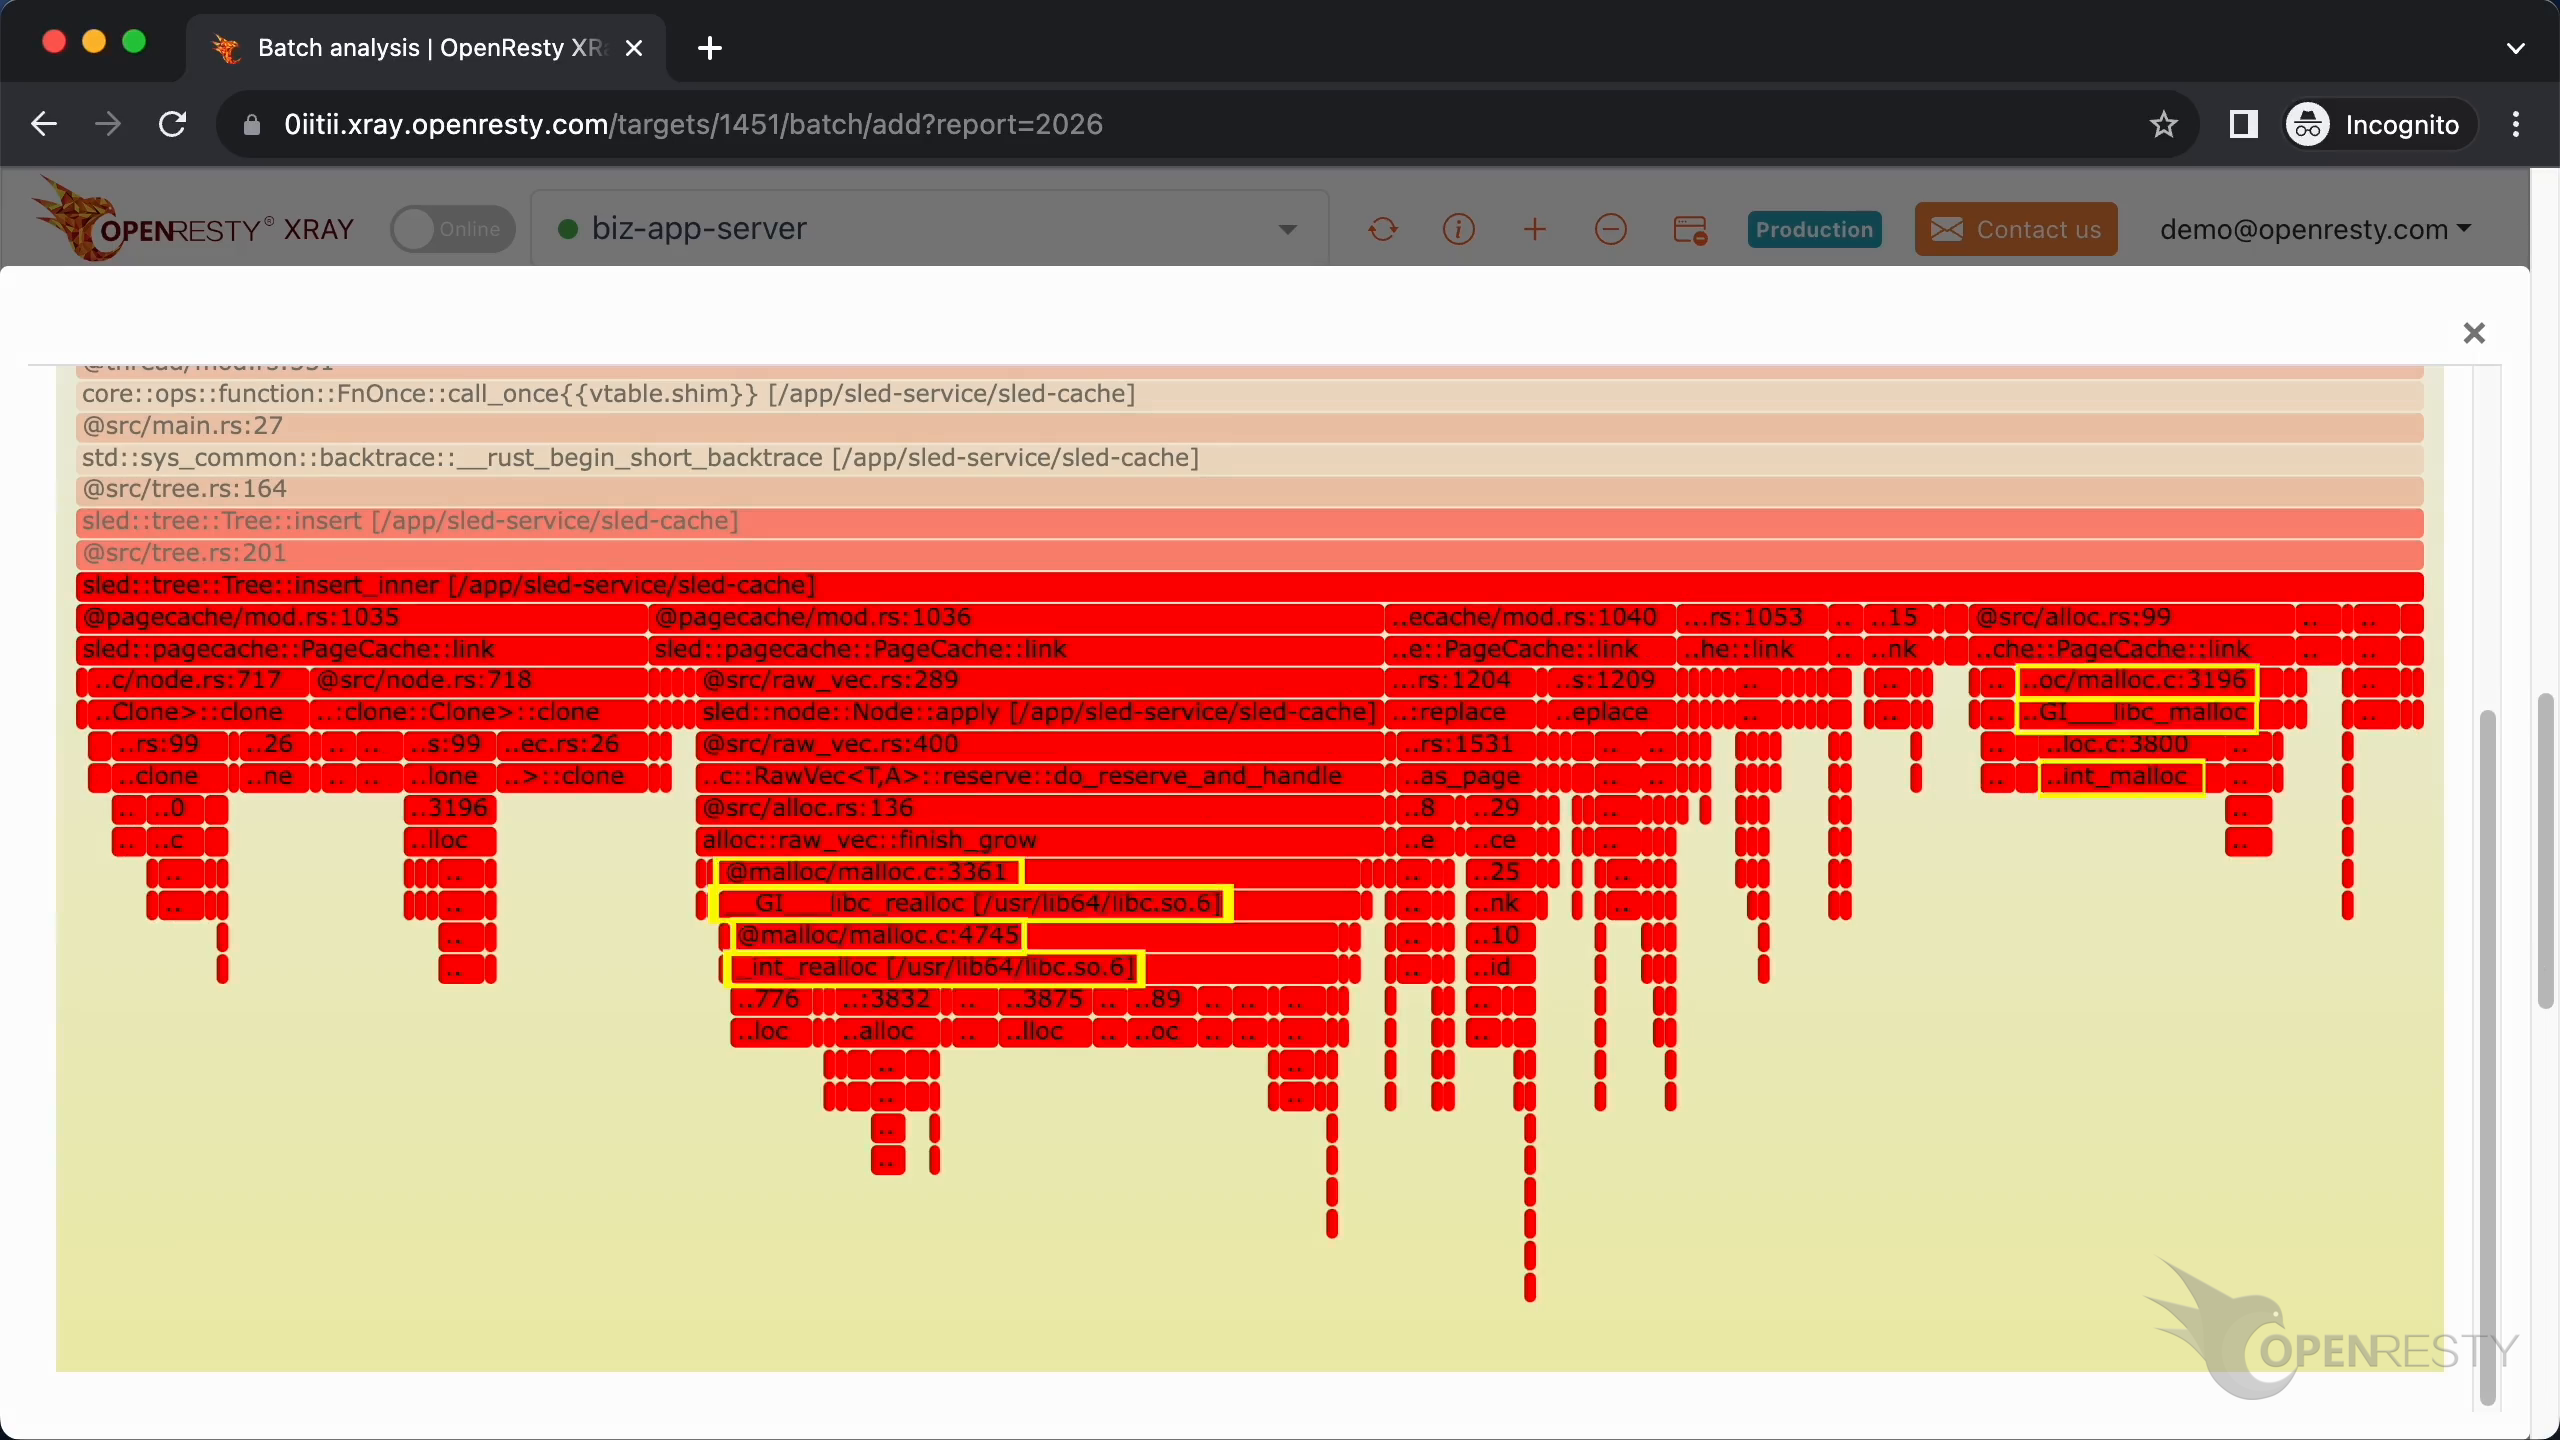
Jump from the Flame Graph to Sled’s Source Code
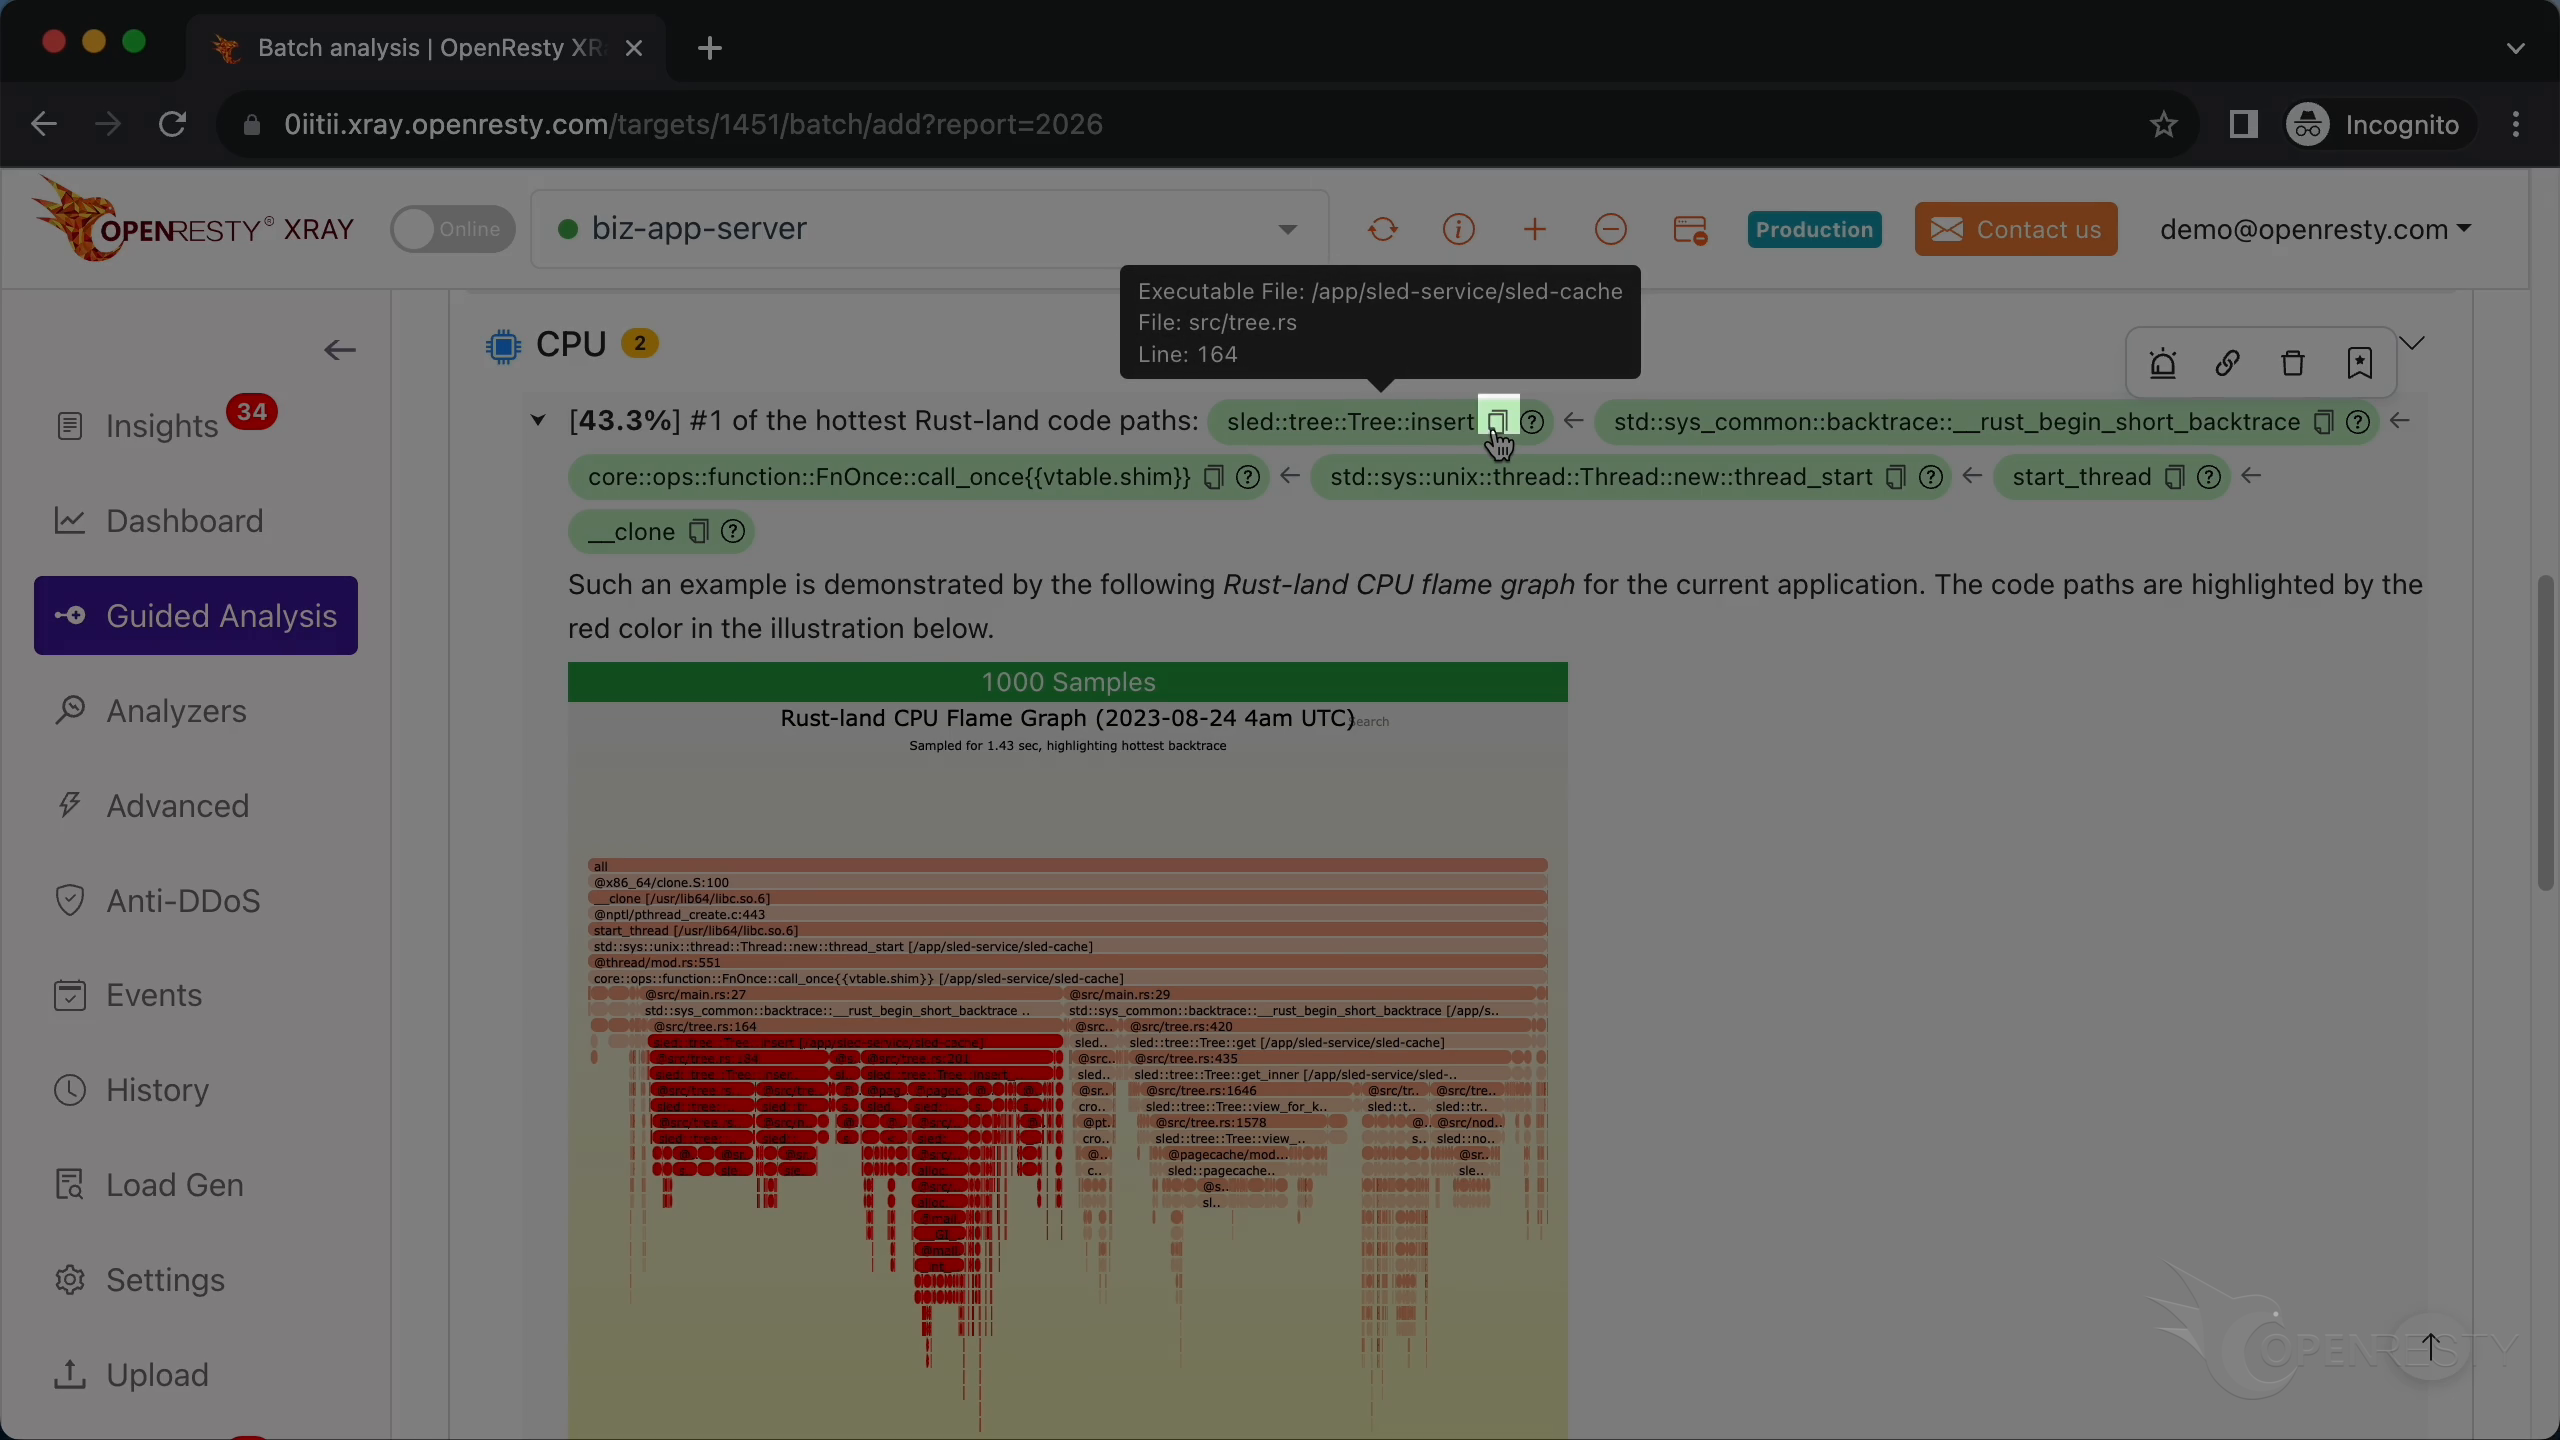
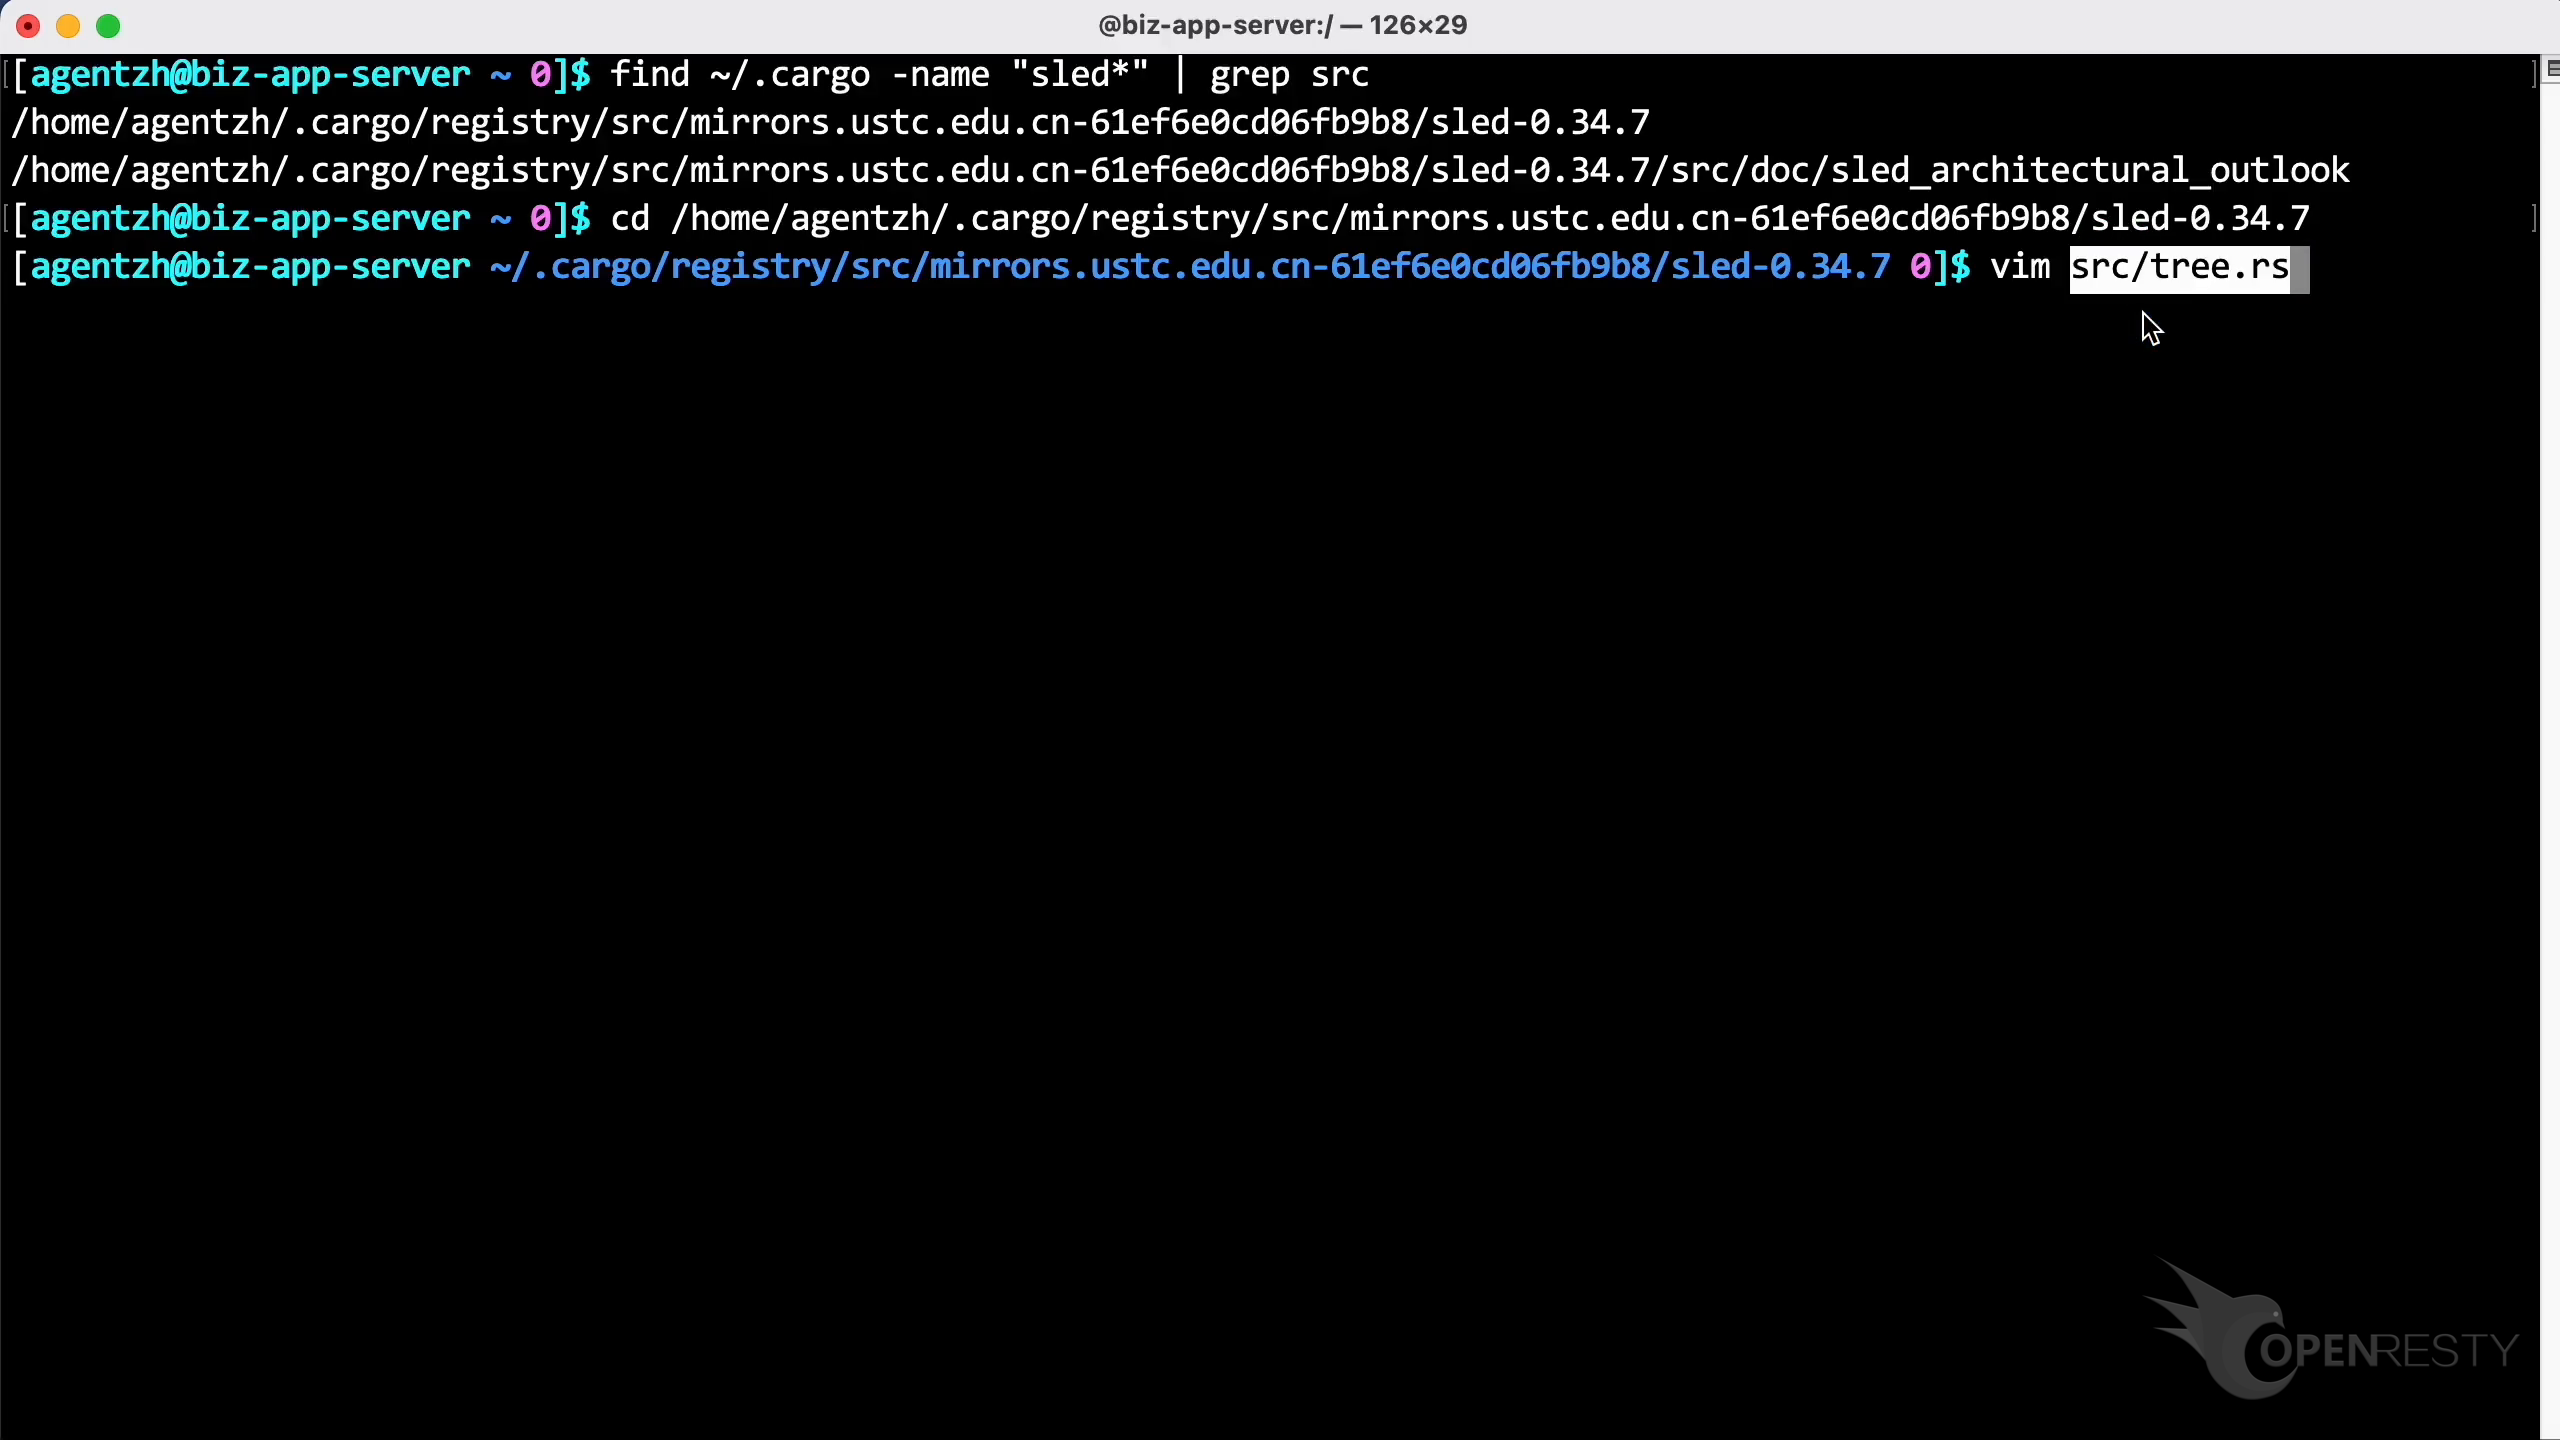
On the terminal, use the find command to locate the Sled library source code directory in the cargo cache.
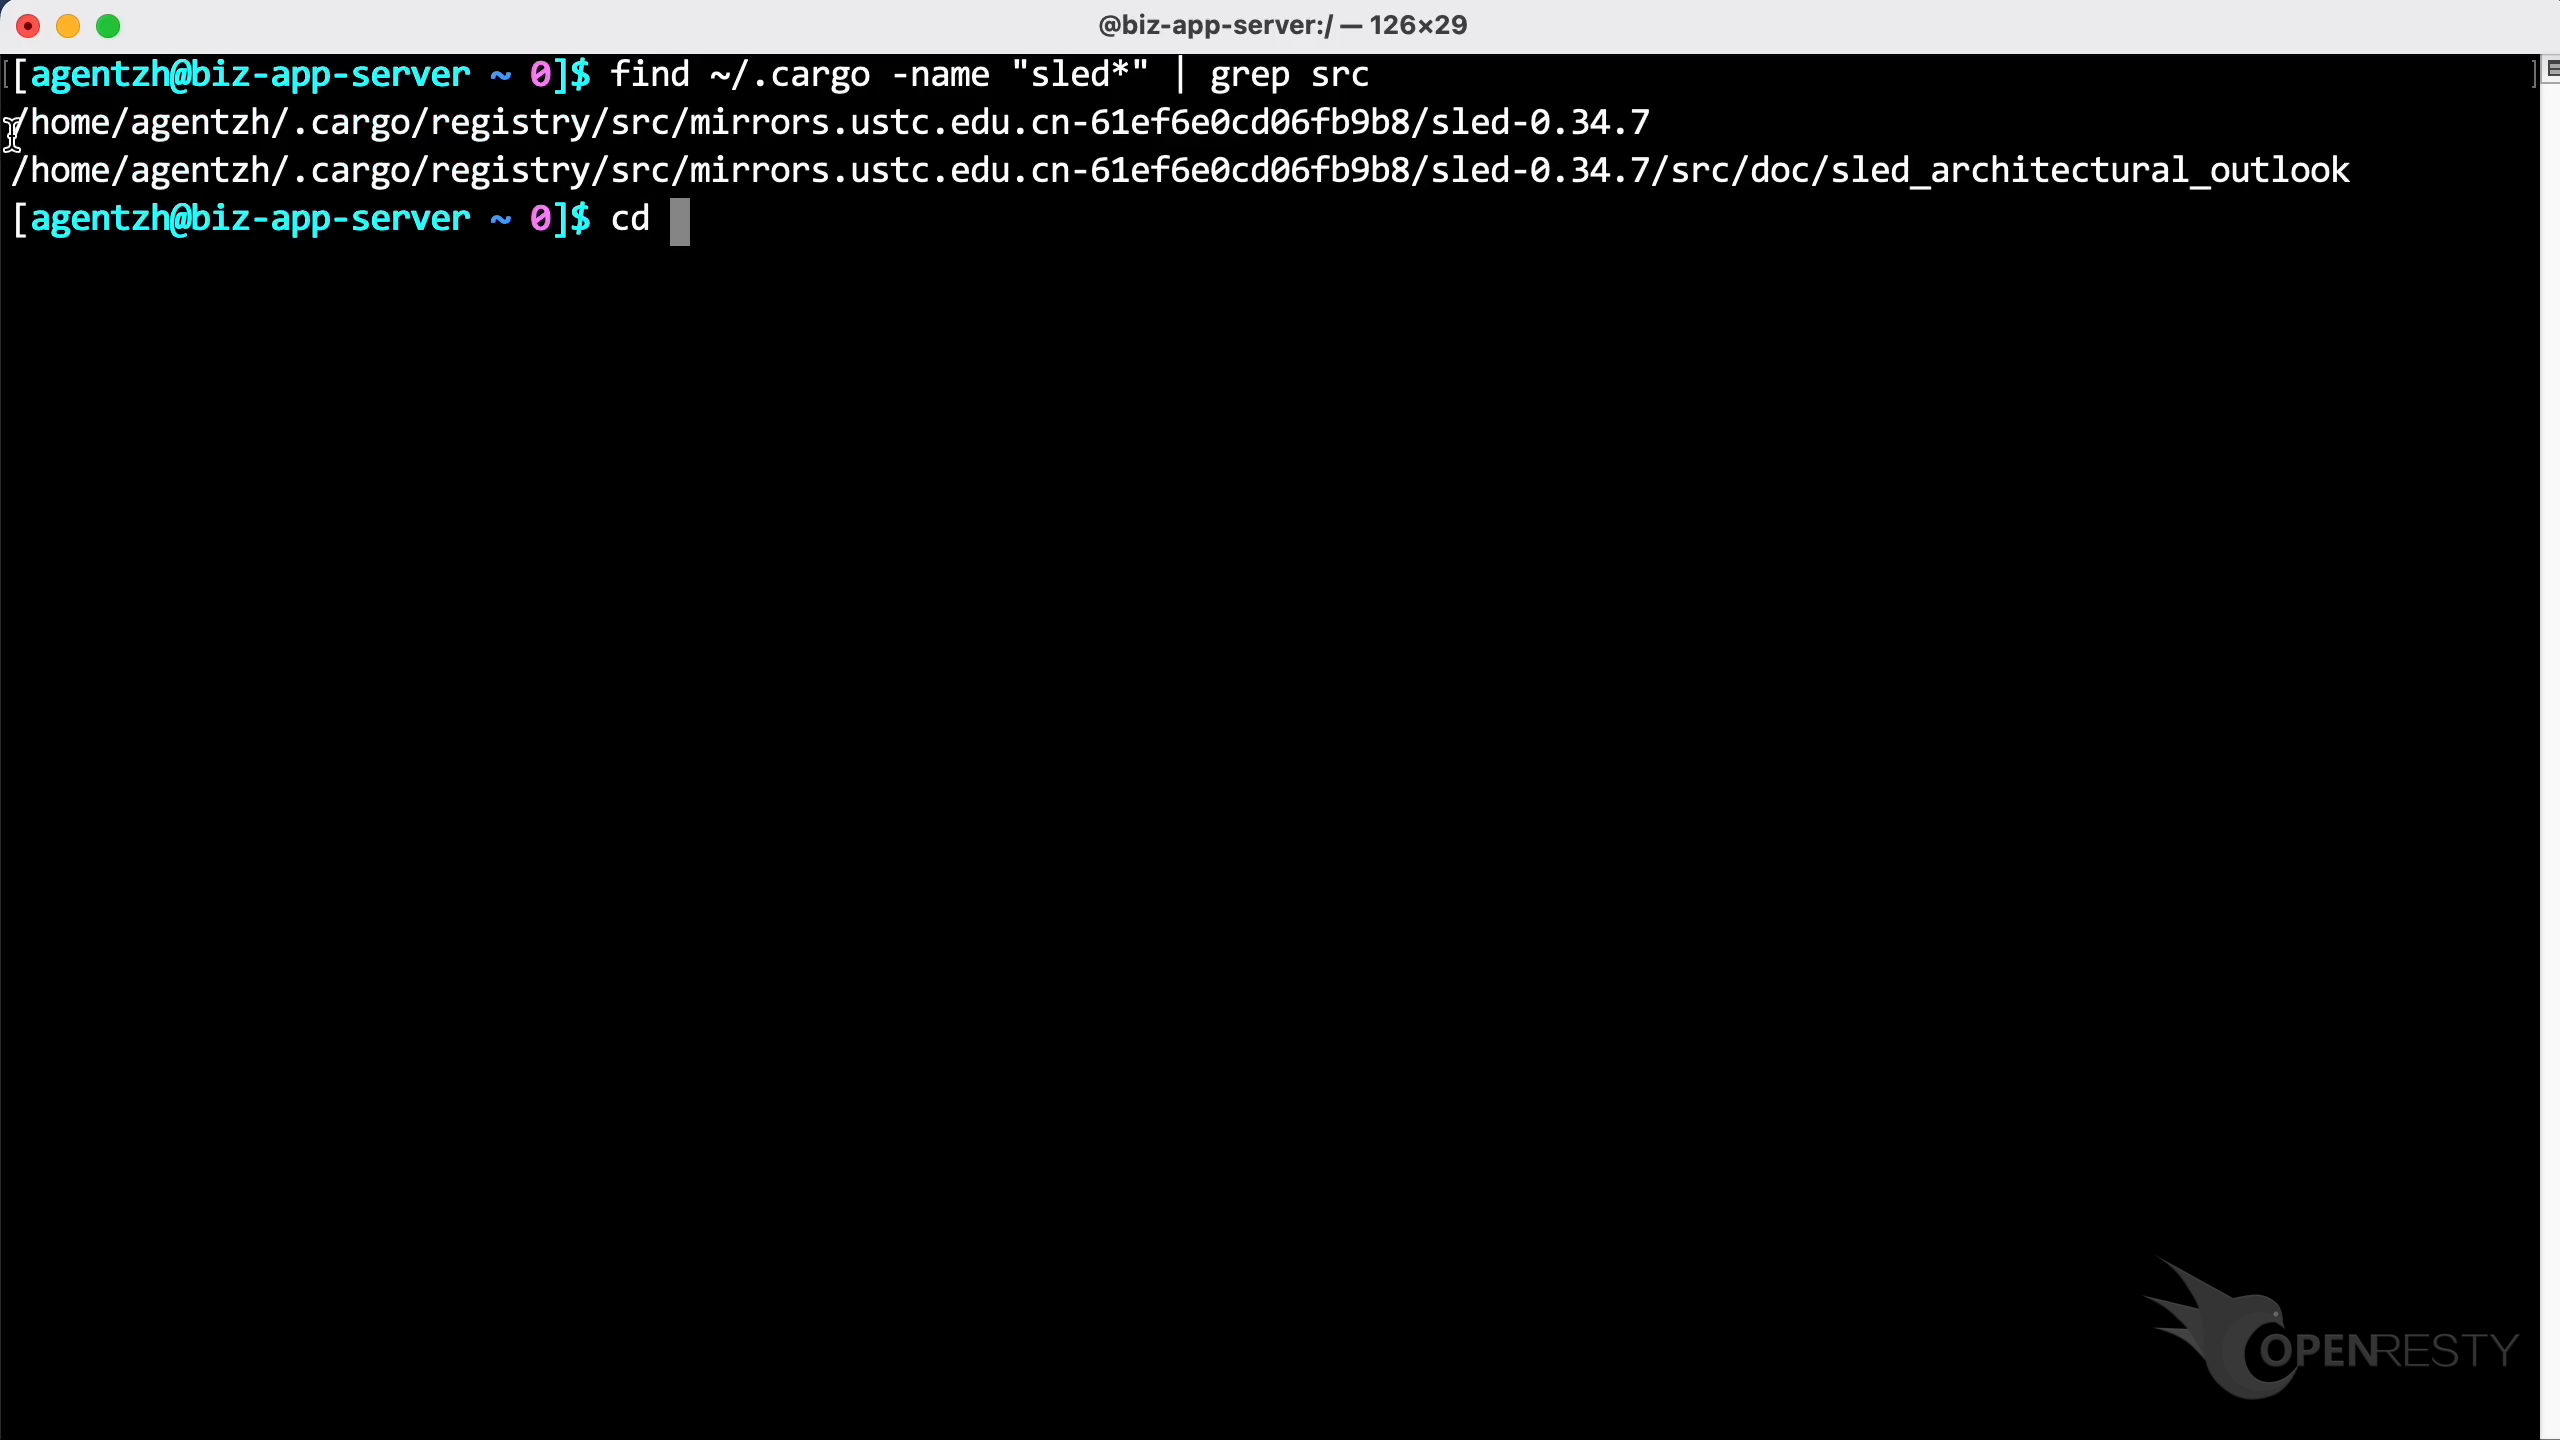
Copy the directory found and enter the Sled source code directory.
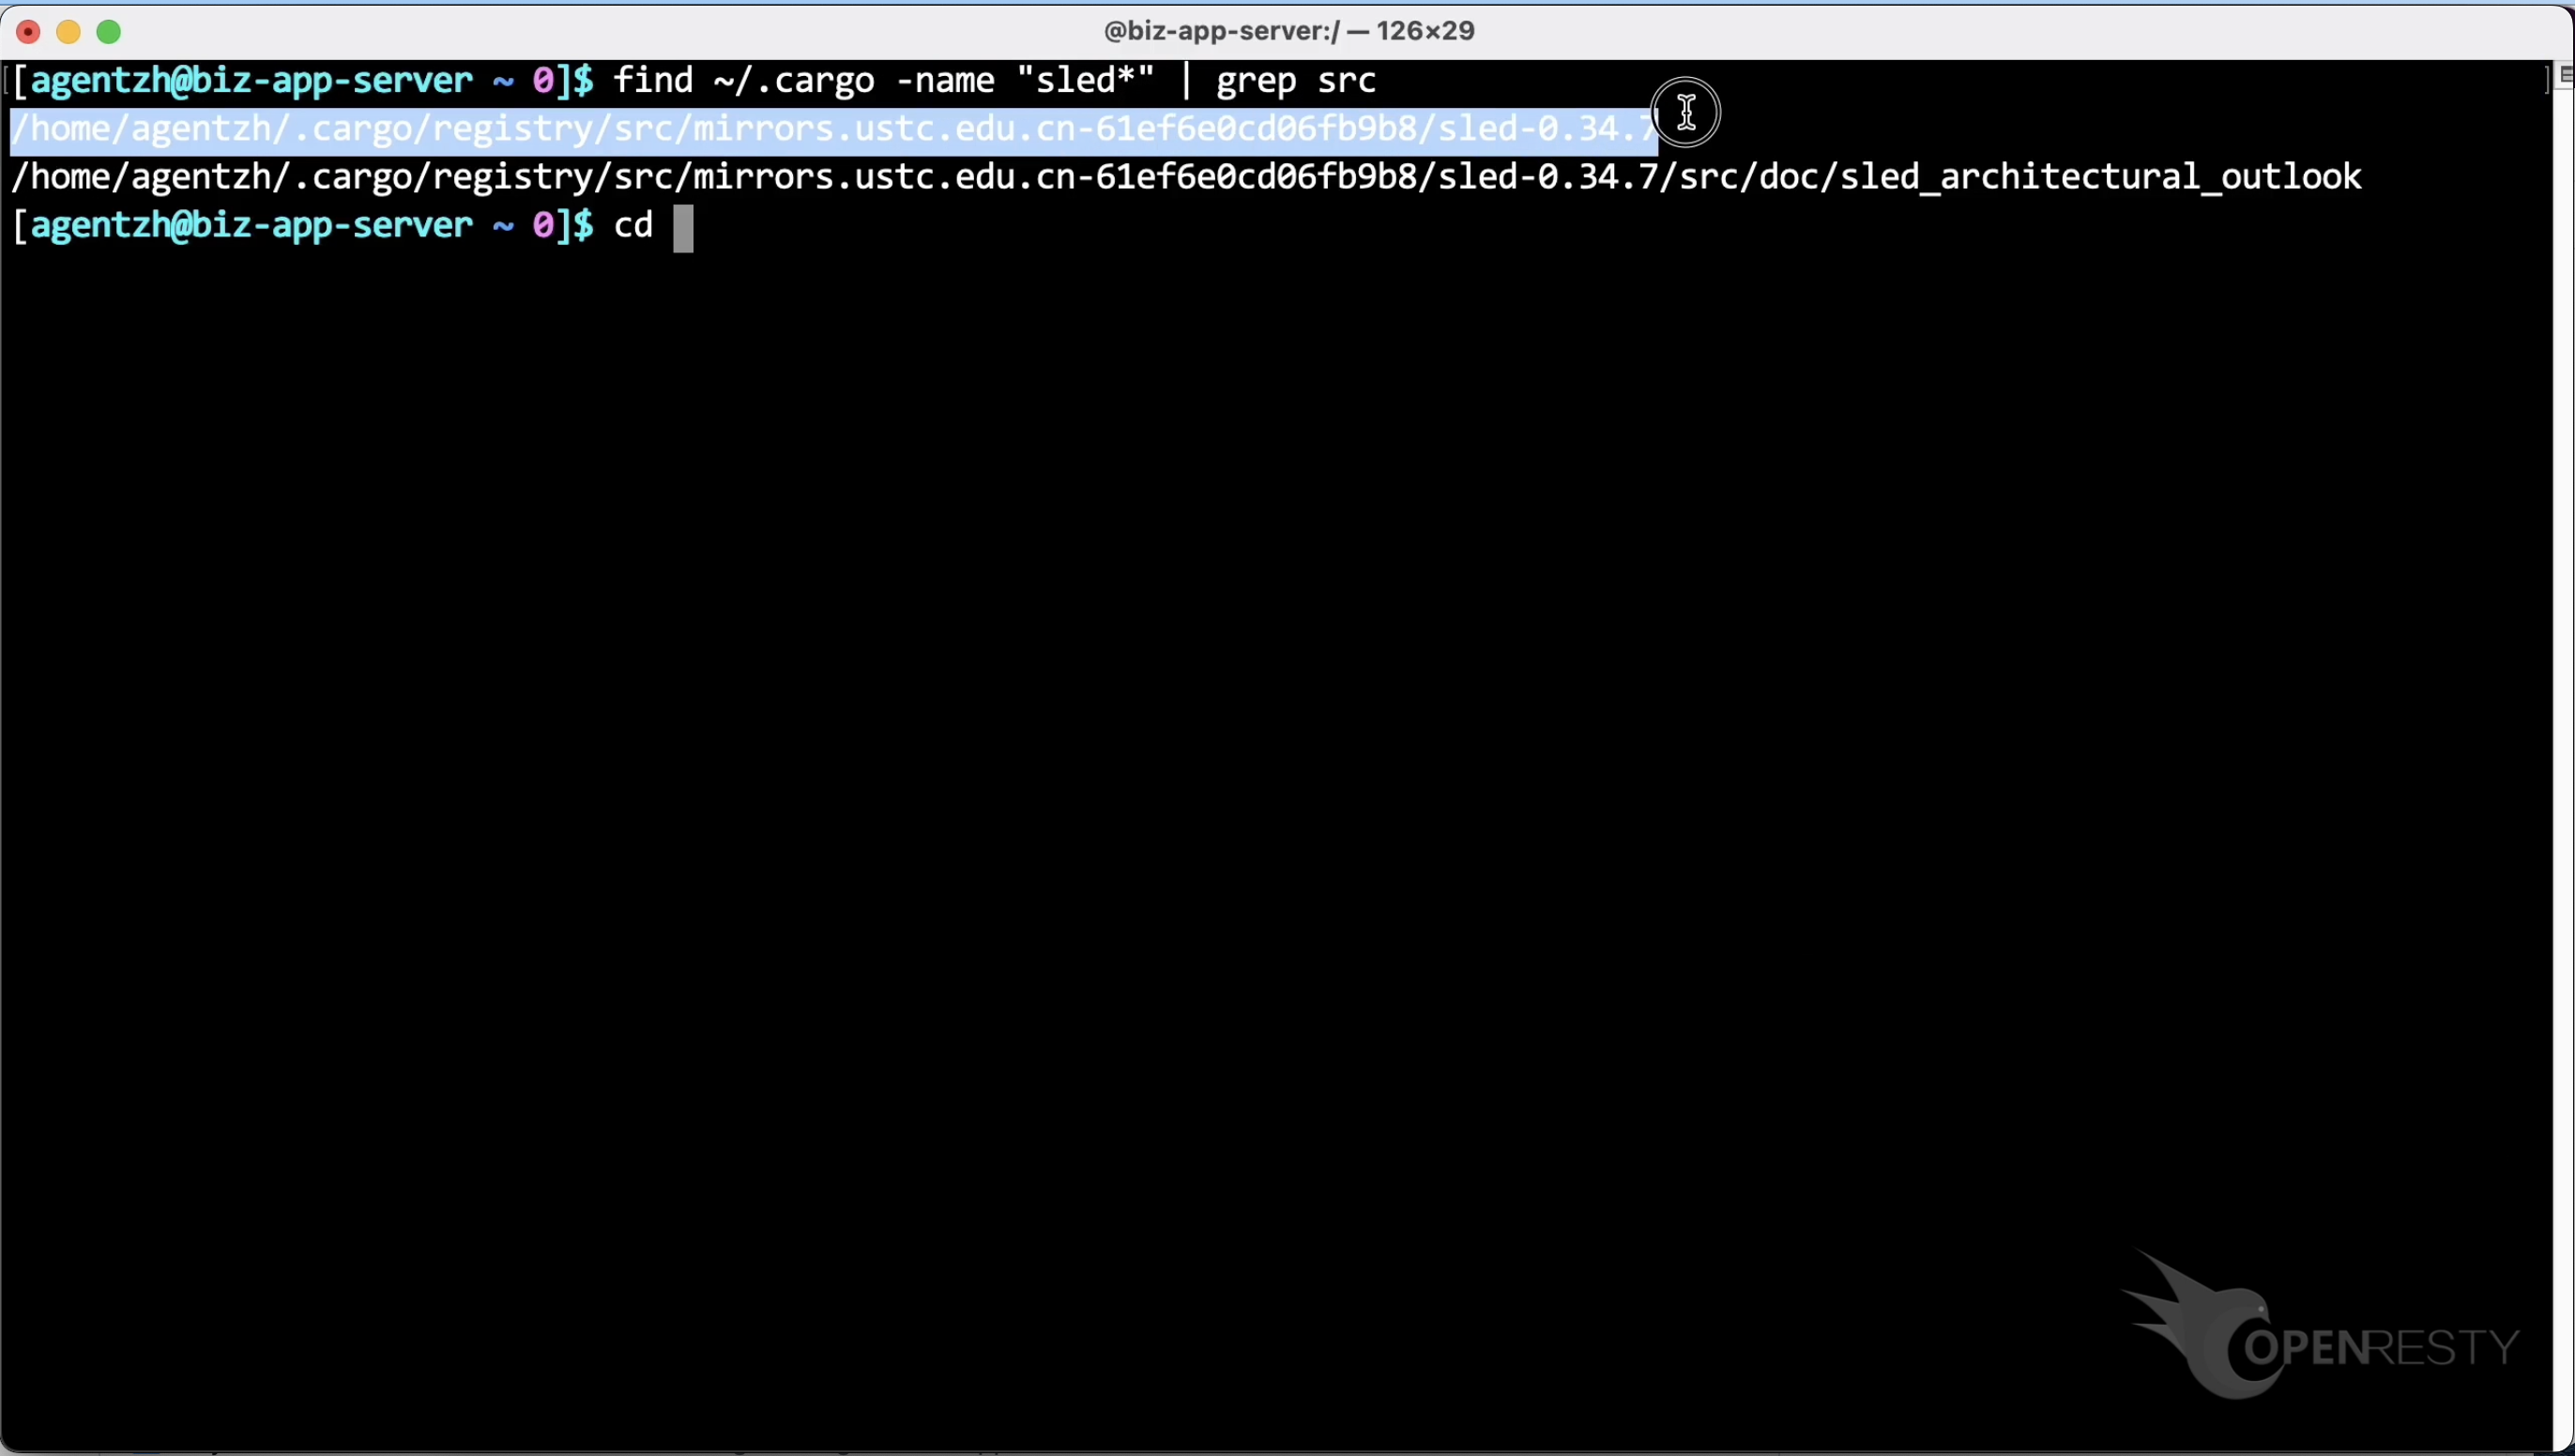
Back in the flame graph, hover the mouse over the green box for the insert function: the tooltip shows the source file of this function.
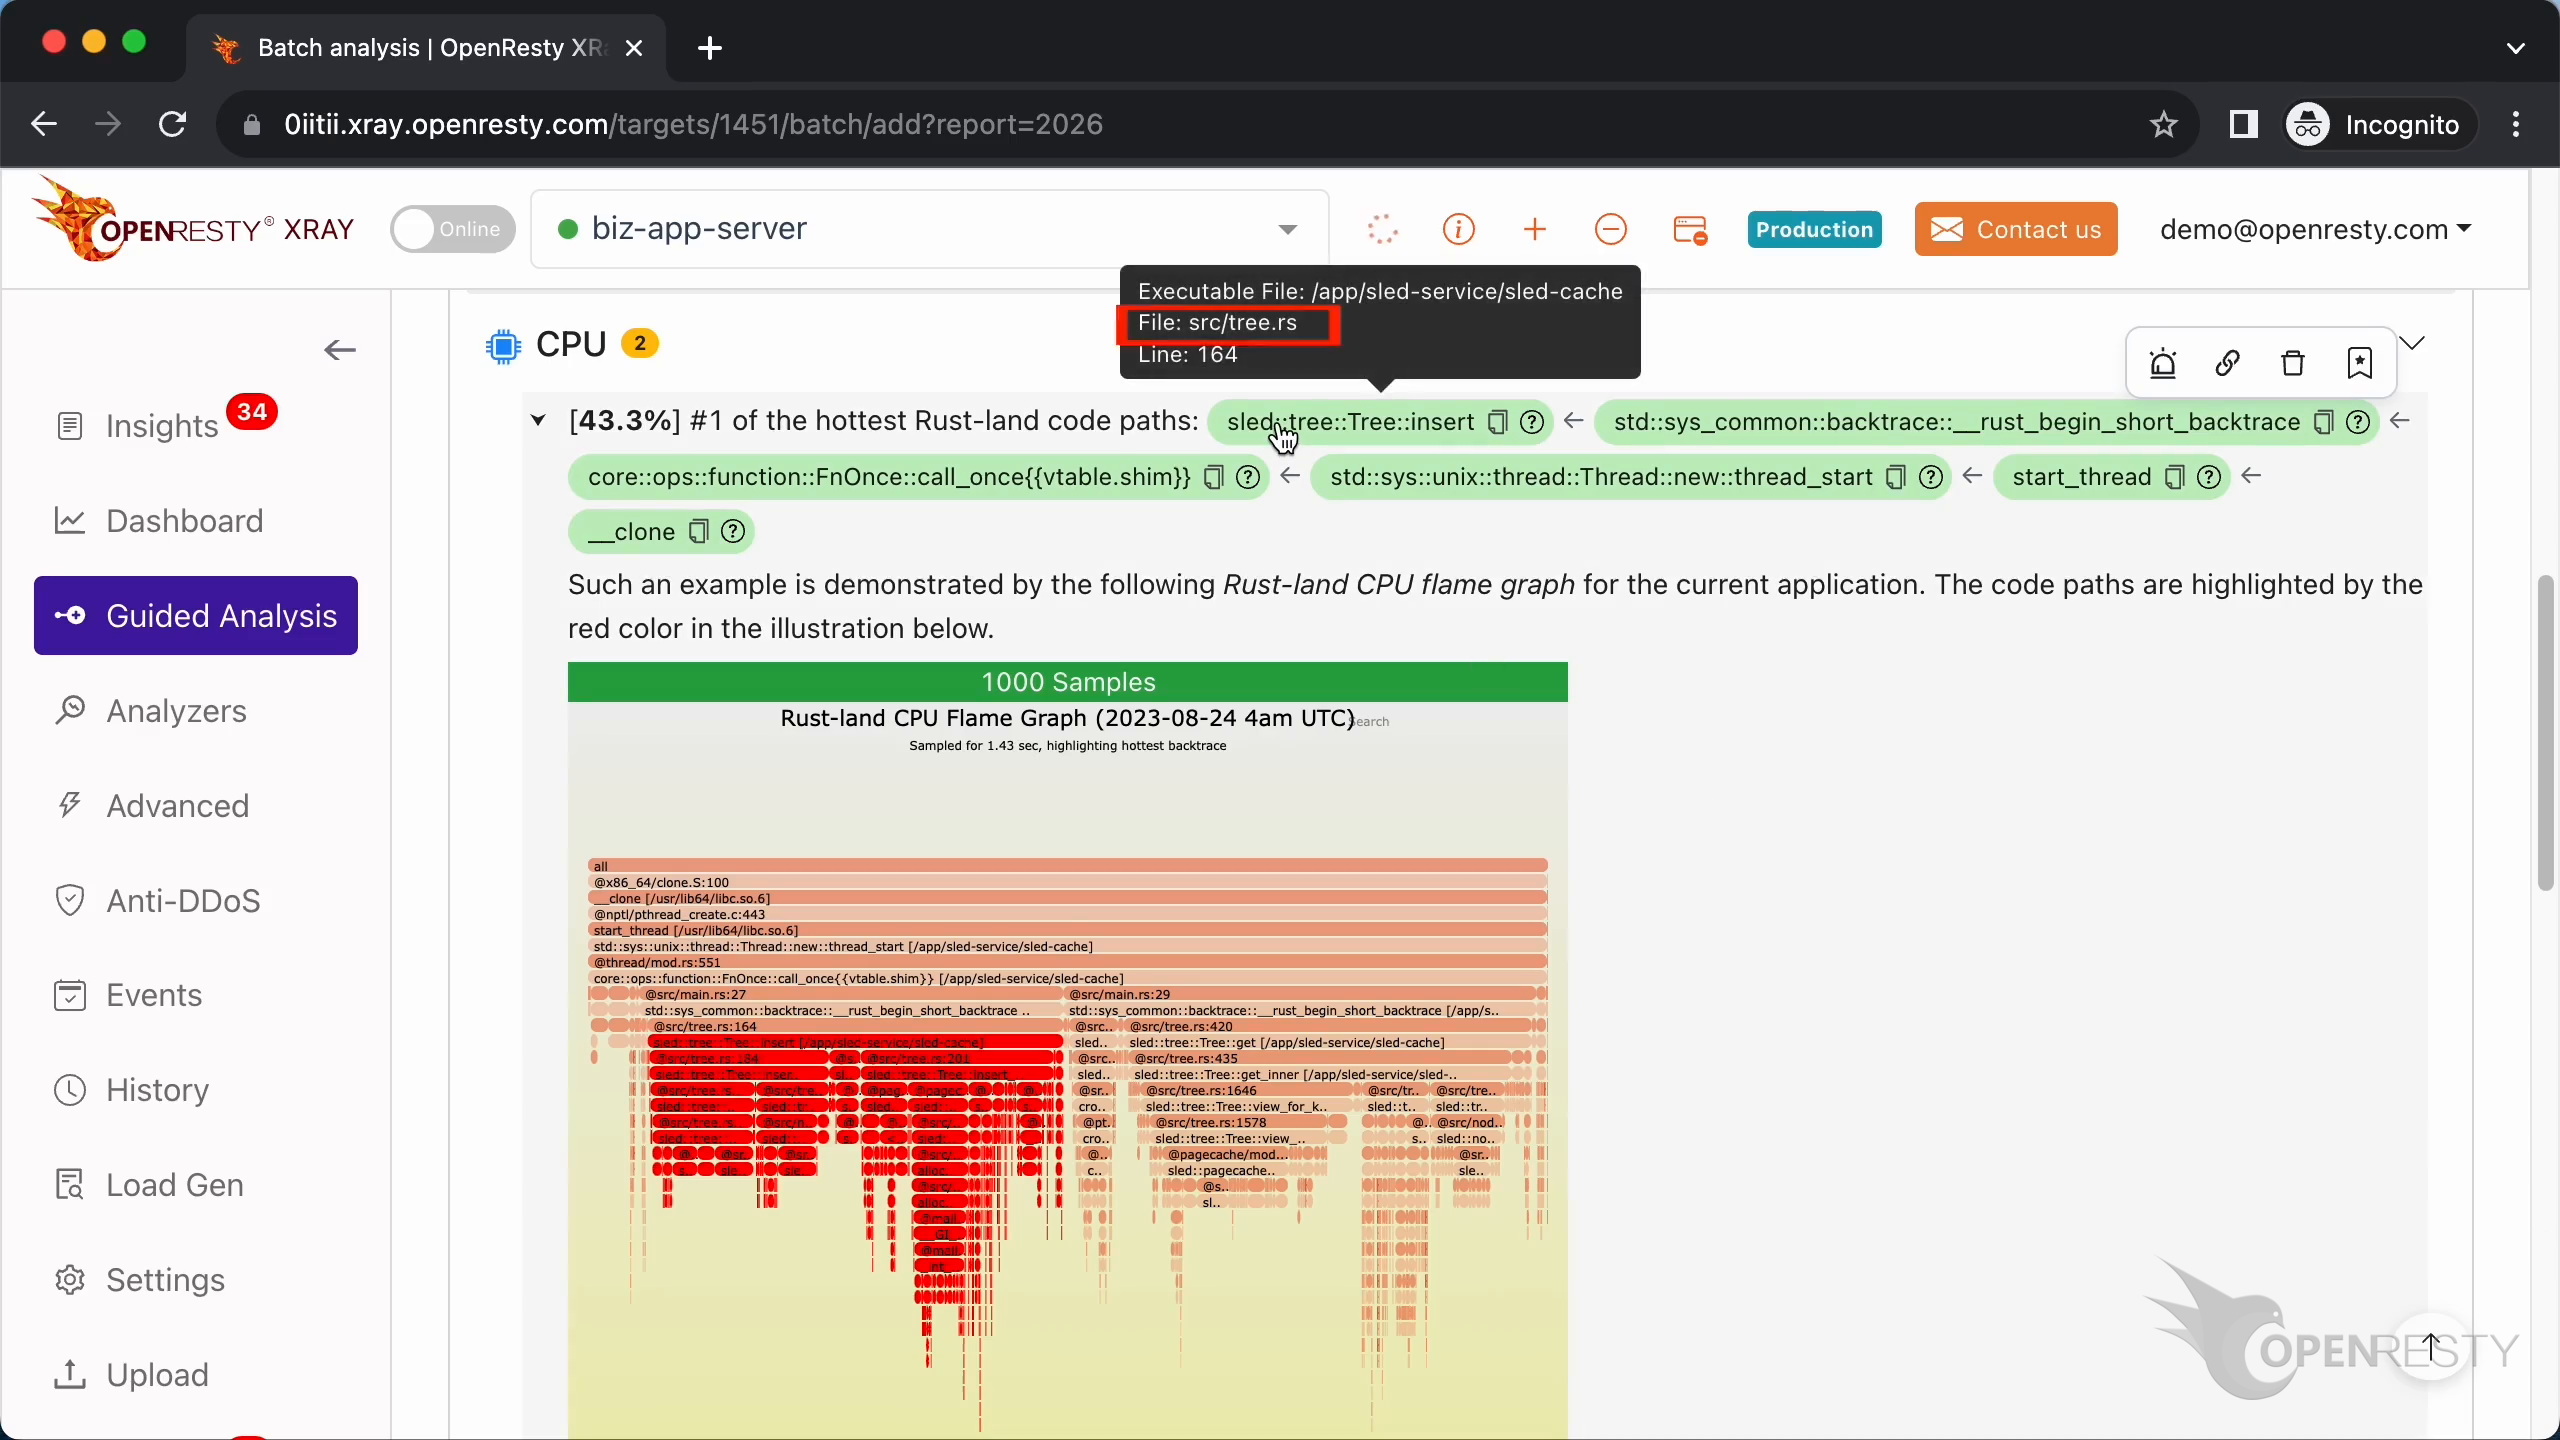
The source line number shown in the tooltip is 164.
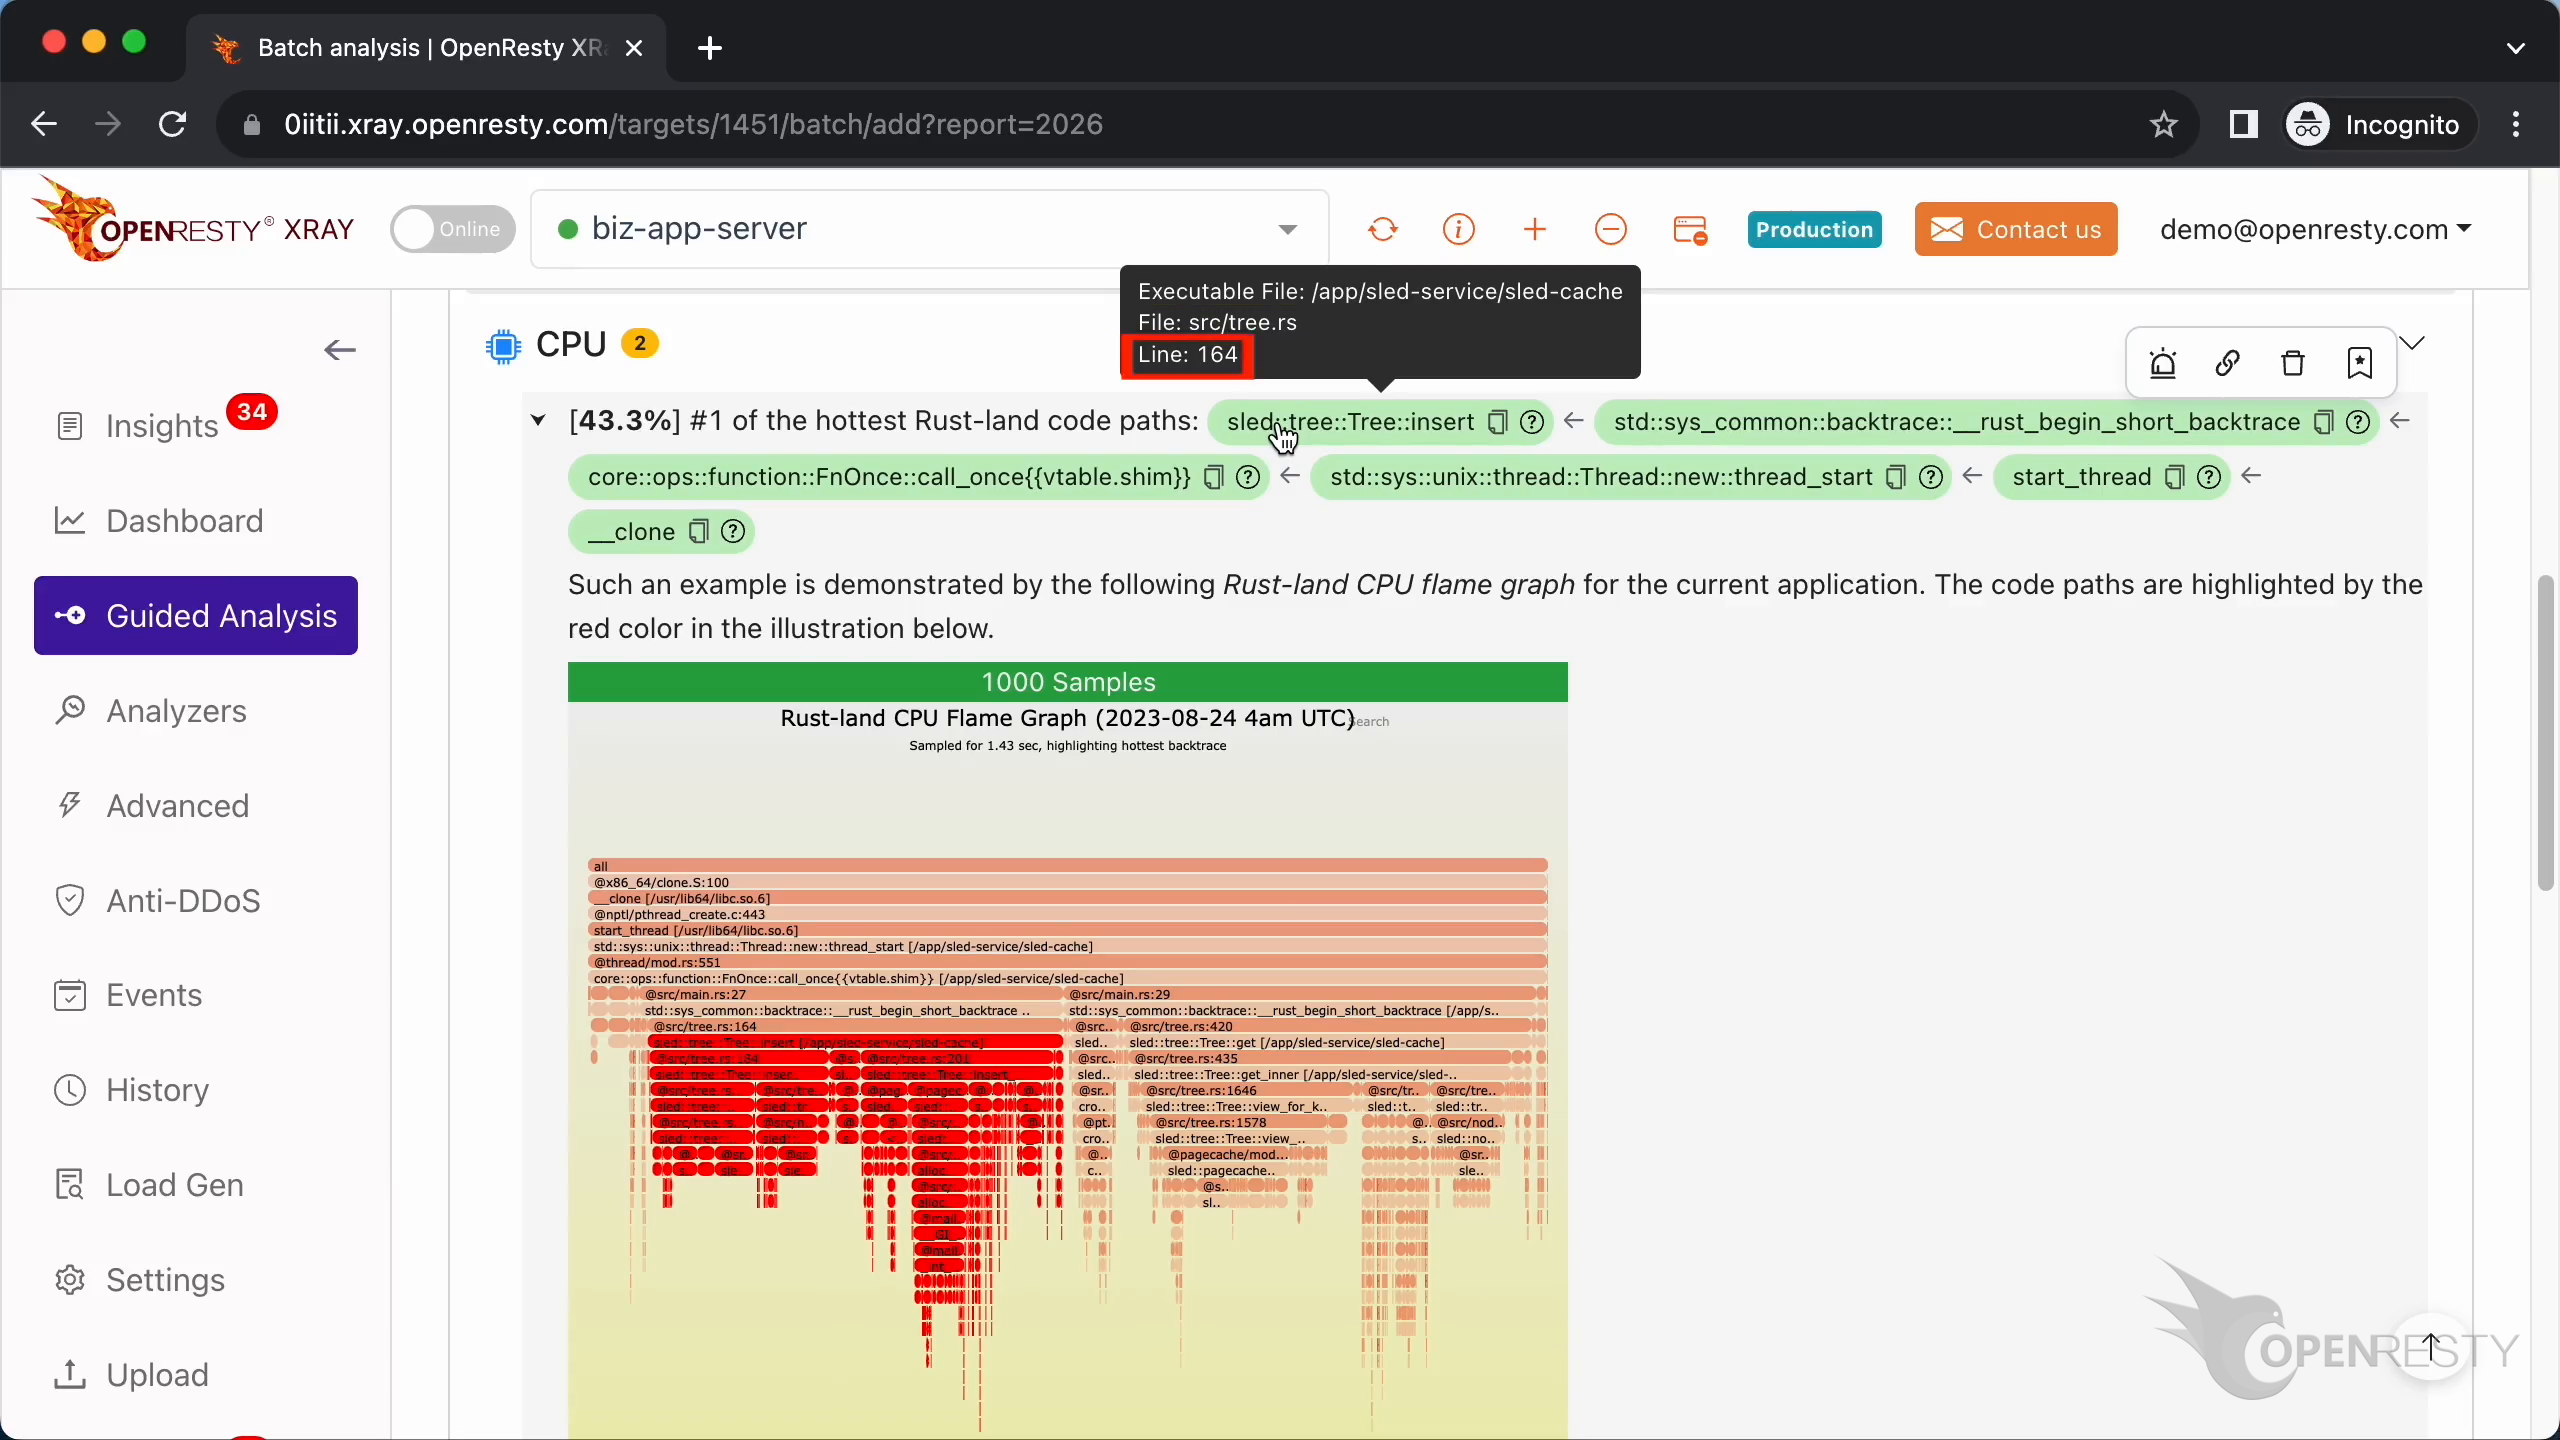
Click this icon to copy the source file path of the function.
Open the source file in the editor you like and paste the path you just copied (here we use vim).
Go to line 164, as OpenResty XRay suggested.
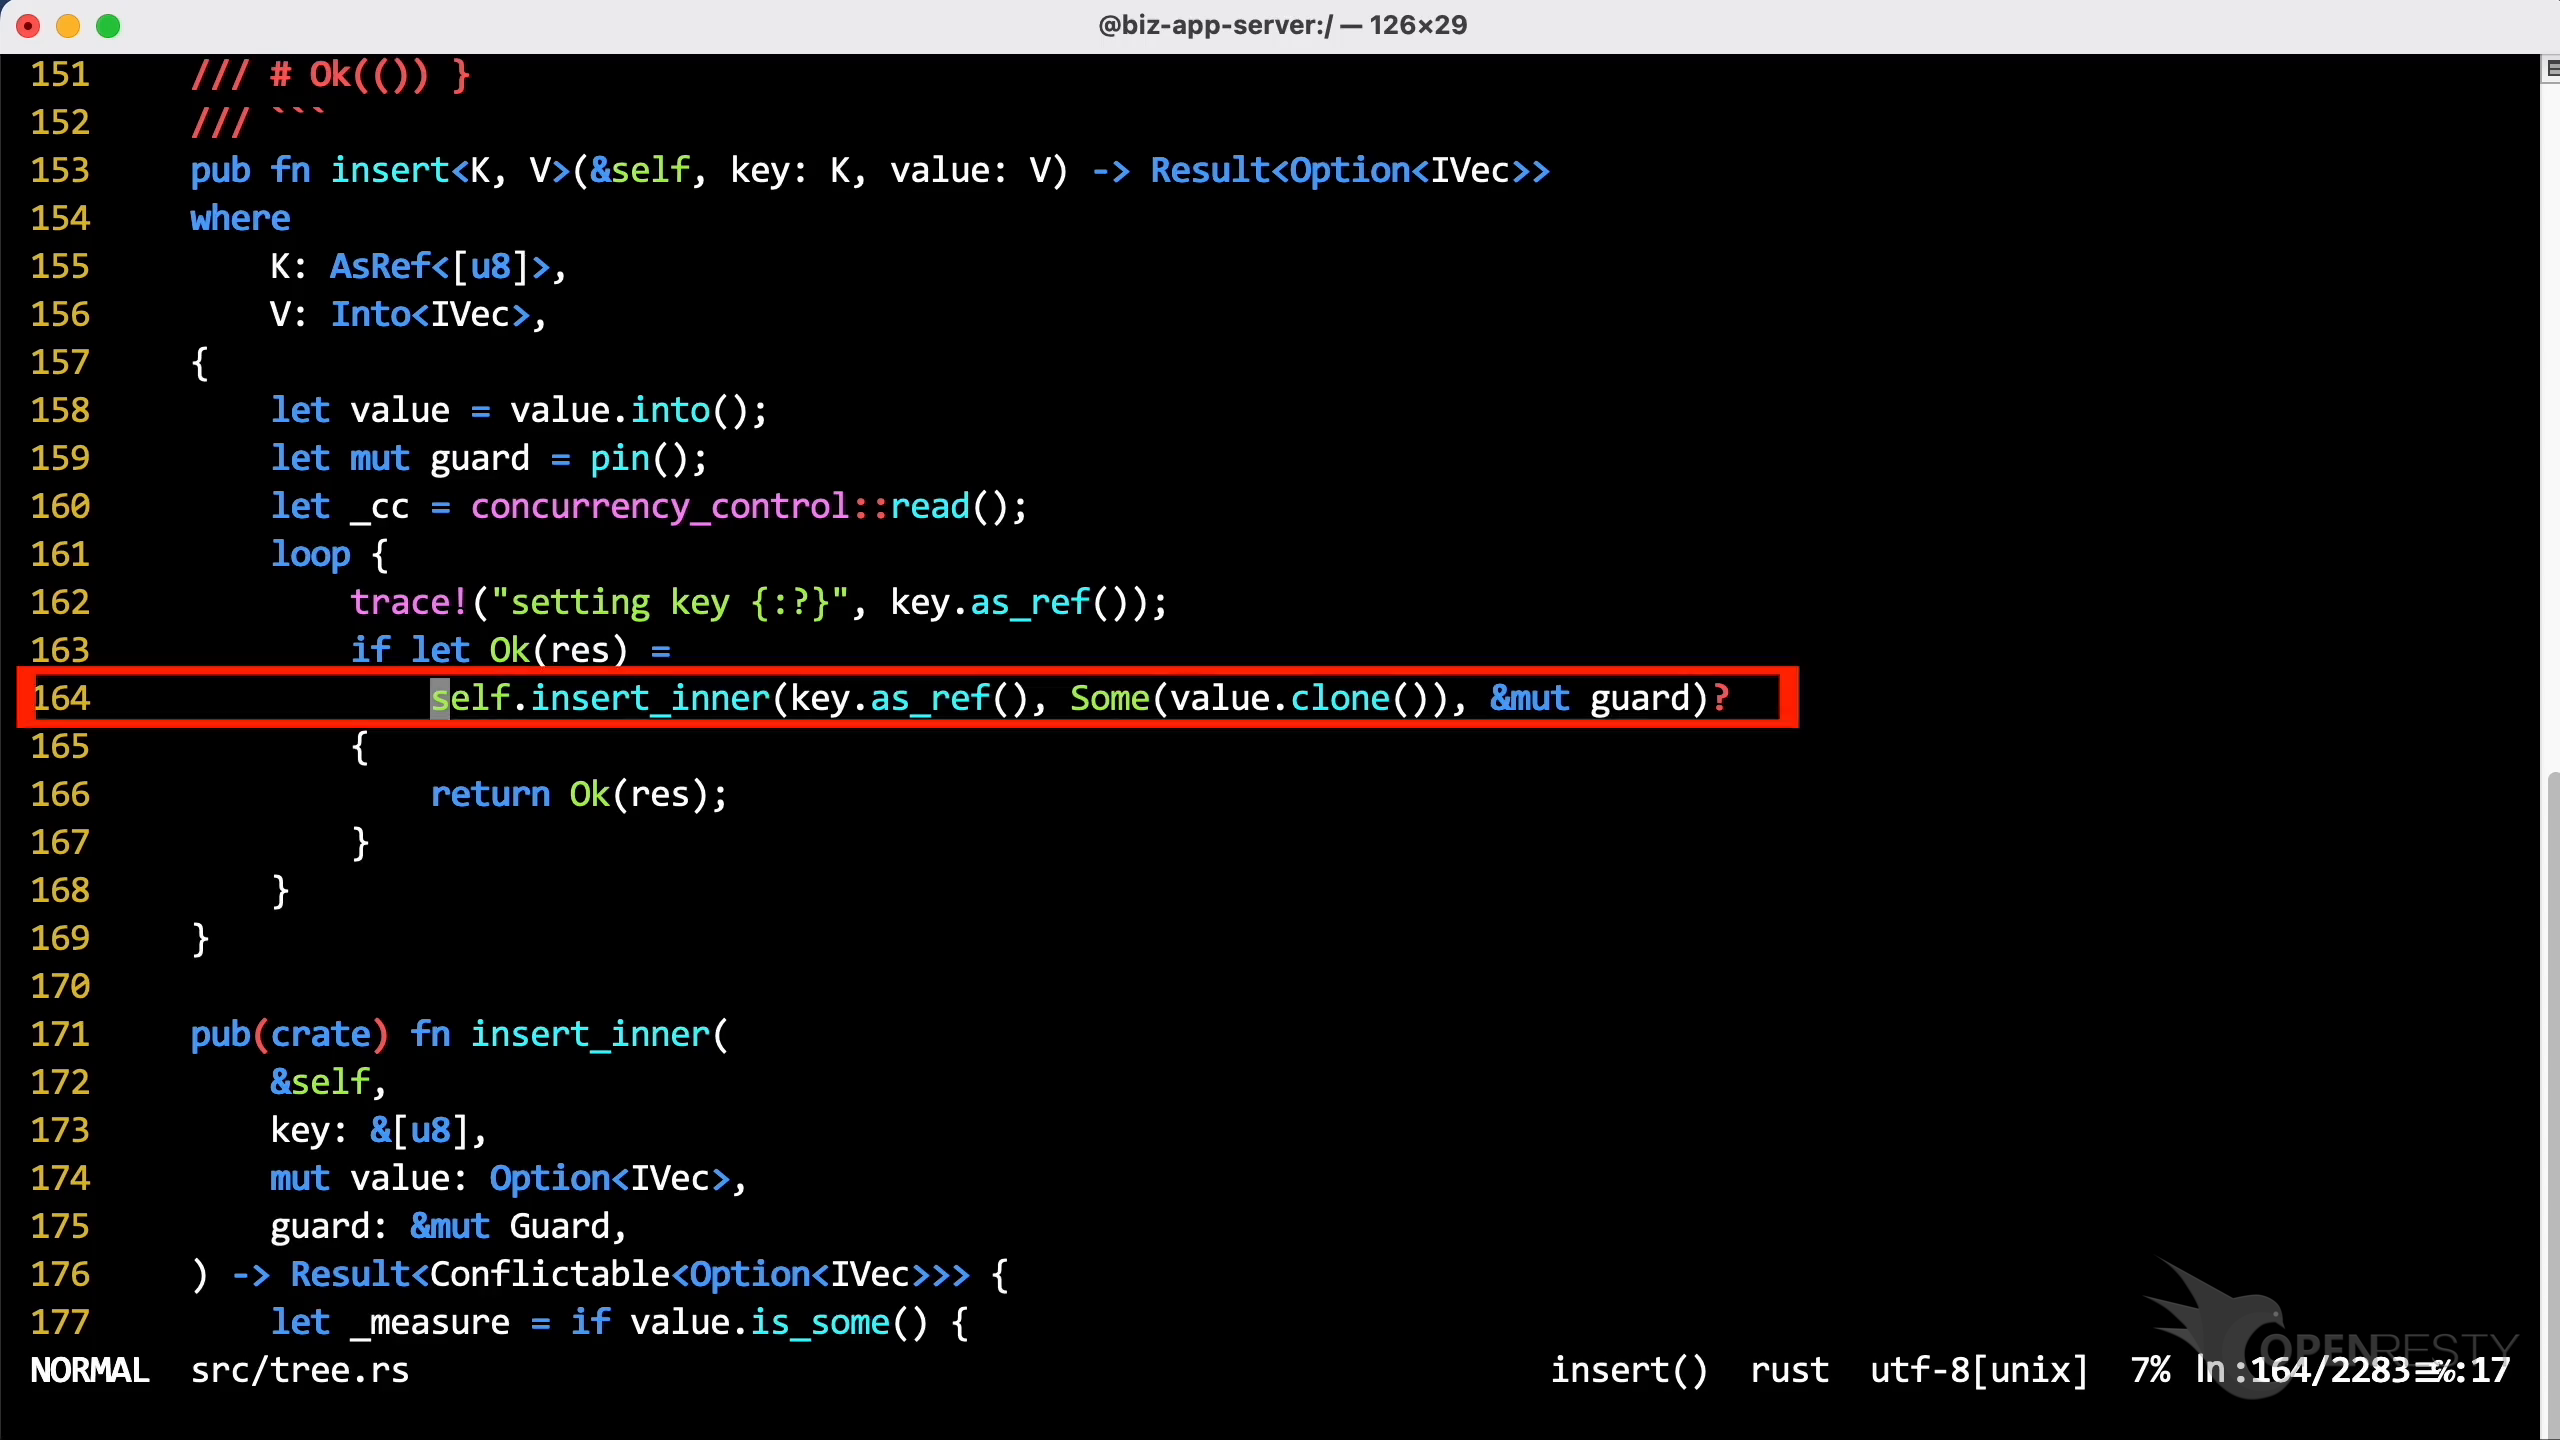
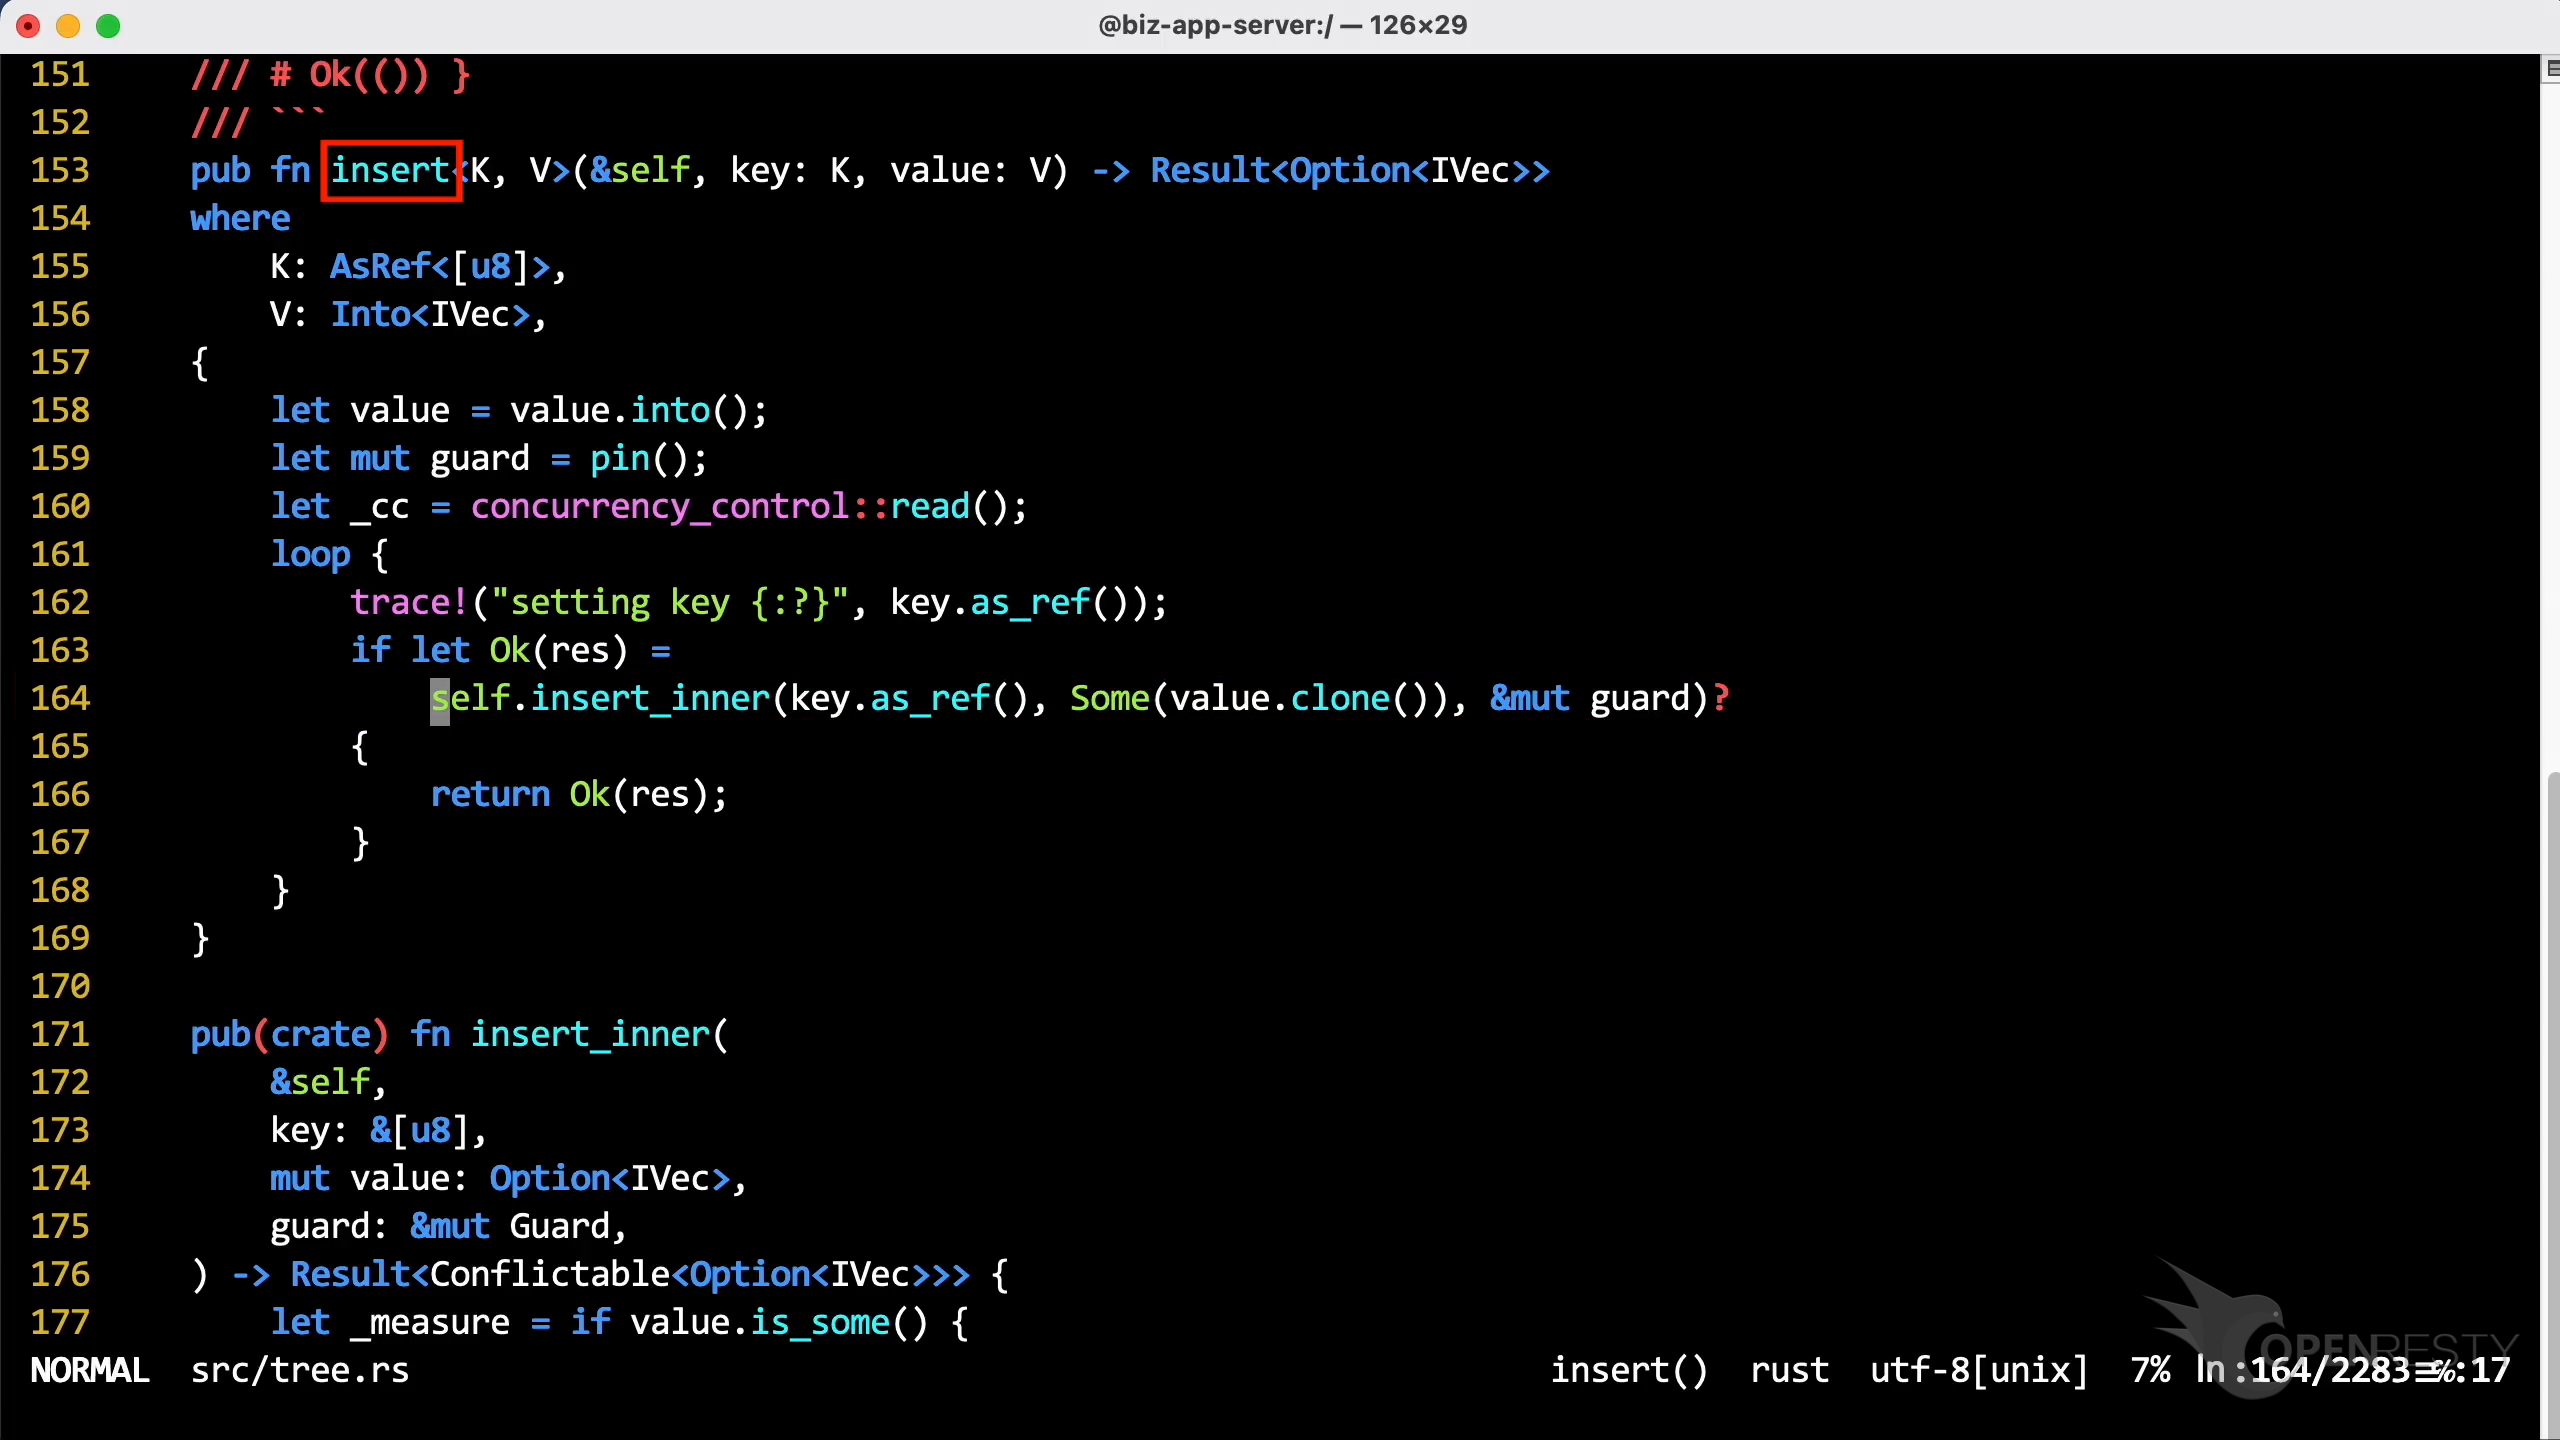
This line is inside the insert function.
The #2 Hottest Code Path: get_inner and view_for_key
Next, check the second code path. The #2 hottest code path consumes almost 40% of the CPU time.
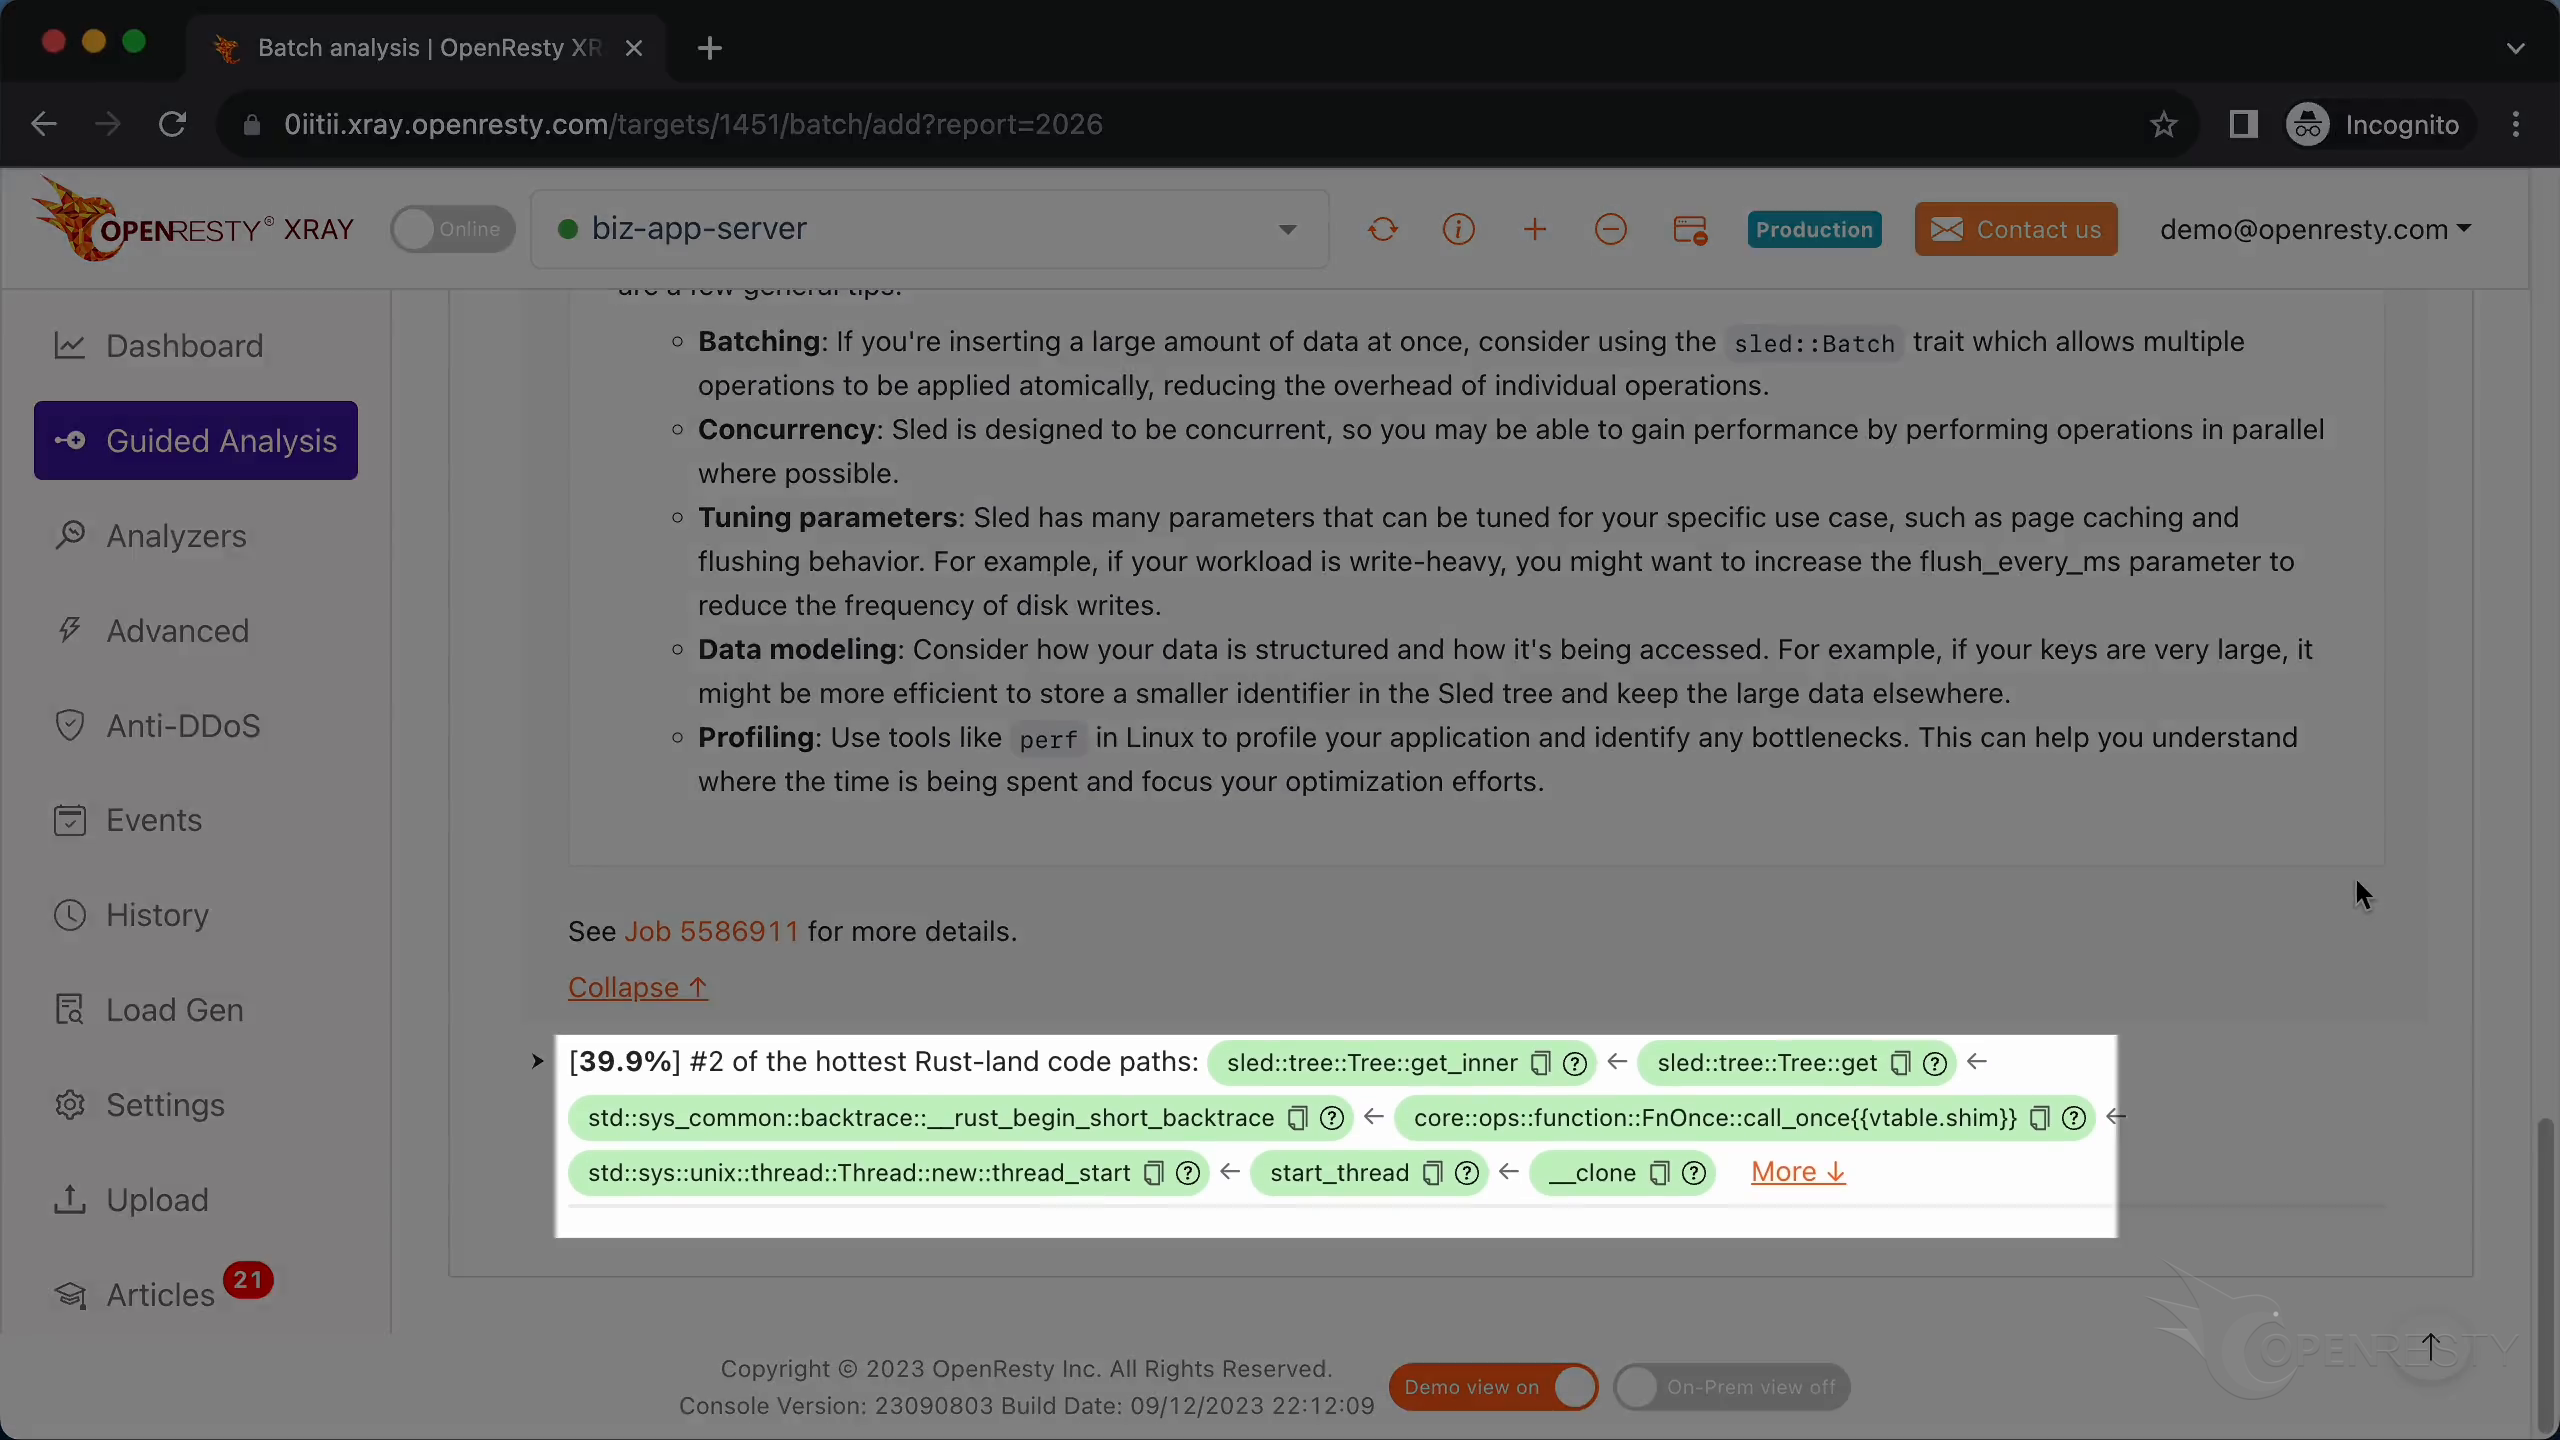
The top function call, get_inner, is the function in Sled that looks up the data.
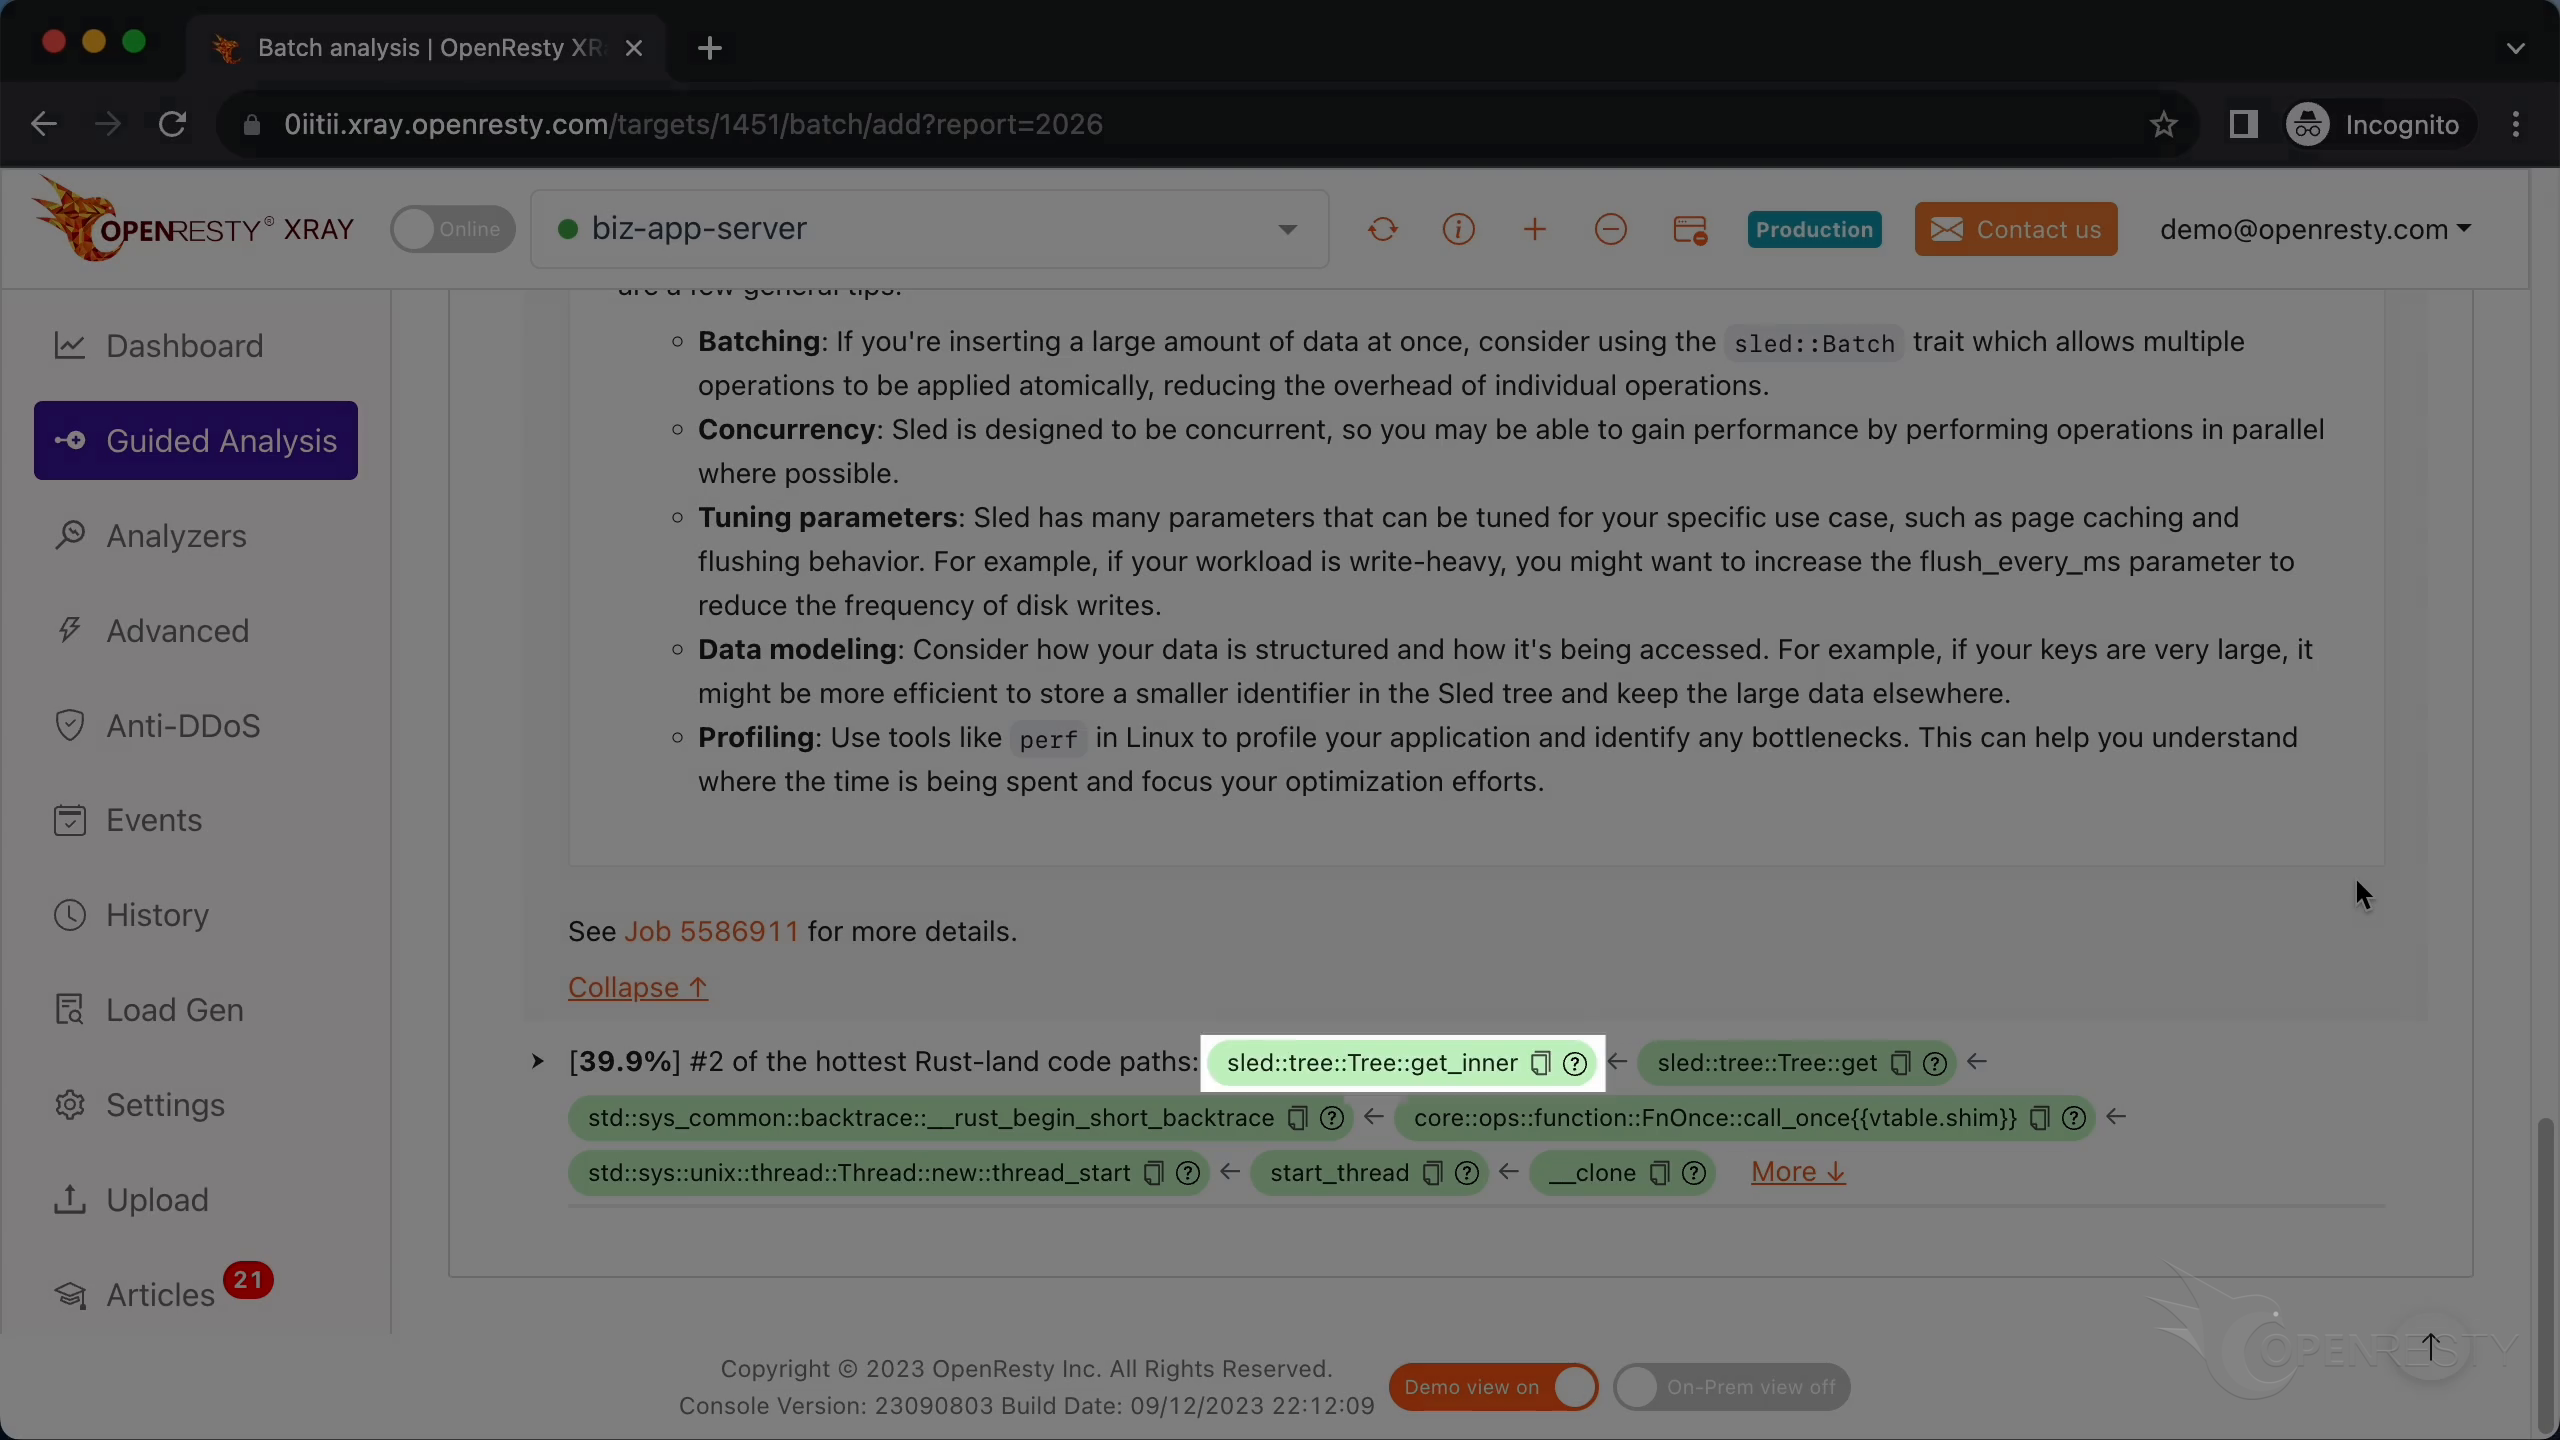
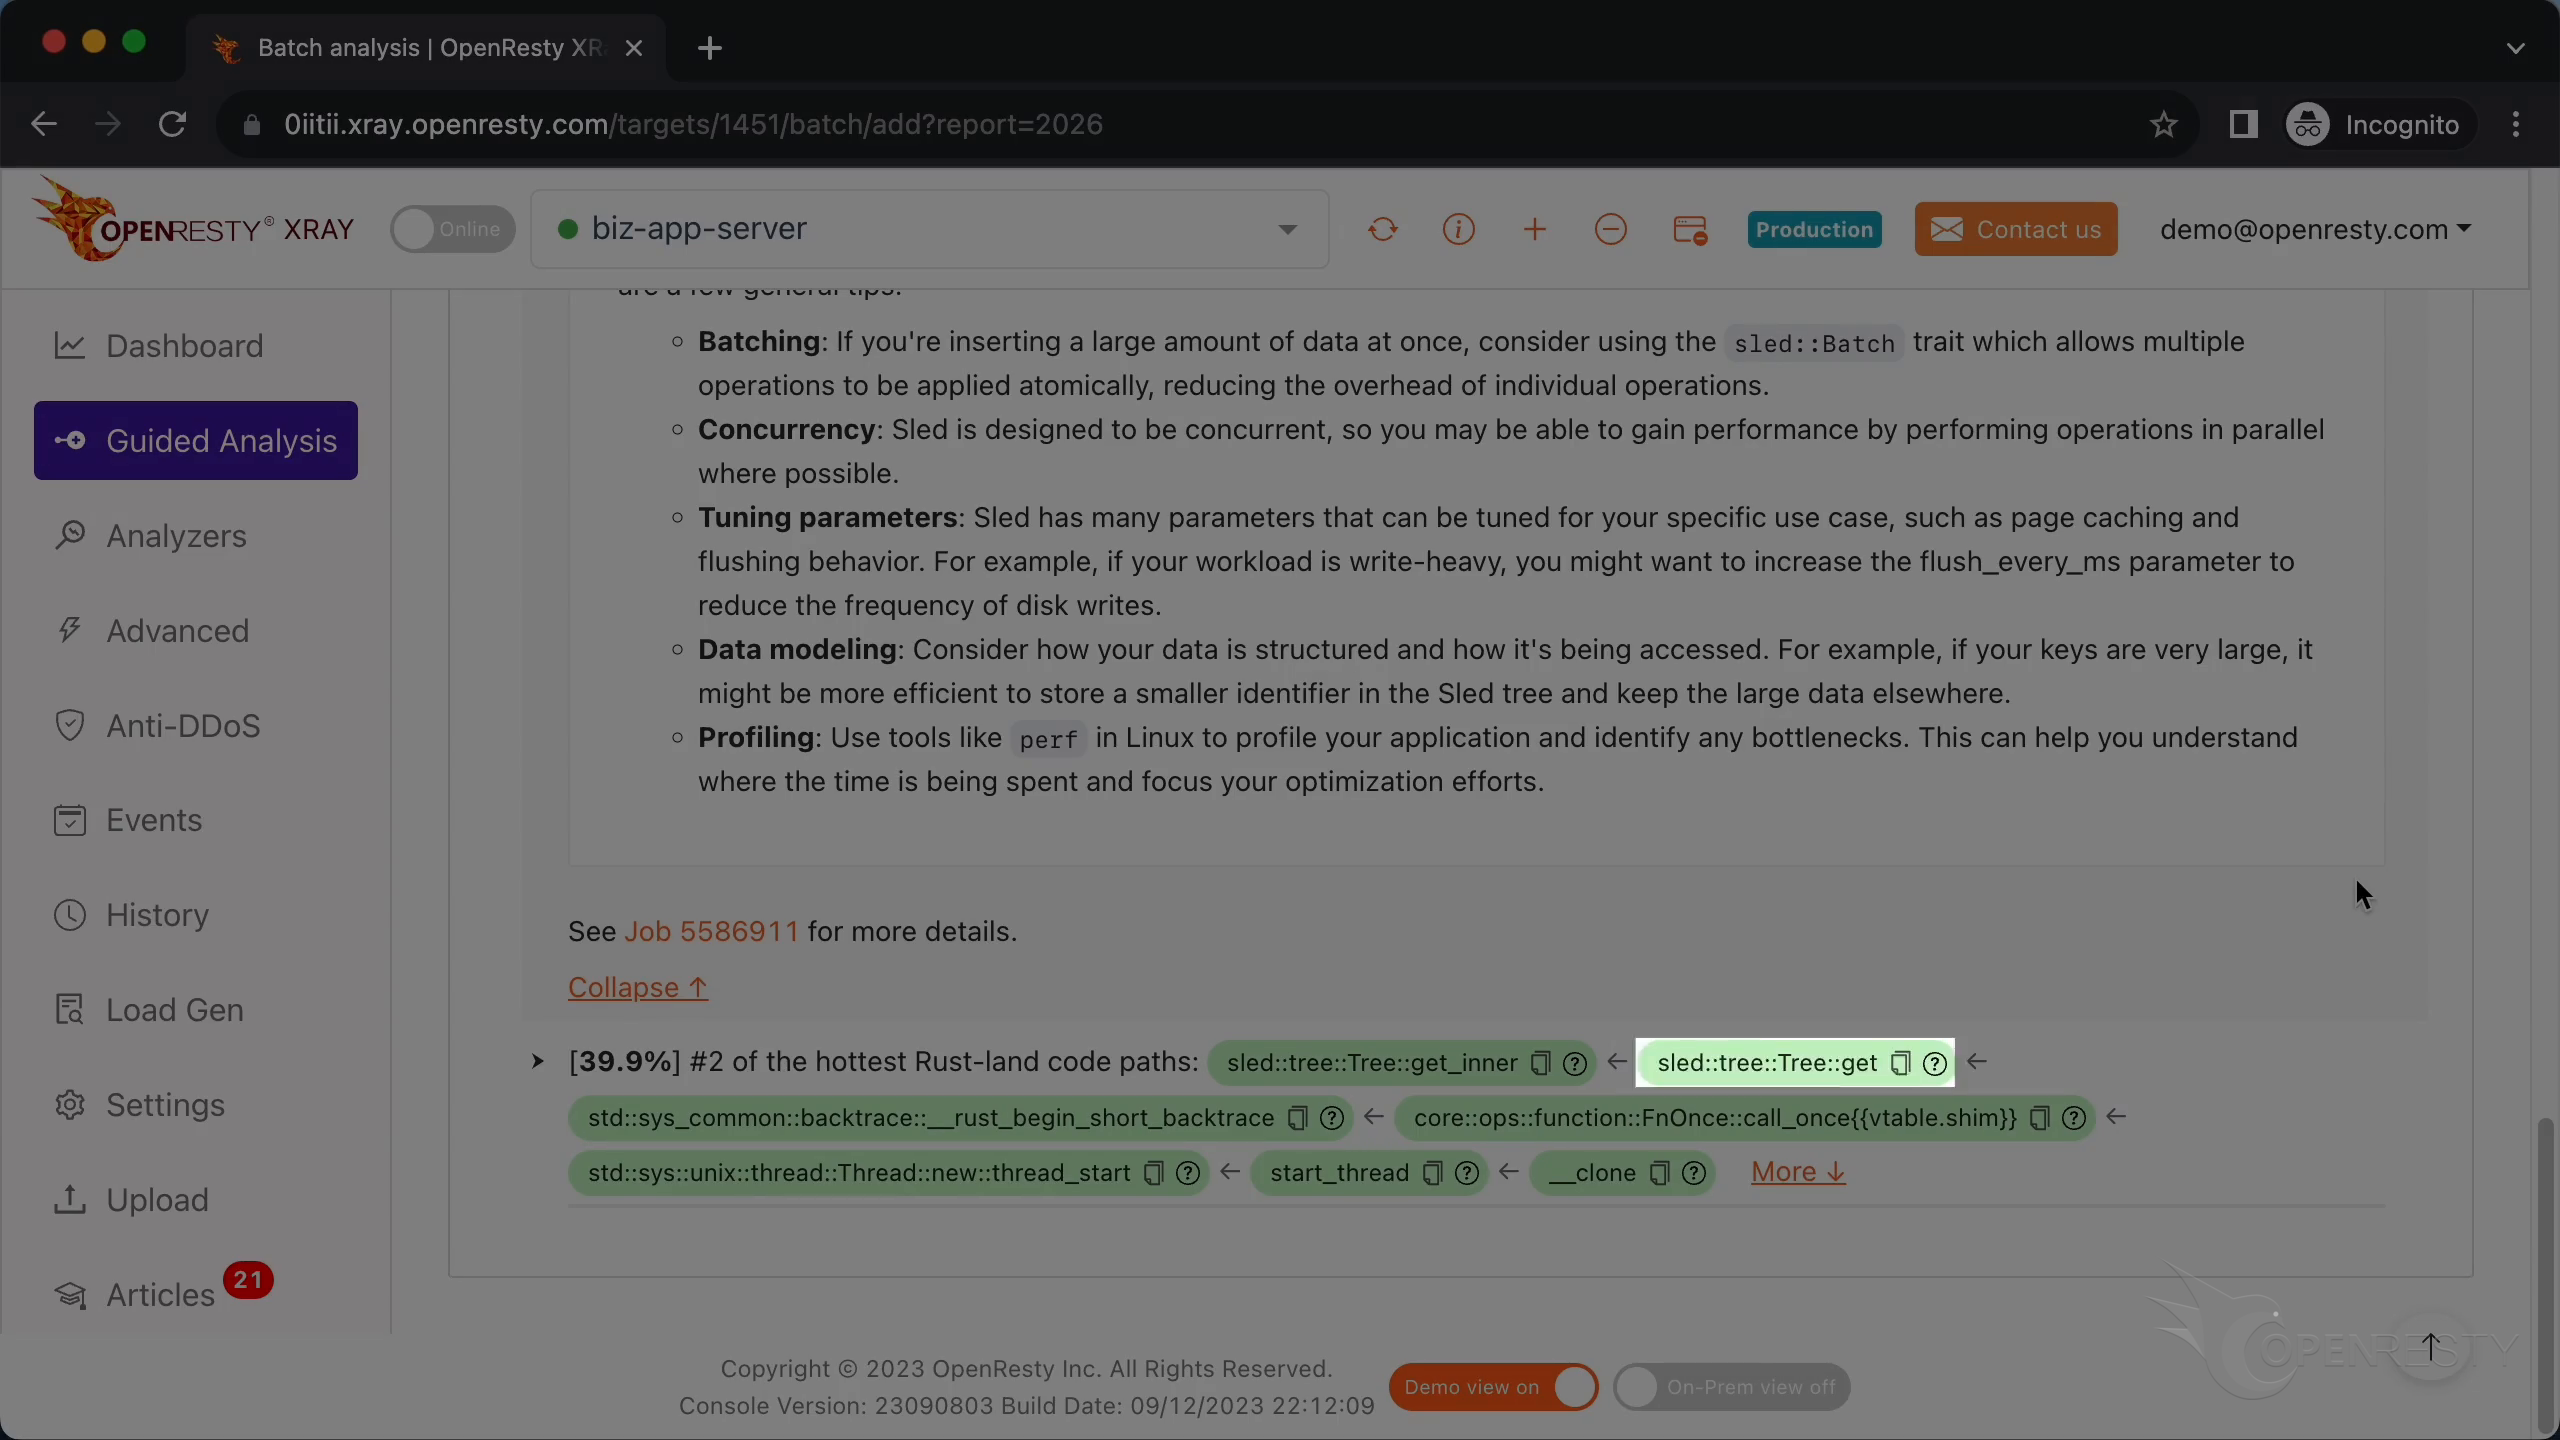
The get function is the interface that the library exposes to the user to get data, and it calls get_inner internally.
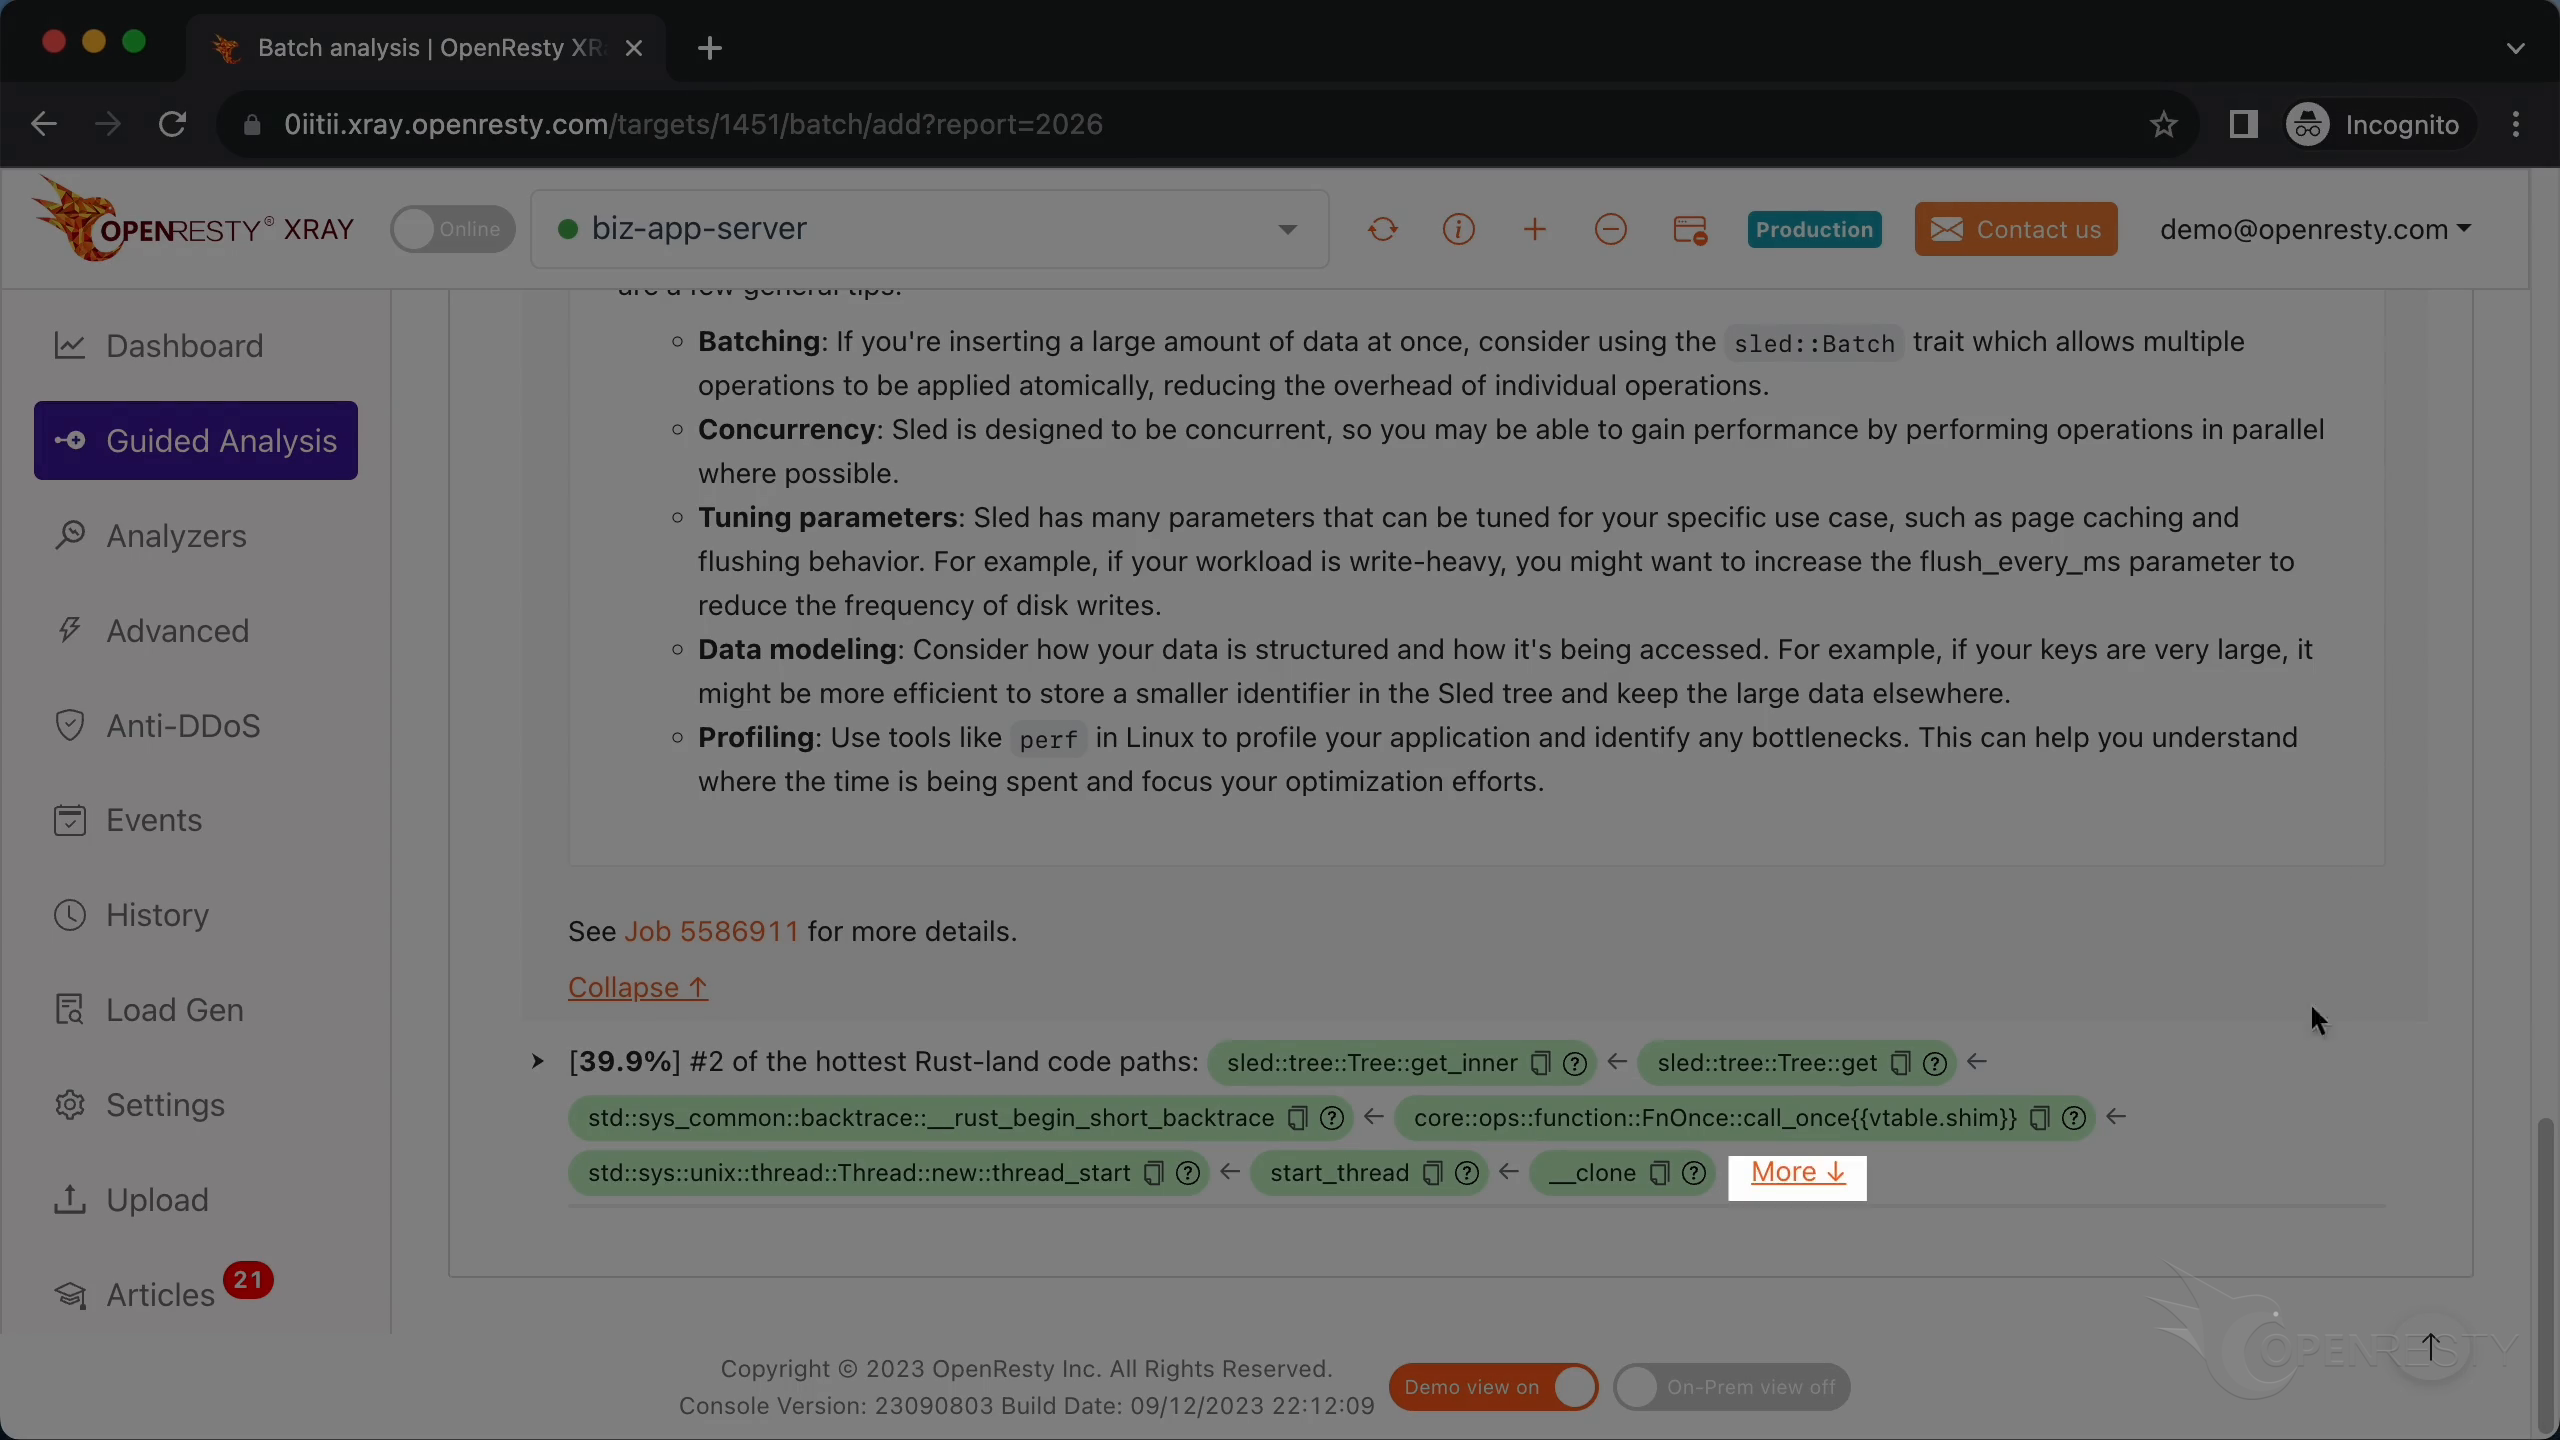
Click “More” to see the details.
Enlarge the flame graph to see the details of the get_inner function call.
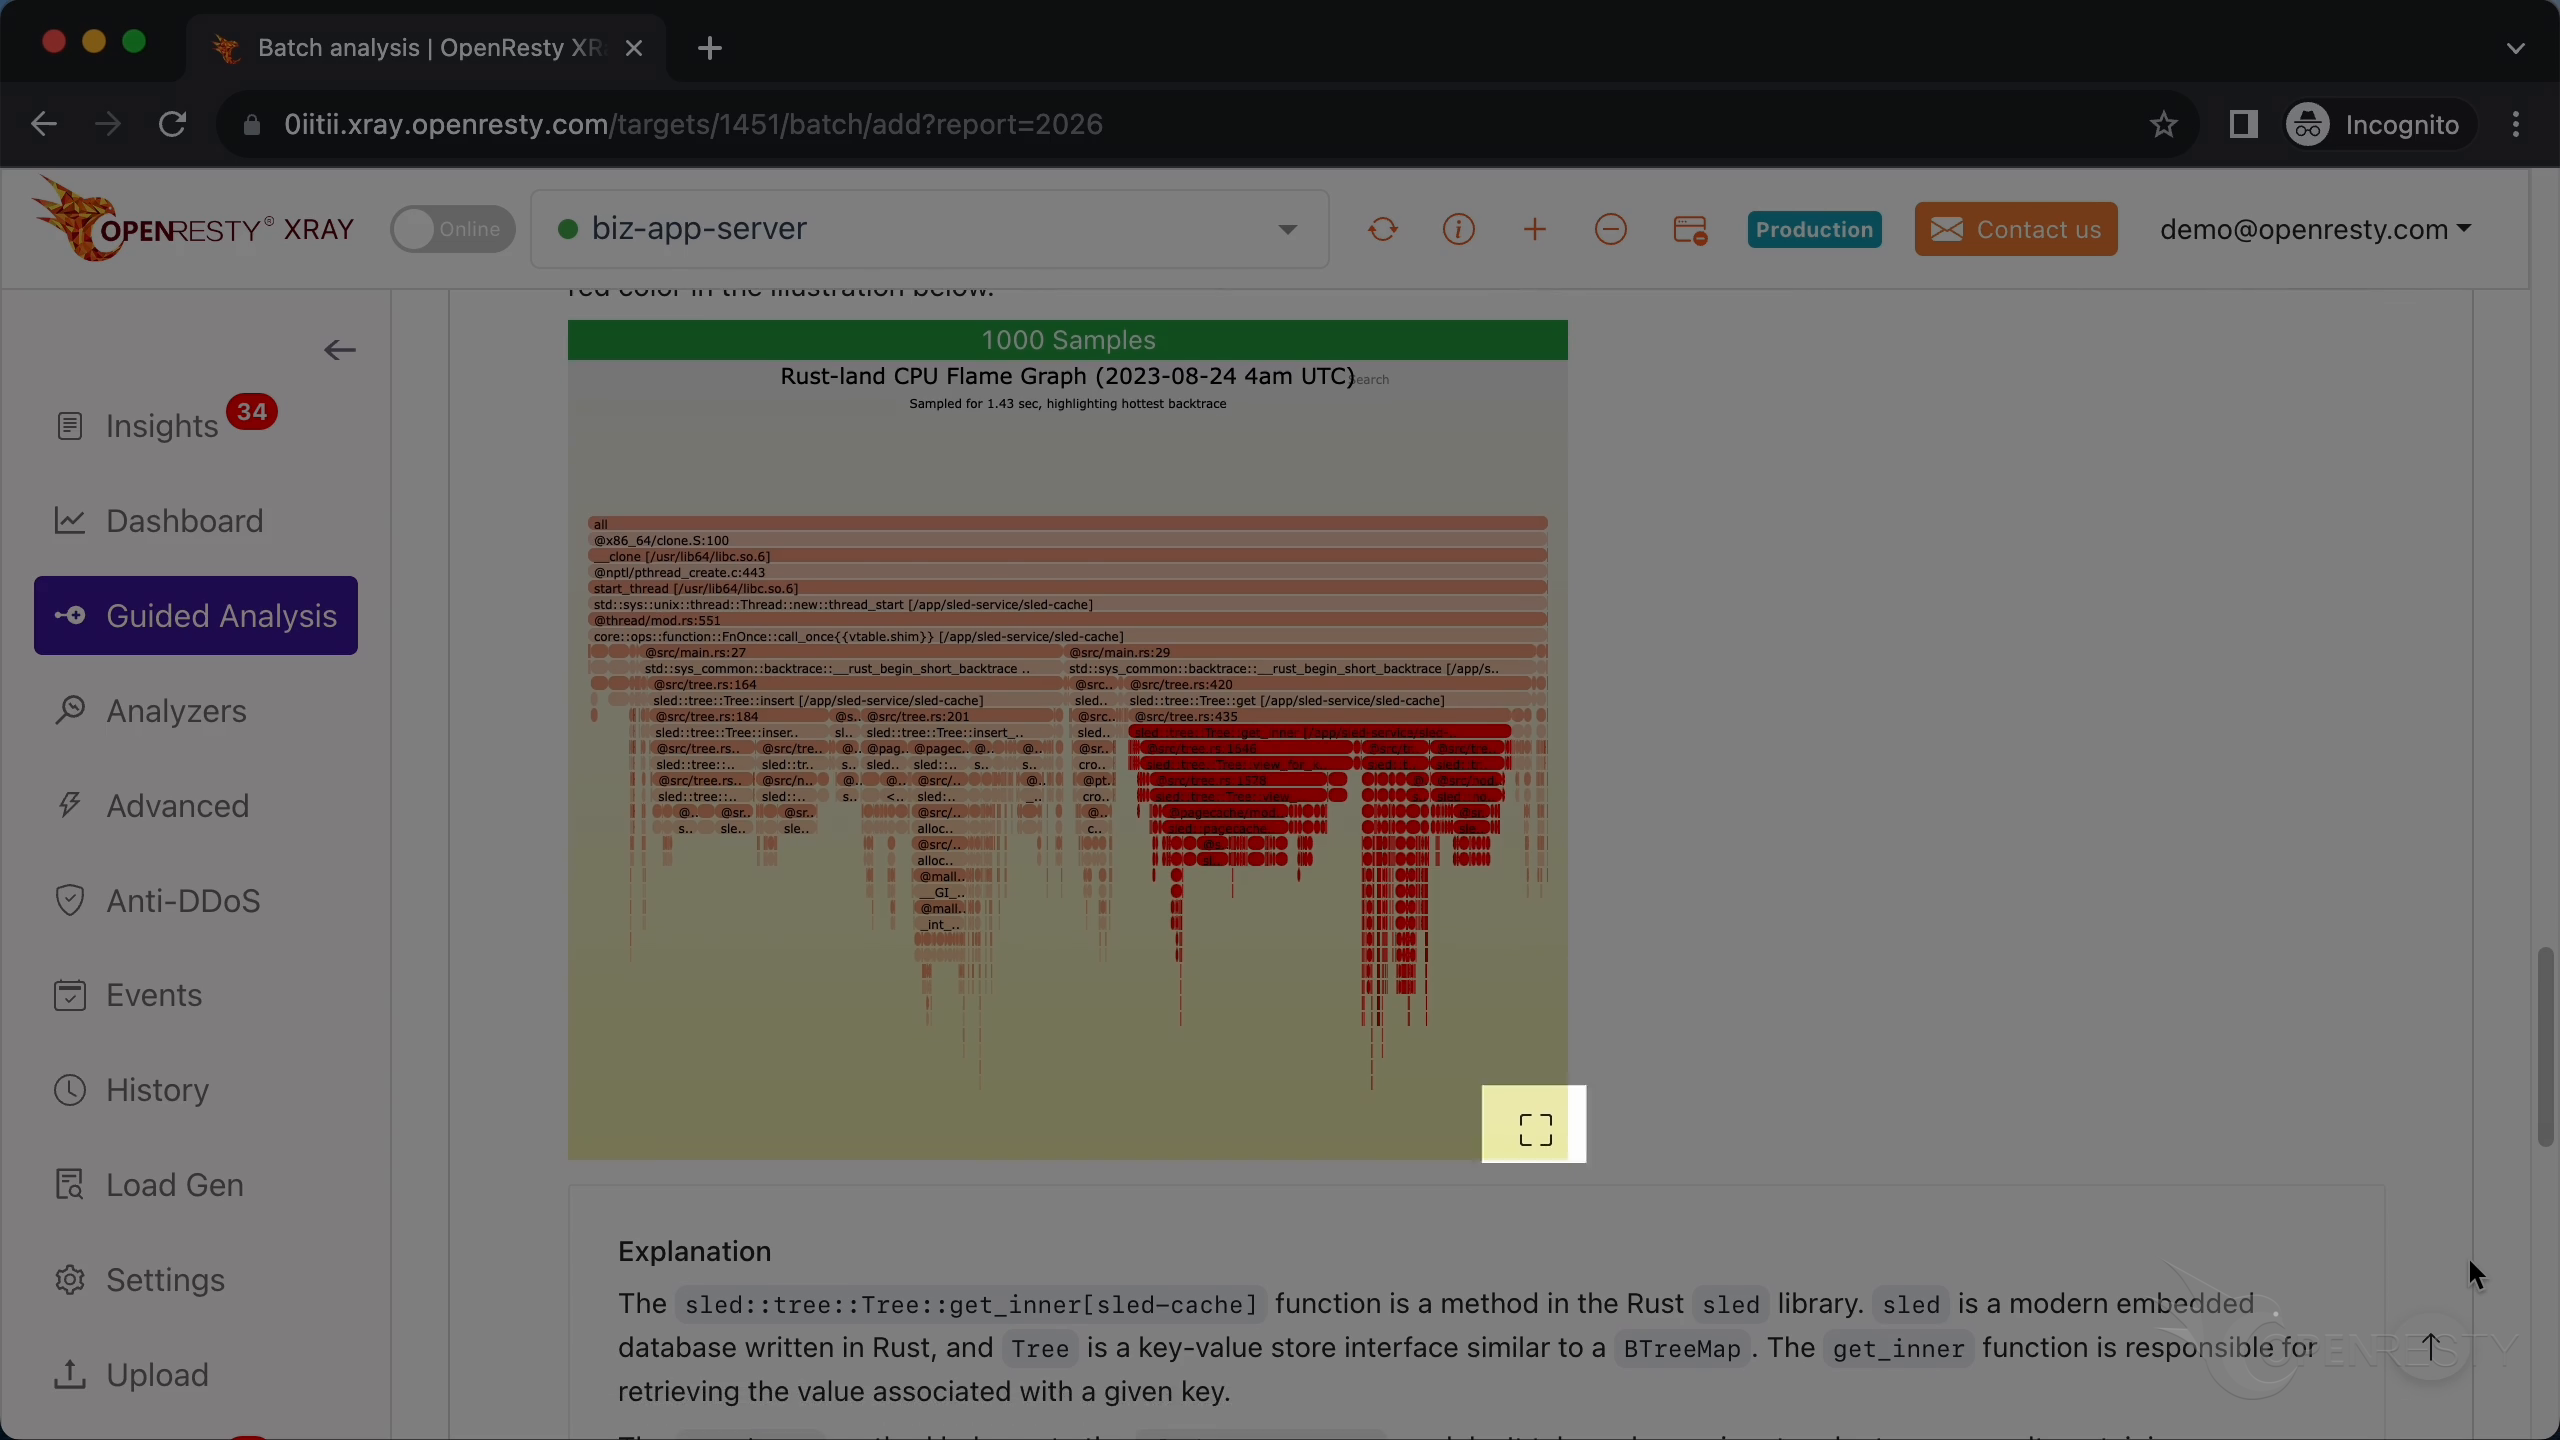
Zoom in further on get_inner.
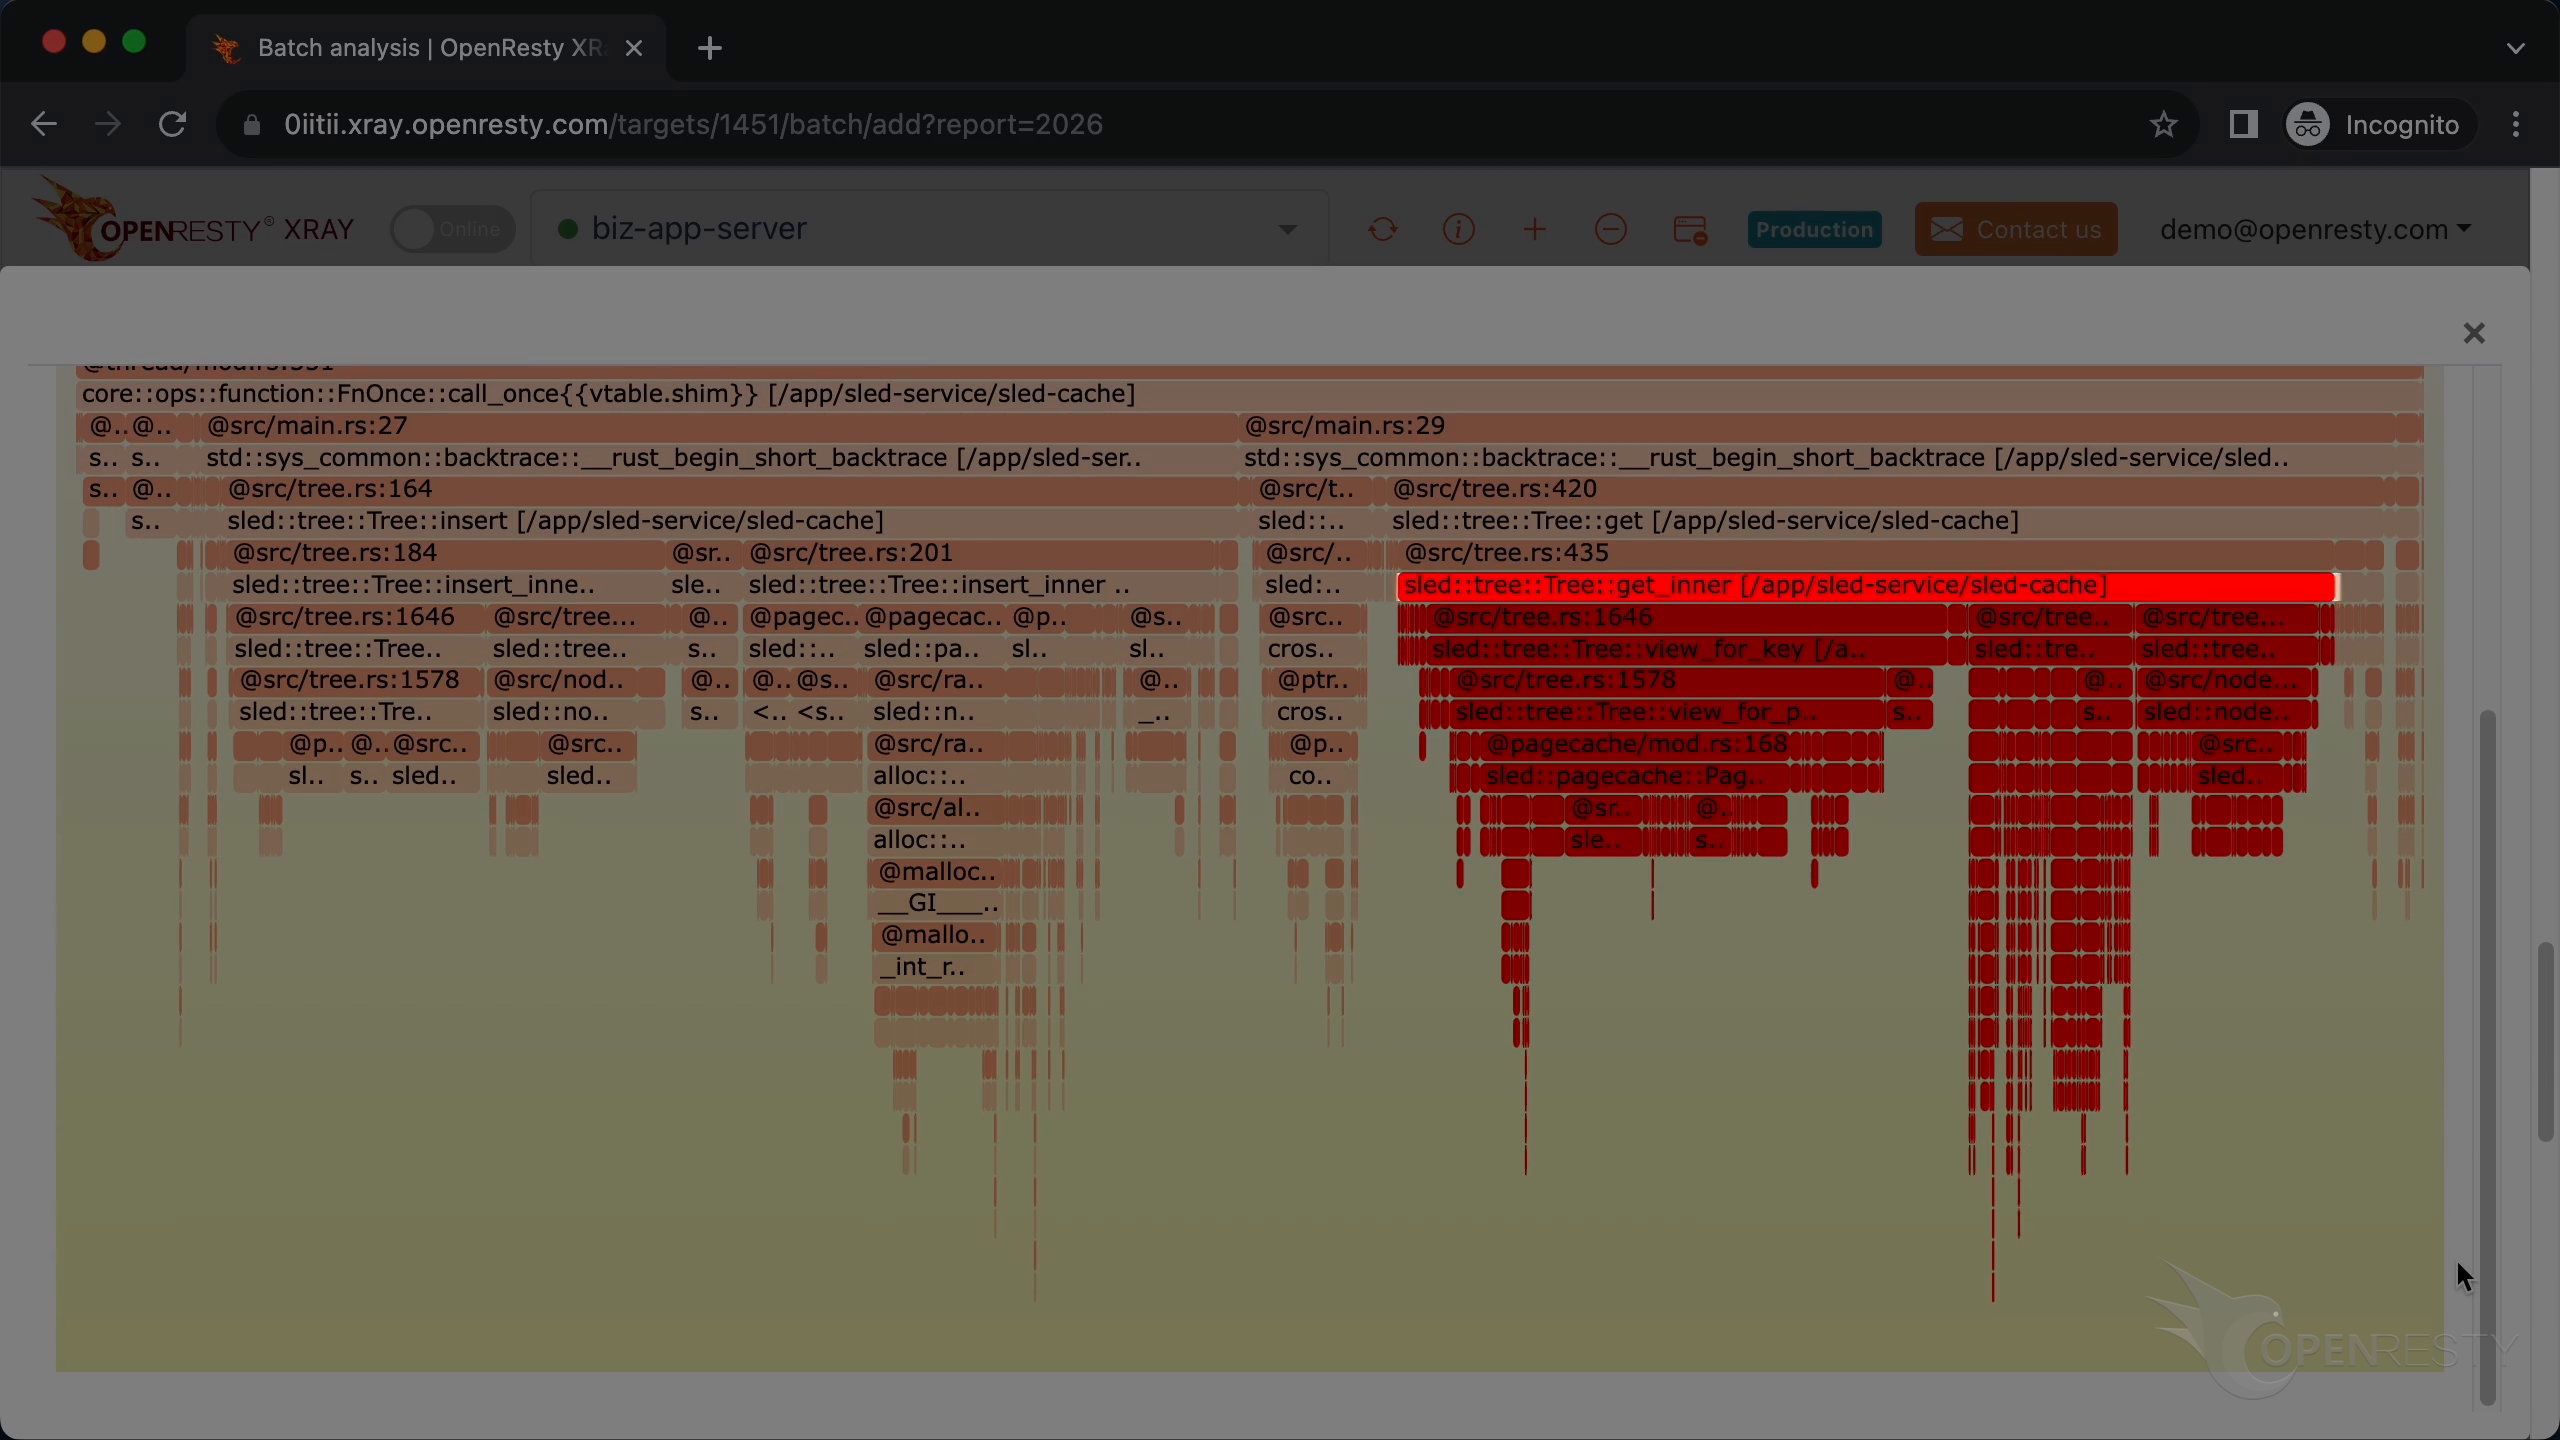
You can see that the get_inner function is taken up mostly by the same view_for_key function mentioned earlier.
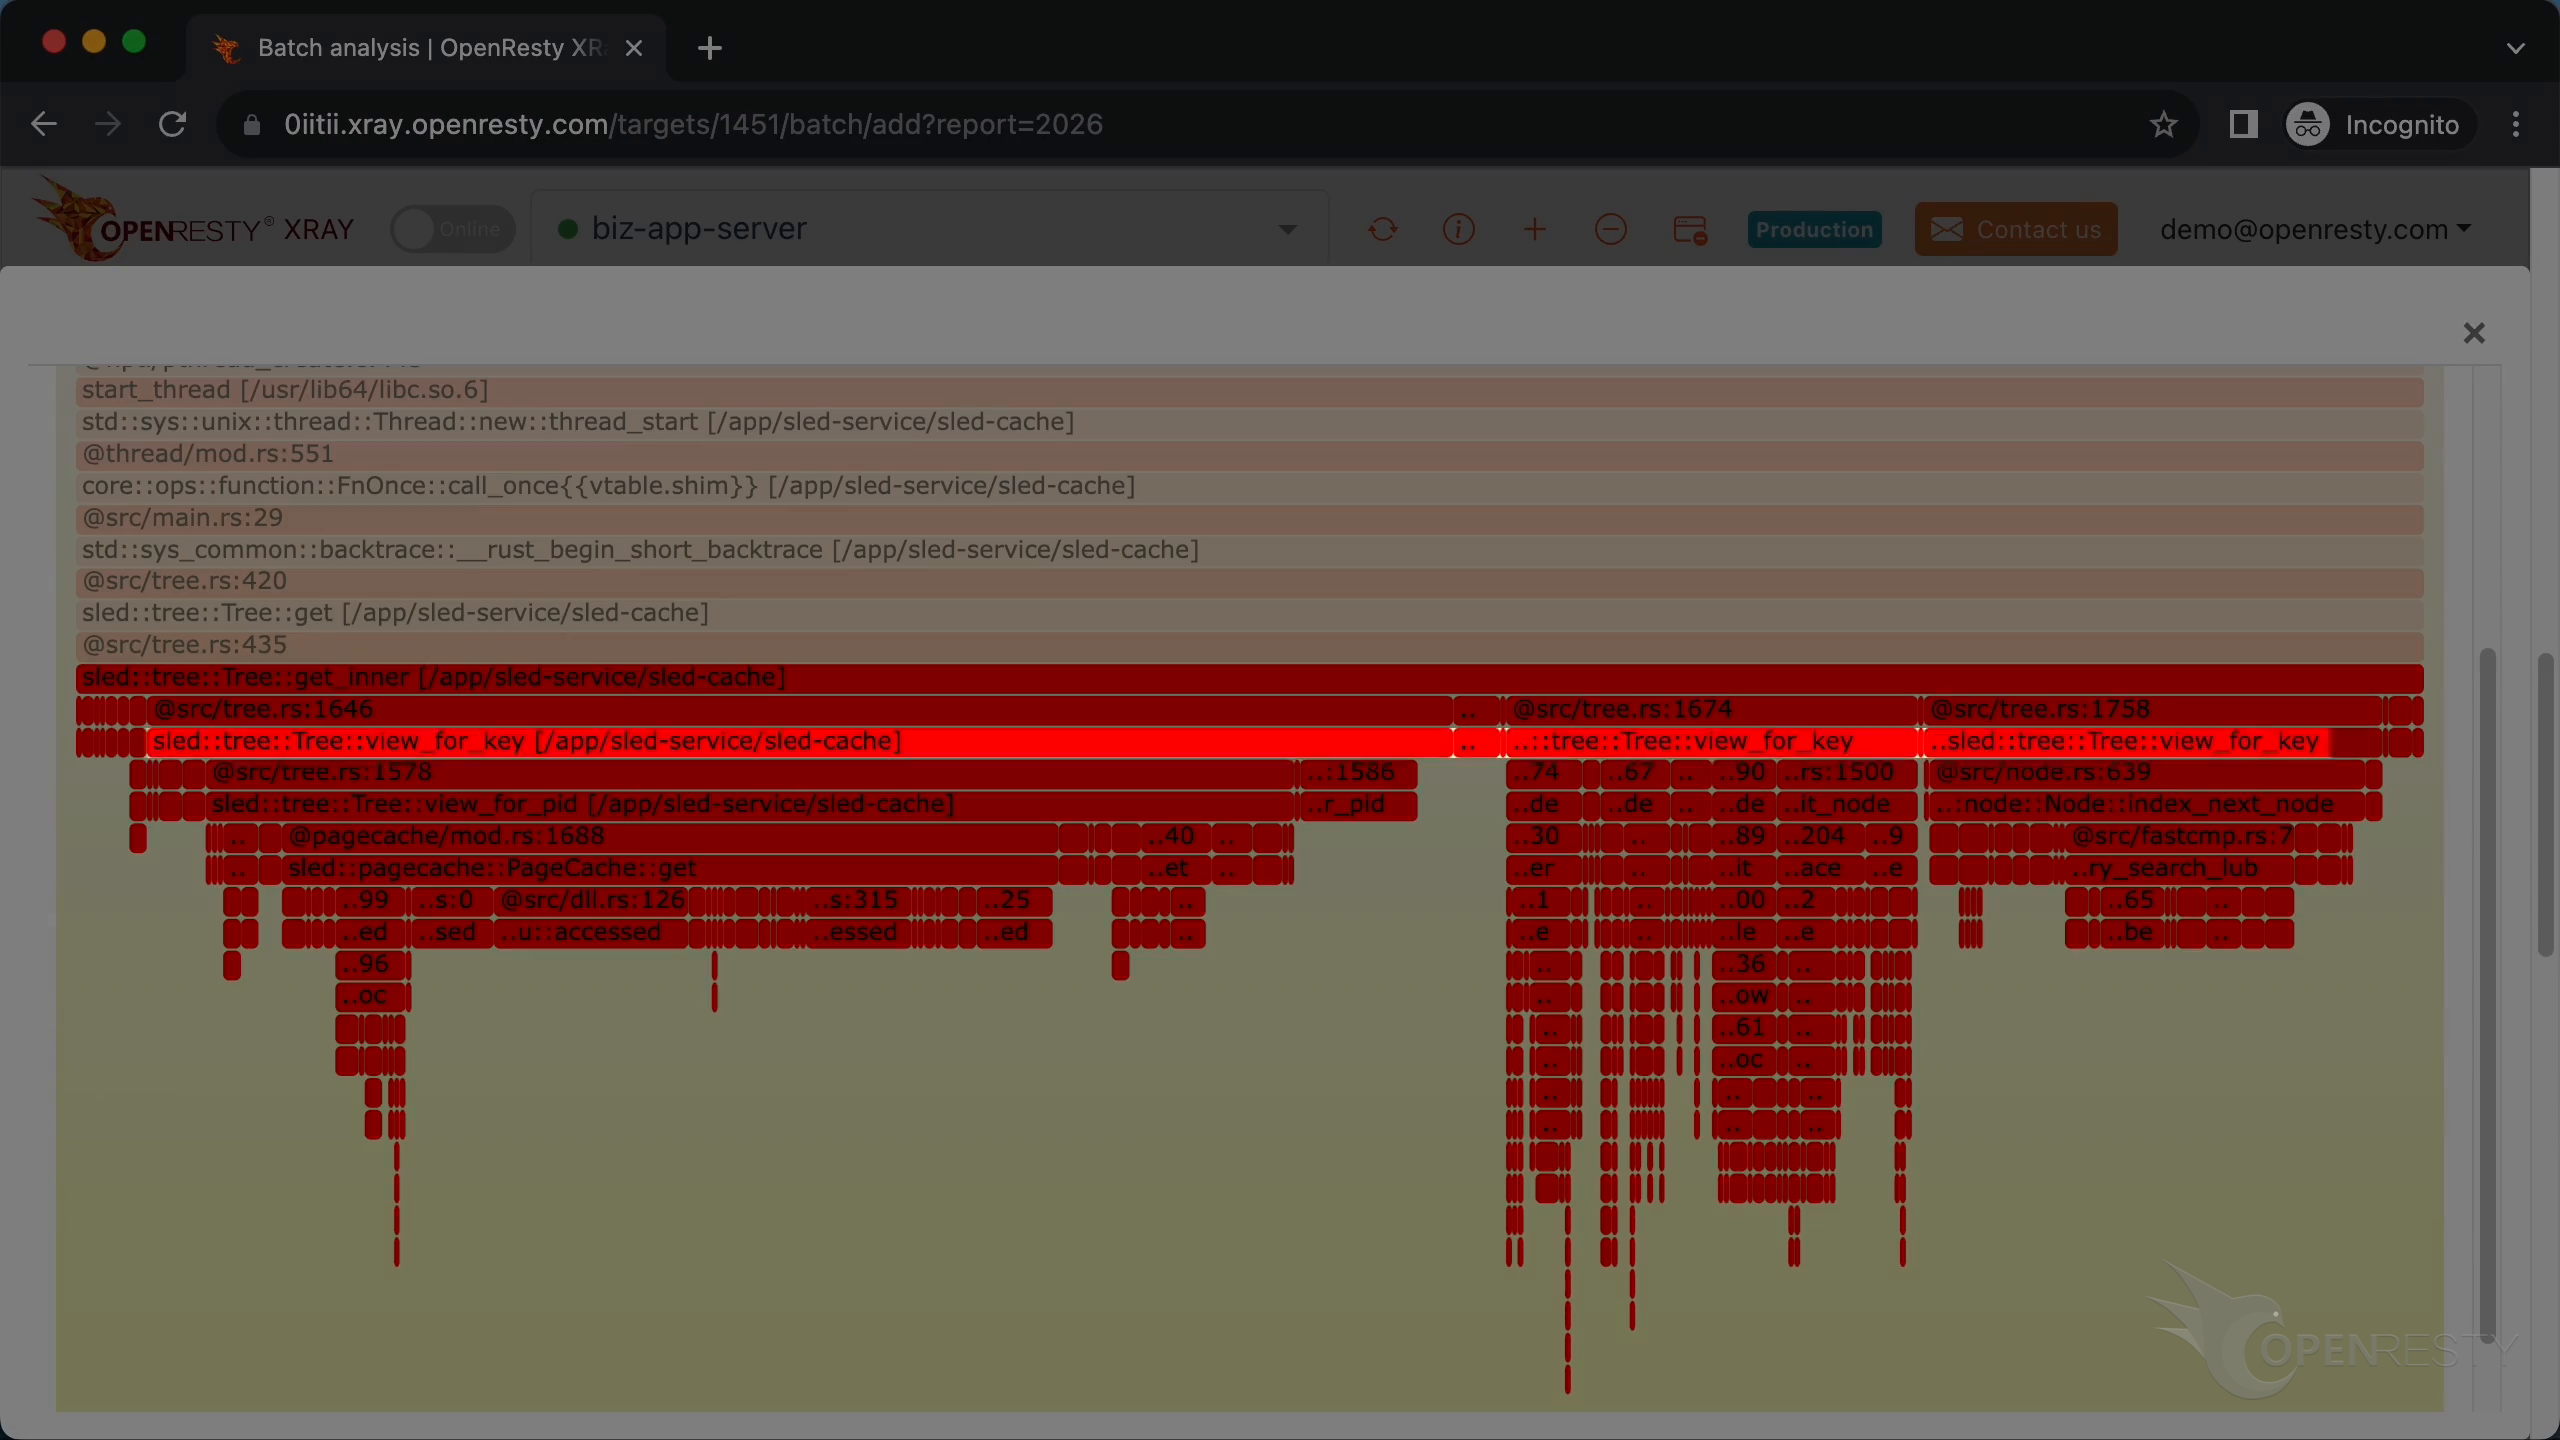
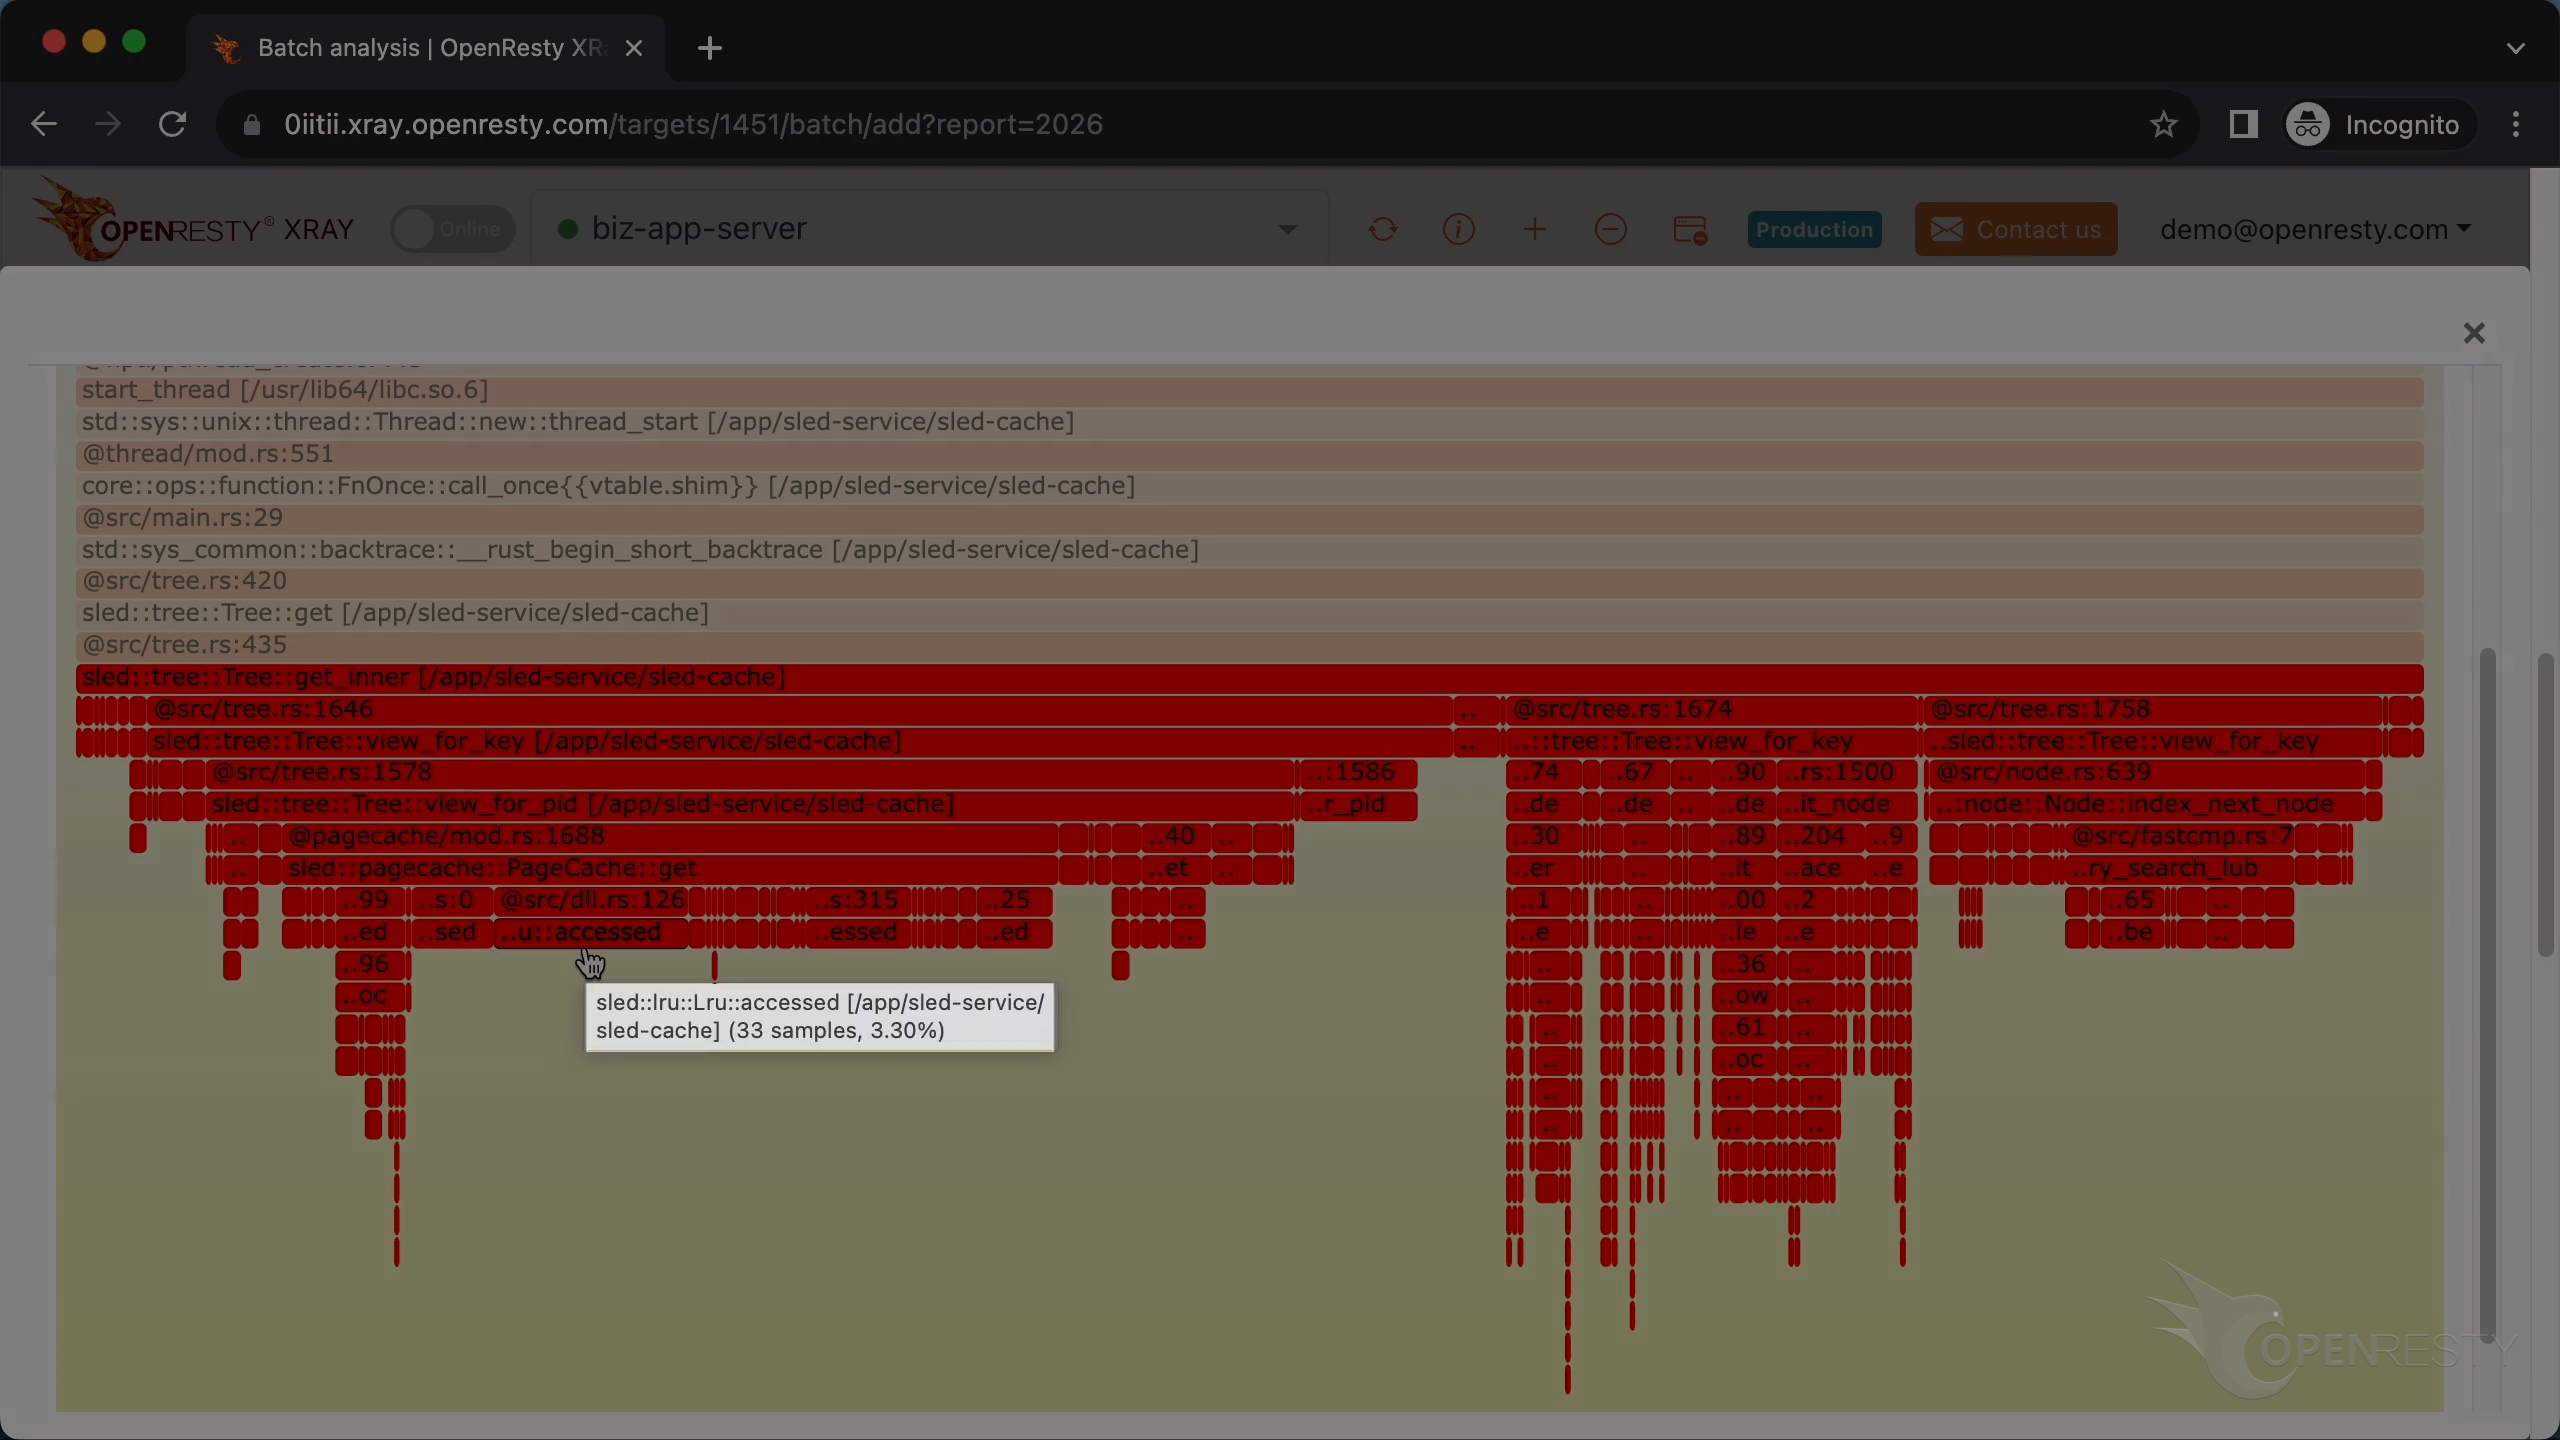
The sled::lru::Lru::accessed function is used in Rust’s Sled library to update the accessed state of an item in the LRU cache, and to return a list of page IDs that need to be evicted.
Automatic Rust CPU Analysis Reports
OpenResty XRay can also monitor online processes automatically and show analysis reports.
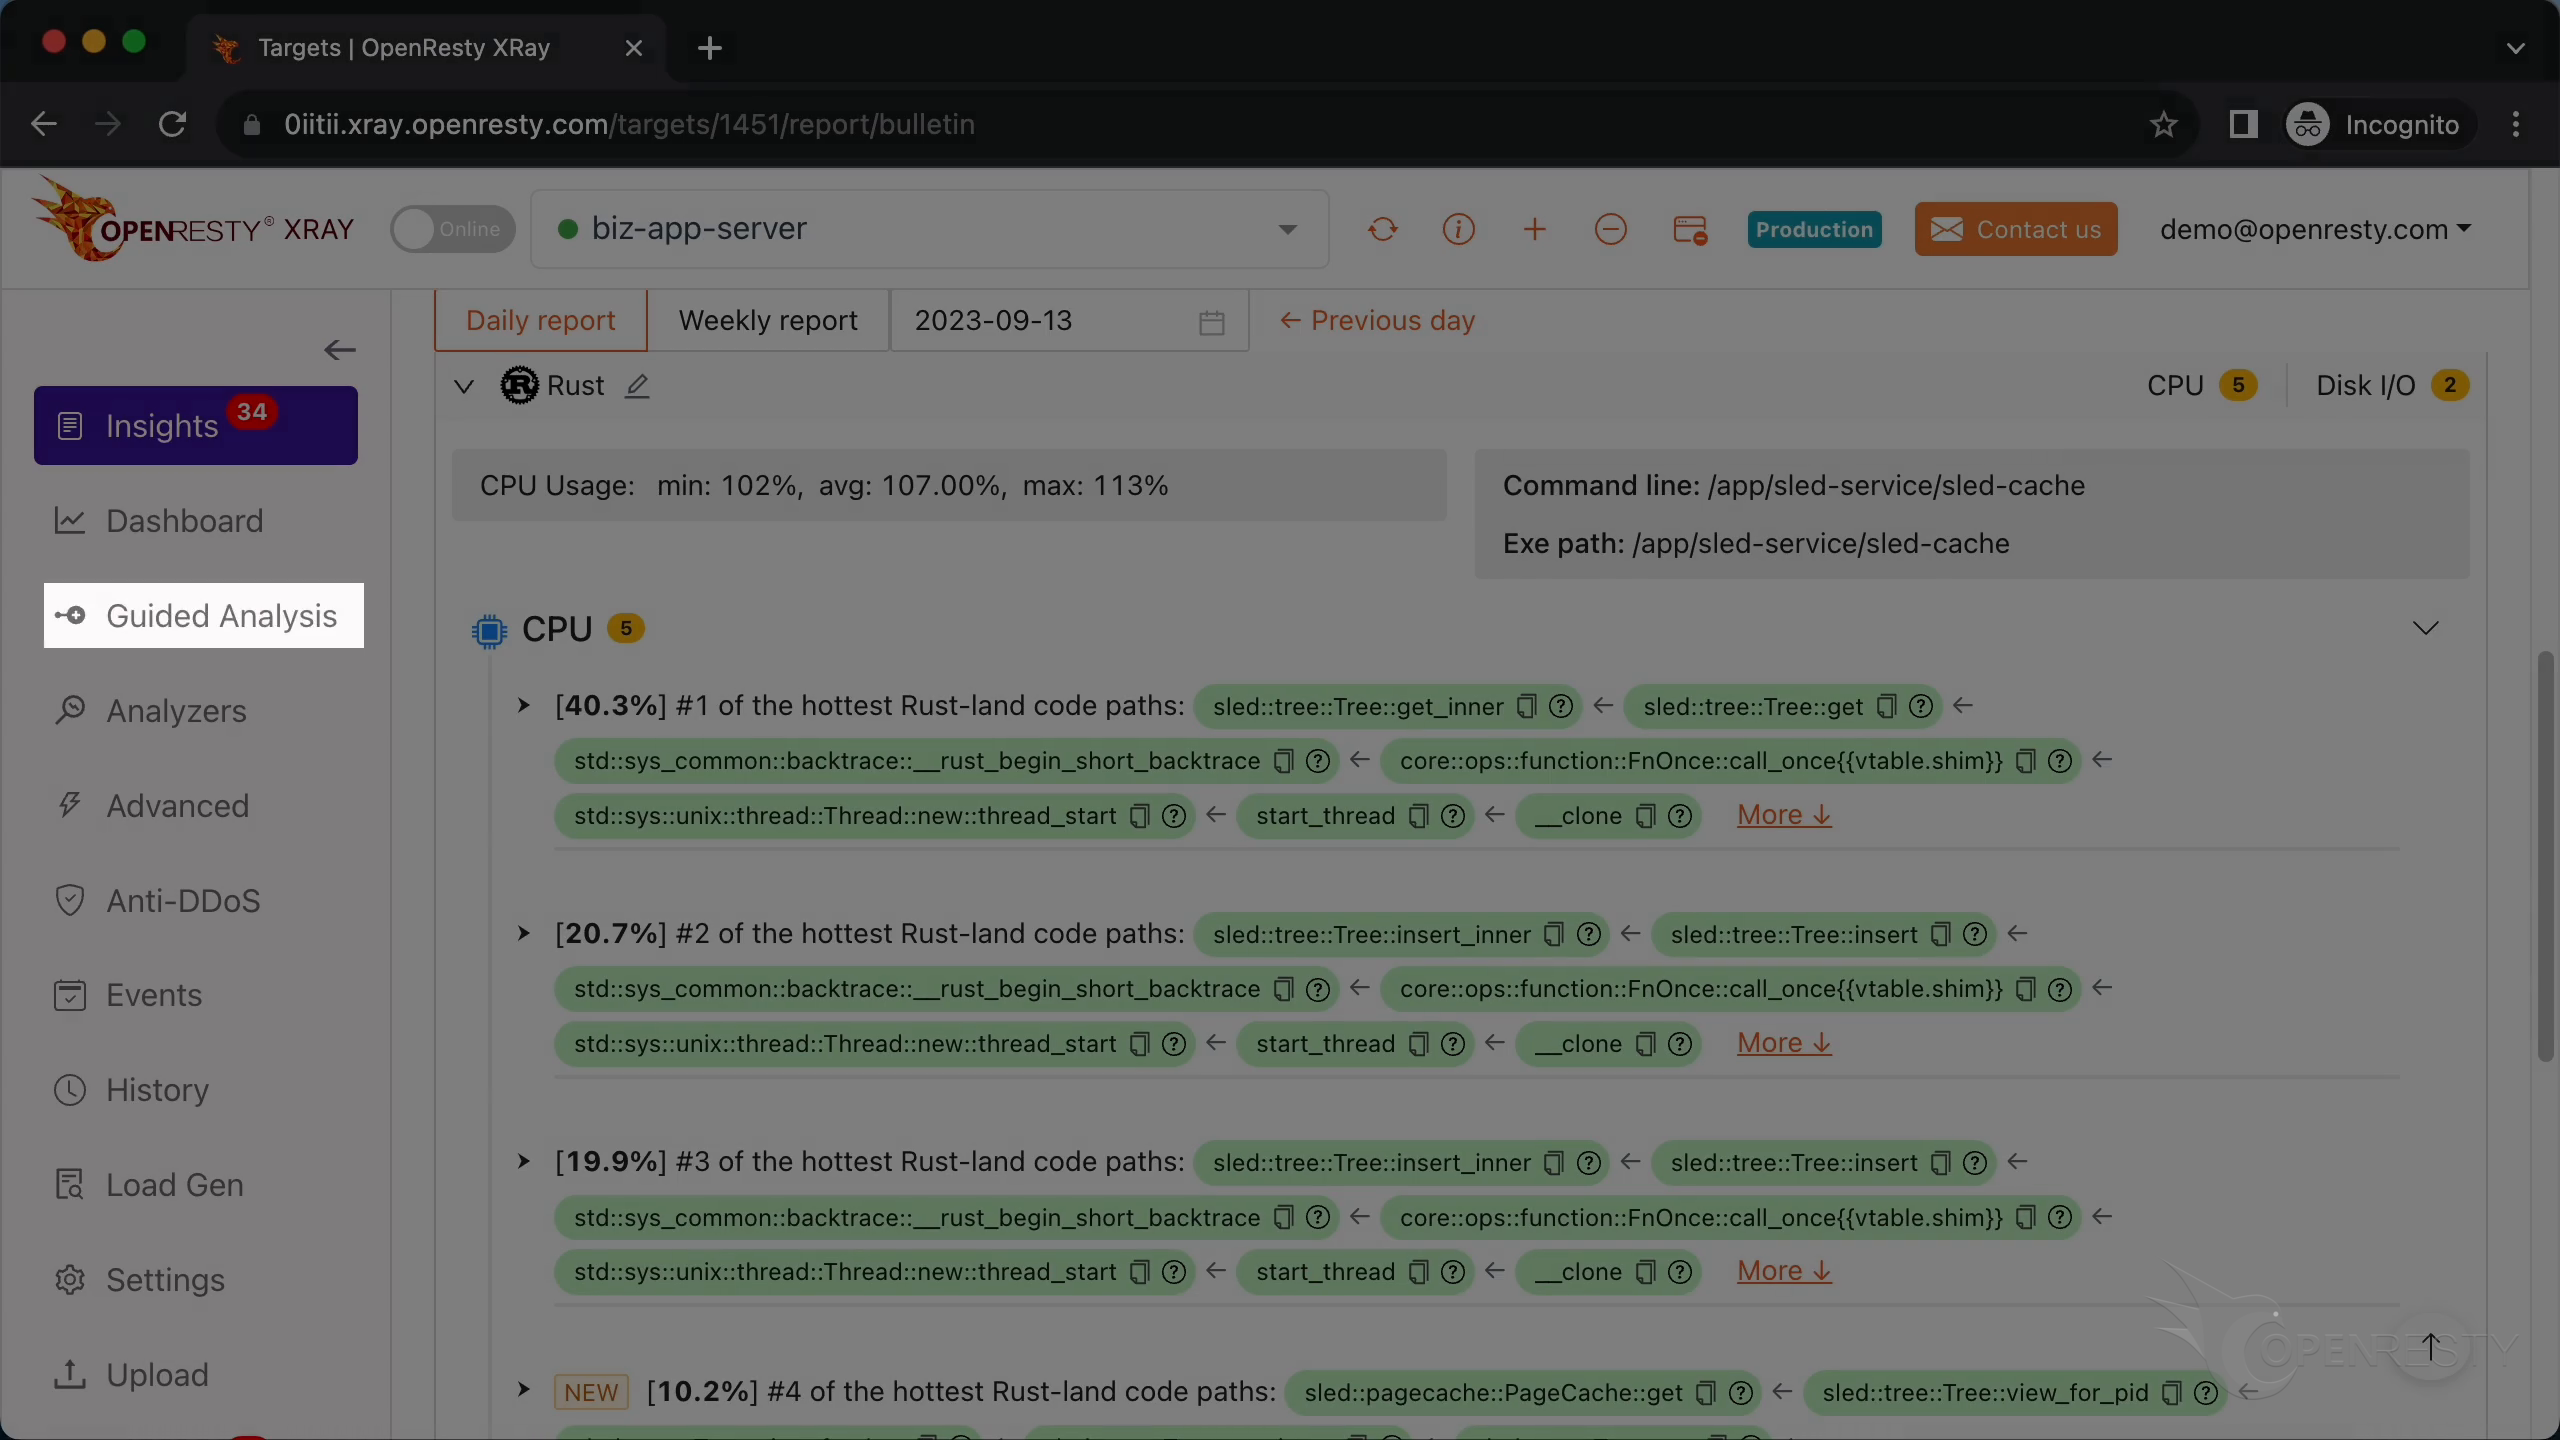
Switch to the “Insights” page.
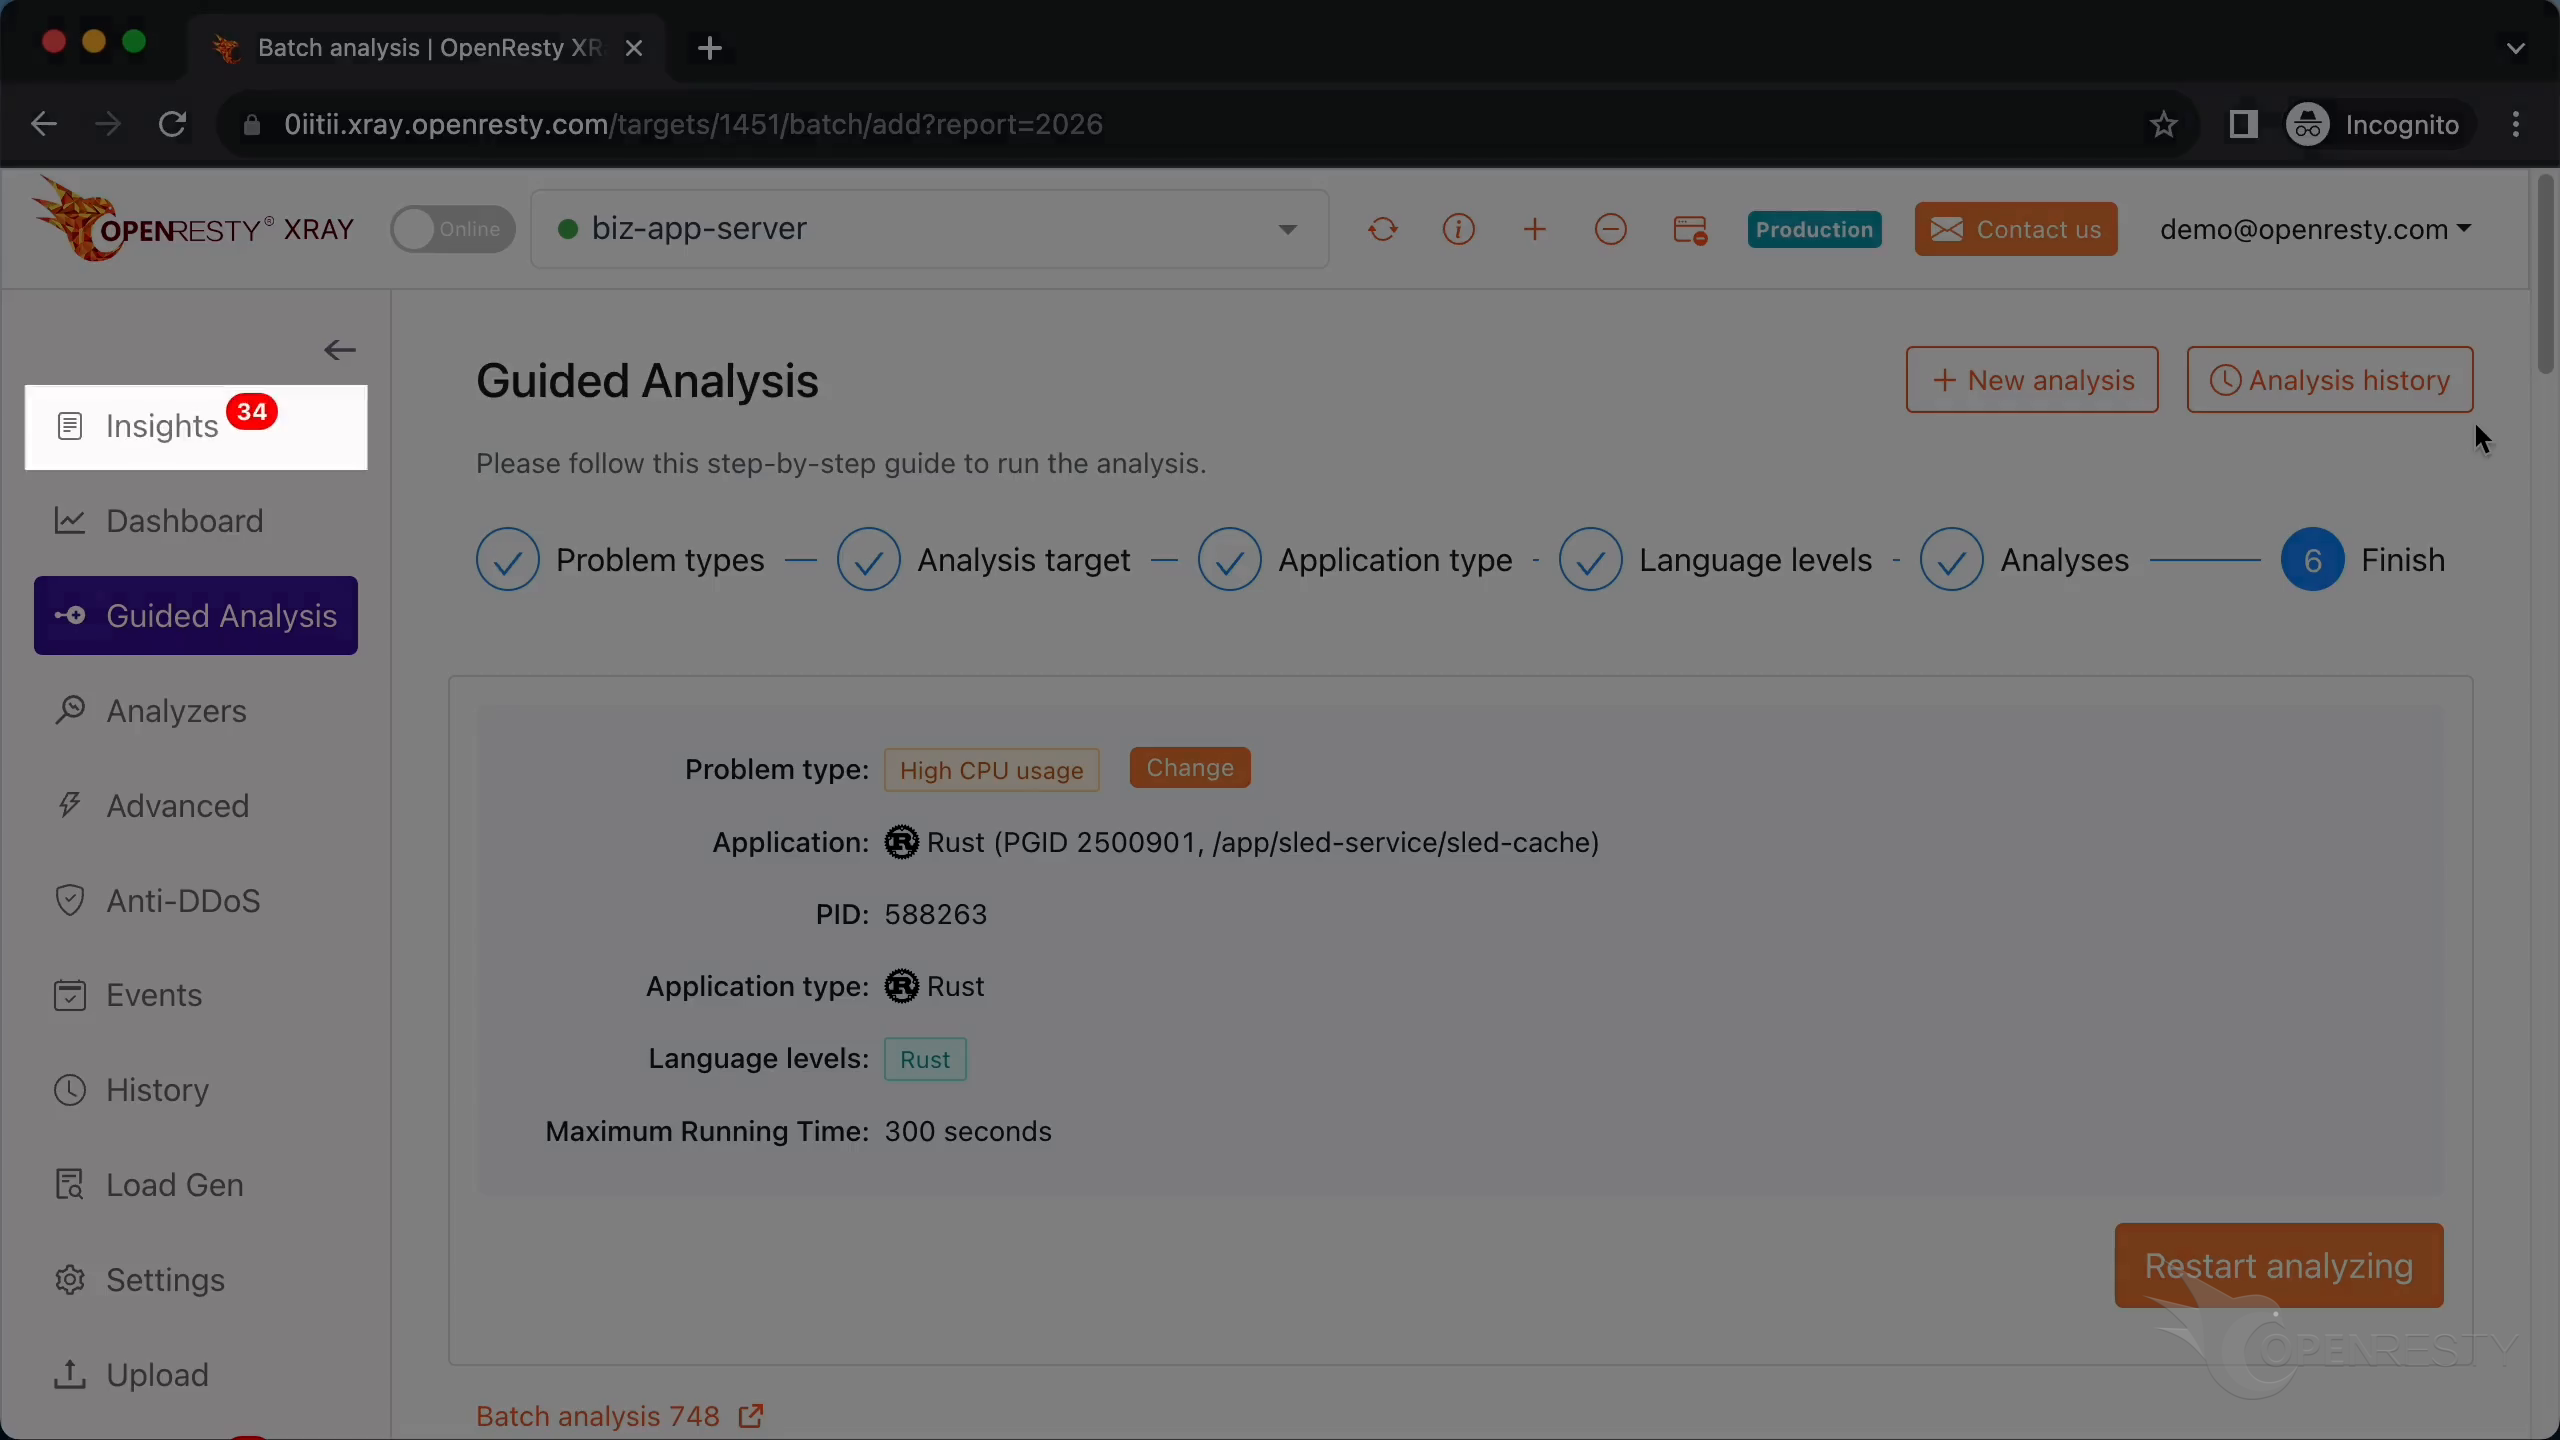
You can find the reports on the Insights page for daily and weekly periods, so you don’t have to use the “Guided Analysis” feature at all.
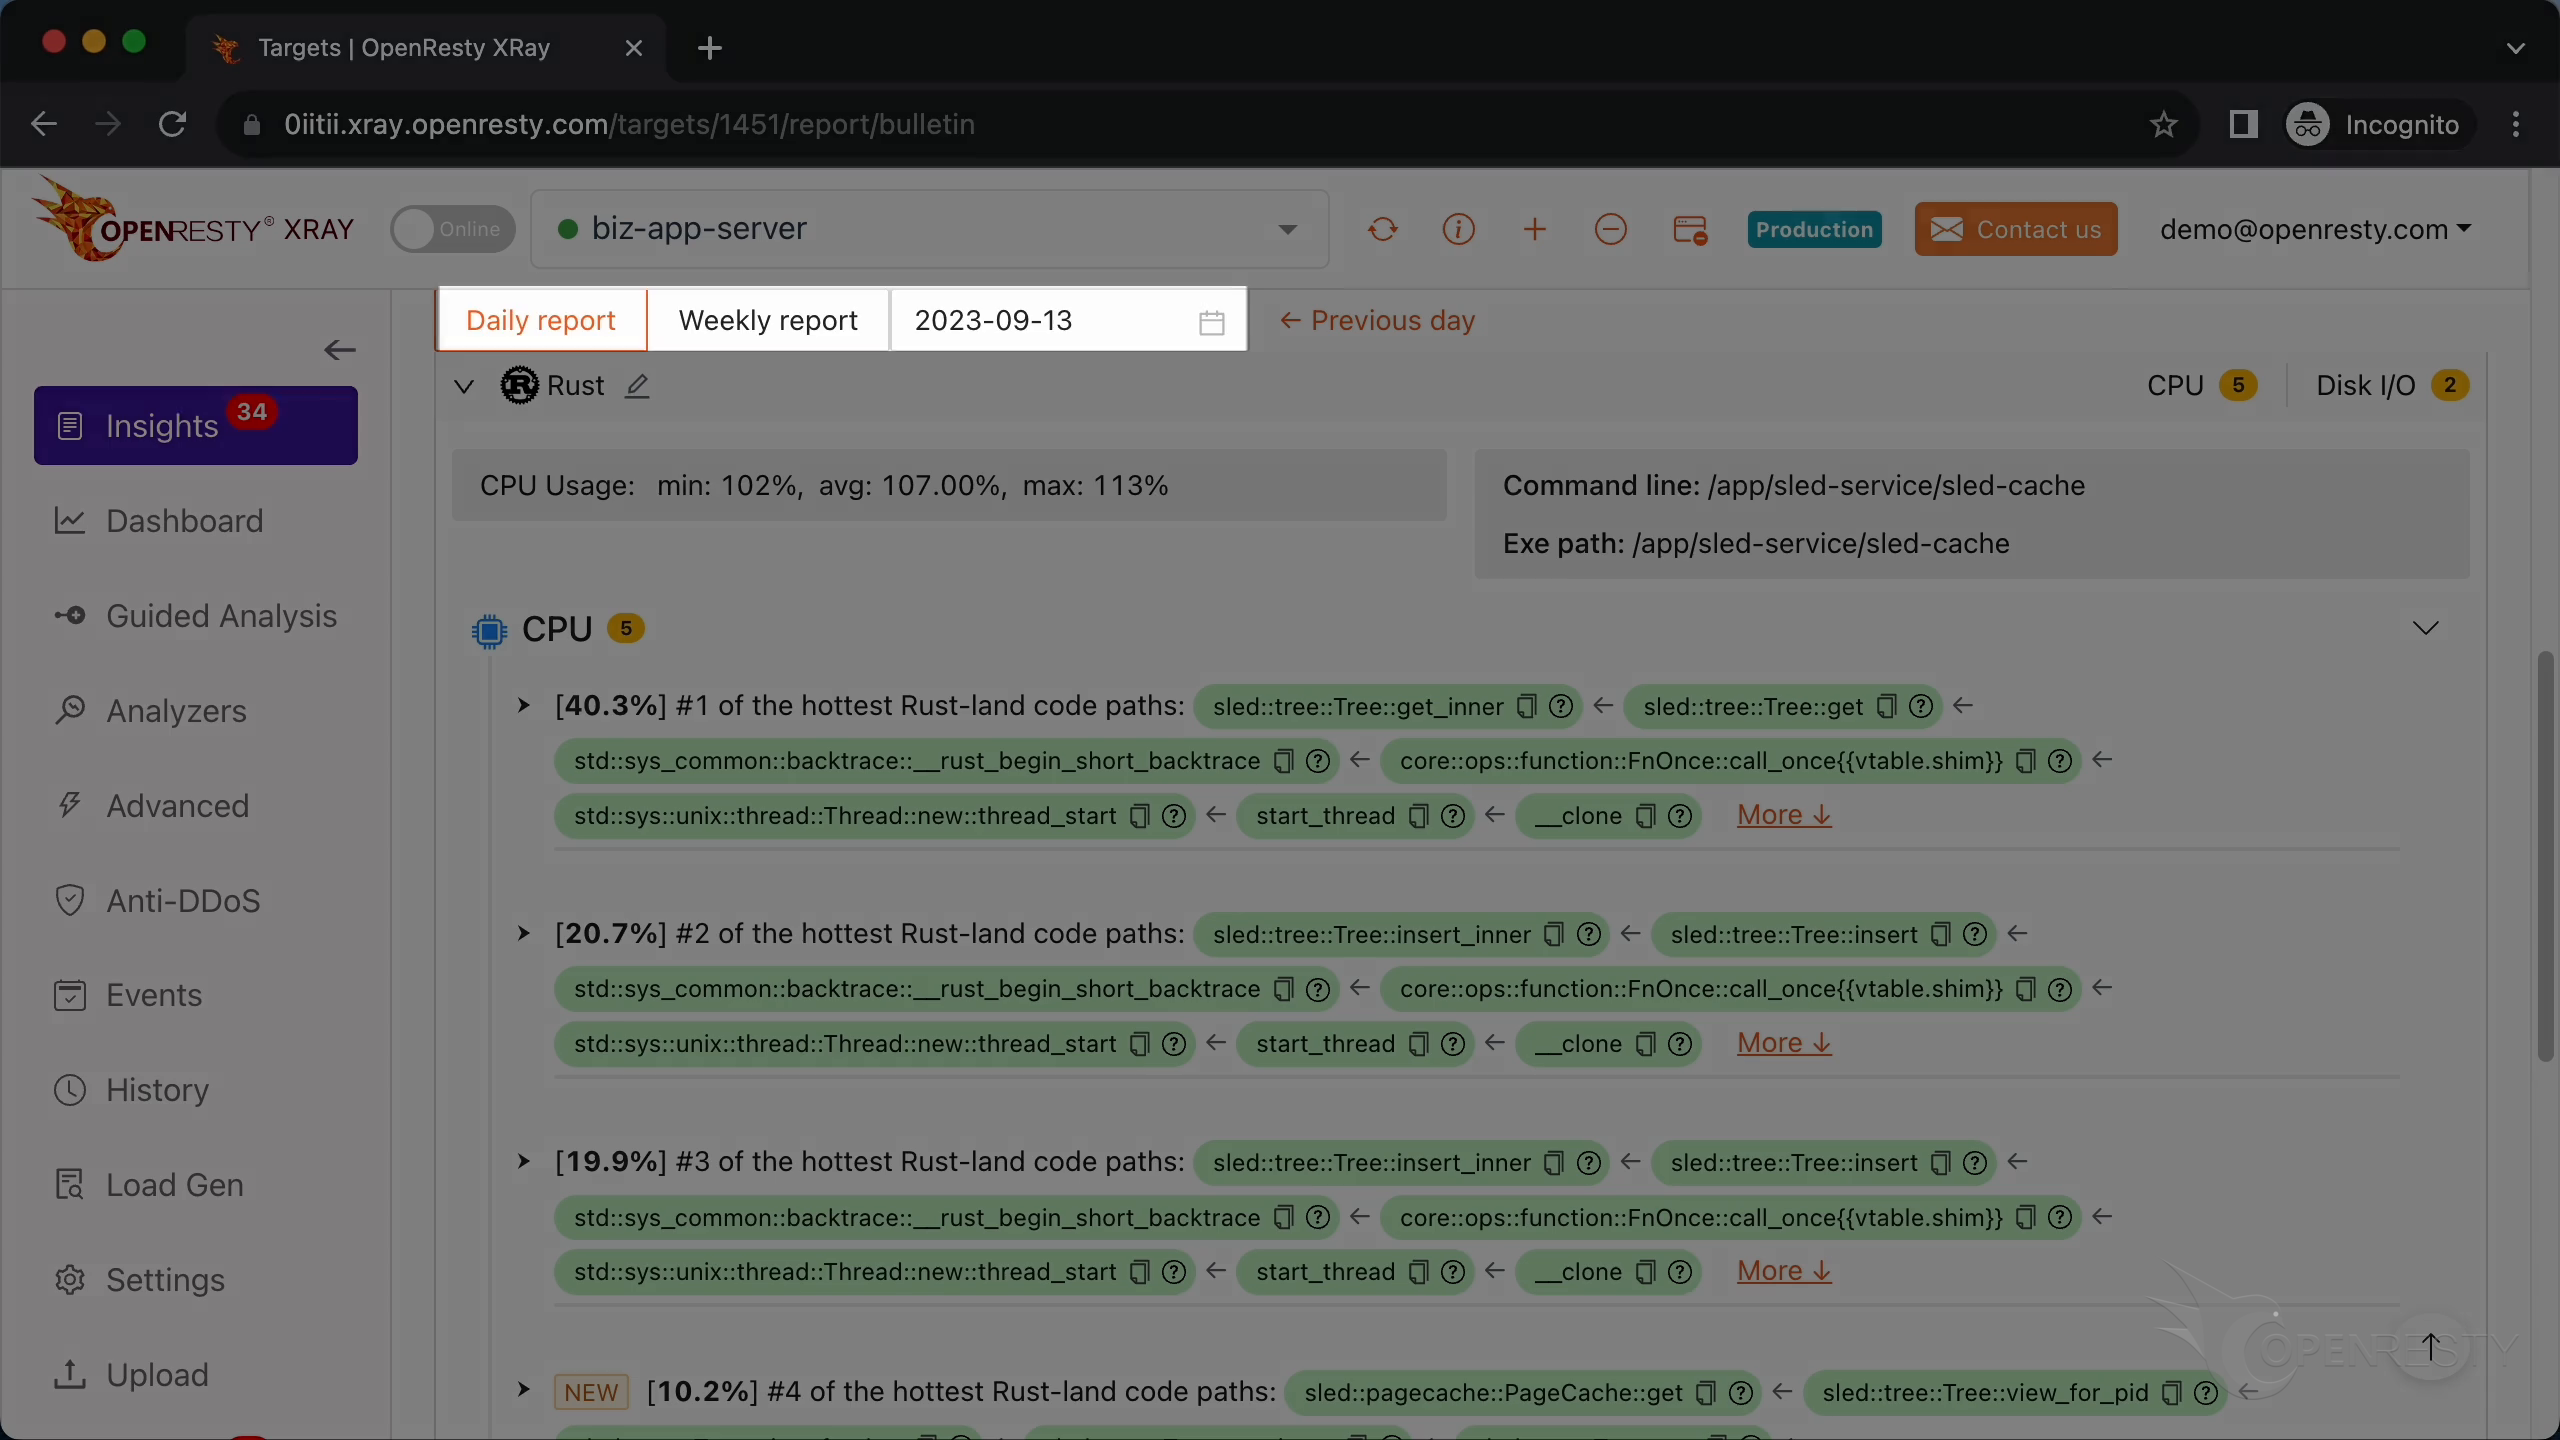
That said, “Guided Analysis” is still useful for application development and demonstration purposes. In the Insights daily report you can see the process’s CPU usage (min 102%, avg 107%, max 113%), along with the hottest Rust code paths ranked by percentage.
Beyond CPU time, OpenResty XRay can also trace panics in Rust programs and diagnose high disk I/O in Rust applications in the same non-invasive way.
Frequently Asked Questions
How do I profile CPU usage of a Rust program without changing its code?
Use a non-invasive profiler based on dynamic tracing. OpenResty XRay analyzes the running, unmodified Rust process directly: you select the process in its Guided Analysis feature, and it samples the process and generates Rust language-level CPU flame graphs — no recompilation and no instrumentation of the target process.
How do I find which Rust function is consuming the most CPU?
Sample the process and get a Rust-land CPU flame graph, then let OpenResty XRay automatically infer the hottest code paths from it — no manual flame graph reading required. In our Sled case, it reported sled::tree::Tree::insert as the #1 hottest path and even pointed to the exact source line (line 164).
Why was our Sled-based service using more than 100% CPU?
In this case, the CPU time concentrated in two paths: data insertion via sled::tree::Tree::insert — where view_for_key and pagecache writes dominated, with glibc’s realloc allocation function running hot — and data lookups via get_inner, which consumed almost 40% of the CPU time, again mostly inside view_for_key.
What is OpenResty XRay
OpenResty XRay is a dynamic-tracing product that automatically analyzes your running applications to troubleshoot performance problems, behavioral issues, and security vulnerabilities with actionable suggestions. Under the hood, OpenResty XRay is powered by our Y language targeting various runtimes like Stap+, eBPF+, GDB, and ODB, depending on the contexts.
If you like this tutorial, please subscribe to this blog site and/or our YouTube channel. Thank you!
About The Author
Yichun Zhang (Github handle: agentzh), is the original creator of the OpenResty® open-source project and the CEO of OpenResty Inc..
Yichun is one of the earliest advocates and leaders of “open-source technology”. He worked at many internationally renowned tech companies, such as Cloudflare, Yahoo!. He is a pioneer of “edge computing”, “dynamic tracing” and “machine coding”, with over 22 years of programming and 16 years of open source experience. Yichun is well-known in the open-source space as the project leader of OpenResty®, adopted by more than 40 million global website domains.
OpenResty Inc., the enterprise software start-up founded by Yichun in 2017, has customers from some of the biggest companies in the world. Its flagship product, OpenResty XRay, is a non-invasive profiling and troubleshooting tool that significantly enhances and utilizes dynamic tracing technology. And its OpenResty Edge product is a powerful distributed traffic management and private CDN software product.
As an avid open-source contributor, Yichun has contributed more than a million lines of code to numerous open-source projects, including Linux kernel, Nginx, LuaJIT, GDB, SystemTap, LLVM, Perl, etc. He has also authored more than 60 open-source software libraries.
Related Articles
OpenResty XRay Dec 25, 2023

OpenResty XRay Aug 23, 2023

OpenResty XRay Aug 4, 2023

OpenResty XRay Jul 28, 2023

OpenResty XRay Apr 1, 2024