Pinpointing CPU-Hottest Go Code Paths Inside Prometheus (using OpenResty XRay)
TL;DR: A standard Prometheus process was consuming over 160% CPU. Guided analysis with OpenResty XRay on the unmodified Go process revealed that Go garbage collection (GC) accounted for more than 99% of the CPU time. The main driver of the GC pressure is the loadWAL function, which rapidly allocates a large number of GC objects while loading data from the Write-Ahead Log (WAL) — this top allocating code path alone accounts for over 19% of all new object allocations. The full walkthrough follows below.
In this tutorial, you will get a step-by-step tour of how to use OpenResty XRay to identify the most CPU-intensive Go (golang) code paths of an online Prometheus server. These code paths are the ones that consume the most CPU time and severely affect Prometheus’ performance.
Problem: high CPU usage
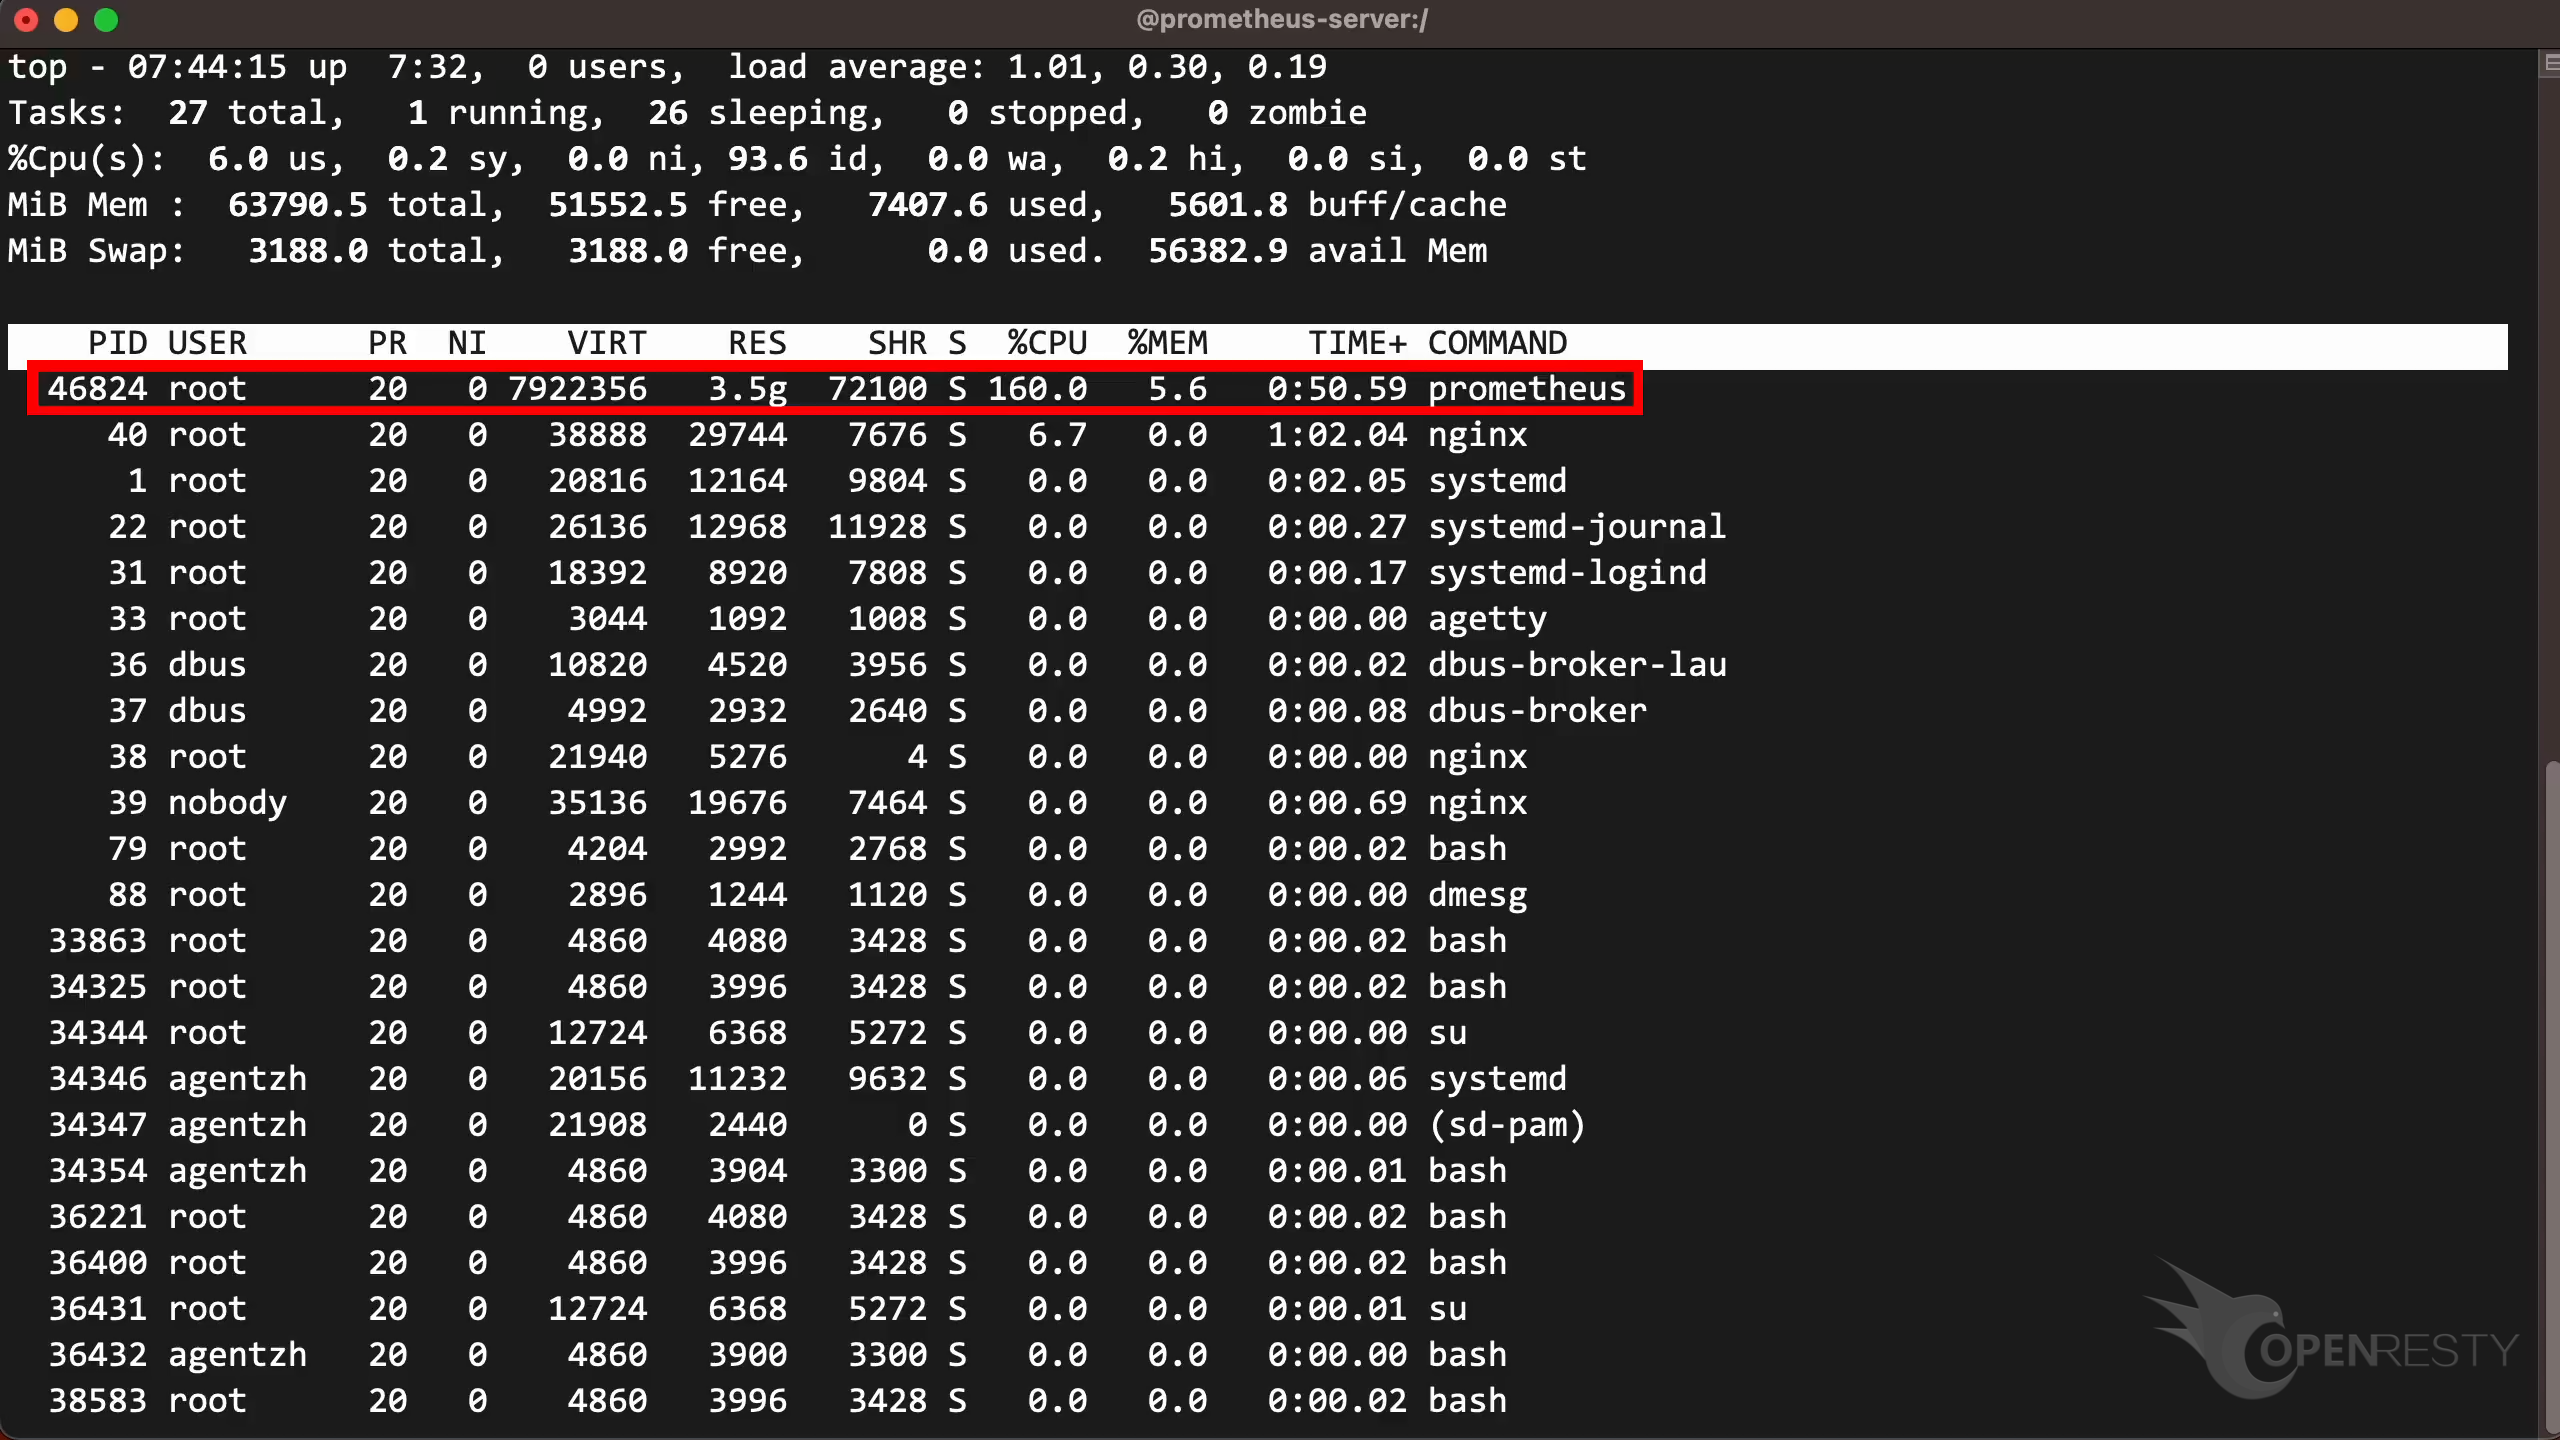
Let’s start by running the top command to check the CPU usage. As shown, the Prometheus process consumes more than 160% of CPU cores.
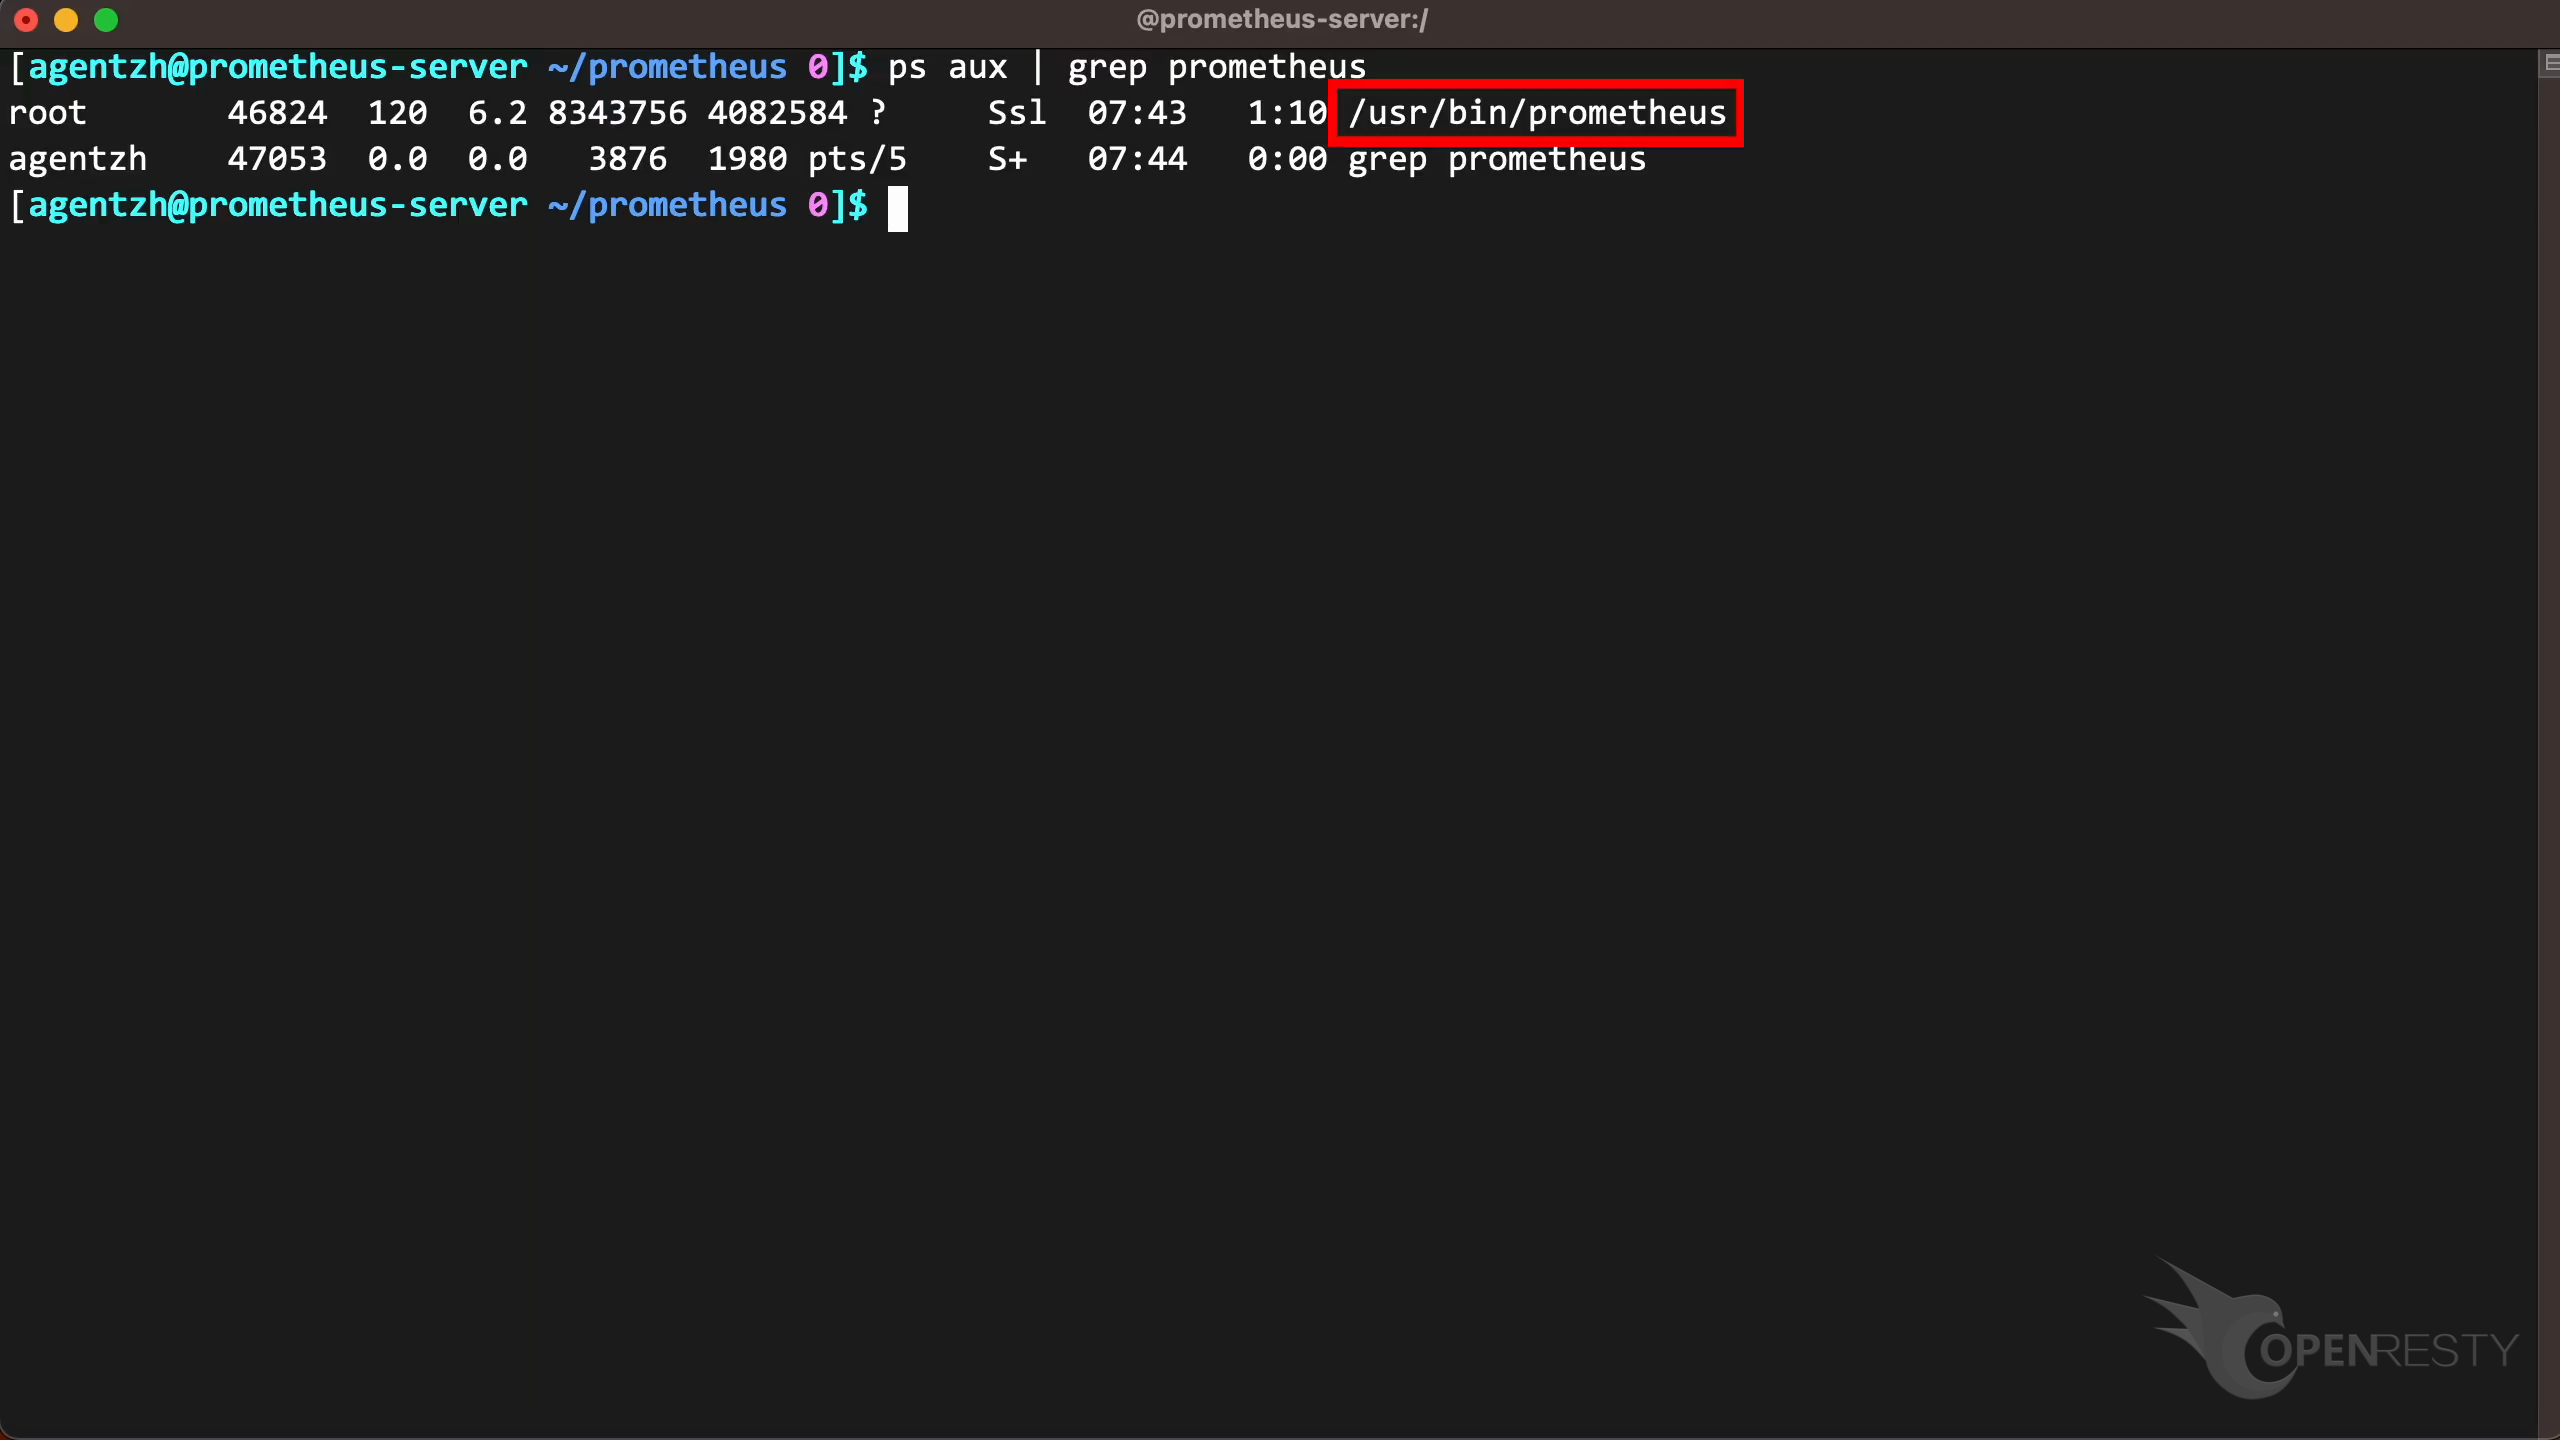
Running the ps command to see the full command line confirms this is the standard Prometheus binary executable (/usr/bin/prometheus) shipped with the Linux distribution, without any modifications.
Use the guided analysis feature of OpenResty XRay to spot the CPU-hottest Go code paths
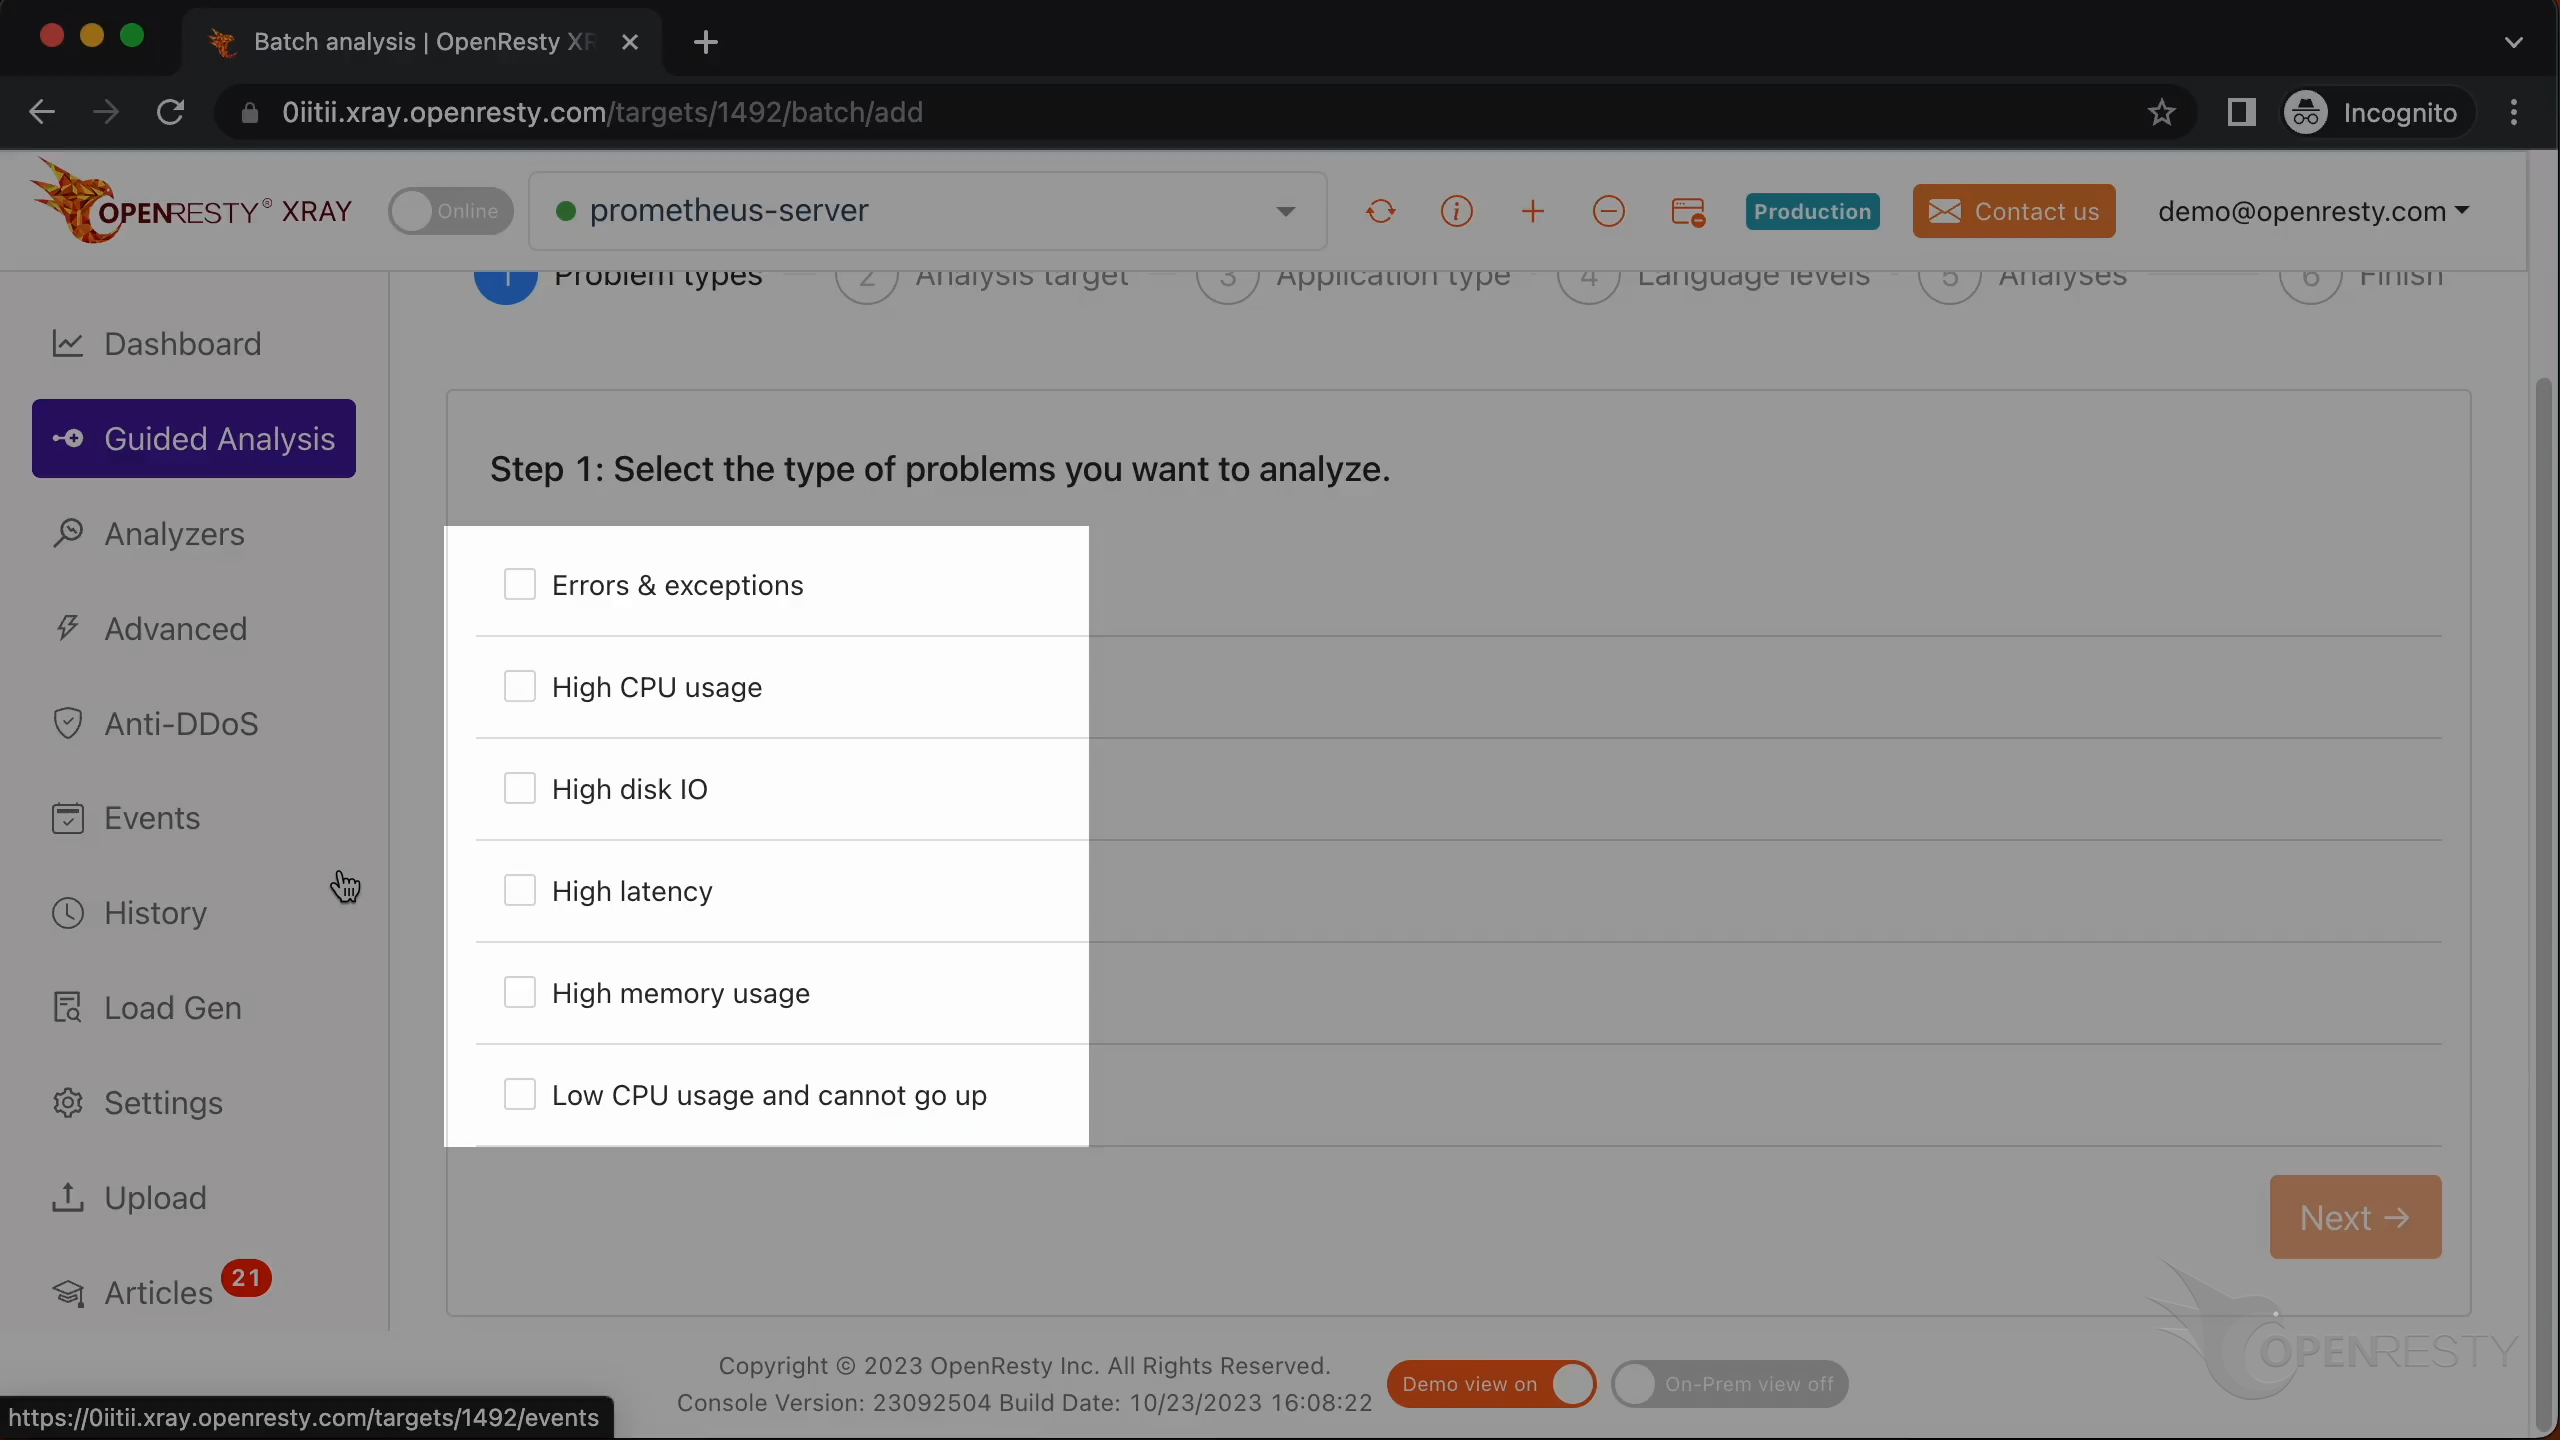
Let’s use OpenResty XRay to analyze this unmodified process in real time. After confirming the target machine in the Web console, go to the “Guided Analysis” page and select “High CPU usage” from the list of problem types the system can diagnose.
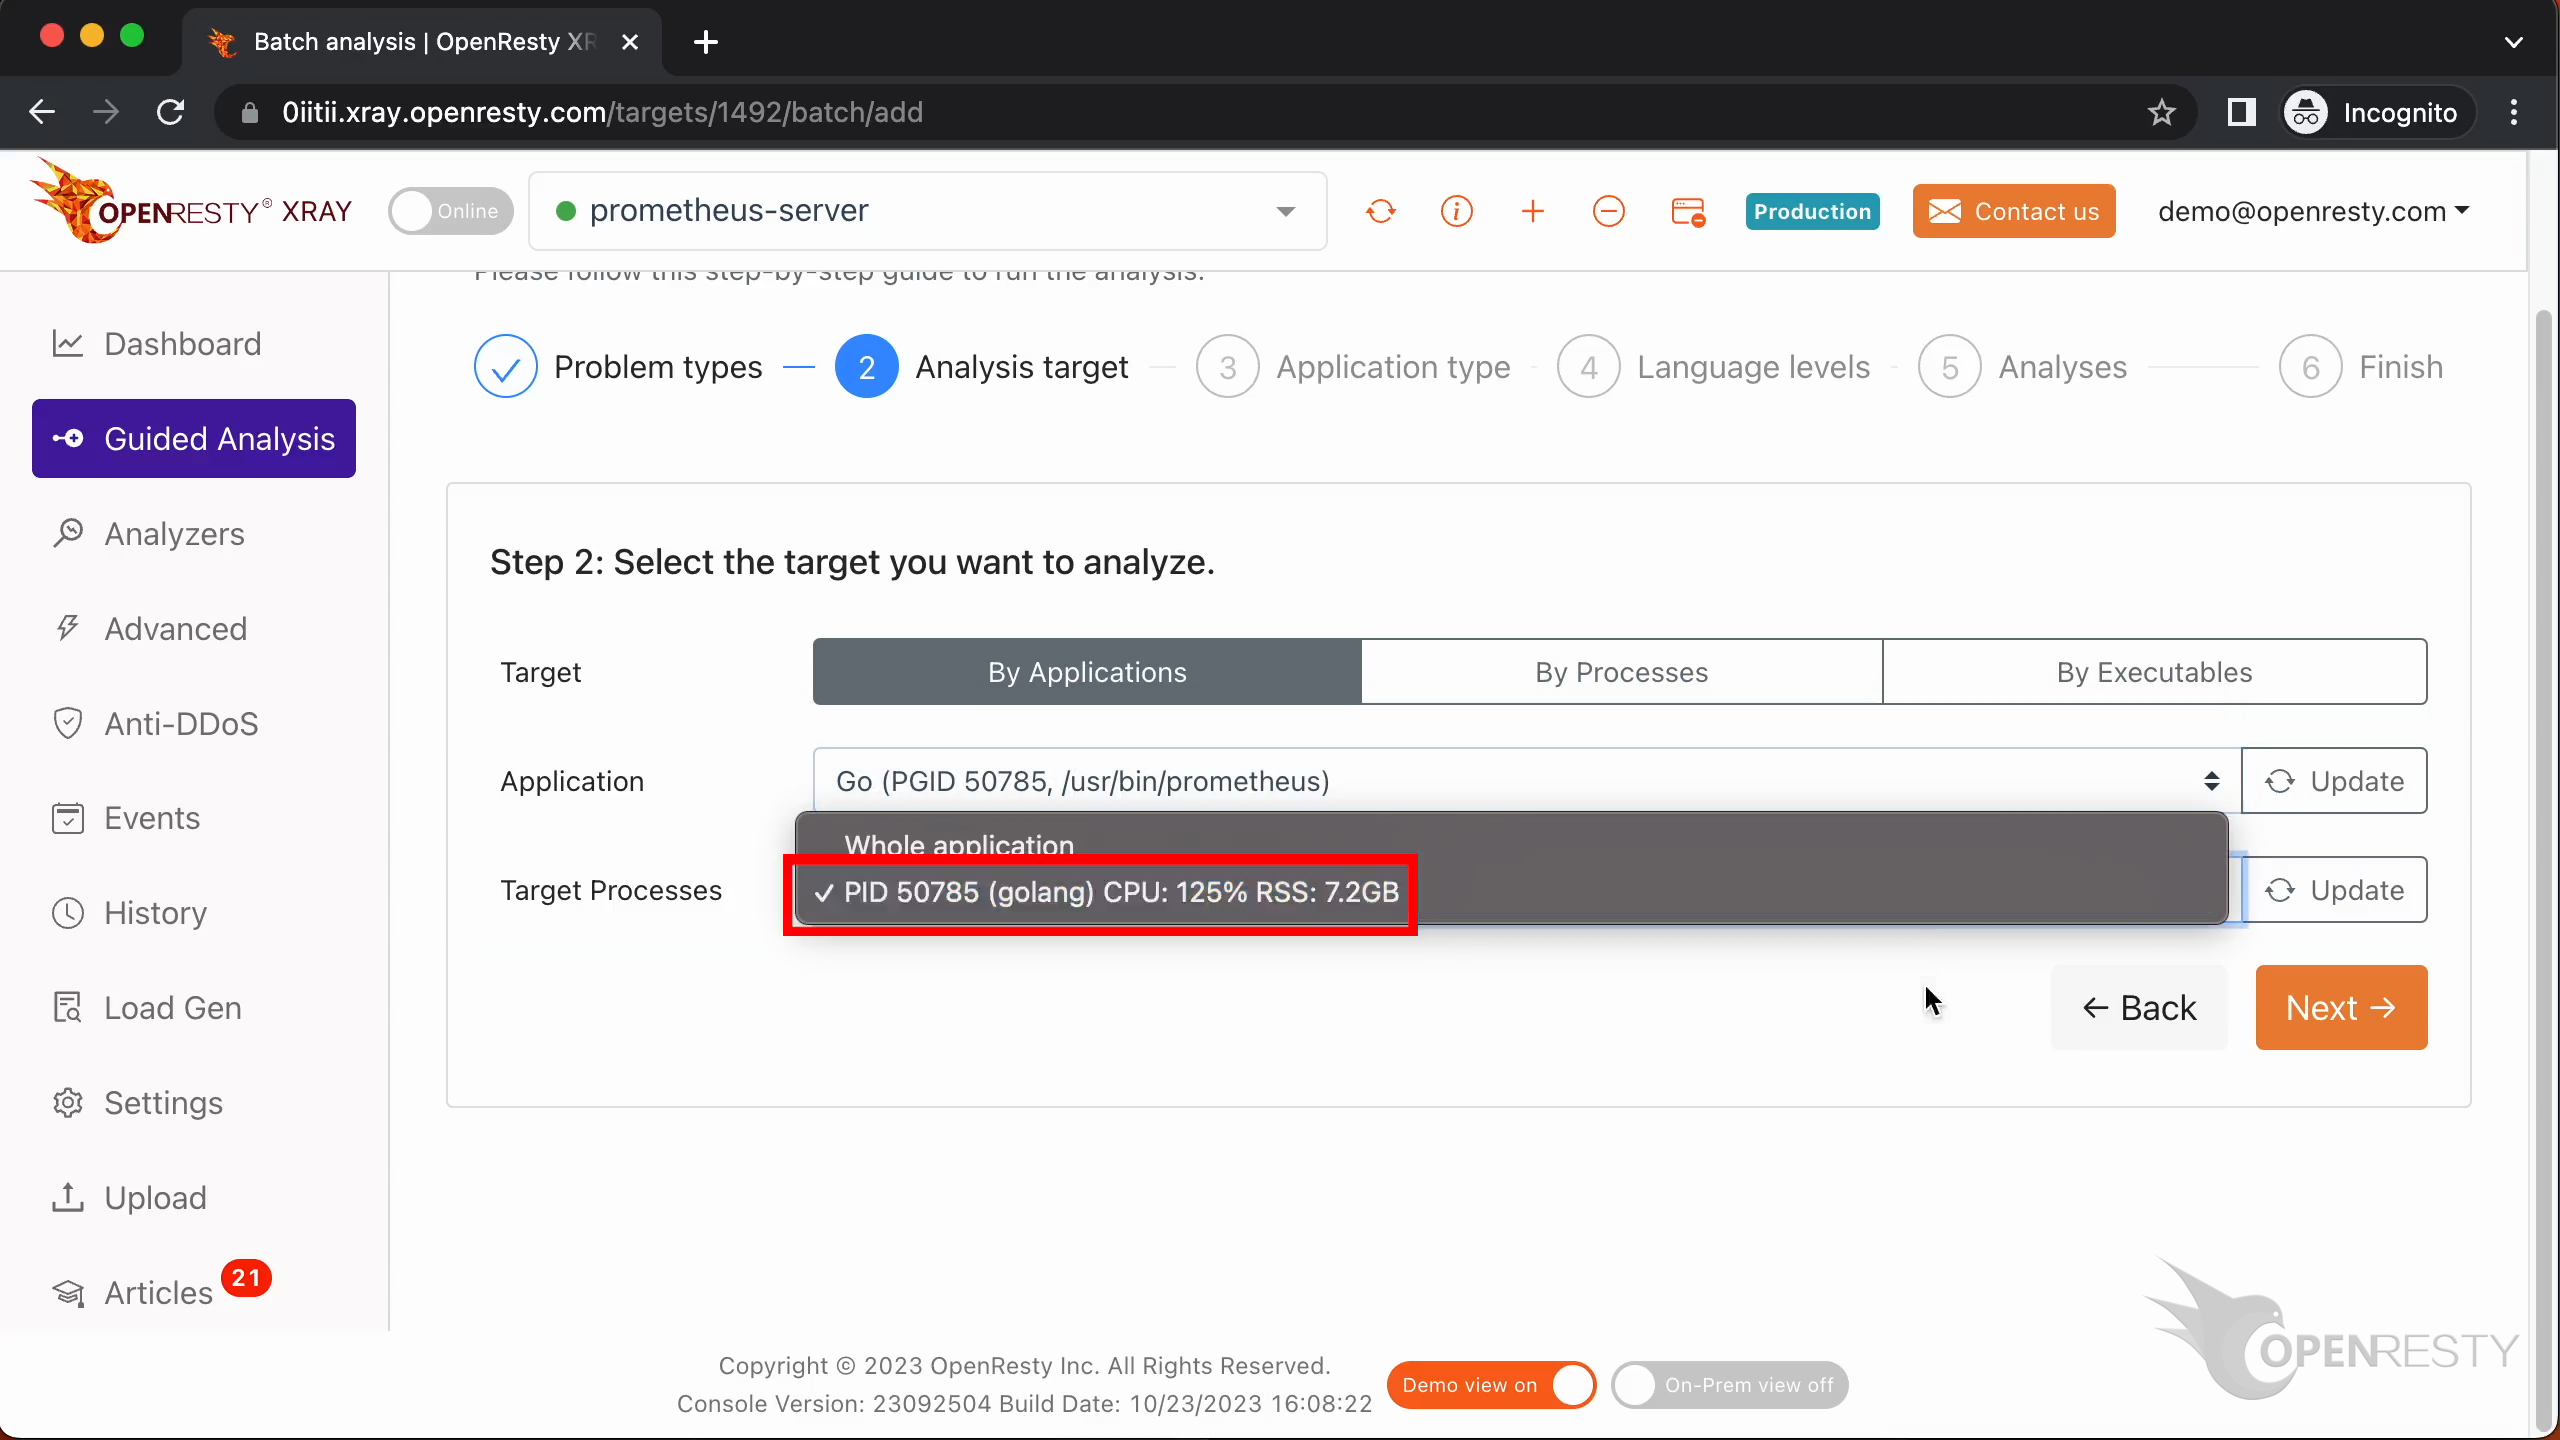
Then select the Go process we saw earlier in top — PID 50785, consuming 125% CPU, with the executable /usr/bin/prometheus. Choose “Go” as the language level, leave the maximum running time at the default 300 seconds, and start analyzing.
OpenResty XRay keeps performing multiple rounds of sampling on the target process. For this case, two or three rounds are enough; then it automatically generates an analysis report.
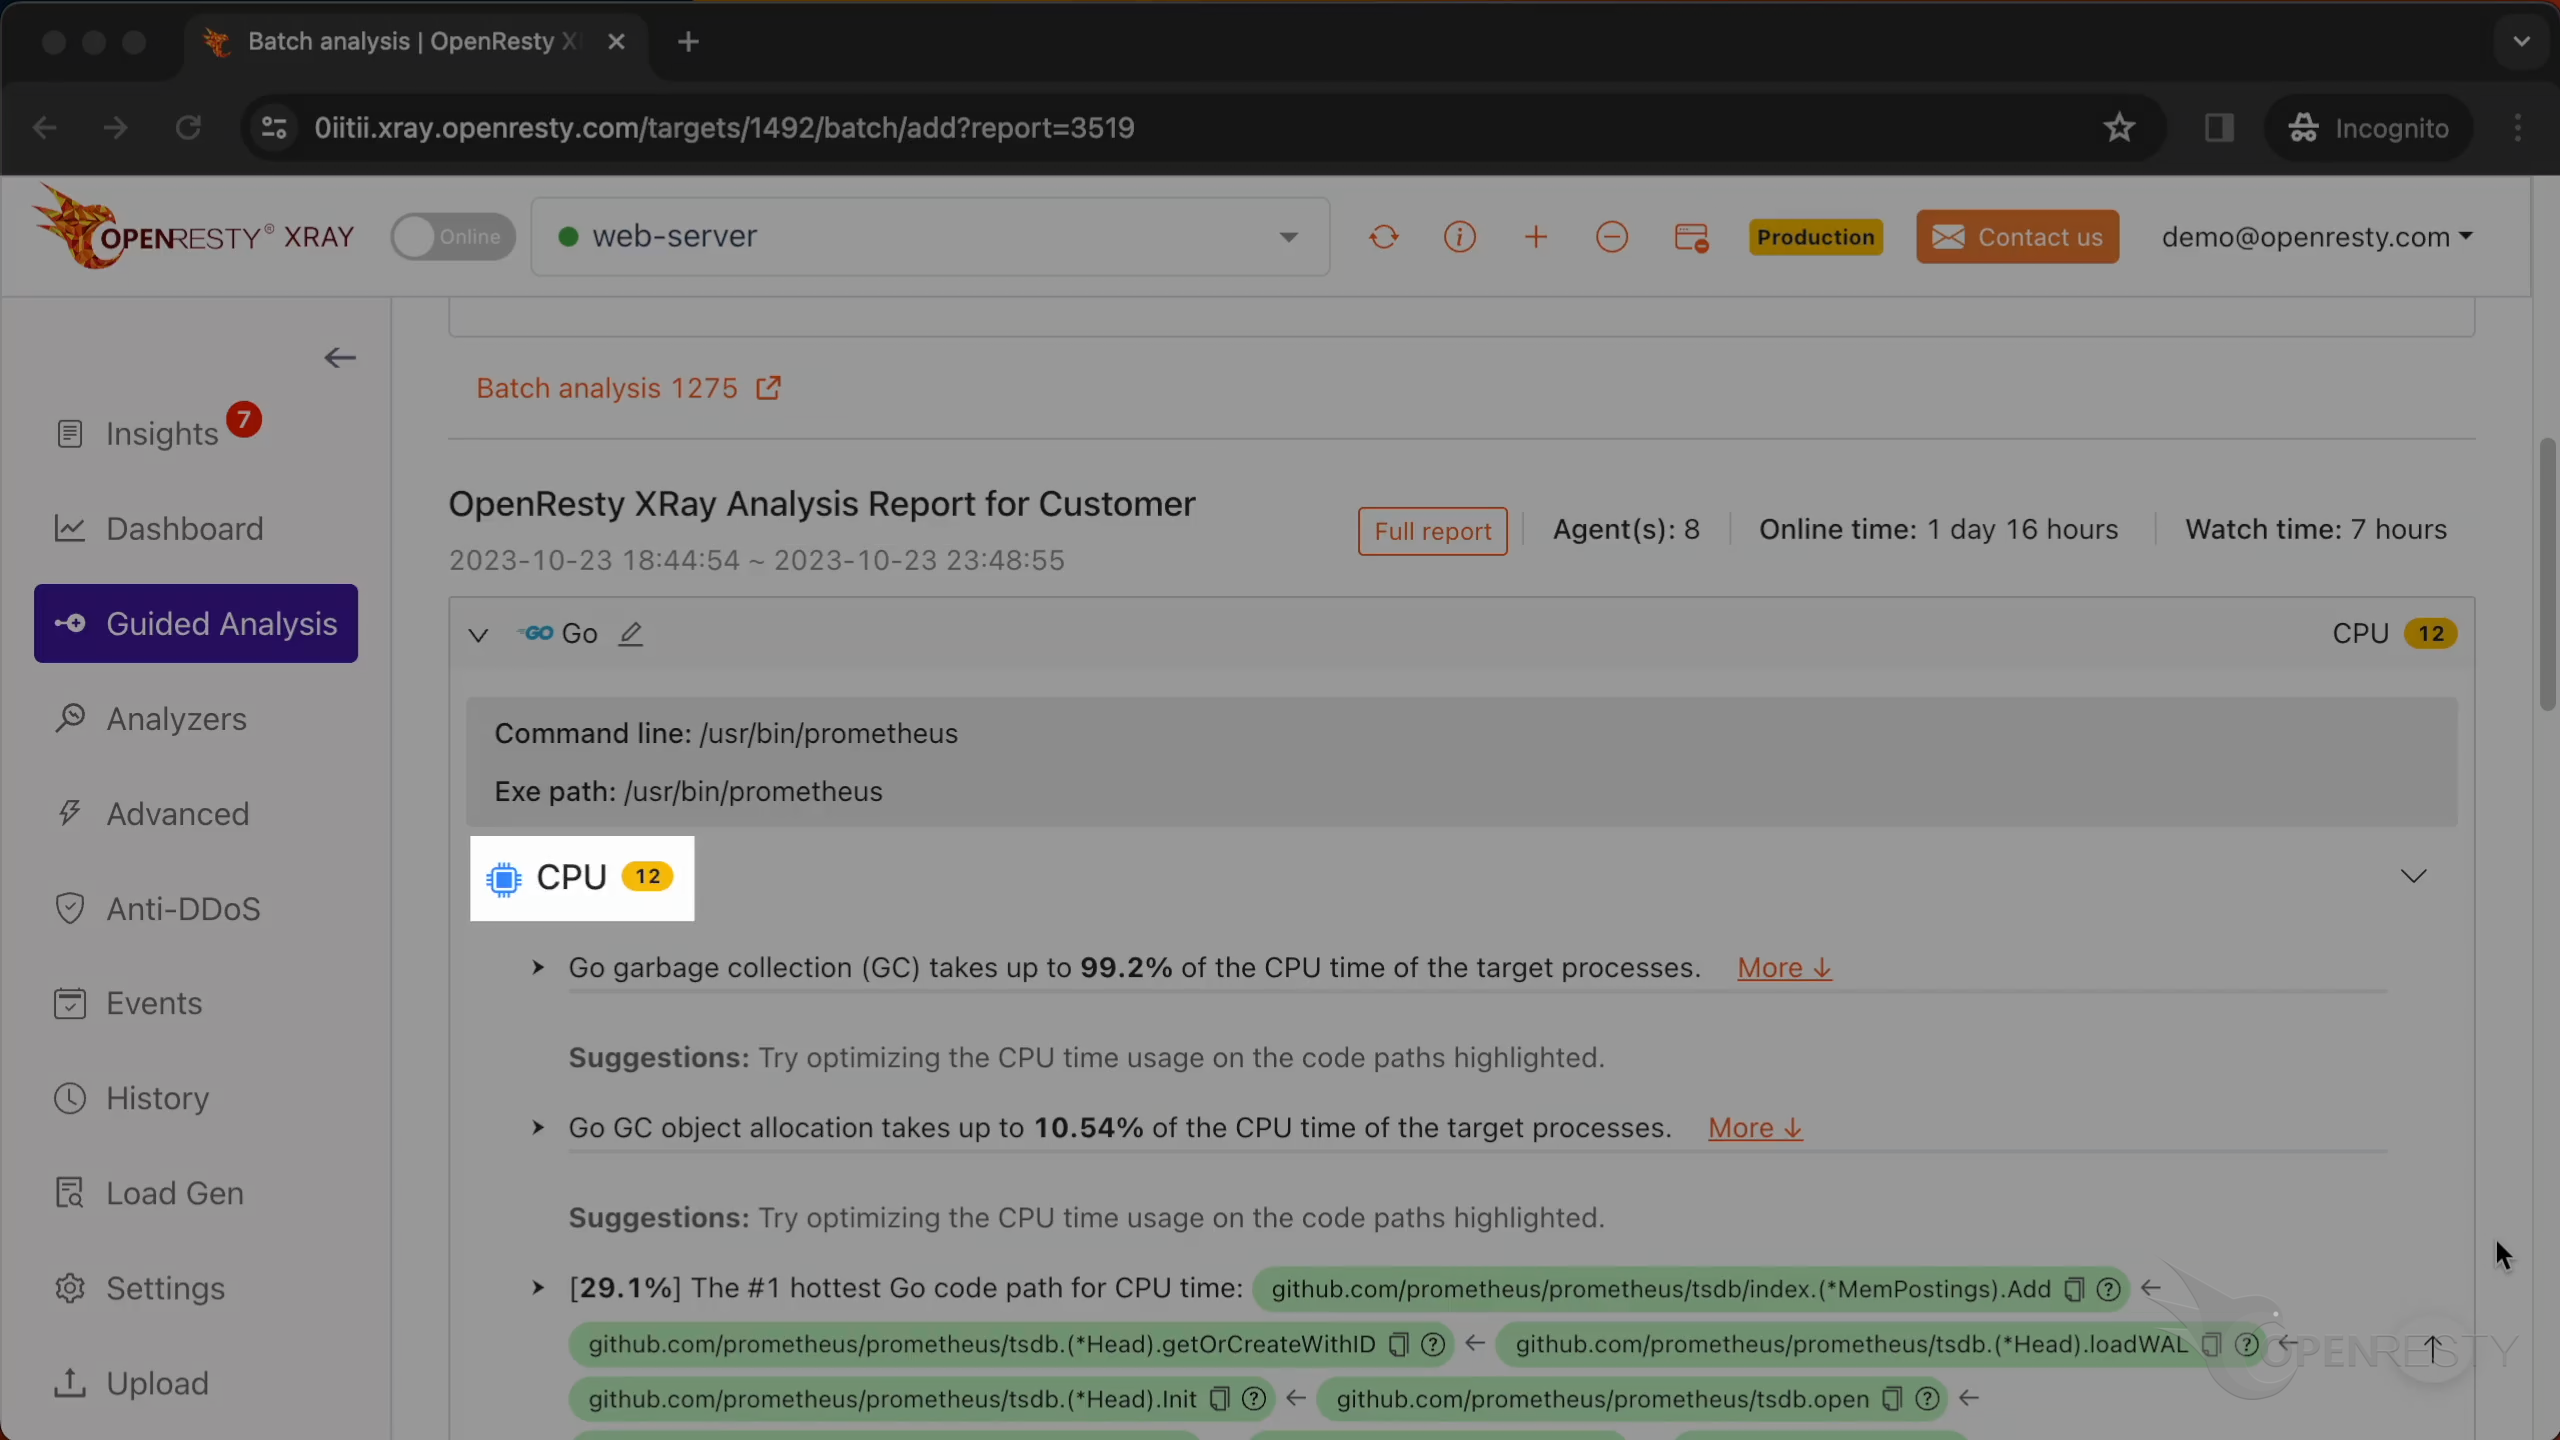
This is the type of problem we diagnose. It’s “CPU”.
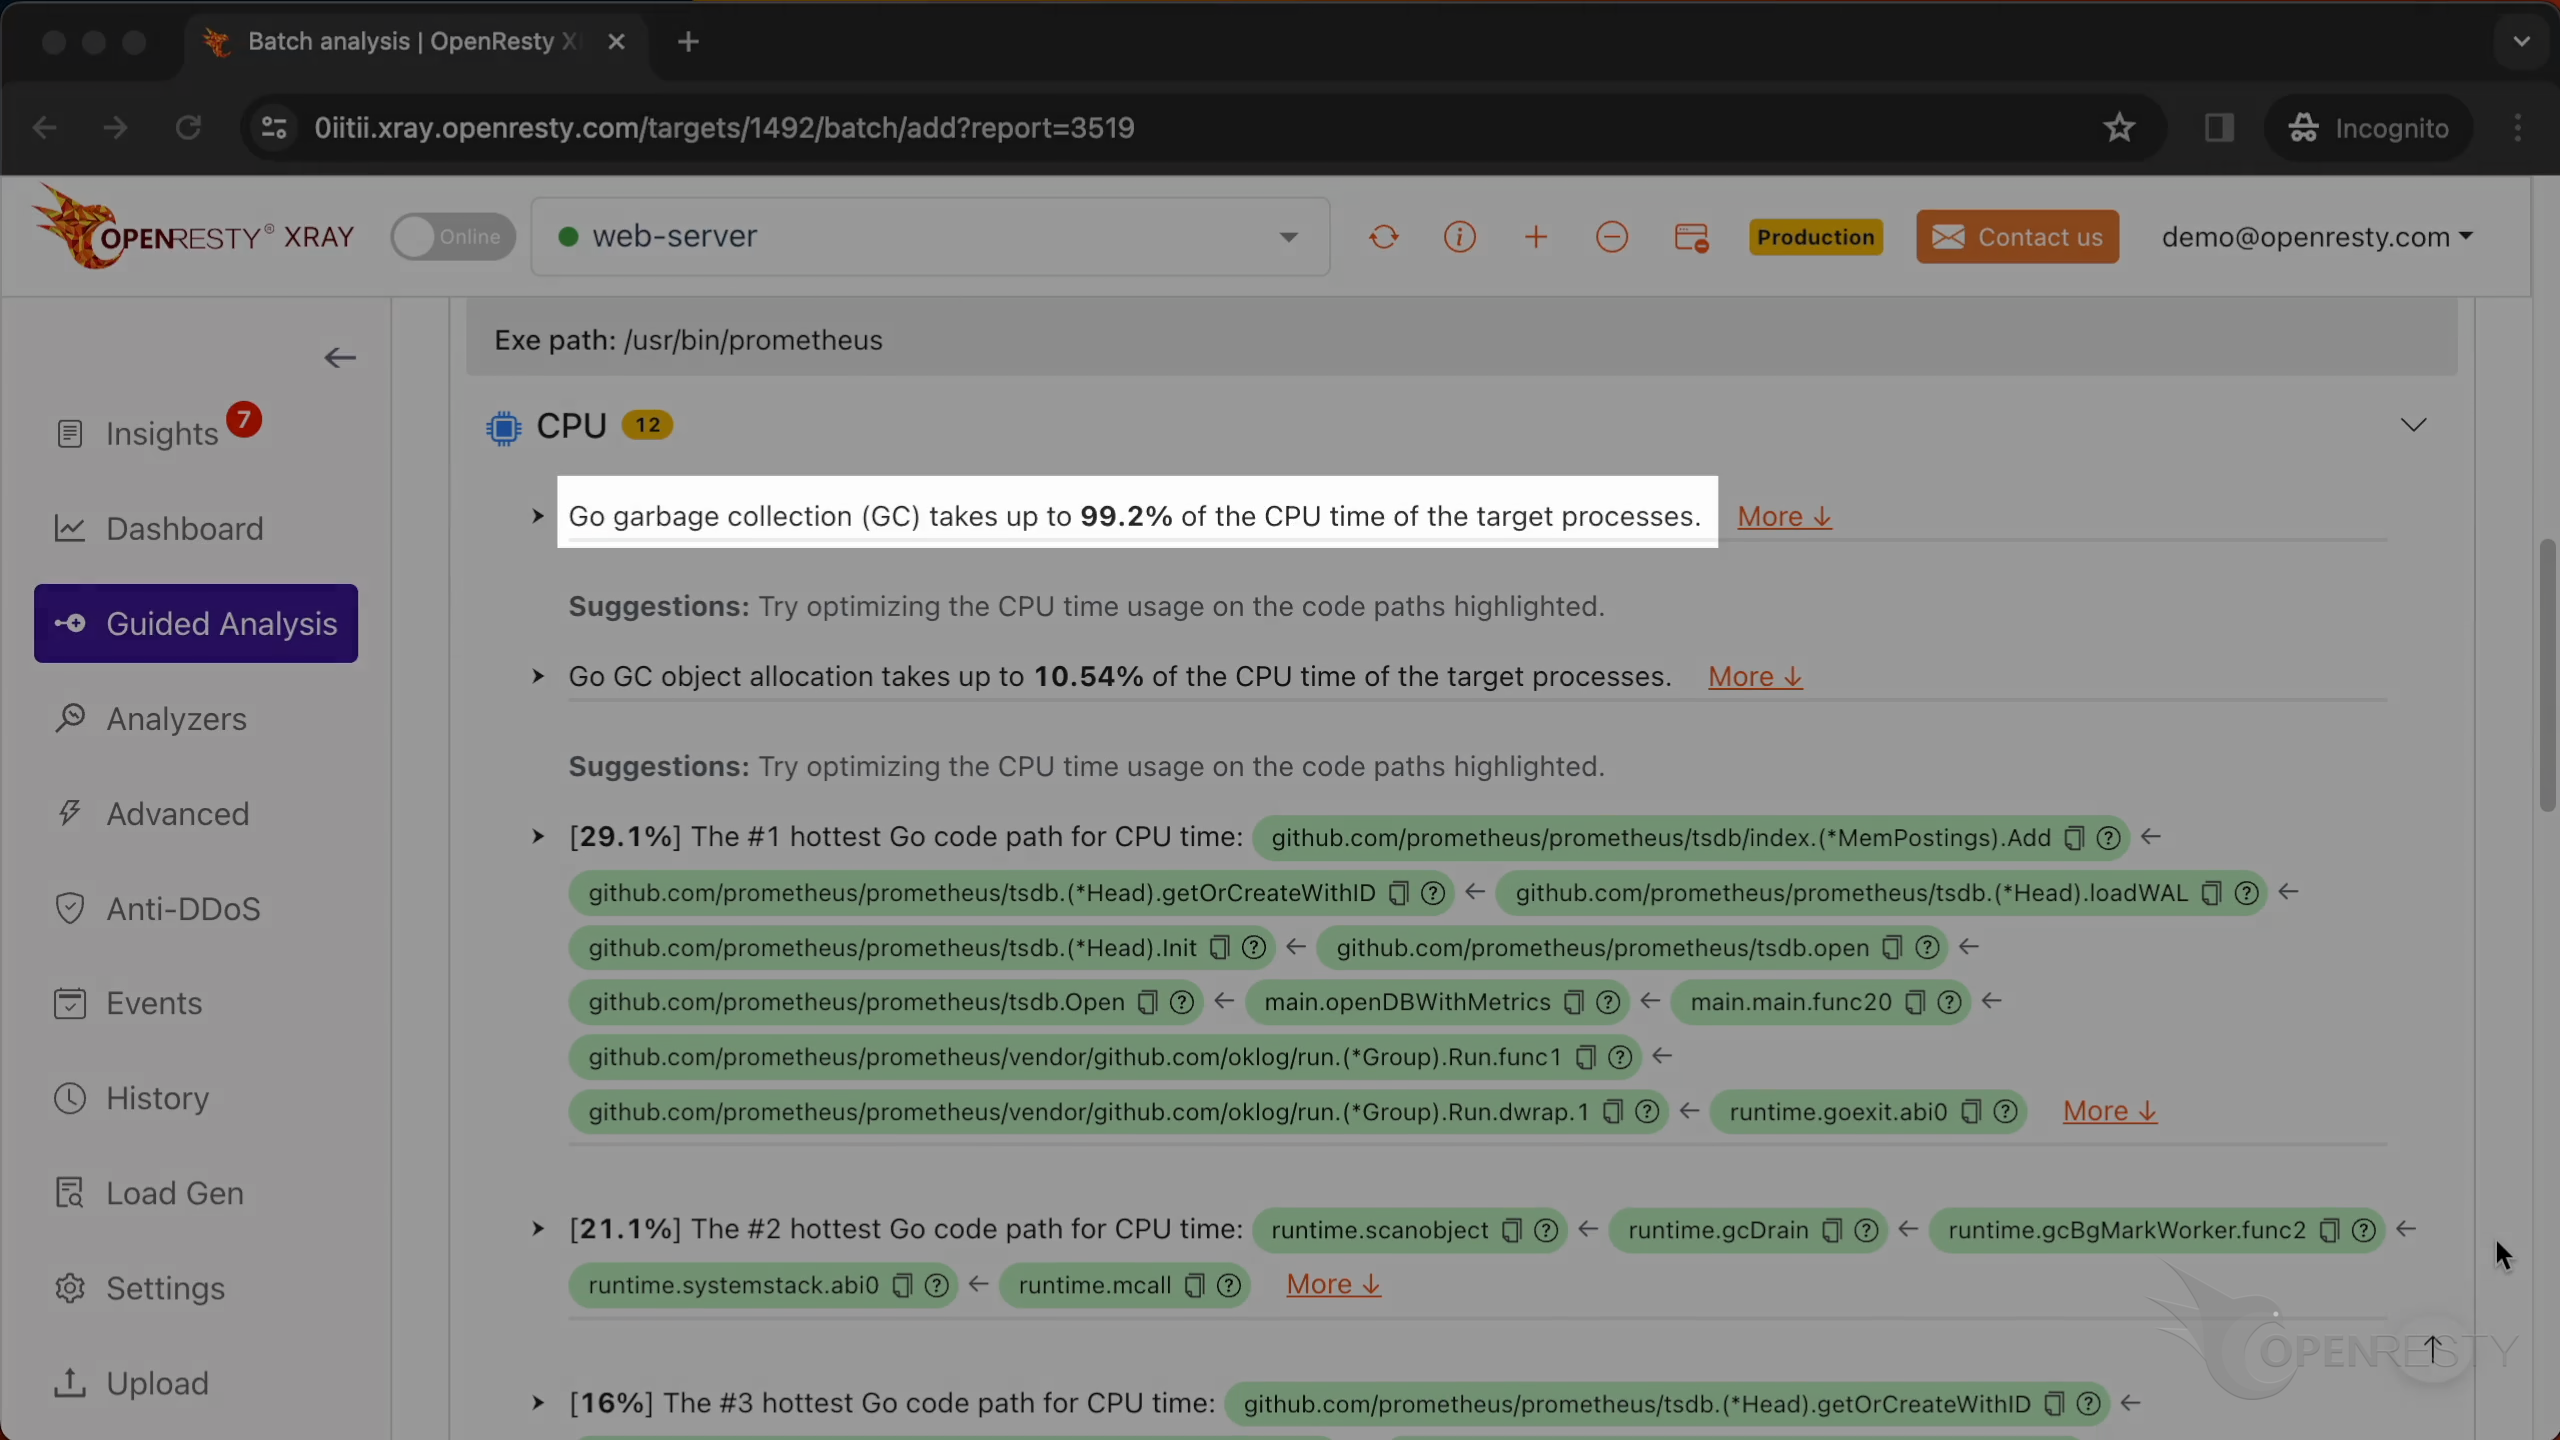
As you can see, the Go garbage collection takes up more than 99% of the CPU time.
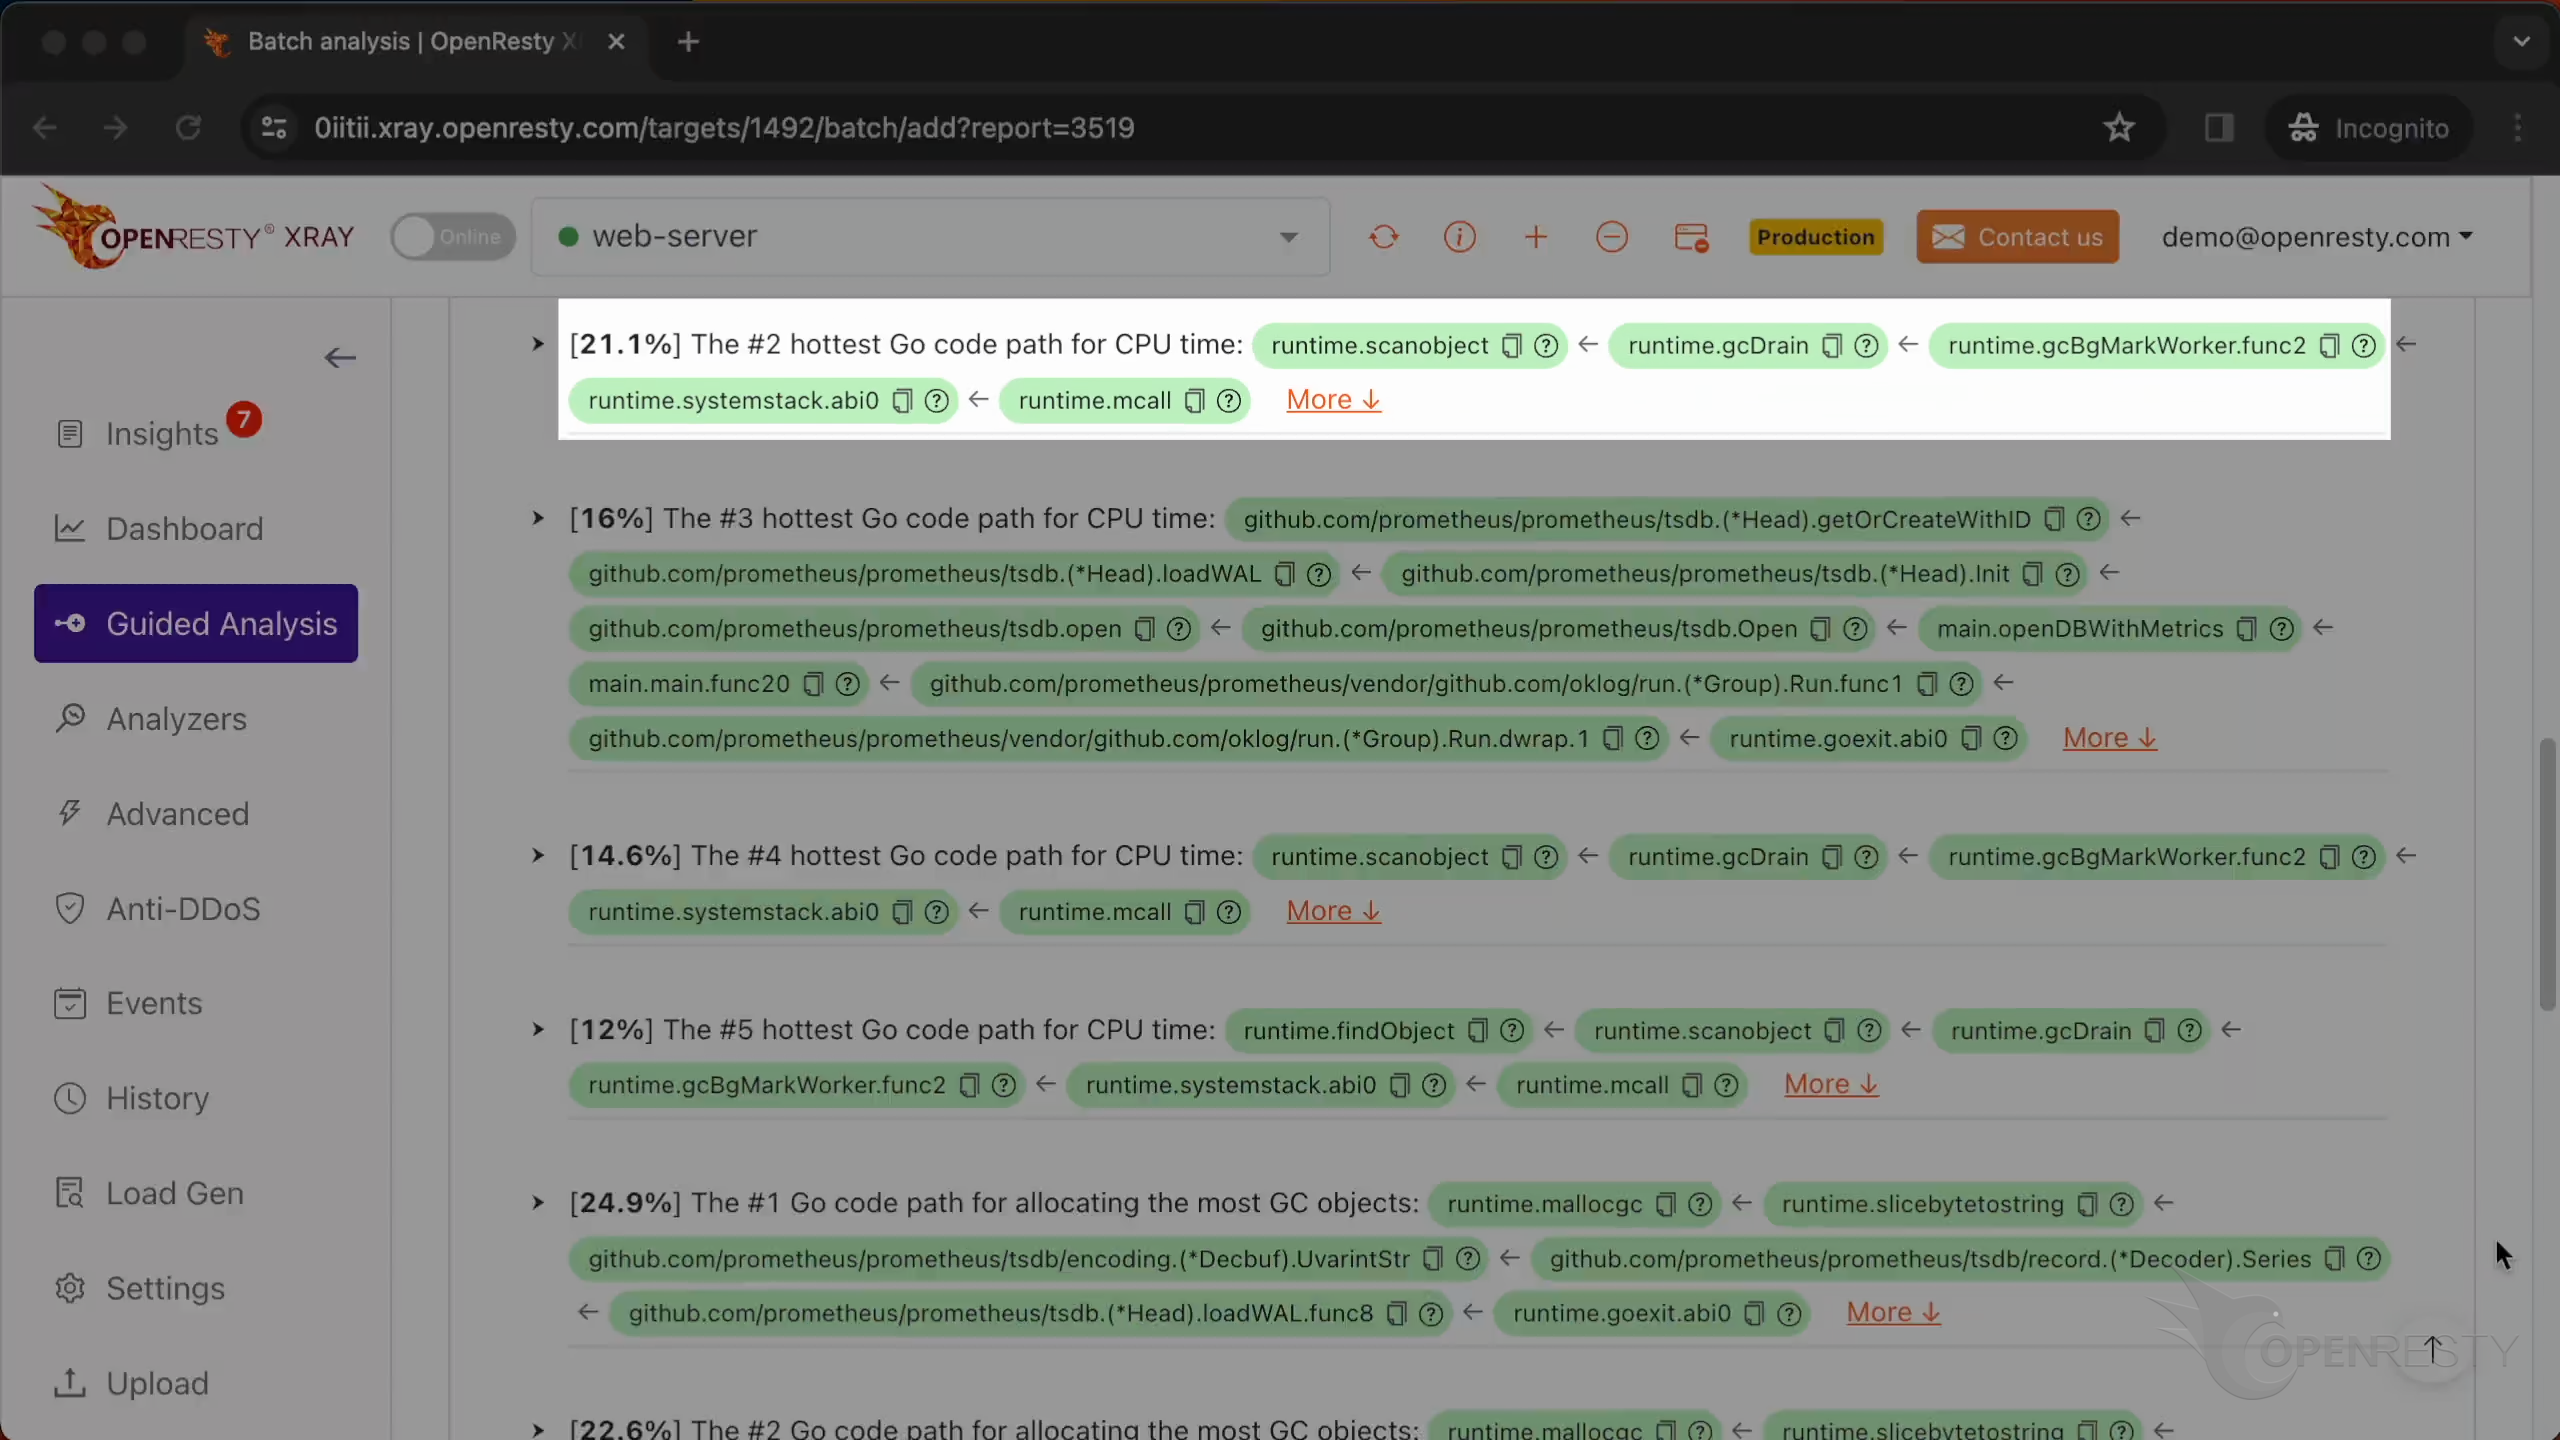
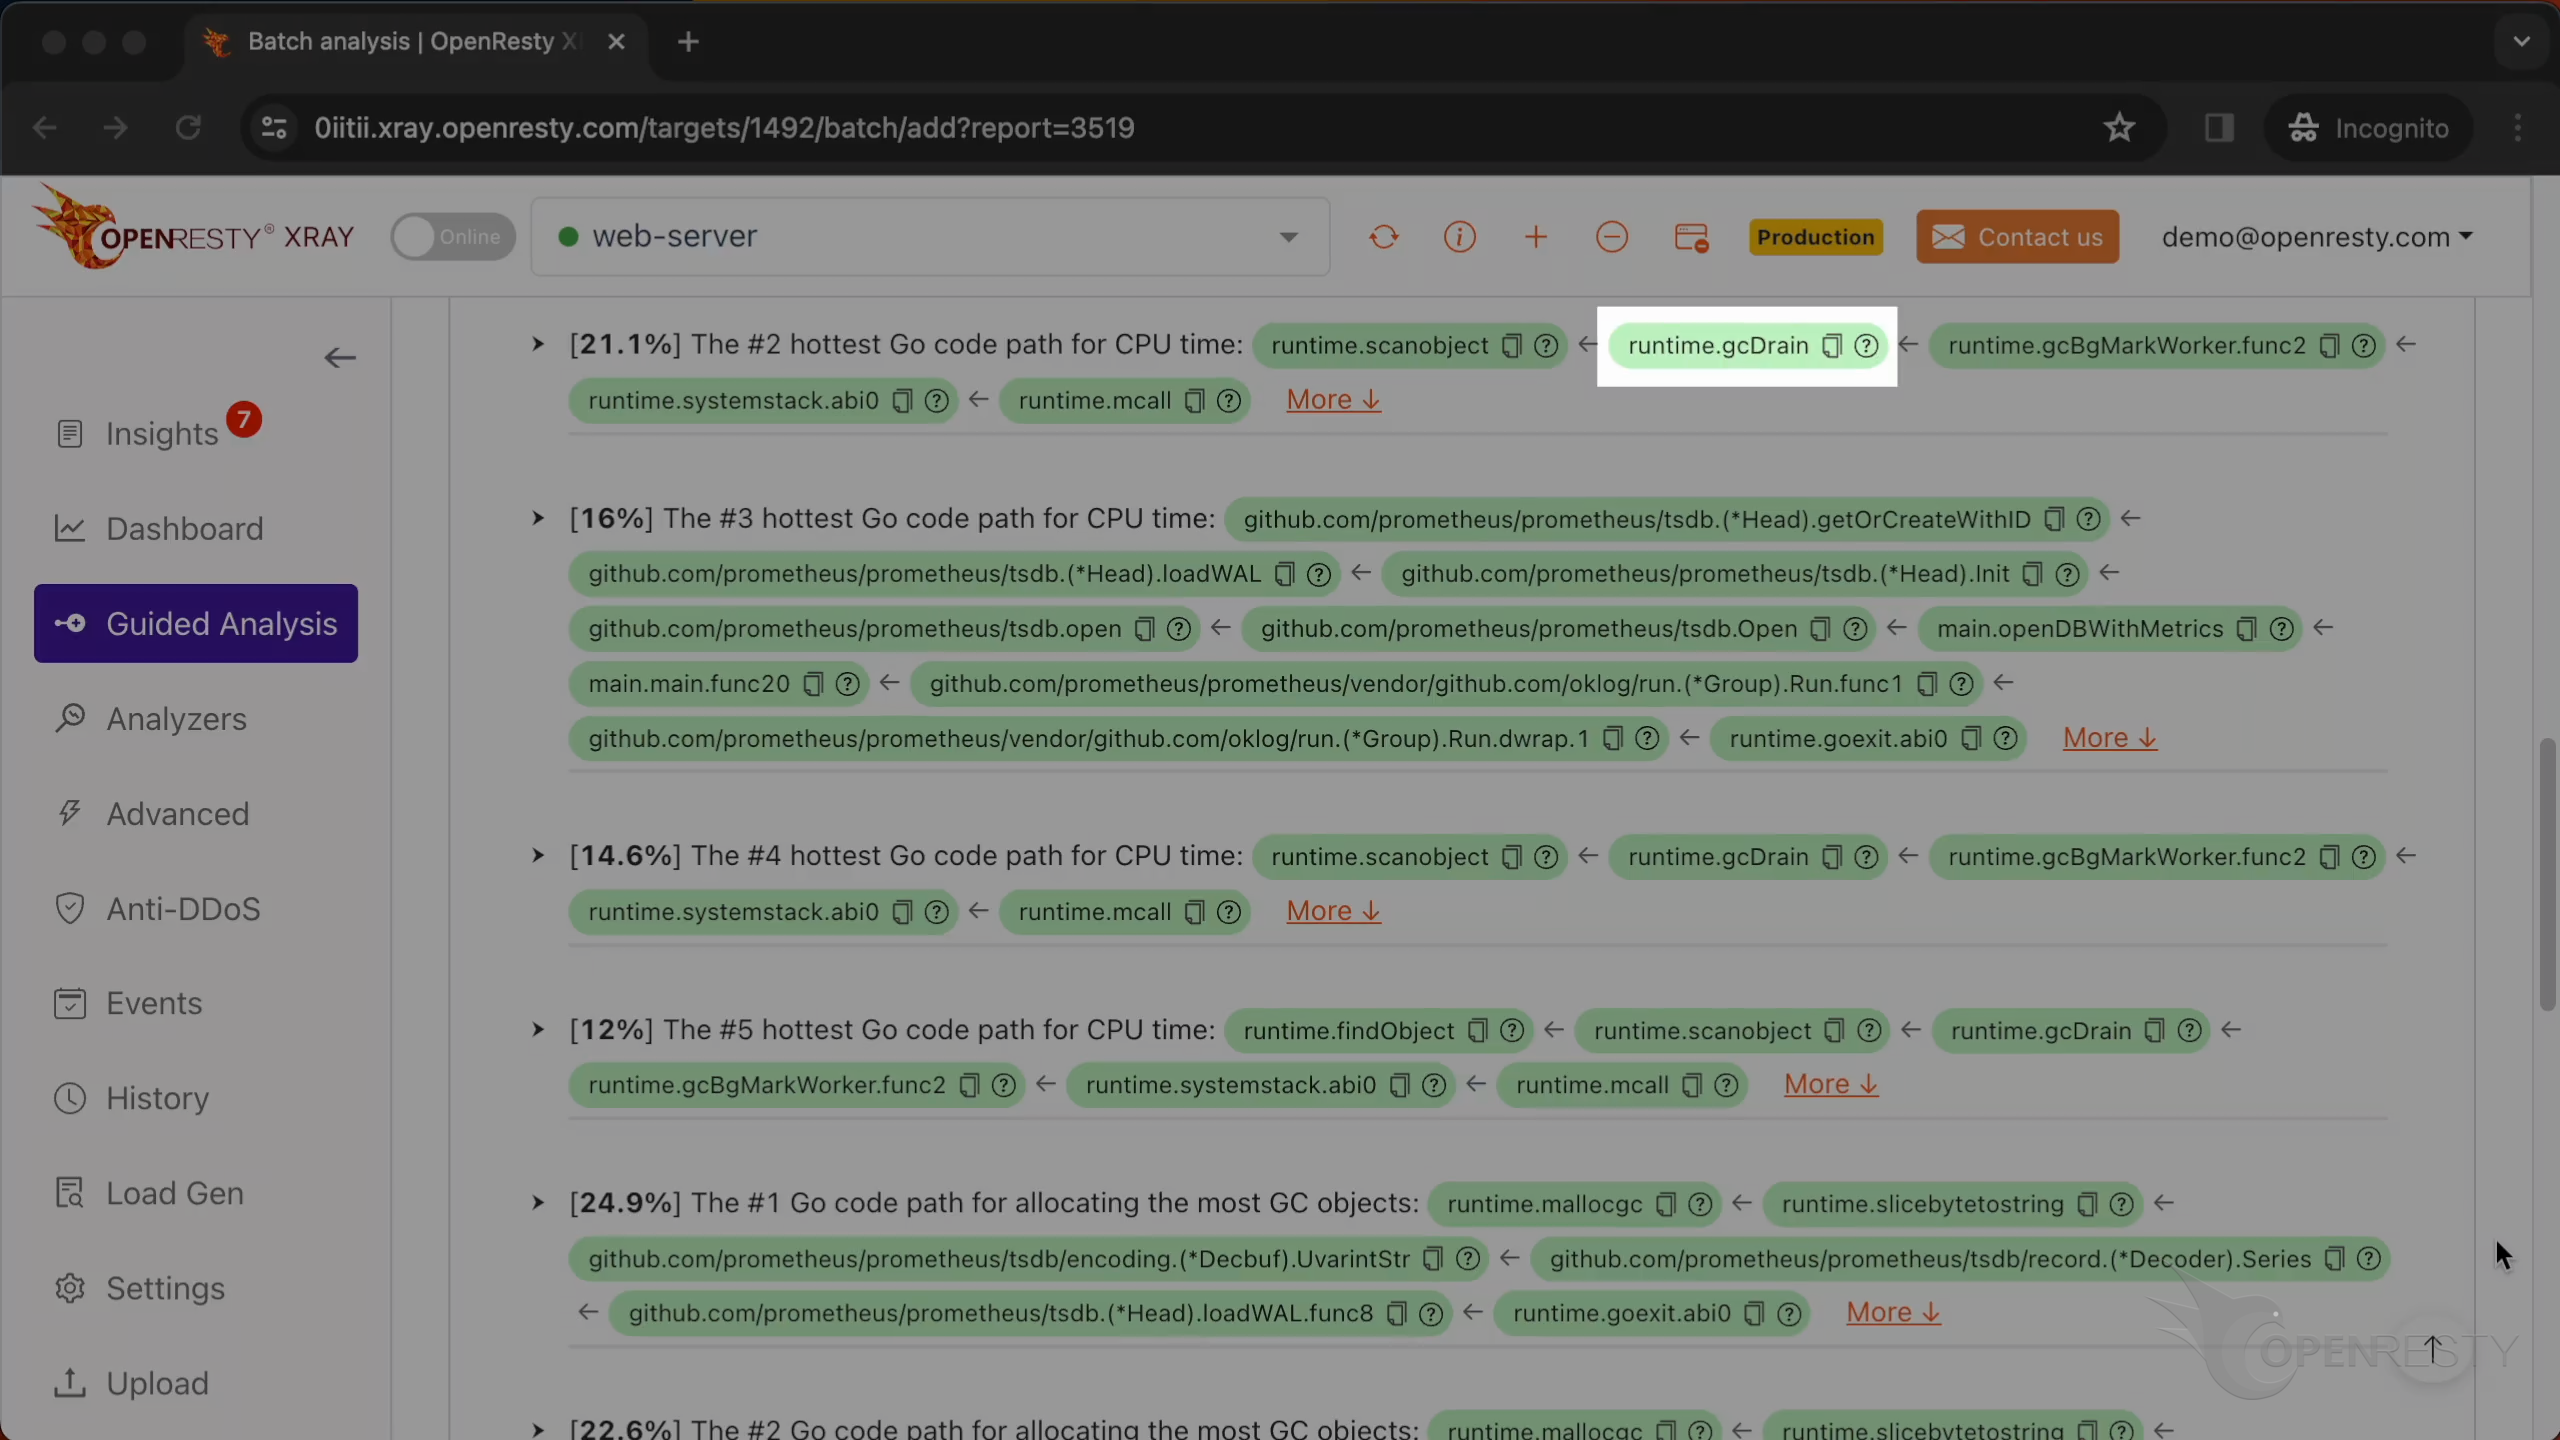
For example, this Go code path where garbage collection is performed takes up to 21% of the CPU time.
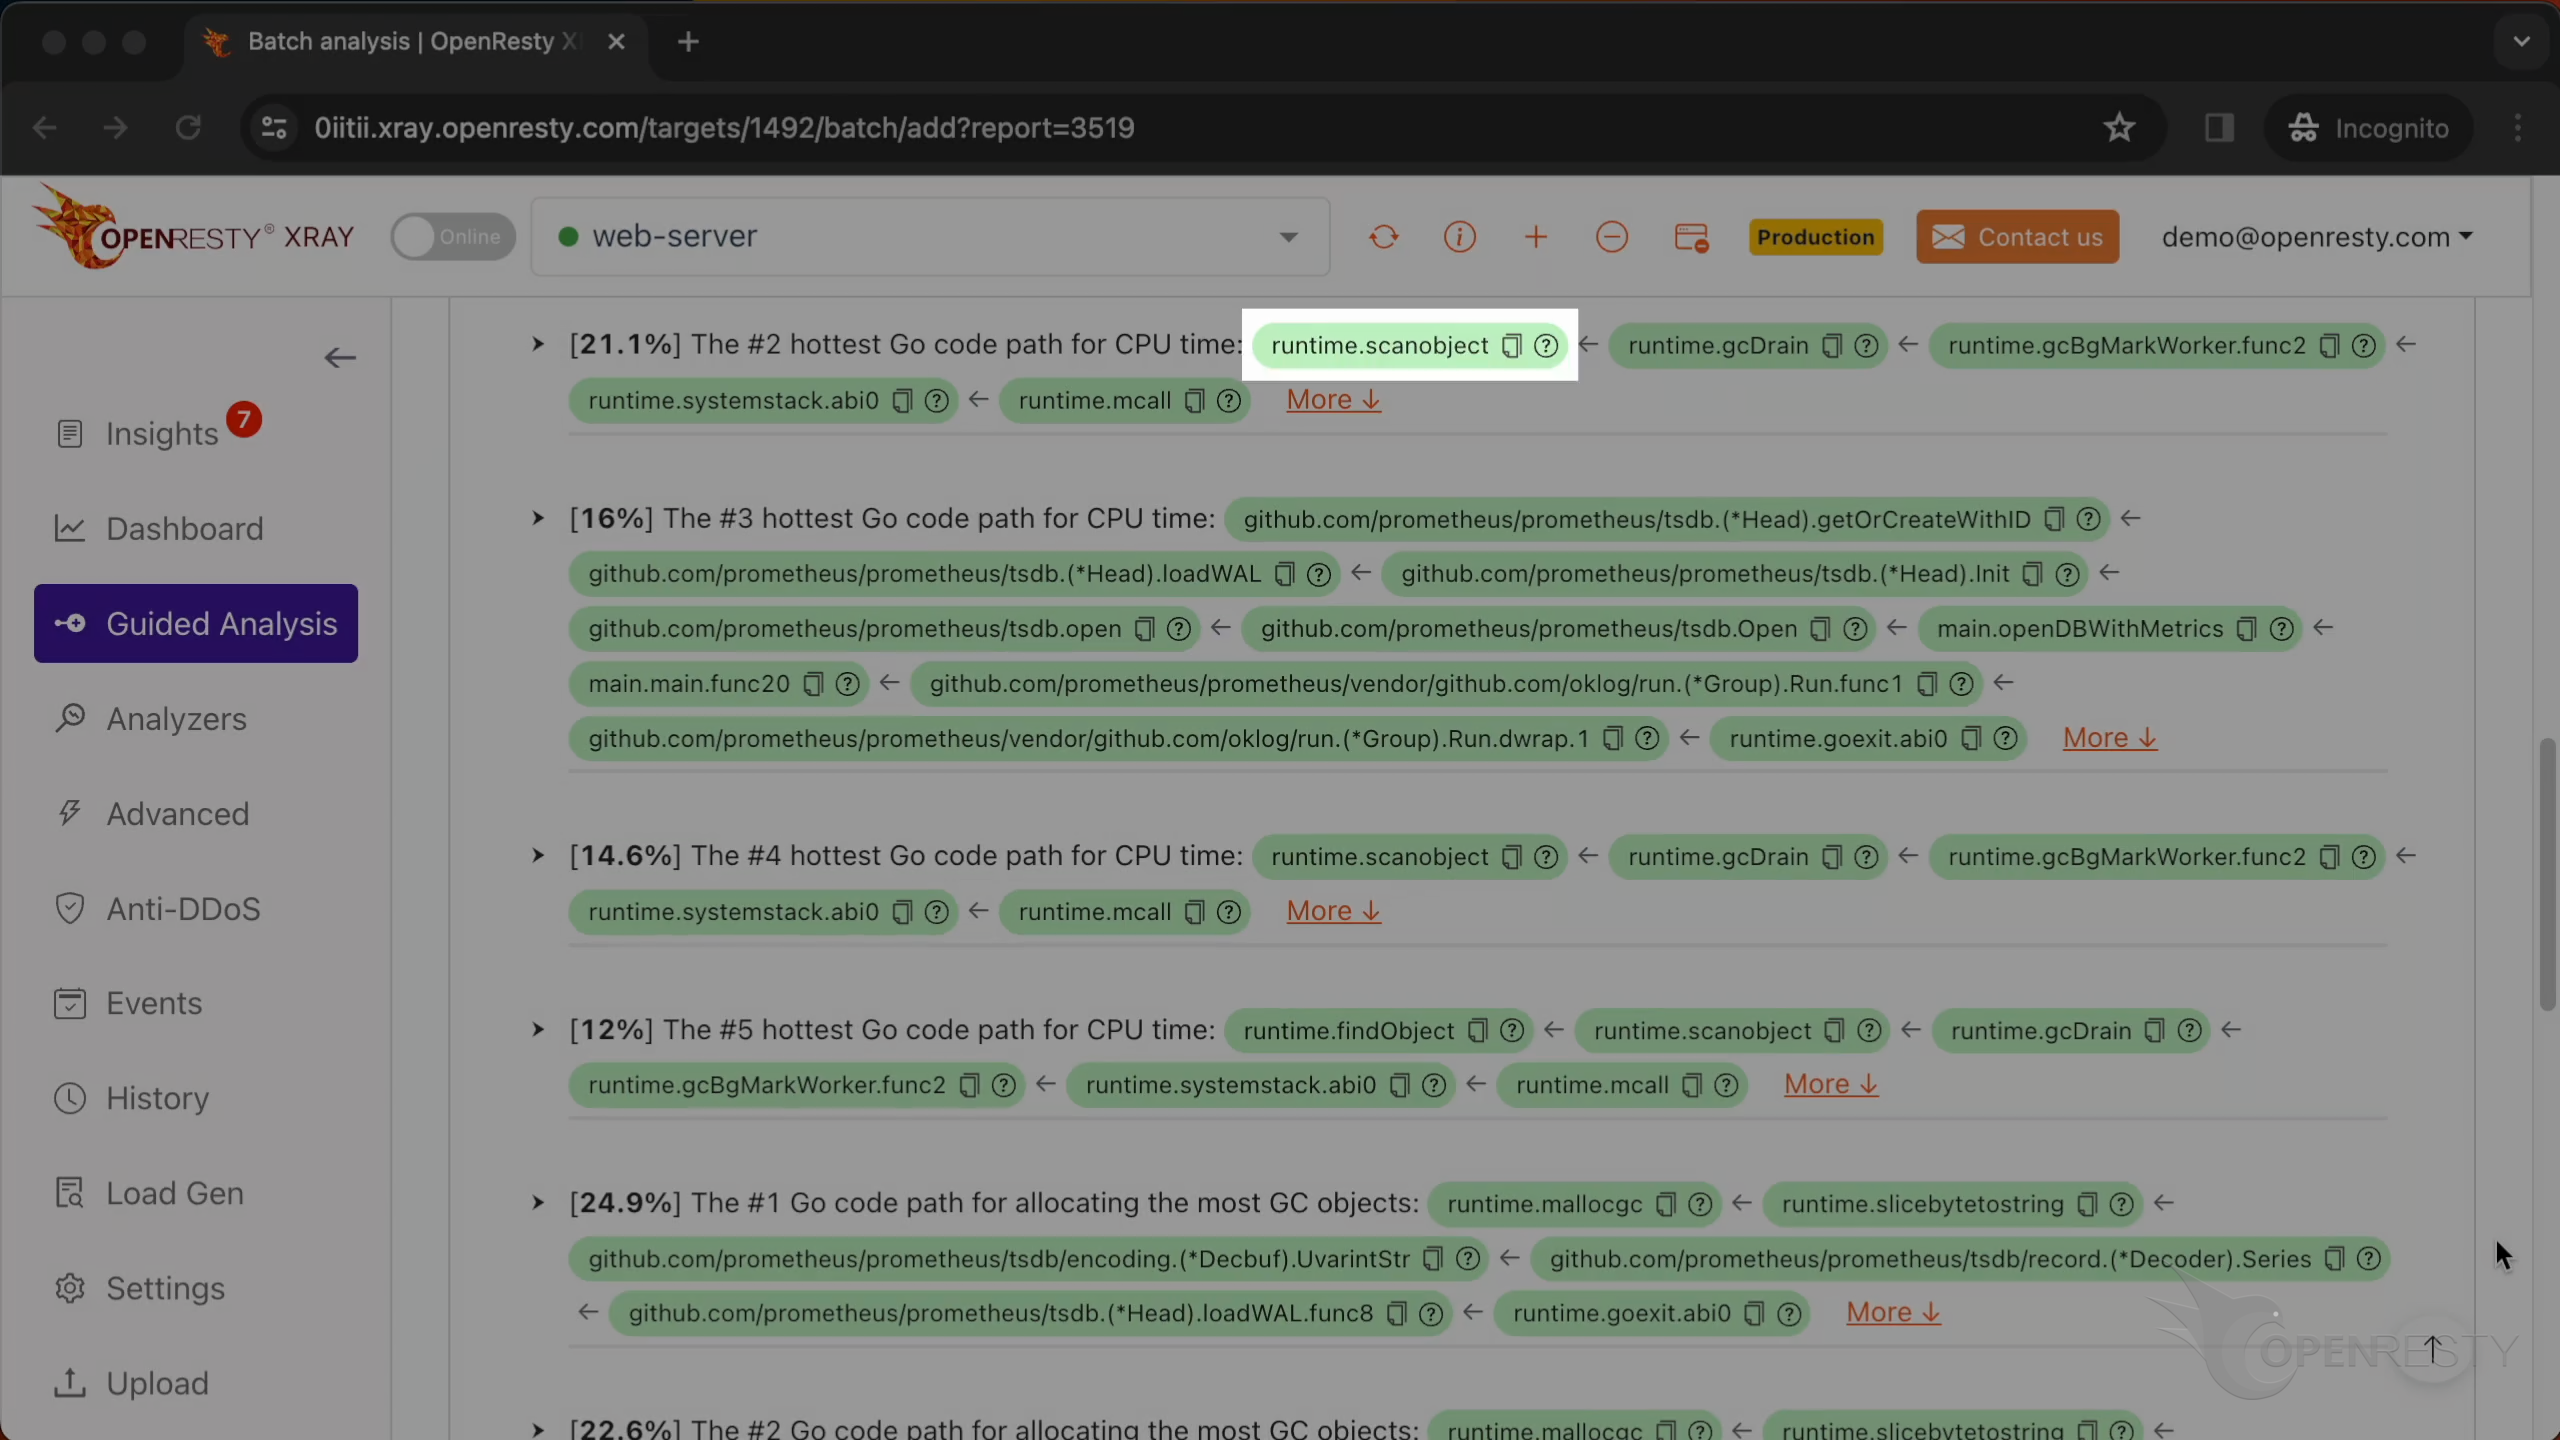
The Go runtime function scanobject belongs to the garbage collector. It scans GC objects in the heap and marks reachable ones.
The function gcDrain is used to drain the work queue of GC objects that need to be marked.
Fast allocation of many GC objects incurs high GC overhead. So the report shows the hottest Go code paths allocating the most objects with the highest speed.
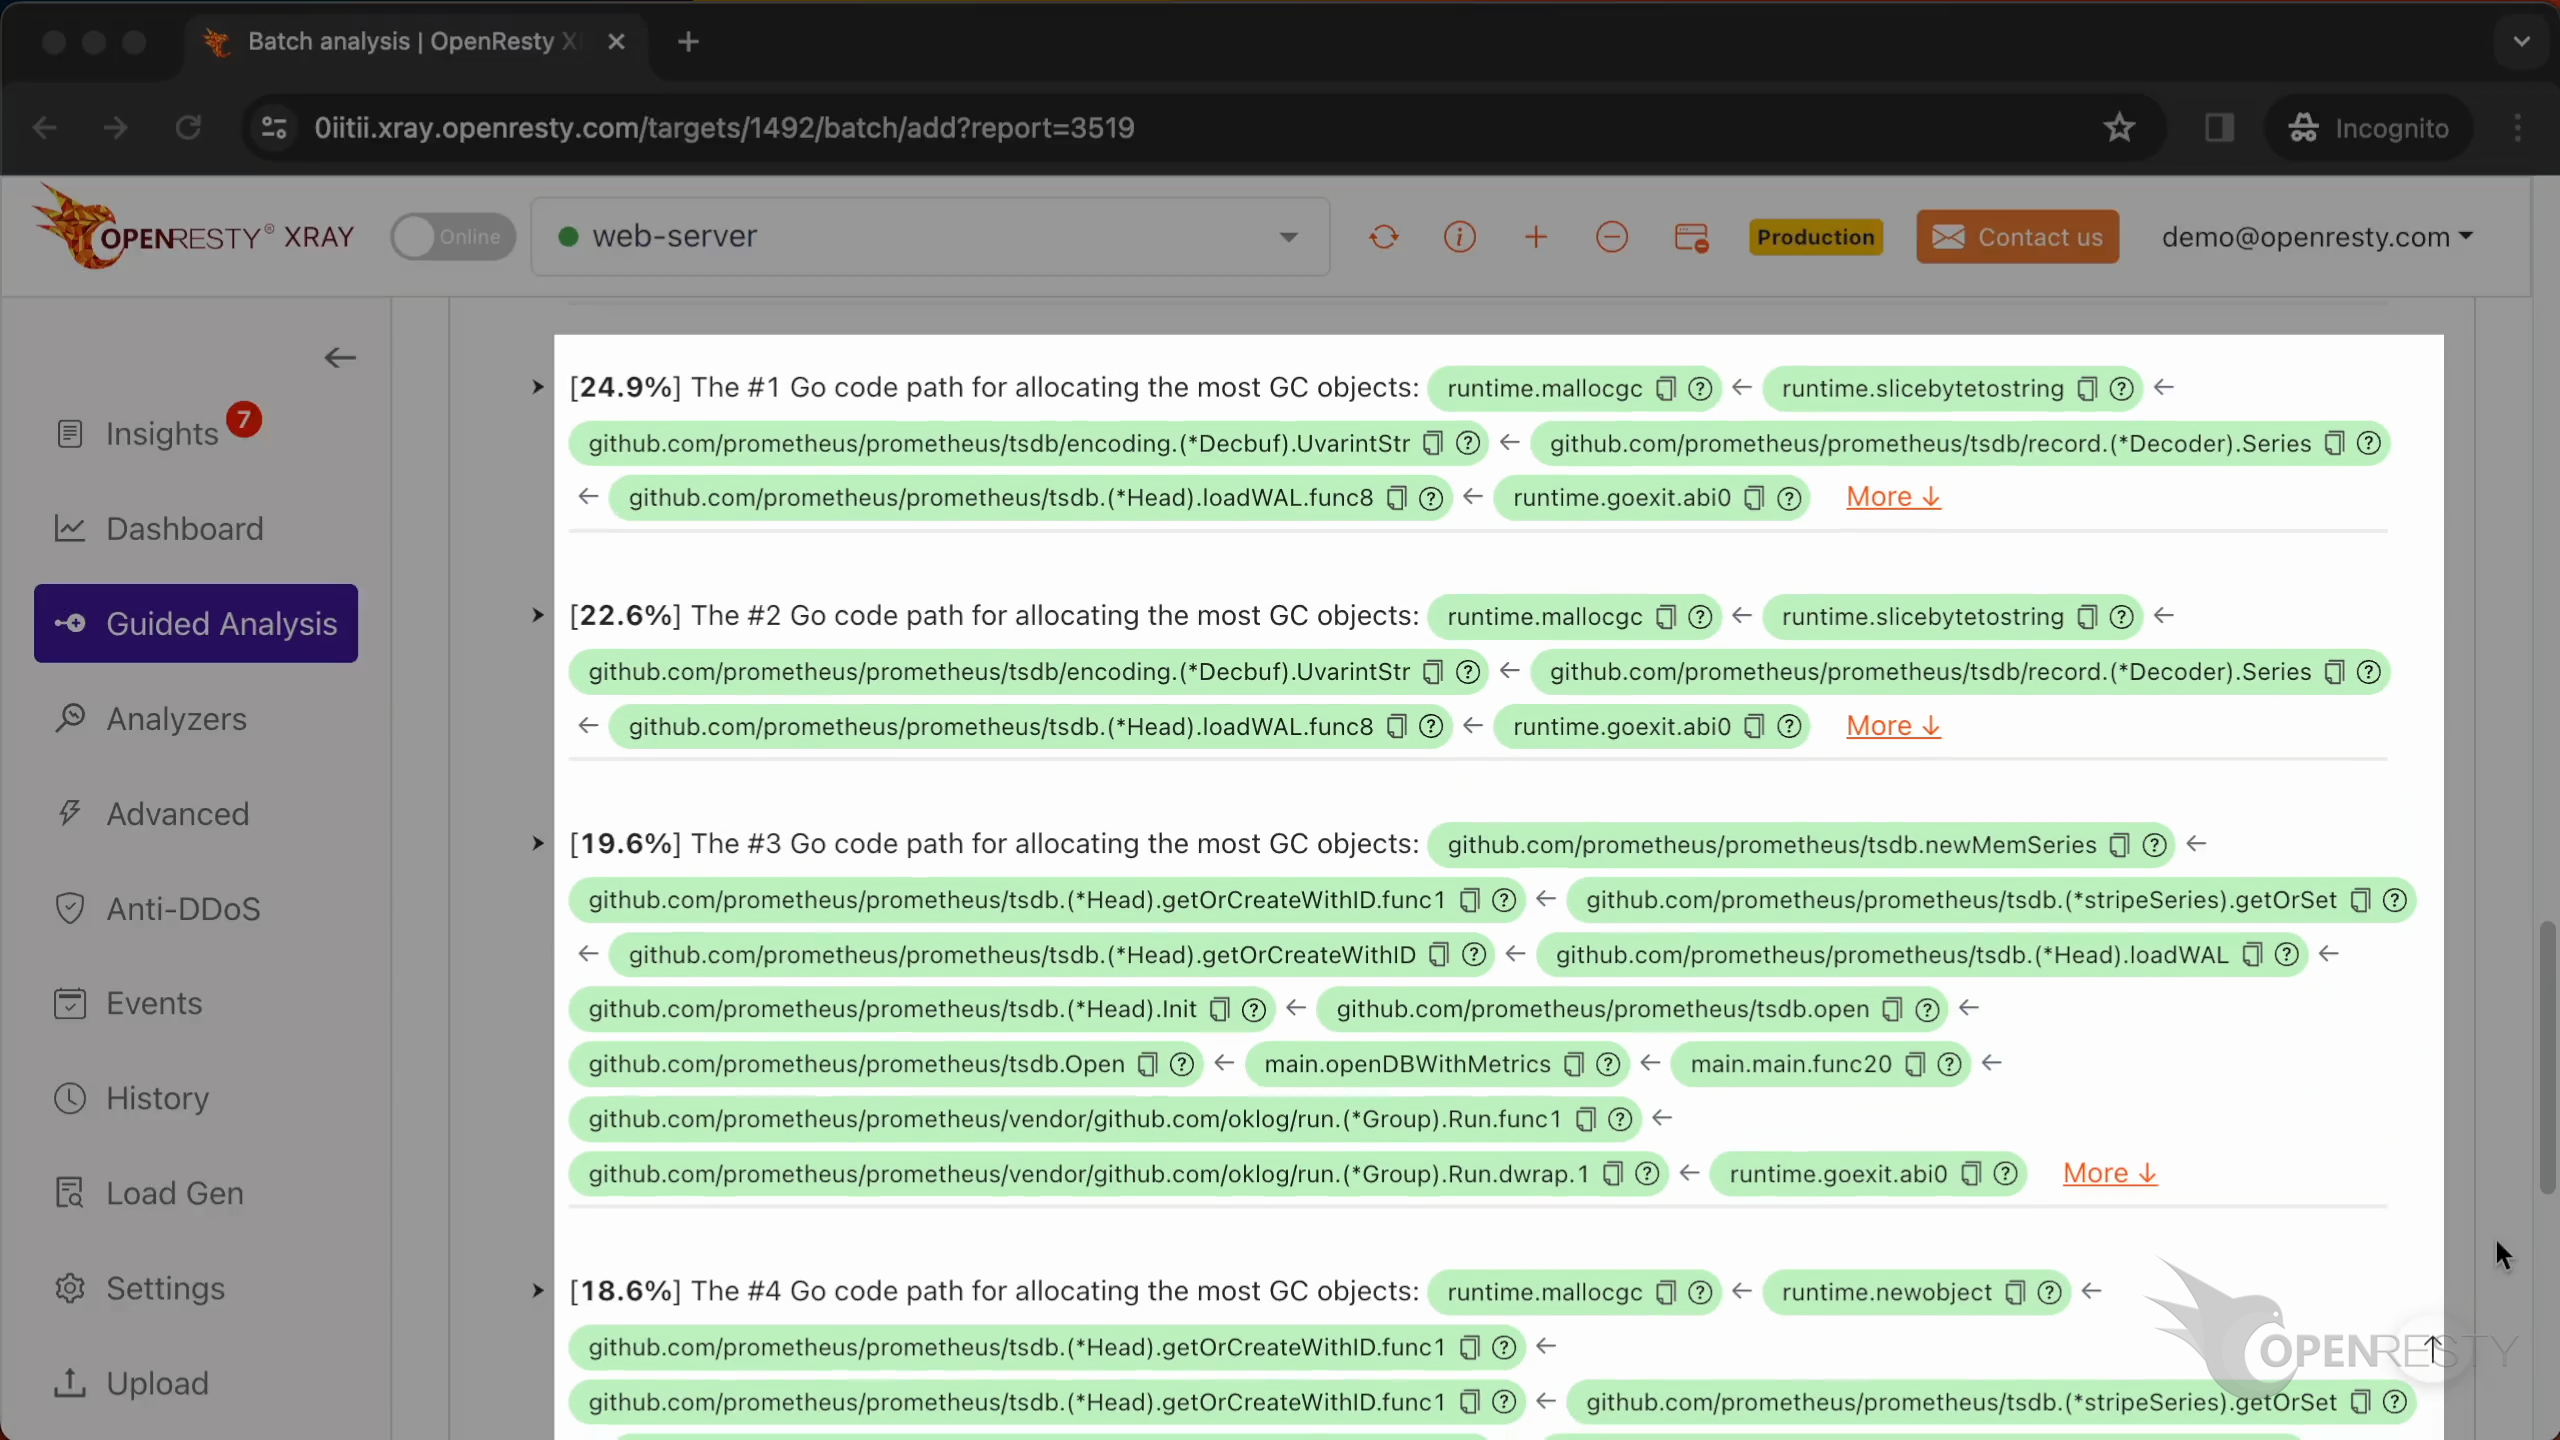
Now let’s check the #1 Go code path that allocates the most GC objects.
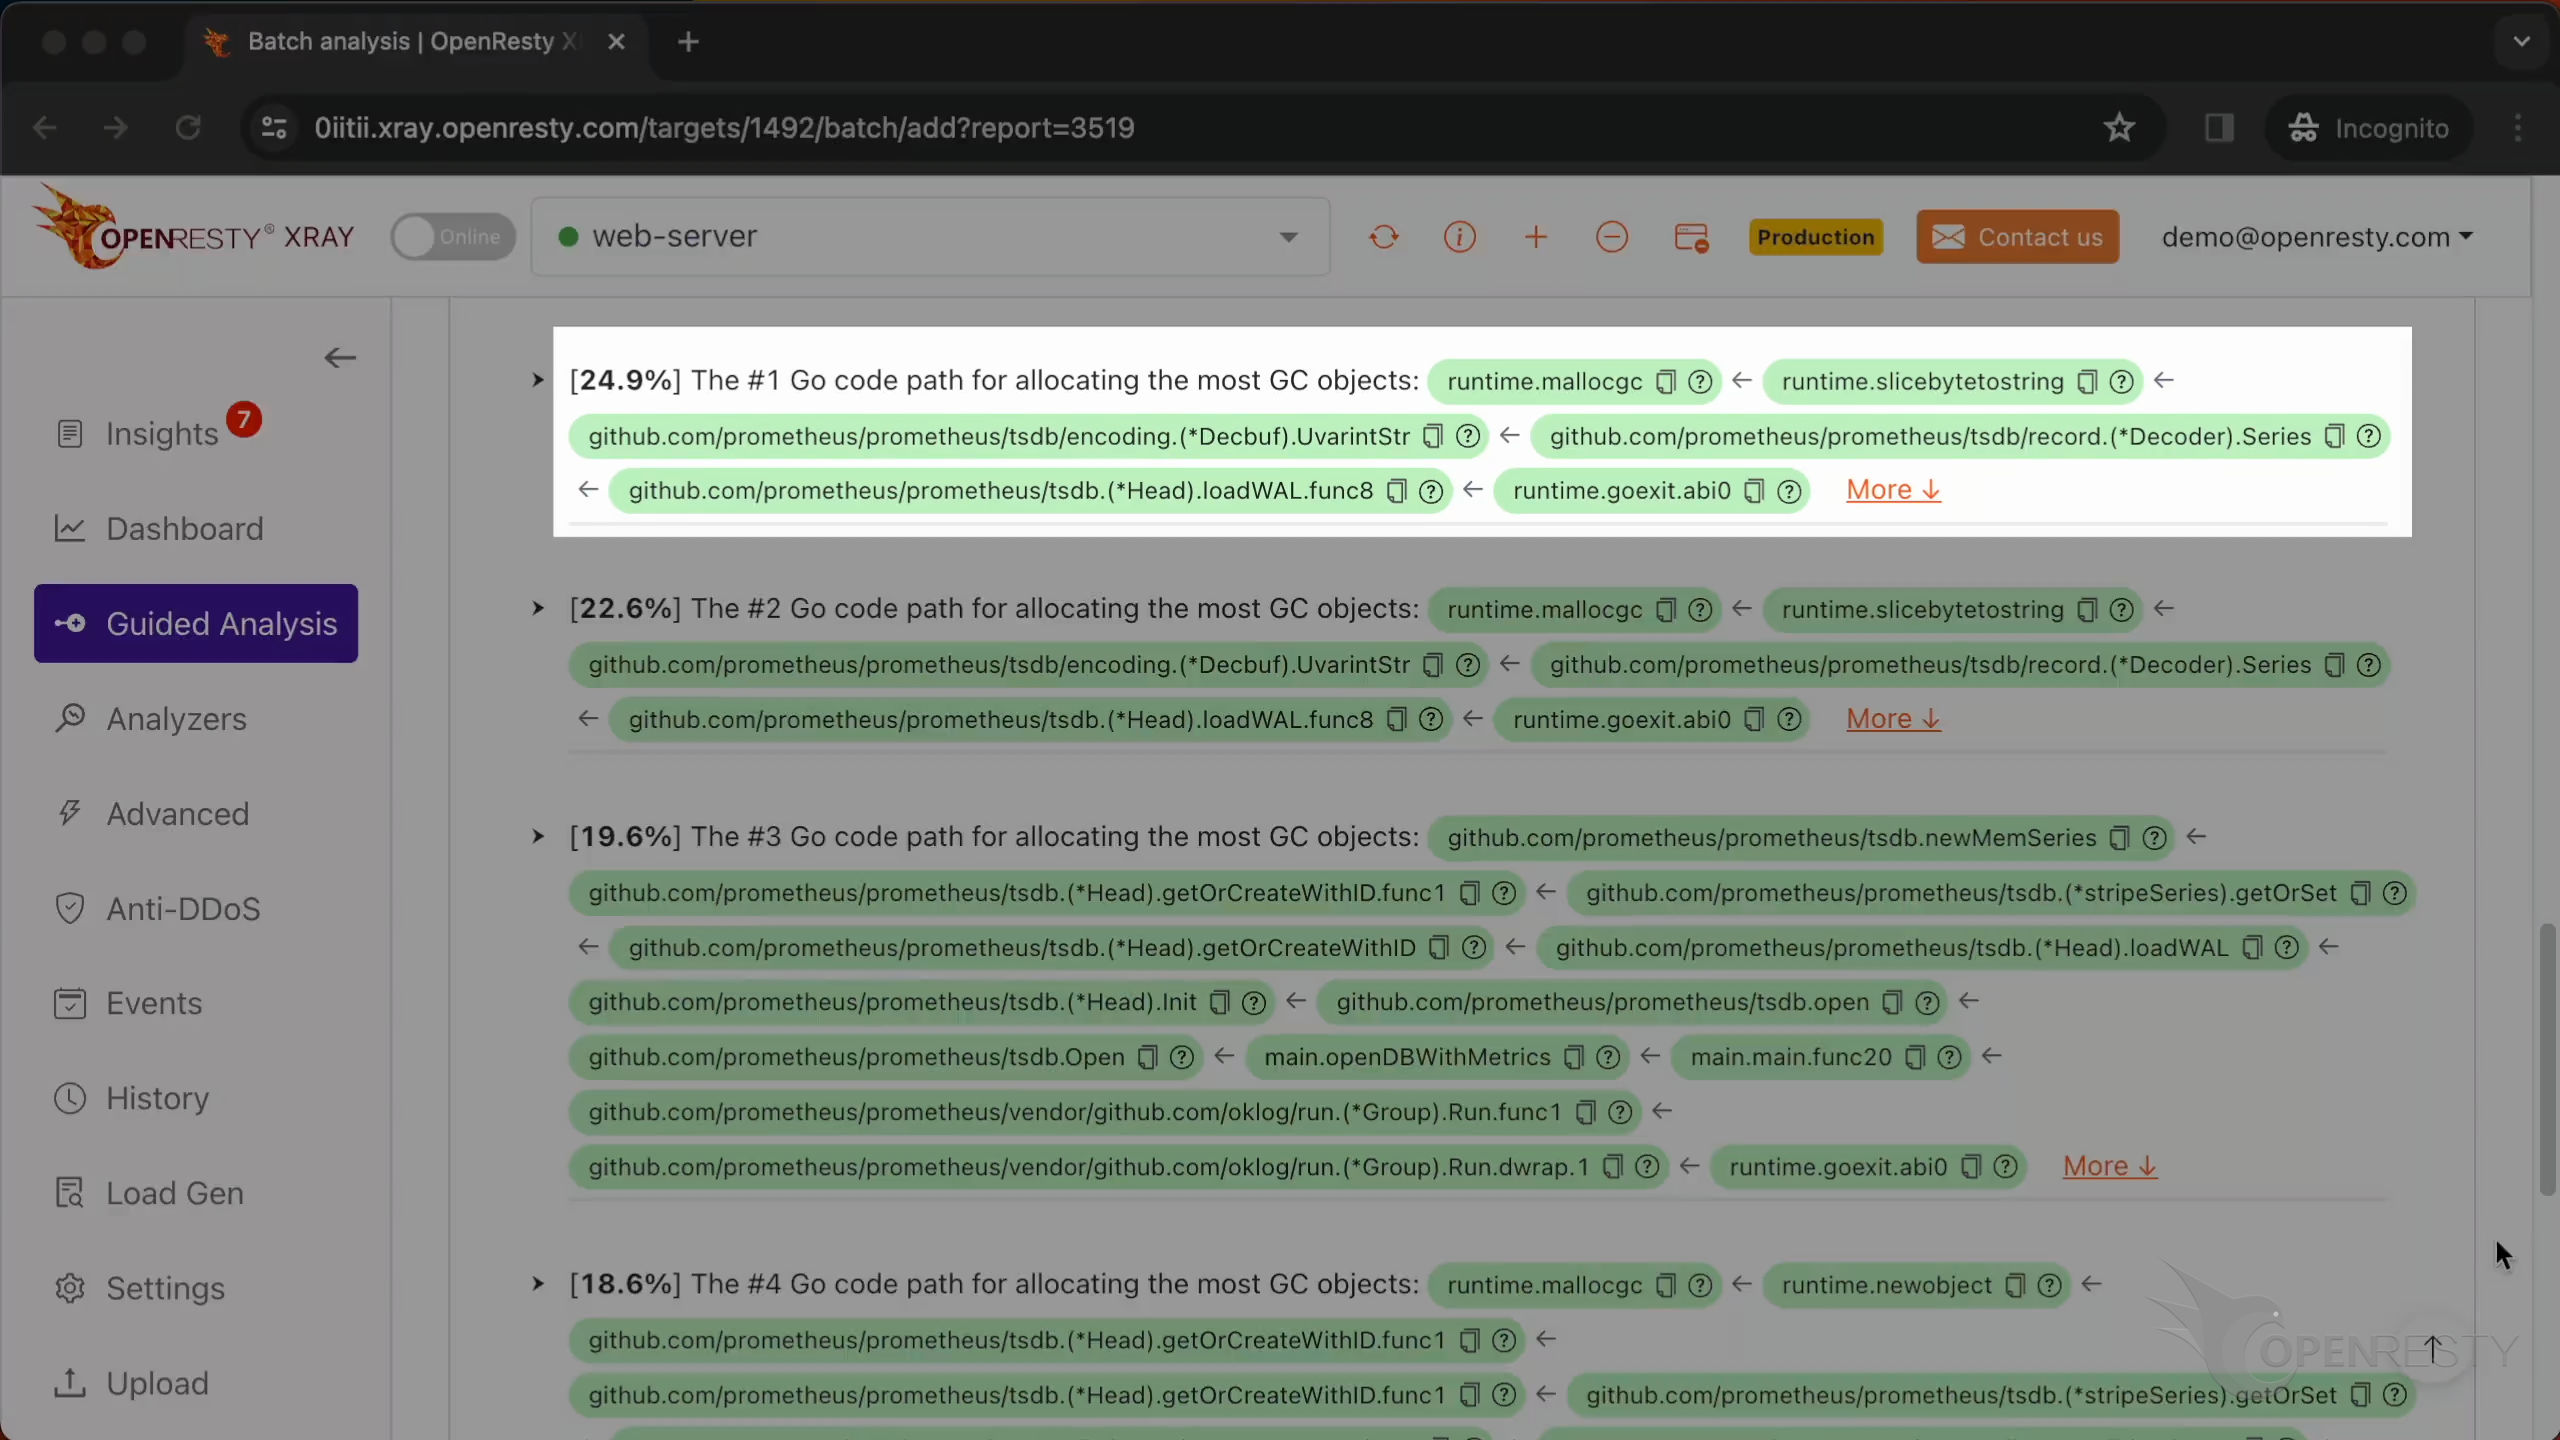
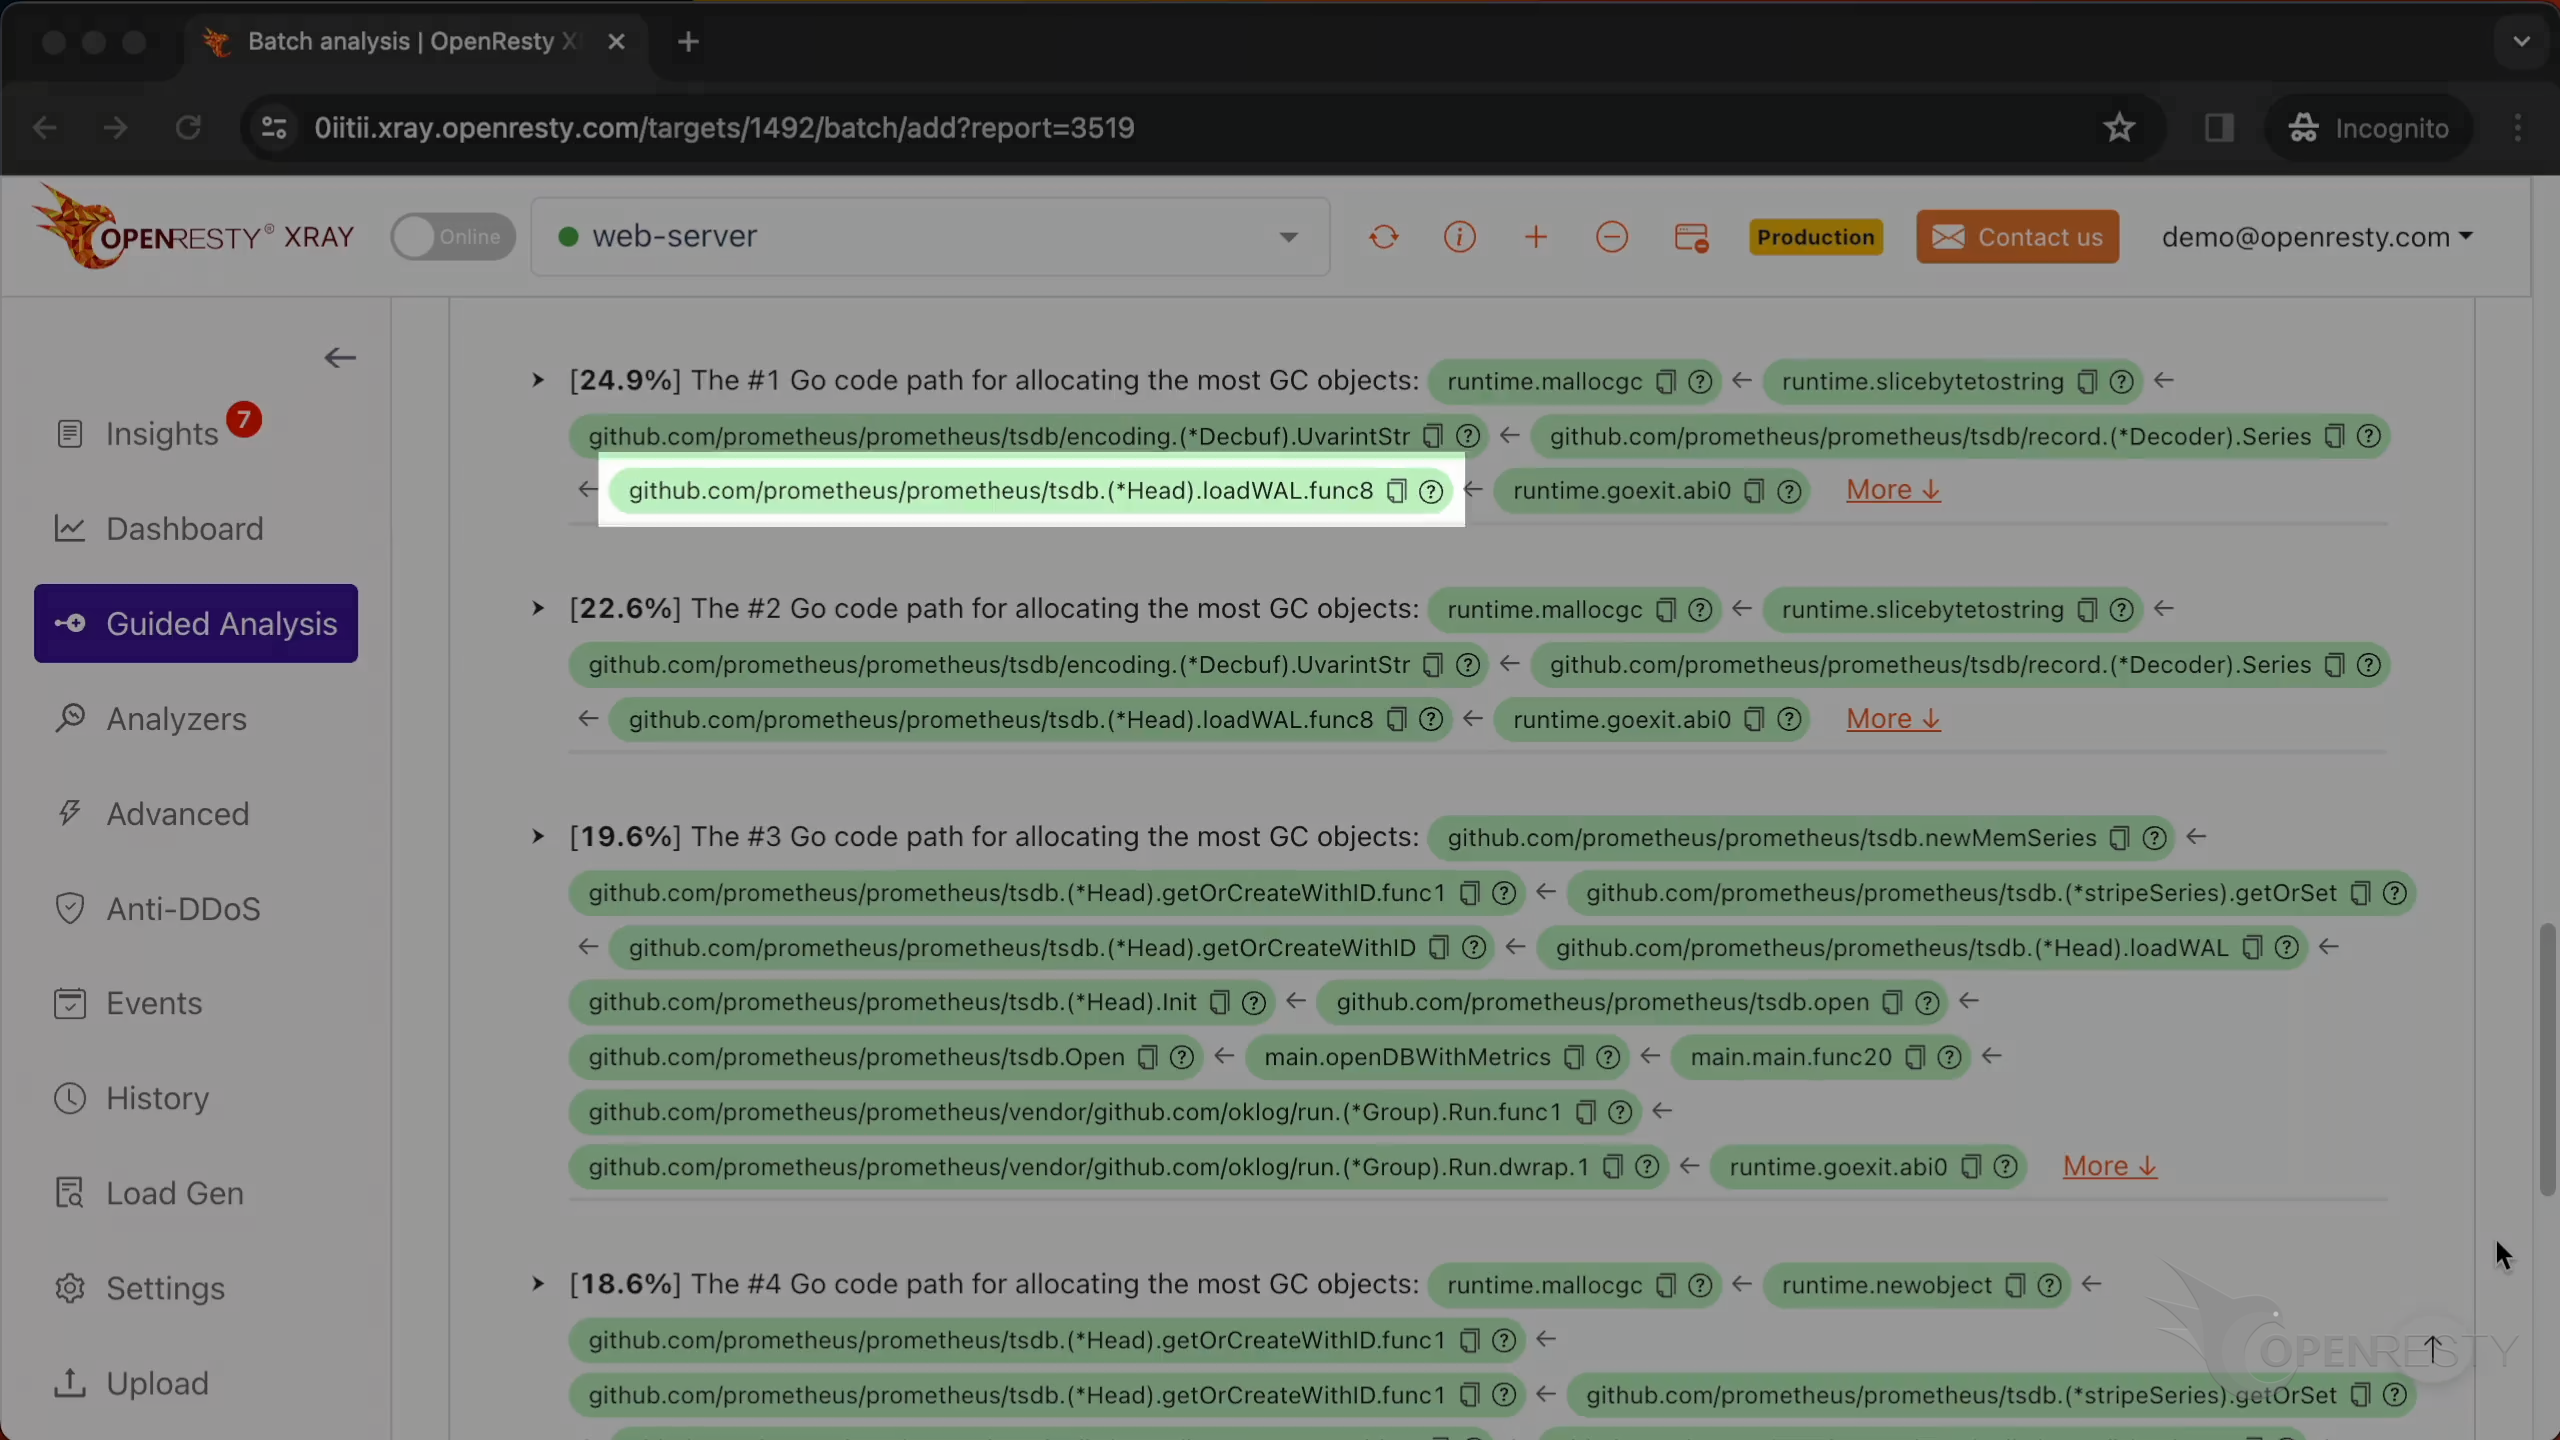
The function loadWAL is loading data from the Write-Ahead Log in Prometheus.
The function Series decodes time series data from the buffer and appends to the given slice.
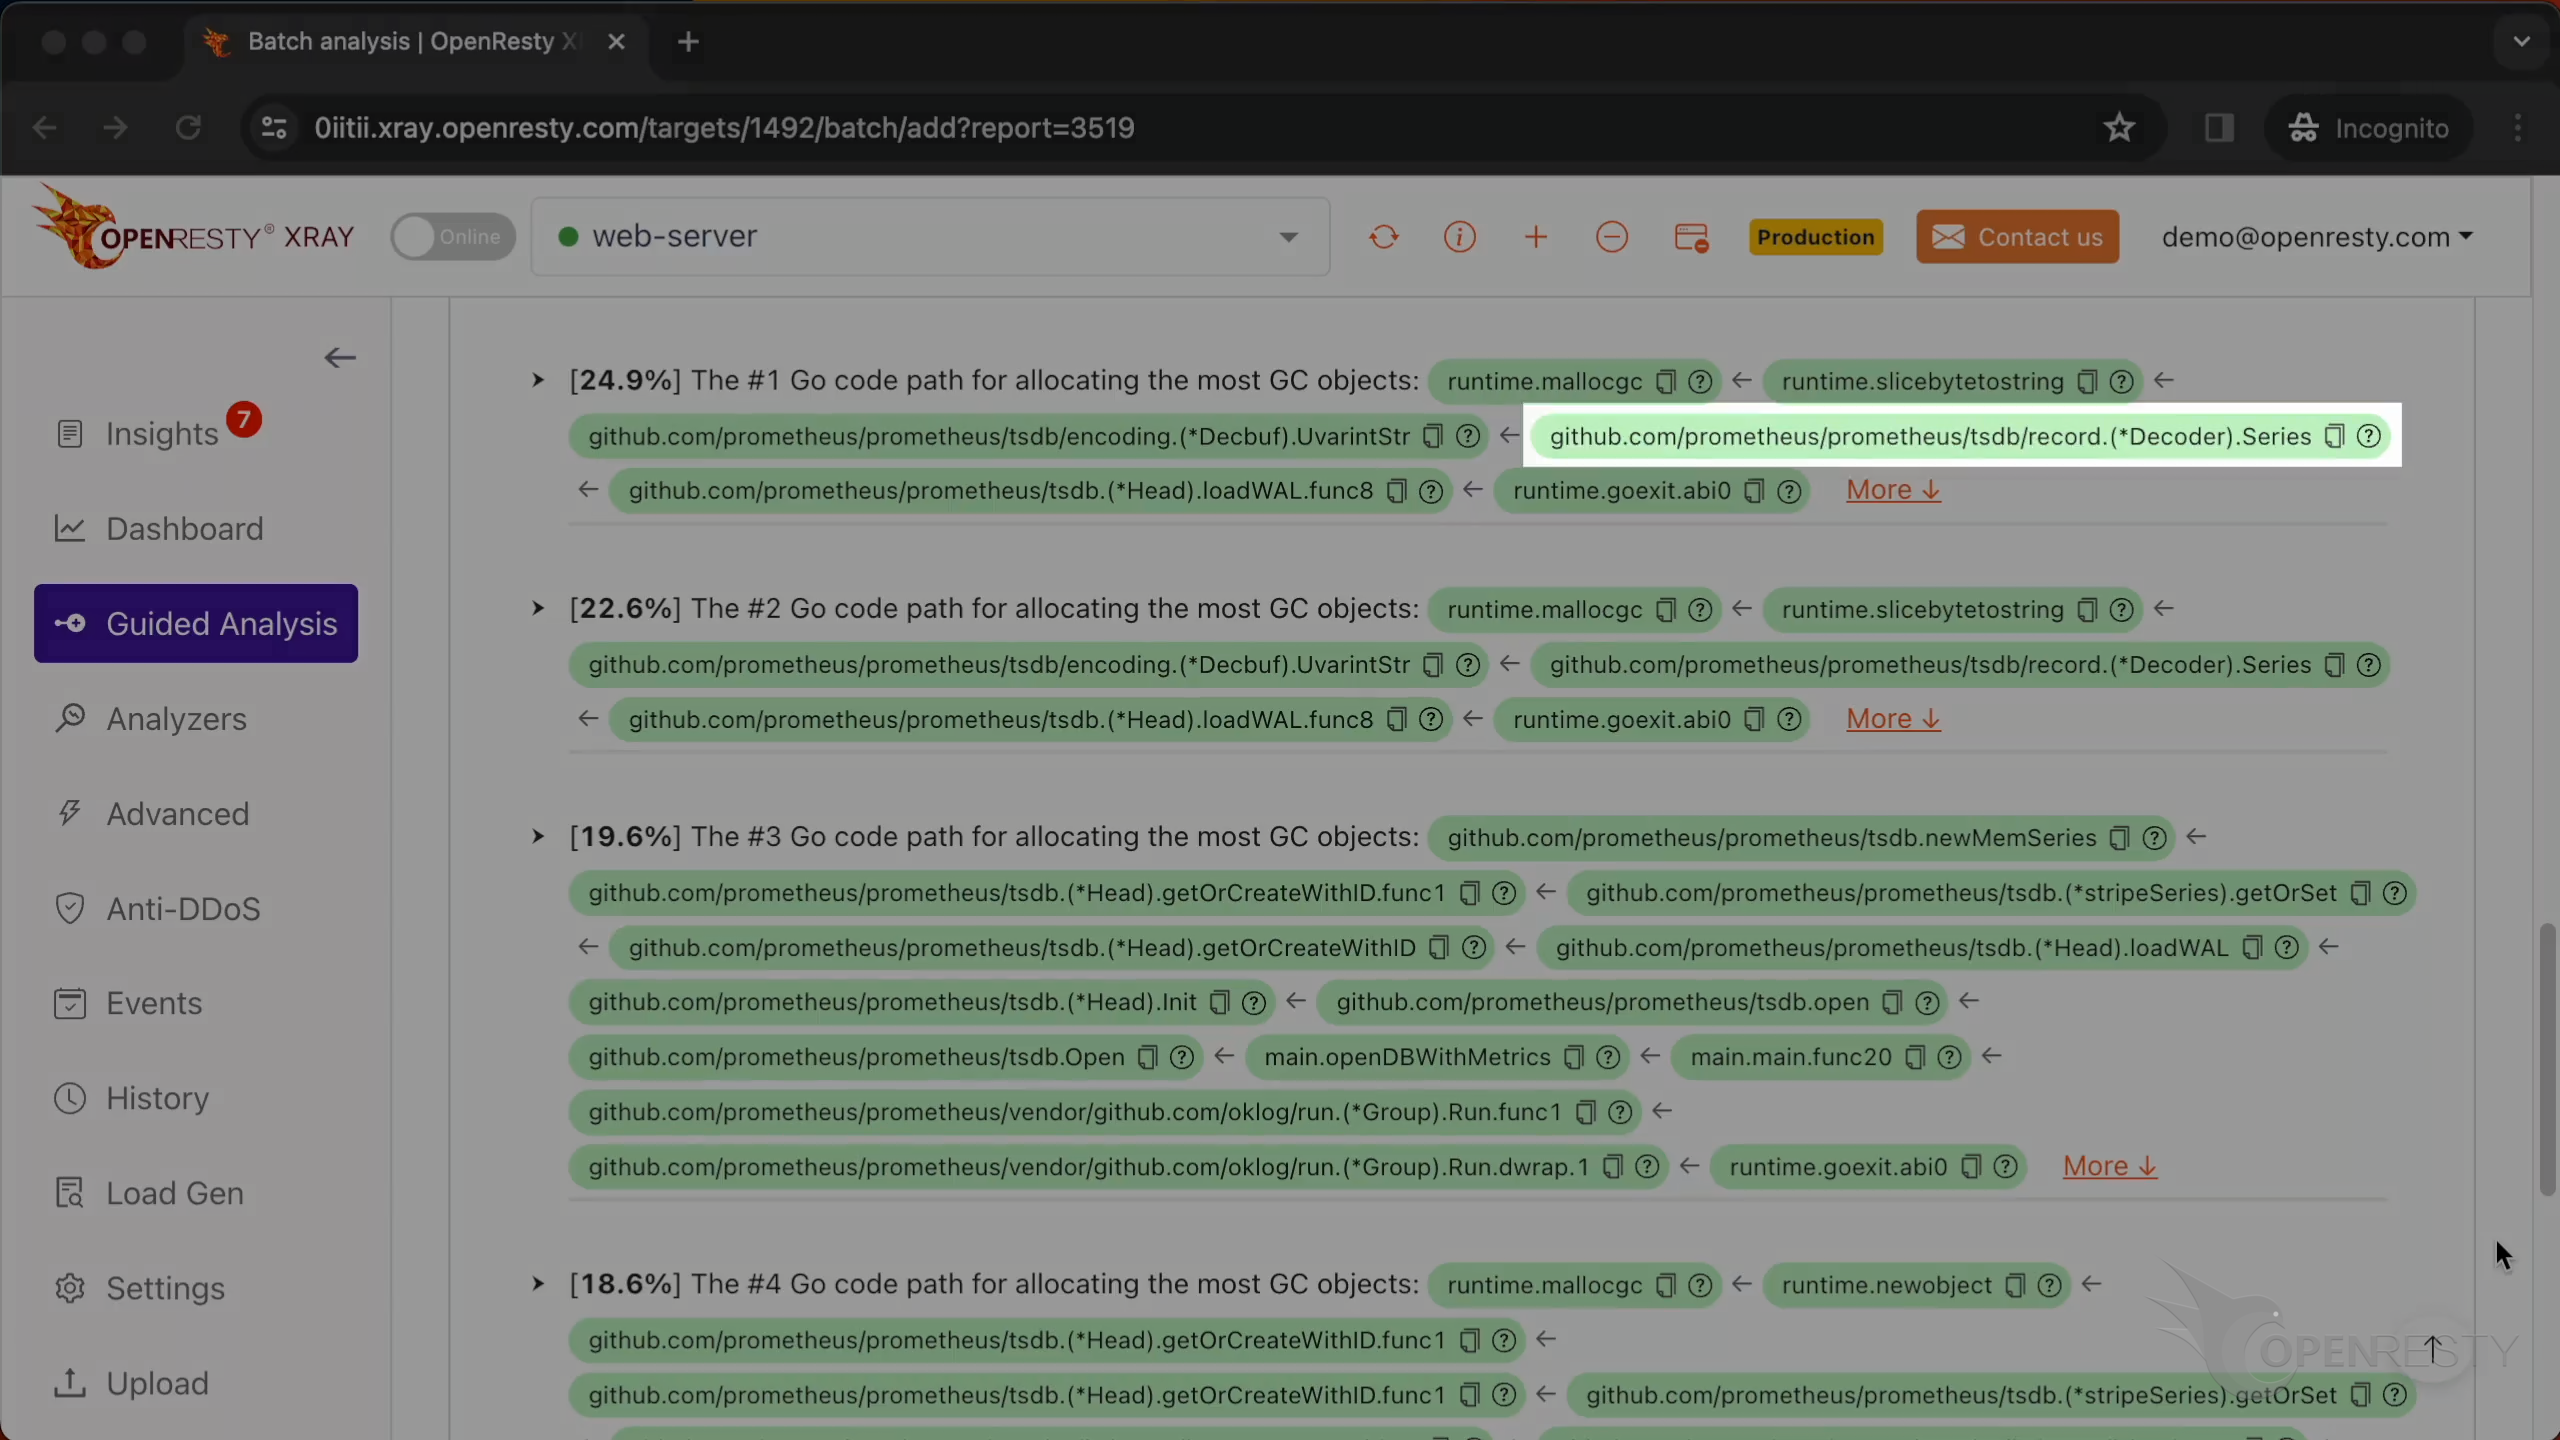
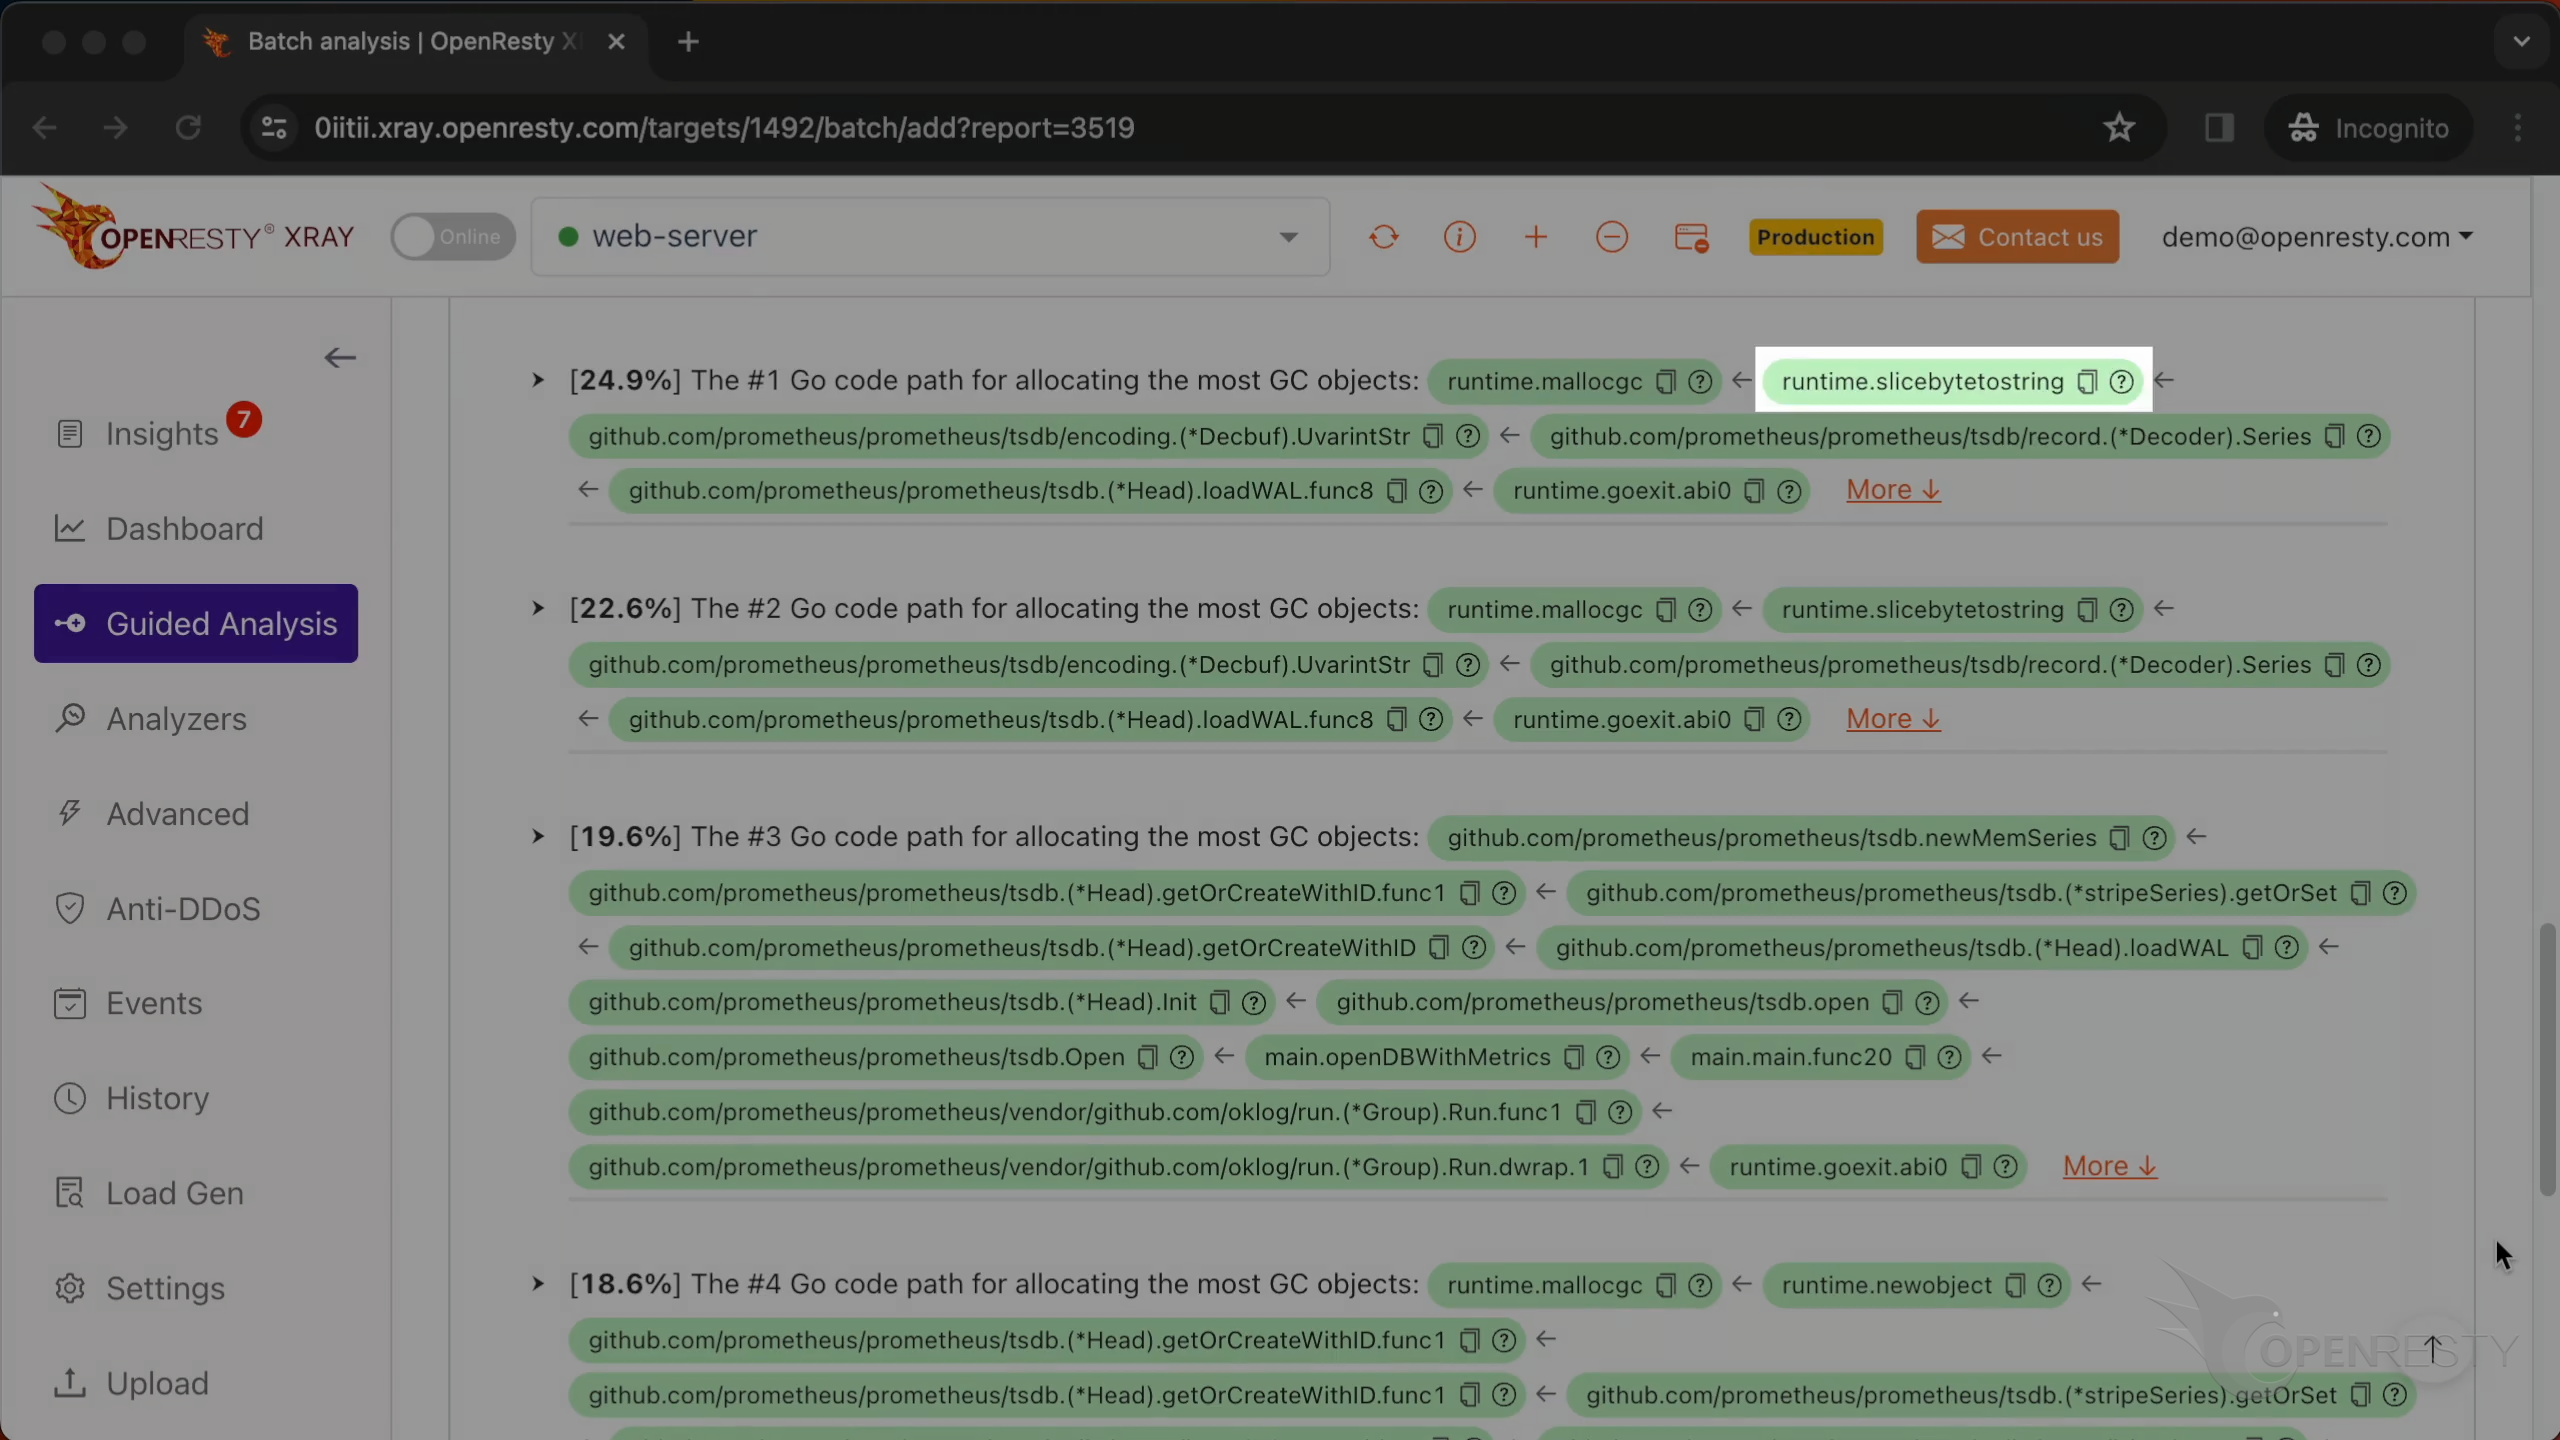
The function slicebytetostring converts a slice of bytes to a string.
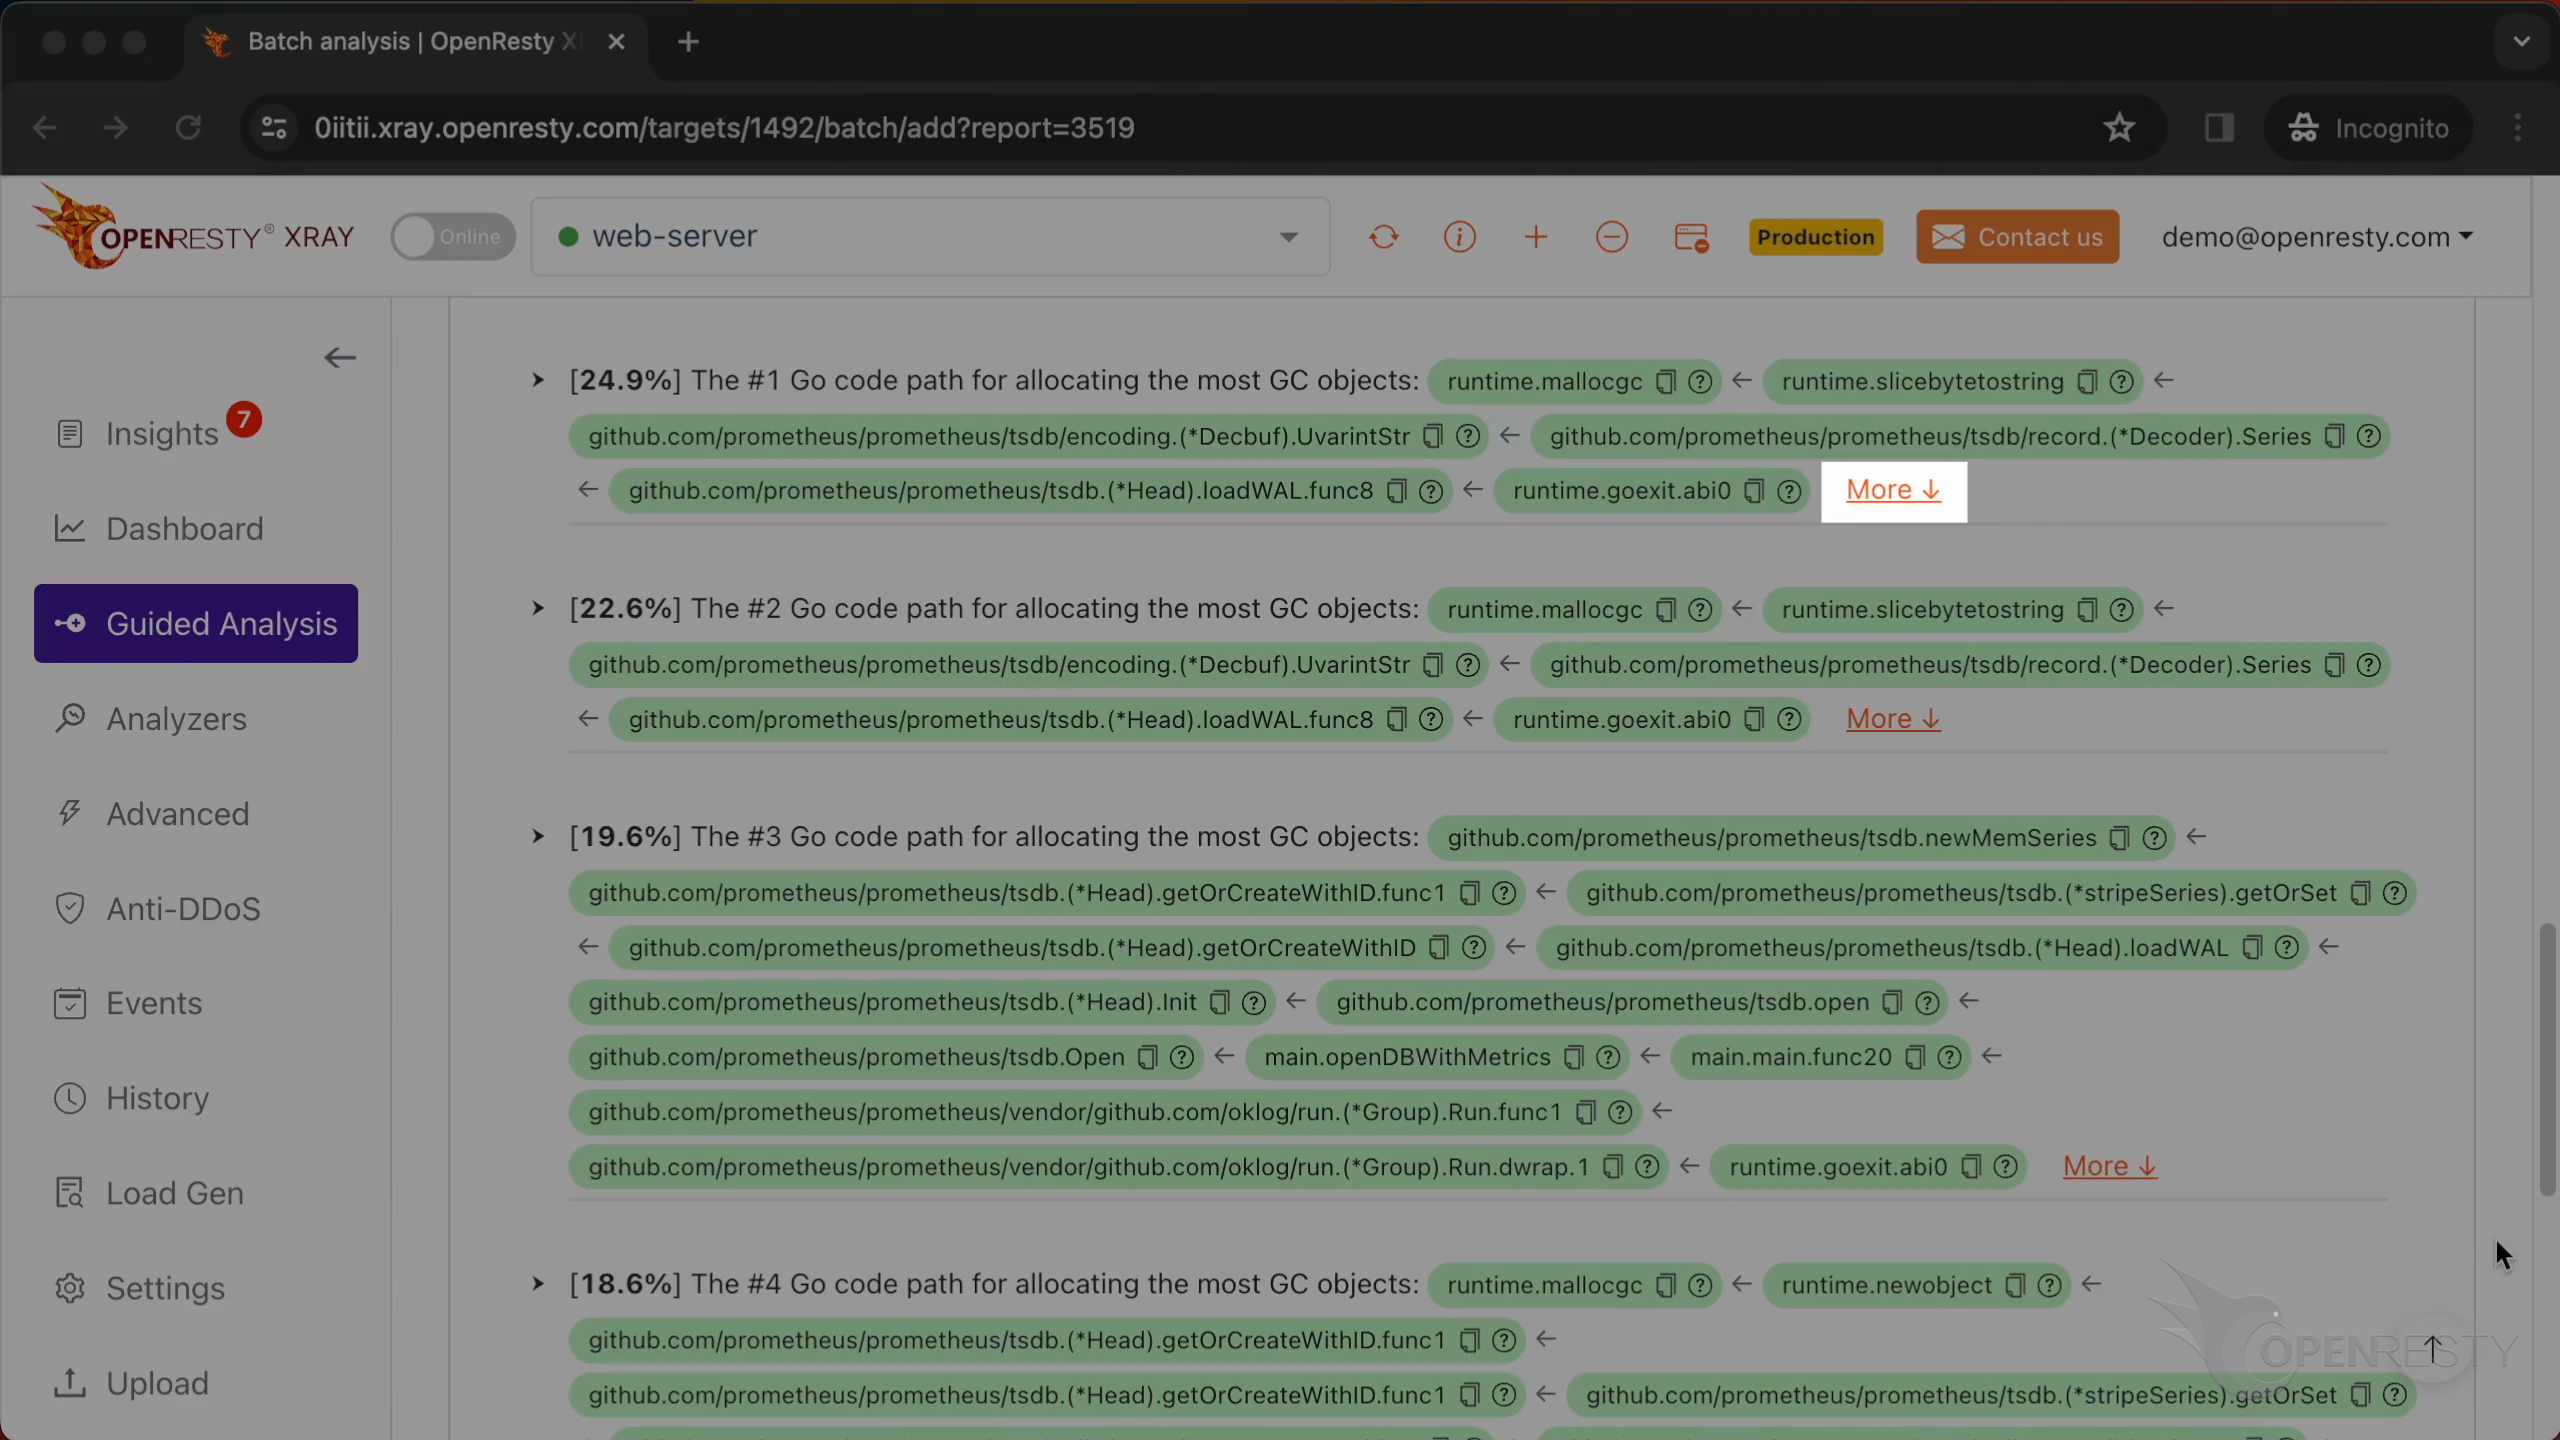
Click “More” to see more details.
This code path was automatically inferred from this Go GC object allocation flame graph.
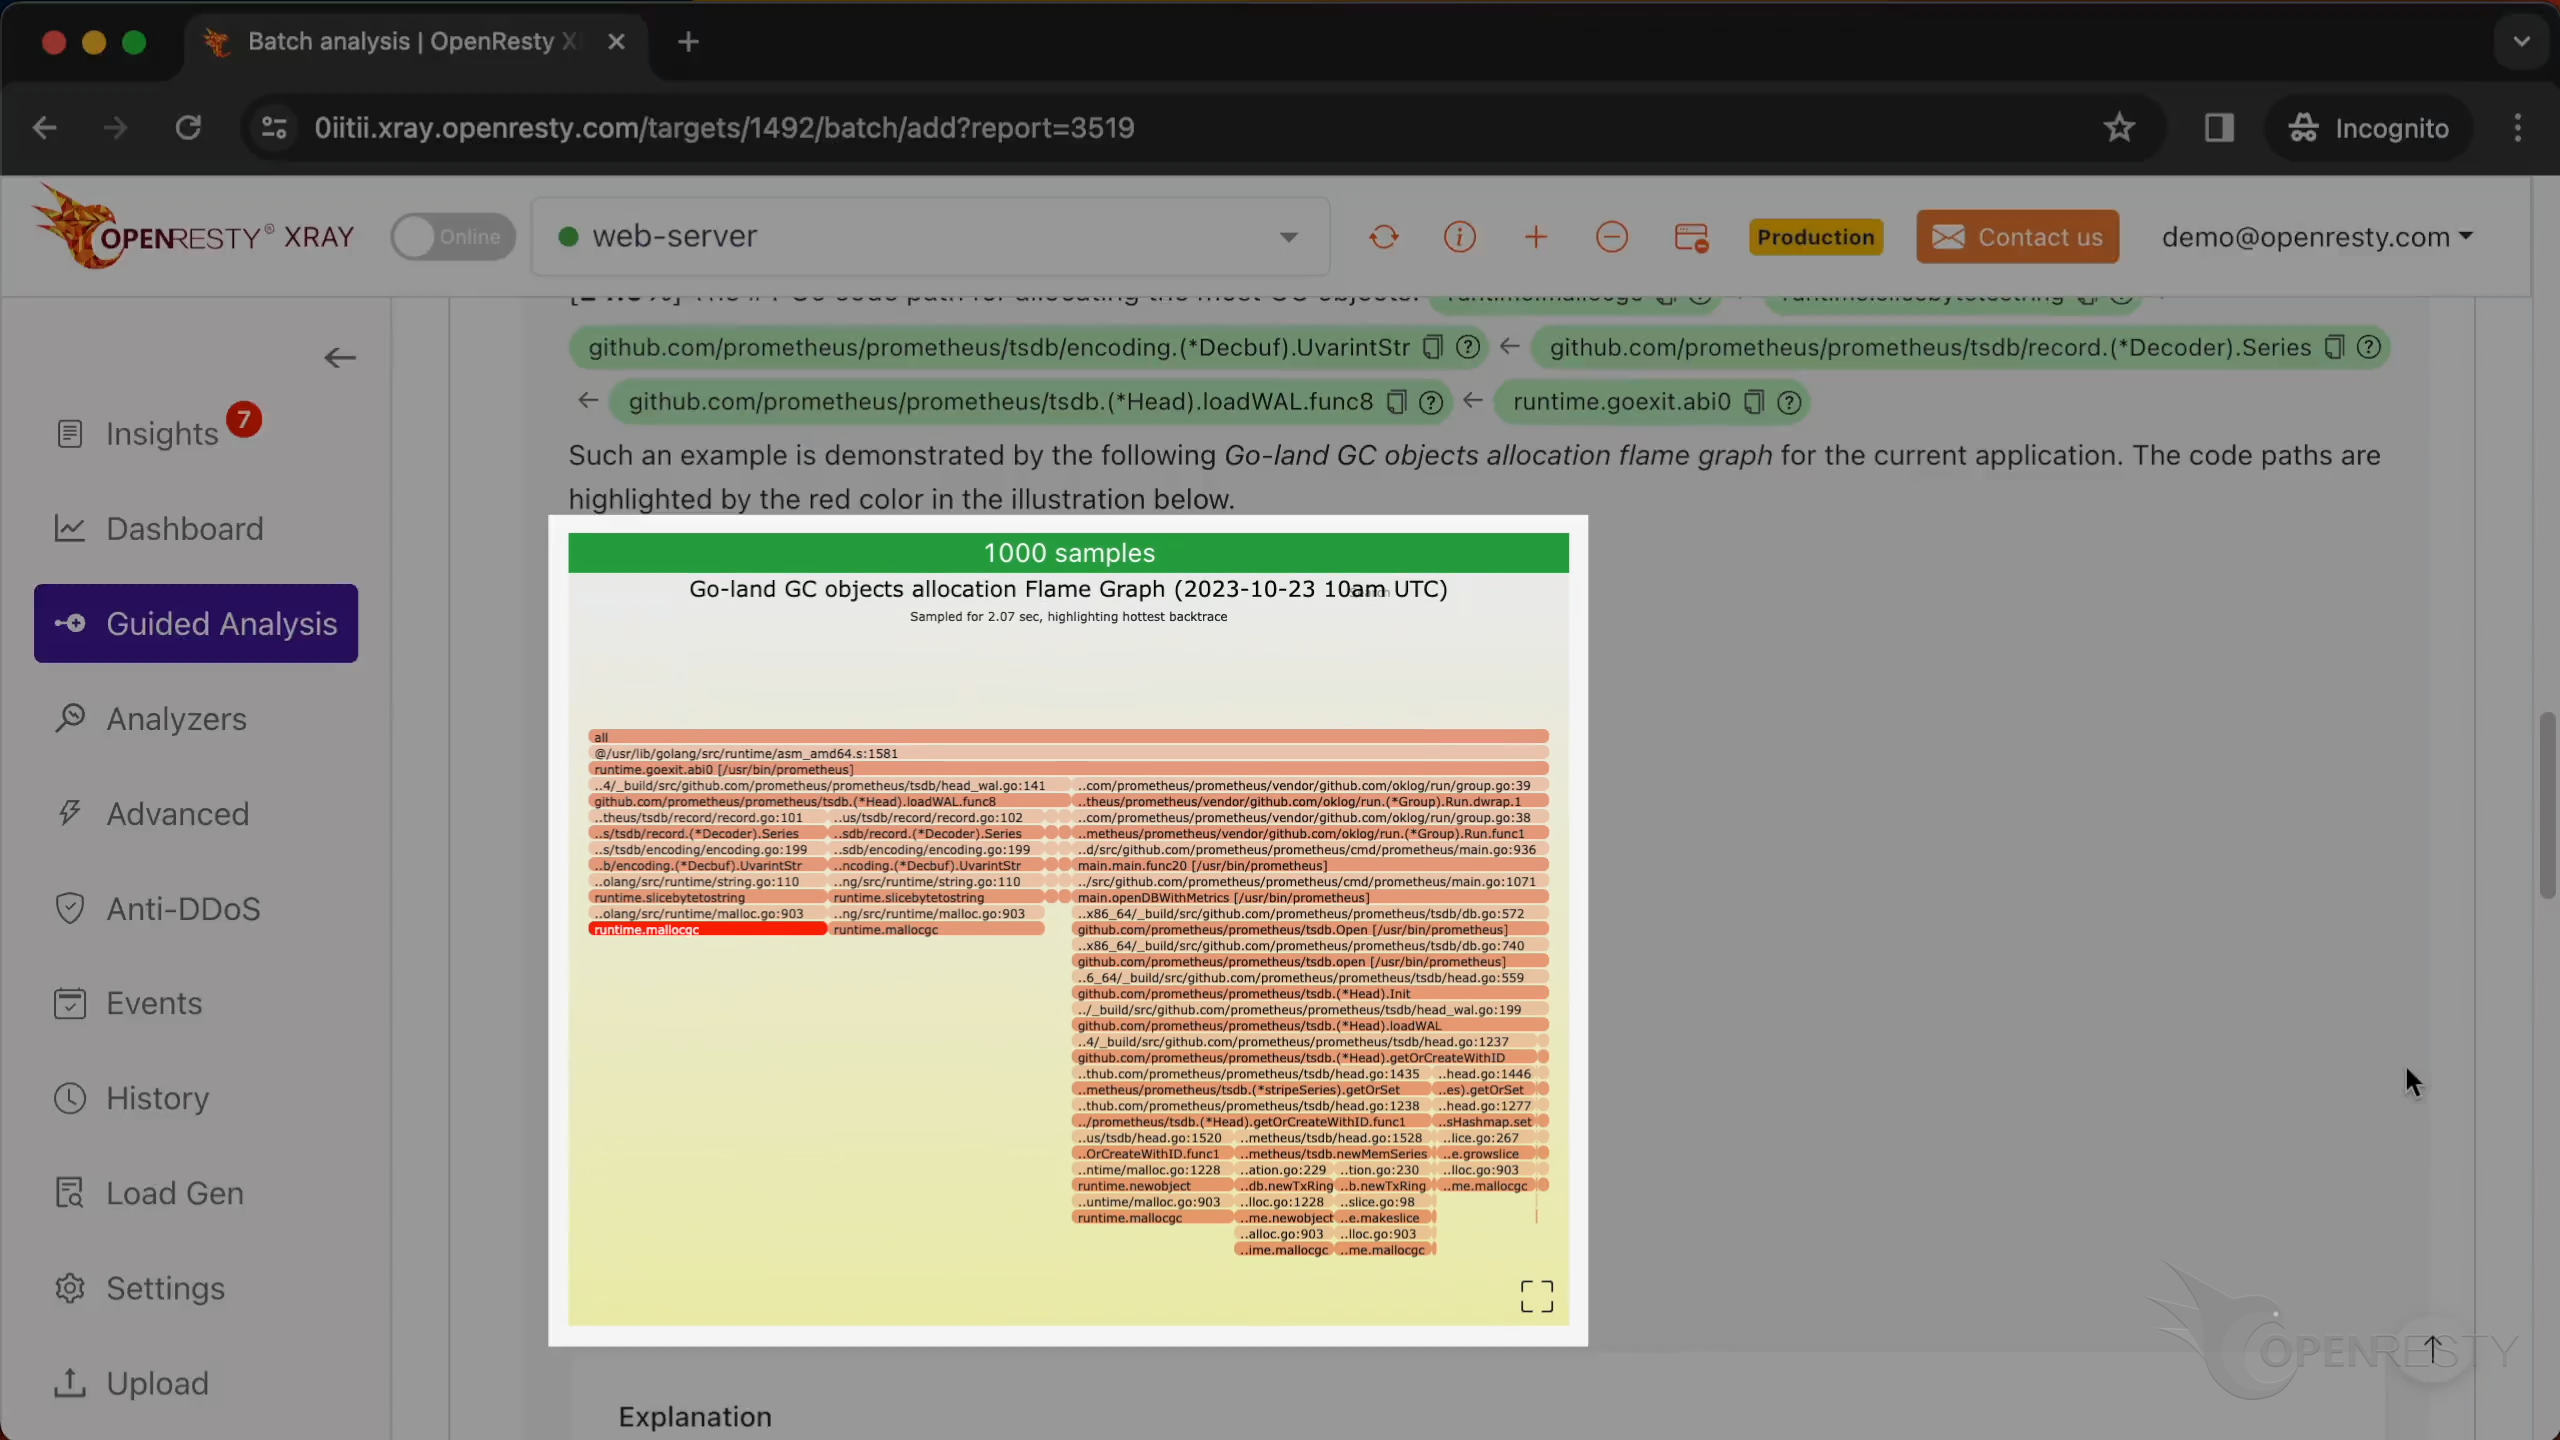
Below are more explanations and suggestions about the issue.
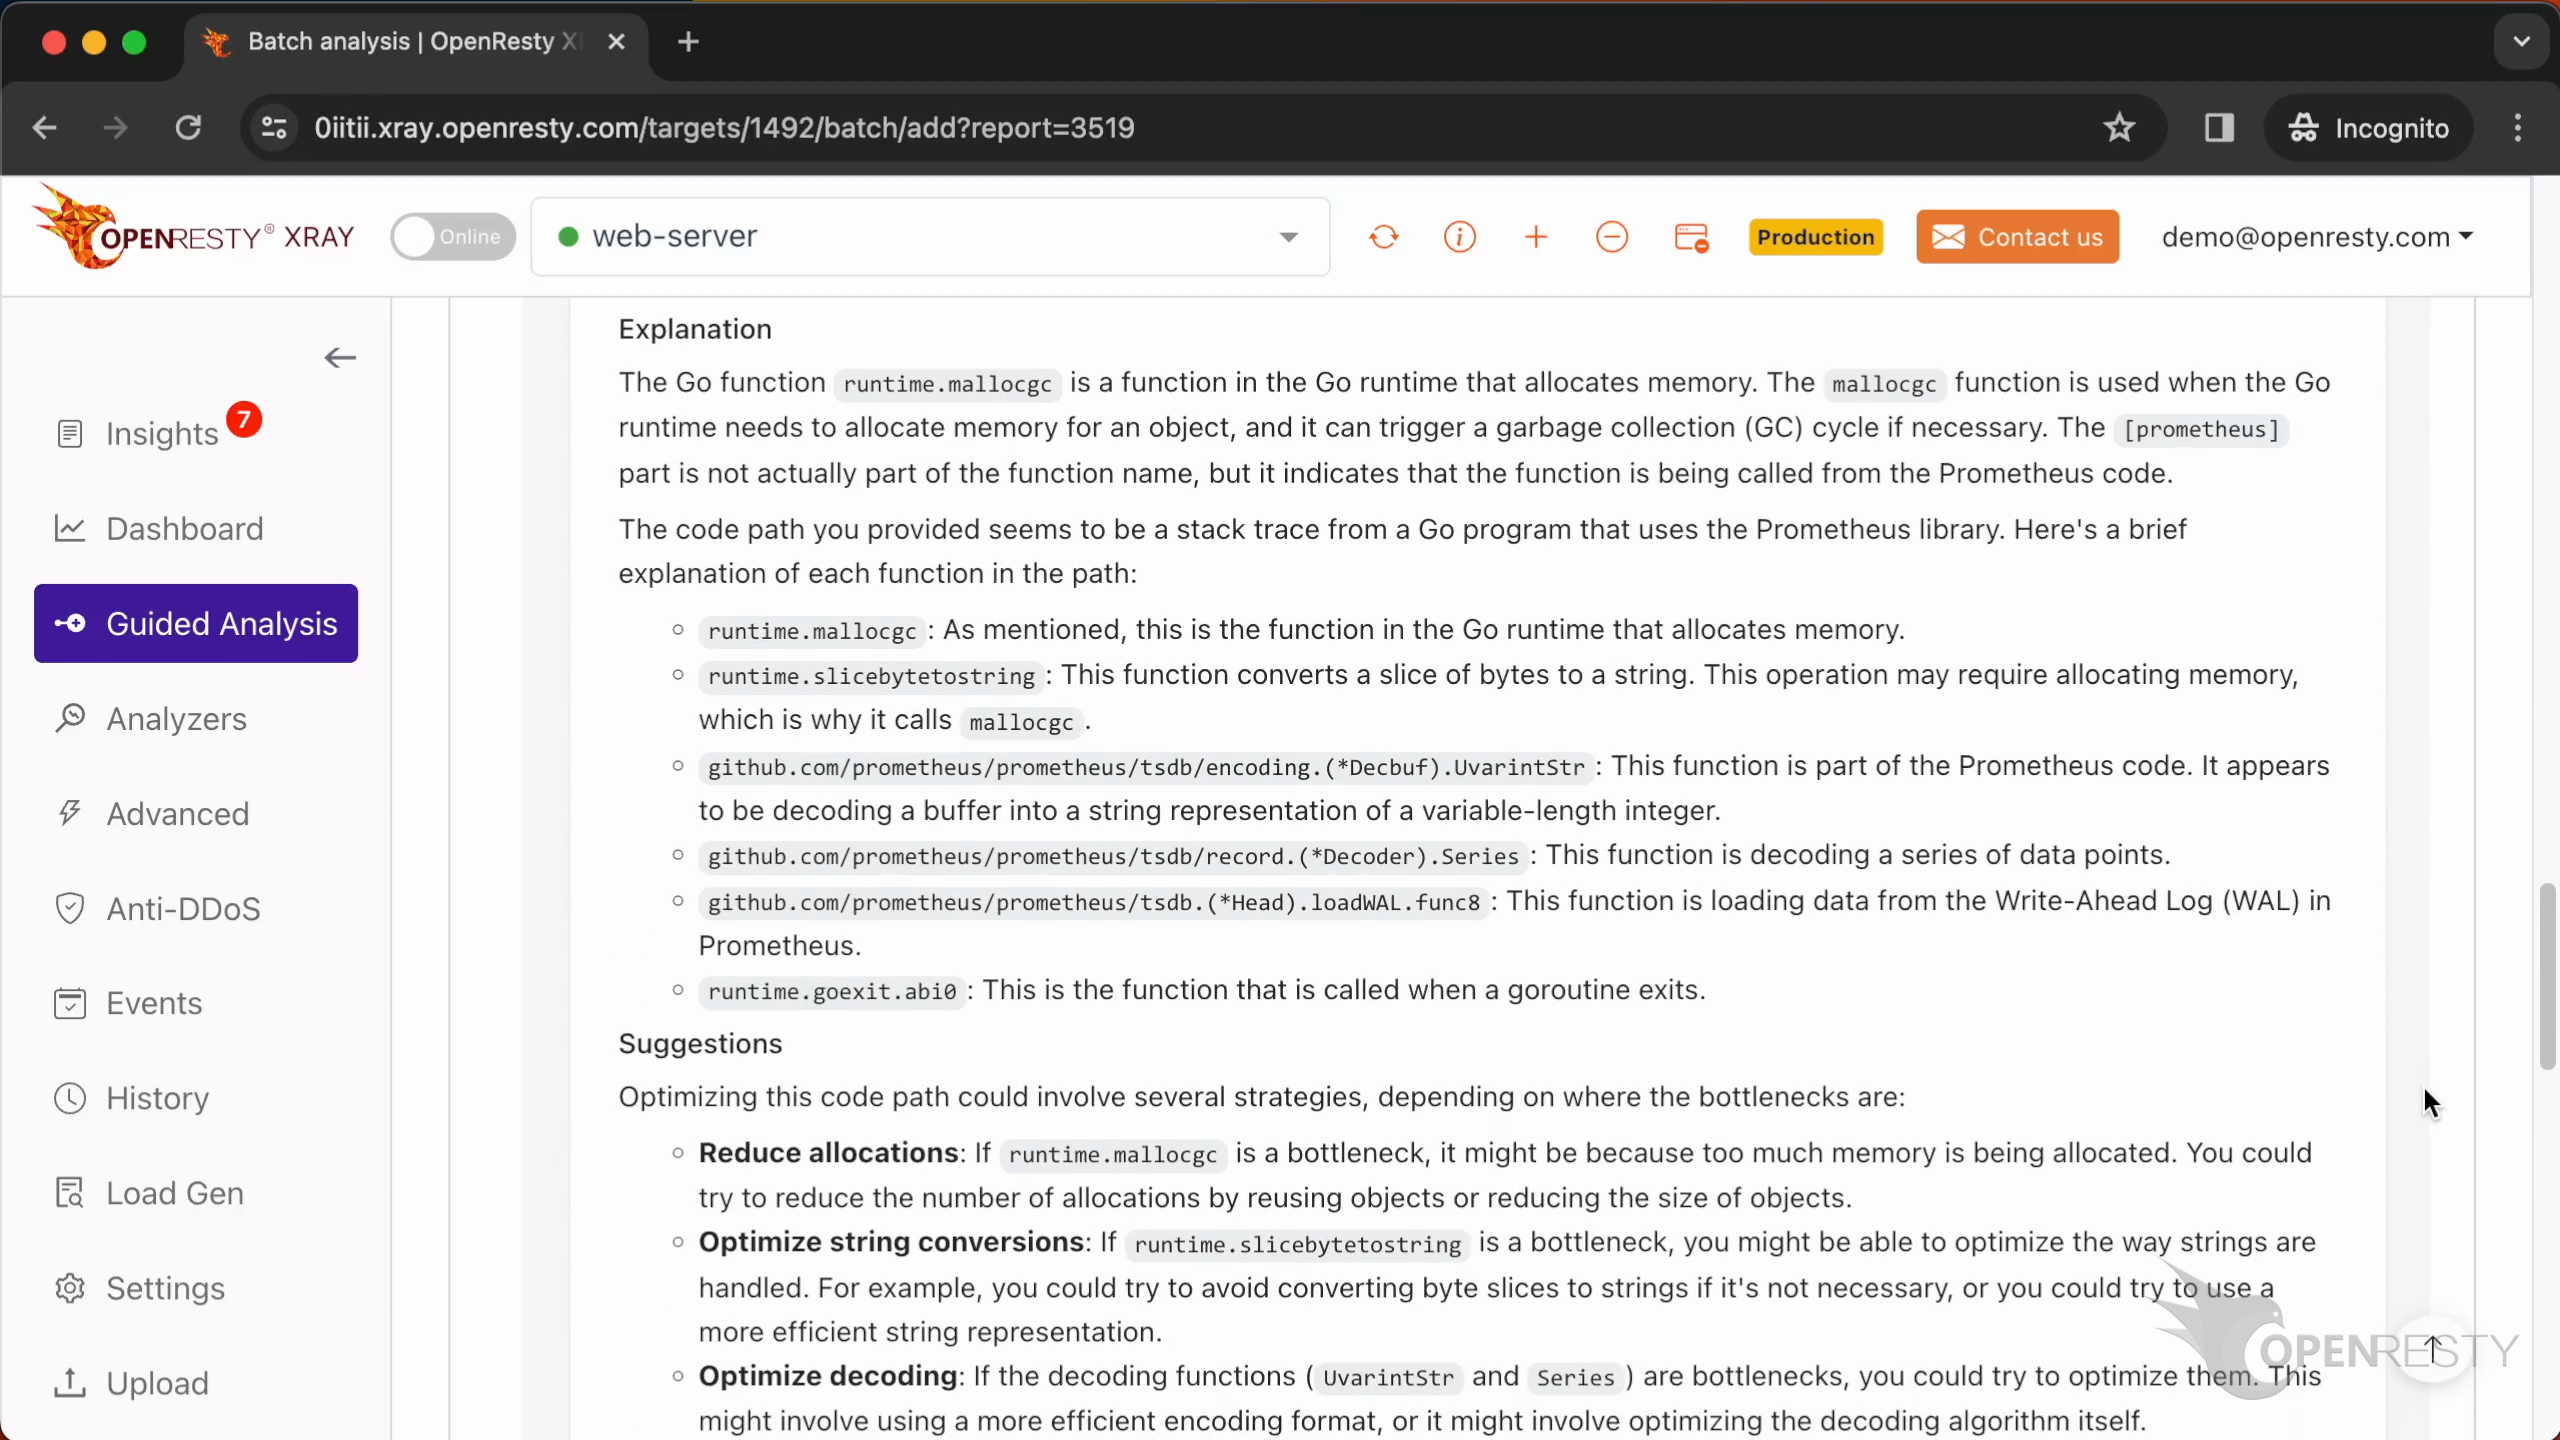
It mentions the function loadWAL.
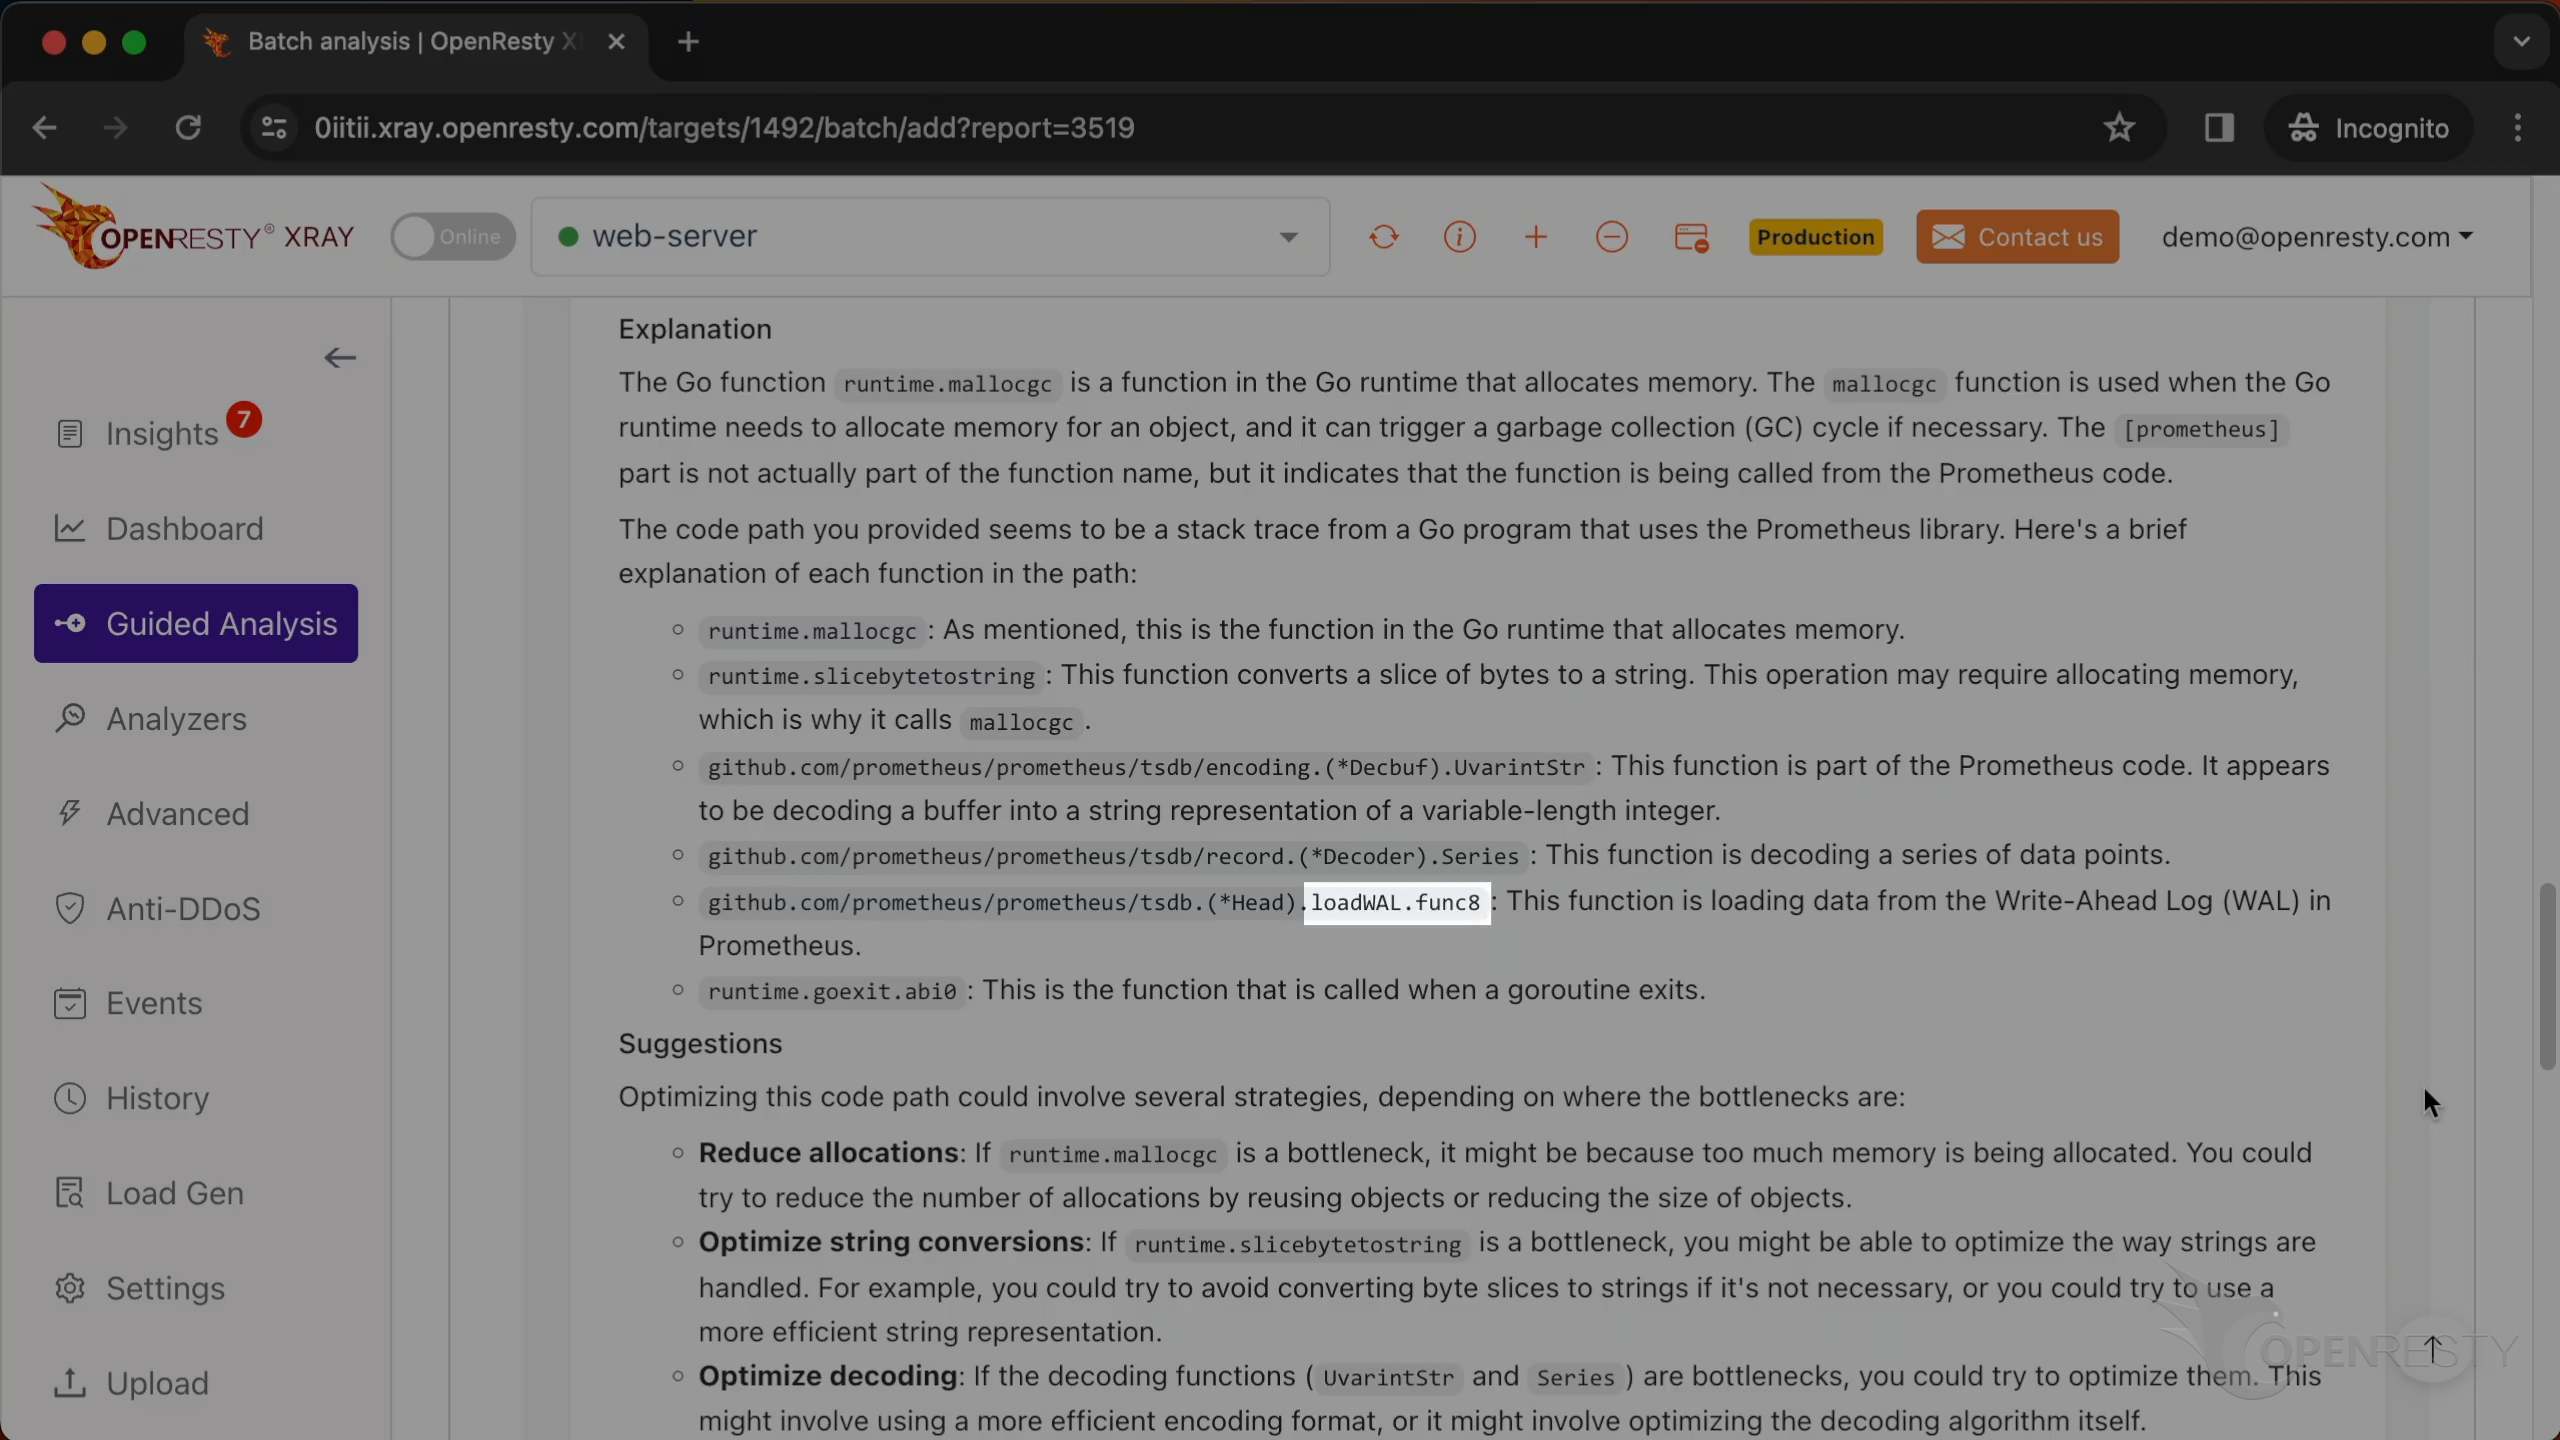
and this function is loading data from the Write-Ahead Log.
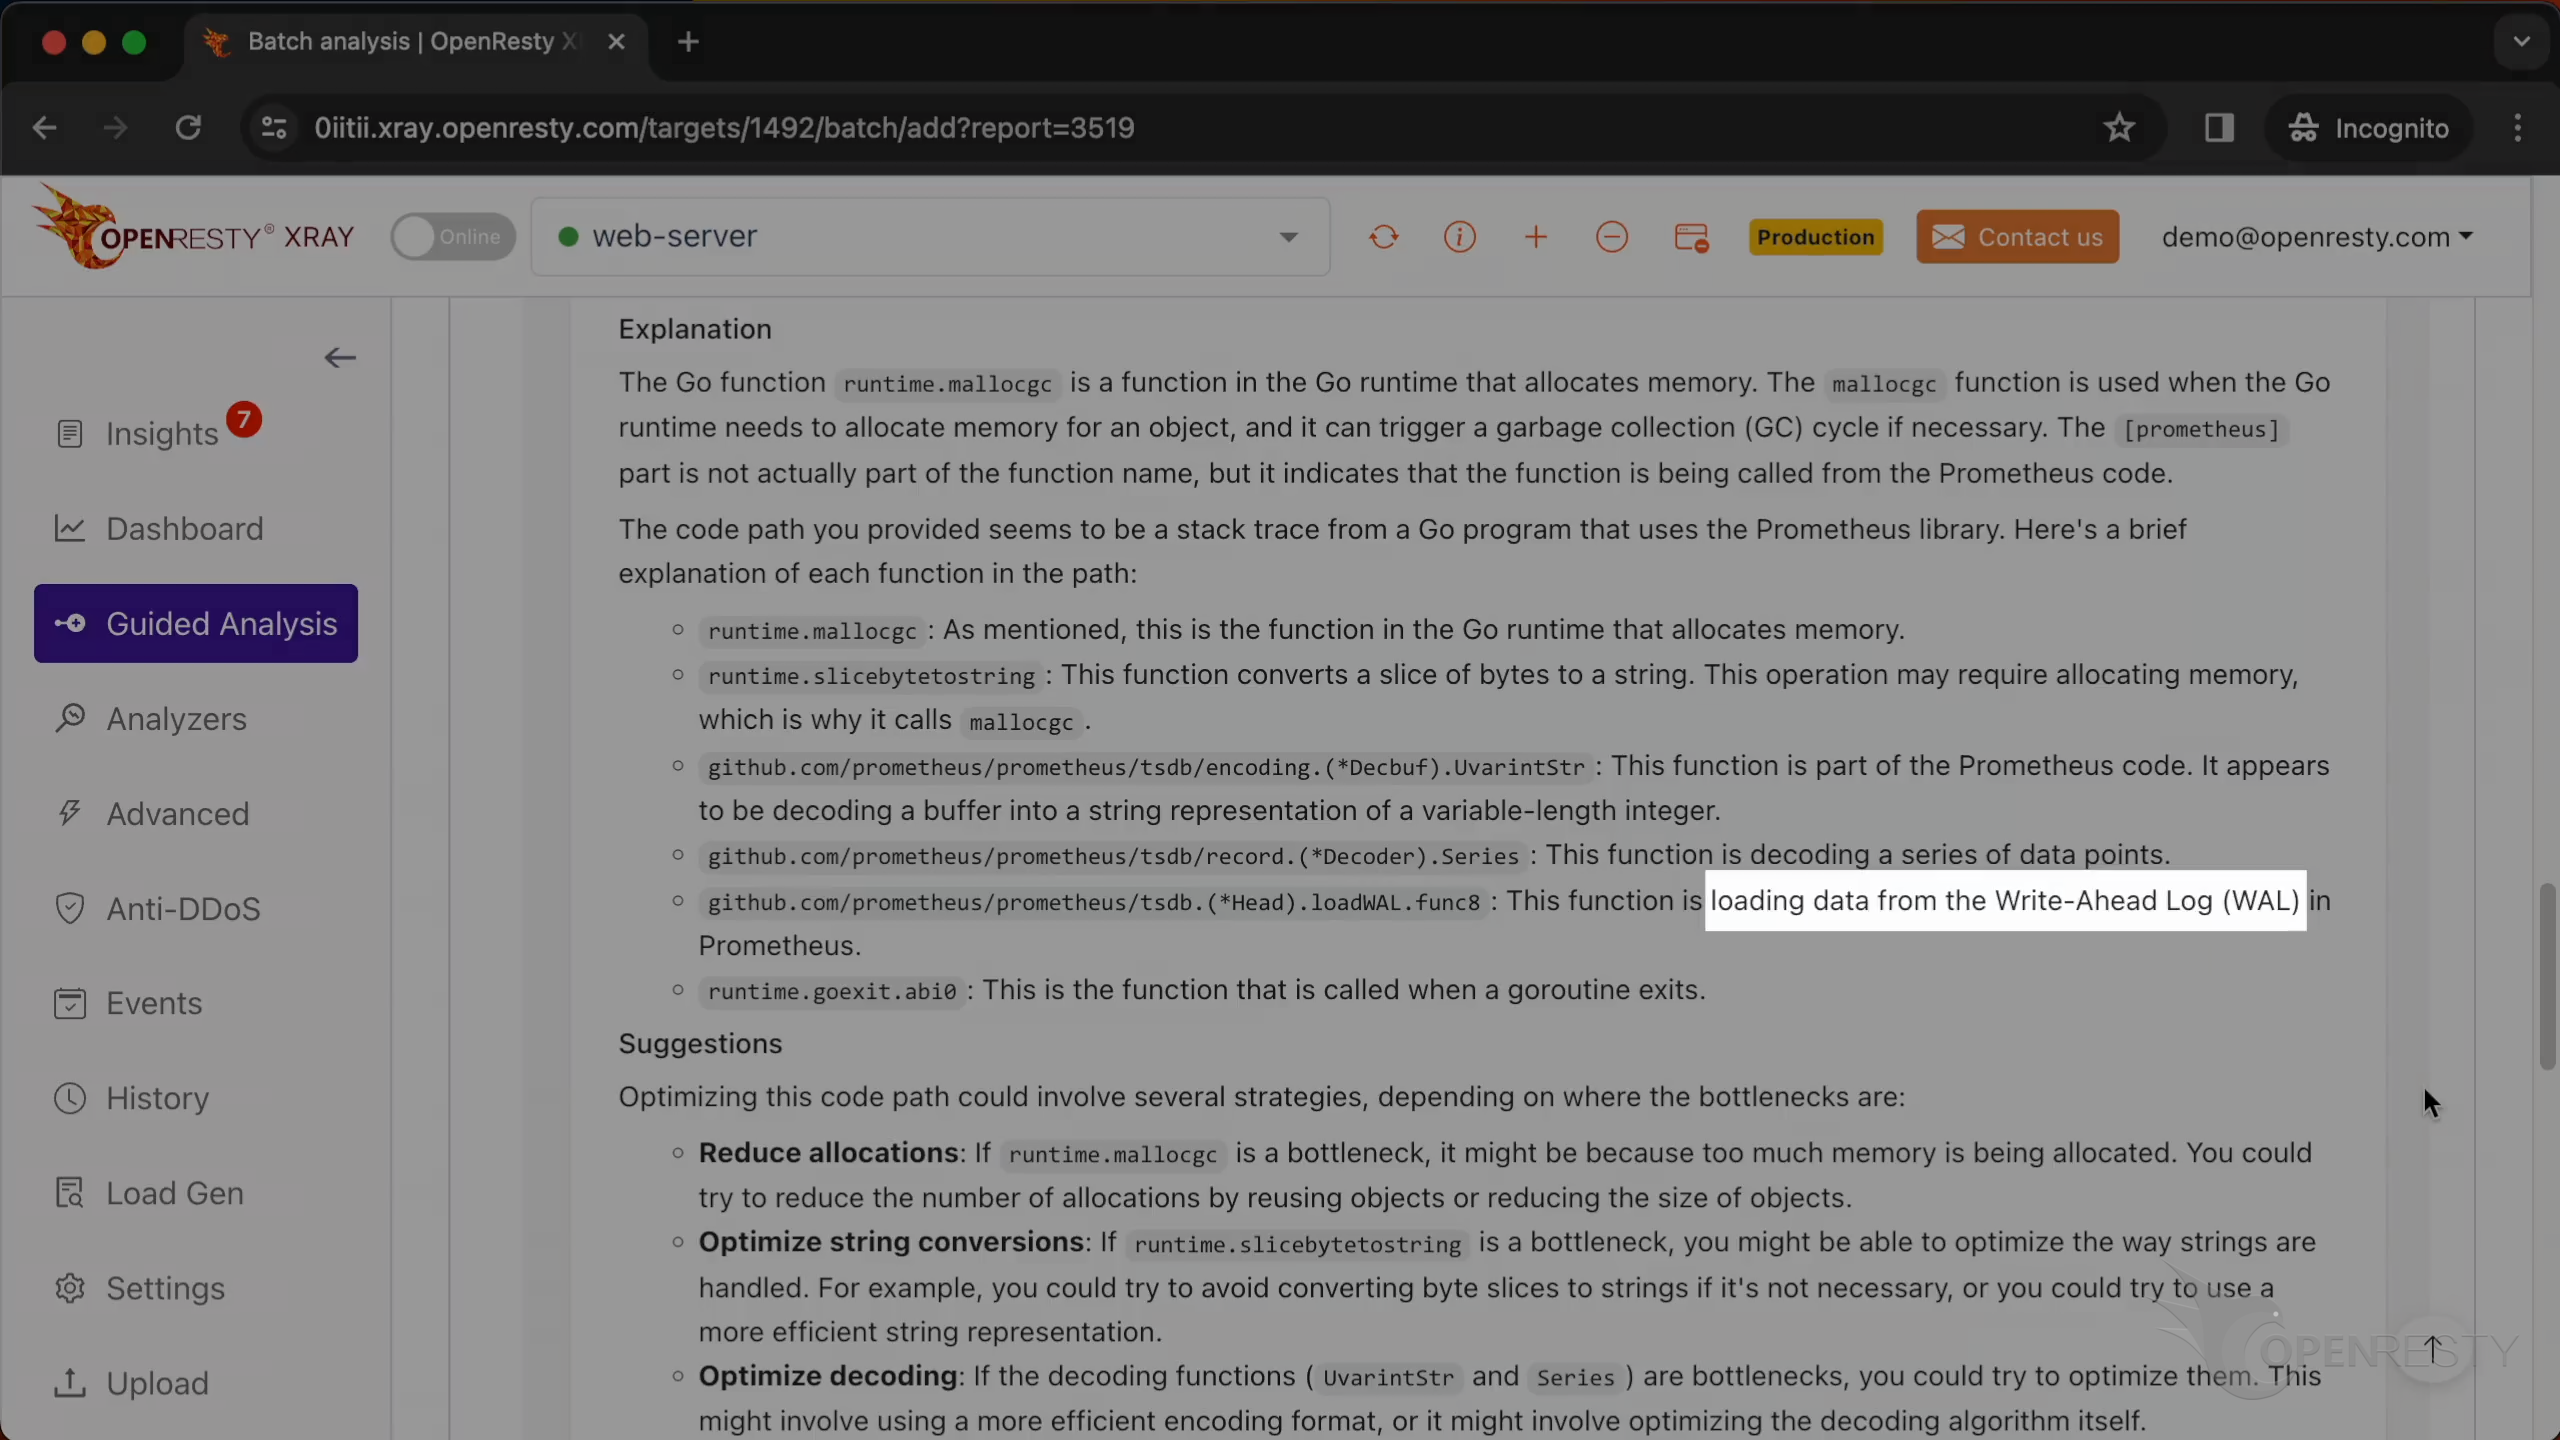
It also mentions the function Series,
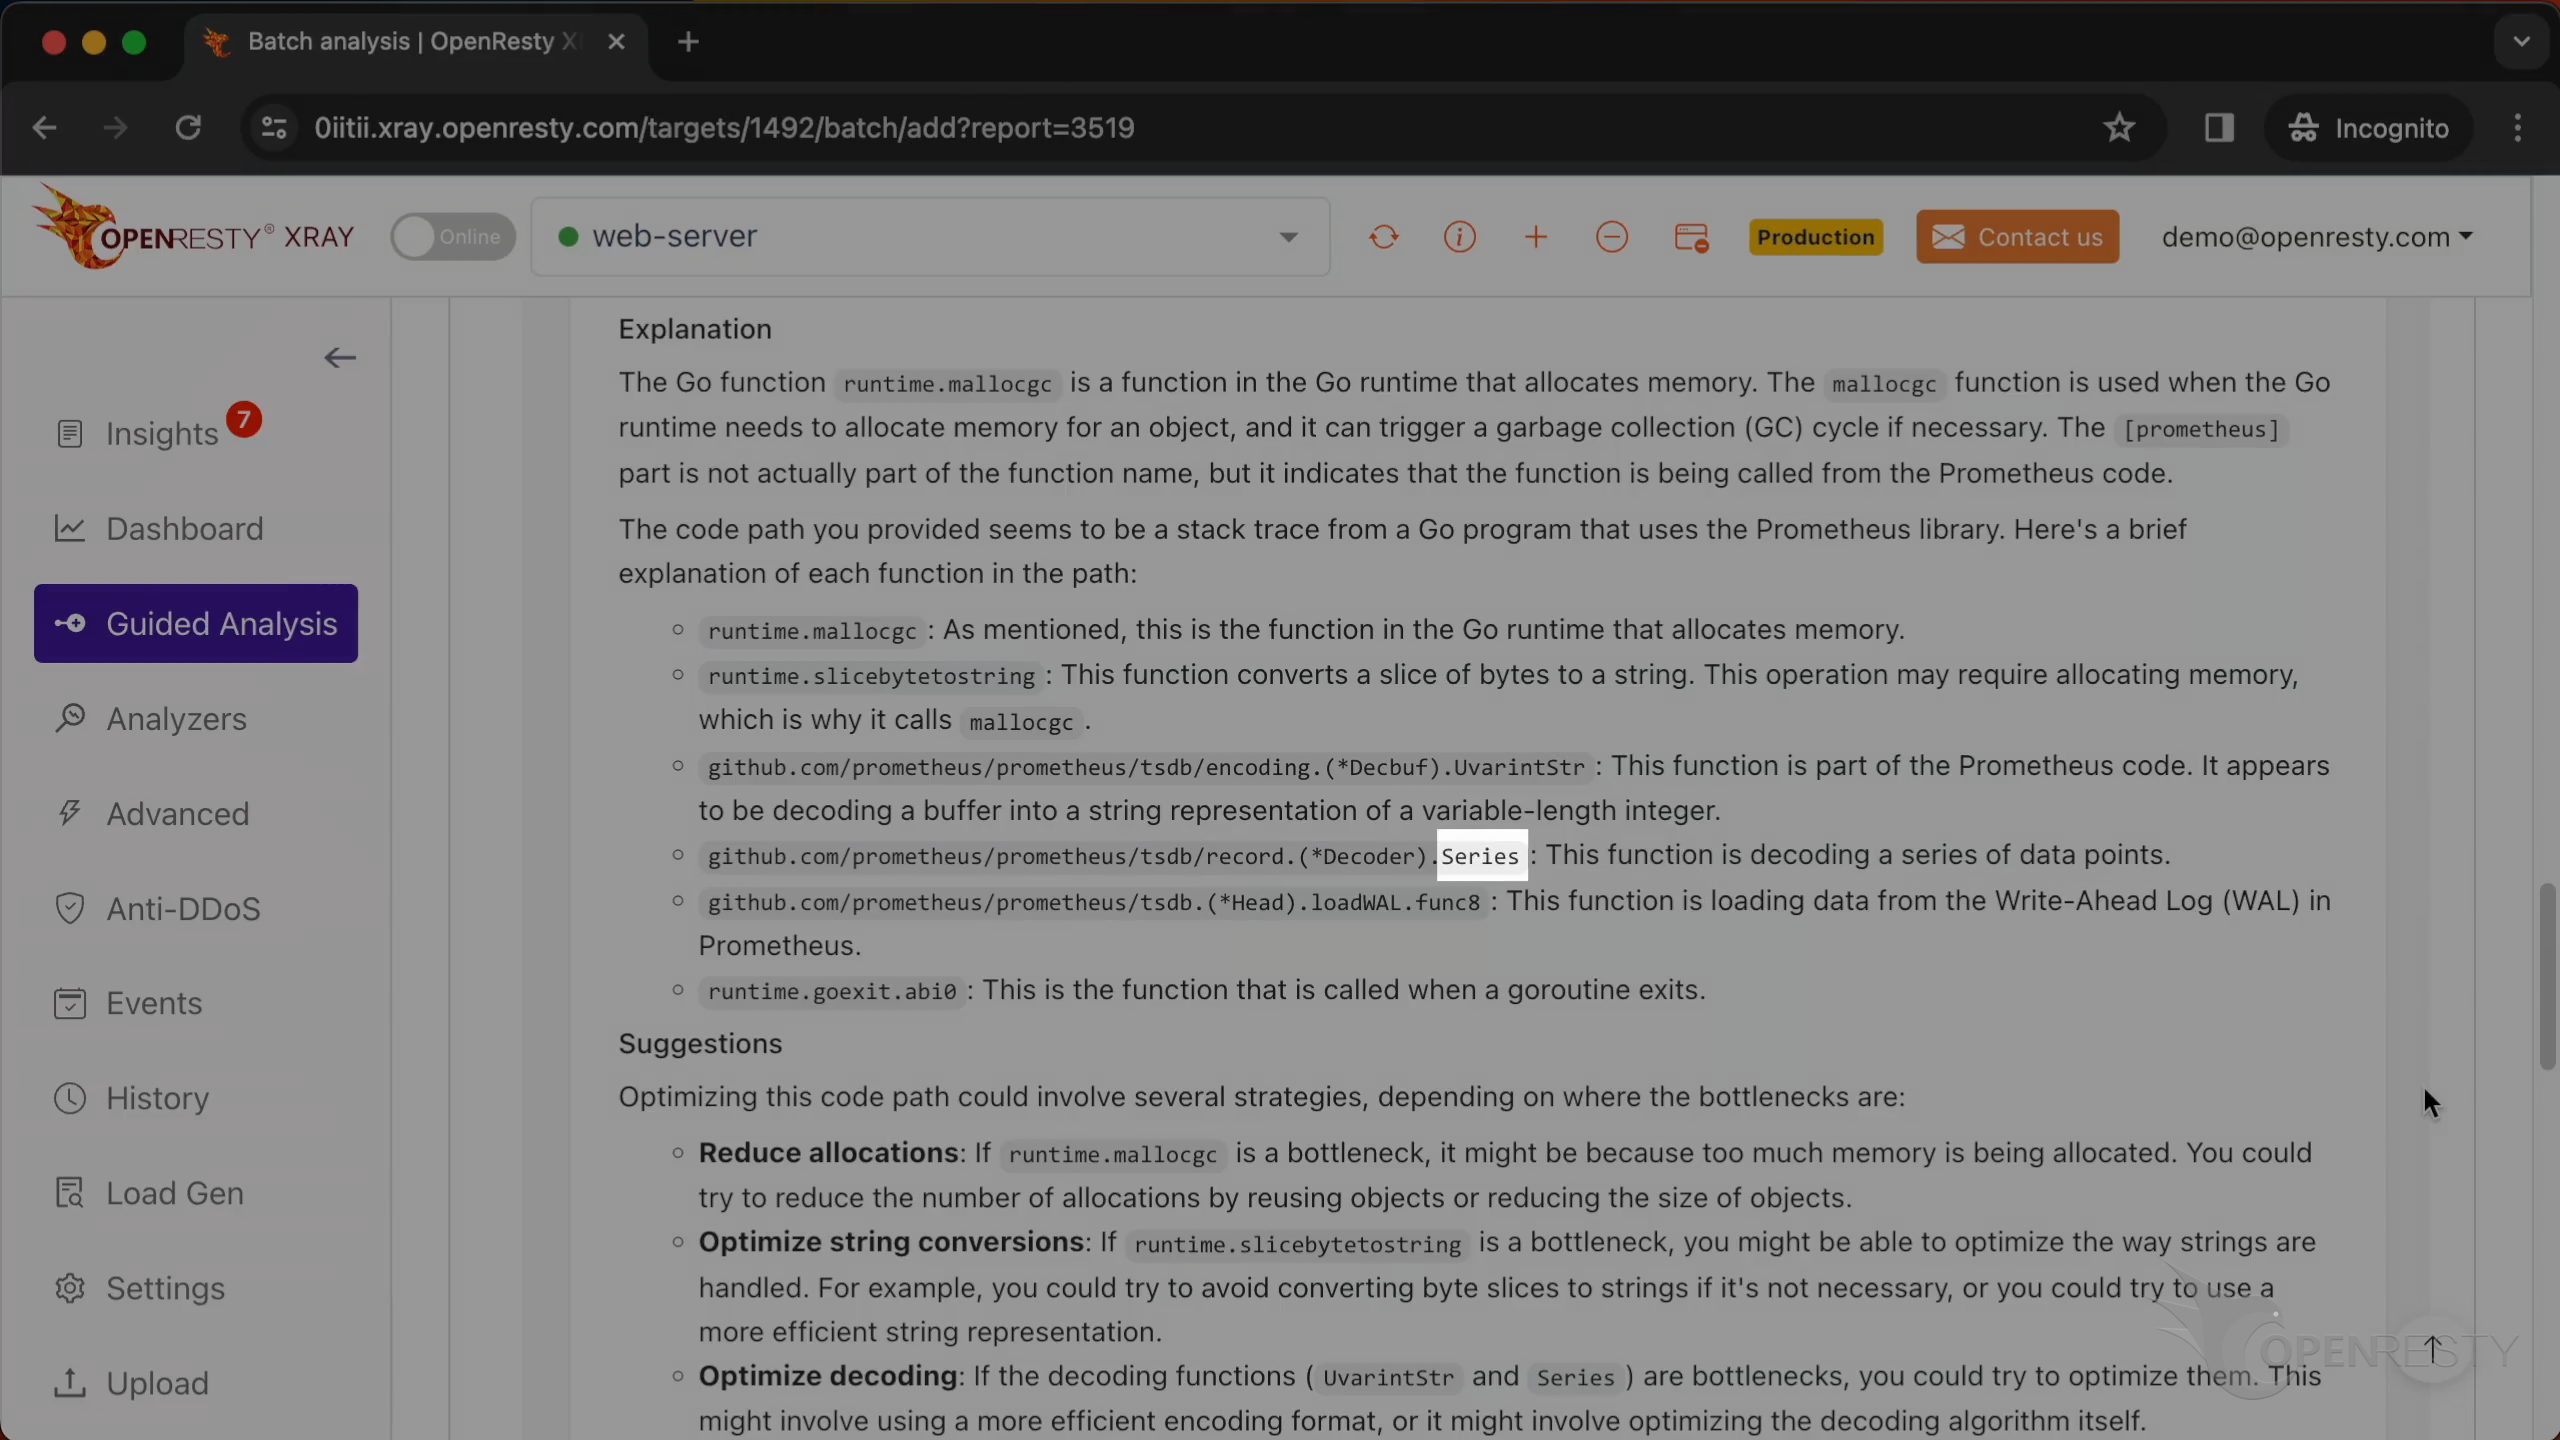
and the function slicebytetostring.
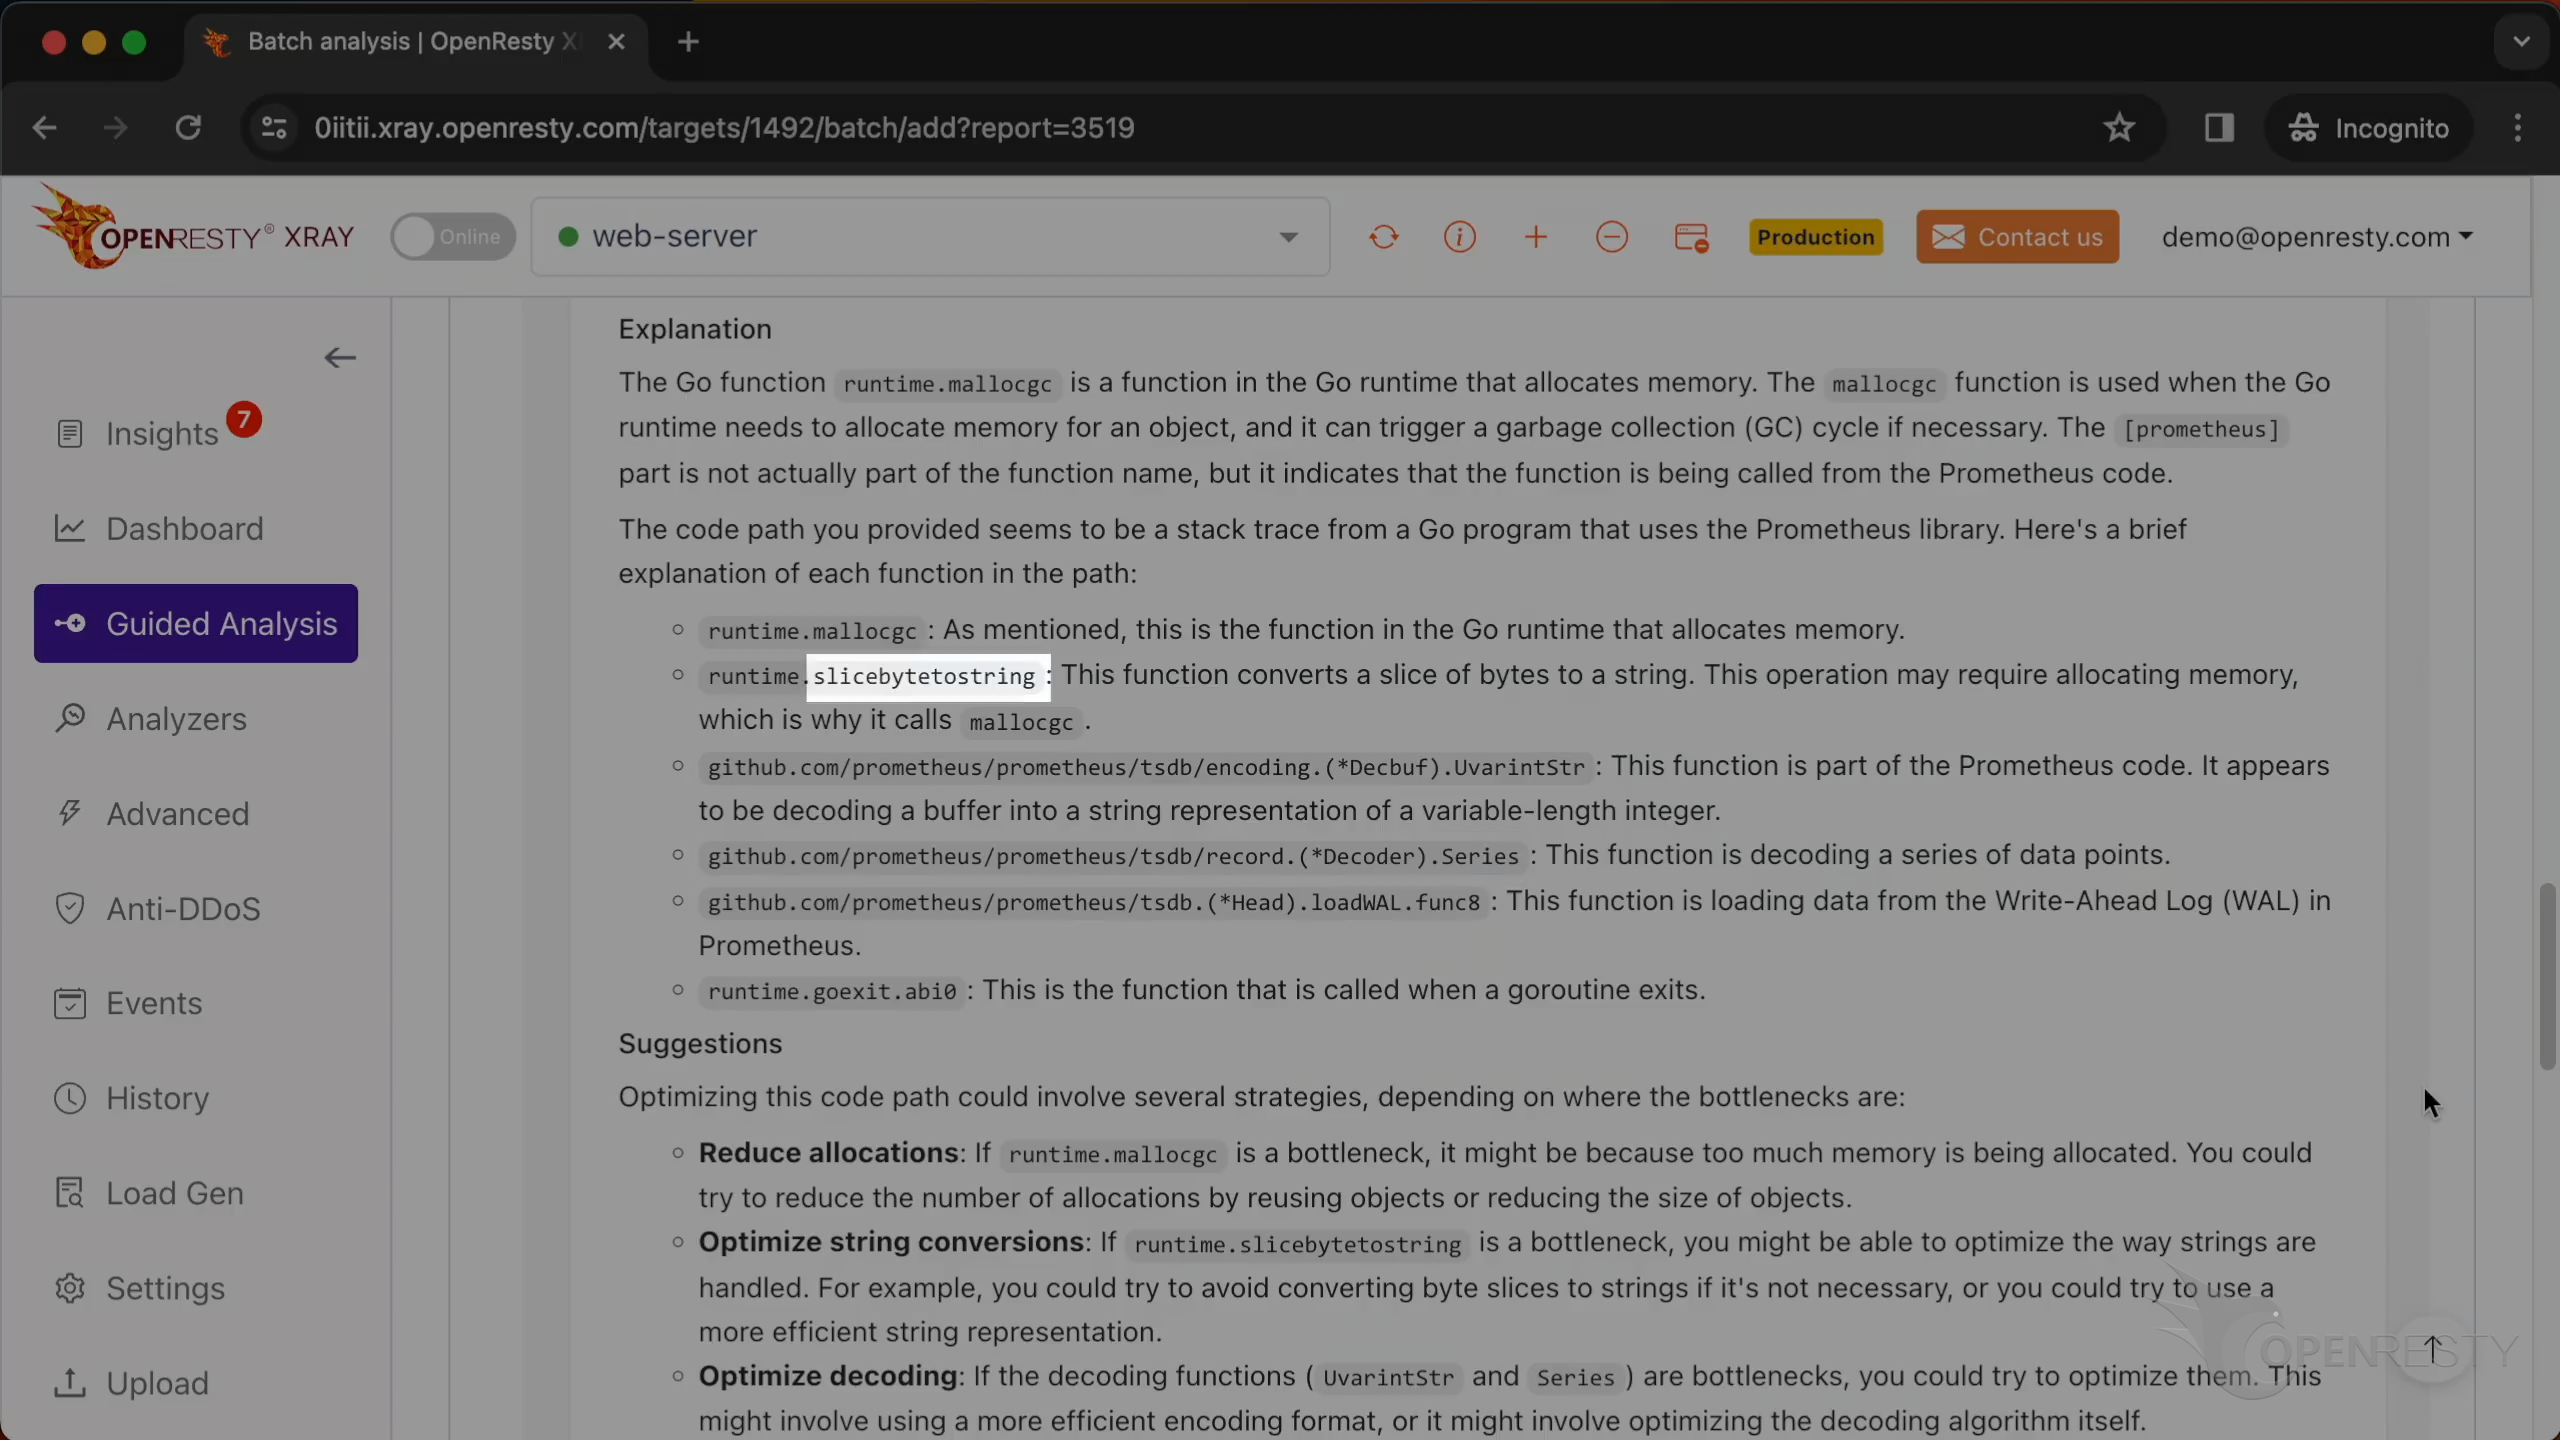
Let’s go back to the code path. Hover the mouse over the green box for the function loadWAL.
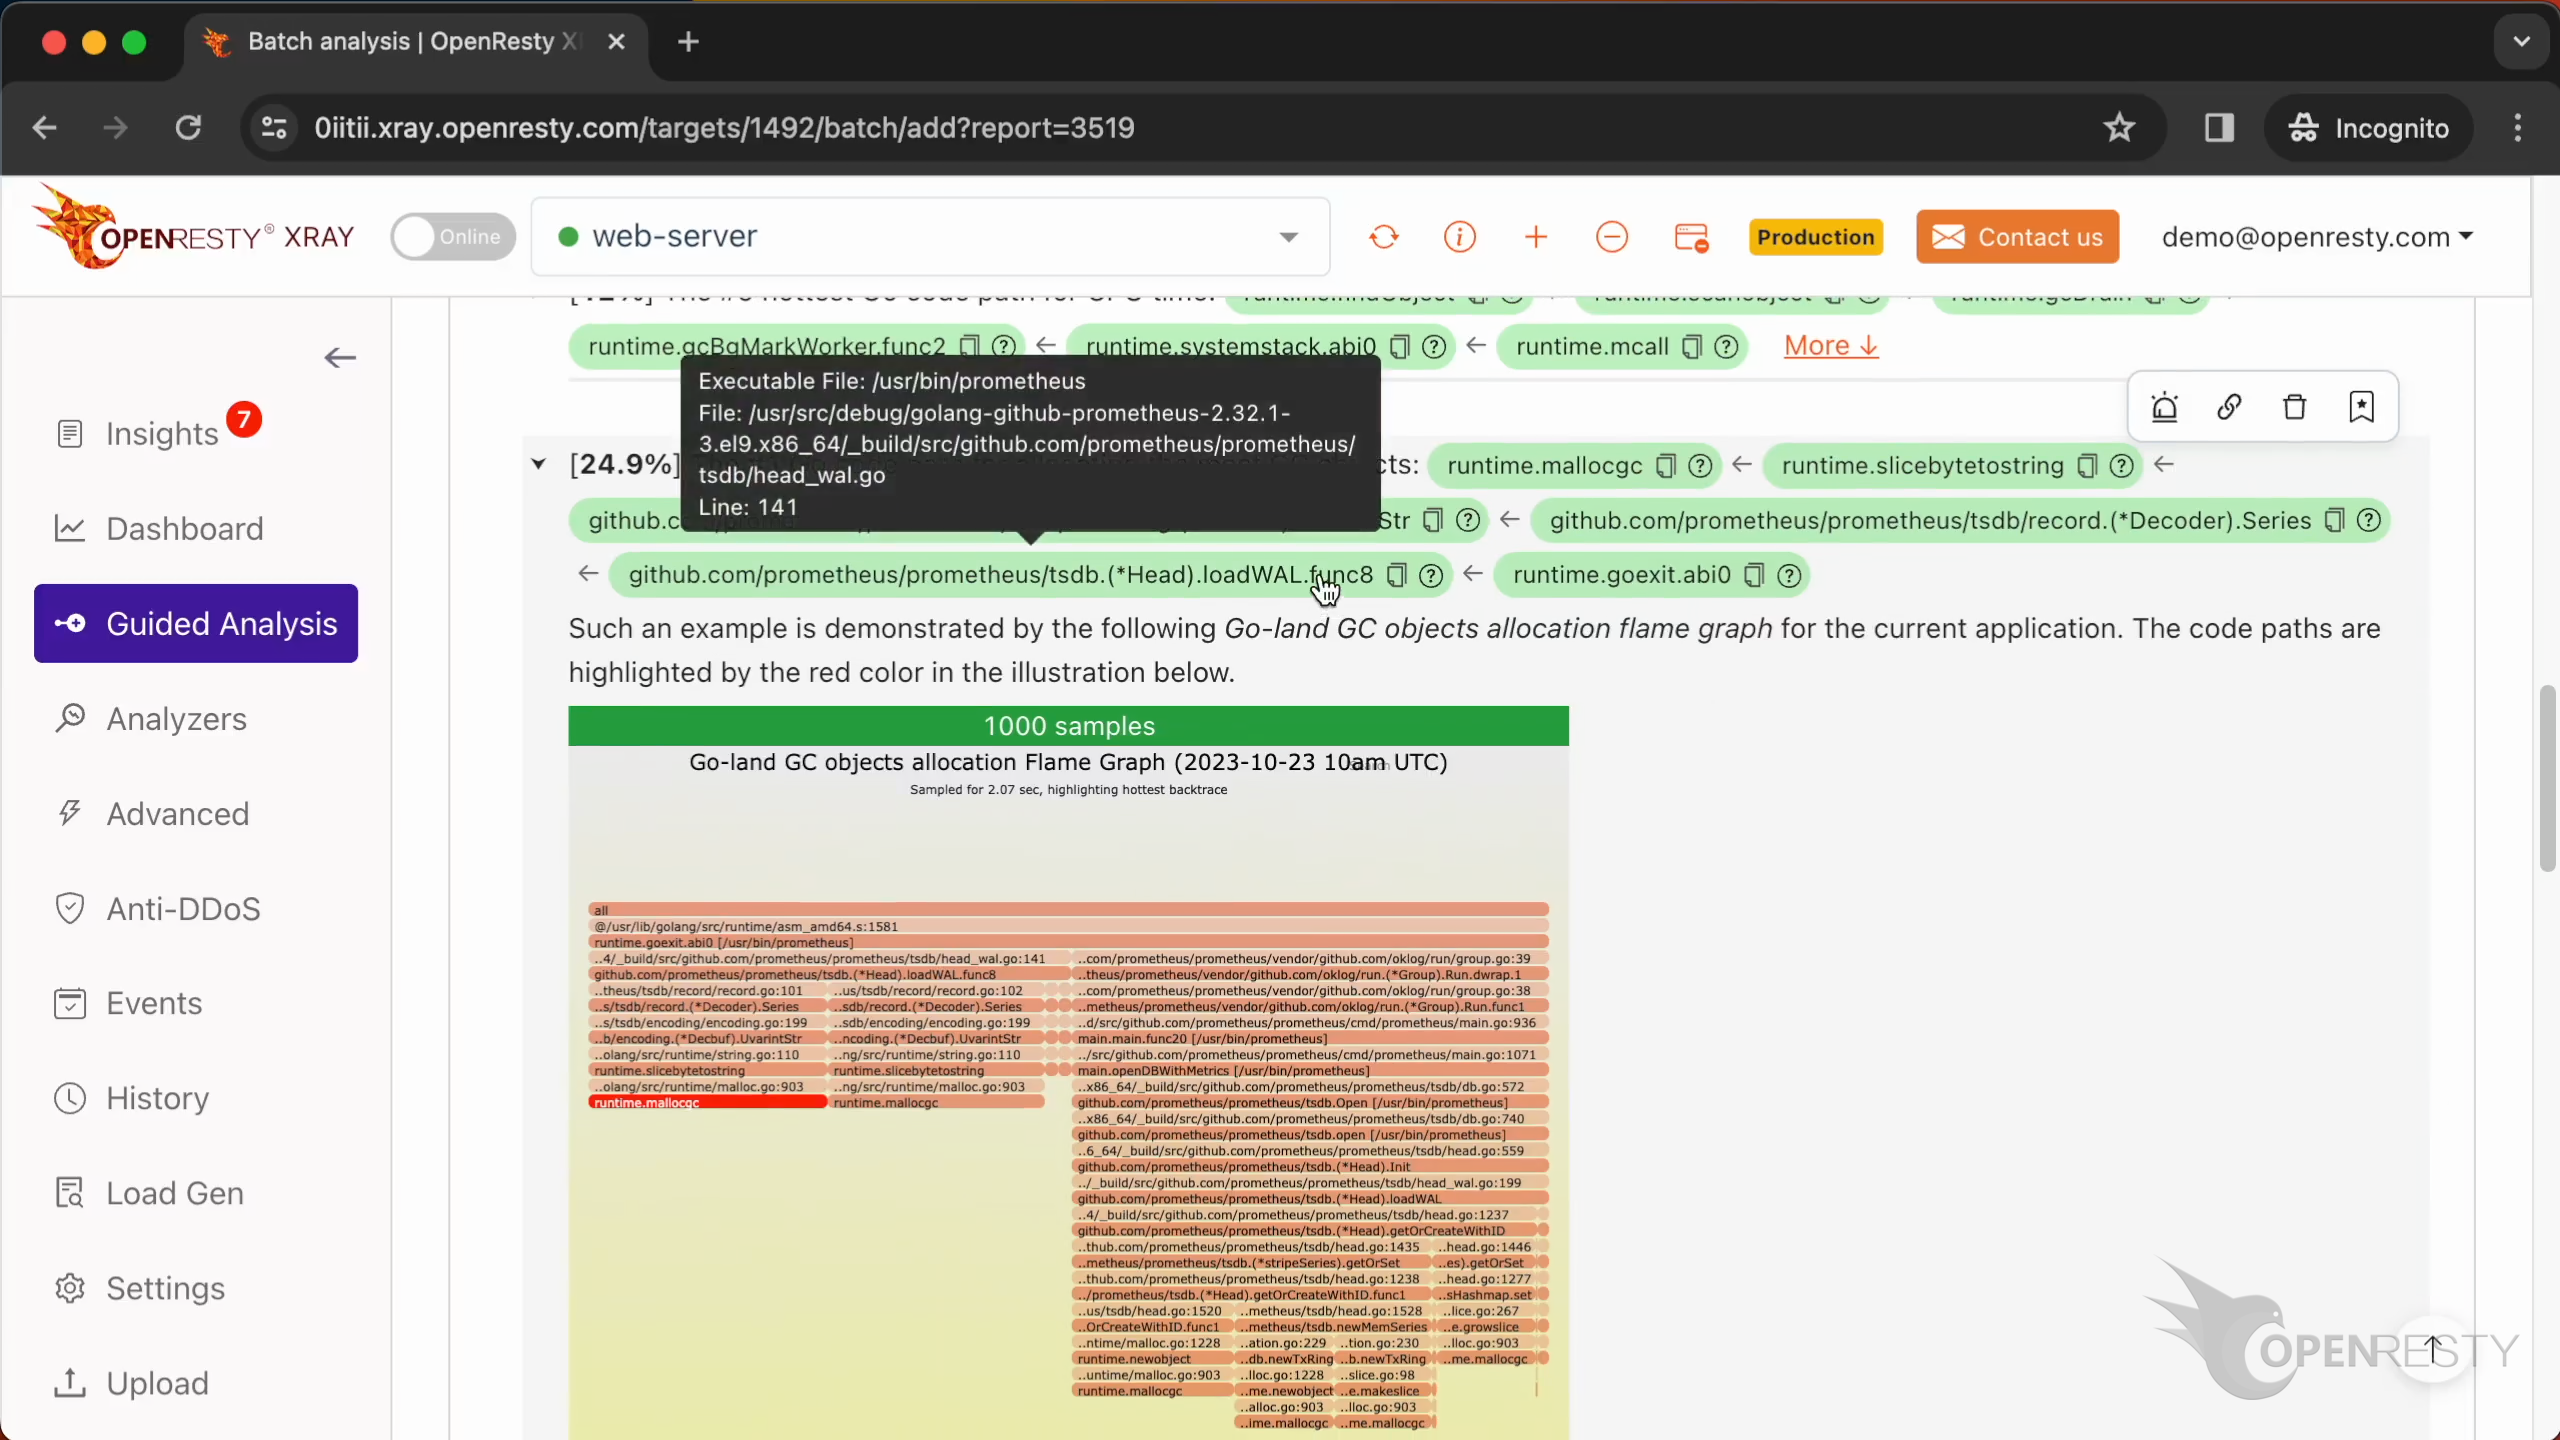
We can see its source file and the full path for this file in the tooltip.
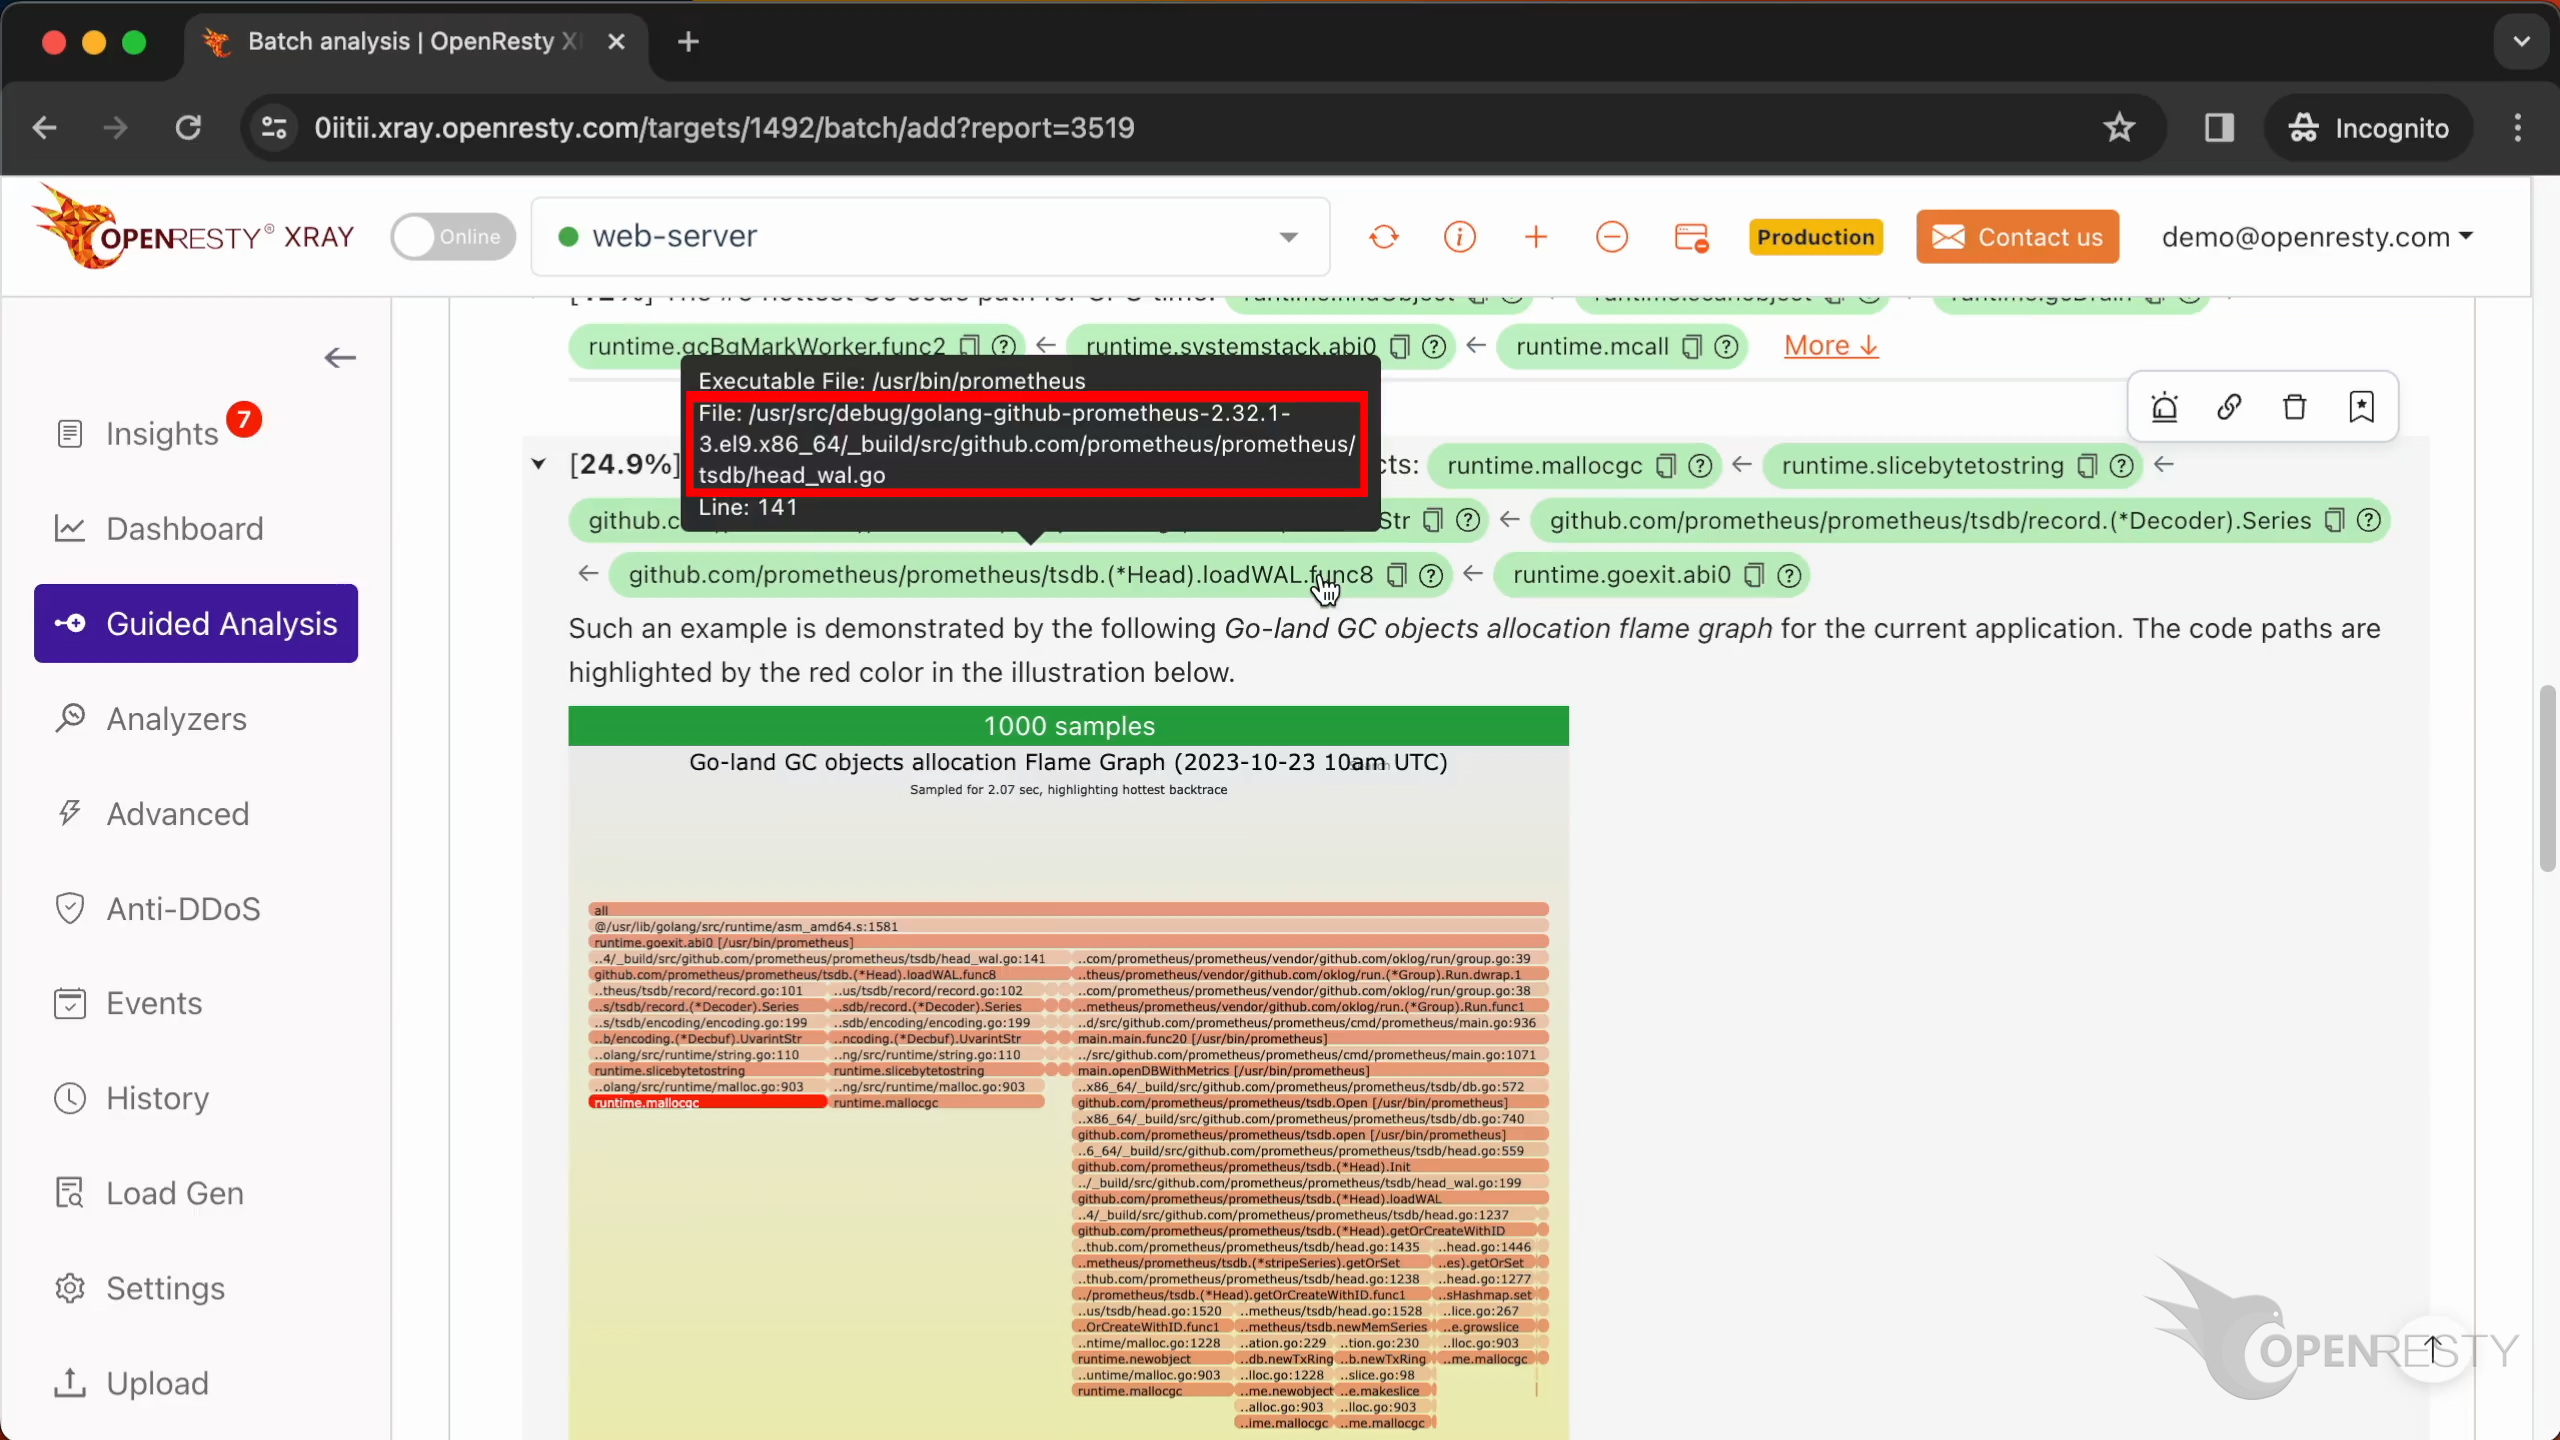
The source line number is 141.
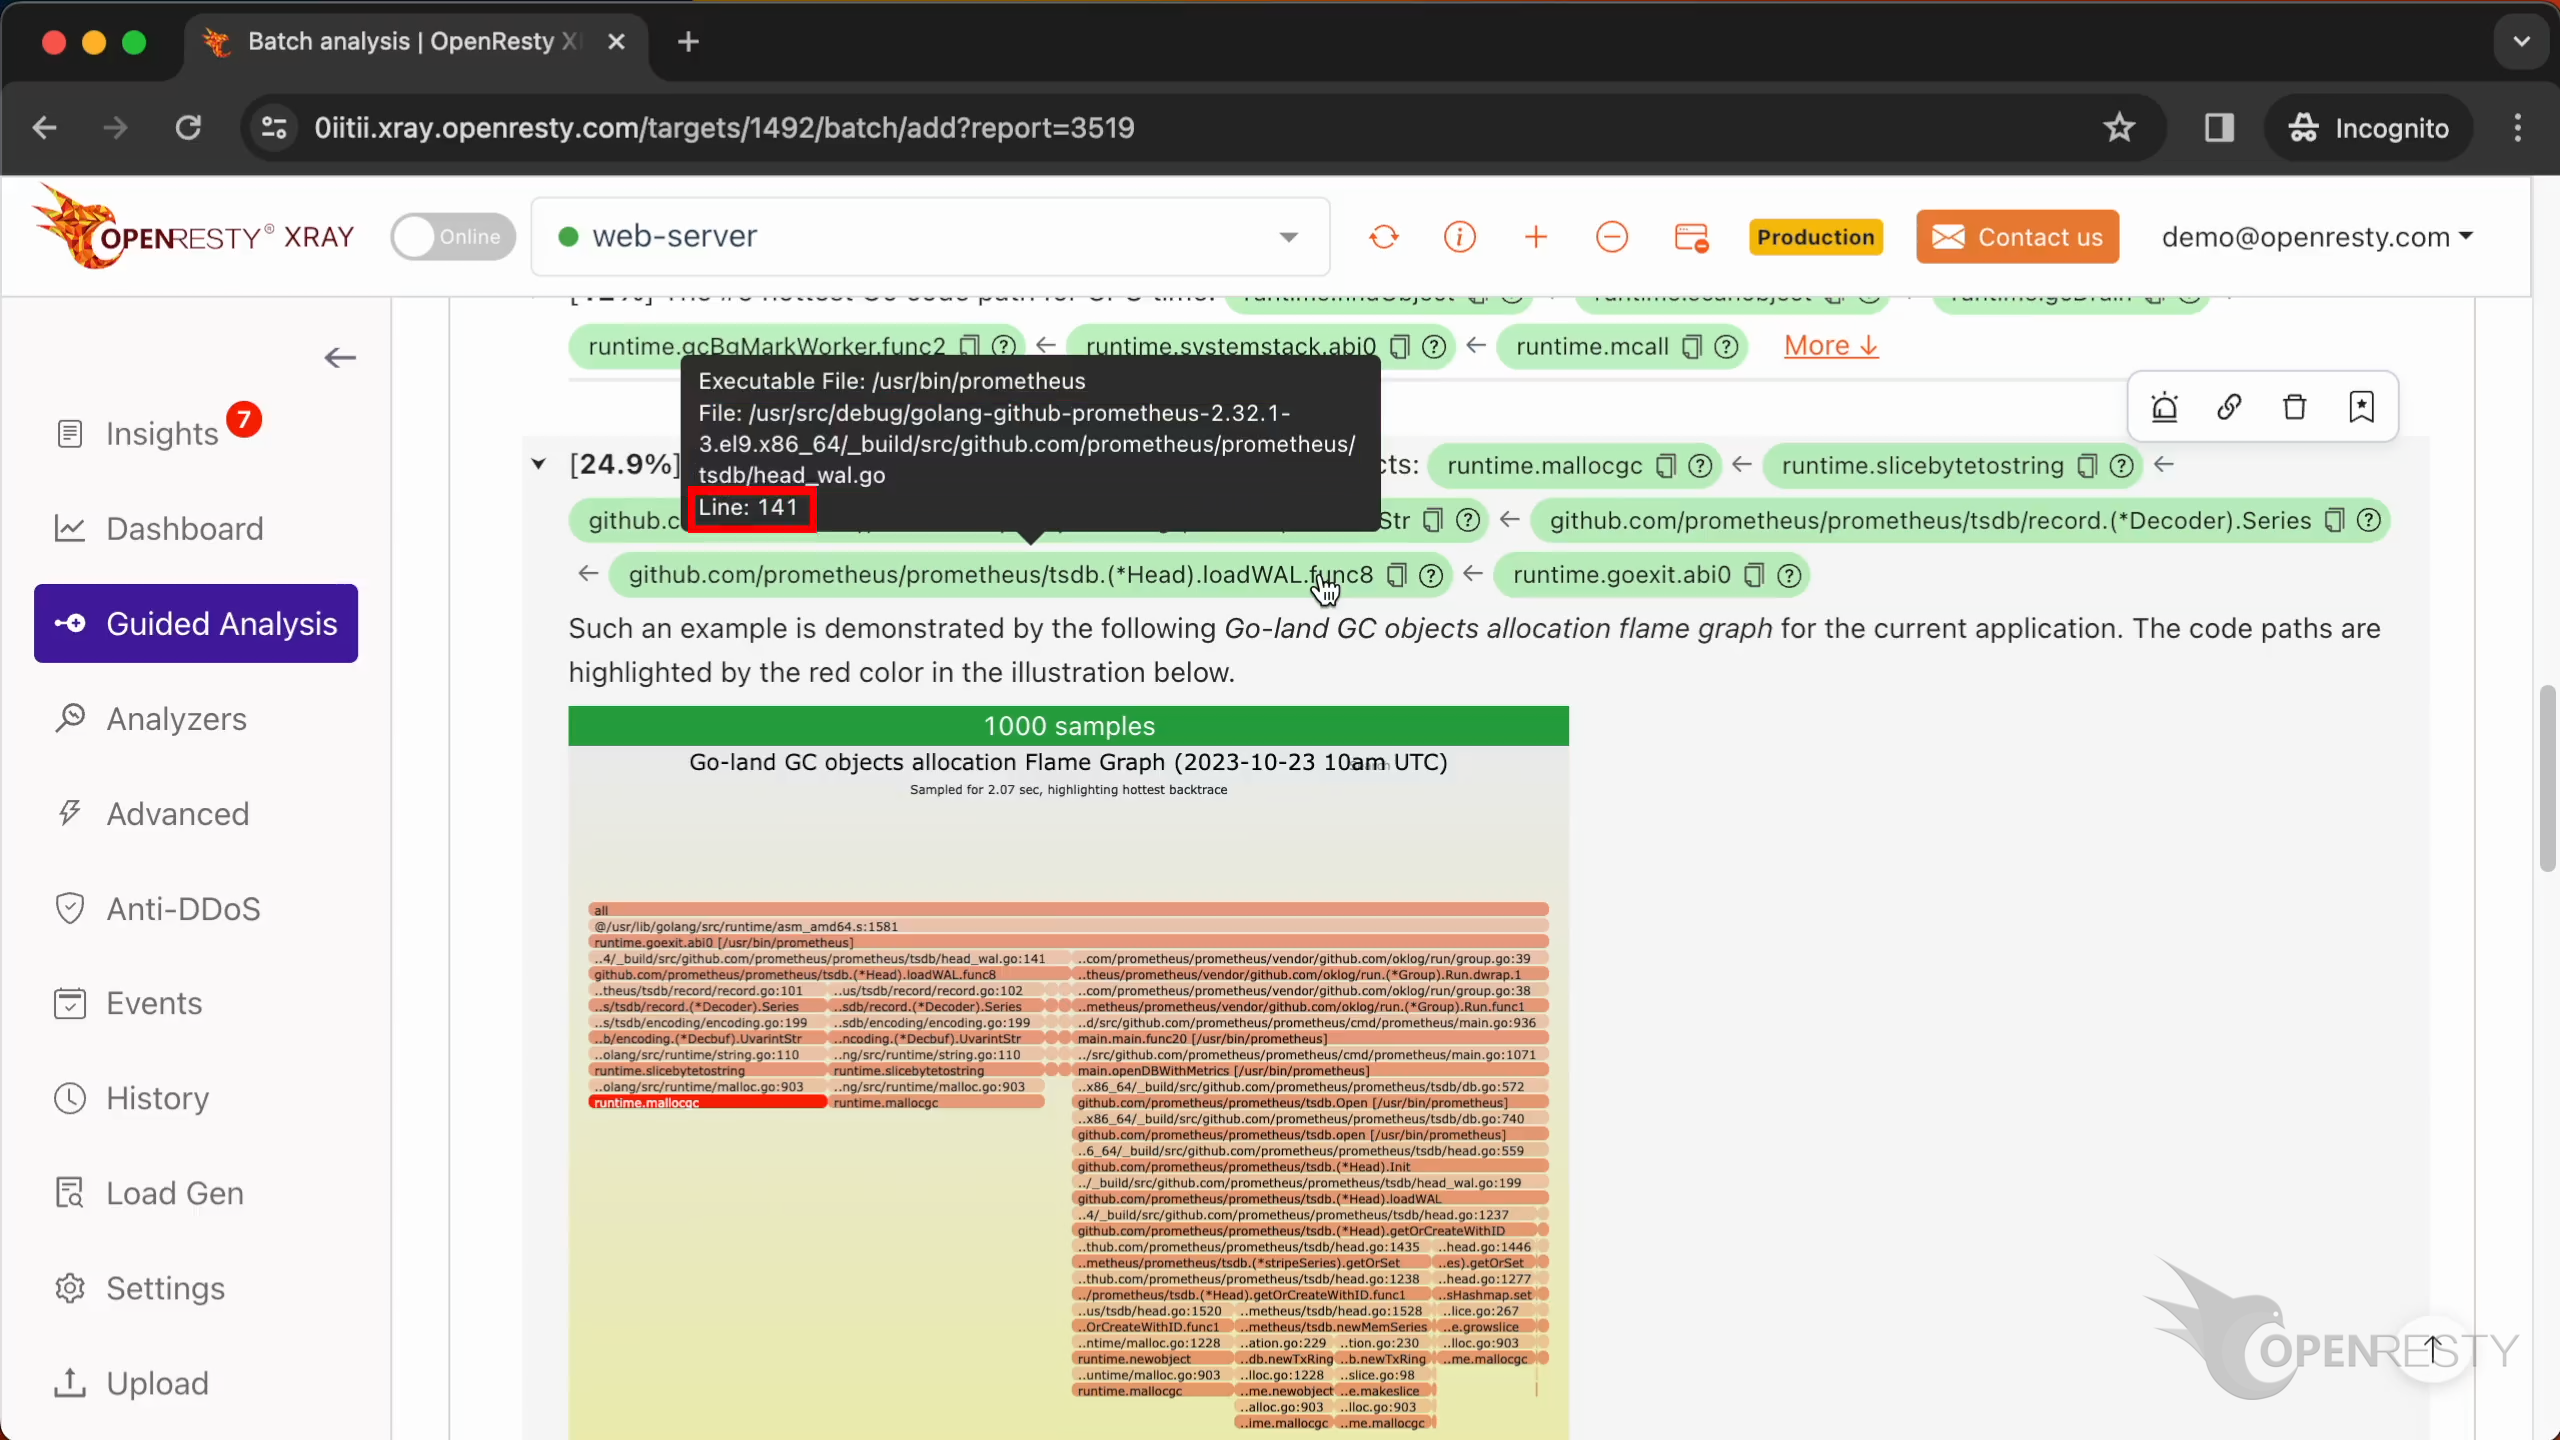
Click the icon to copy the full Go source file path for this function.
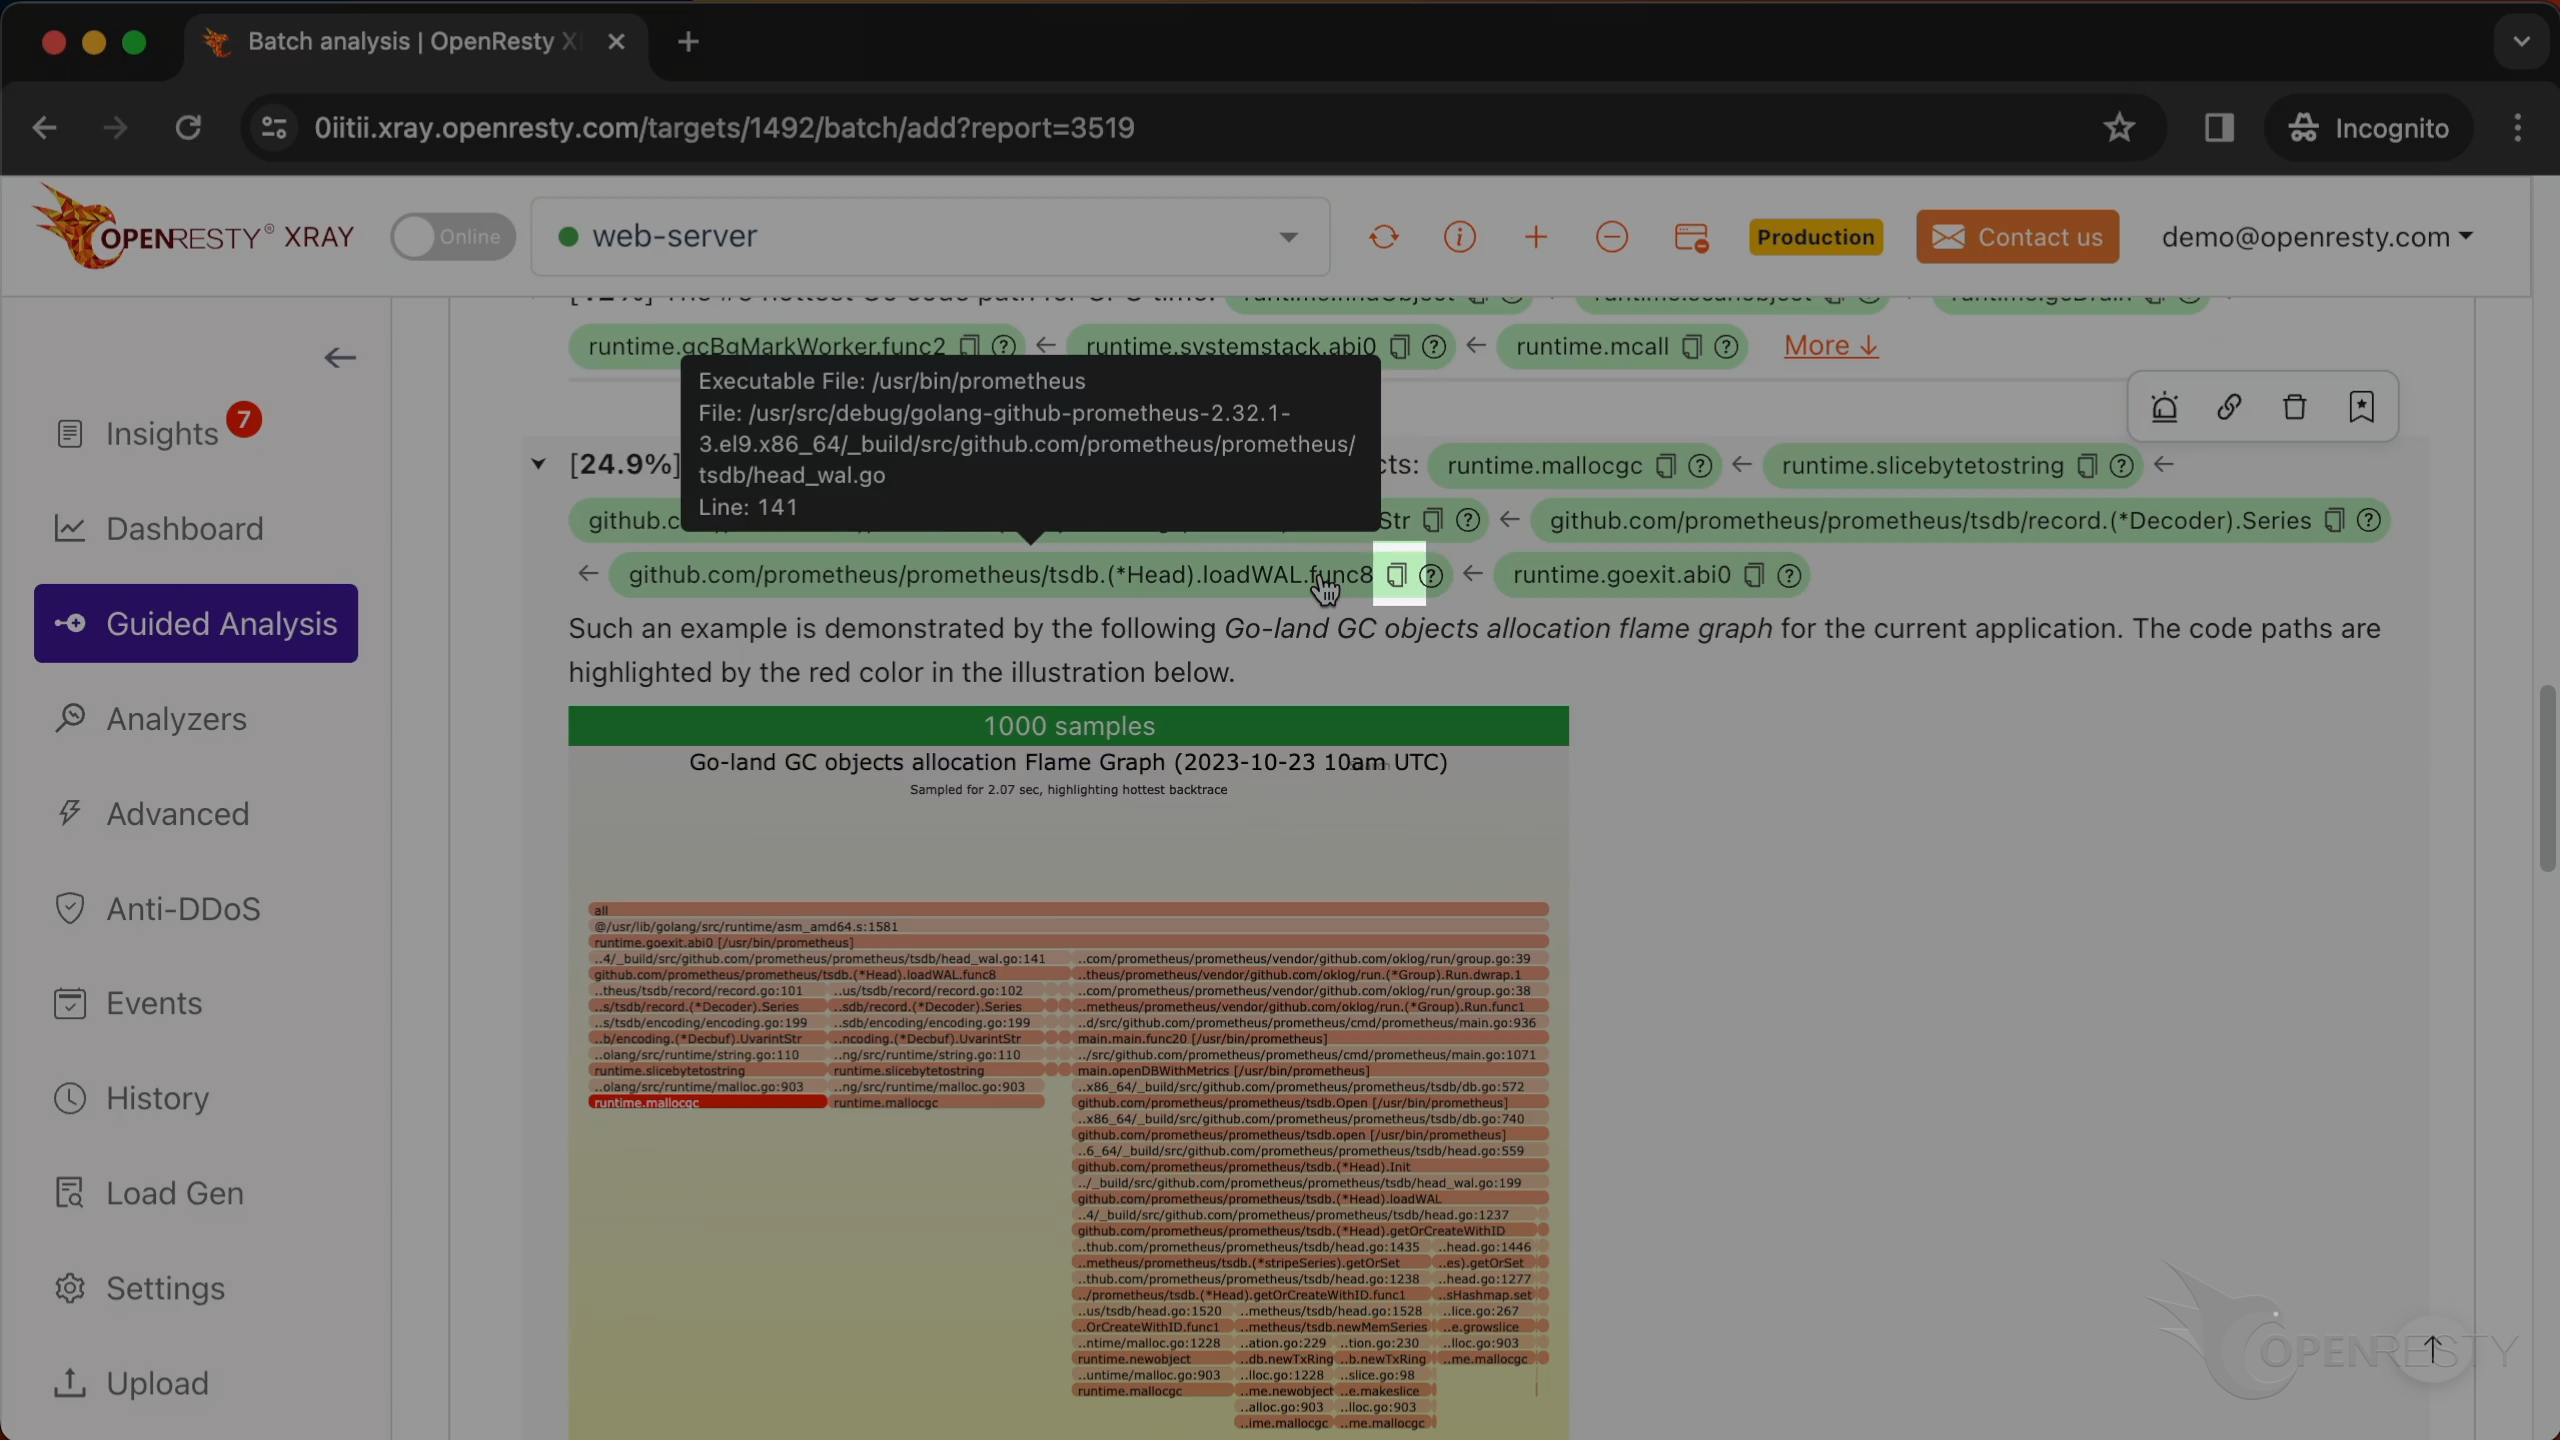
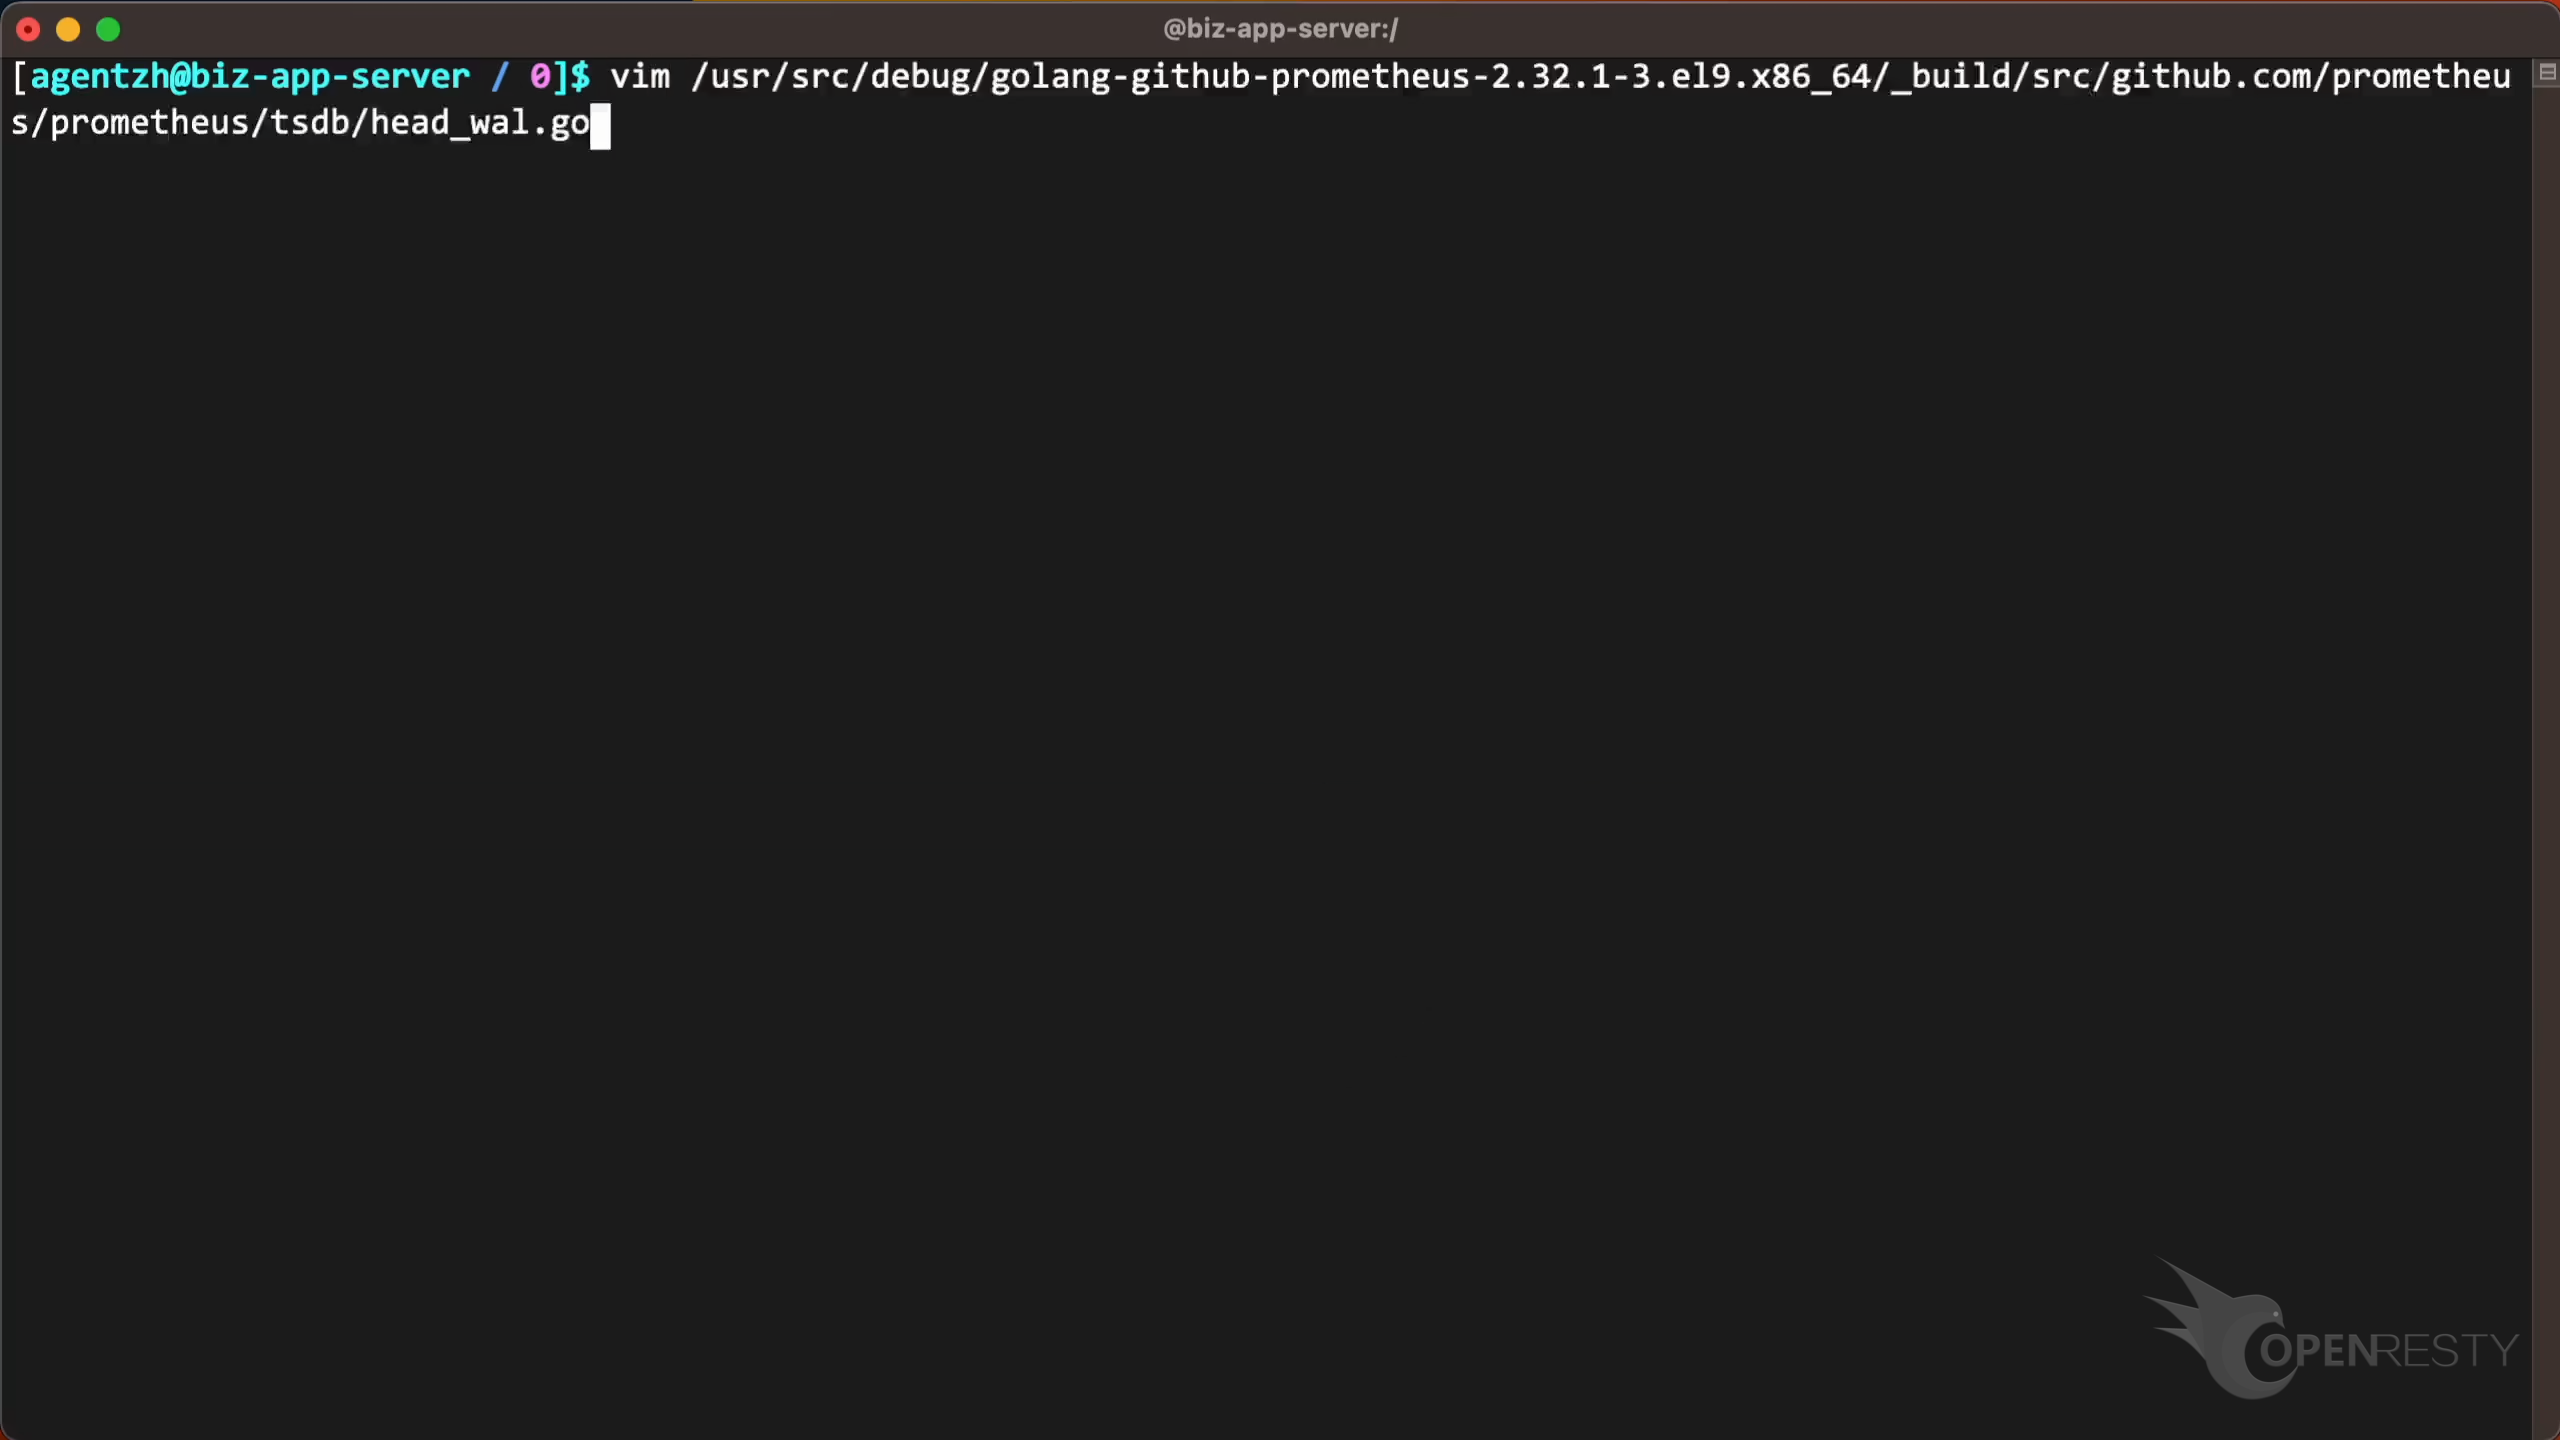
Use the vim editor to open the source file. And look at the golang code in this file. You can use any editors you like.
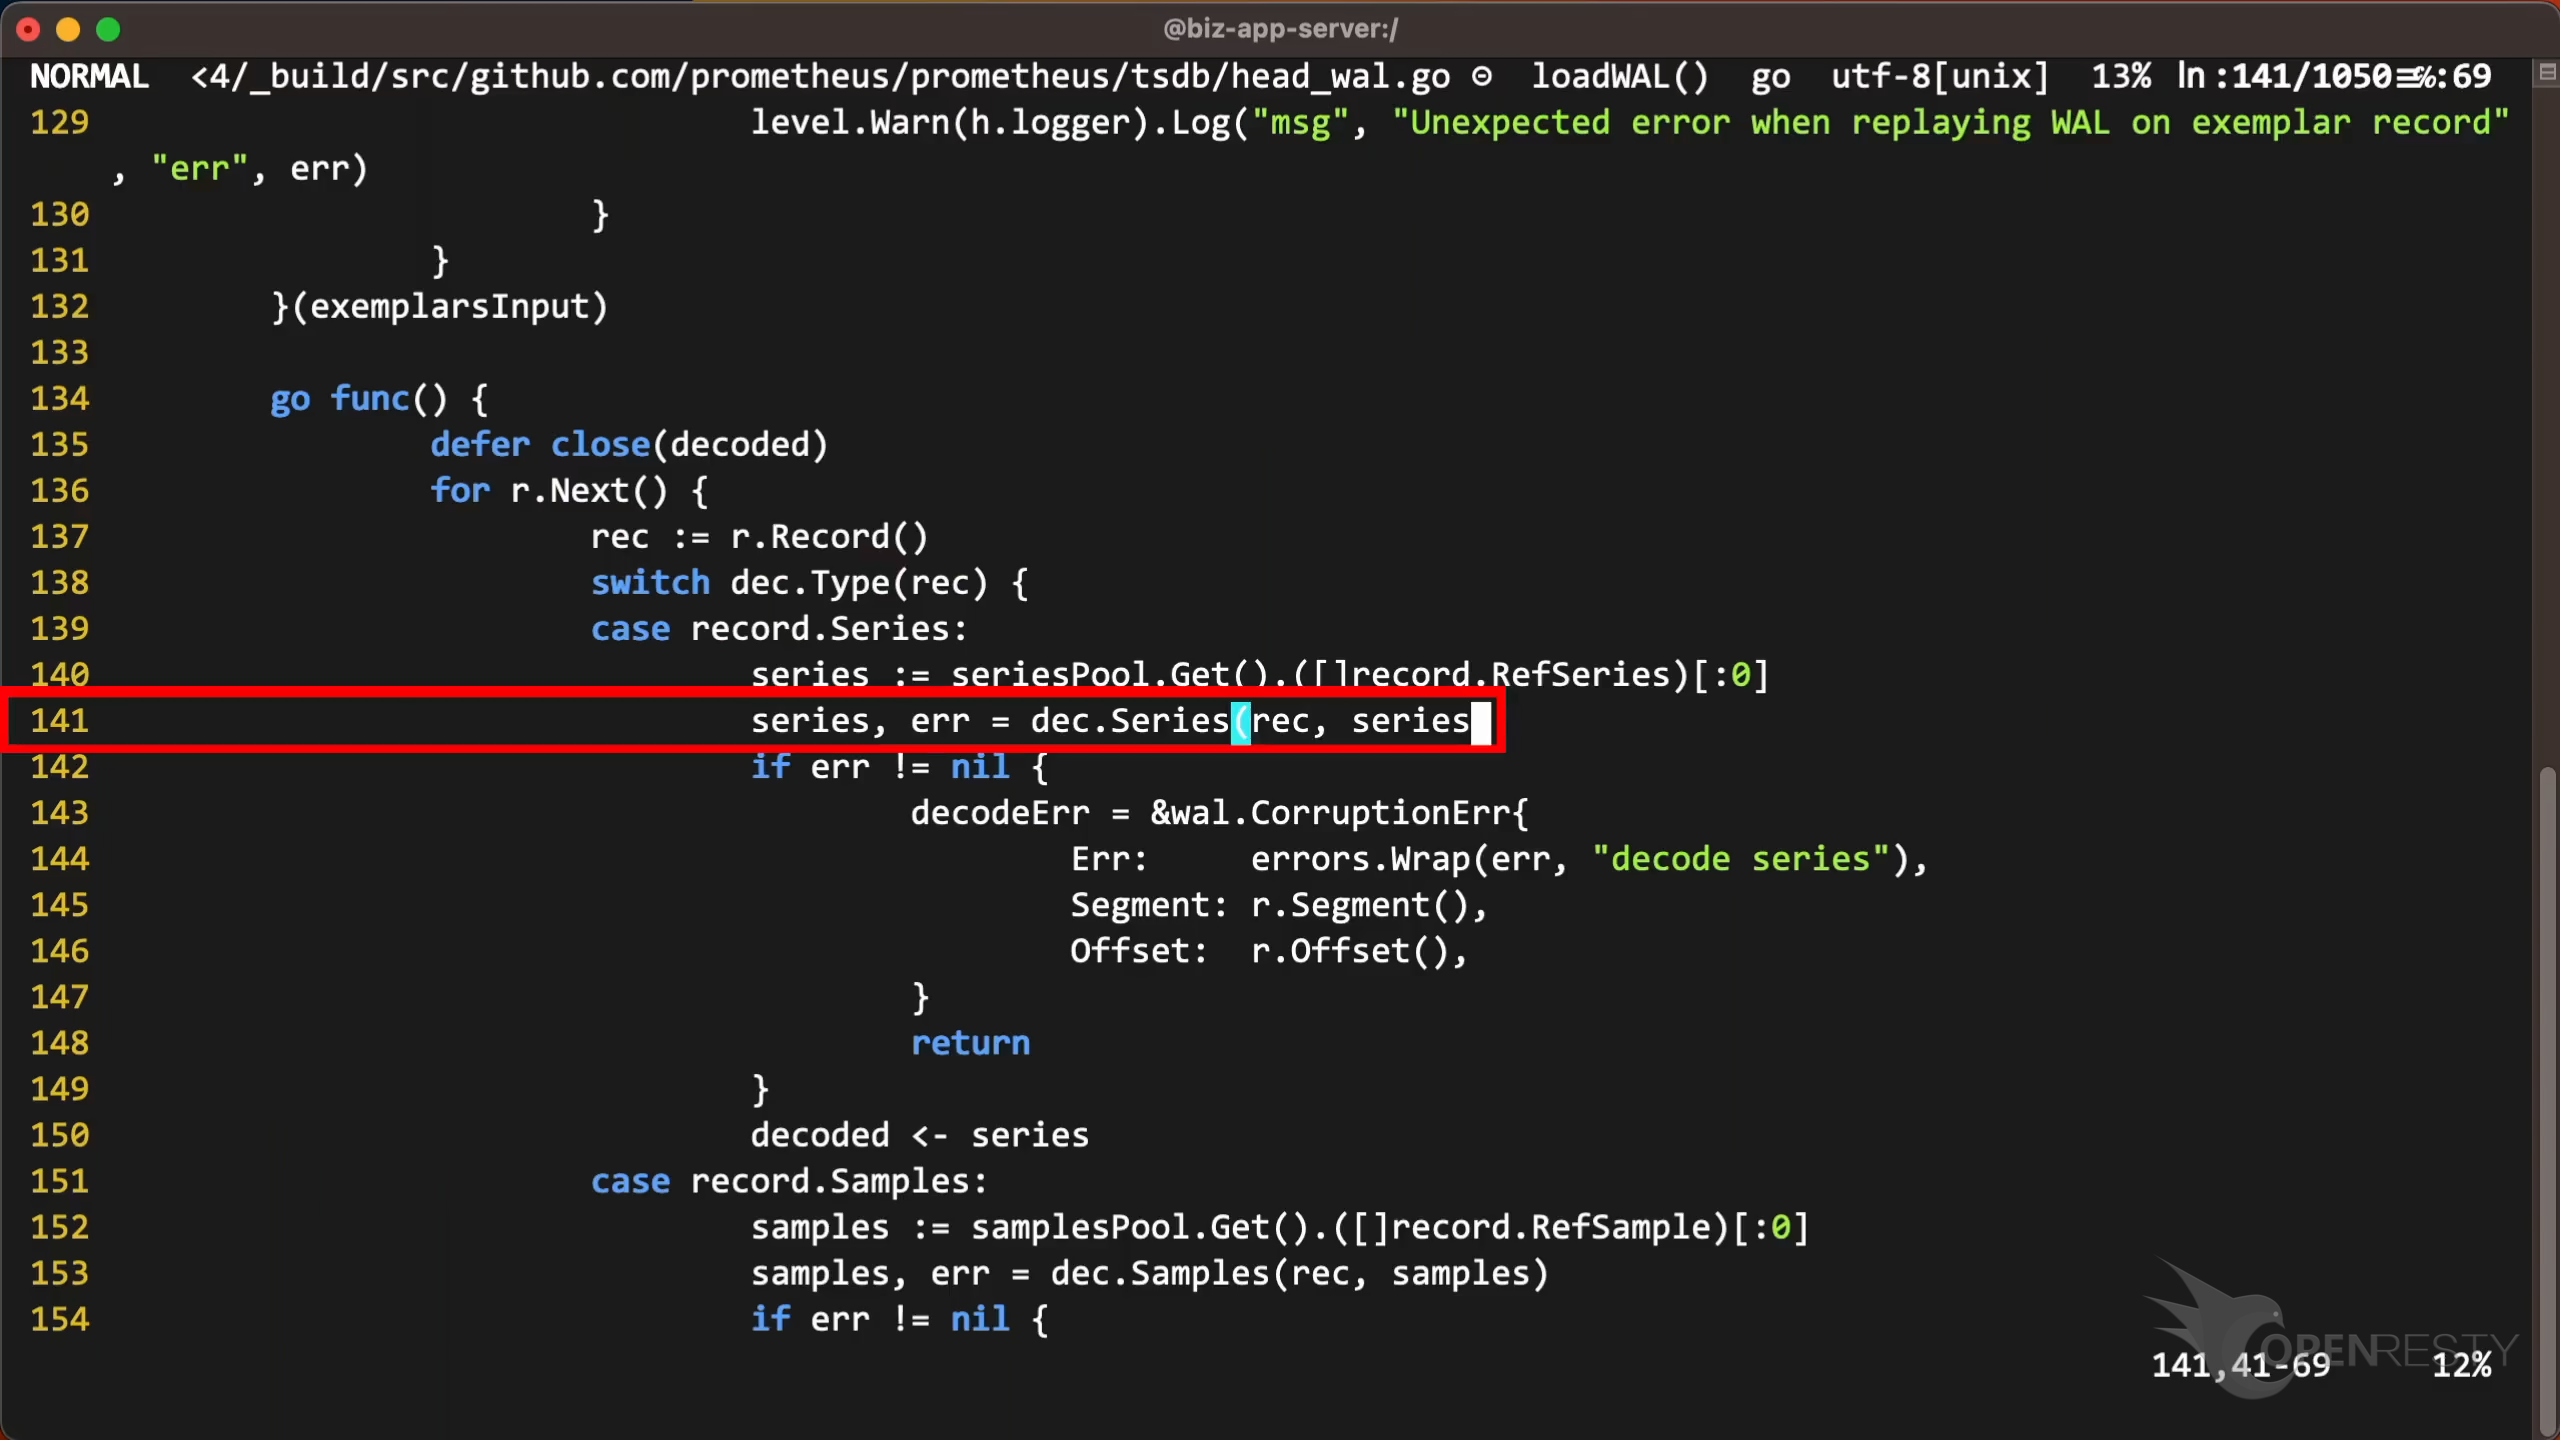
Go to line 141, as OpenResty XRay suggested.
The function dec.Series is to decode a set of time series from a record.
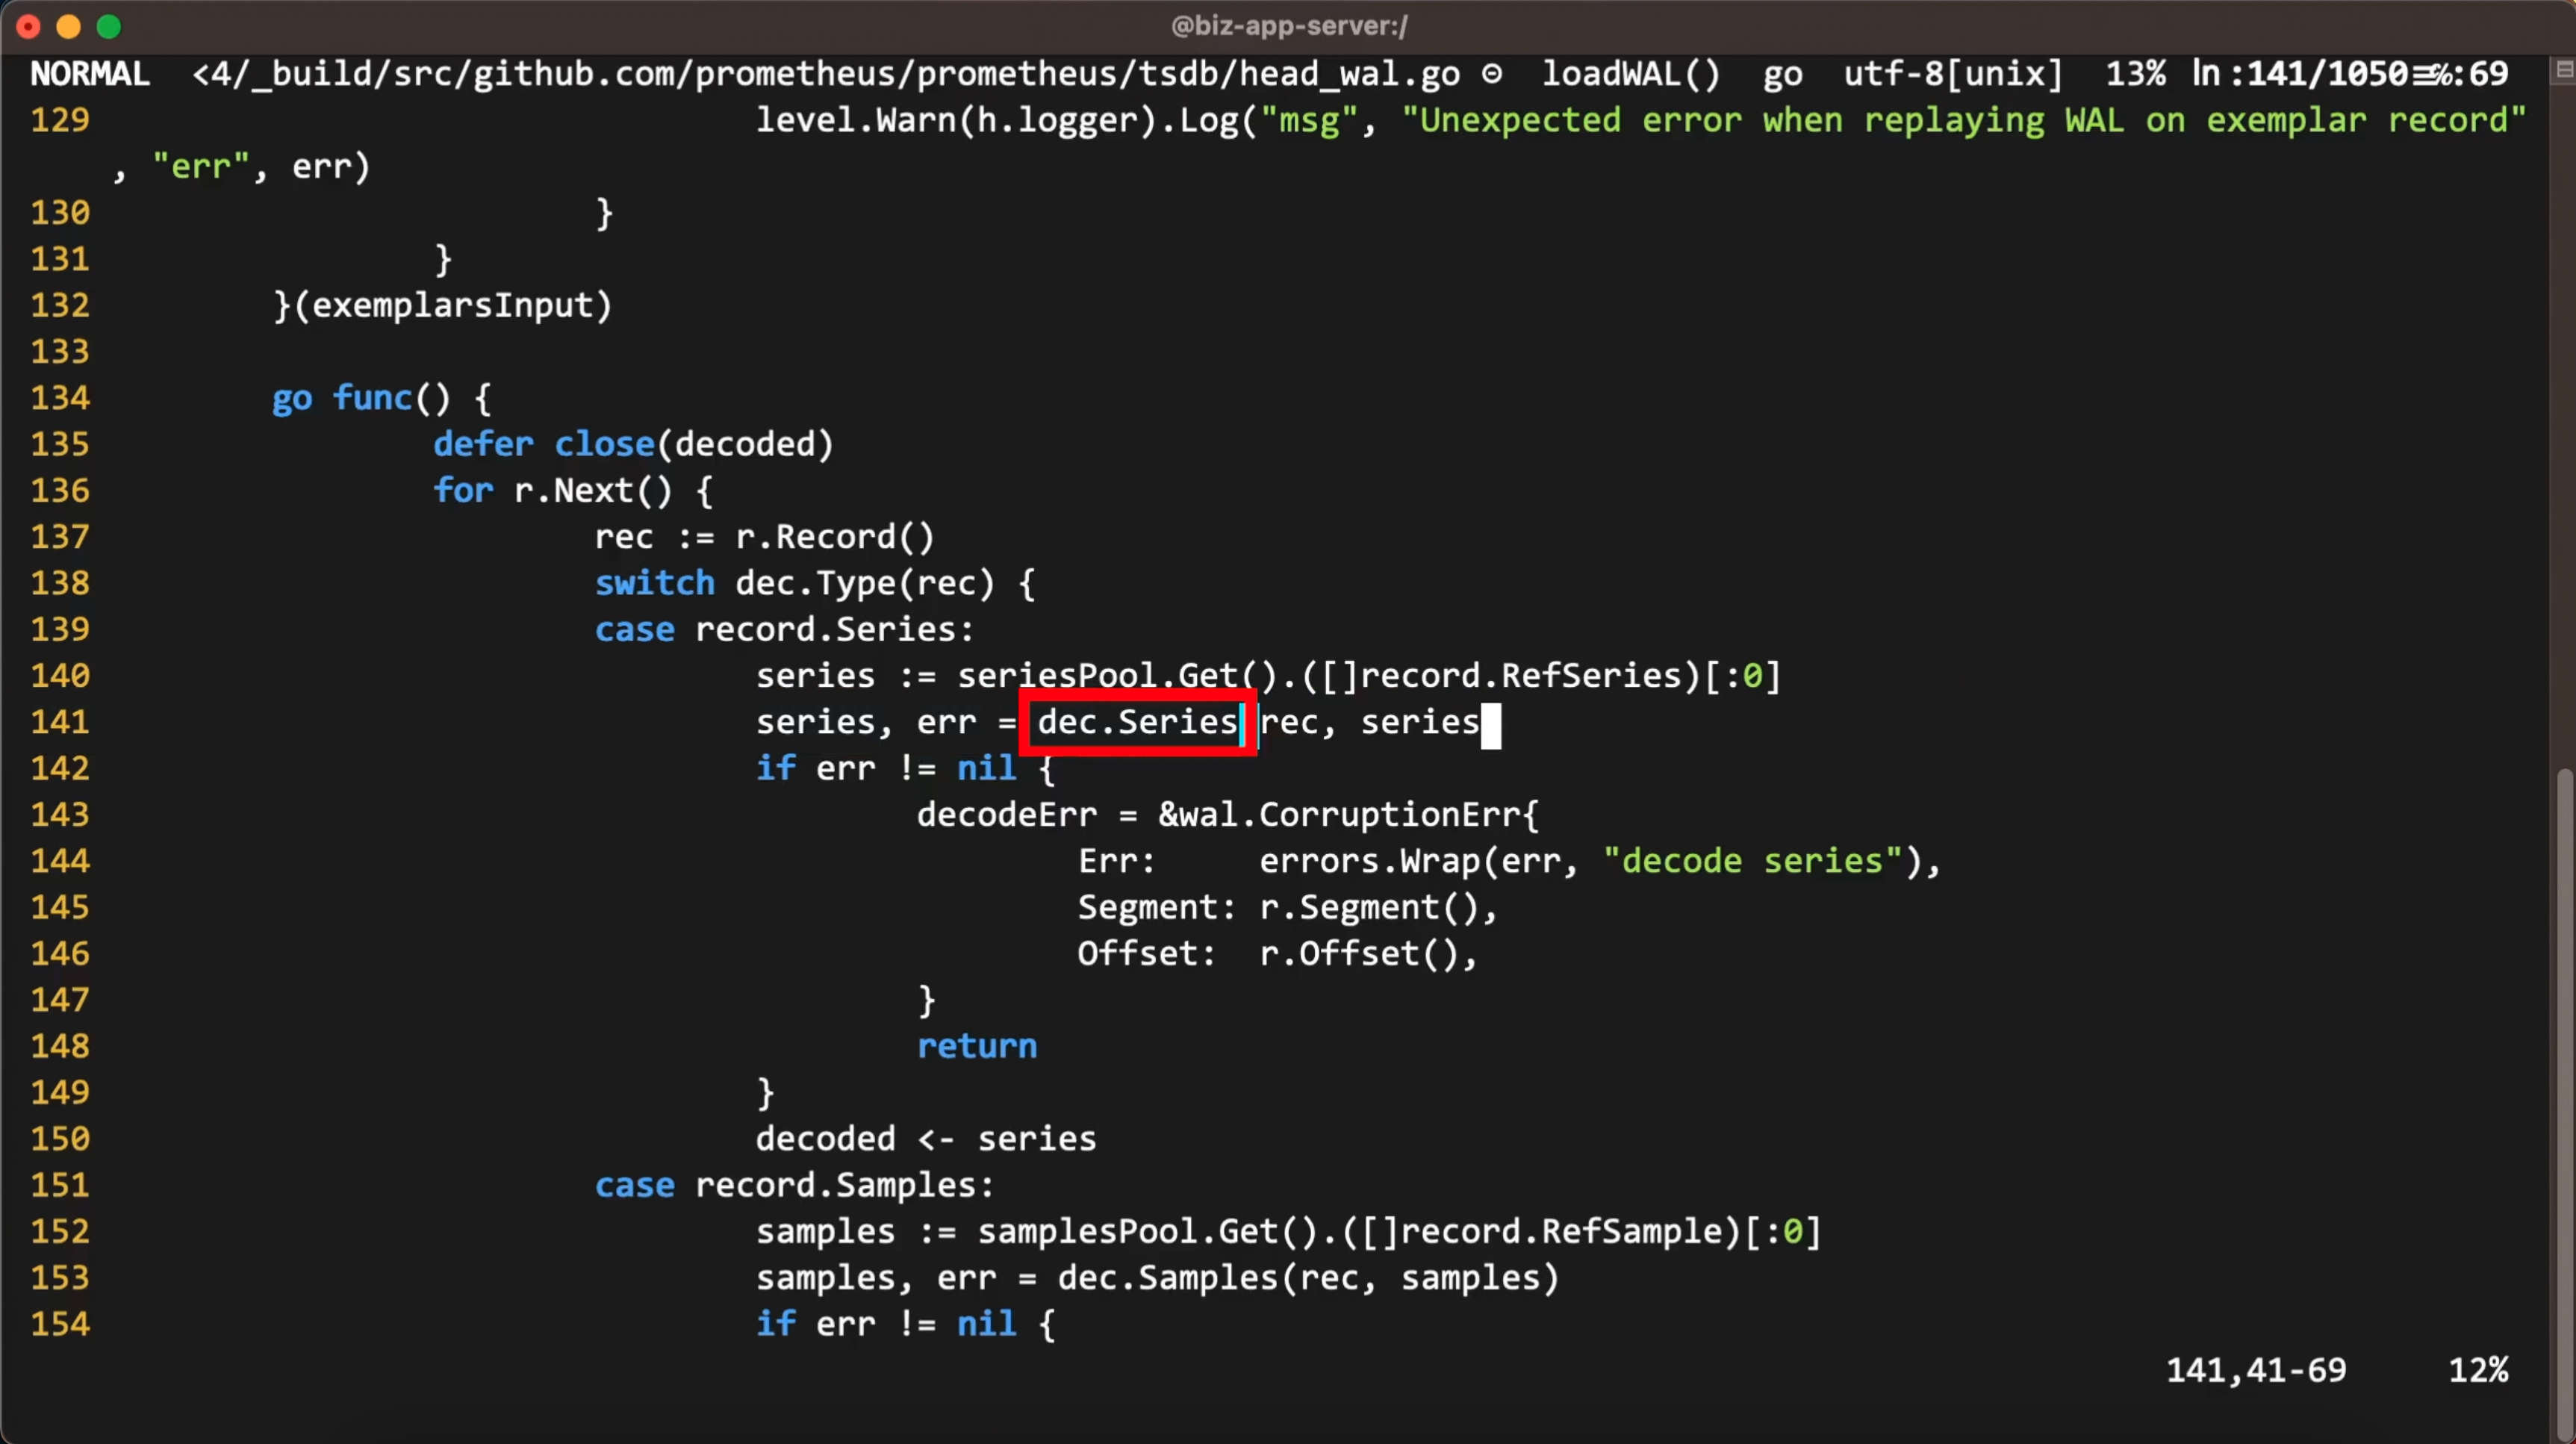
On the status bar, you can see that this source line is inside the loadWAL function as shown in the report.
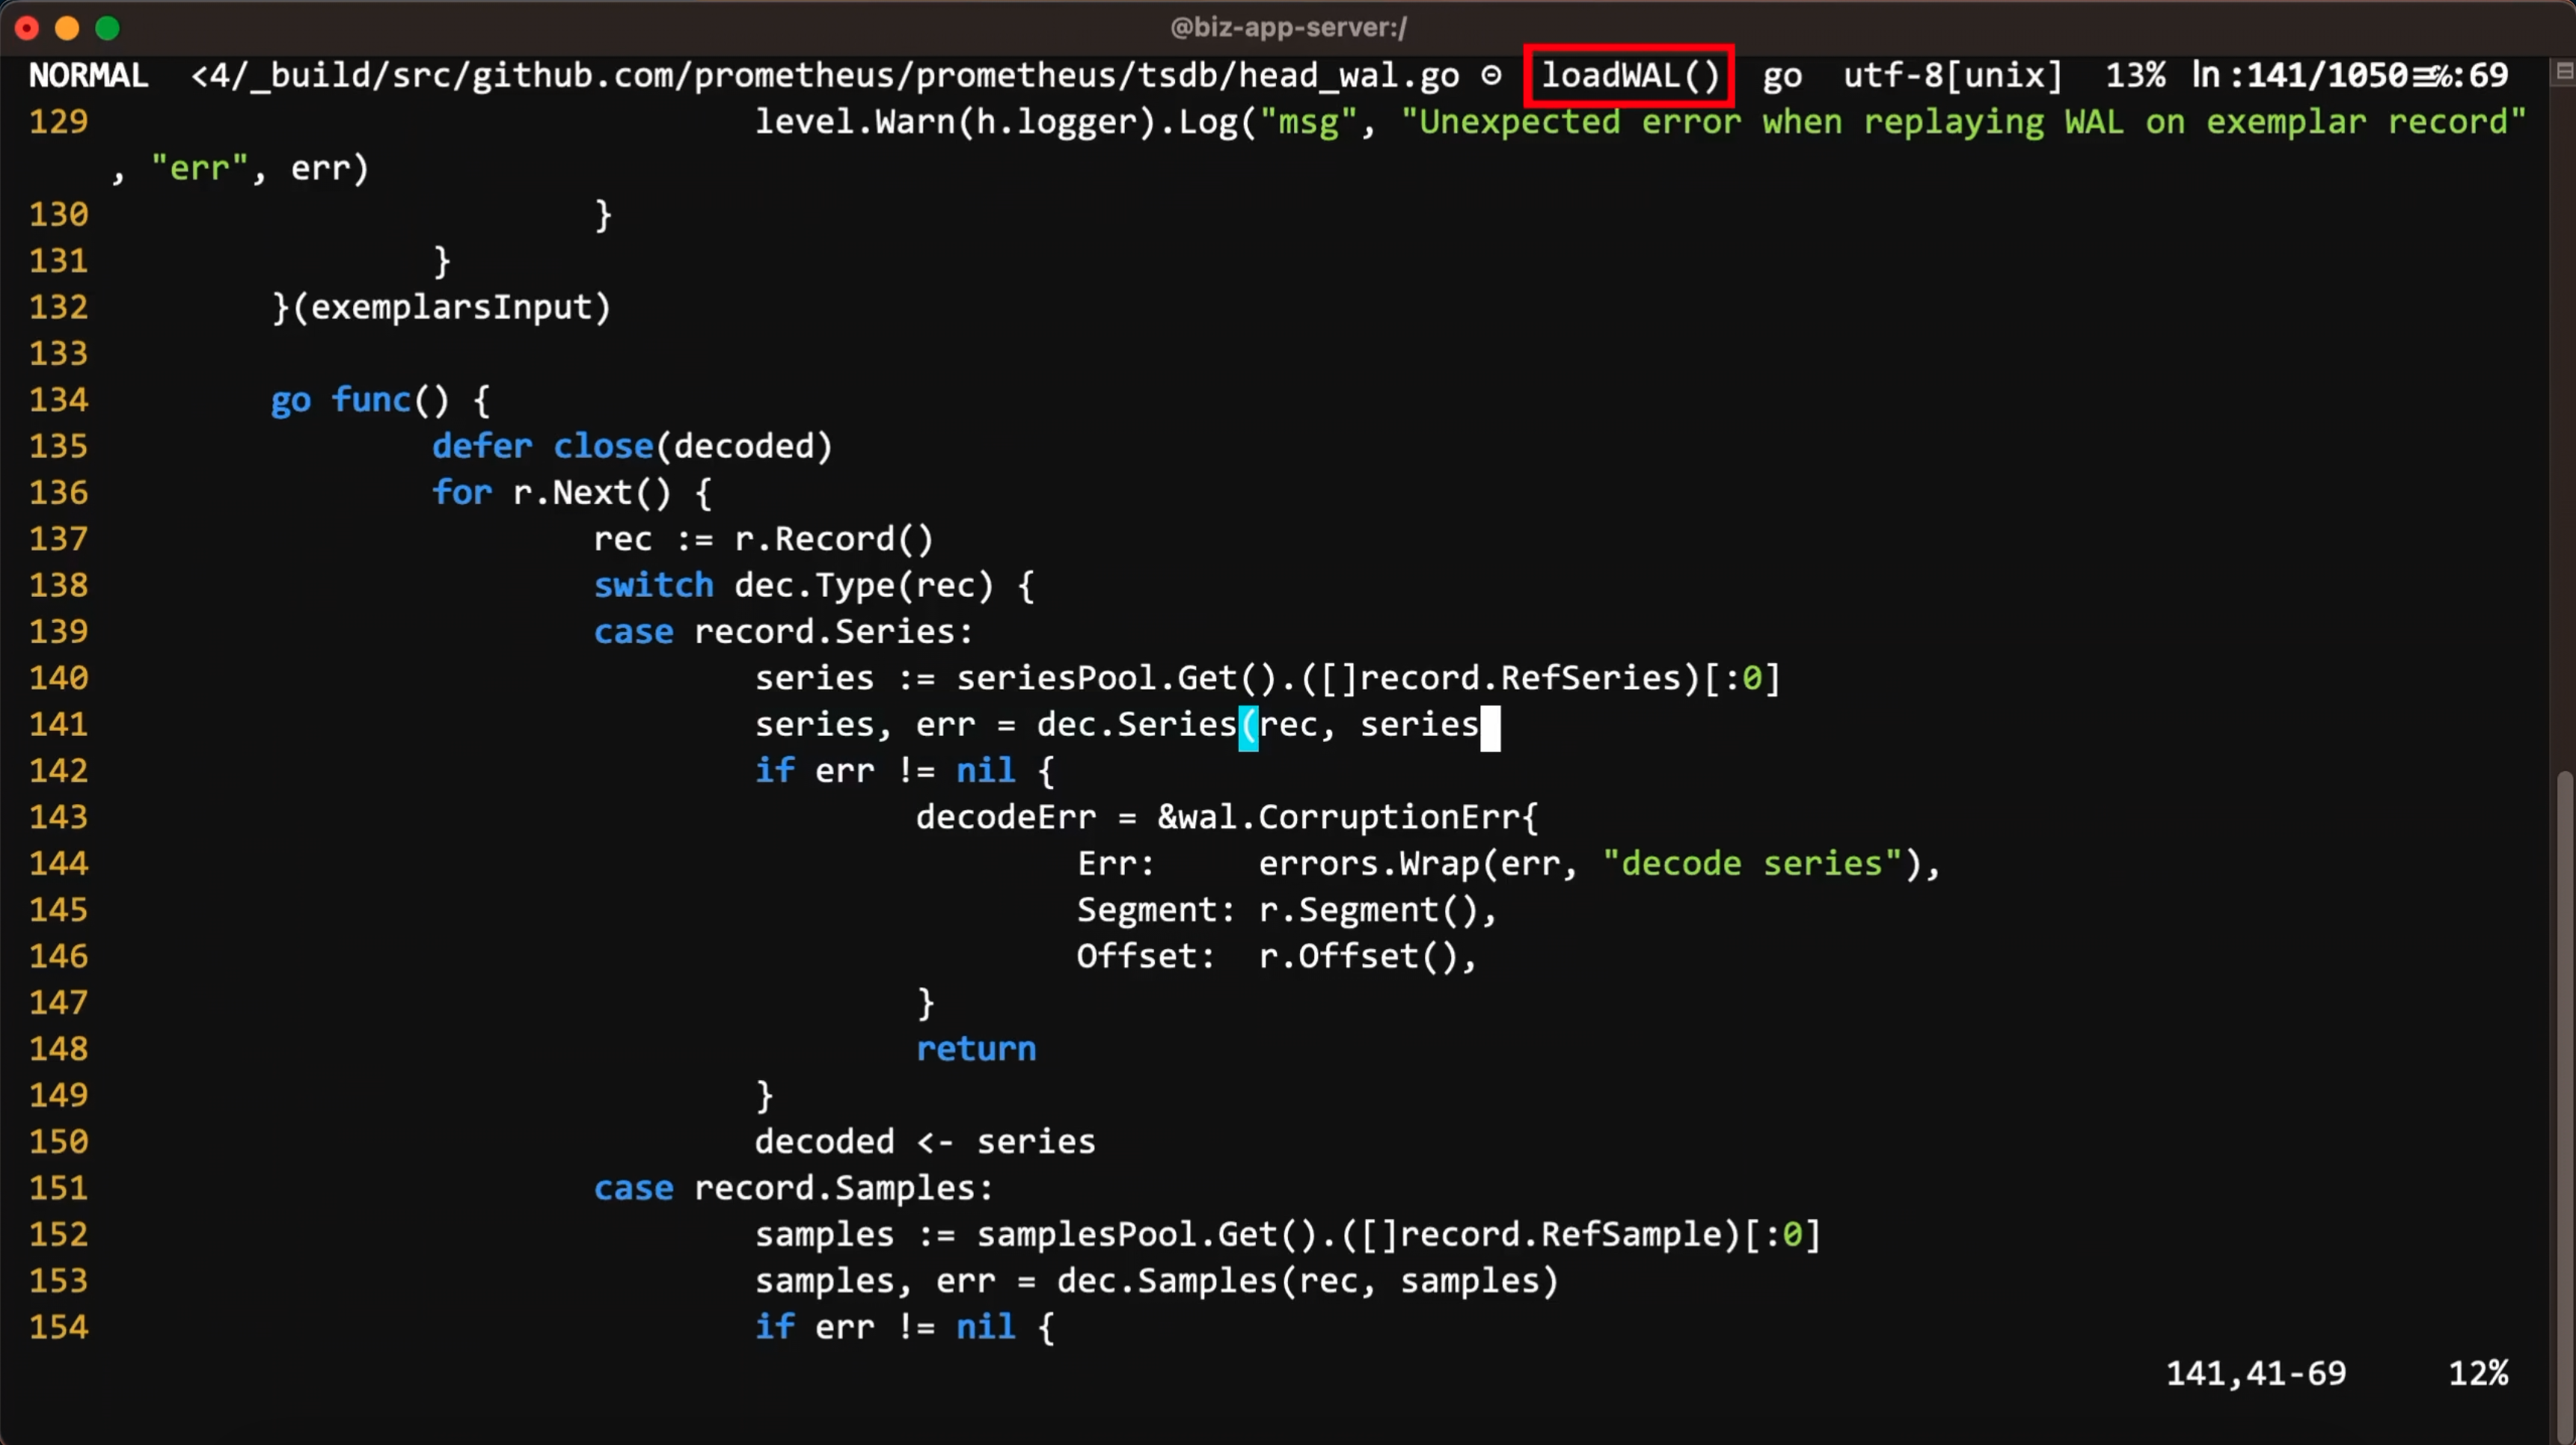
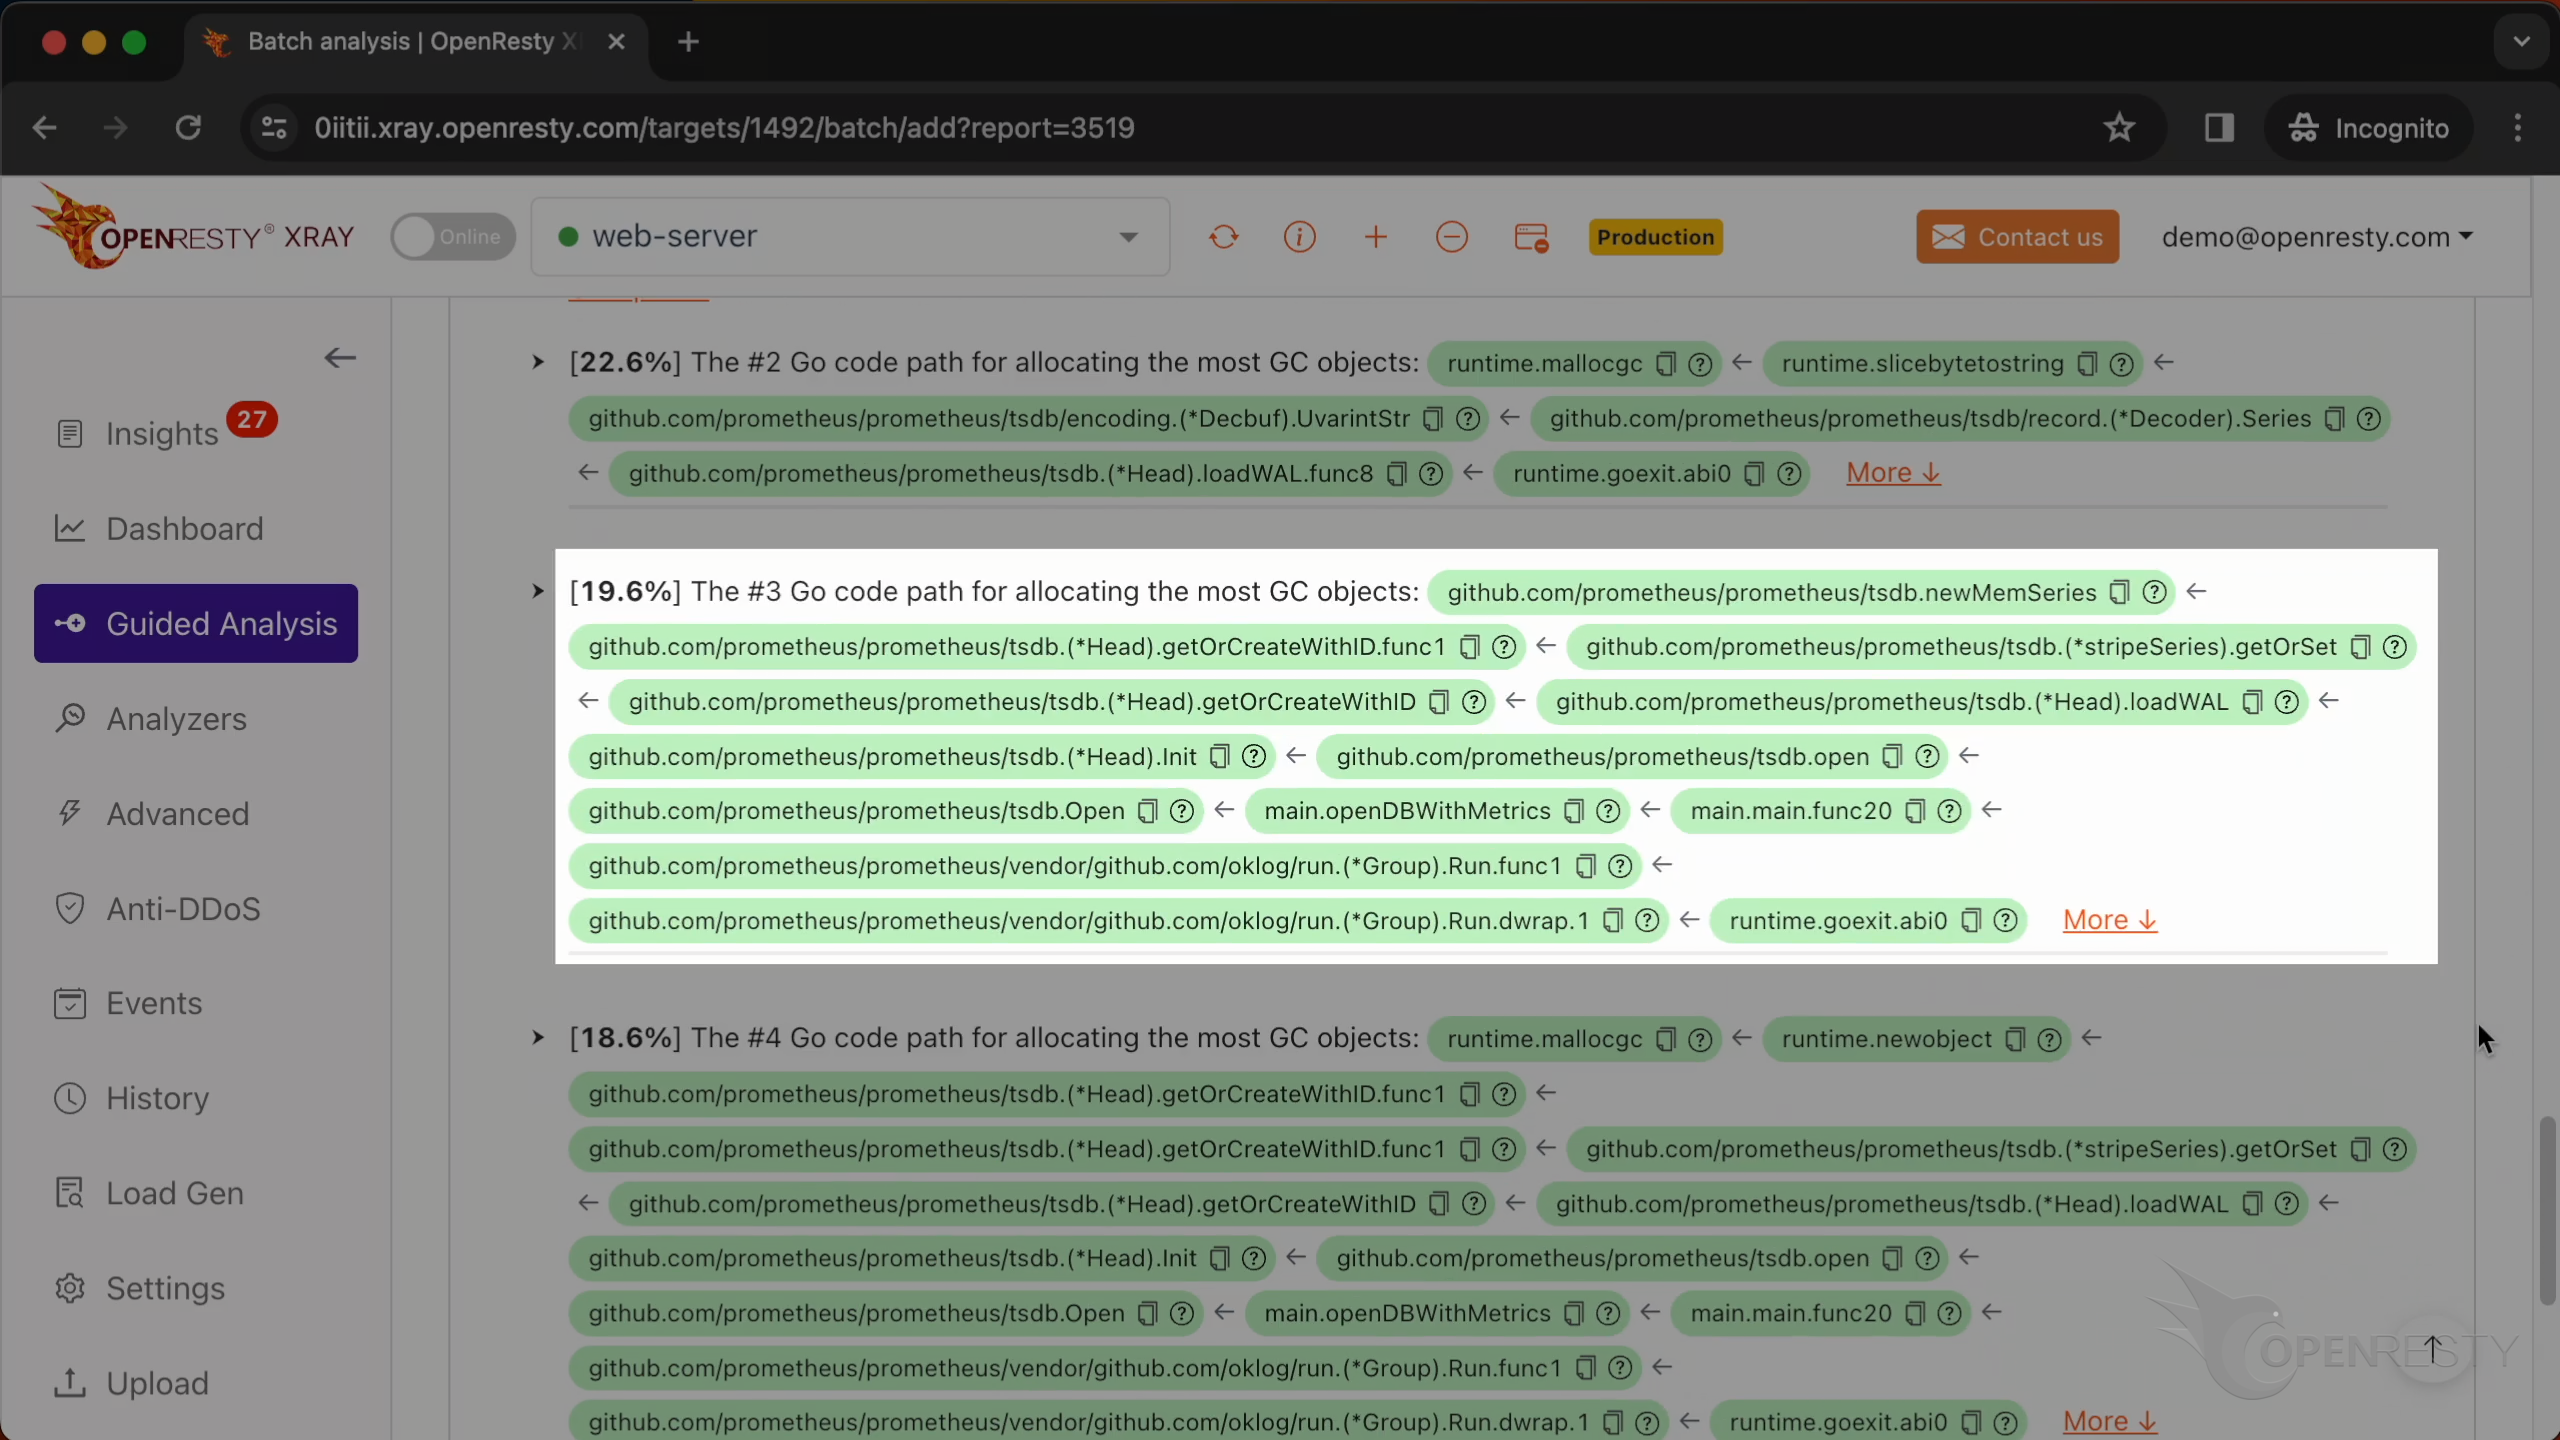
The TSDB of Prometheus creates a memory series to manage the most recent data. The number of GC objects newly allocated by this code path exceeds 19% of the total new allocations.
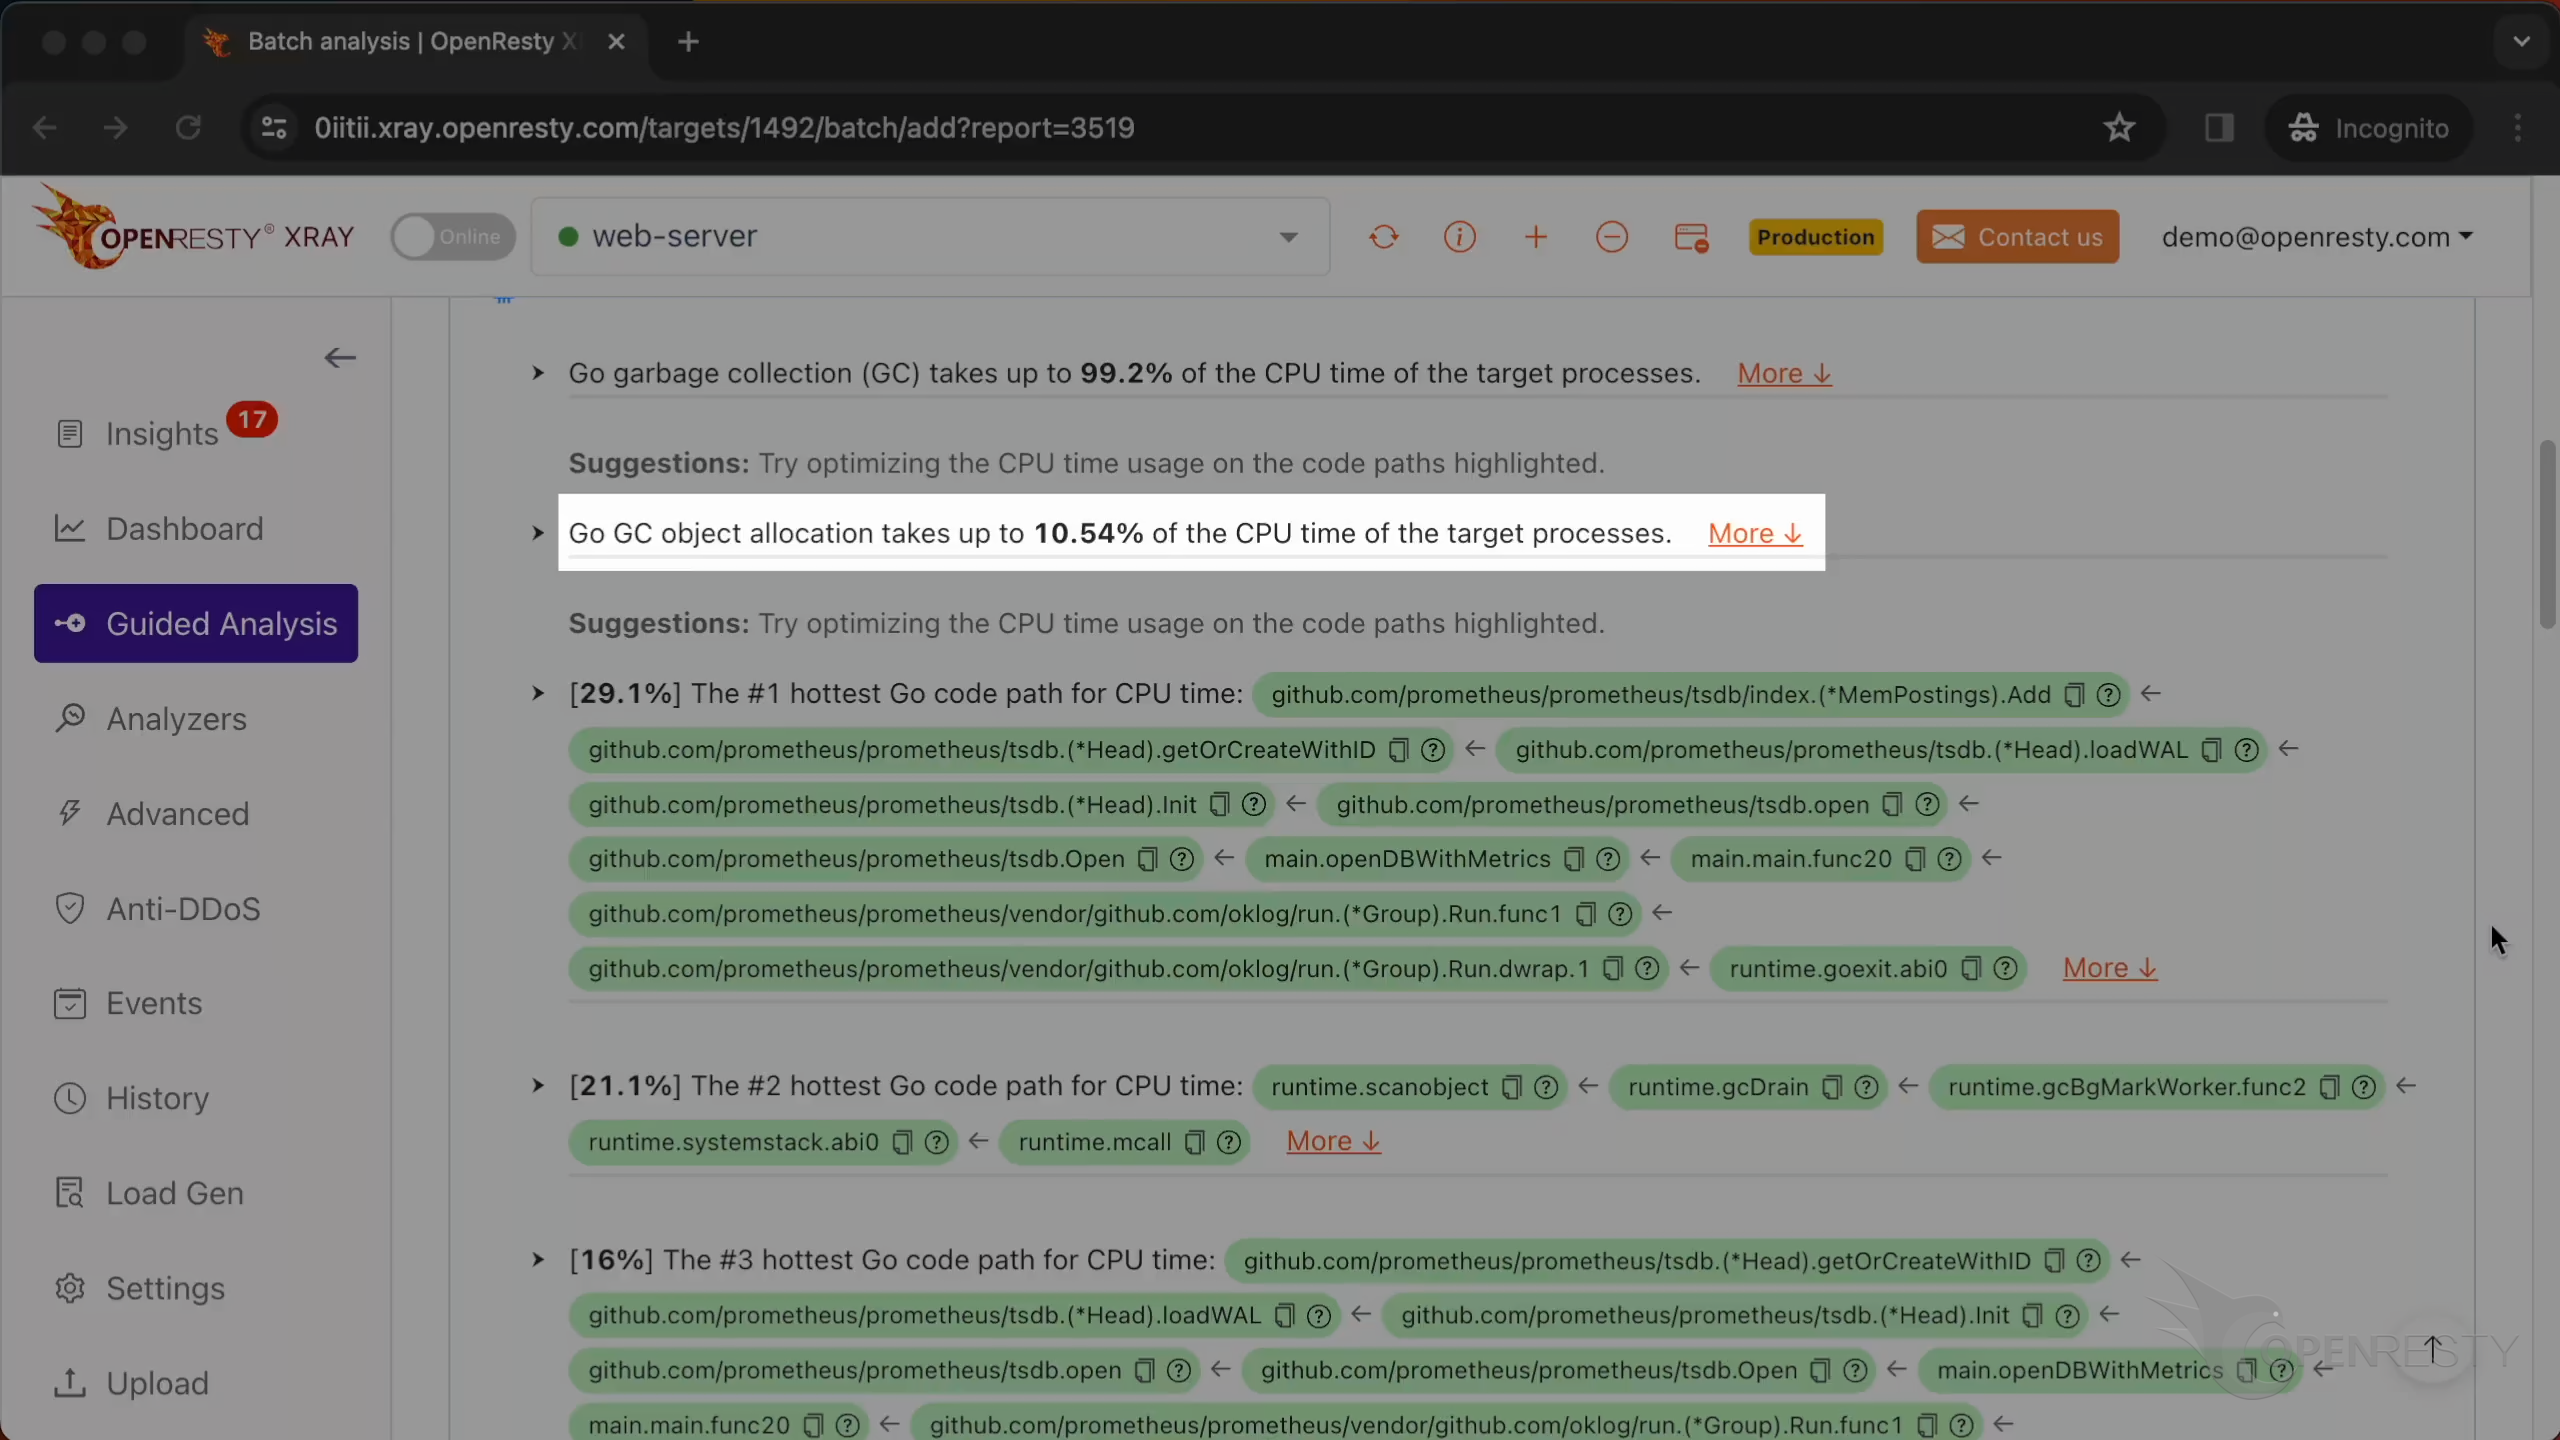
And we can see here that dynamically allocating new GC objects takes up almost 11% of the CPU time. So such allocations not only incur high garbage collection overhead but are also expensive themselves.
Automatic analysis and reports
Besides guided analysis, OpenResty XRay can also monitor online processes automatically and generate reports periodically. On the “Insights” page, you can find automatic analysis reports for daily and weekly periods — they also pinpoint the Go garbage collection and the hottest code paths without any manual work.
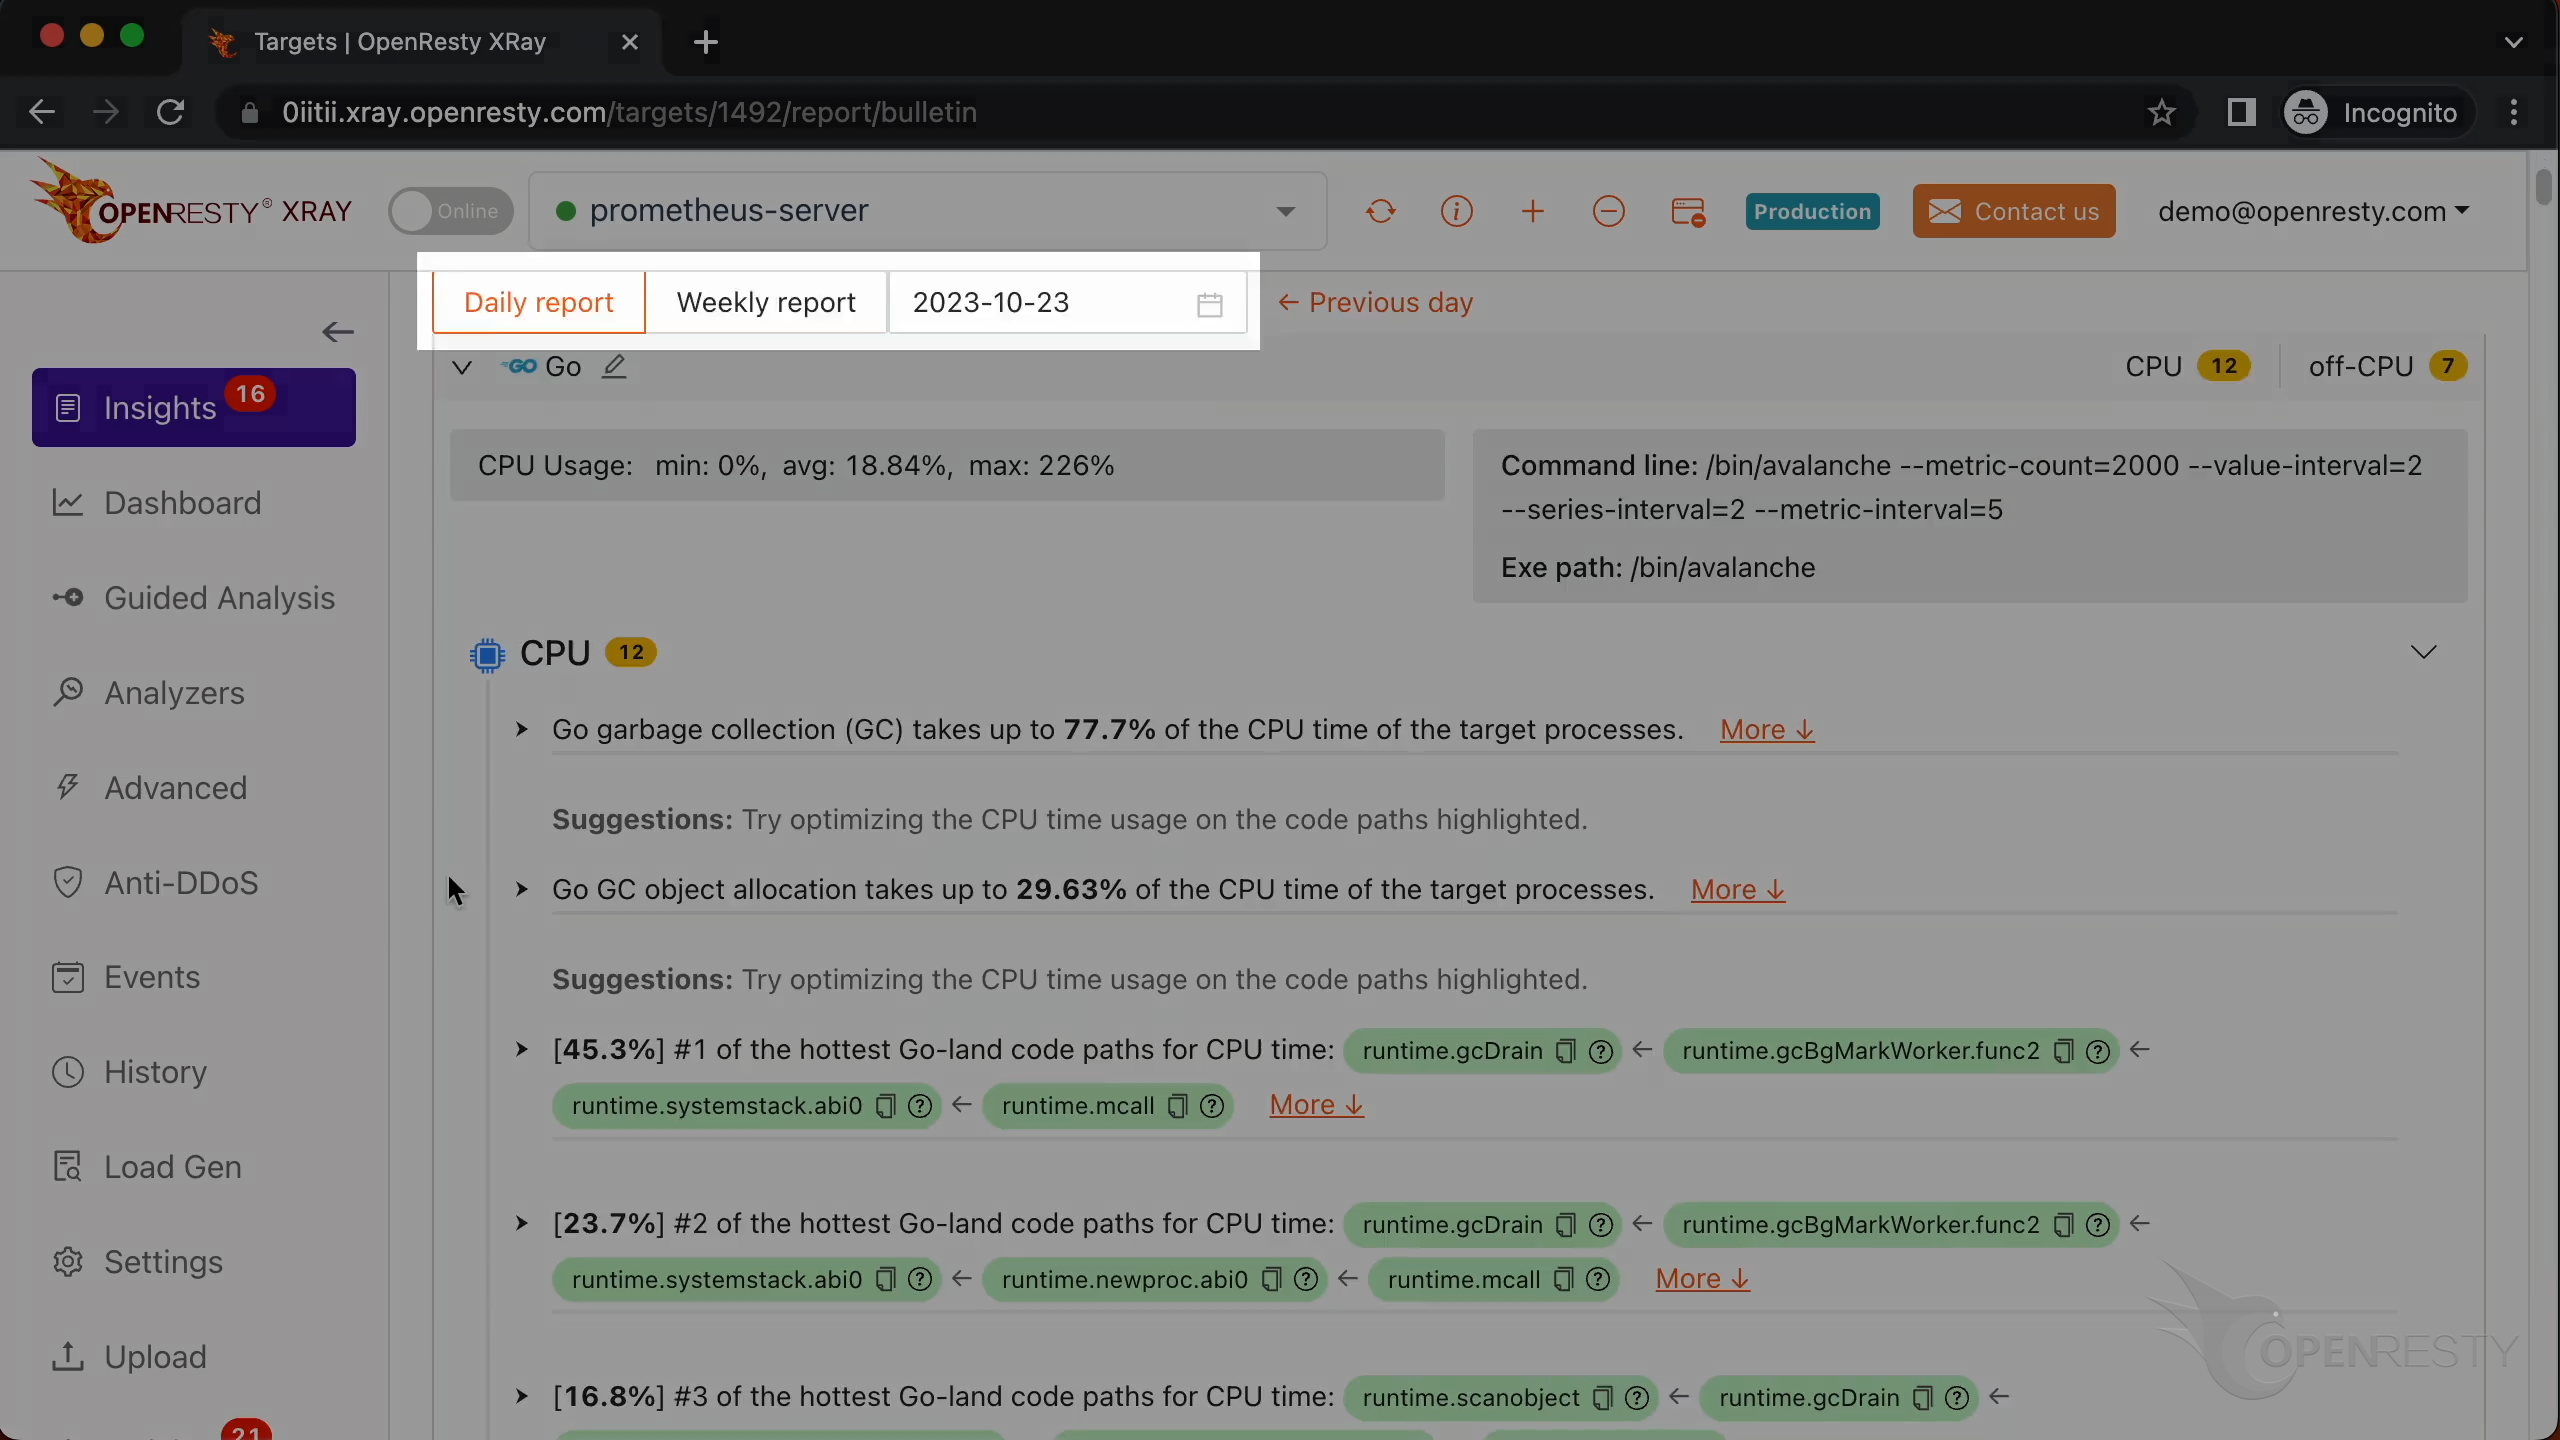
So you don’t necessarily have to use the “Guided Analysis” feature manually; that said, it remains very useful for application development and demonstration.
FAQ
Why is my Prometheus server using high CPU?
In this case, a standard, unmodified Prometheus binary (/usr/bin/prometheus) was consuming over 160% of CPU cores. Guided analysis with OpenResty XRay showed that Go garbage collection accounted for more than 99% of the CPU time. The GC pressure came from the loadWAL function rapidly allocating a large number of GC objects while loading data from the Write-Ahead Log (WAL) — that single code path accounted for over 19% of all newly allocated objects.
Why does Go garbage collection consume so much CPU?
Fast allocation of many GC objects incurs high GC overhead. The garbage collector then spends CPU time scanning and marking those objects — runtime functions like scanobject, which scans GC objects in the heap and marks reachable ones, and gcDrain, which drains the work queue of objects to be marked, showed up prominently in the analysis report. The allocations are also expensive by themselves: in this case, dynamically allocating new GC objects took up almost 11% of the CPU time on top of the collection work.
How do I find the Go code path causing Prometheus’s high CPU?
Use OpenResty XRay’s guided analysis on the running process — no modifications or instrumentation required. The report lists the hottest Go code paths allocating the most objects, inferred automatically from a Go GC object allocation flame graph. Hovering over a function box, such as loadWAL, reveals its source file path and line number (line 141 in this case), so you can open the file in any editor and inspect the exact code. The Insights page can also produce the same findings automatically in daily and weekly reports.
What is OpenResty XRay
OpenResty XRay is a dynamic-tracing product that automatically analyzes your running applications to troubleshoot performance problems, behavioral issues, and security vulnerabilities with actionable suggestions. Under the hood, OpenResty XRay is powered by our Y language targeting various runtimes like Stap+, eBPF+, GDB, and ODB, depending on the contexts.
If you like this tutorial, please subscribe to this blog site and/or our YouTube channel. Thank you!
About The Author
Yichun Zhang (Github handle: agentzh), is the original creator of the OpenResty® open-source project and the CEO of OpenResty Inc..
Yichun is one of the earliest advocates and leaders of “open-source technology”. He worked at many internationally renowned tech companies, such as Cloudflare, Yahoo!. He is a pioneer of “edge computing”, “dynamic tracing” and “machine coding”, with over 22 years of programming and 16 years of open source experience. Yichun is well-known in the open-source space as the project leader of OpenResty®, adopted by more than 40 million global website domains.
OpenResty Inc., the enterprise software start-up founded by Yichun in 2017, has customers from some of the biggest companies in the world. Its flagship product, OpenResty XRay, is a non-invasive profiling and troubleshooting tool that significantly enhances and utilizes dynamic tracing technology. And its OpenResty Edge product is a powerful distributed traffic management and private CDN software product.
As an avid open-source contributor, Yichun has contributed more than a million lines of code to numerous open-source projects, including Linux kernel, Nginx, LuaJIT, GDB, SystemTap, LLVM, Perl, etc. He has also authored more than 60 open-source software libraries.
Related Articles
OpenResty XRay Mar 10, 2024

OpenResty XRay Feb 19, 2024

OpenResty XRay Dec 25, 2023

OpenResty XRay Dec 7, 2023

OpenResty XRay Nov 24, 2023