Performance Impact of OpenResty XRay when Tracing PHP Apps
When you profile a live PHP application in production, the biggest worry is usually not whether you can pinpoint the problem, but whether the profiling tool itself will drag down your production service. We measured the overhead of OpenResty XRay on a live PHP application in production mode: during active sampling, maximum throughput dropped by only 3.7% and average latency rose by just 0.22 ms, while the Agent’s overhead is exactly zero when idle. This is possible because, unlike always-on APM agents, it performs no code injection or modification on the target process and only collects data — at low frequency — when a user explicitly starts an analysis; the sections below use point-by-point benchmark data to show its real impact on CPU, memory, and load, as well as on throughput and latency. For the full walkthrough, see the video version at the top of this article.
Testing Environment and Performance Baseline
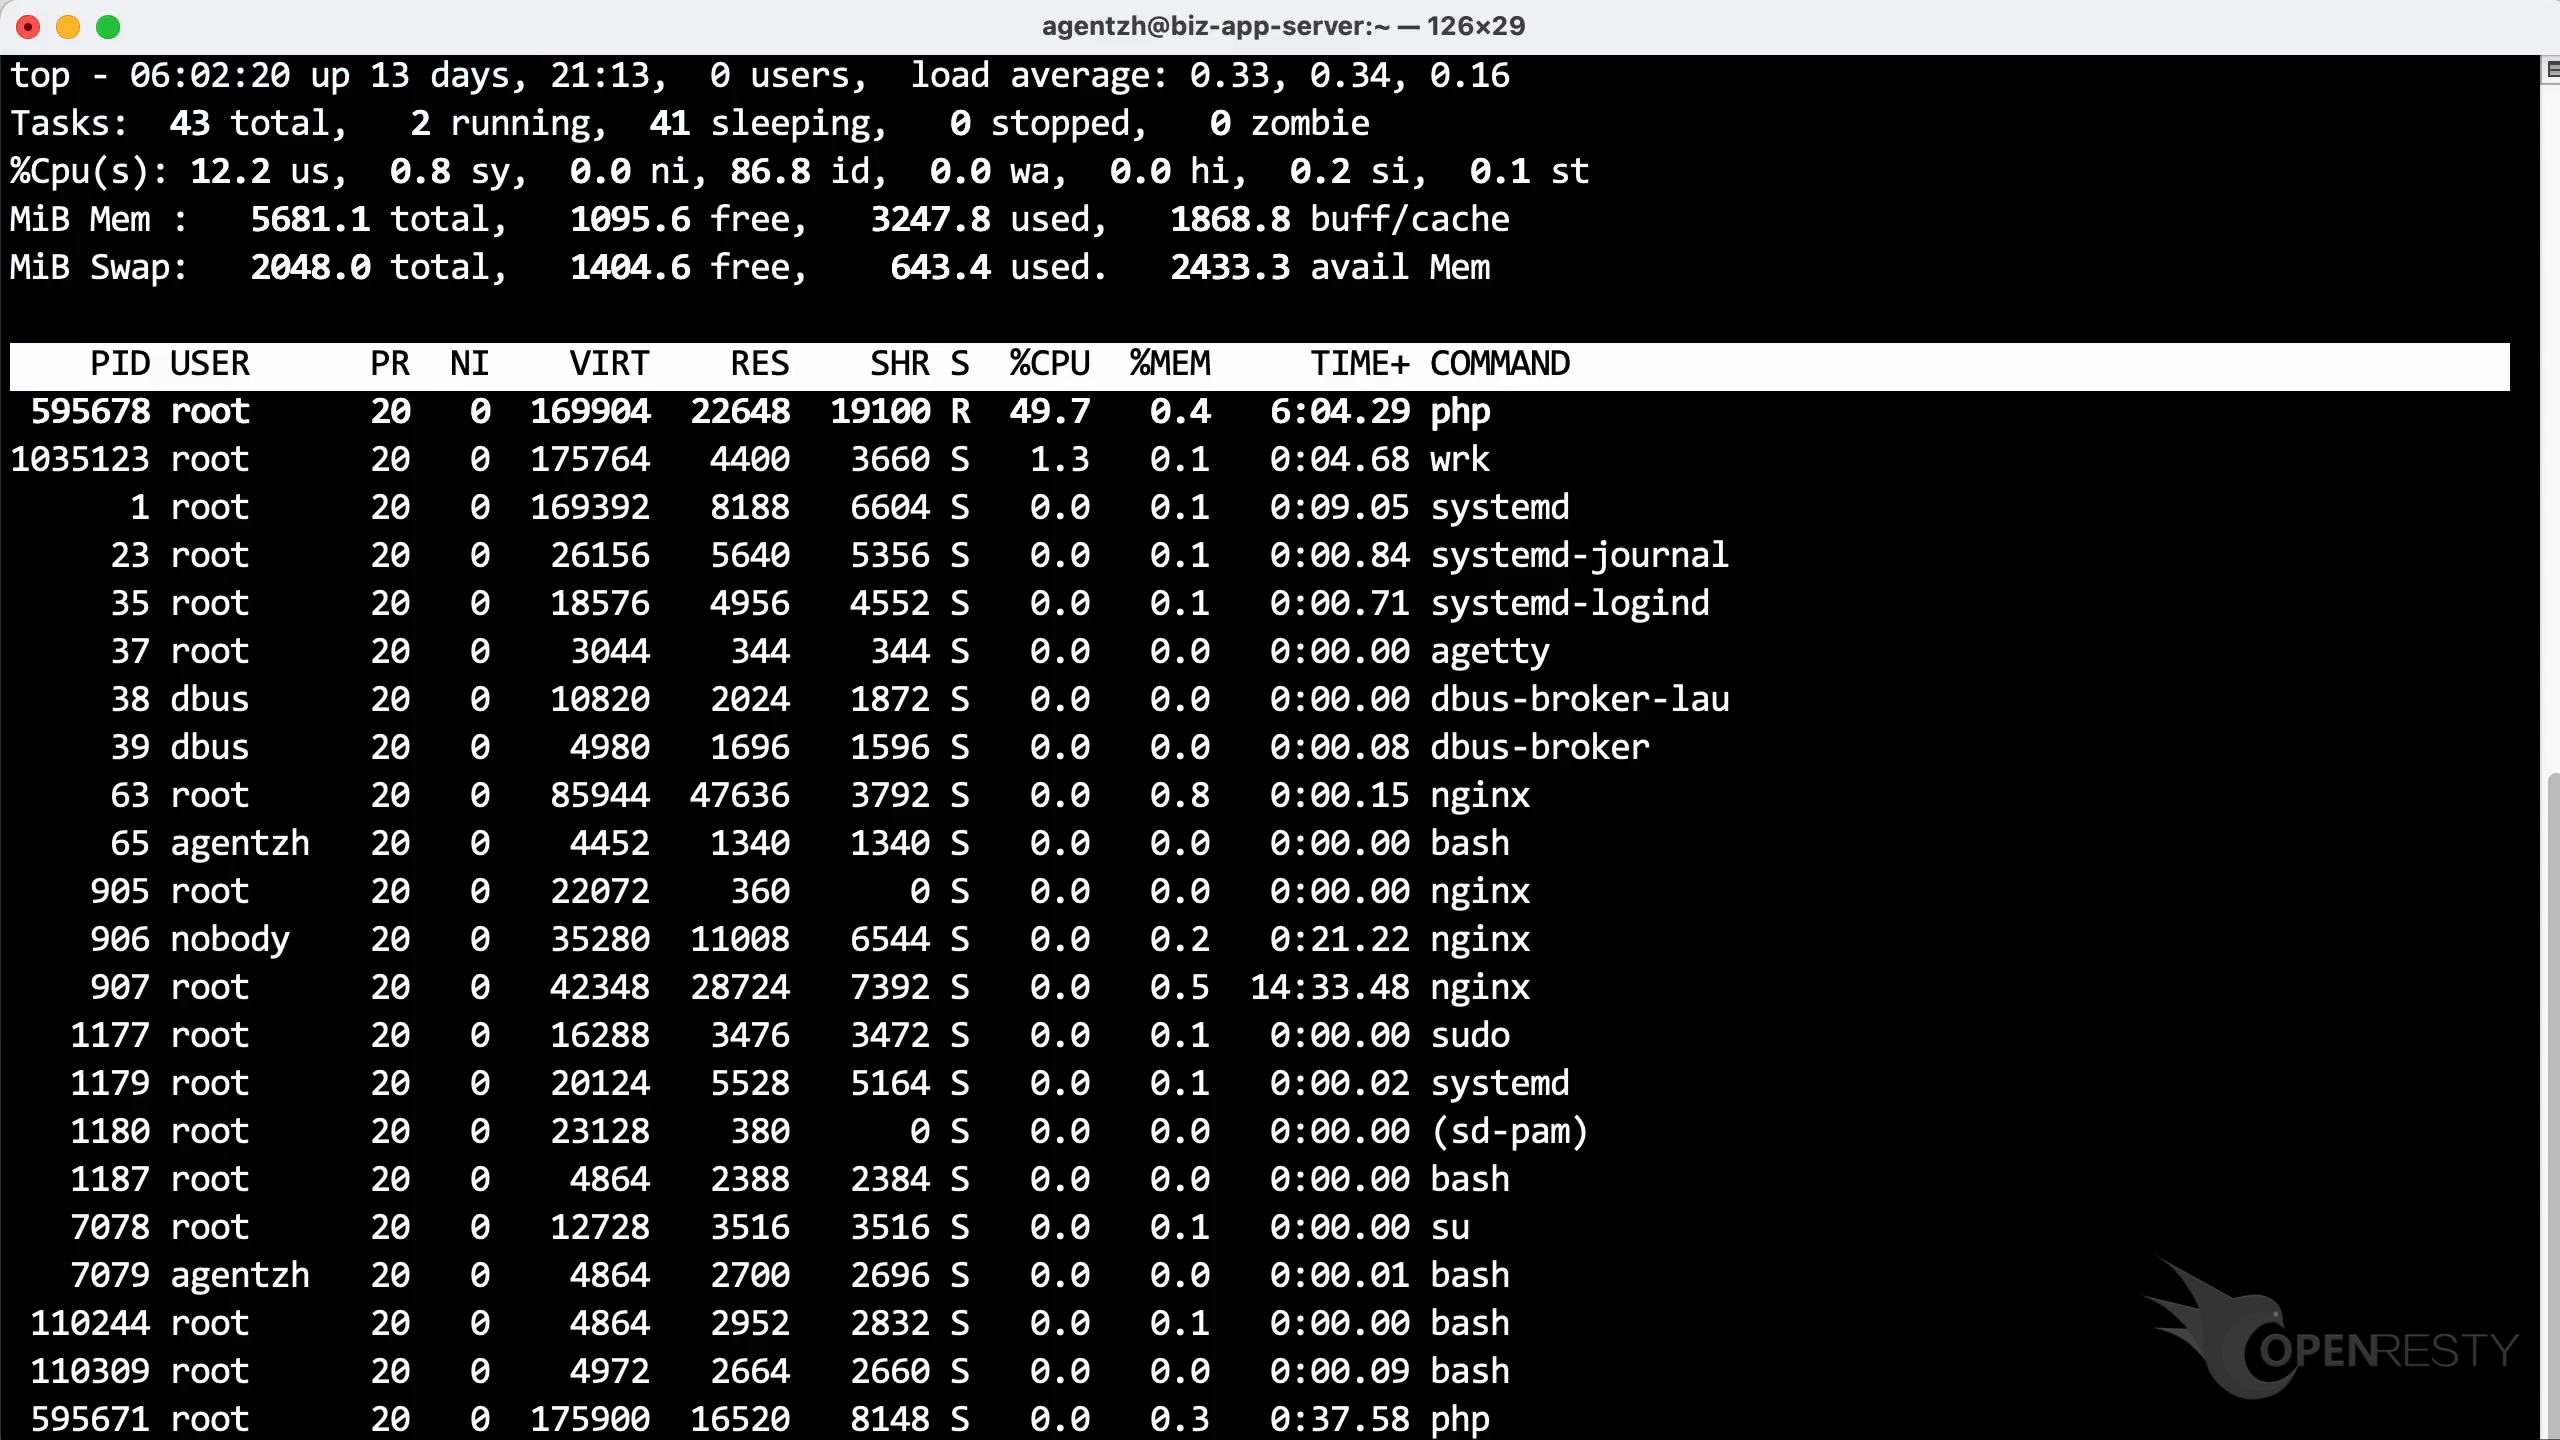
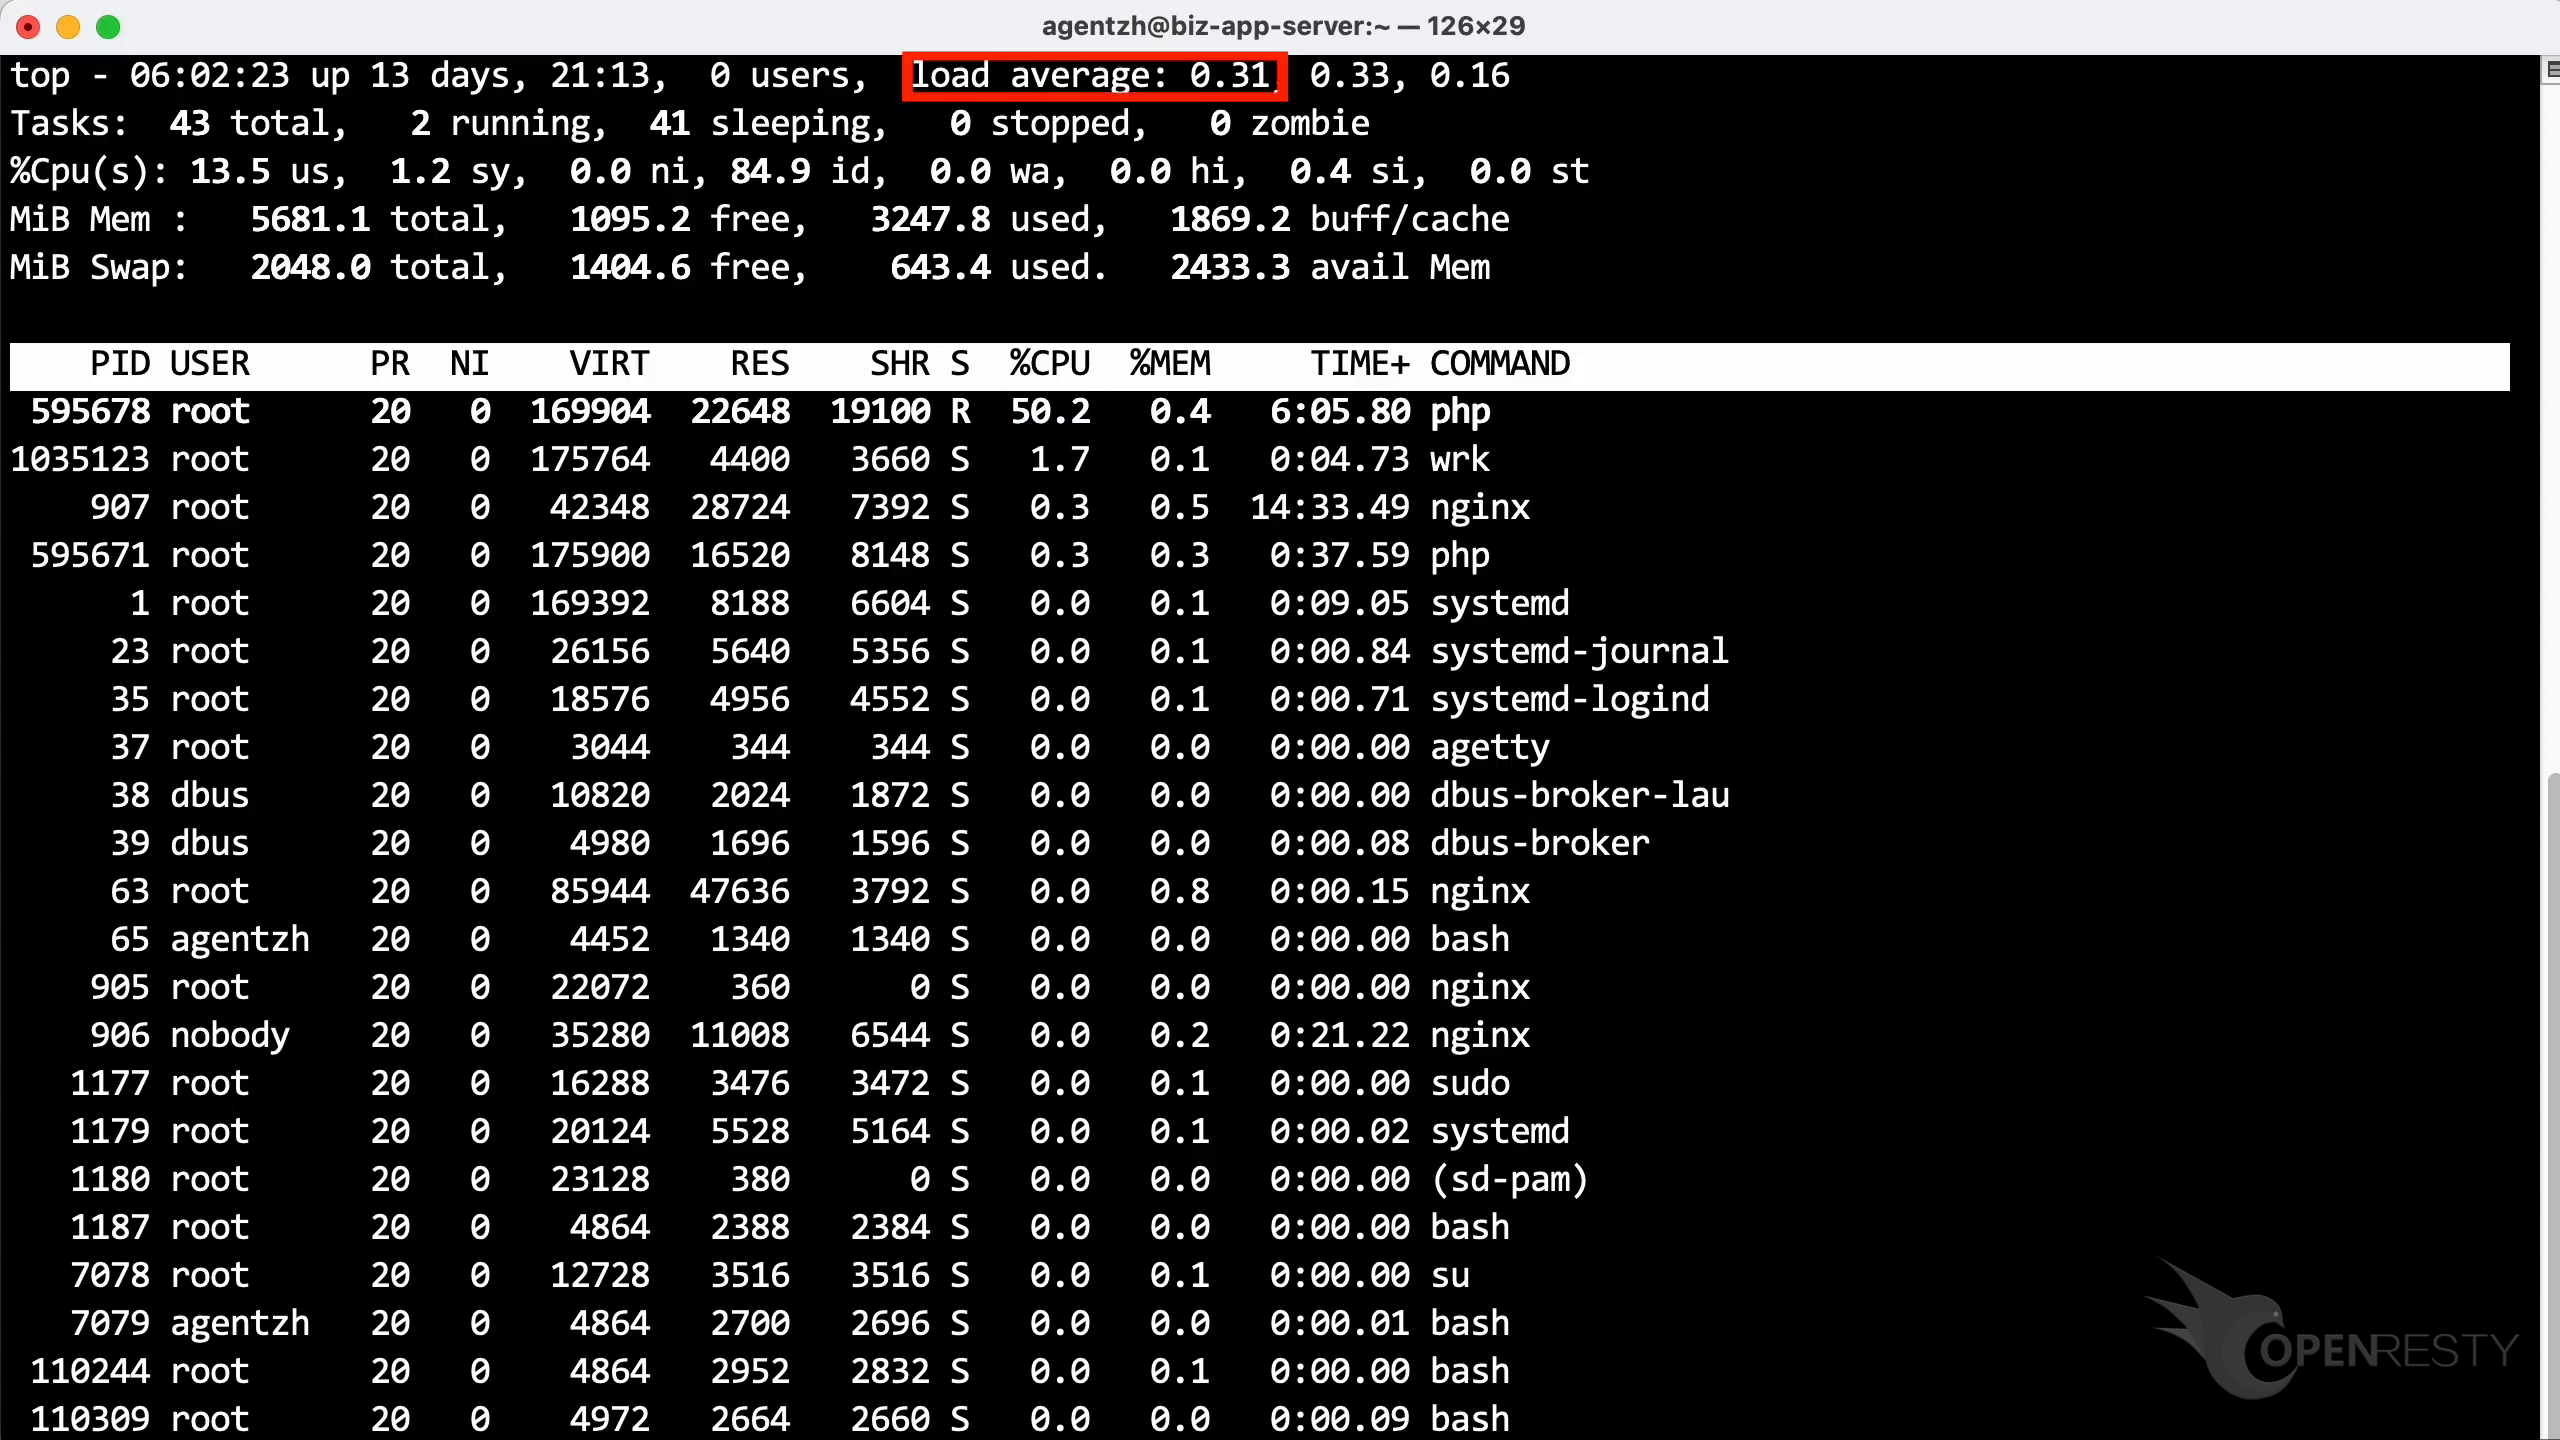
To establish a comparison baseline, we captured system performance metrics using the top command before starting the profiler. As shown below, the target php process was consuming approximately 50% CPU, the system’s 1-minute load average was 0.31, the CPU idle percentage was approximately 85%, and available memory was approximately 2,433 MB.
What Happens to CPU, Memory, and Load During Profiling?
To simulate a real-world diagnostic scenario, we used the OpenResty XRay console to launch a 300-second (5-minute) “High CPU usage” analysis against the PHP process in production mode.
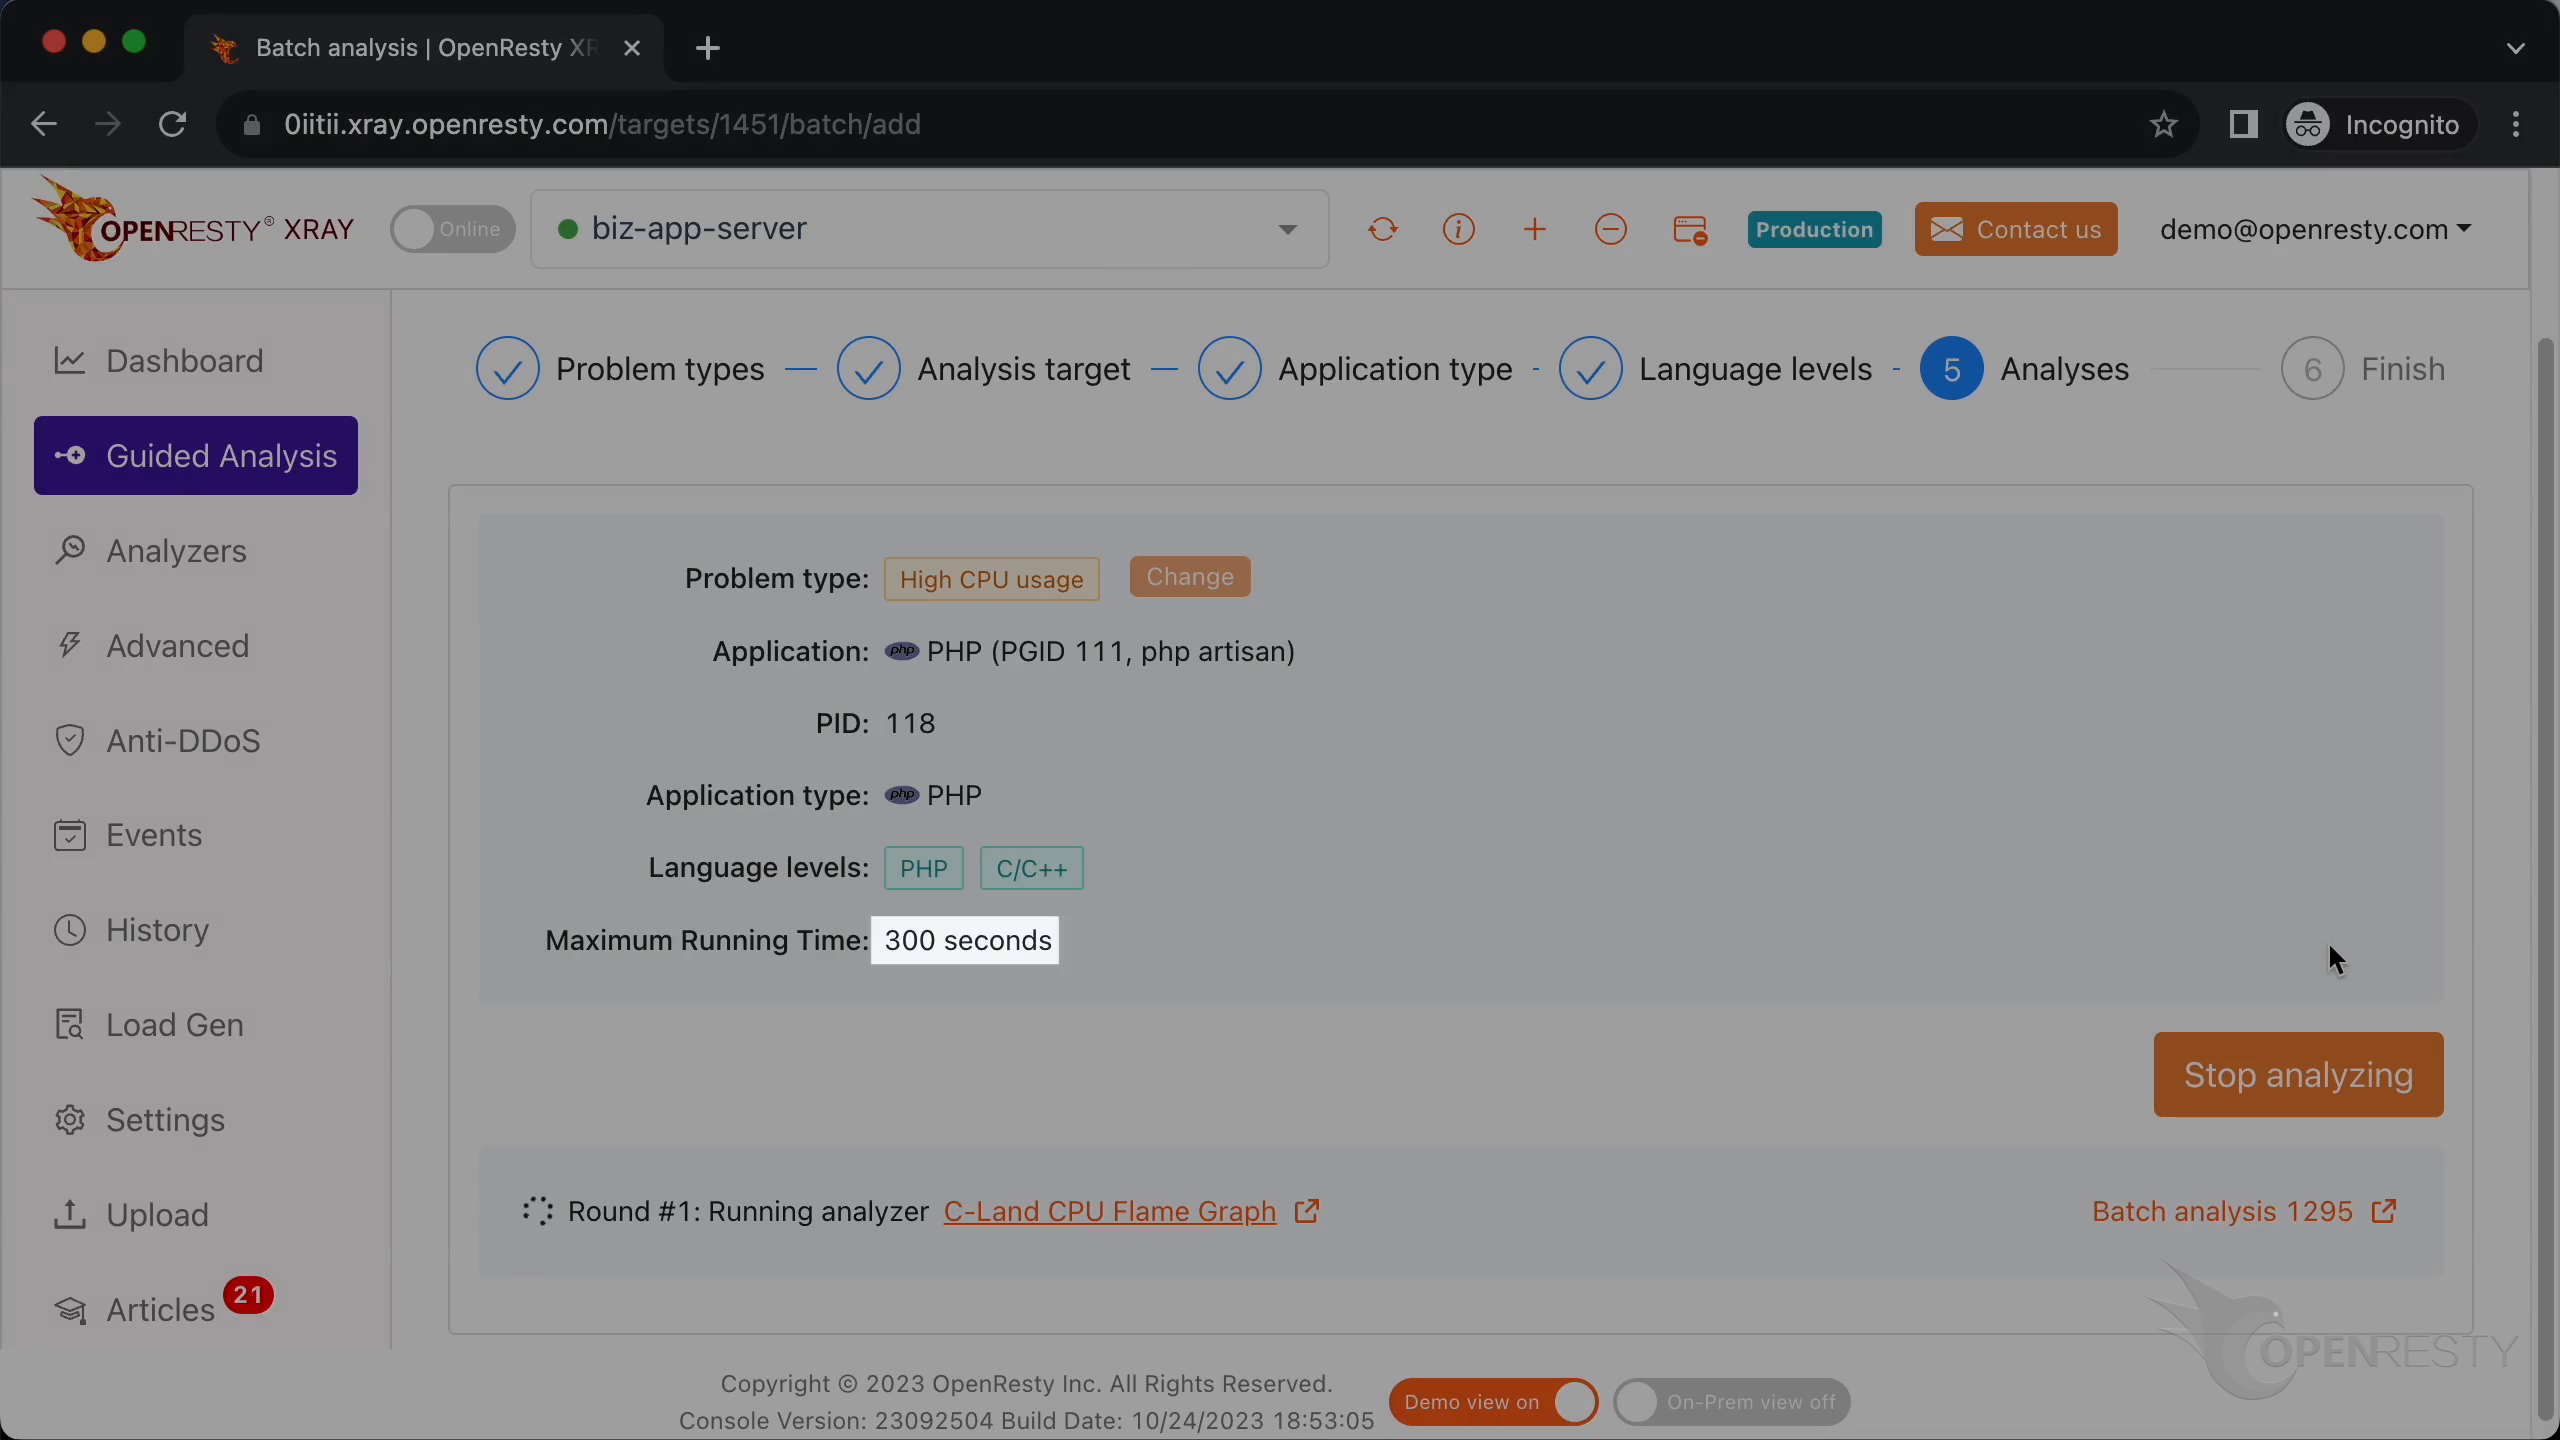
Selecting “production mode” is important here: it is specifically designed for live environments and minimizes performance impact through techniques such as low-frequency sampling. The trade-off is that analysis runs may take longer to complete.
During profiler operation, we observed the following subtle changes across system metrics:
- Target process CPU usage: Increased to ~53%, up approximately 3 percentage points from the baseline.
- System 1-minute load average: Increased to 0.41, a modest rise from the baseline of 0.31.
- CPU idle percentage: Increased to ~85.9%, essentially unchanged from the baseline of 85%.
- Available system memory: Held steady at ~2,433 MB, with no meaningful change.
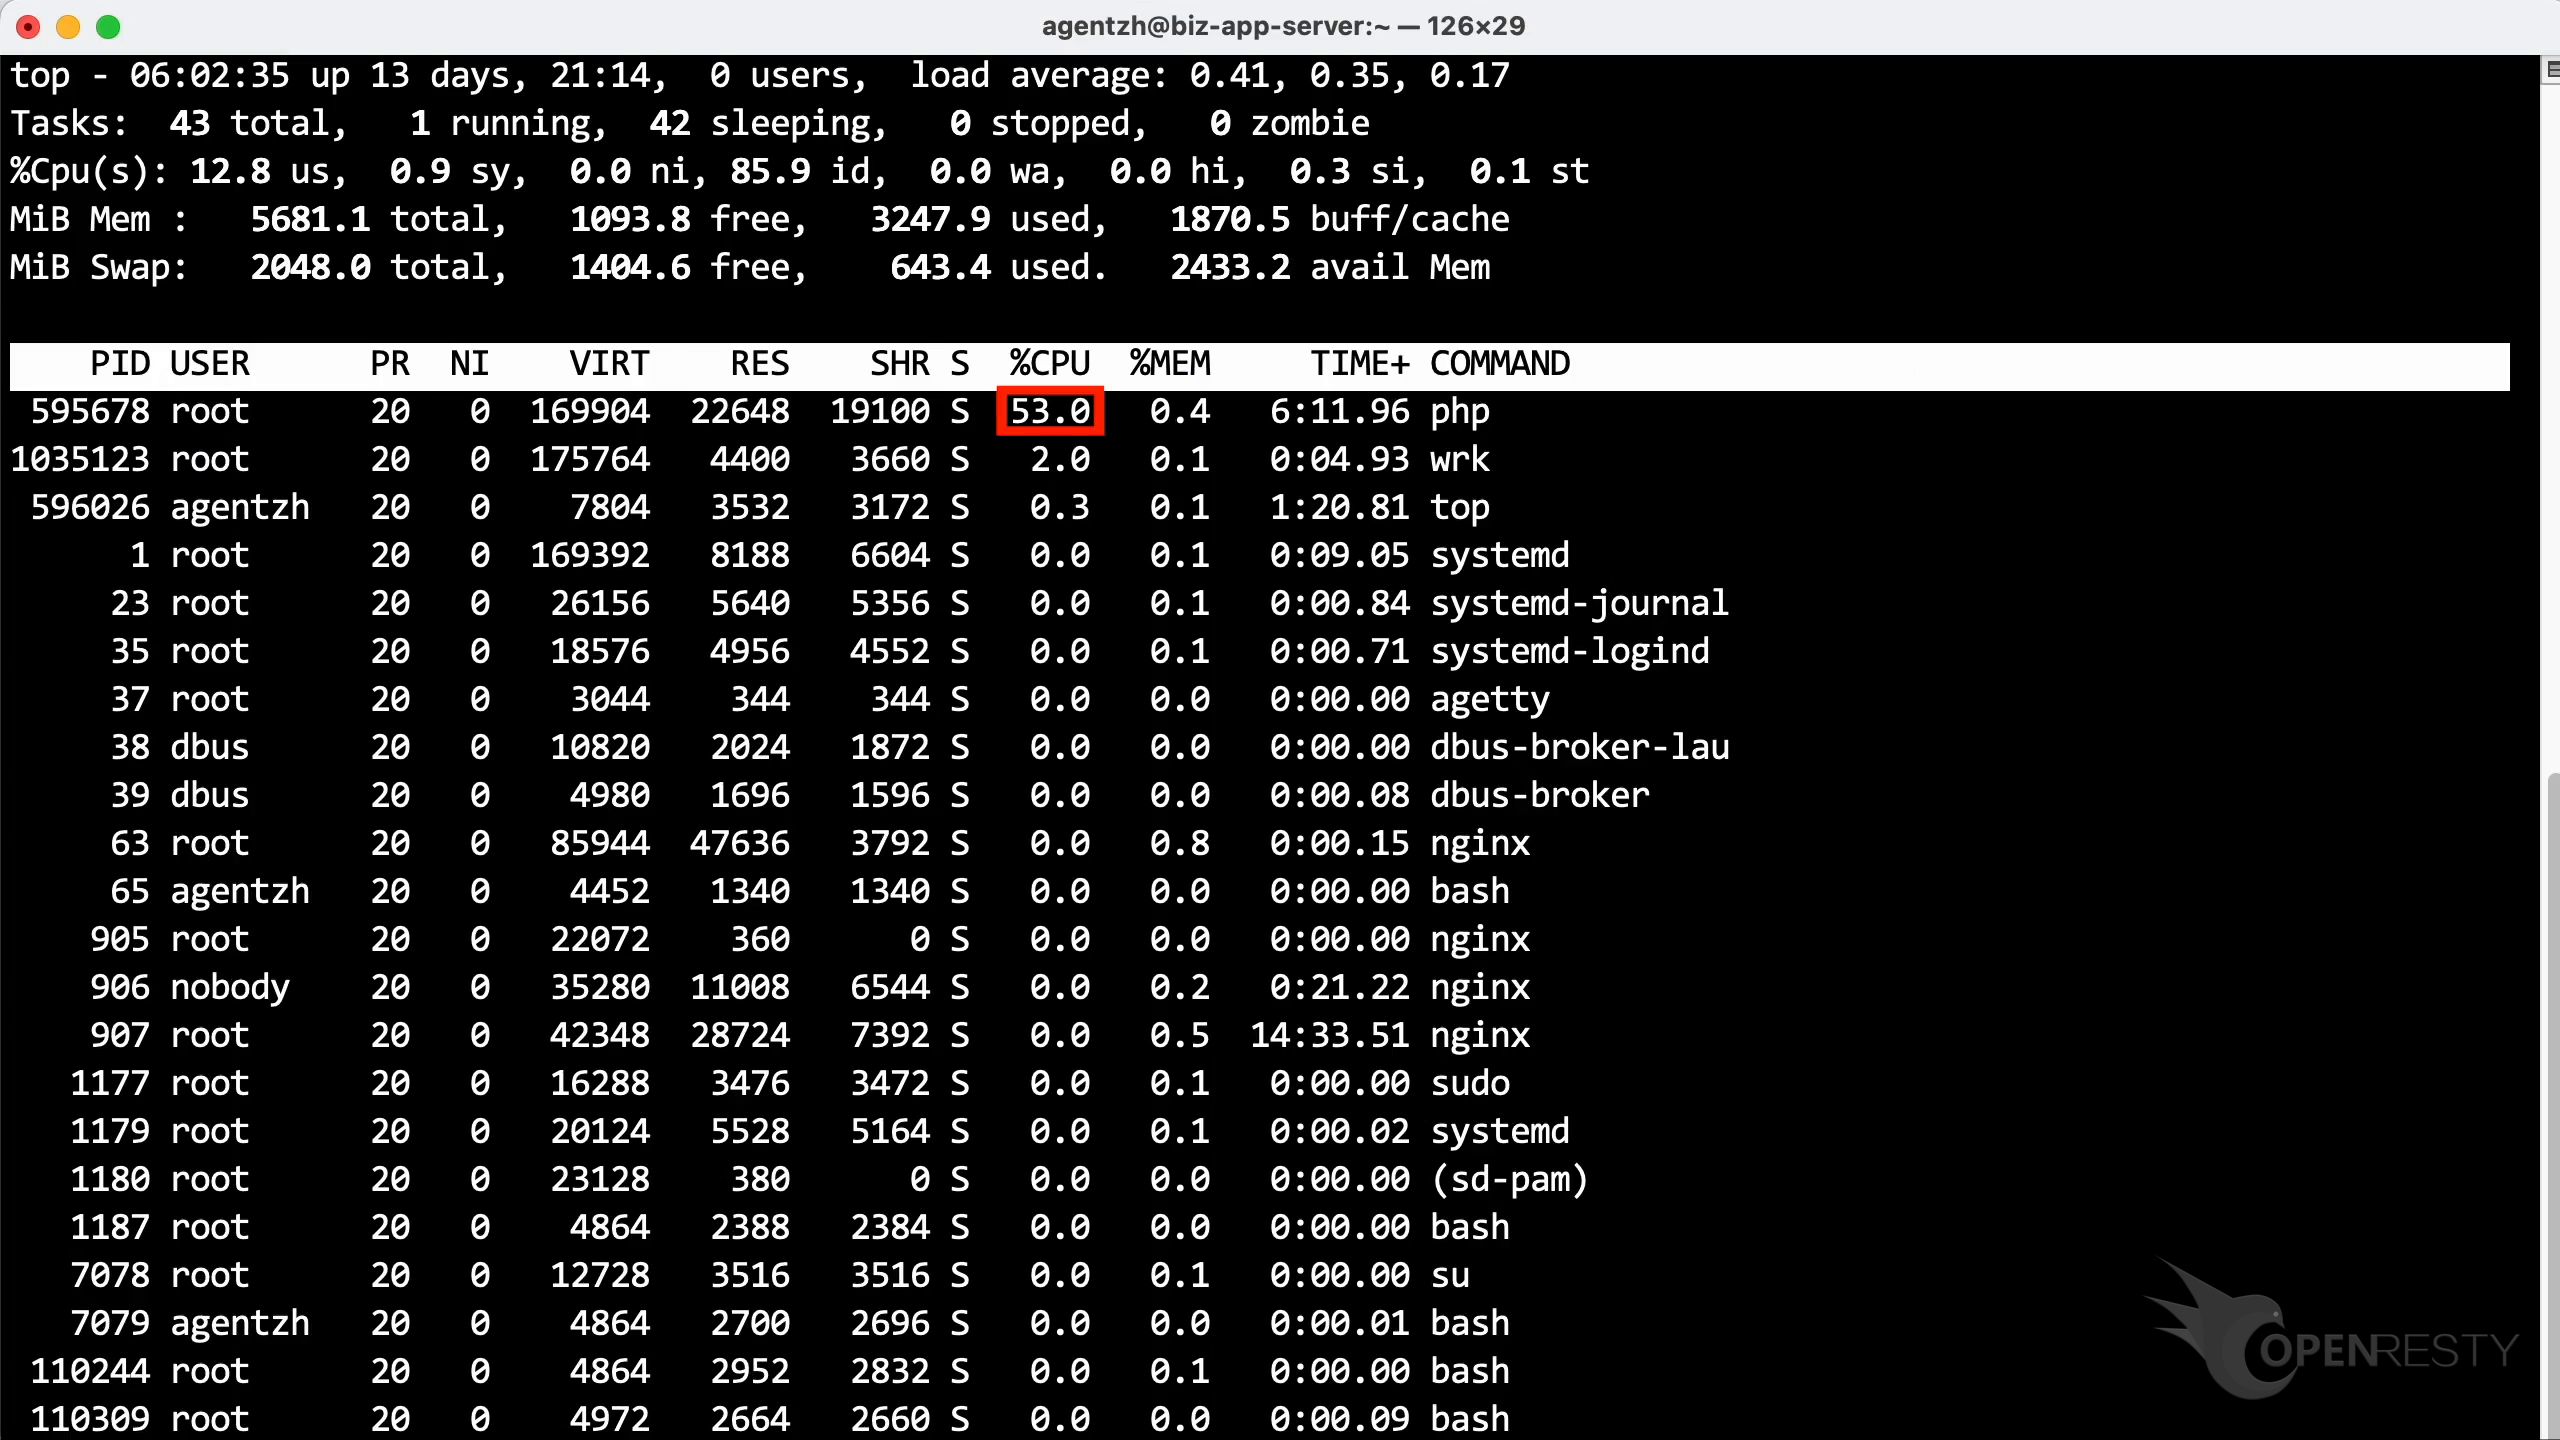
In summary, the OpenResty XRay profiler does introduce some measurable impact on system-level resources (CPU, memory, and load) during sampling, but the magnitude is small enough to pose no threat to system stability.
How Much Does Profiling Affect Throughput and Latency?
For production services, throughput and latency are the most critical indicators of performance. We ran three sets of comparative benchmarks covering these two core metrics. The table below summarizes the results across all three scenarios:
| Scenario | Max throughput | Avg latency |
|---|---|---|
| OpenResty XRay Agent not installed | 369 req/s | 5.36 ms |
| Agent installed, profiler idle | 369 req/s (unchanged) | 5.36 ms (unchanged) |
| Profiler actively sampling | 355 req/s (−3.7%) | 5.58 ms (+0.22 ms) |
1. Maximum Throughput
We used a load-testing tool to measure peak server throughput under different conditions.
Without the Agent: 369 req/s
Agent installed, profiler not running: 369 req/s (no change)
Profiler active: 355 req/s
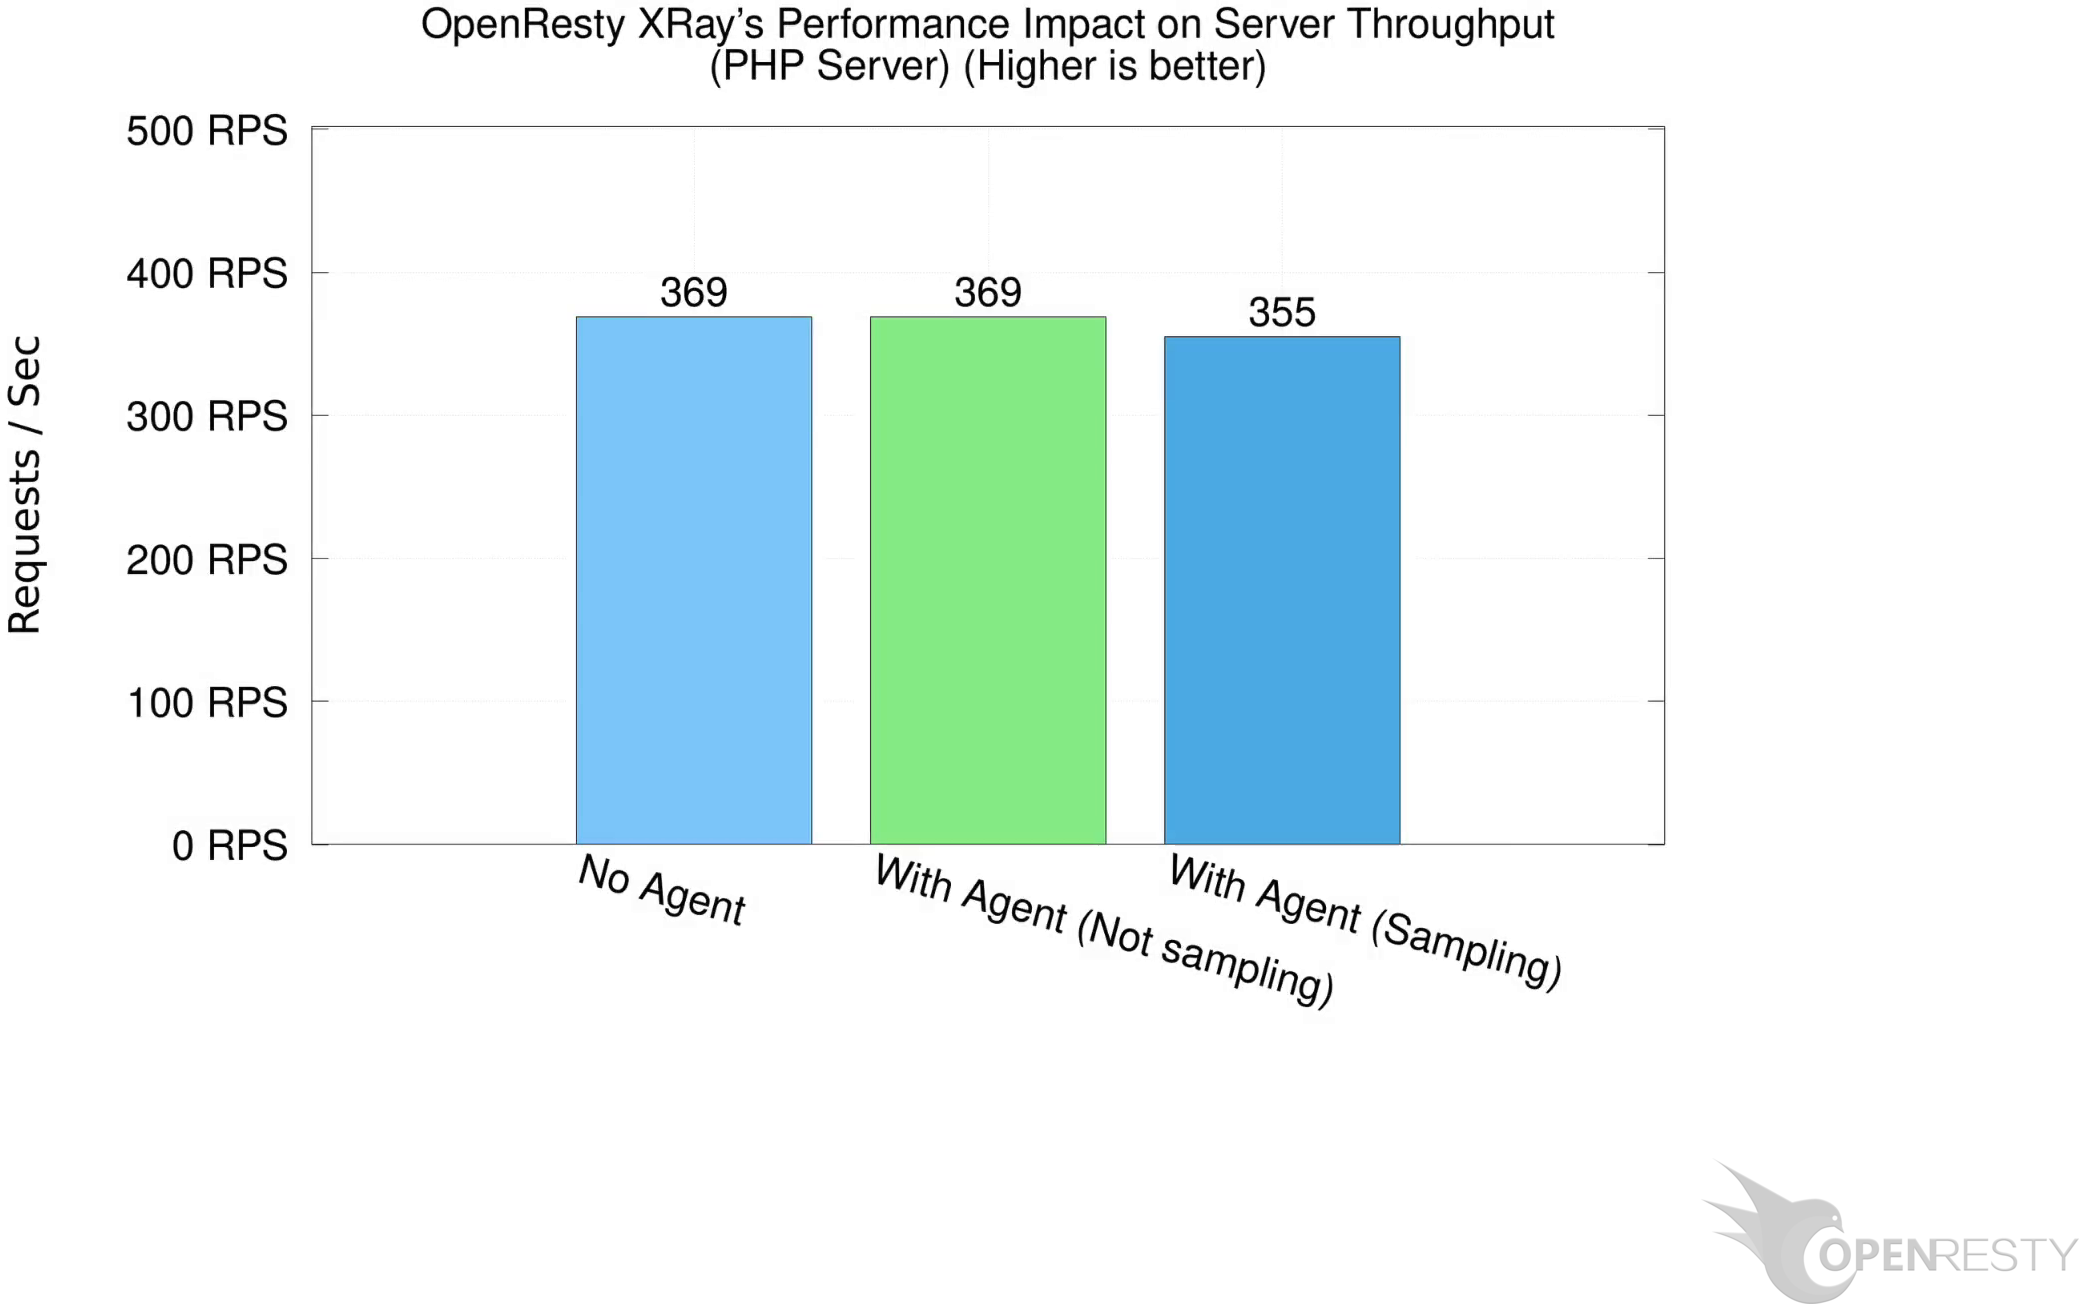
The results show that with the profiler actively sampling, peak throughput is approximately 355 requests per second — only 3.7% lower than the no-sampling baseline.
2. Average Request Latency
We measured the impact on request latency during profiler sampling.
- Without the Agent: 5.36 ms
- Agent installed, profiler not running: 5.36 ms (no change)
- Profiler active: 5.58 ms
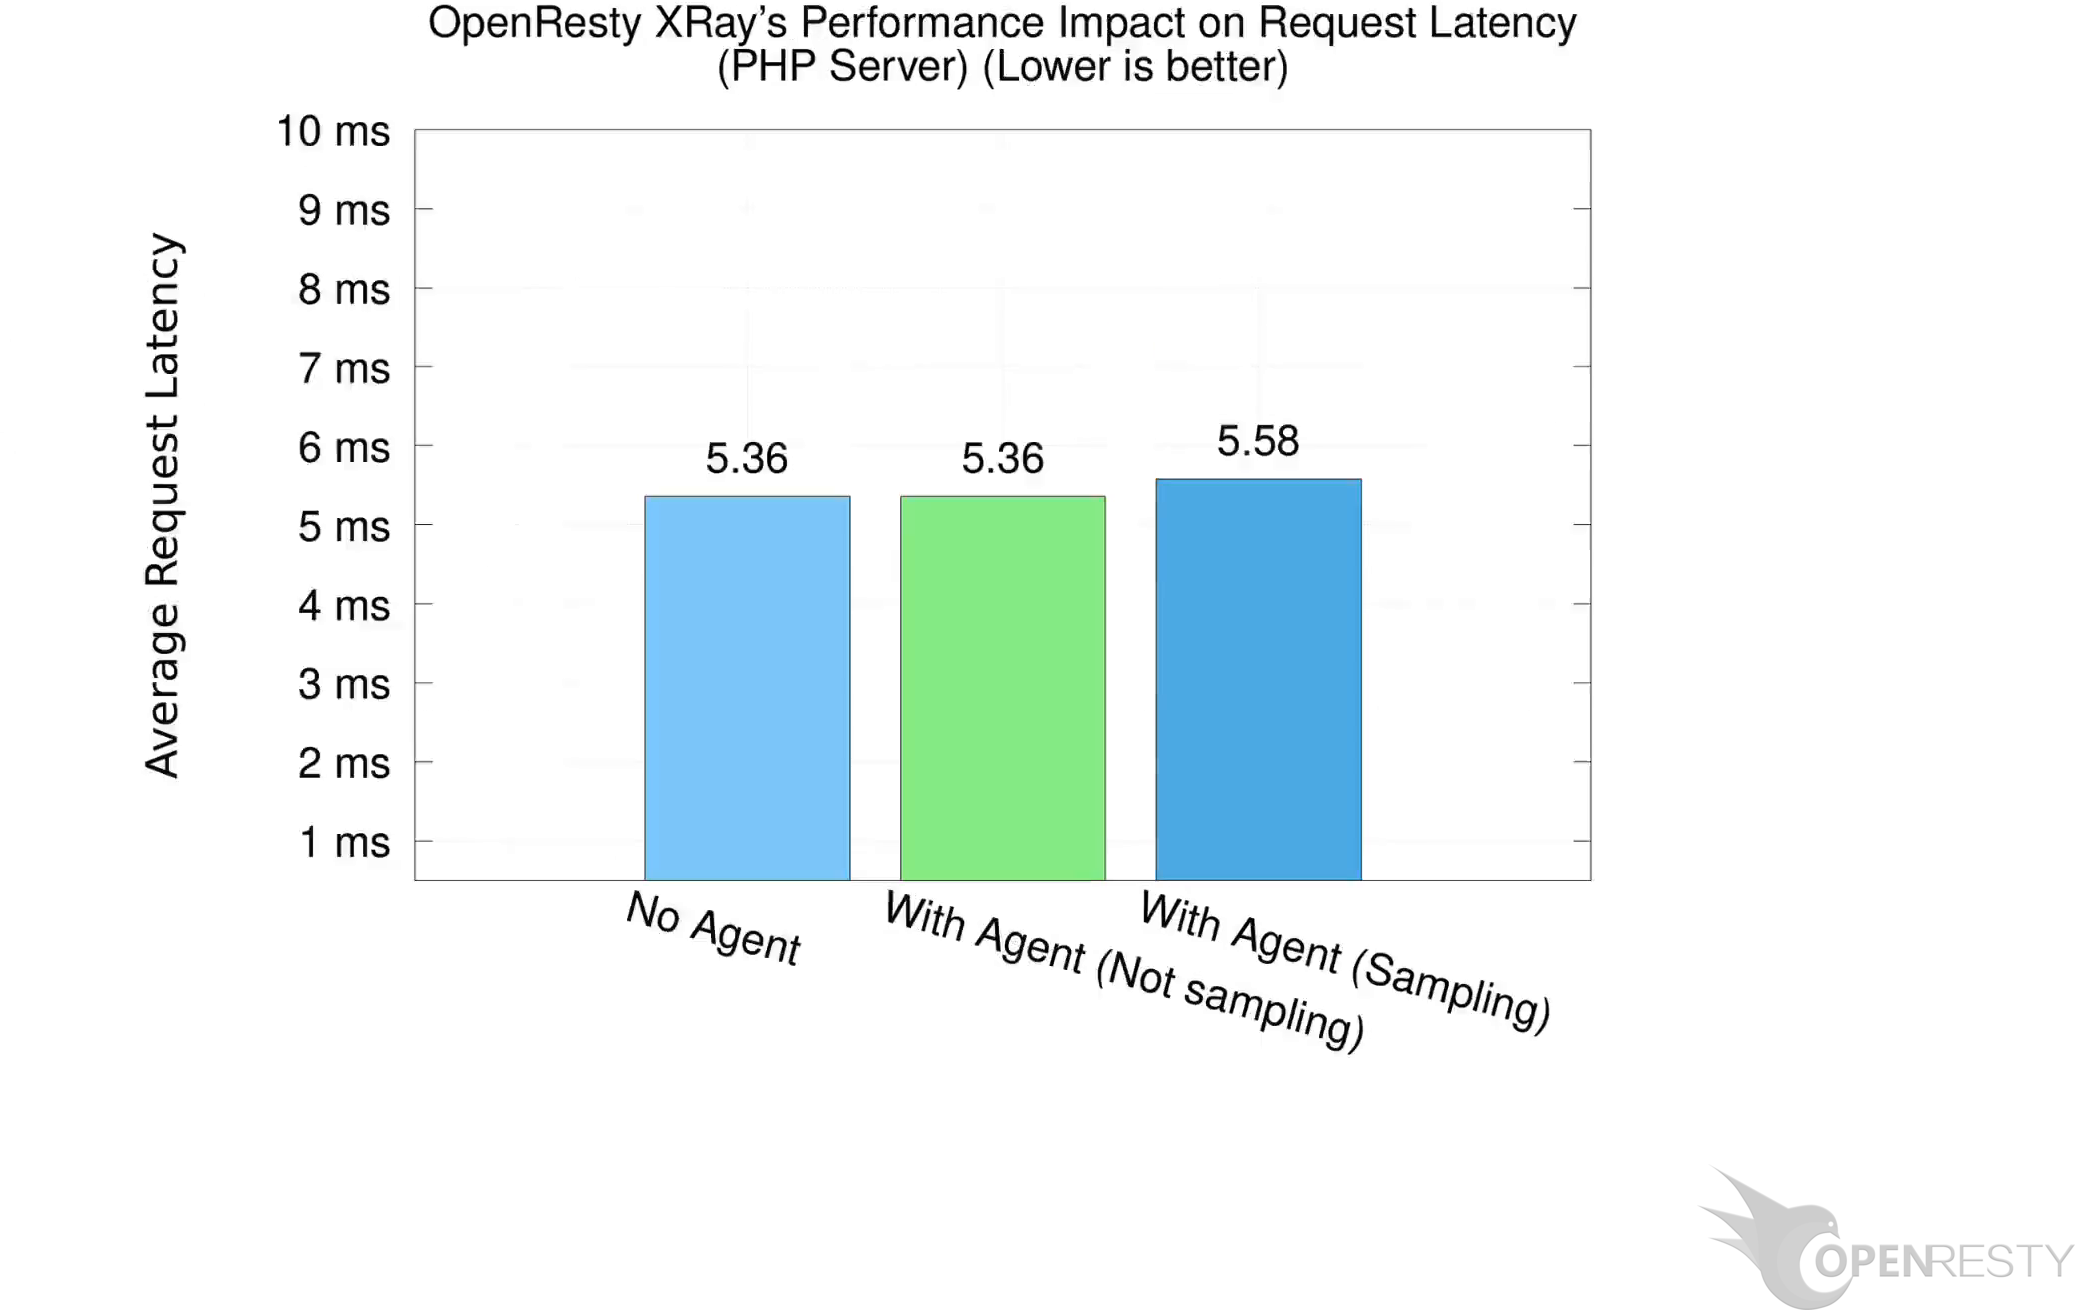
The results show that running the profiler added only 0.22 ms to average request latency.
Summary
Through comprehensive measurement of system resources, application throughput, and request latency, we can conclude that the dynamic tracing architecture of OpenResty XRay delivers measurable, predictable overhead when diagnosing production PHP applications in real time, with minimal impact on core business metrics. This demonstrates that it is a profiling tool that can be safely and confidently deployed as a permanent fixture in production environments.
The overhead of automatic analysis on the Insights and Dashboard pages is equally negligible.
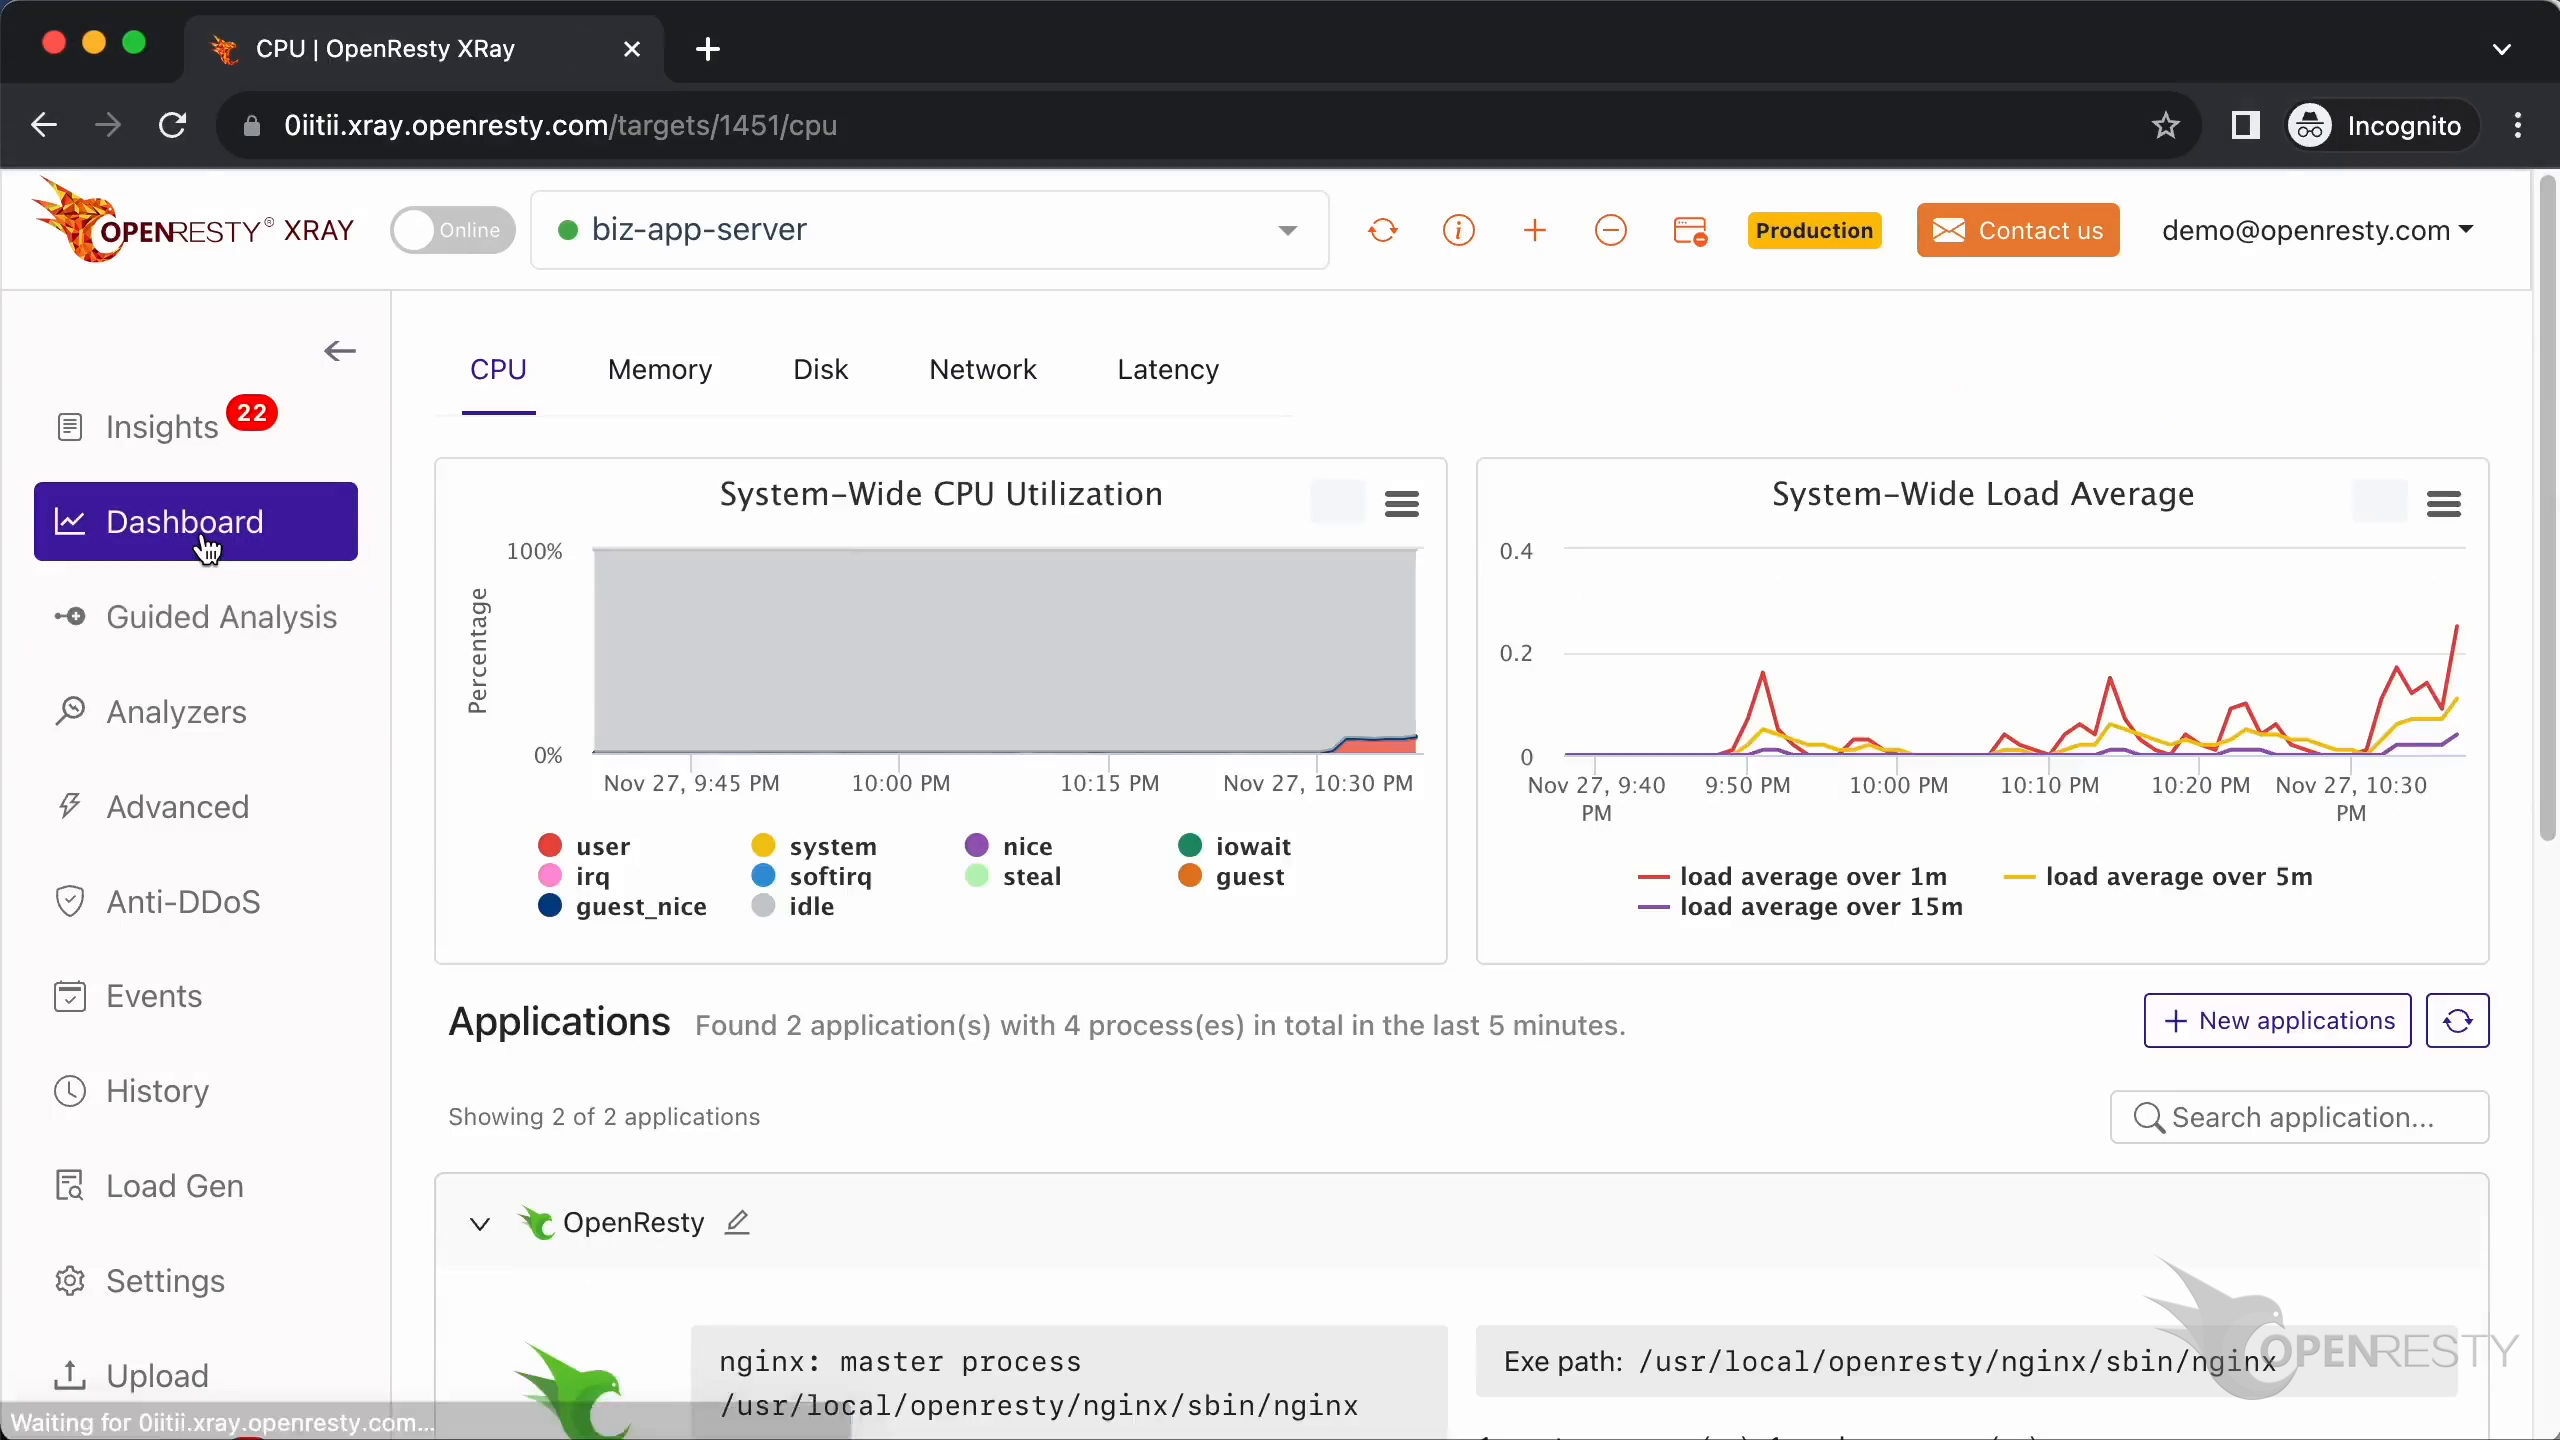
If you are troubleshooting an actual high CPU issue in a PHP application, see how to find the hottest PHP code path: analyzing high CPU usage in PHP applications. We ran the same production-mode overhead measurement on other languages as well — see the results for Go, Rust, Python, and Perl applications.
OpenResty XRay vs. Always-On APM Agents
The reason the overhead stays this low is architectural. Traditional APM agents inject code into the target process and collect data continuously, so they impose runtime overhead at all times — whether or not anyone is looking. OpenResty XRay takes the opposite approach: it is non-intrusive and samples only on demand.
| Traditional always-on APM agent | OpenResty XRay | |
|---|---|---|
| Data collection | Continuous, always on | On demand, only during a user-initiated analysis |
| Target process | Code injection / instrumentation | Non-intrusive, no code modification |
| Overhead when idle | Persistent | Exactly zero |
| Overhead while sampling | Persistent | ~3.7% throughput, +0.22 ms latency |
FAQ
How much performance overhead does OpenResty XRay add to a production PHP application?
During active analysis, OpenResty XRay lowers maximum throughput by about 3.7% (from 369 to 355 requests per second) and adds about 0.22 ms of average latency (from 5.36 ms to 5.58 ms). When the Agent is installed but not actively sampling, throughput and latency are unchanged, and when it is idle the overhead is exactly zero.
Is OpenResty XRay safe to run on a production PHP application?
Yes. The OpenResty XRay Agent is non-intrusive — it performs no code injection or modification on the target process and only collects data when you explicitly start an analysis, at a low sampling frequency. During a 300-second production-mode analysis of a live php process, the one-minute load average rose only from 0.31 to 0.41 and target-process CPU from about 50% to about 53%, so it can be deployed continuously in production.
Does OpenResty XRay slow down my PHP app when it is not actively analyzing?
No. The Agent only collects data while a user-initiated analysis is running. When it is installed but idle, maximum throughput and request latency are identical to having no Agent at all — the performance overhead is exactly zero.
How does OpenResty XRay’s overhead compare to a traditional always-on APM agent?
Traditional APM agents inject code into the target process and run continuously, imposing overhead at all times. OpenResty XRay instead samples on demand at a low frequency, so it adds zero overhead when idle and only about 3.7% throughput impact while actively profiling.
How much CPU and memory does OpenResty XRay use while profiling a PHP process?
While sampling the php process, target-process CPU usage rose from a baseline of about 50% to about 53% (roughly 3 percentage points), CPU idle edged up from 85% to about 85.9%, and available memory held steady at about 2,433 MB — with no meaningful change.
What is OpenResty XRay
OpenResty XRay is a dynamic-tracing product that automatically analyzes your running applications to troubleshoot performance problems, behavioral issues, and security vulnerabilities with actionable suggestions. Under the hood, OpenResty XRay is powered by our Y language targeting various runtimes like Stap+, eBPF+, GDB, and ODB, depending on the contexts.
If you like this tutorial, please subscribe to this blog site and/or our YouTube channel. Thank you!
About The Author
Yichun Zhang (Github handle: agentzh), is the original creator of the OpenResty® open-source project and the CEO of OpenResty Inc..
Yichun is one of the earliest advocates and leaders of “open-source technology”. He worked at many internationally renowned tech companies, such as Cloudflare, Yahoo!. He is a pioneer of “edge computing”, “dynamic tracing” and “machine coding”, with over 22 years of programming and 16 years of open source experience. Yichun is well-known in the open-source space as the project leader of OpenResty®, adopted by more than 40 million global website domains.
OpenResty Inc., the enterprise software start-up founded by Yichun in 2017, has customers from some of the biggest companies in the world. Its flagship product, OpenResty XRay, is a non-invasive profiling and troubleshooting tool that significantly enhances and utilizes dynamic tracing technology. And its OpenResty Edge product is a powerful distributed traffic management and private CDN software product.
As an avid open-source contributor, Yichun has contributed more than a million lines of code to numerous open-source projects, including Linux kernel, Nginx, LuaJIT, GDB, SystemTap, LLVM, Perl, etc. He has also authored more than 60 open-source software libraries.
Related Articles
OpenResty XRay Dec 25, 2023

OpenResty XRay Dec 7, 2023

OpenResty XRay Nov 27, 2023

OpenResty XRay Nov 27, 2023

OpenResty XRay Aug 4, 2024