PHP High CPU Usage: Find the Hottest Code Path with OpenResty XRay
To find which PHP function is causing high CPU usage, attach OpenResty XRay to the already-running PHP process — no recompiling and no restarting. Its Guided Analysis produces a CPU flame graph of the live process. In this case the hottest path was a preg_match call inside the processOrders business function, reached through Laravel’s callAction, pointing straight at a regular expression as the CPU bottleneck. Concerned about the overhead on a live PHP process? We measured it end to end.
Today I will show you another step-by-step guide for analyzing PHP applications with OpenResty XRay. We’ll quickly pinpoint the hottest code paths in an already-running PHP process. These code paths might take most of the CPU time of your applications. OpenResty XRay is a truly non-intrusive dynamic analysis tool that requires no installation of any special modules or plugins in the target application, no recompilation of the target application, and even no need to restart the running processes.
Problem: high CPU usage
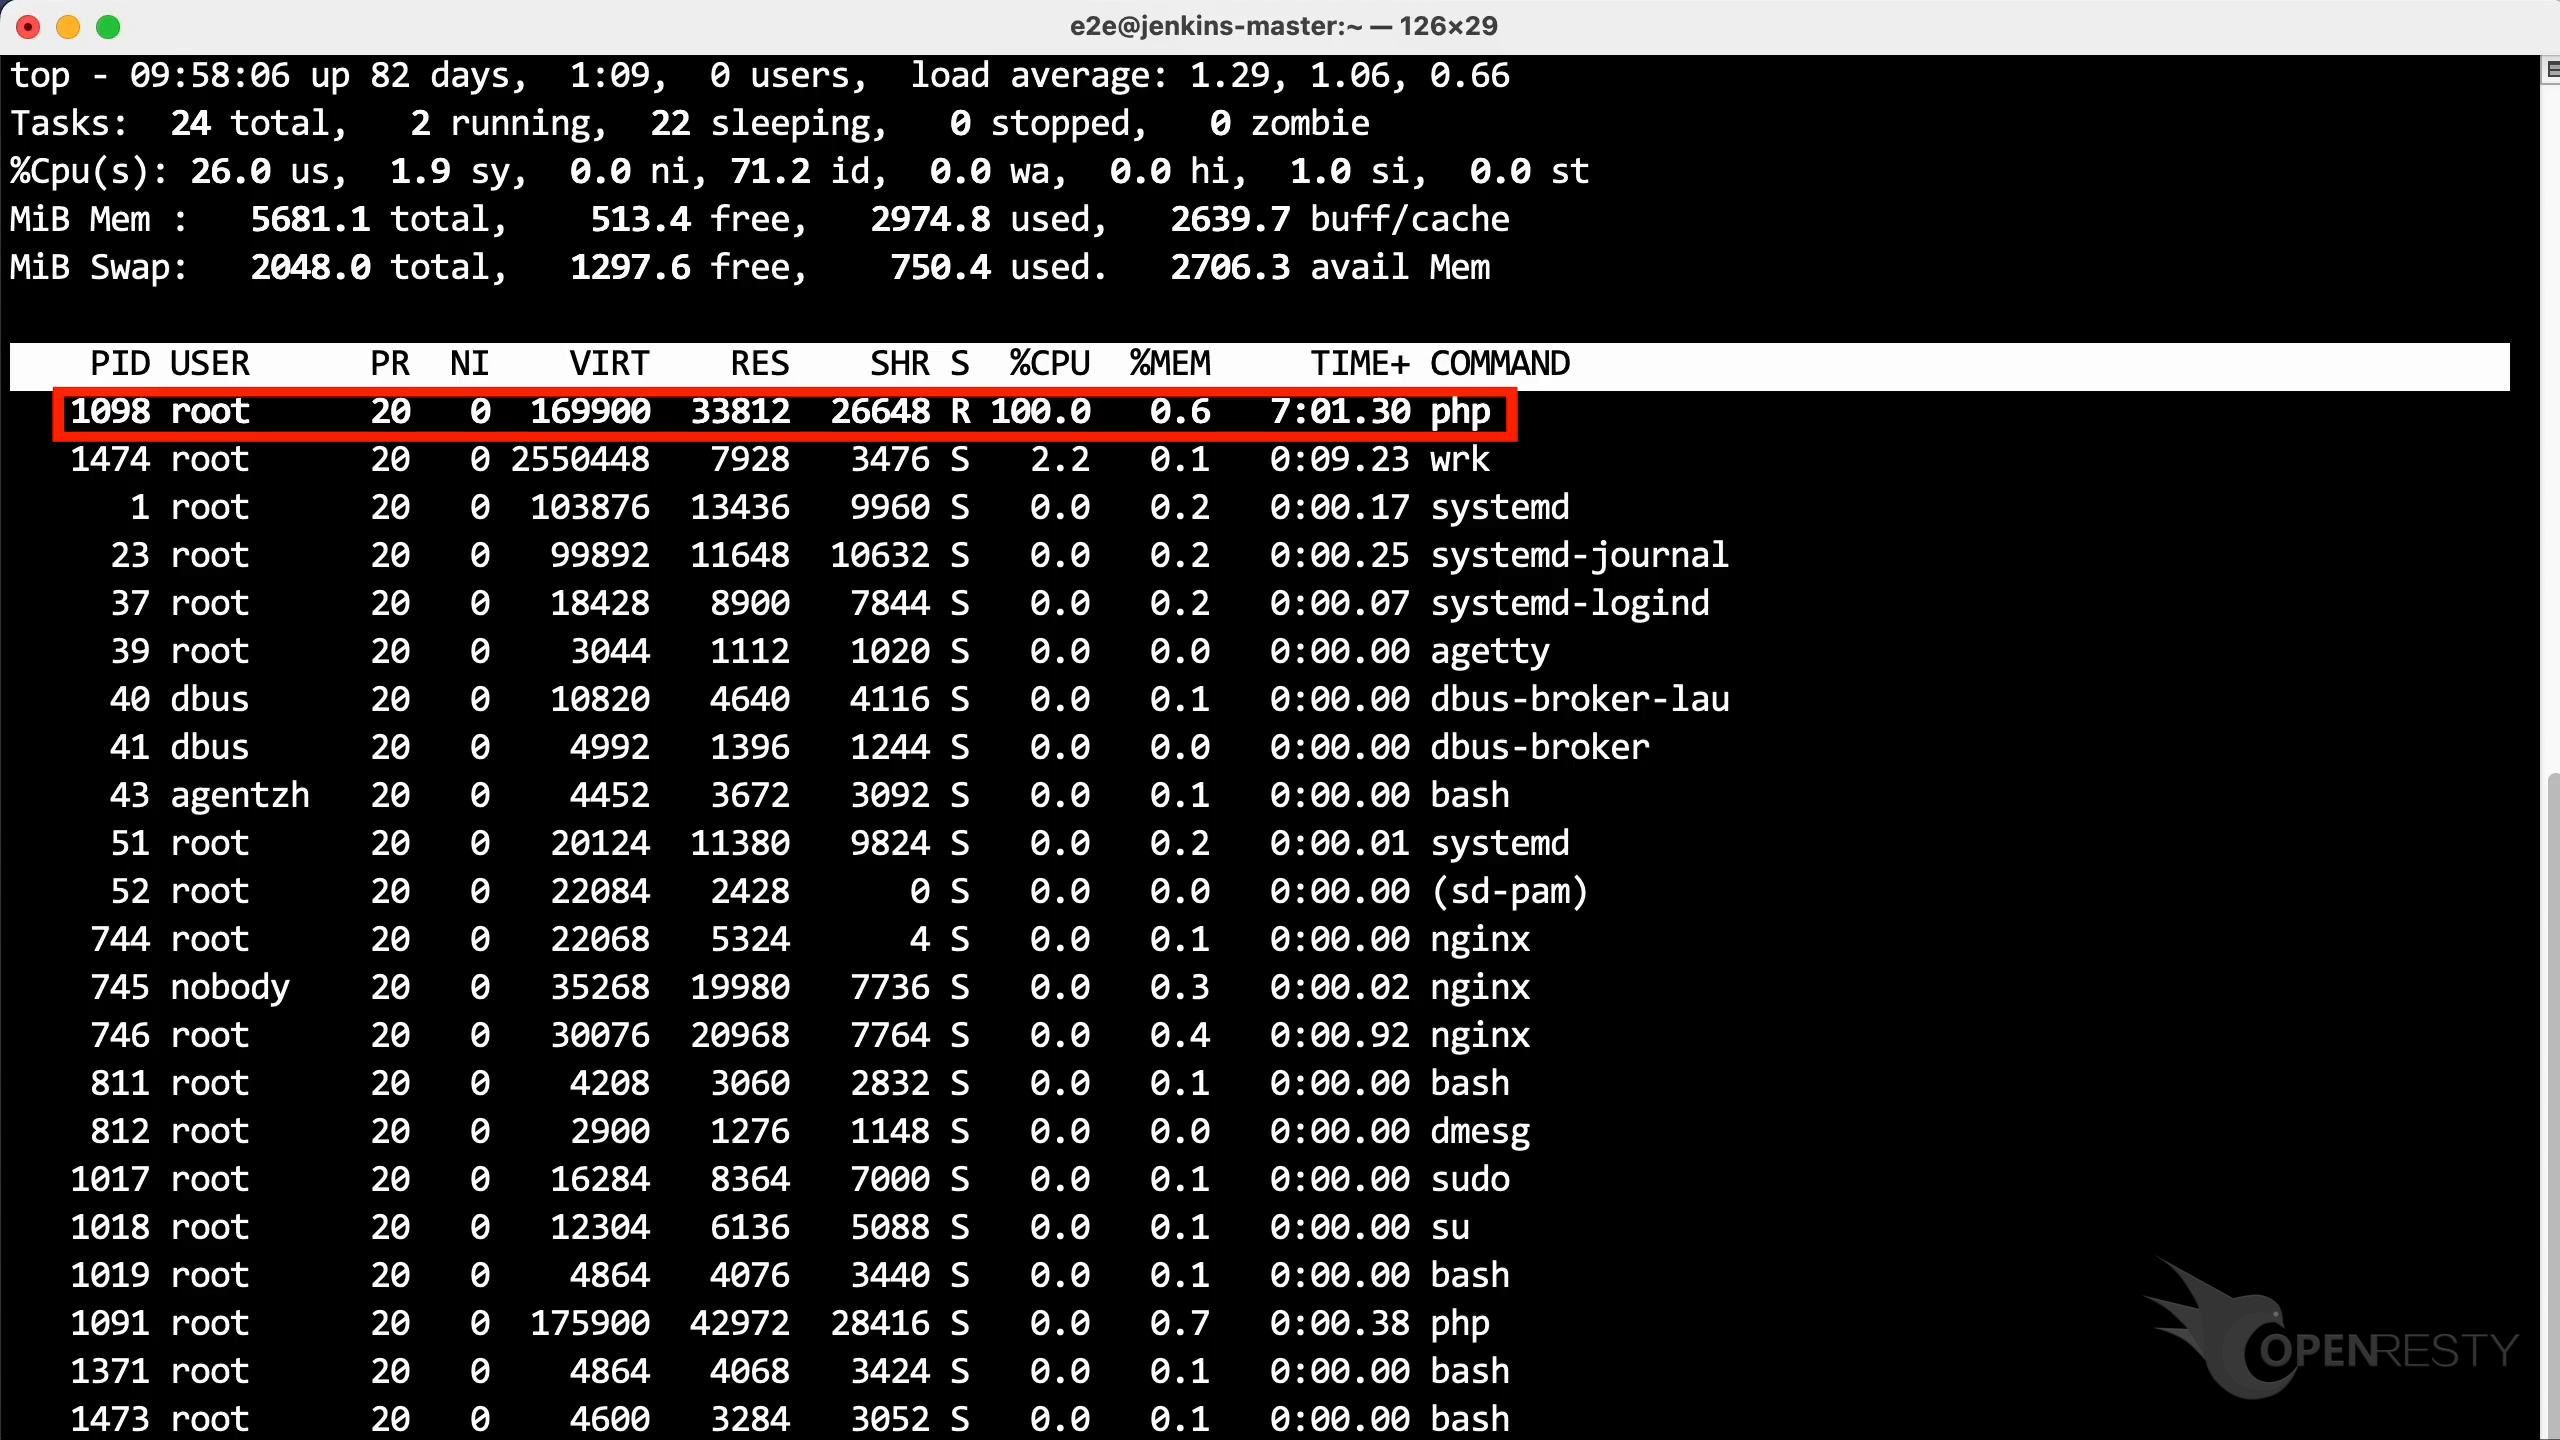
Let’s run the top command to check the CPU usage. As shown, the php process consumes 100% of a CPU core.
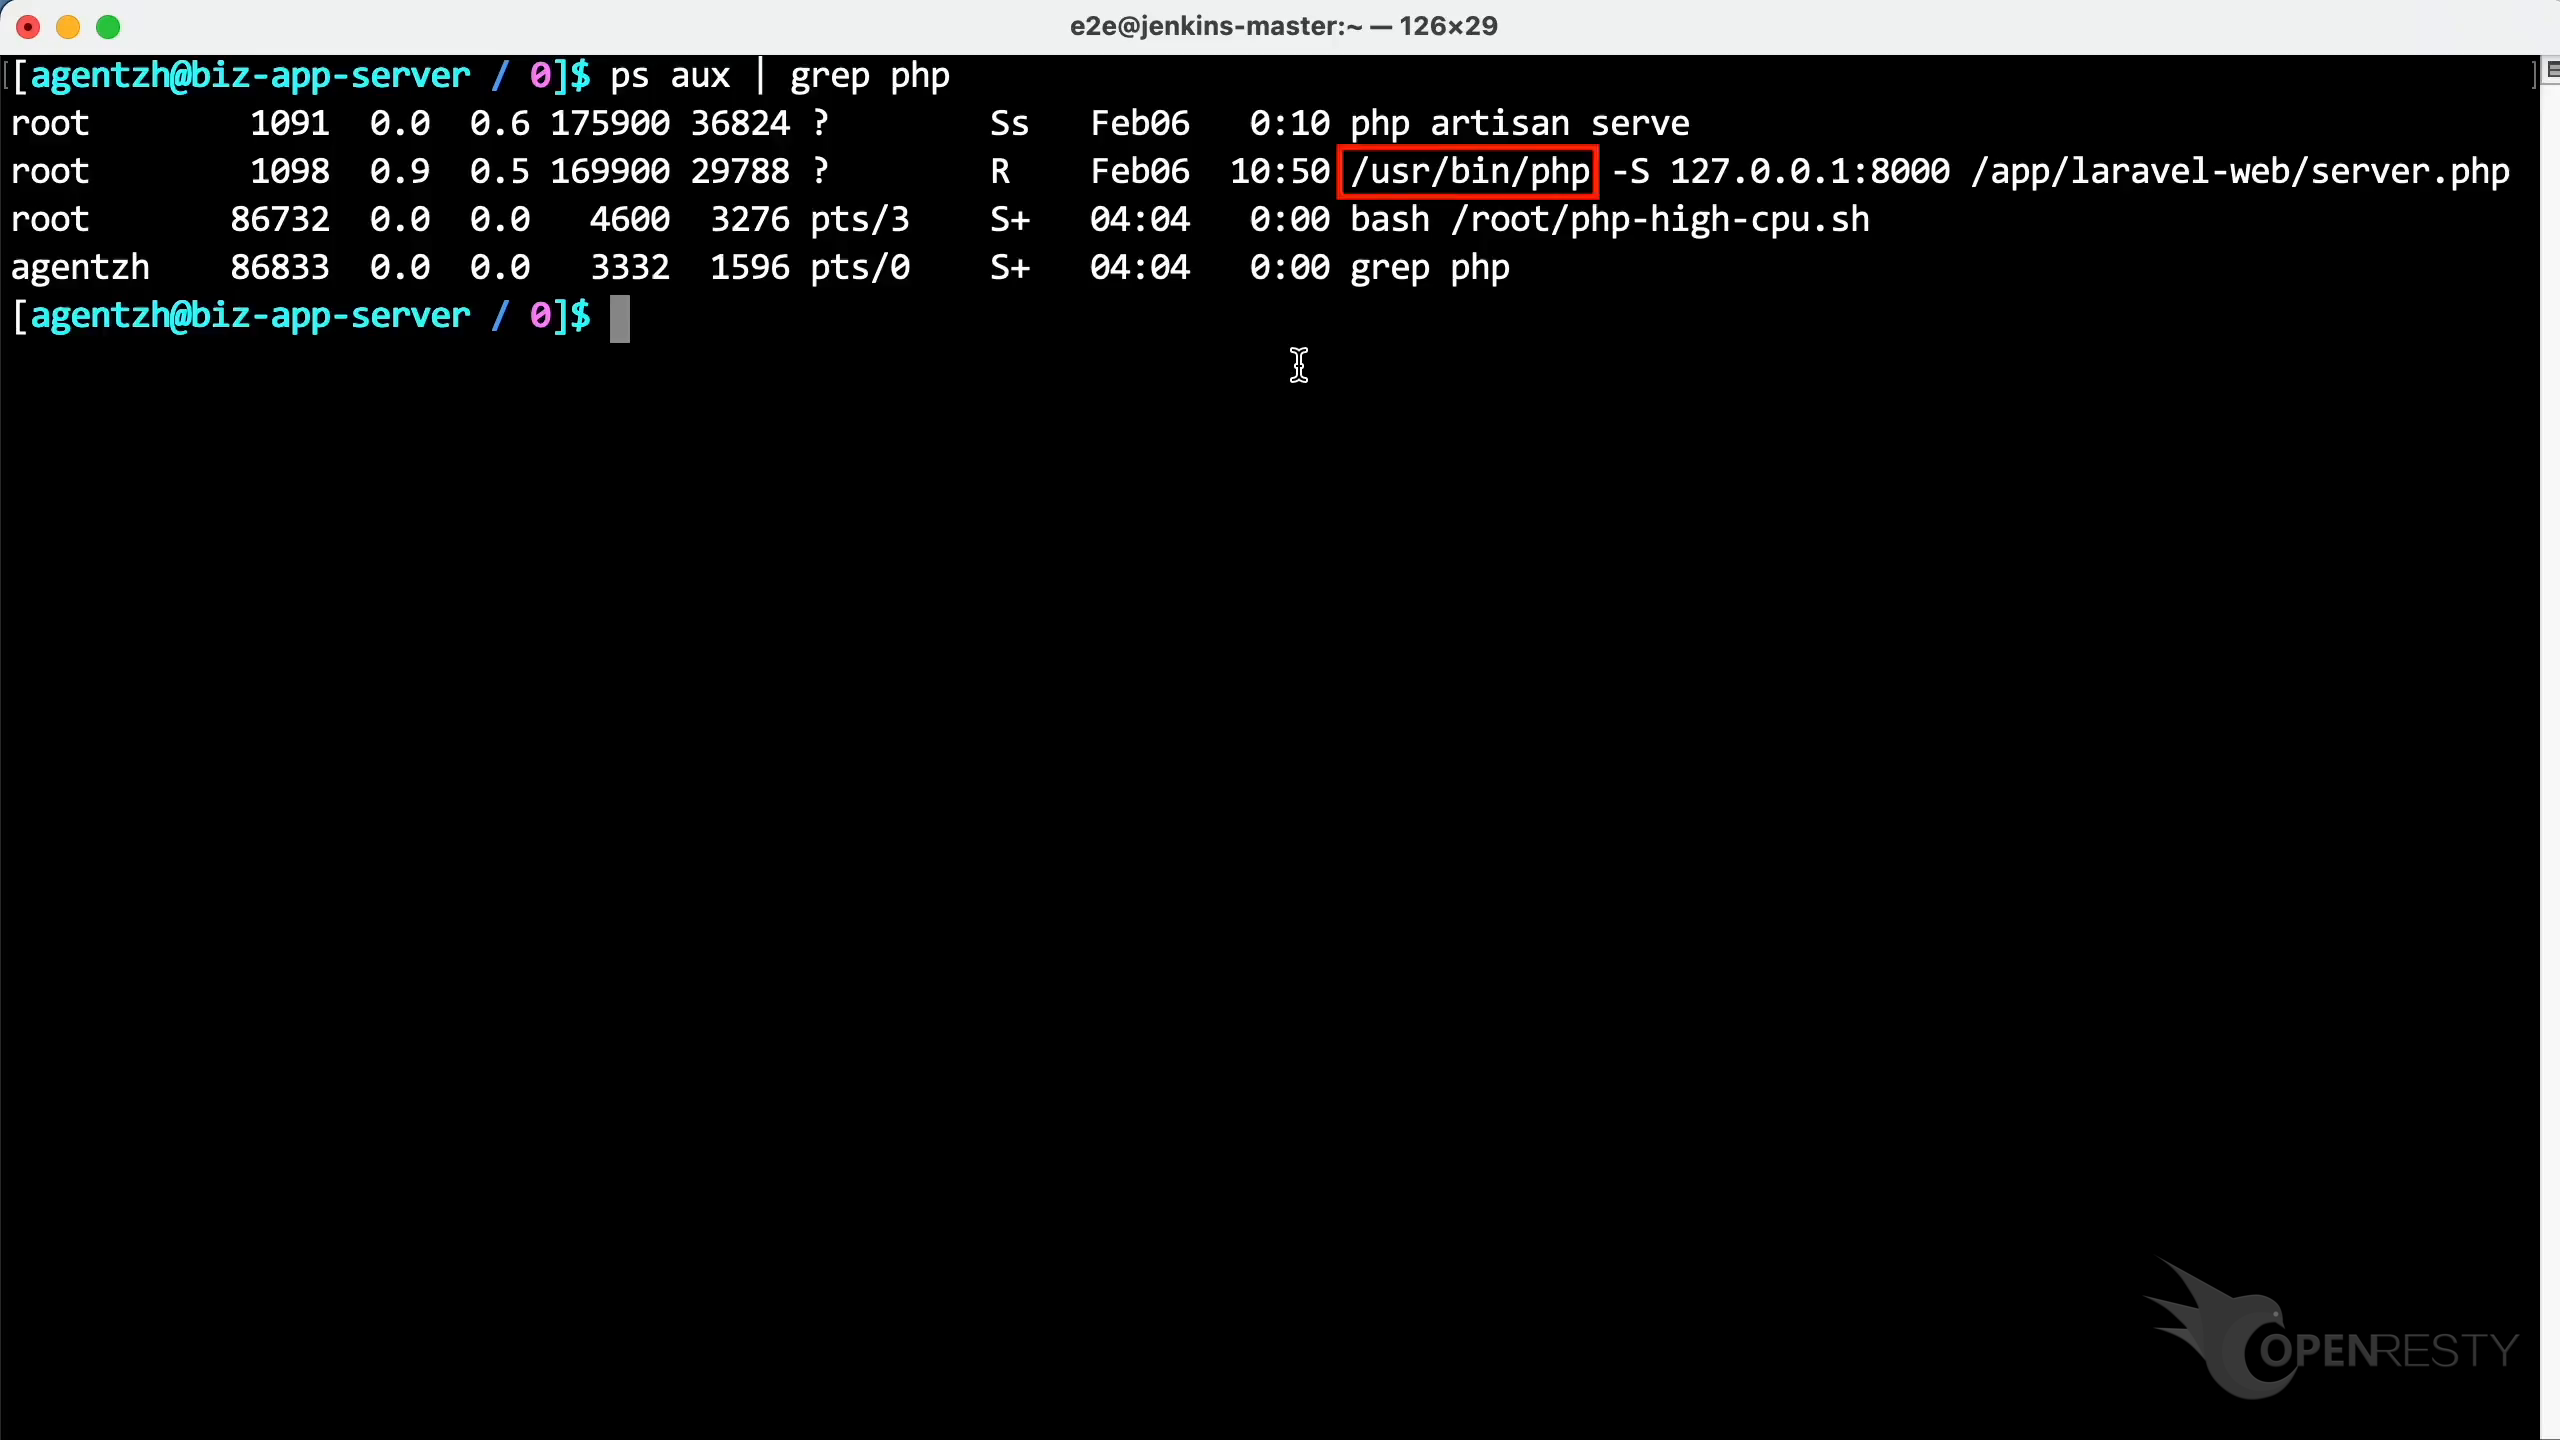
Run the ps command to see the full command line for this process. We can see it is the standard PHP binary executable shipped with the Linux distribution.
Find which PHP function is using the CPU
Let’s use OpenResty XRay to check out this unmodified process and figure out what’s going on in real time.
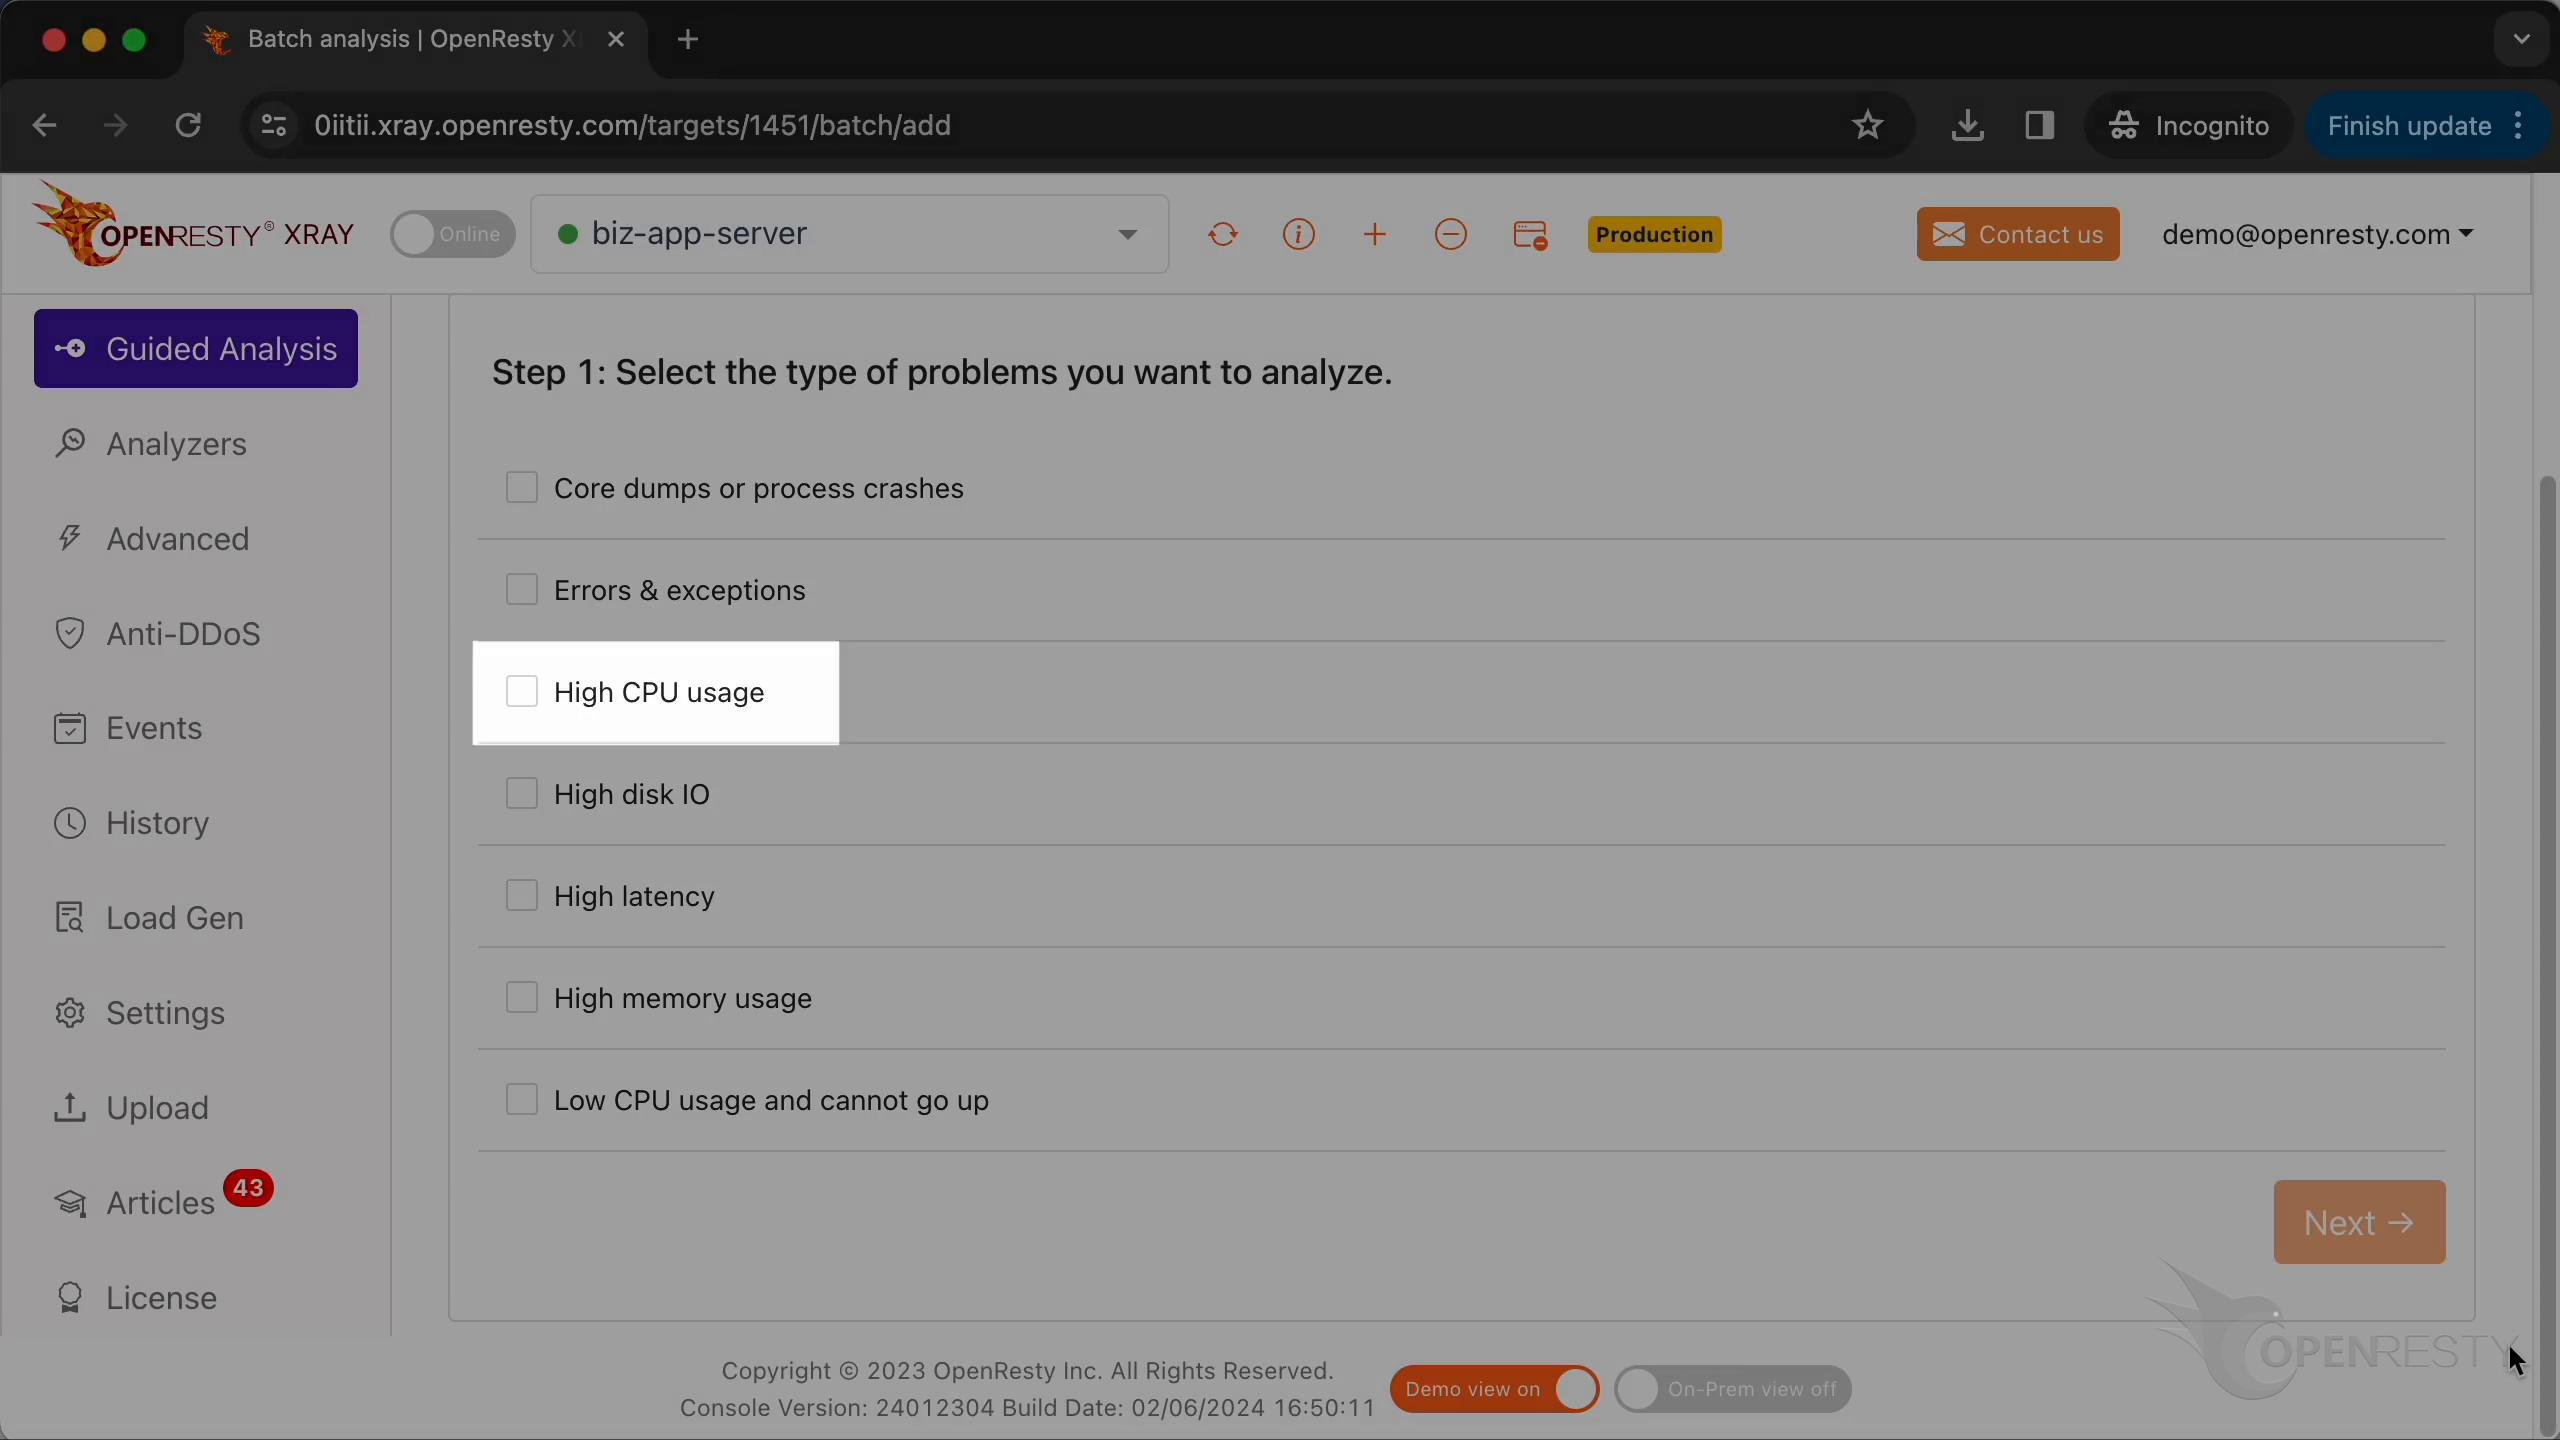
Open the OpenResty XRay web console, confirm you are on the machine running the hot PHP process (you can pick a different machine from the list if needed), and go to the “Guided Analysis” page. From the list of problem types, choose “High CPU usage”.
Next, point the analysis at the PHP application and select the process consuming 100% of the CPU — the same one we saw earlier in top. OpenResty XRay can analyze multiple language levels at once, so we keep both the PHP and C/C++ levels selected and leave the maximum analyzing time at the default 300 seconds. Start the analysis; it runs successive rounds automatically, and after the first couple of rounds we have enough data, so we stop it and let it build the report.
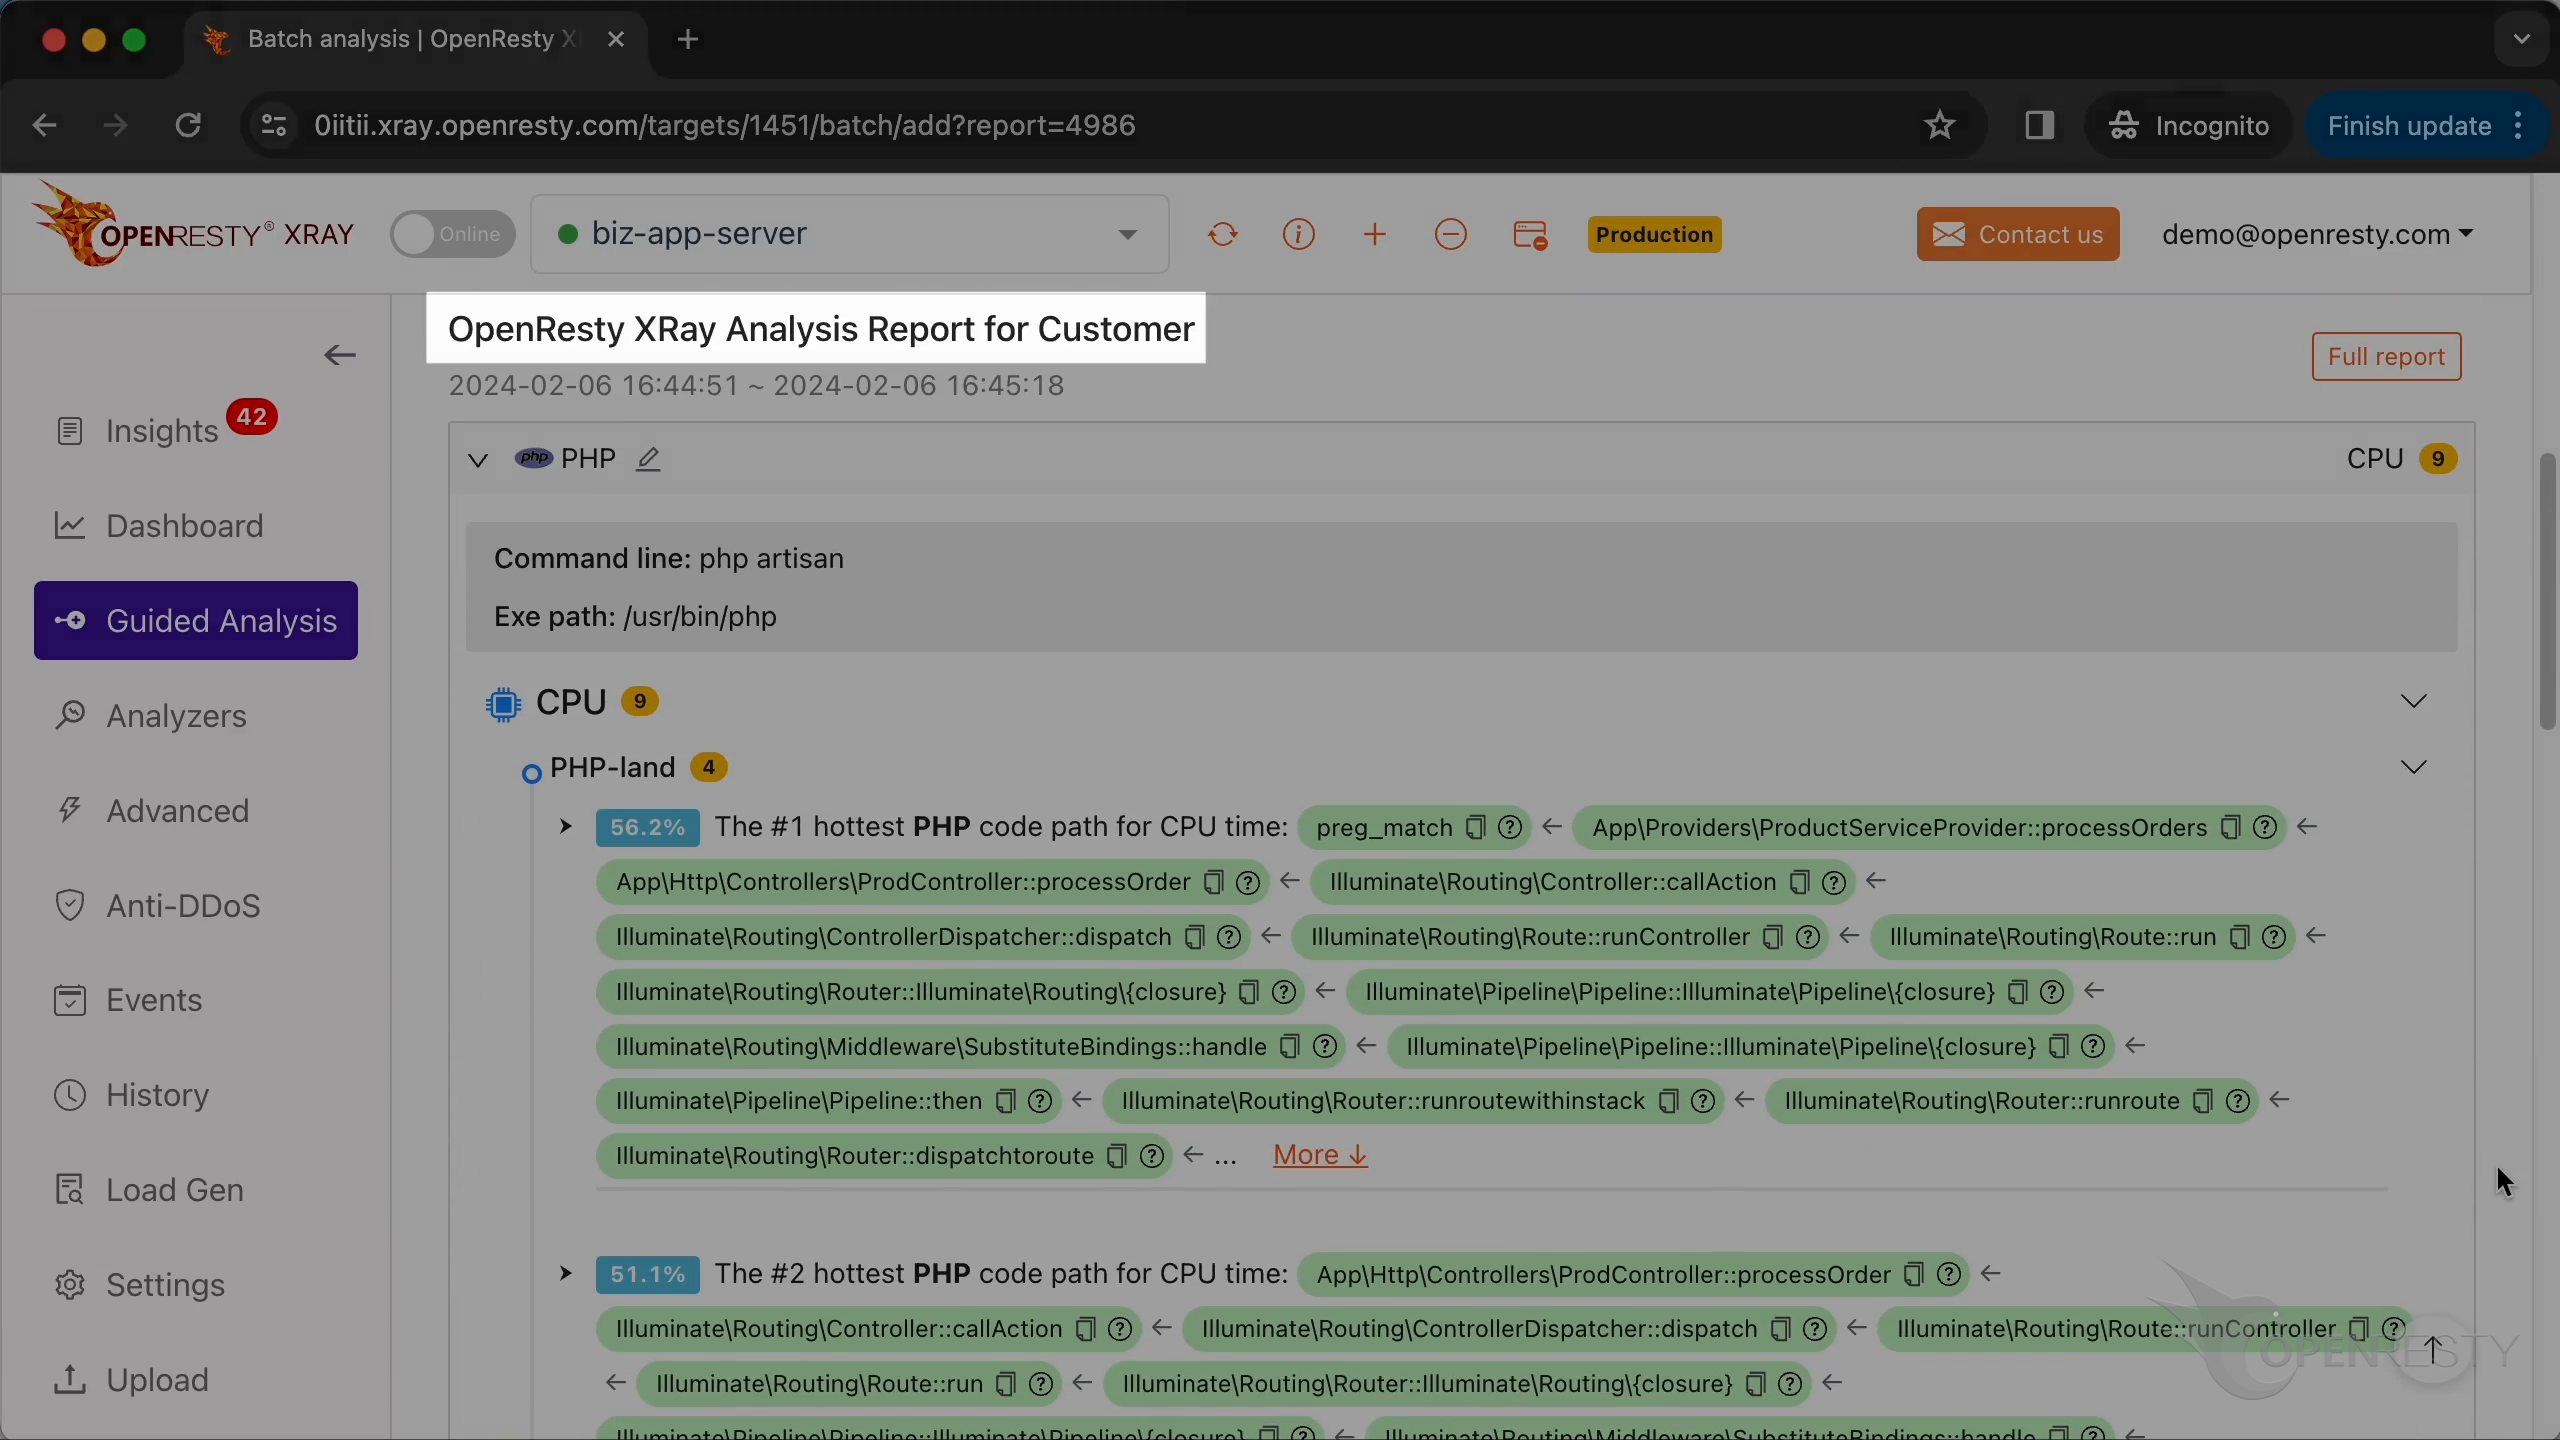
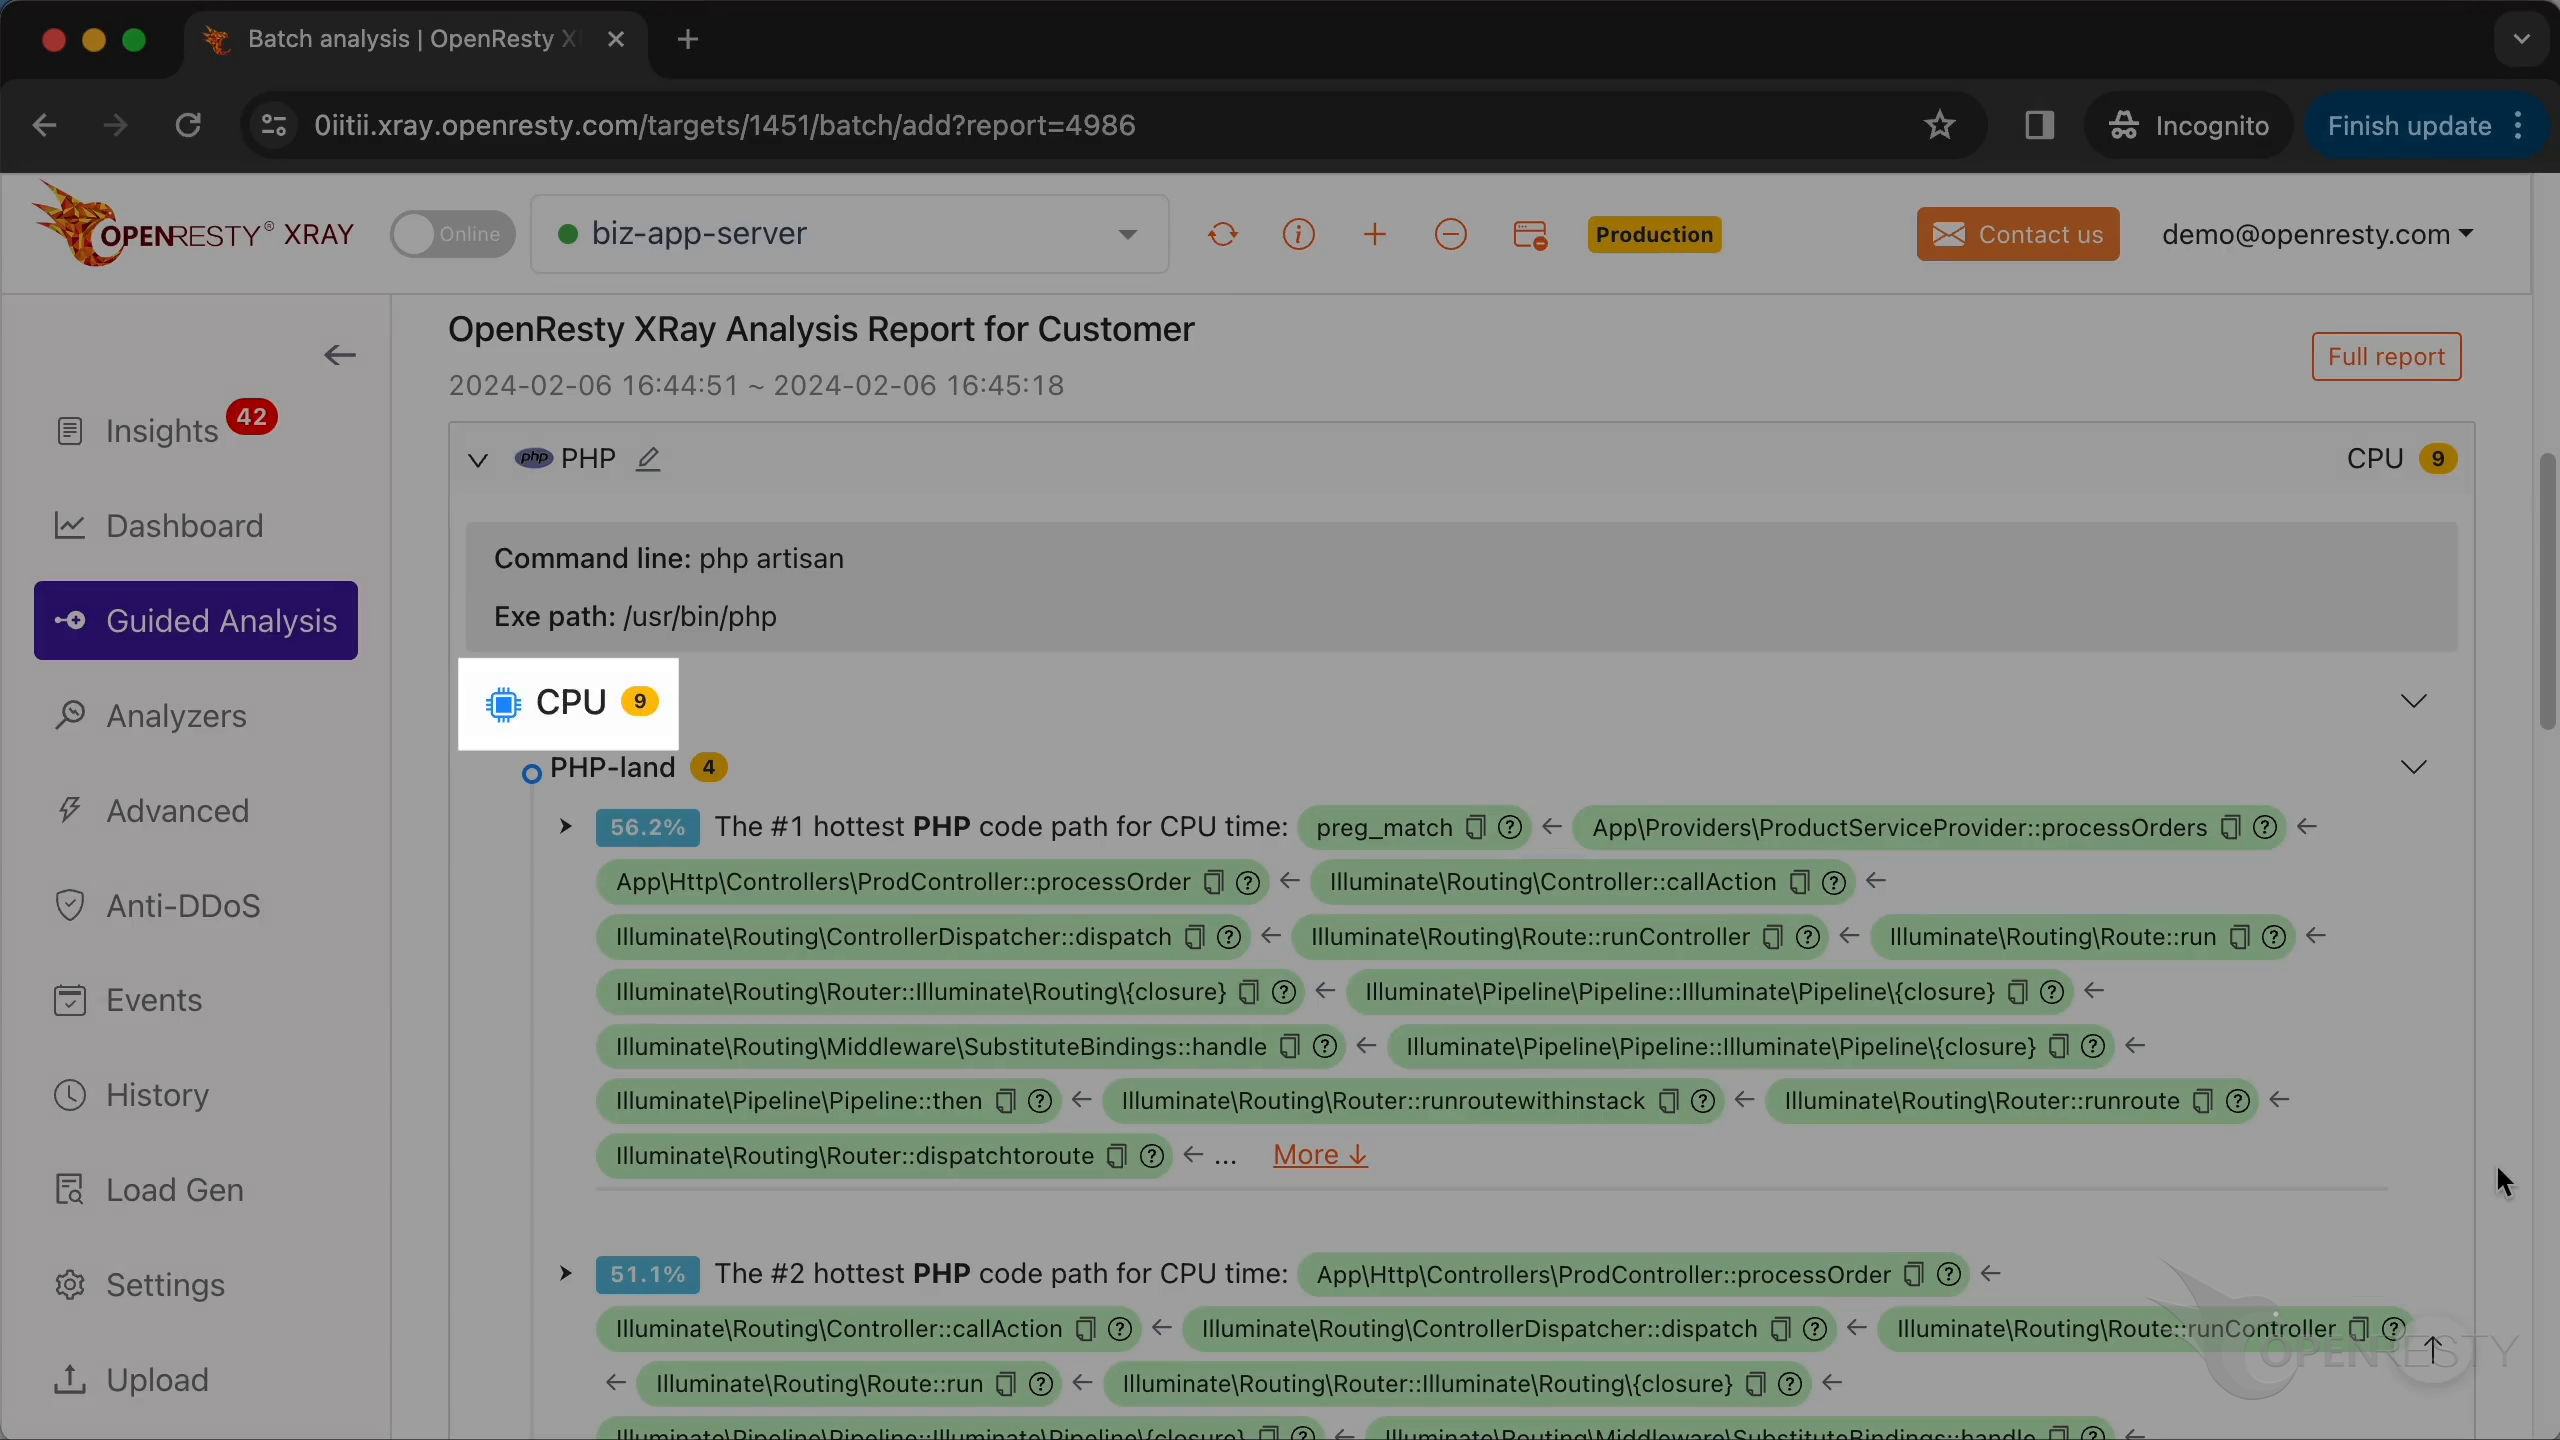
This is the problem type we are analyzing now: CPU.
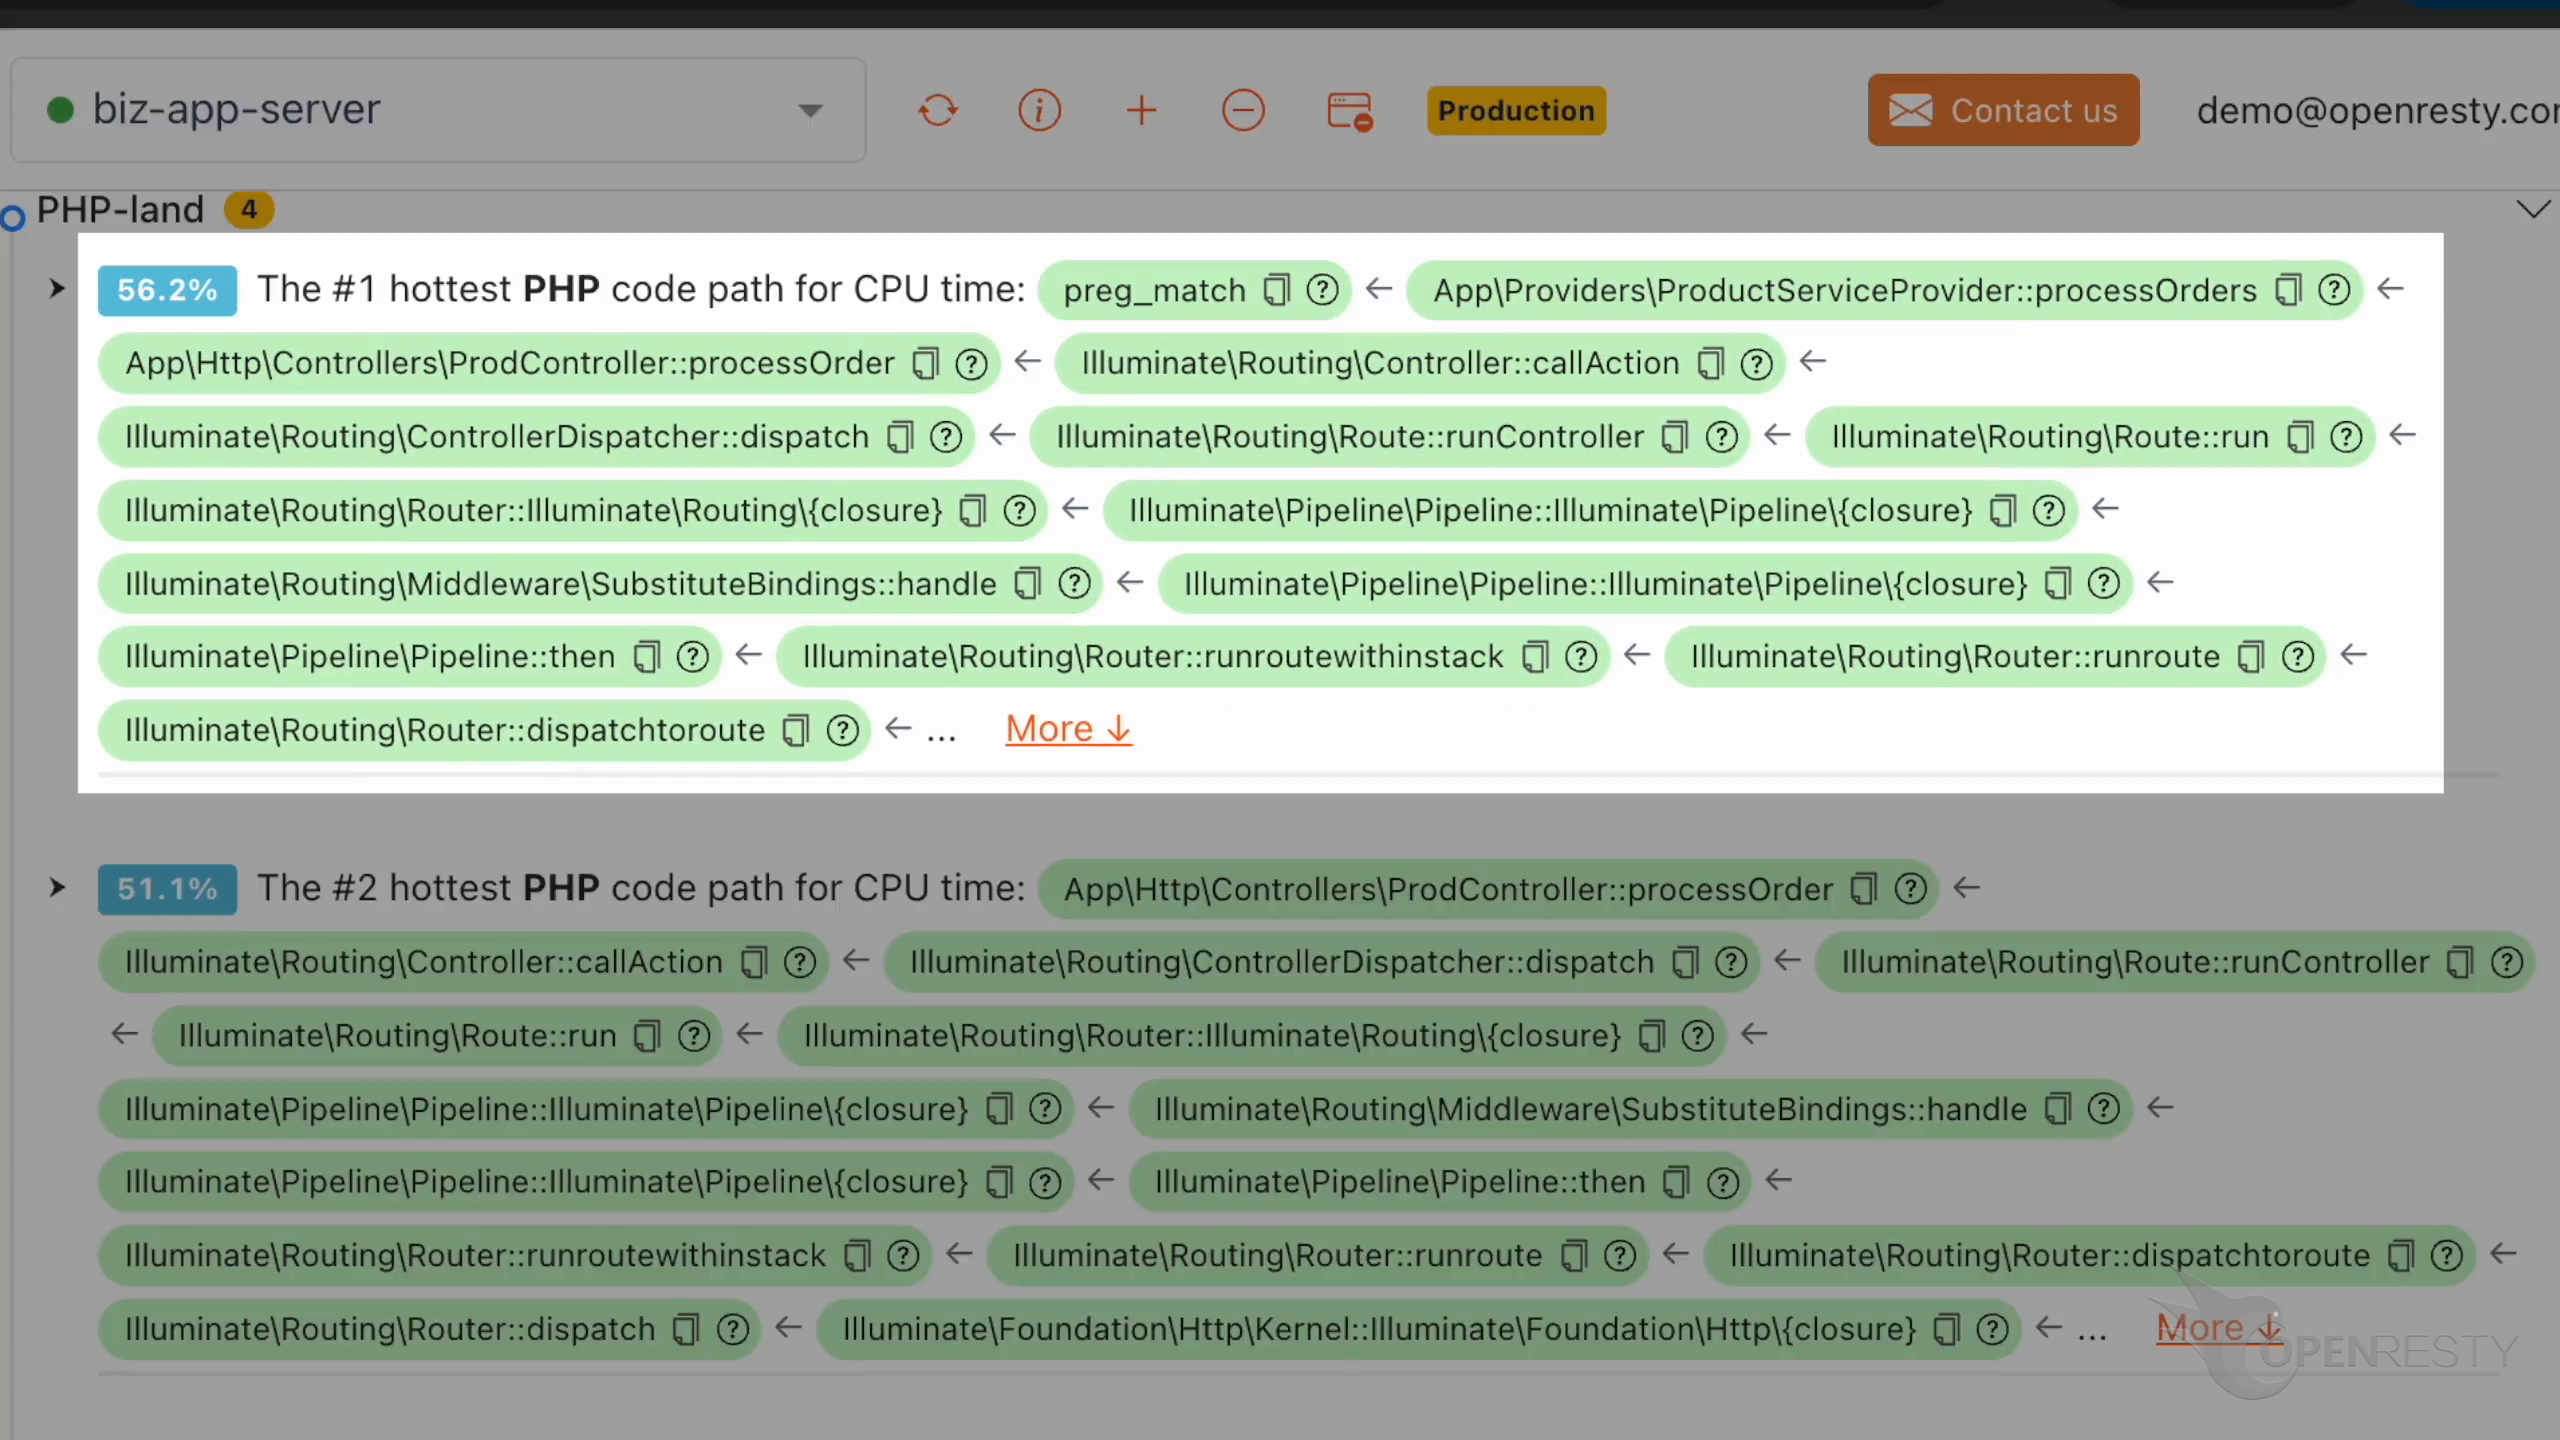
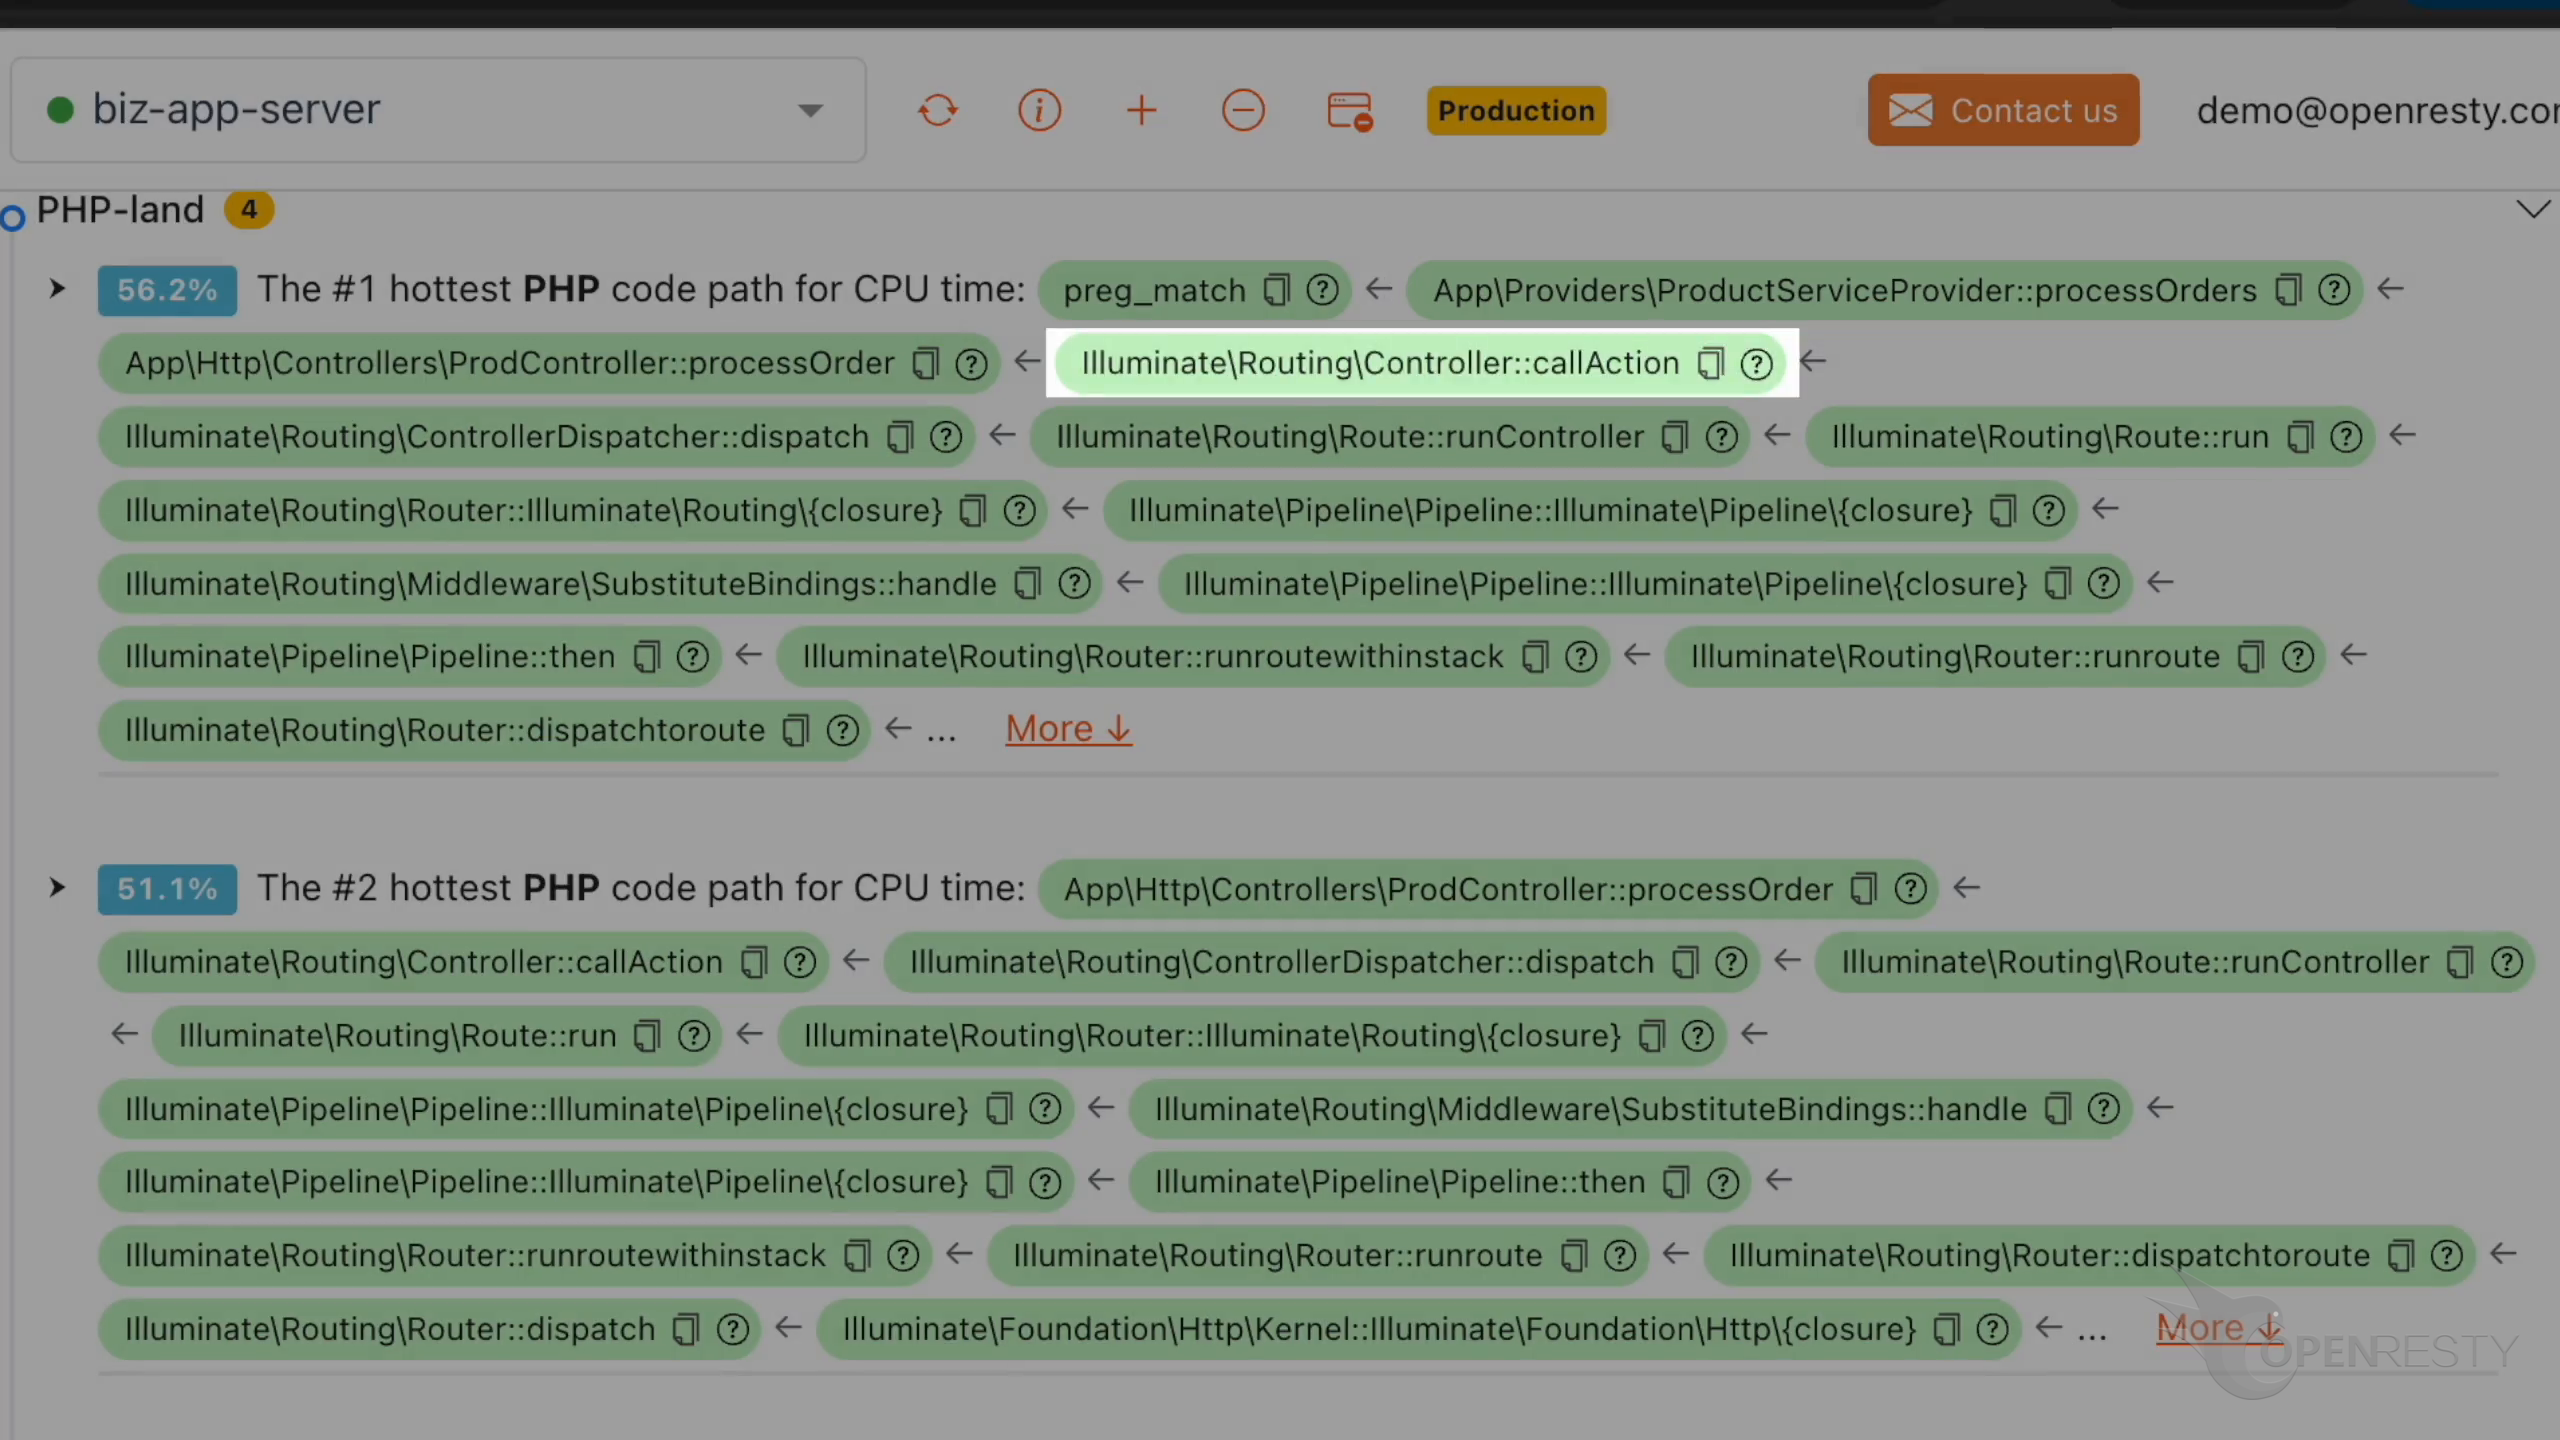
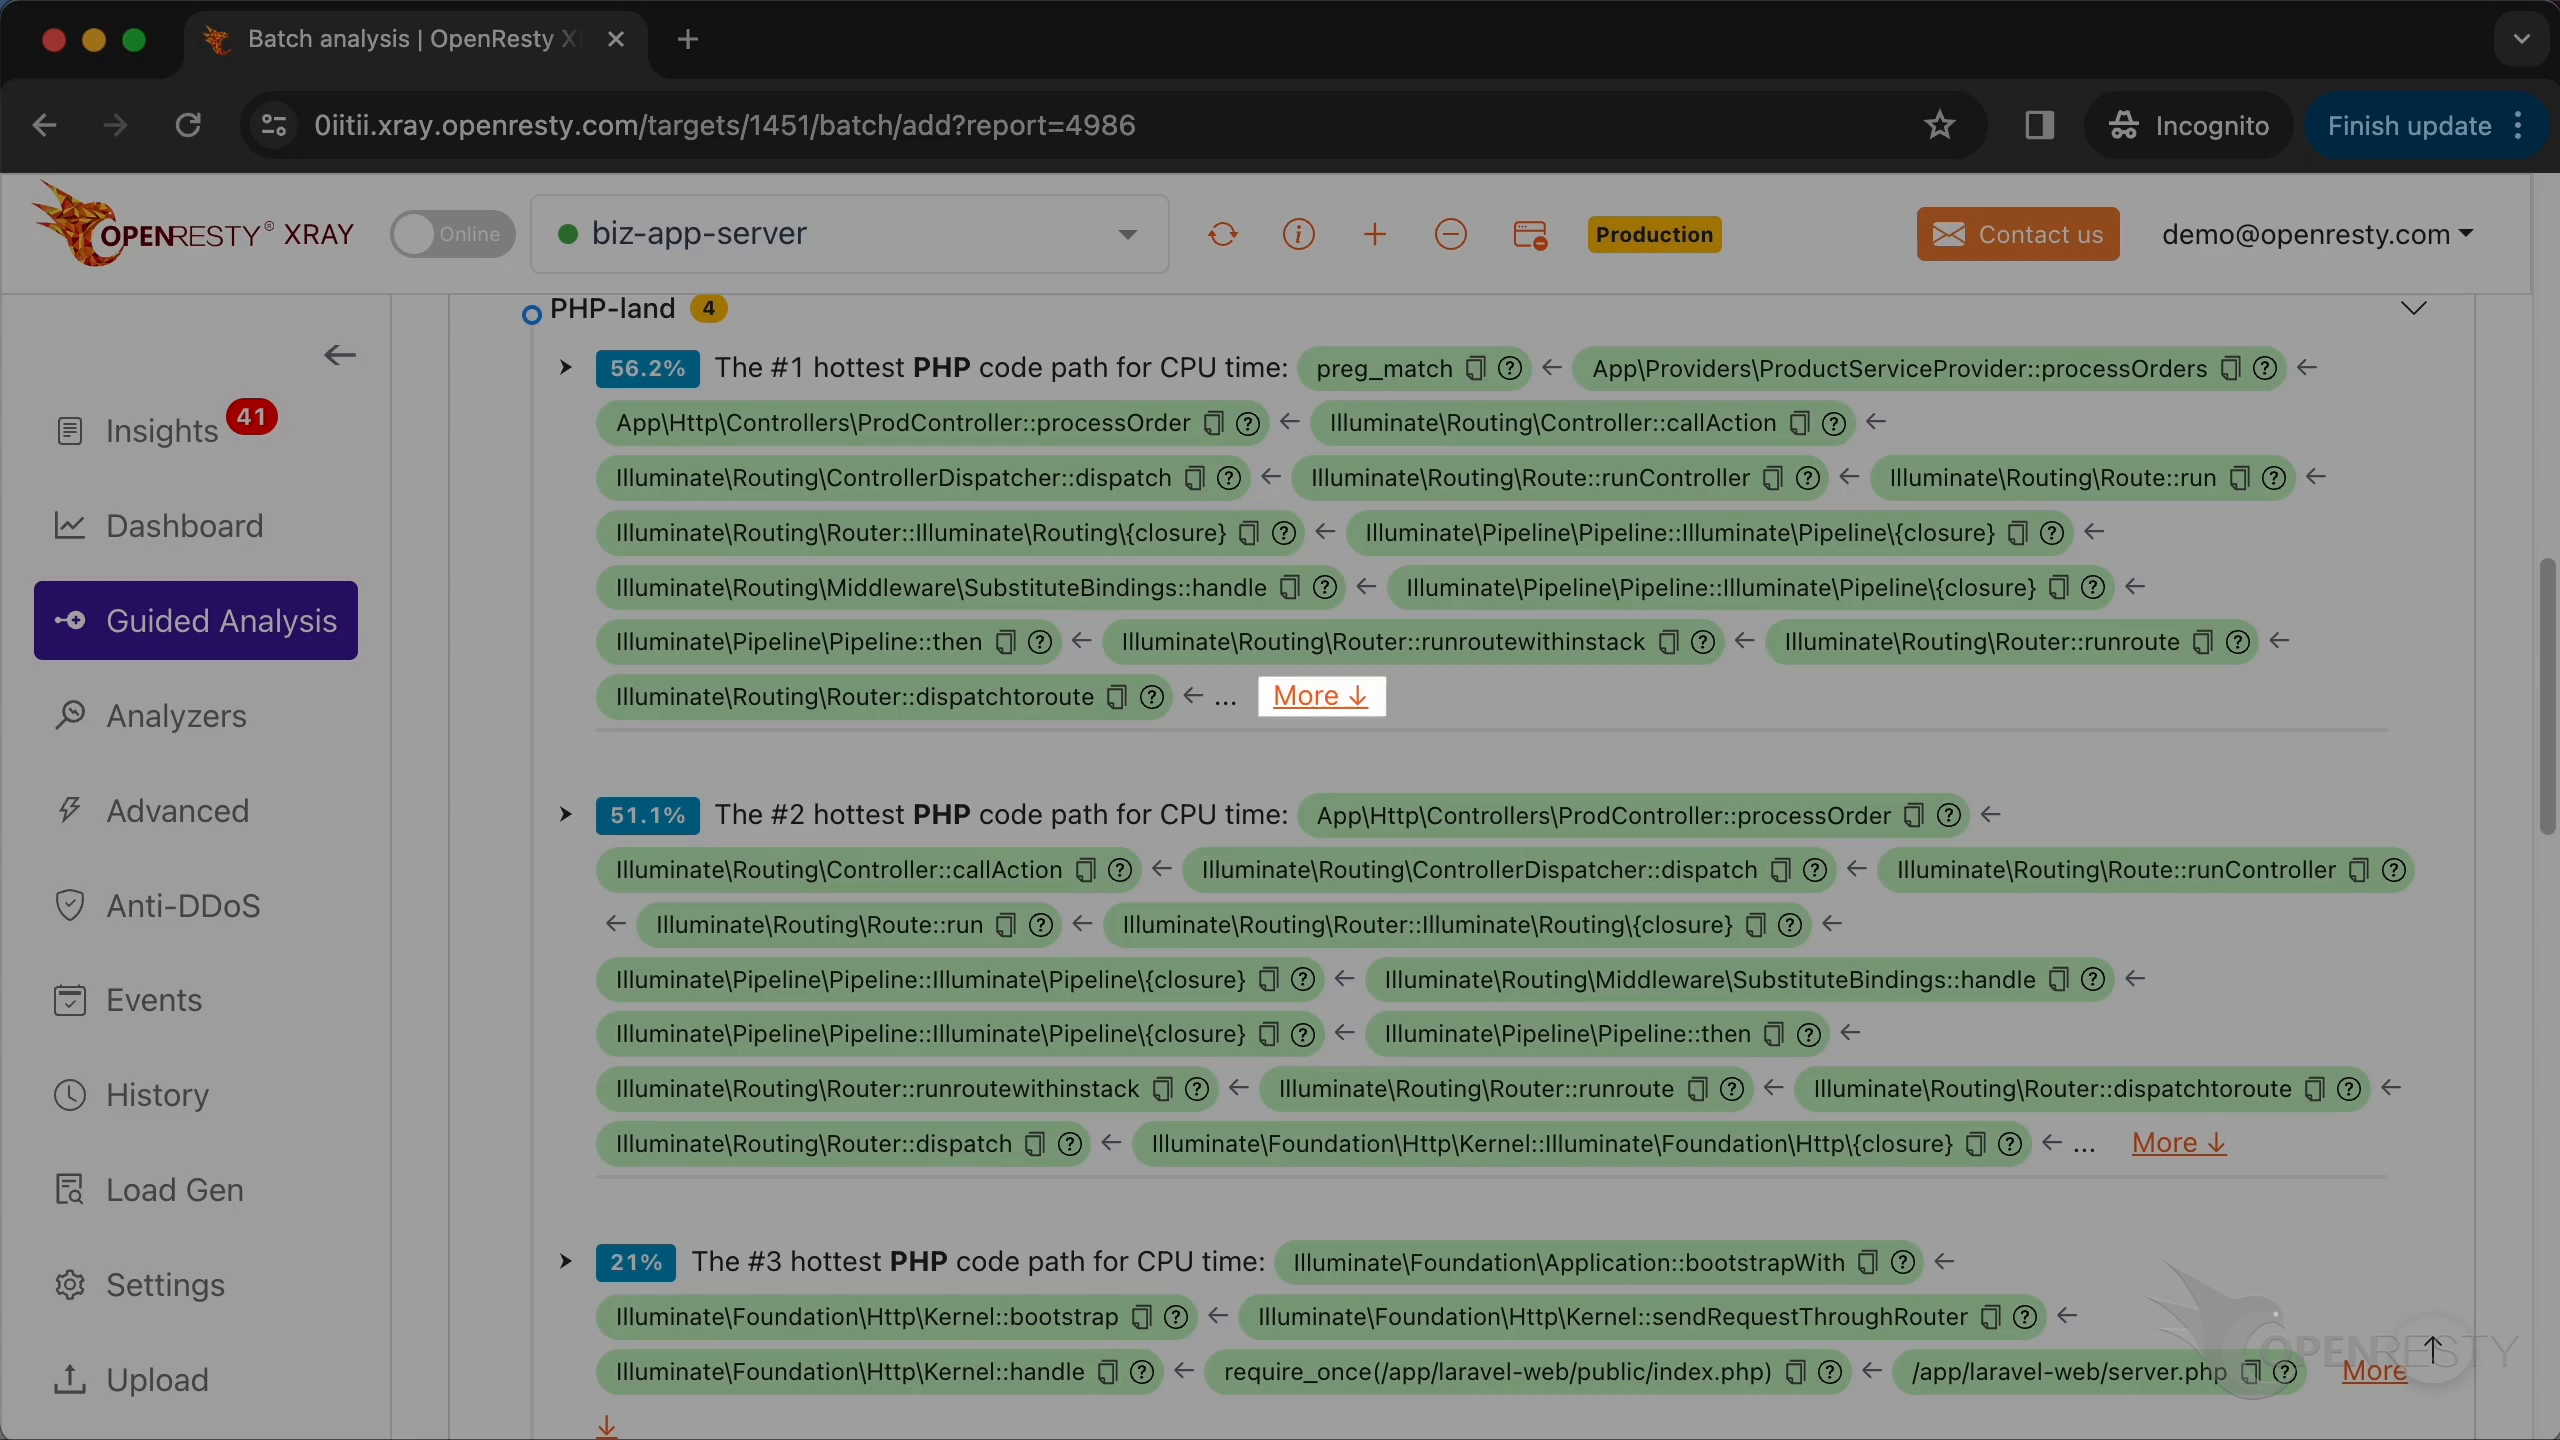
This is the #1 hottest PHP code path using the most CPU time, taking 56.2% of the CPU time:
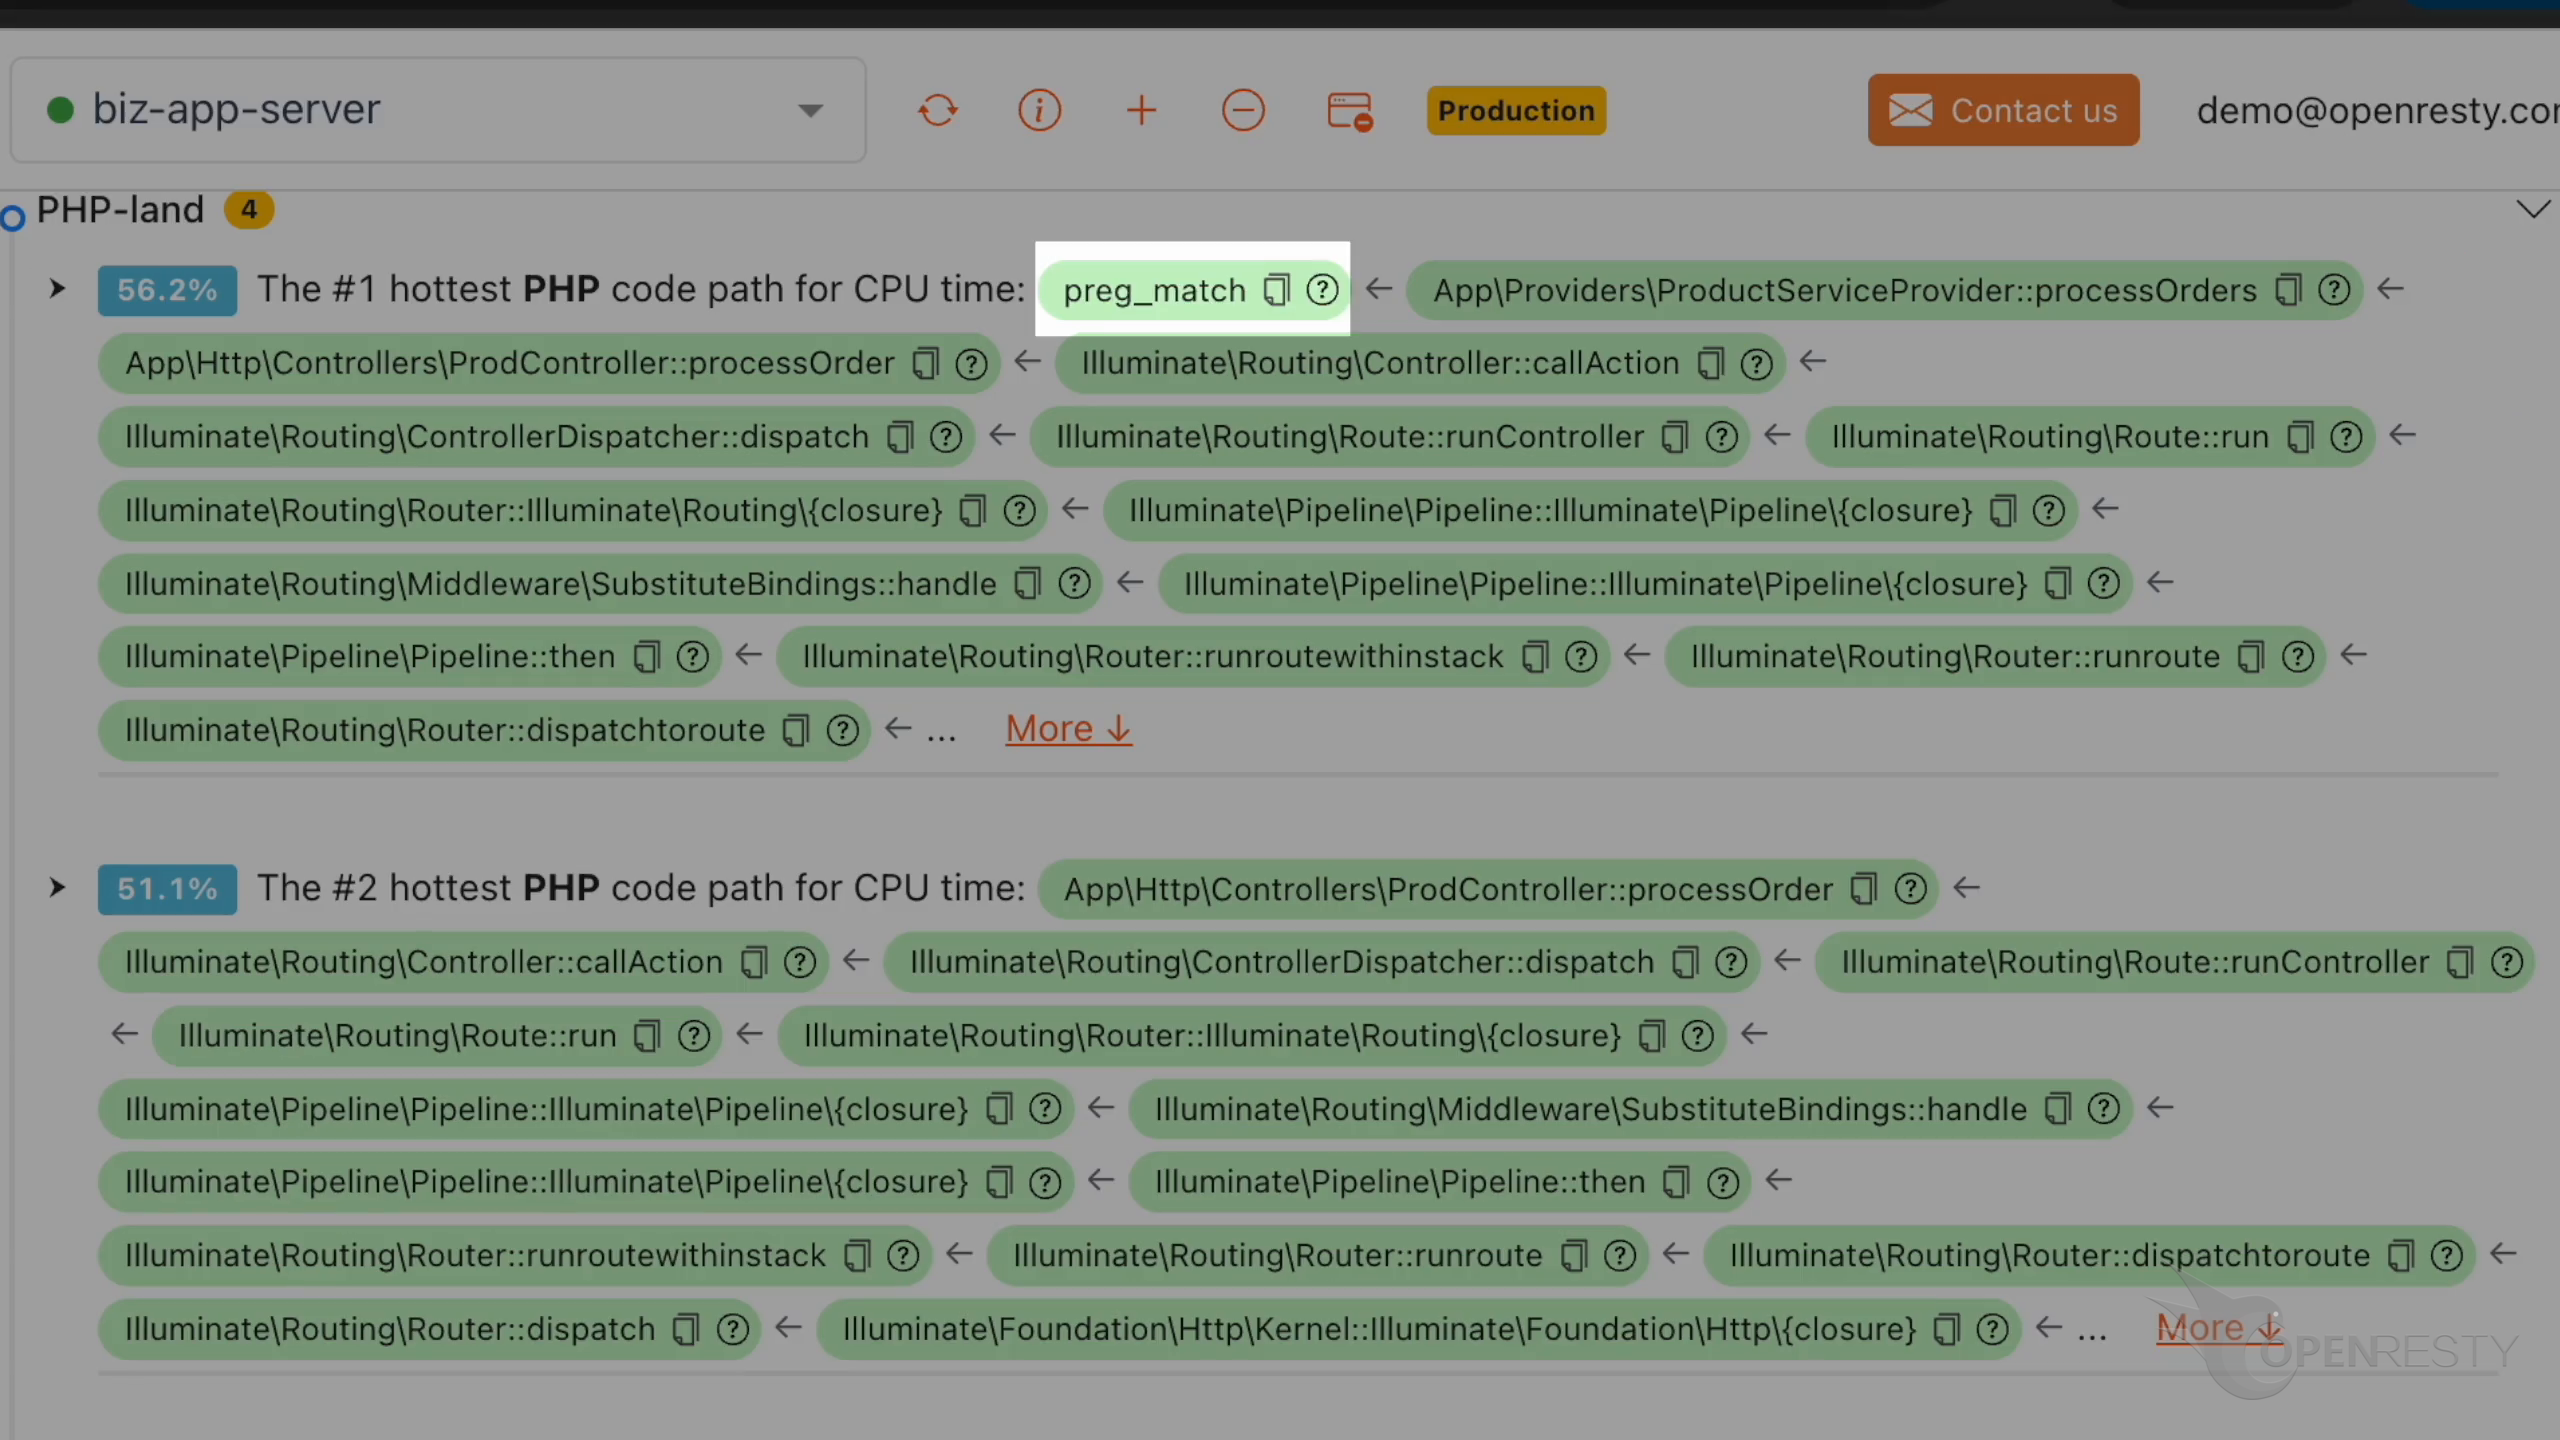
The hottest function call is preg_match. It is PHP’s wrapper for regular expression matching:
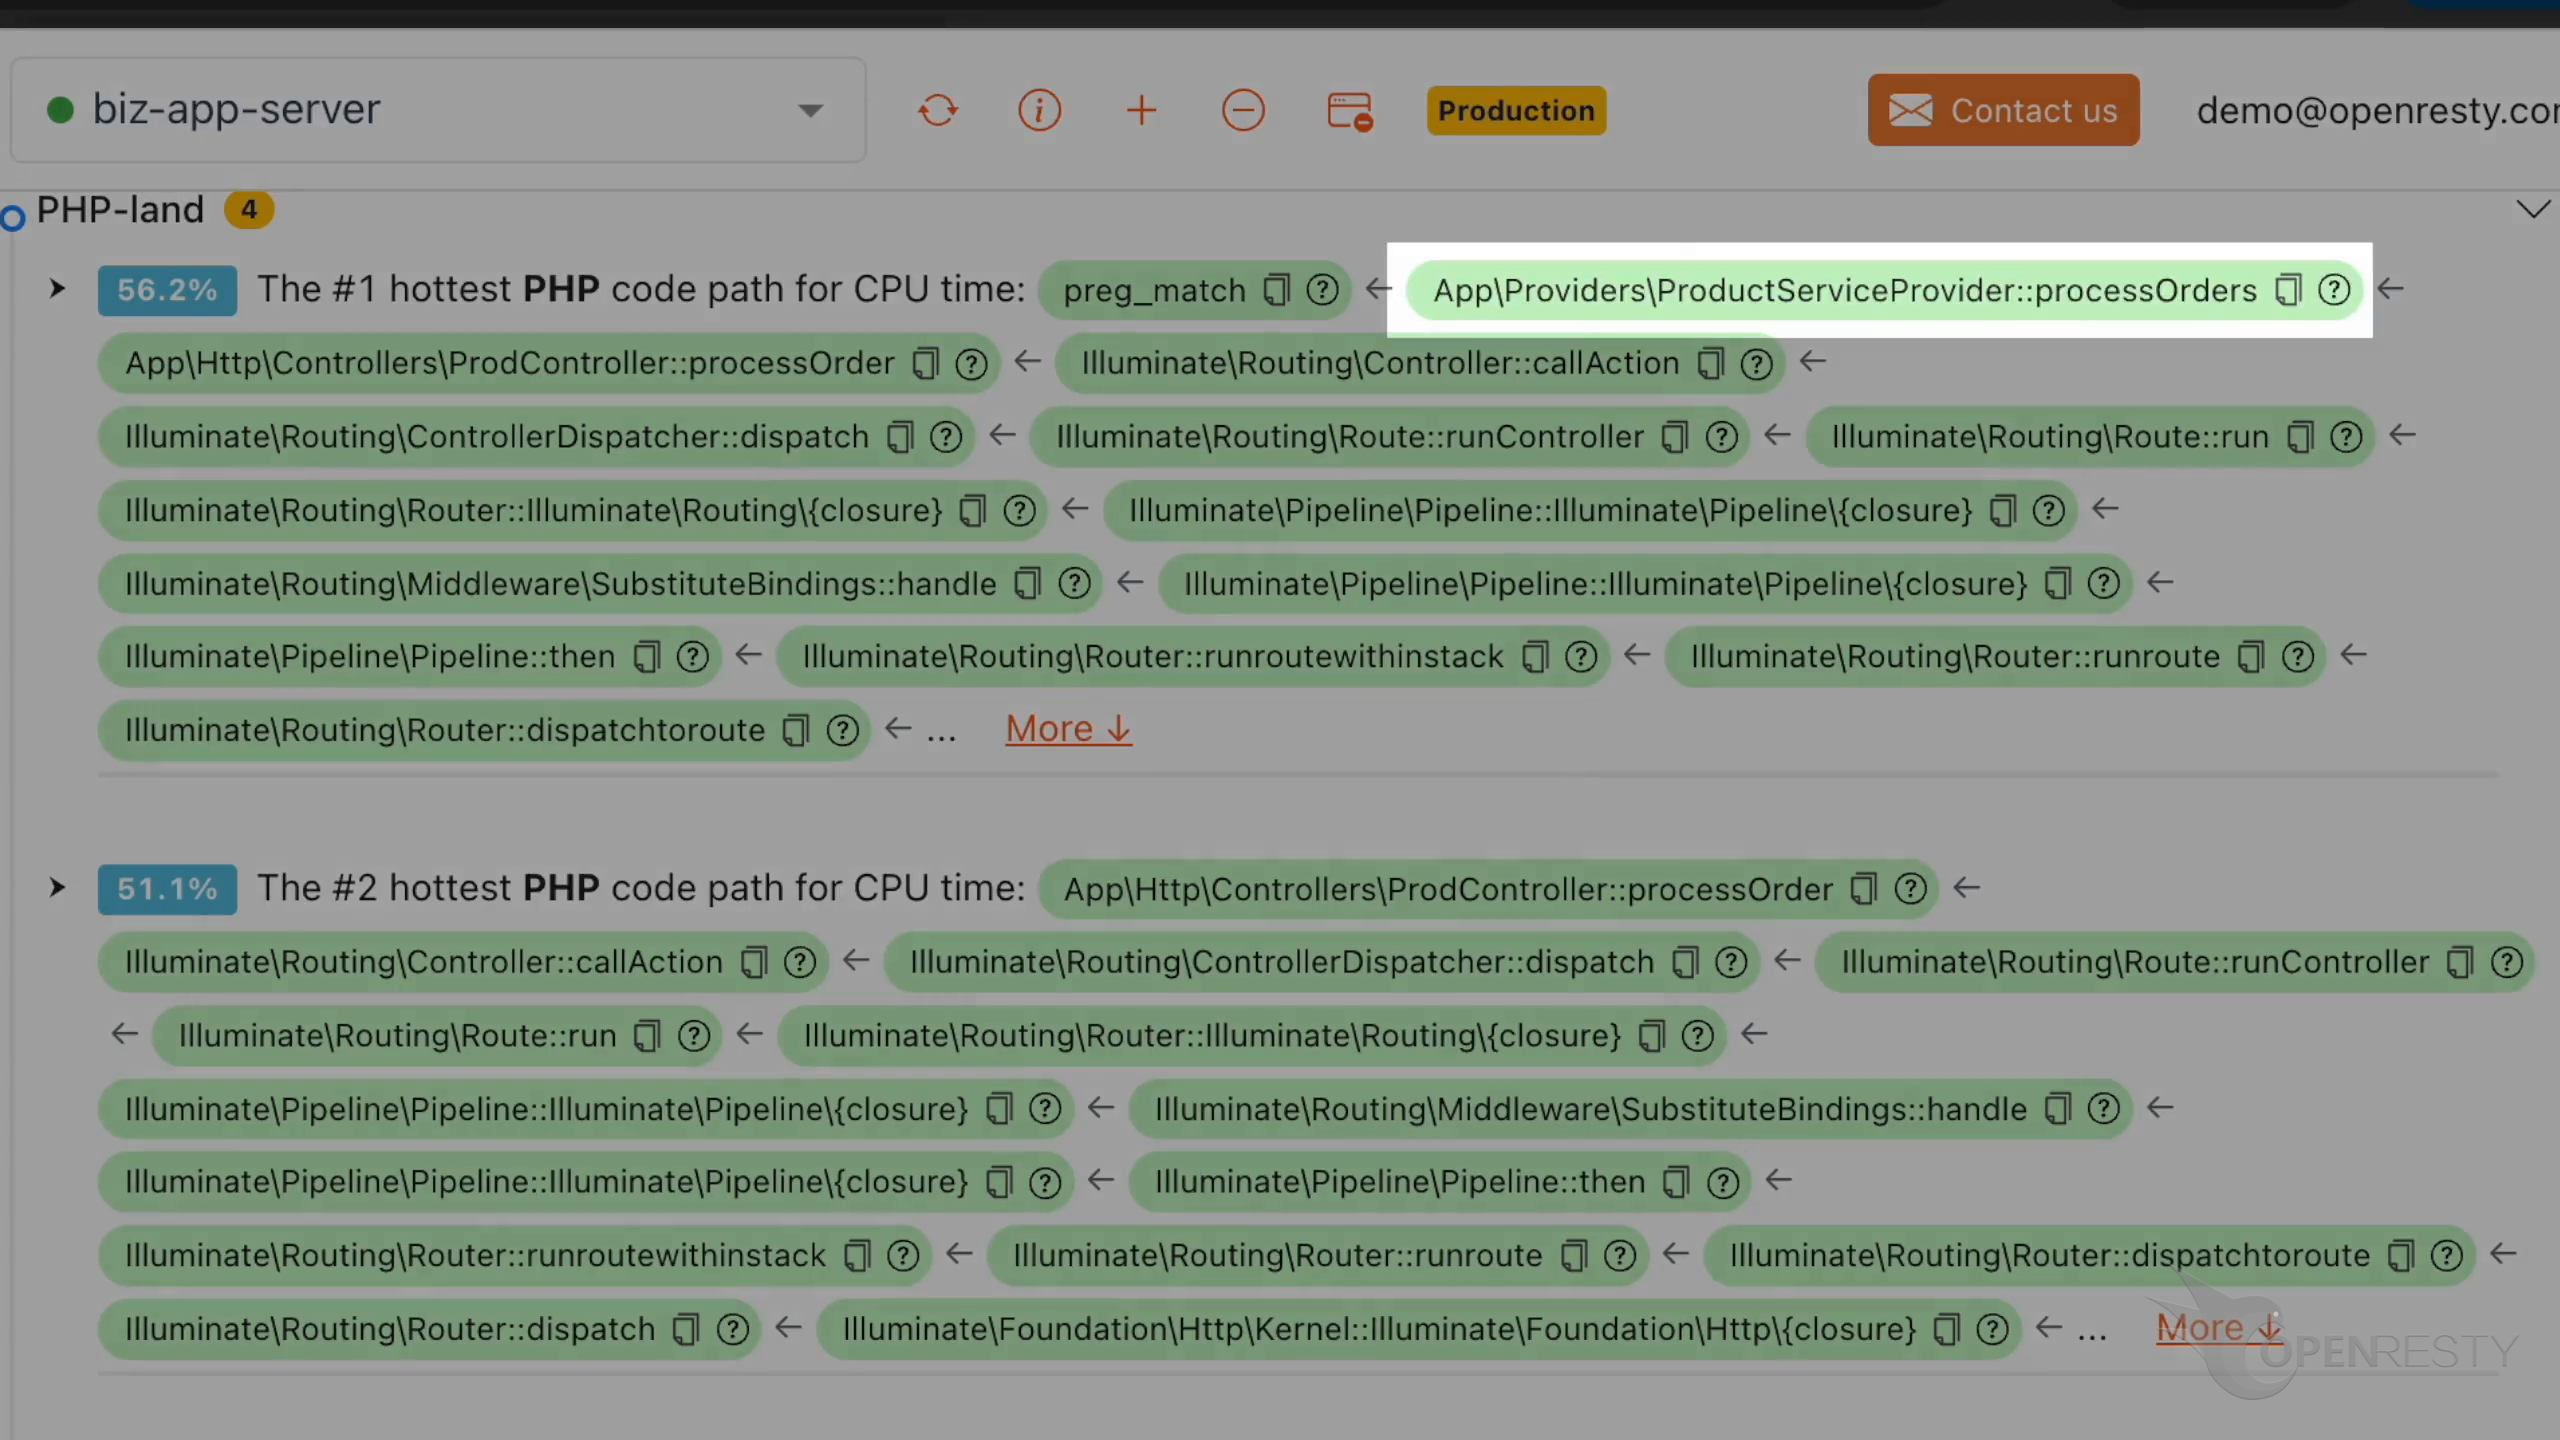
The processOrders function belongs to the business code:
callAction is a method in the Laravel framework that invokes a specified action in a controller:
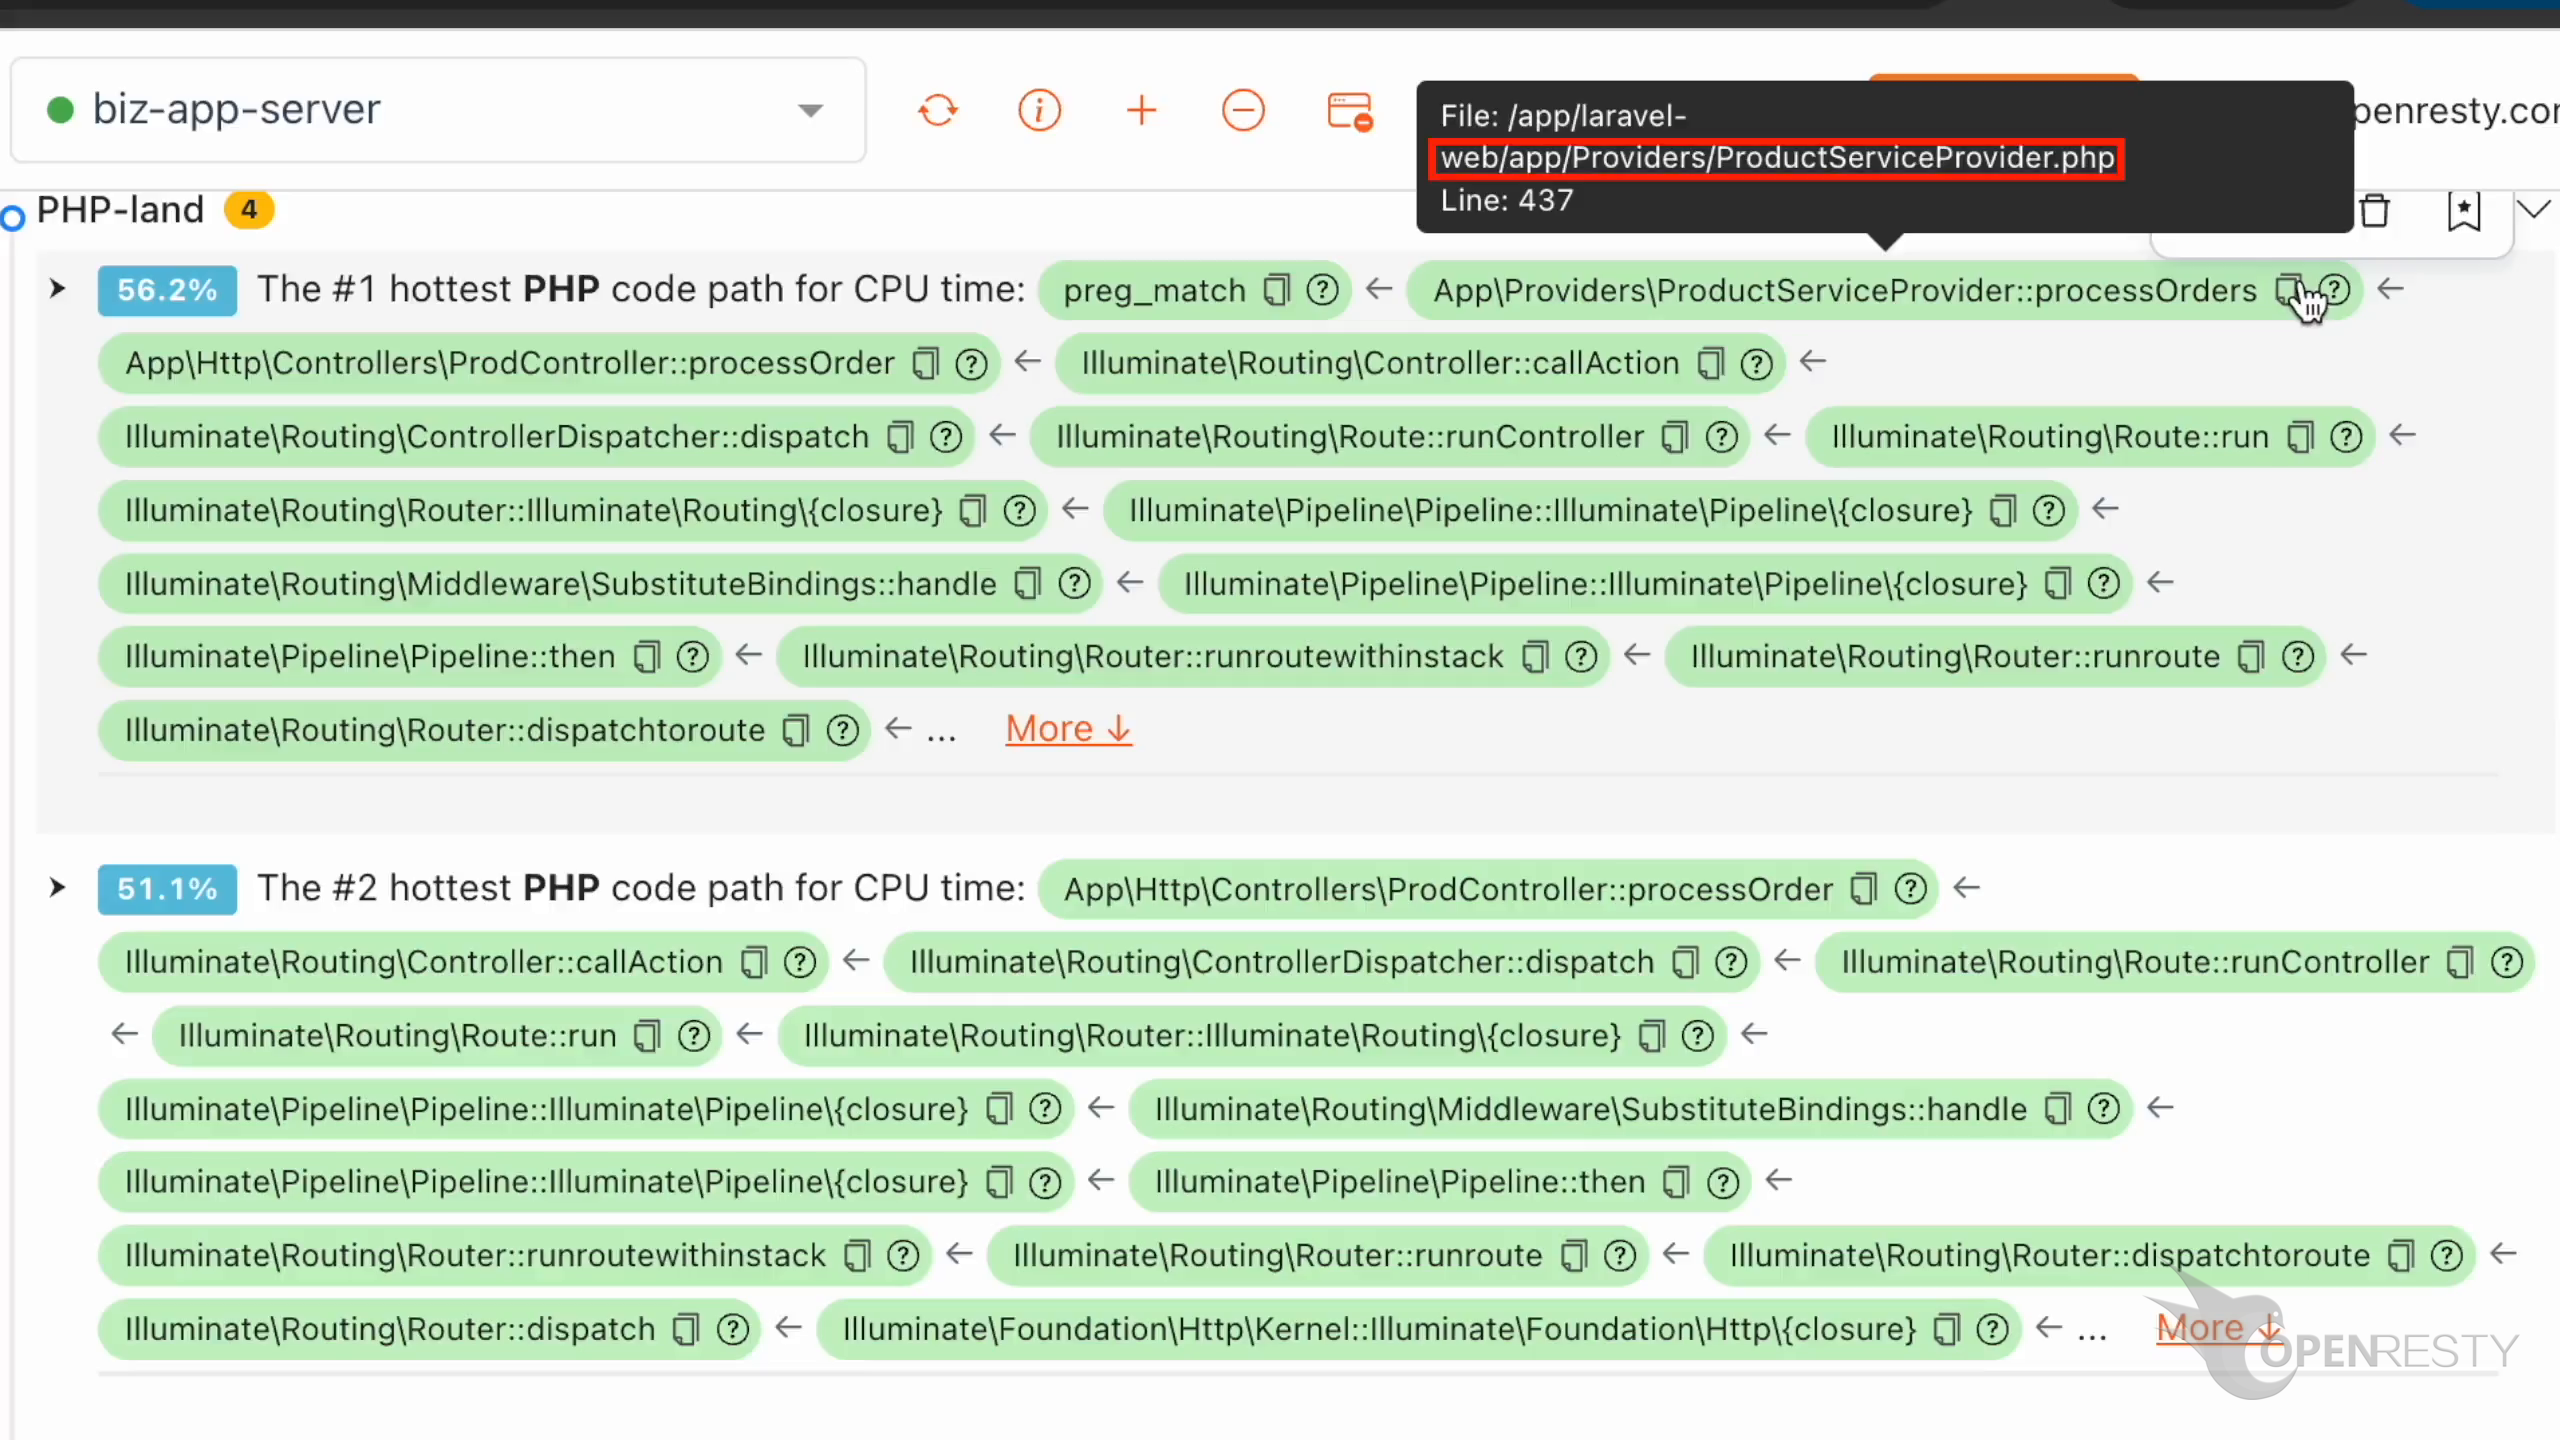
Hover the mouse over the green box of the processOrders function. The tooltip shows the full path of this PHP source file:
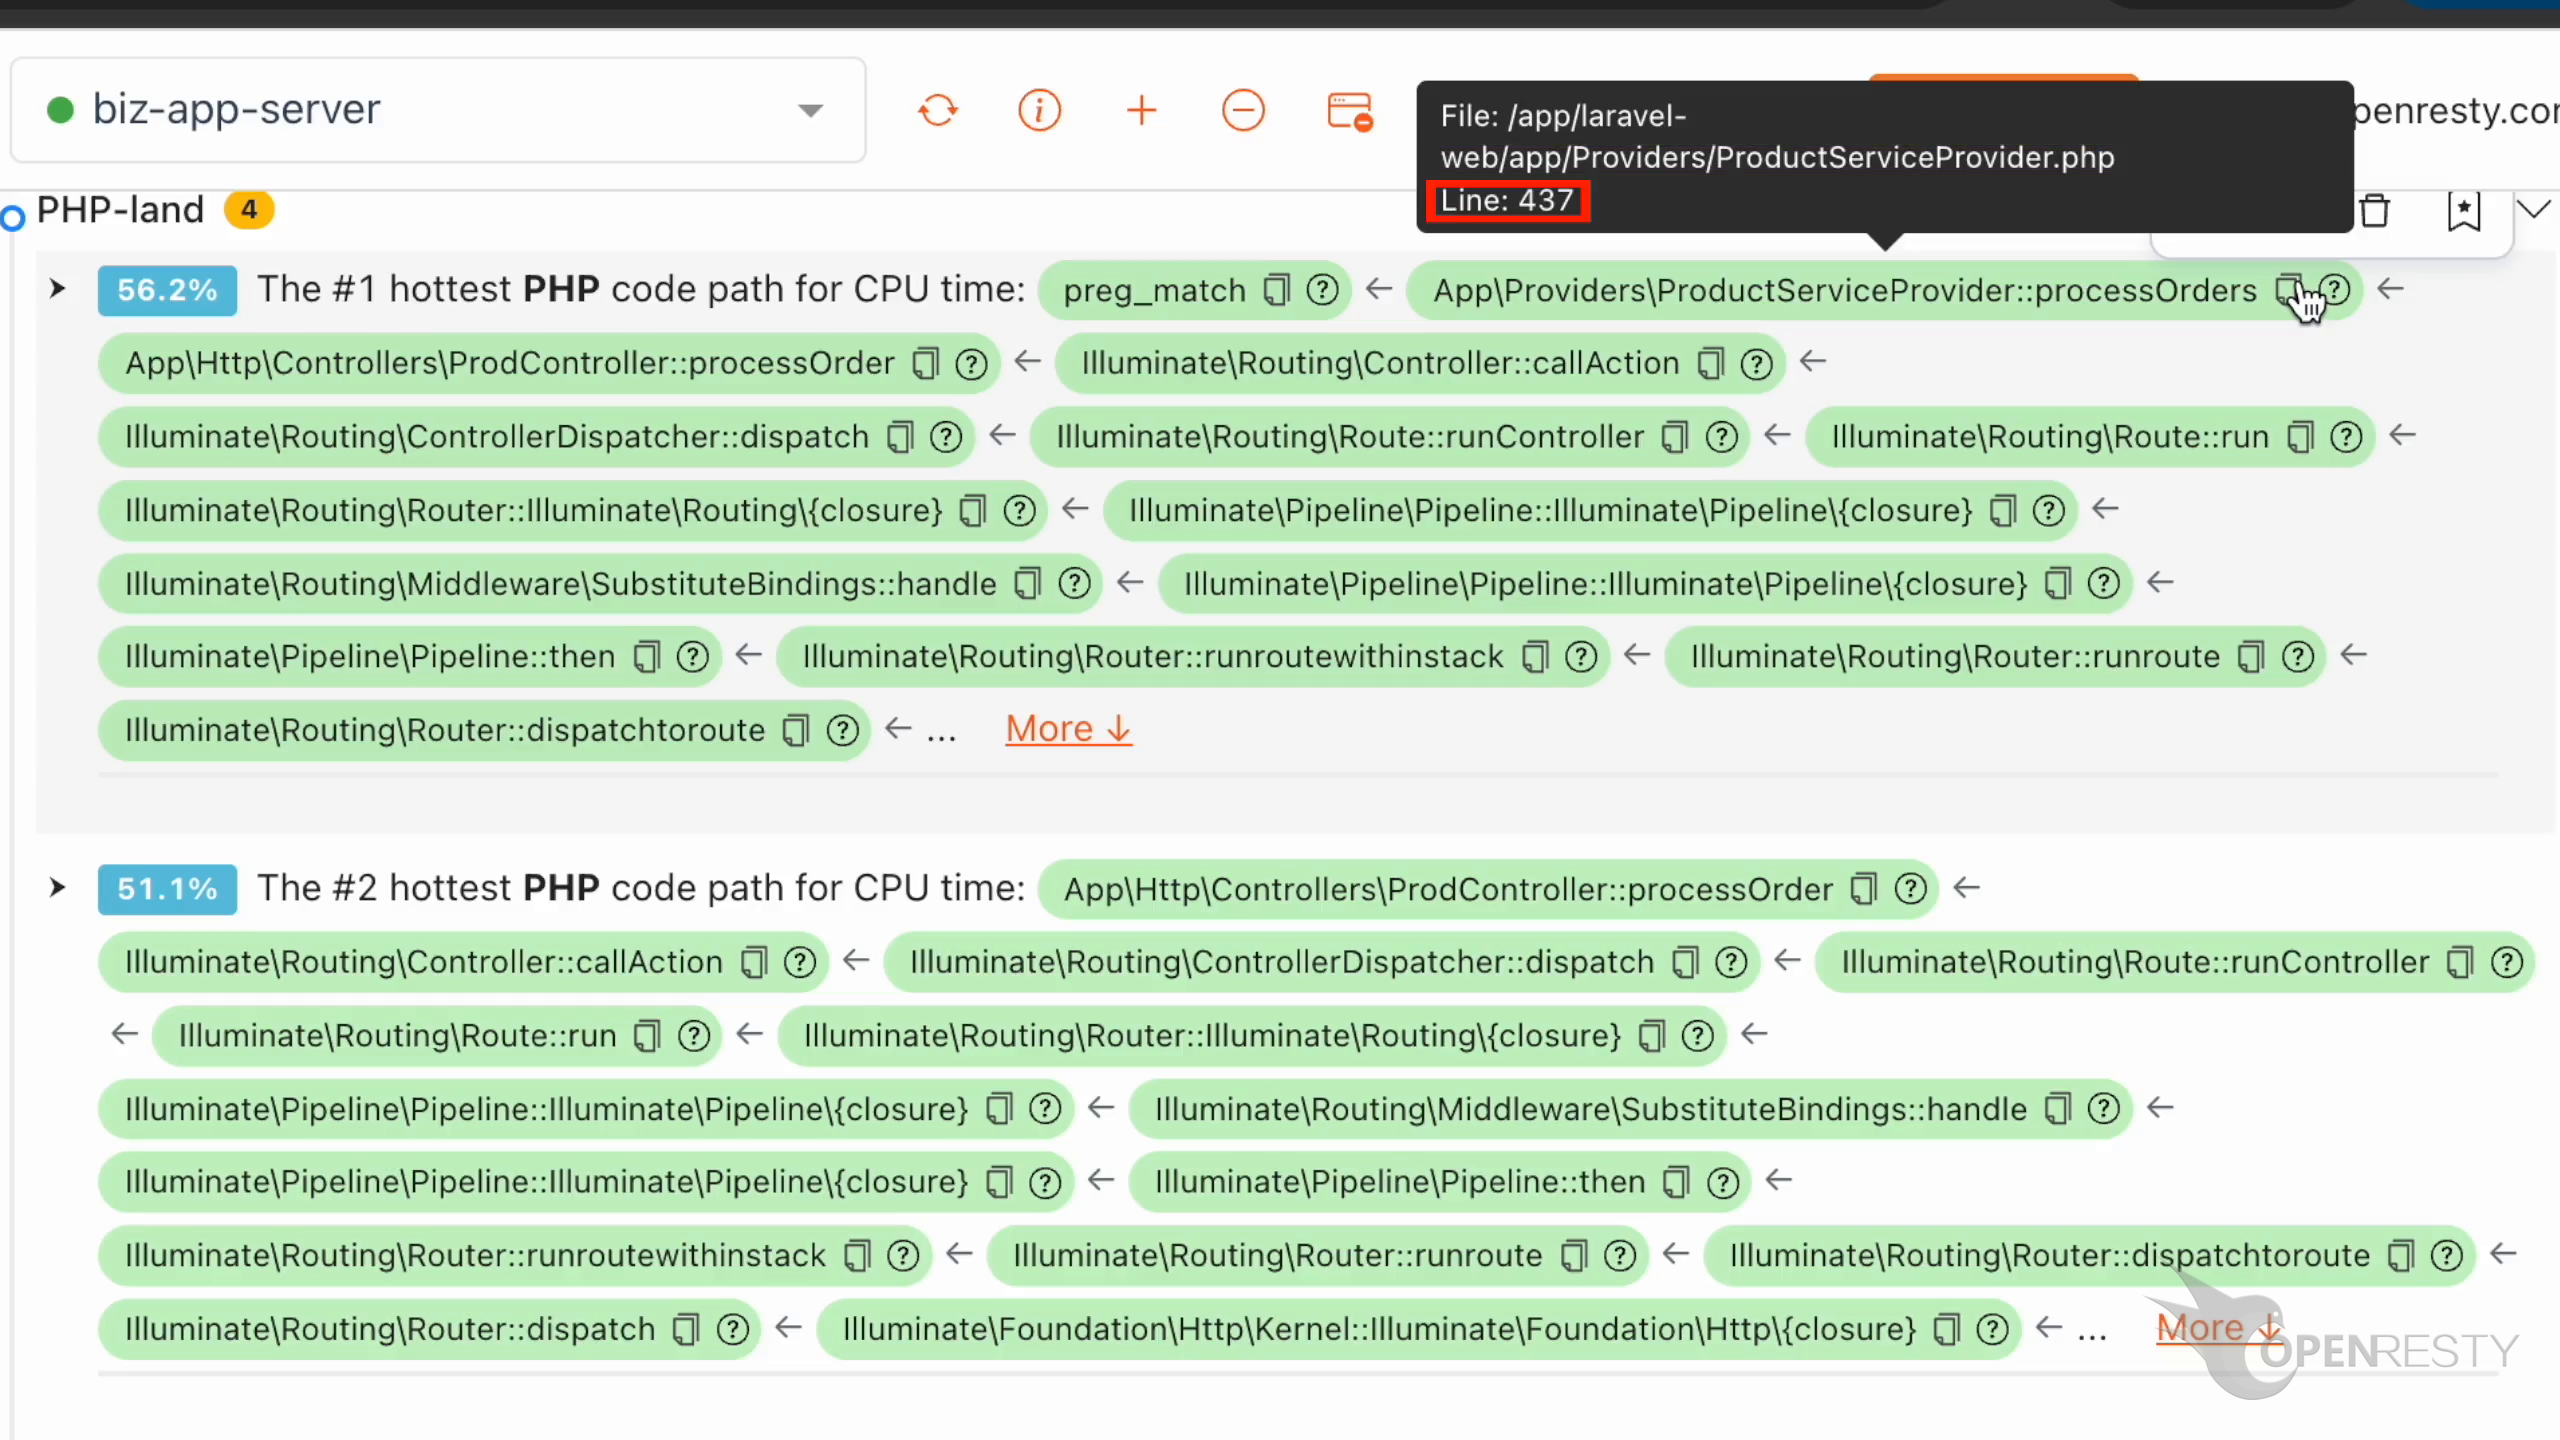
The line number of this source line is 437:
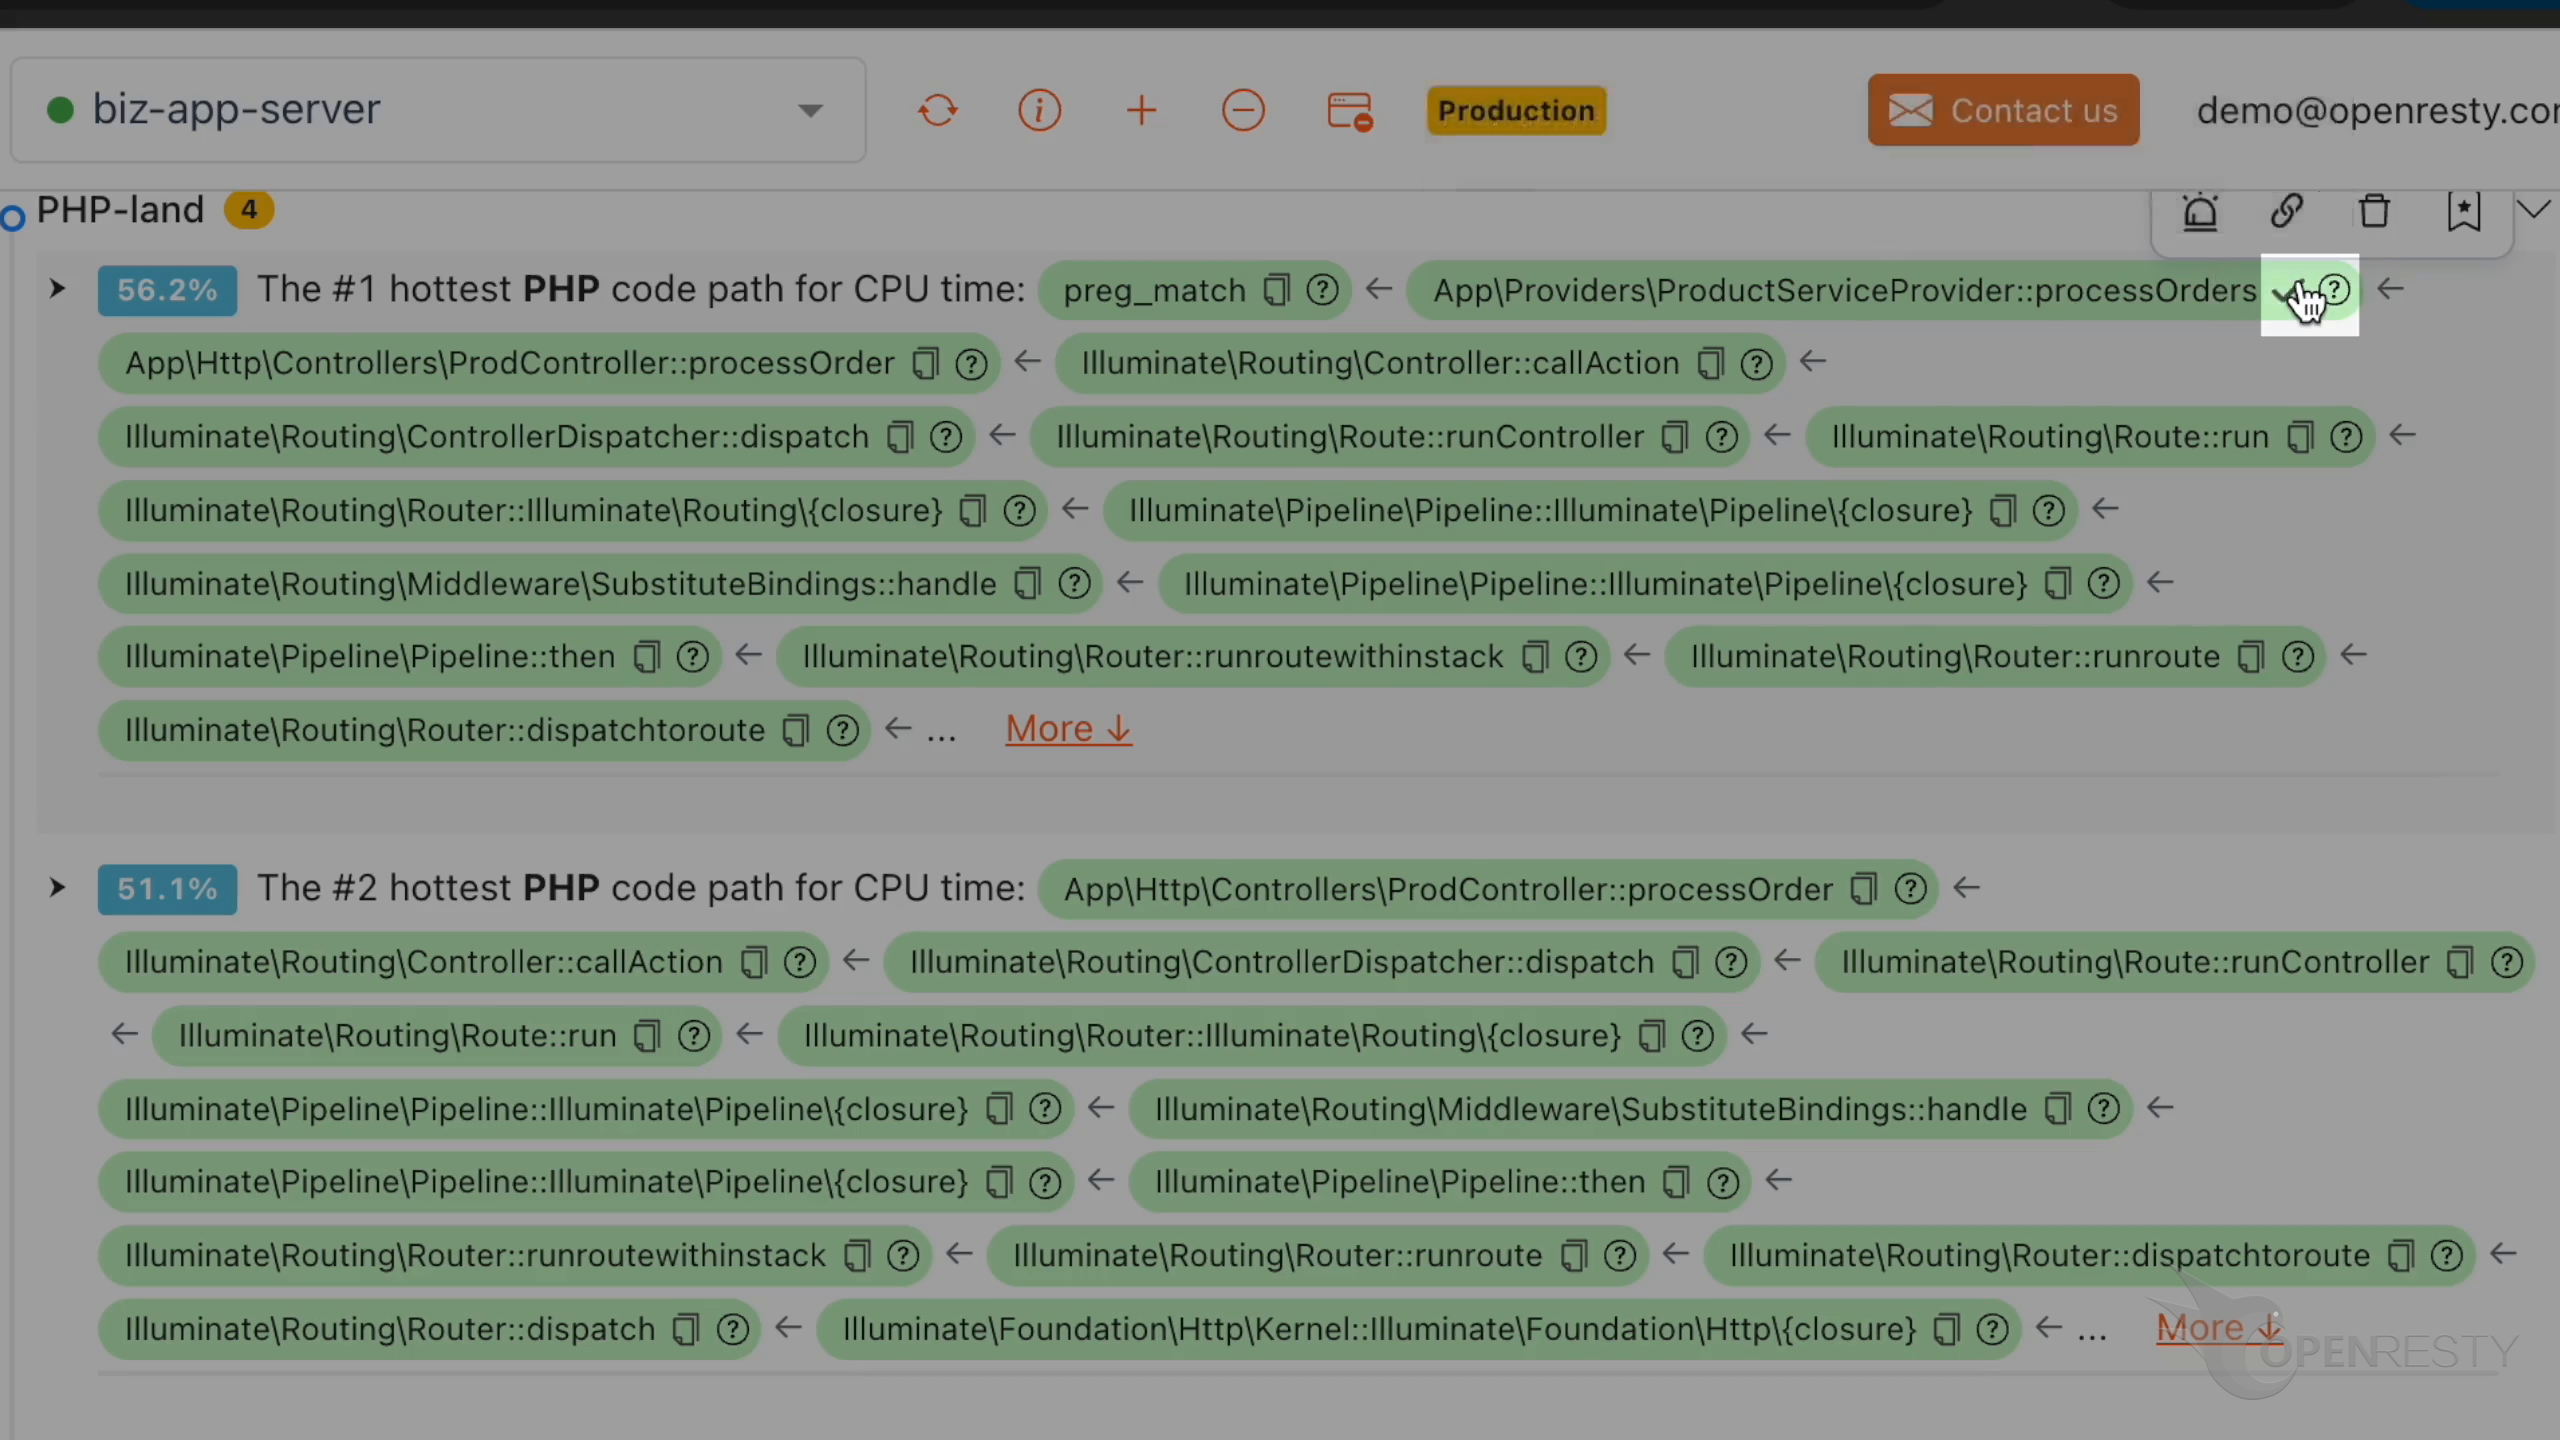
Copy its source file path:
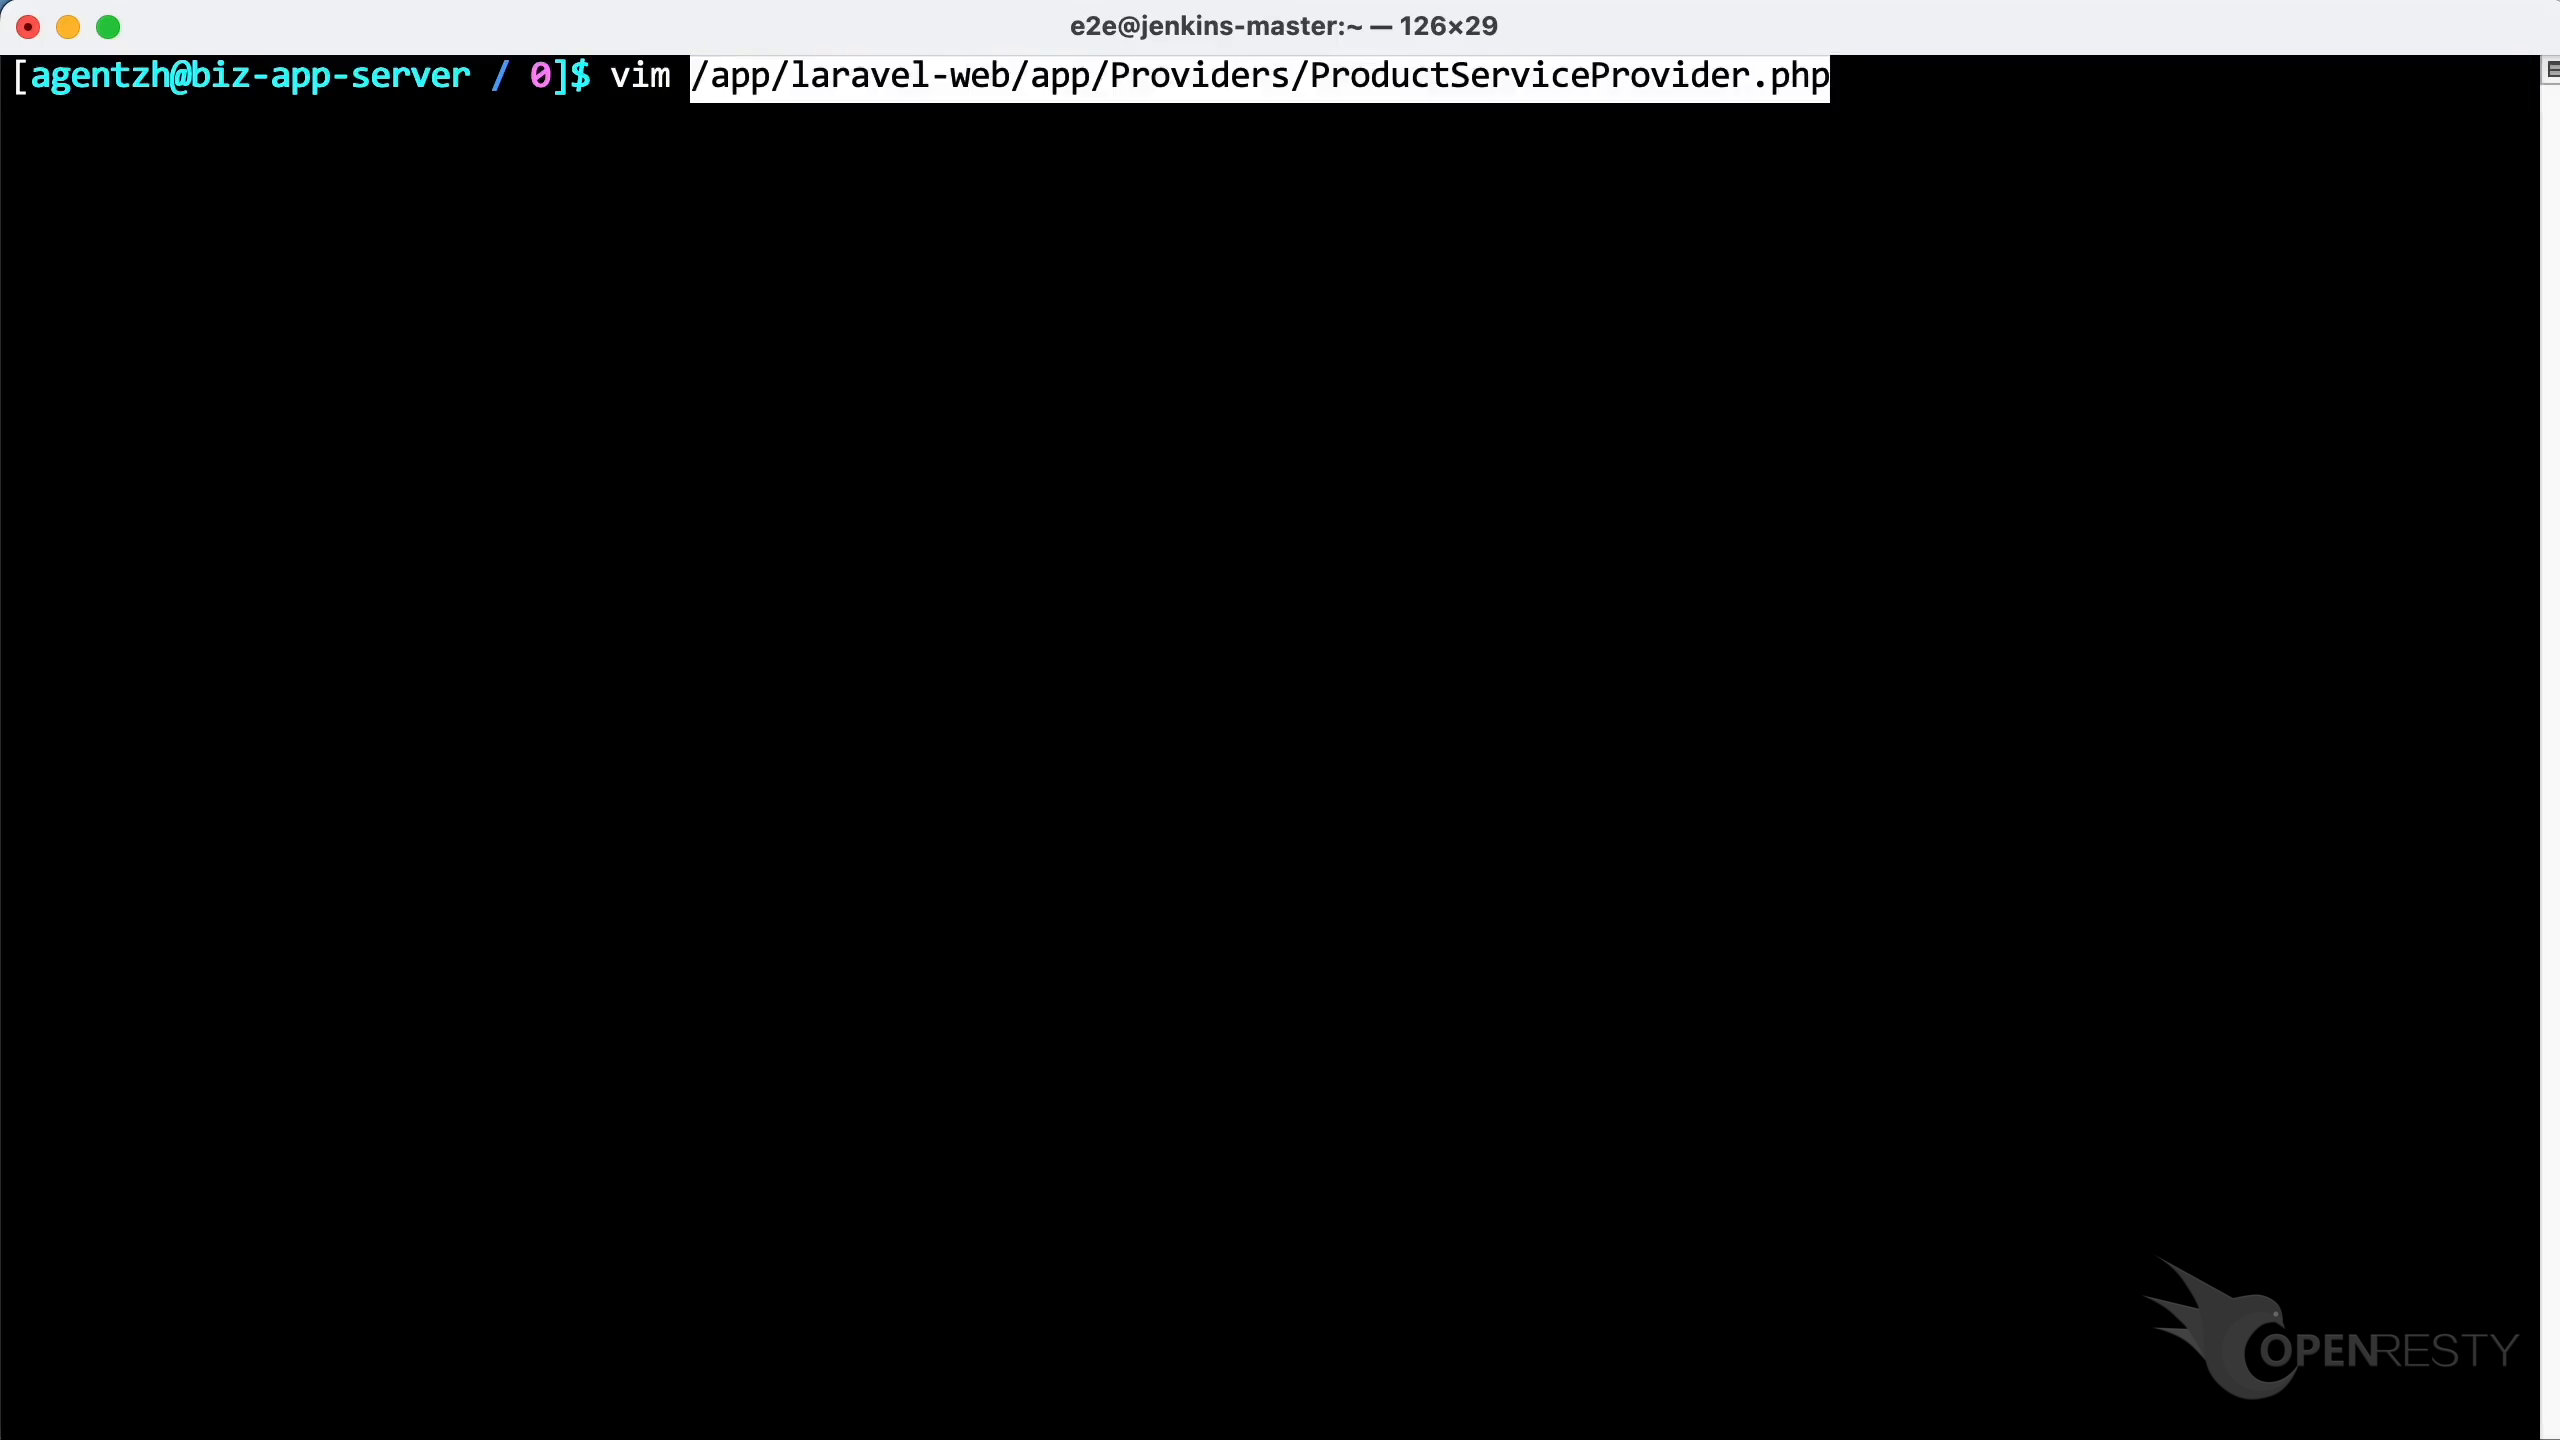
Open its source file with the Vim editor and view the PHP code in this file. You can use any editor you like:
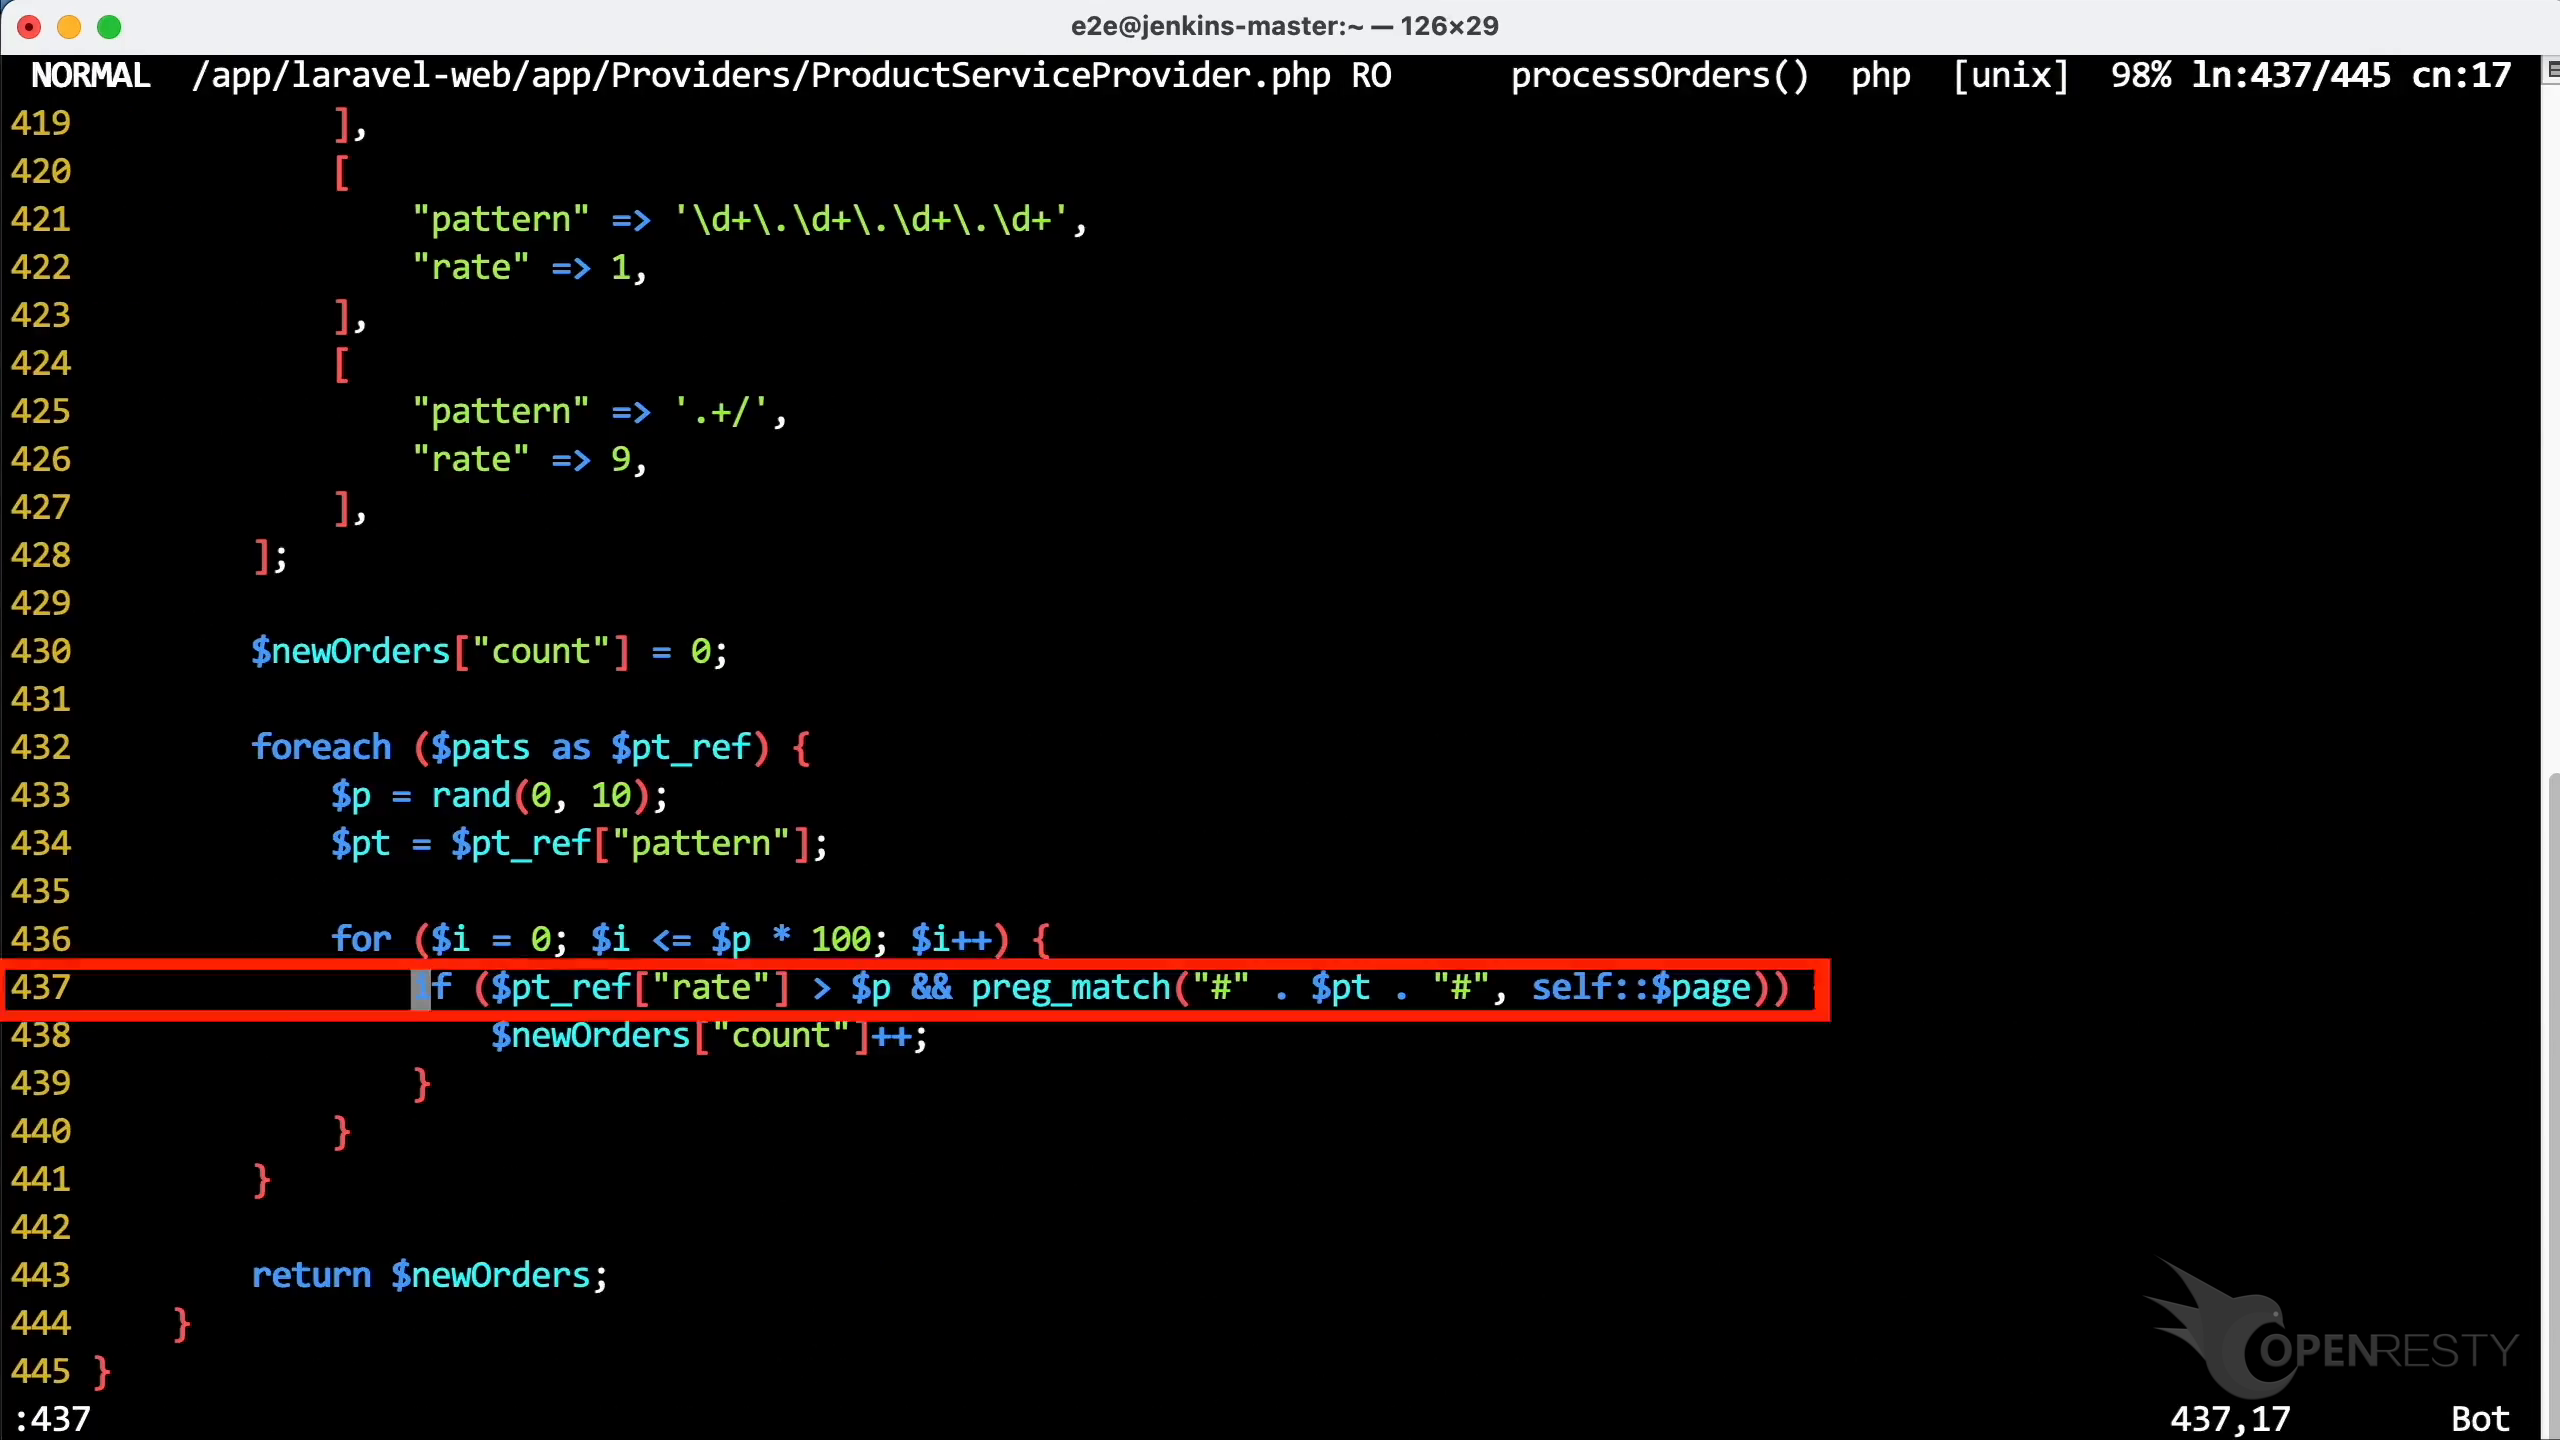
Following the advice from OpenResty XRay, jump to line 437:
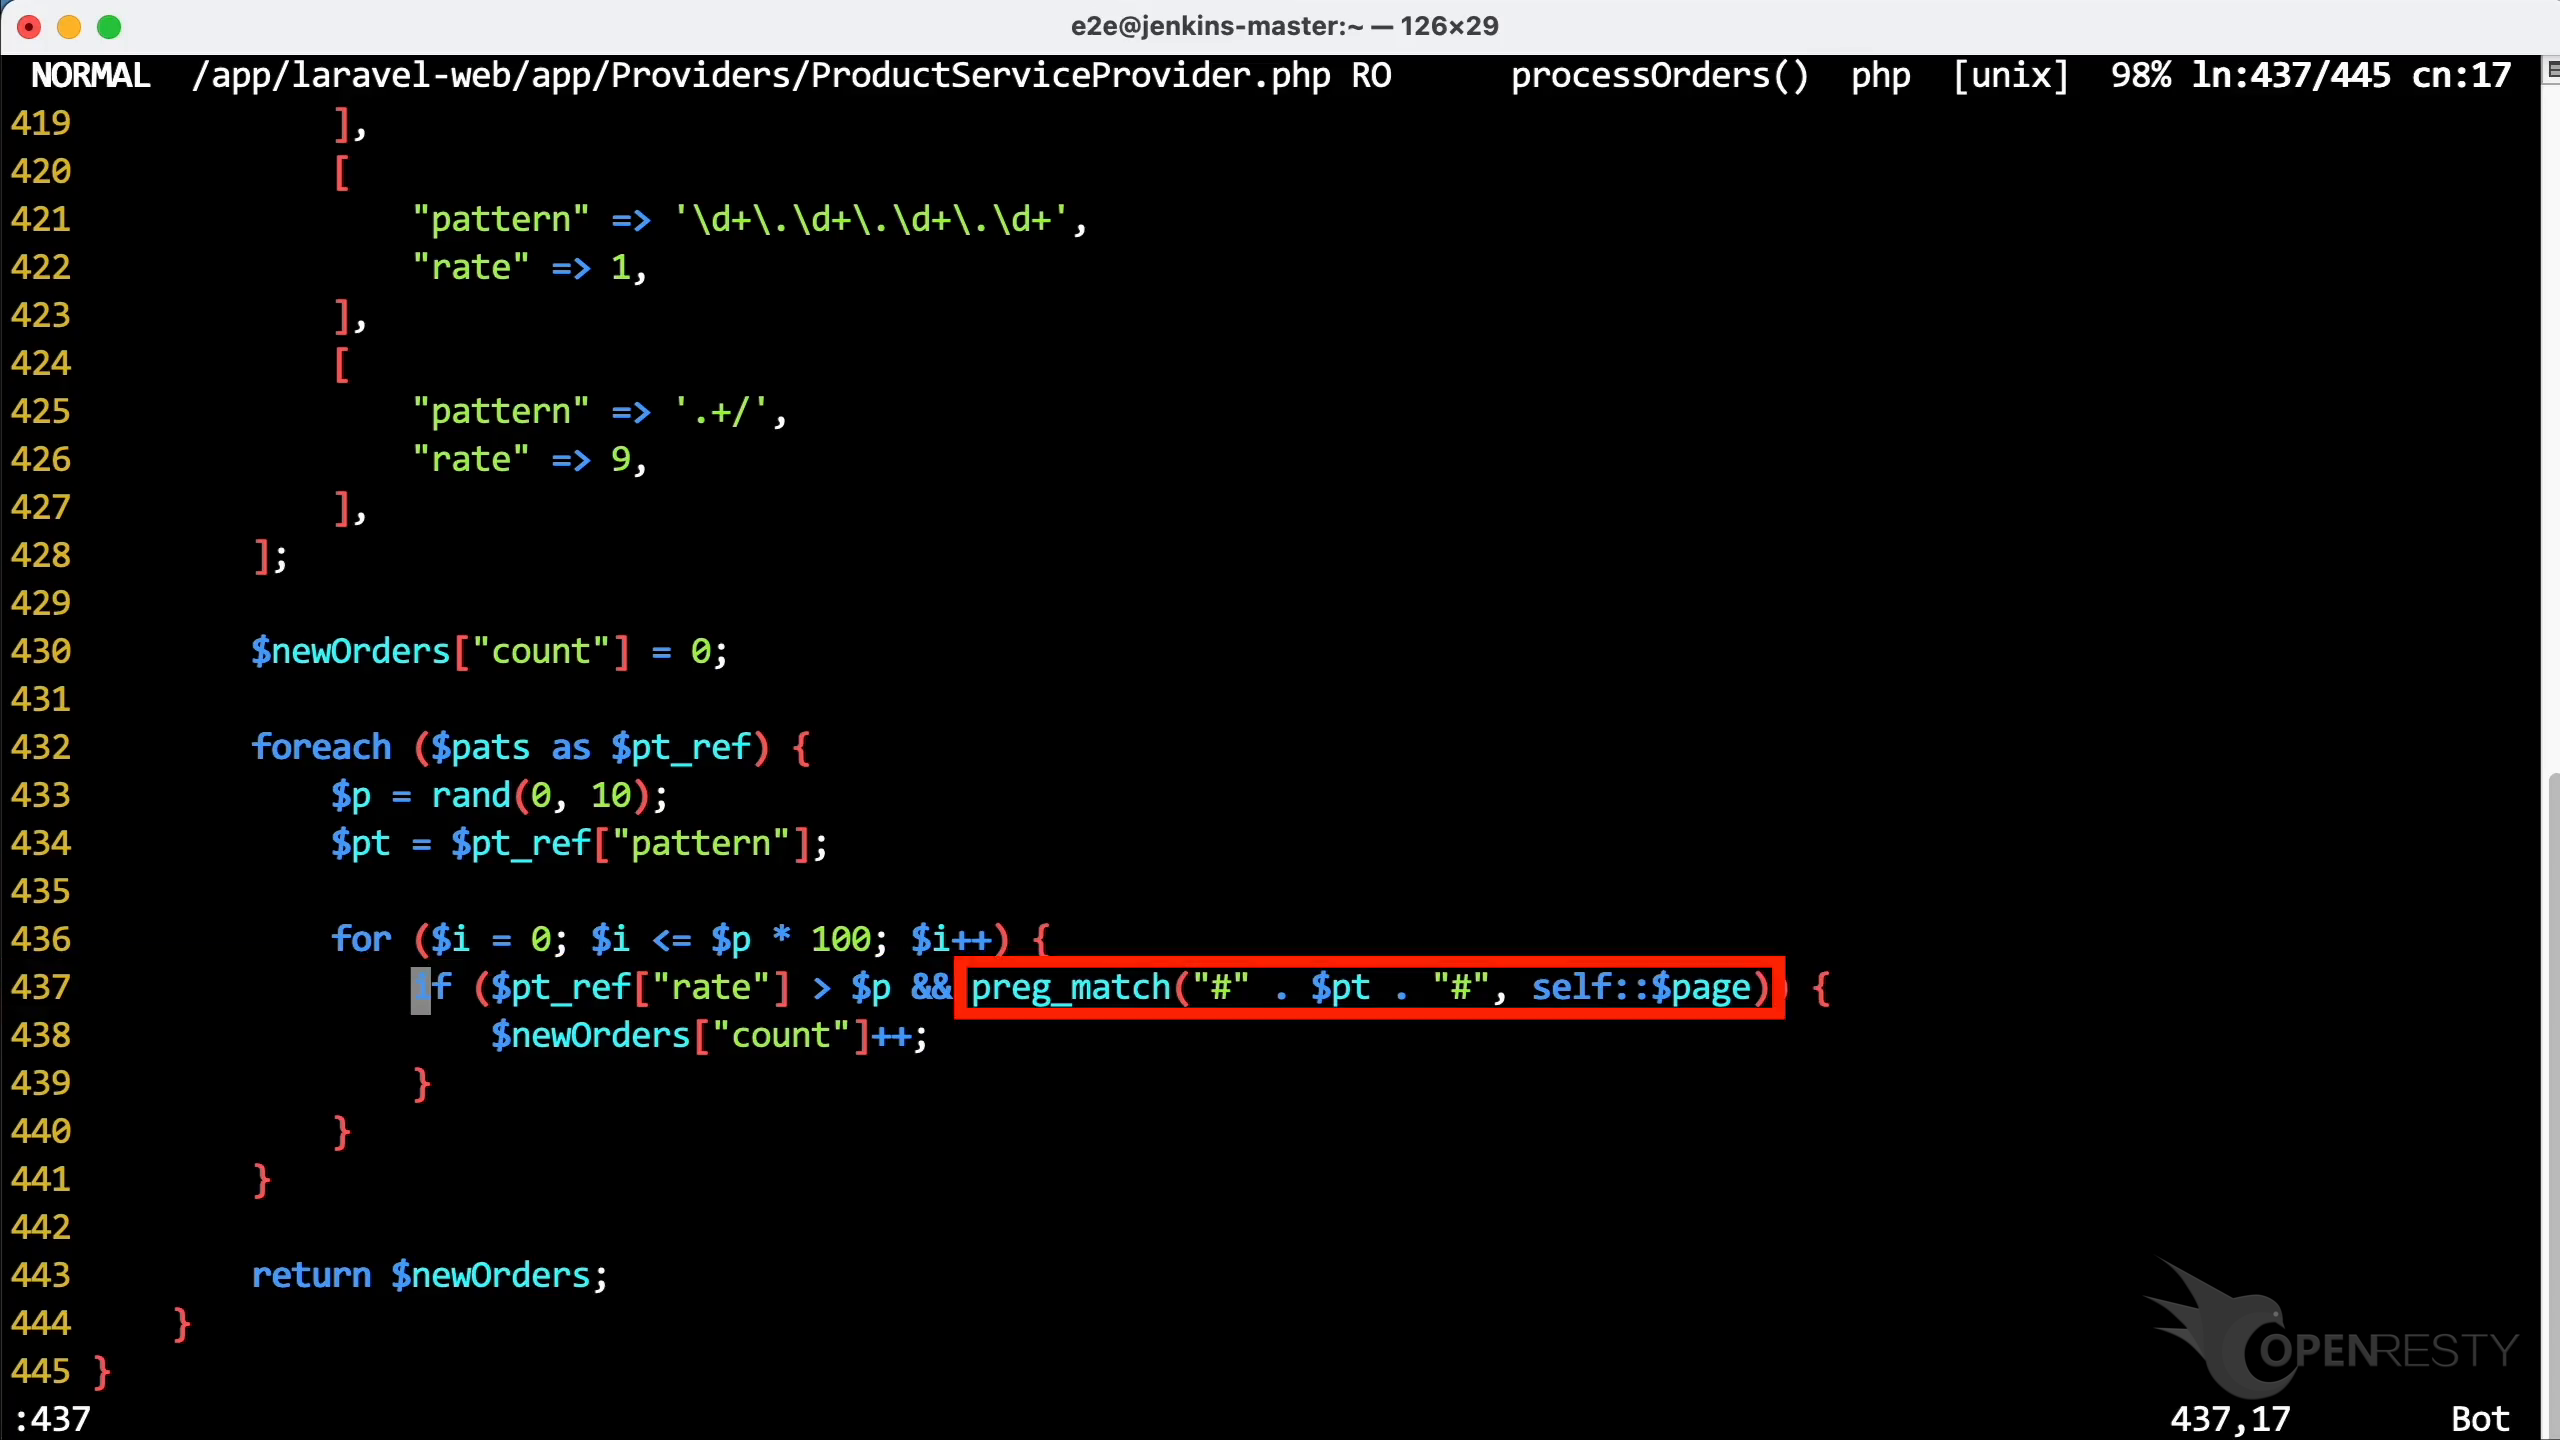
We can see the preg_match call matches the report. Because the regular expression is matched repeatedly inside a loop, we can precompile it to cut the CPU cost — a concrete, actionable optimization:
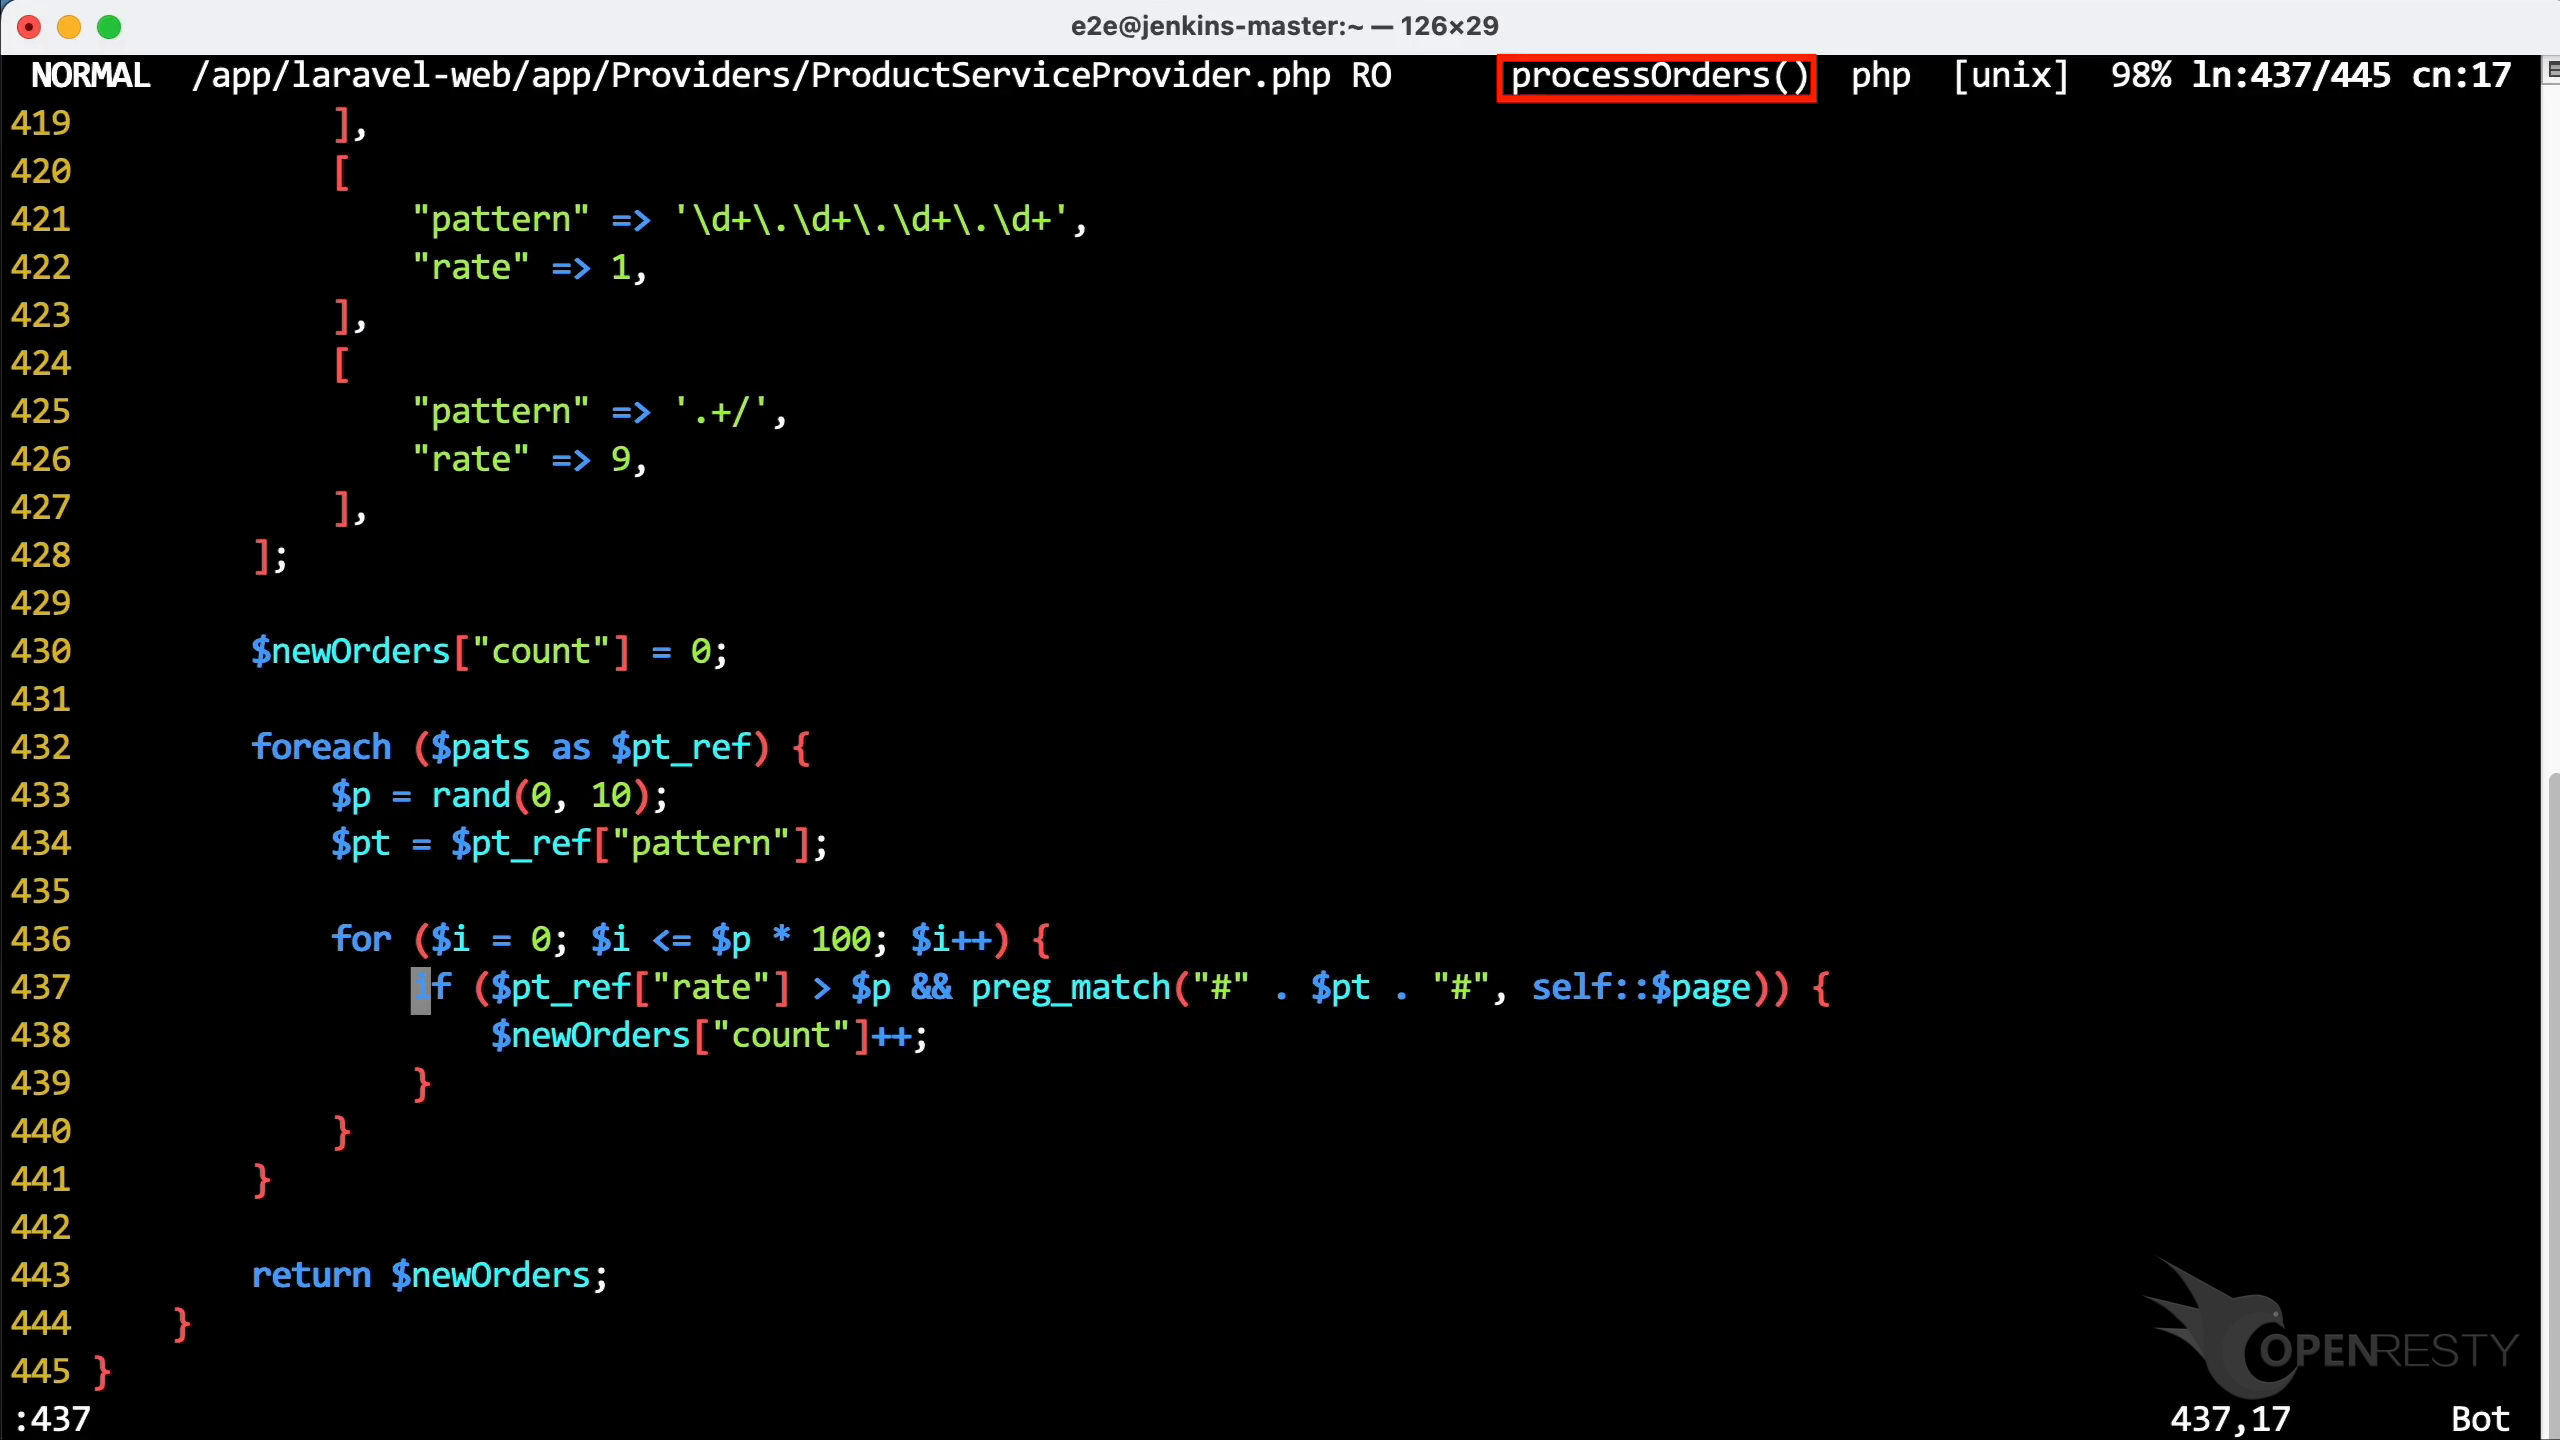
This source line sits inside the processOrders function:
Click “More” to see the details of this code path:
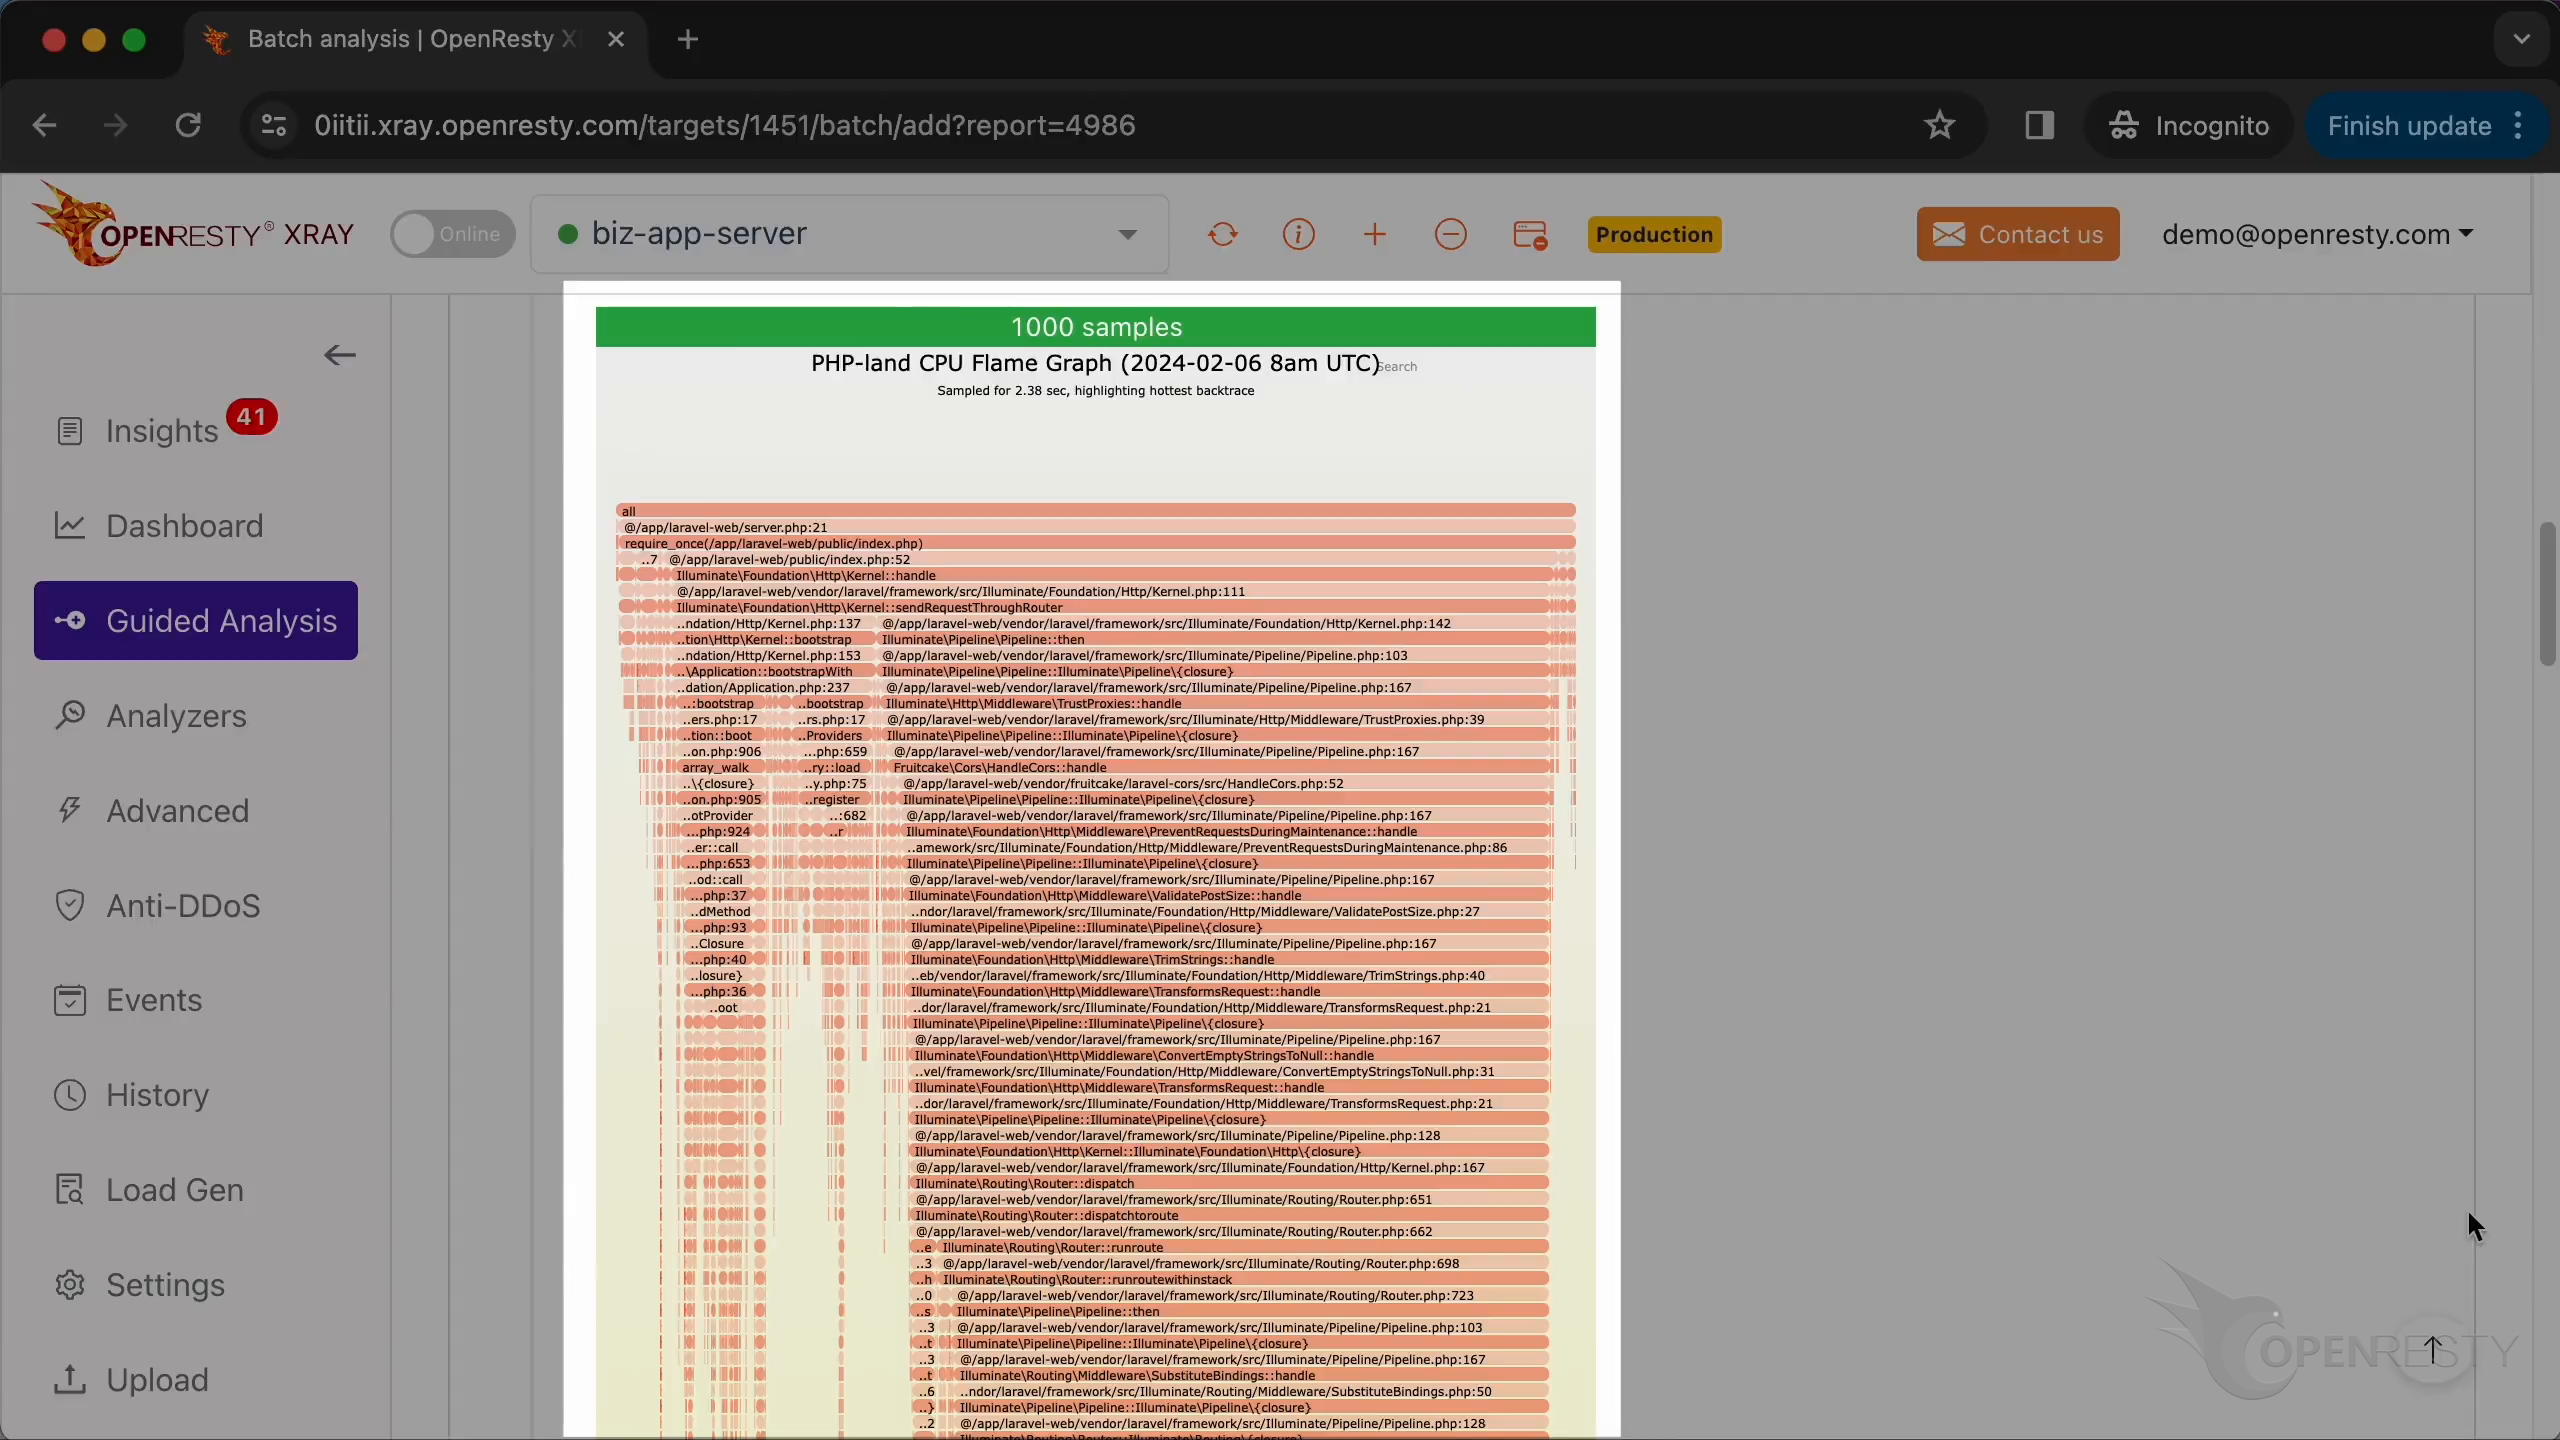
This hot code path is automatically inferred from this PHP-land CPU flame graph, which lays out where the process actually spends its CPU time:
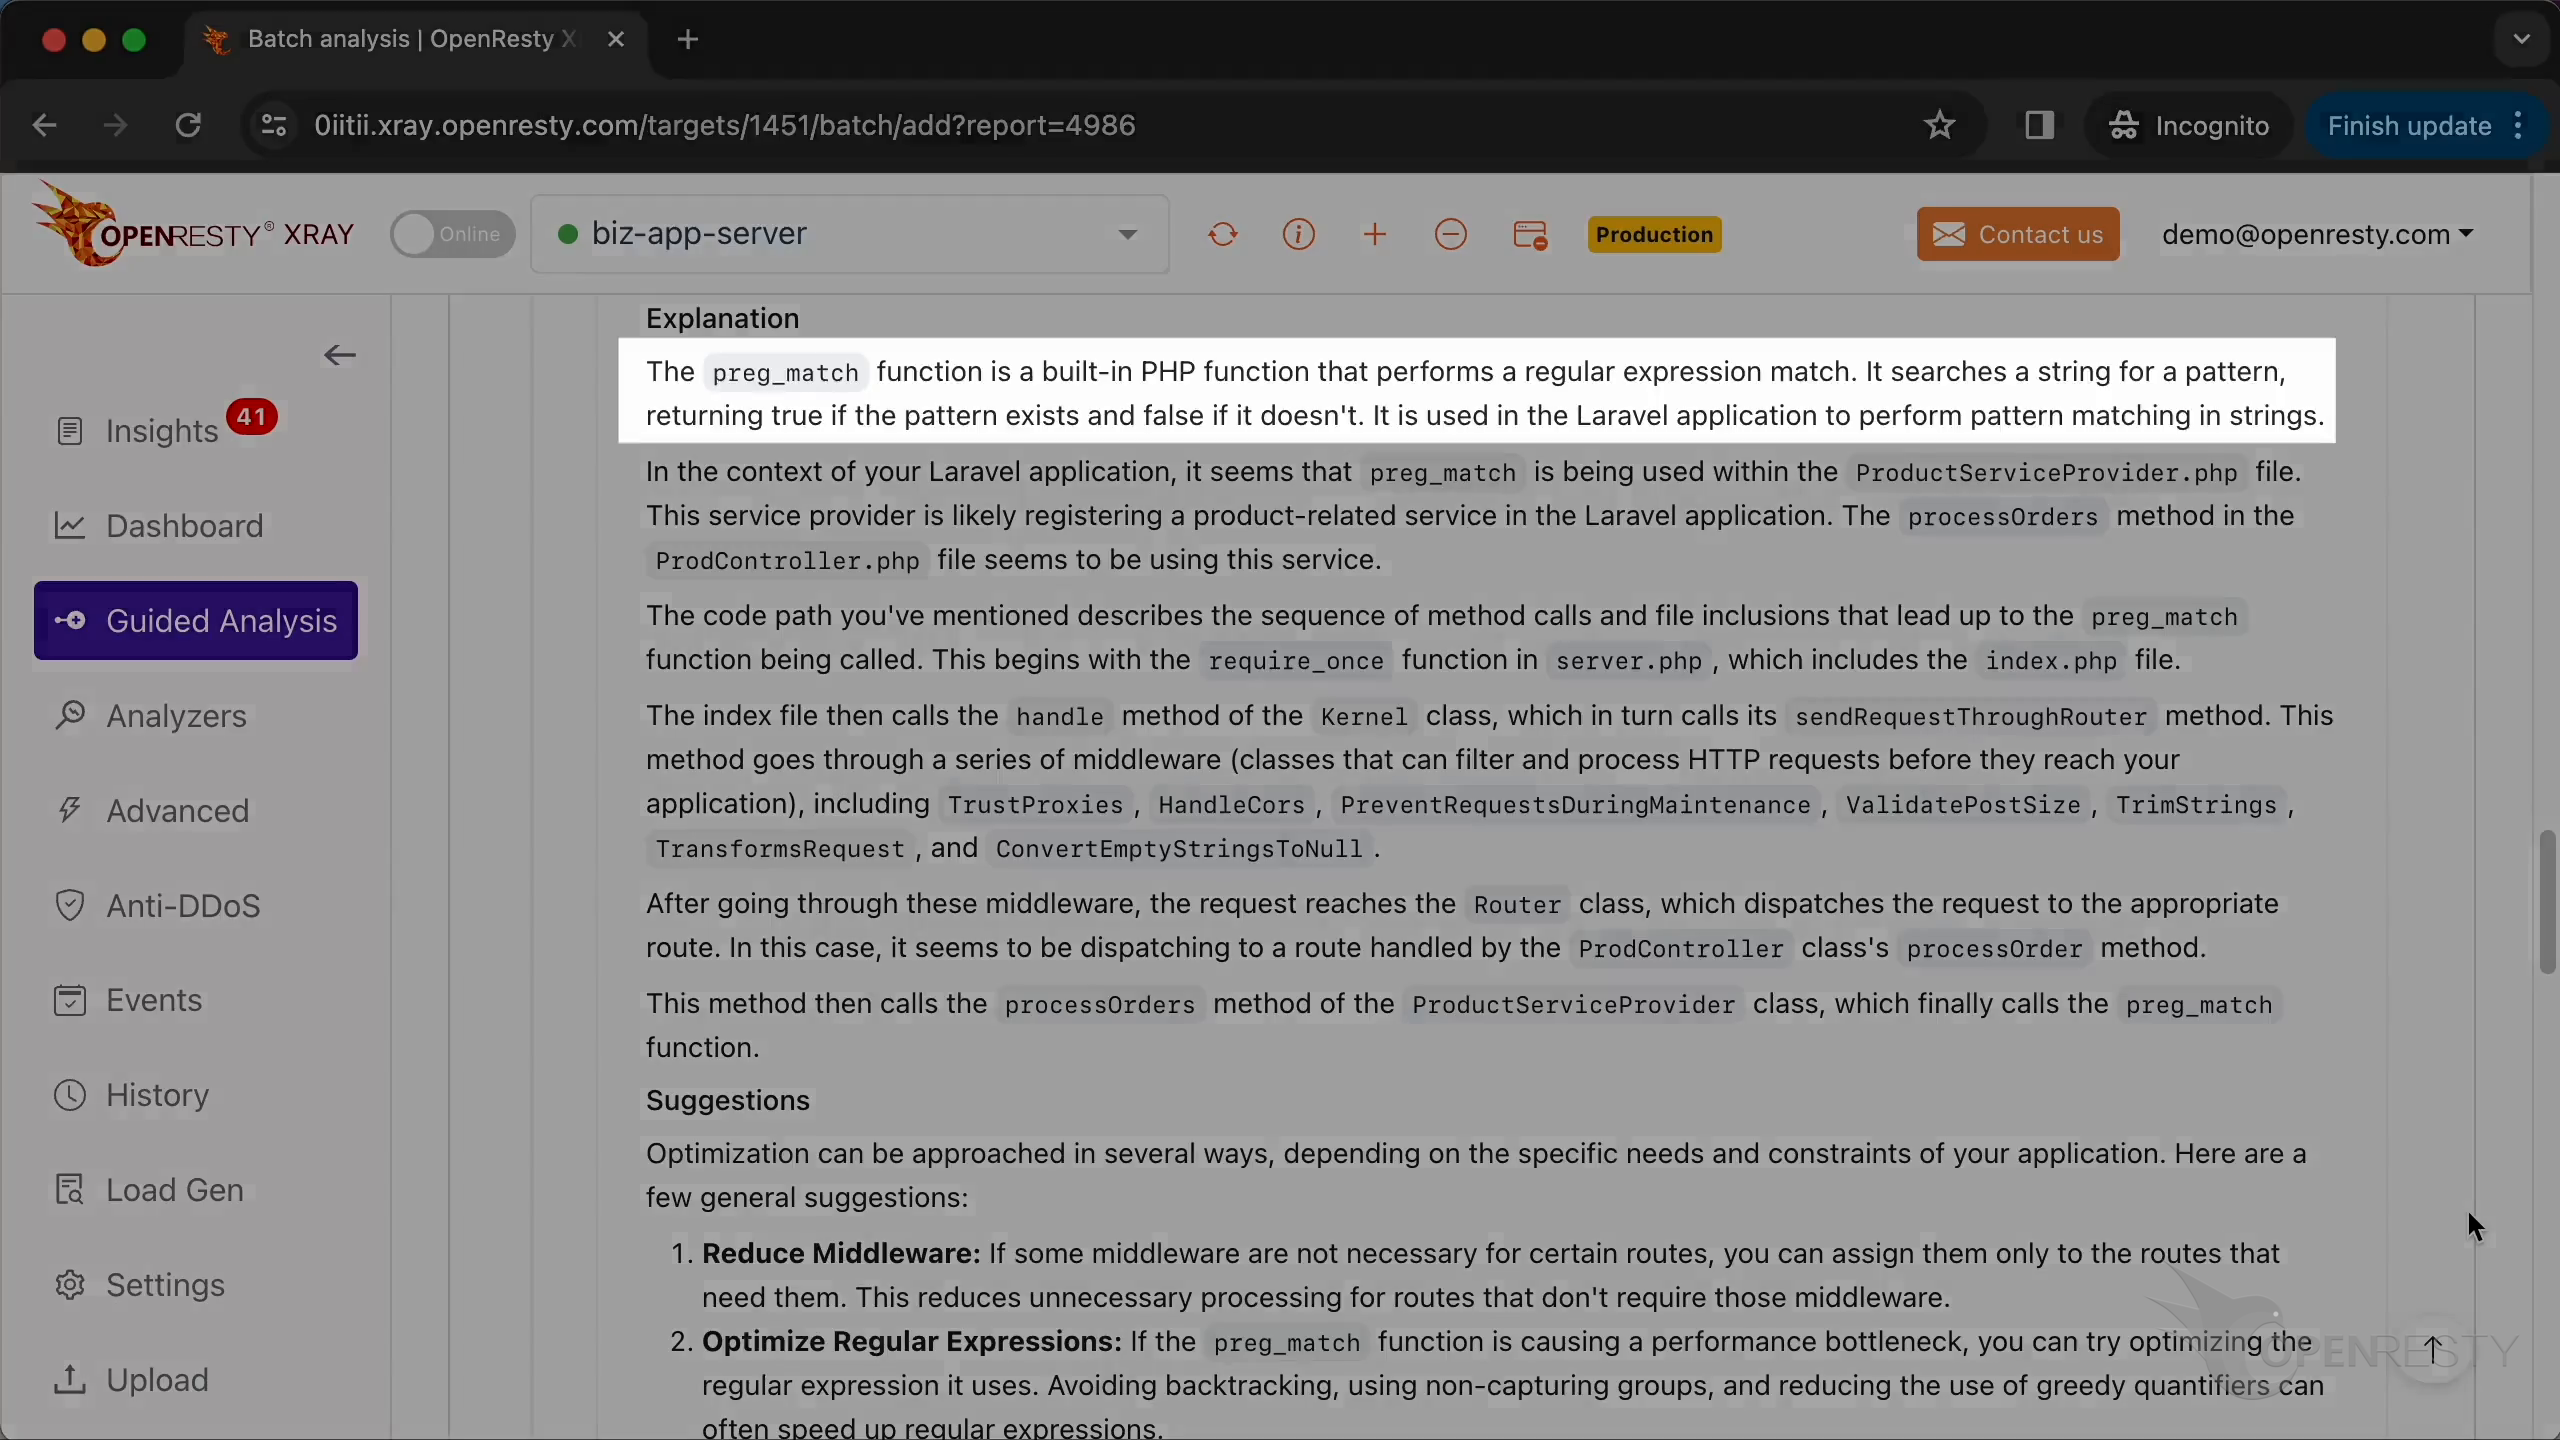
Below is a more detailed explanation and set of suggestions for the problem. It mentions the preg_match function we saw earlier and offers advice such as removing unnecessary middlewares and optimizing the regular expression (avoiding backtracking, using non-capturing groups, reducing greedy quantifiers):
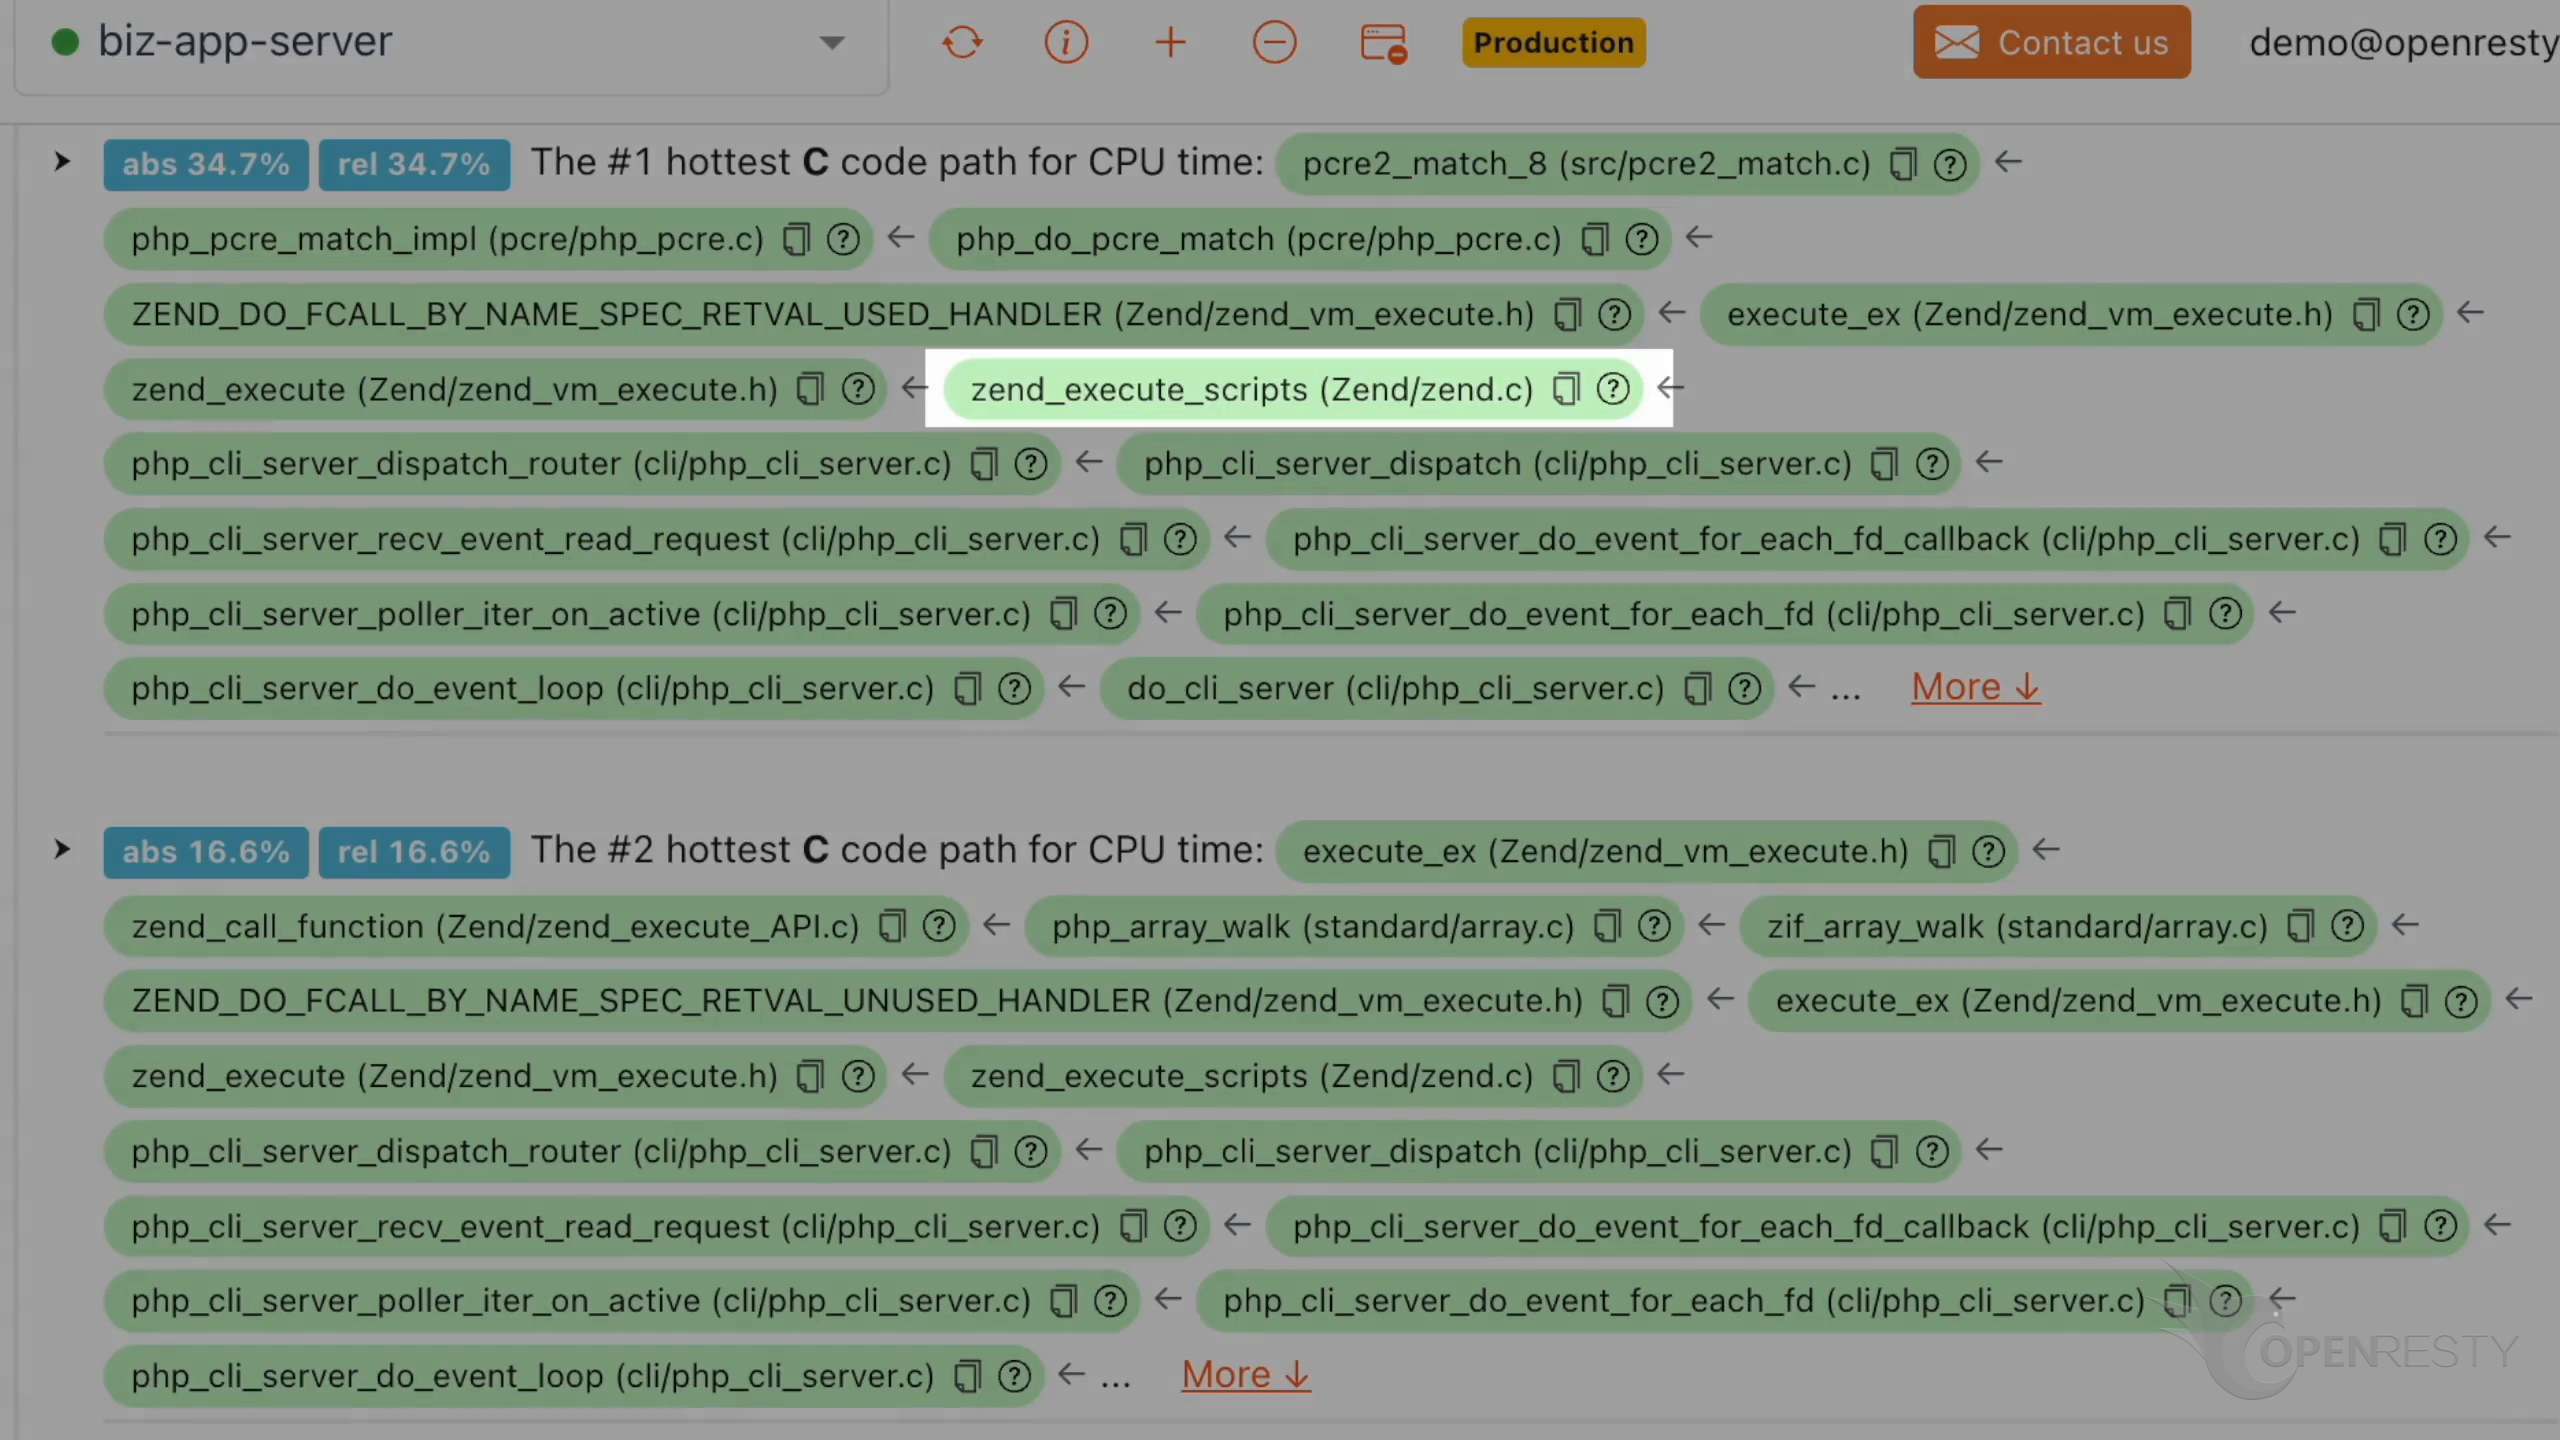
Let’s look at the C code path using the most CPU time. It takes 34.7% of the CPU time and mirrors the PHP-side path:
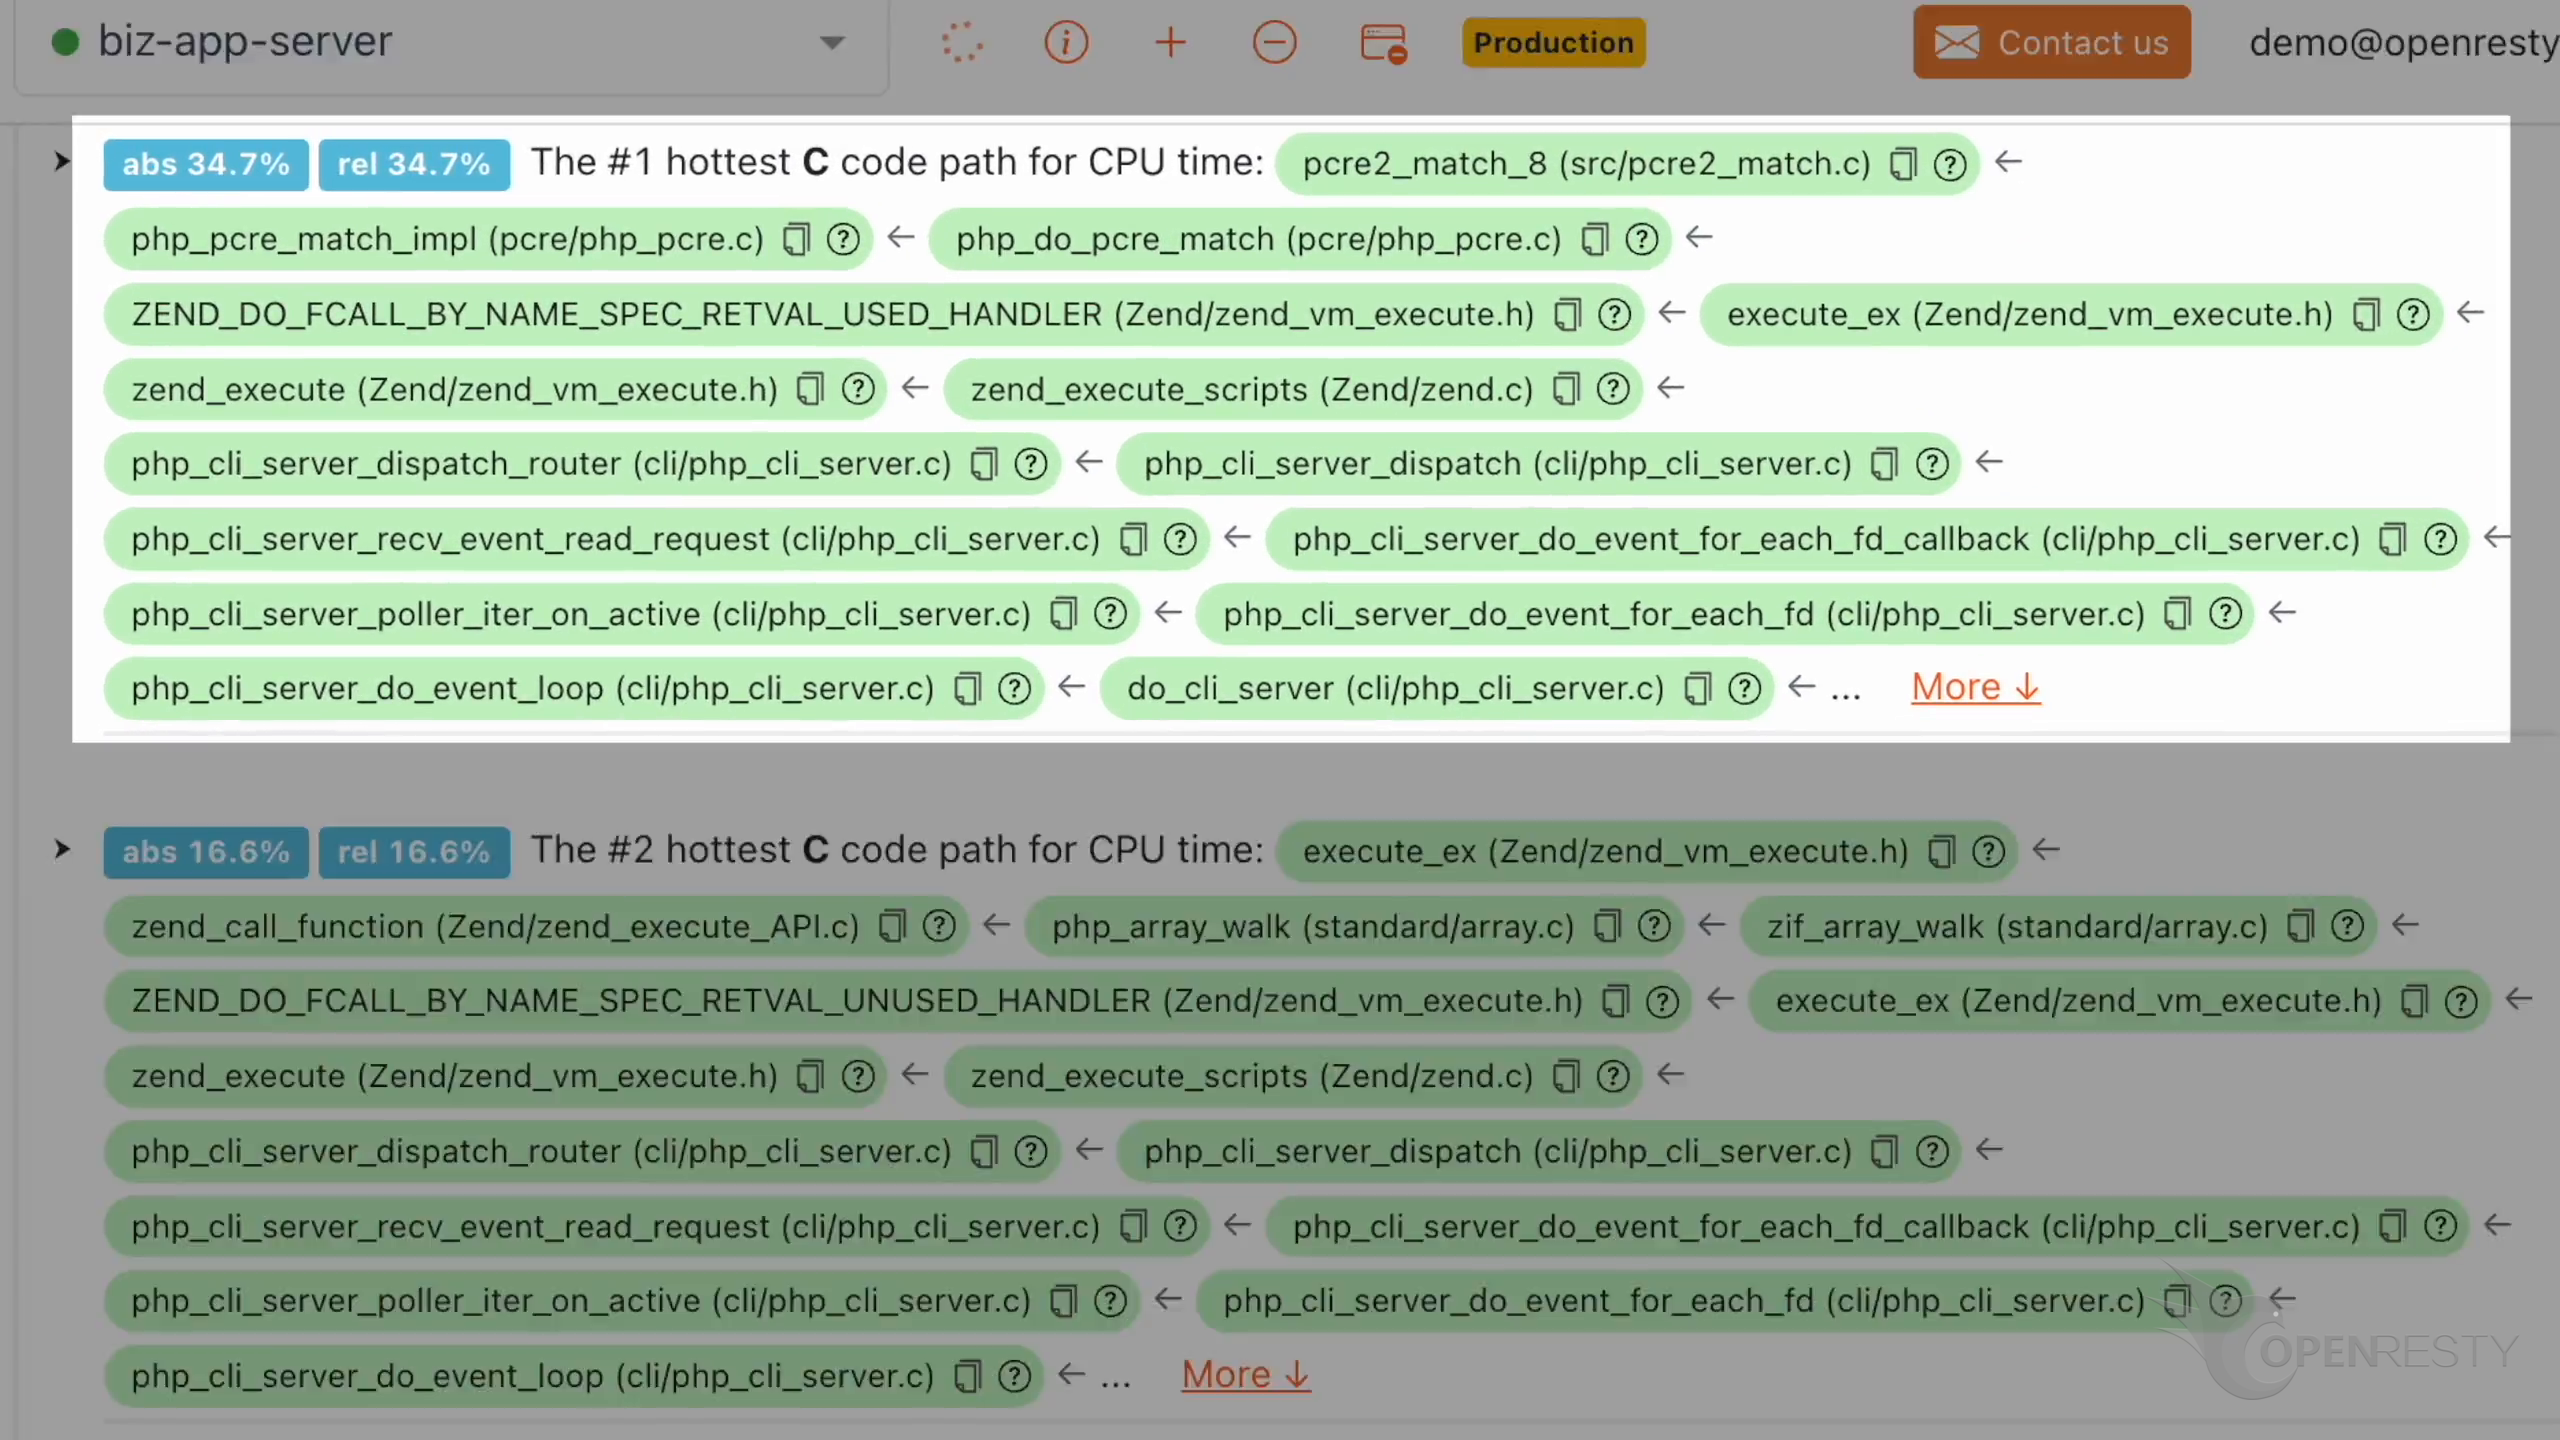
The pcre2_match_8 function is part of the PCRE2 library:
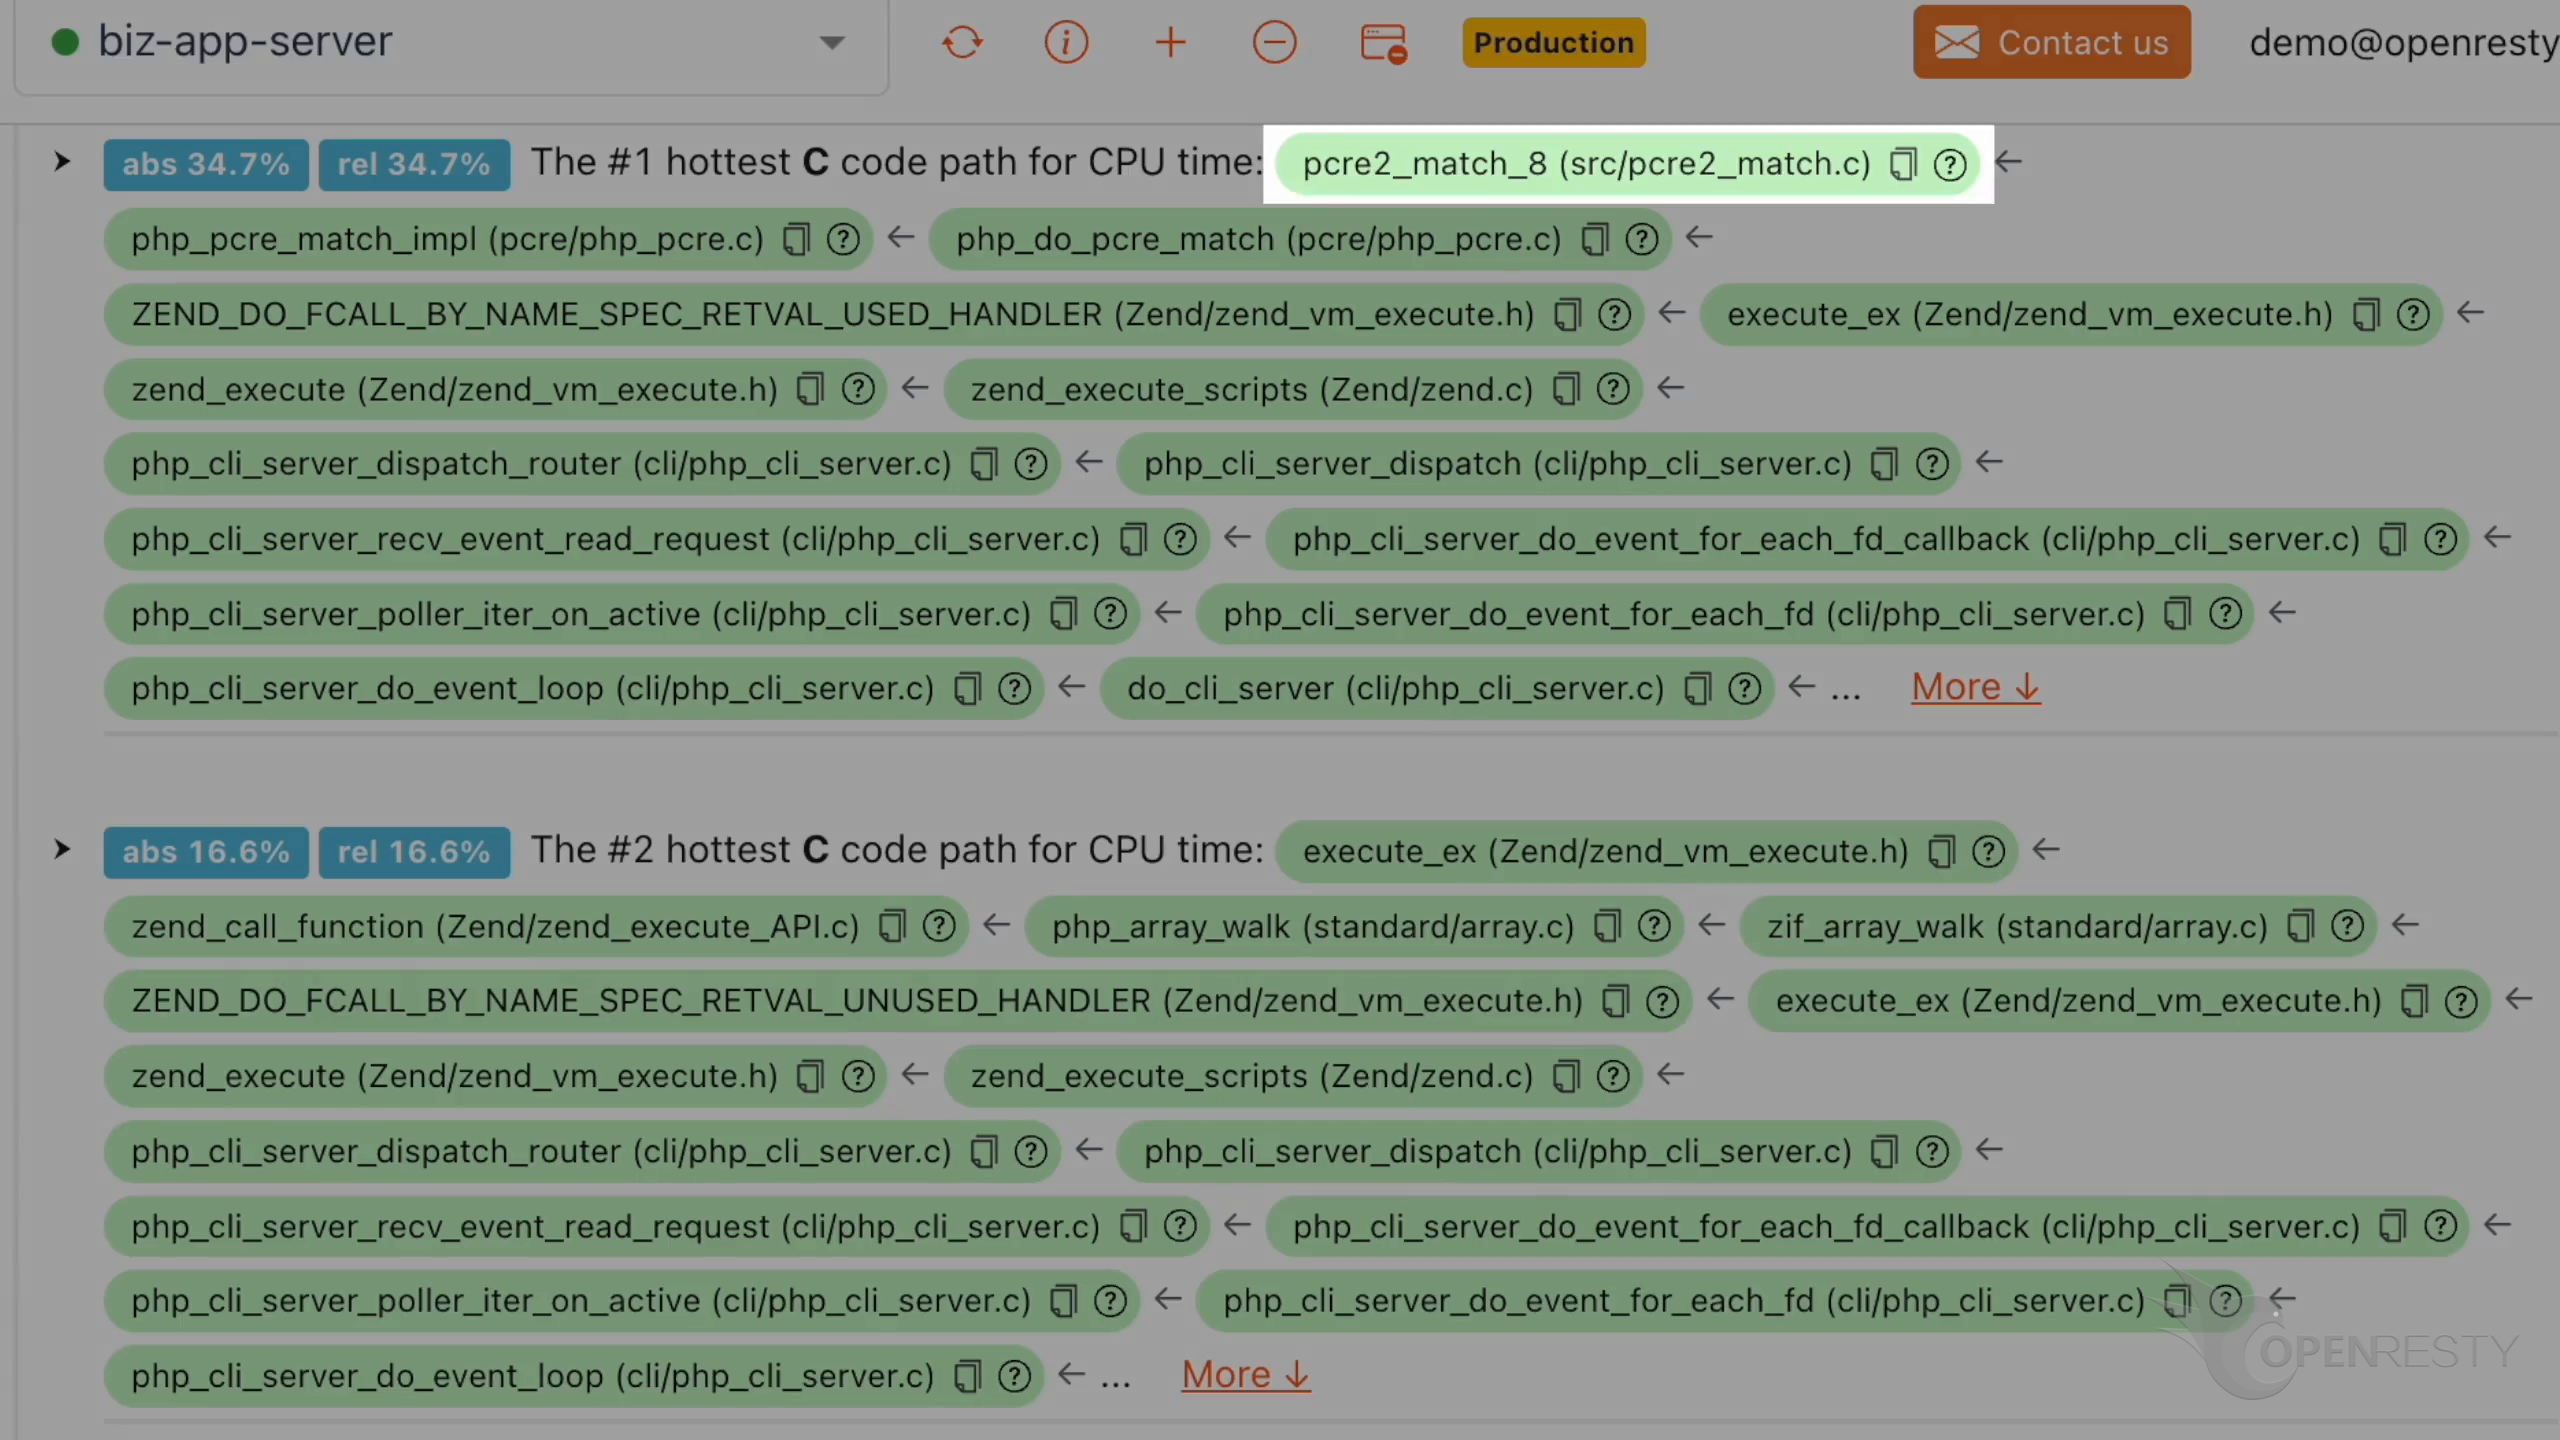
The php_pcre_match_impl function calls into PCRE2 to implement regular expression matching:
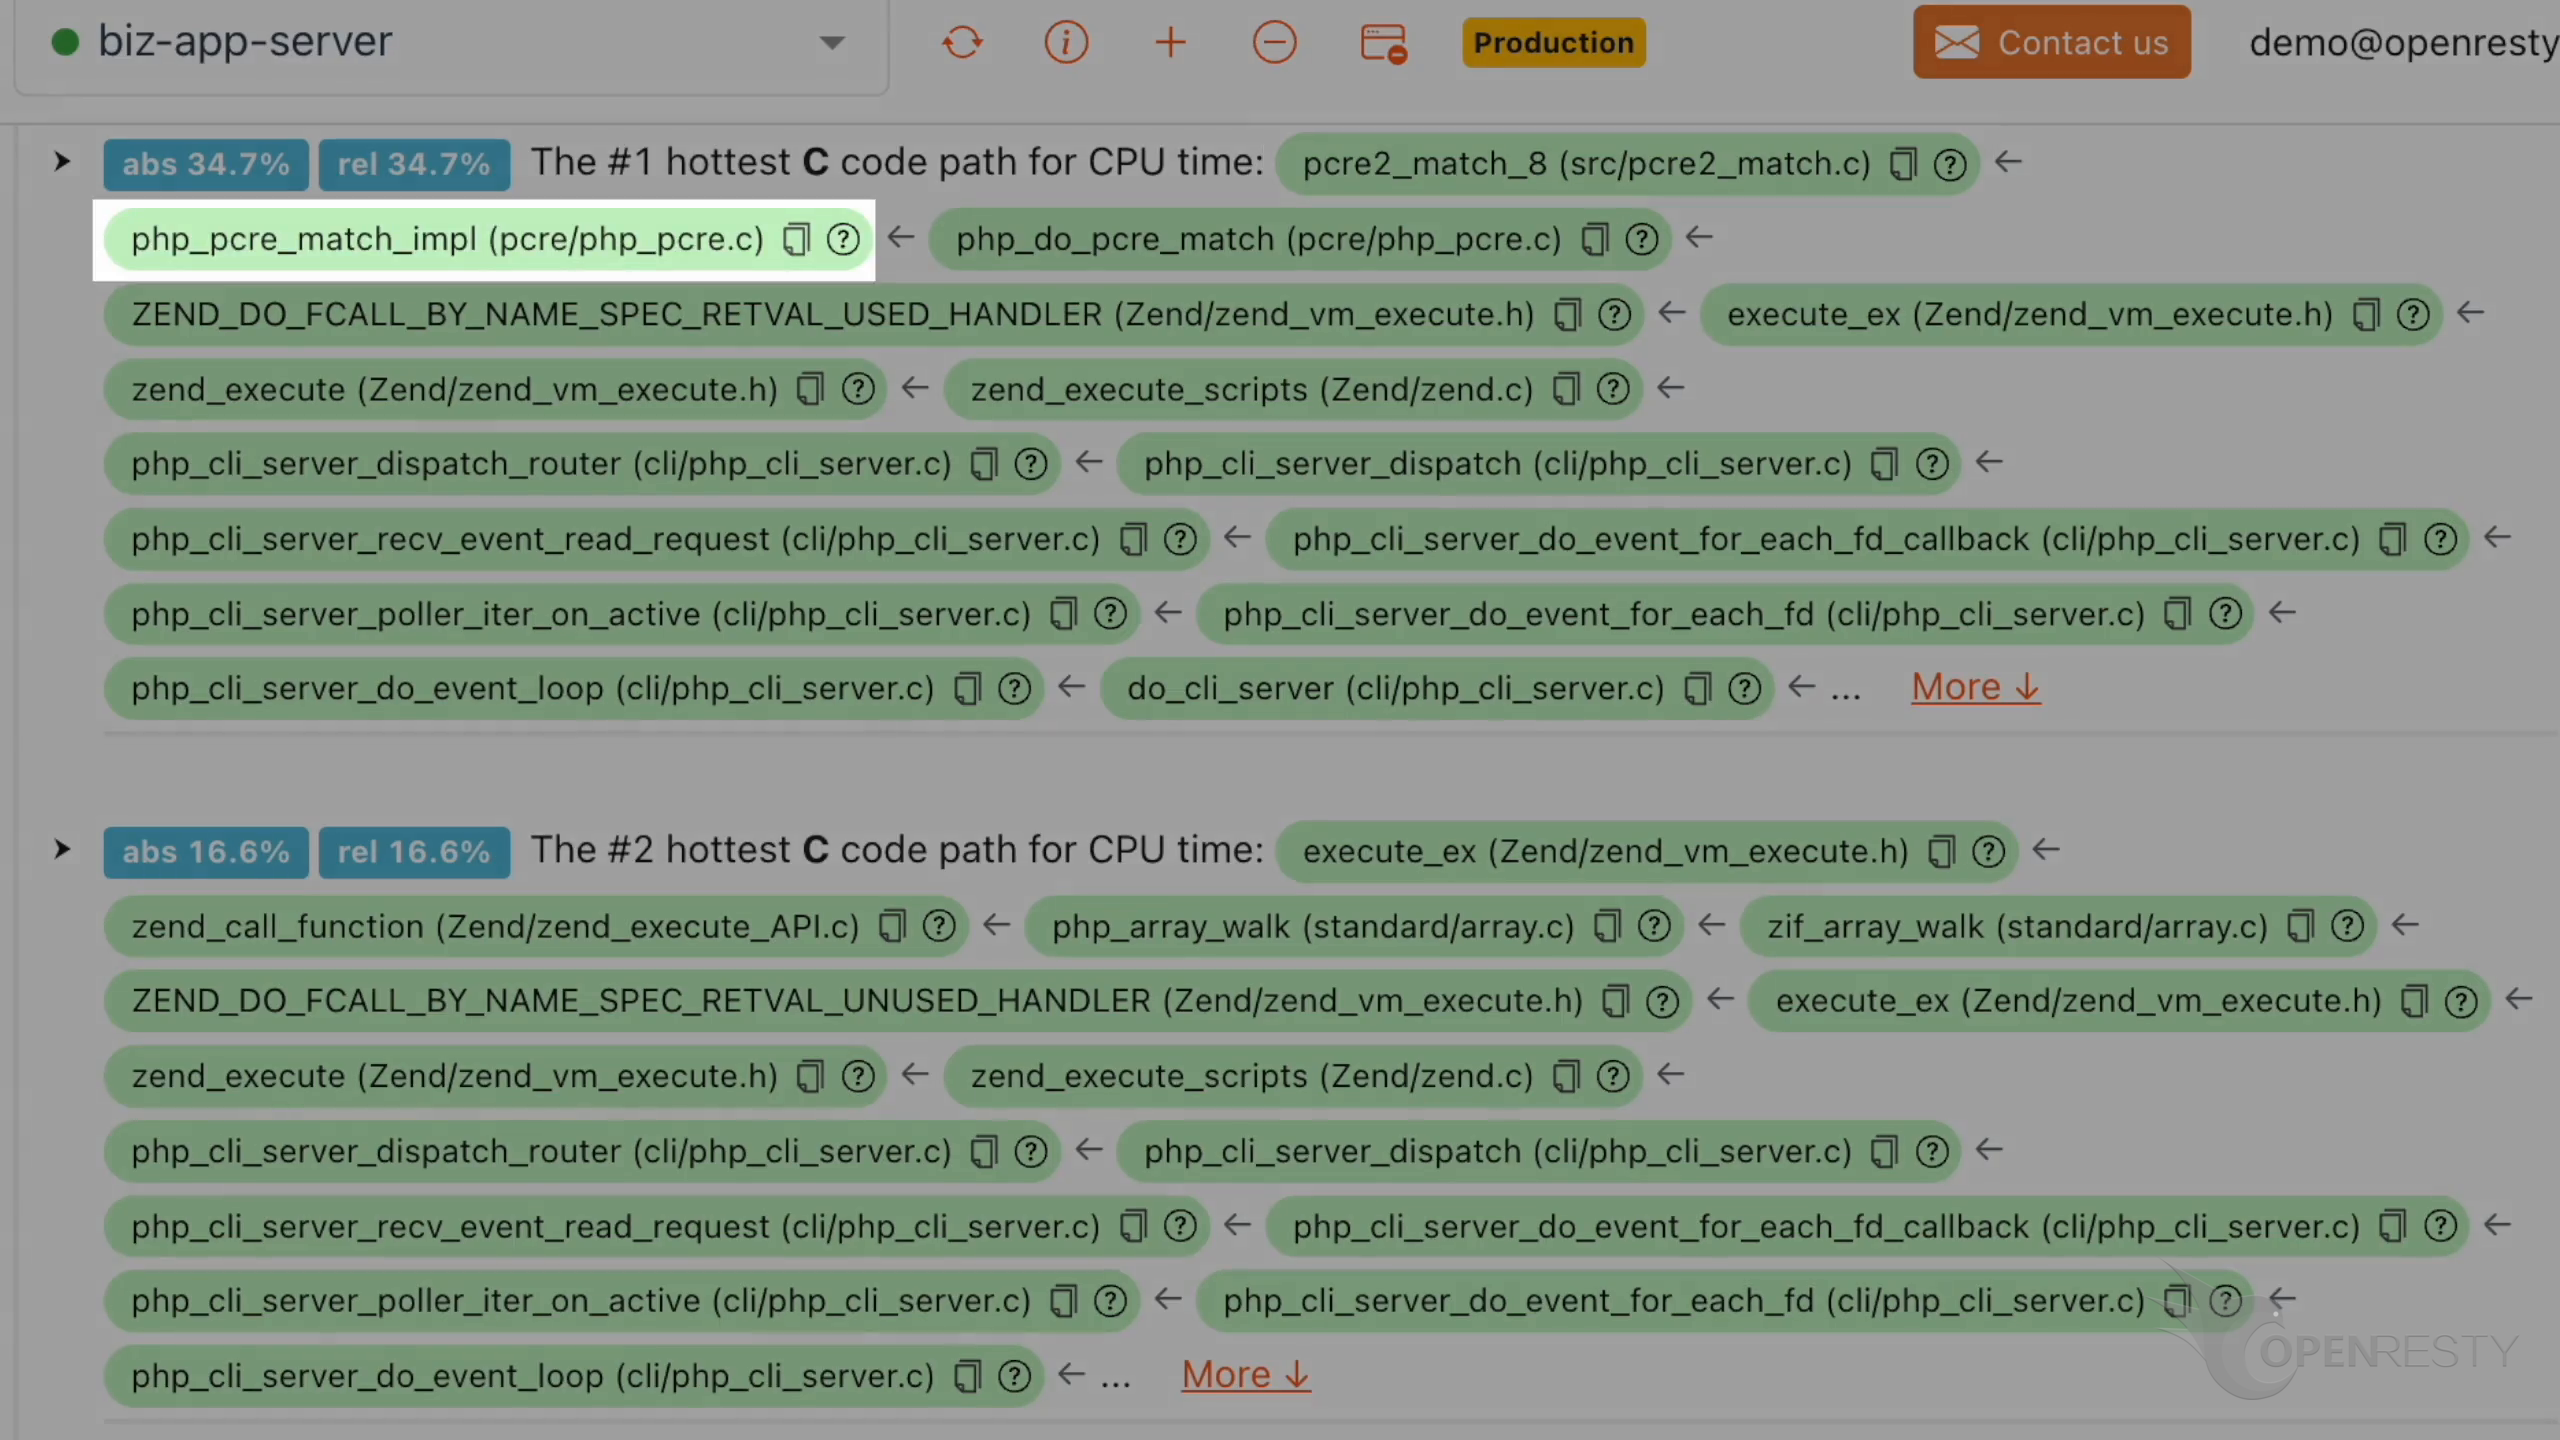
php_do_pcre_match implements the preg_match function. It matches a regular expression against a string:
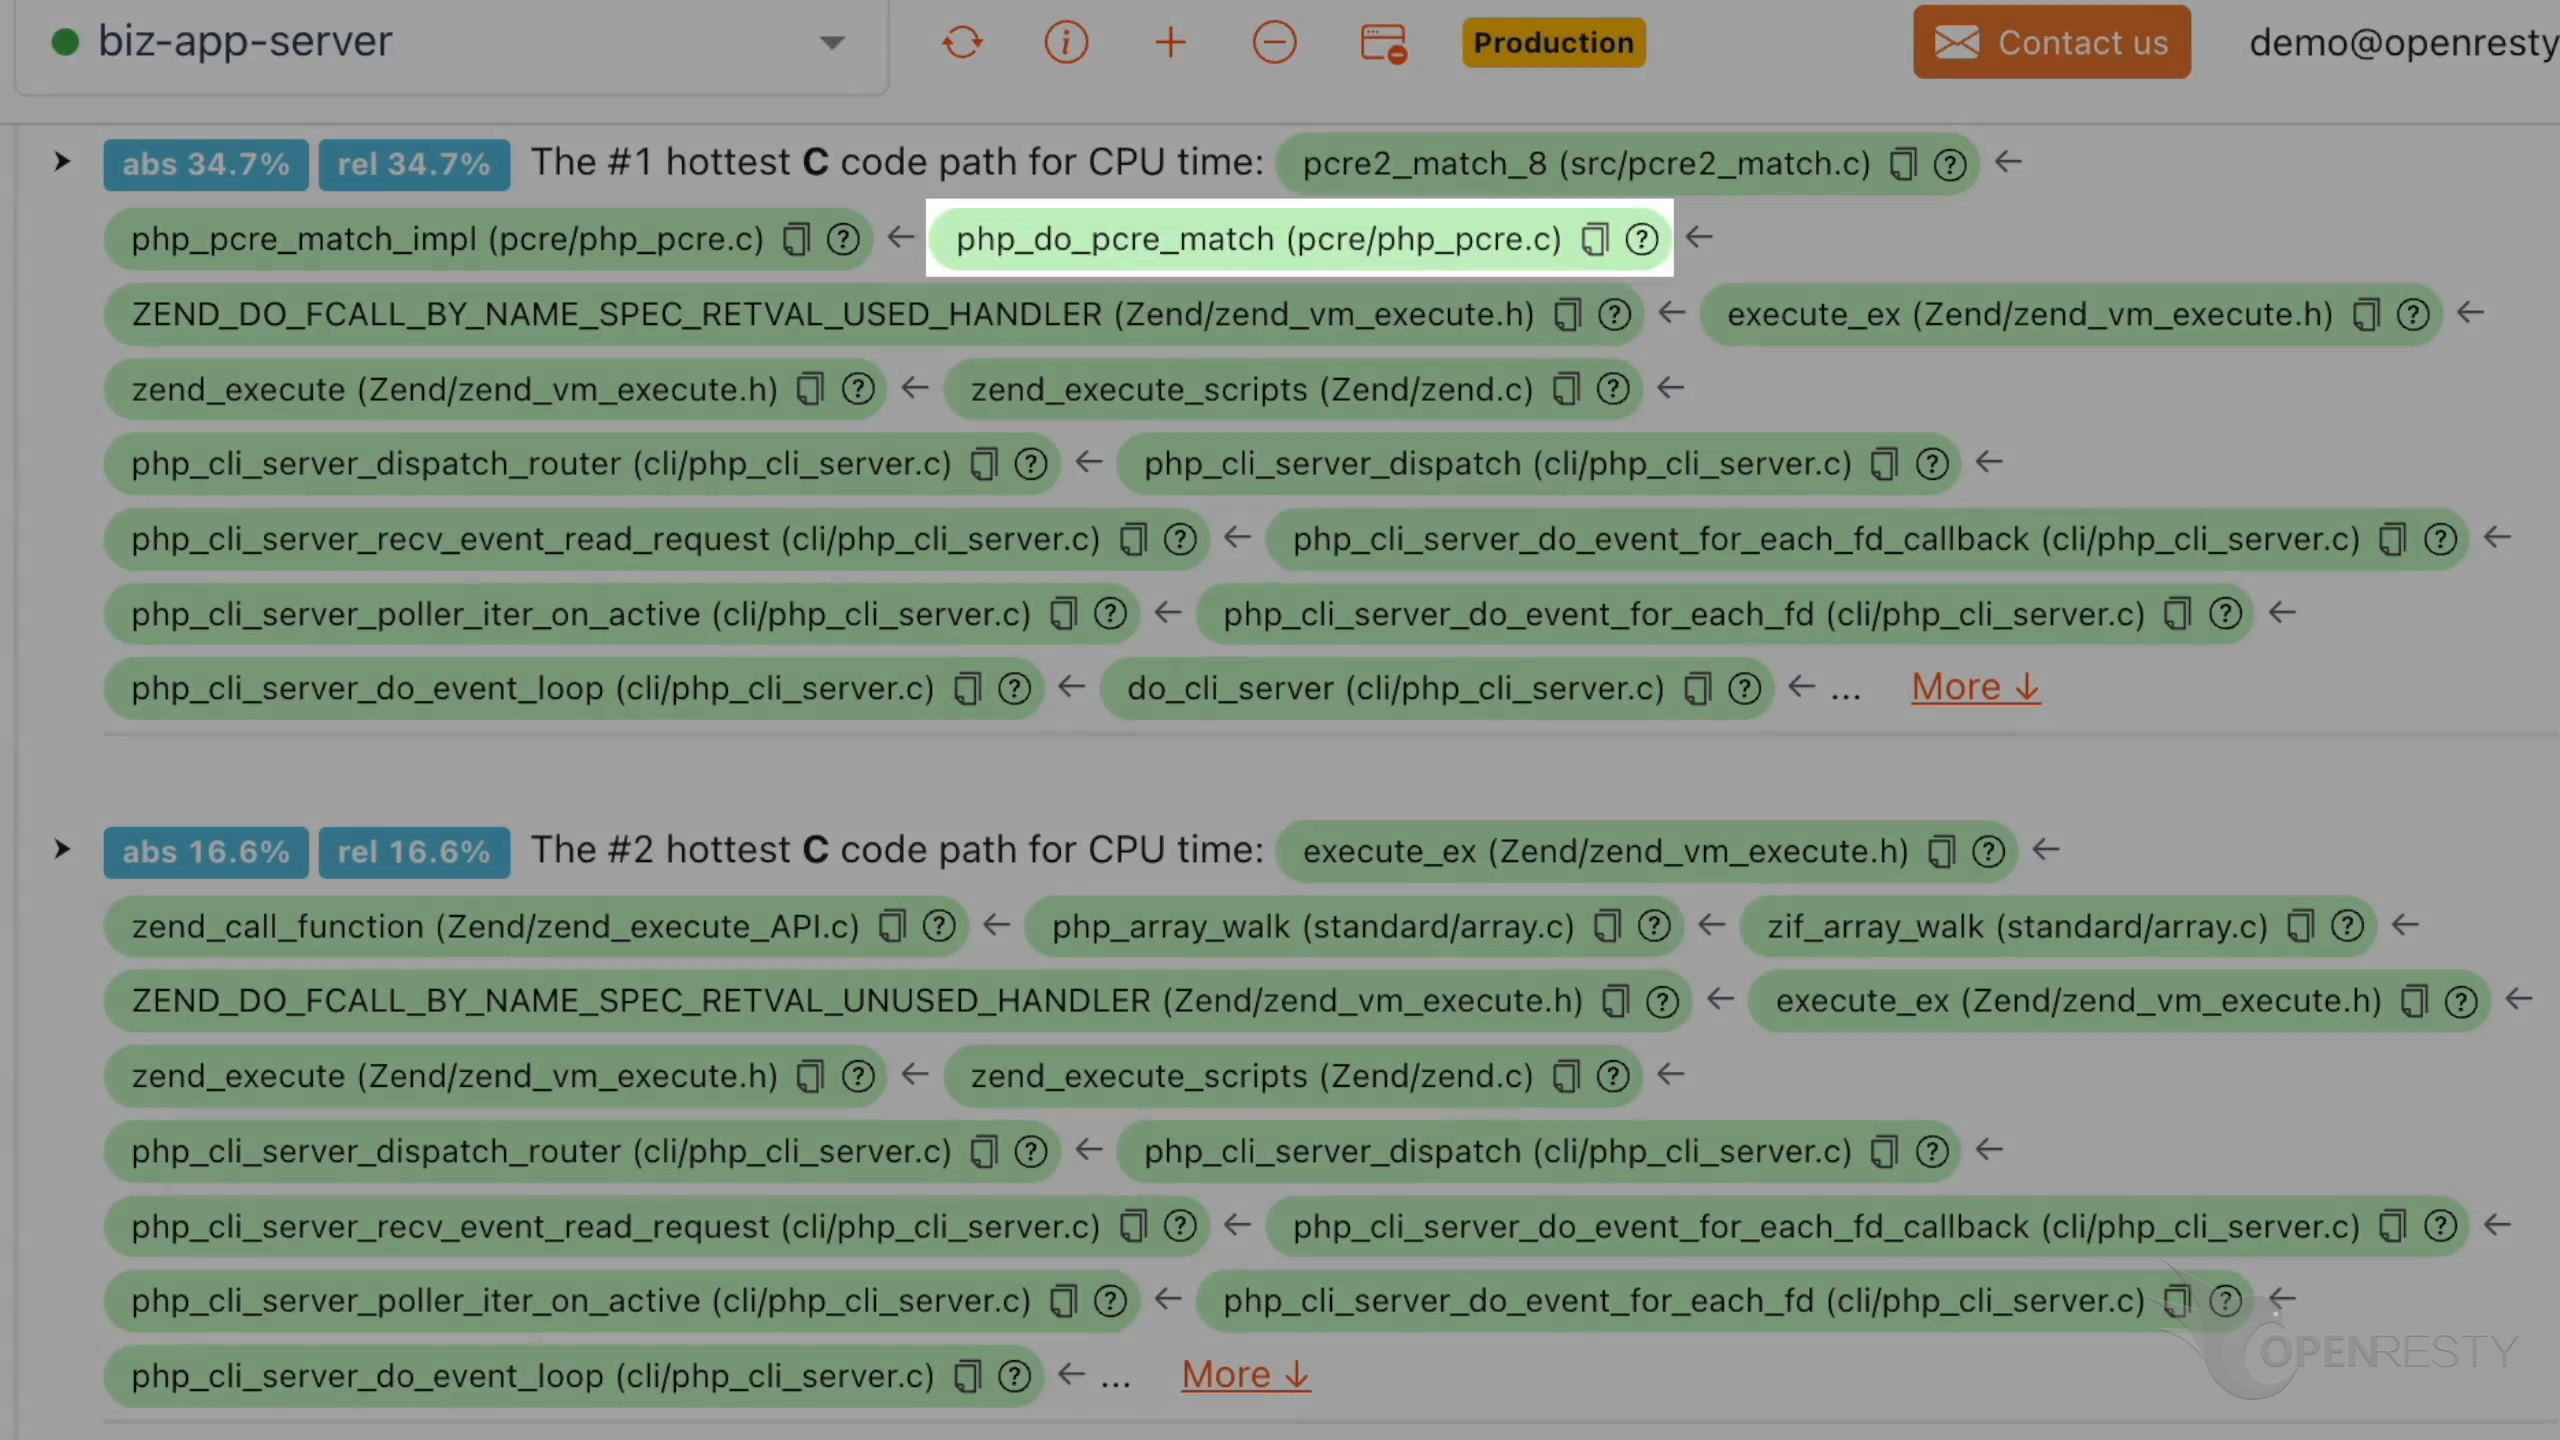
The zend_execute_scripts function is used to execute the PHP script. Clearly, this is similar to the PHP hot code path we just looked at. This confirms, from the C level, that the regular expression matching is the true CPU bottleneck:
This is the same PHP profiling workflow we use for the sibling problem of a PHP process using too much memory, and for tracing PHP exceptions in production — always on live, unmodified processes.
Automatic analysis and reports
OpenResty XRay can also monitor online processes automatically and generate analysis reports. Go to the “Insights” page:
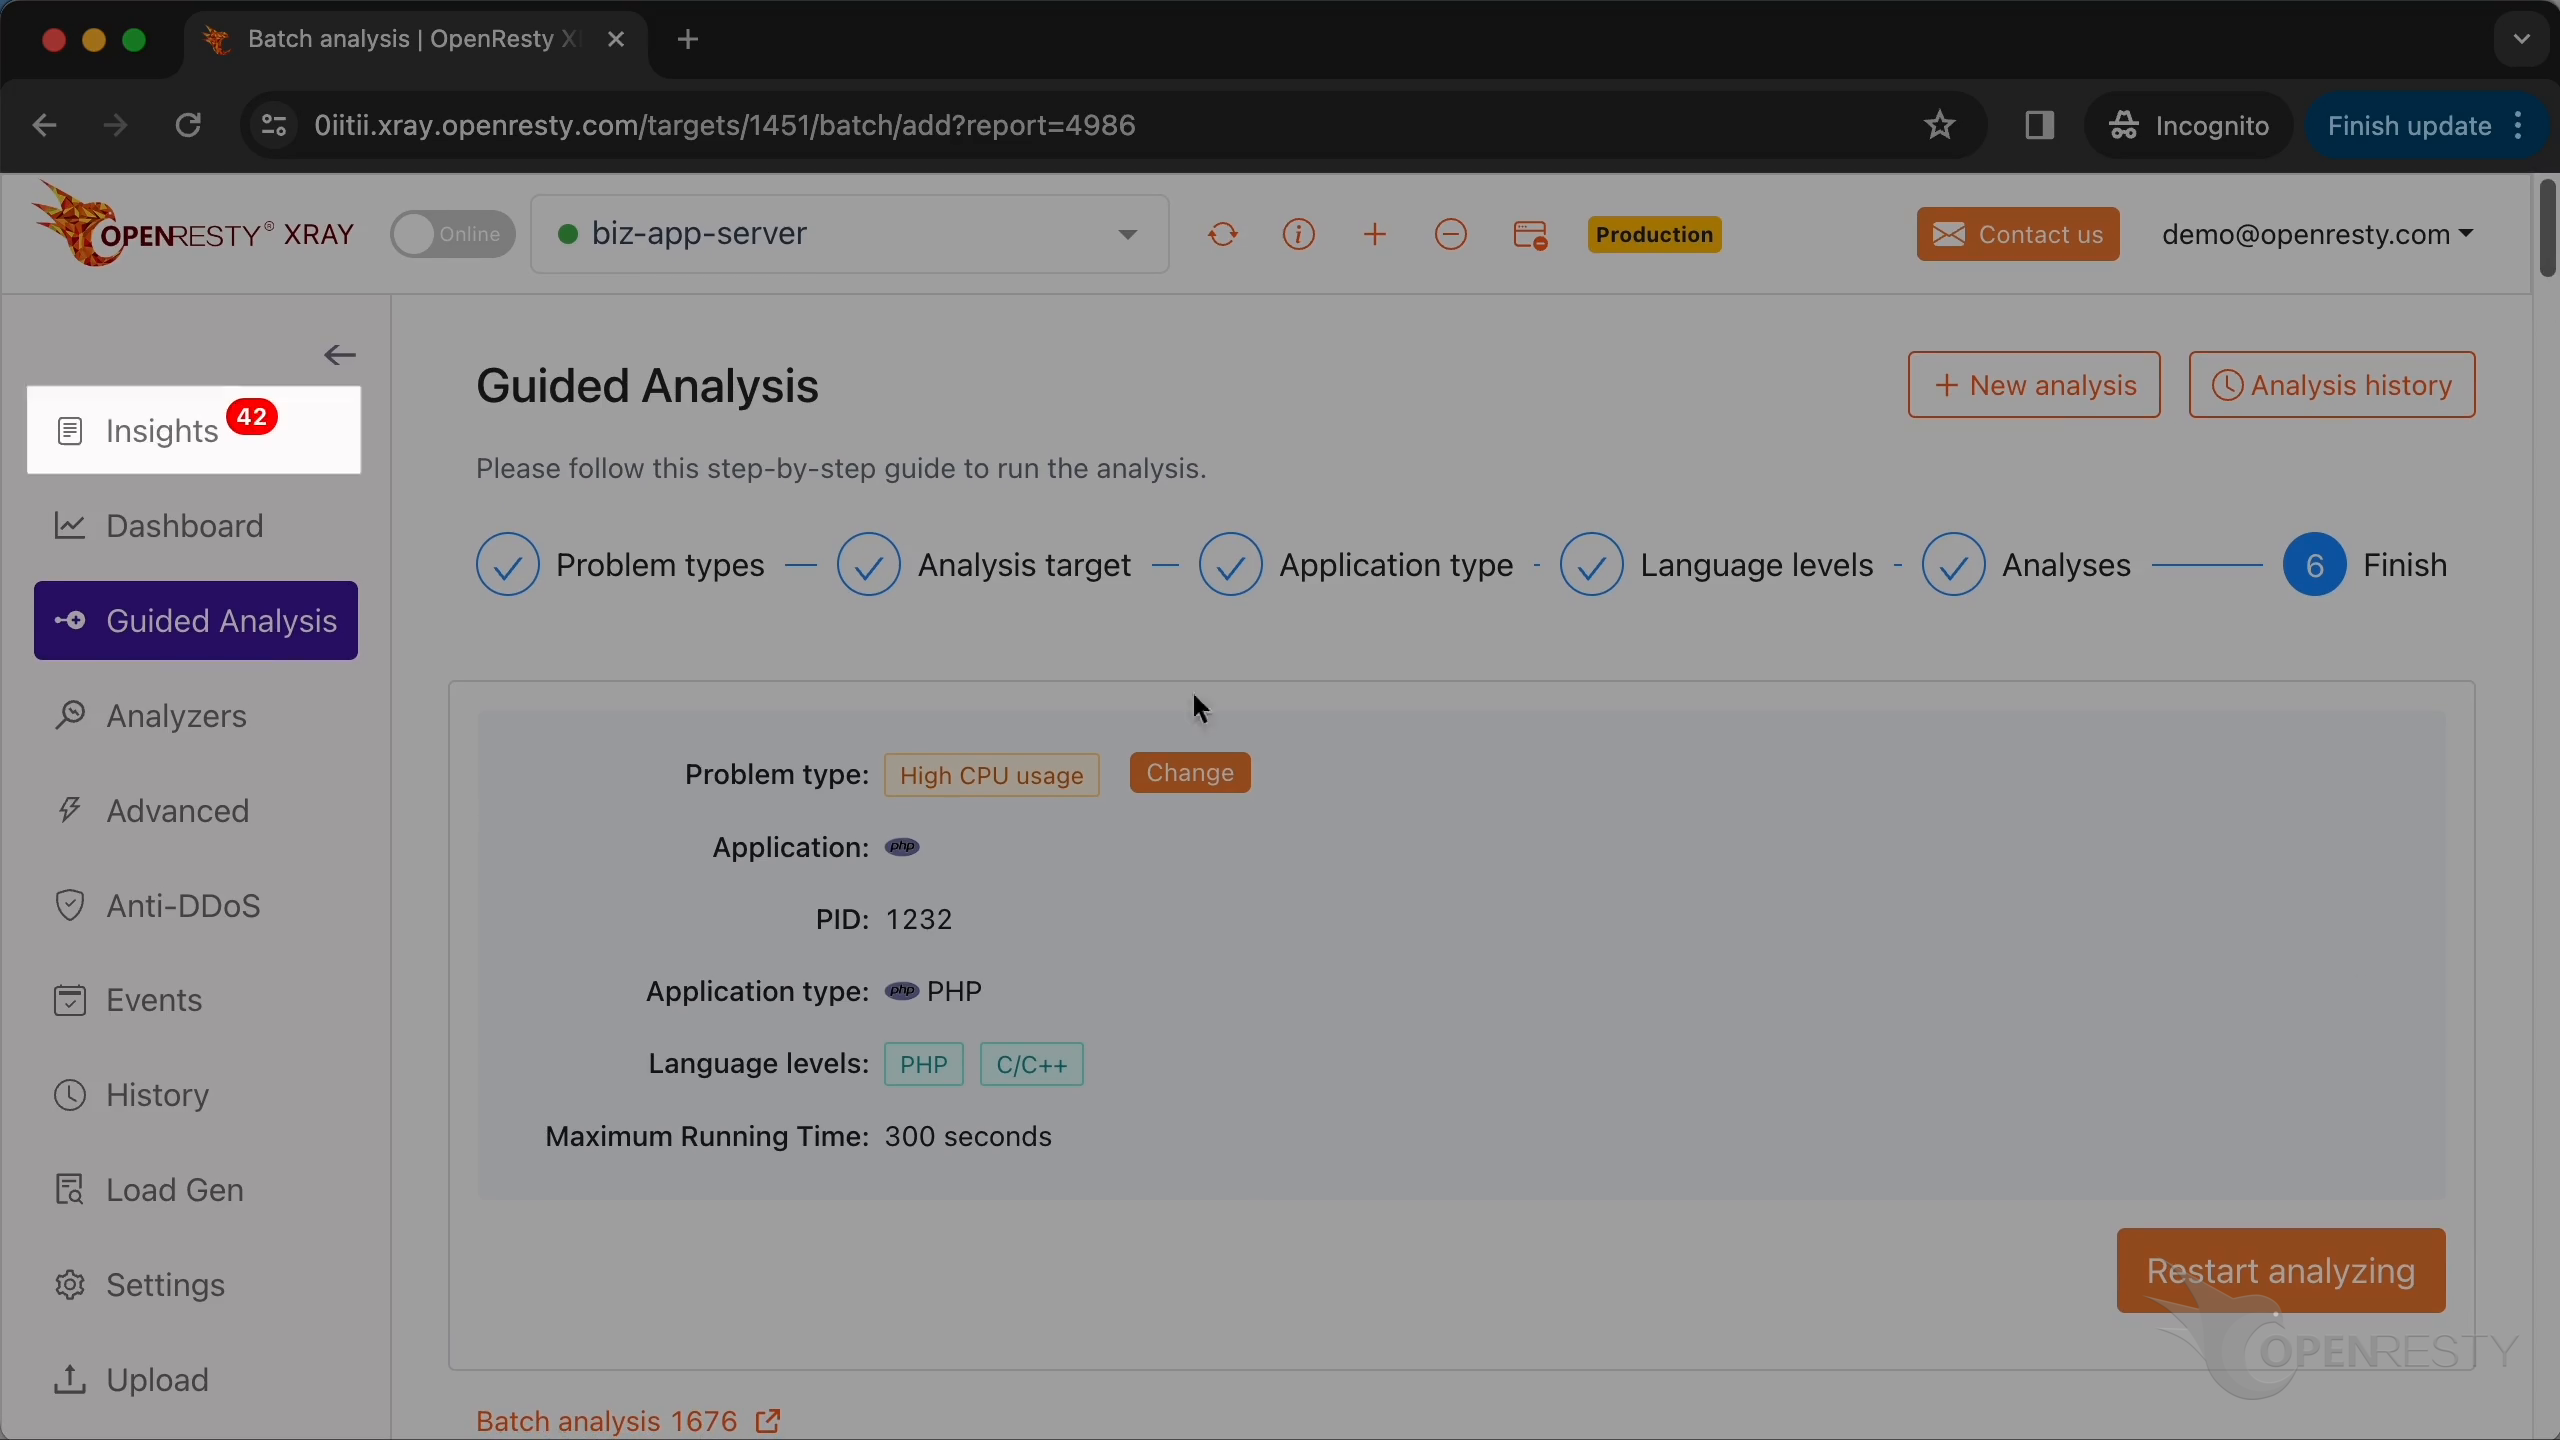
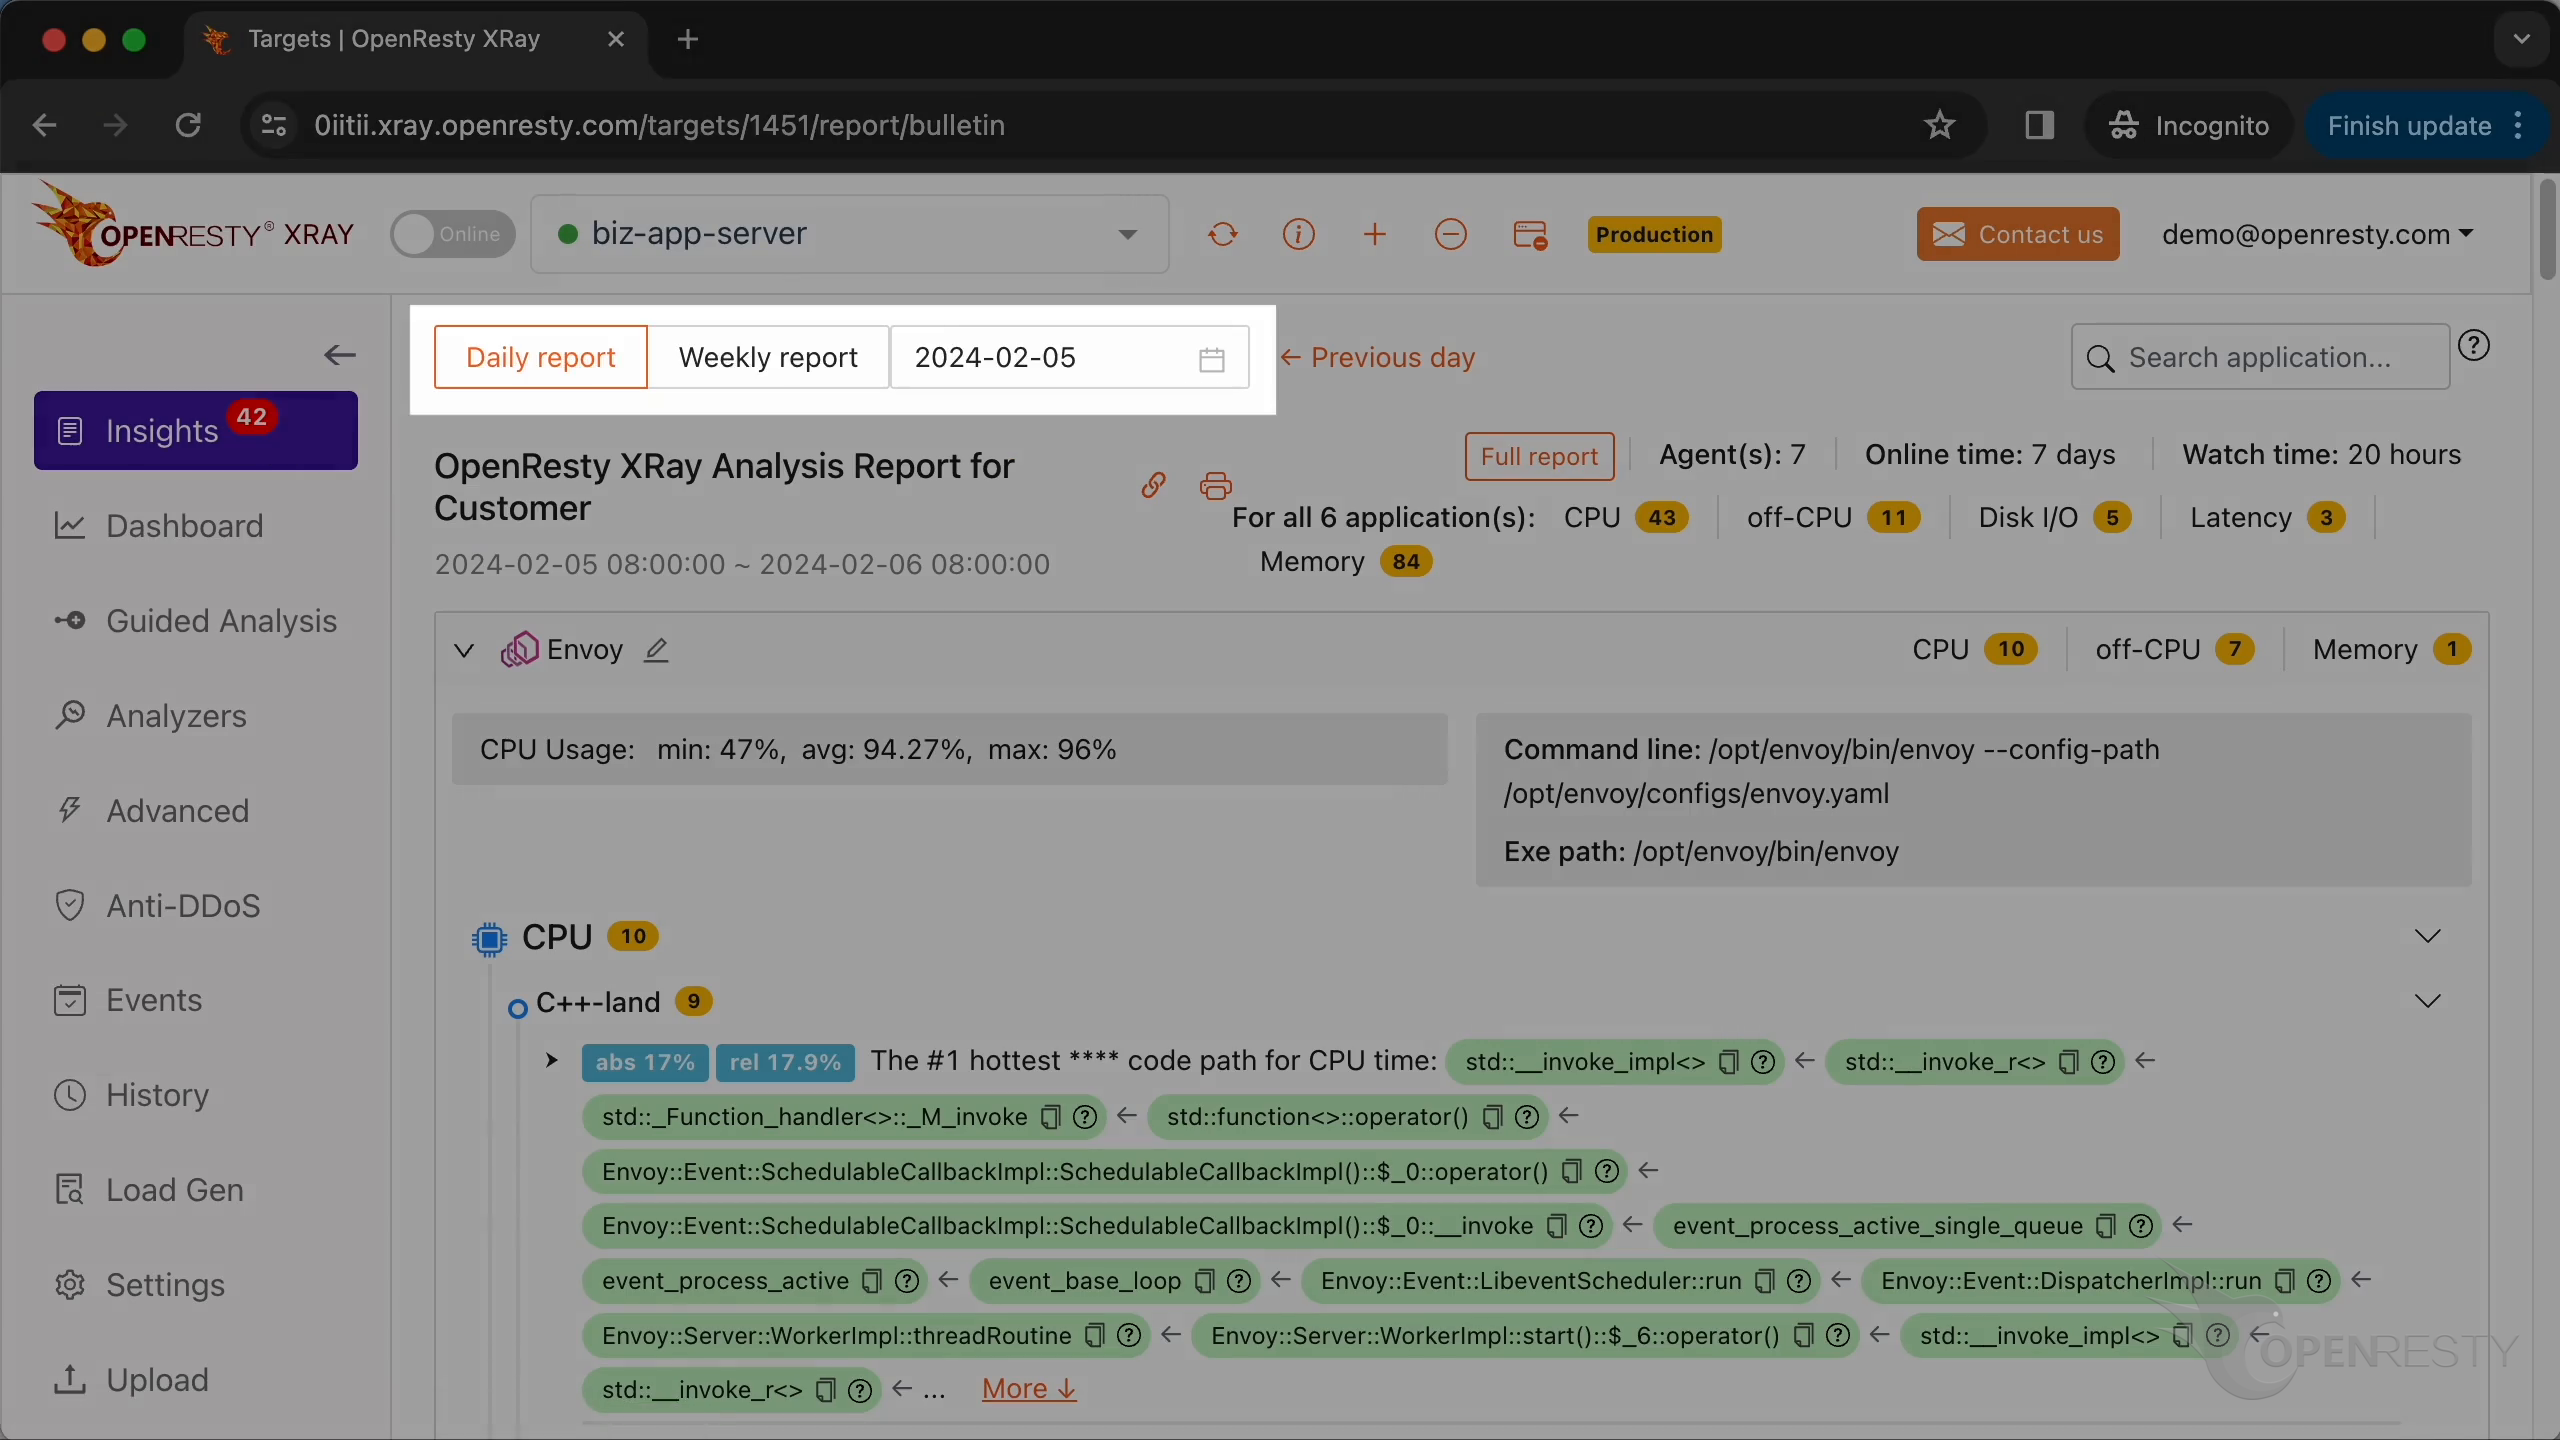
On the “Insights” page you can find automatic reports for daily and weekly periods — so you don’t even have to run Guided Analysis yourself:
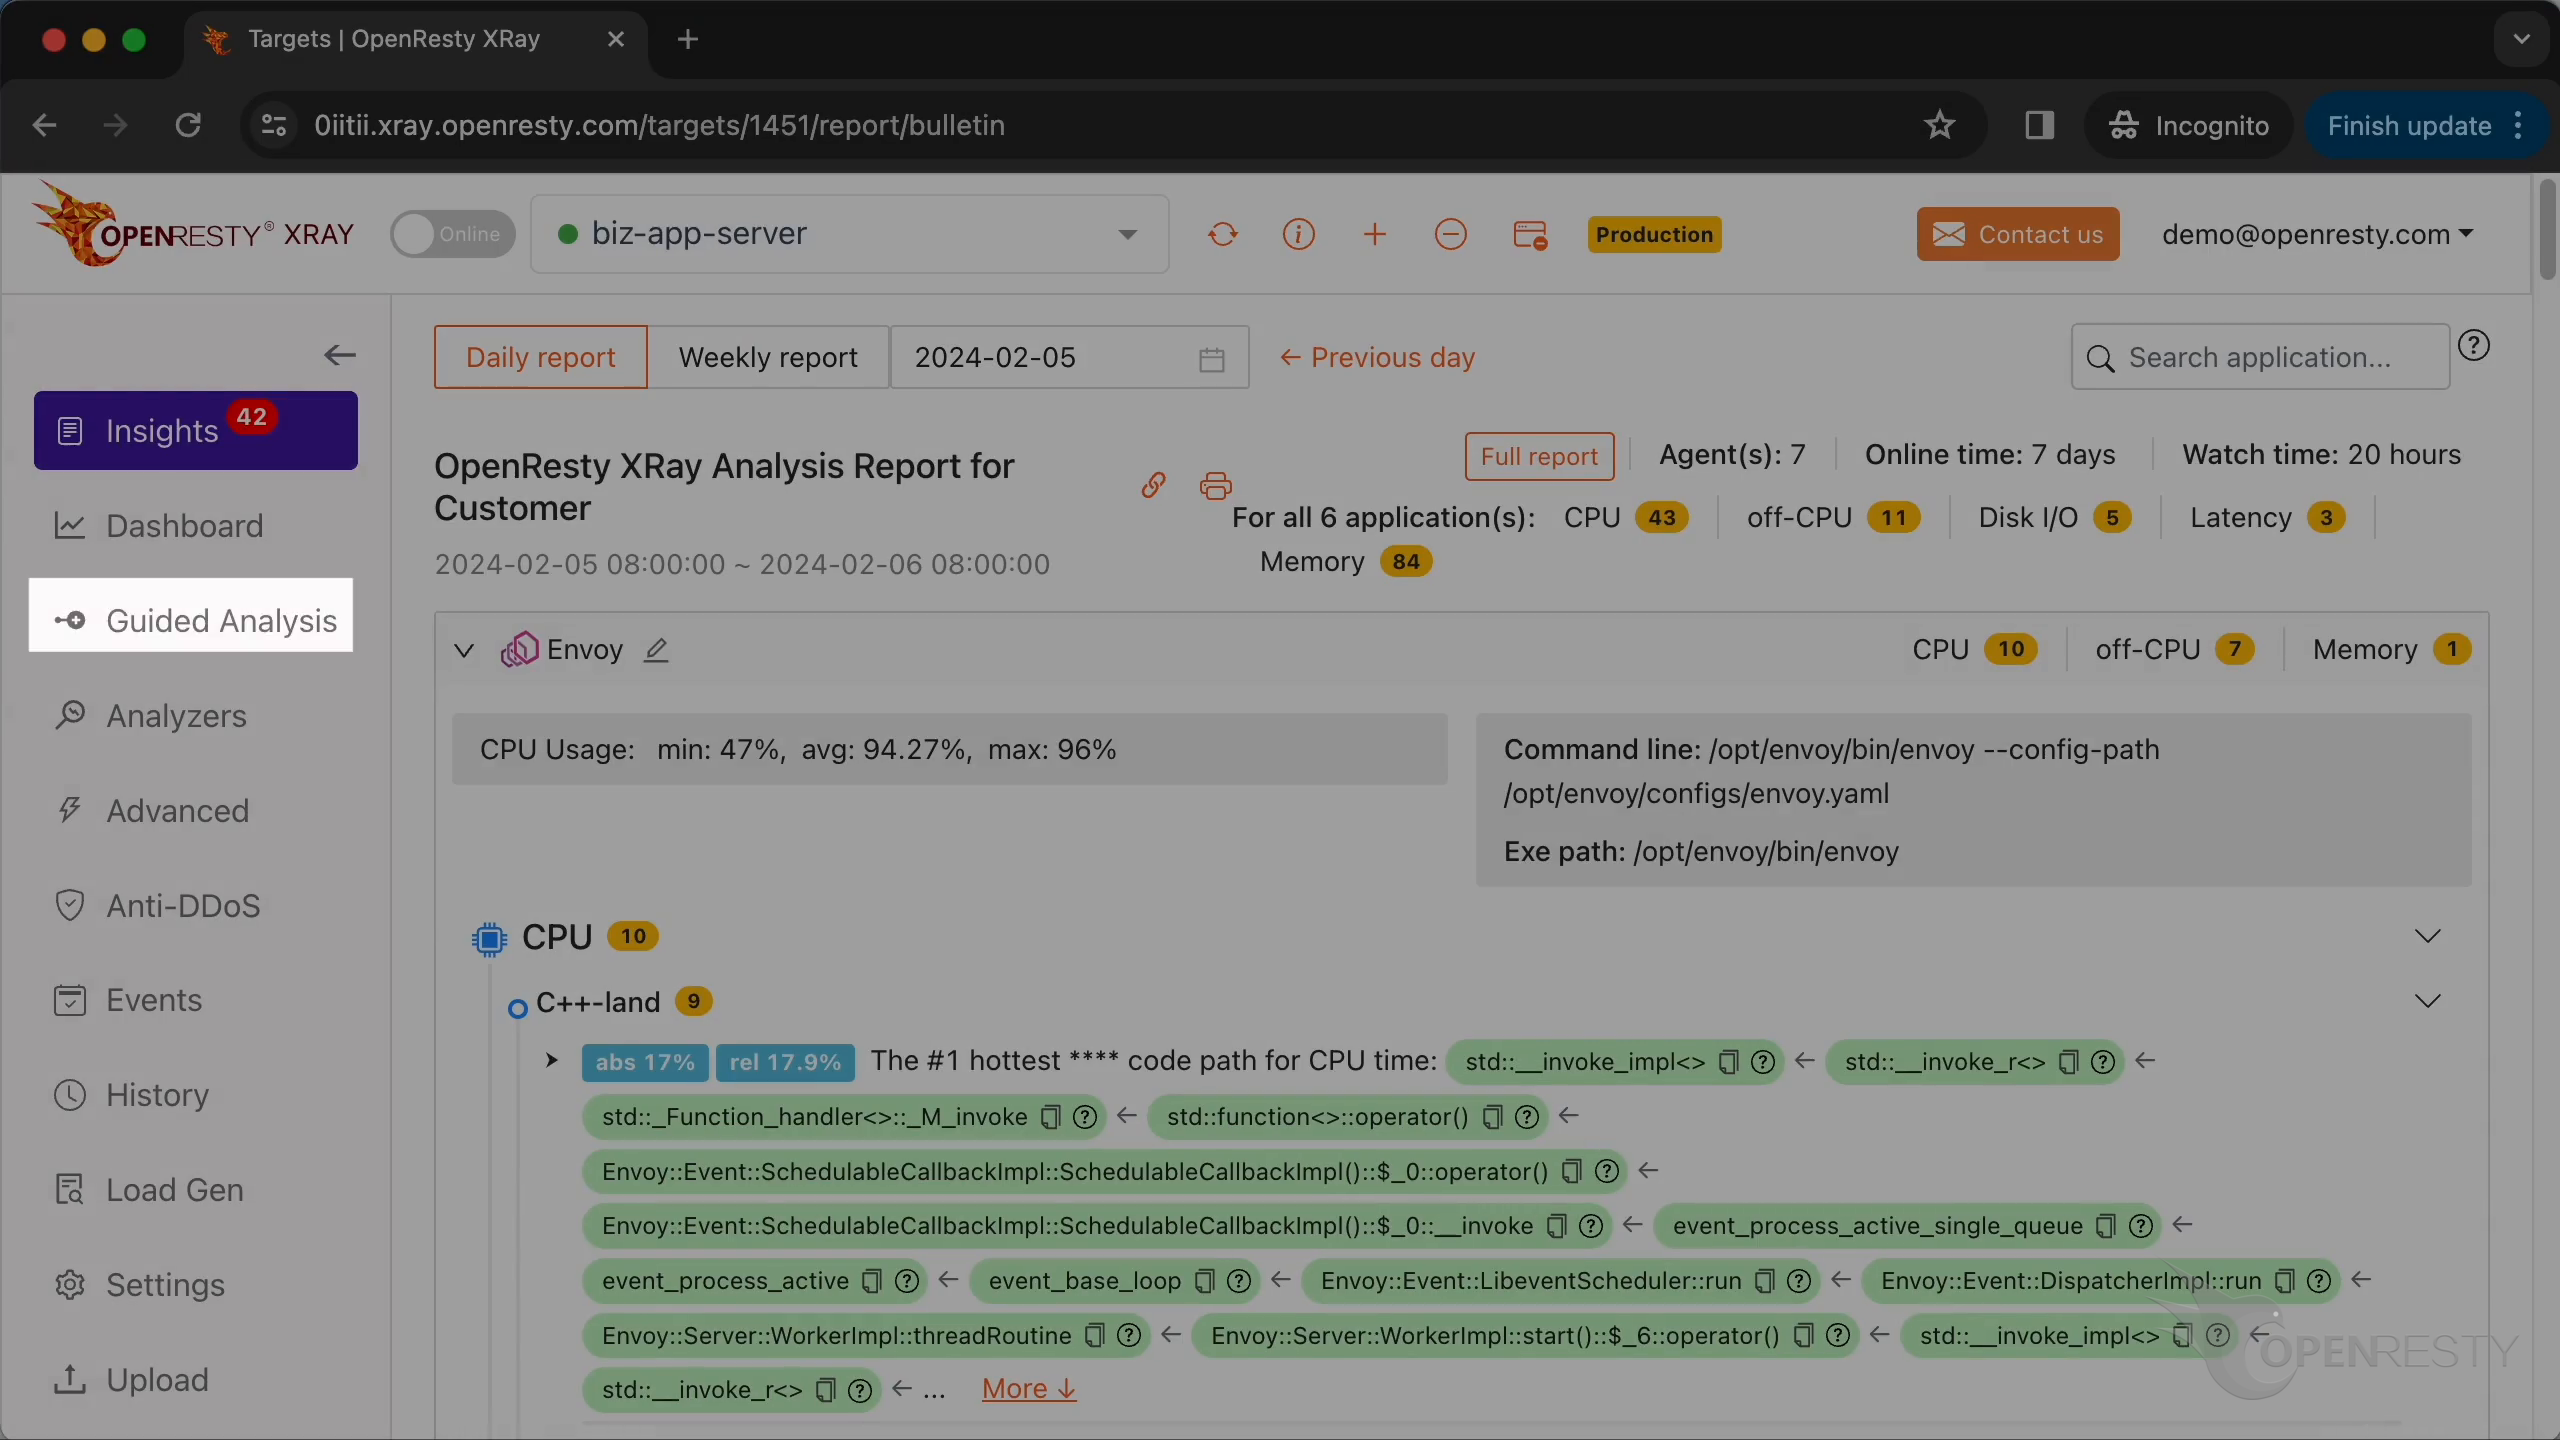
Of course, Guided Analysis remains useful for application development and demonstration purposes:
Frequently Asked Questions
Why is my PHP process using 100% CPU?
A PHP process pinned at 100% CPU is CPU-bound — burning cycles in hot code rather than waiting on I/O. In this case the culprit was a preg_match regular expression matched repeatedly inside a loop in the processOrders function. Attaching OpenResty XRay to the live process and reading its CPU flame graph reveals exactly which function is burning the CPU, without recompiling or restarting anything.
How do I find which PHP function is causing high CPU usage?
Attach OpenResty XRay to the already-running PHP process and start a Guided Analysis for “High CPU usage”. It reads the process in real time, so you don’t instrument, recompile, or restart your application. The result is a report and a CPU flame graph that ranks the hottest PHP code paths and points you to the exact function, source file, and line number responsible.
Can preg_match or regular expressions cause high CPU in PHP?
Yes. preg_match runs on the PCRE2 engine, and matching a regular expression repeatedly — for example inside a loop — can dominate CPU time. In this article the hottest PHP path was preg_match inside processOrders, and the hottest C path (pcre2_match_8 via php_do_pcre_match) confirmed it. Precompiling the expression so it isn’t rebuilt on every iteration is a straightforward fix.
What is OpenResty XRay
OpenResty XRay is a dynamic-tracing product that automatically analyzes your running applications to troubleshoot performance problems, behavioral issues, and security vulnerabilities with actionable suggestions. Under the hood, OpenResty XRay is powered by our Y language targeting various runtimes like Stap+, eBPF+, GDB, and ODB, depending on the contexts.
If you like this tutorial, please subscribe to this blog site and/or our YouTube channel. Thank you!
About The Author
Yichun Zhang (Github handle: agentzh), is the original creator of the OpenResty® open-source project and the CEO of OpenResty Inc..
Yichun is one of the earliest advocates and leaders of “open-source technology”. He worked at many internationally renowned tech companies, such as Cloudflare, Yahoo!. He is a pioneer of “edge computing”, “dynamic tracing” and “machine coding”, with over 22 years of programming and 16 years of open source experience. Yichun is well-known in the open-source space as the project leader of OpenResty®, adopted by more than 40 million global website domains.
OpenResty Inc., the enterprise software start-up founded by Yichun in 2017, has customers from some of the biggest companies in the world. Its flagship product, OpenResty XRay, is a non-invasive profiling and troubleshooting tool that significantly enhances and utilizes dynamic tracing technology. And its OpenResty Edge product is a powerful distributed traffic management and private CDN software product.
As an avid open-source contributor, Yichun has contributed more than a million lines of code to numerous open-source projects, including Linux kernel, Nginx, LuaJIT, GDB, SystemTap, LLVM, Perl, etc. He has also authored more than 60 open-source software libraries.
Related Articles
OpenResty XRay Apr 1, 2024

OpenResty XRay Feb 27, 2024

OpenResty XRay Aug 27, 2026

OpenResty XRay Dec 25, 2023

OpenResty XRay Sep 28, 2023