How to Trace PHP Exceptions in Production Without Restarting
OpenResty XRay traces PHP exceptions in live production applications without restarting or modifying the process, detecting both crashing and silently caught exceptions. It automatically interprets PHP-level Exception Flame Graphs to pinpoint the exact code path behind each error, minimizing performance overhead in latency-sensitive production environments.
This tutorial walks through using XRay’s Guided Analysis to trace exceptions inside a real PHP application, from launching the scan to reading the automatically generated report.
Trace PHP Exceptions with XRay’s Guided Analysis
Inspect the process and open the XRay console
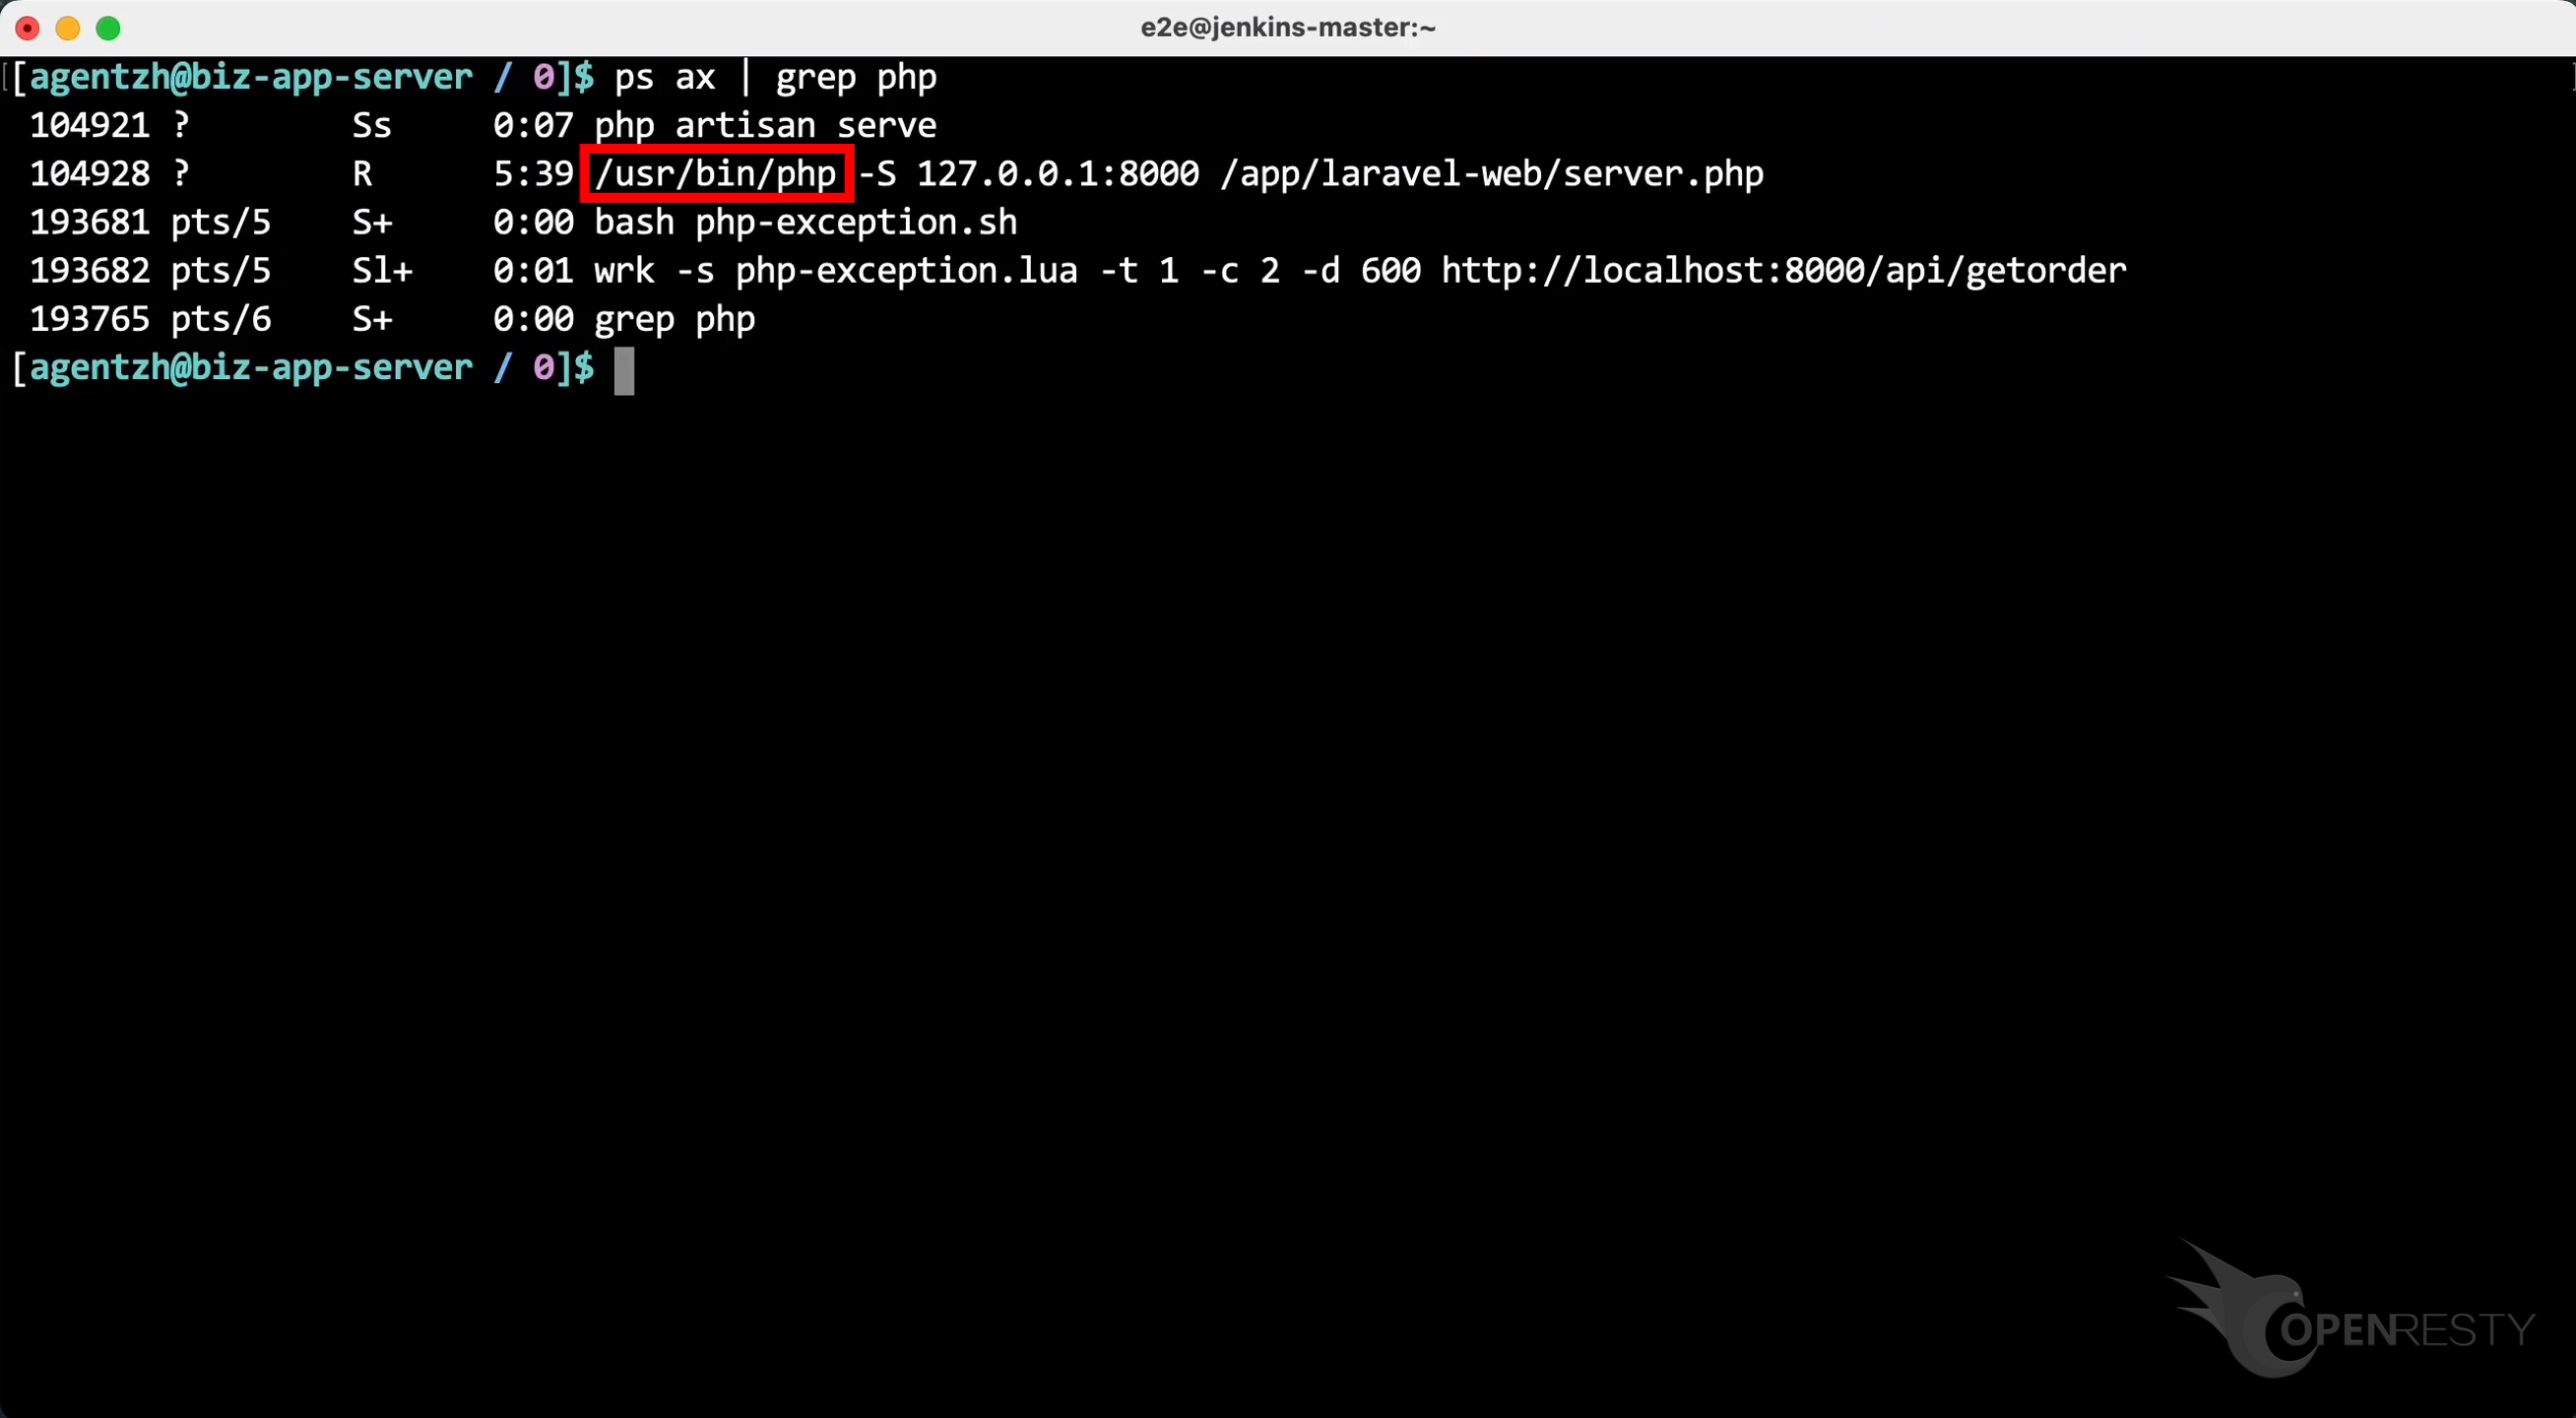
First, run the ps command to see the full command line for this process.
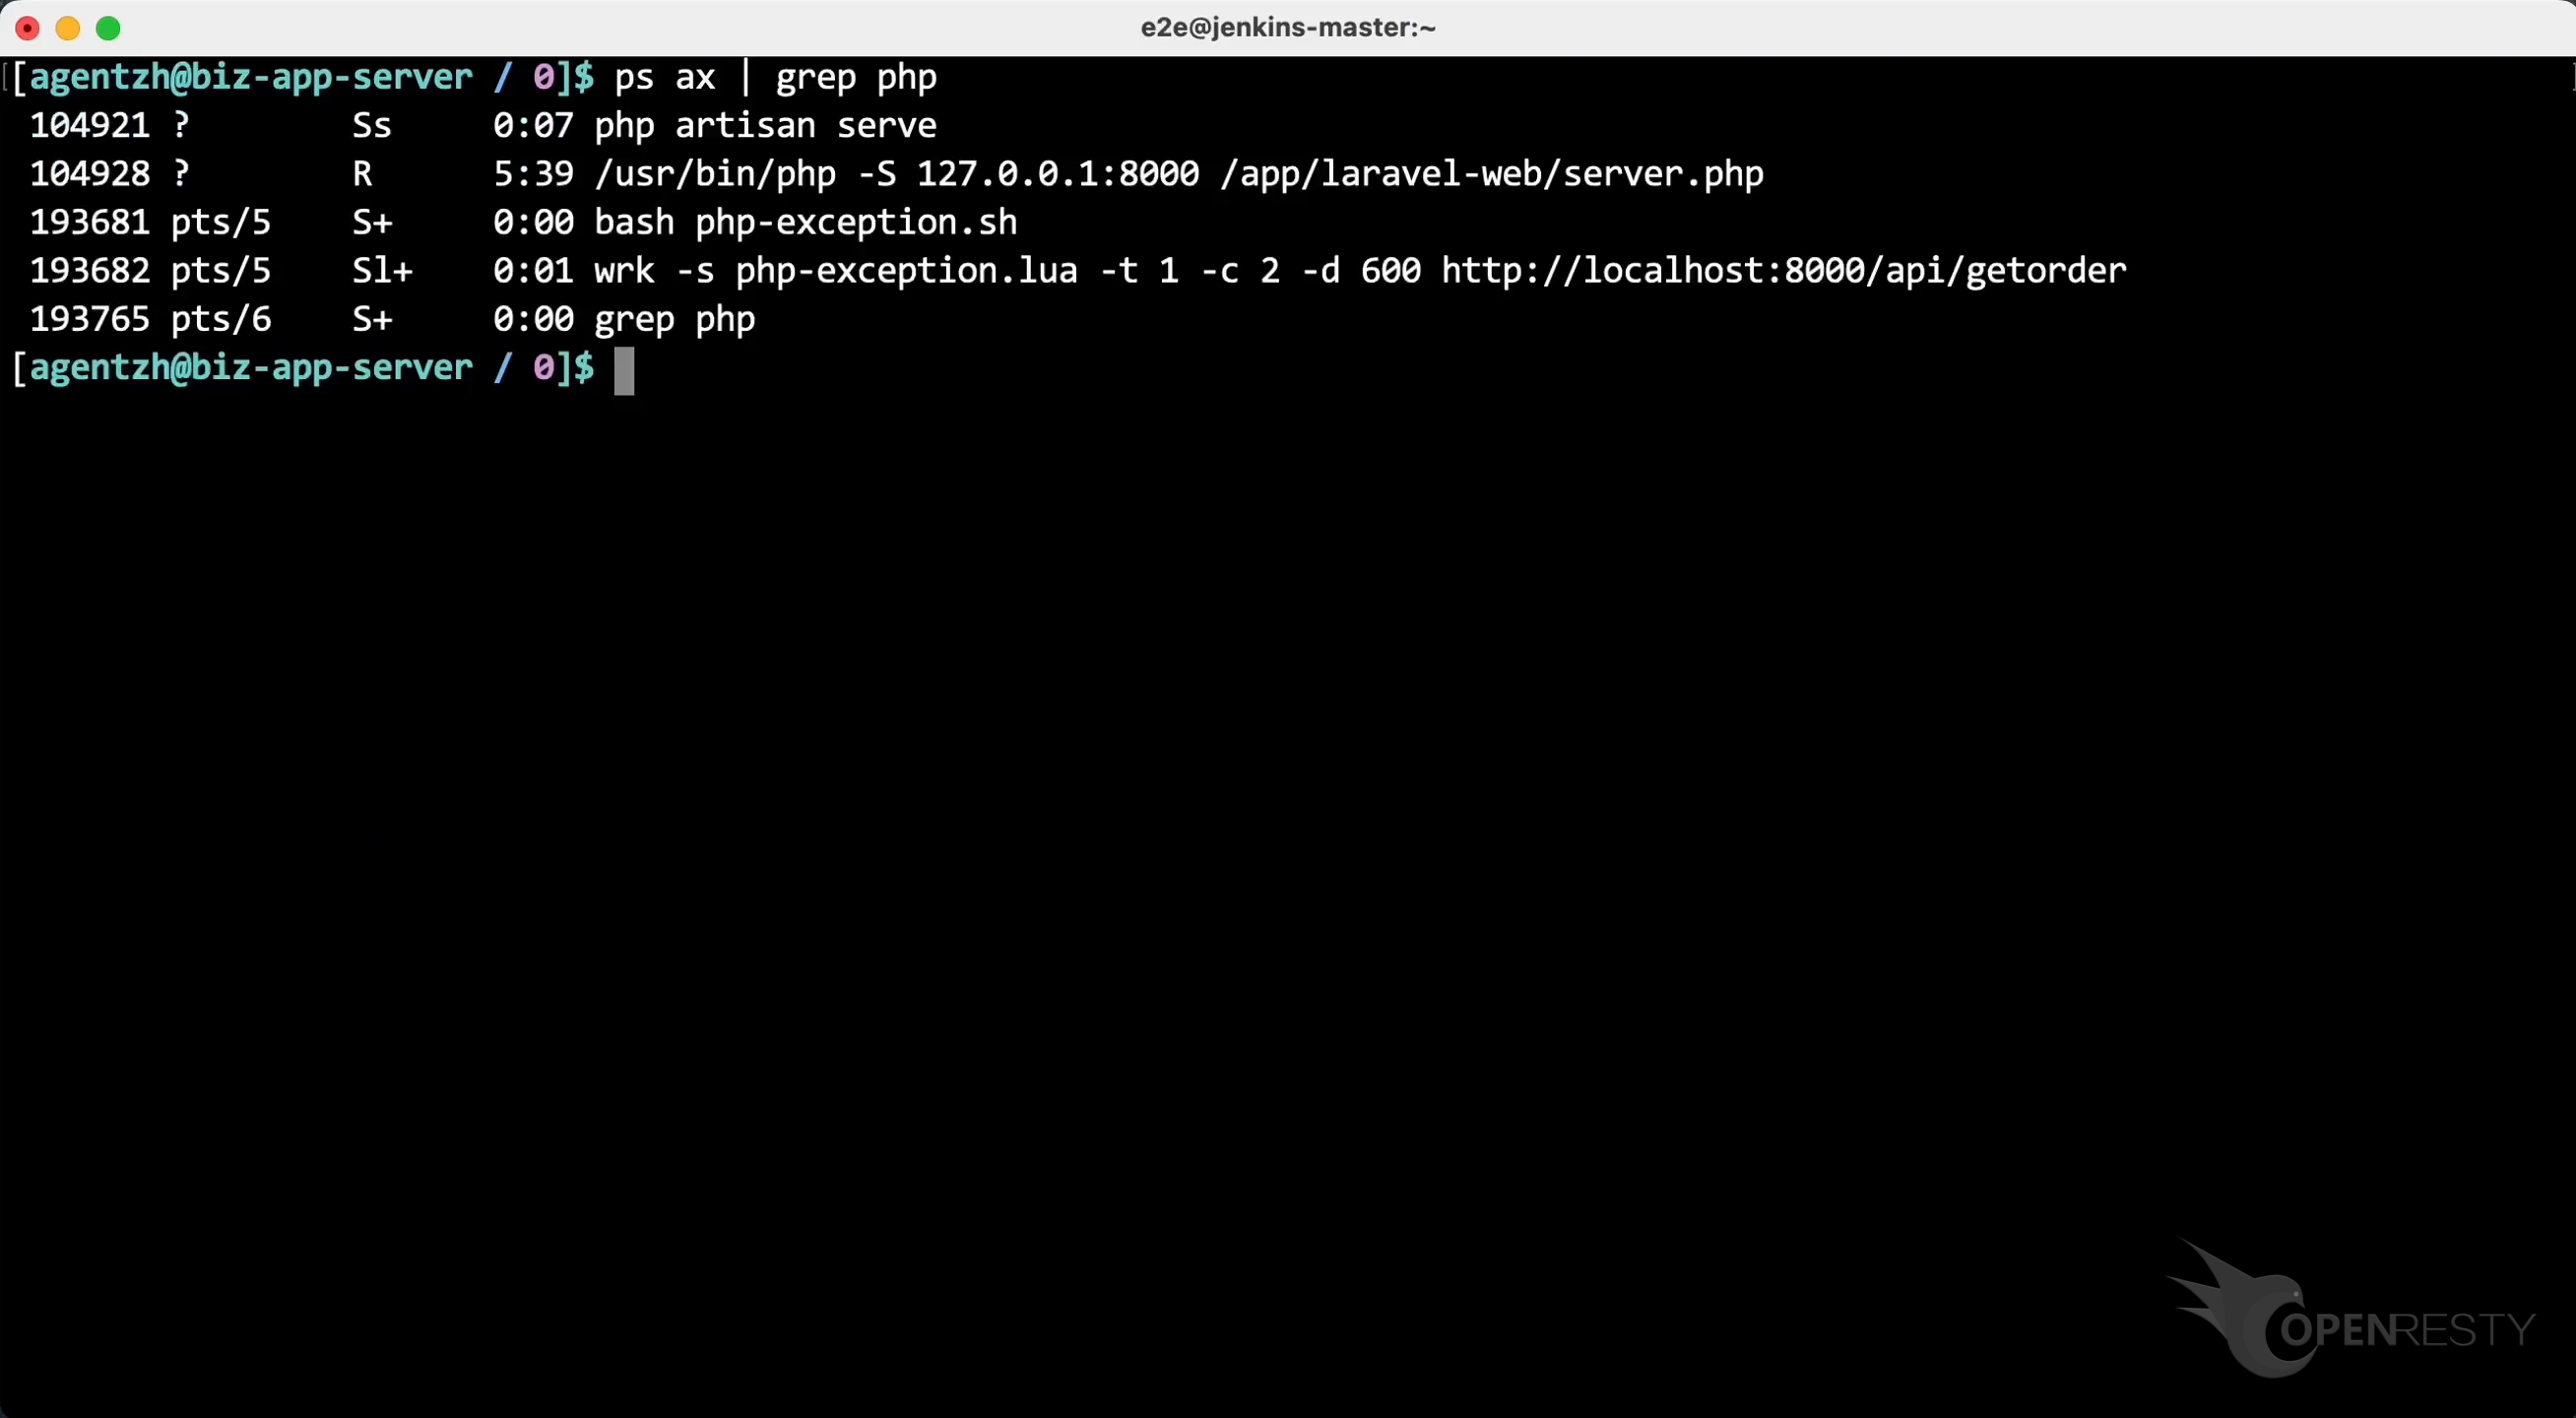
We can see it is the standard PHP binary executable shipped with the Linux distribution.
Let’s use OpenResty XRay to check out this unmodified process. We can analyze it in real time and figure out what’s going on.
Switich to the OpenResty XRay Web console.
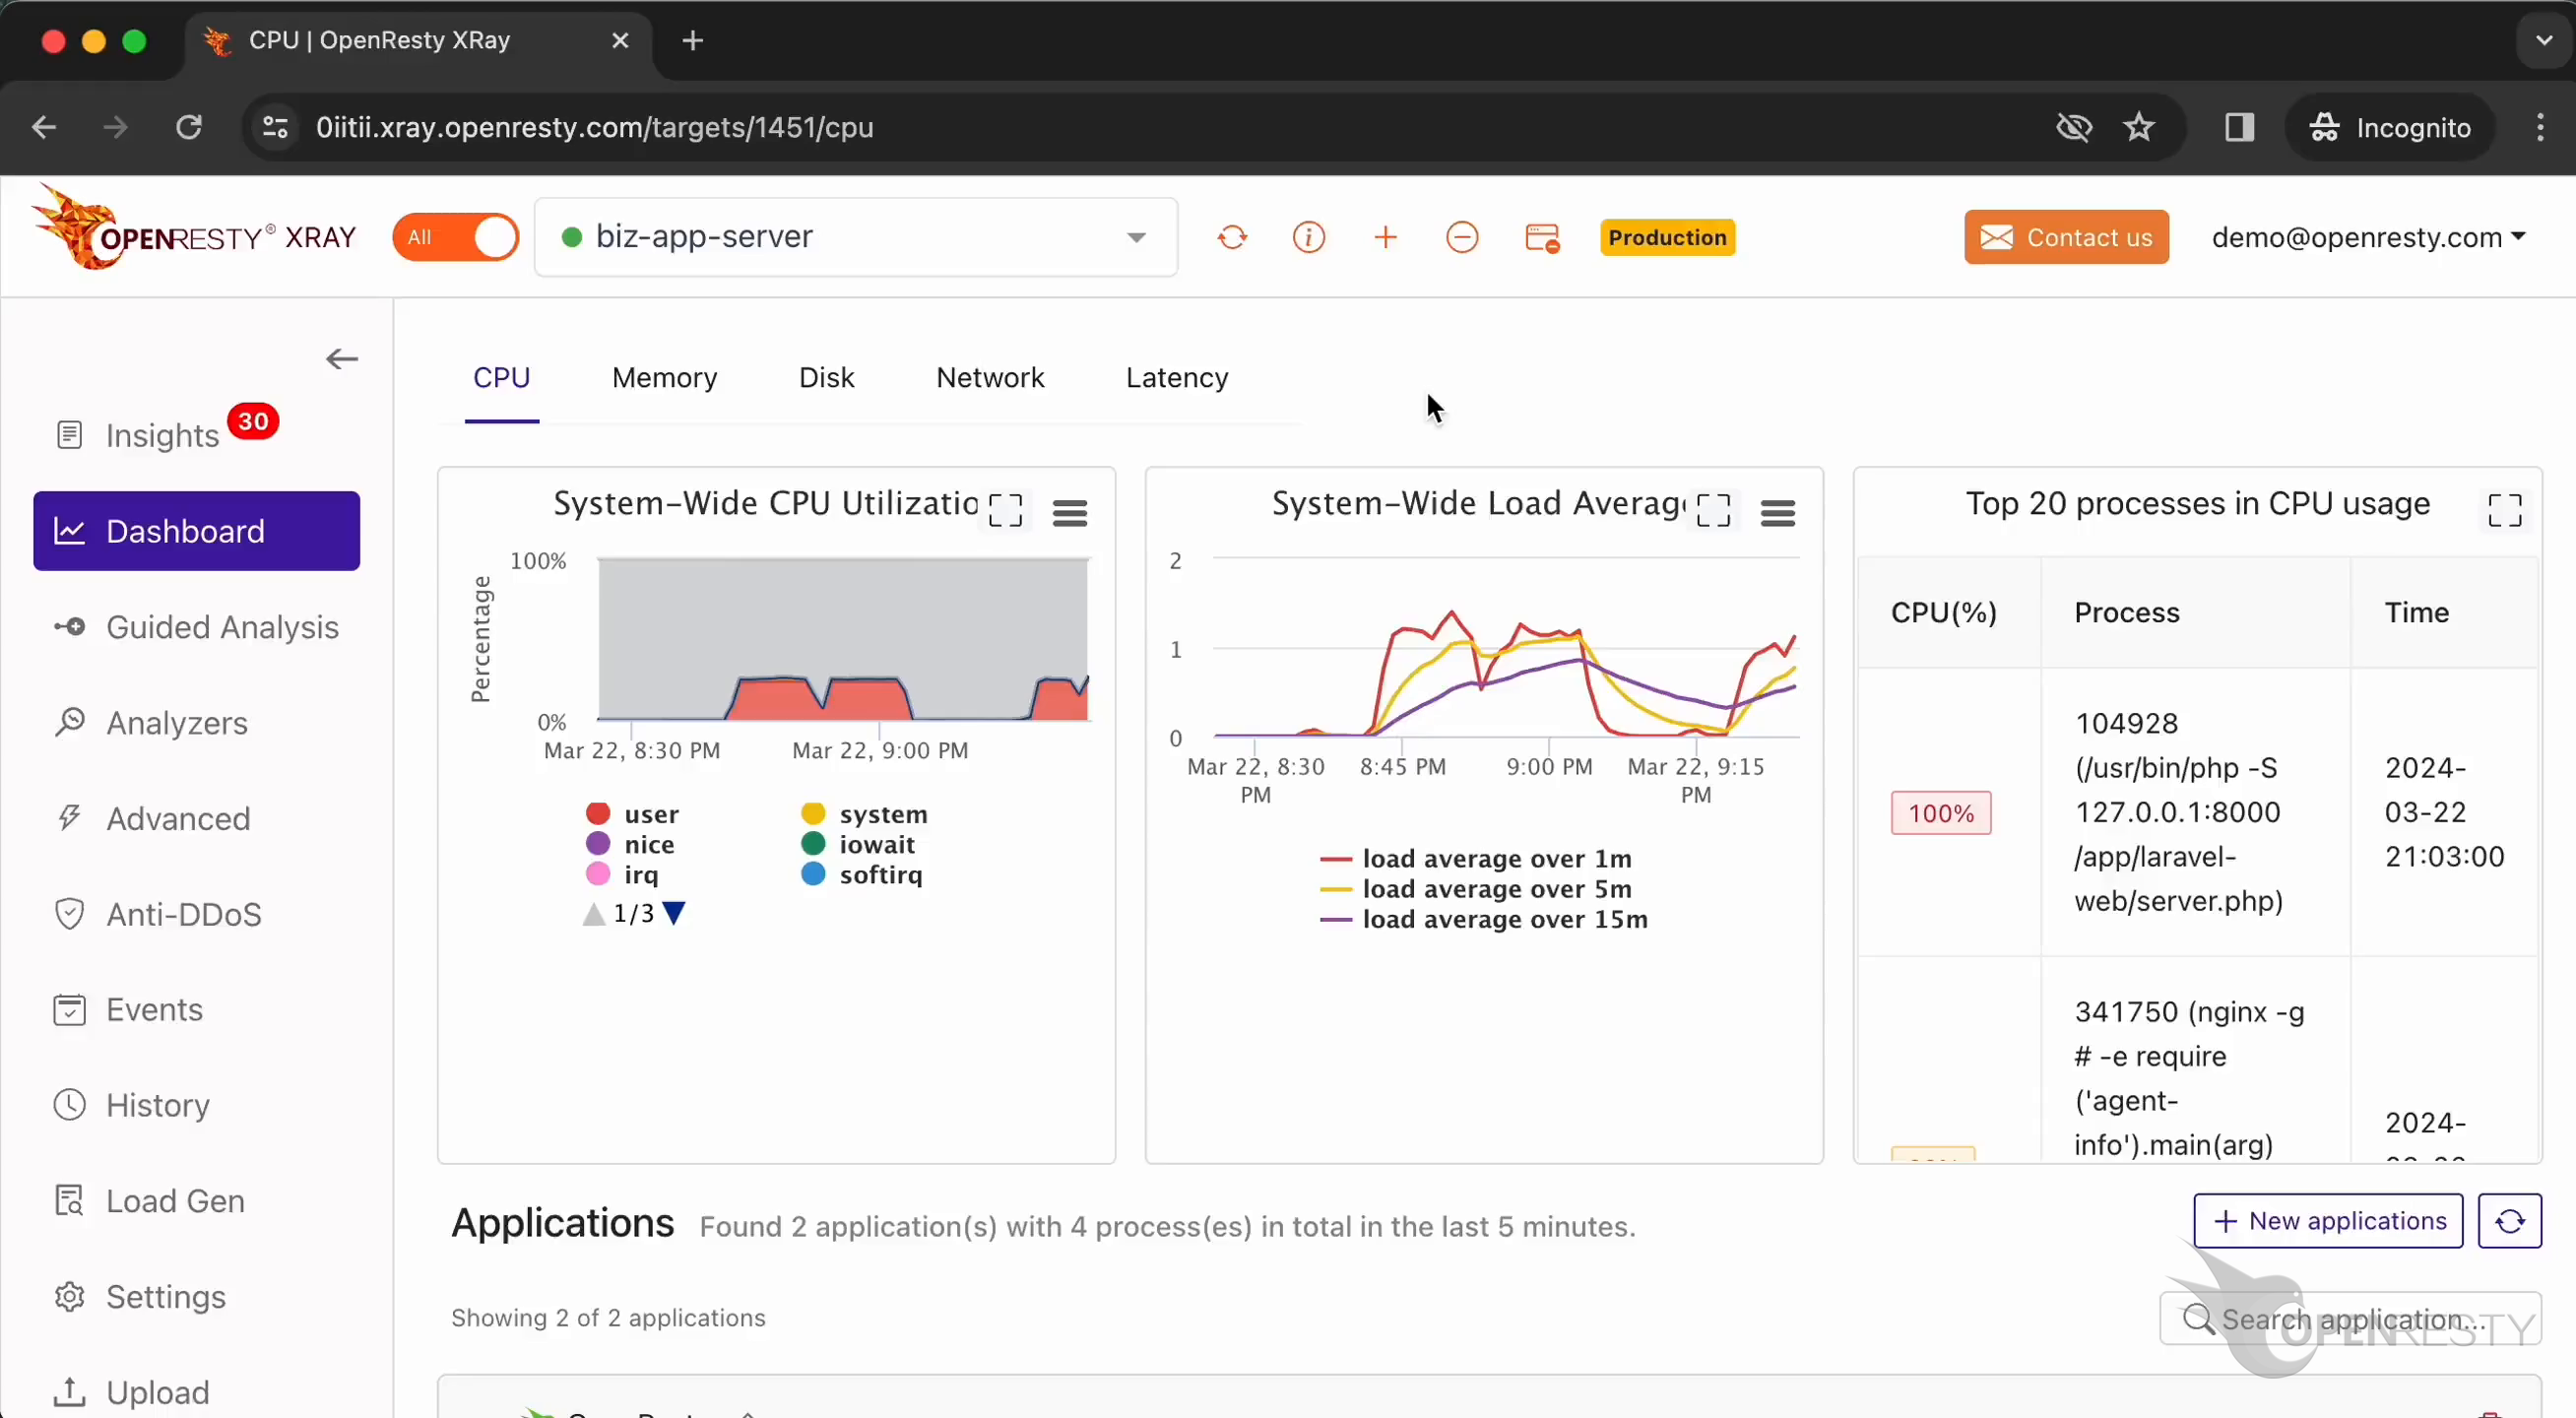
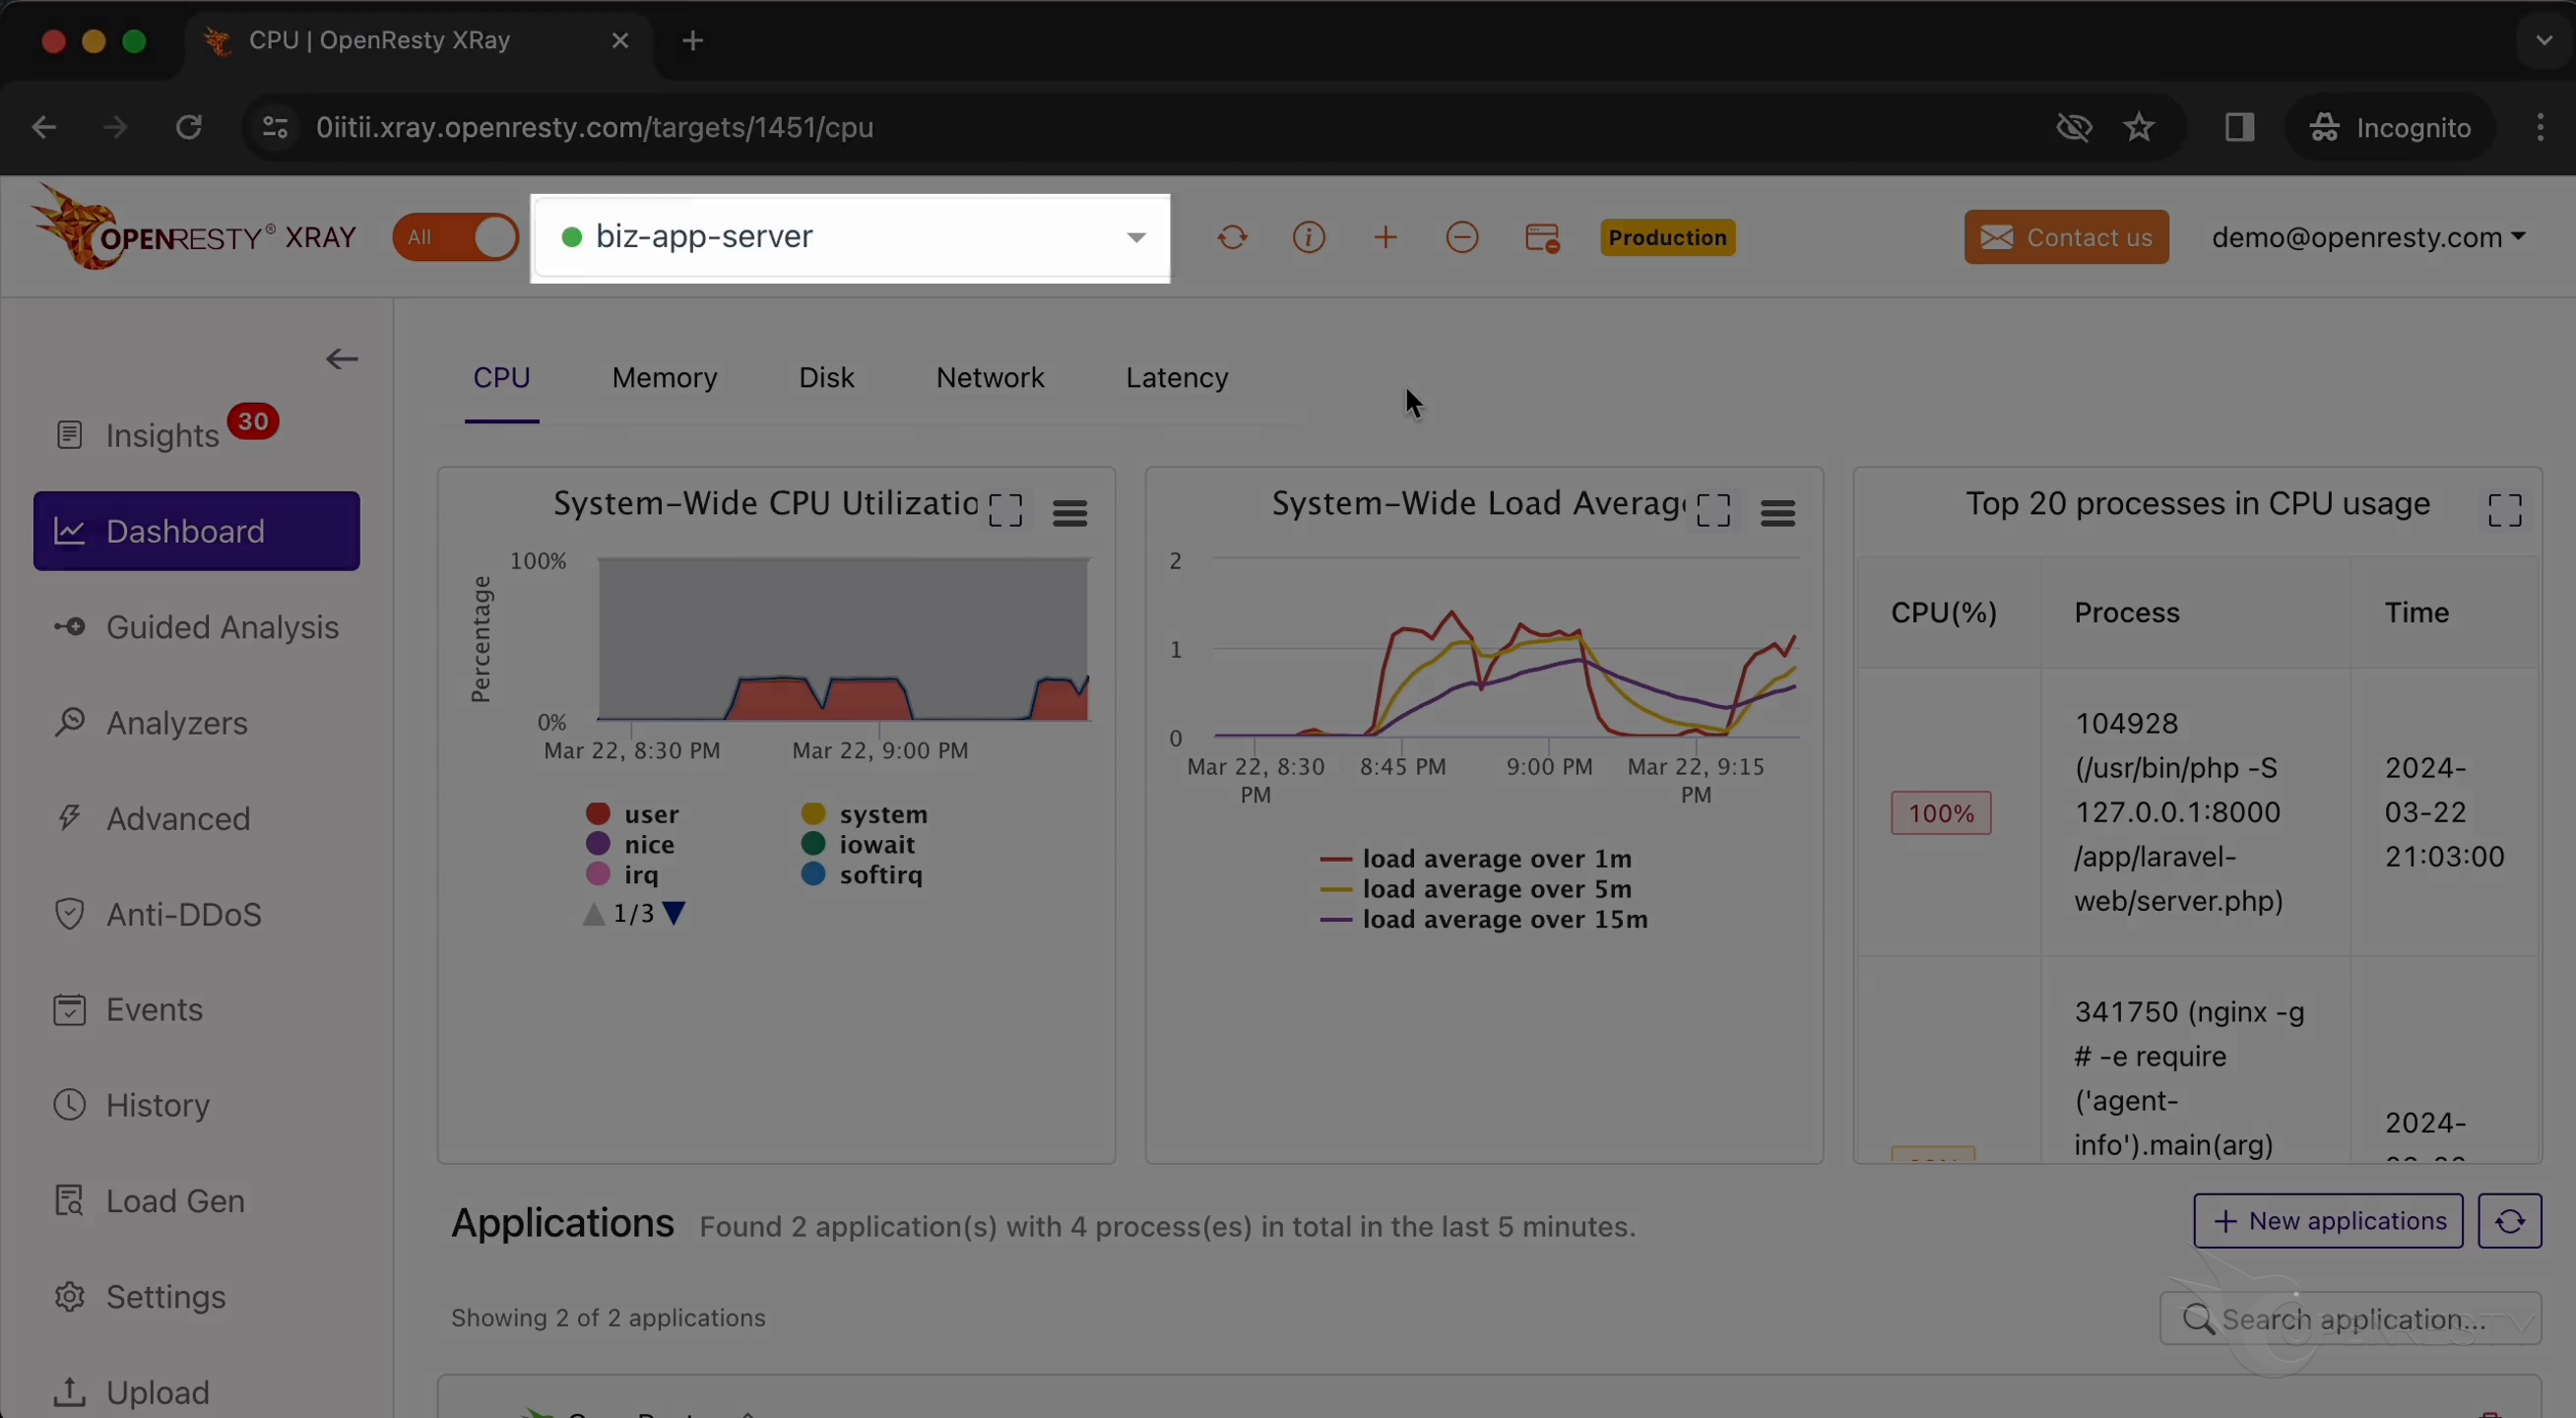
Make sure it is the right machine you are watching.
Run Guided Analysis to scan for PHP exceptions
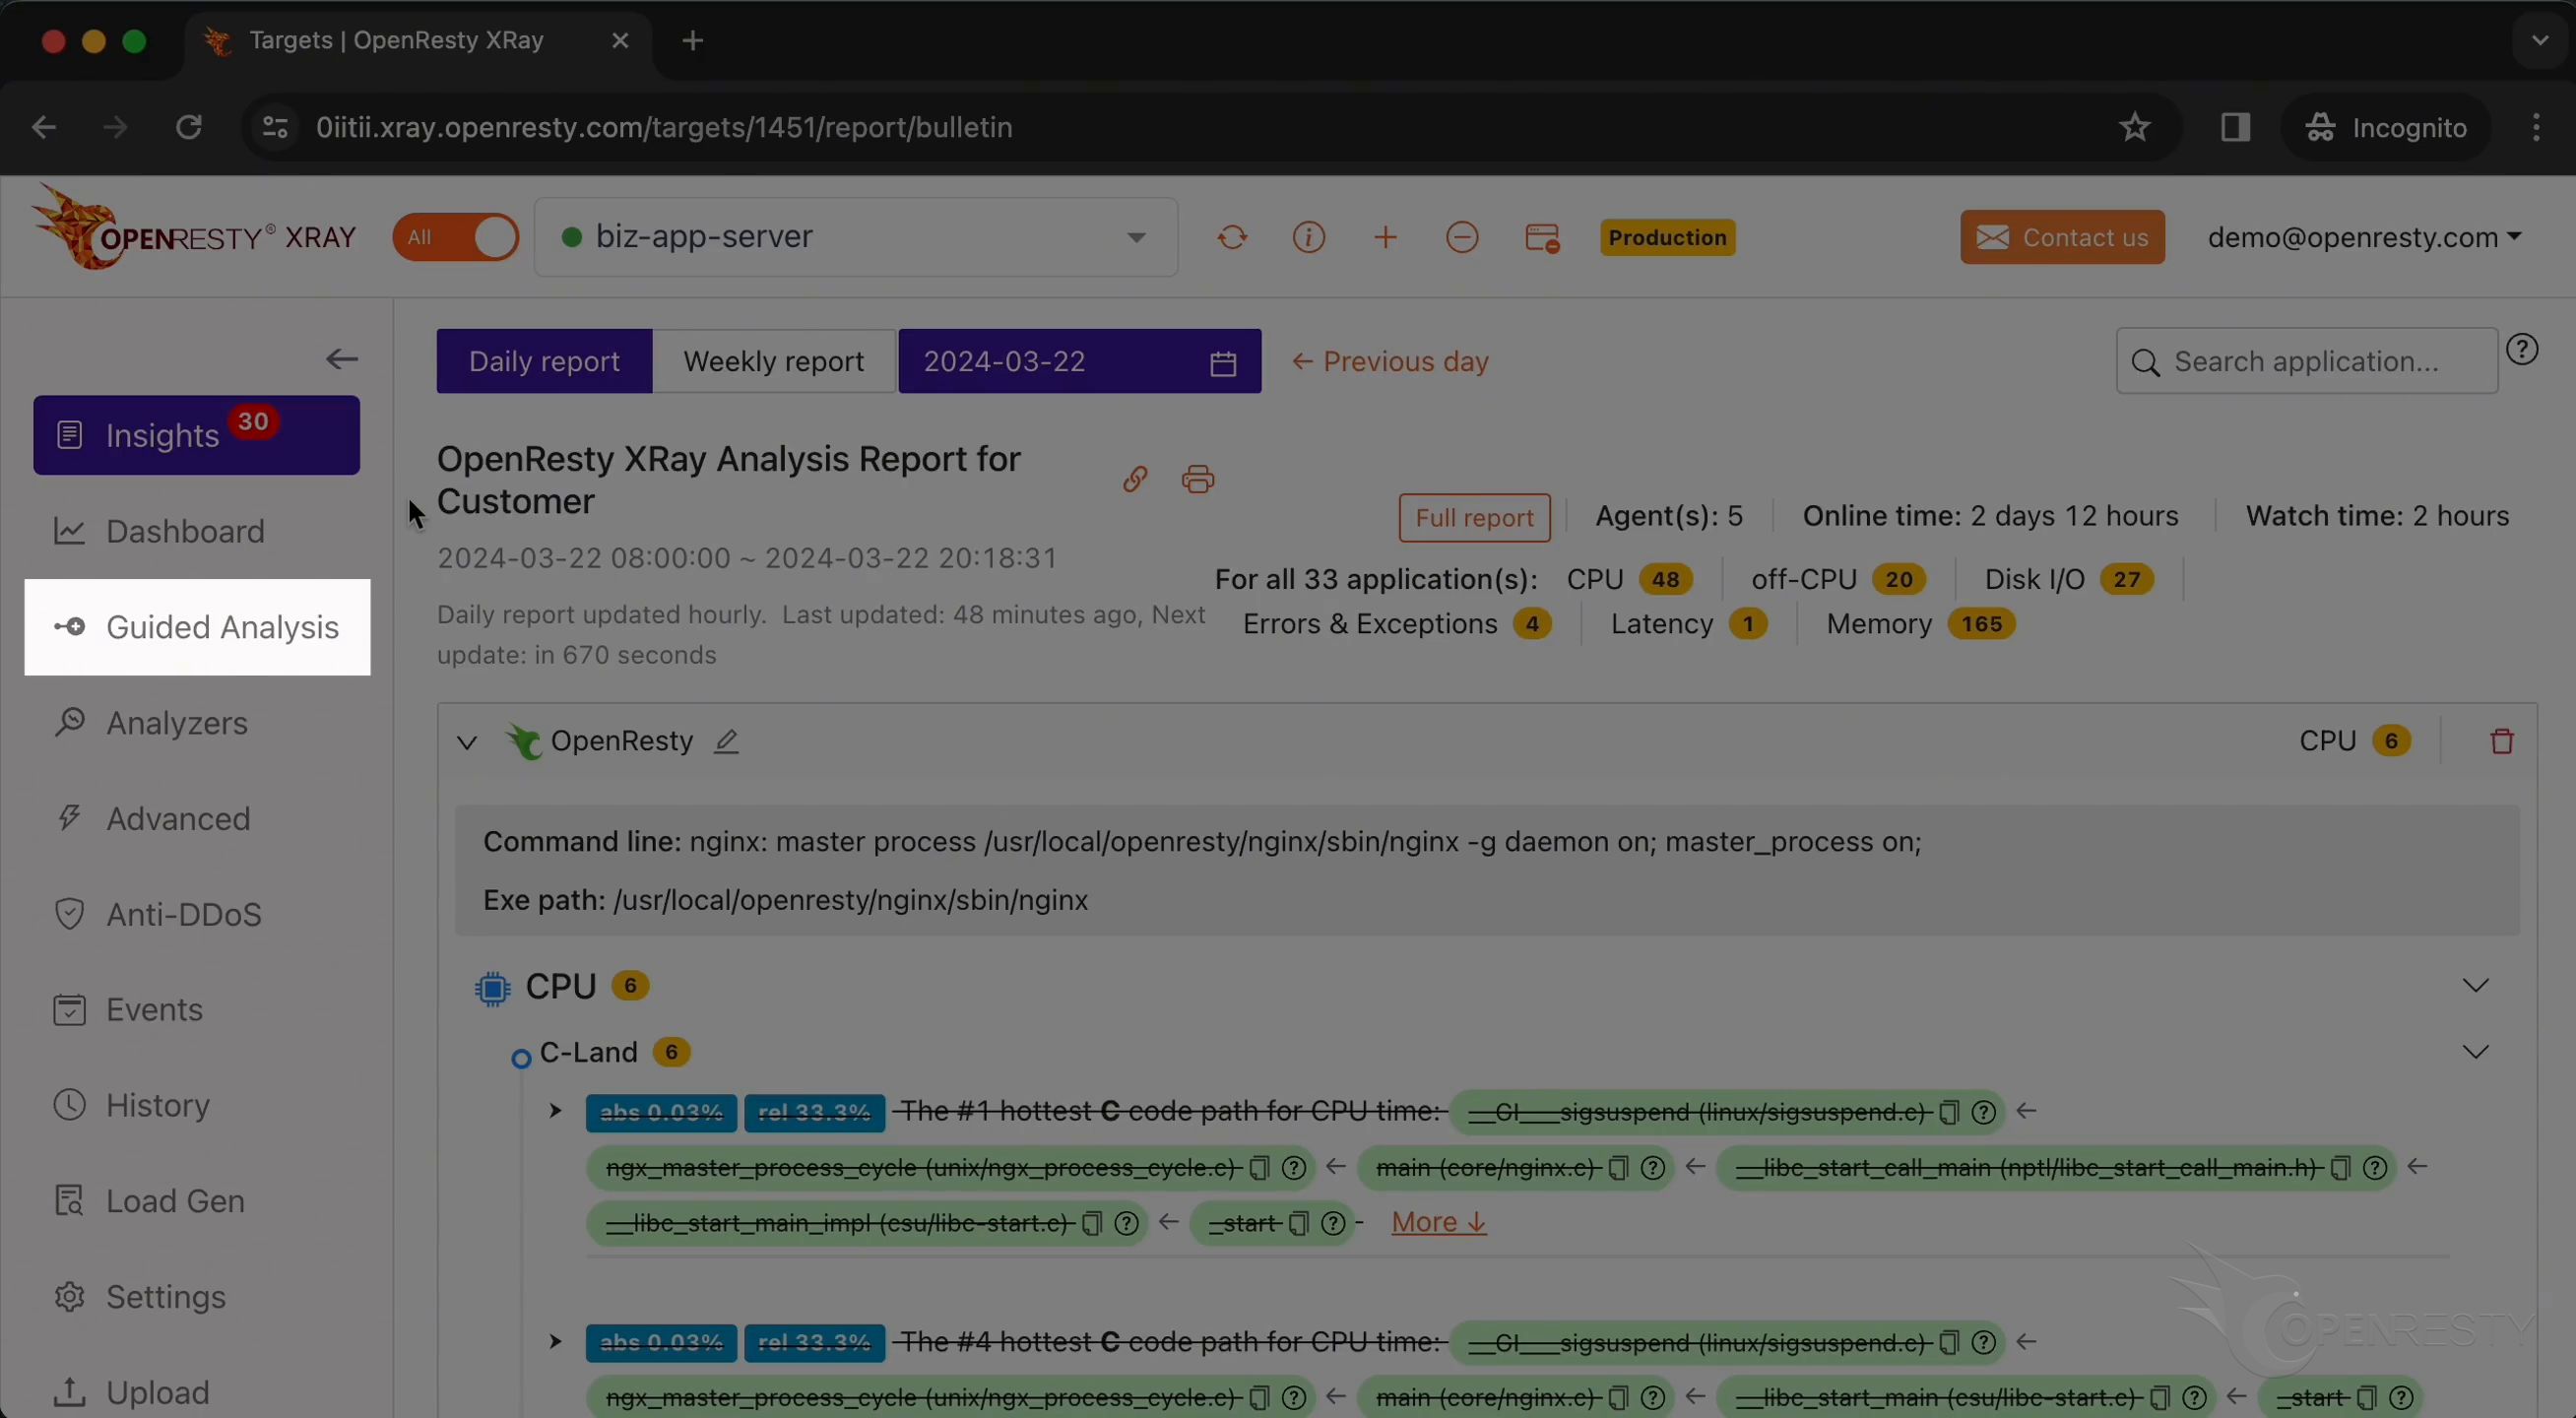
Go to the “Guided Analysis” page.
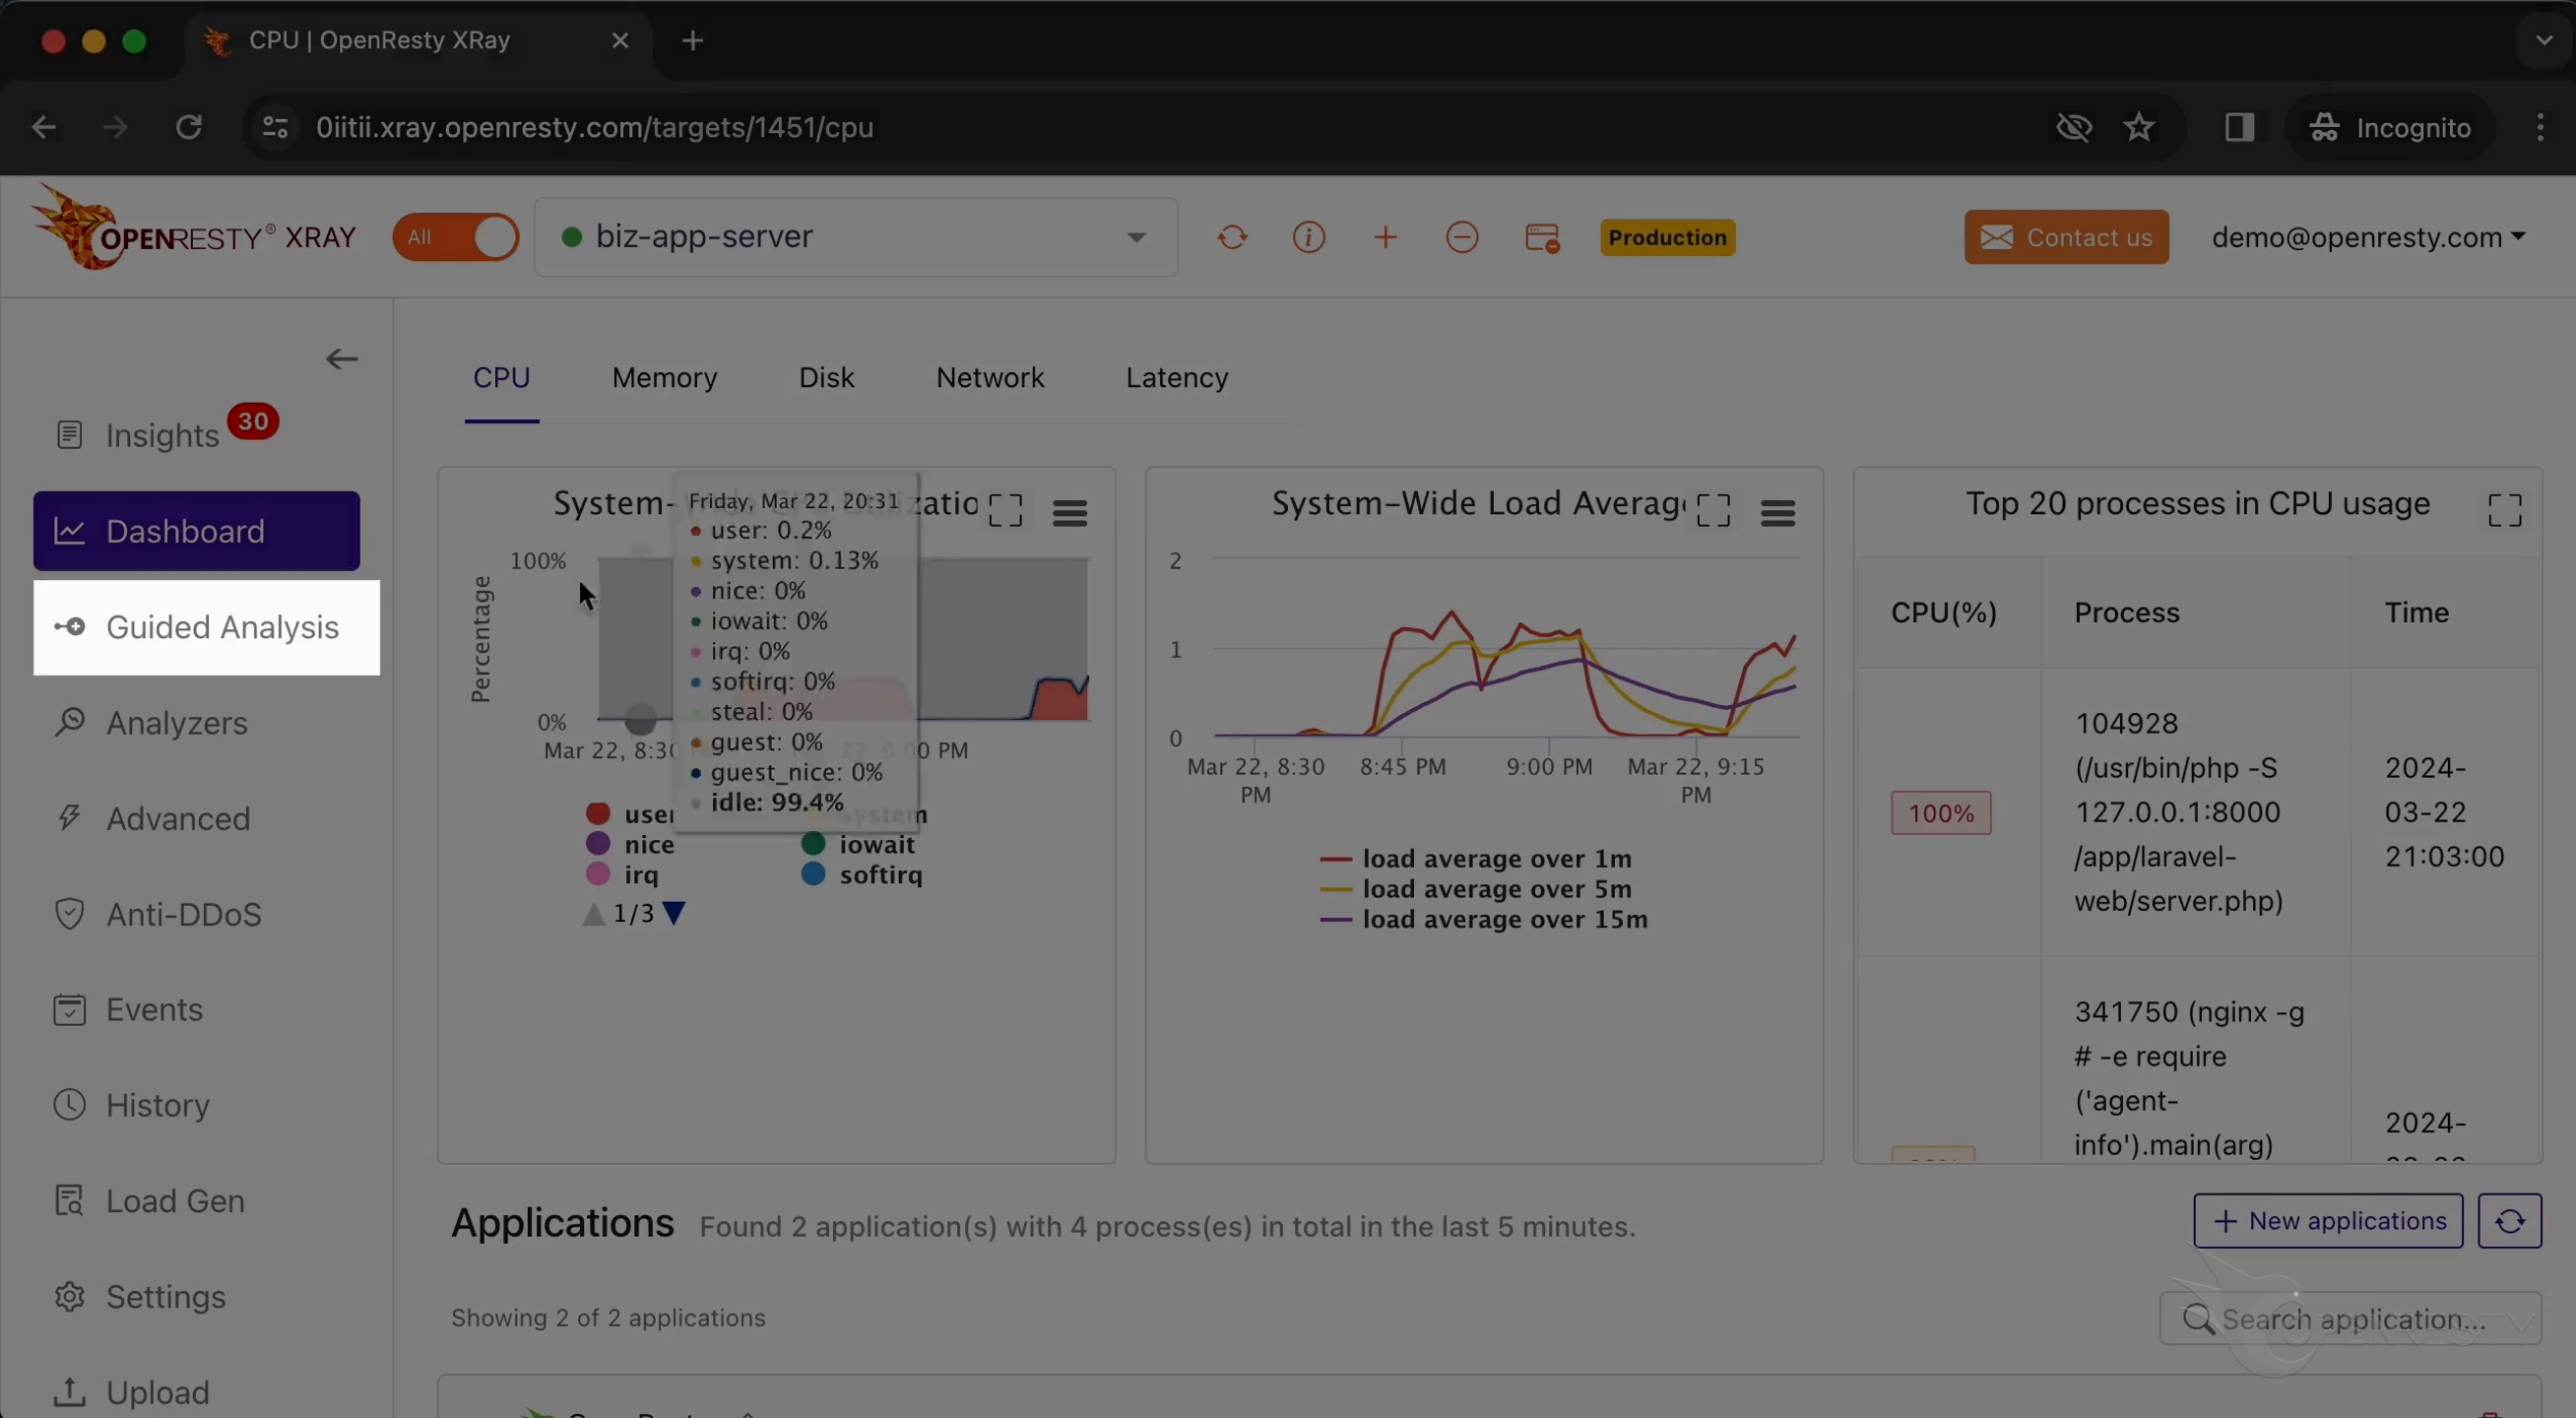
Here you can see different types of problems that you can diagnose.
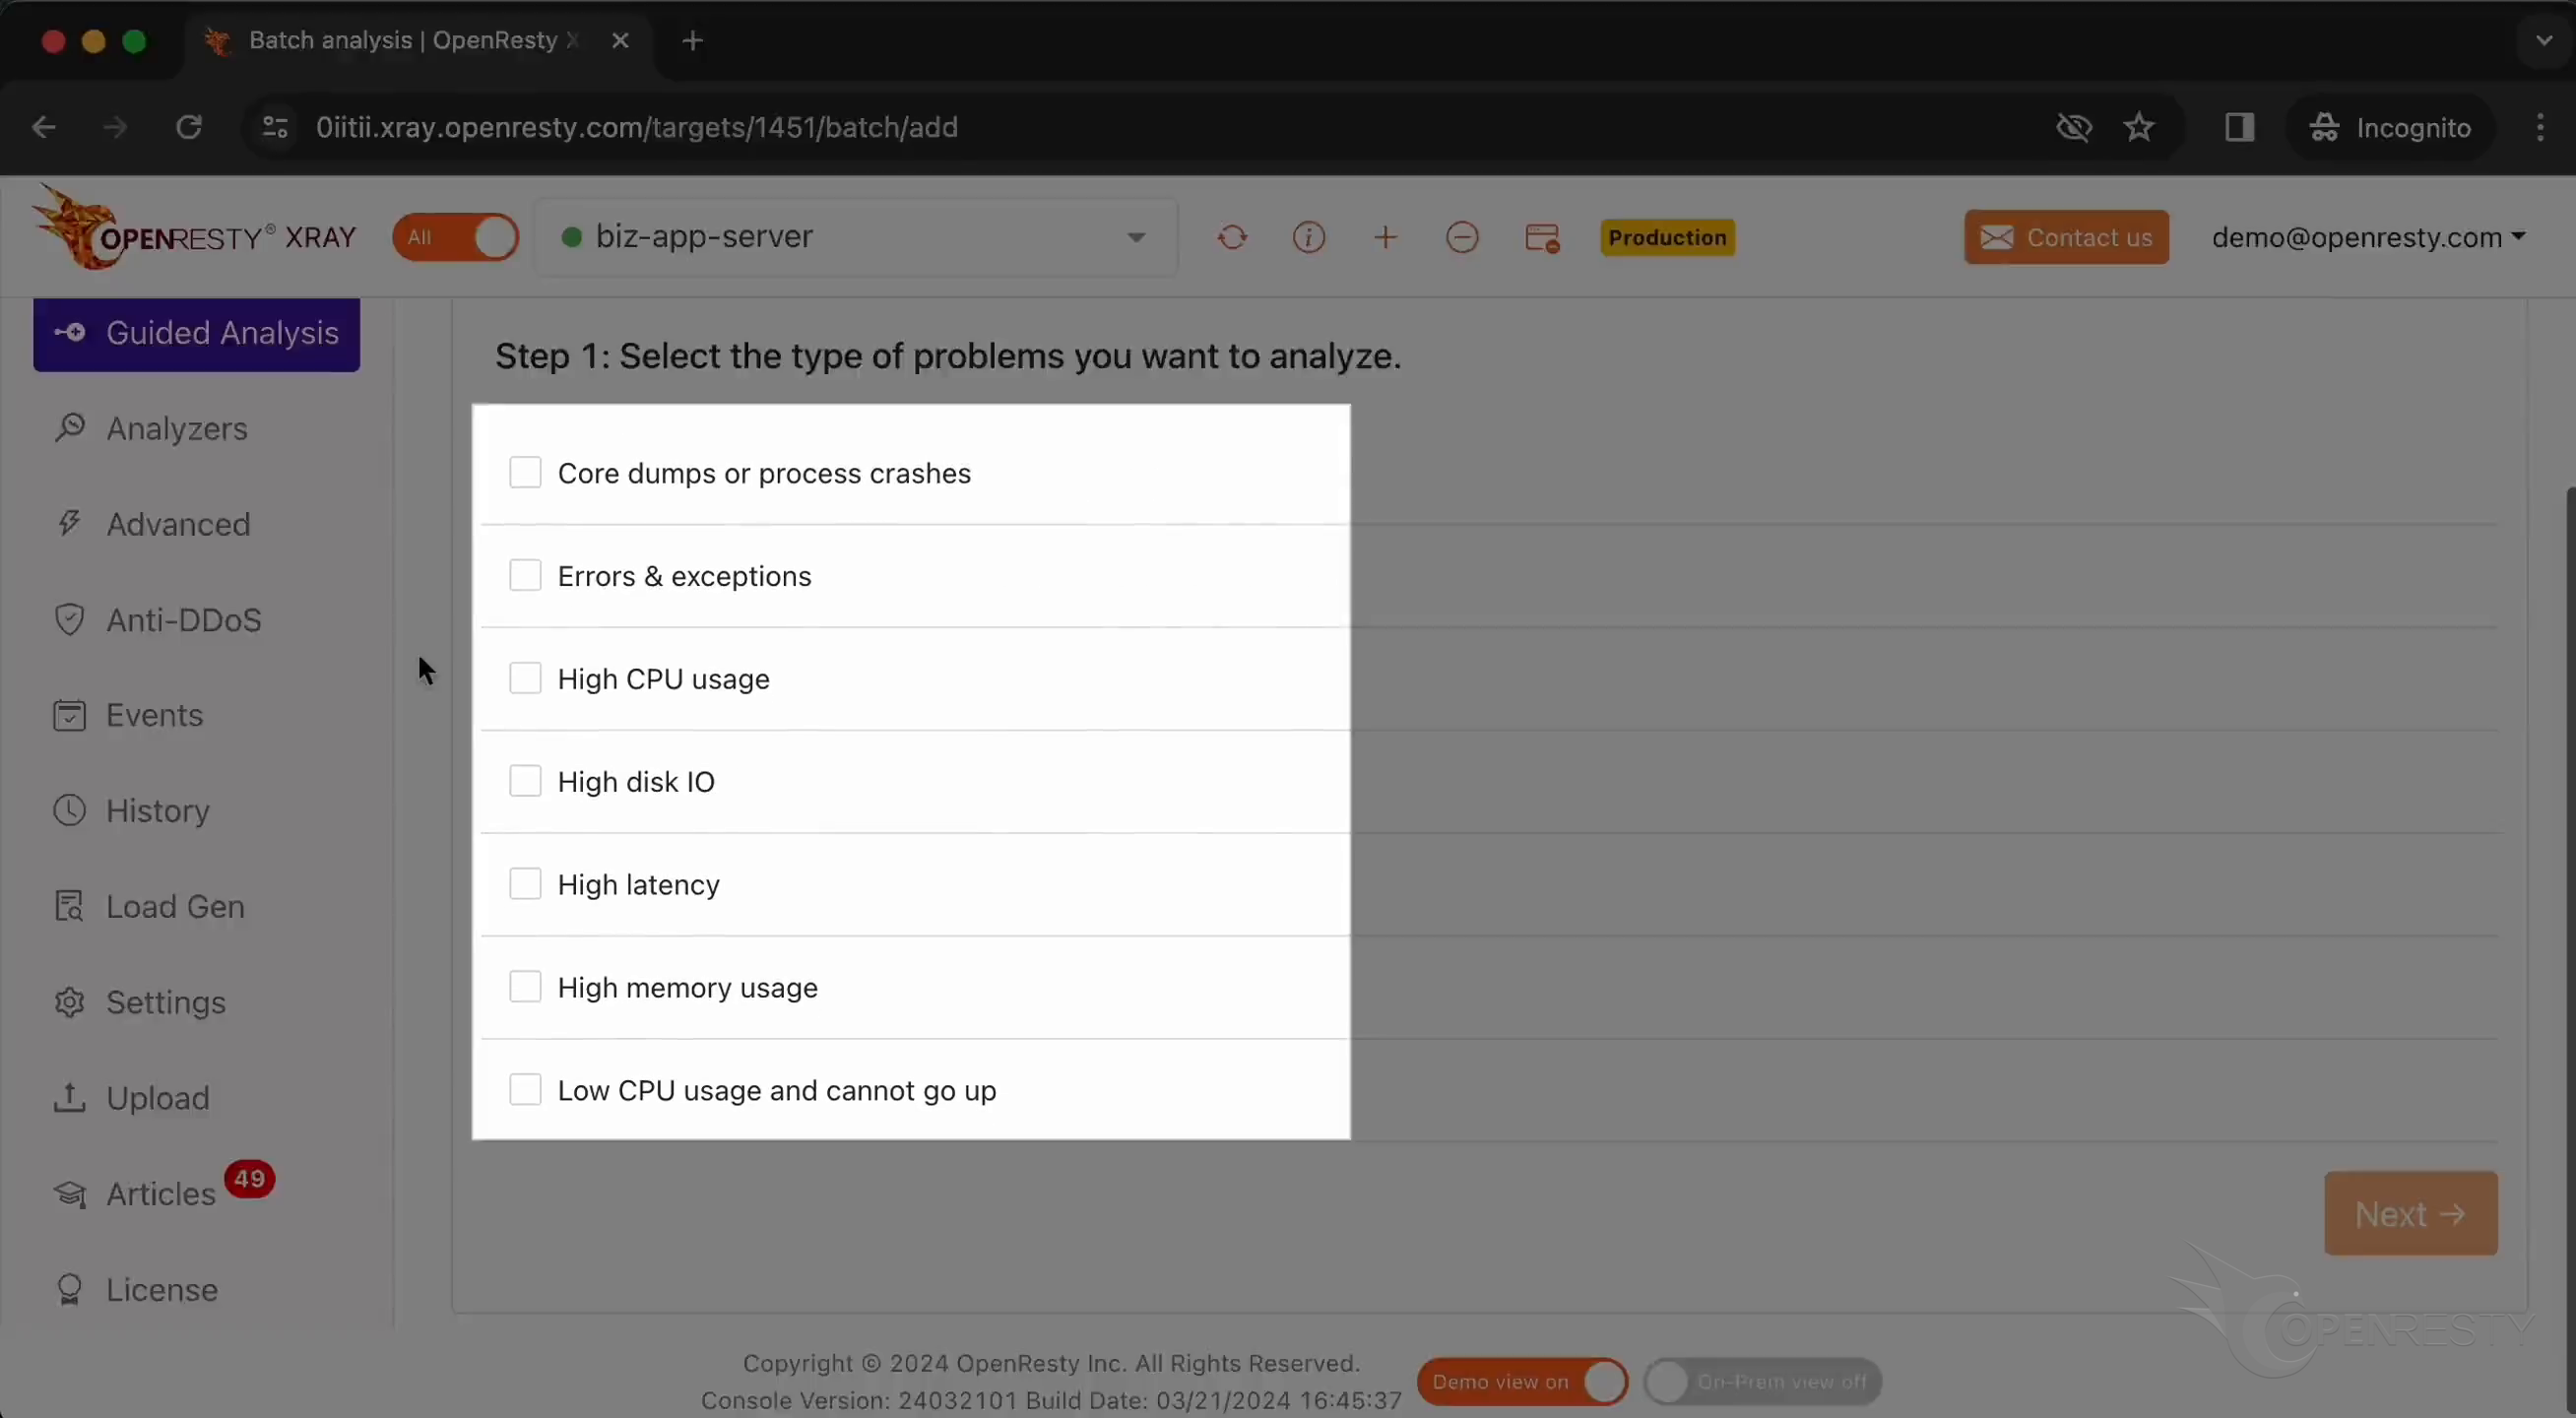
Let’s select “Errors & exceptions”.
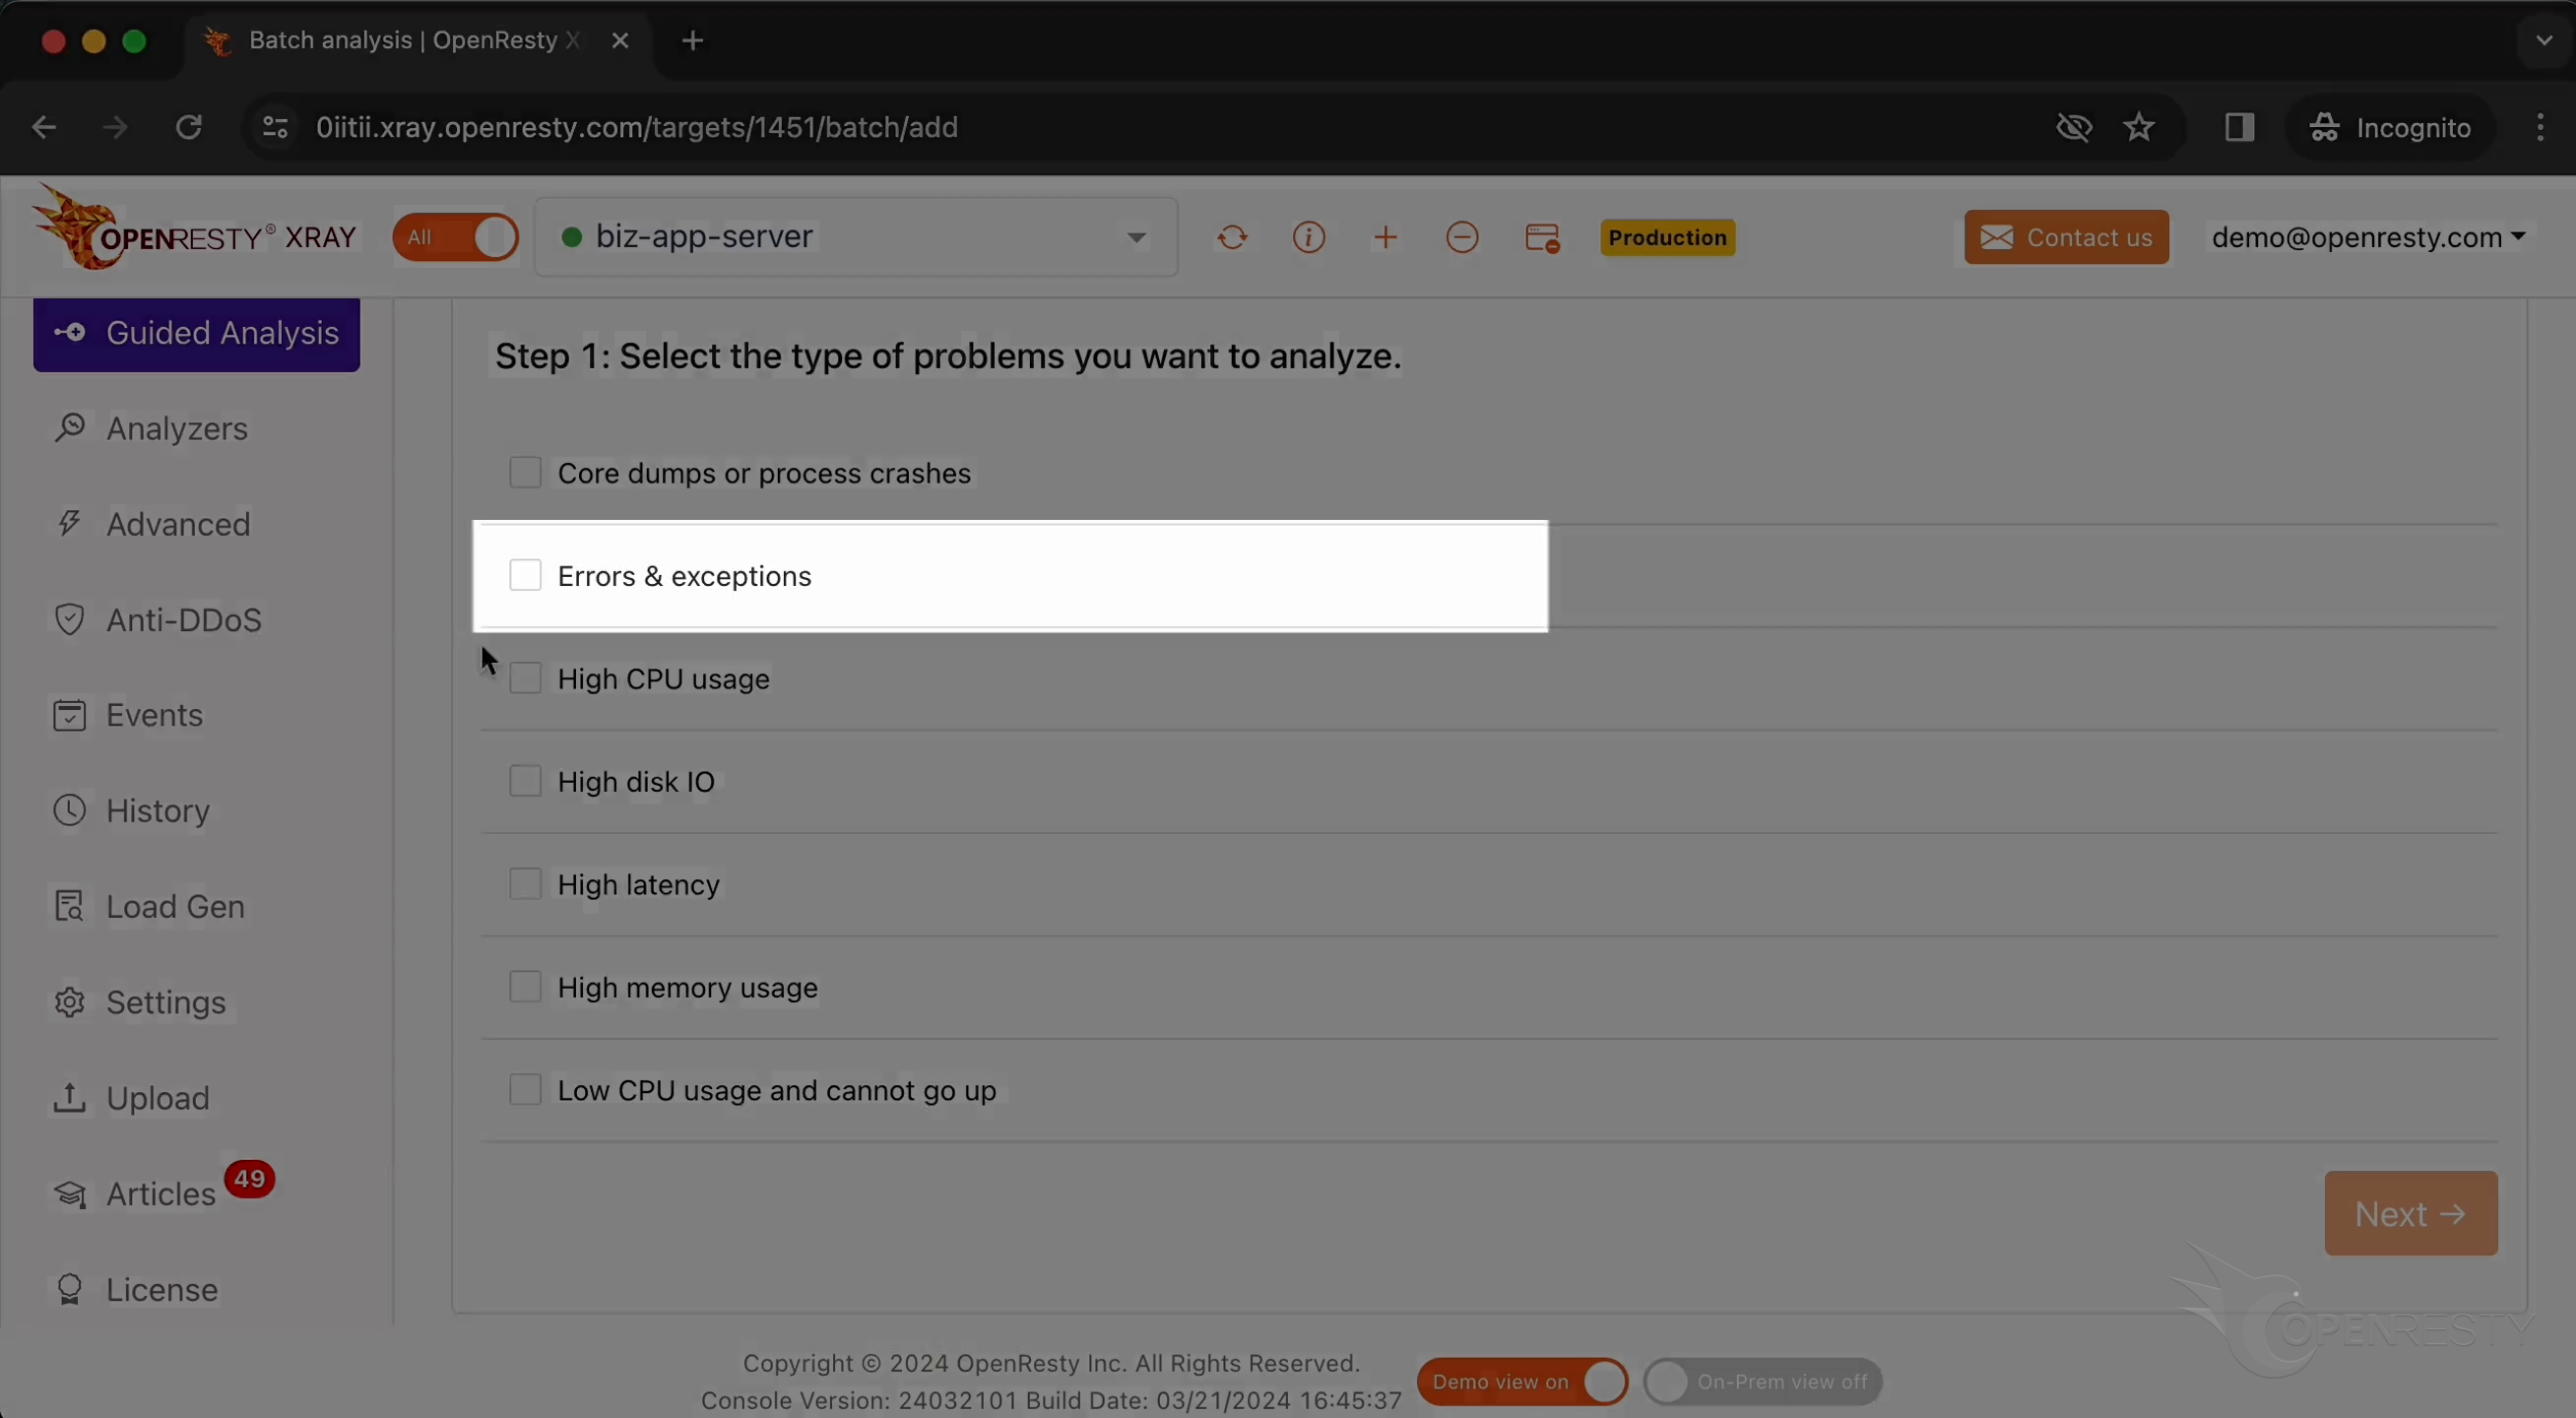
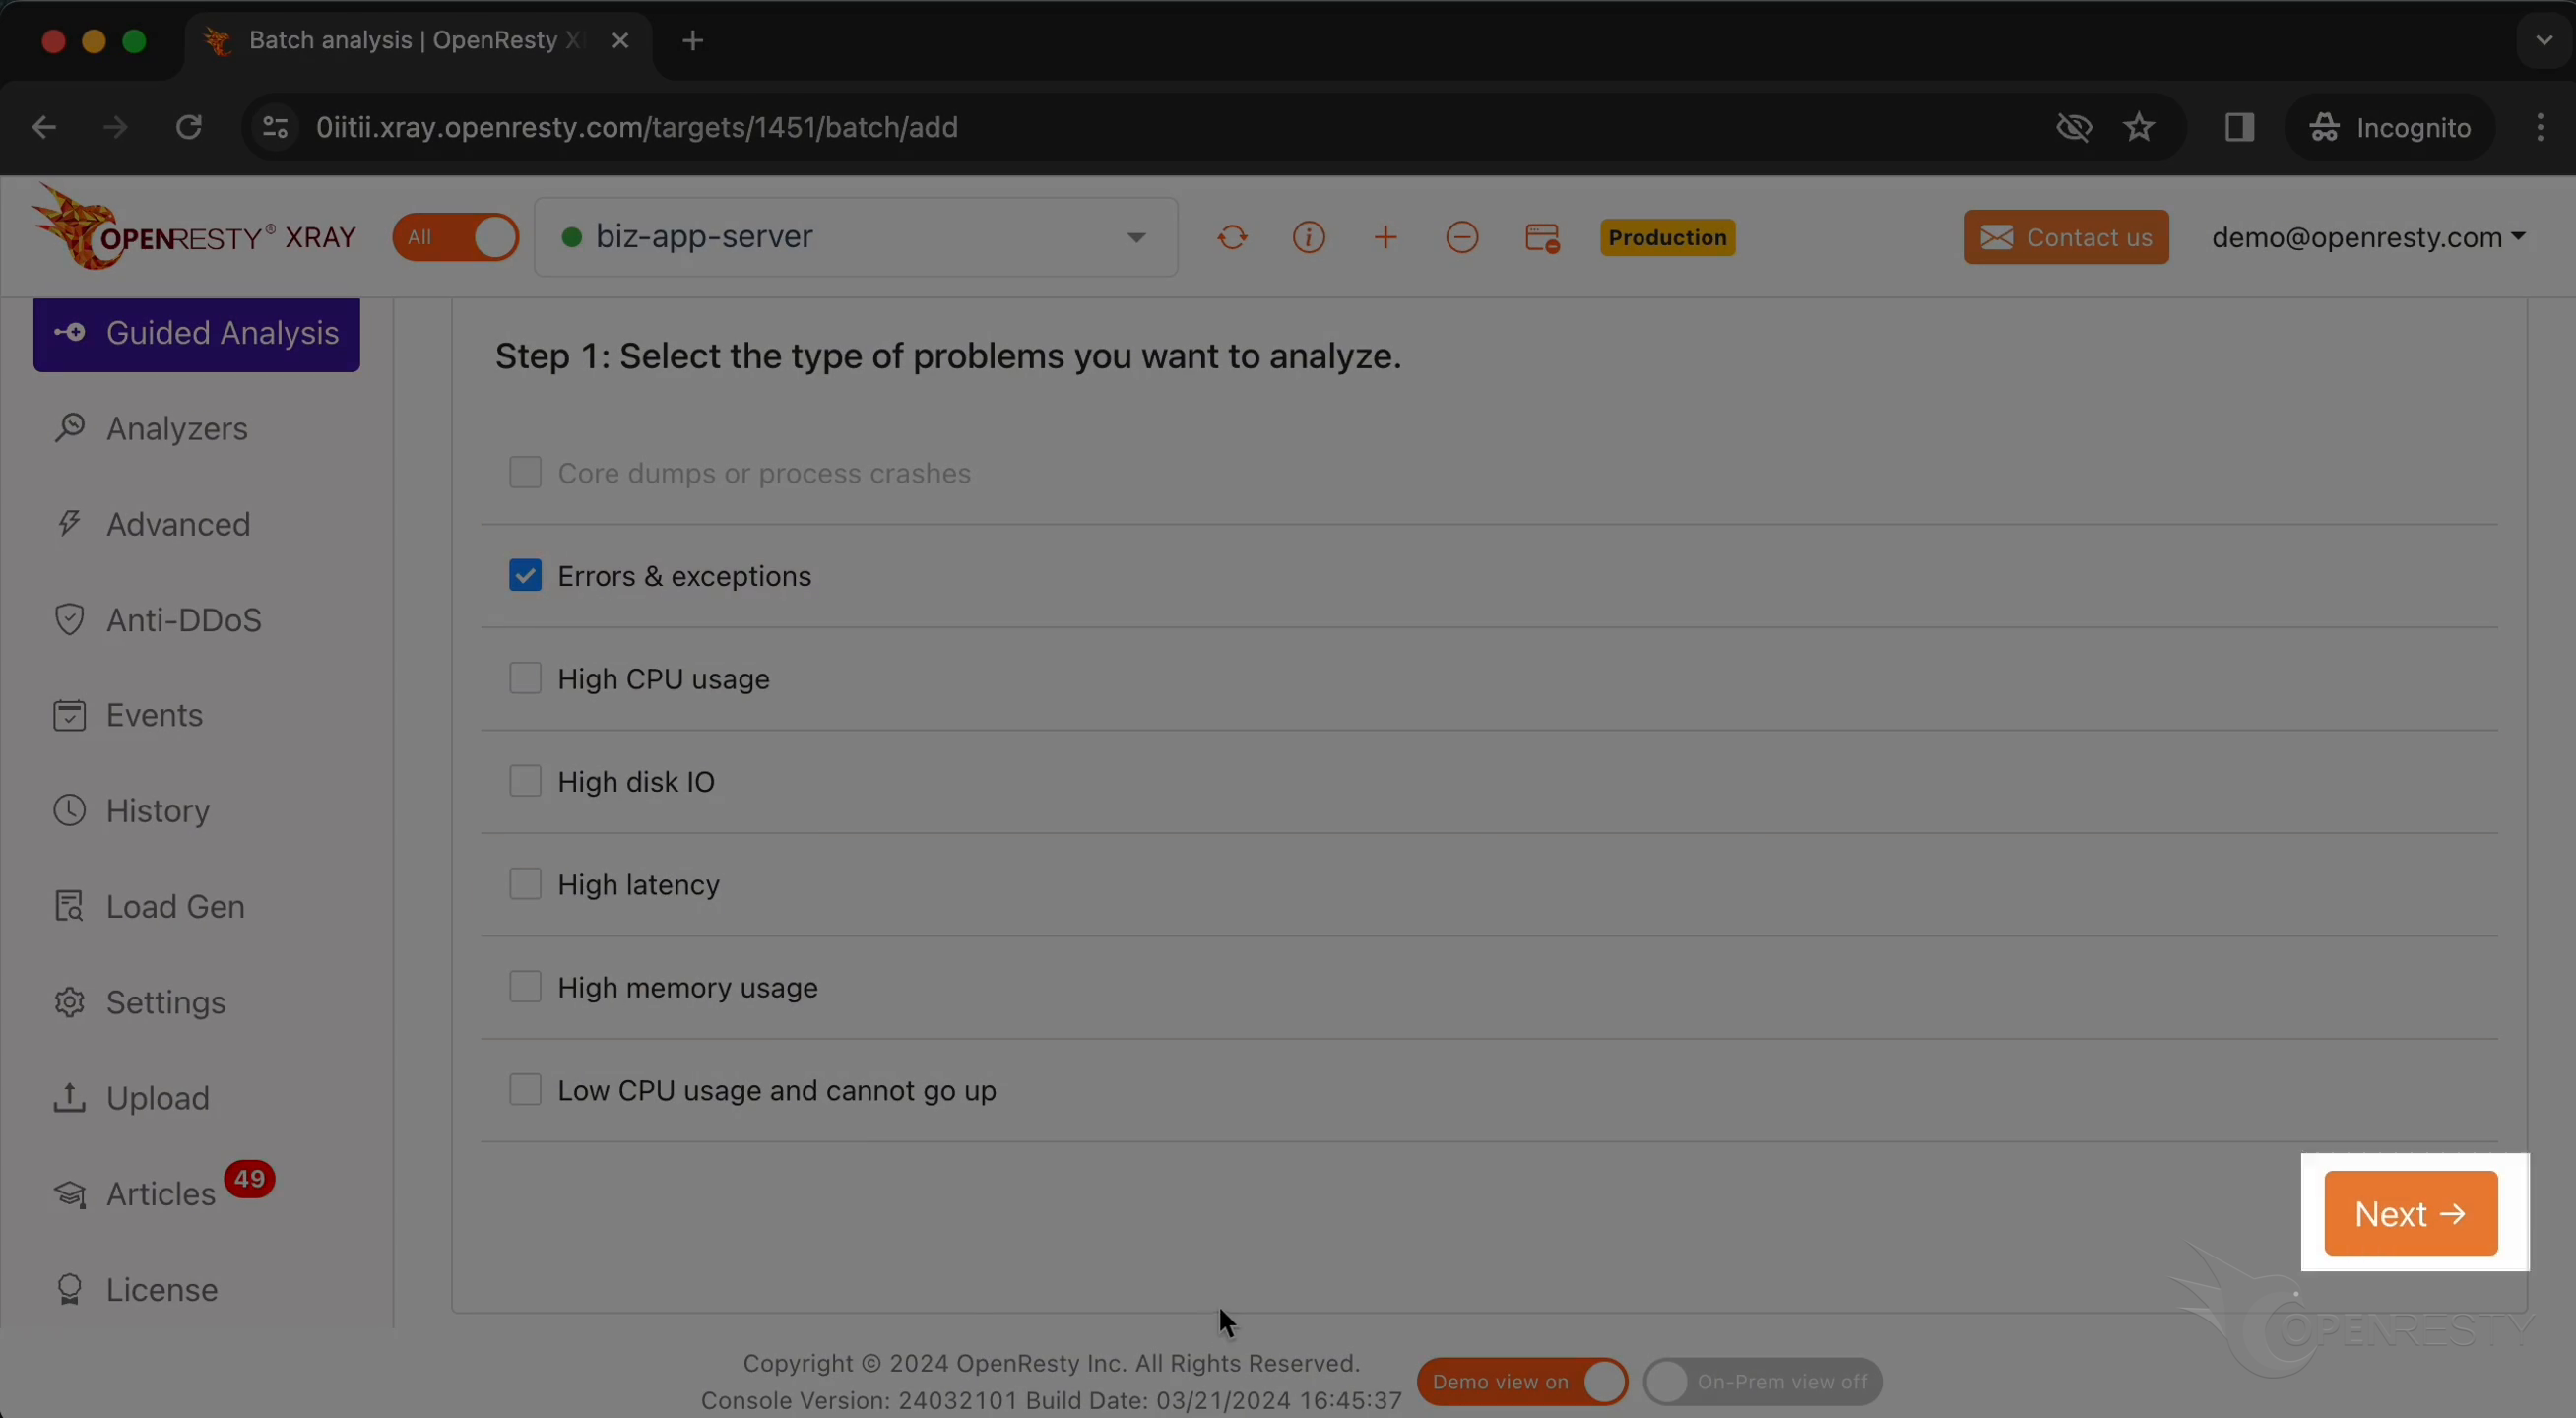
Click on “Next”.
Select the PHP application.
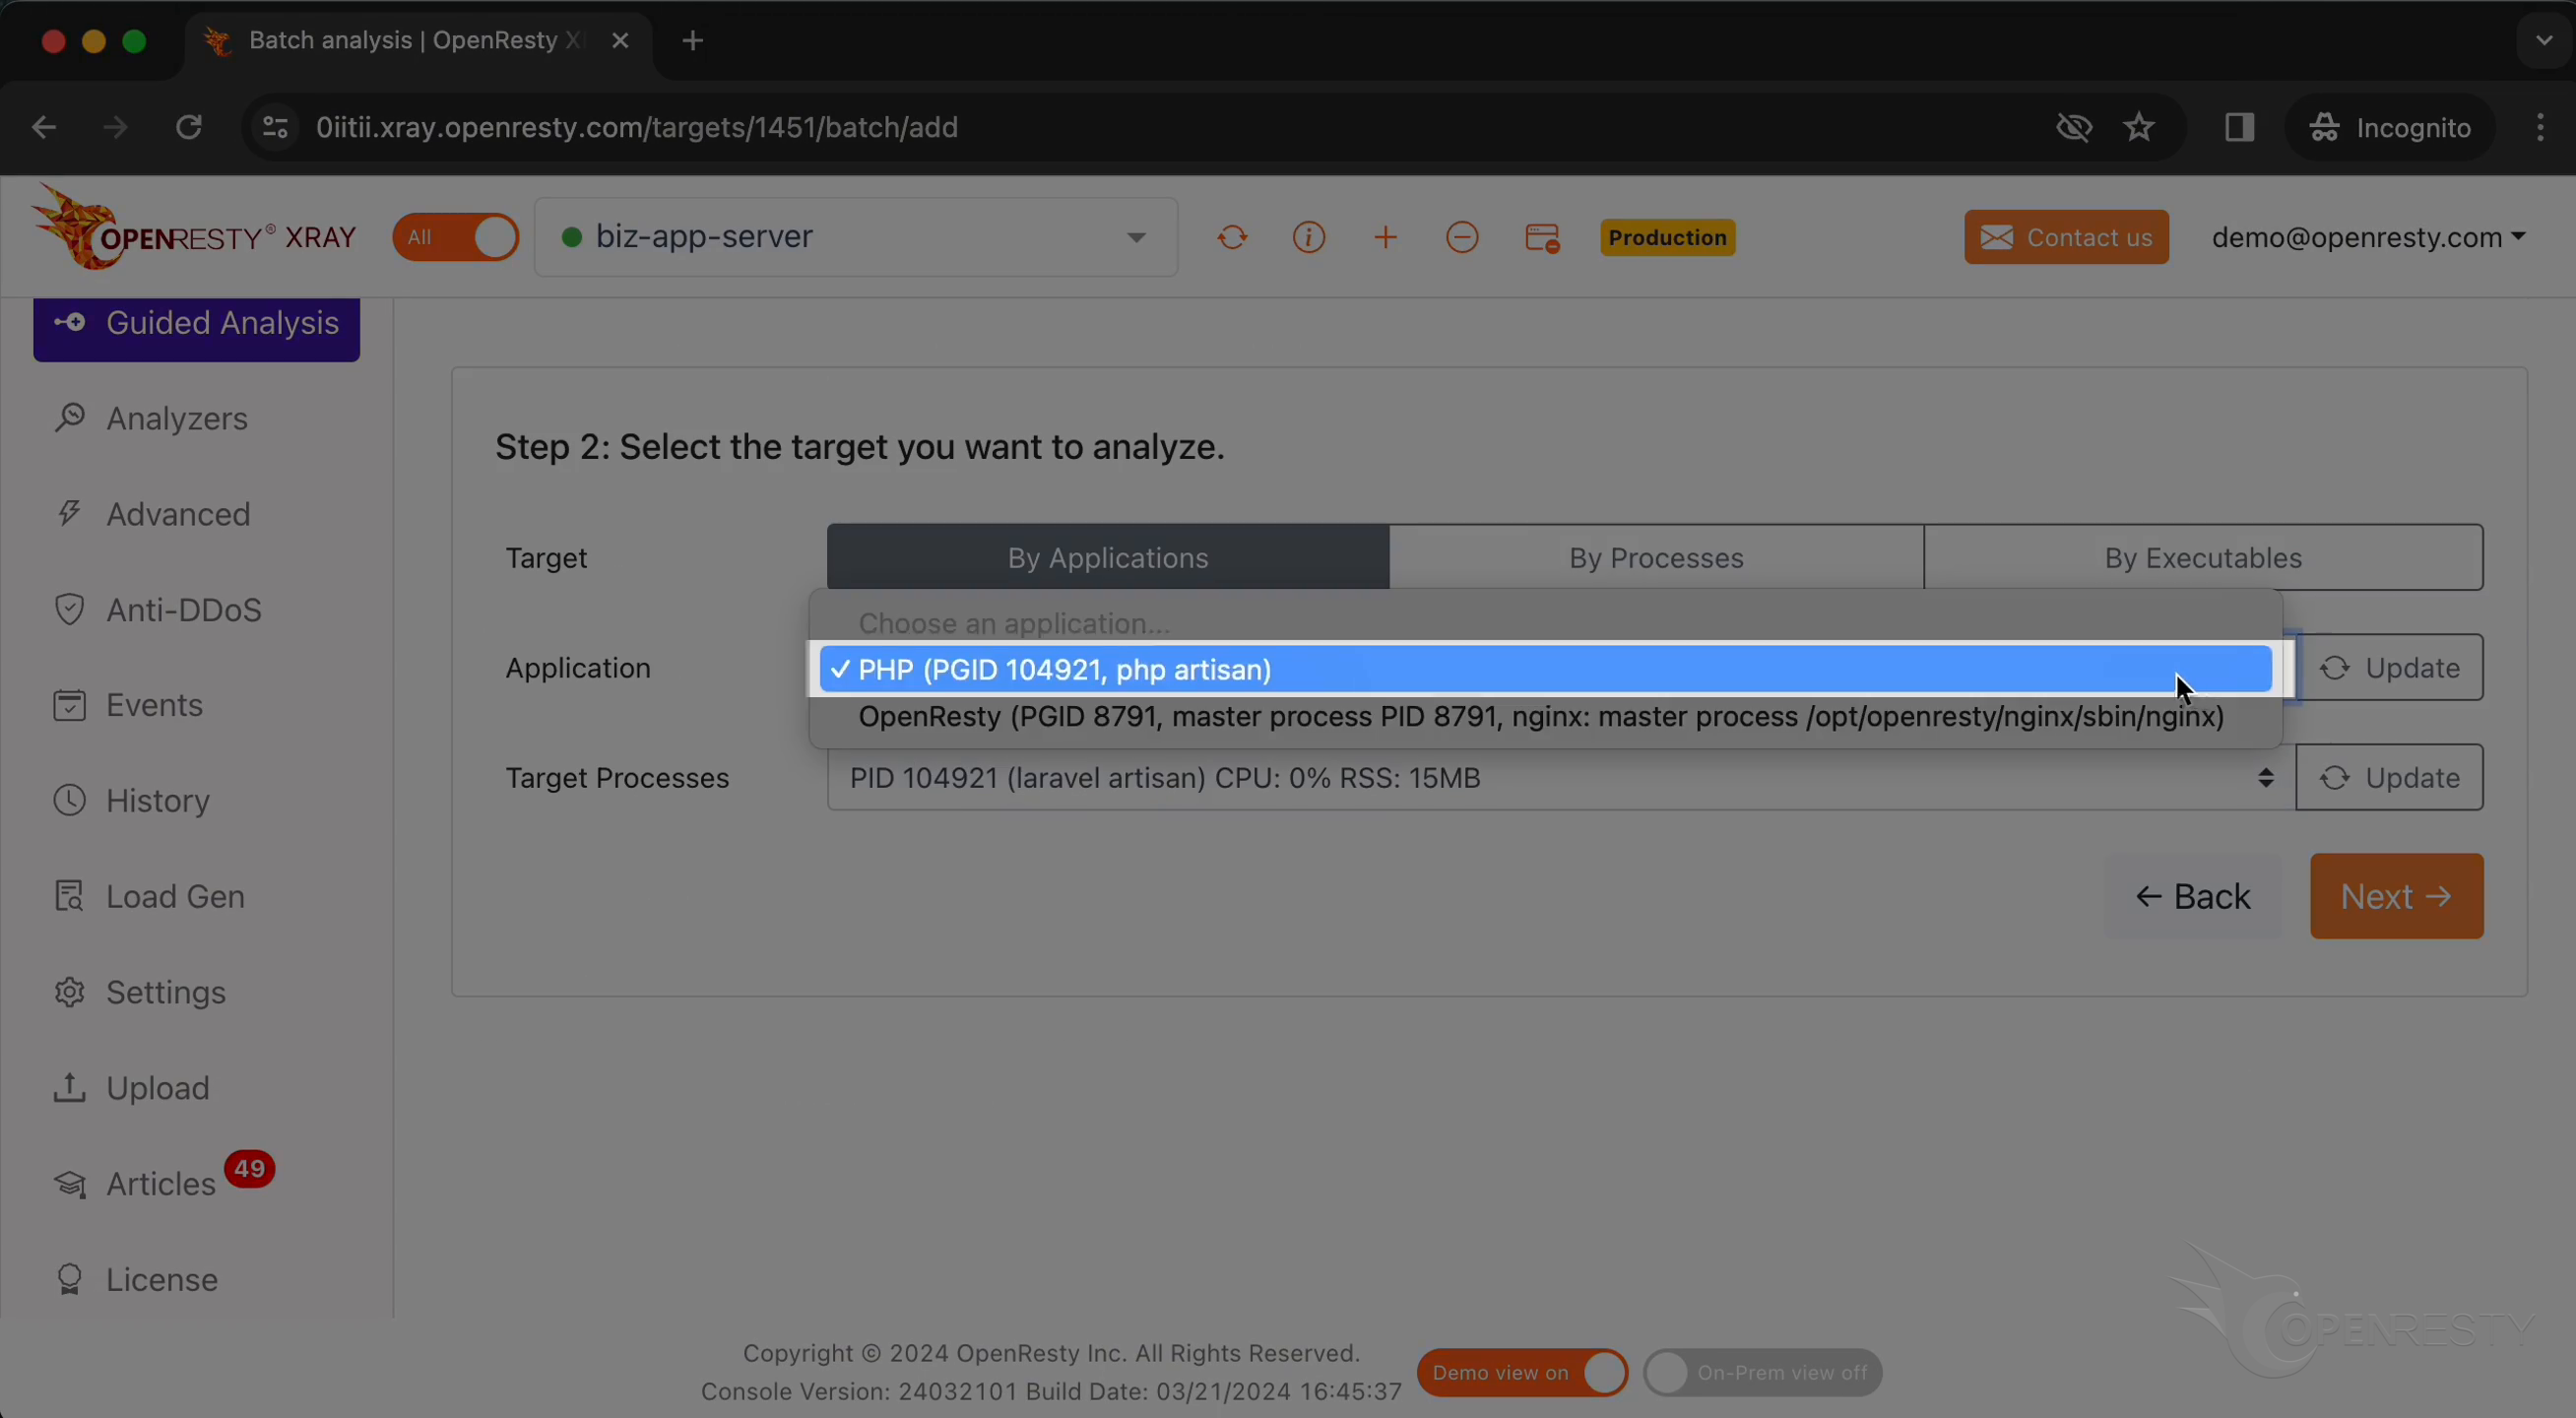
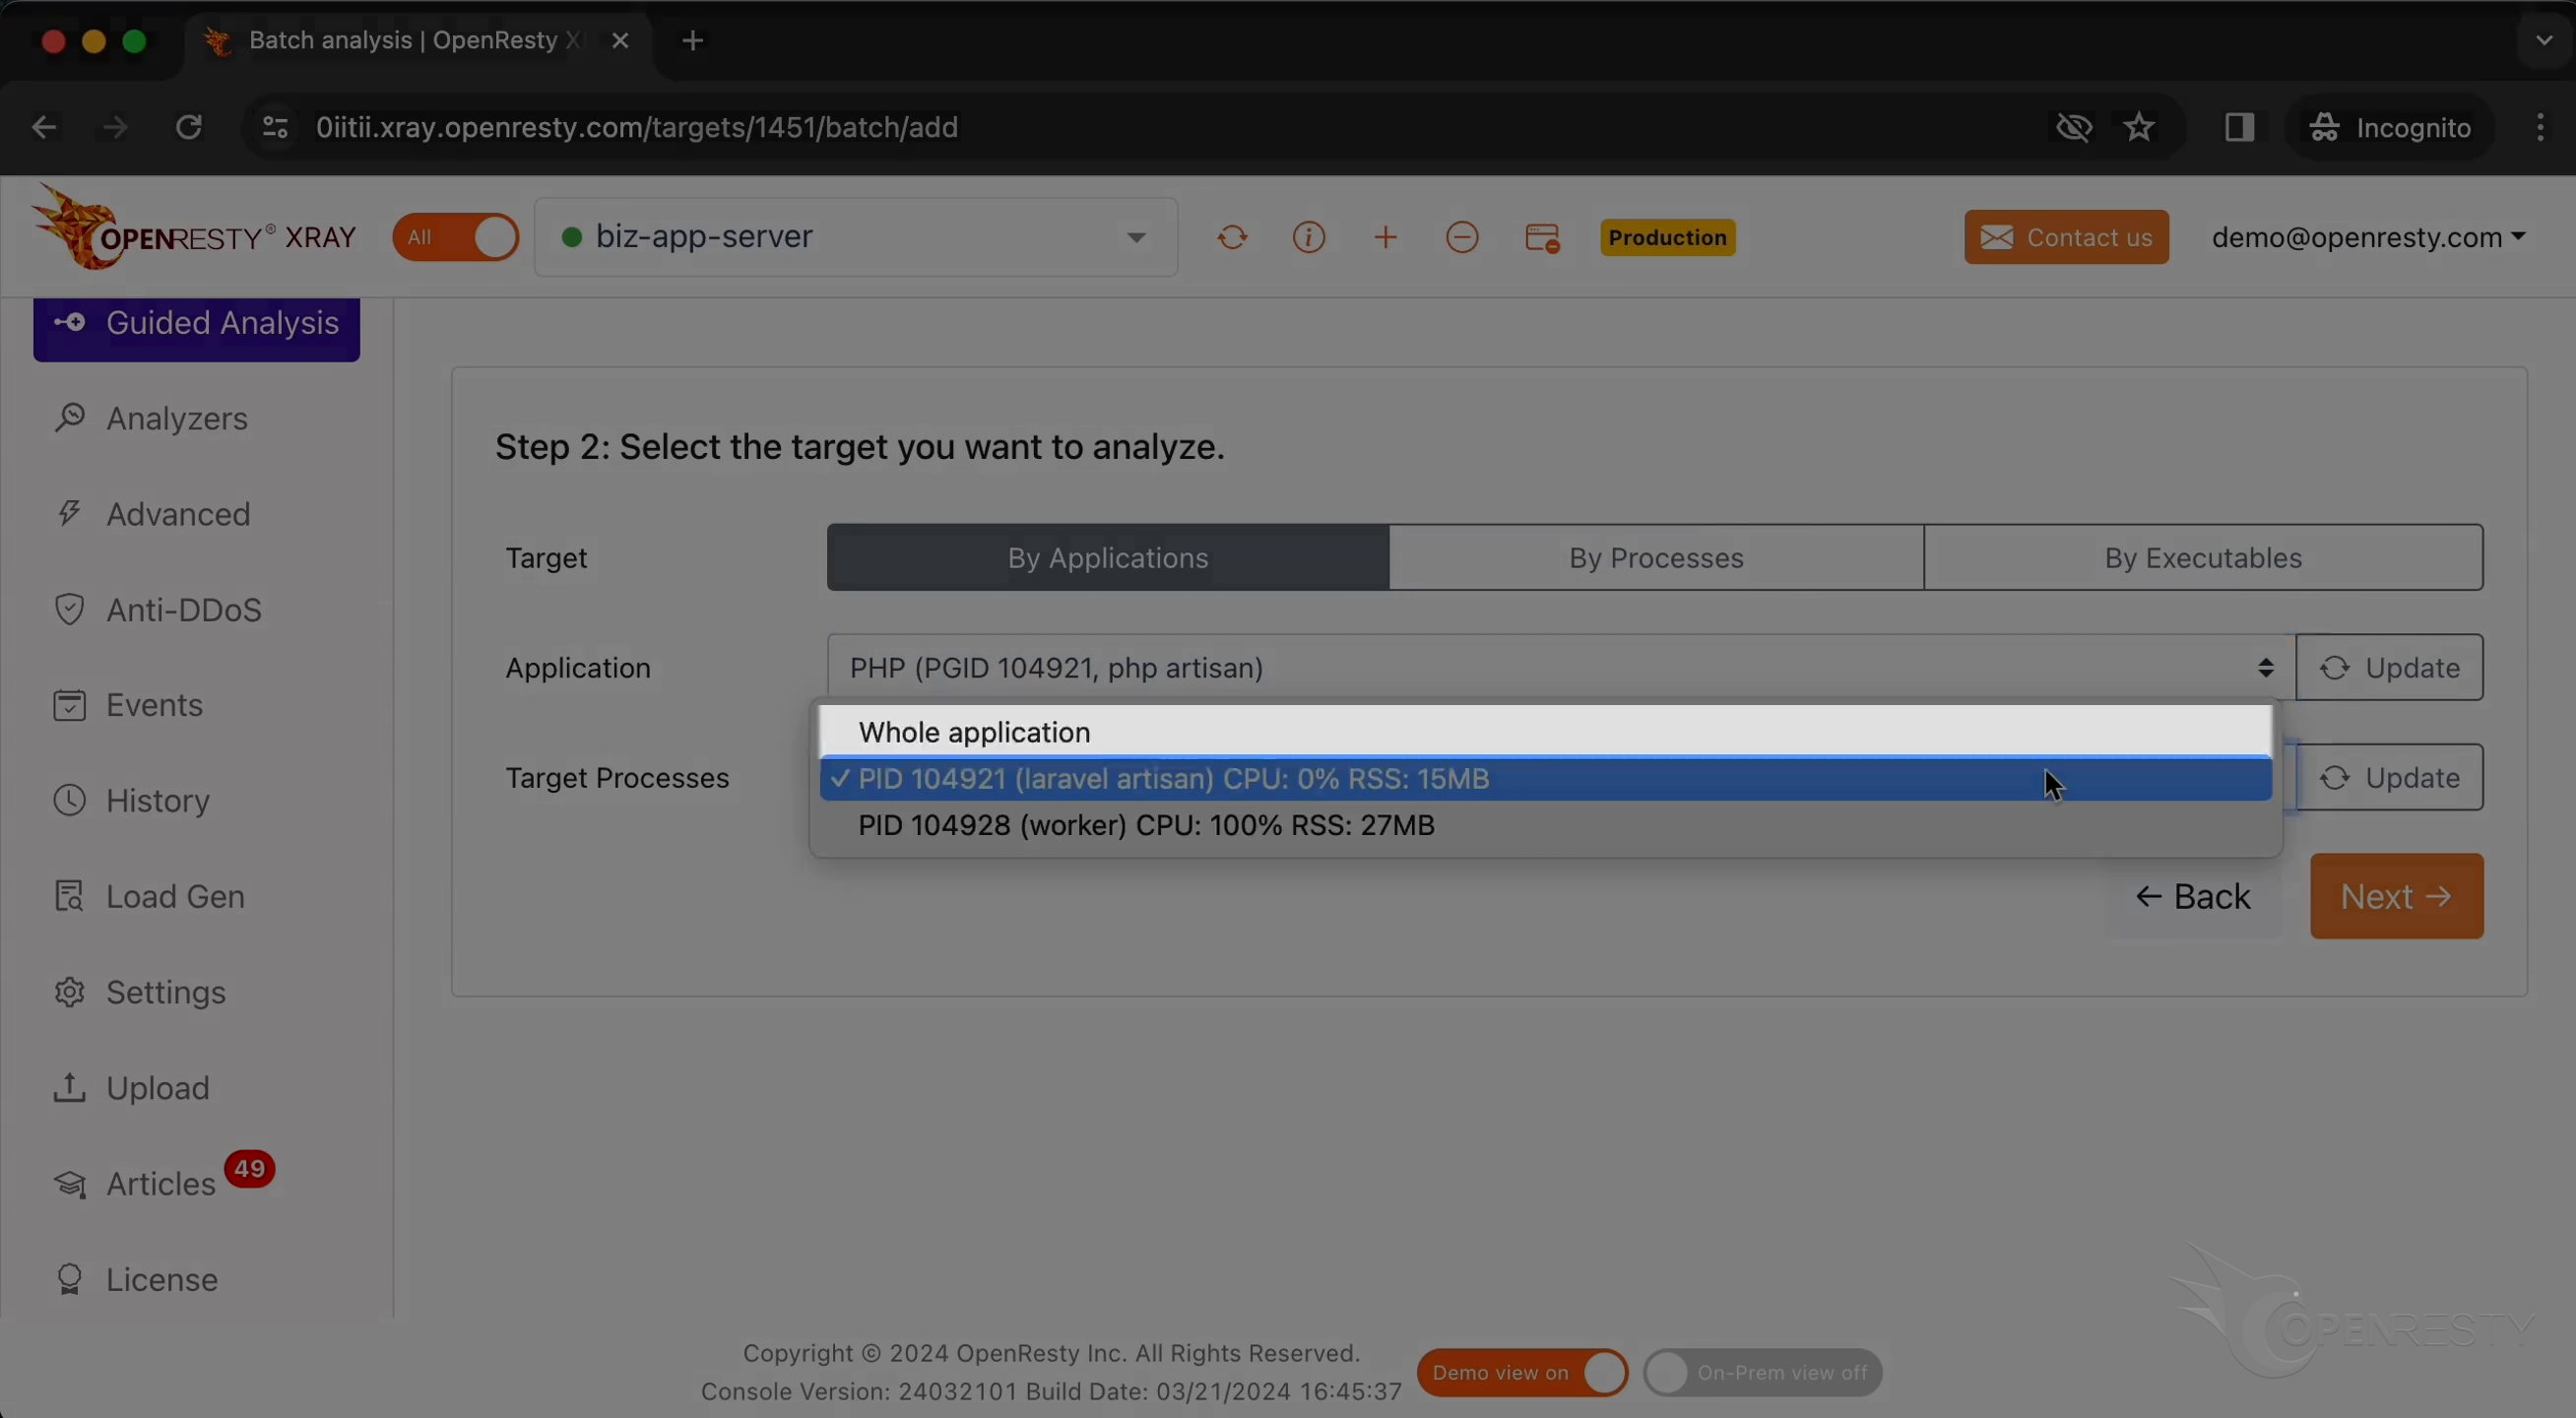
Select “Whole application”.
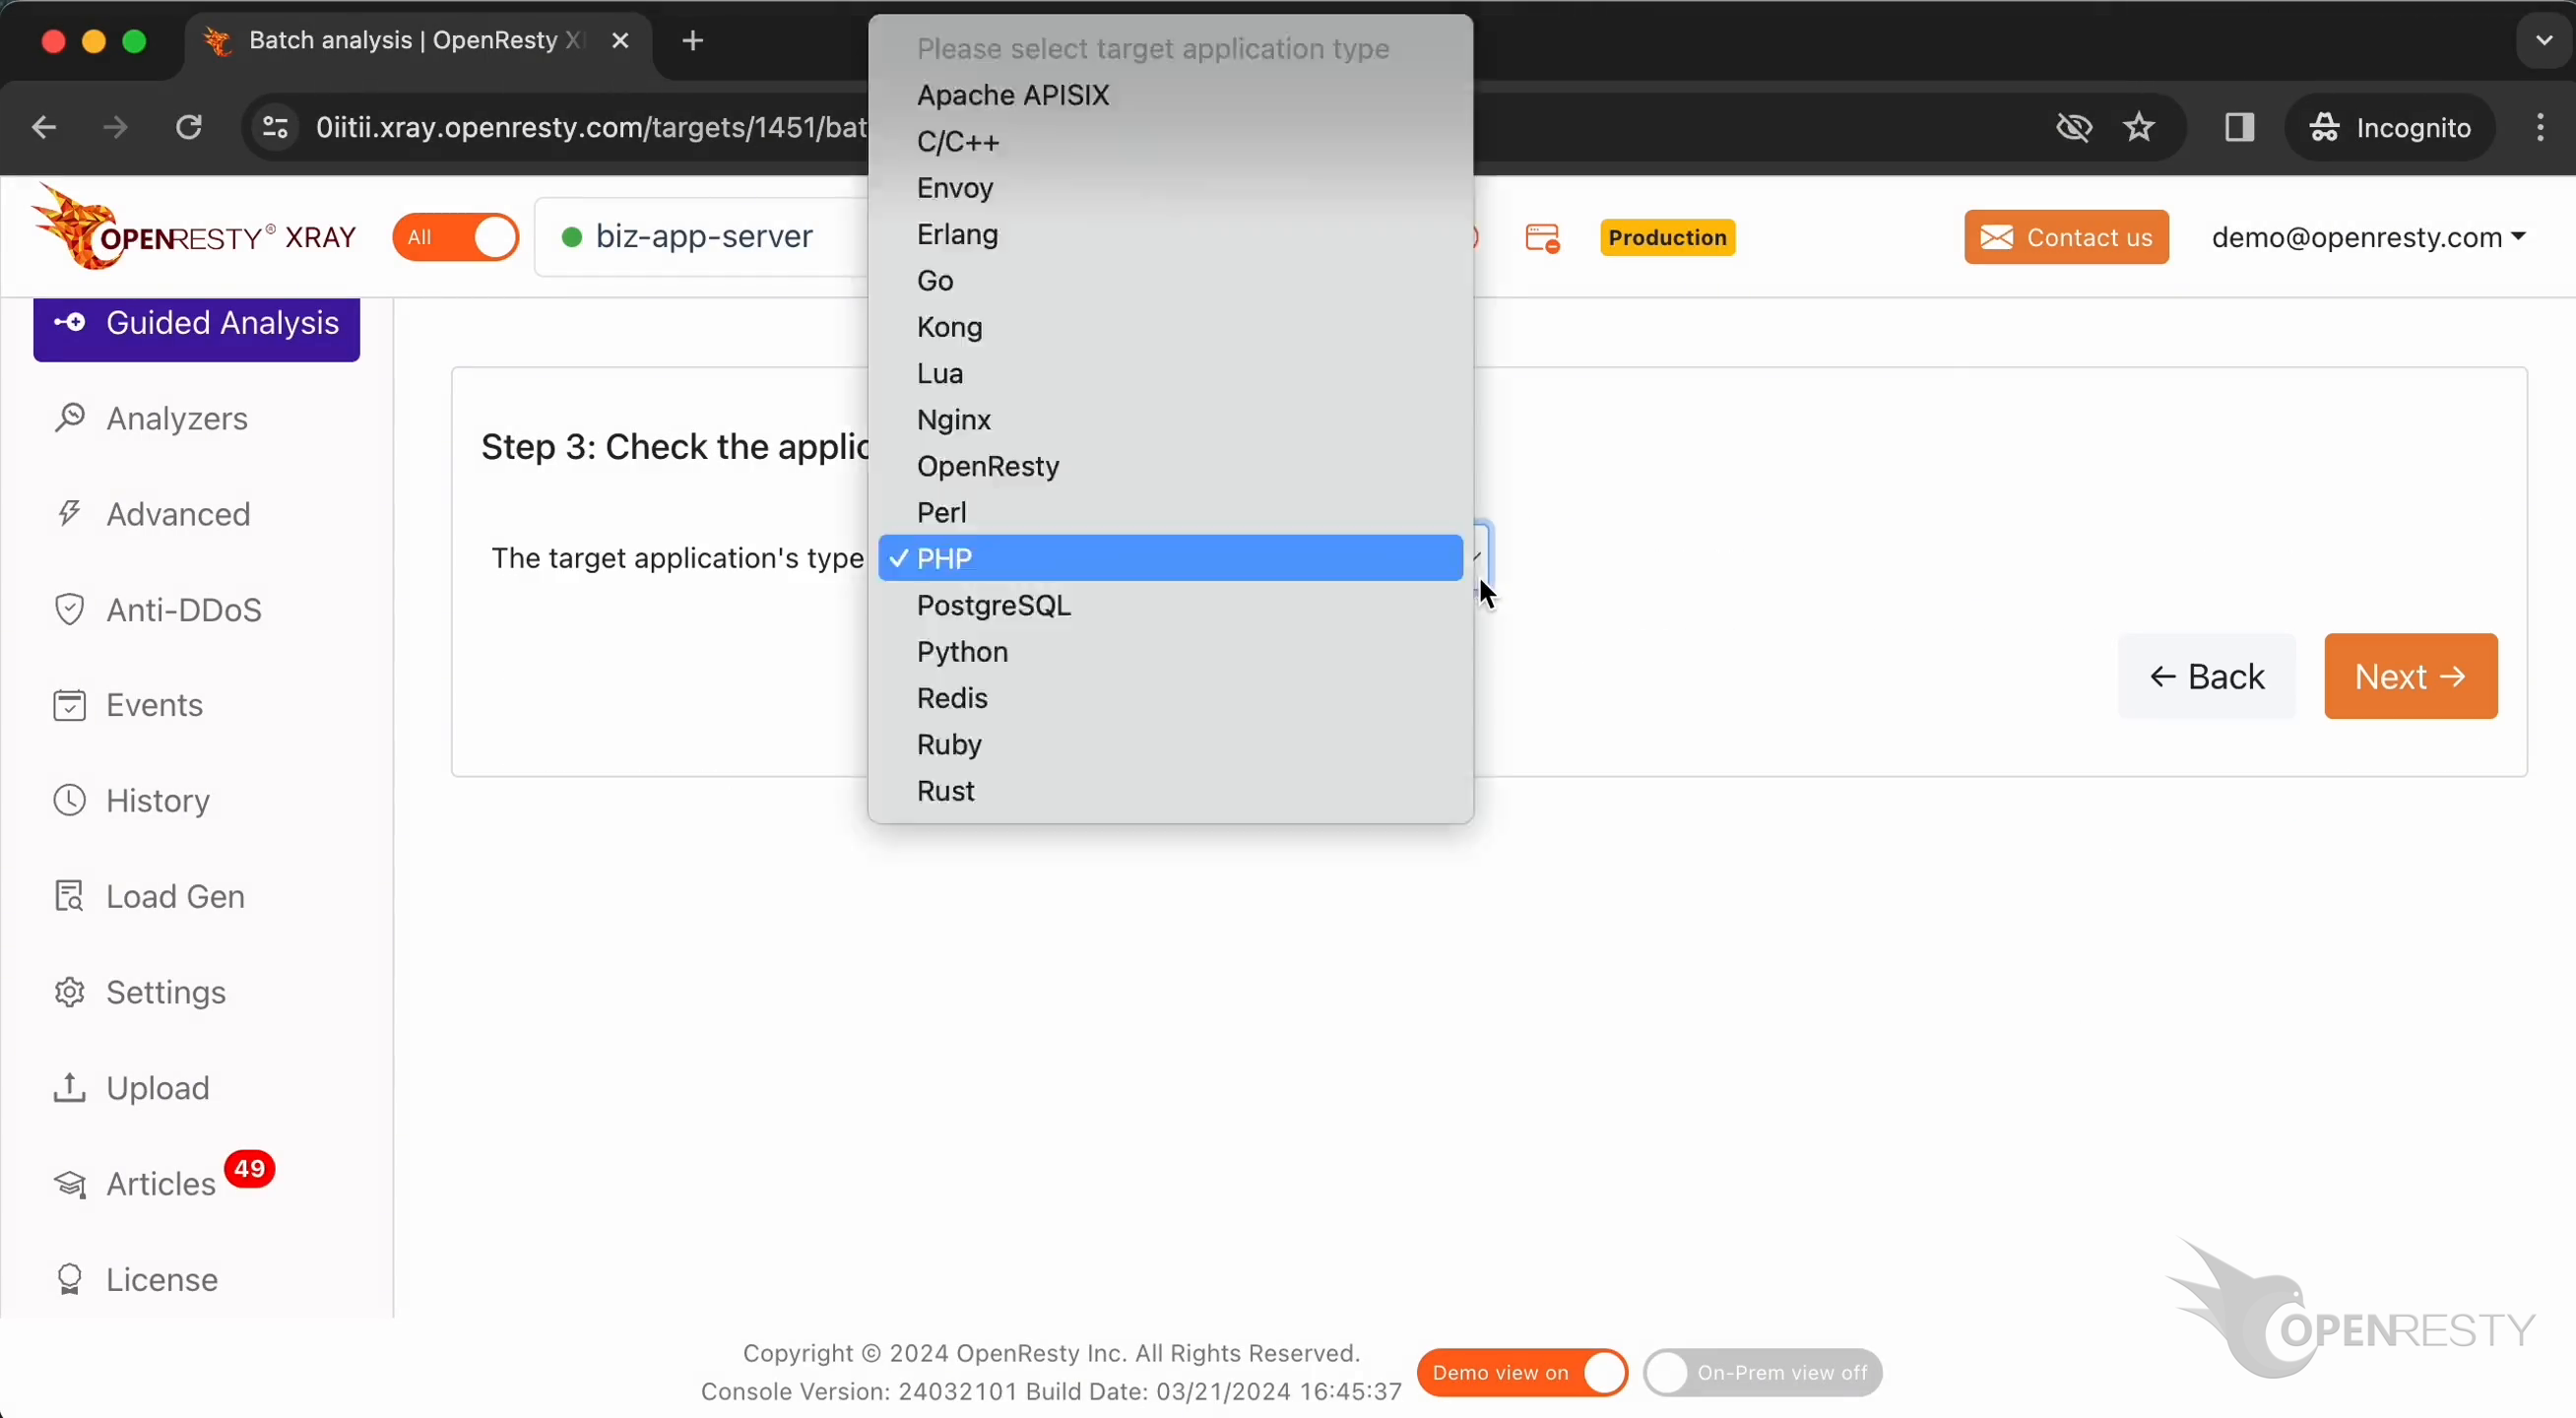
Make sure that the application type is right. Usually, the default should be correct.
OpenResty XRay can analyze multiple language levels at the same time. We’ll keep both PHP and C/C++ selected.
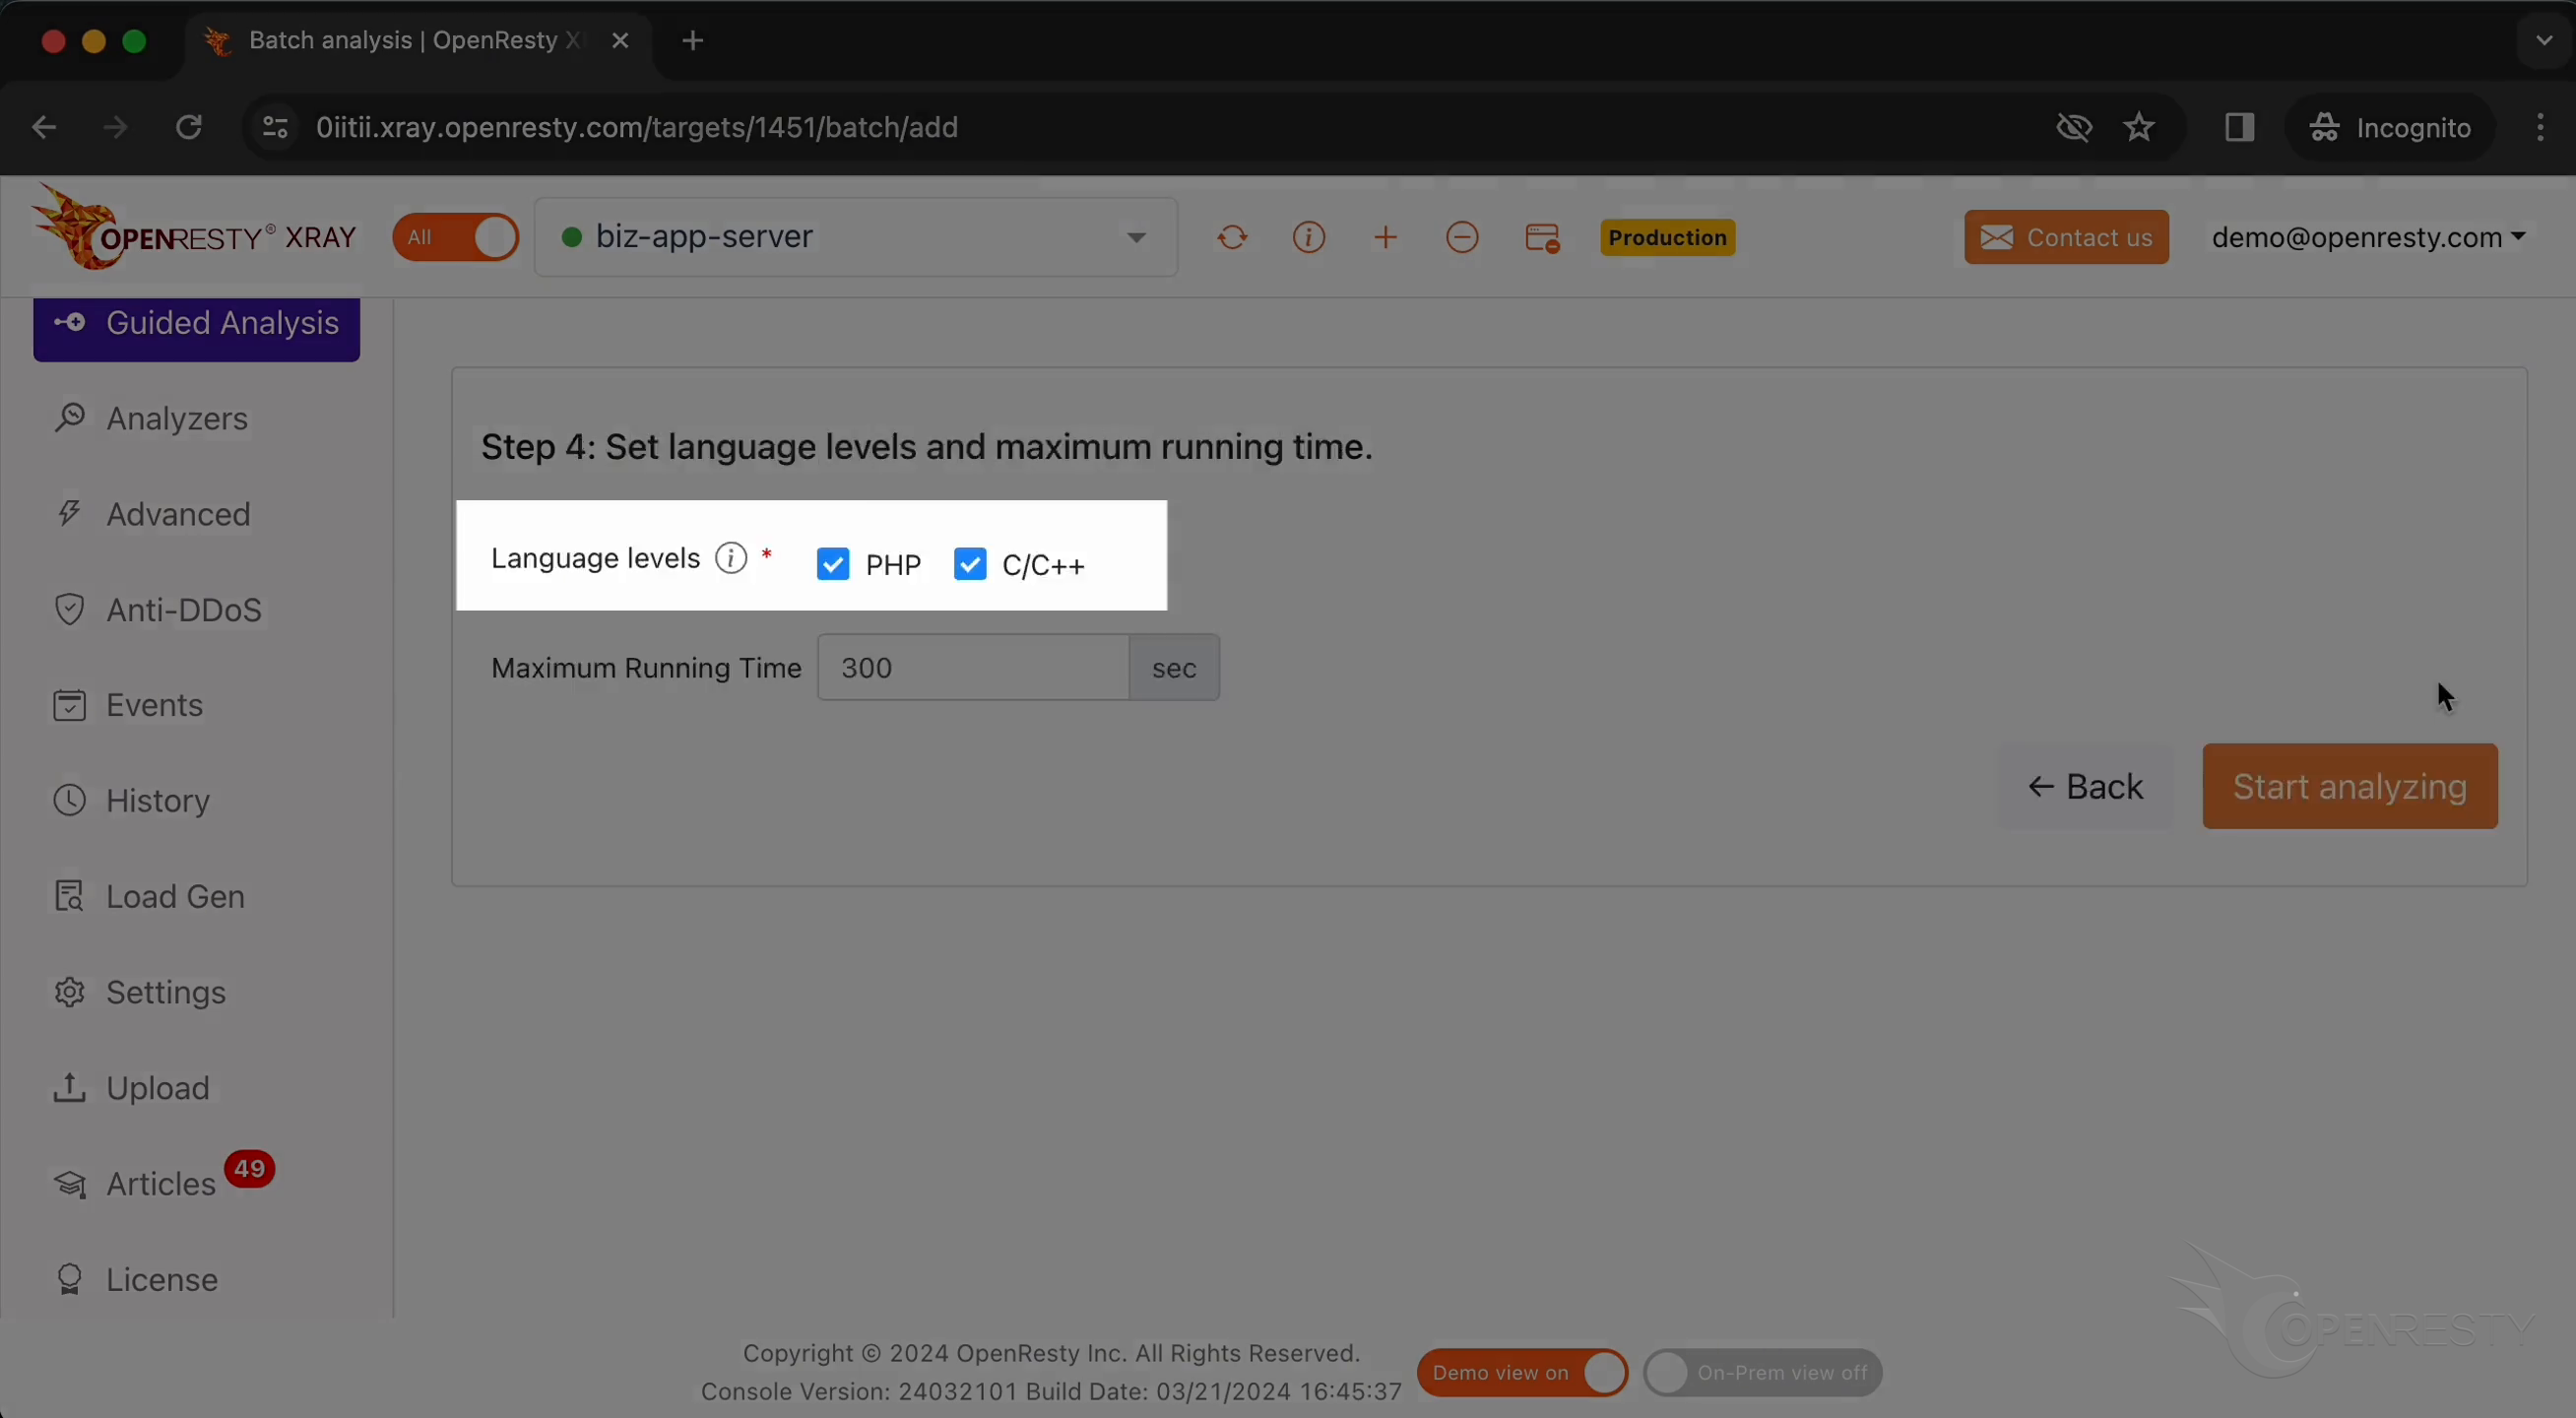
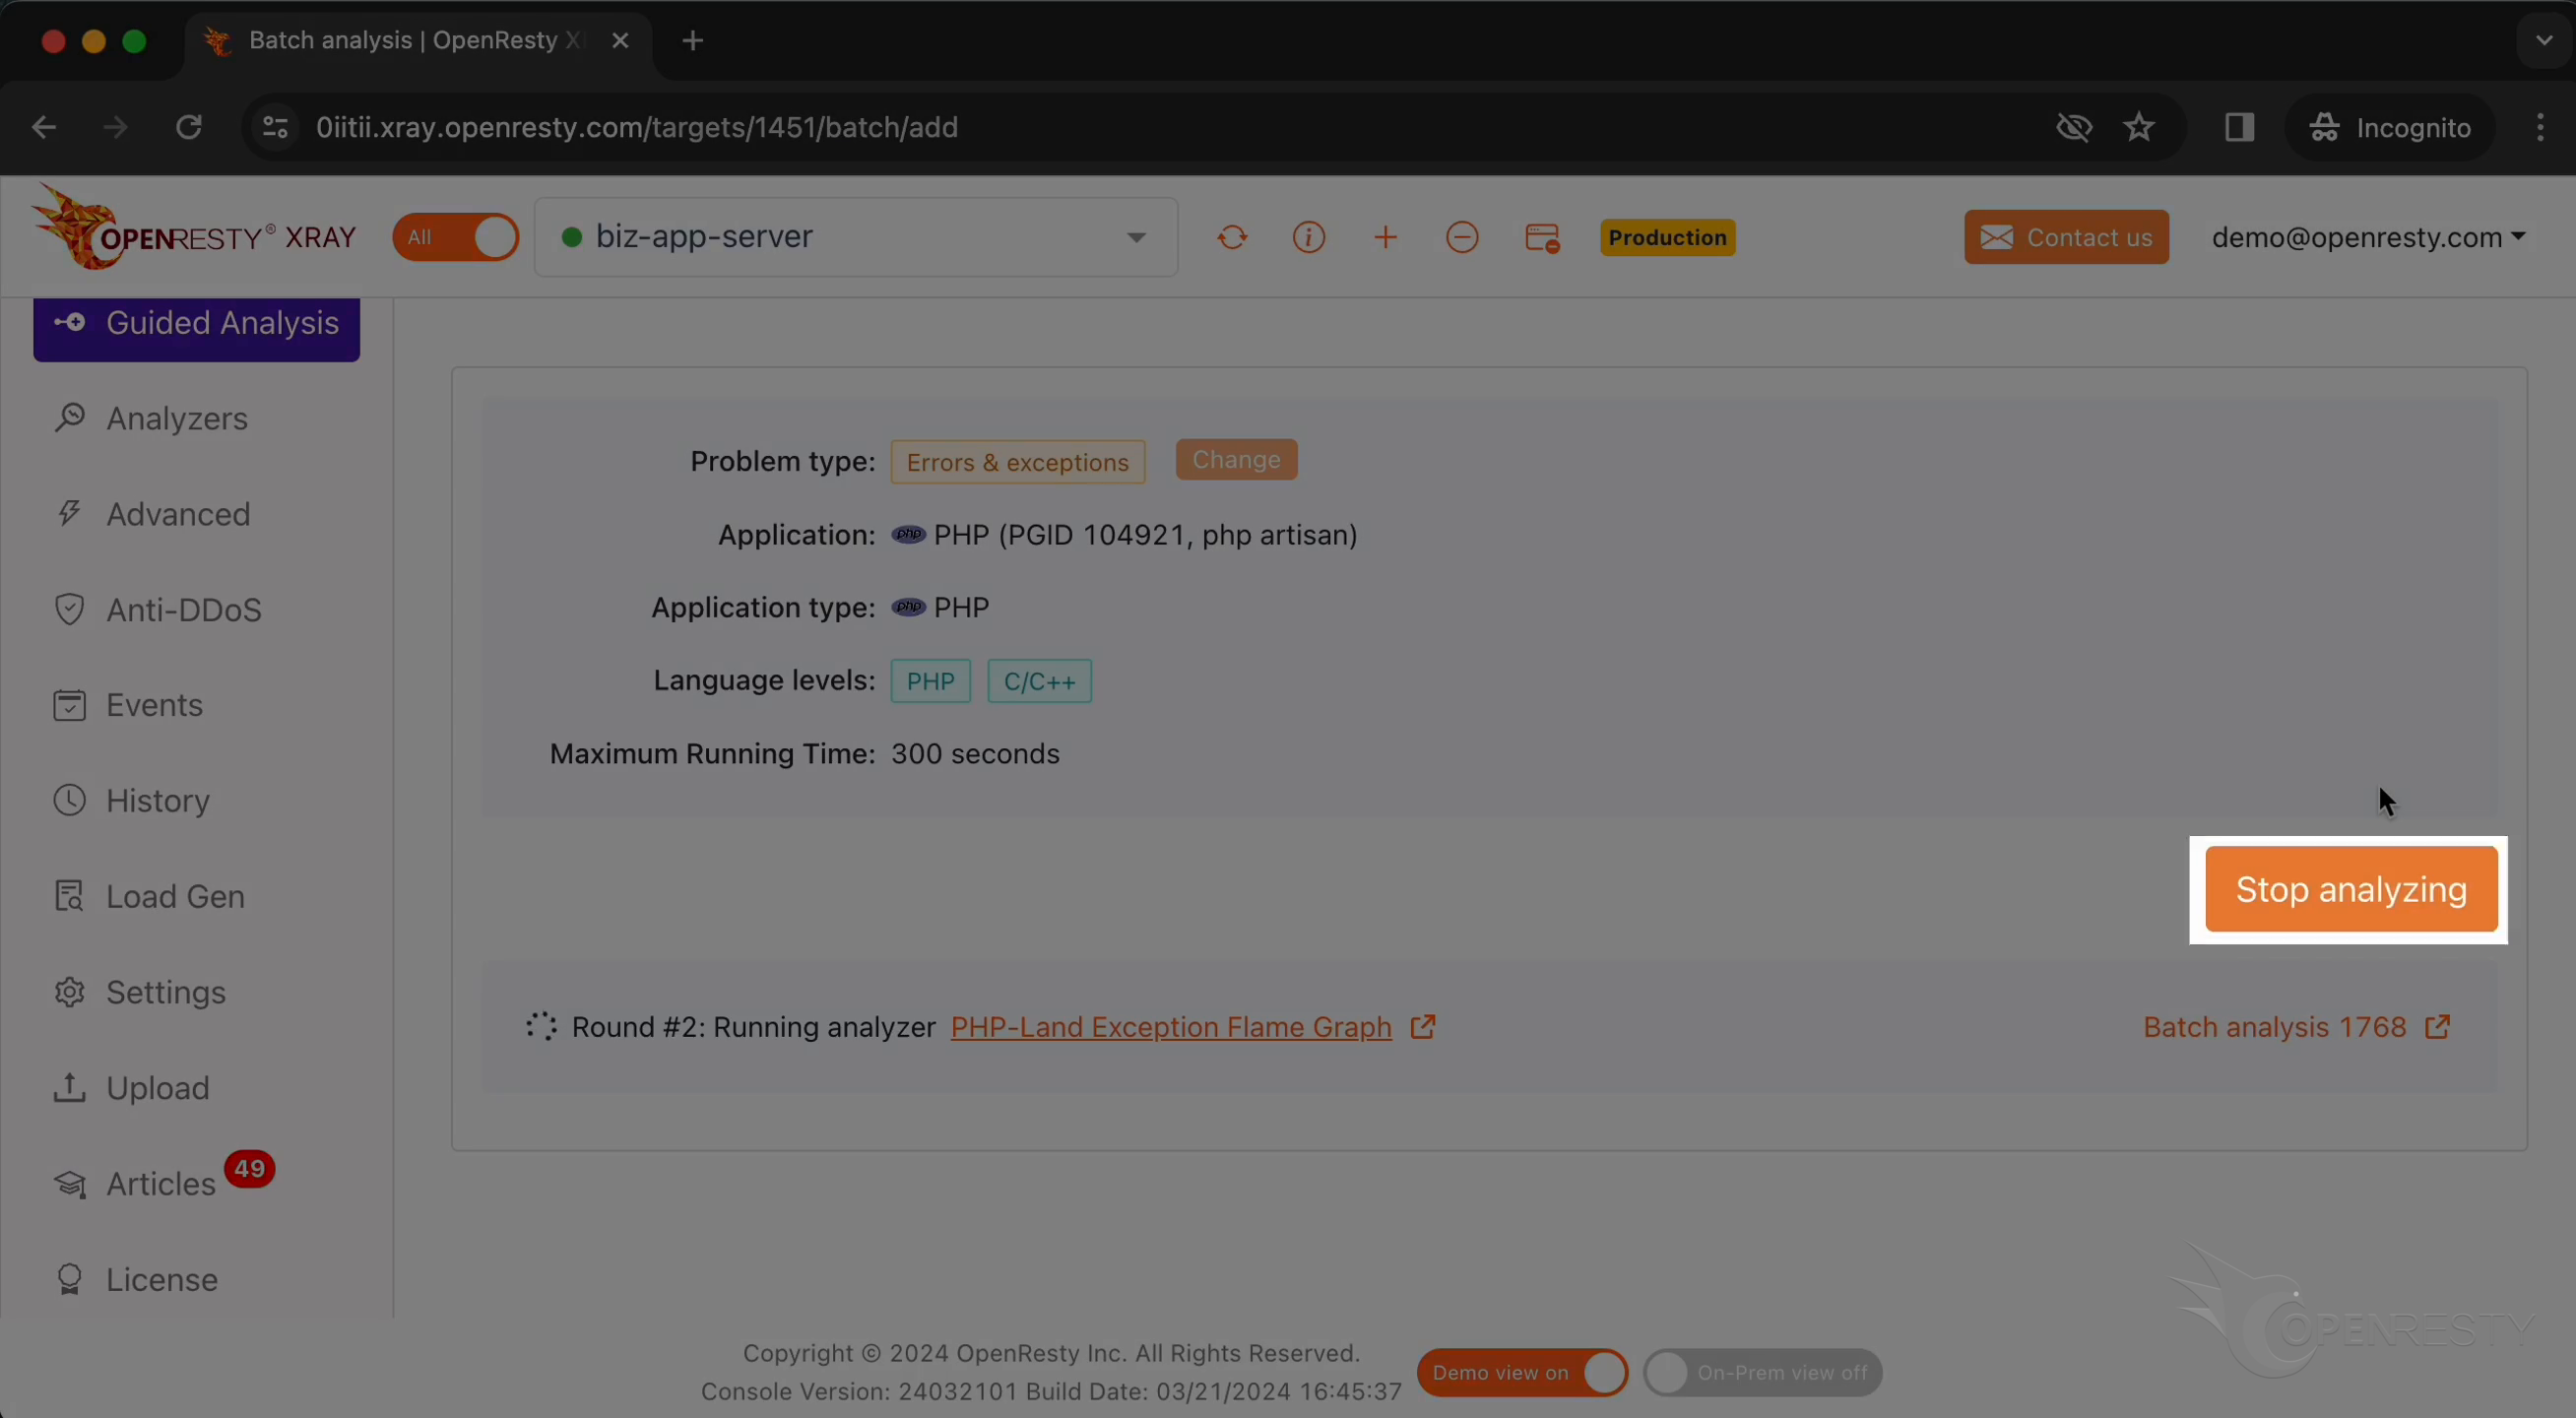
We can also set the maximum analyzing time. We’ll leave it as 300 seconds, which is the default value.
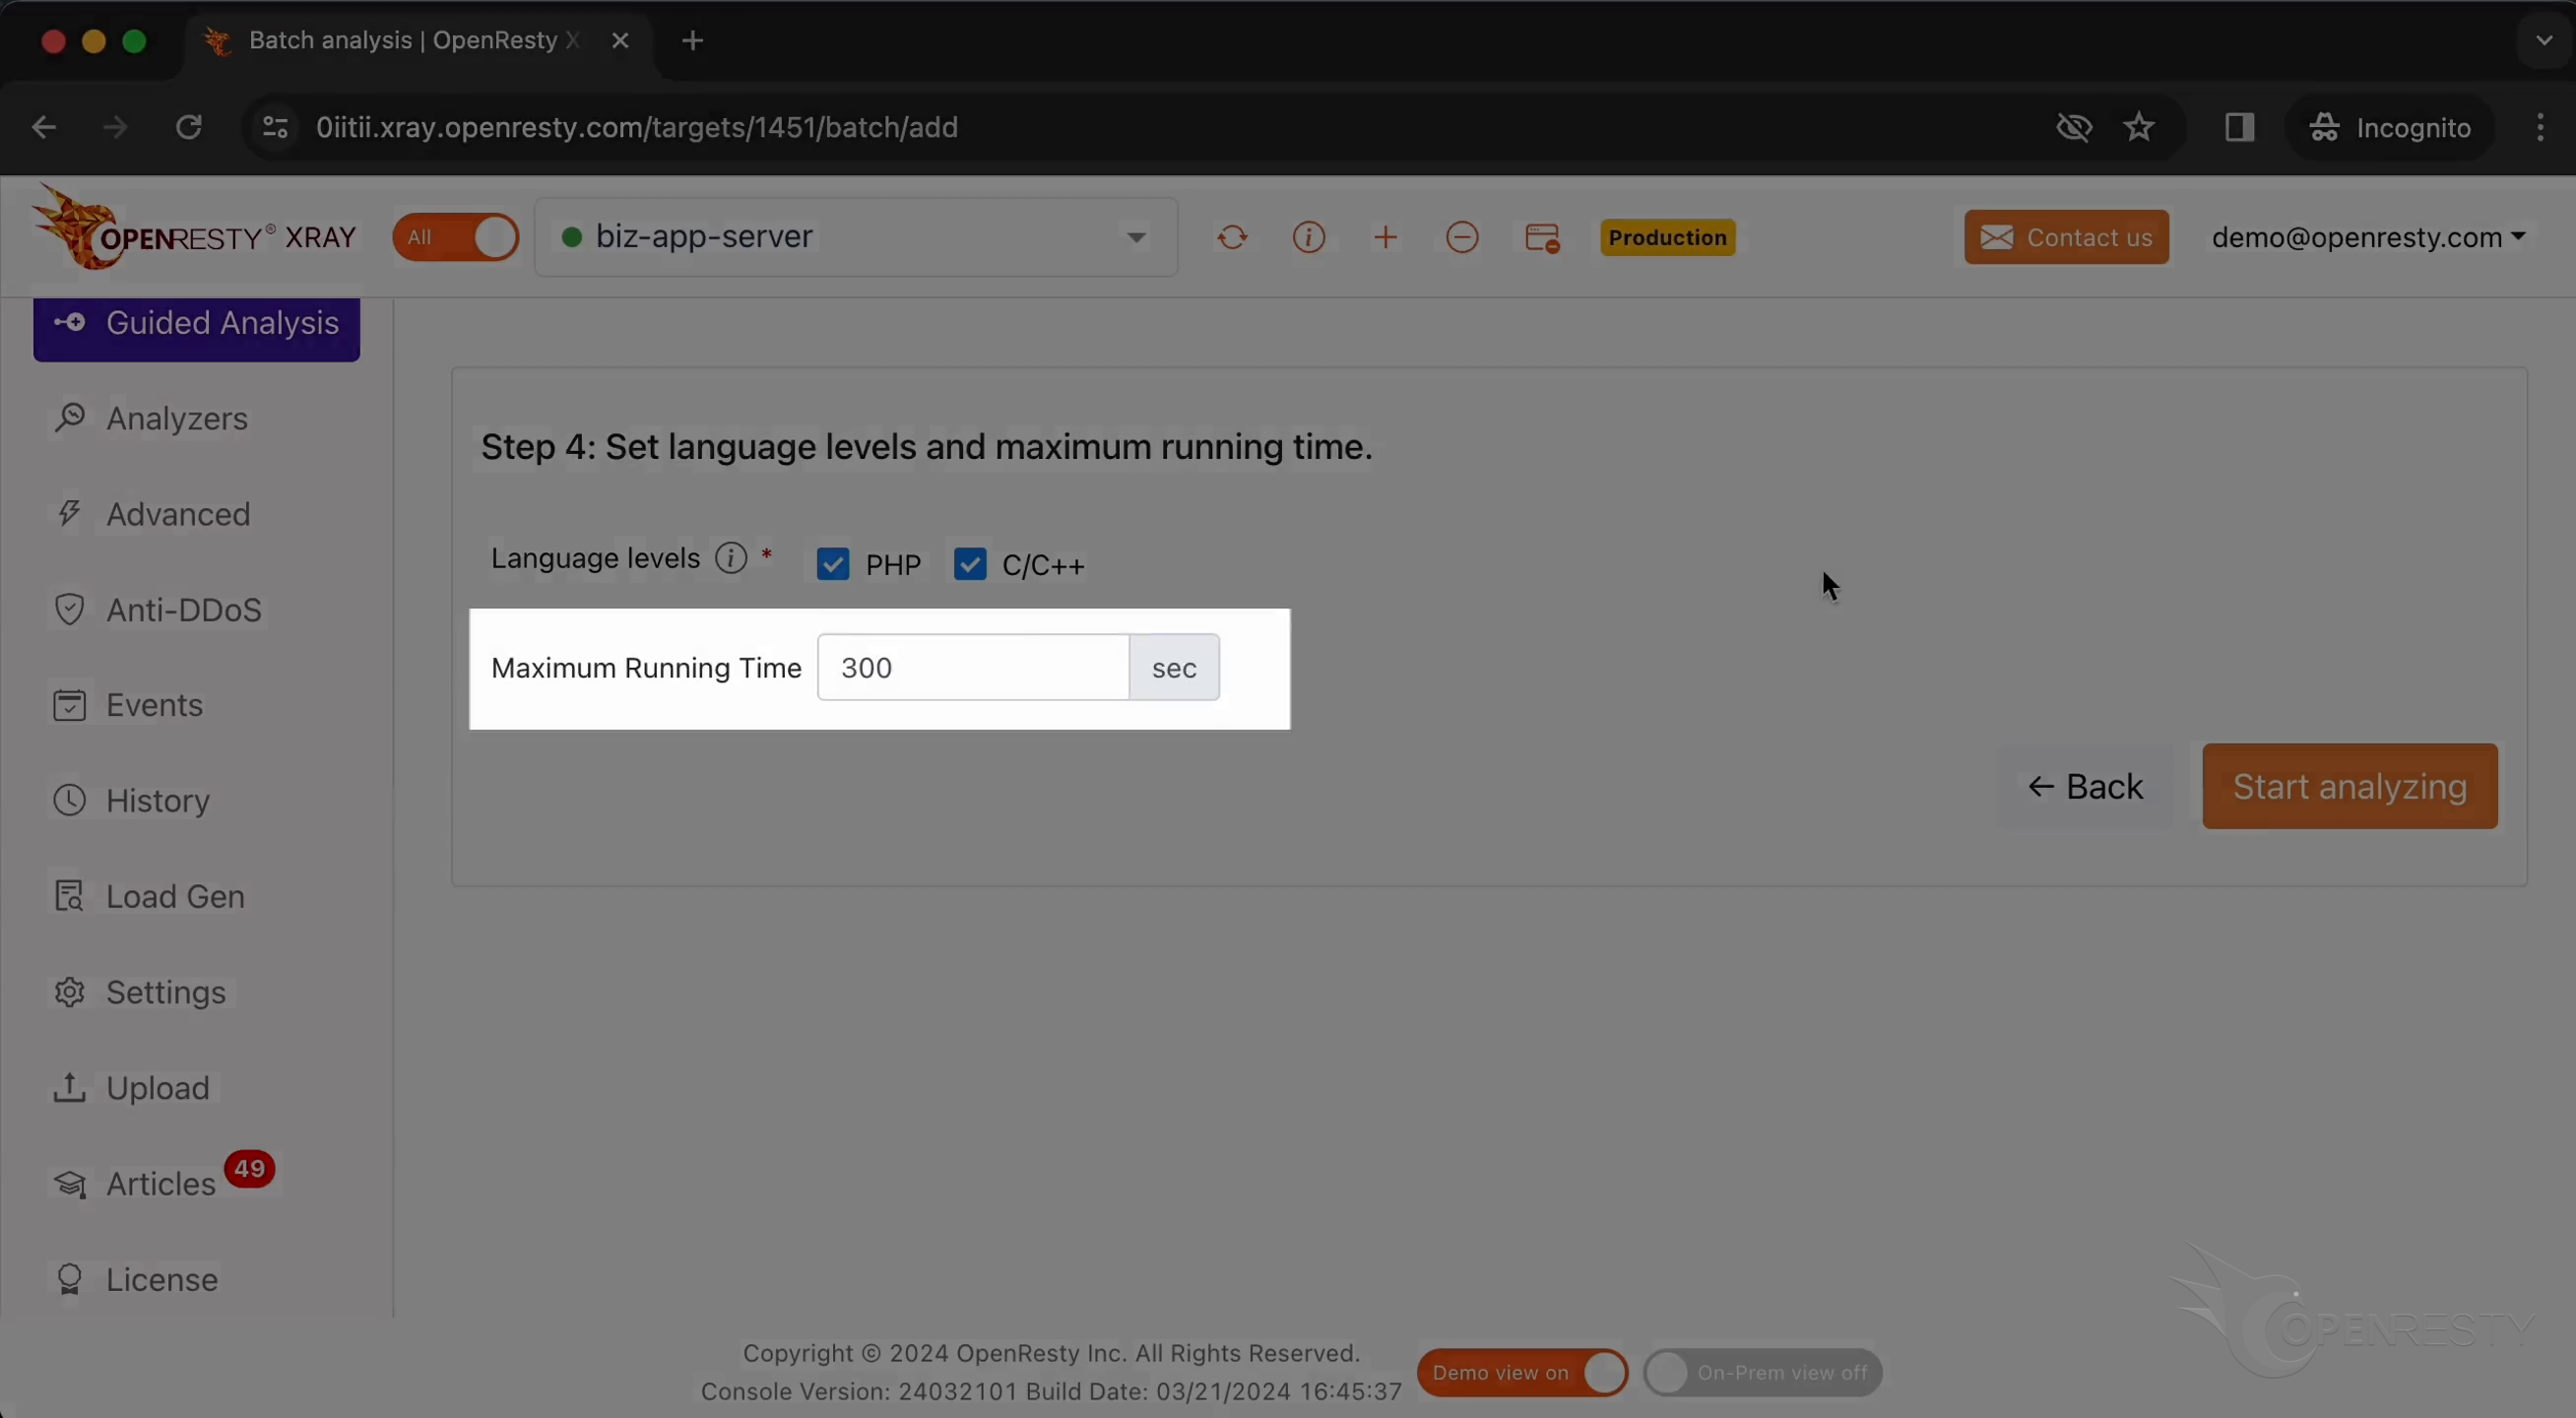
Let’s start analyzing.
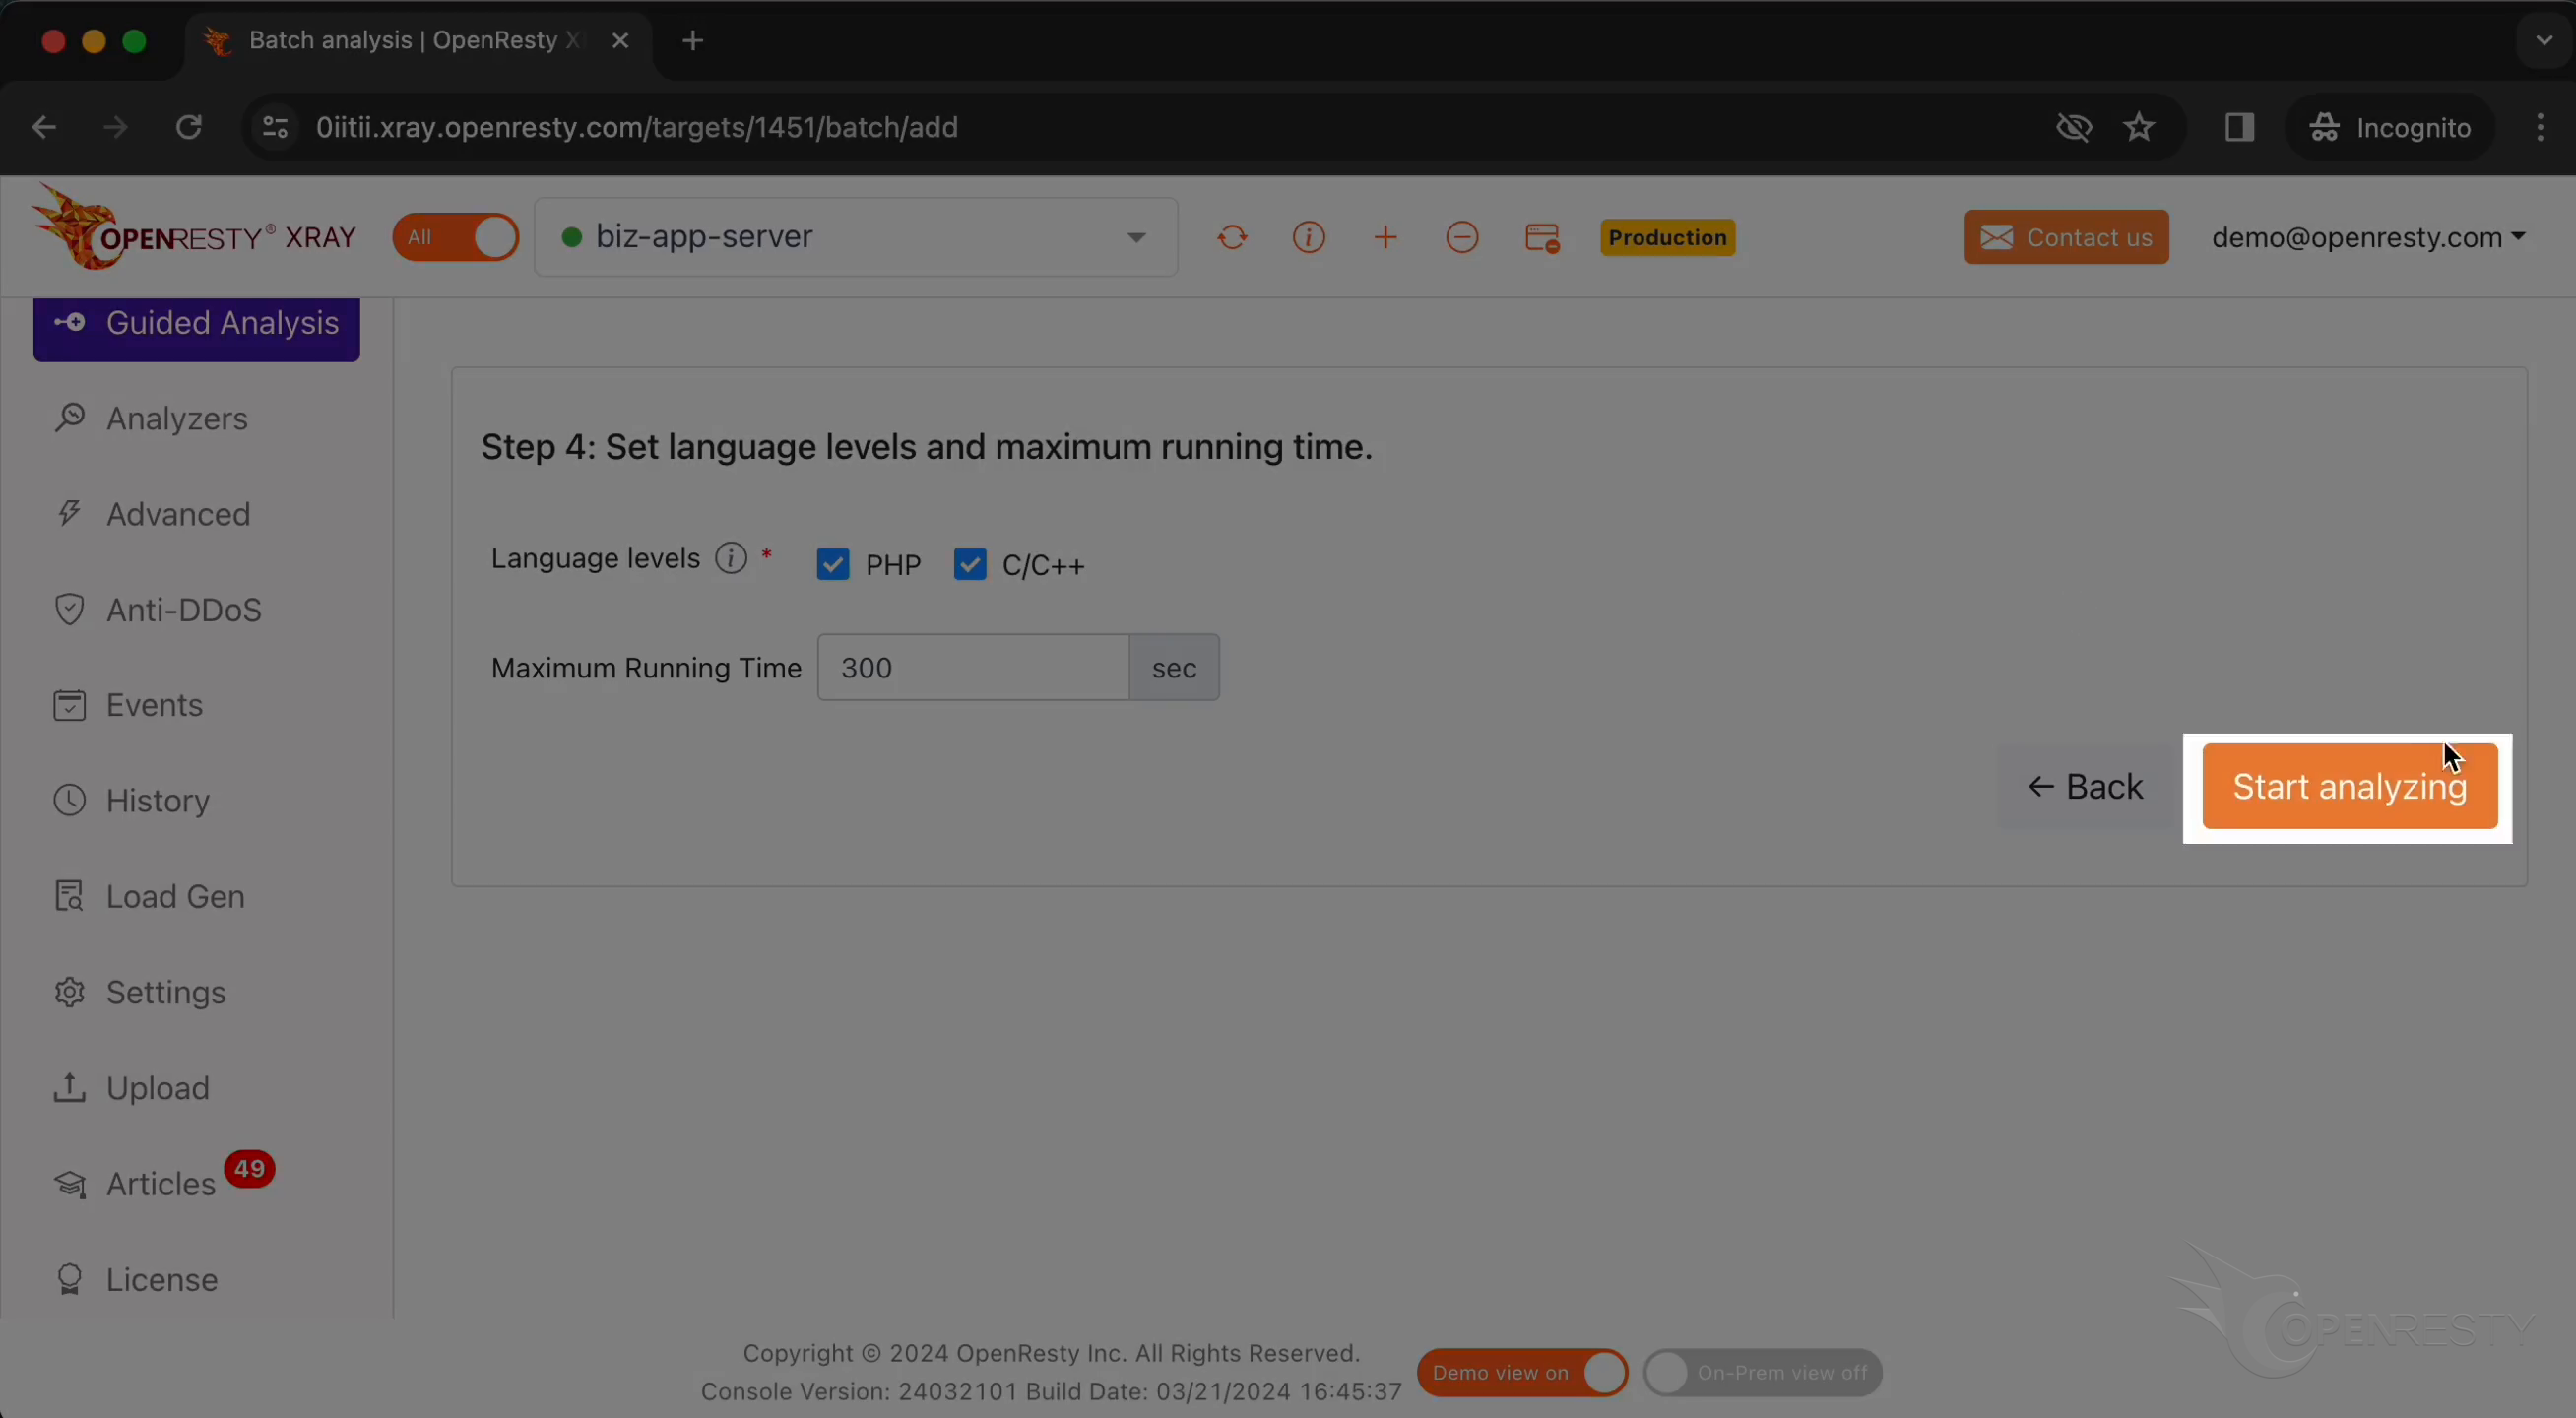
The system will keep performing different rounds of analysis. Now, it’s executing the first round.
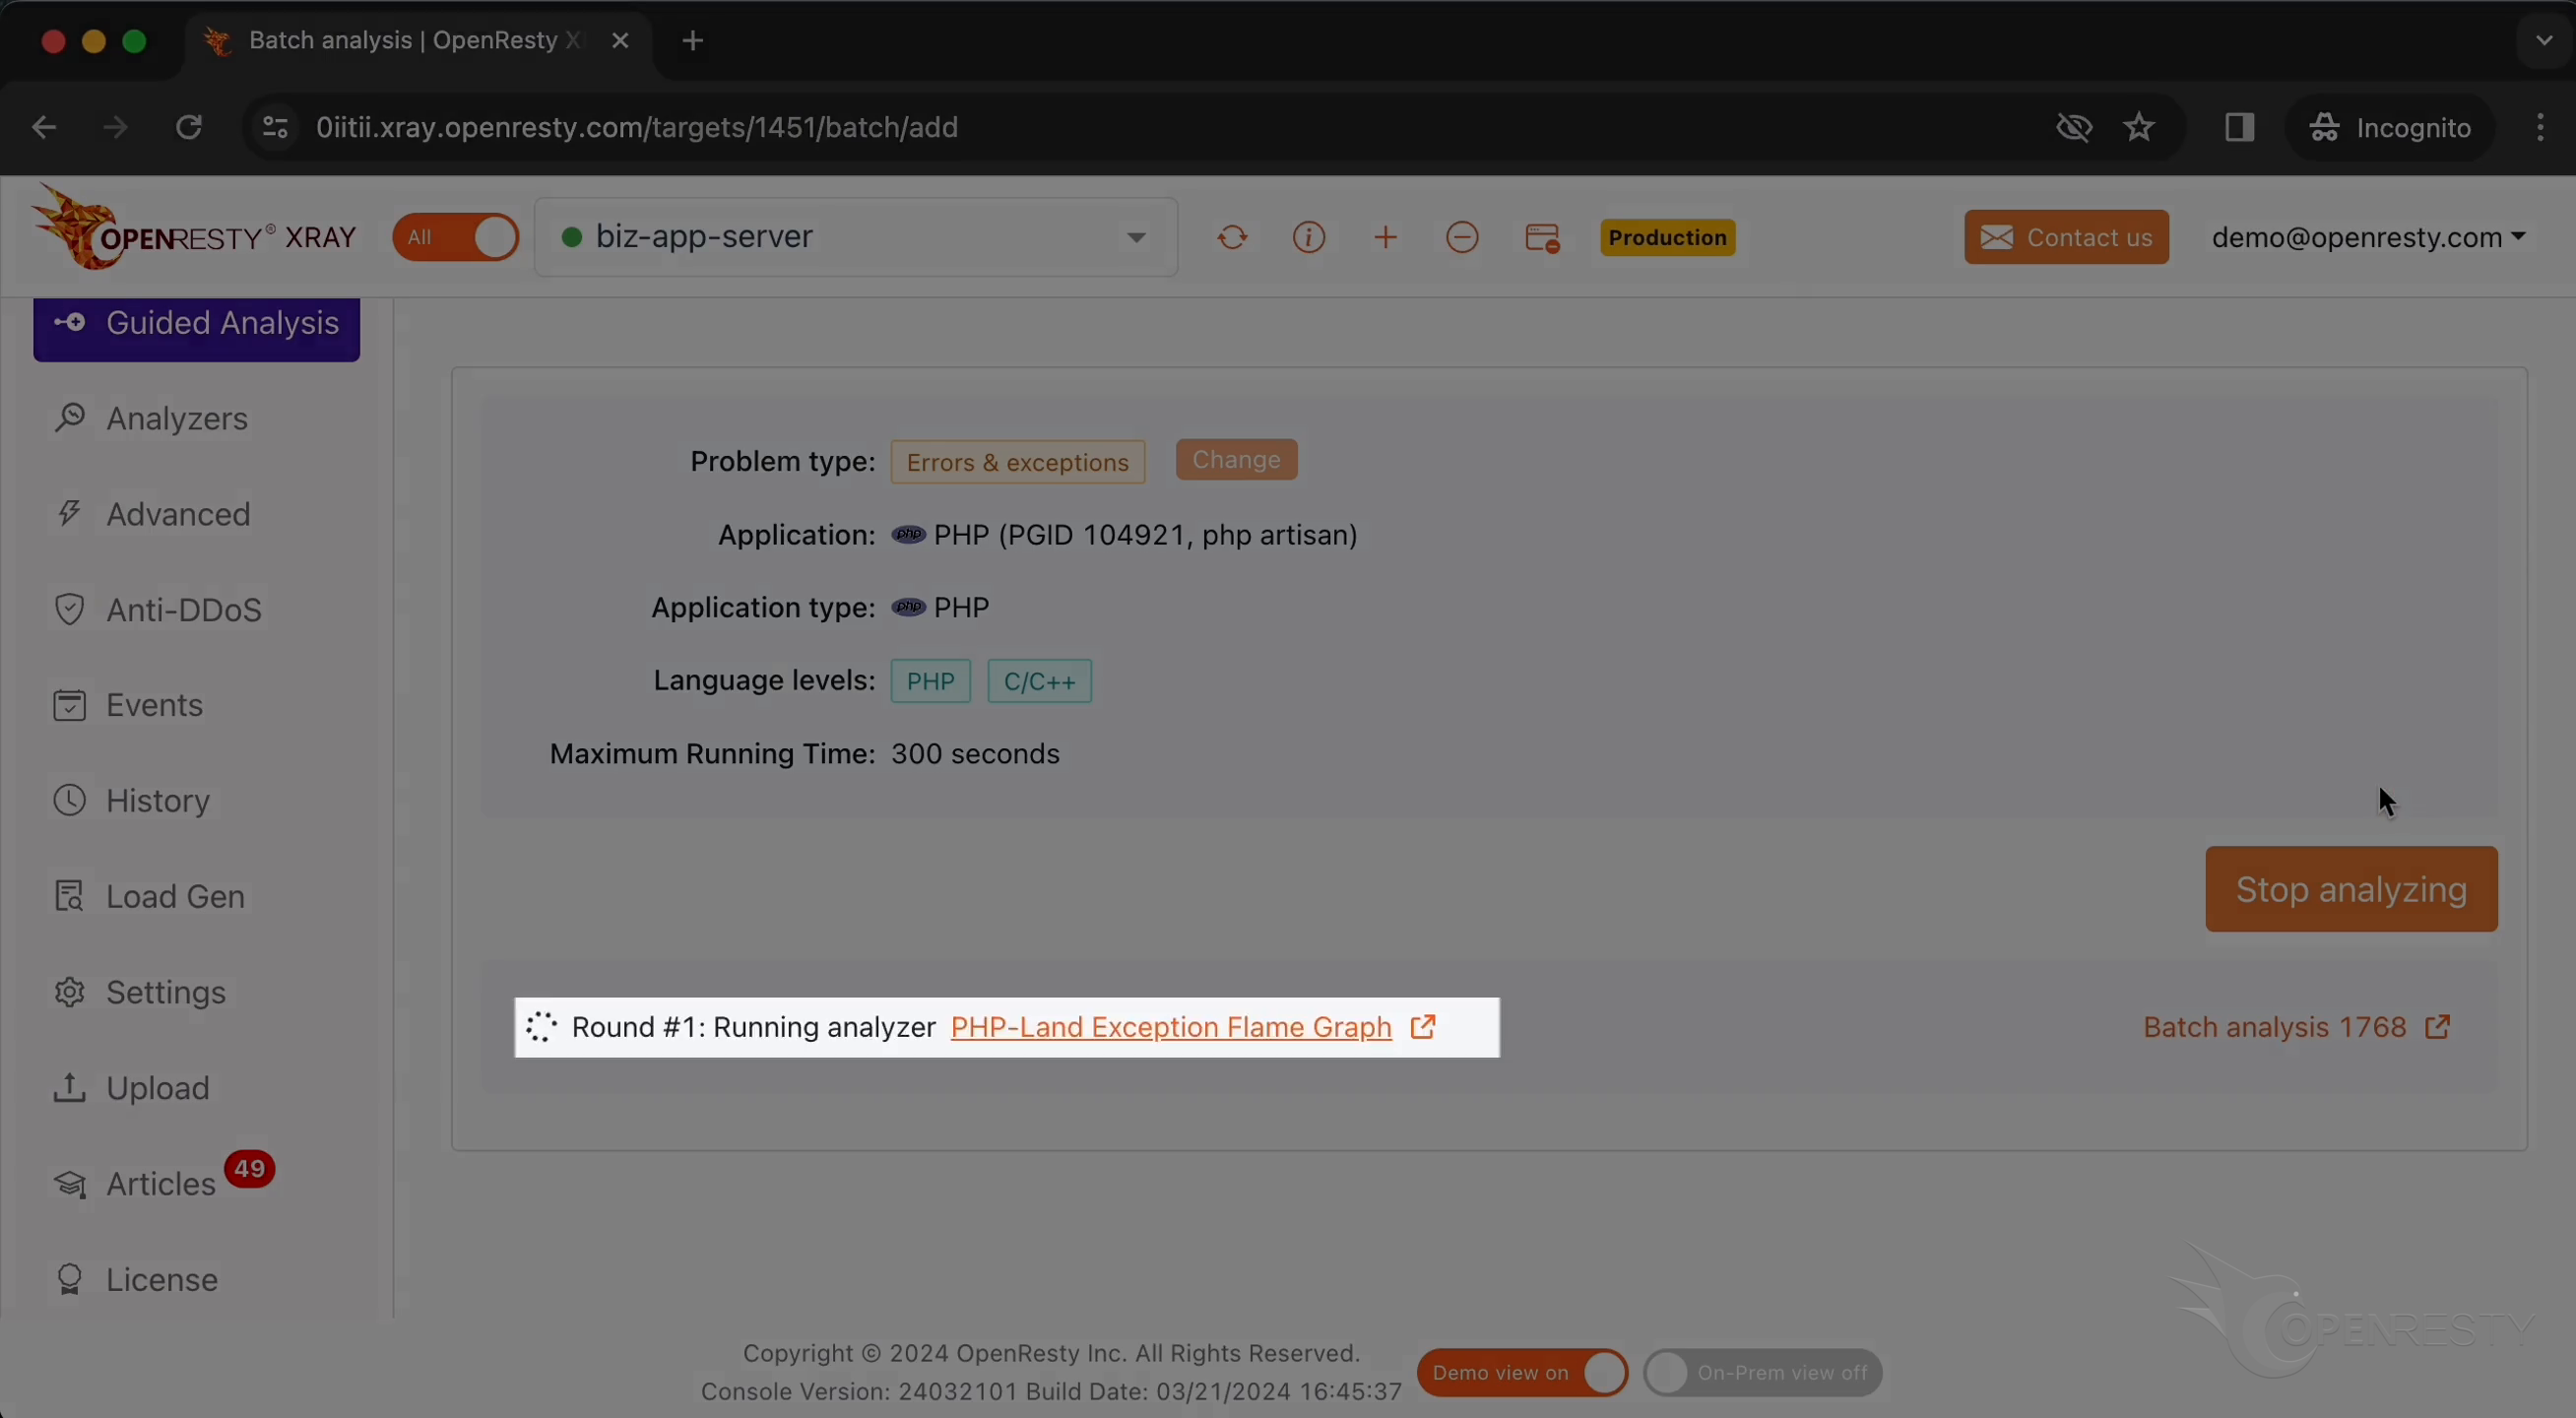
The first round is done and it’s already on the second one. That’s enough for this case.
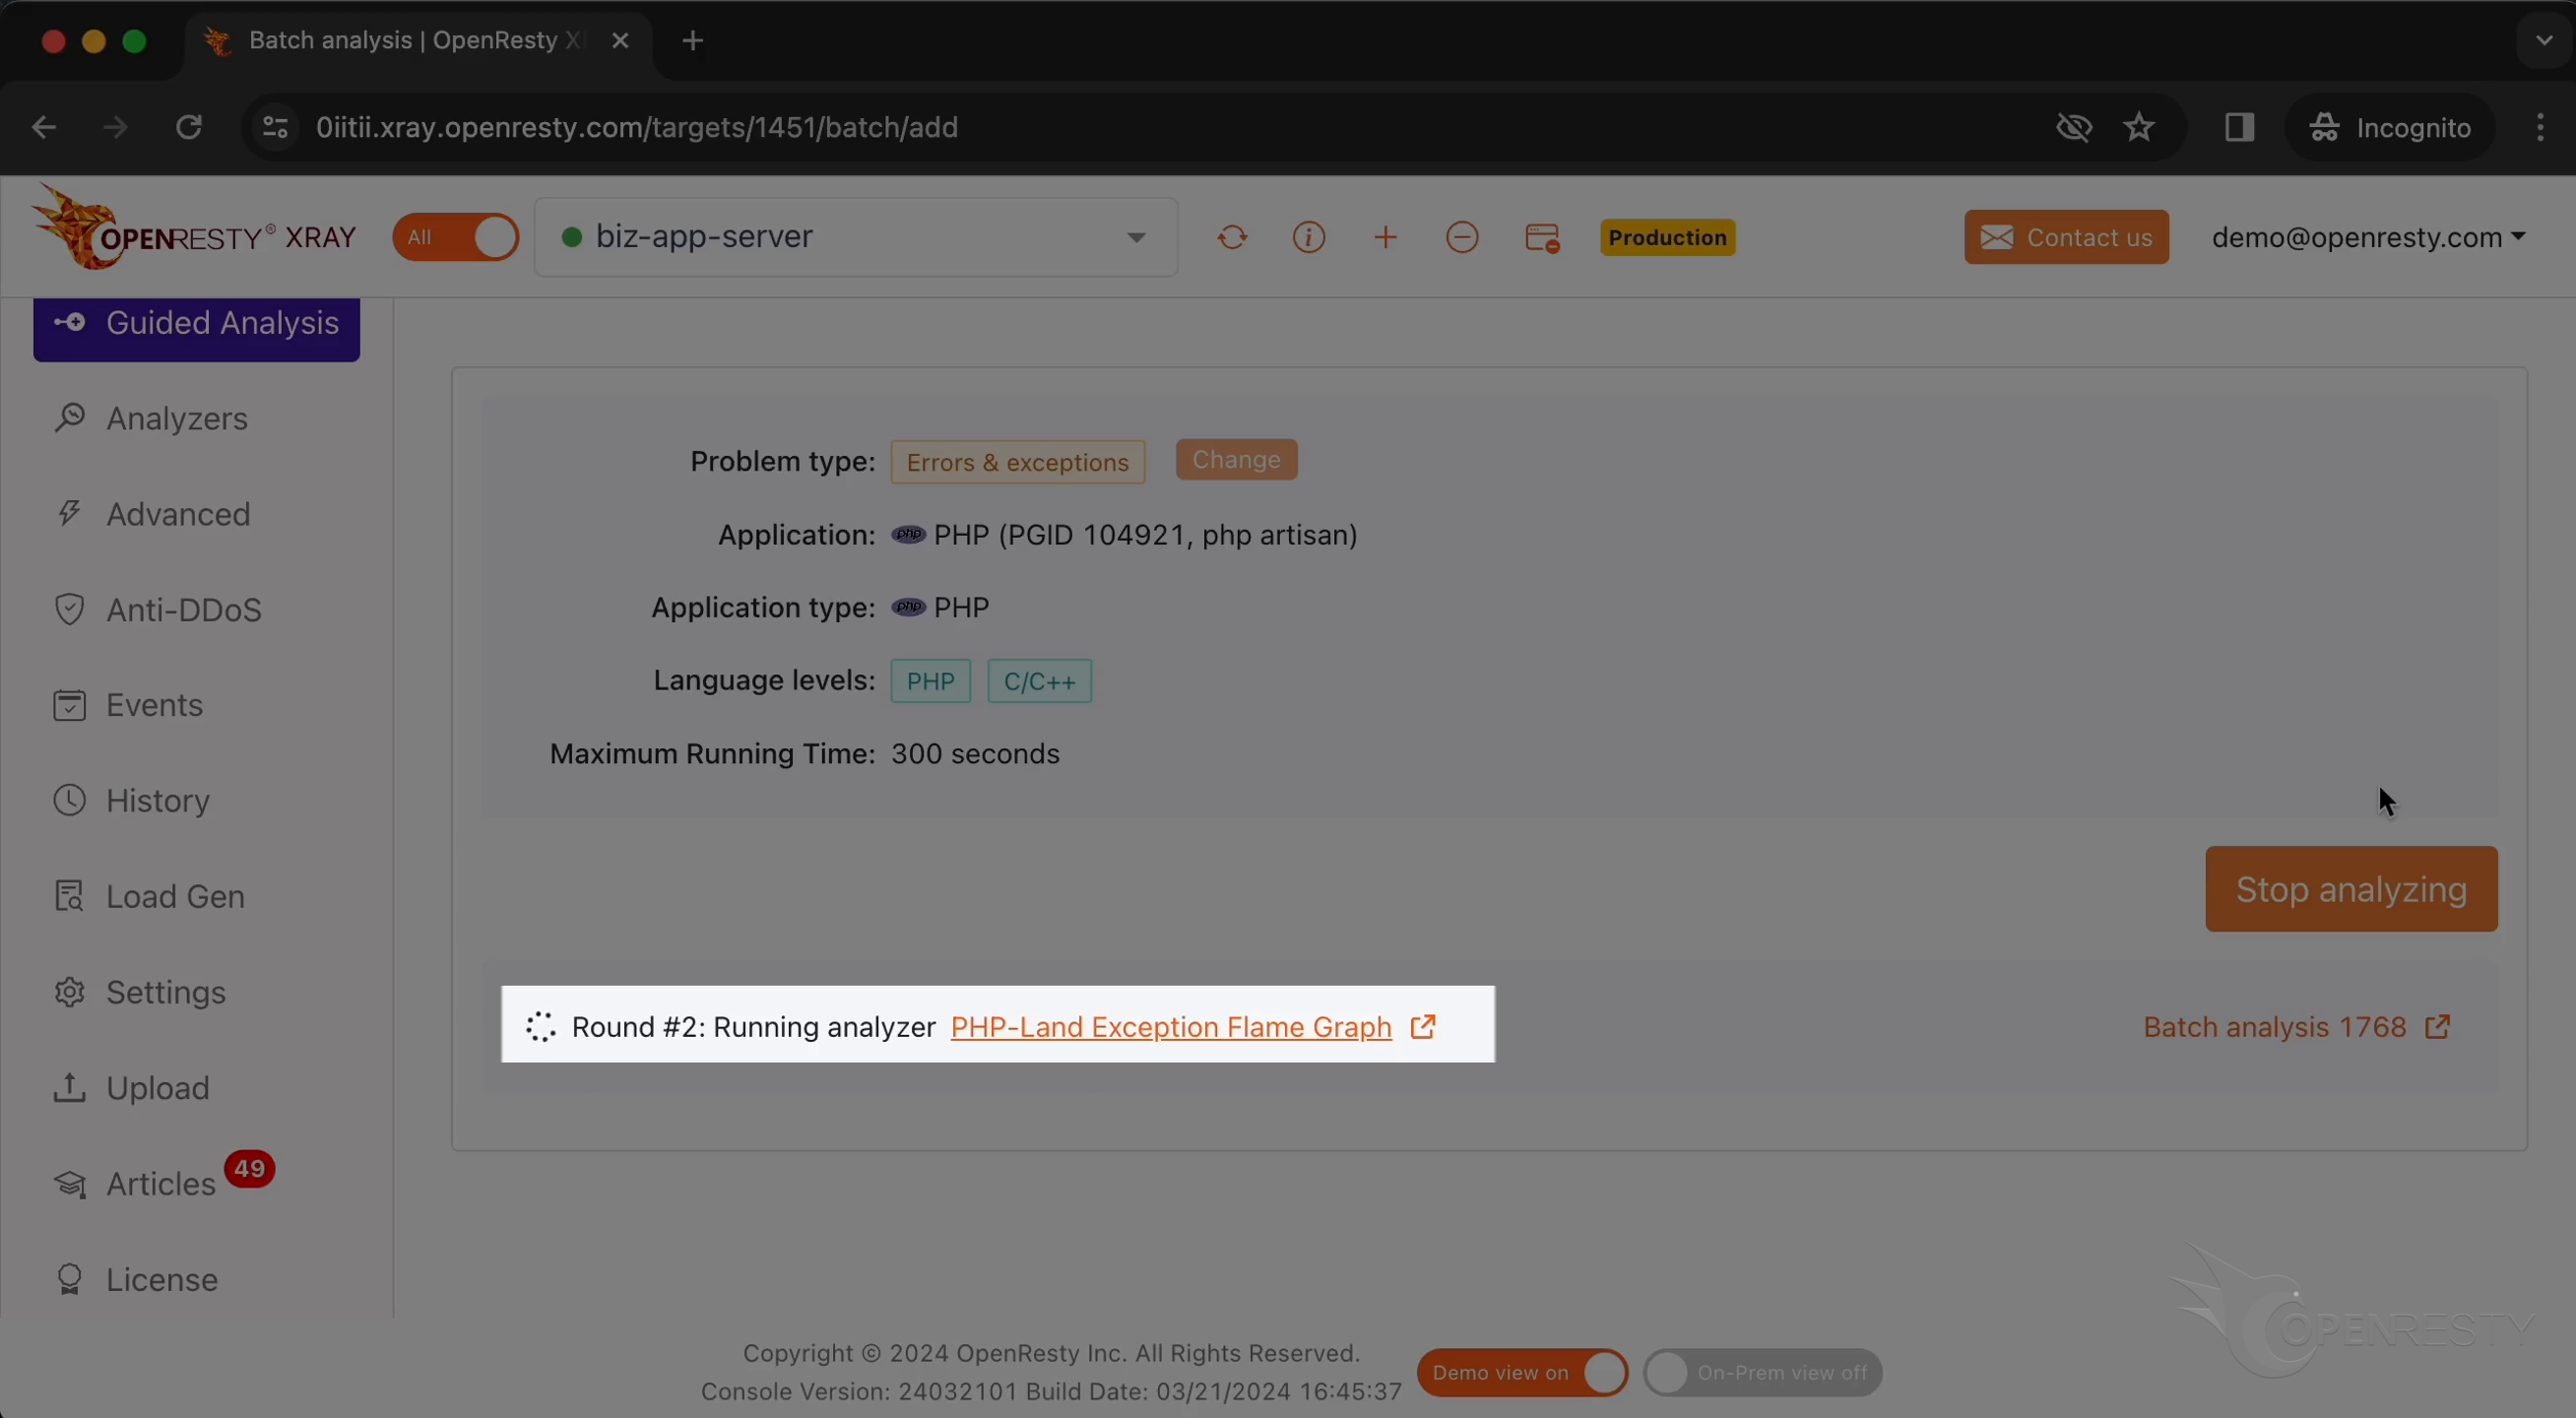
Stop analyzing.
Read the exception report and hot code path
It automatically generated an analysis report.
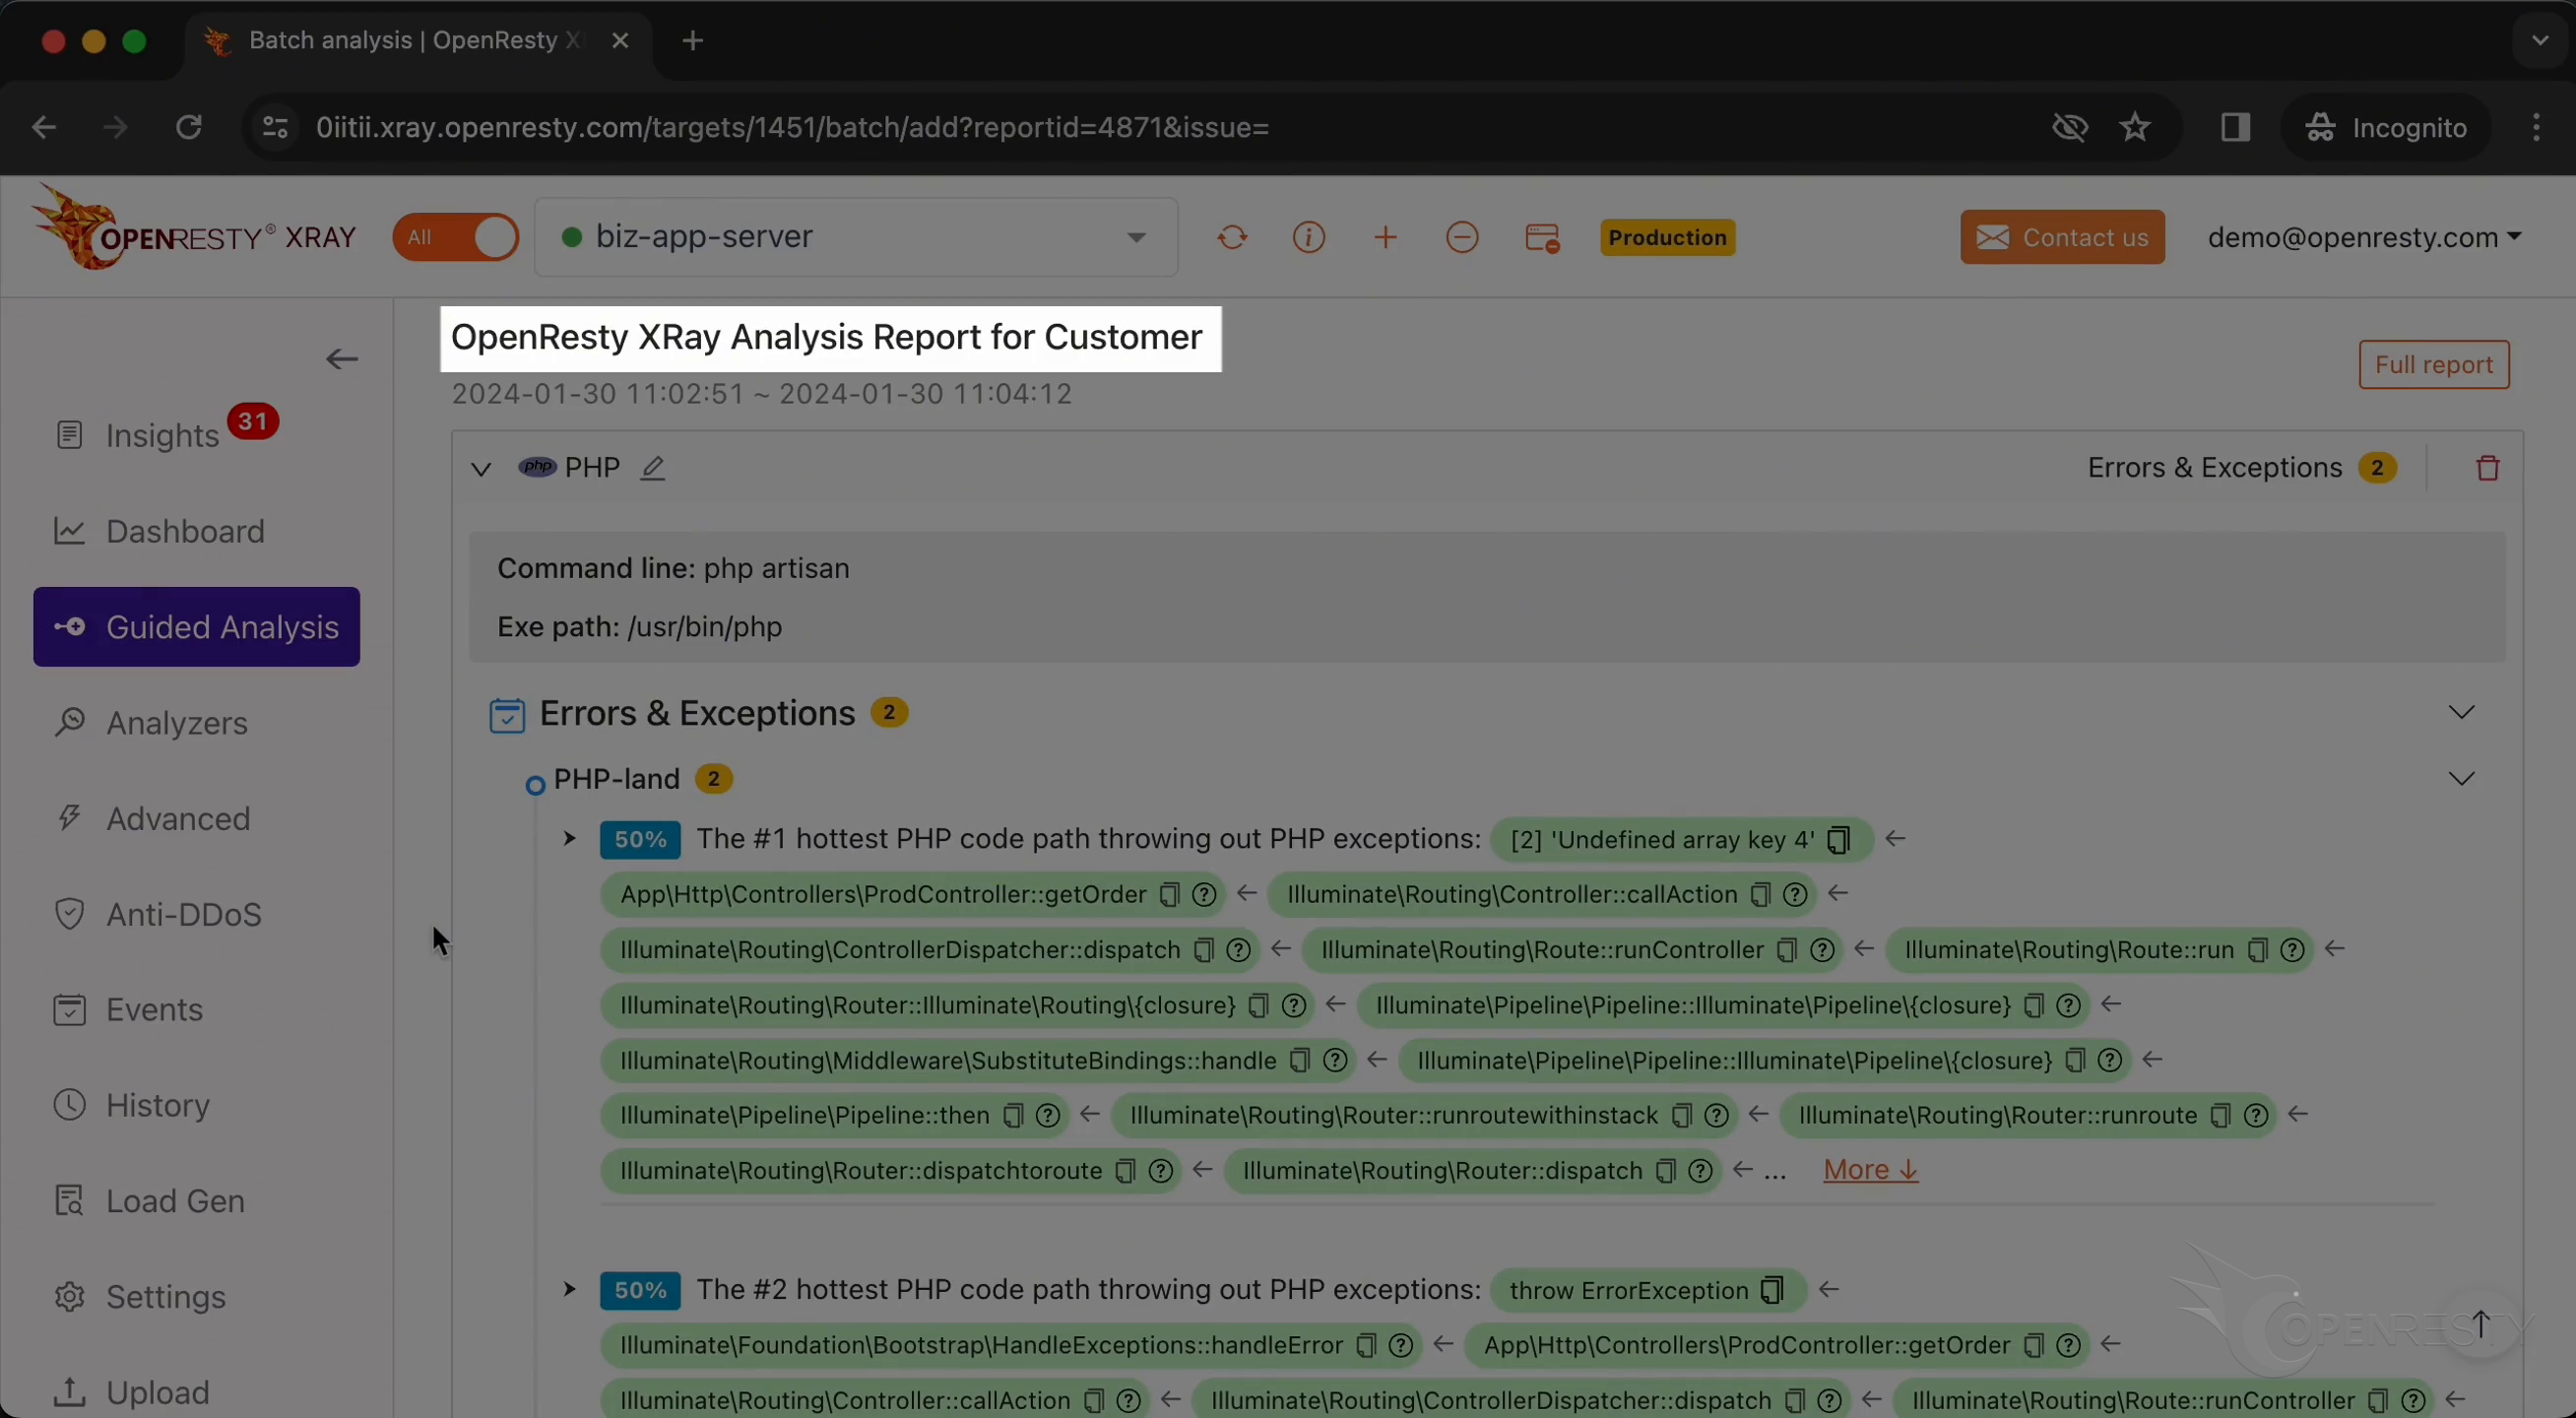
This is the type of problem we diagnose. It’s Errors & Exceptions.
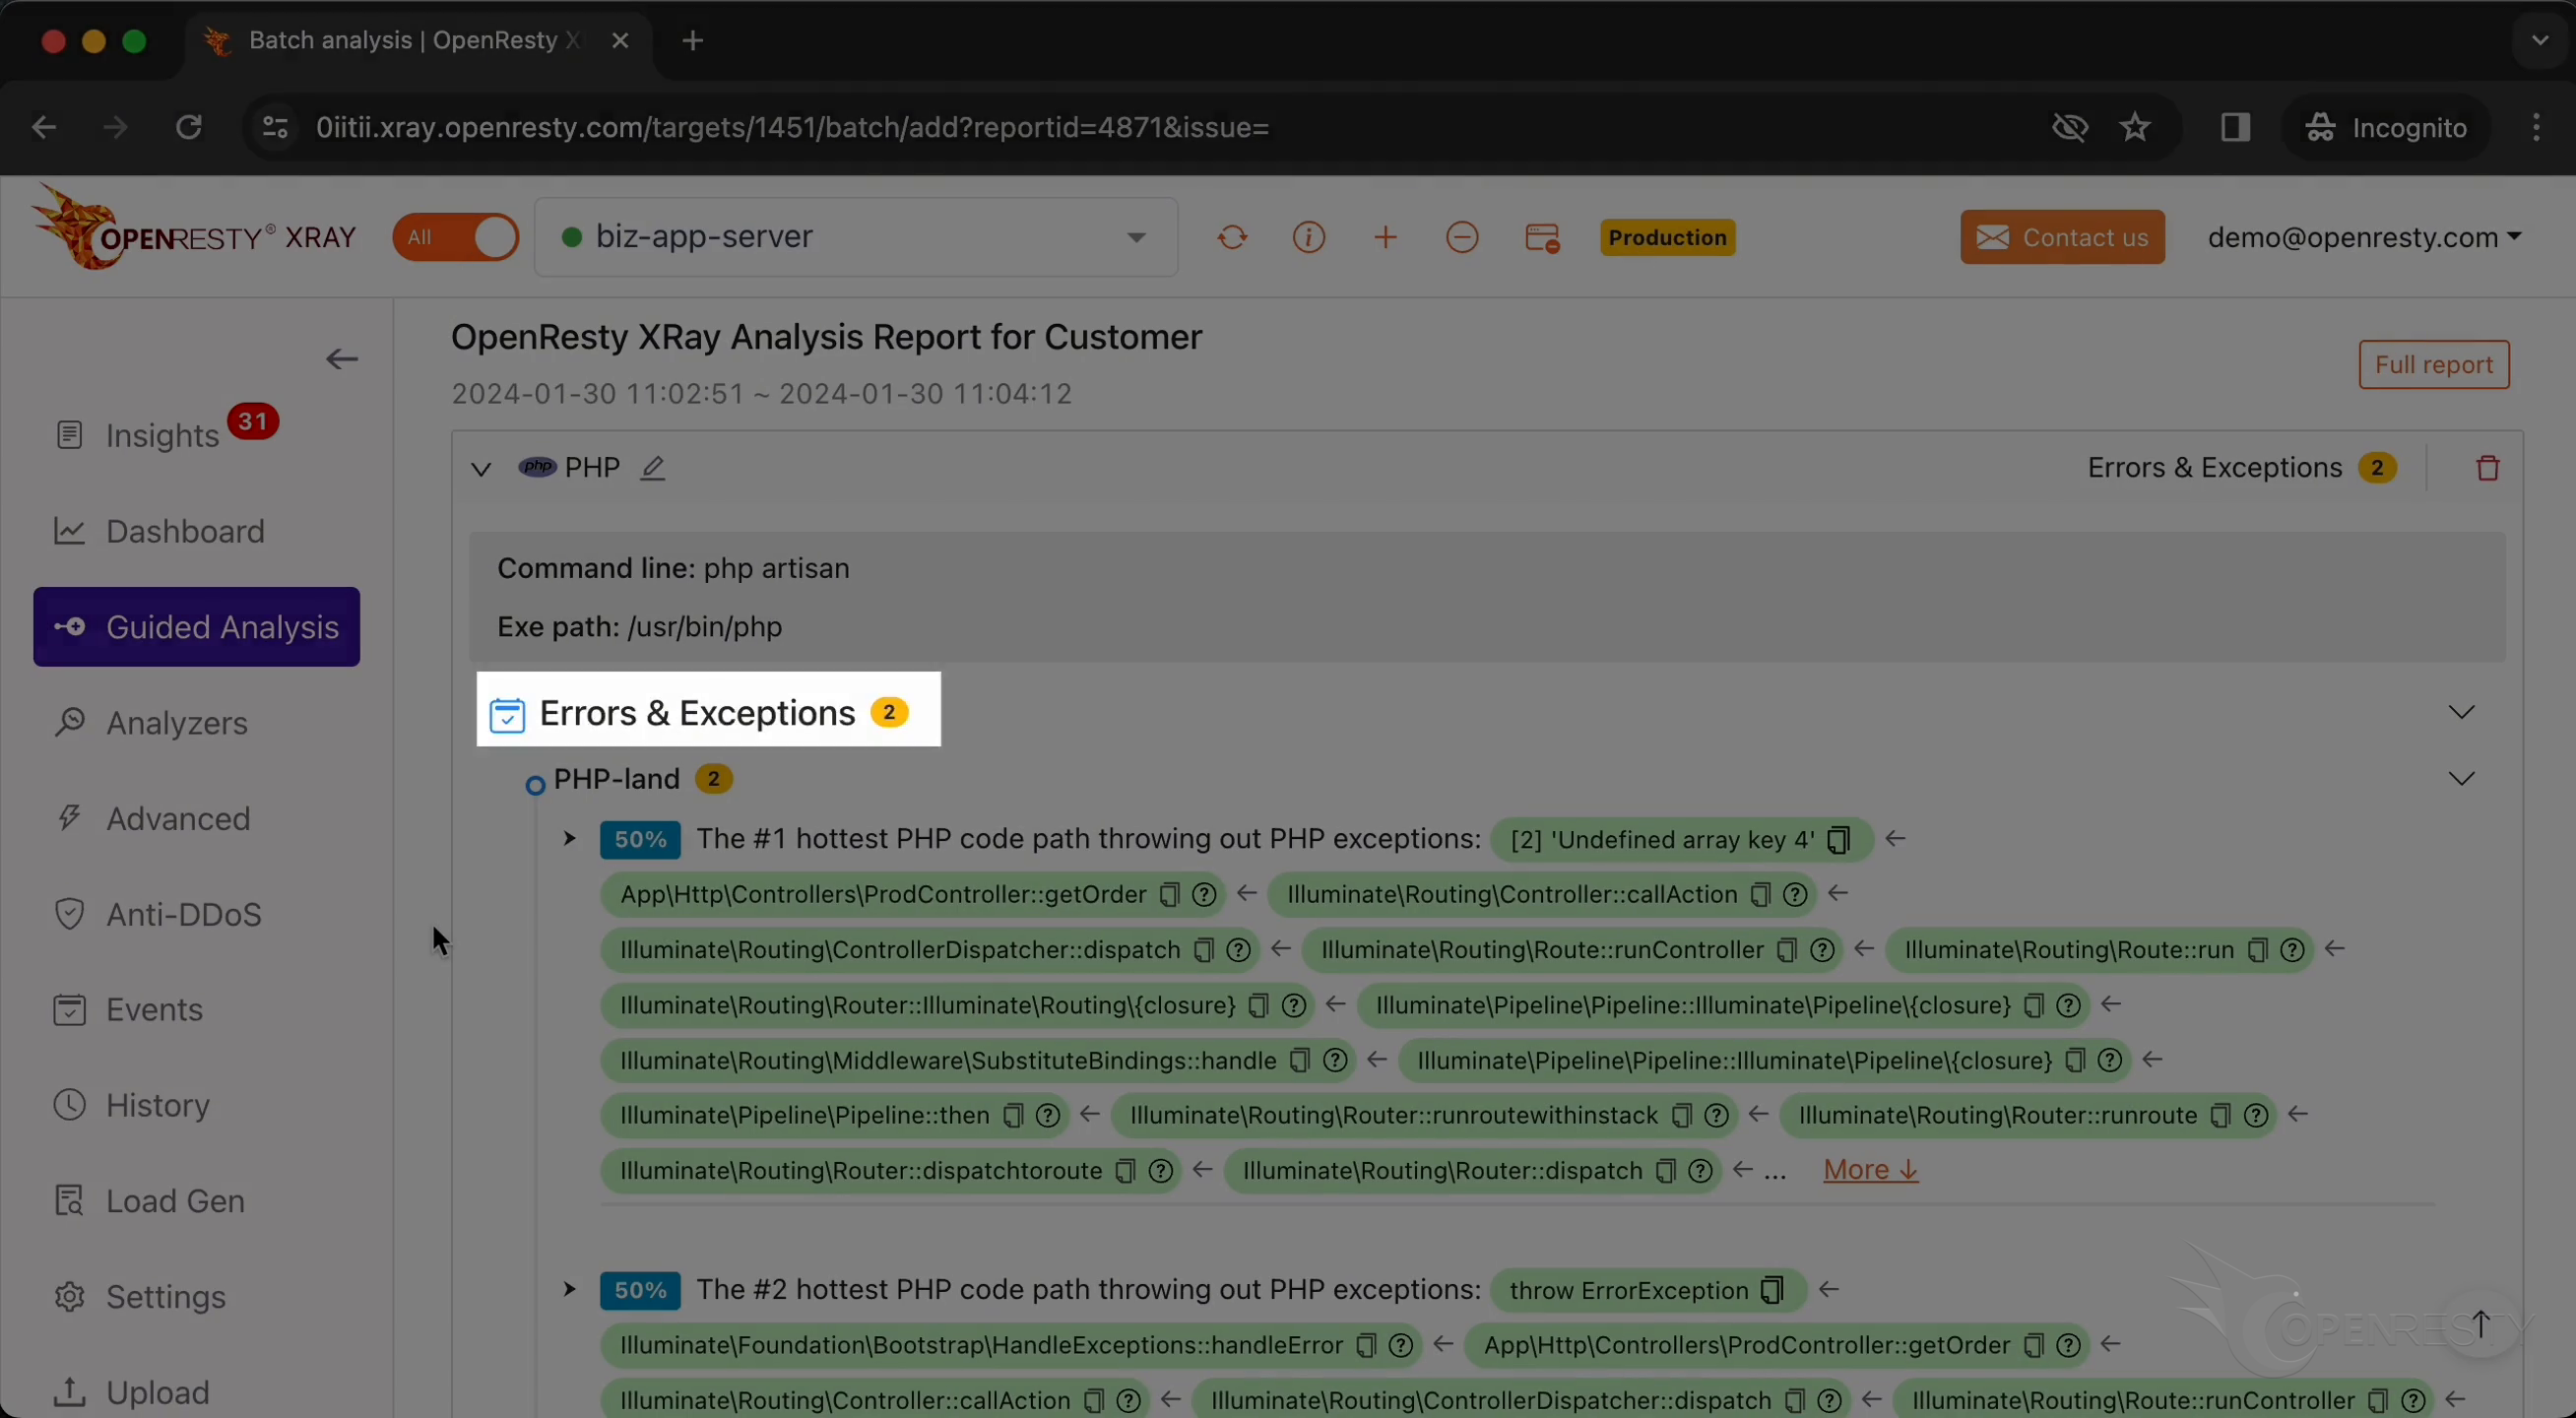
This refers to PHP code paths. We can see it displays the code paths that throw the most exceptions.
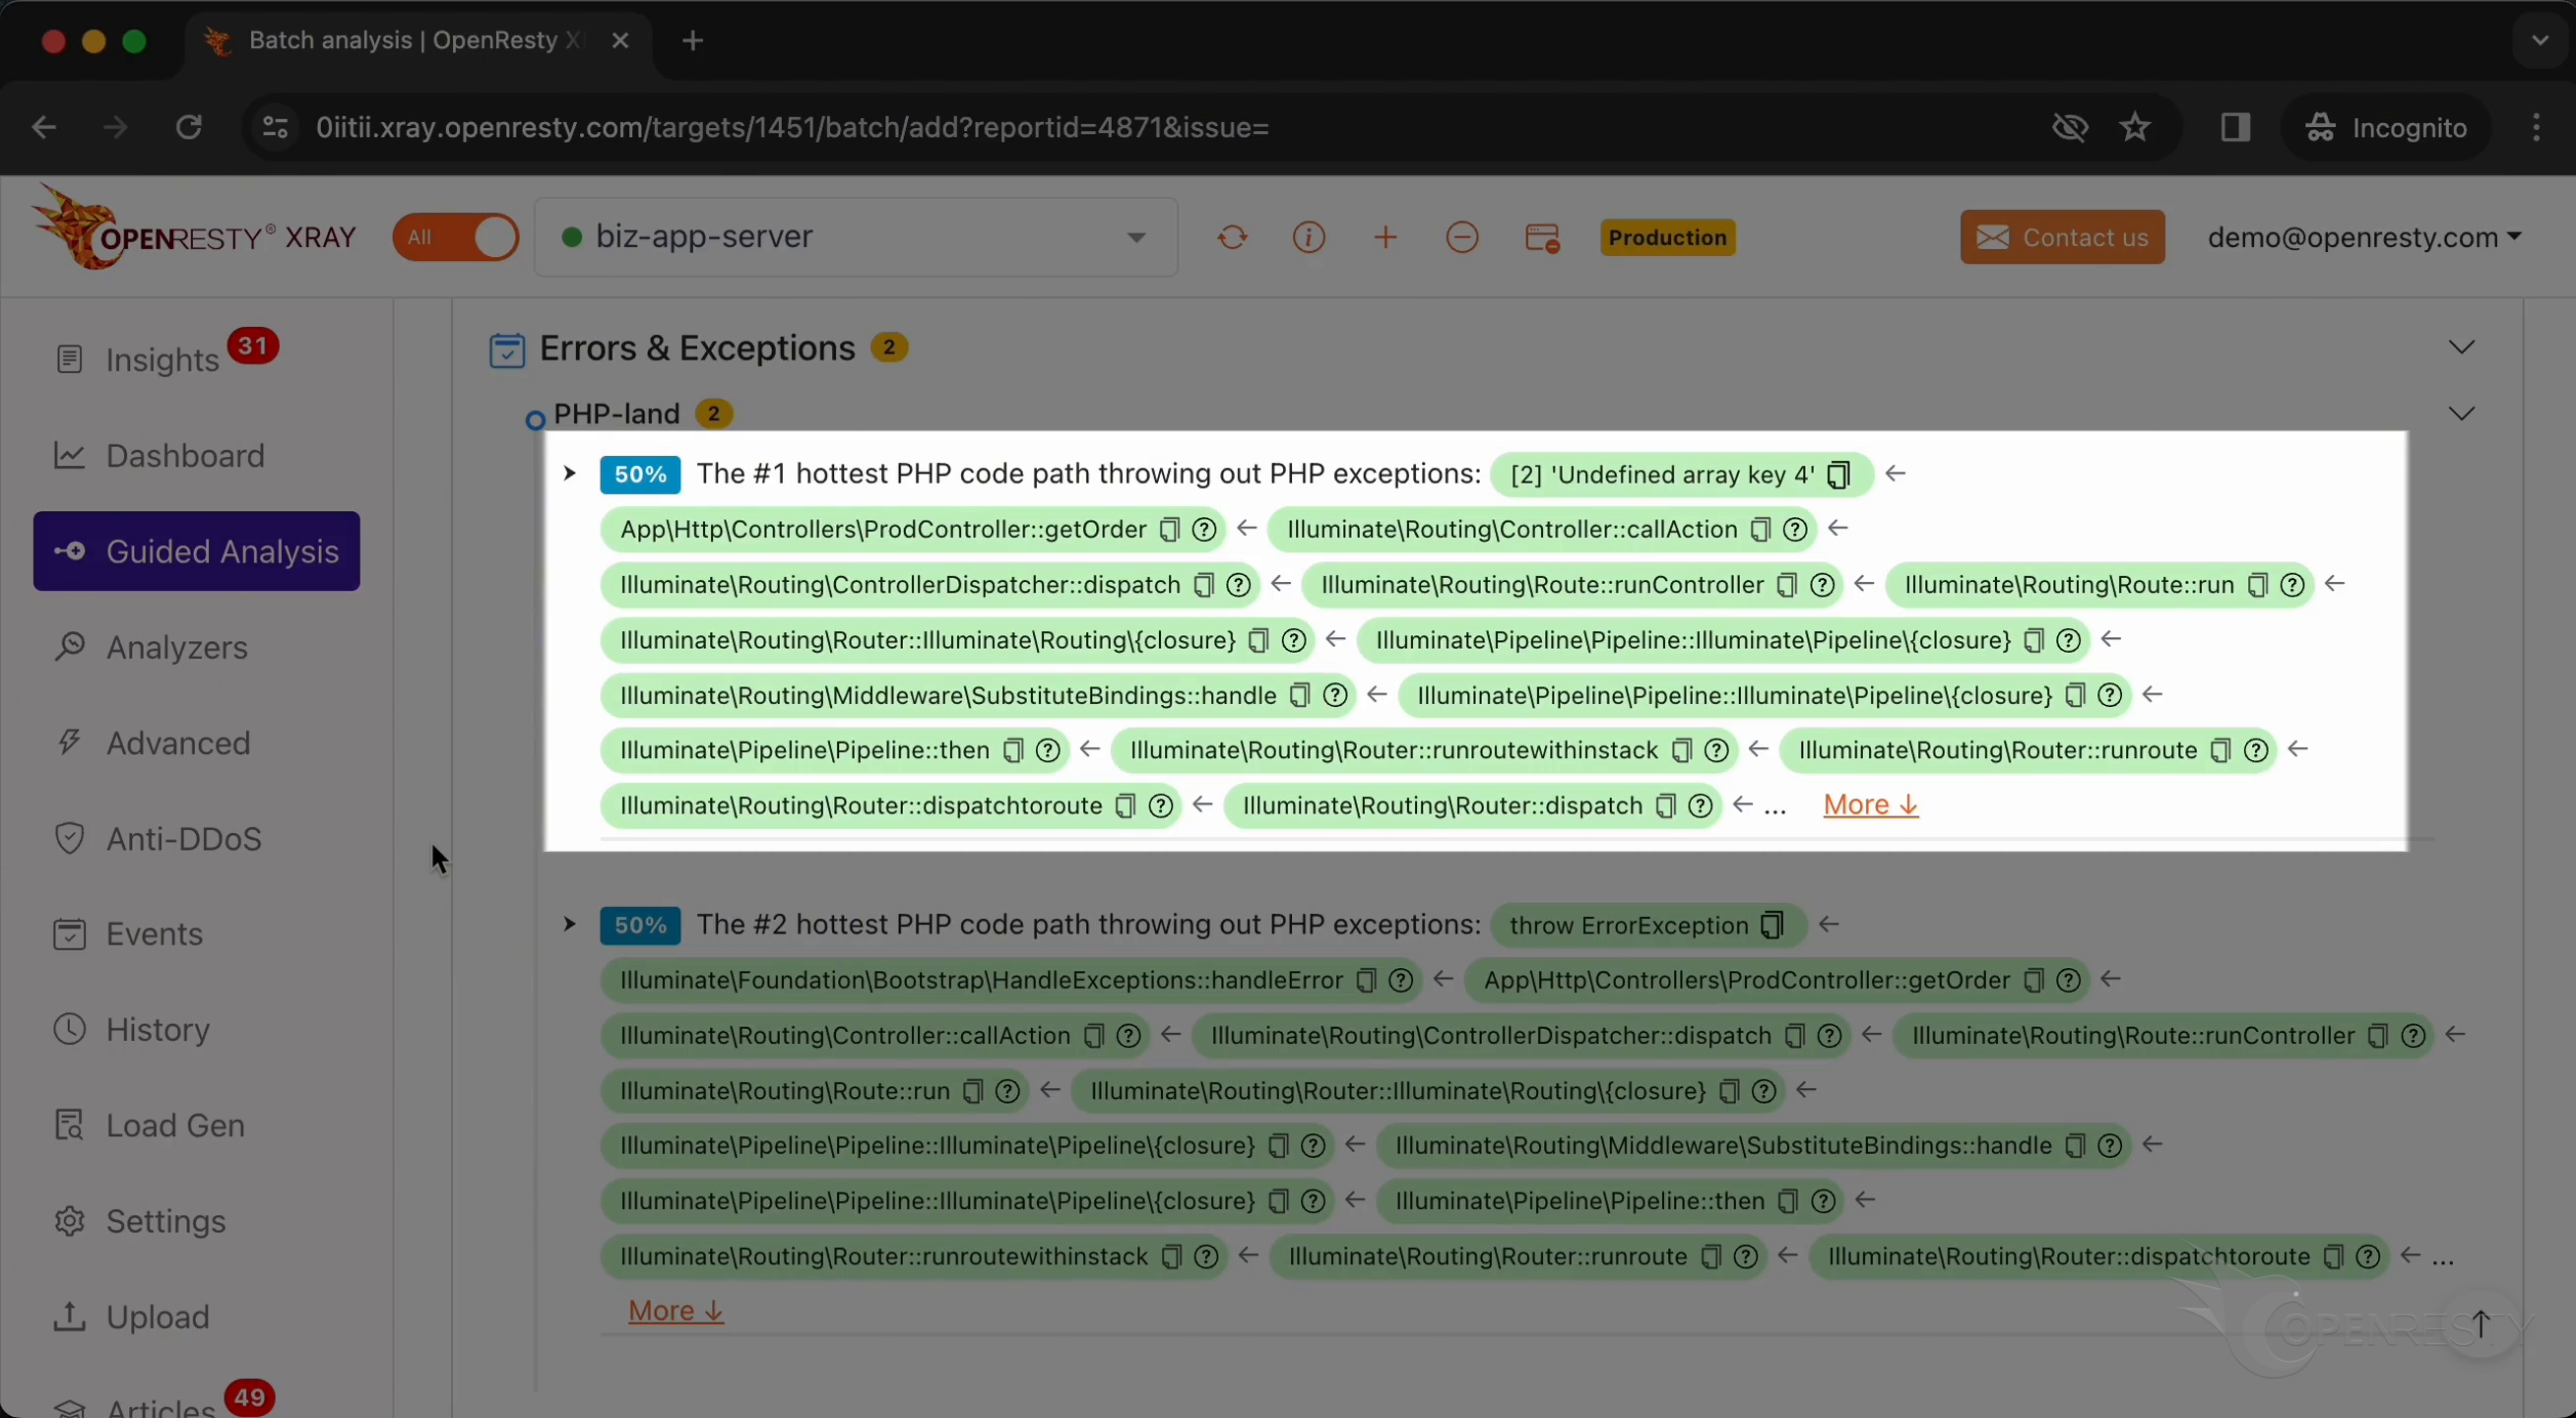
First, we can observe an error showing an out-of-bound array access.
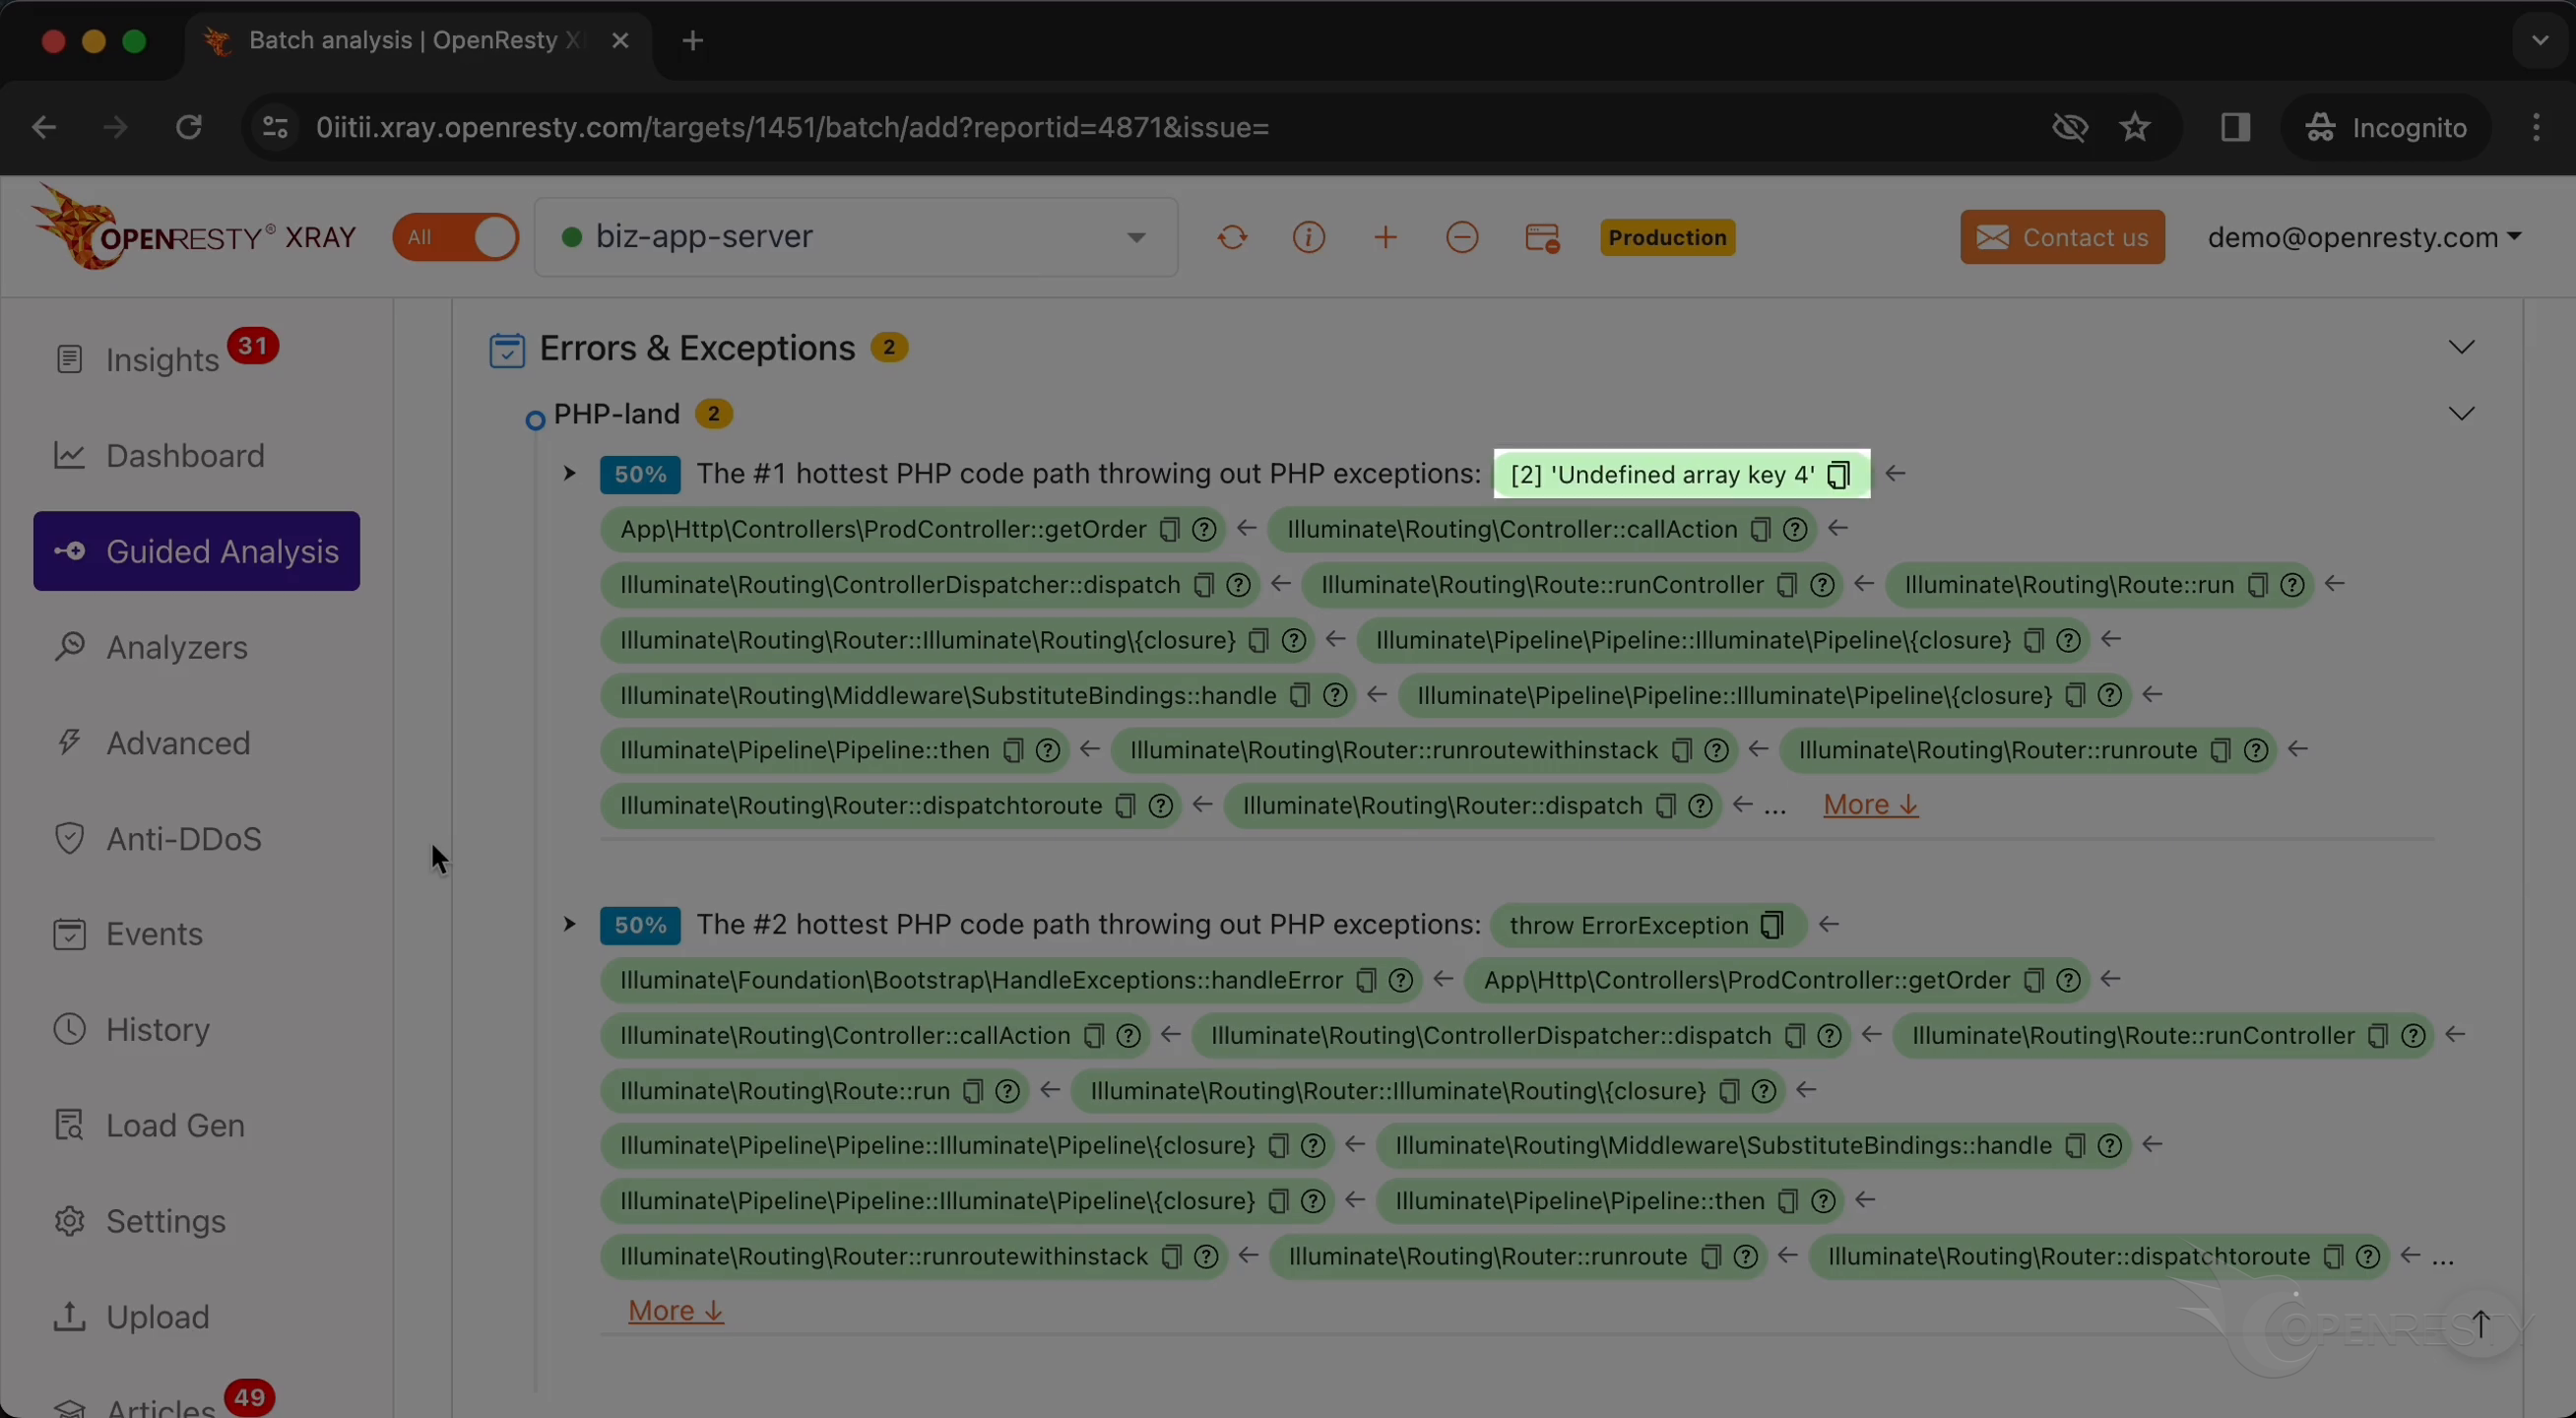
This error occurred within the business code in the function getOrder.
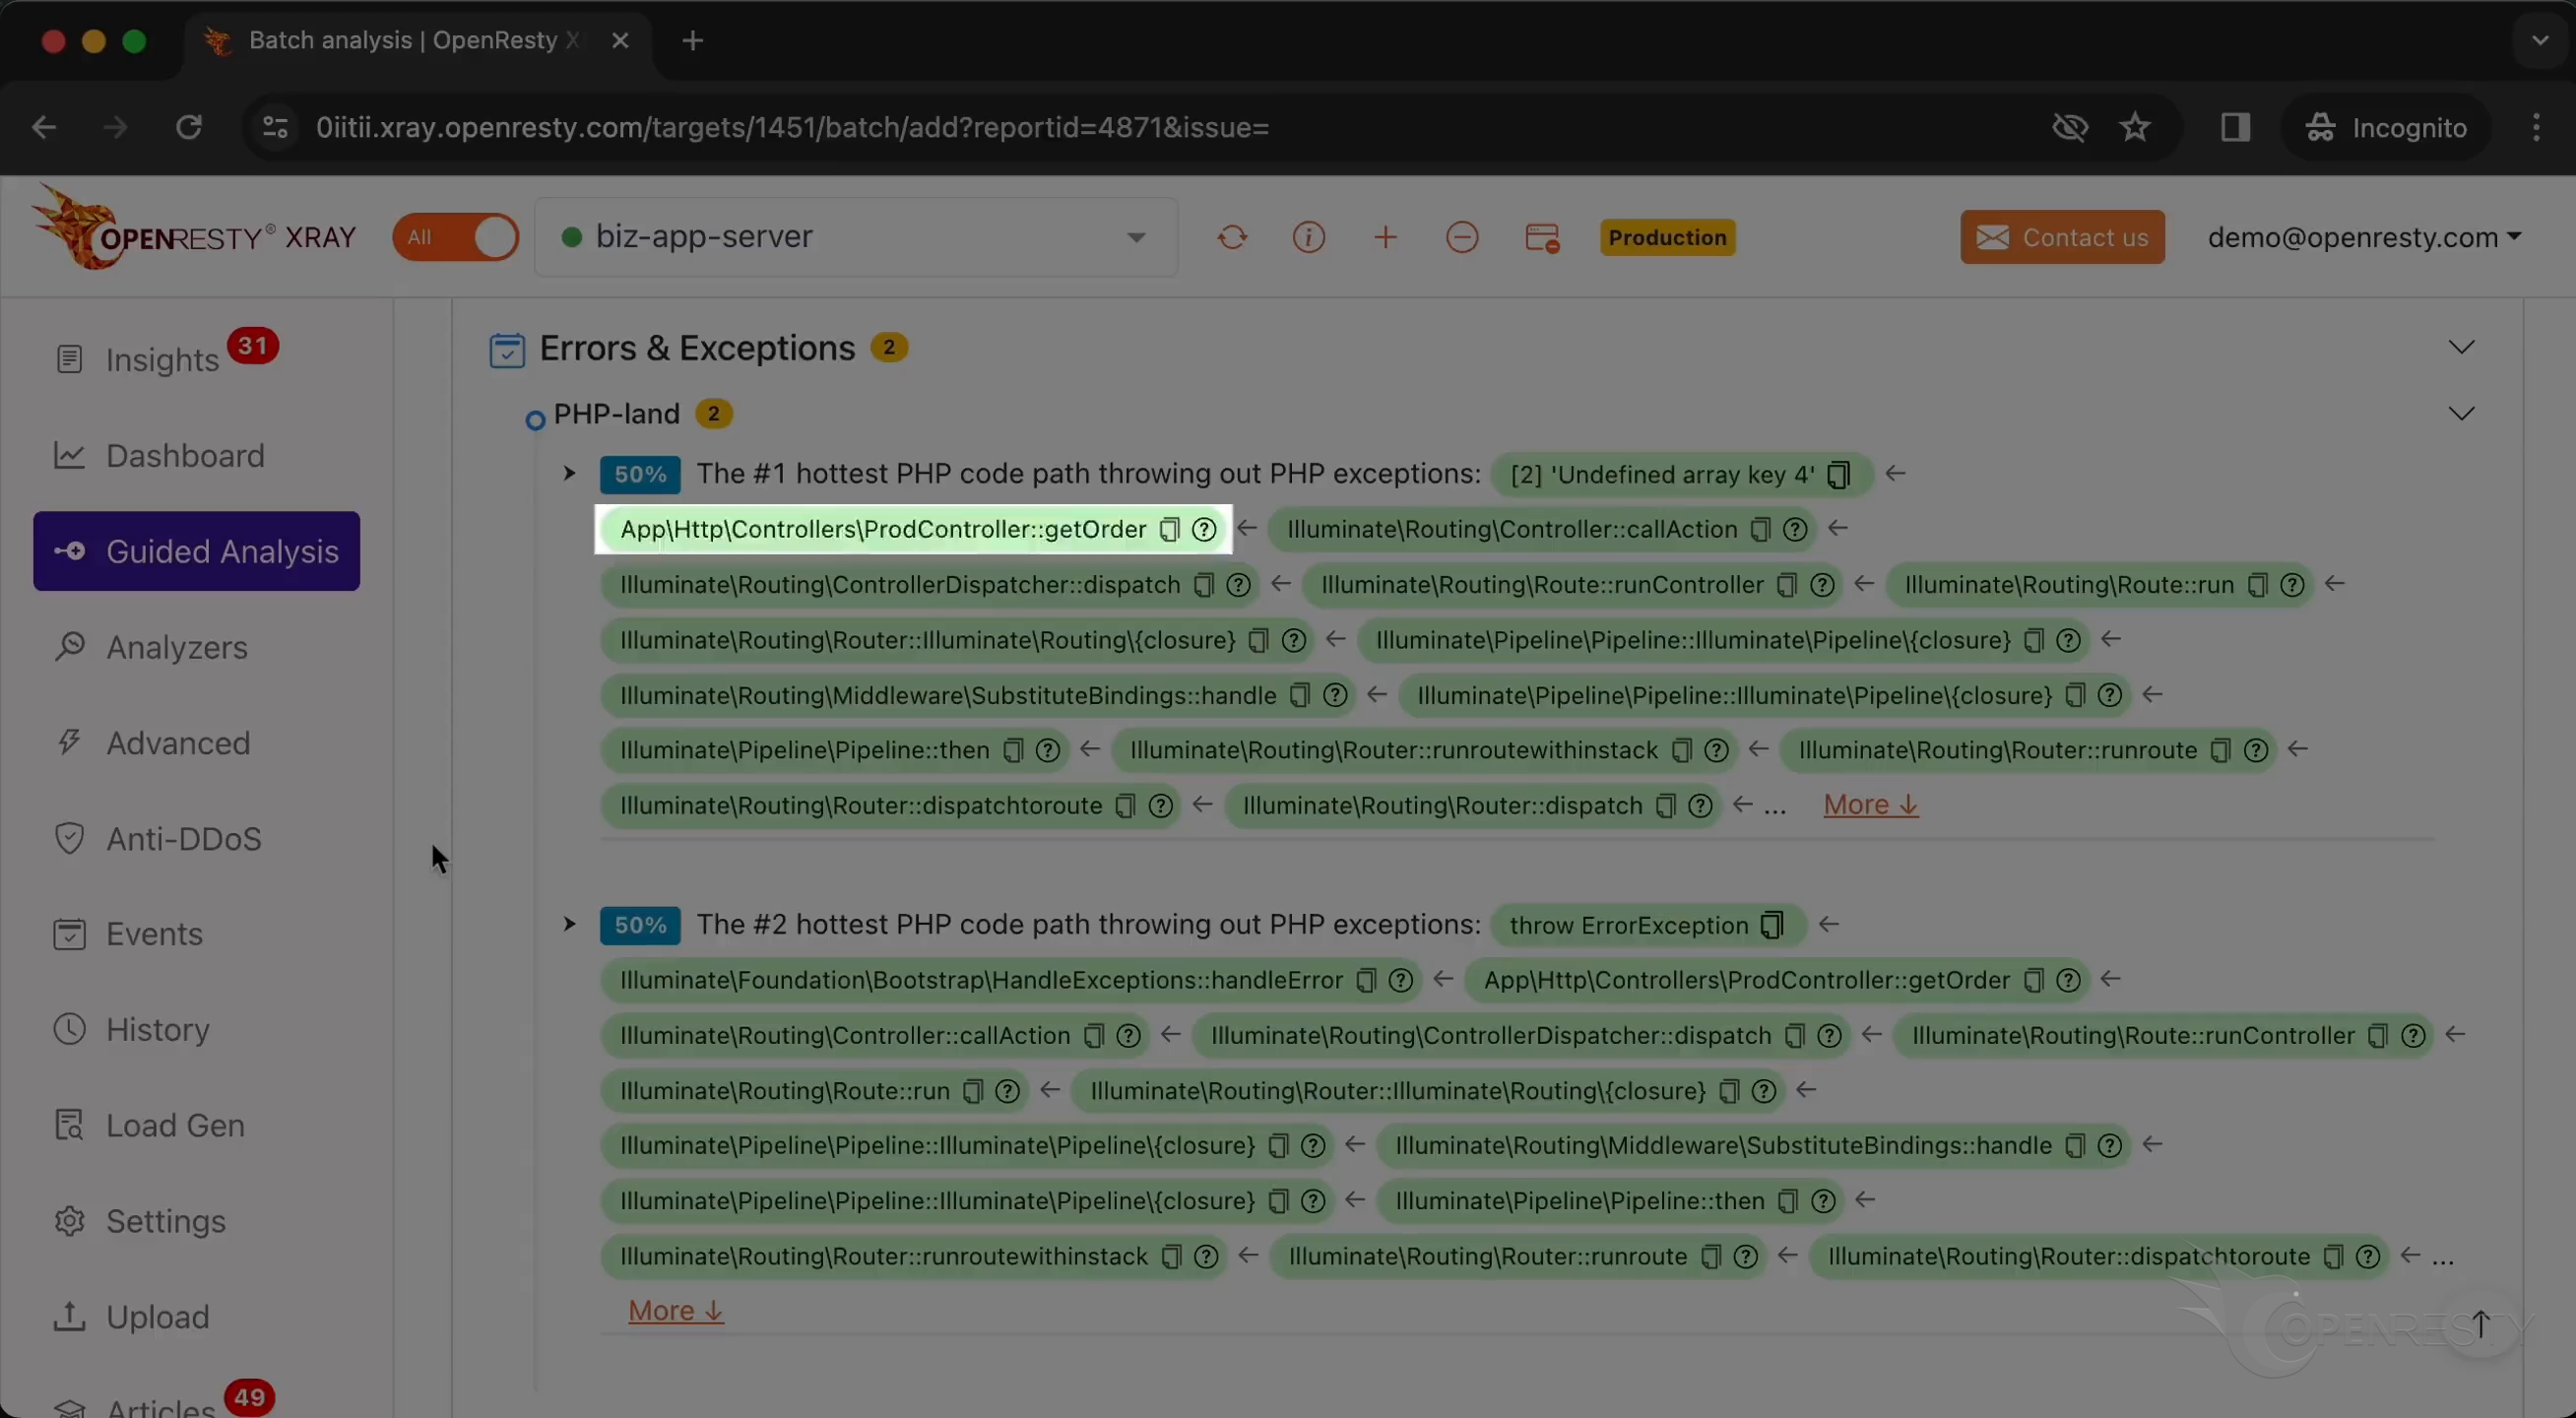
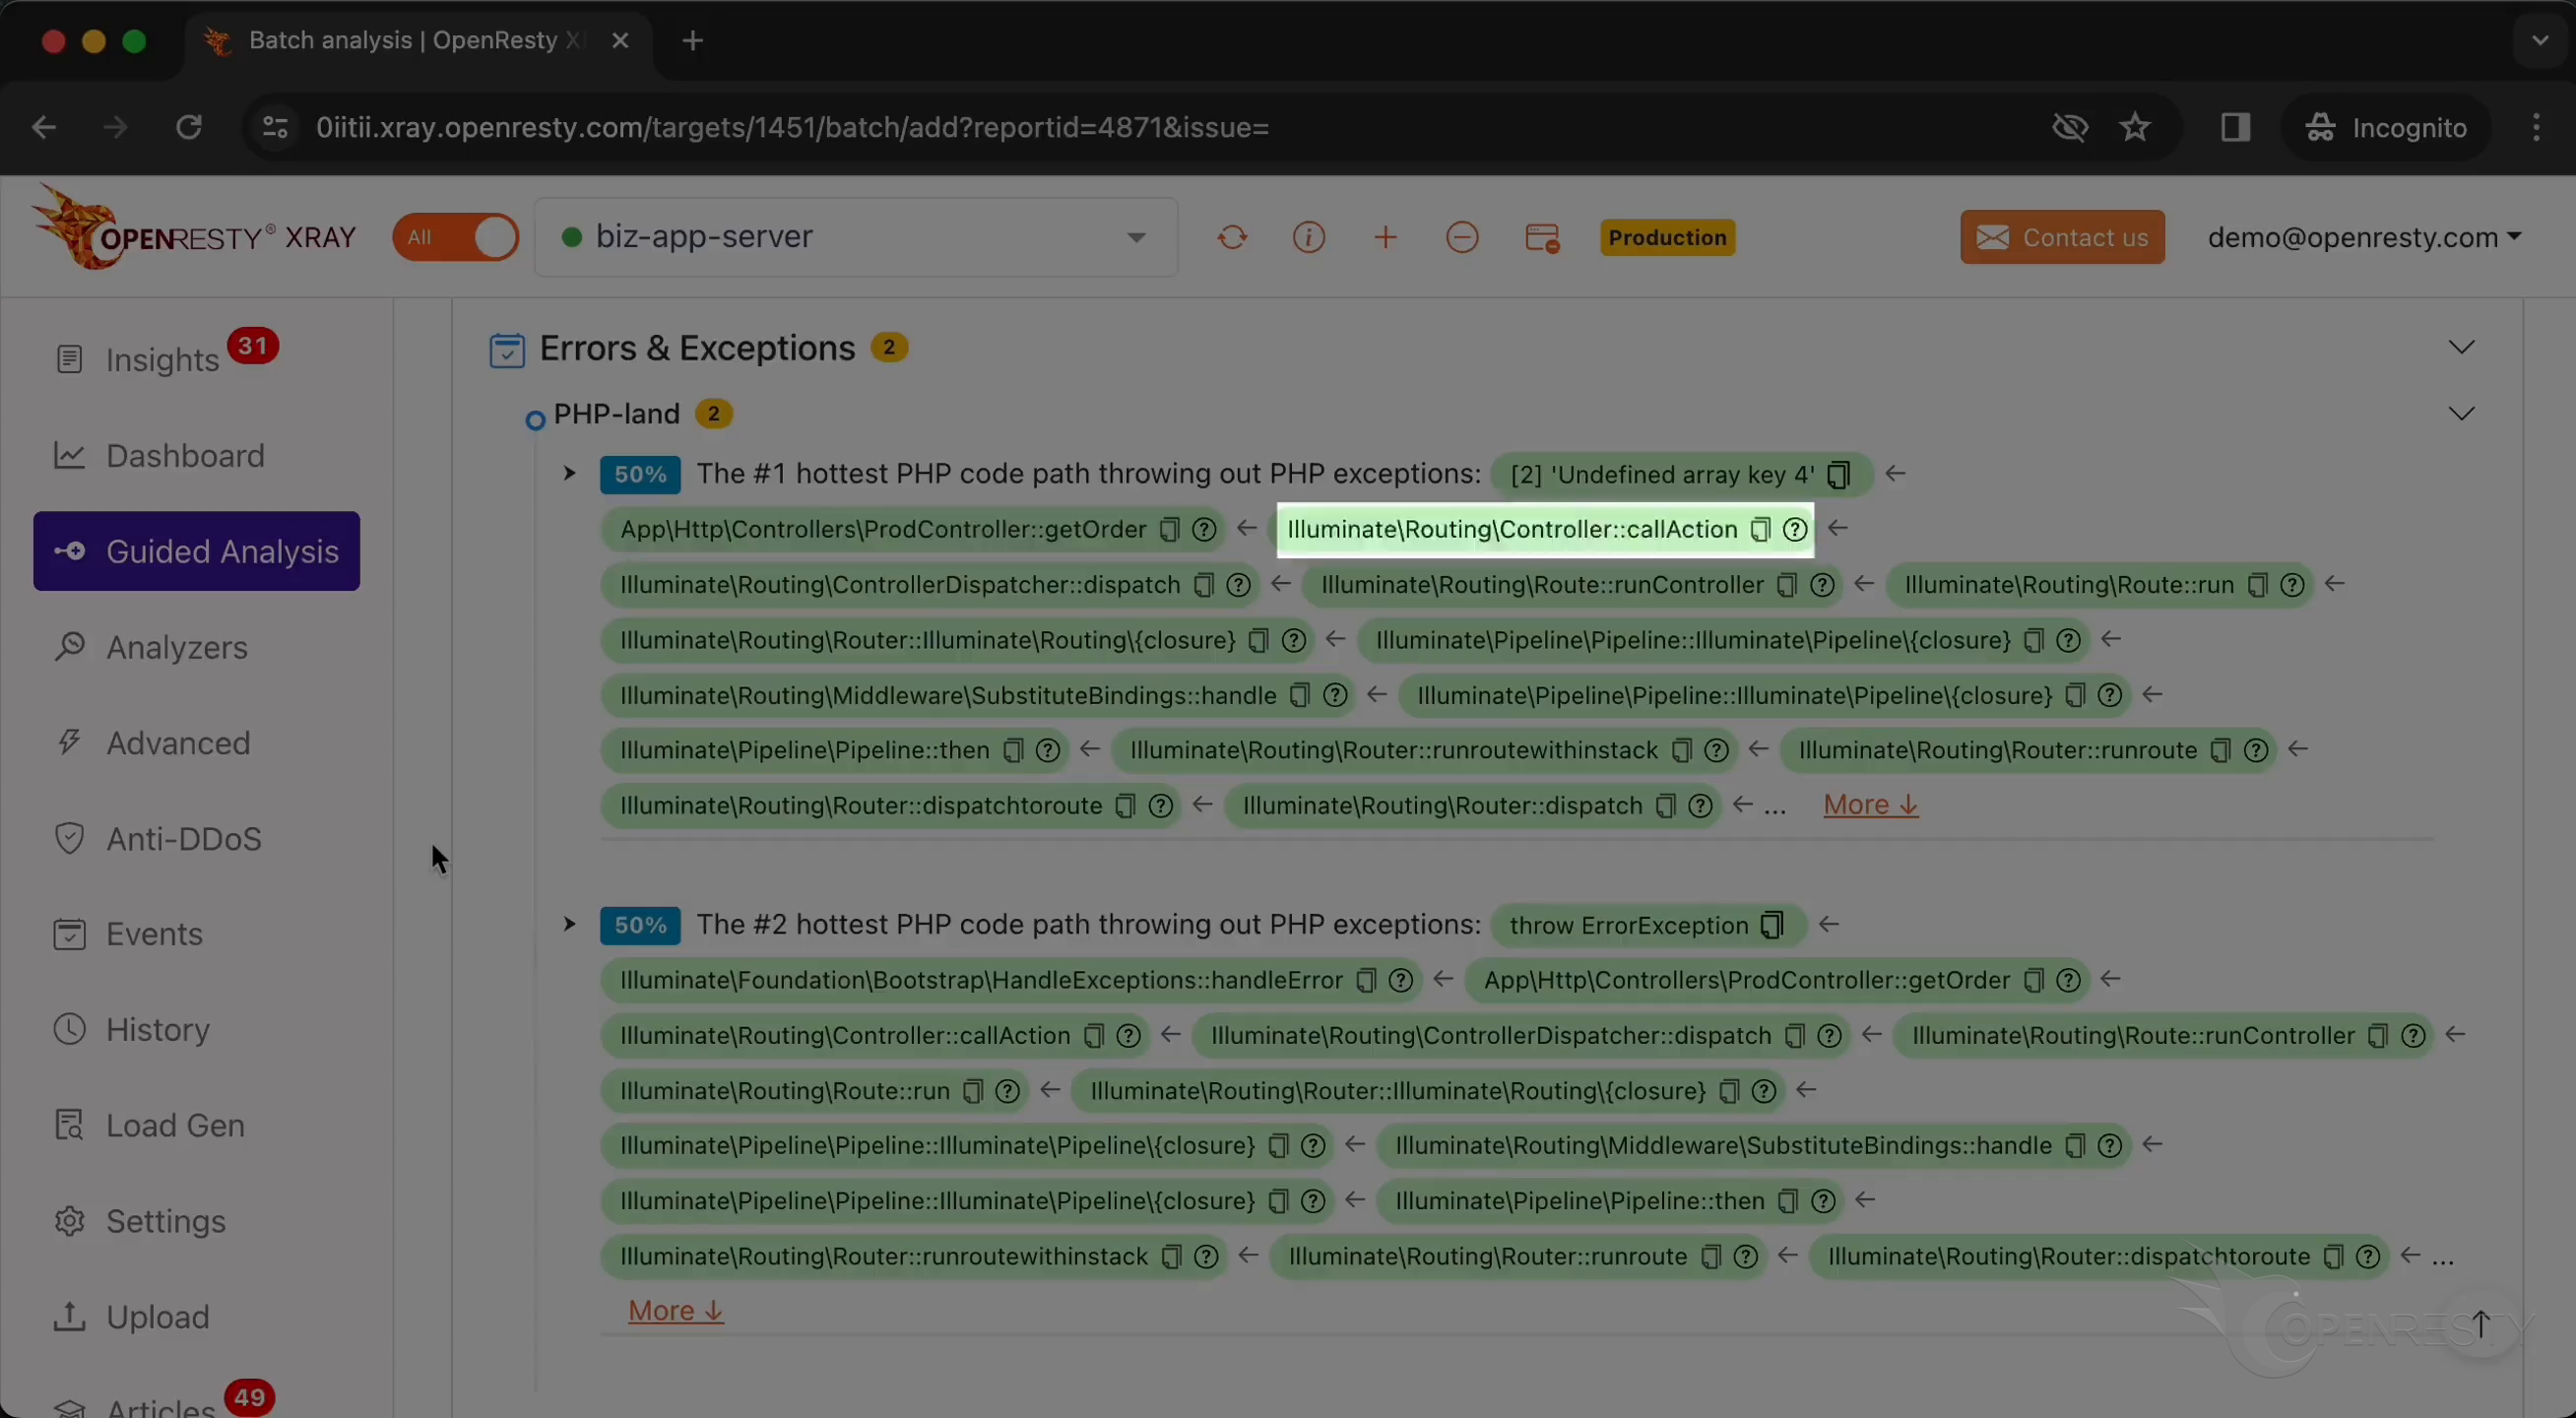
The Laravel routing component automatically calls the controller method callAction to execute the corresponding business code.
Click on “More”.
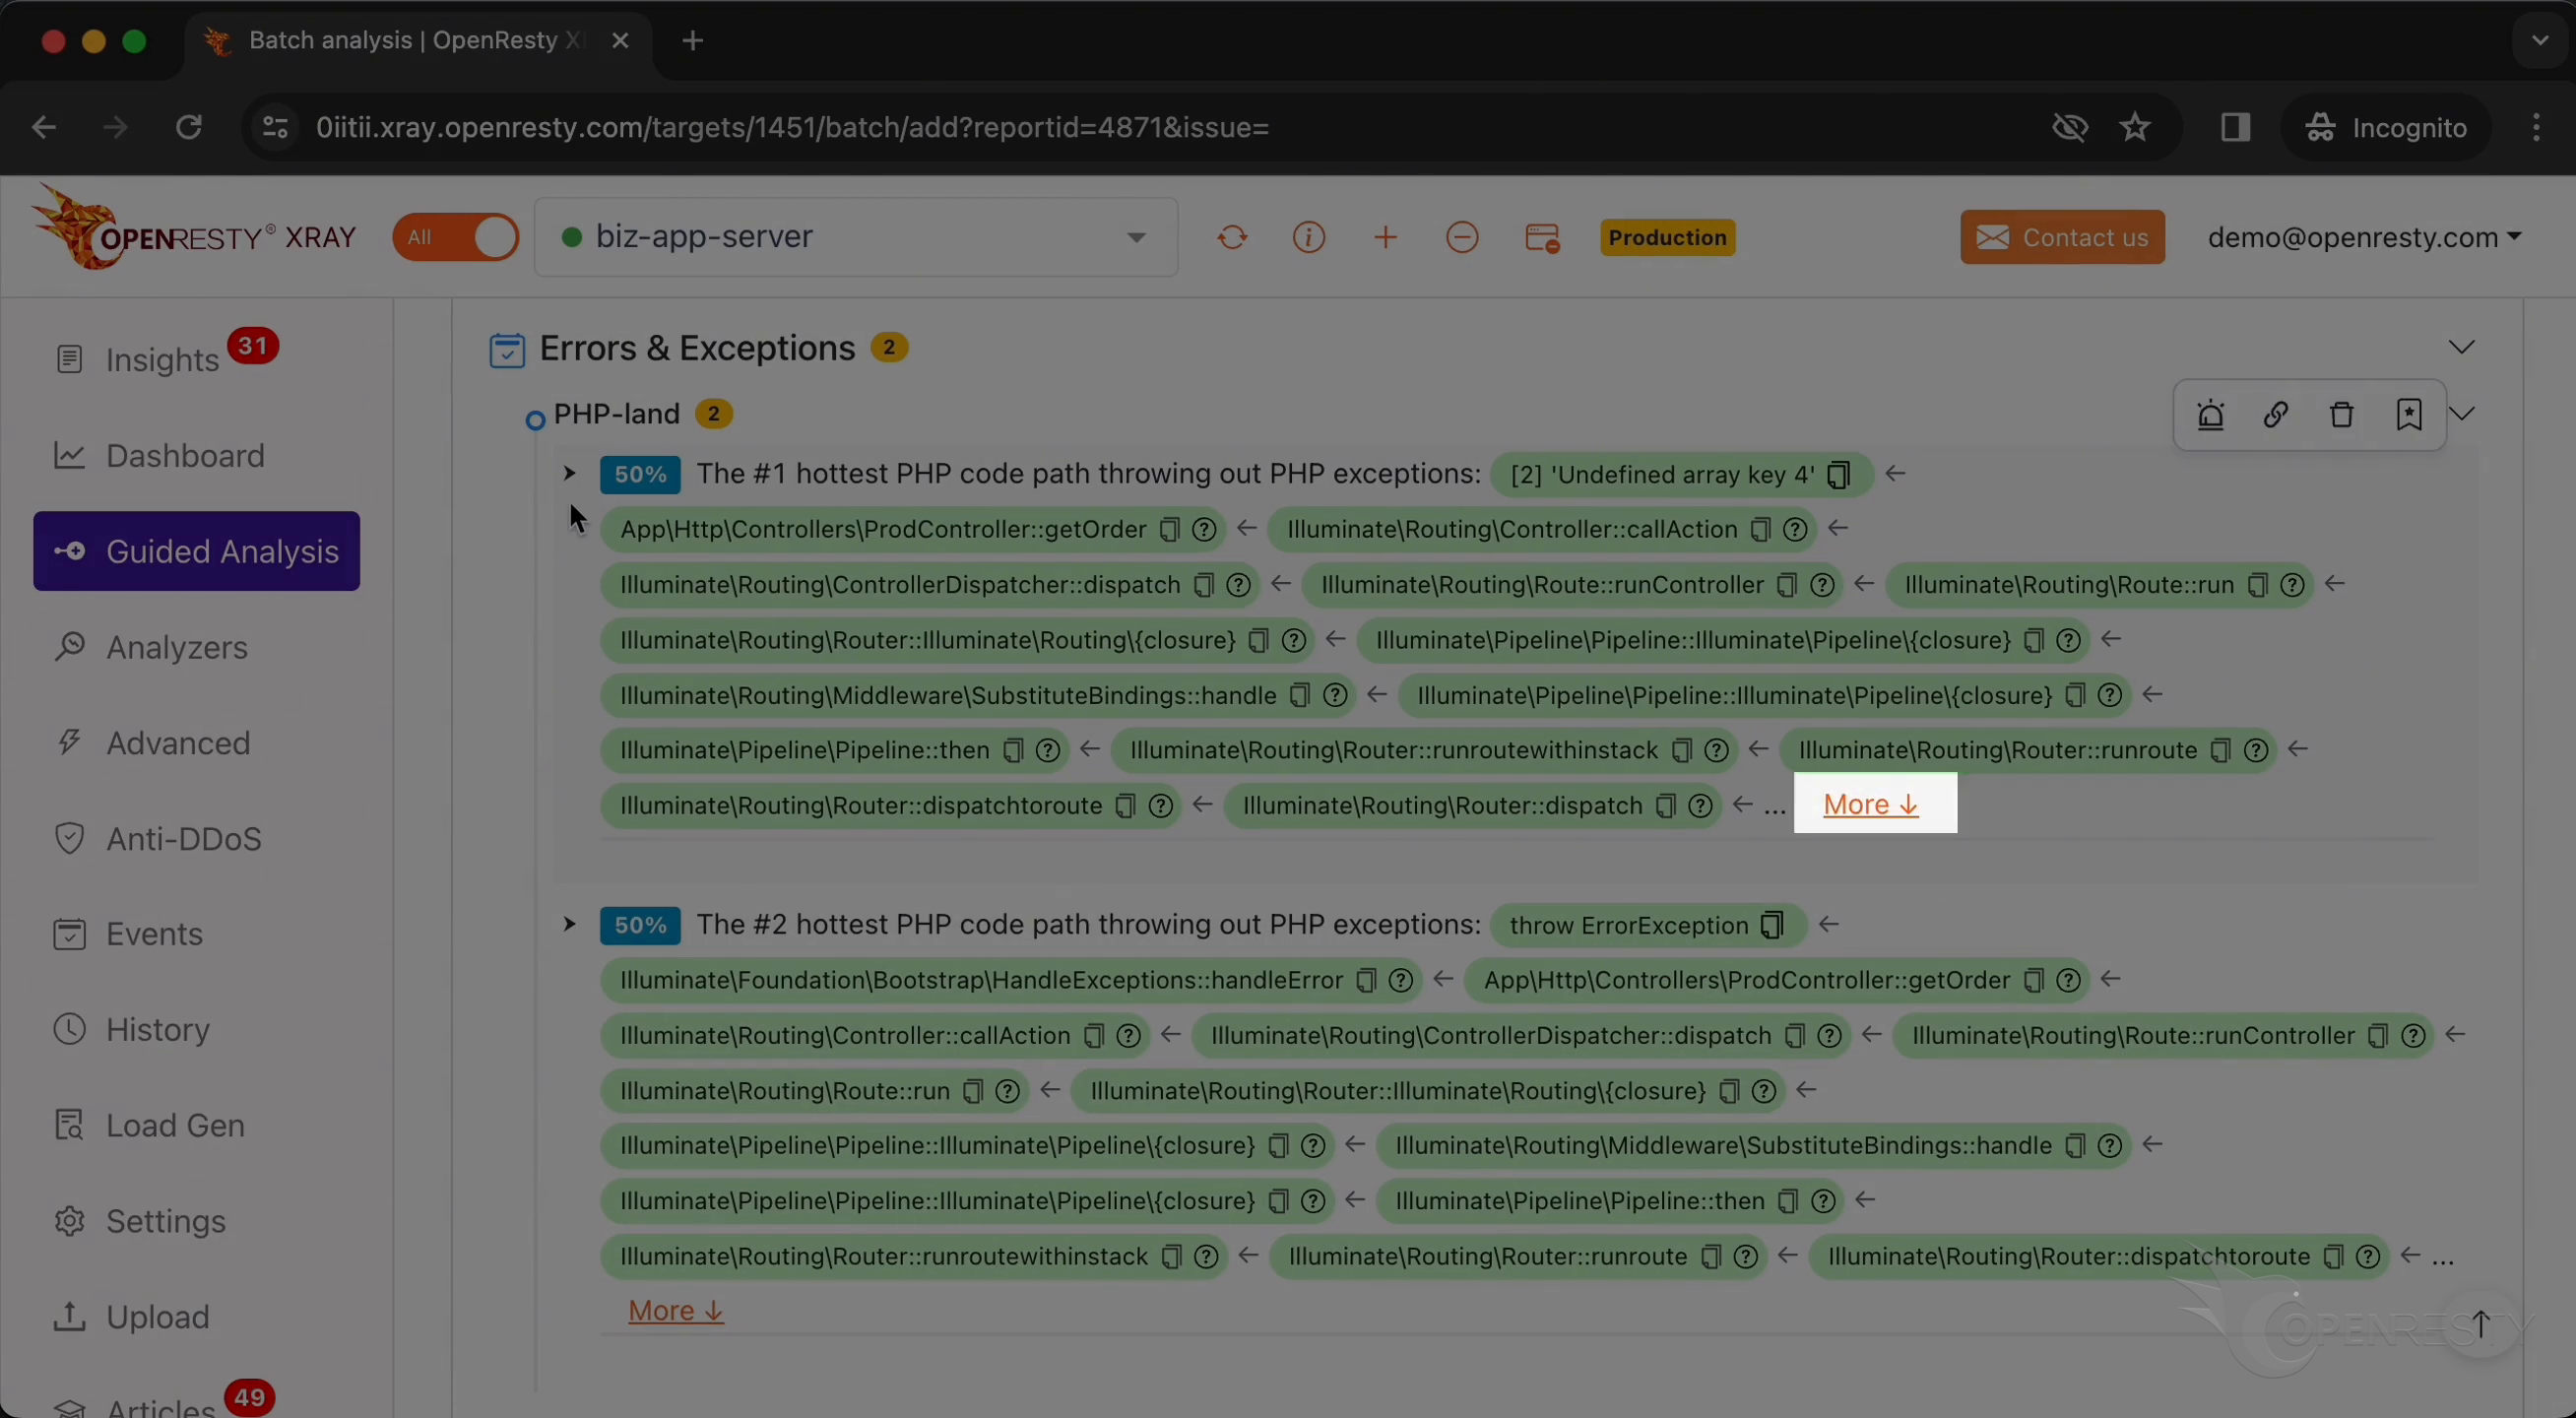
This hot code path is automatically inferred from this PHP-land exception flame graph.
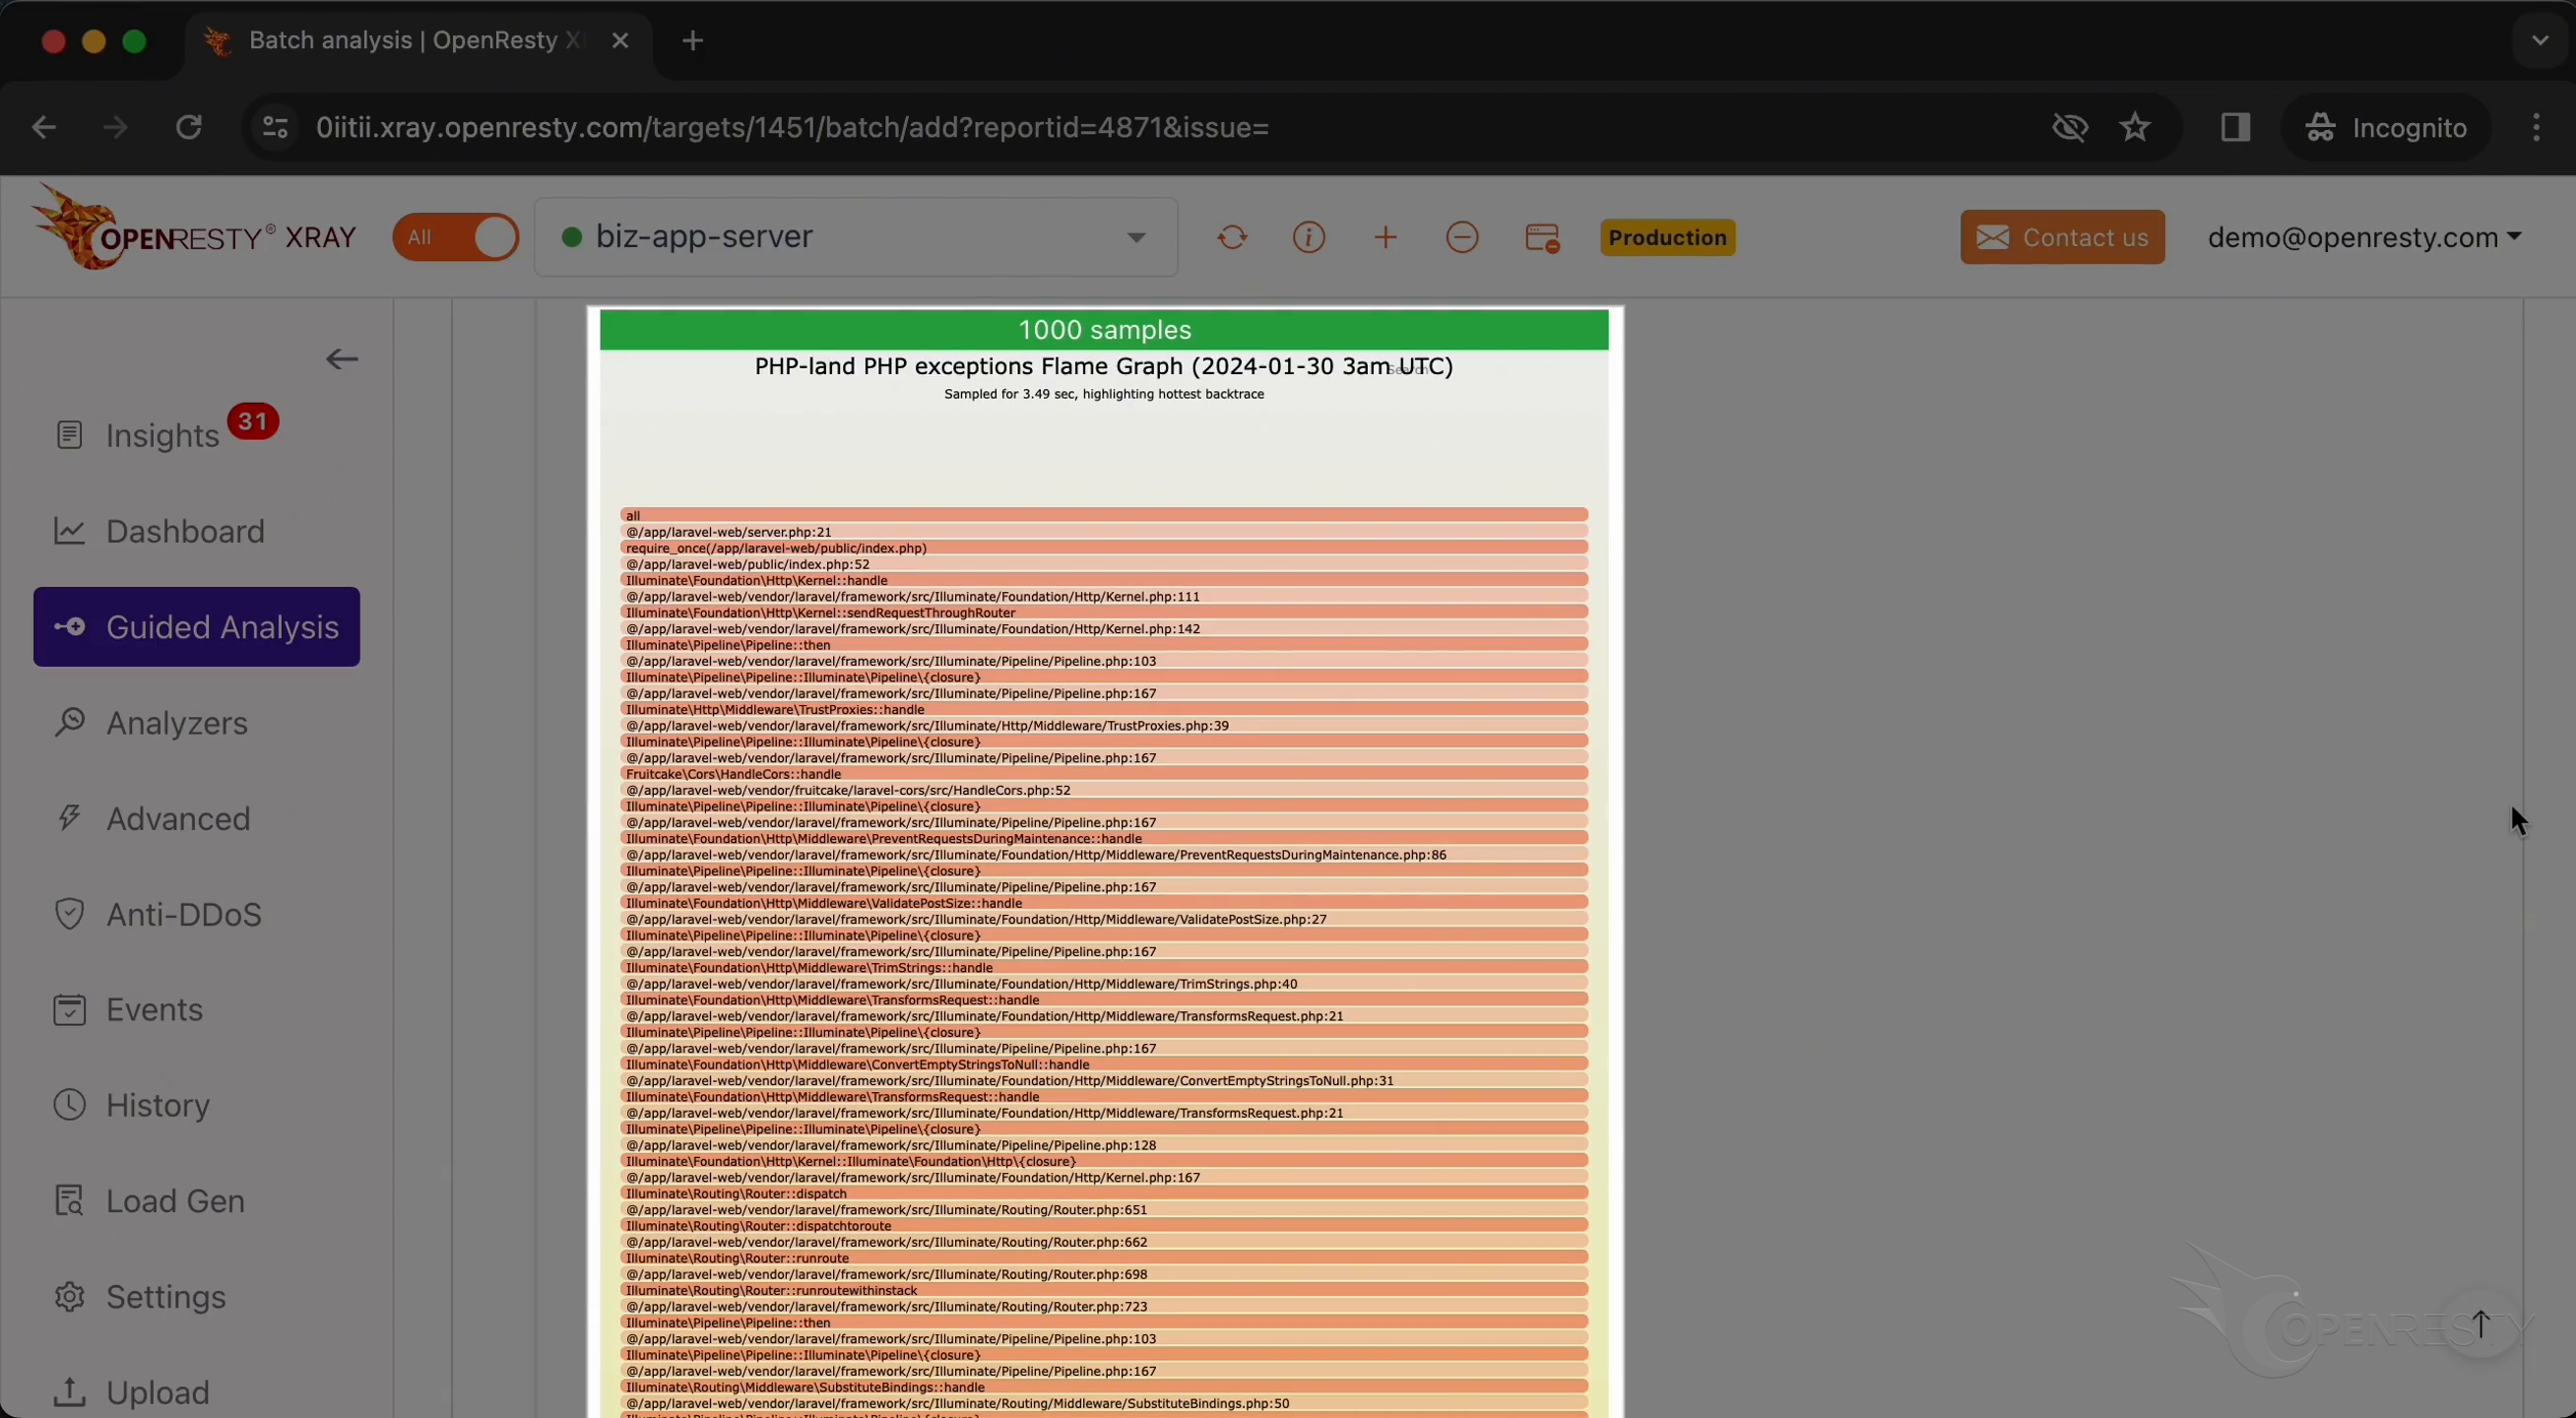
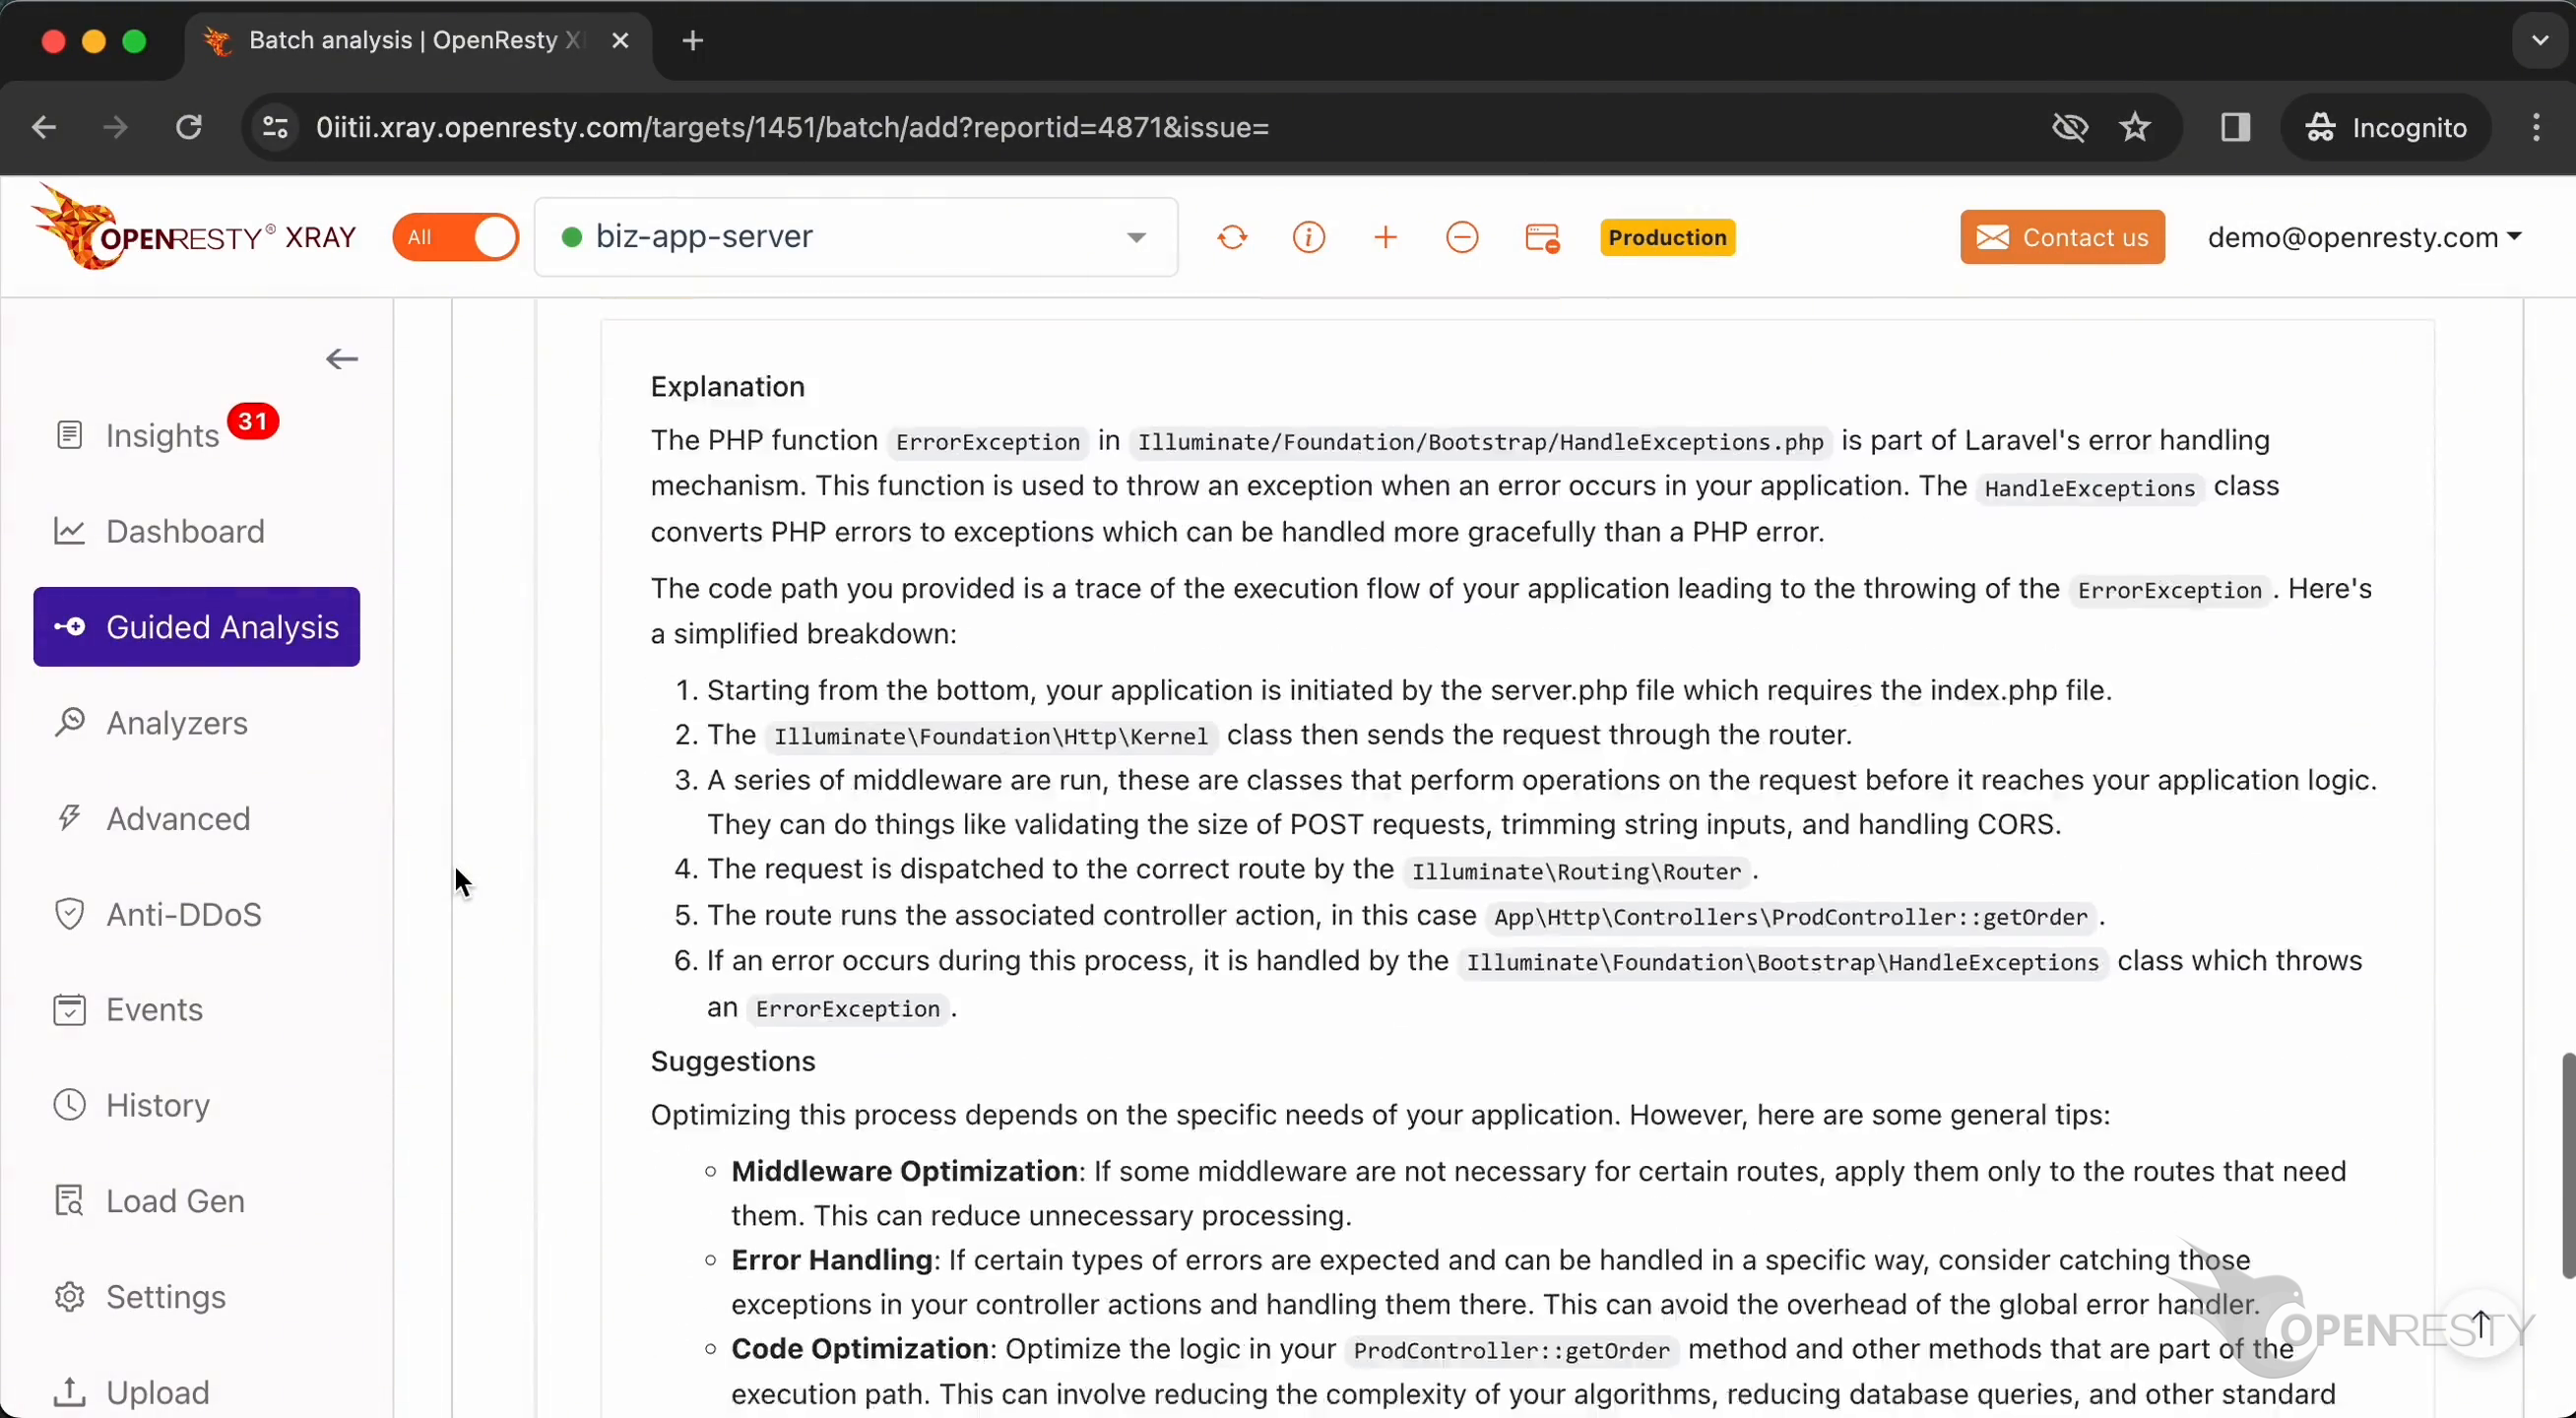
Below are more detailed explanations regarding the current issue.
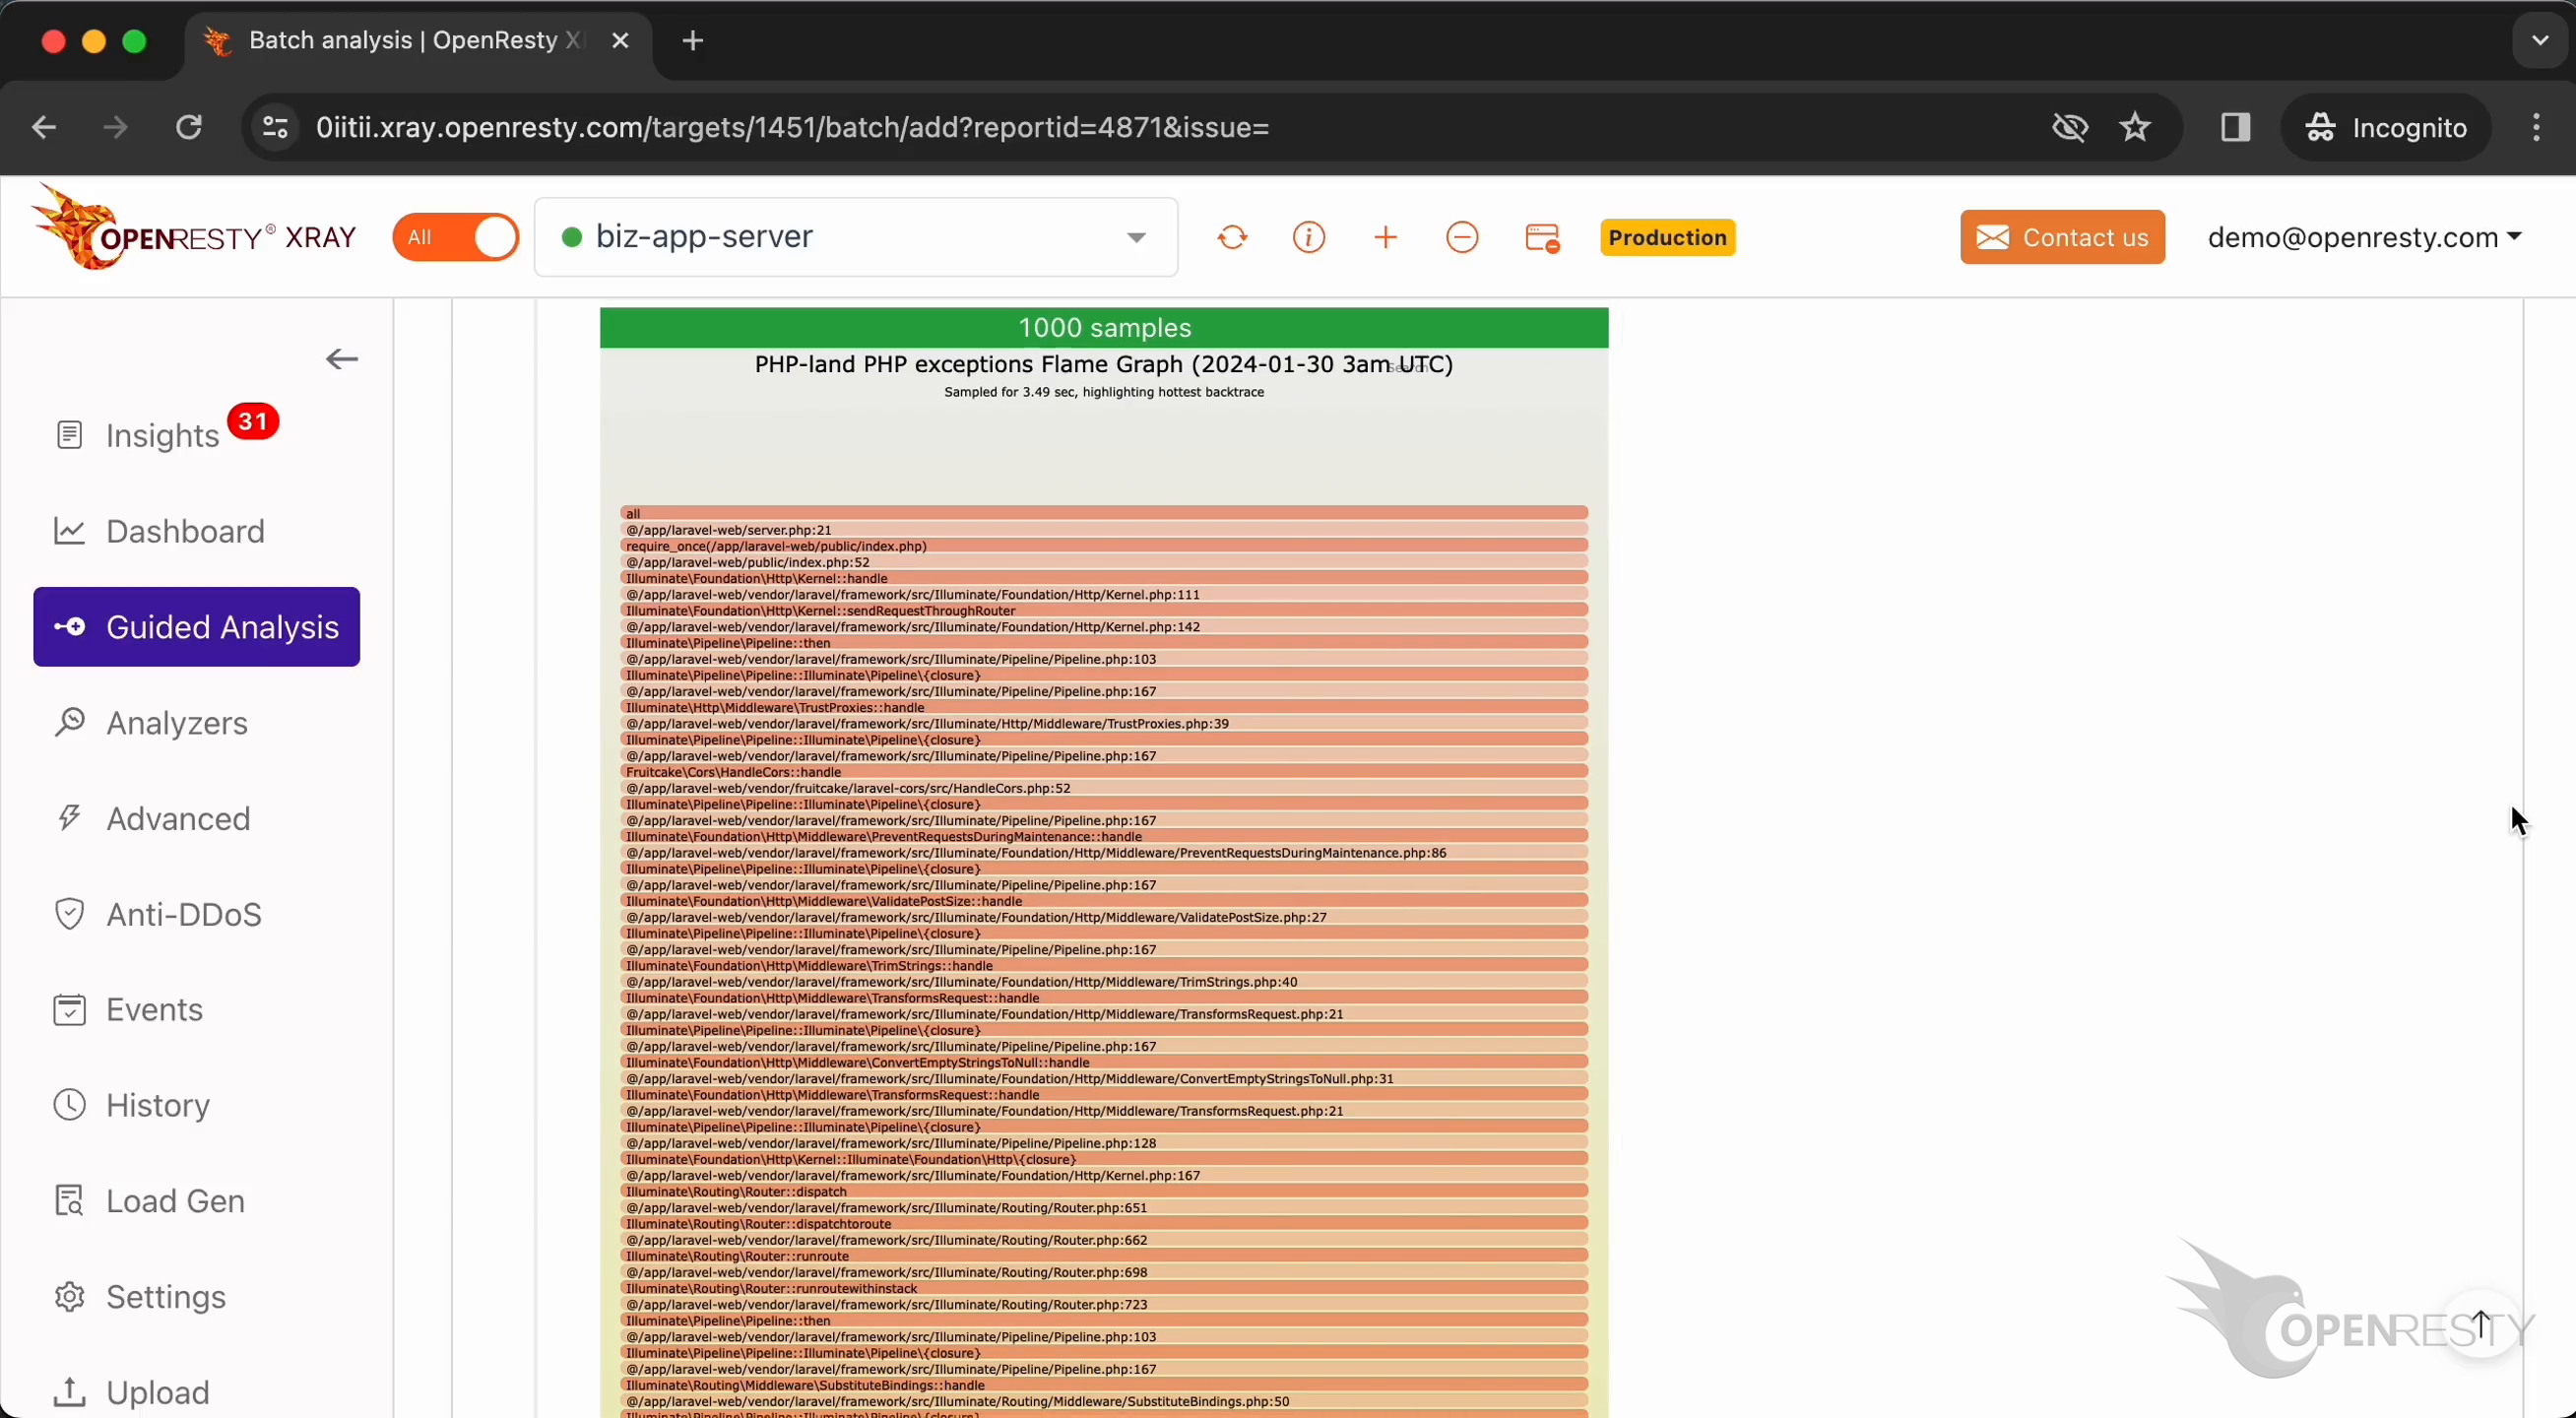
It mentions the exceptions above.
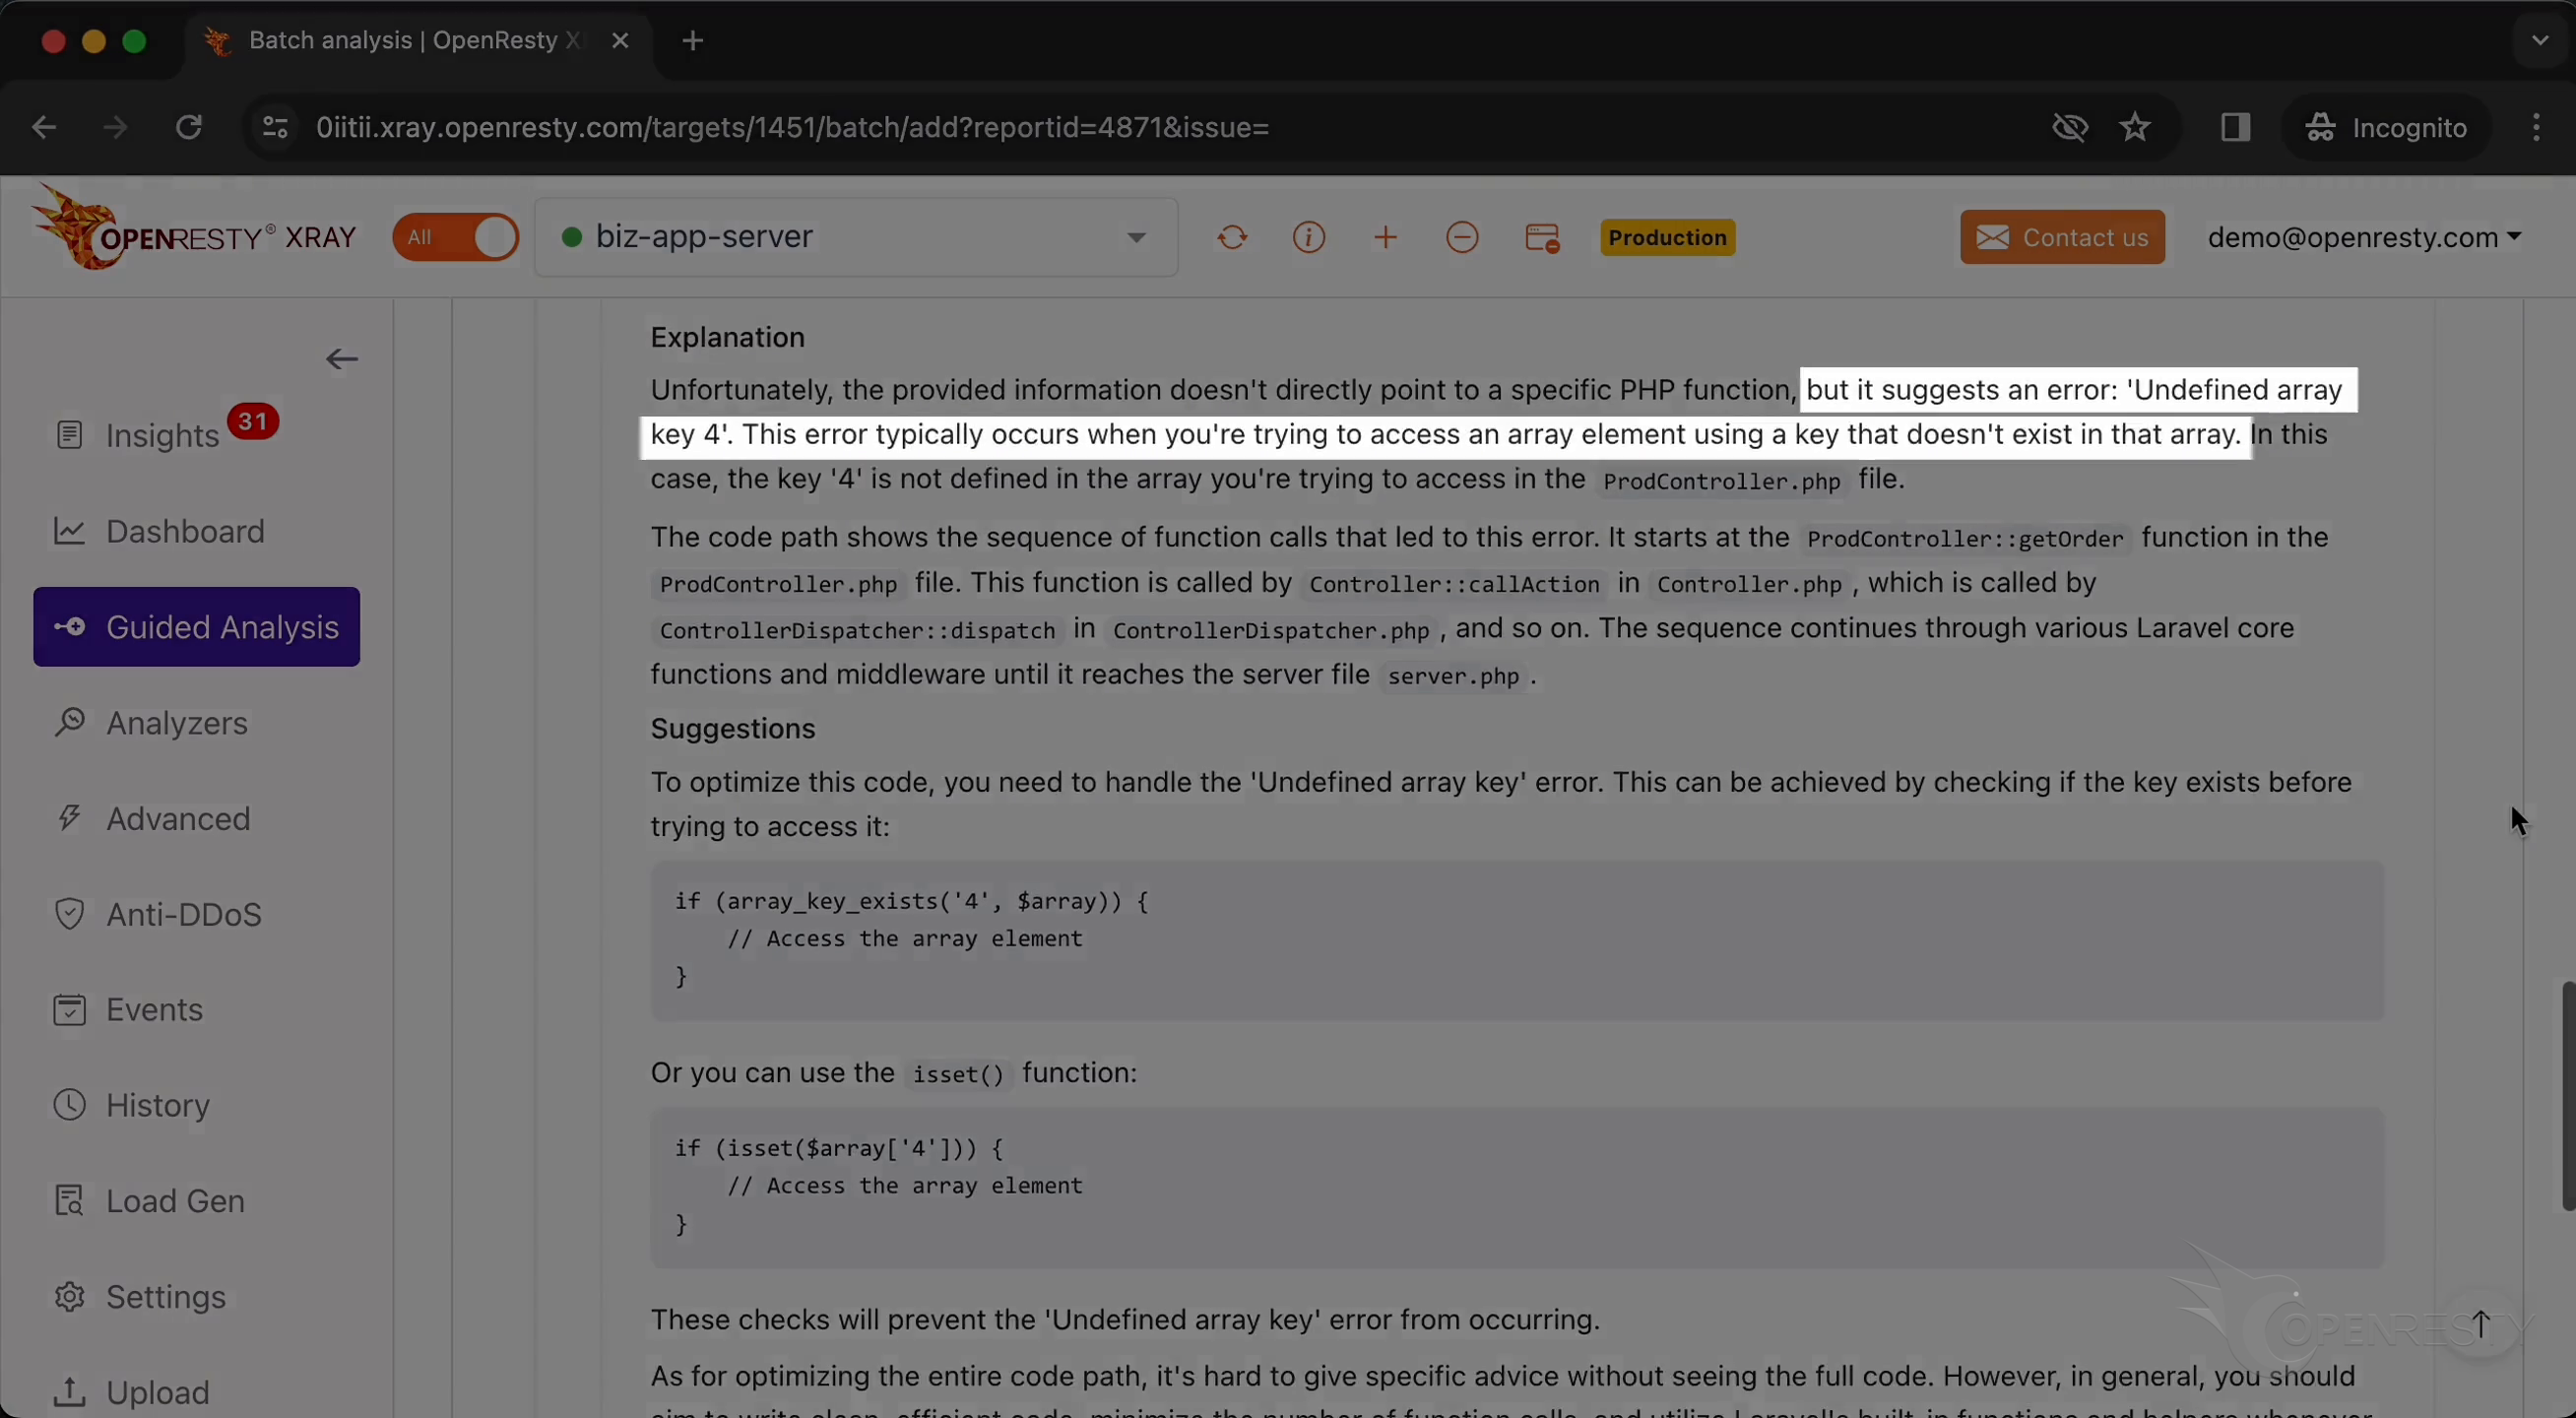
It points out the location of the PHP error occurrence.
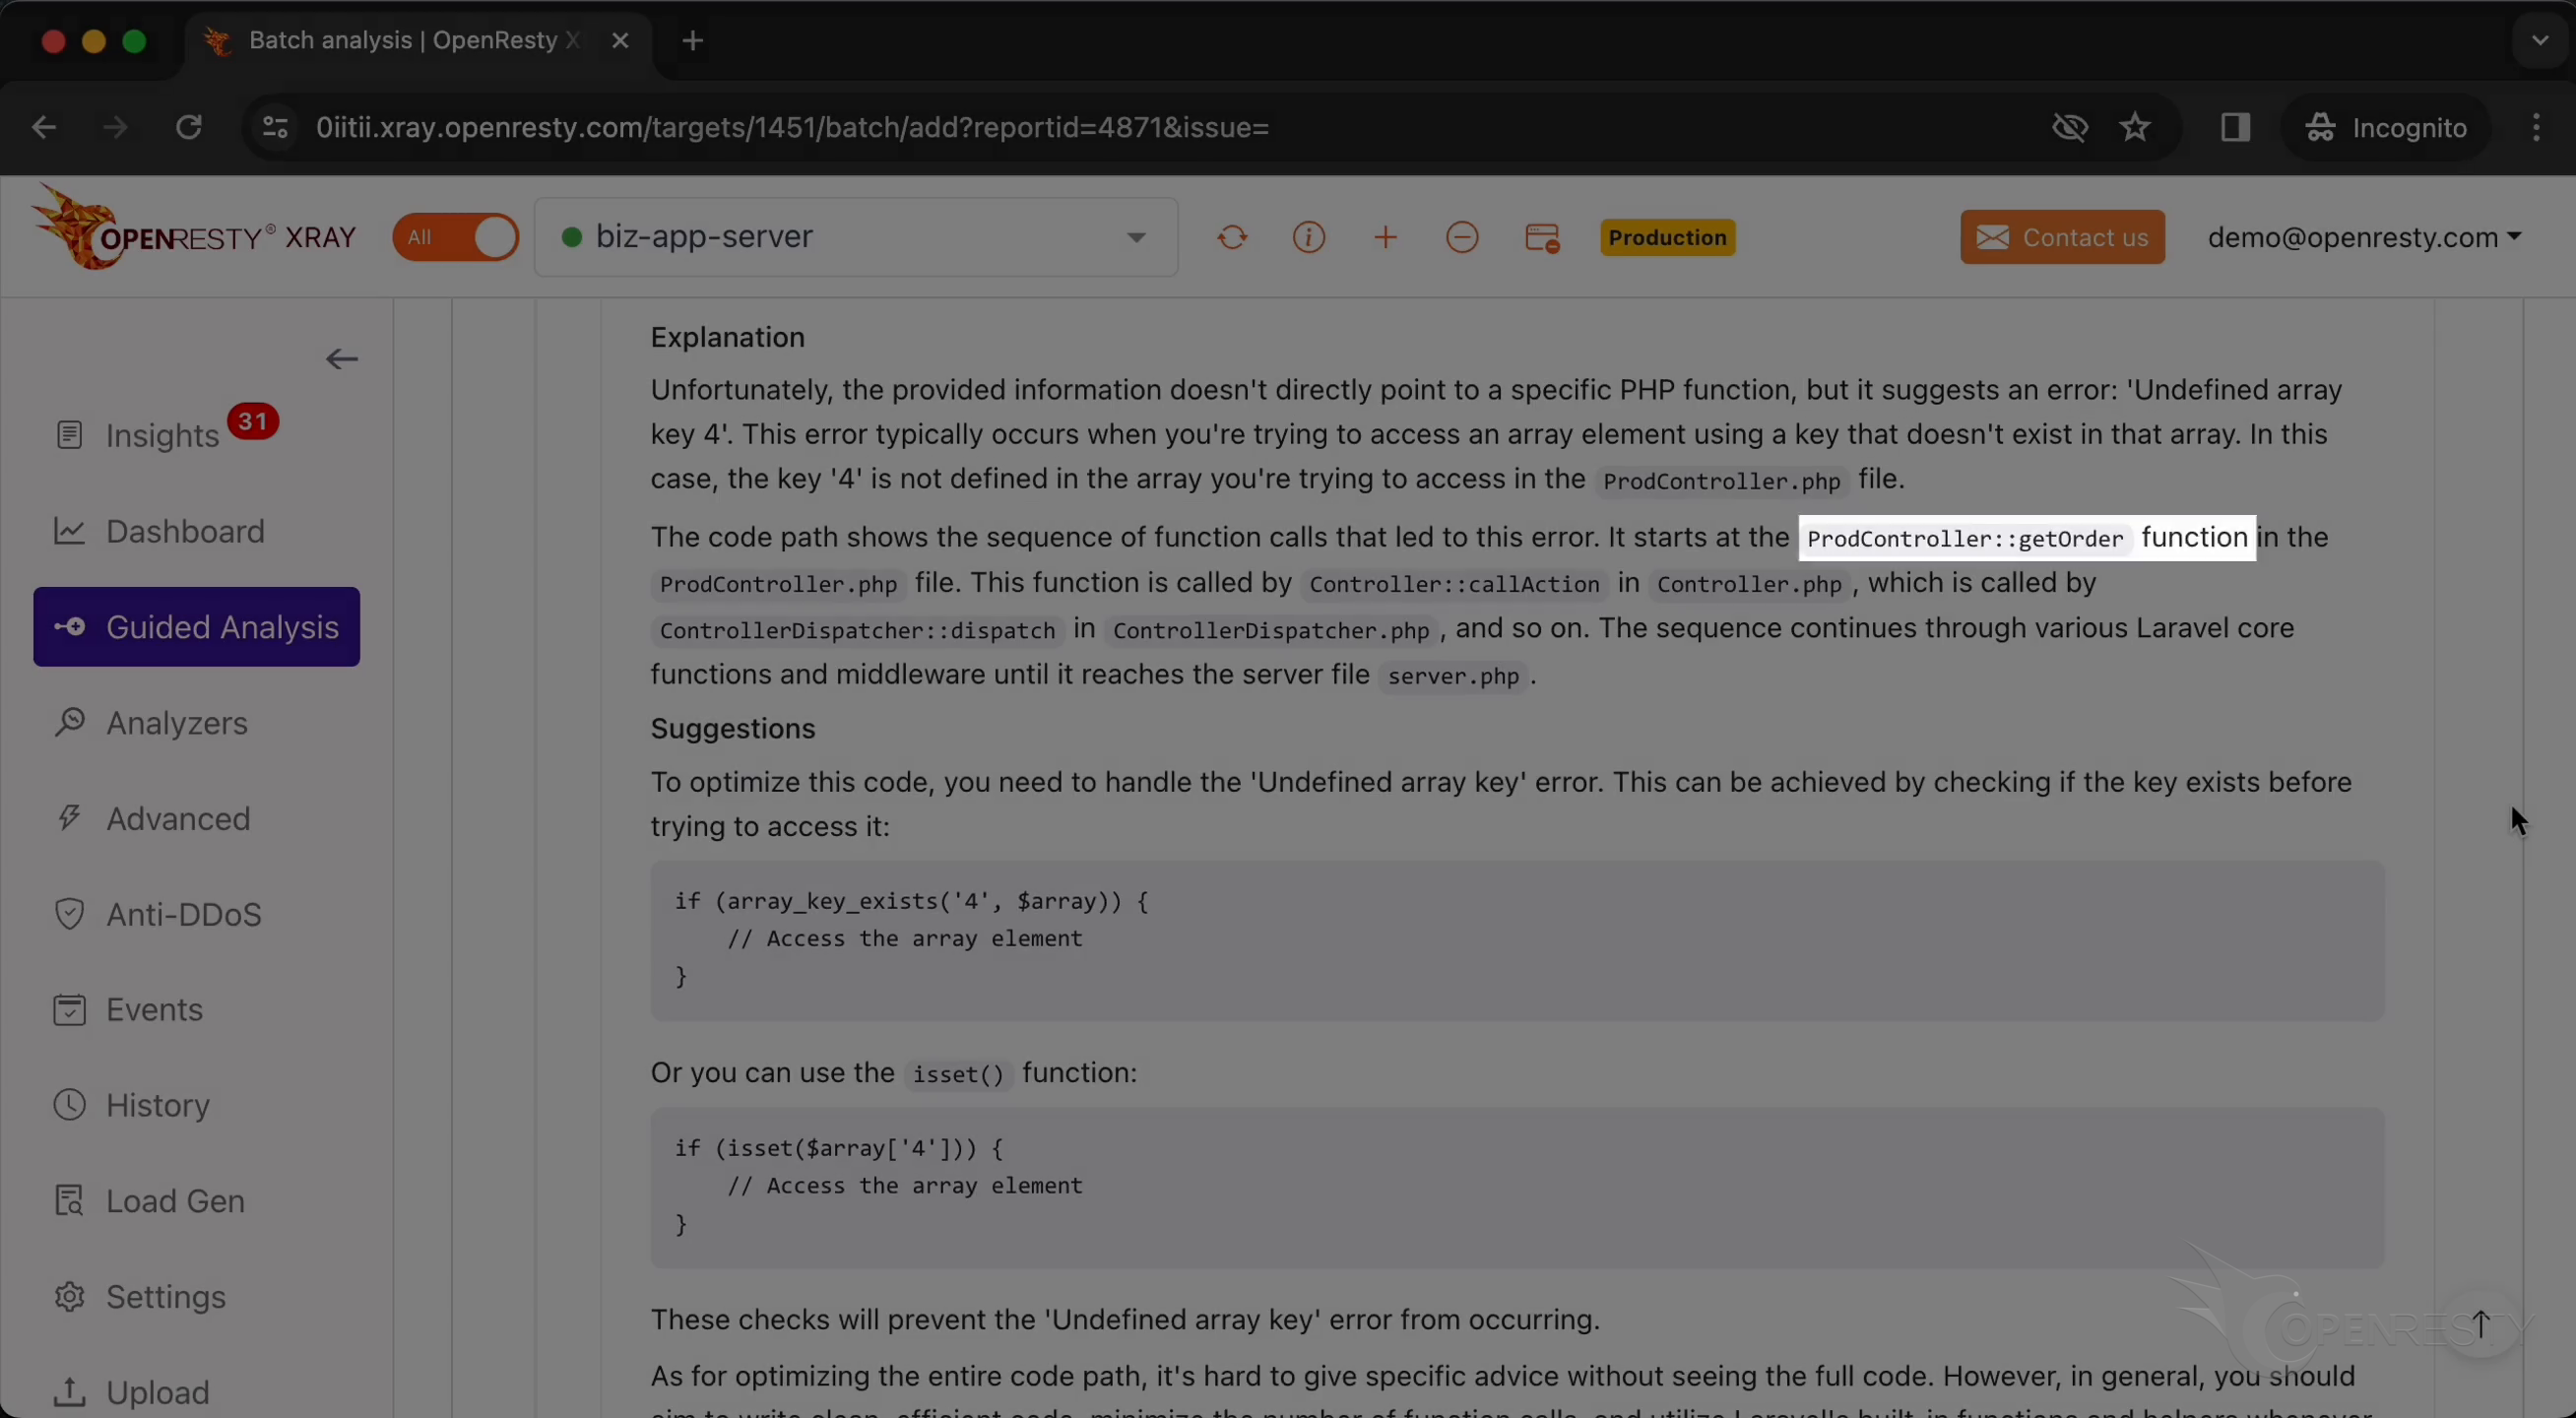
We can avoid this error by following the suggestions given here. OpenResty XRay also provides a code example that can fix this error.
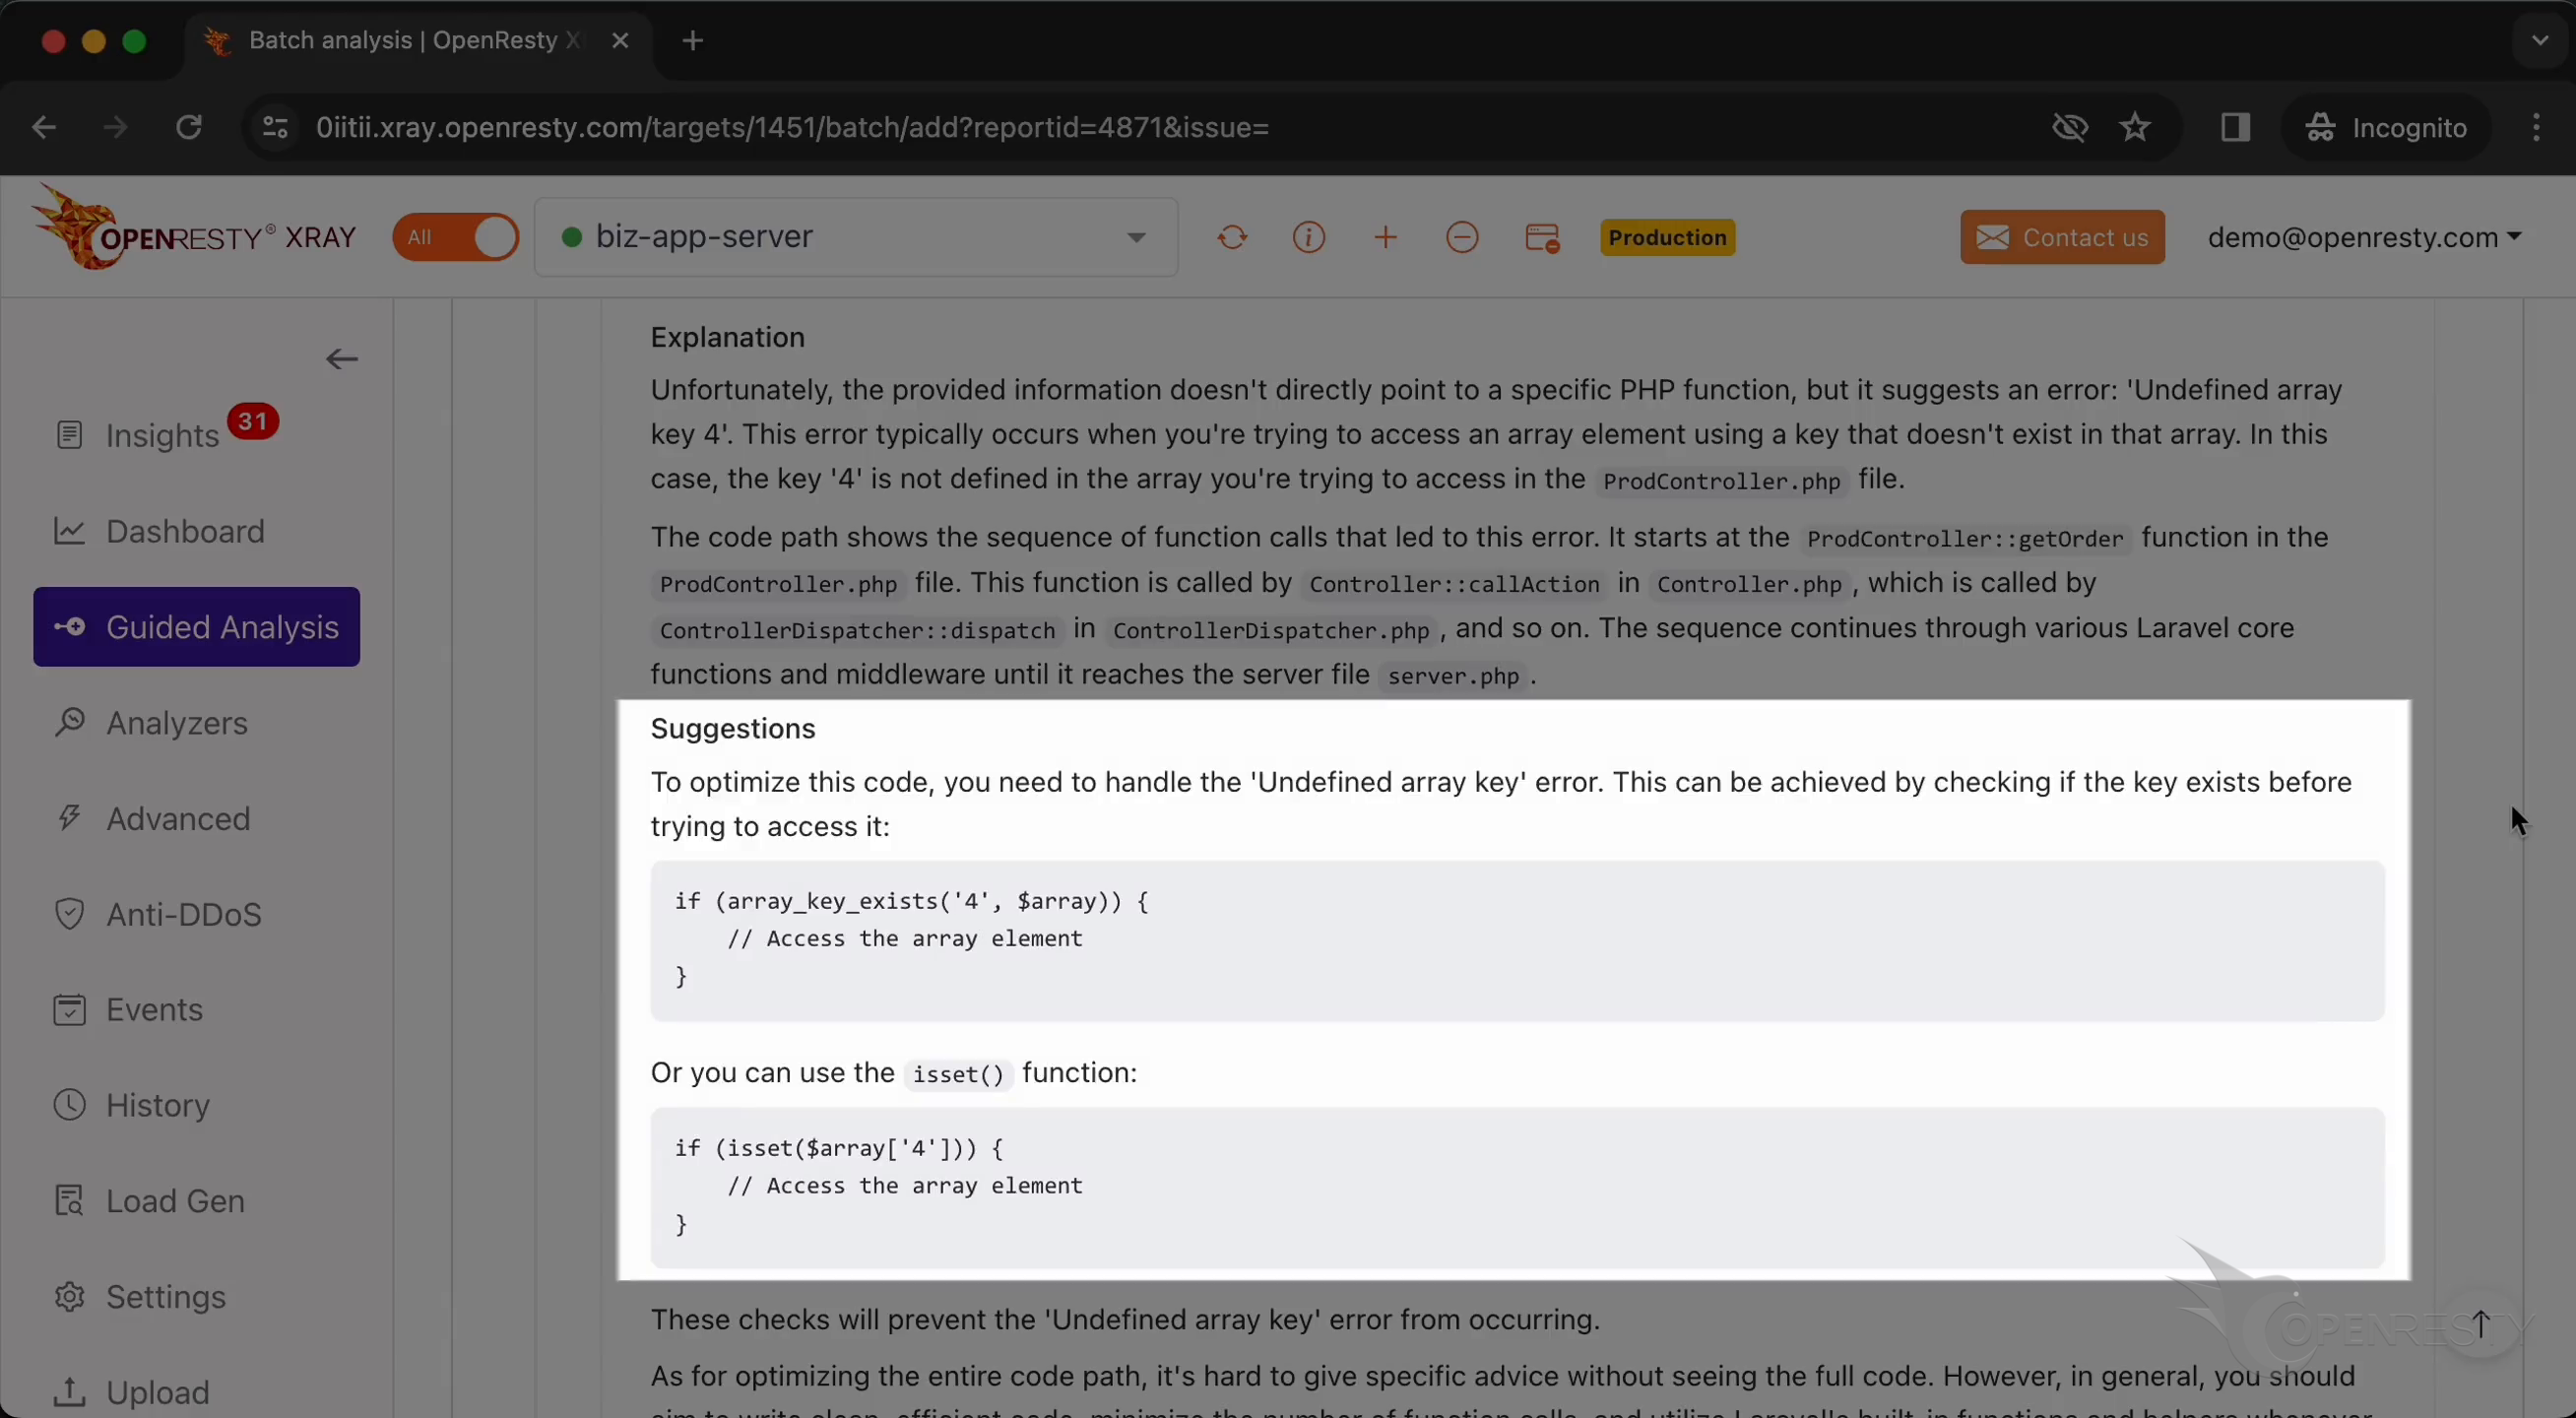
Trace the hot code path to the exact PHP source line
Let’s go back to the original hot code path.
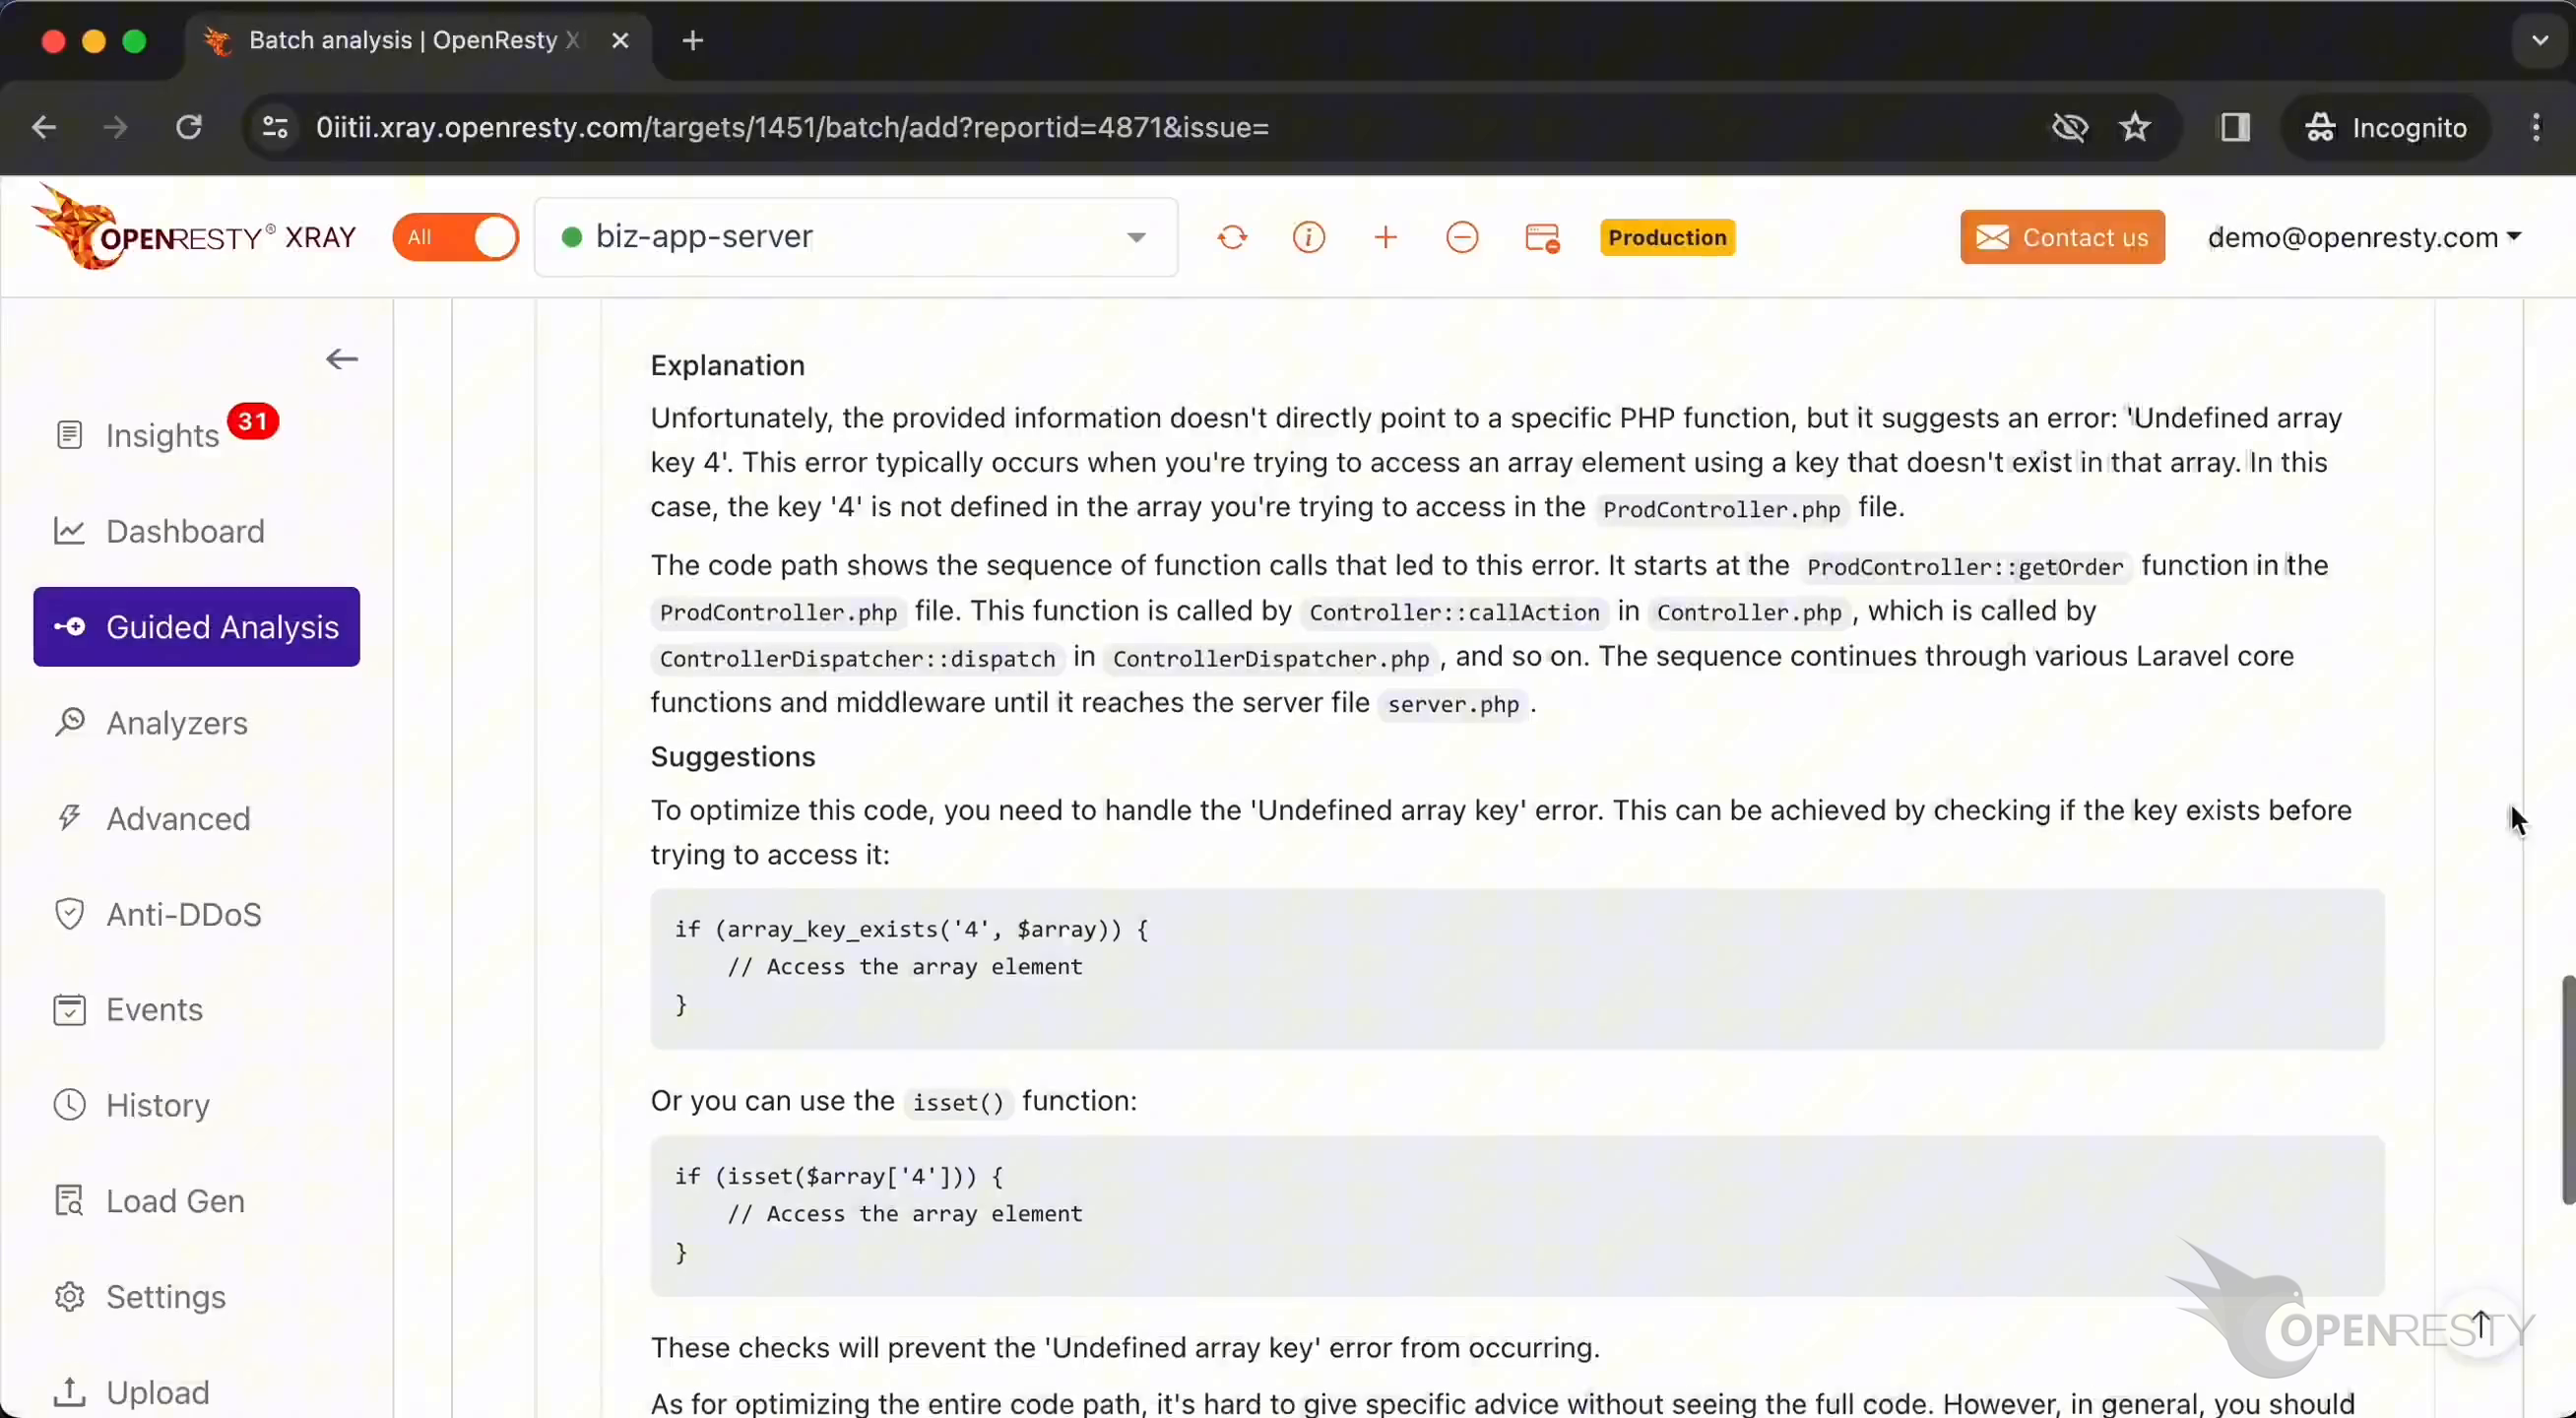
Hover the mouse over the green box for the getOrder function.
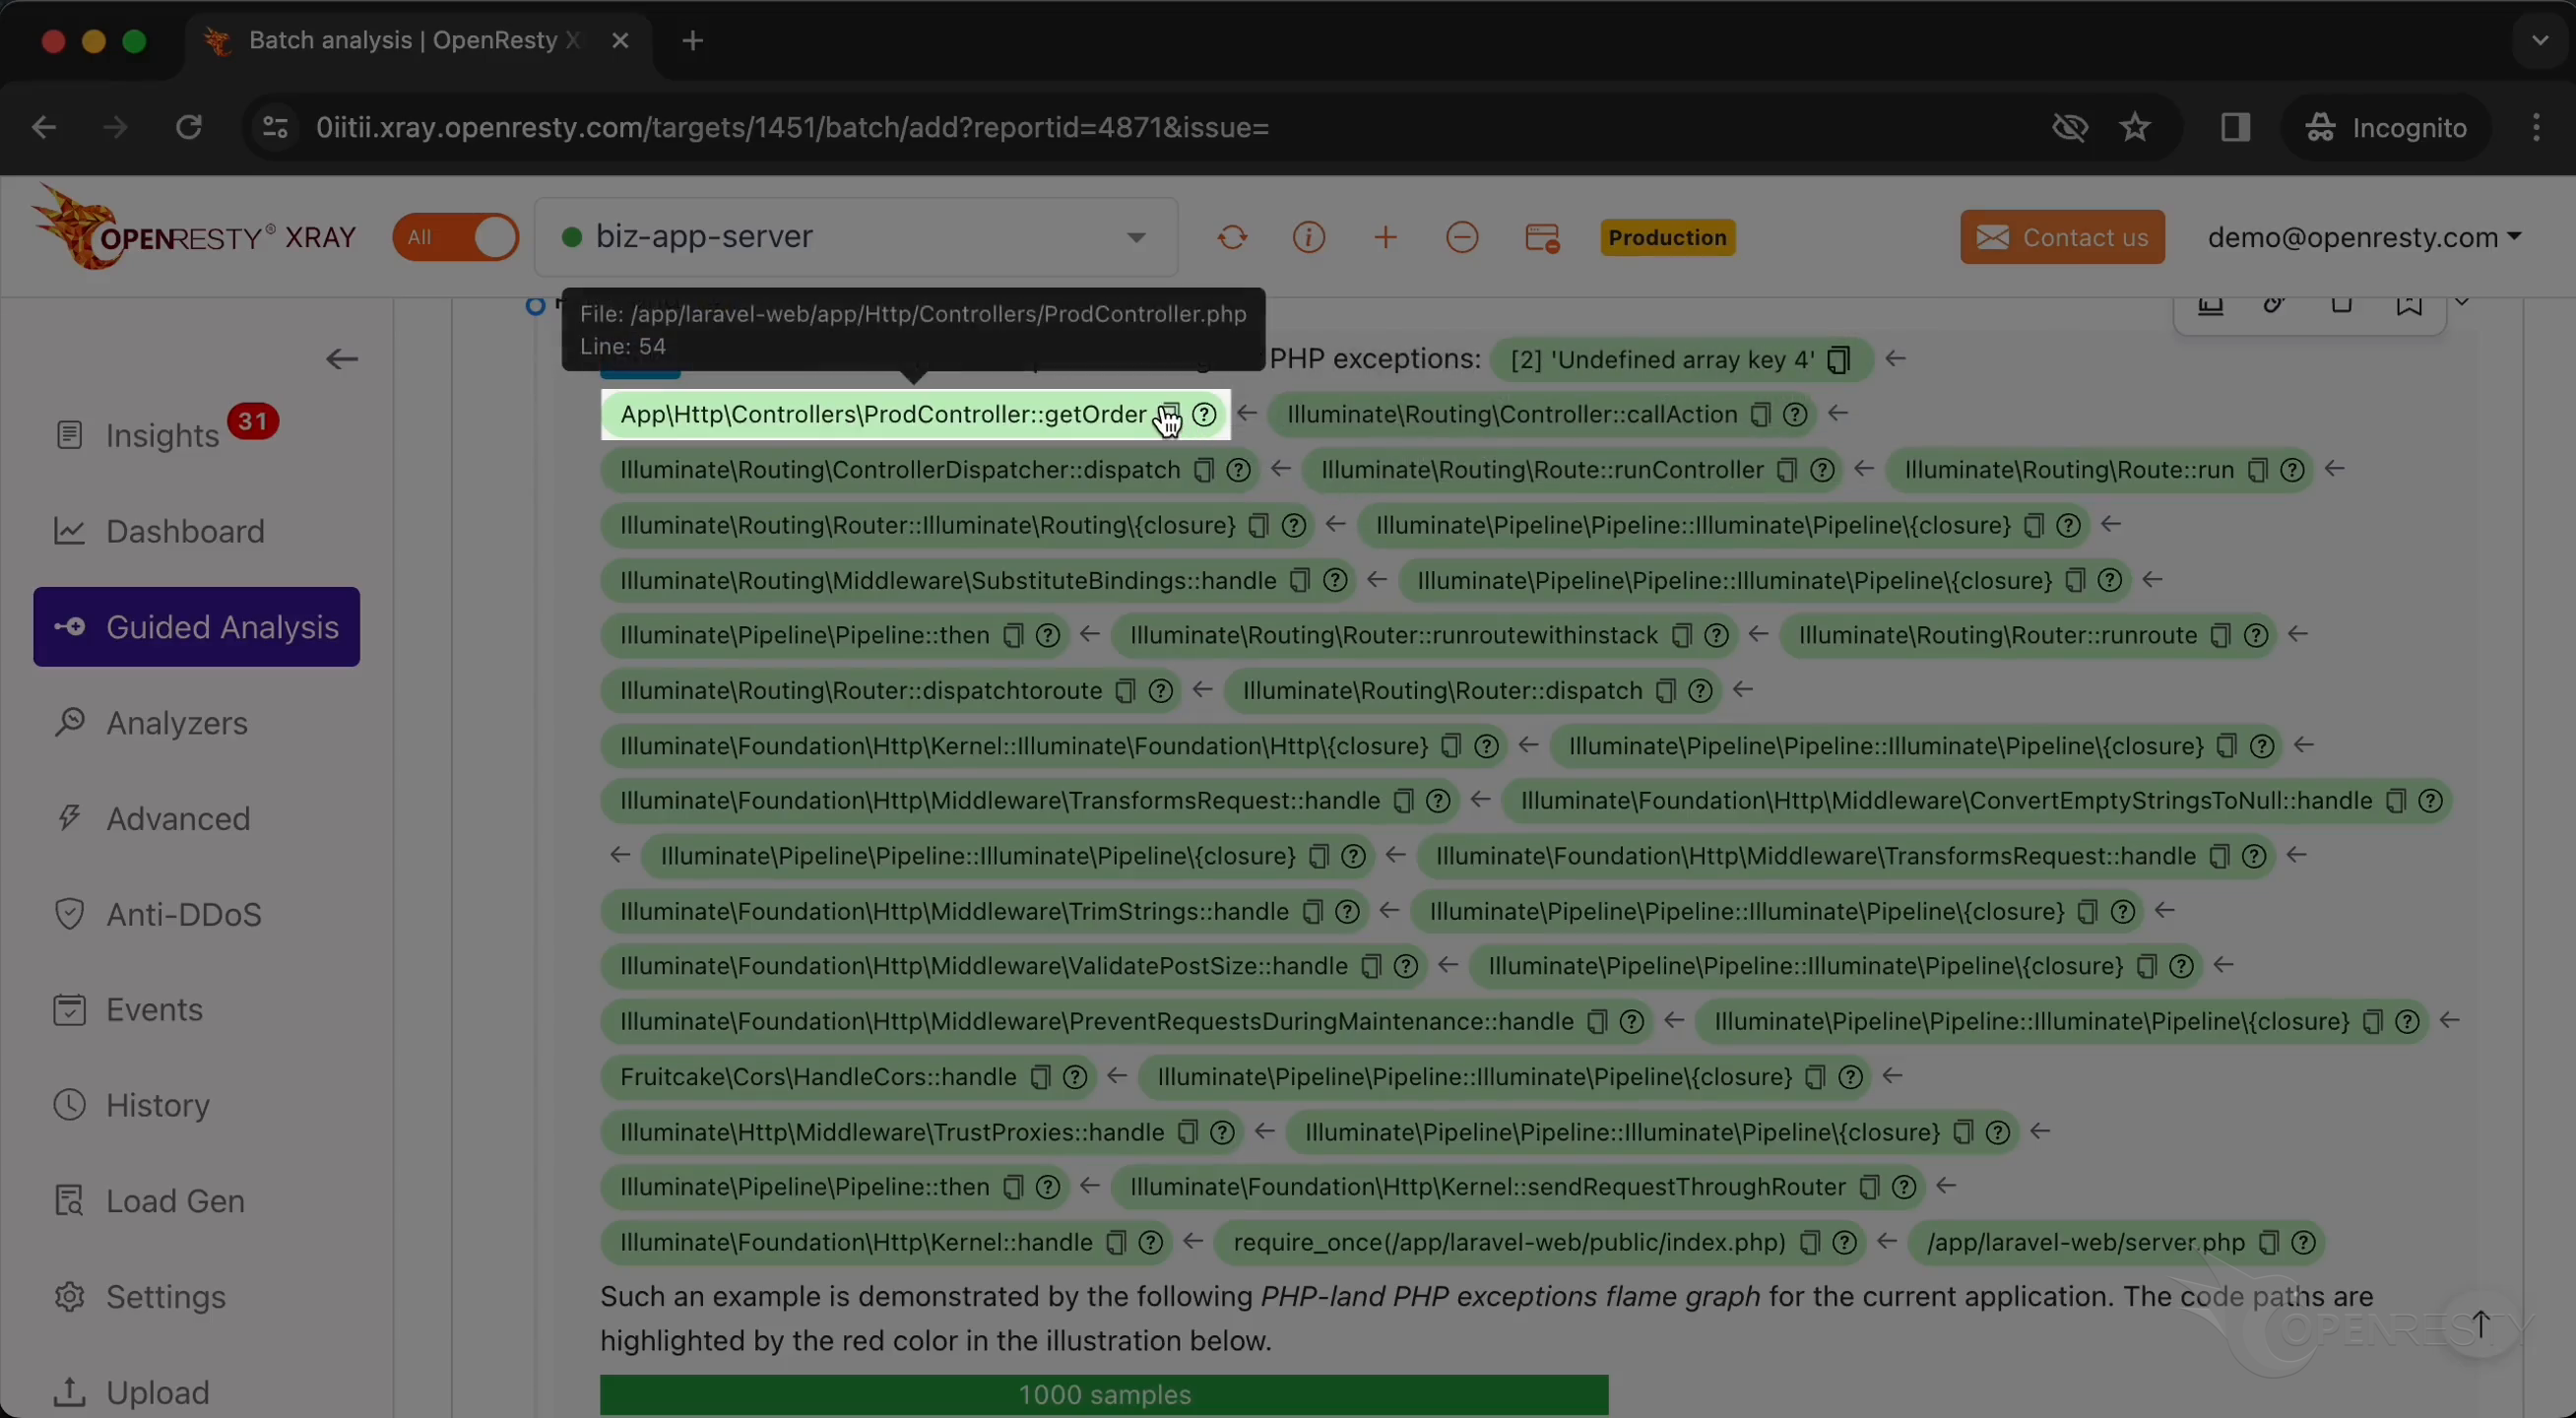
We can see the PHP source file of this function in the tooltip.
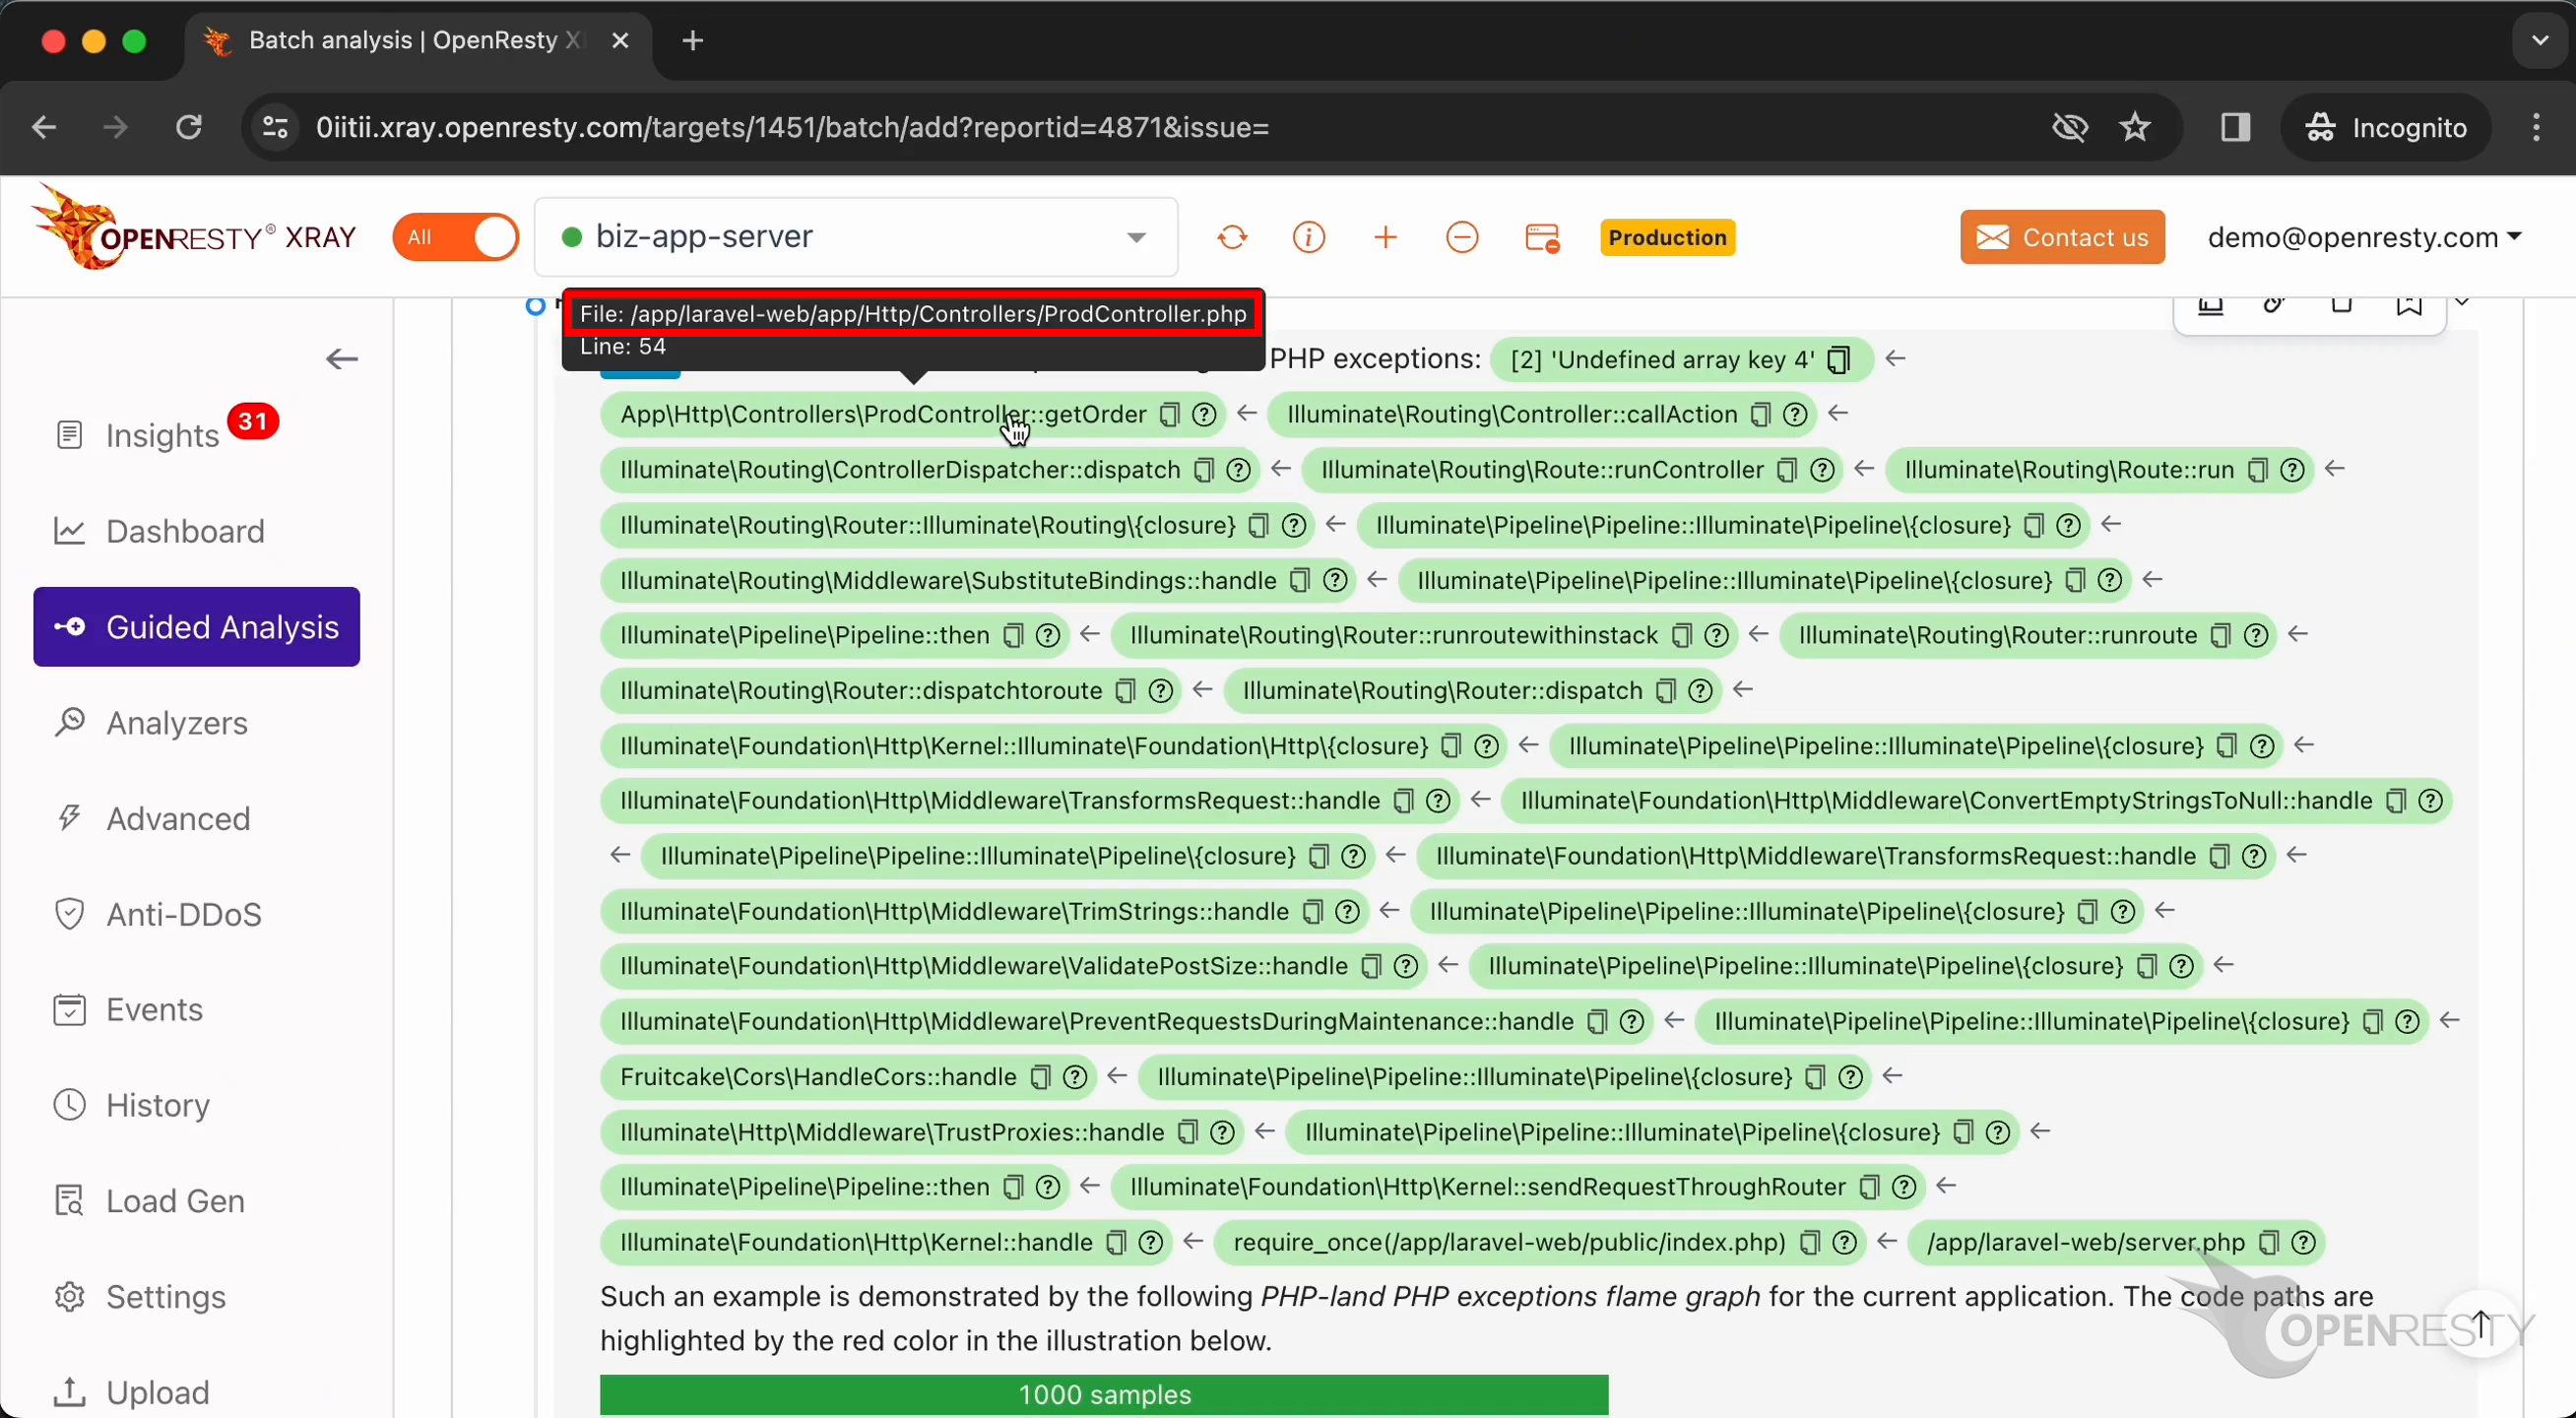
The source line number is 54.
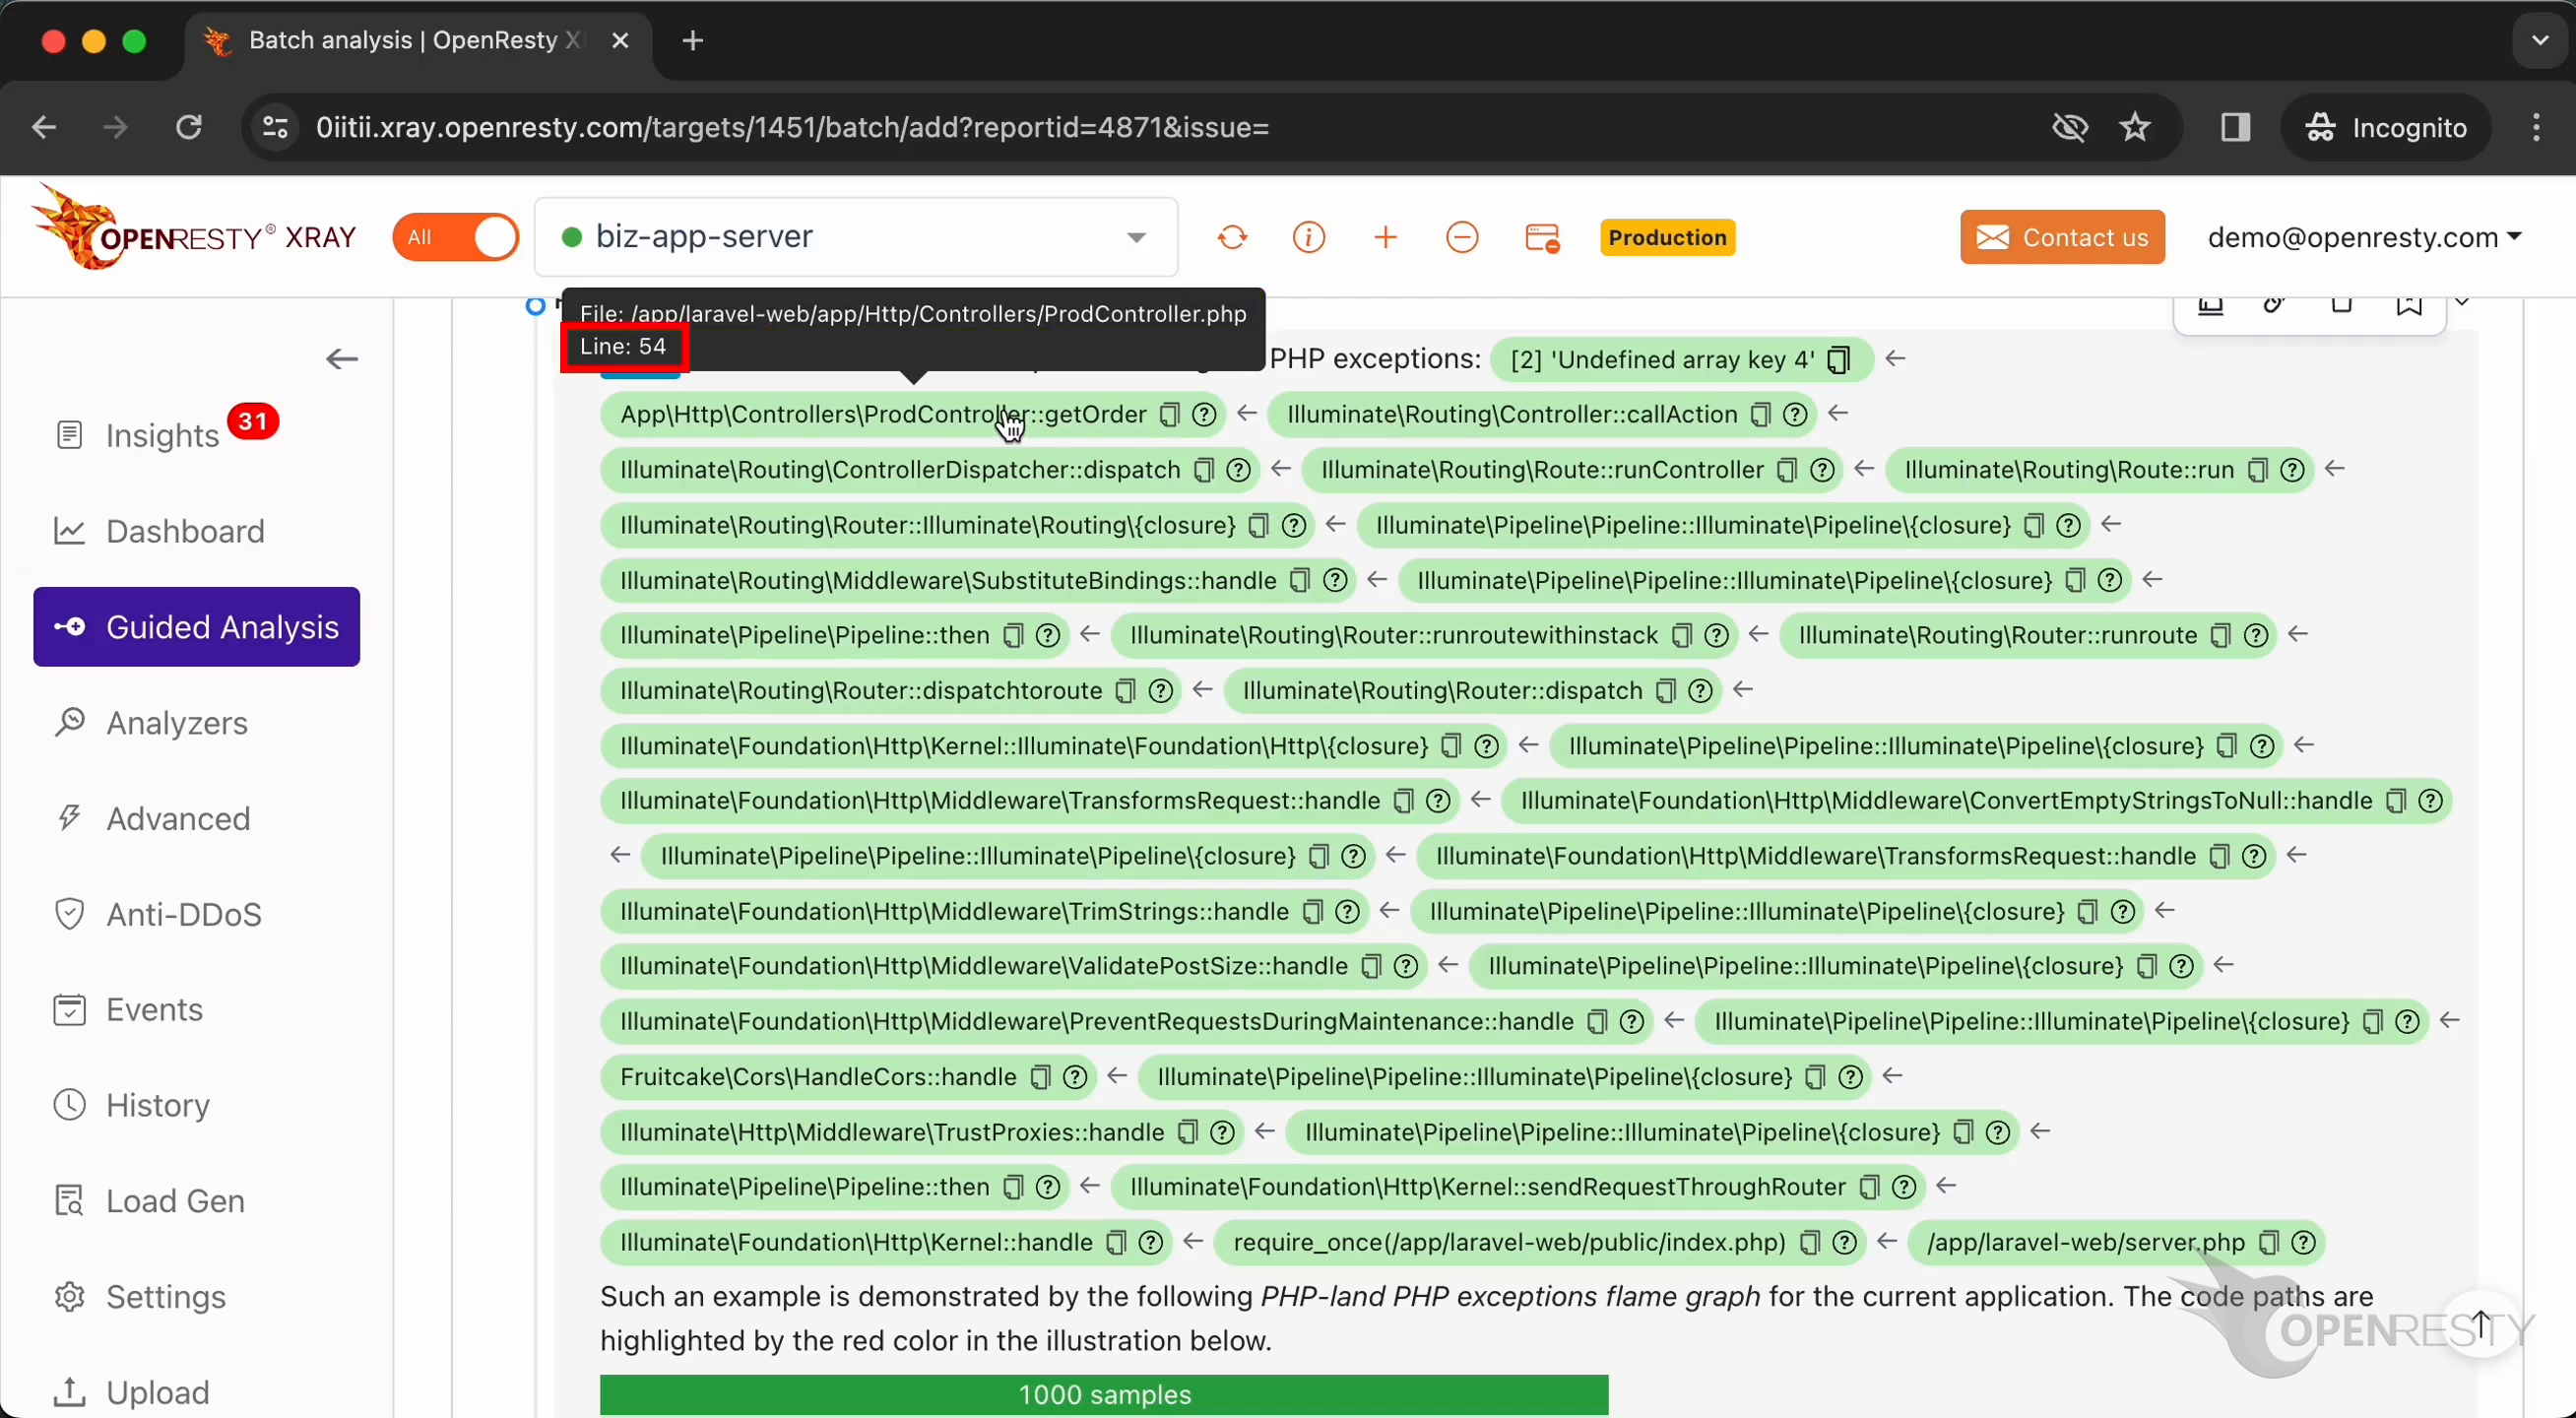
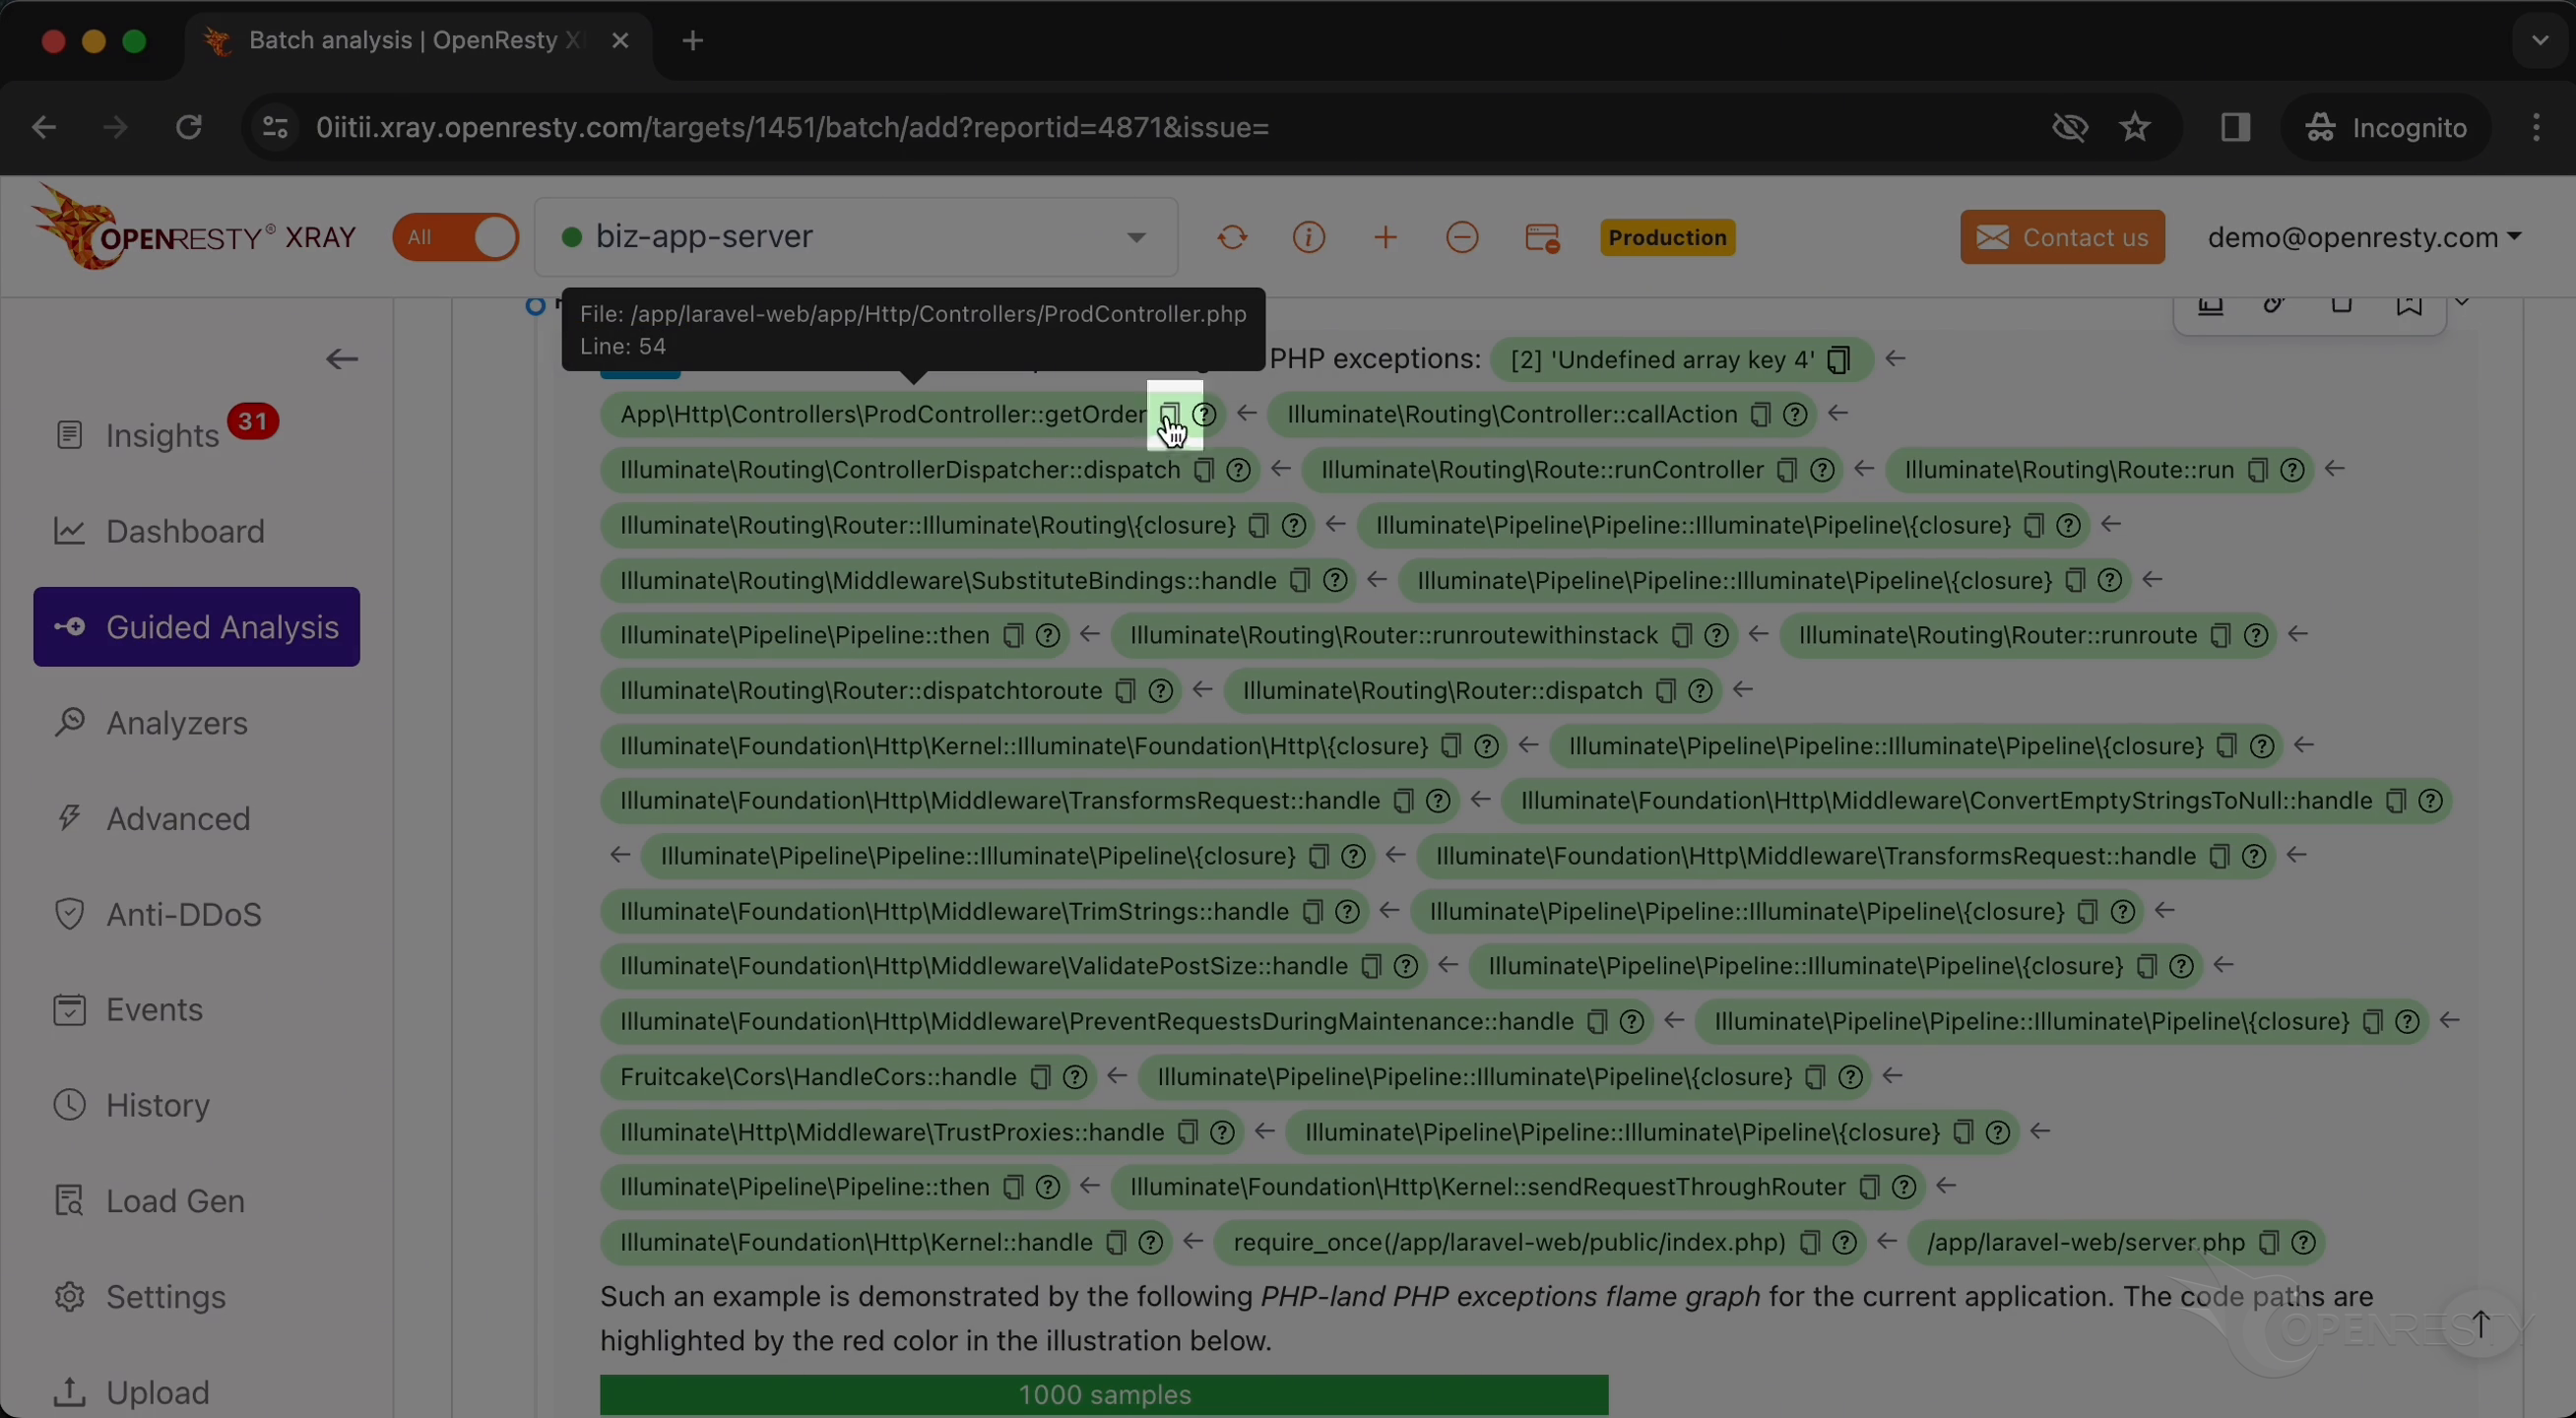
Click the icon to copy the source file path.
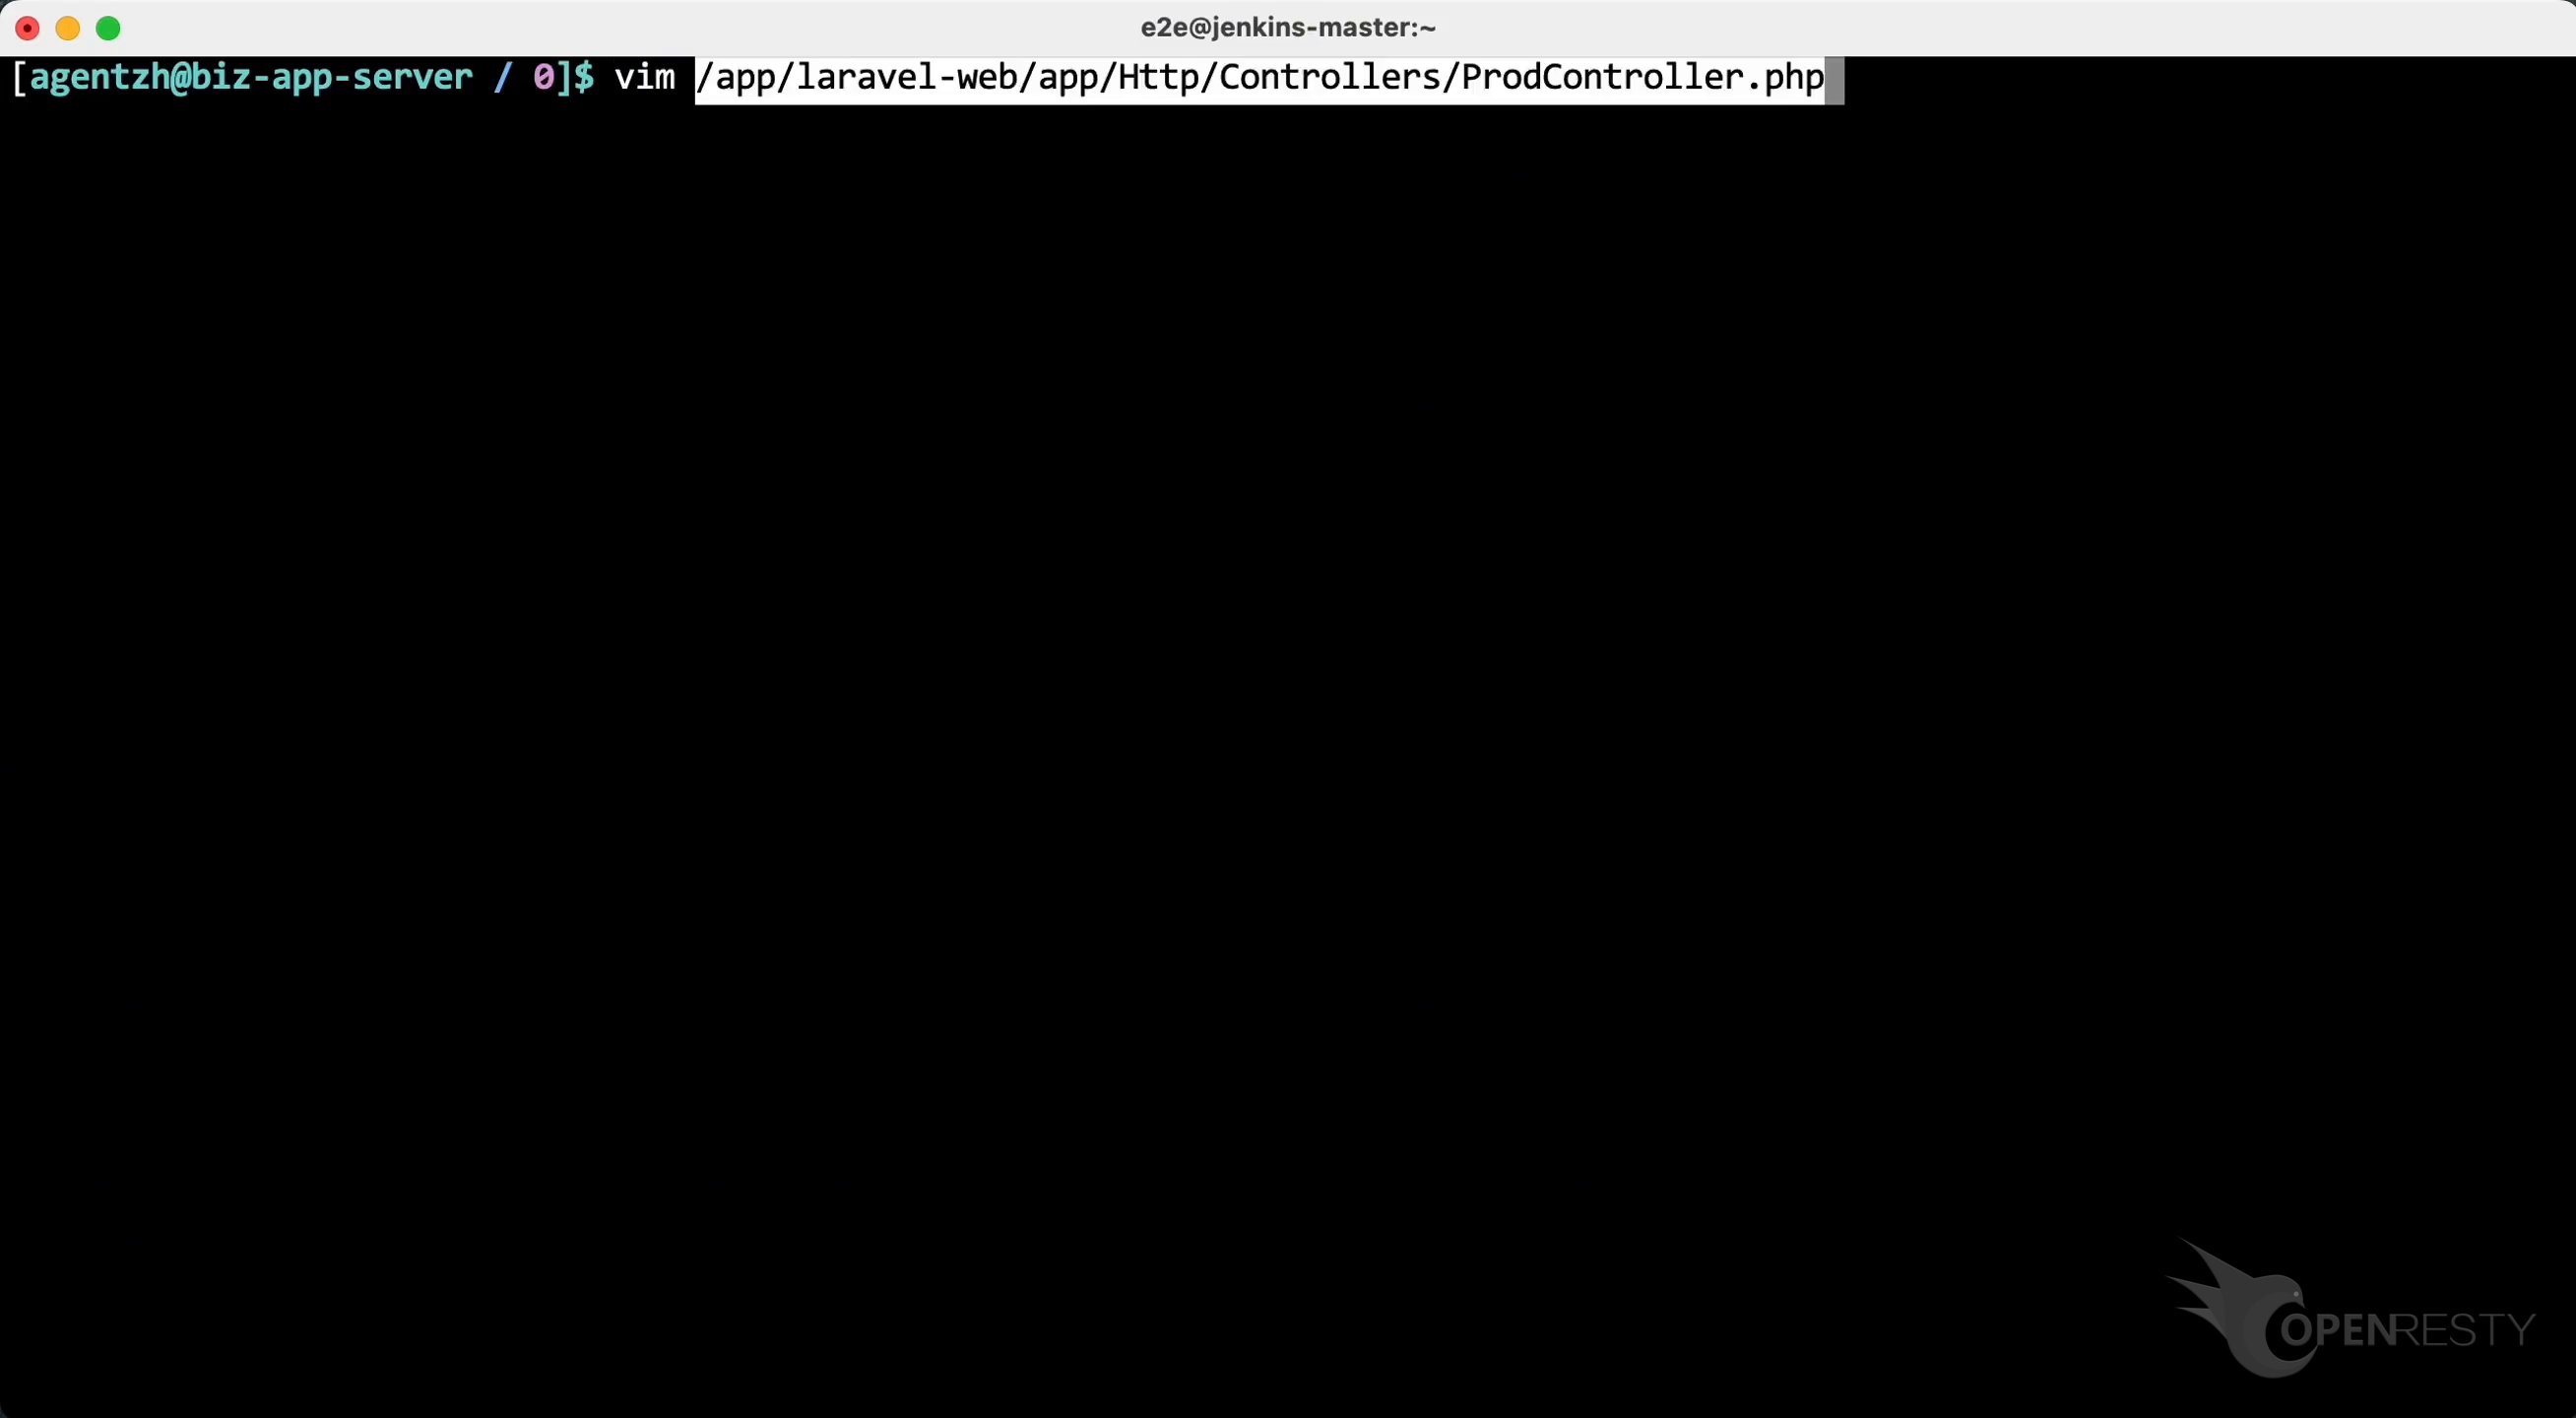
Use the vim editor to open the source file. Paste the file path we just copied. You can use any editor you like.
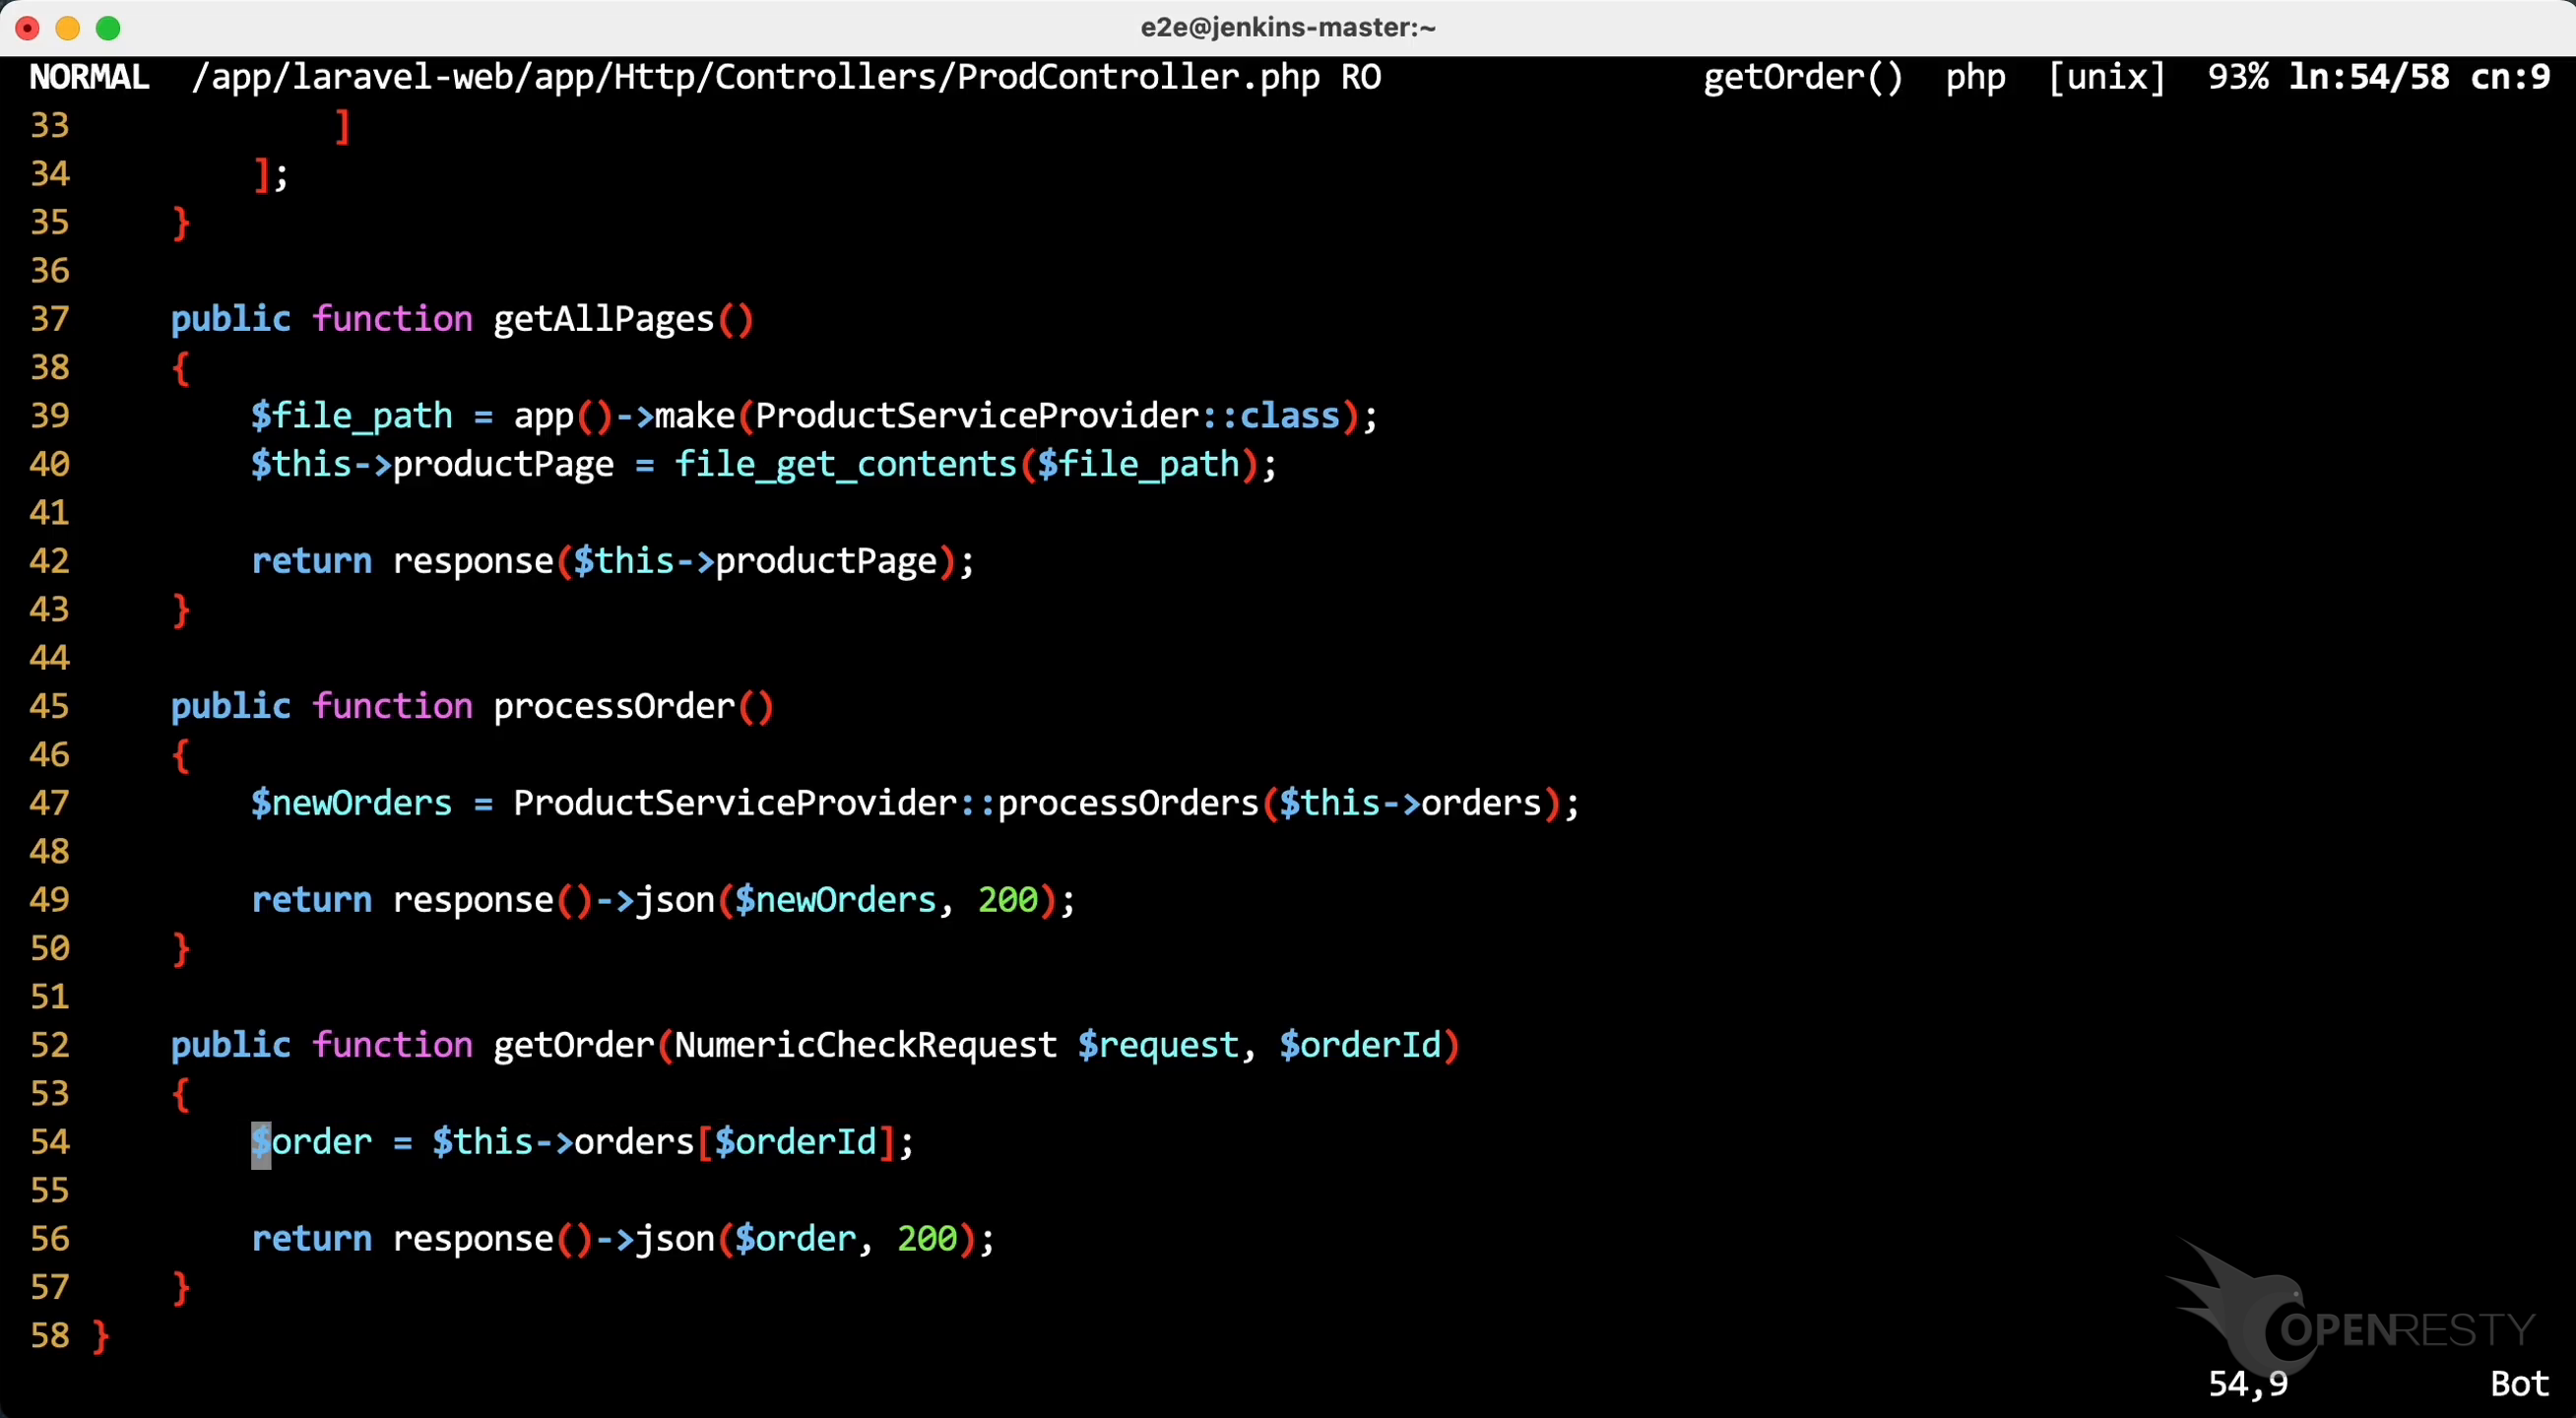
Go to line 54, as OpenResty XRay suggested.
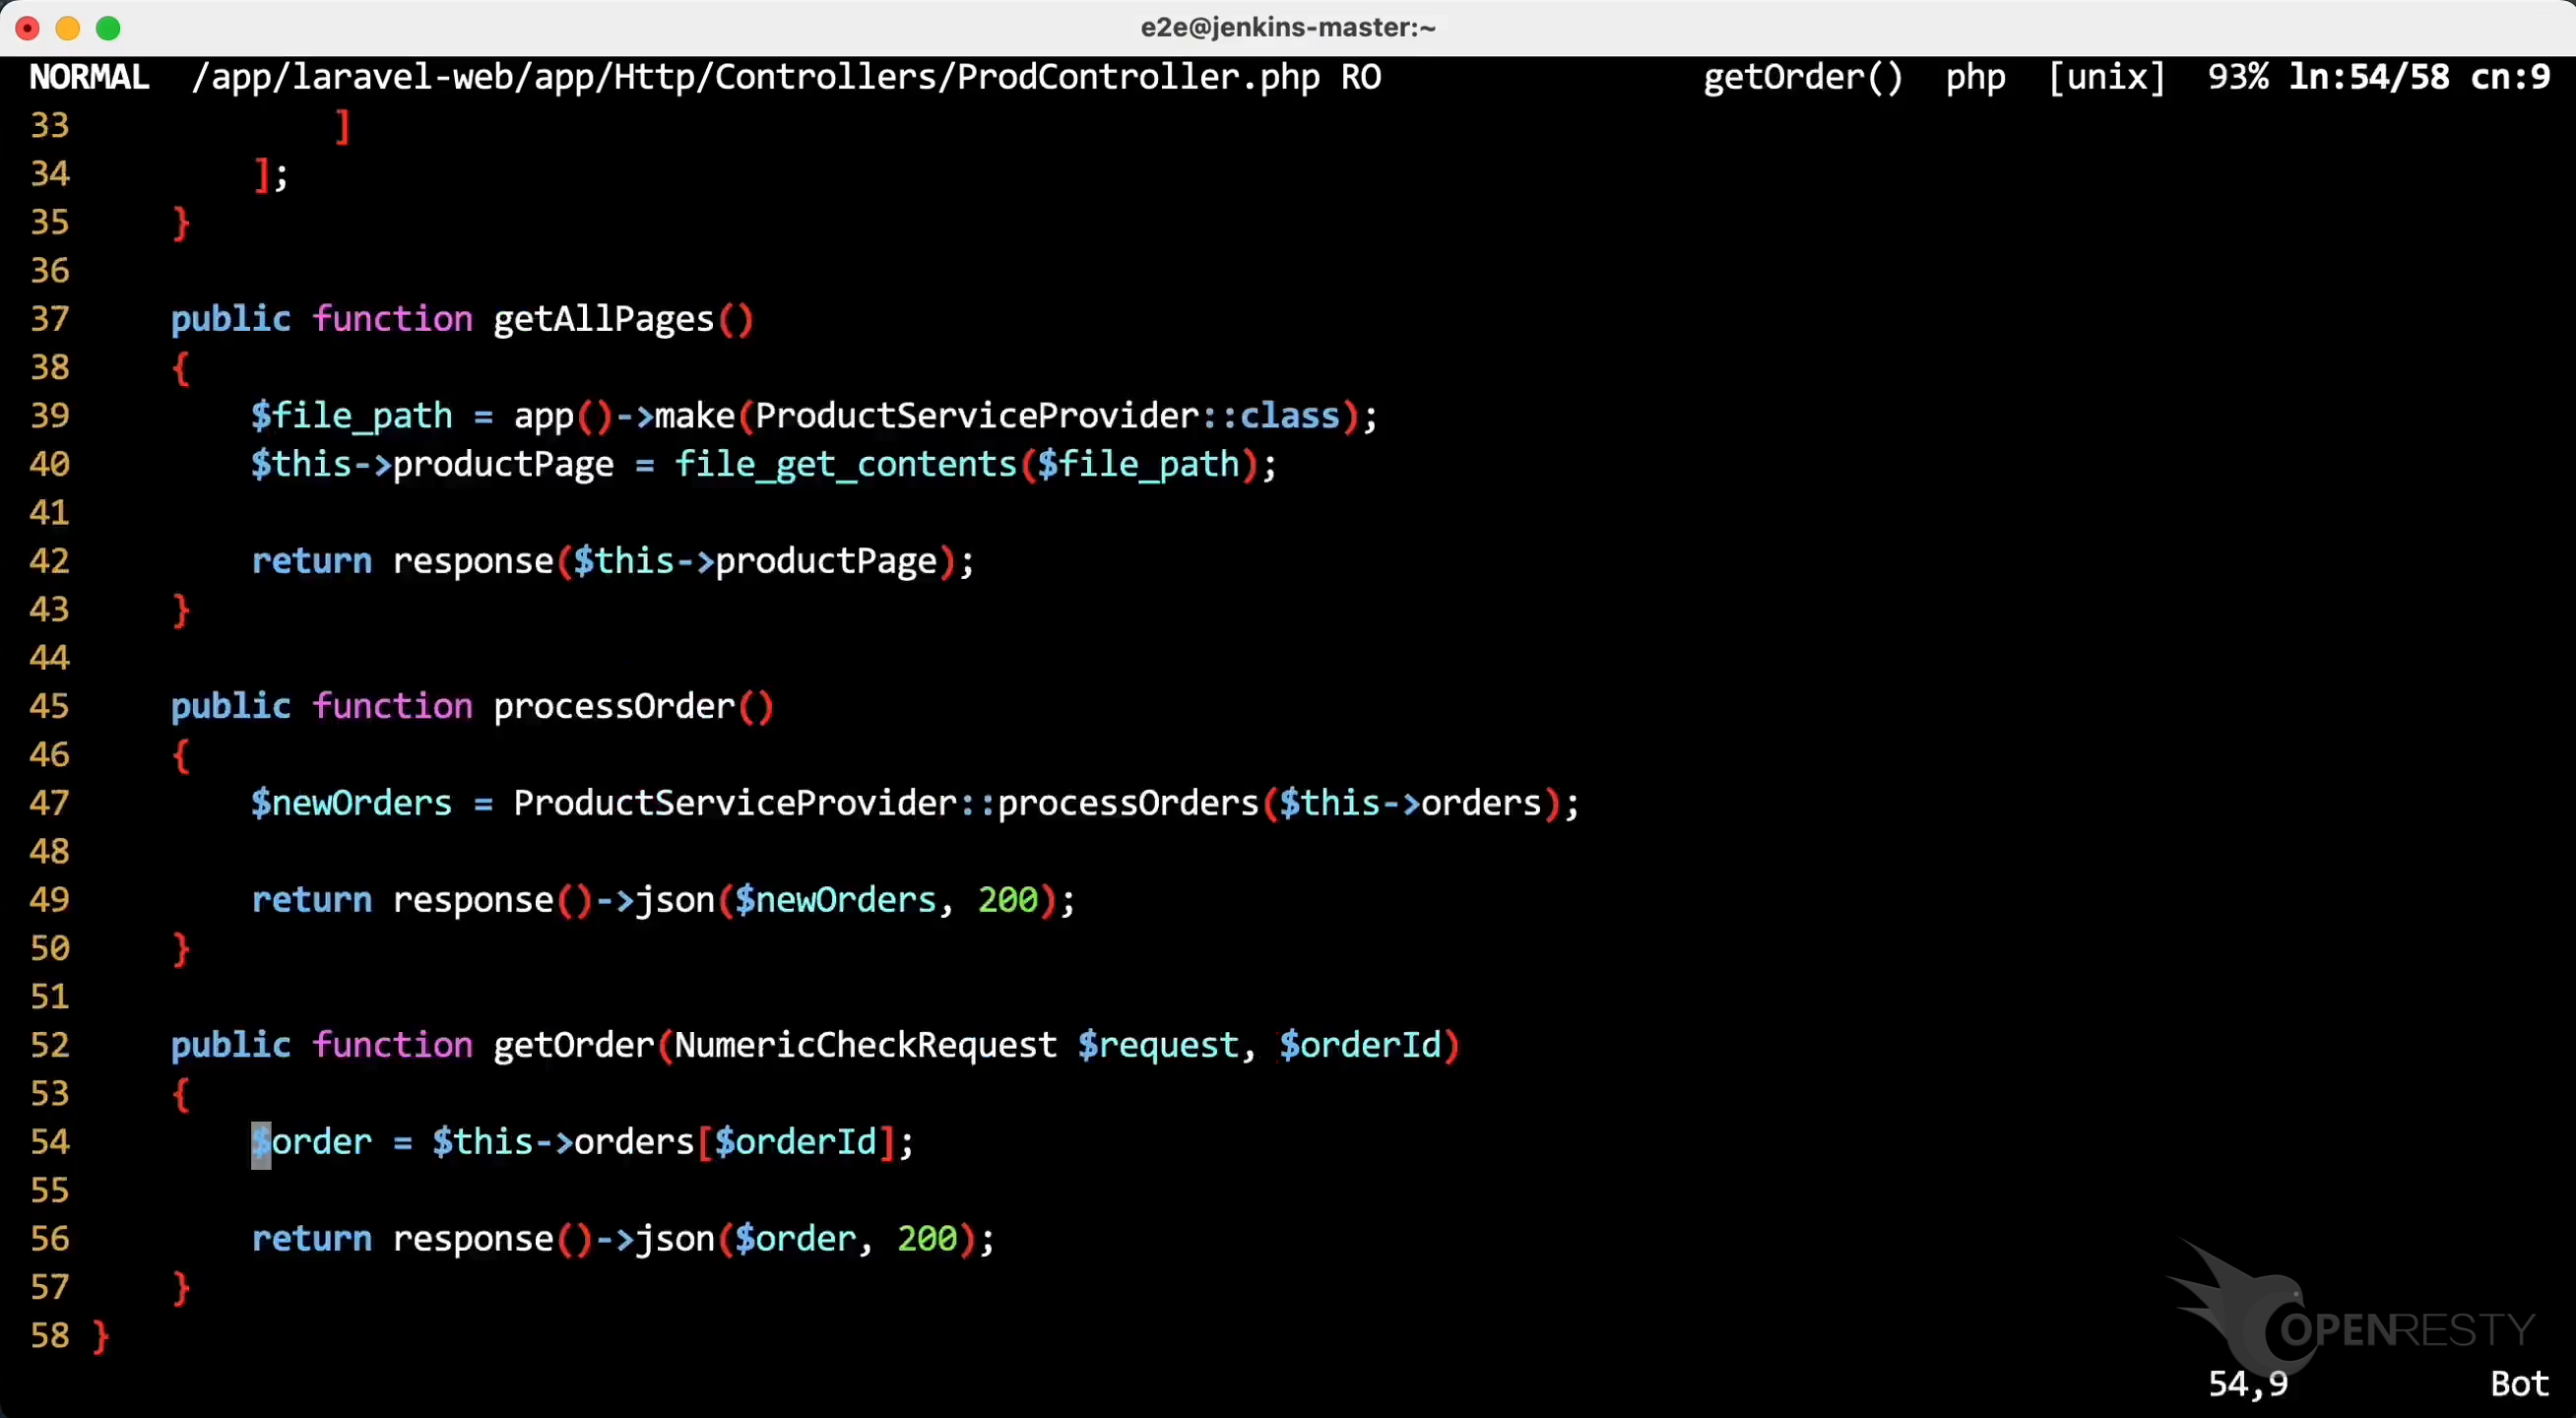
We can see the access to PHP array elements. The value of the orderId variable sometimes clearly exceeds the array boundaries. The user needs to check the value of this array index before this line of source code, but hasn’t done so yet.
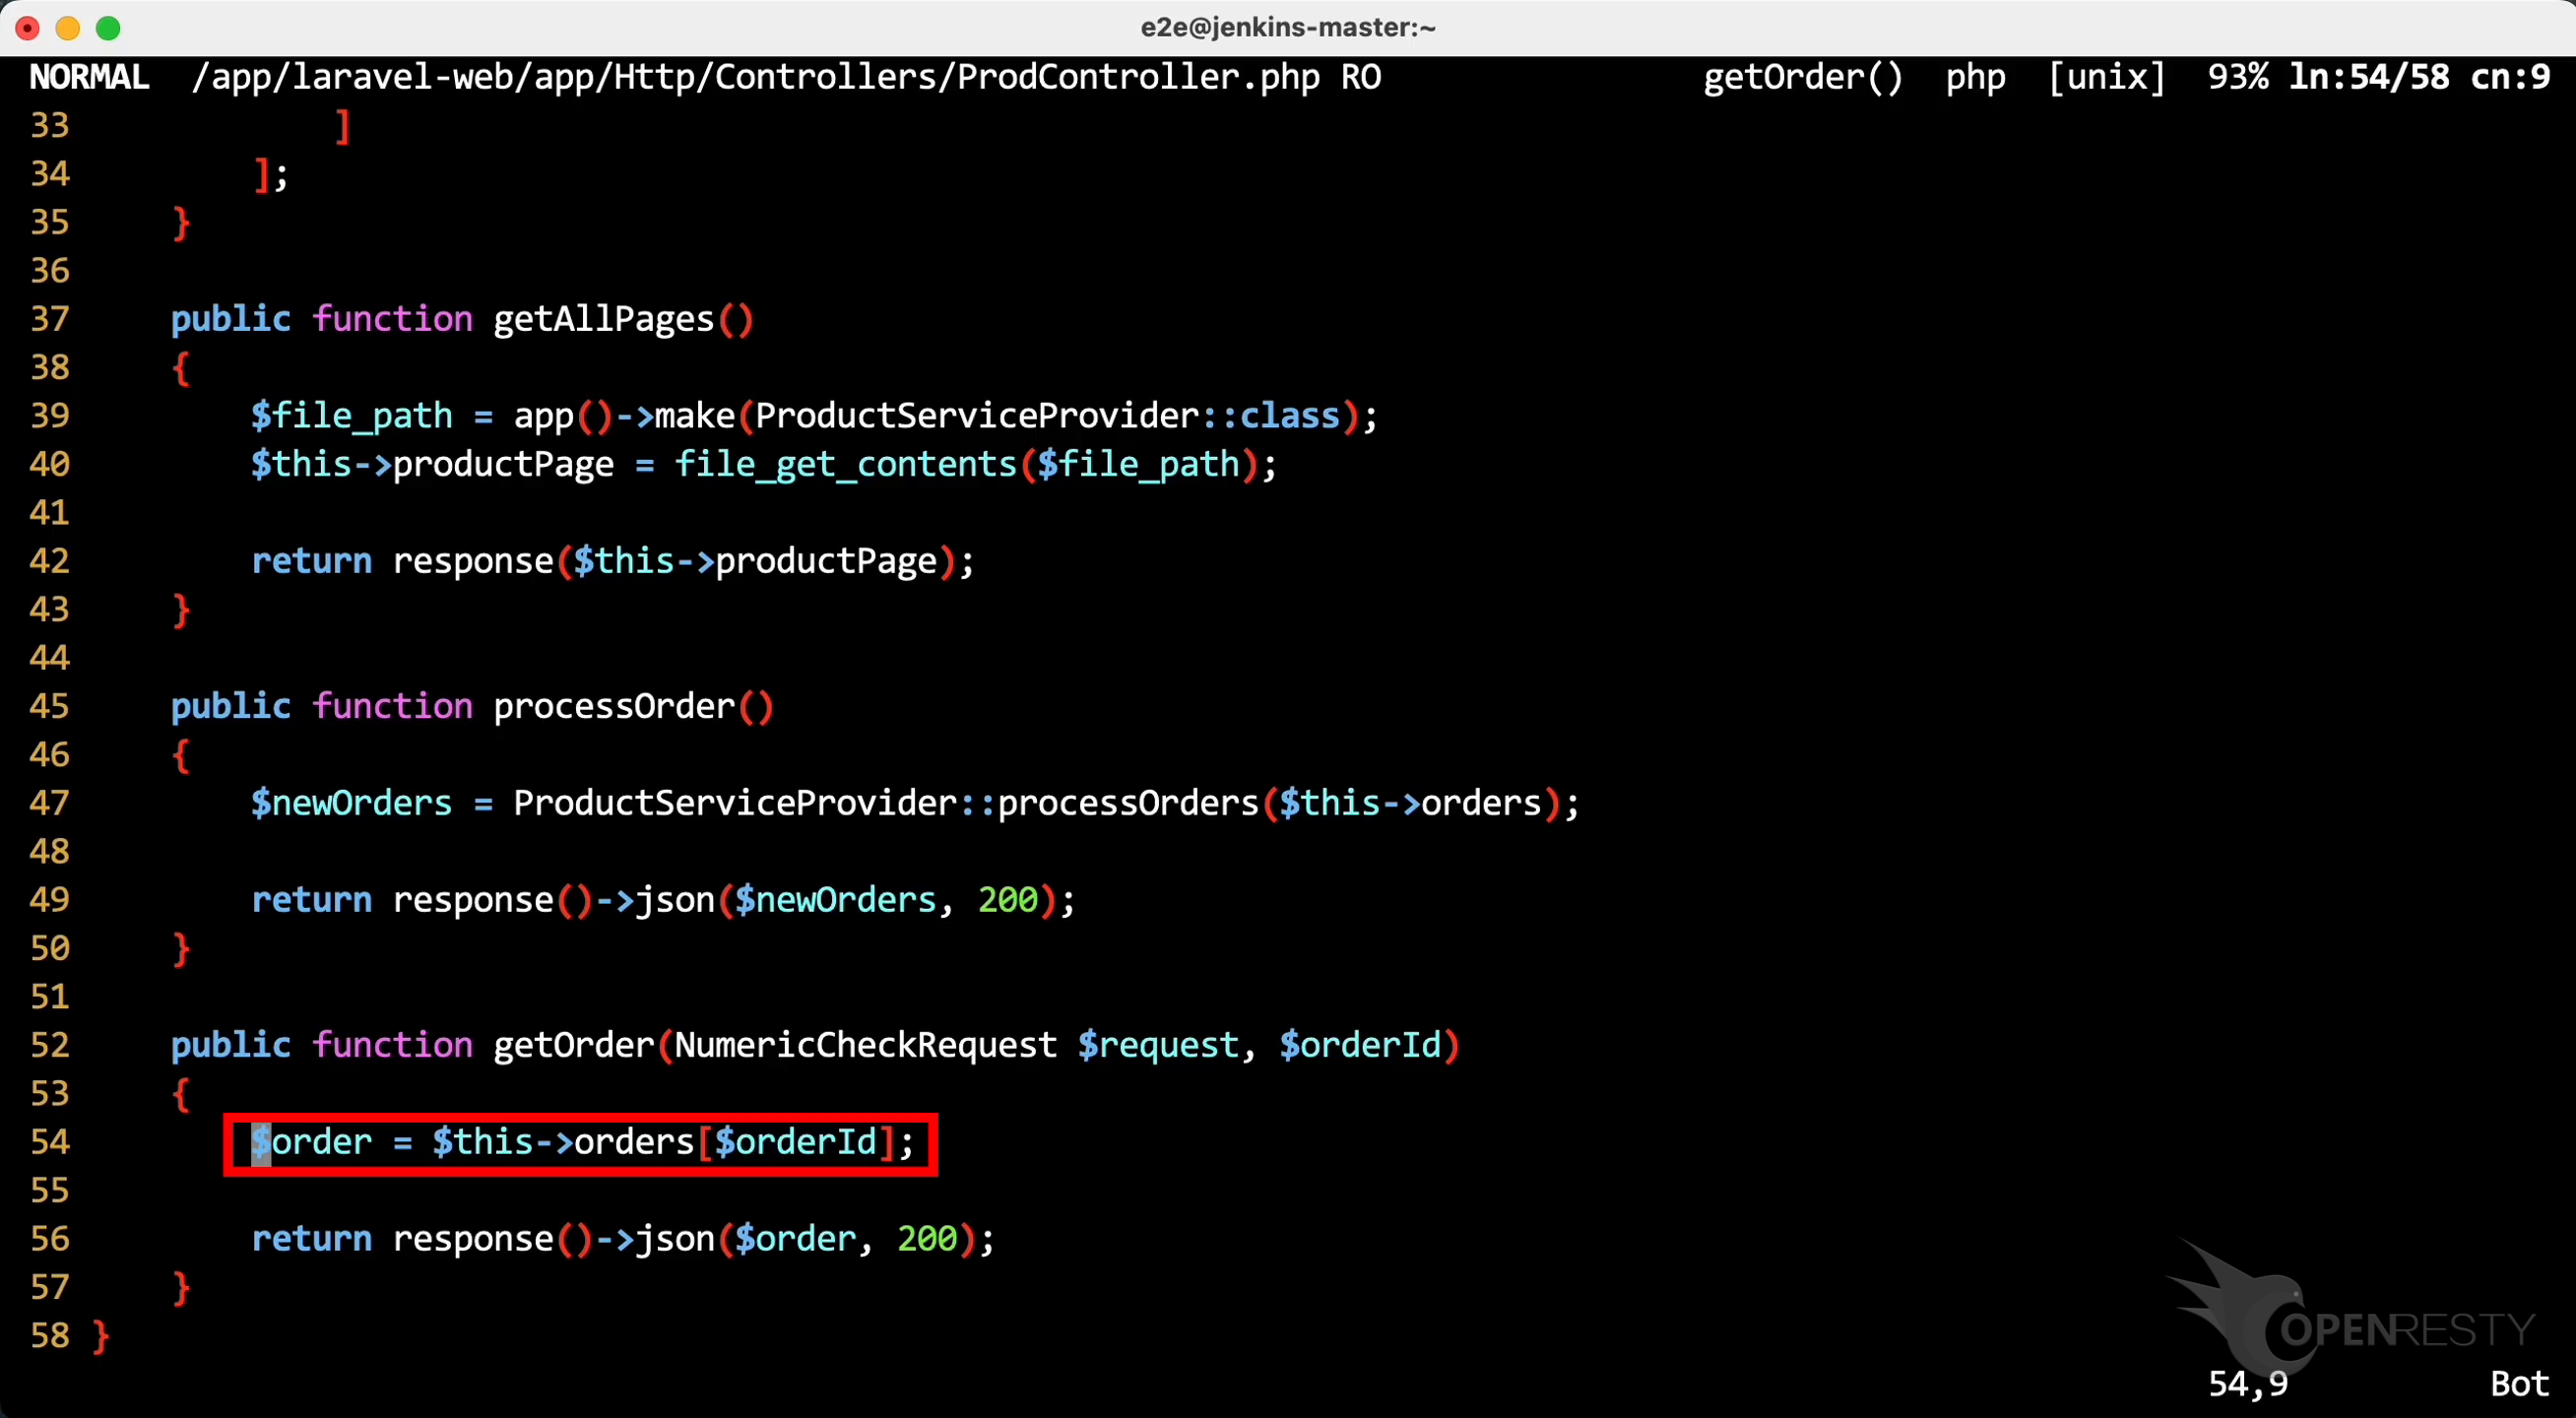
Although this exception is caught by the application itself, OpenResty XRay can still detect it.
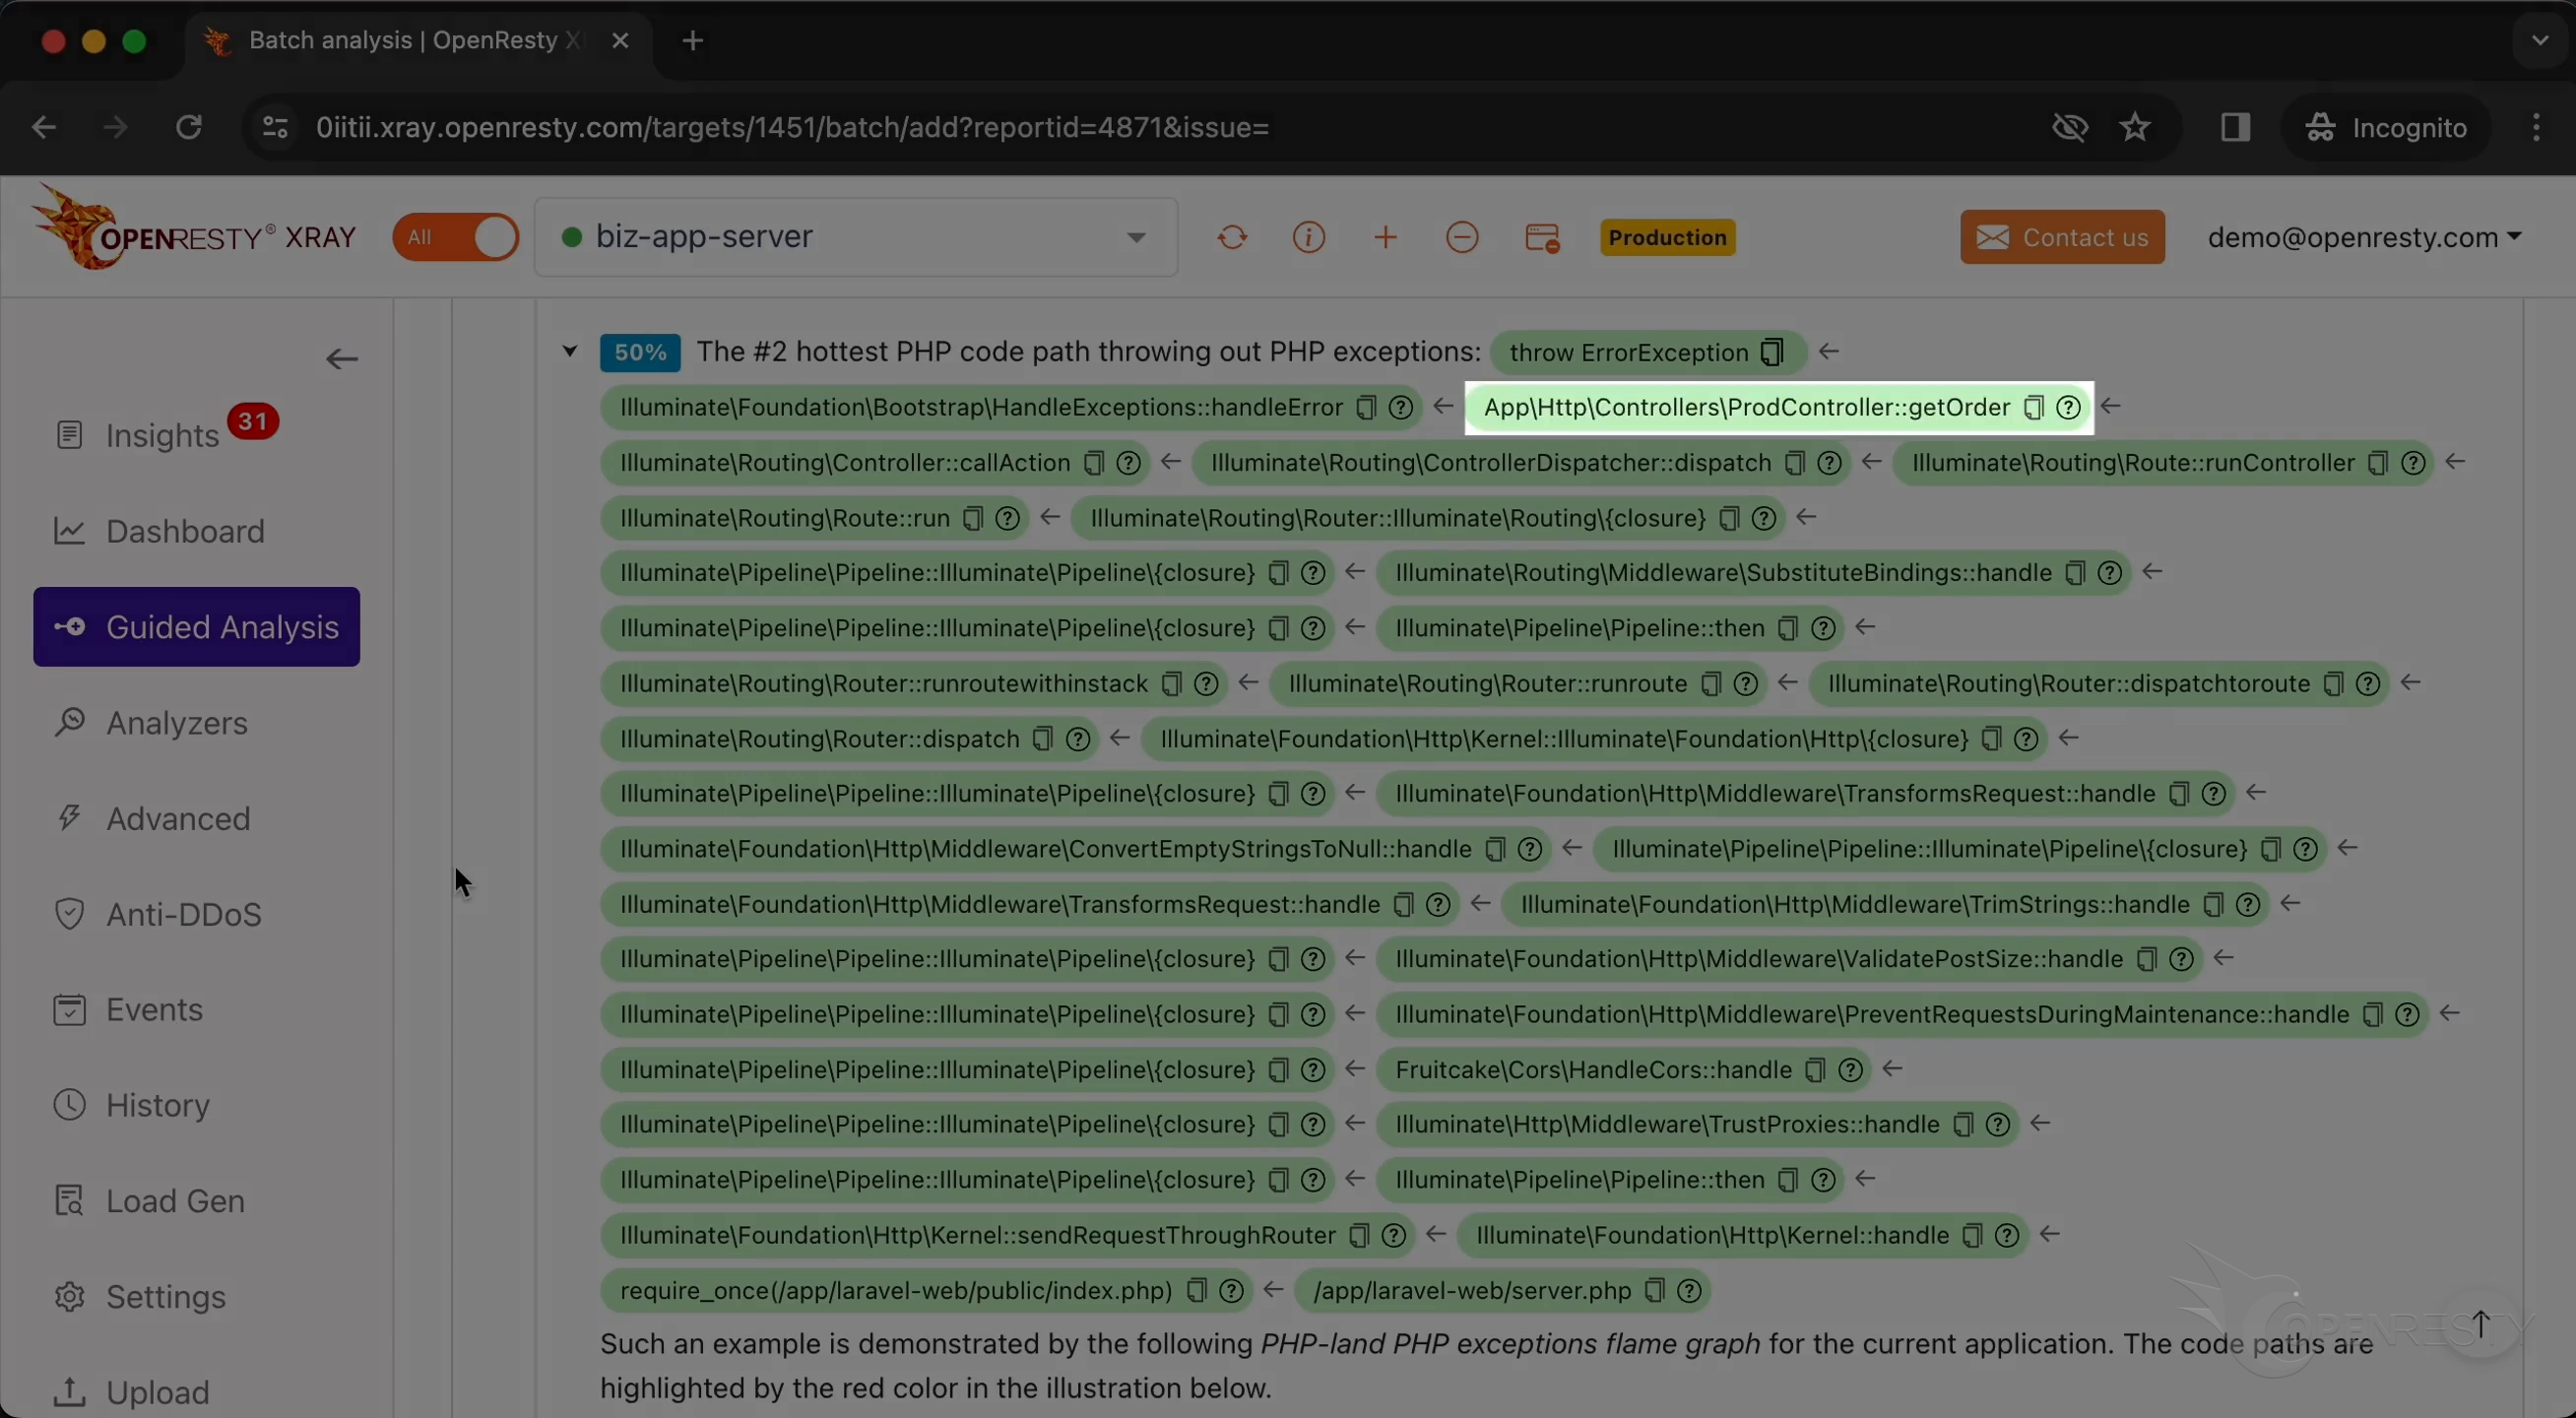
Check the second PHP exception: an explicit throw statement
Next, check the second code path that throws out exceptions.
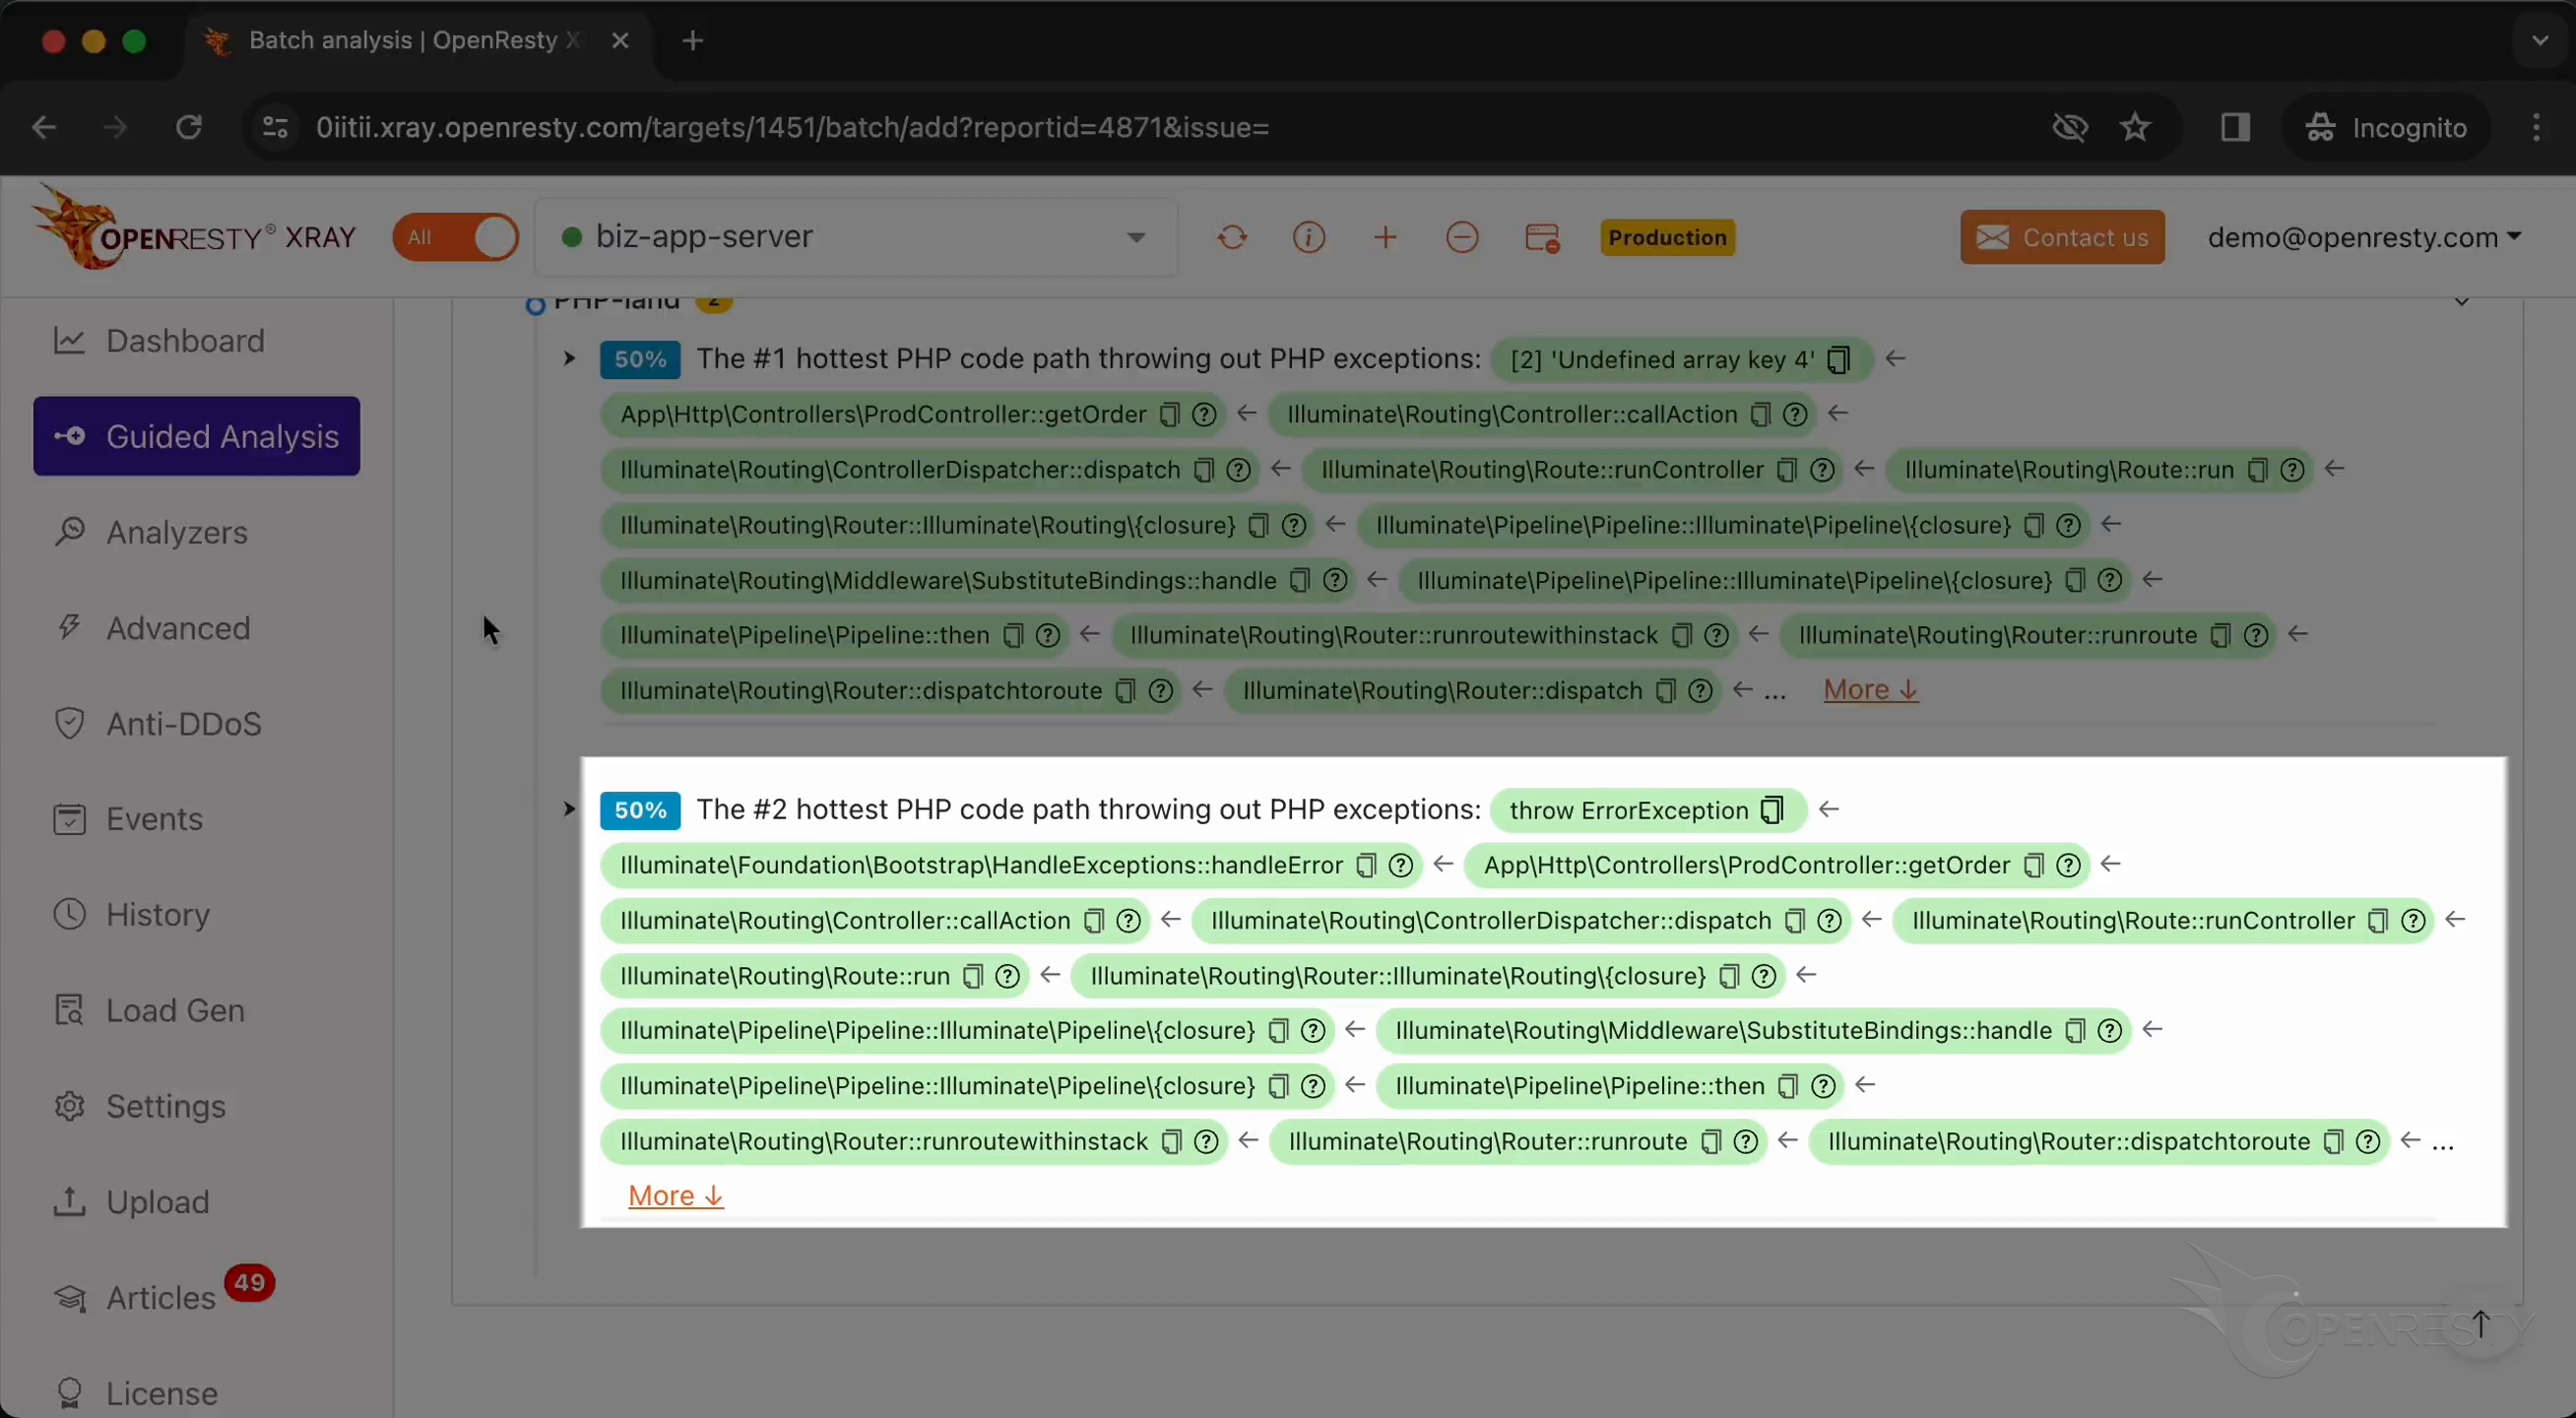
PHP business code actively throws this exception using the throw statement.
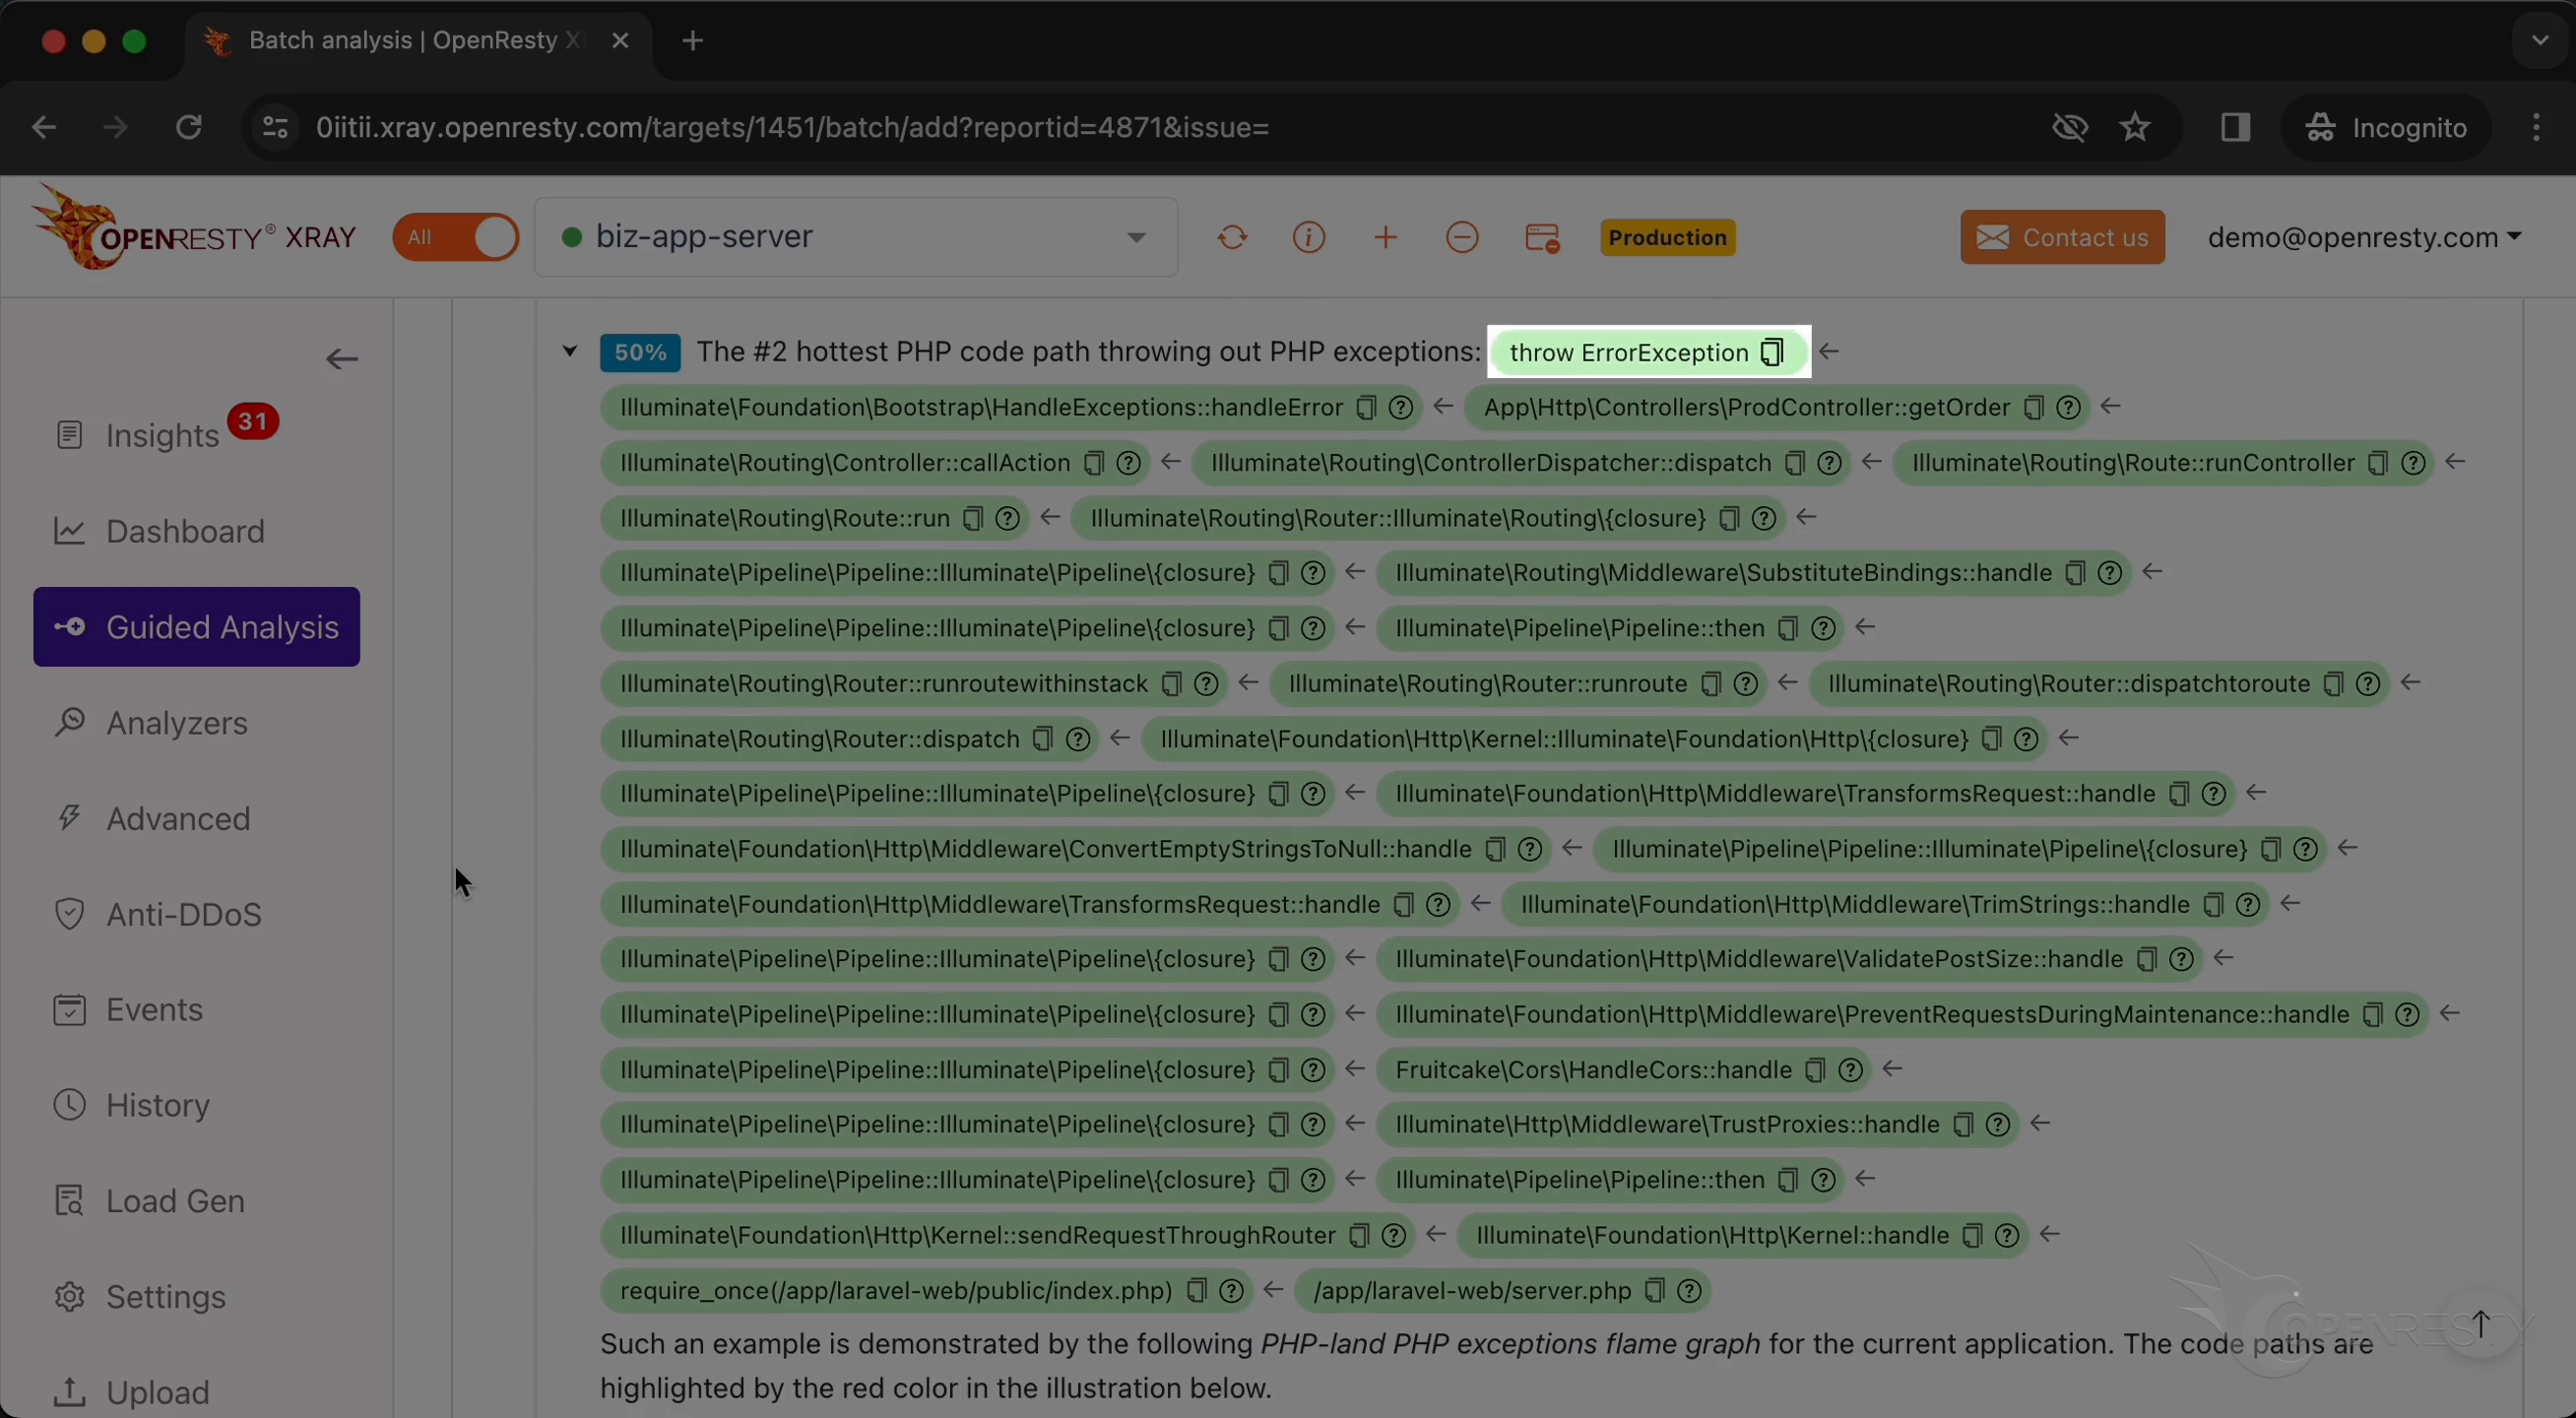
This exception was also triggered by the getOrder function in this code path.
Automatic PHP Exception Reports (No Guided Analysis Needed)
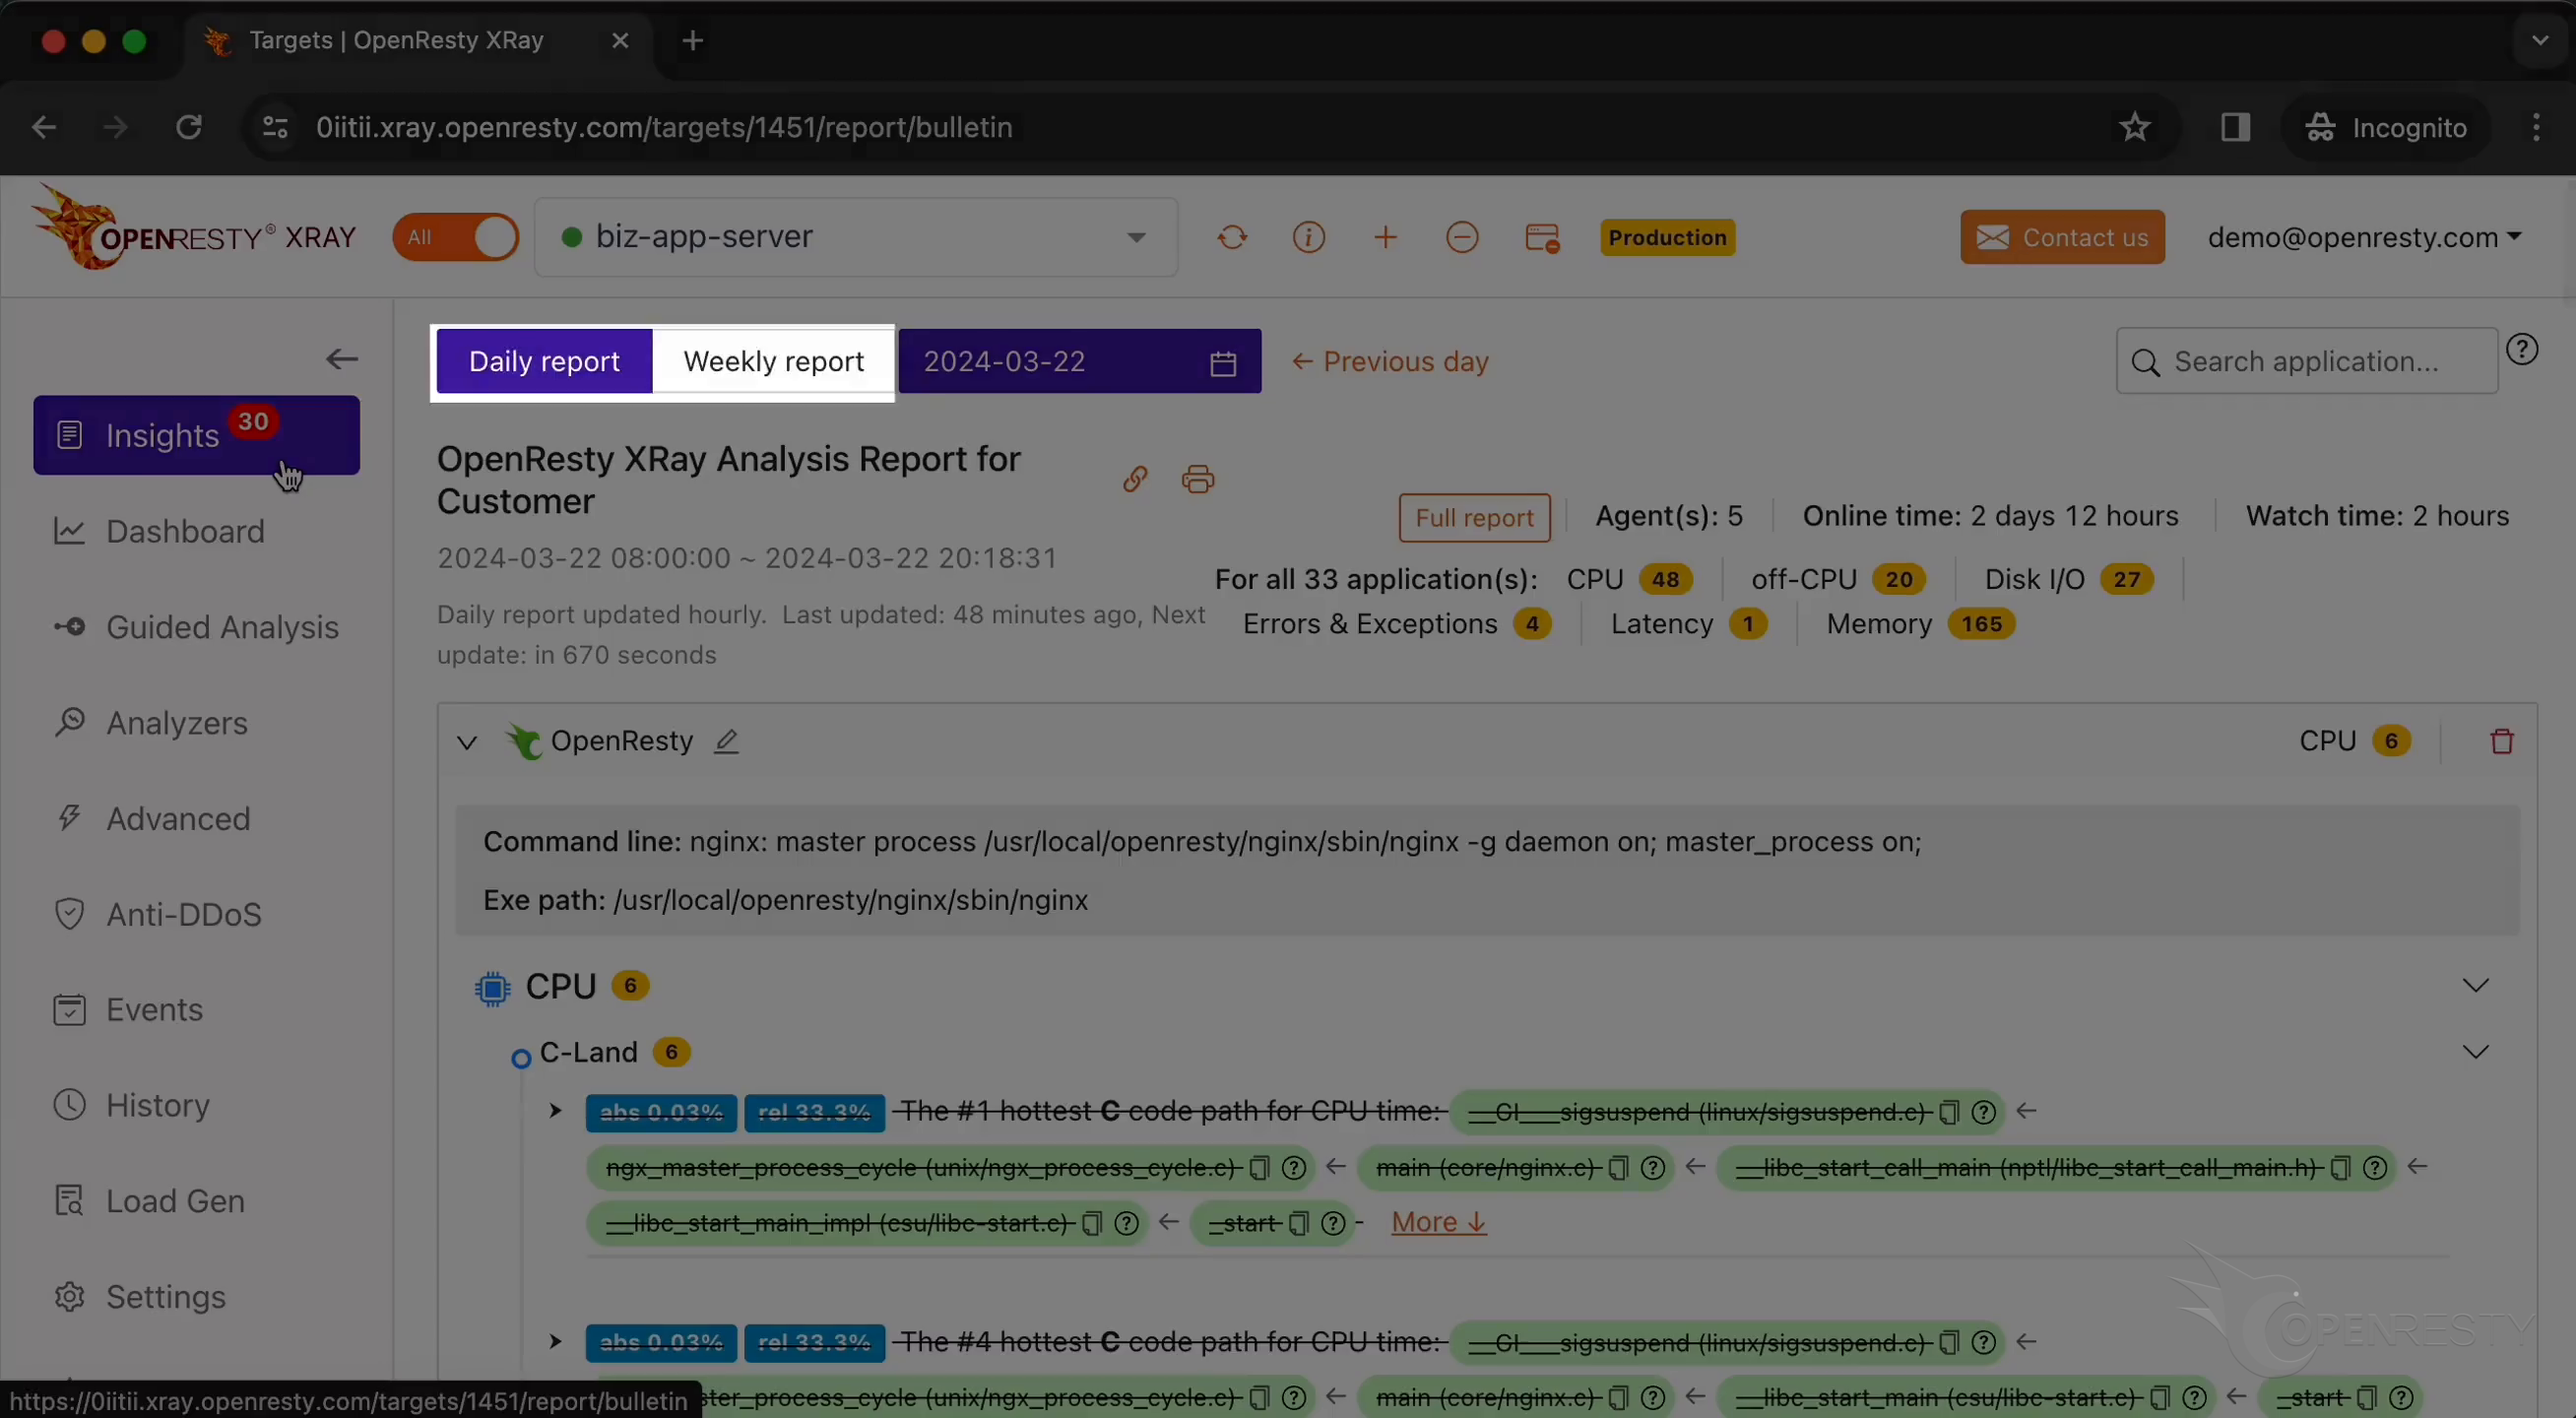
OpenResty XRay can also monitor online processes automatically and generate analysis reports.
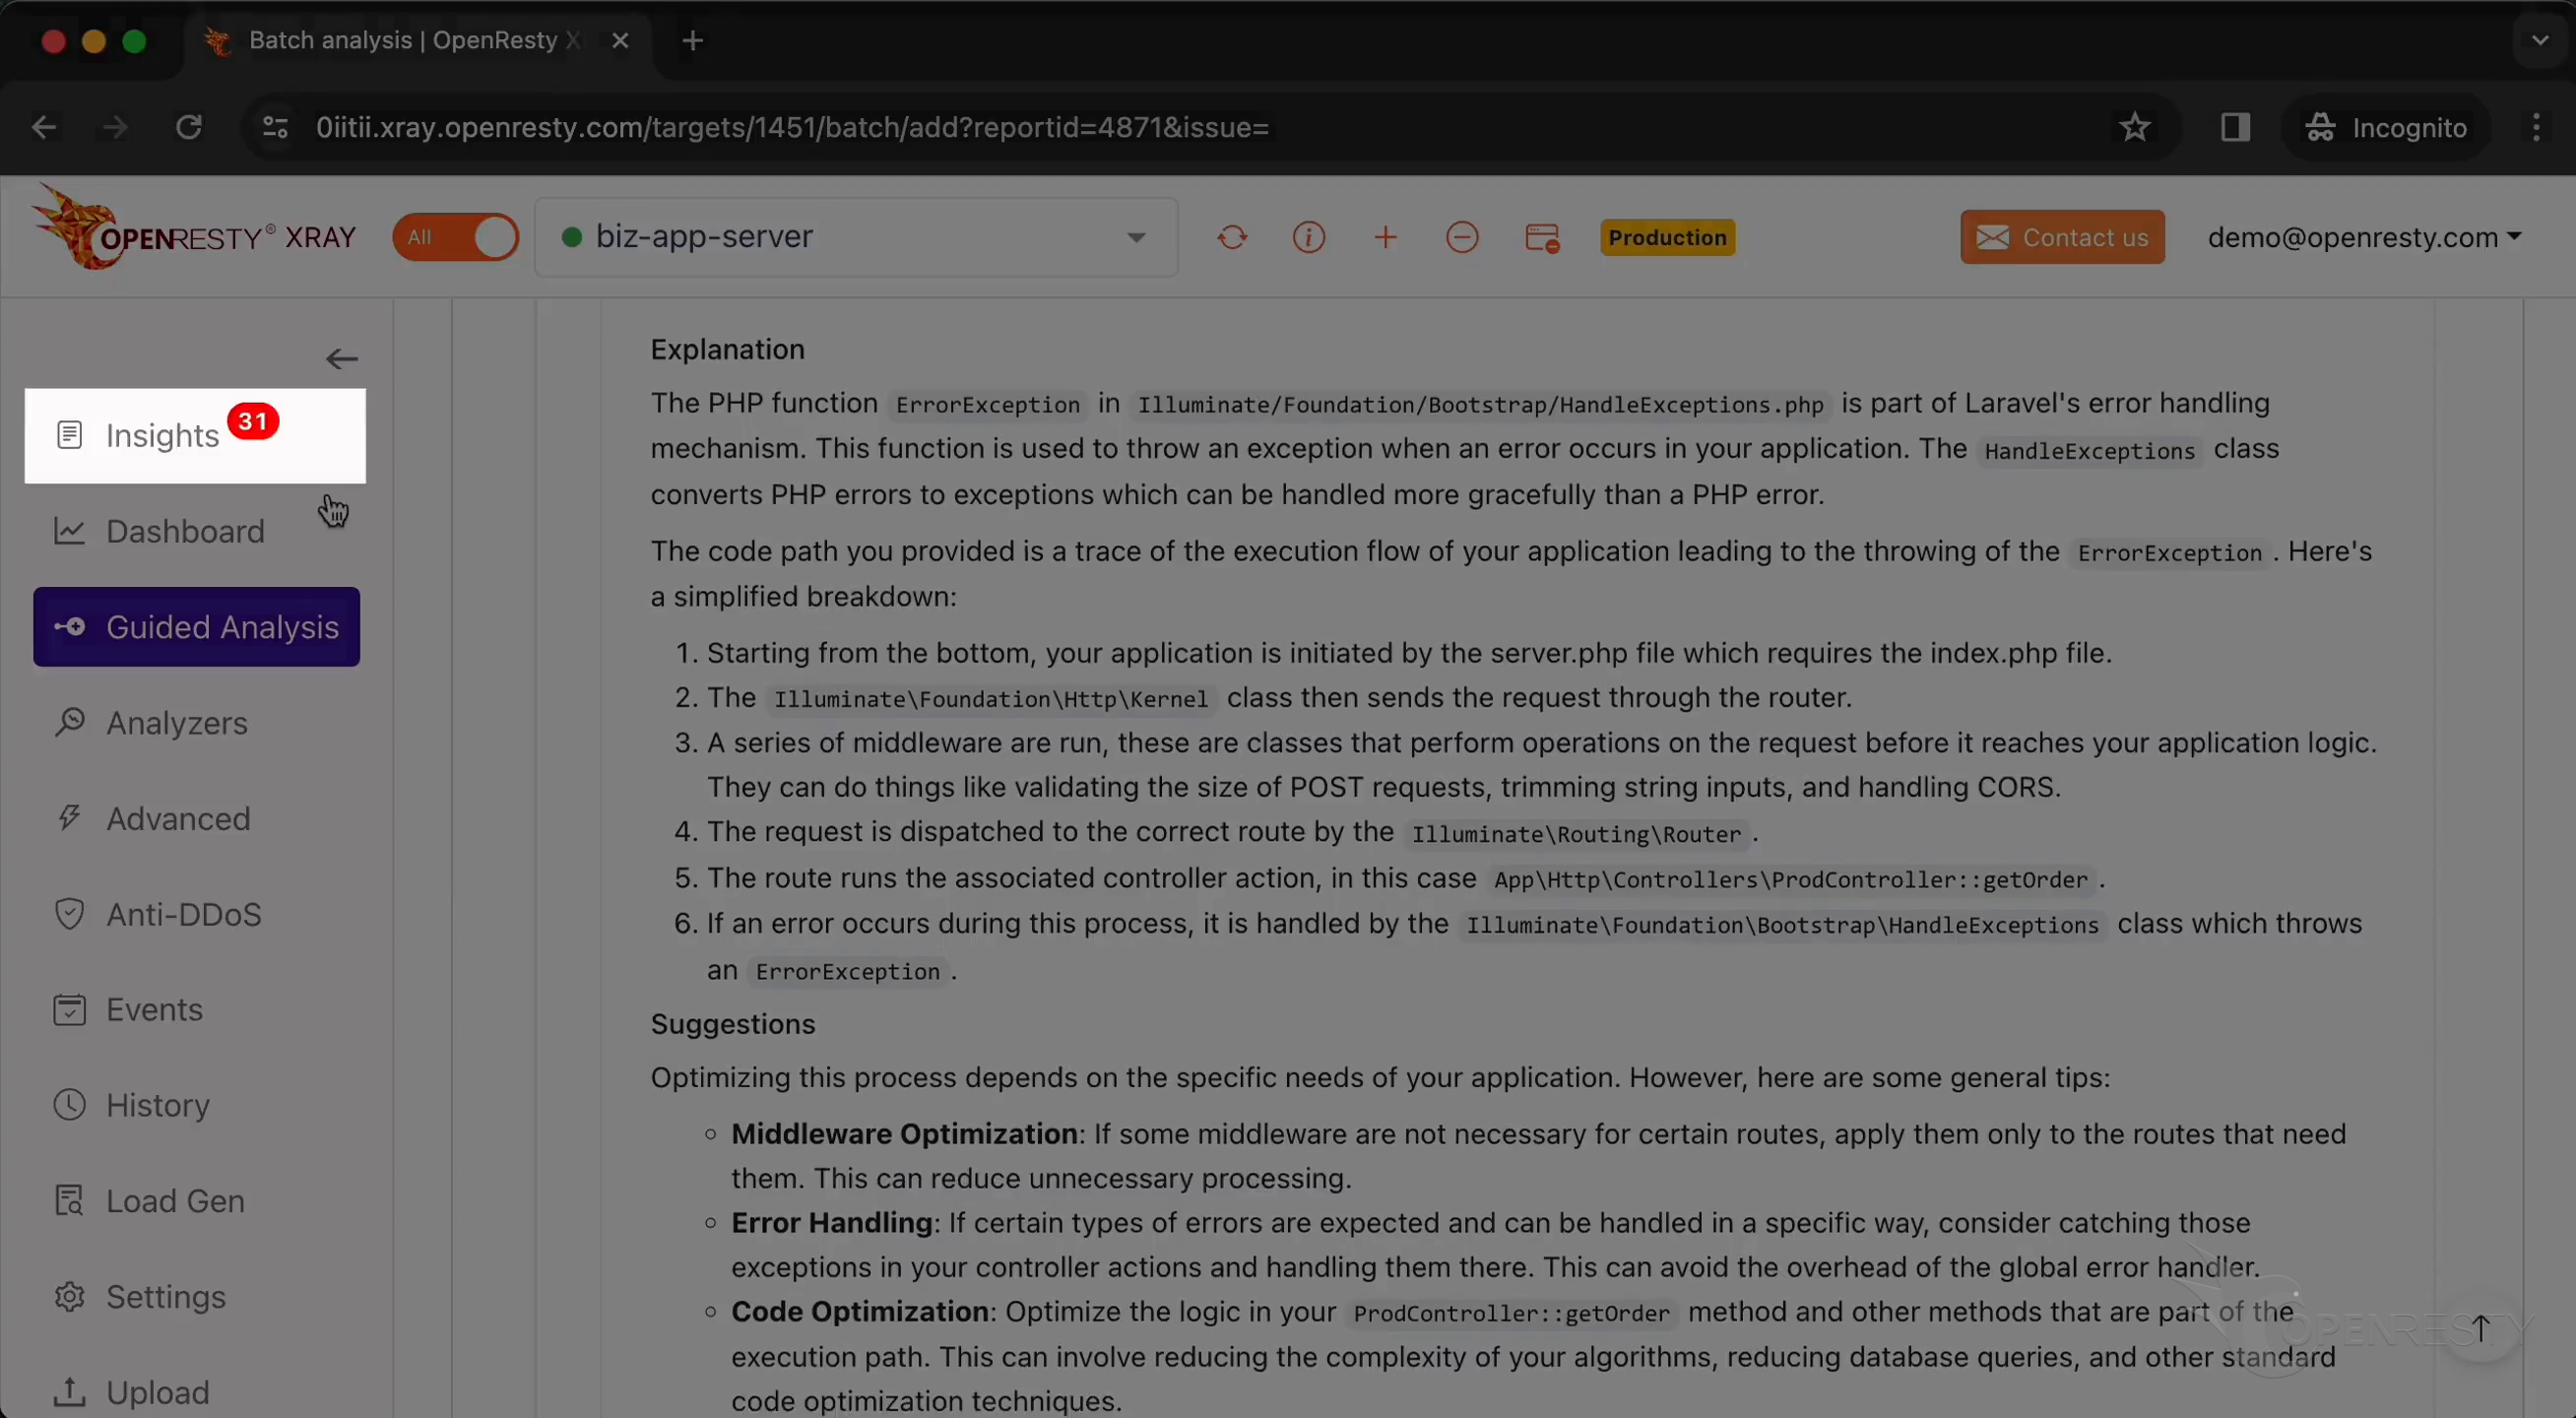
Go to the “Insights” page.
You can find the reports on the “Insights” page for daily and weekly periods. For this reason, you don’t have to use the “Guided Analysis” feature.
Though “Guided analysis” is useful for application development and demonstration purposes.
FAQ
Q: How does OpenResty XRay detect PHP exceptions without restarting the application? A: XRay uses non-intrusive dynamic tracing — powered by its Y language targeting runtimes like Stap+, eBPF+, and GDB — to observe a running PHP process from the outside, so it can capture exceptions without touching the process’s code or lifecycle.
Q: Can OpenResty XRay catch PHP exceptions that the application already handles? A: Yes. Even when an exception is caught by the application itself and never crashes the process, XRay still detects it, exposing the code path that most logging-based approaches miss.
Q: What causes the out-of-bounds array exception shown in this tutorial?
A: The business code in the getOrder function accesses a PHP array using an orderId variable that sometimes exceeds the array’s boundaries, without checking the index value beforehand — a classic out-of-bounds access bug.
Q: Where can I see PHP exception reports without running Guided Analysis? A: The “Insights” page in the XRay console generates daily and weekly reports automatically, so you don’t need to run a Guided Analysis session each time you want to check for new exceptions.
Related: When the same PHP process eats CPU instead of throwing, see diagnosing PHP high CPU usage. OpenResty XRay catches runtime failures the same non-invasive way in other languages — Perl exceptions, Go panics, and Rust panics.
What is OpenResty XRay
OpenResty XRay is a dynamic-tracing product that automatically analyzes your running applications to troubleshoot performance problems, behavioral issues, and security vulnerabilities with actionable suggestions. Under the hood, OpenResty XRay is powered by our Y language targeting various runtimes like Stap+, eBPF+, GDB, and ODB, depending on the contexts.
If you like this tutorial, please subscribe to this blog site and/or our YouTube channel. Thank you!
About The Author
Yichun Zhang (Github handle: agentzh), is the original creator of the OpenResty® open-source project and the CEO of OpenResty Inc..
Yichun is one of the earliest advocates and leaders of “open-source technology”. He worked at many internationally renowned tech companies, such as Cloudflare, Yahoo!. He is a pioneer of “edge computing”, “dynamic tracing” and “machine coding”, with over 22 years of programming and 16 years of open source experience. Yichun is well-known in the open-source space as the project leader of OpenResty®, adopted by more than 40 million global website domains.
OpenResty Inc., the enterprise software start-up founded by Yichun in 2017, has customers from some of the biggest companies in the world. Its flagship product, OpenResty XRay, is a non-invasive profiling and troubleshooting tool that significantly enhances and utilizes dynamic tracing technology. And its OpenResty Edge product is a powerful distributed traffic management and private CDN software product.
As an avid open-source contributor, Yichun has contributed more than a million lines of code to numerous open-source projects, including Linux kernel, Nginx, LuaJIT, GDB, SystemTap, LLVM, Perl, etc. He has also authored more than 60 open-source software libraries.
Related Articles
OpenResty XRay May 11, 2024

OpenResty XRay Mar 30, 2024

OpenResty XRay Feb 27, 2024

OpenResty XRay Feb 19, 2024

OpenResty XRay Feb 1, 2024