Locate the Largest Memory Objects in a Live Perl Process
To find what’s consuming memory in a running Perl process, profile it with OpenResty XRay: it attaches to the unmodified process, ranks live Perl objects and values by the memory they hold, and traces the largest one back to its exact variable and source line via a data reference path — no code changes and no restart.
This tutorial walks through that with OpenResty XRay’s guided analysis and the Perl object memory distribution flame graph we invented — in a real case, a 180MB Perl process whose memory turned out to be dominated by a single hash named order_name_cache.
Symptom: a Perl process using high memory in top
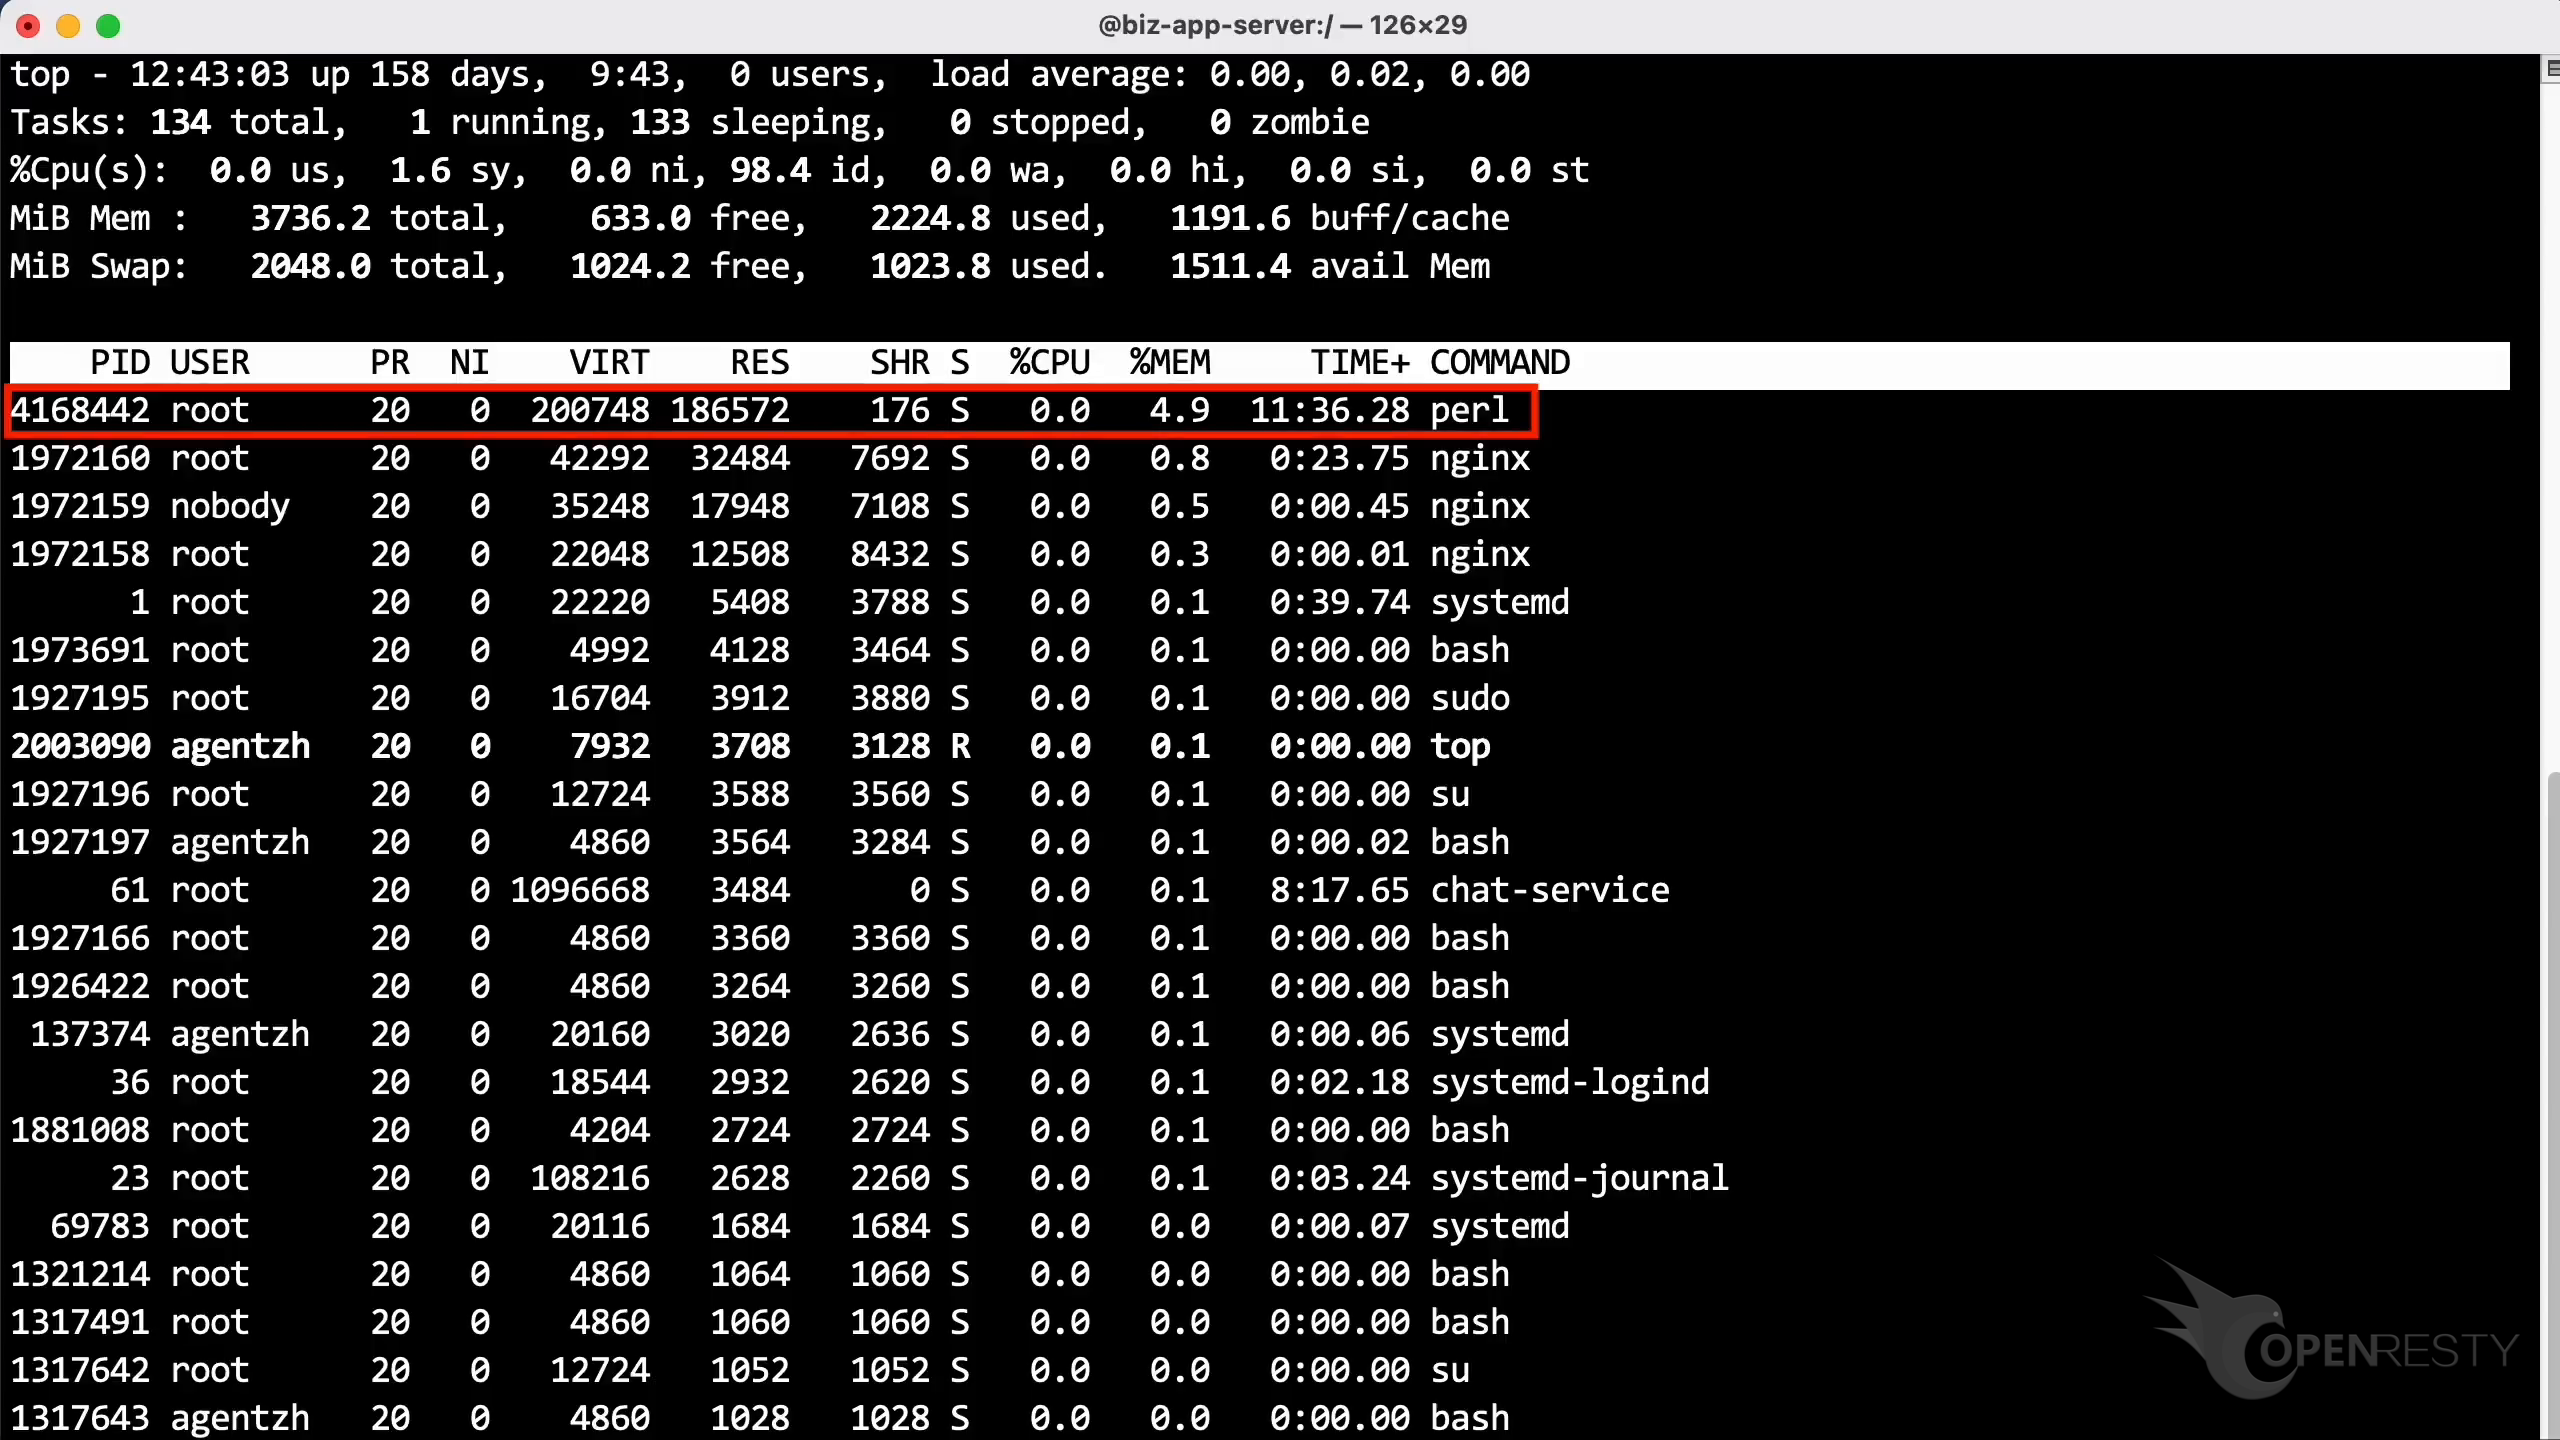
First, run the top command to check the memory usage of each process. As shown, one Perl process uses the most memory — more than 180MB.
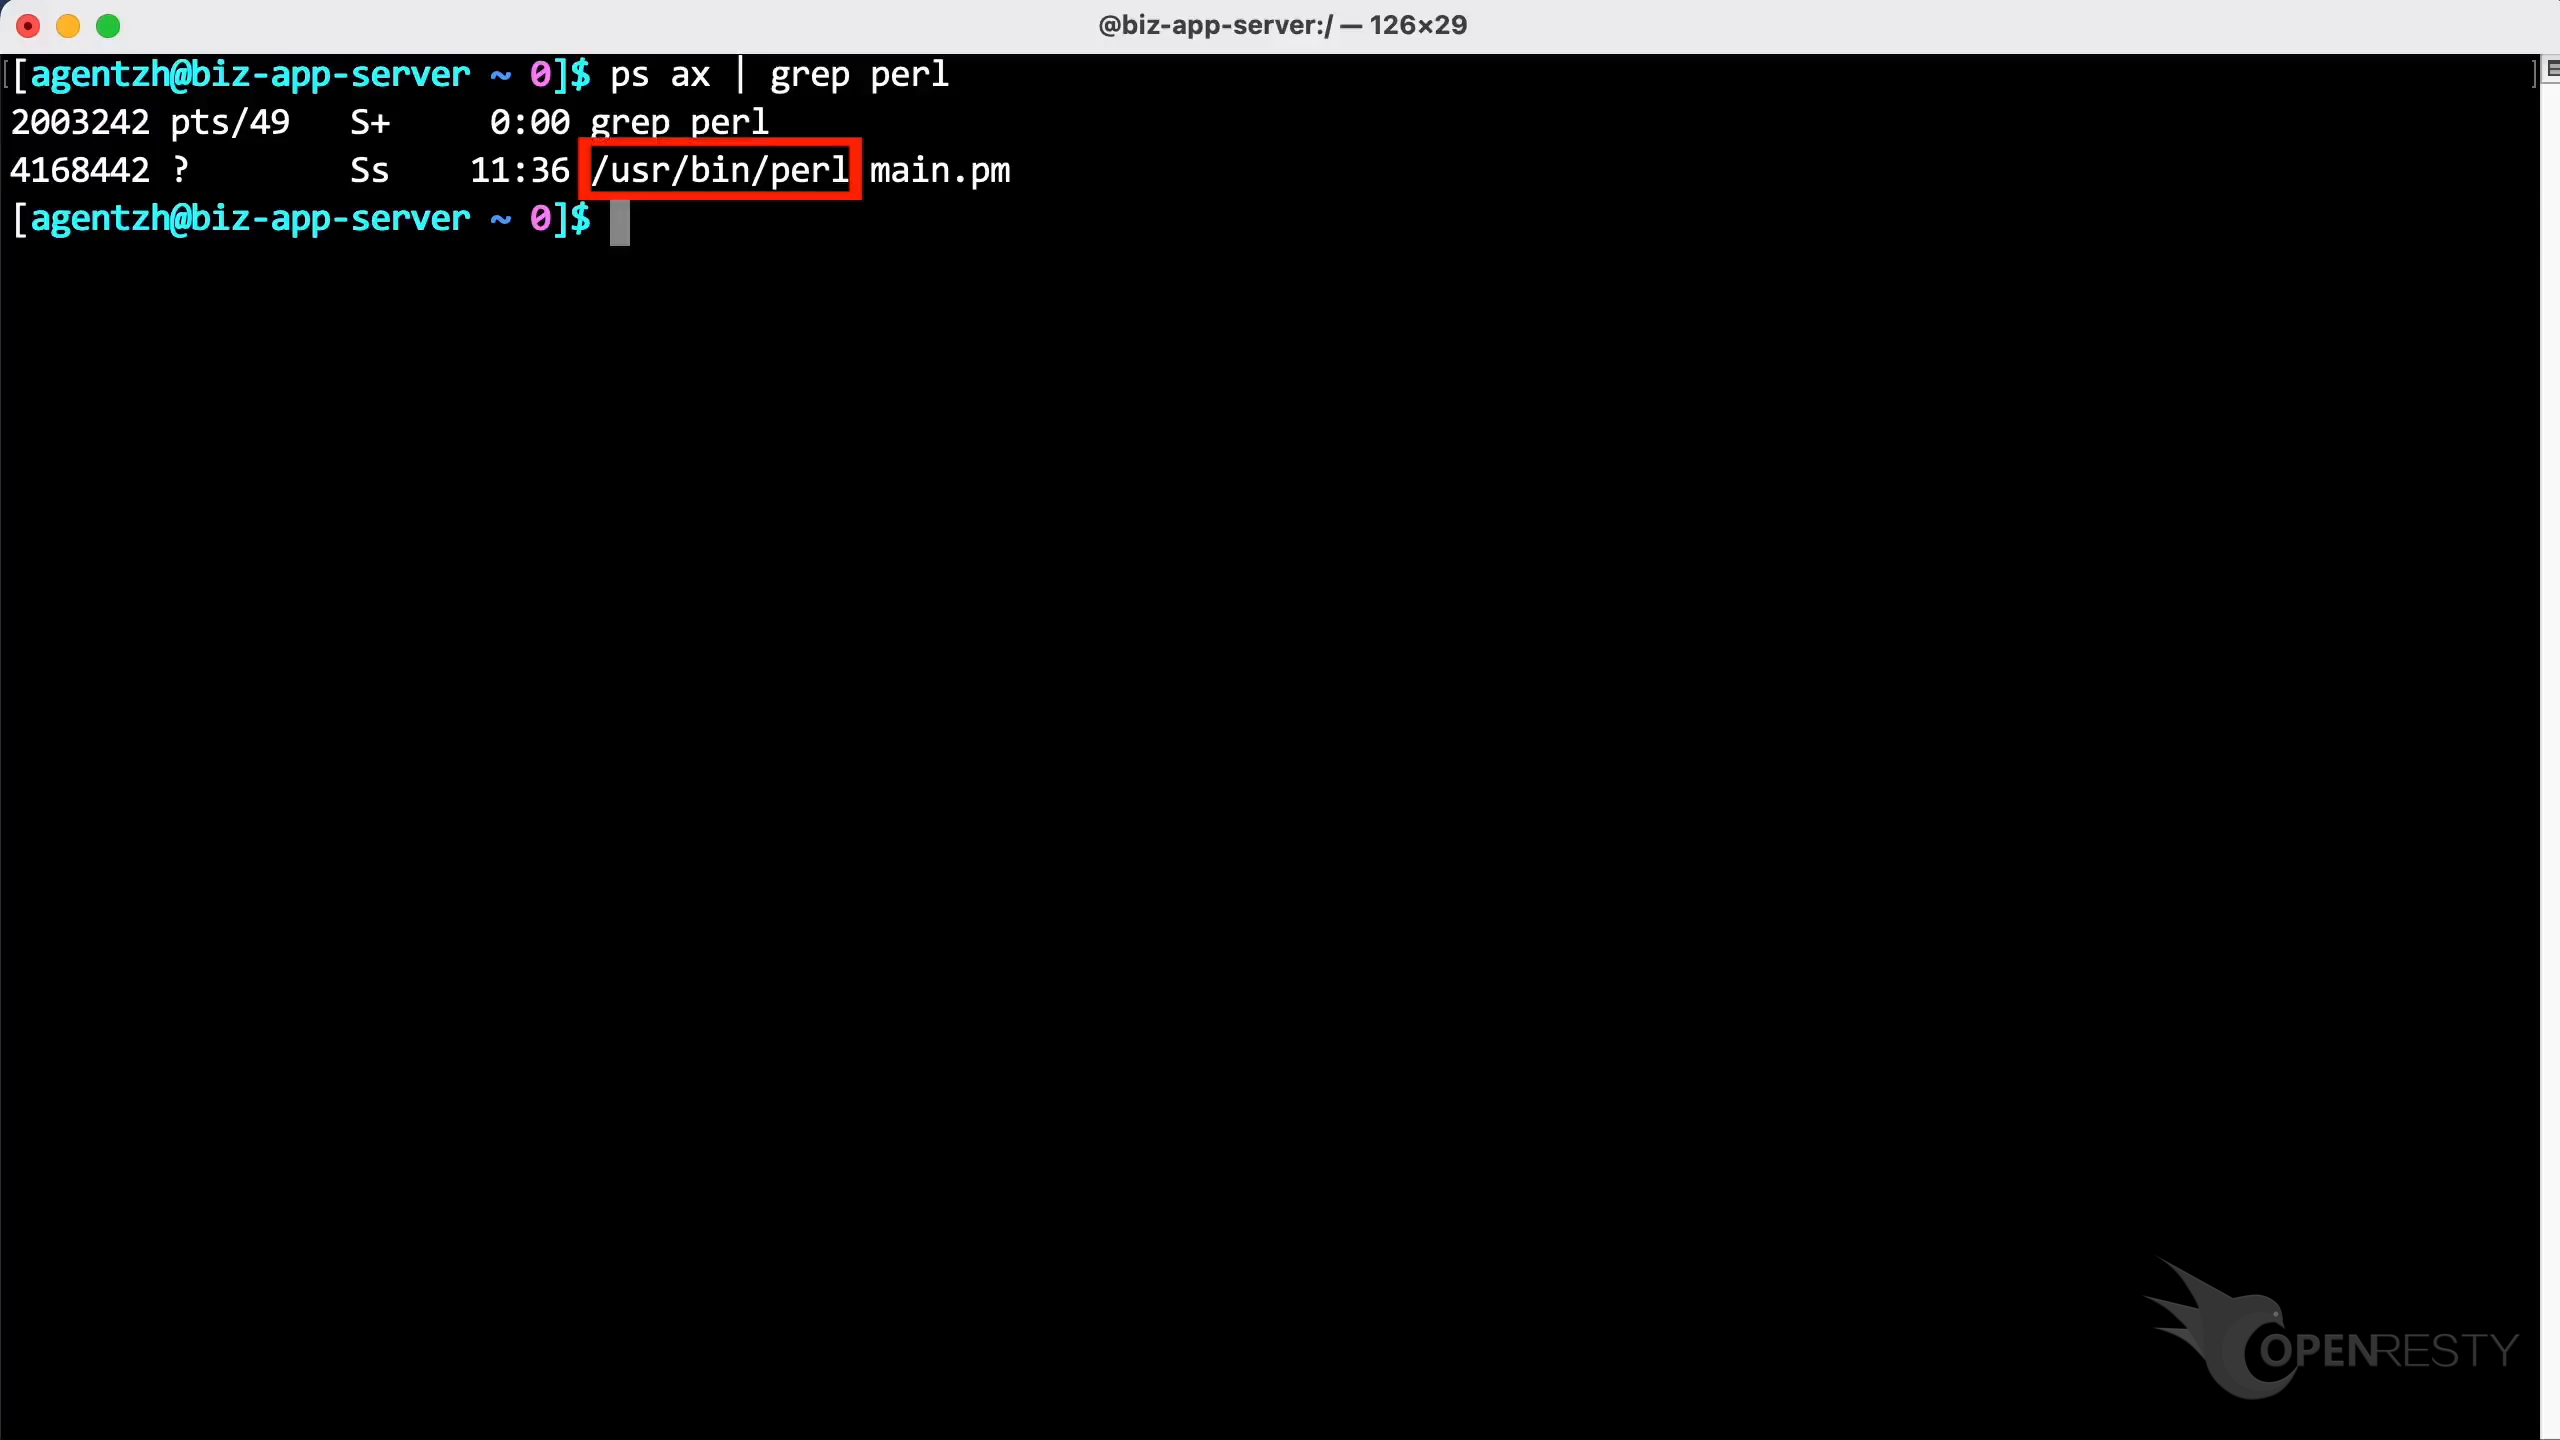
Let’s run the ps command for more details about this process. We can see it is the standard Perl binary executable shipped with the Linux distribution.
Let’s use OpenResty XRay to check out this unmodified process. We can analyze it in real time and figure out where exactly the memory is spent.
Profile the process with OpenResty XRay guided analysis to find the largest Perl objects
Open the OpenResty XRay web console and make sure you are watching the right machine. Go to the Guided Analysis page, where you can pick from the types of problems OpenResty XRay can diagnose.
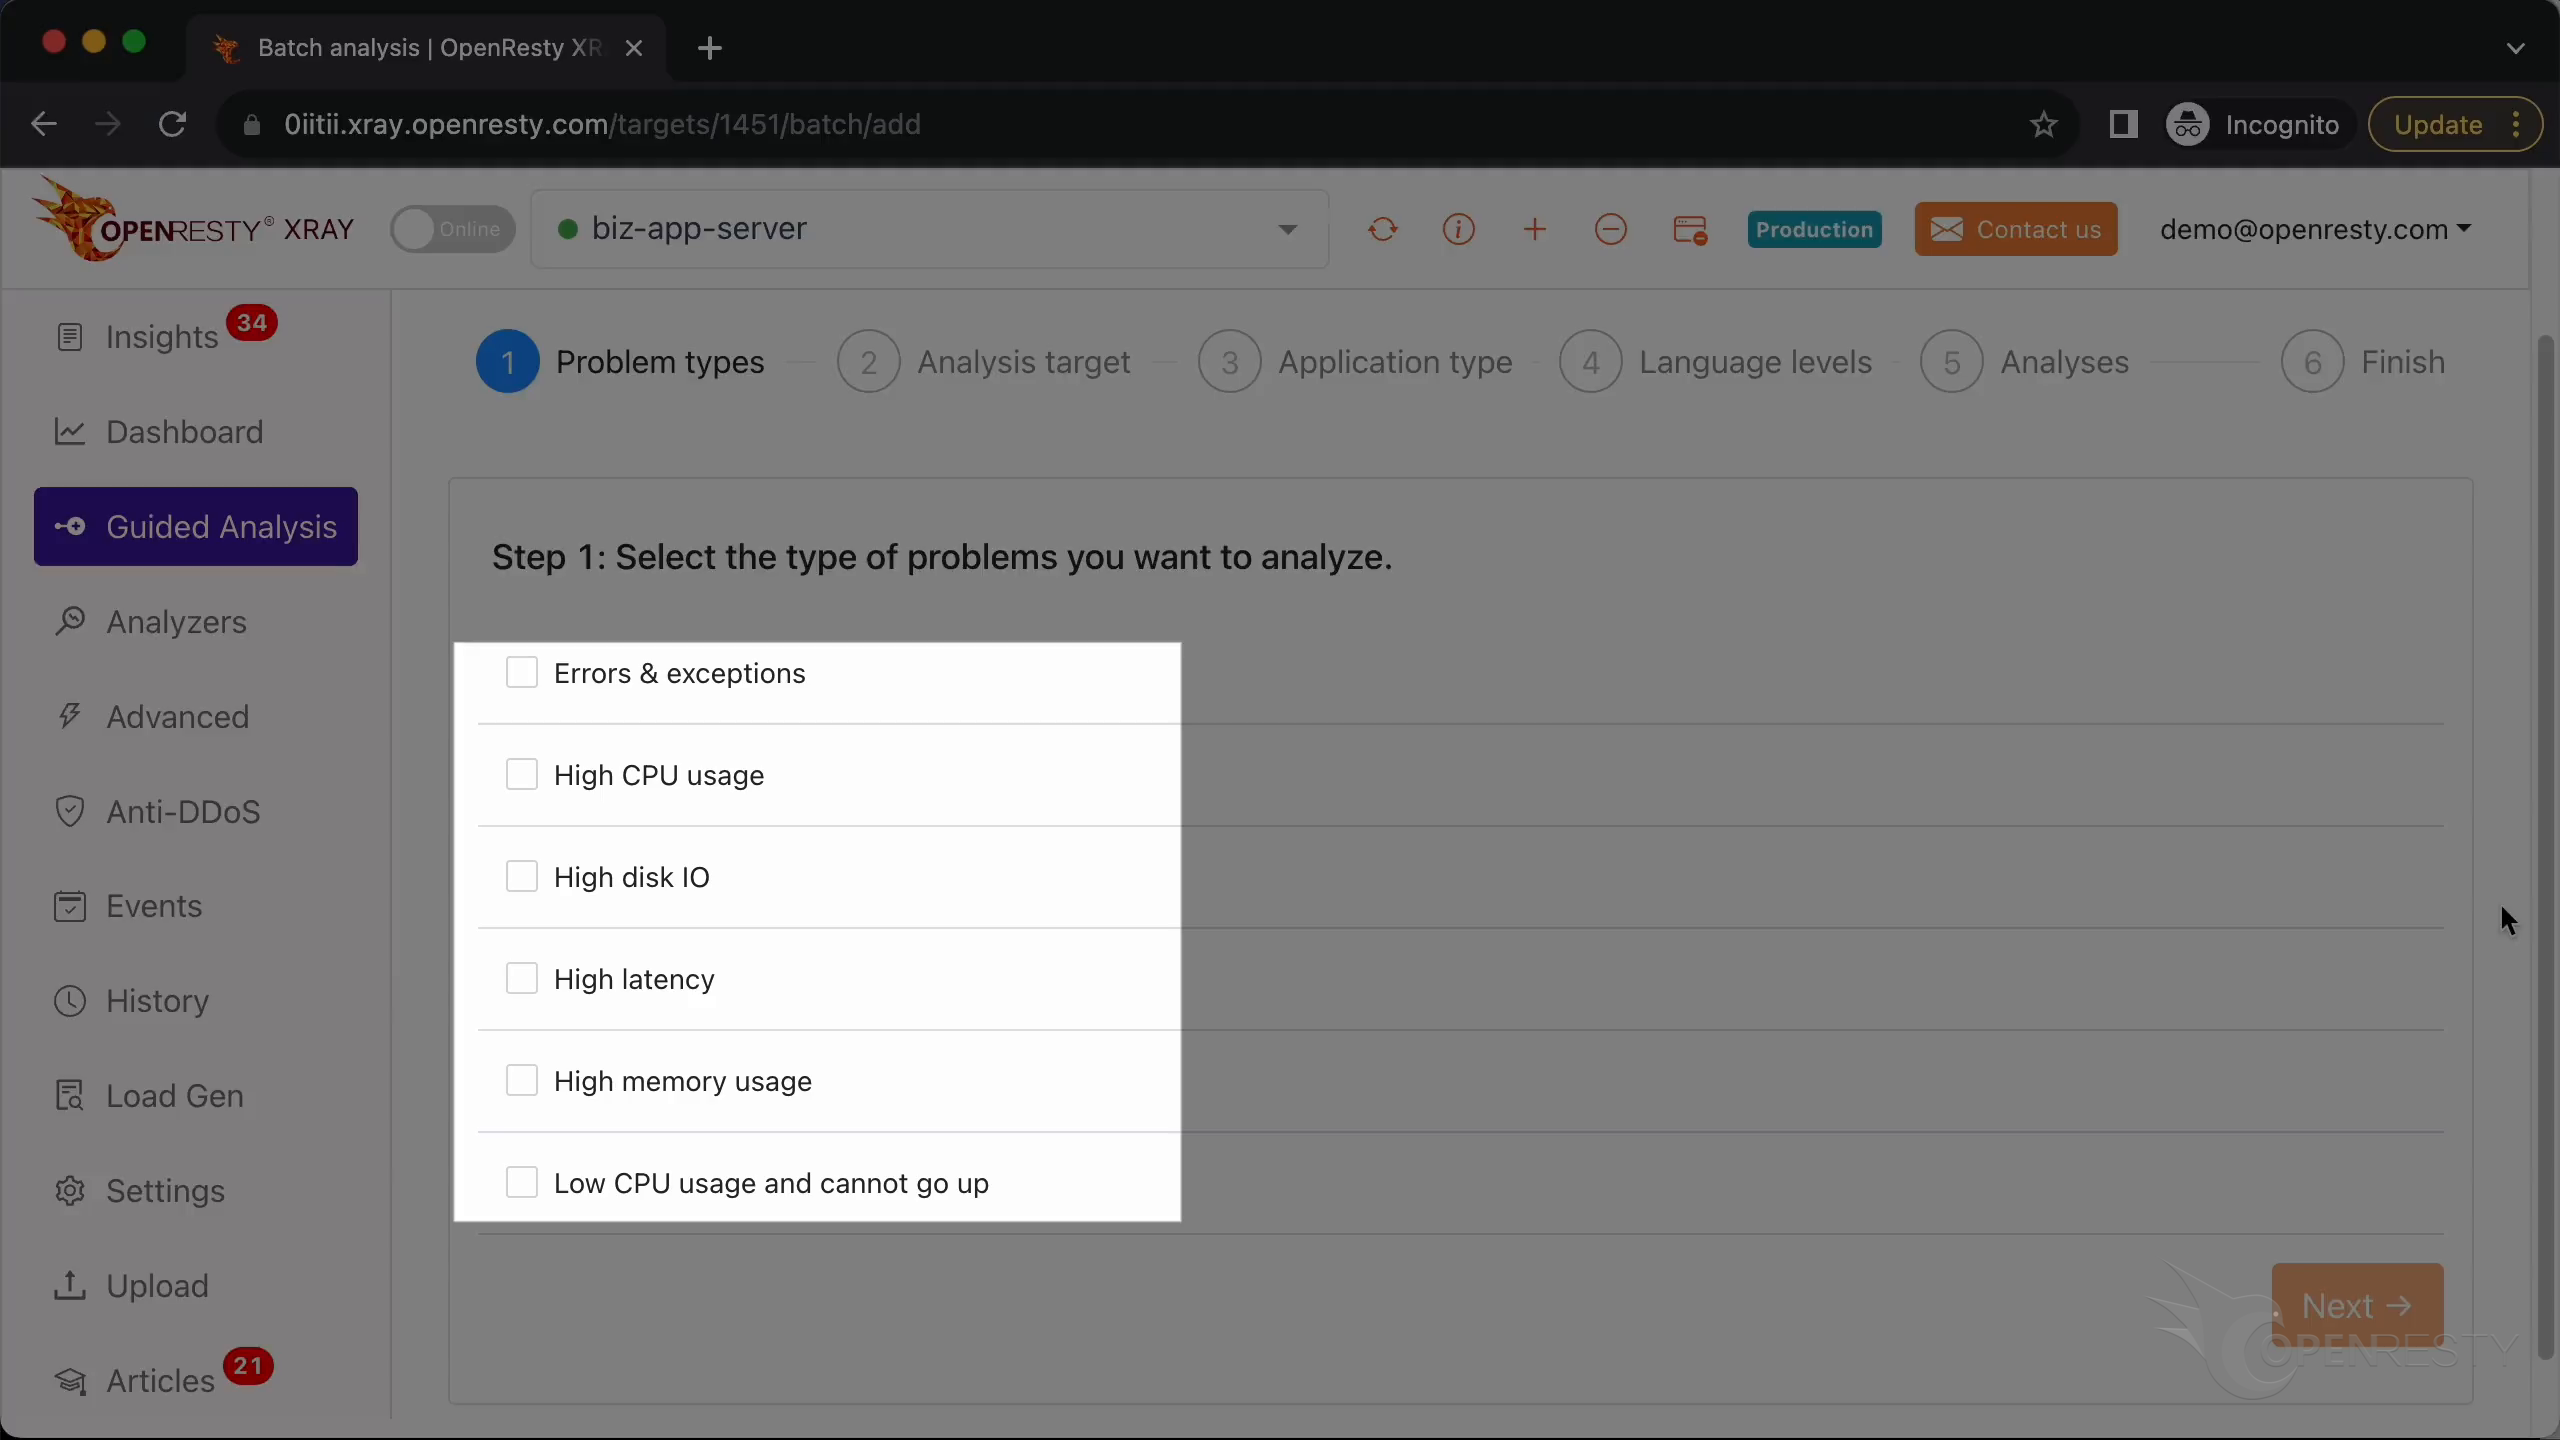
Select High memory usage, choose the Perl application and the process that top flagged (the one using more than 180MB), keep both Perl and C/C++ language levels, and leave the maximum analyzing time at the default 300 seconds. Start the analysis; after a round or two, OpenResty XRay automatically produces a memory analysis report. We can see most of the memory is allocated by the libc allocator — more than 160MB.
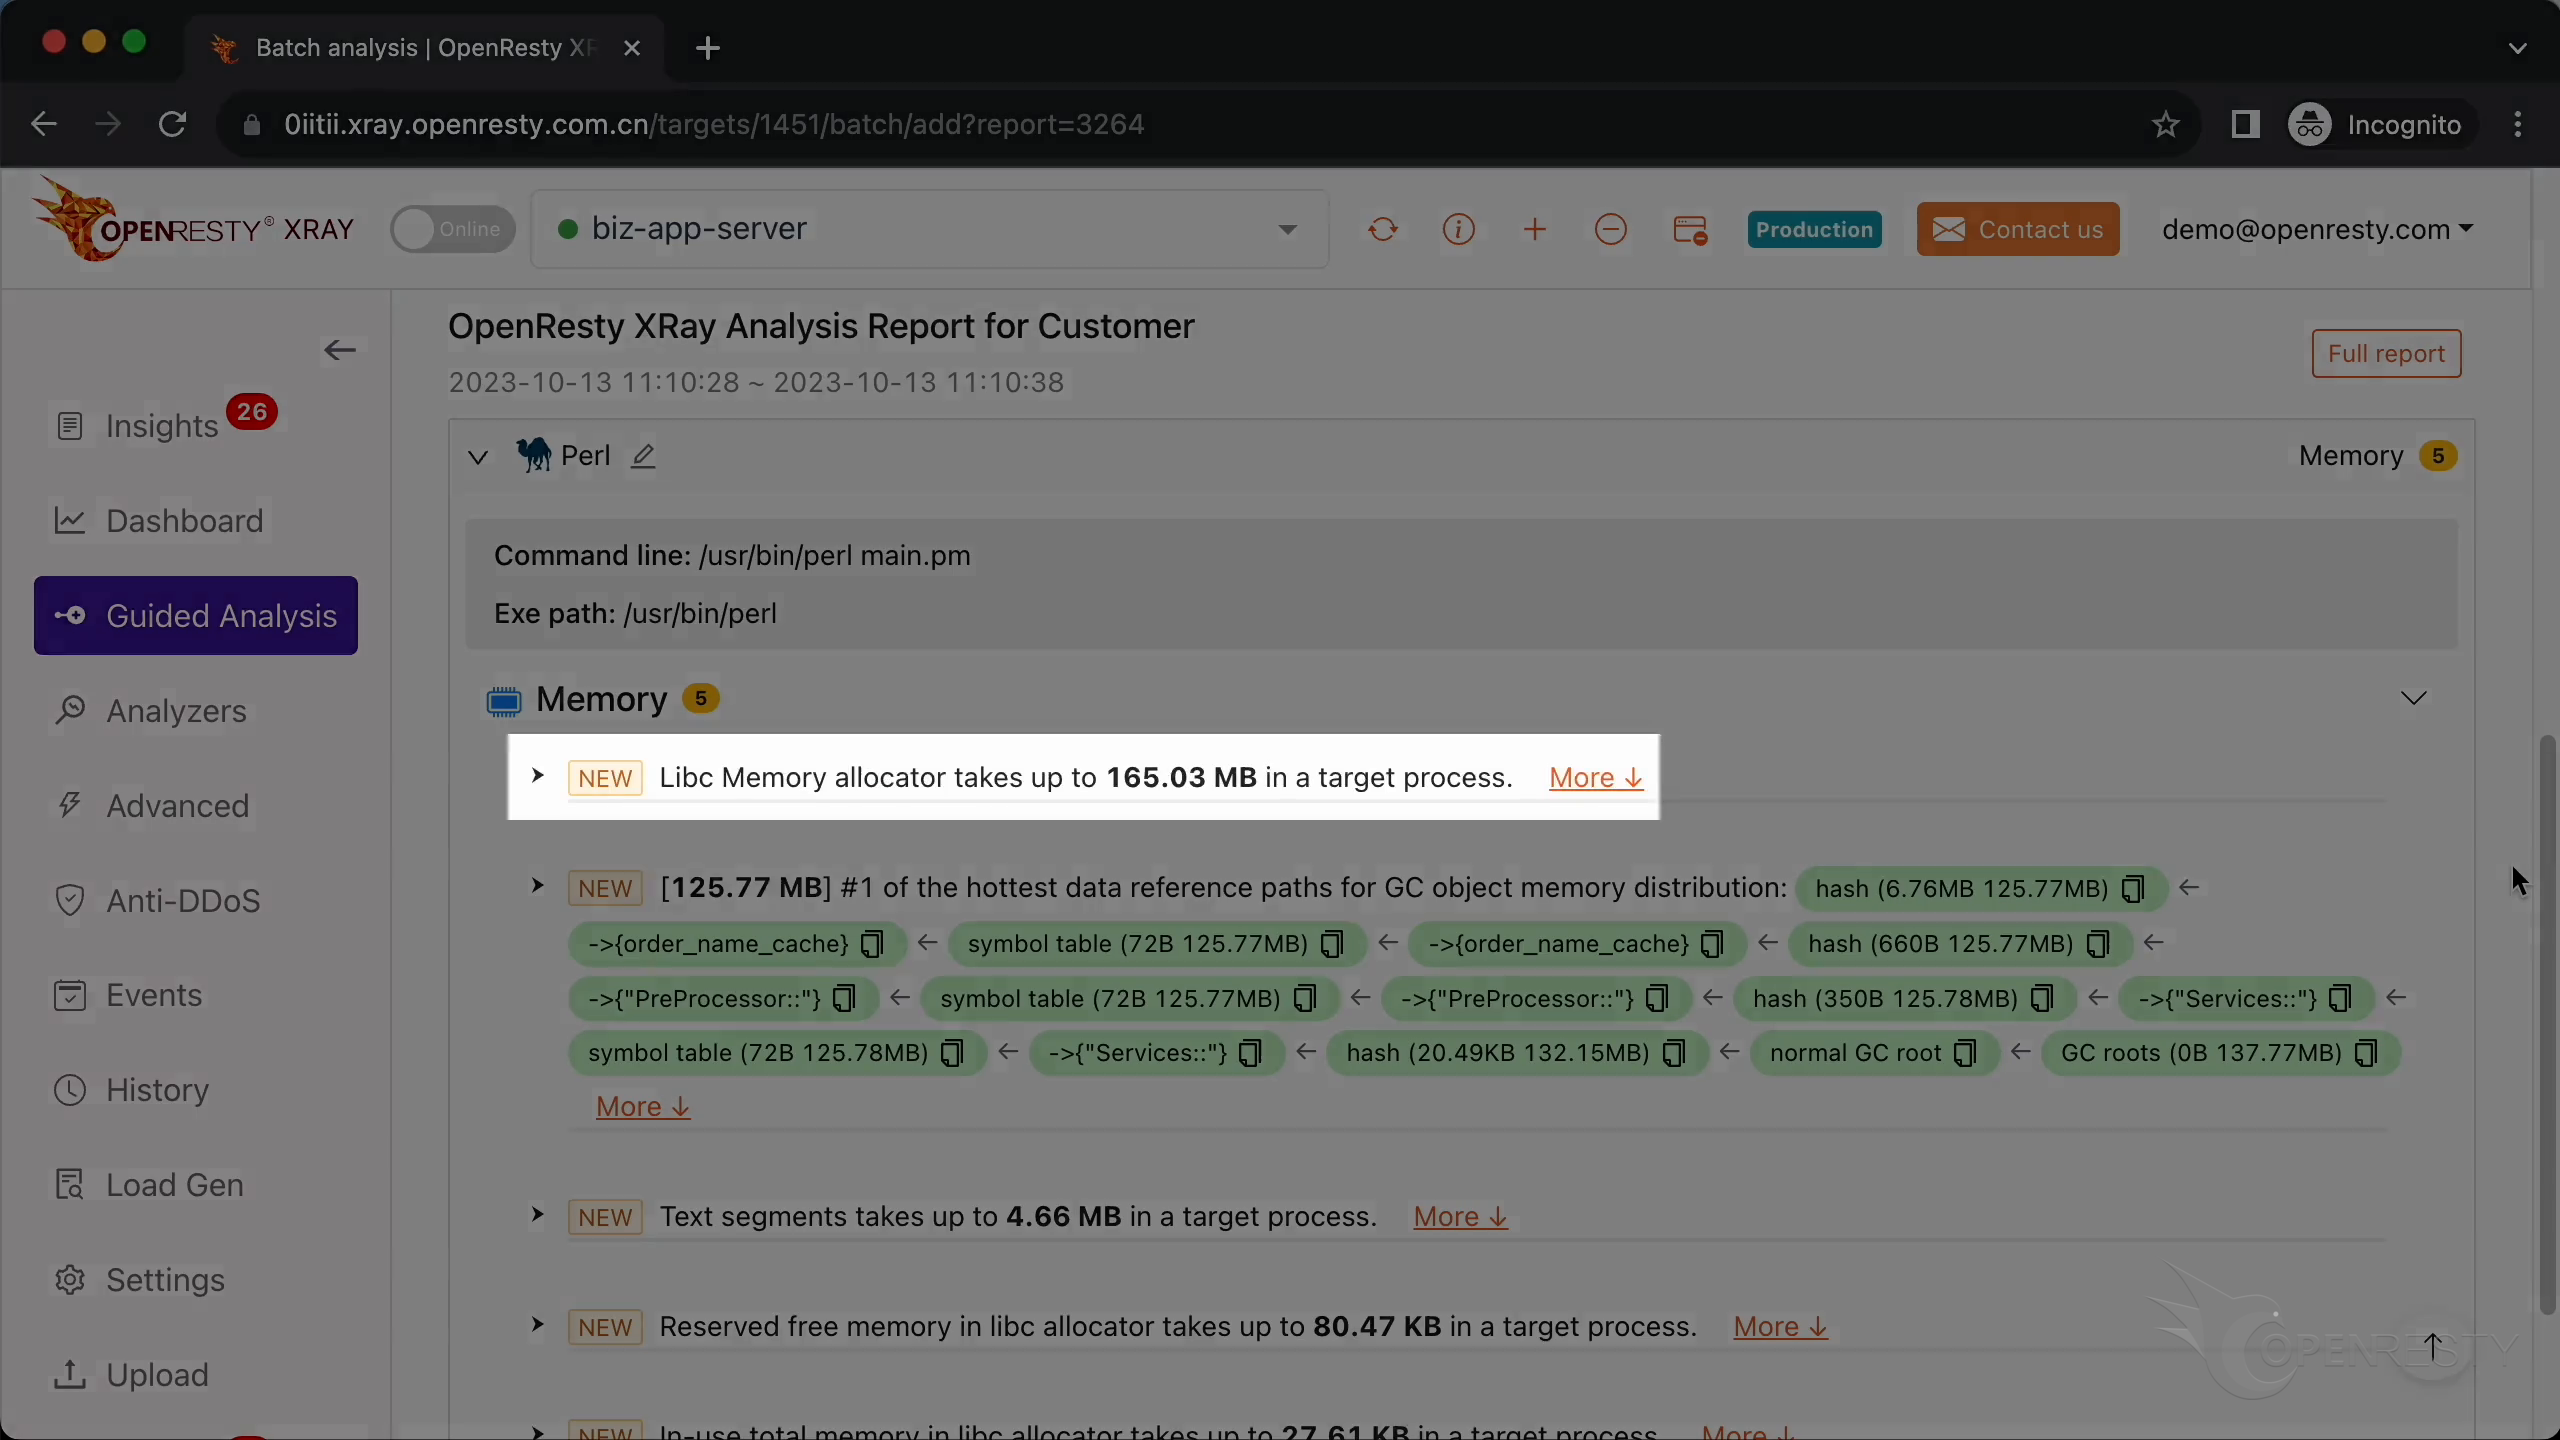
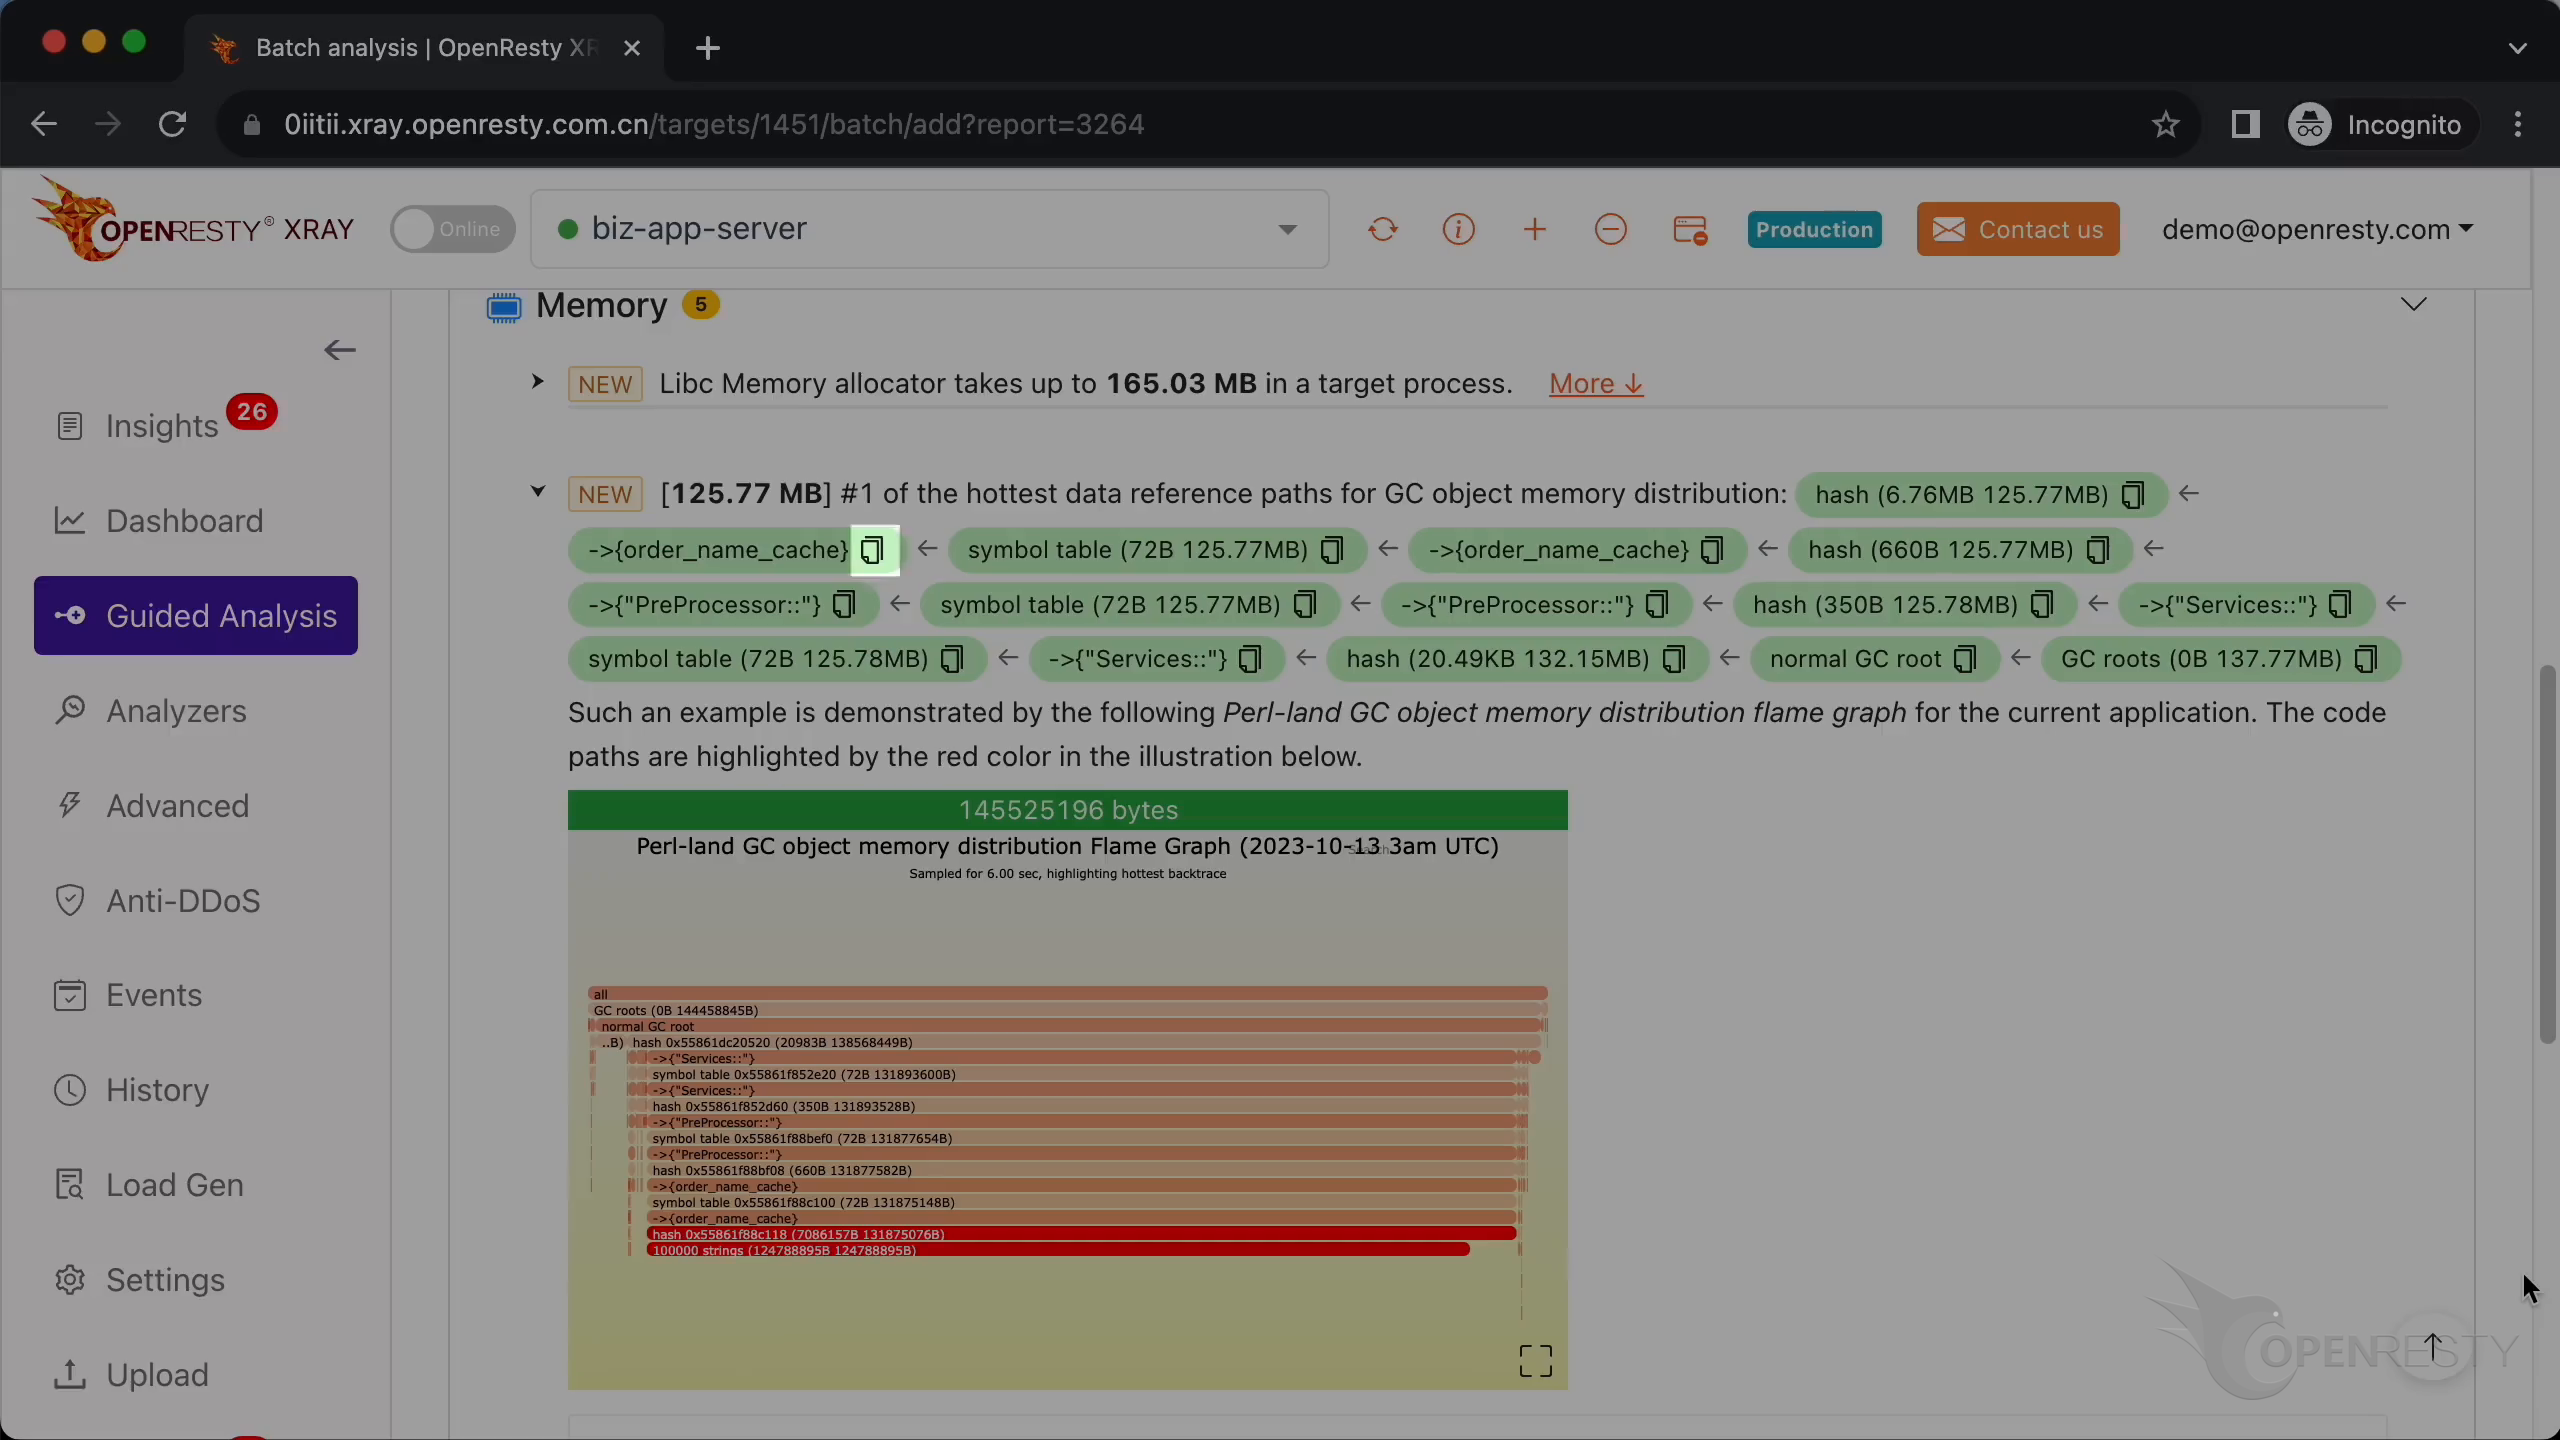
This is the Perl memory object reference path occupying the most memory. Obviously, this Perl VM uses most of the memory allocated by libc.
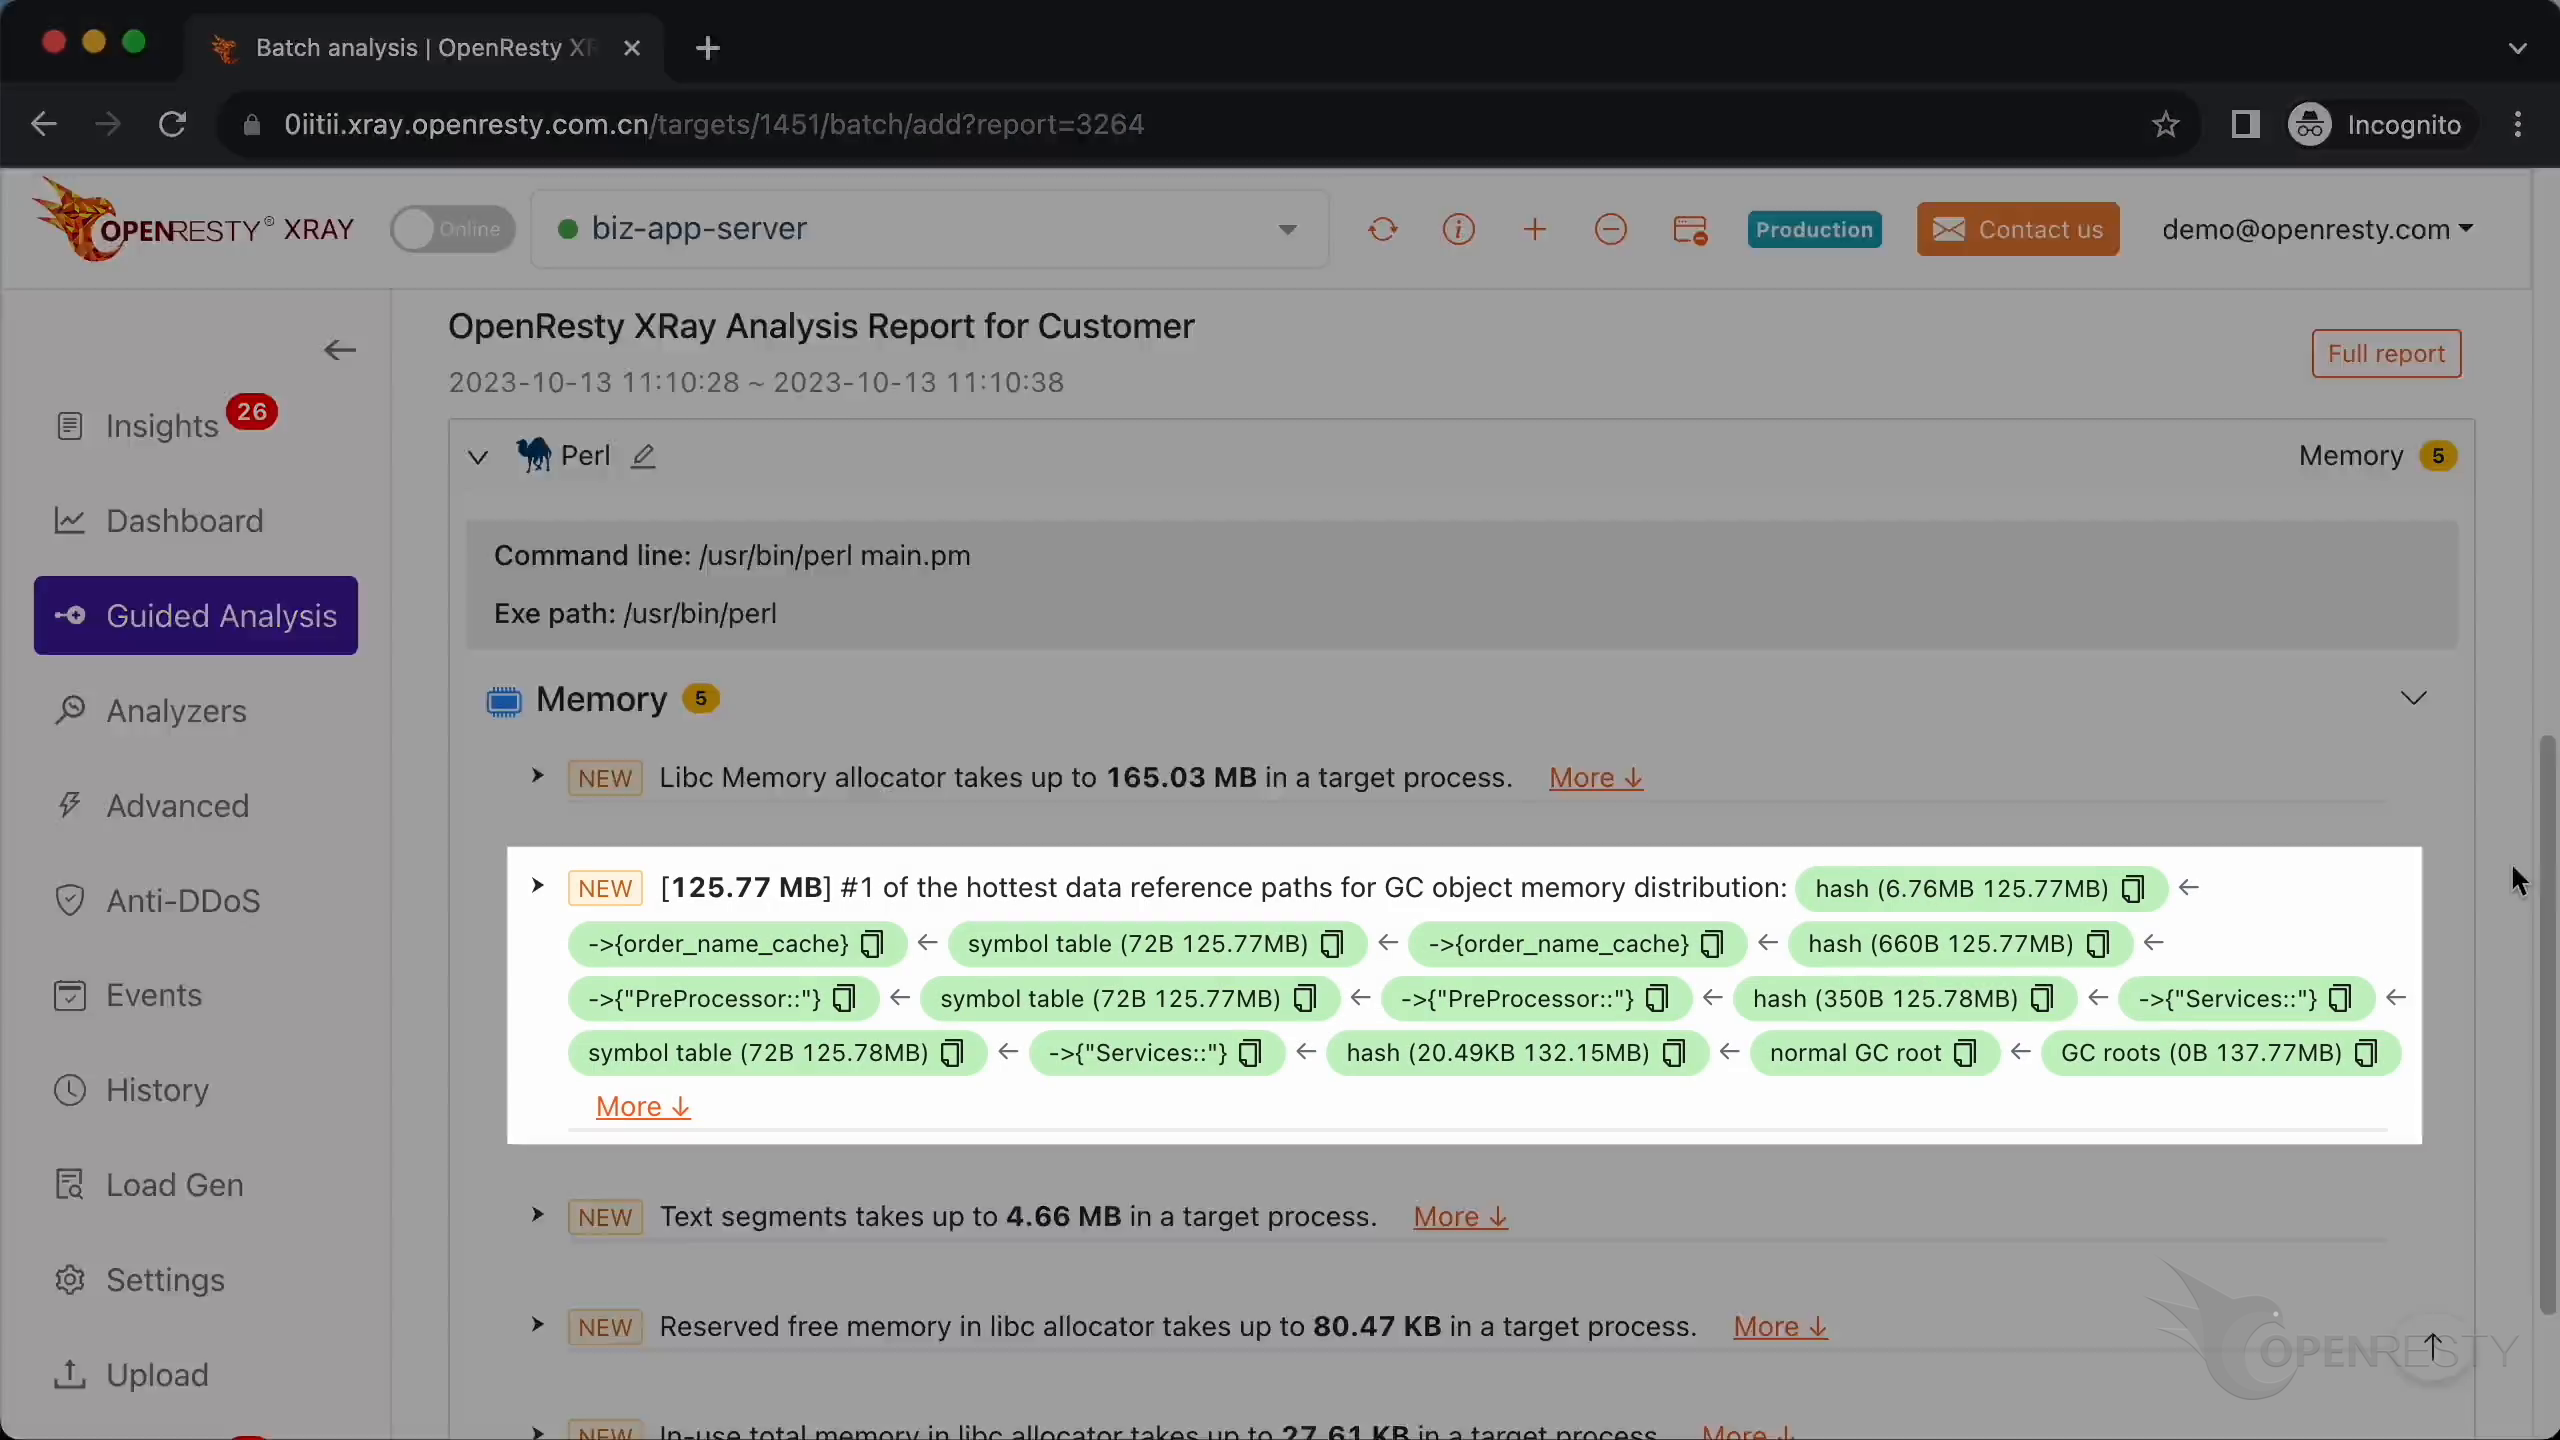
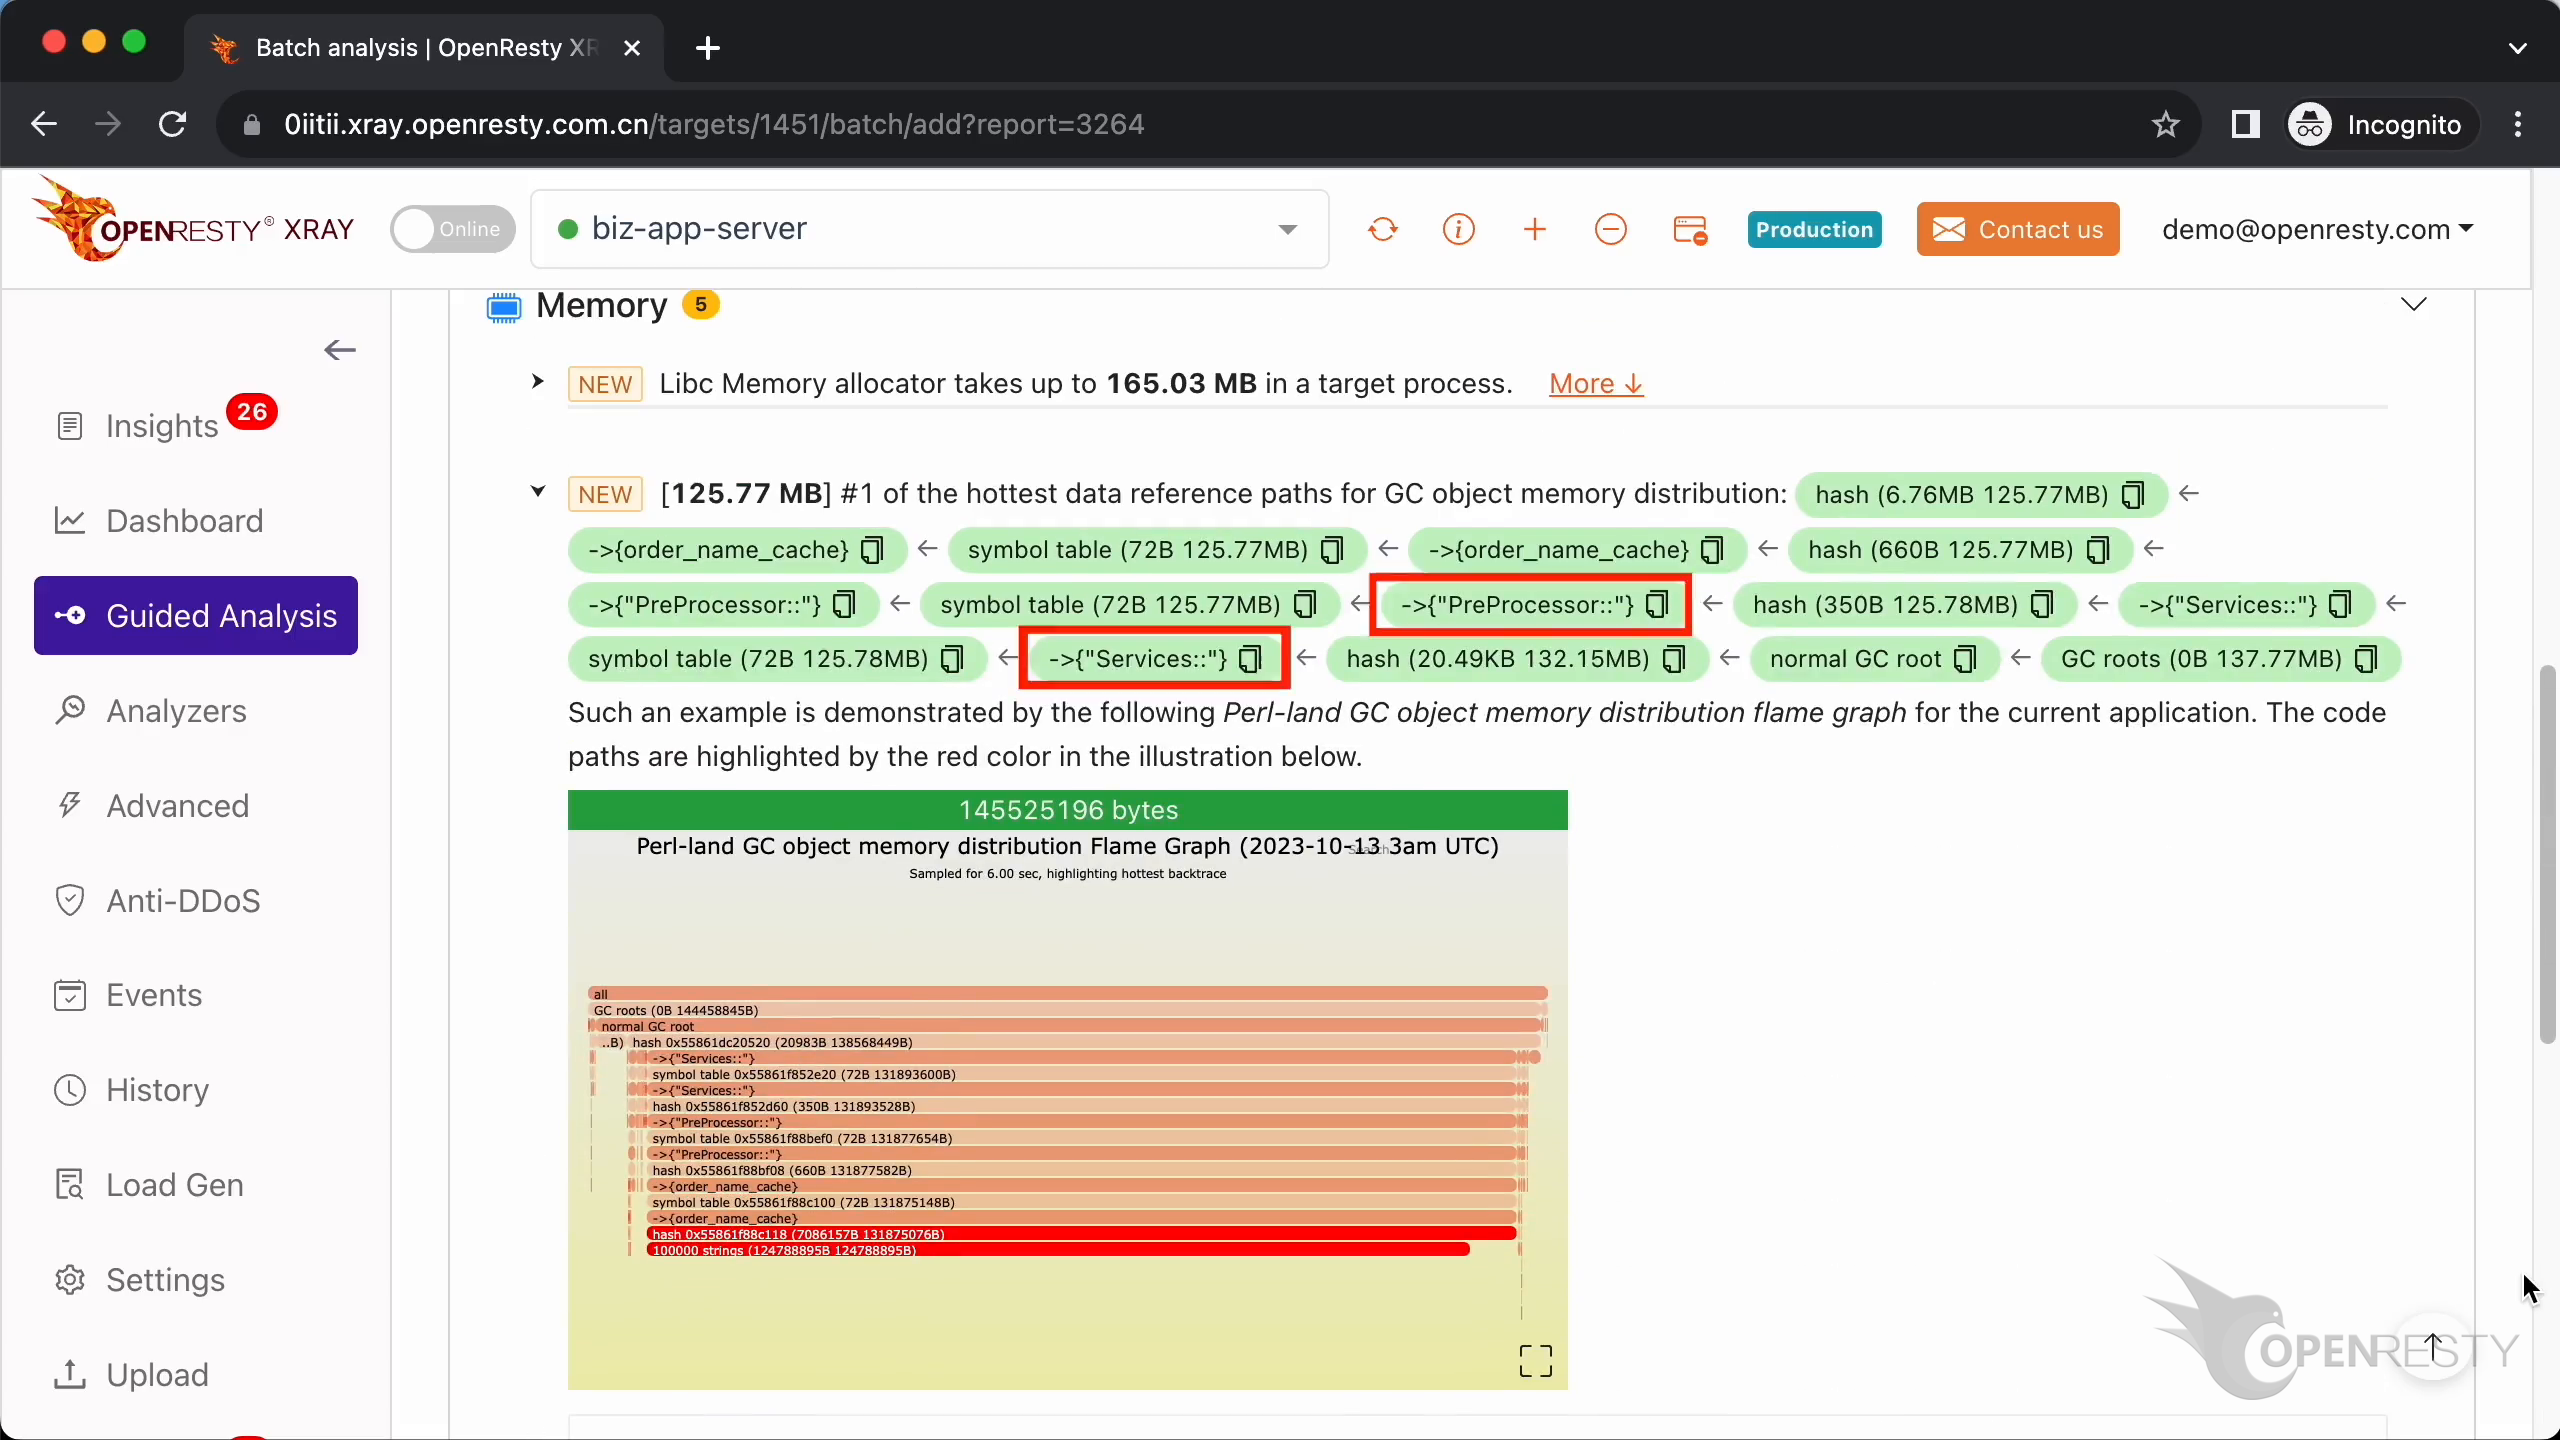
It is in the Services::Preprocessor Perl module.
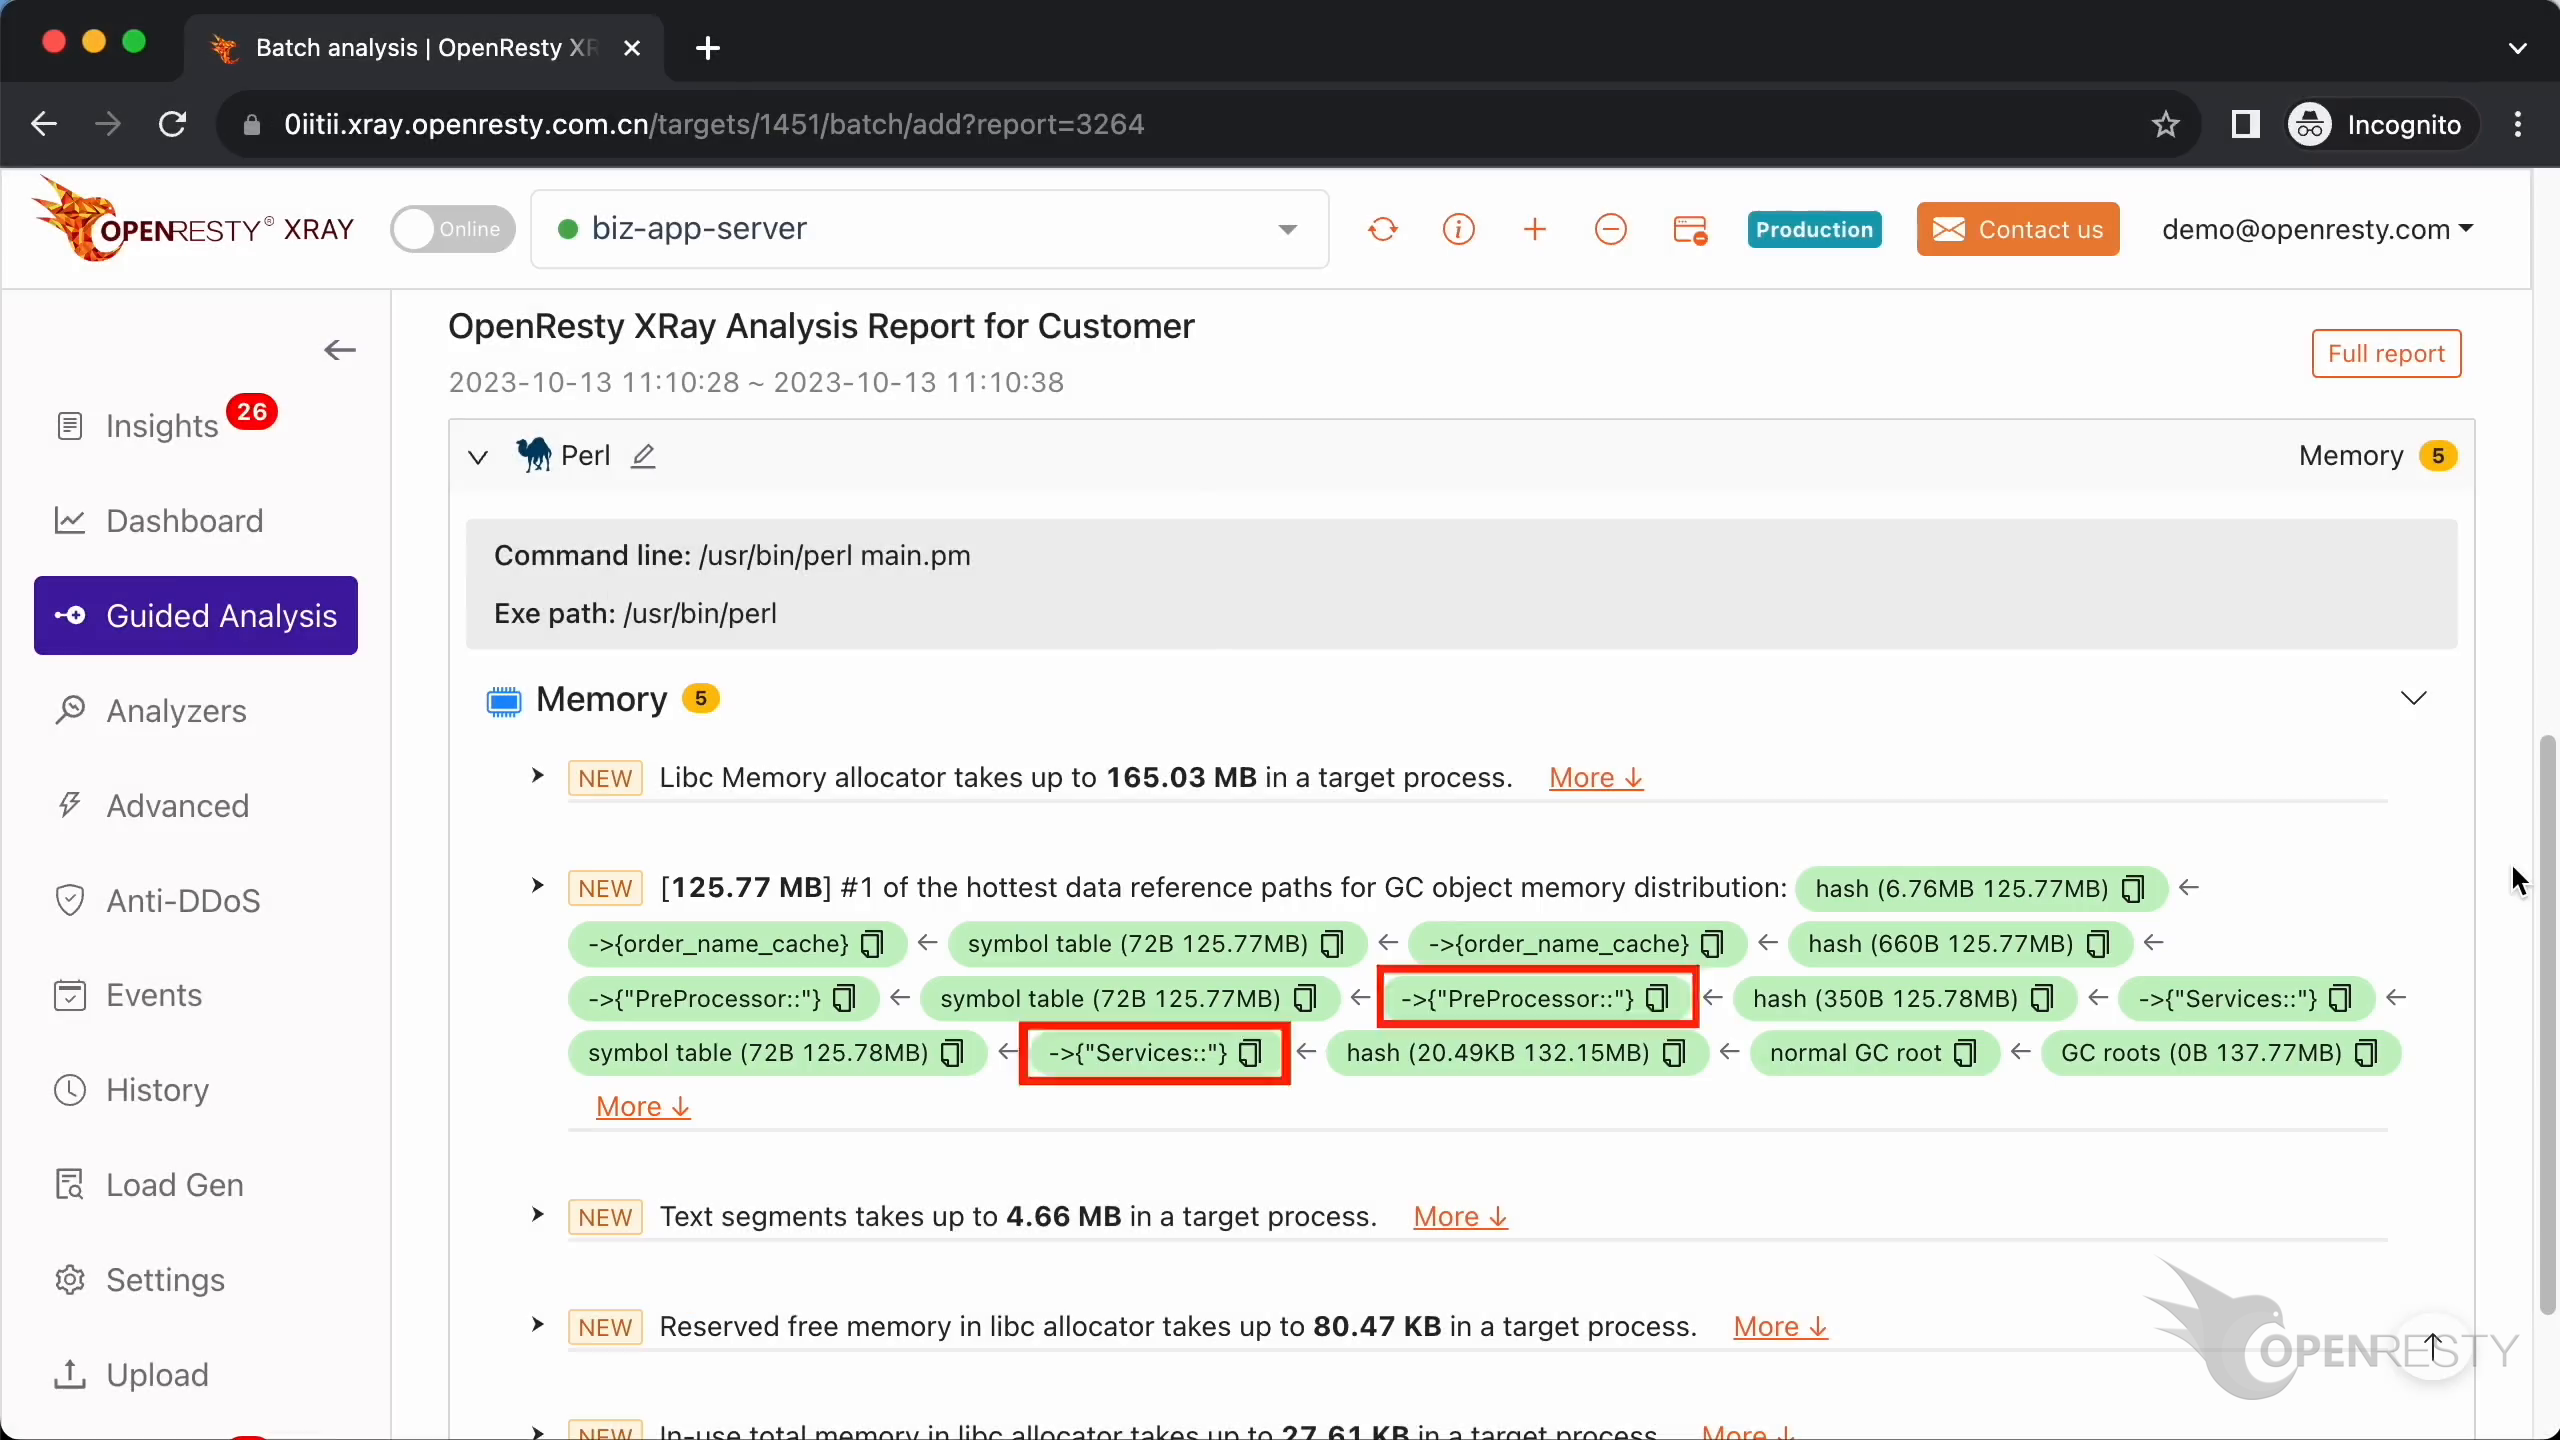
In the module’s symbol table, there is a variable named order_name_cache.
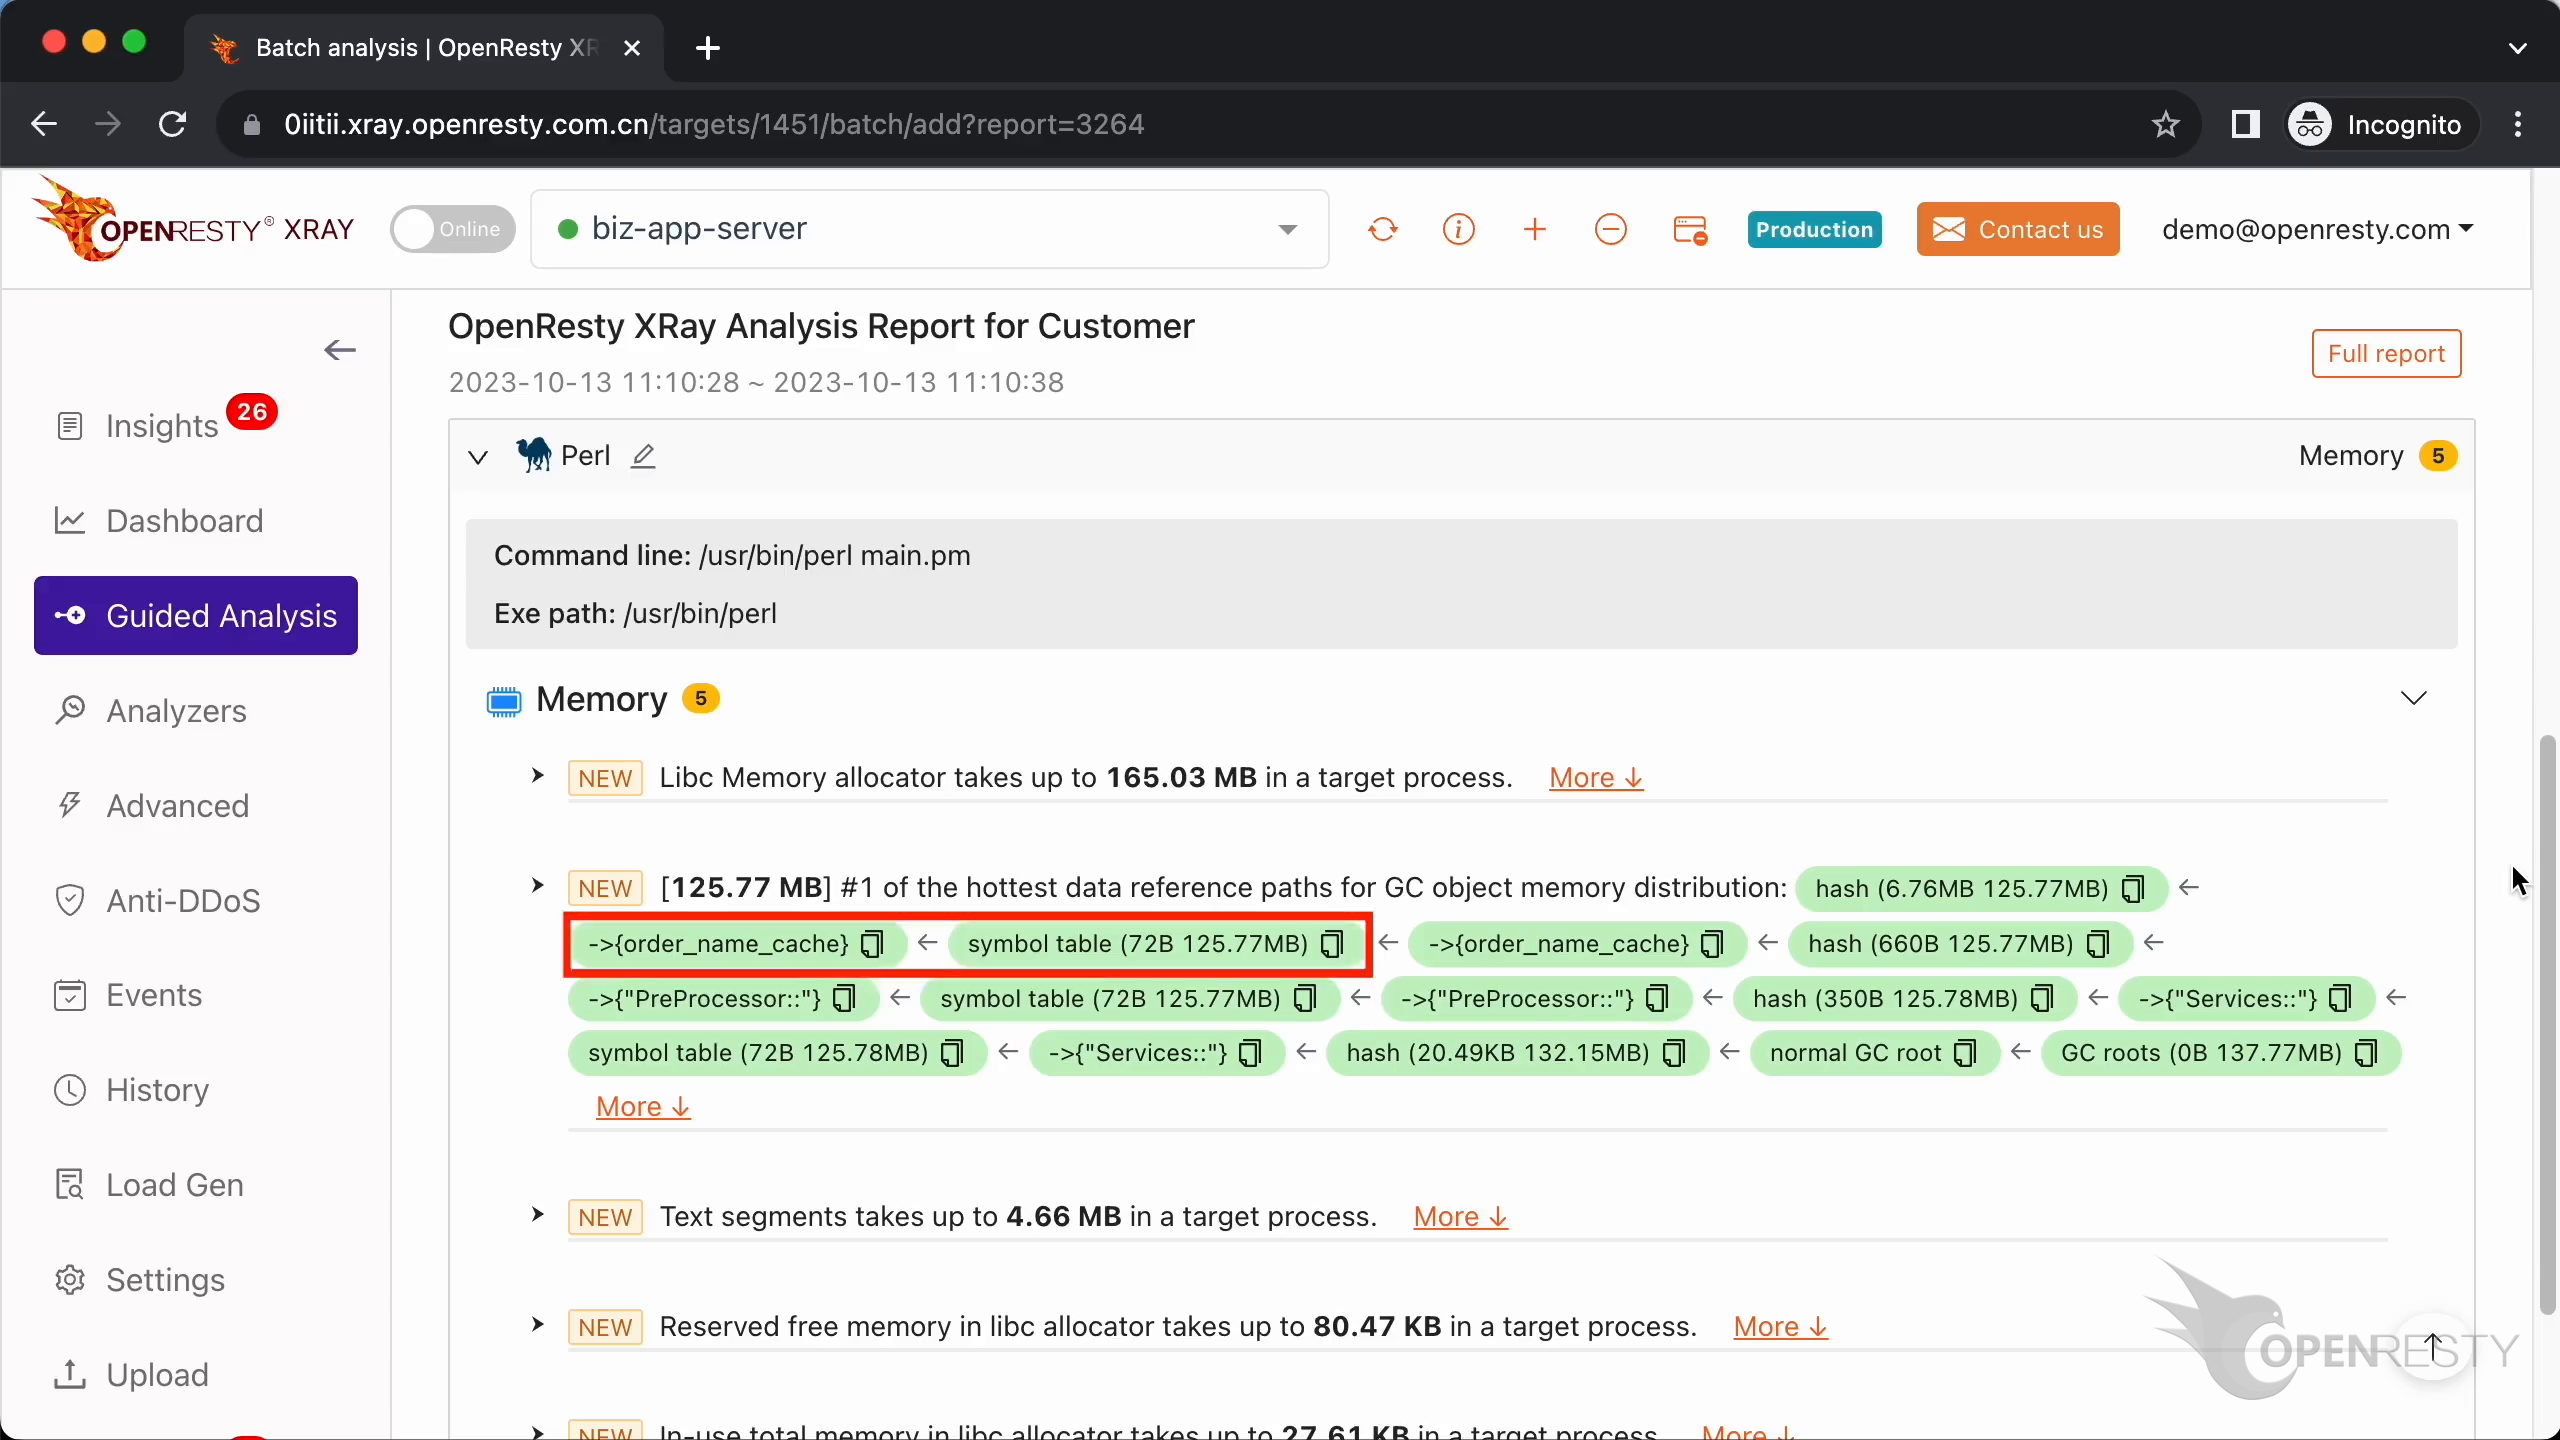
And this variable is a Perl hash table.
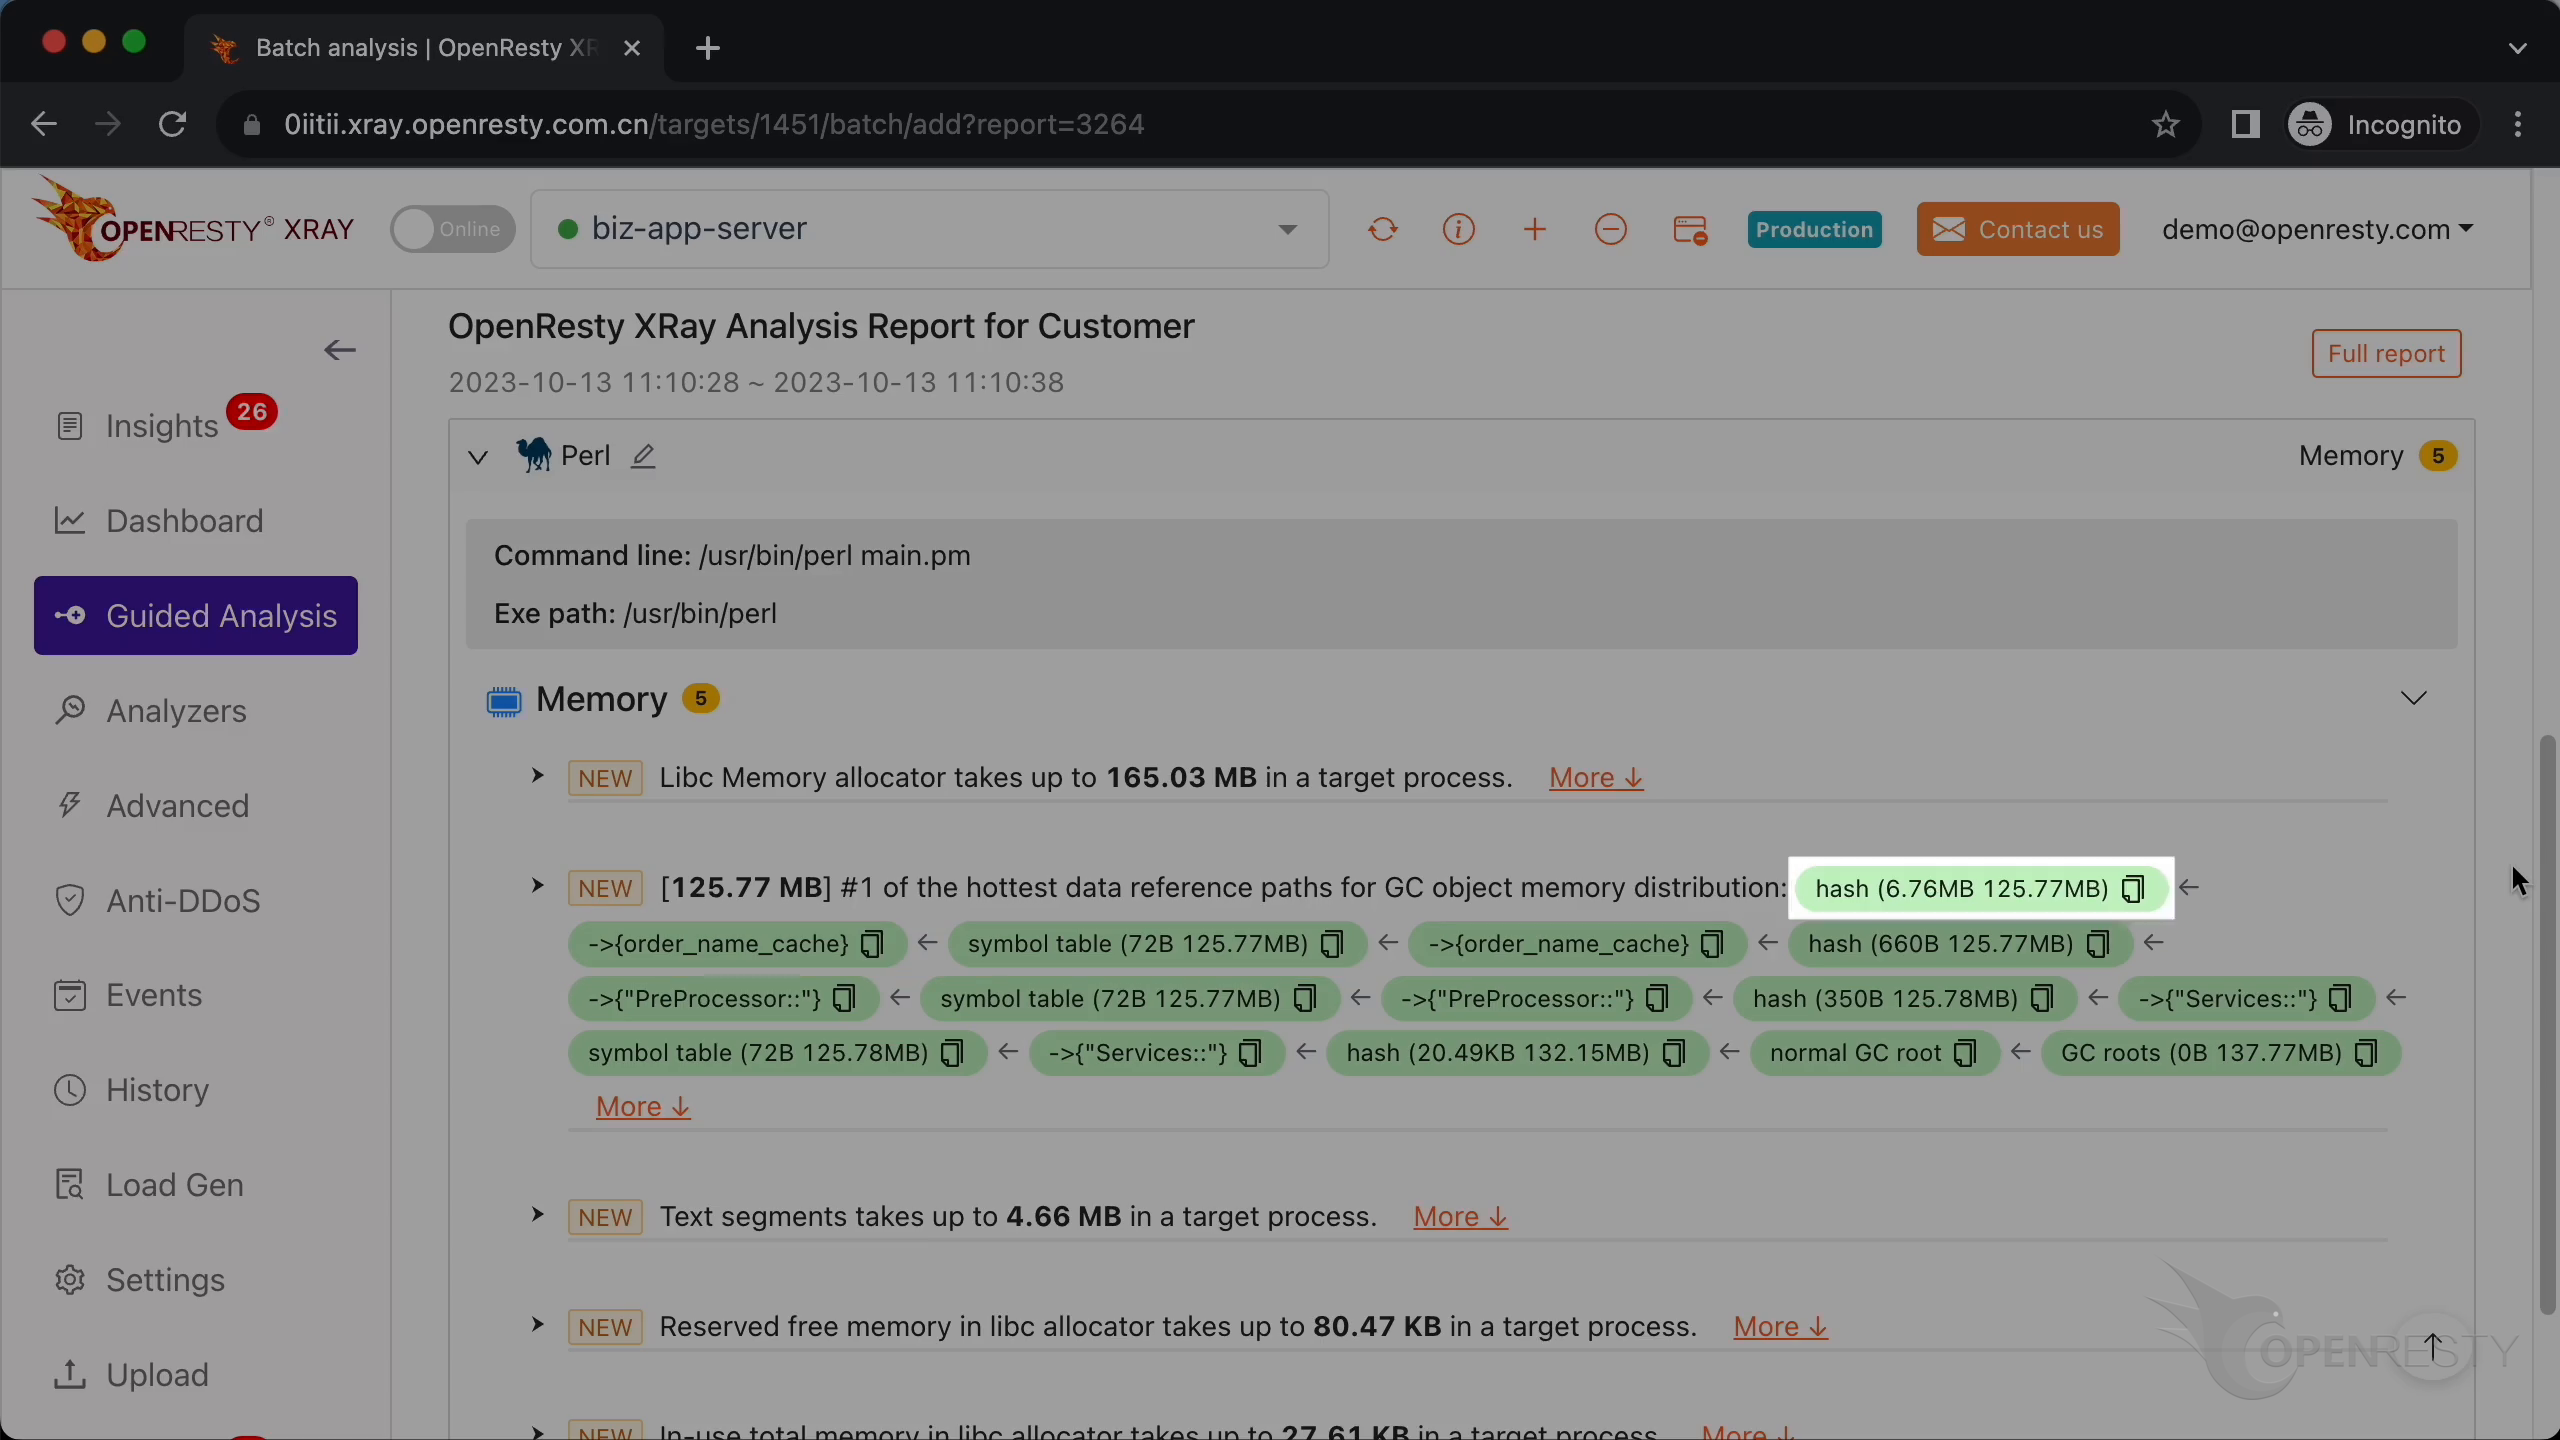
Click to see more details.
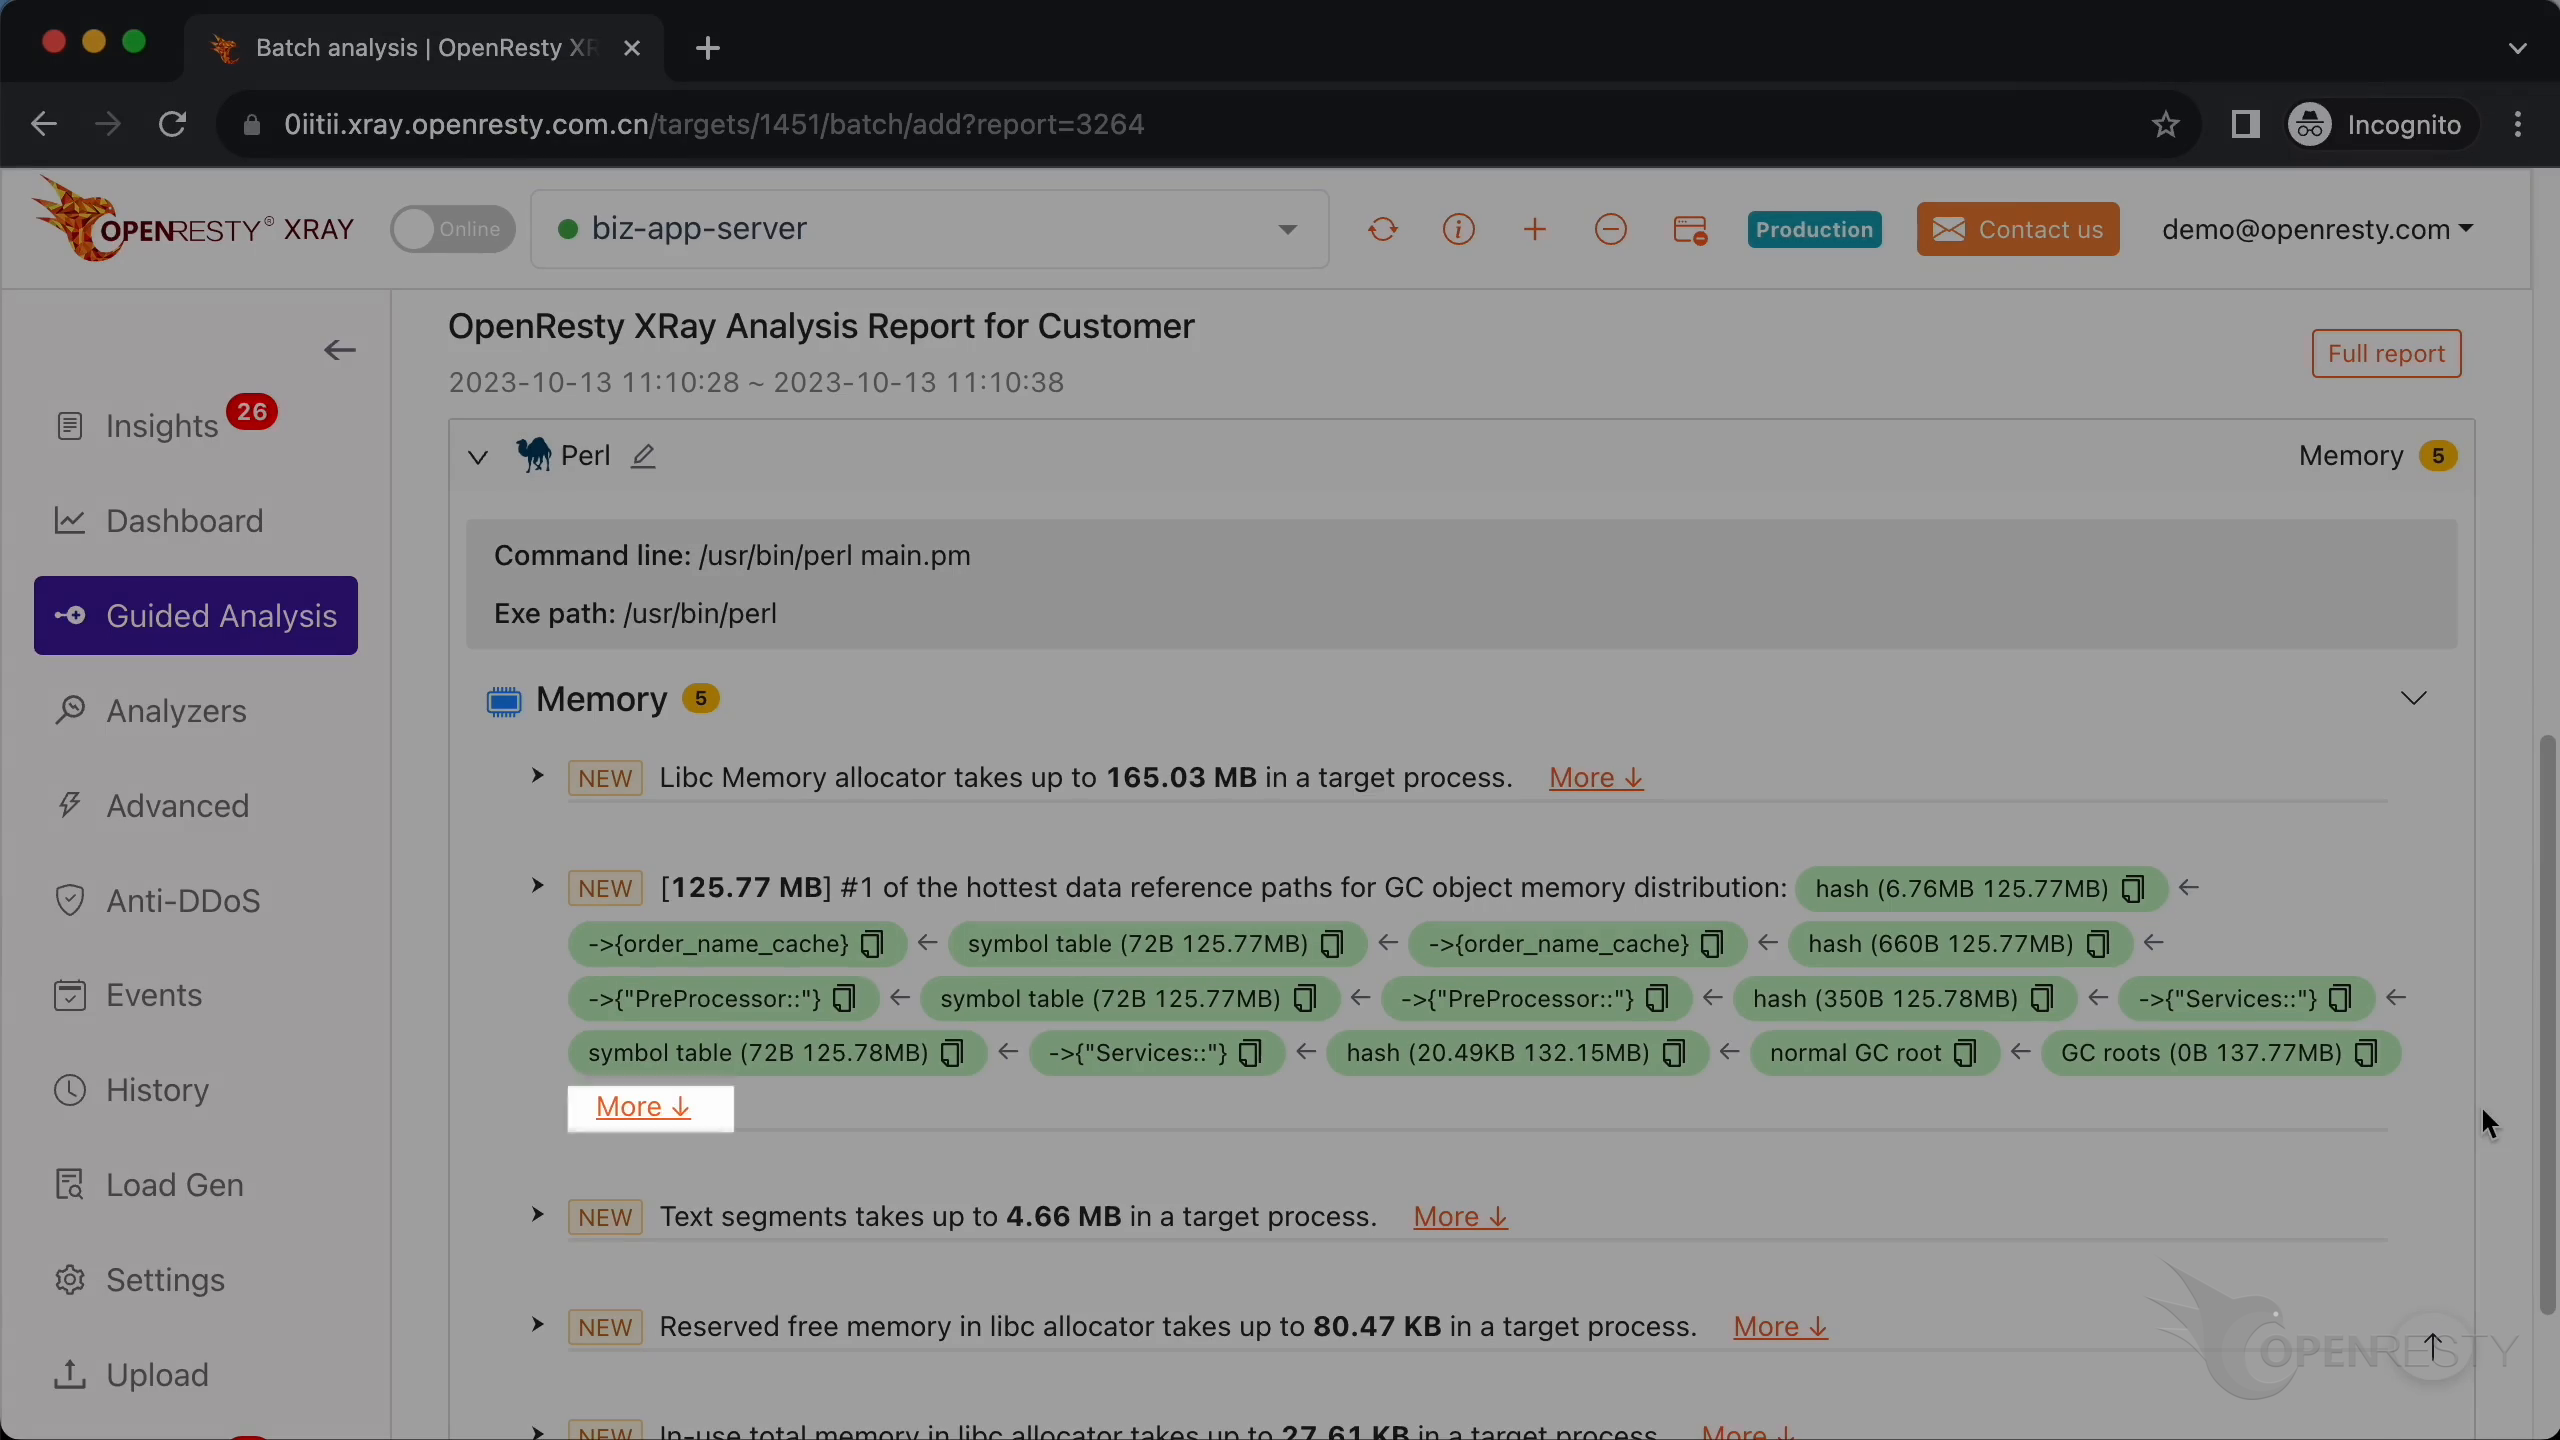
This object reference path is automatically inferred from this Perl-land GC objects memory distribution flame graph.
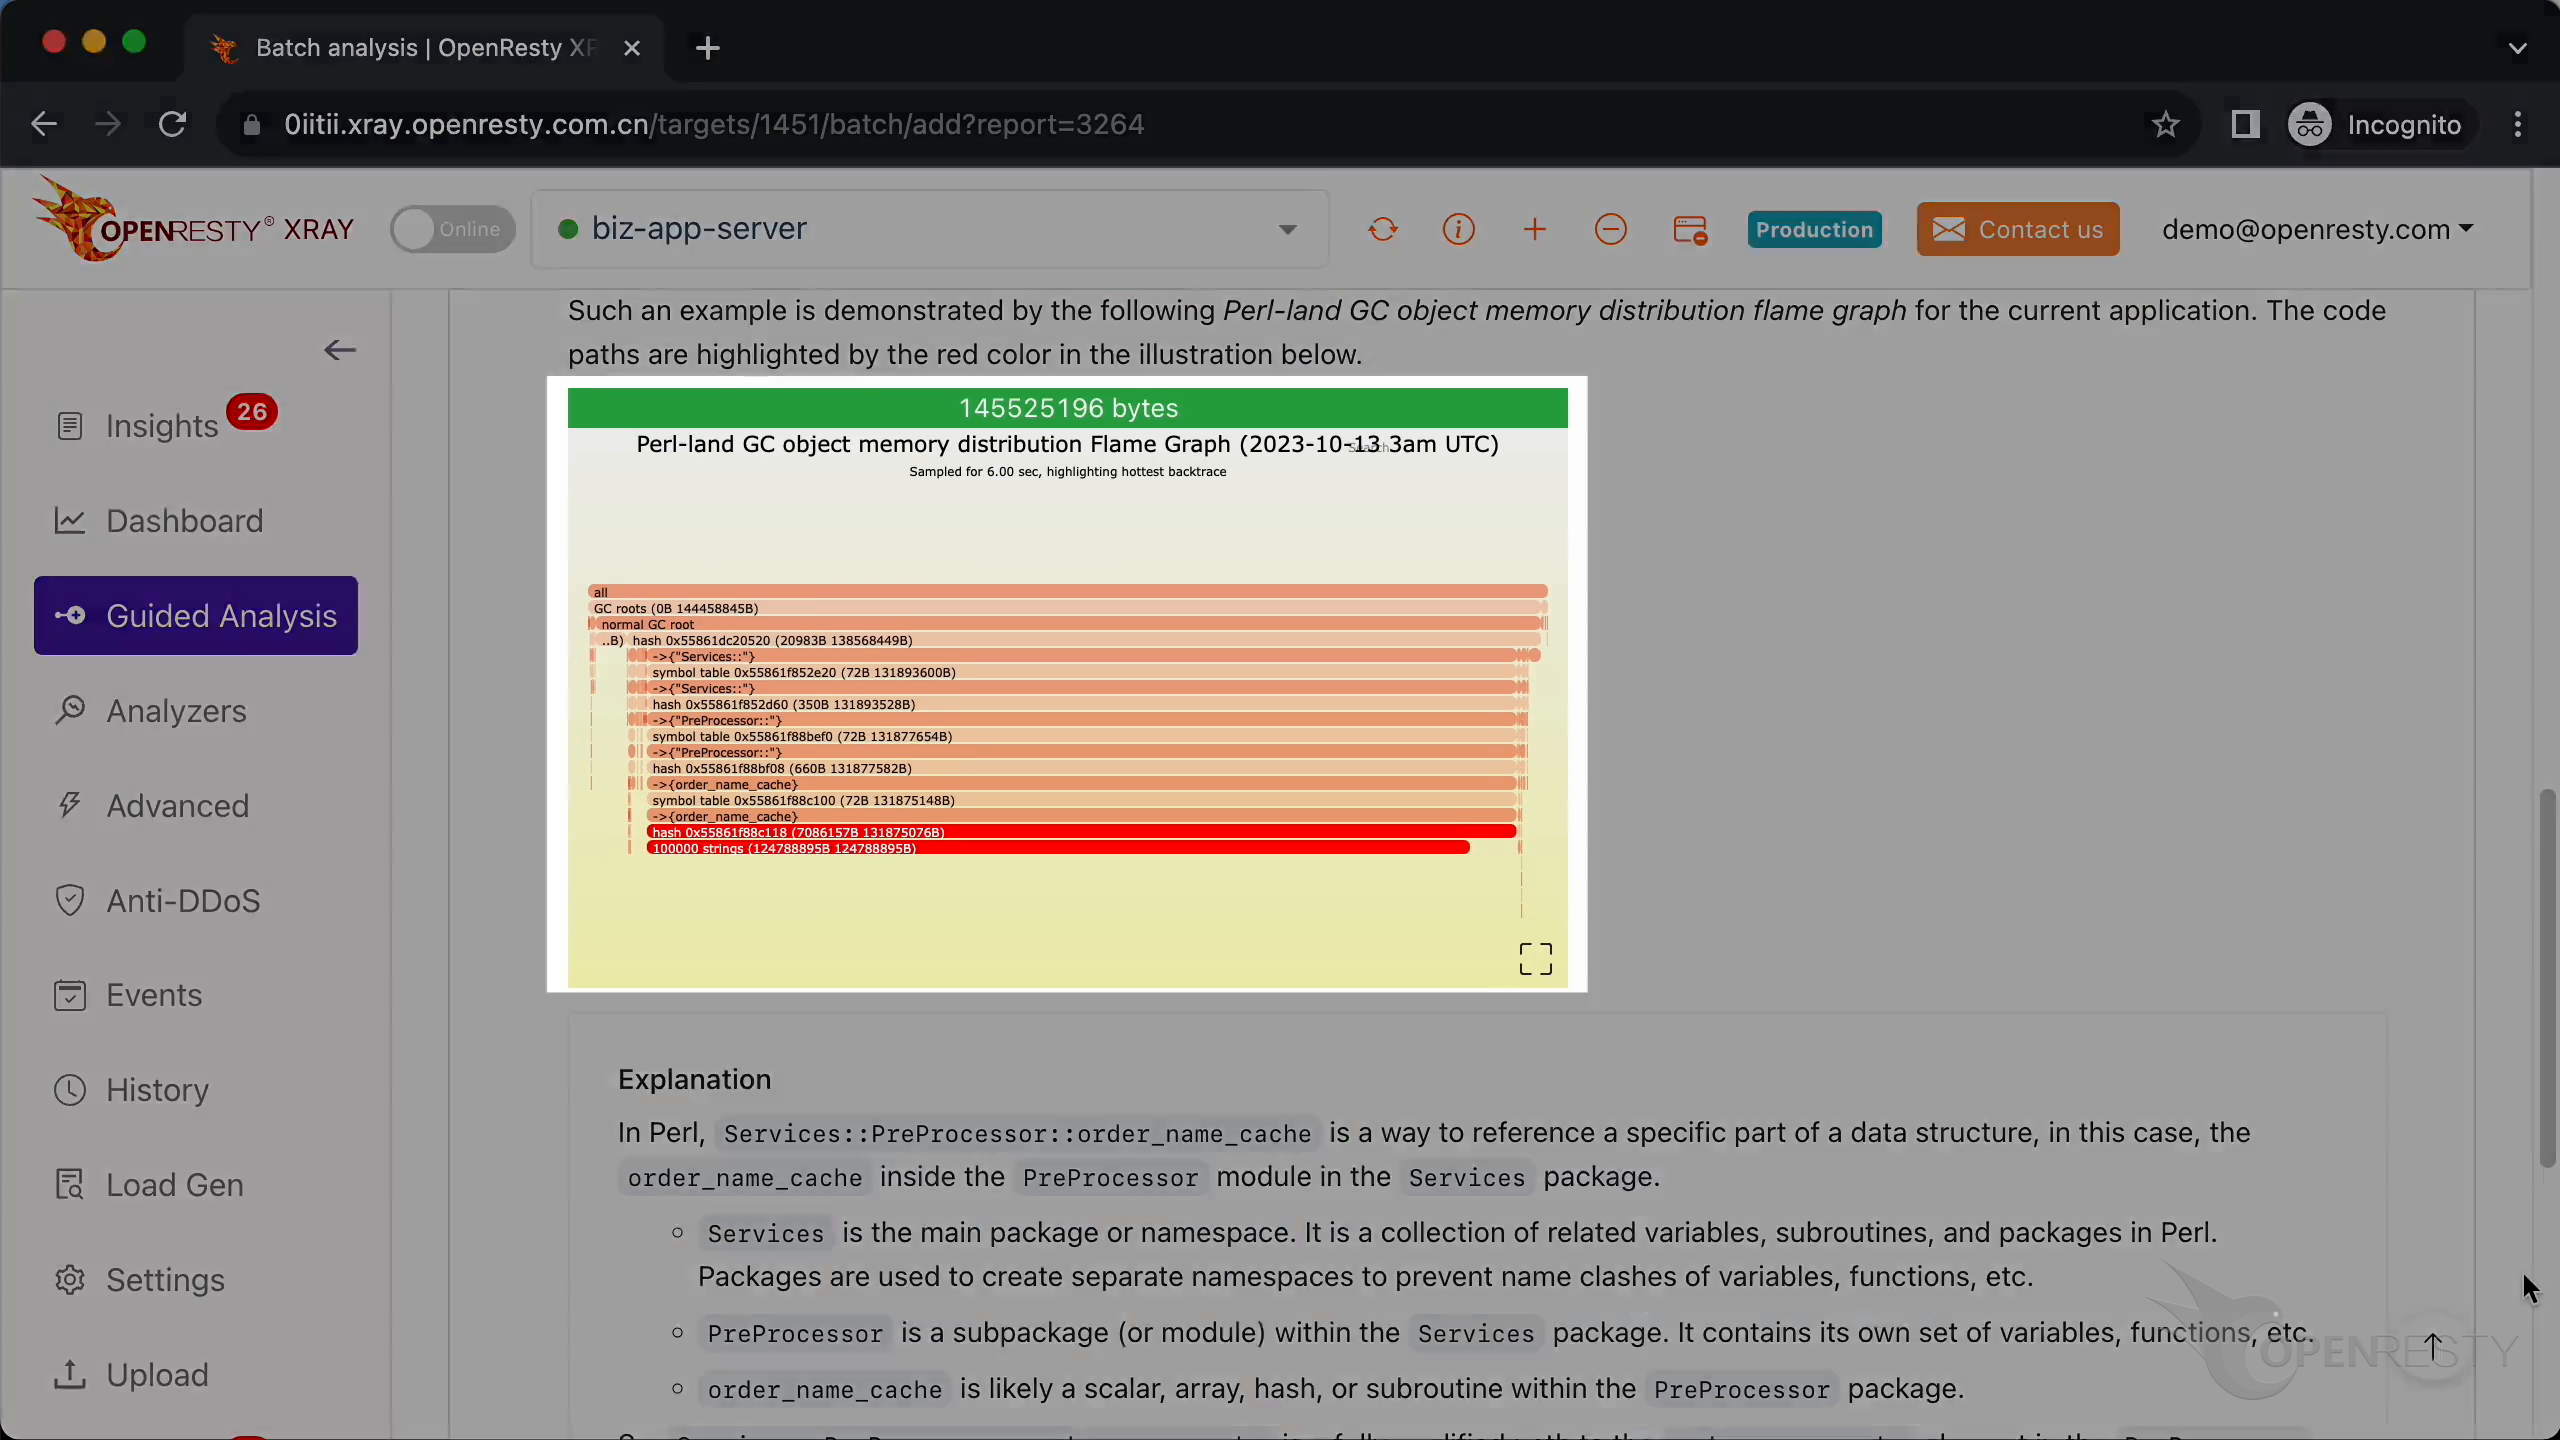
Below are more detailed explanations and suggestions regarding the current issue. It explains the objects in the data reference paths one by one.
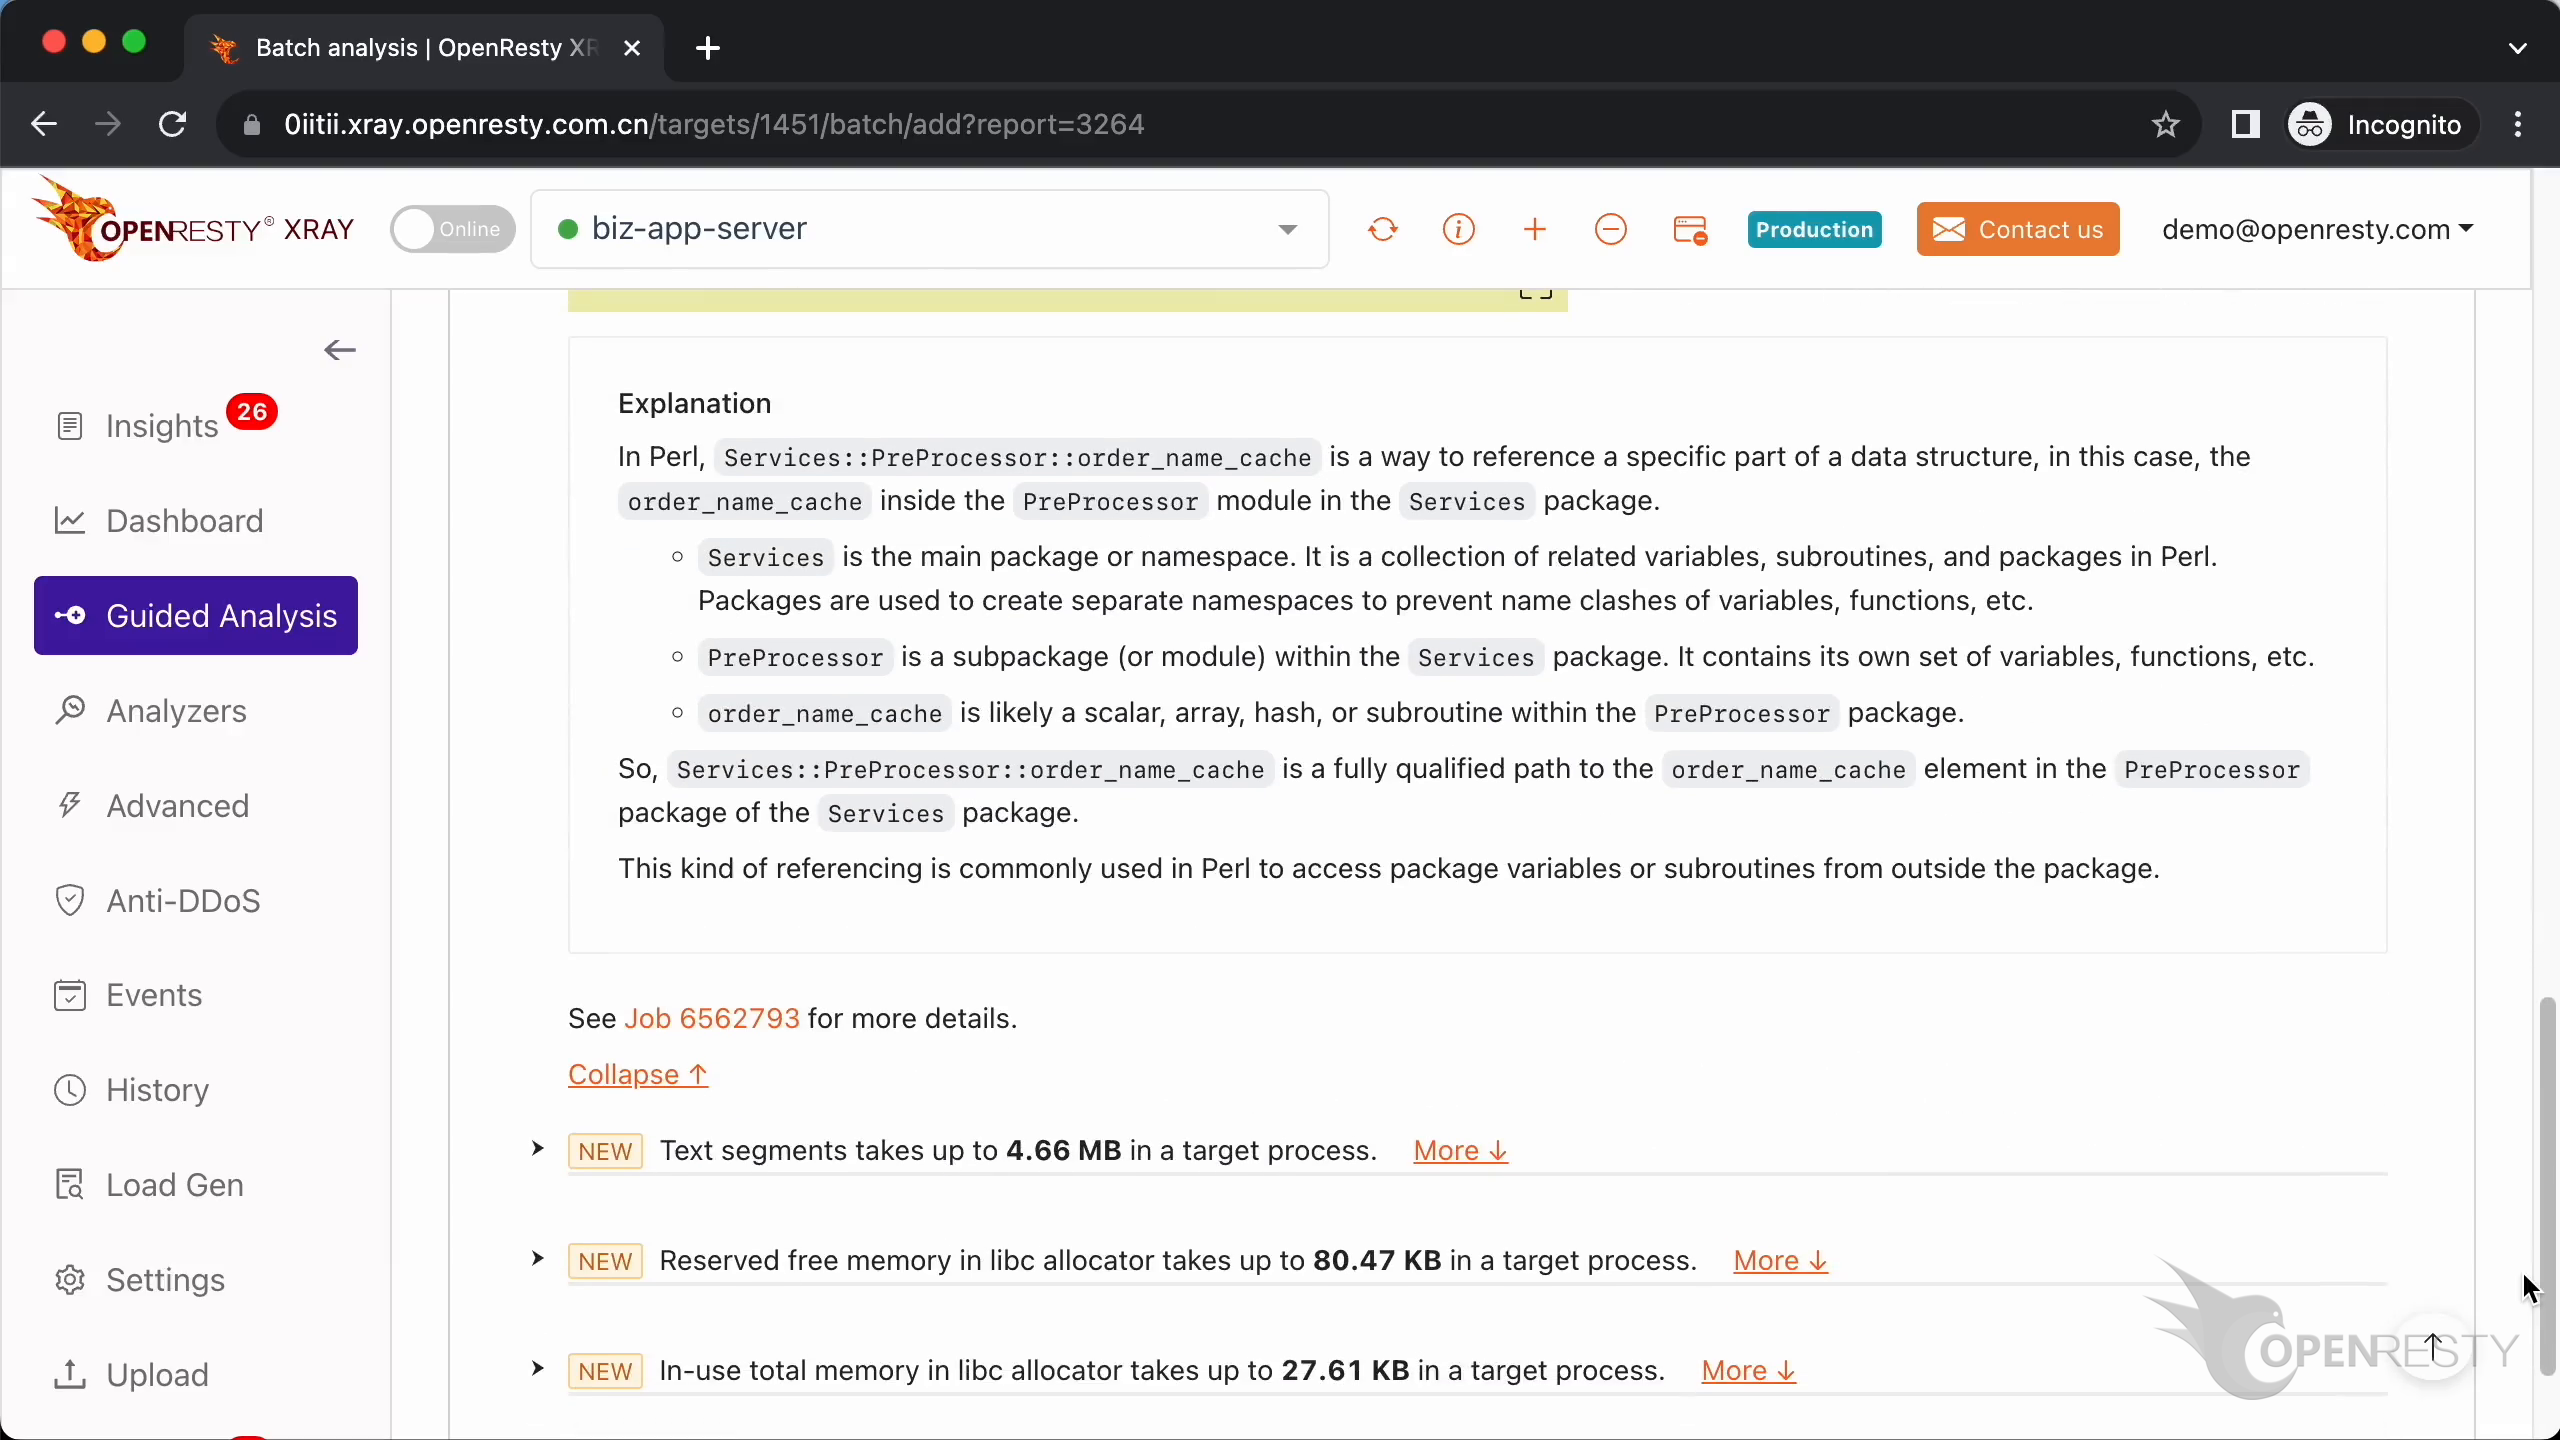
Trace the largest object back to its source file
The module name Services::PreProcessor corresponds to the Perl source file path, so we can find the source files through it.
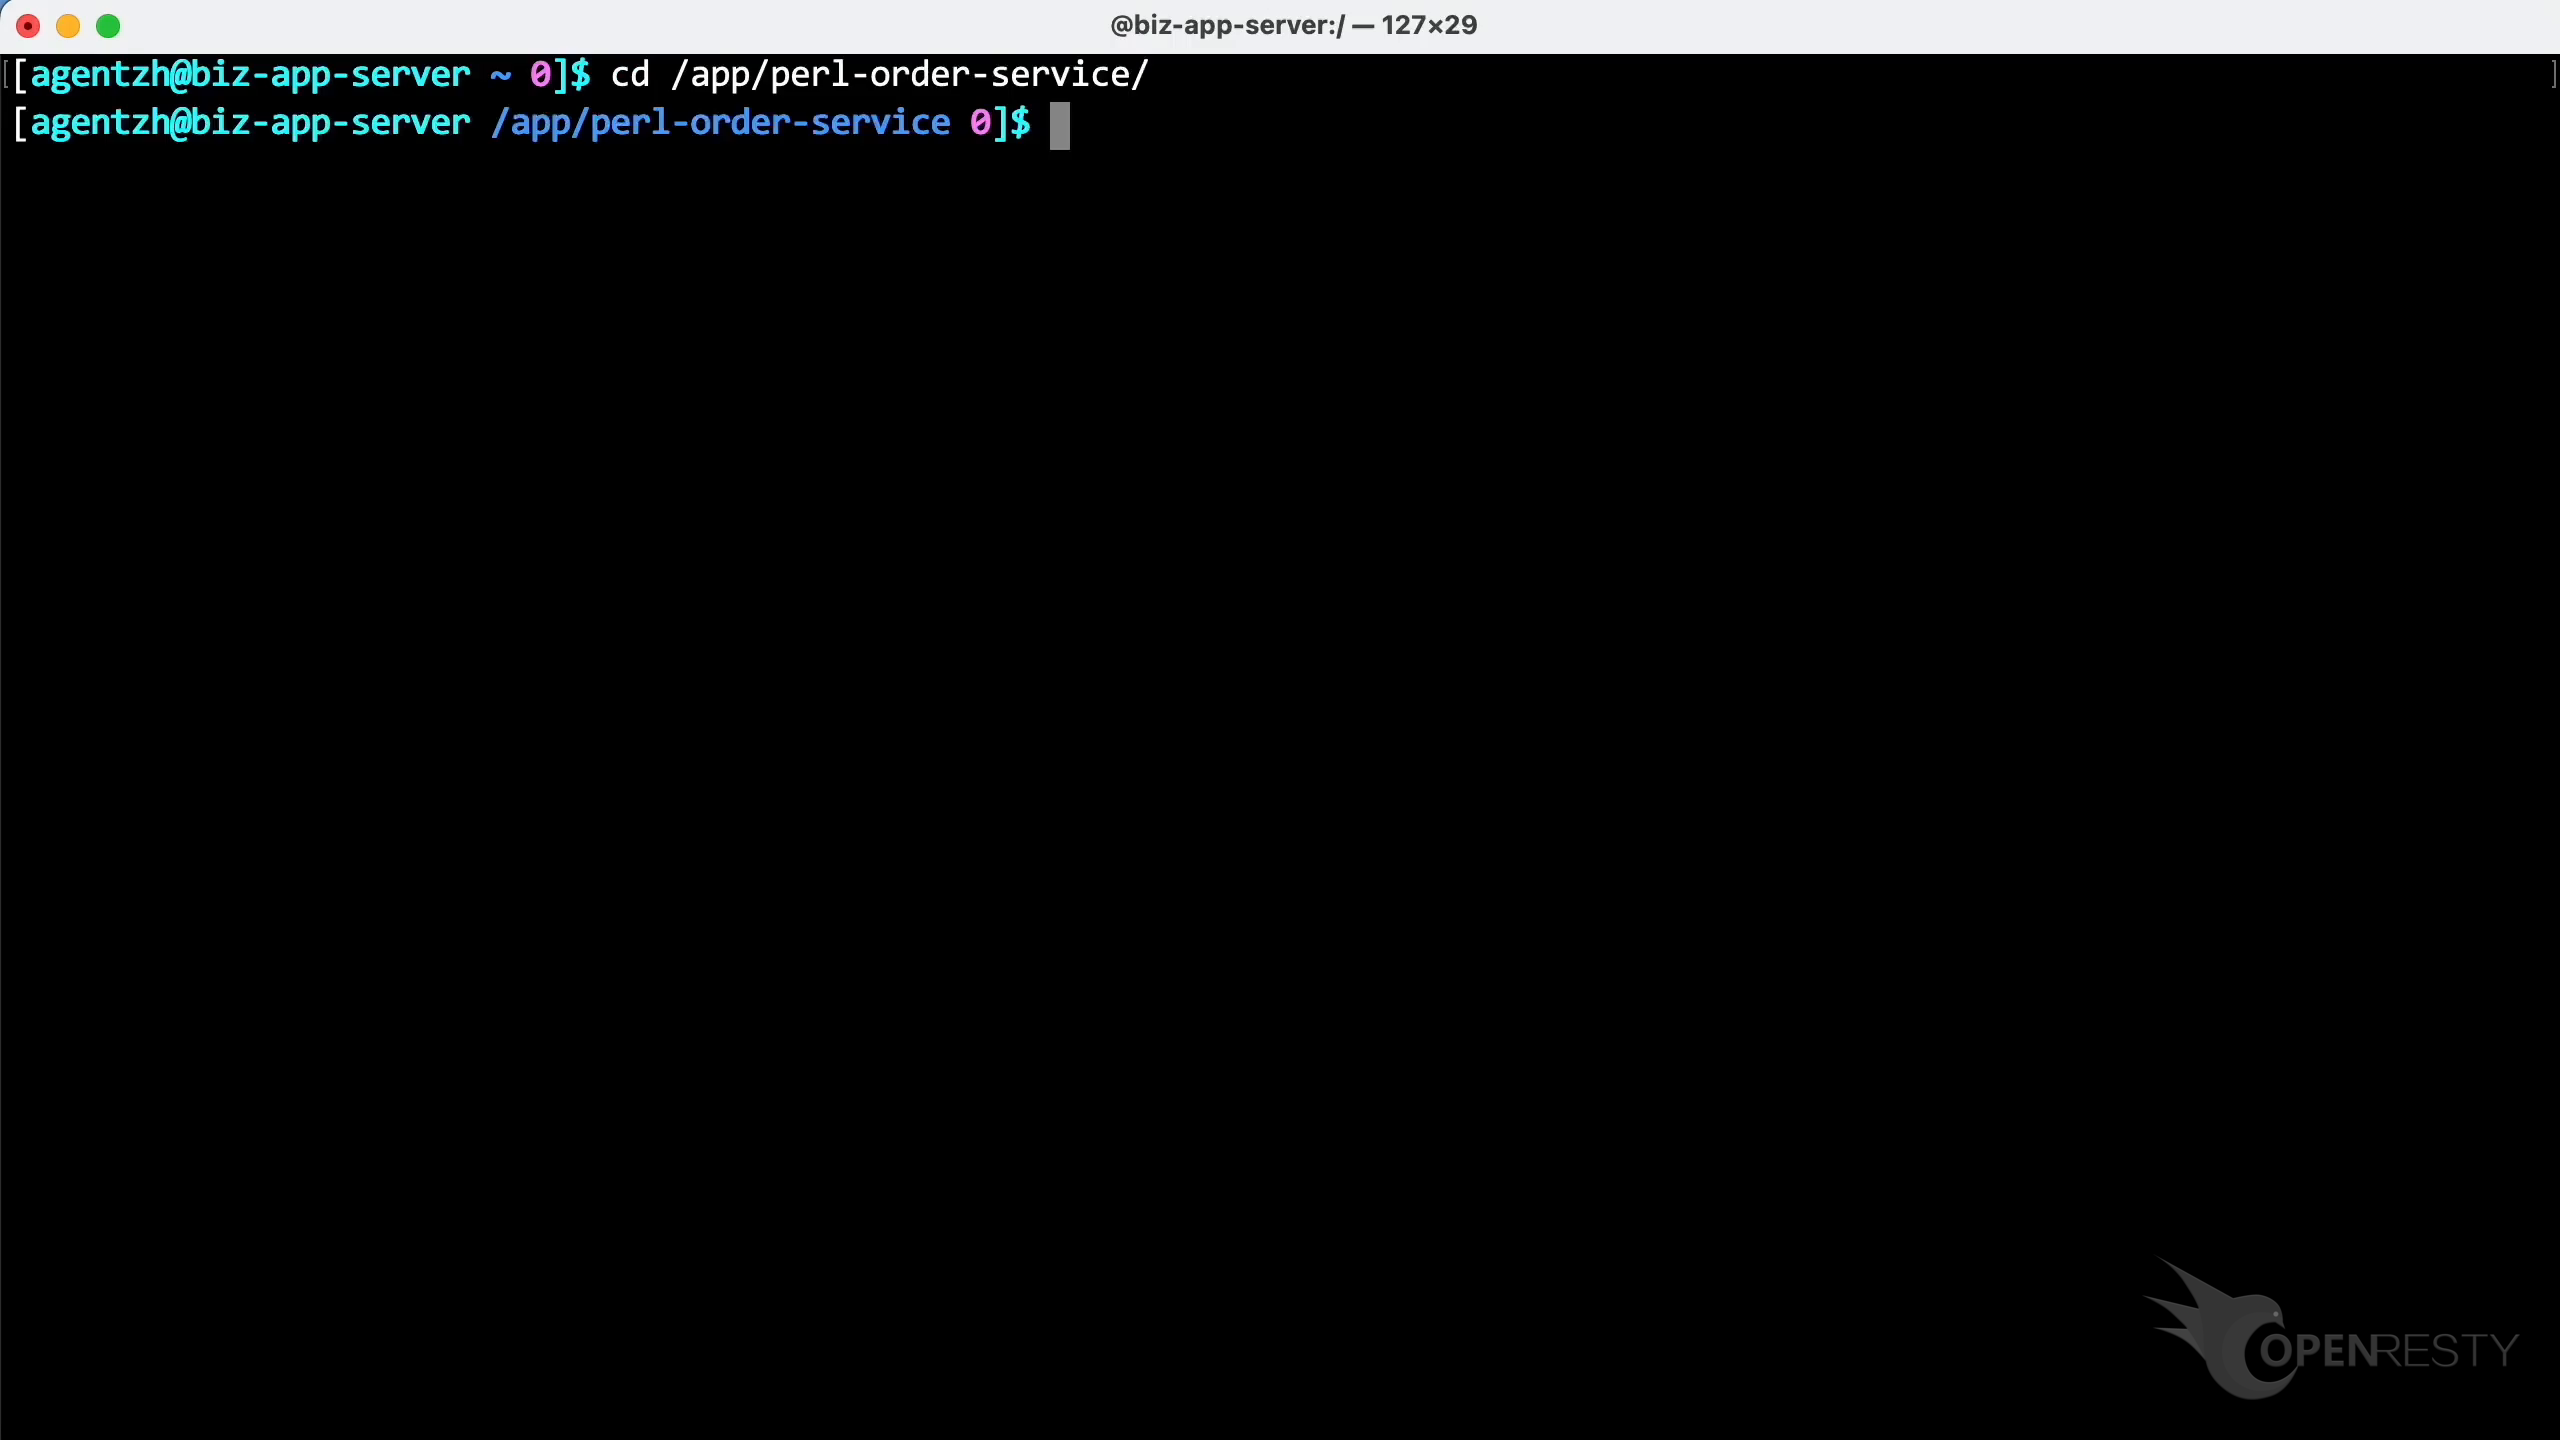
On the terminal, switch the current working directory to the Perl application’s source tree.
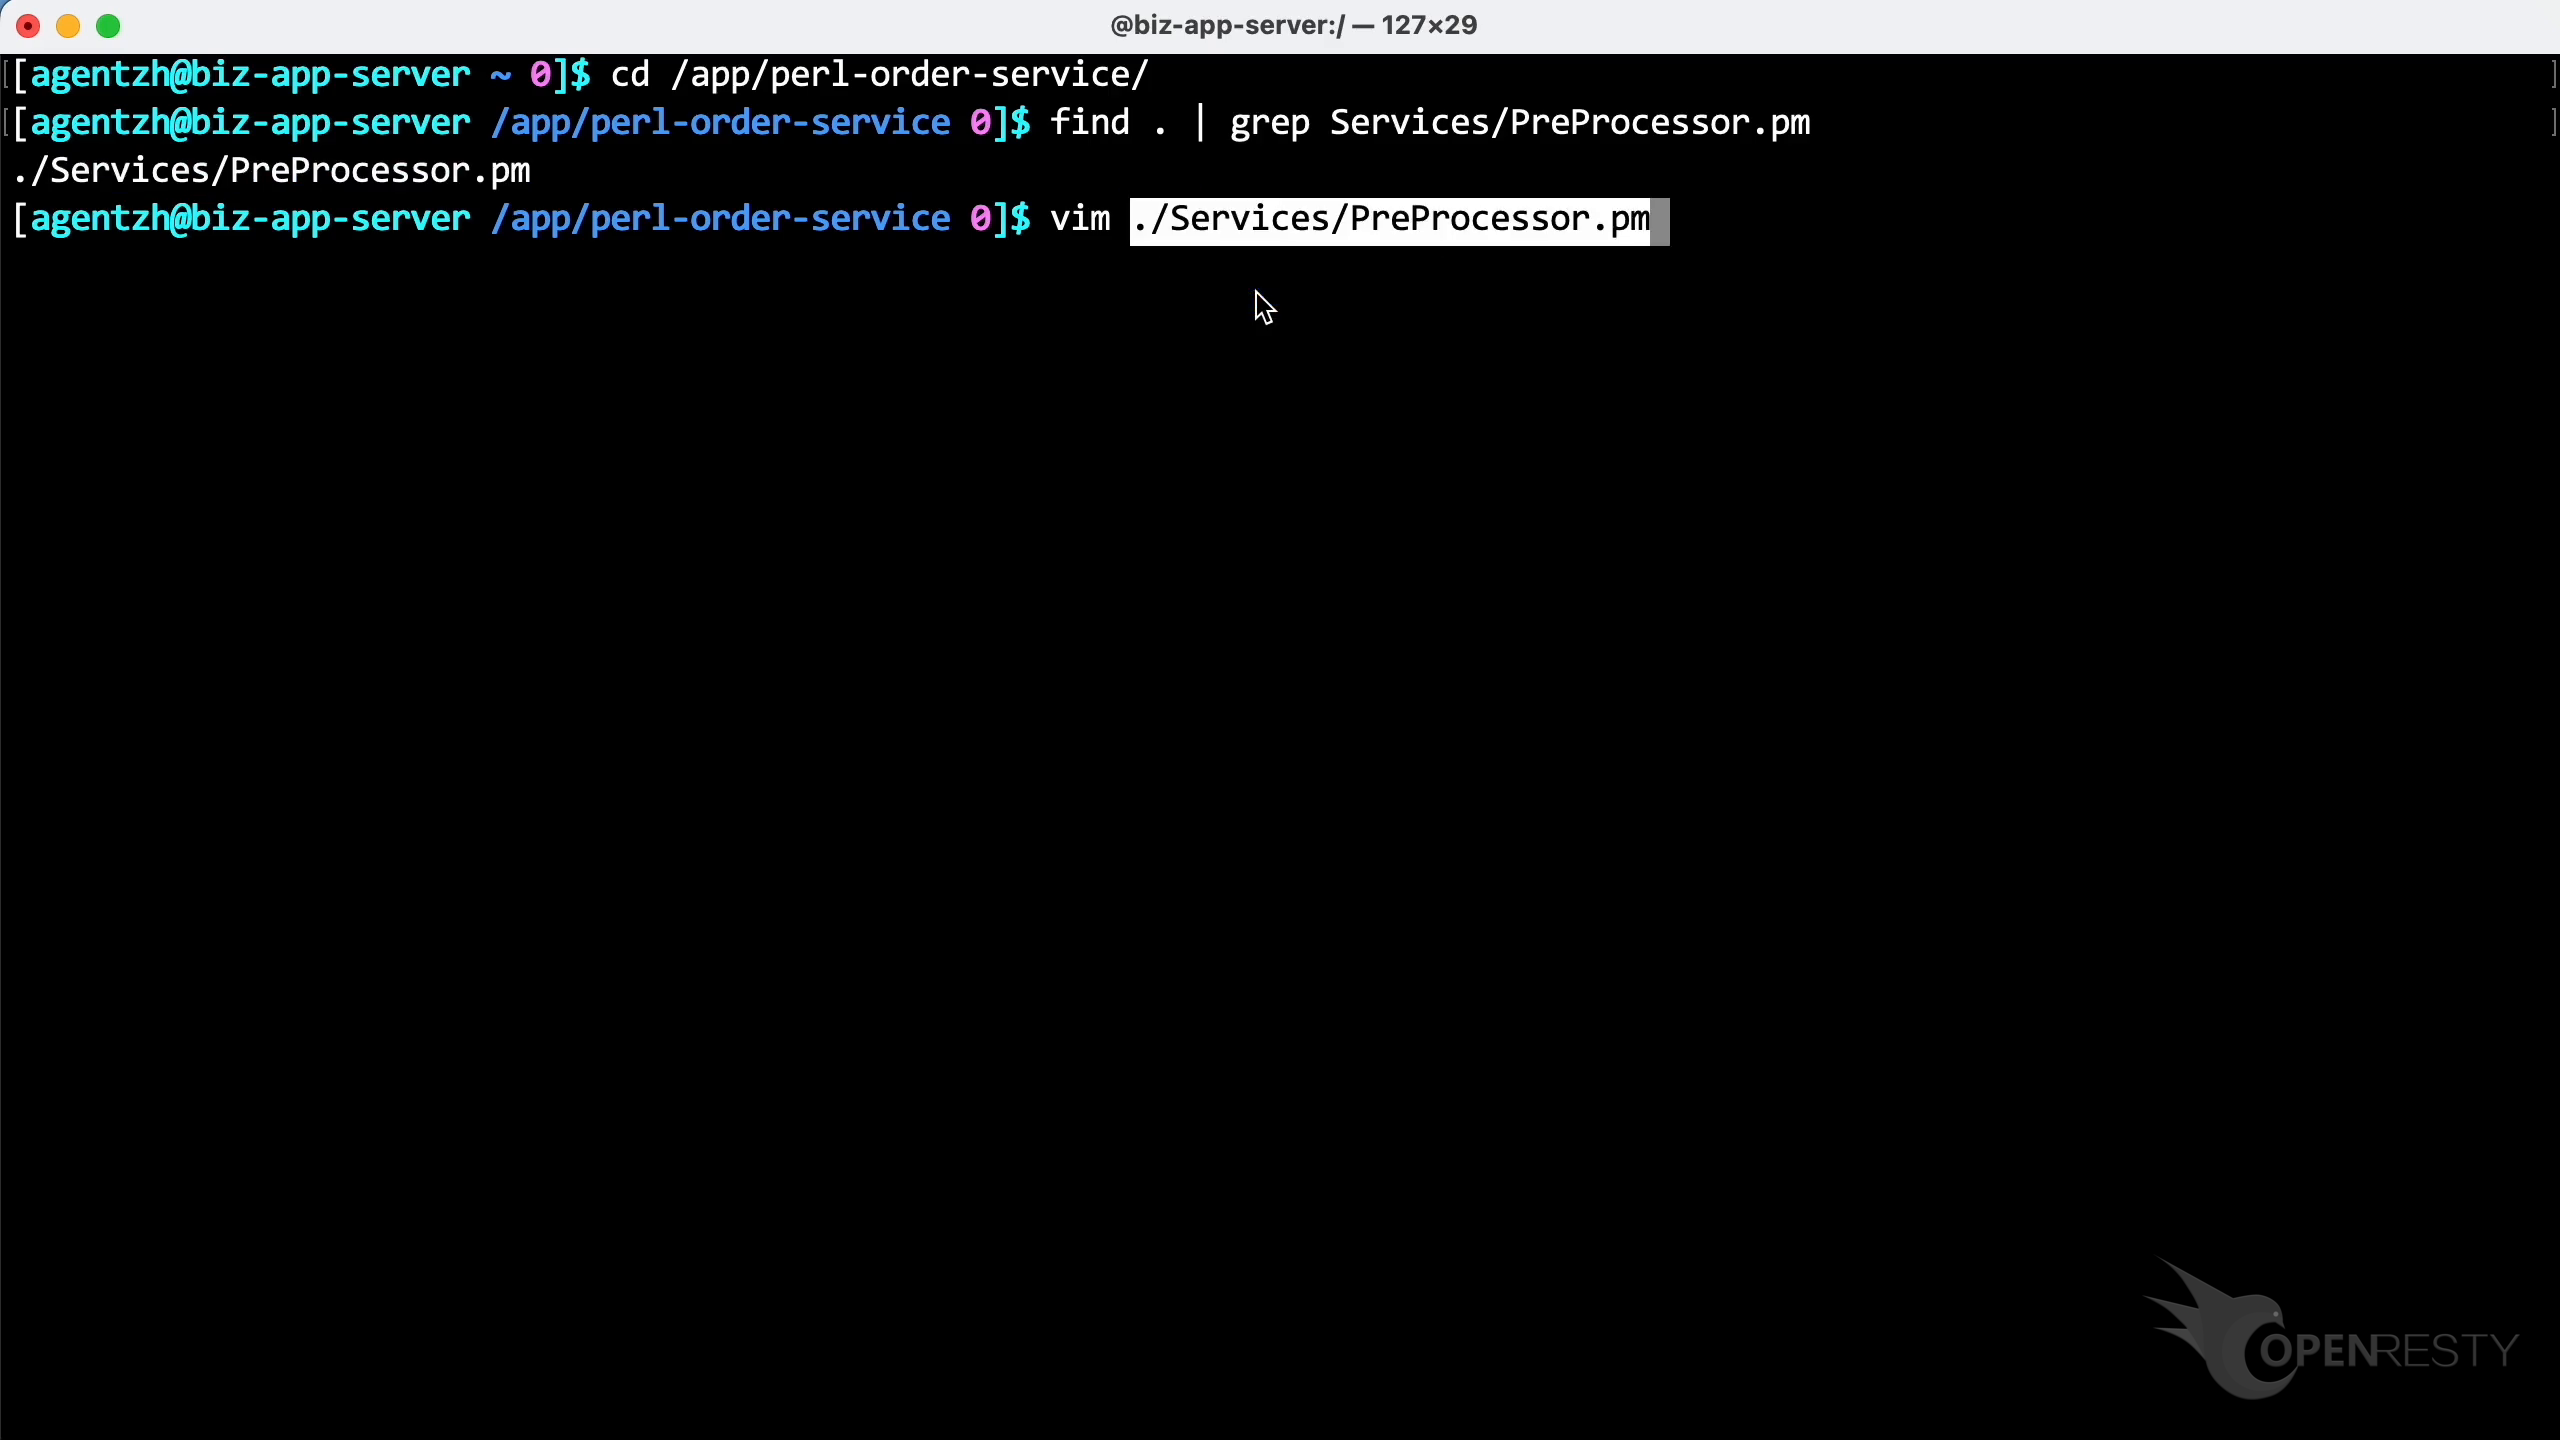
Use the find command to find the source file. Copy the full file path, then open the source file in the vim editor (or any editor you like).
Go back to the data reference path and copy the variable name for the Perl hash table.
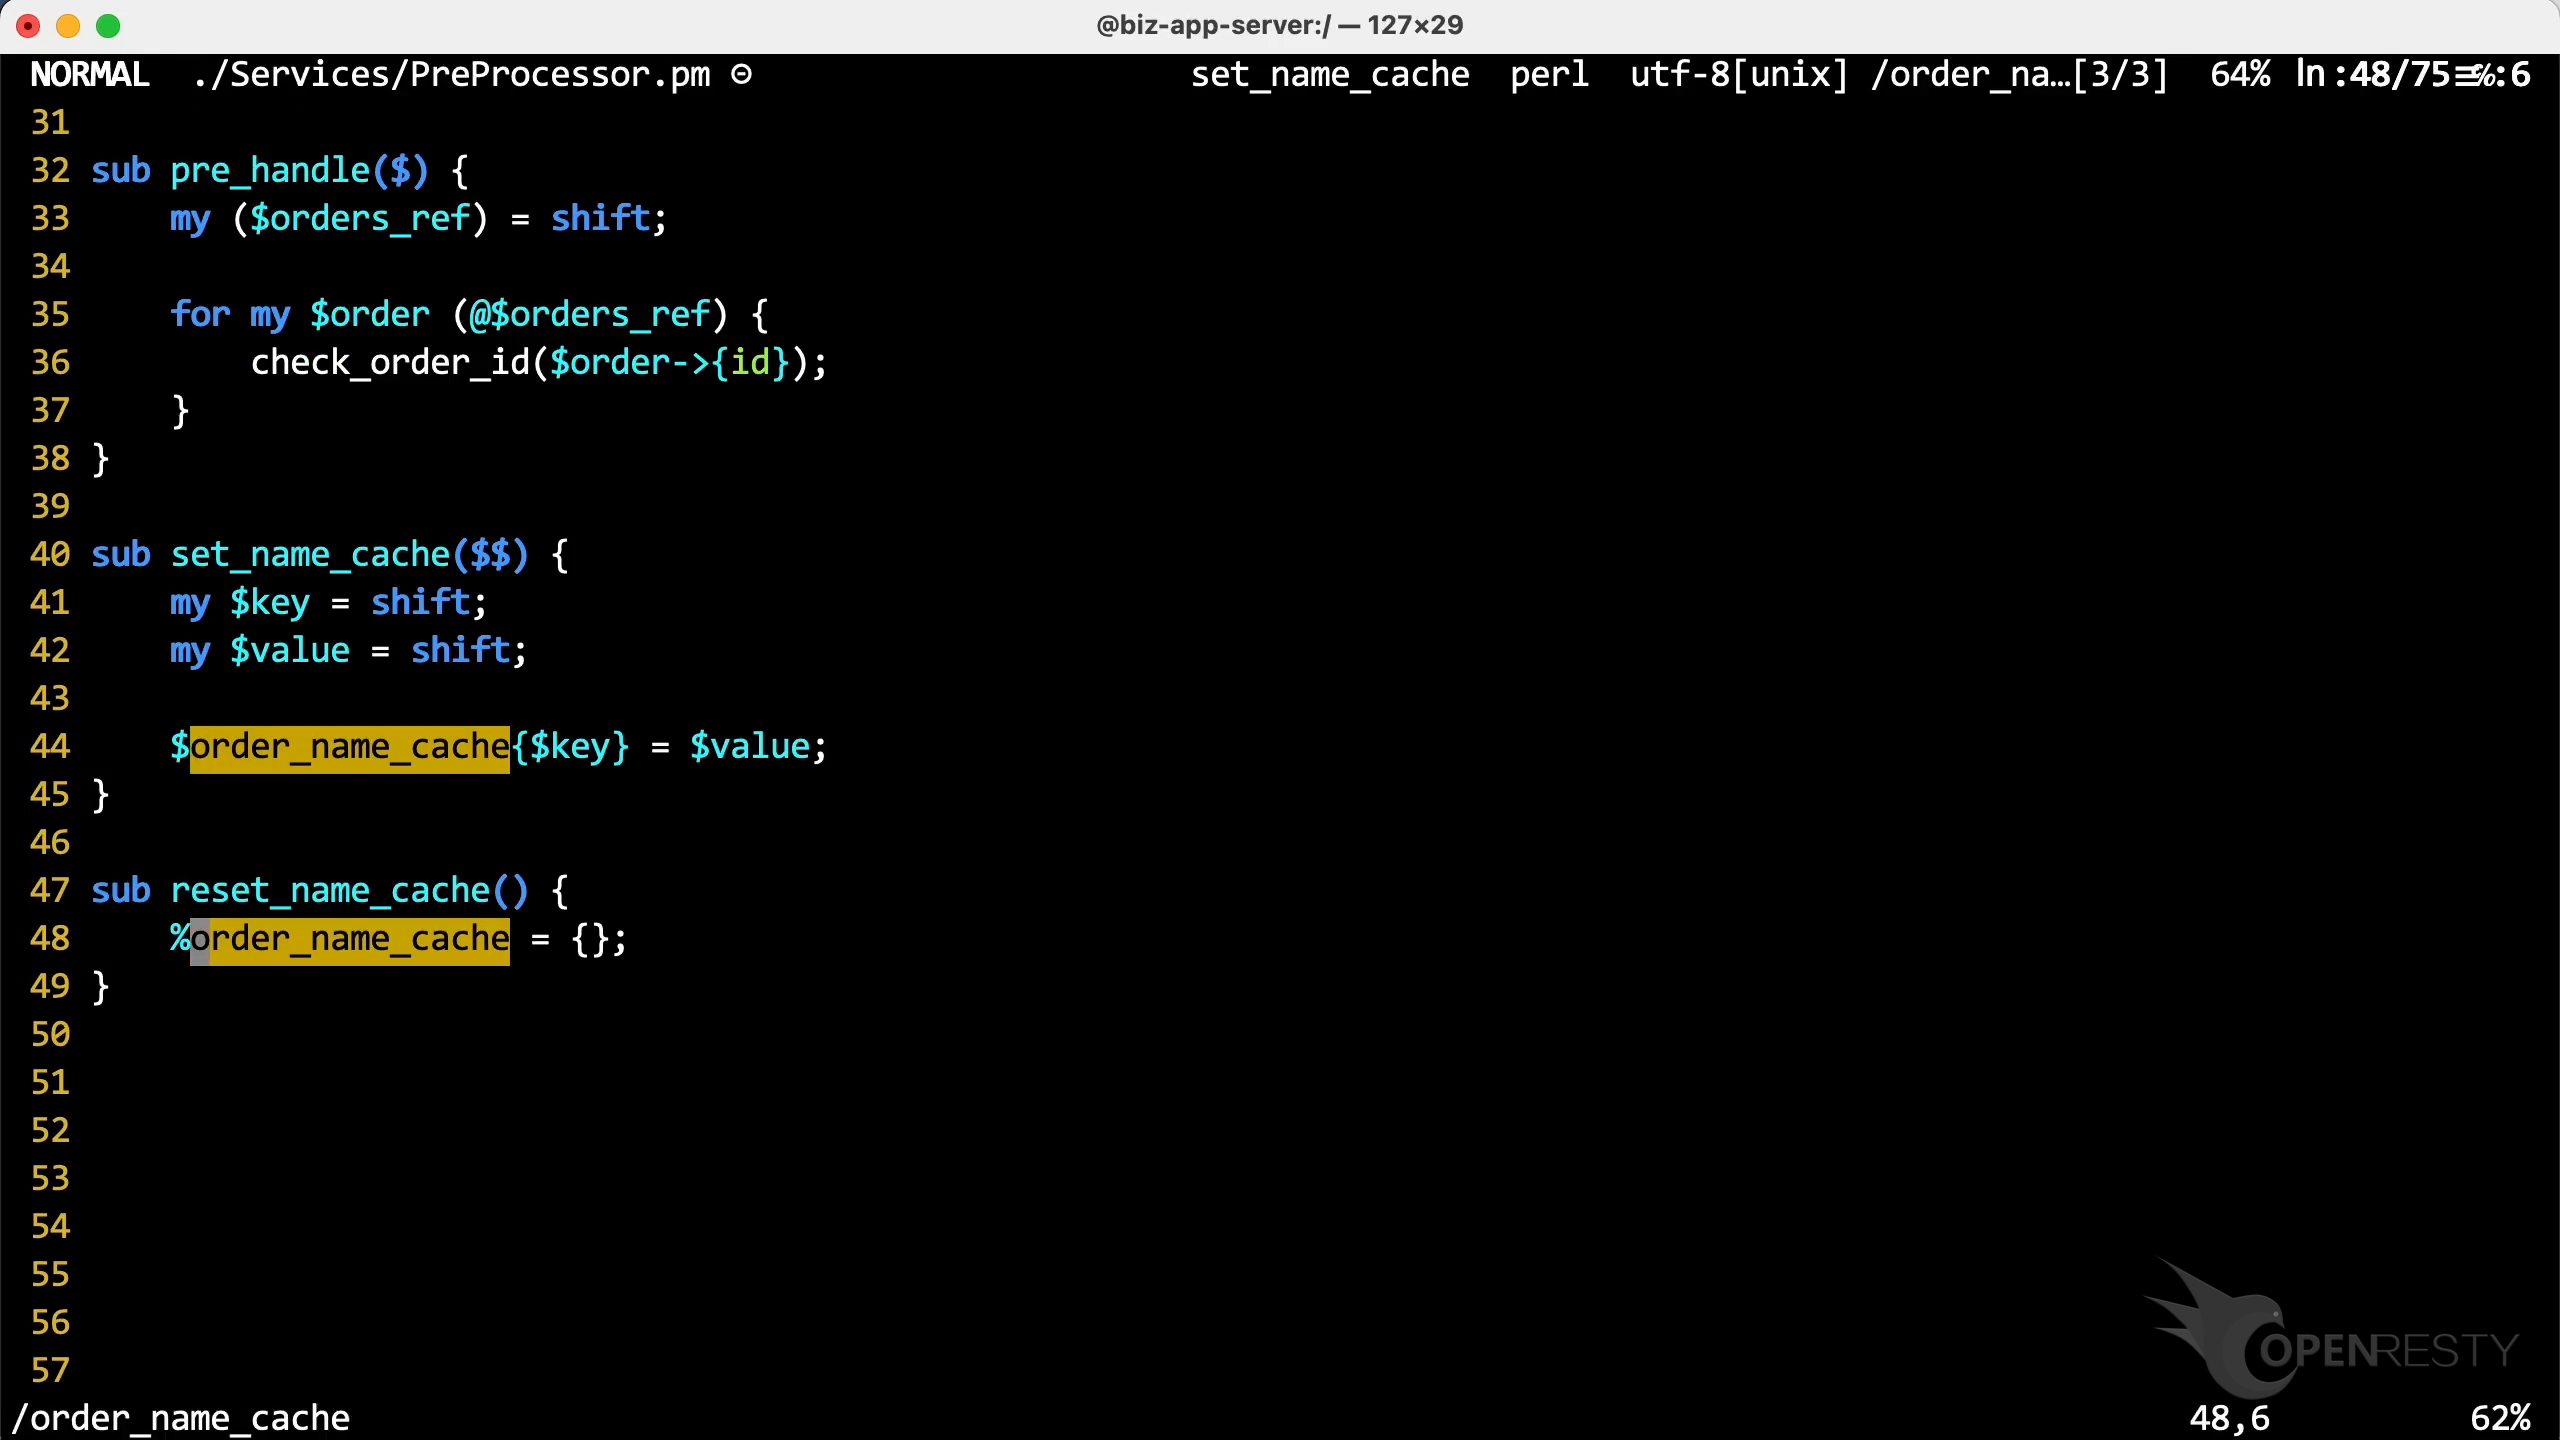
Paste what we just copied. We can see the hash table is defined here.
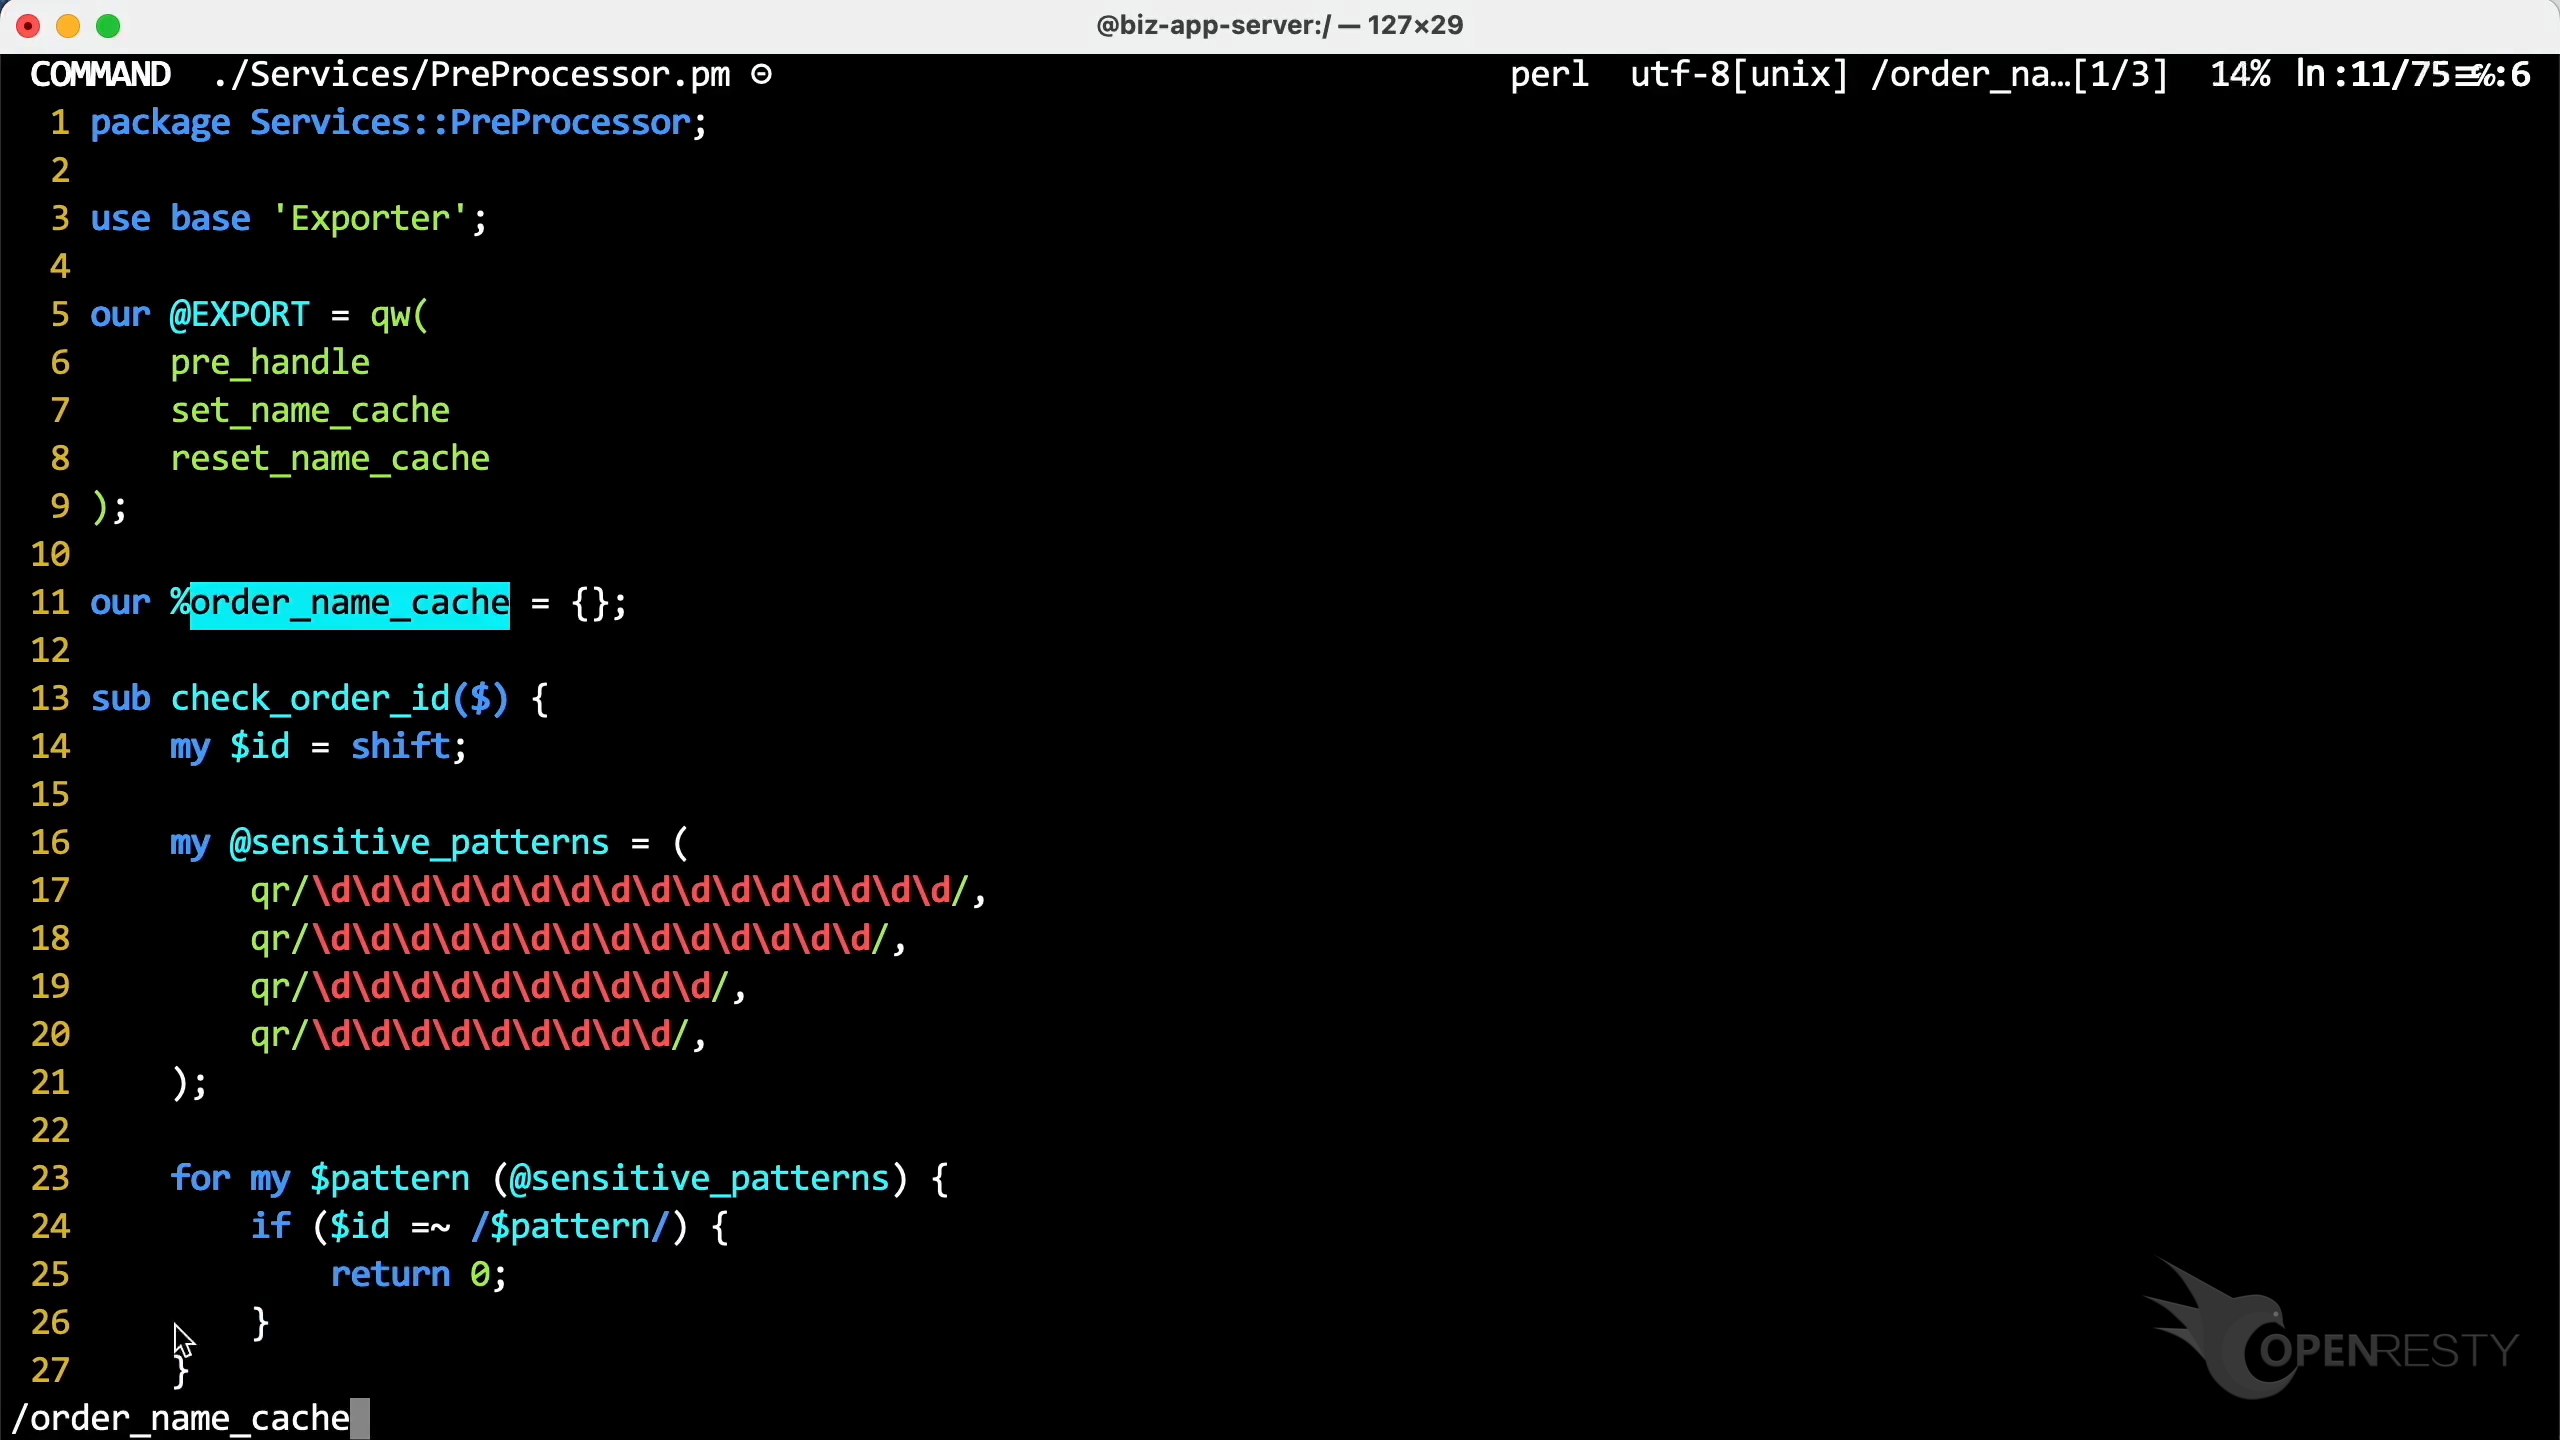
And where this hash table variable is used.
Monitor Perl process memory automatically with Insights reports
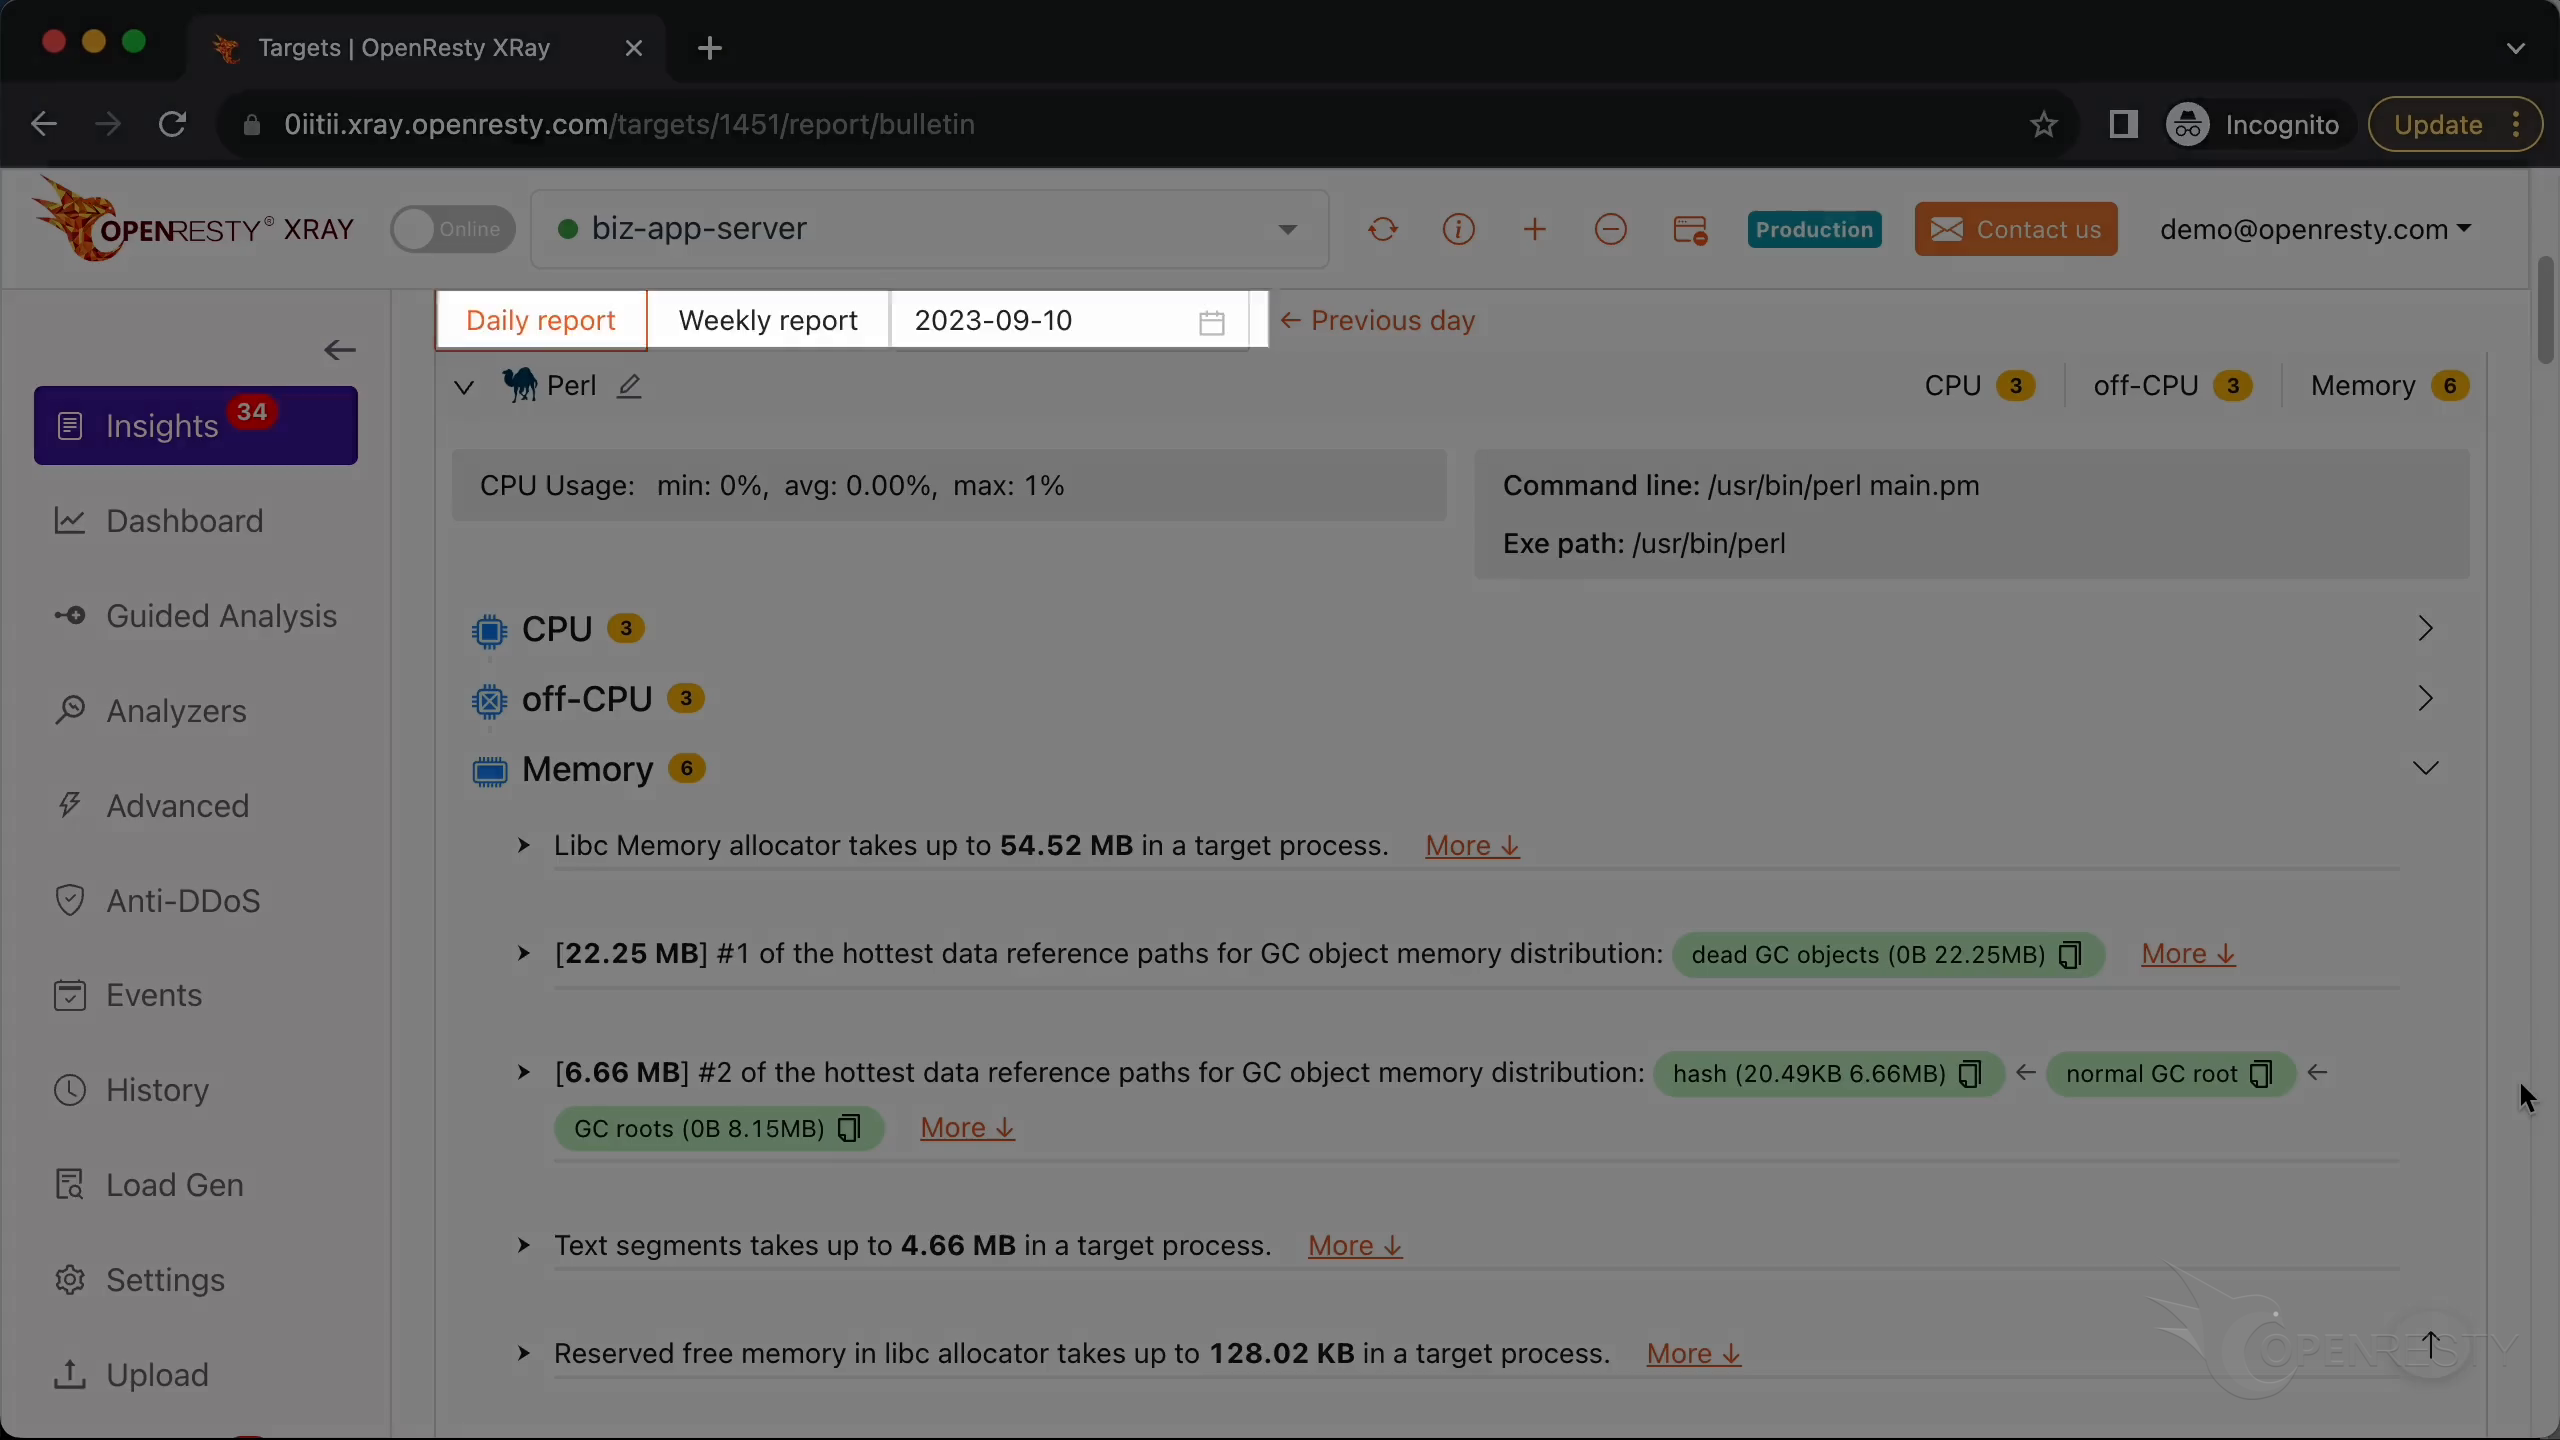
OpenResty XRay can also monitor online processes automatically and show analysis reports. On the Insights page you can find daily and weekly reports, so you don’t have to run the Guided Analysis manually — though Guided Analysis is still useful for application development and demonstration purposes.
This walkthrough targets a large, stable memory footprint. Not sure which case you have? Our guide explains how to tell a memory leak from high memory usage. If a Perl process instead keeps growing over time, see our case study on diagnosing a Perl memory leak. For CPU-side problems, see high CPU usage in a Perl process.
FAQ
How do I find which Perl process is using the most memory?
Run the top command — the Perl process shows up as the one using the most memory, more than 180MB in this case. Run ps for more details; here it’s the standard Perl binary shipped with the Linux distribution. OpenResty XRay then analyzes that exact process to find where the memory is spent.
Can I profile Perl memory usage without changing the code or restarting?
Yes. OpenResty XRay analyzes the unmodified, running Perl process in real time — in this case the standard Perl binary shipped with the Linux distribution. Because it works on the process as-is, you don’t modify or restart the application to see where its memory goes.
What is a Perl memory object reference path?
It’s the reference path to the object holding the most memory — here, the order_name_cache hash table in the Services::Preprocessor module. OpenResty XRay infers this path automatically from the Perl-land GC object memory distribution flame graph.
How do I trace a large Perl object back to its source code?
The module name corresponds to the Perl source file path, so you can locate the source file through it. Copy the variable name from the reference path — here order_name_cache — use find to locate the file, open it, and see where the hash table is defined and used.
What is OpenResty XRay
OpenResty XRay is a dynamic-tracing product that automatically analyzes your running applications to troubleshoot performance problems, behavioral issues, and security vulnerabilities with actionable suggestions. Under the hood, OpenResty XRay is powered by our Y language targeting various runtimes like Stap+, eBPF+, GDB, and ODB, depending on the contexts.
If you like this tutorial, please subscribe to this blog site and/or our YouTube channel. Thank you!
About The Author
Yichun Zhang (Github handle: agentzh), is the original creator of the OpenResty® open-source project and the CEO of OpenResty Inc..
Yichun is one of the earliest advocates and leaders of “open-source technology”. He worked at many internationally renowned tech companies, such as Cloudflare, Yahoo!. He is a pioneer of “edge computing”, “dynamic tracing” and “machine coding”, with over 22 years of programming and 16 years of open source experience. Yichun is well-known in the open-source space as the project leader of OpenResty®, adopted by more than 40 million global website domains.
OpenResty Inc., the enterprise software start-up founded by Yichun in 2017, has customers from some of the biggest companies in the world. Its flagship product, OpenResty XRay, is a non-invasive profiling and troubleshooting tool that significantly enhances and utilizes dynamic tracing technology. And its OpenResty Edge product is a powerful distributed traffic management and private CDN software product.
As an avid open-source contributor, Yichun has contributed more than a million lines of code to numerous open-source projects, including Linux kernel, Nginx, LuaJIT, GDB, SystemTap, LLVM, Perl, etc. He has also authored more than 60 open-source software libraries.
Related Articles
OpenResty XRay Sep 12, 2025

OpenResty XRay Dec 25, 2023

OpenResty XRay Oct 11, 2023

OpenResty XRay Sep 28, 2023

OpenResty XRay Aug 4, 2023