How to Trace Exceptions inside Perl Applications (using OpenResty XRay)
In this tutorial, we will walk through how to use OpenResty XRay to detect and analyze the exceptions in the Perl applications online. OpenResty XRay offers the capability to detect and analyze exceptions or panics in online Go processes, including caught ones that do not lead to process crashes. The code paths are obtained by OpenResty XRay automatically analyzing and interpreting the Go code-level Exception Flame Graphs. It will minimize the performance impact. This makes it ideal for production environments sensitive to performance overhead and latency.
How to detect and analyze exceptions inside Perl applications
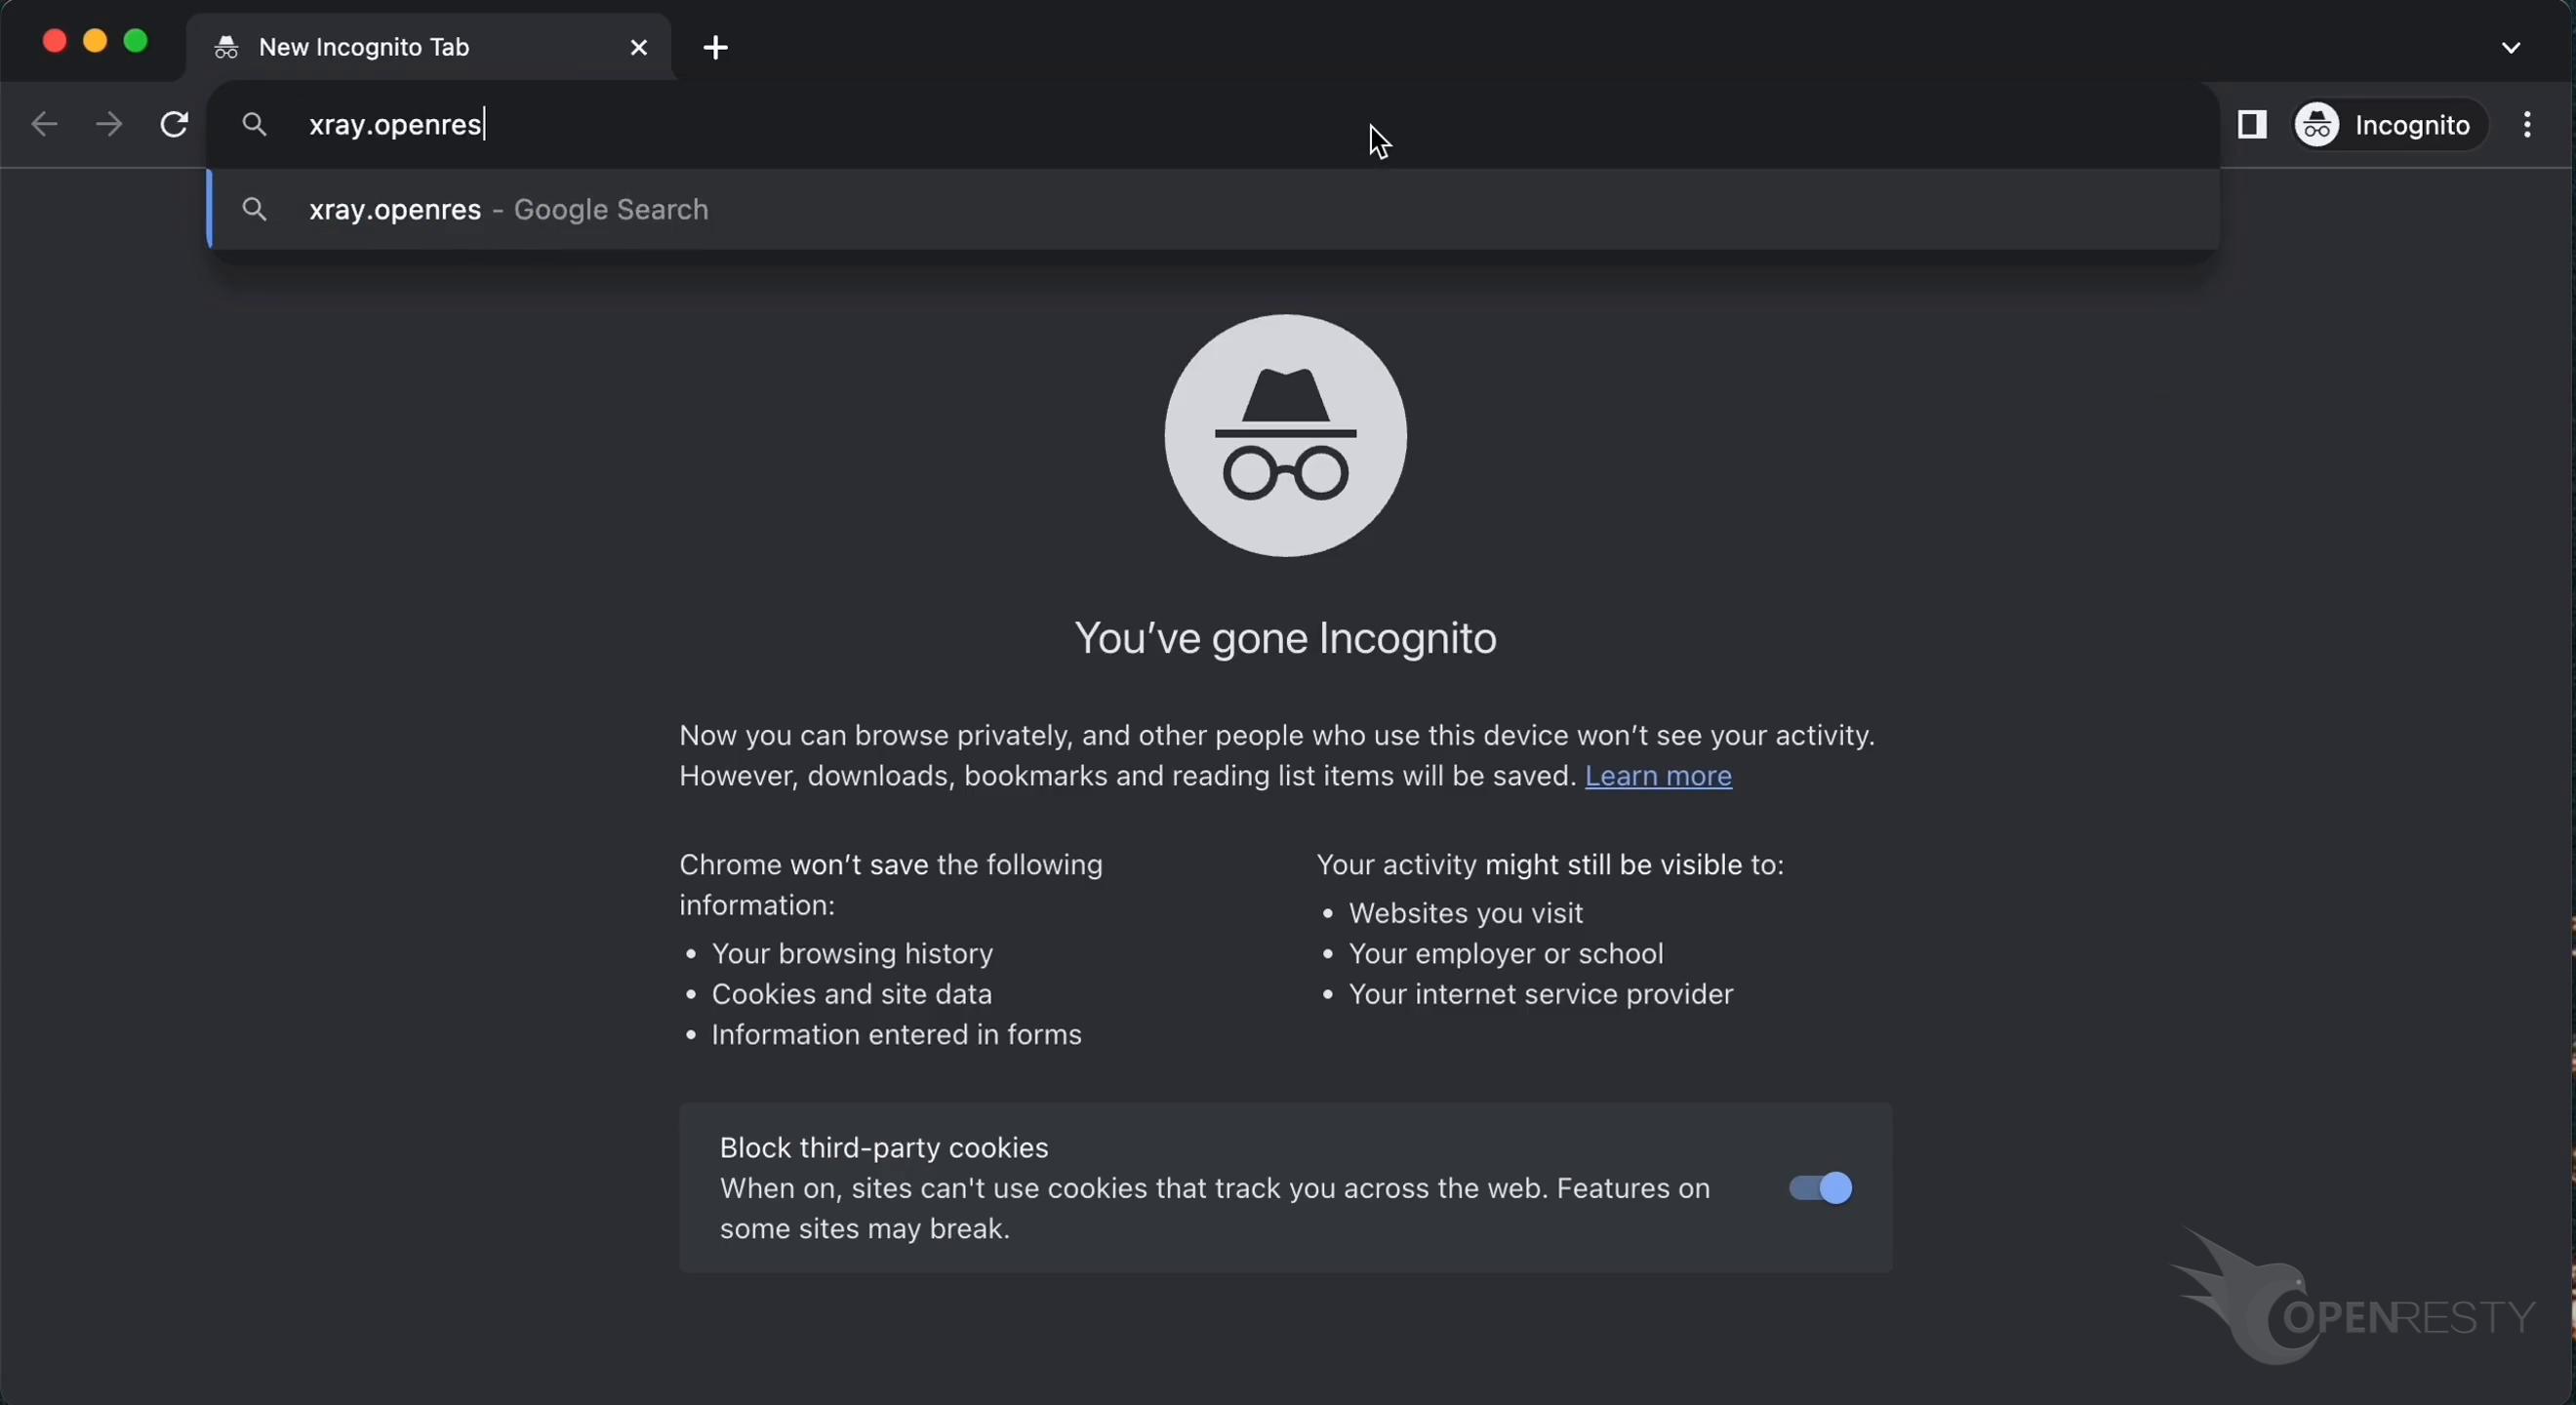
Open the OpenResty XRay web console in the web browser.
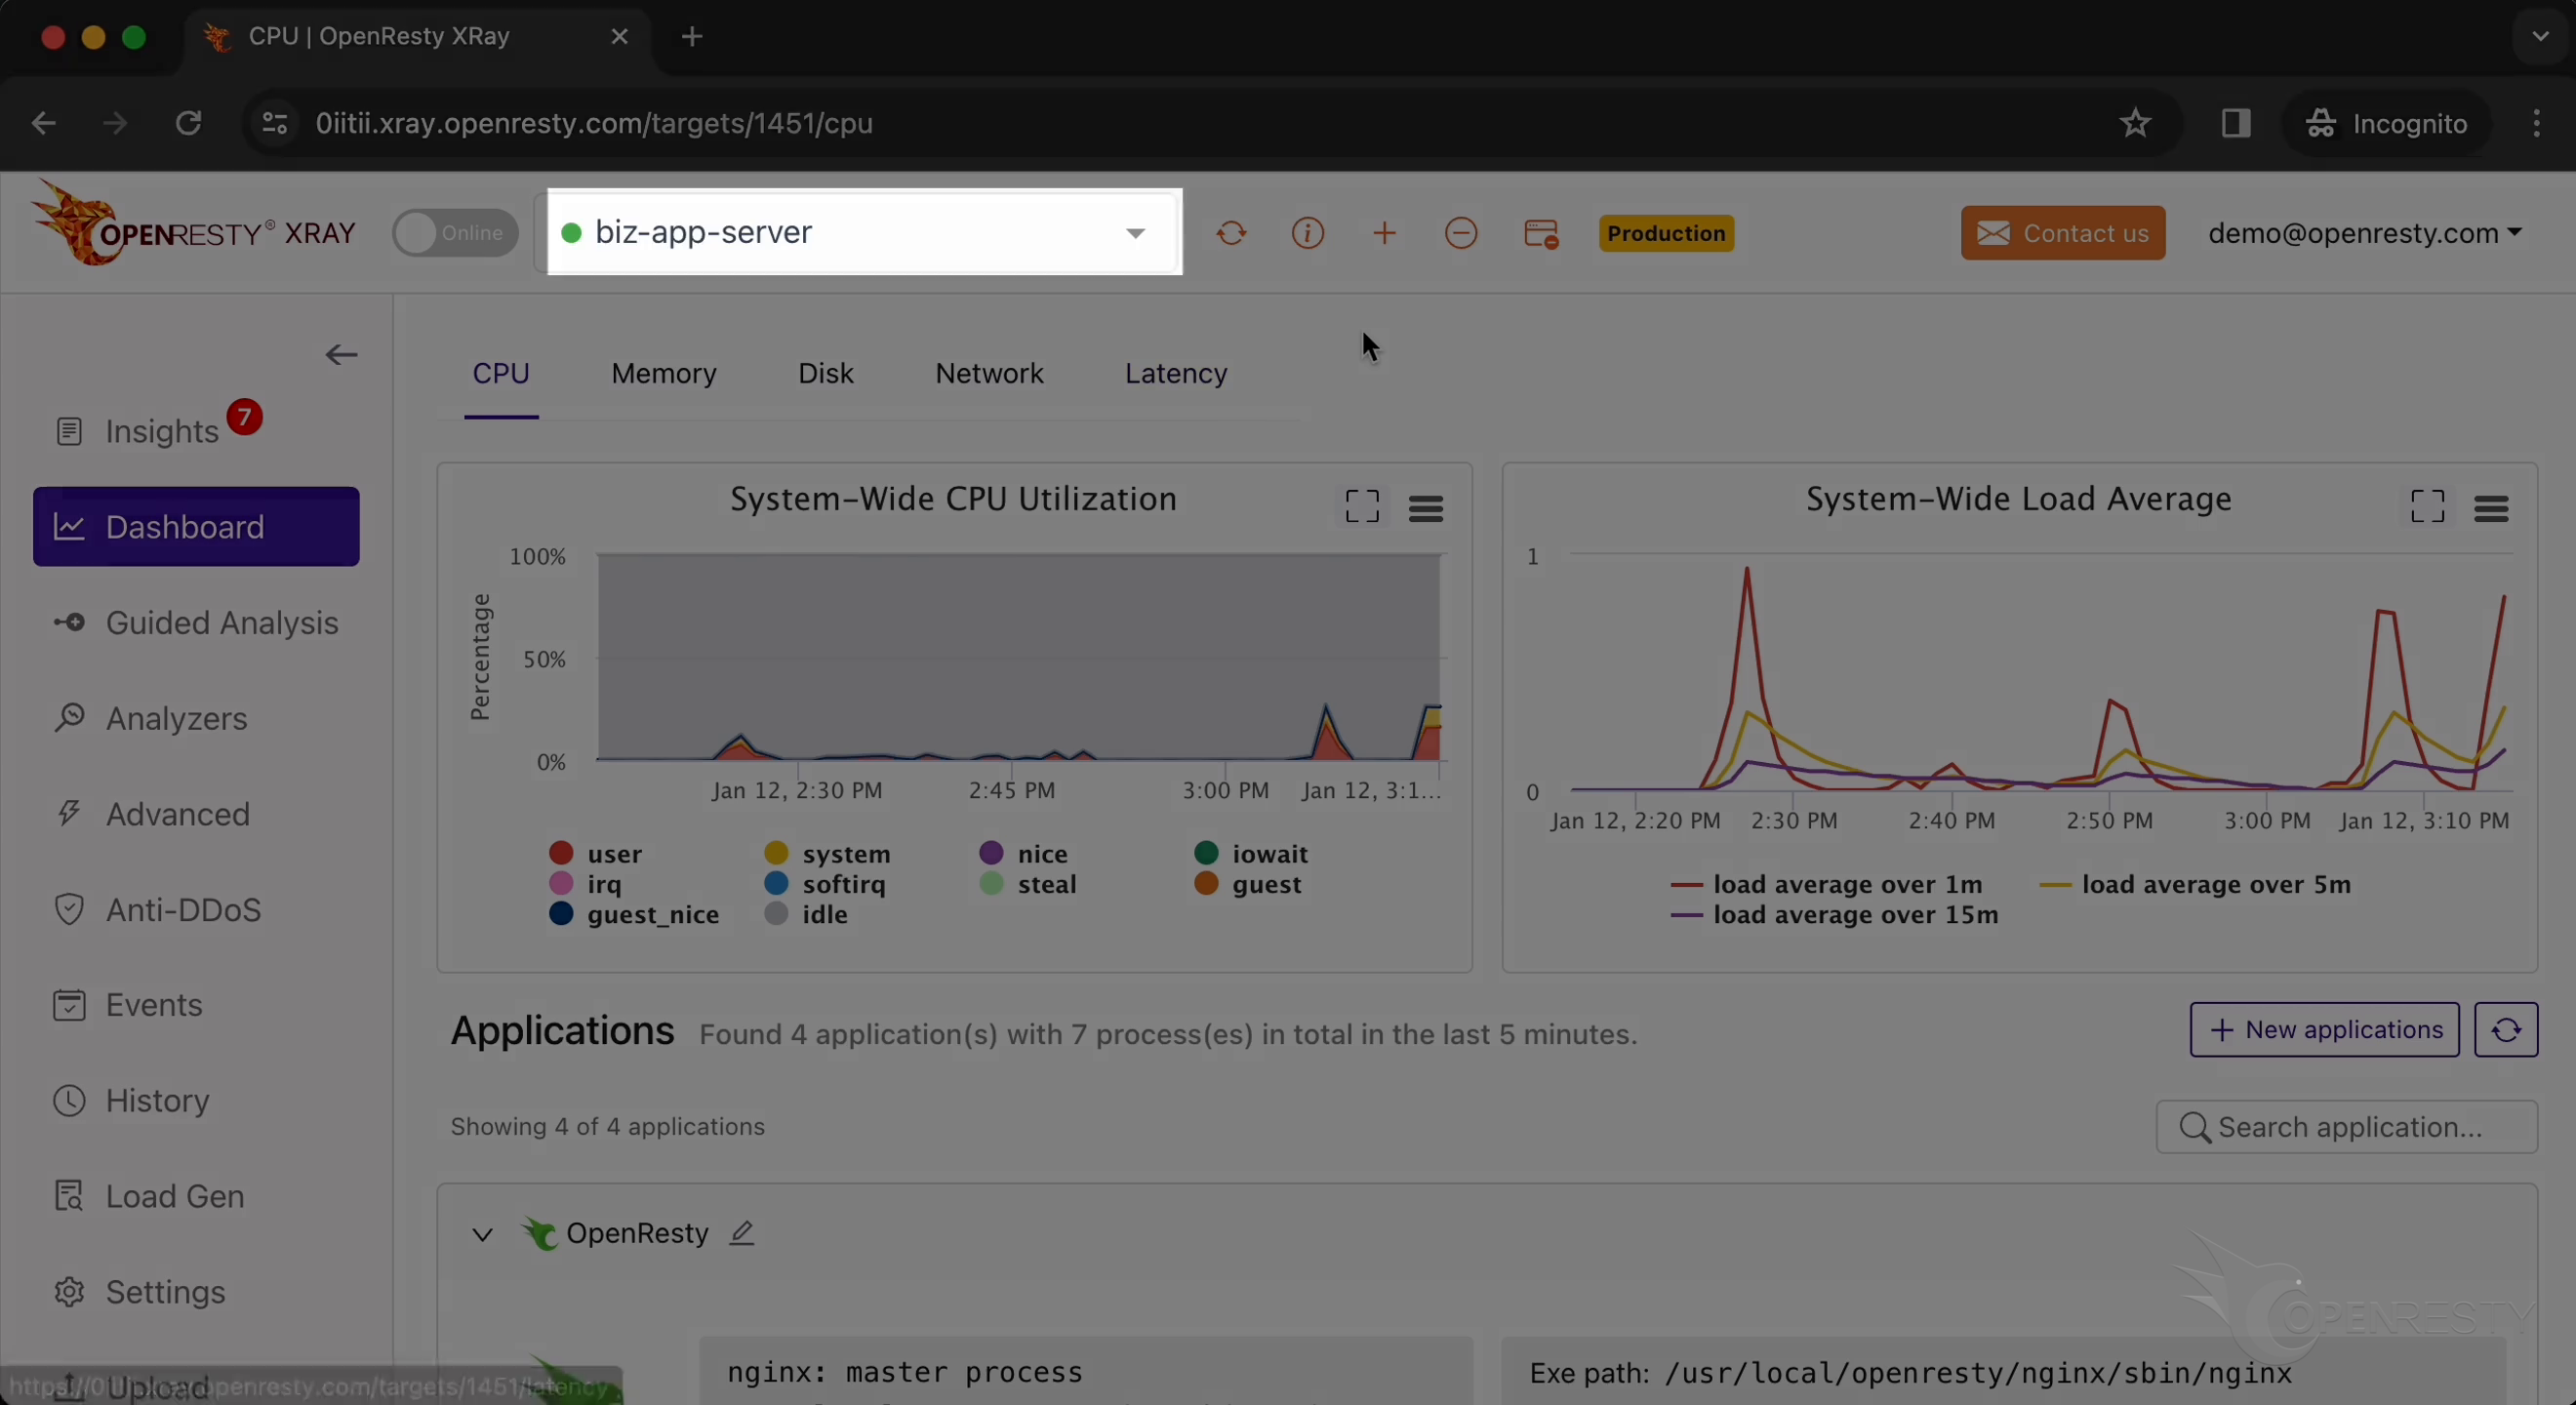
Make sure it is the right machine you are watching.
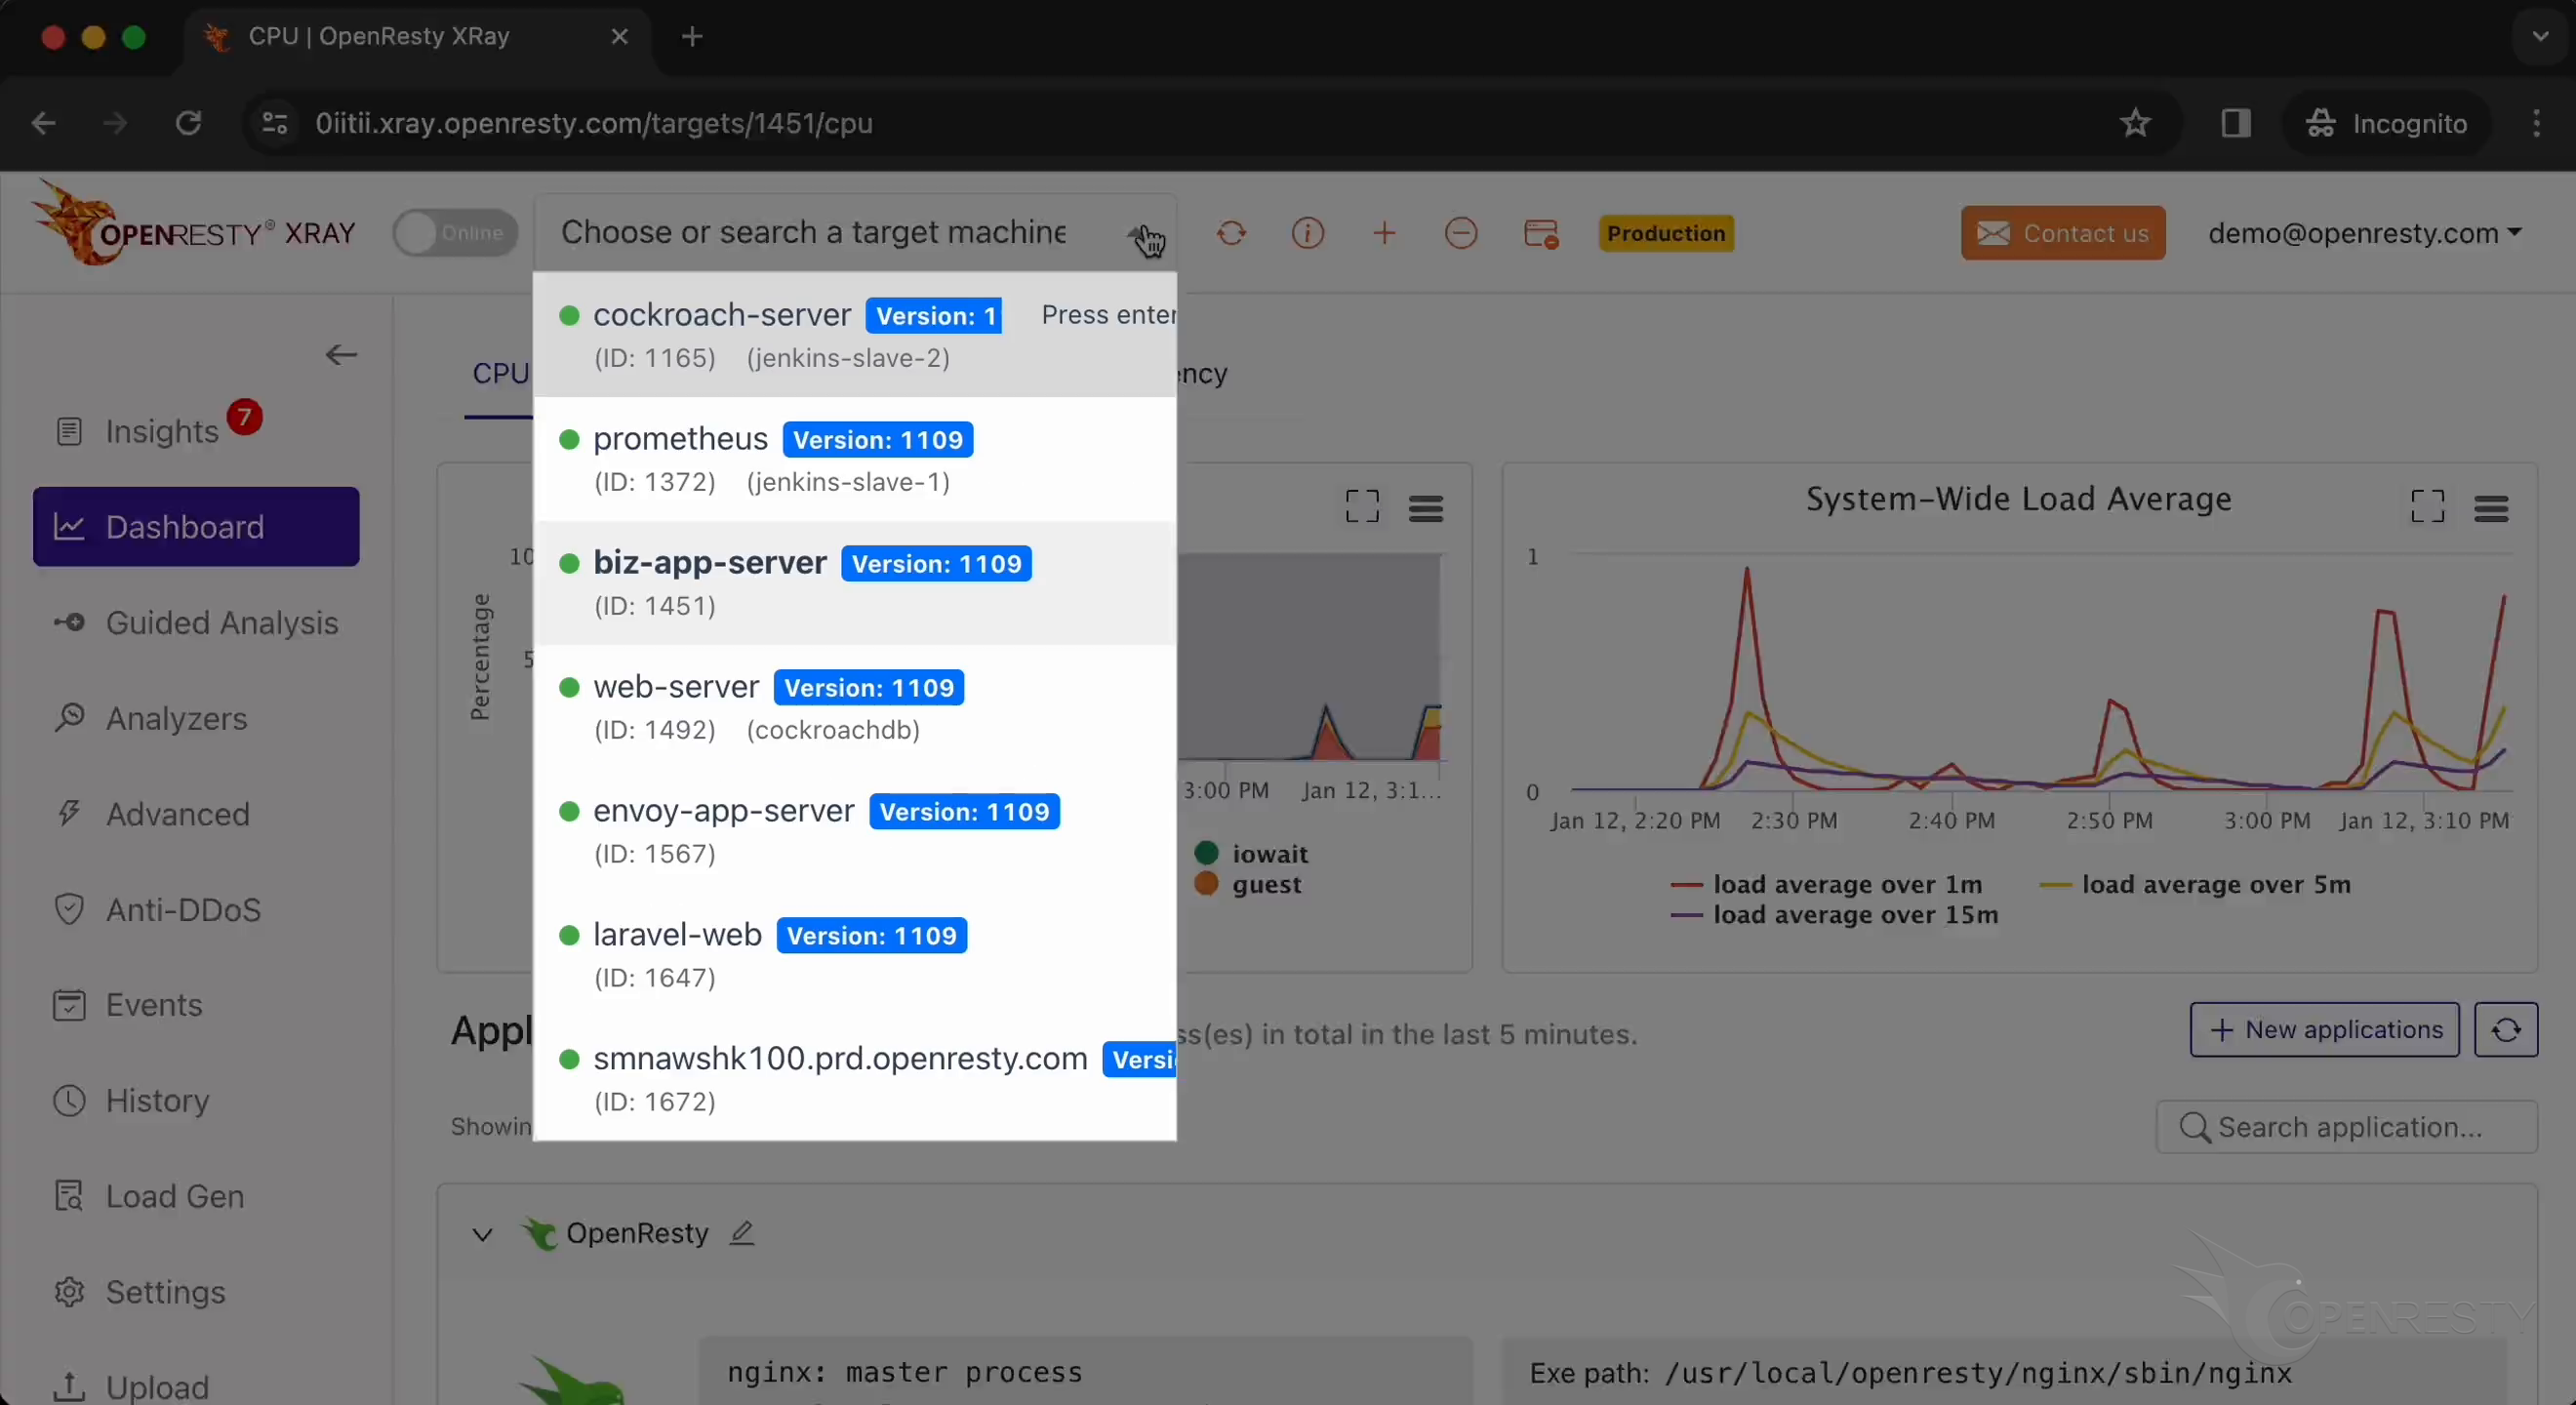
You can choose the right machine from the list below if the current one is not correct.
Go to the “Guided Analysis” page.
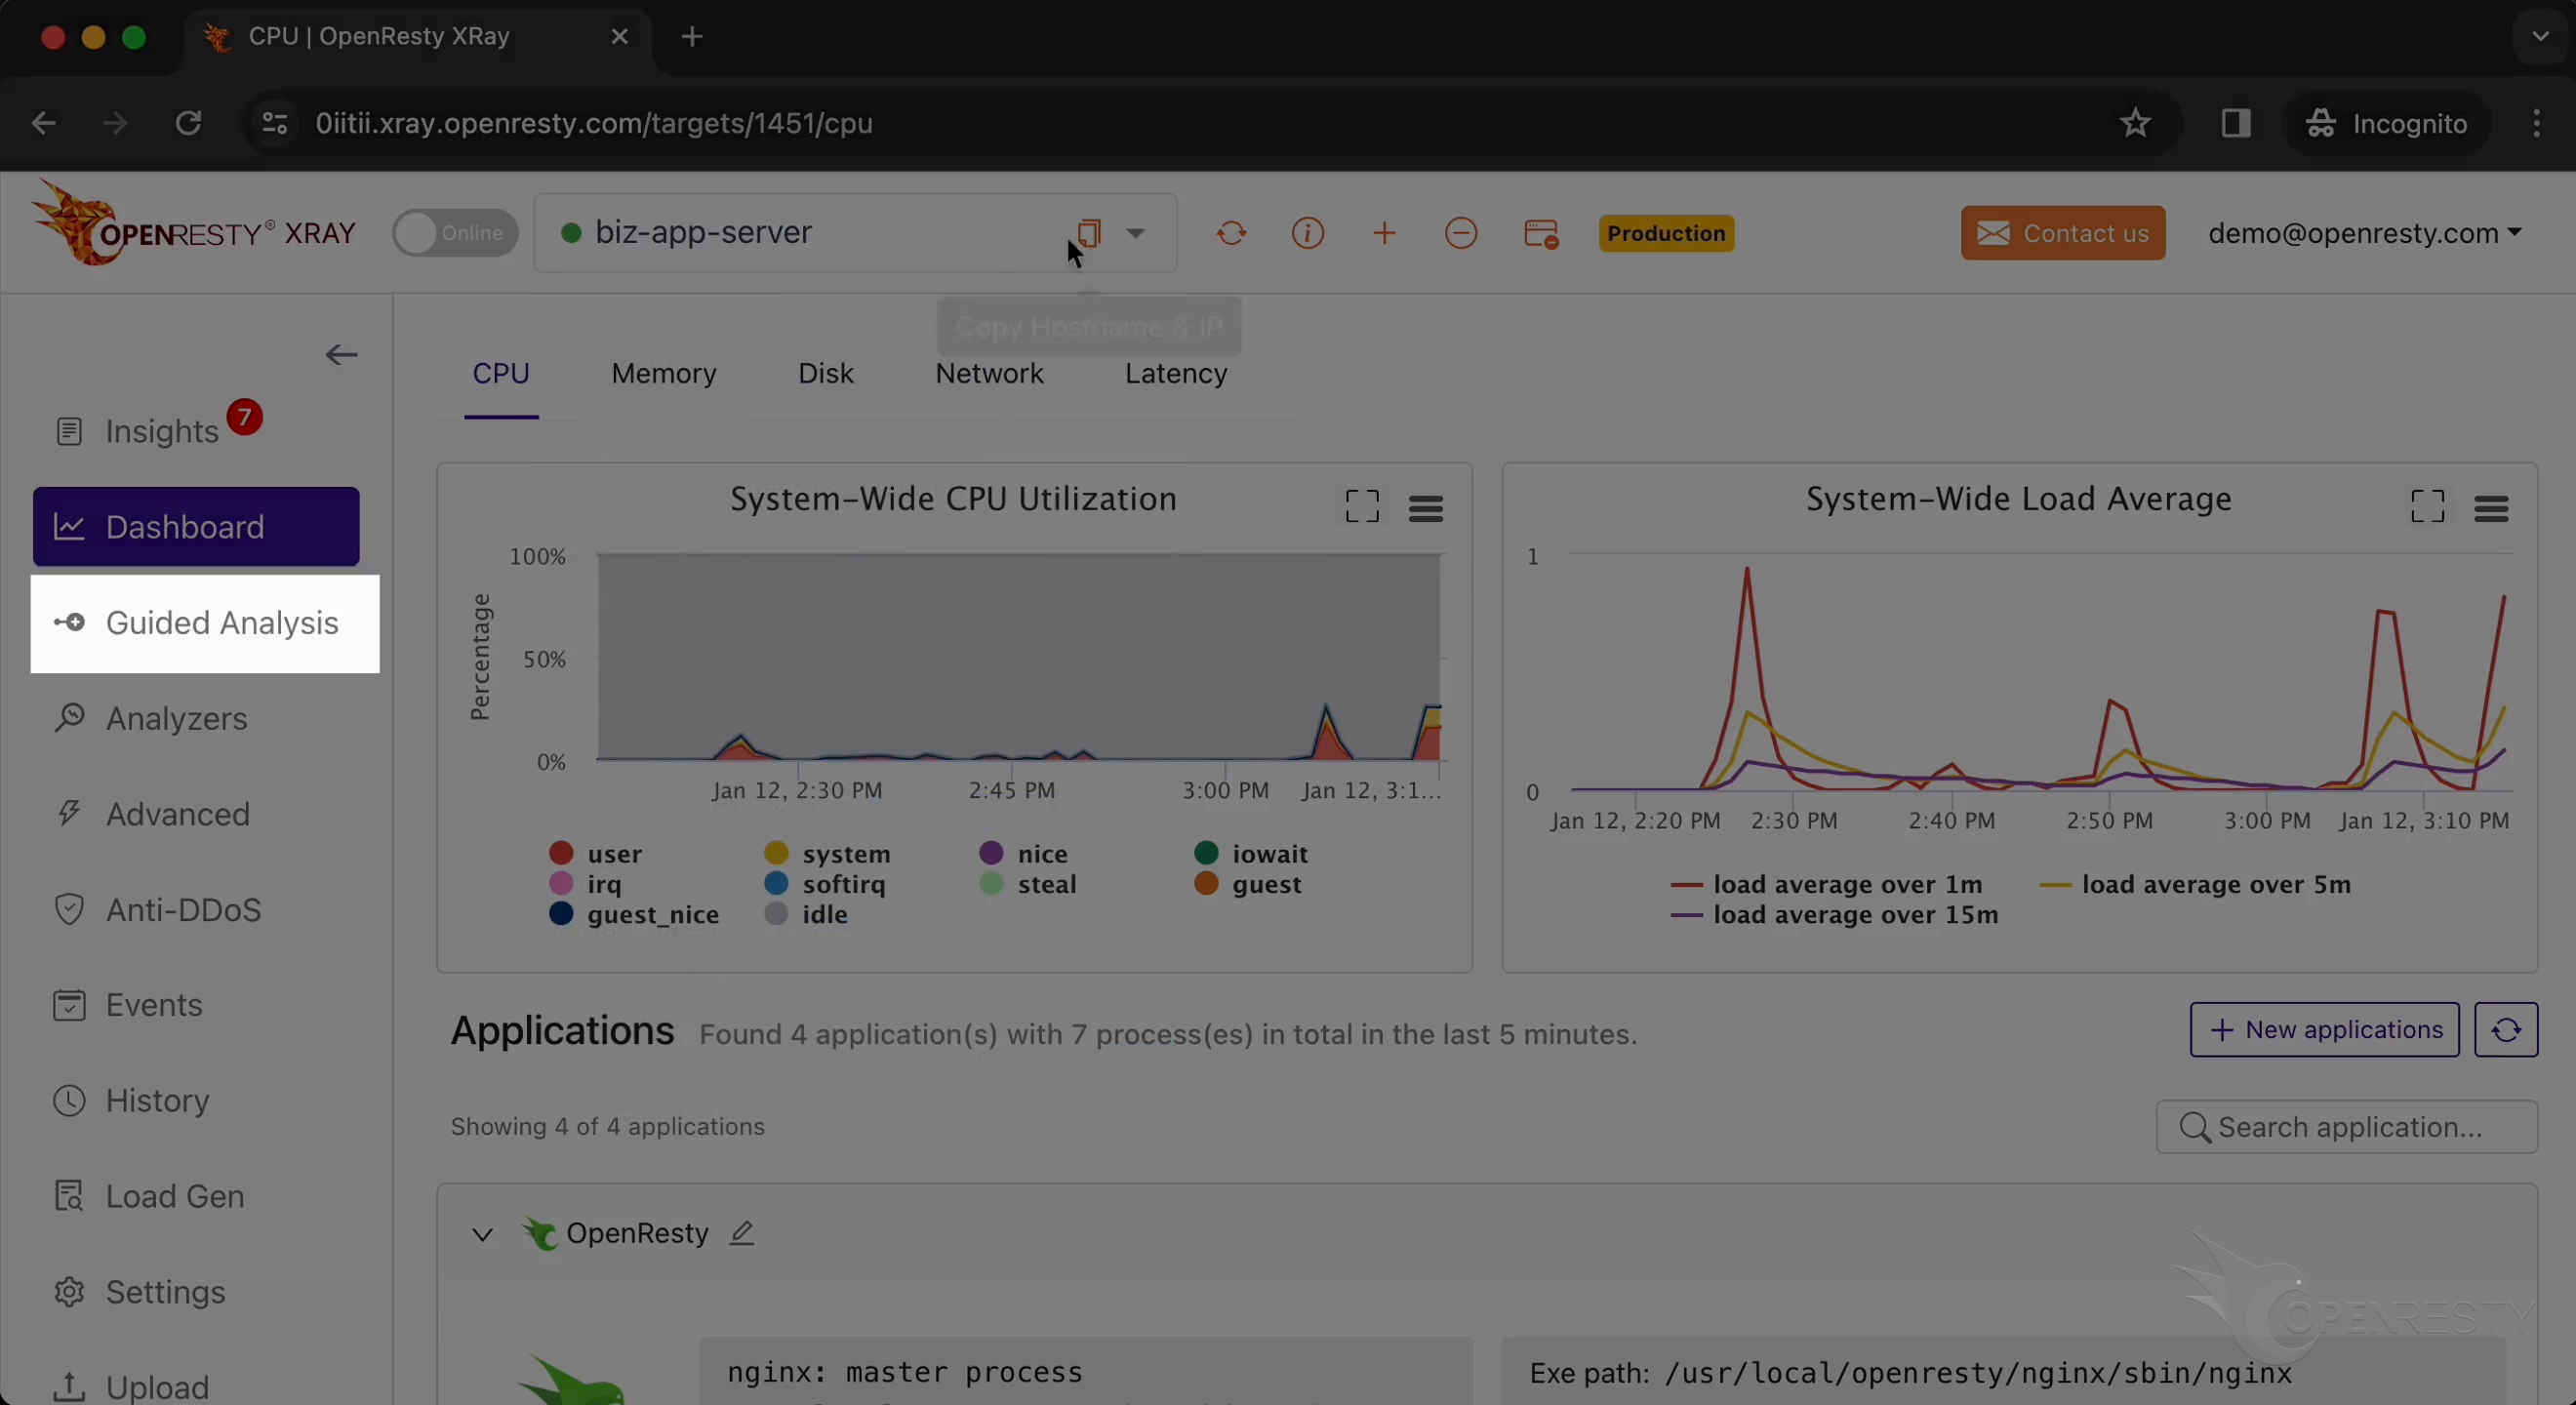
Here you can see different types of problems that you can diagnose.
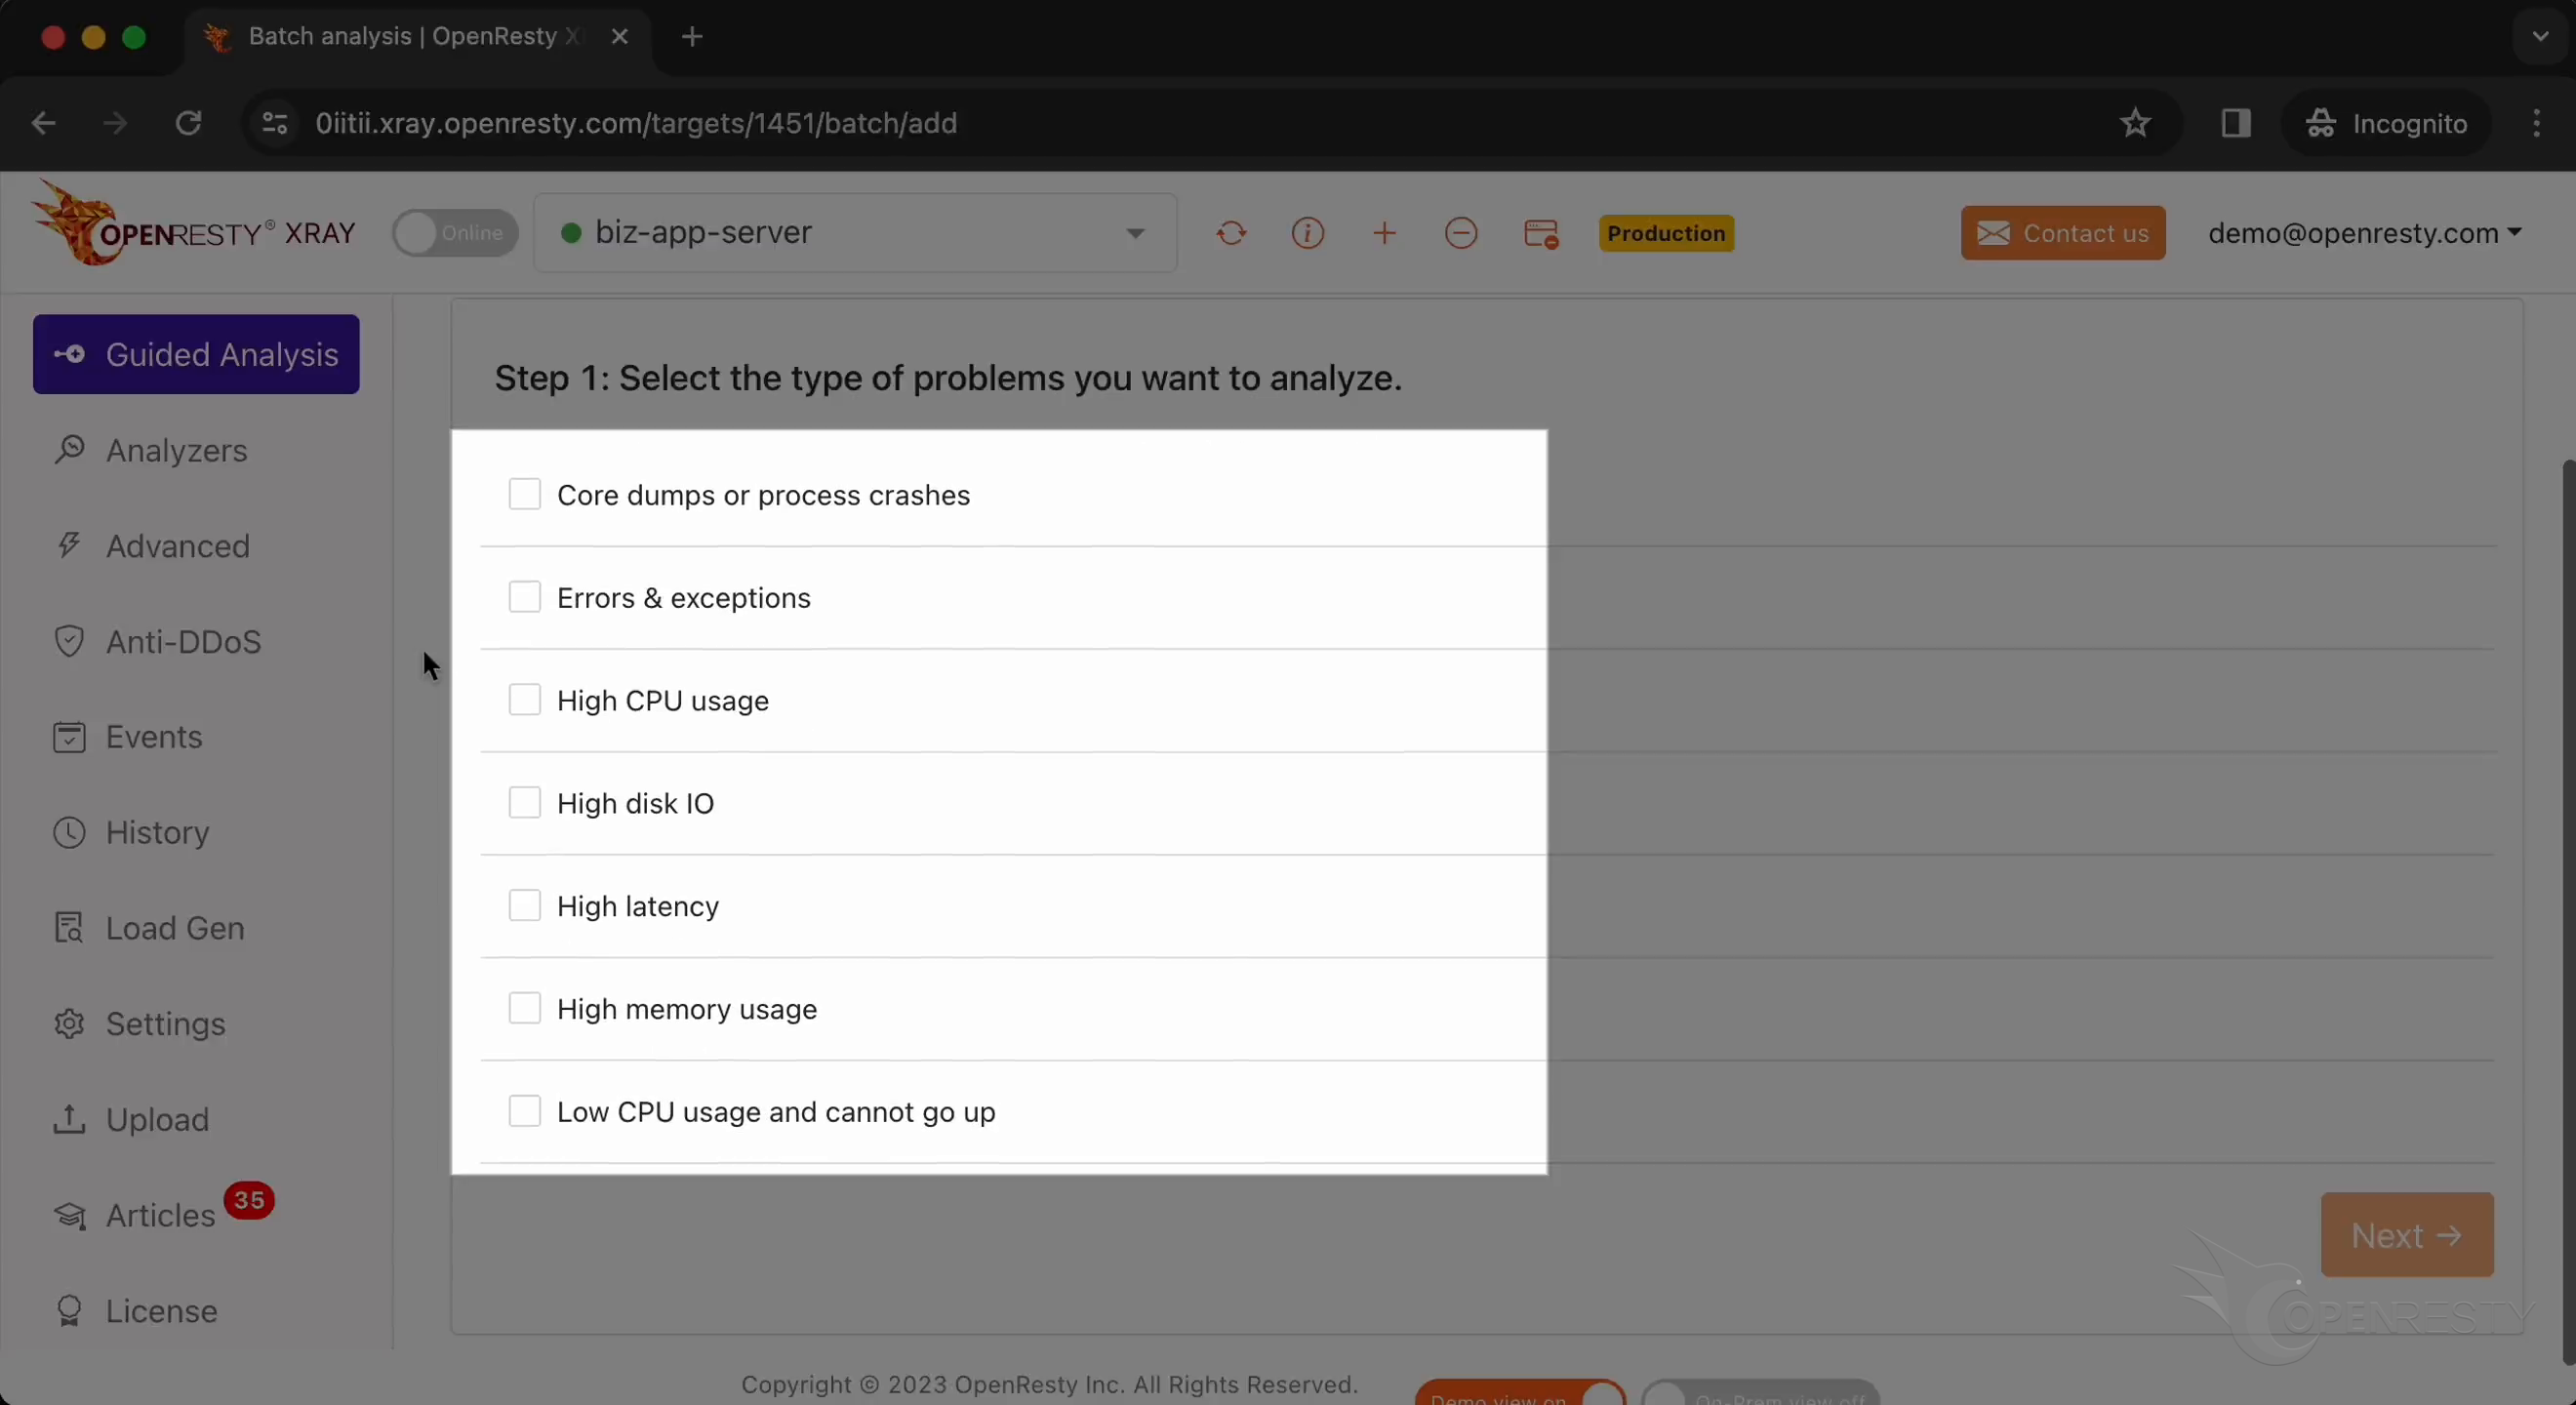
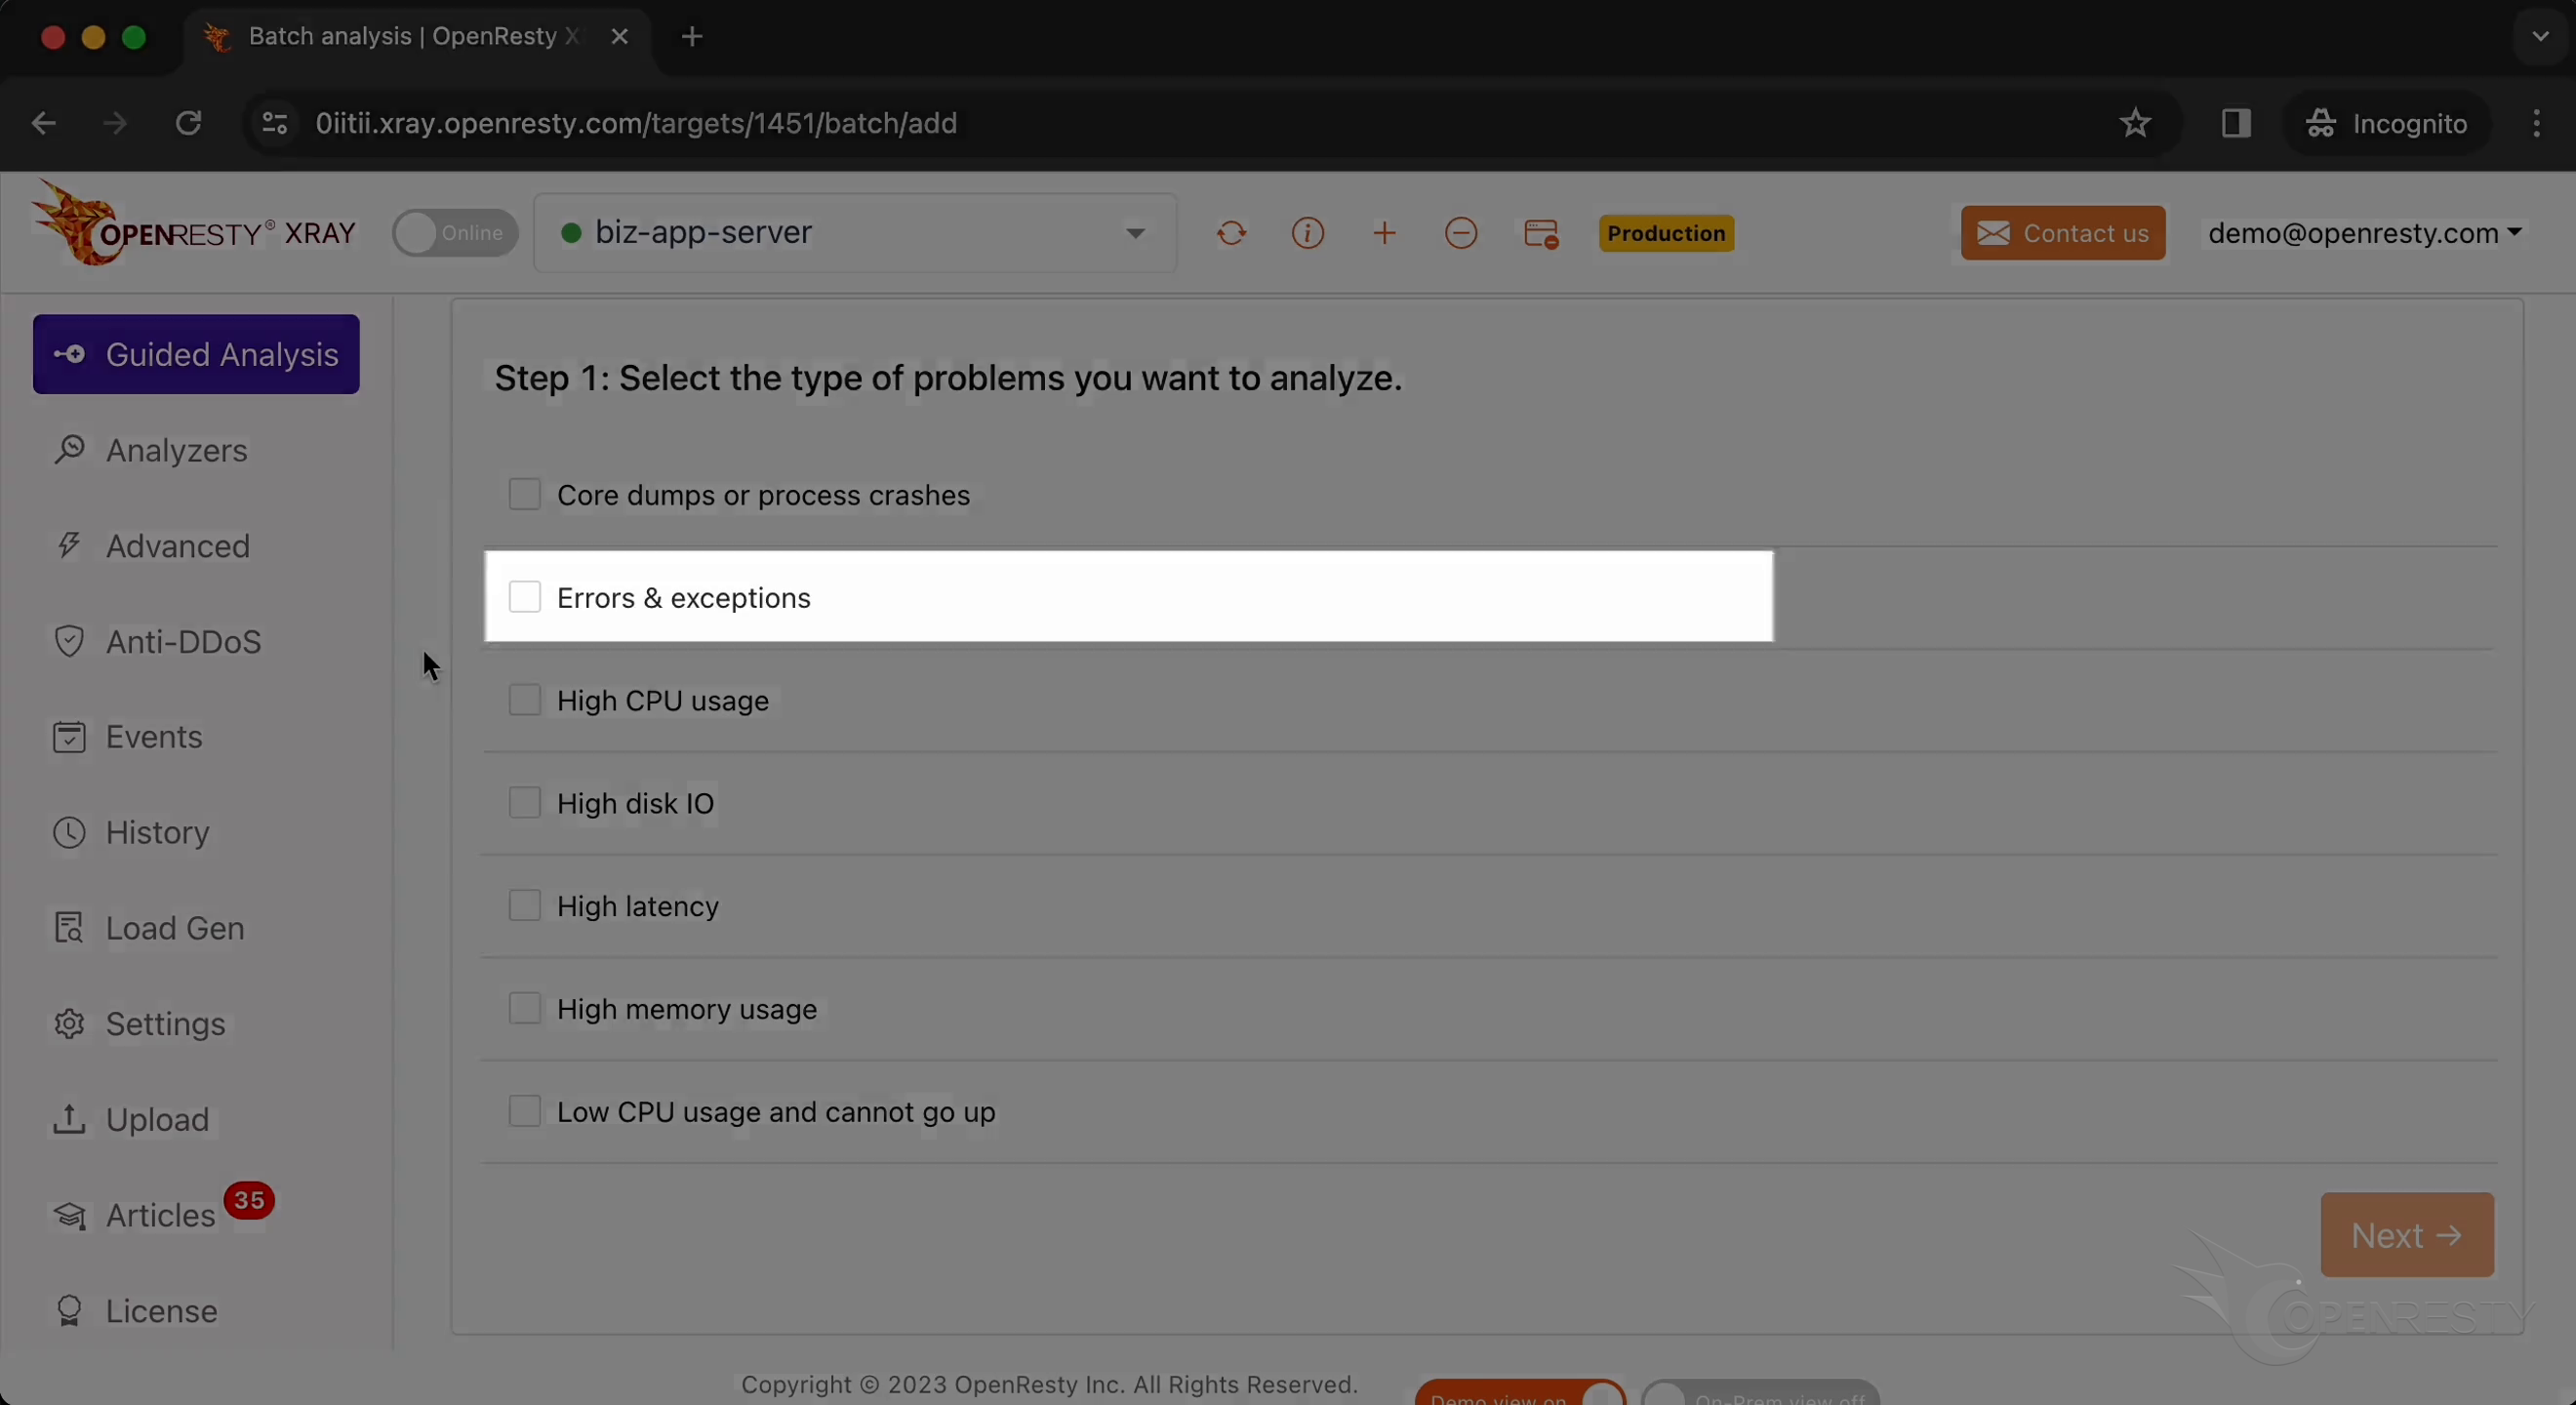
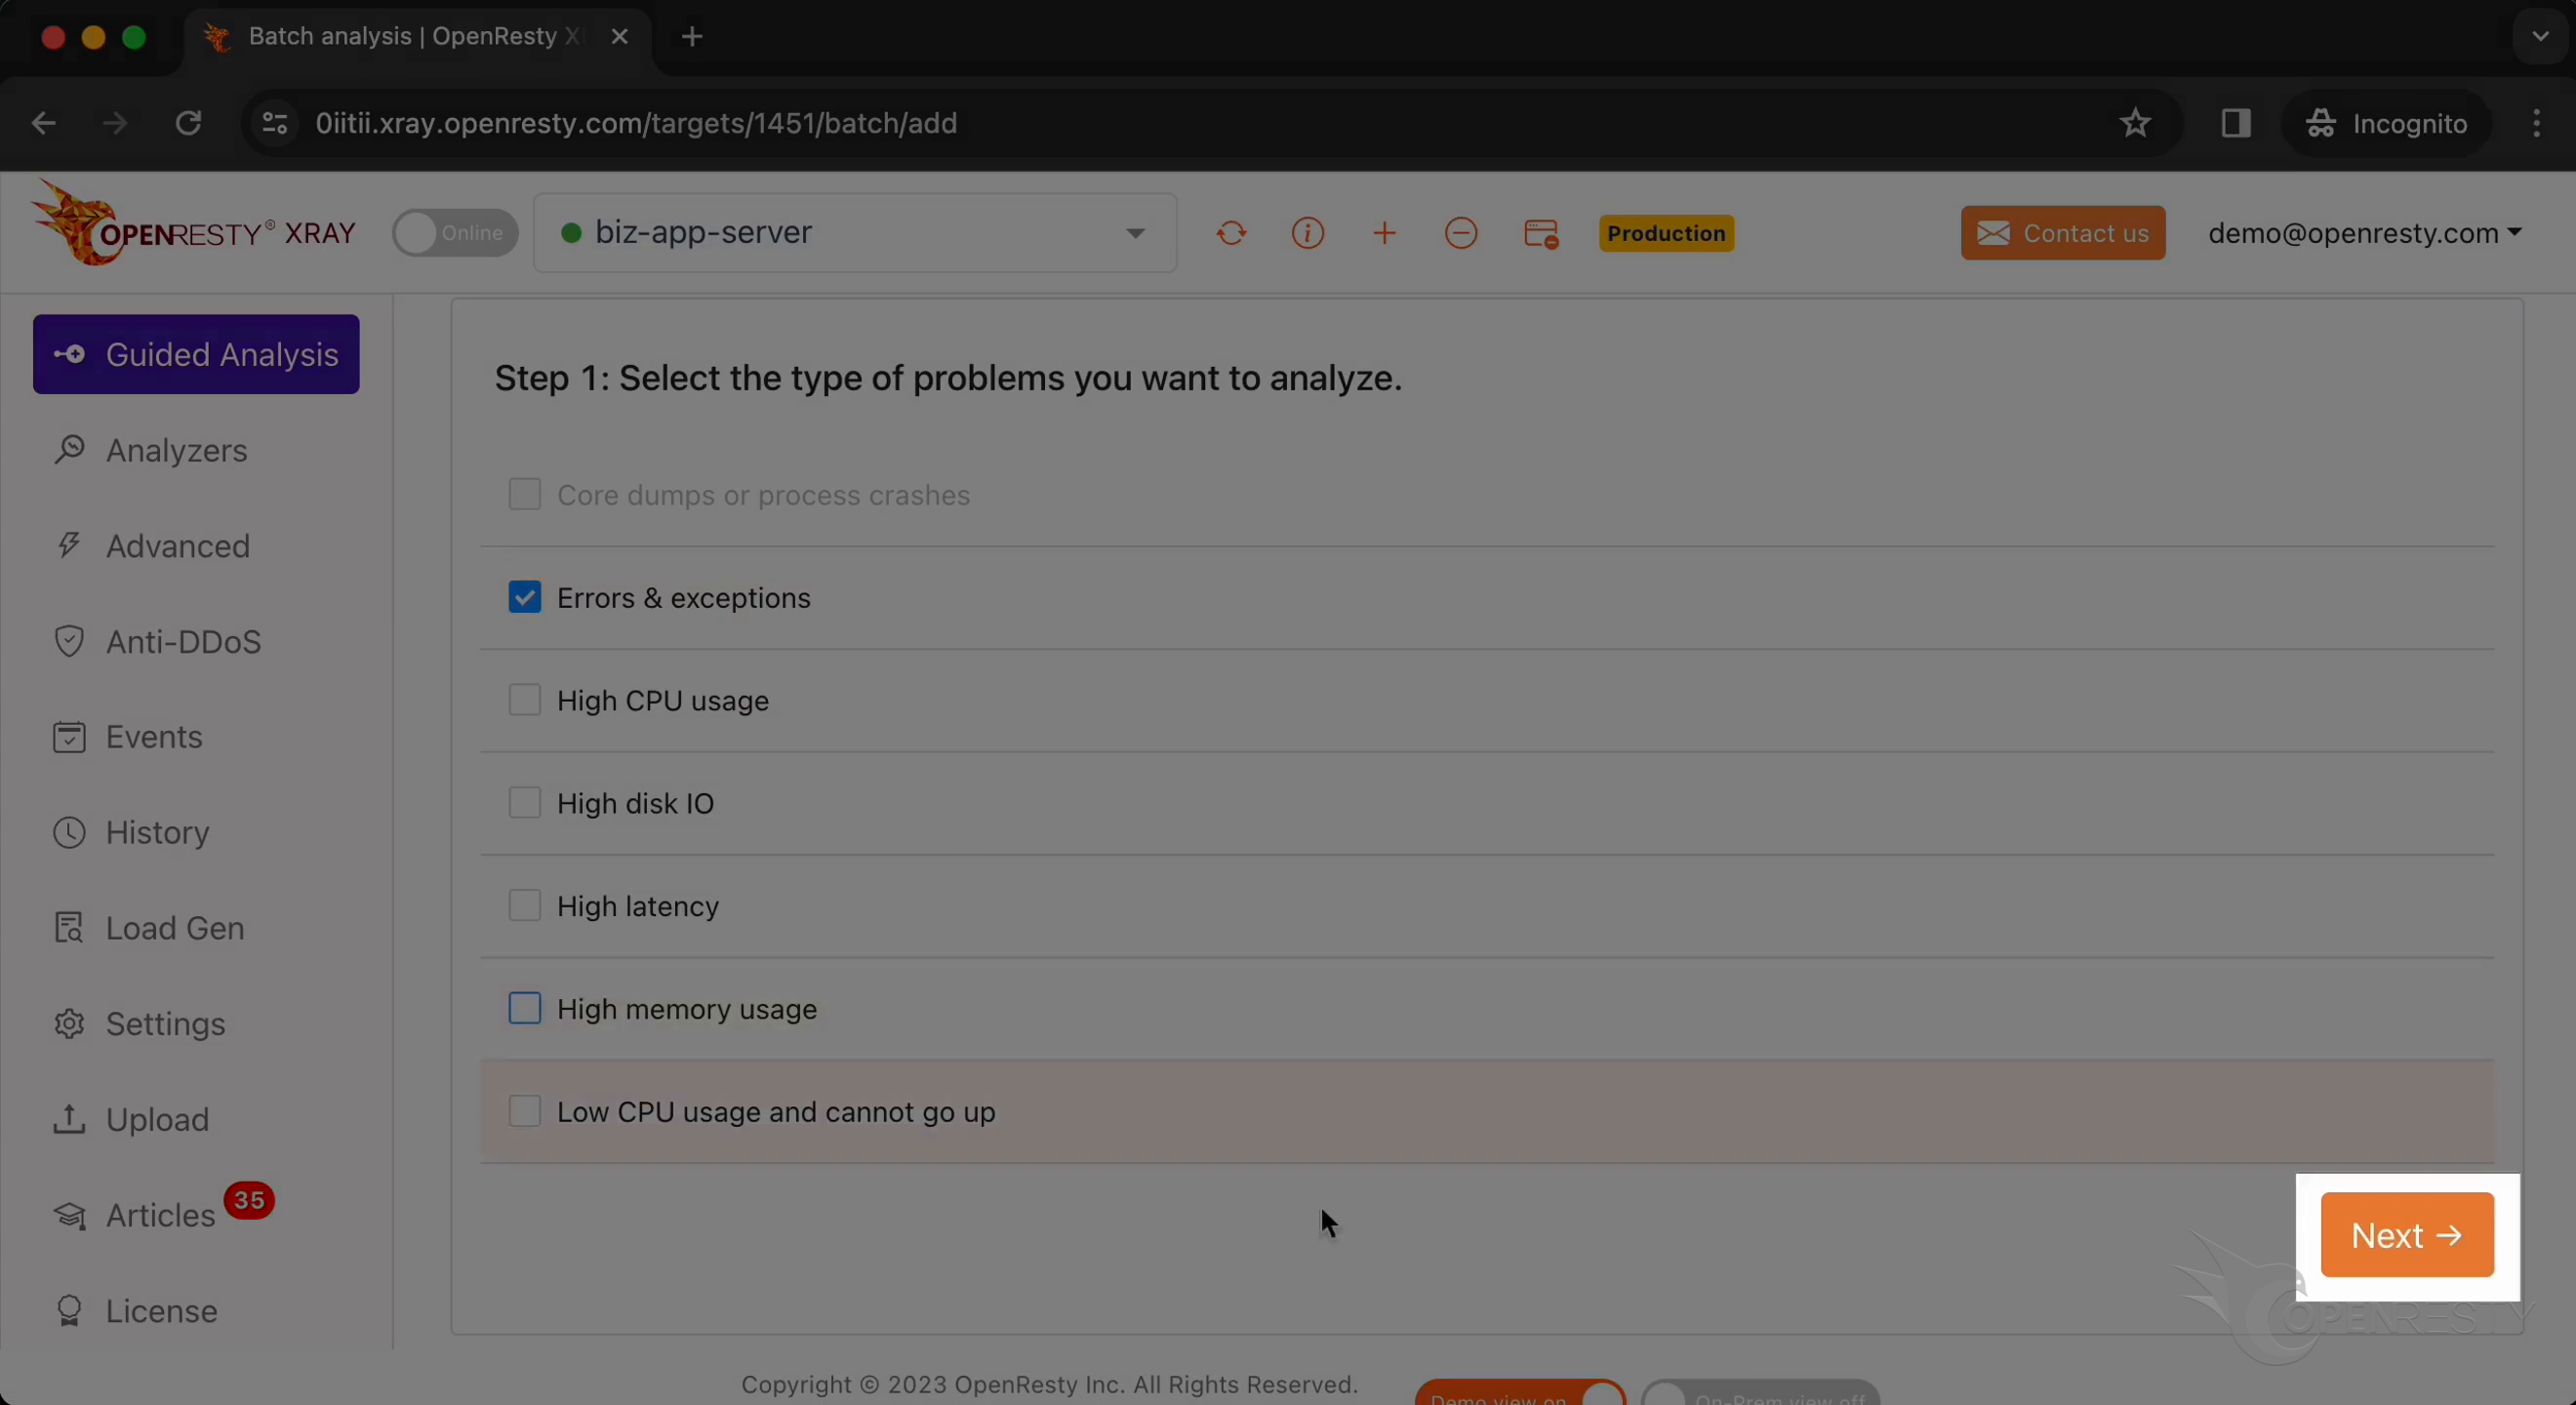
Let’s select “Errors & exceptions”.
Click on “Next”.
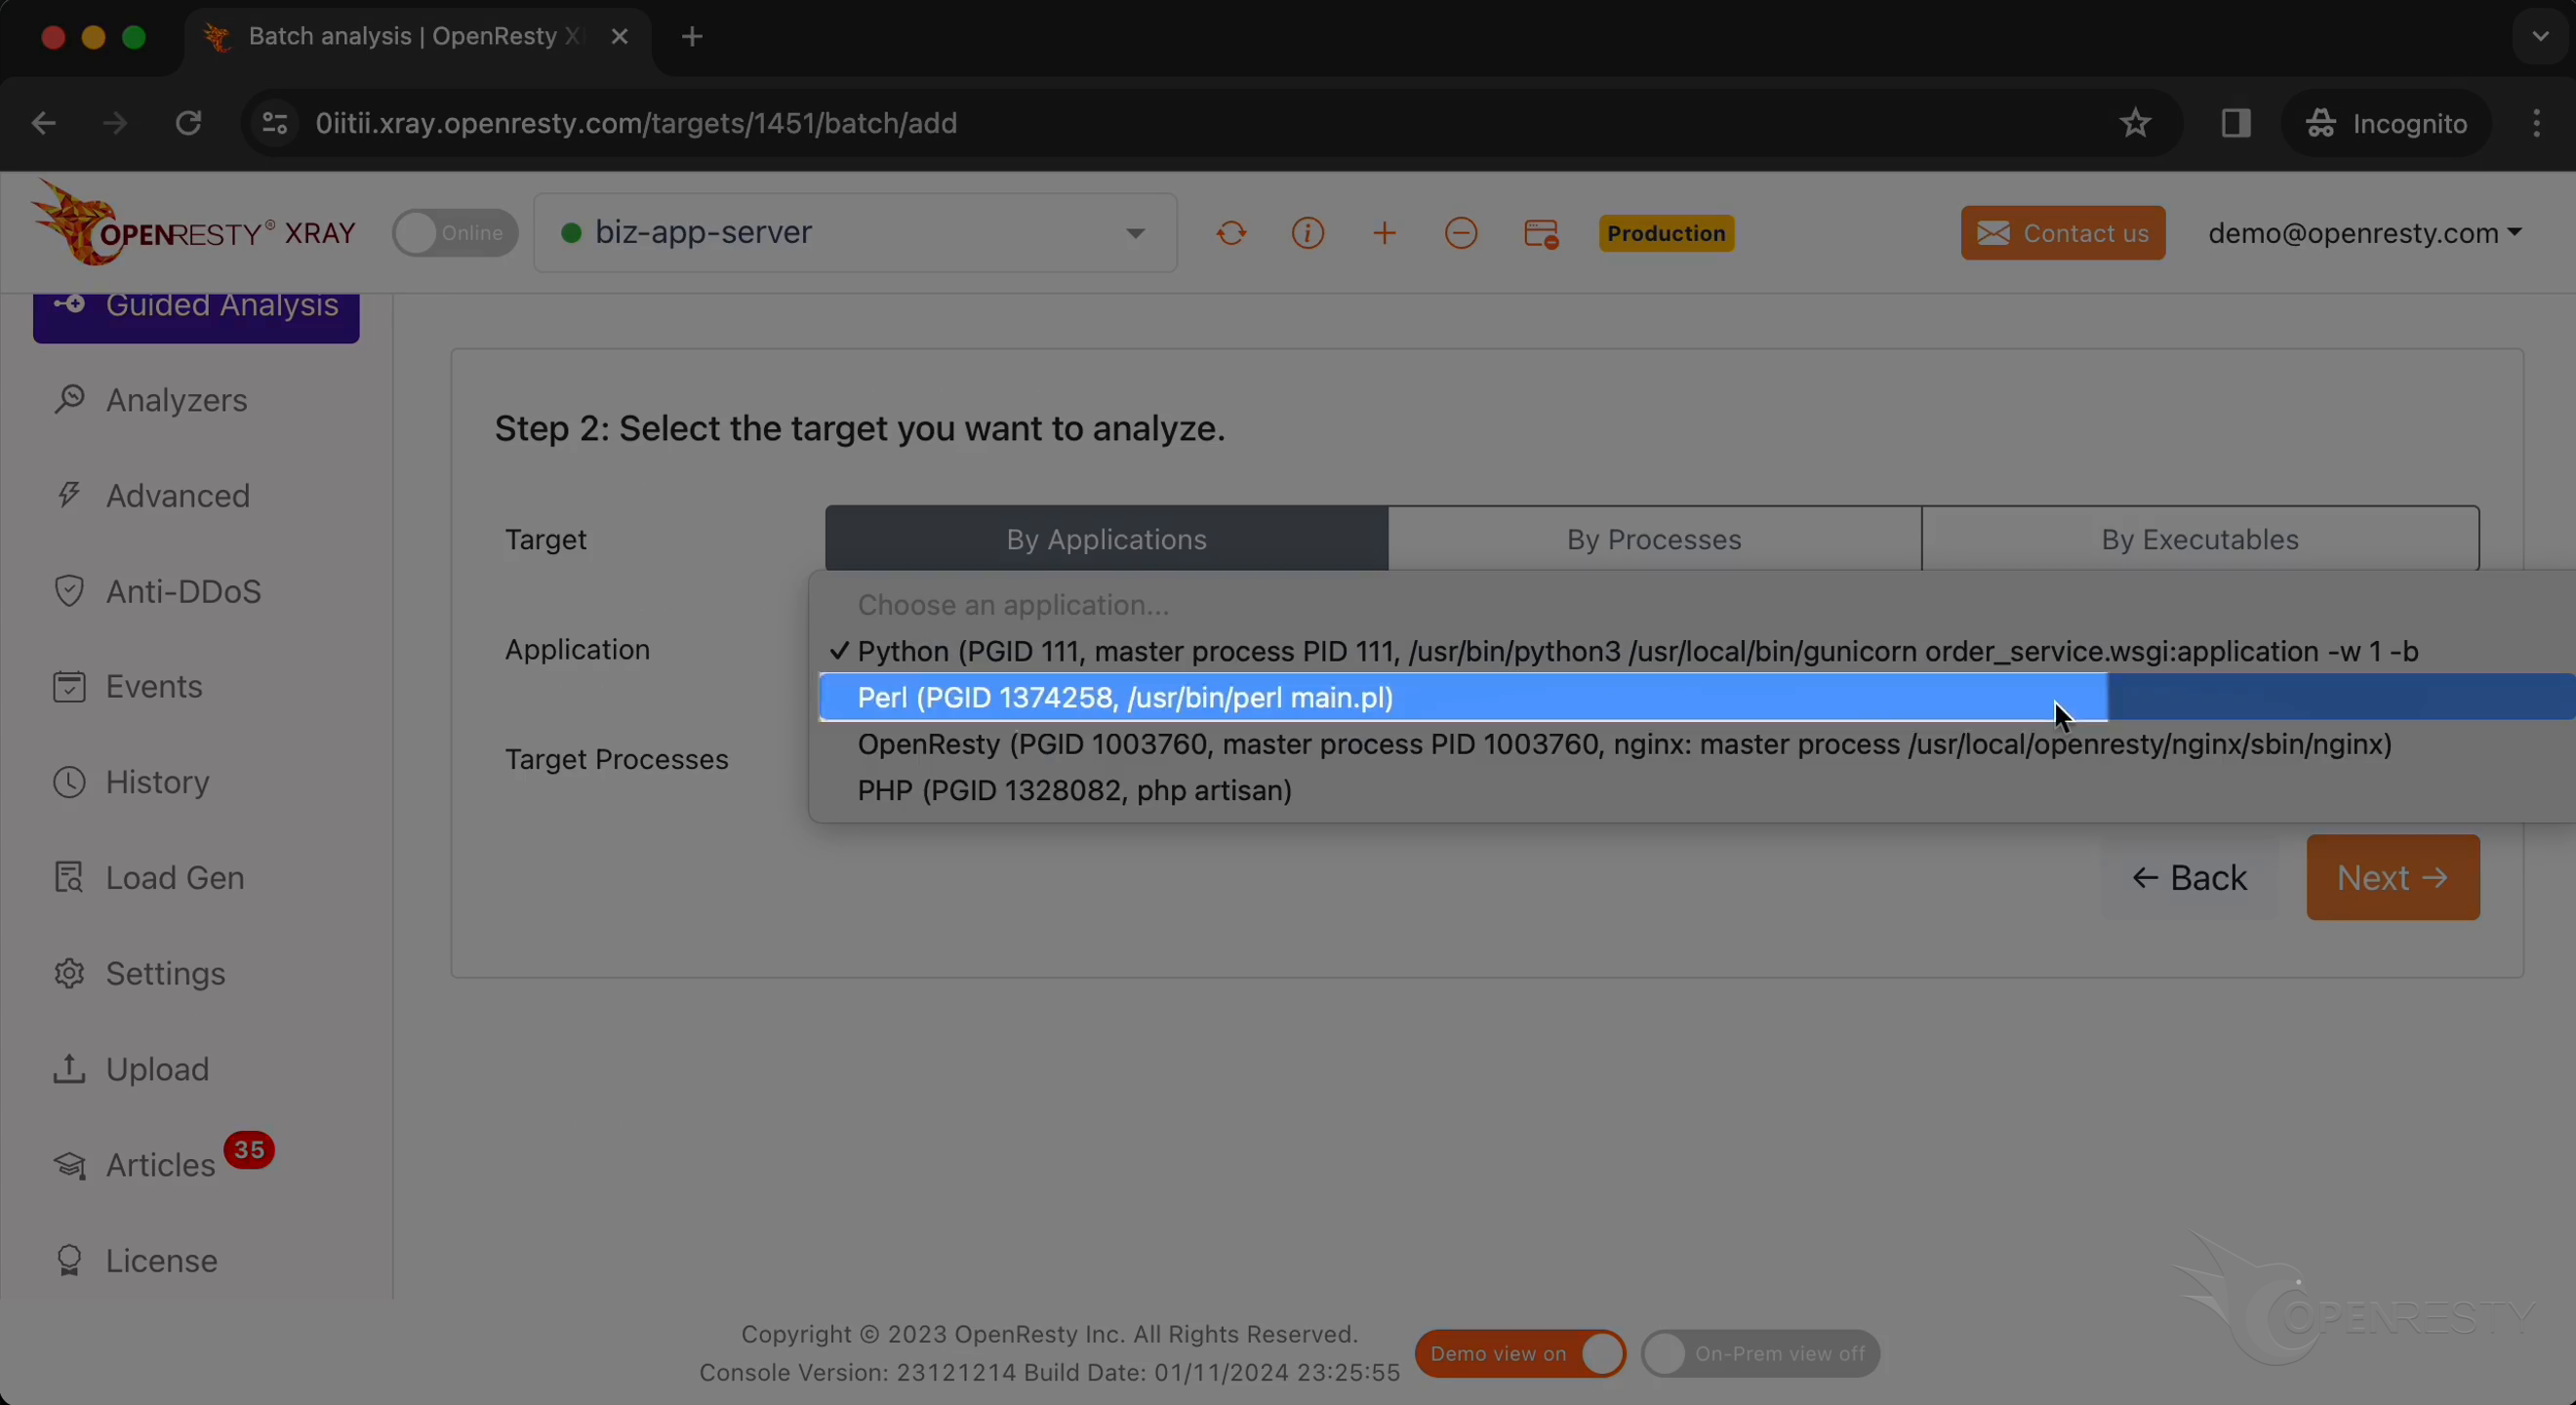
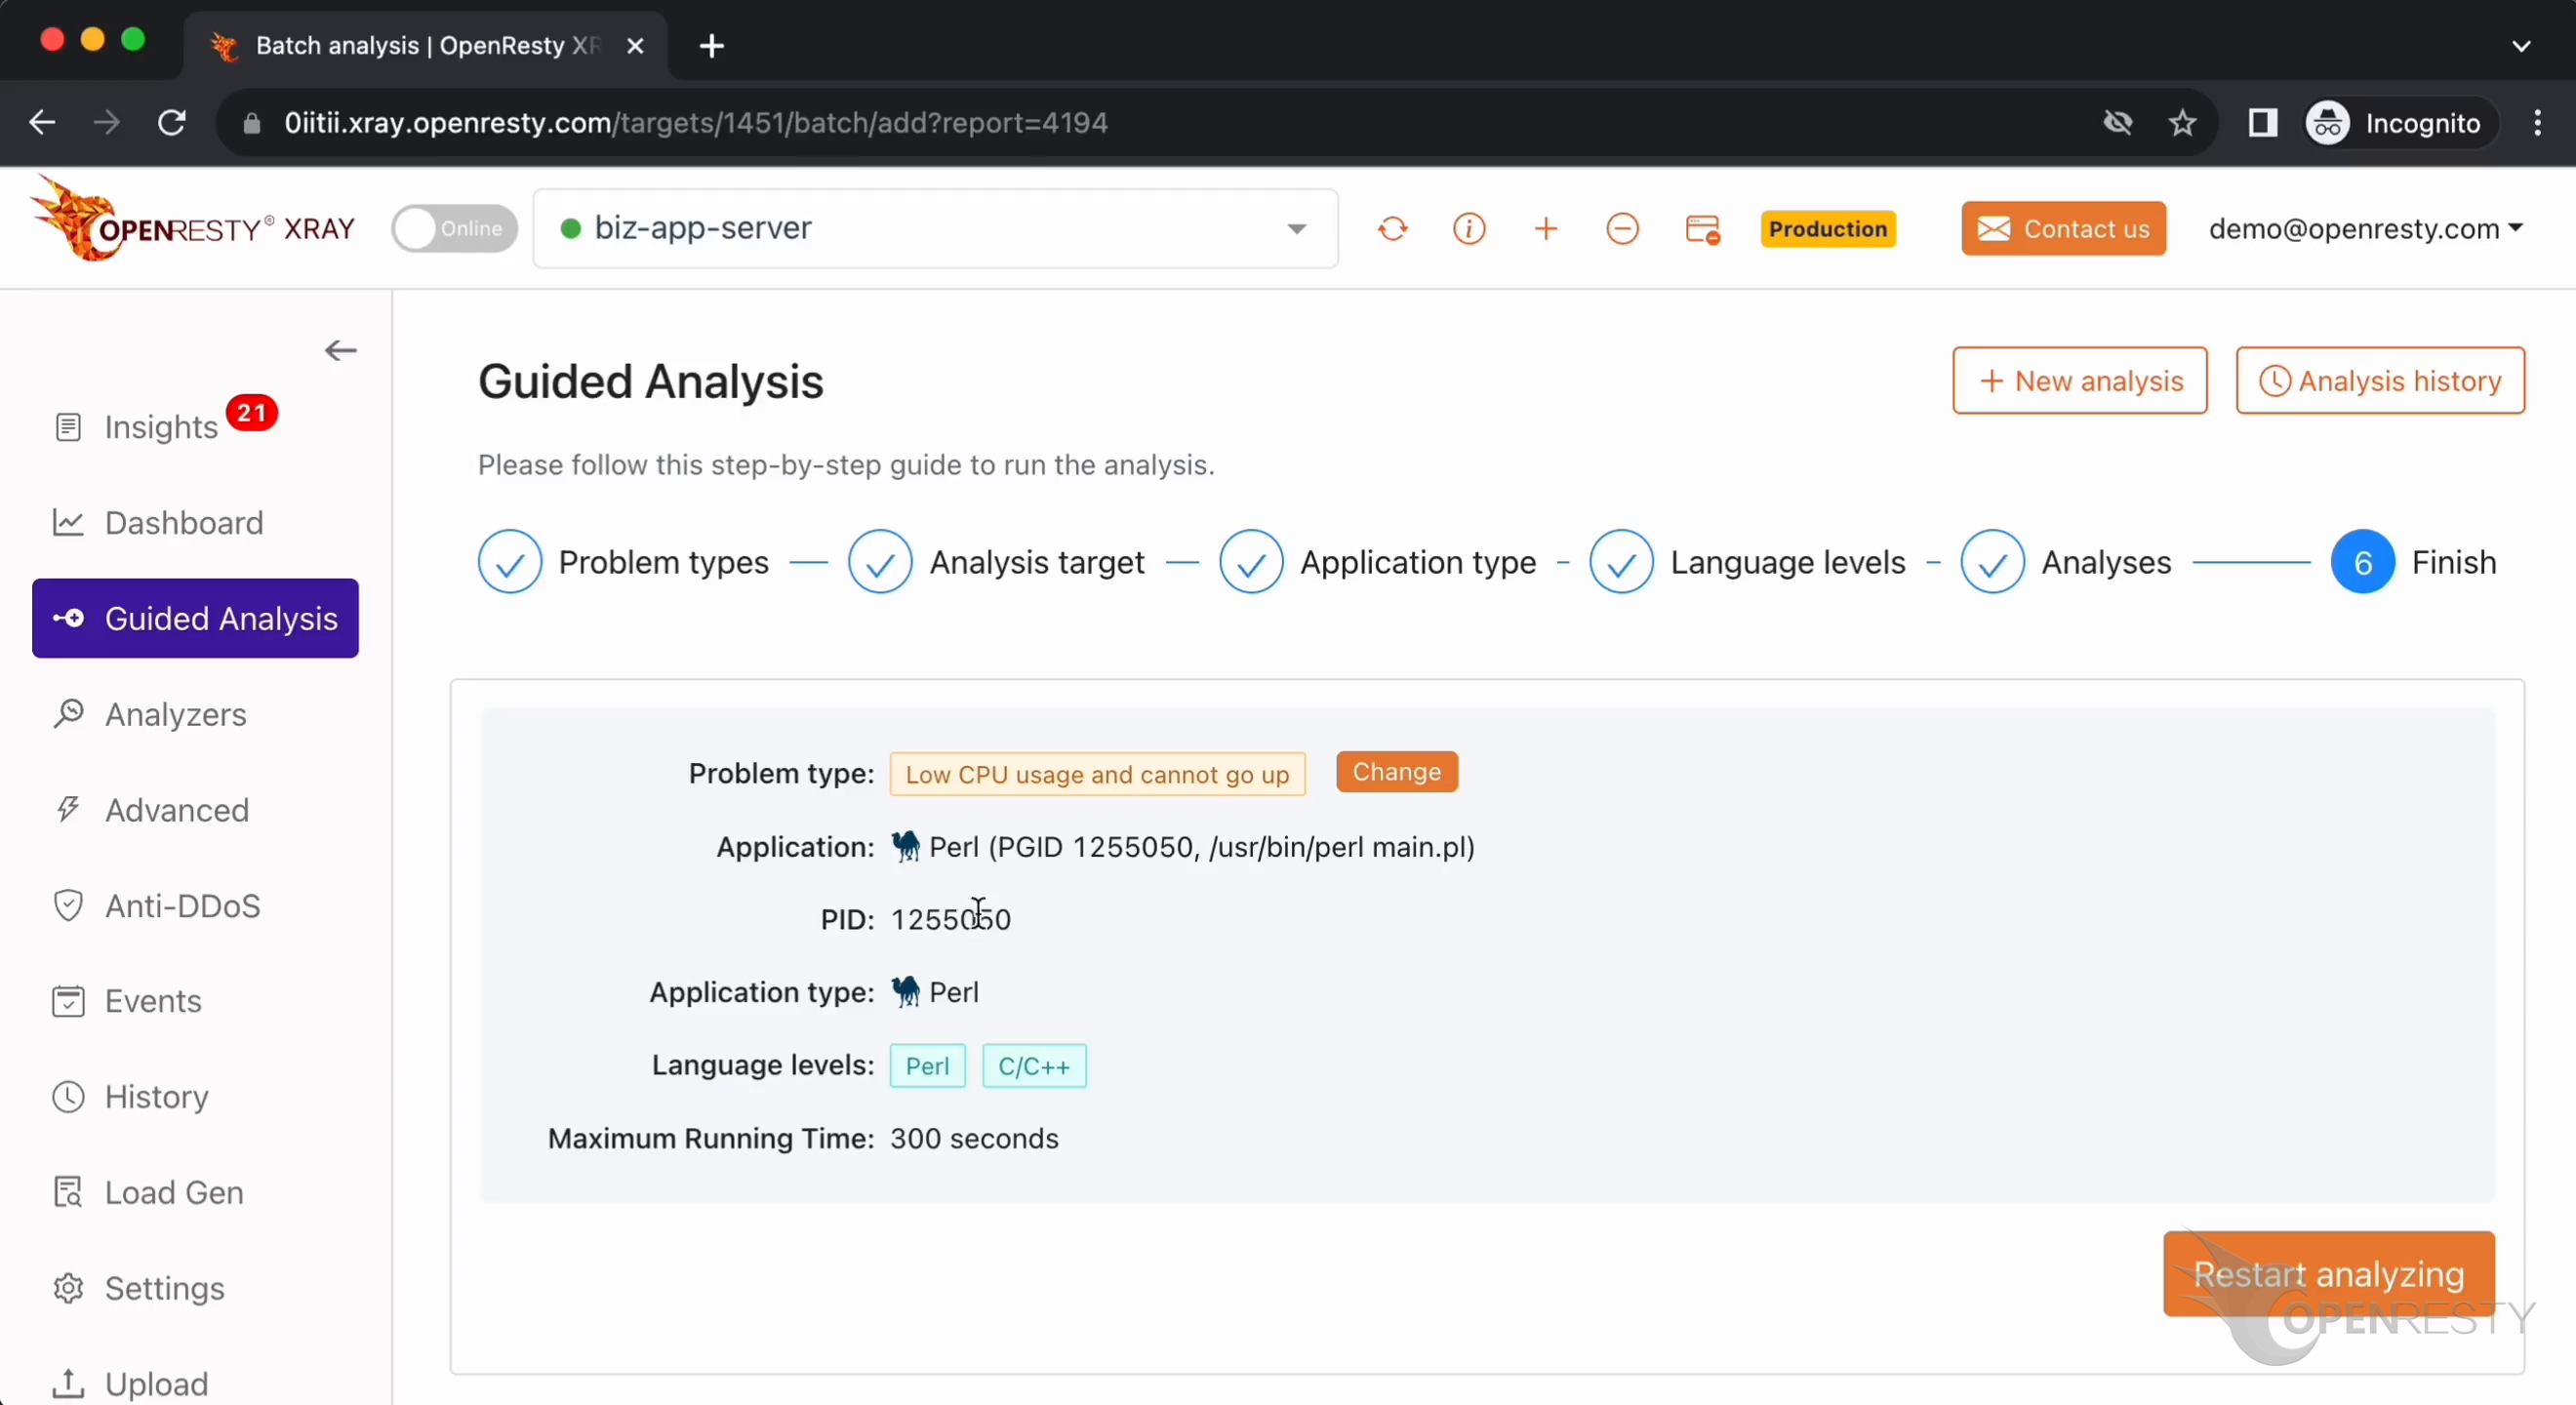
Select the Perl application.
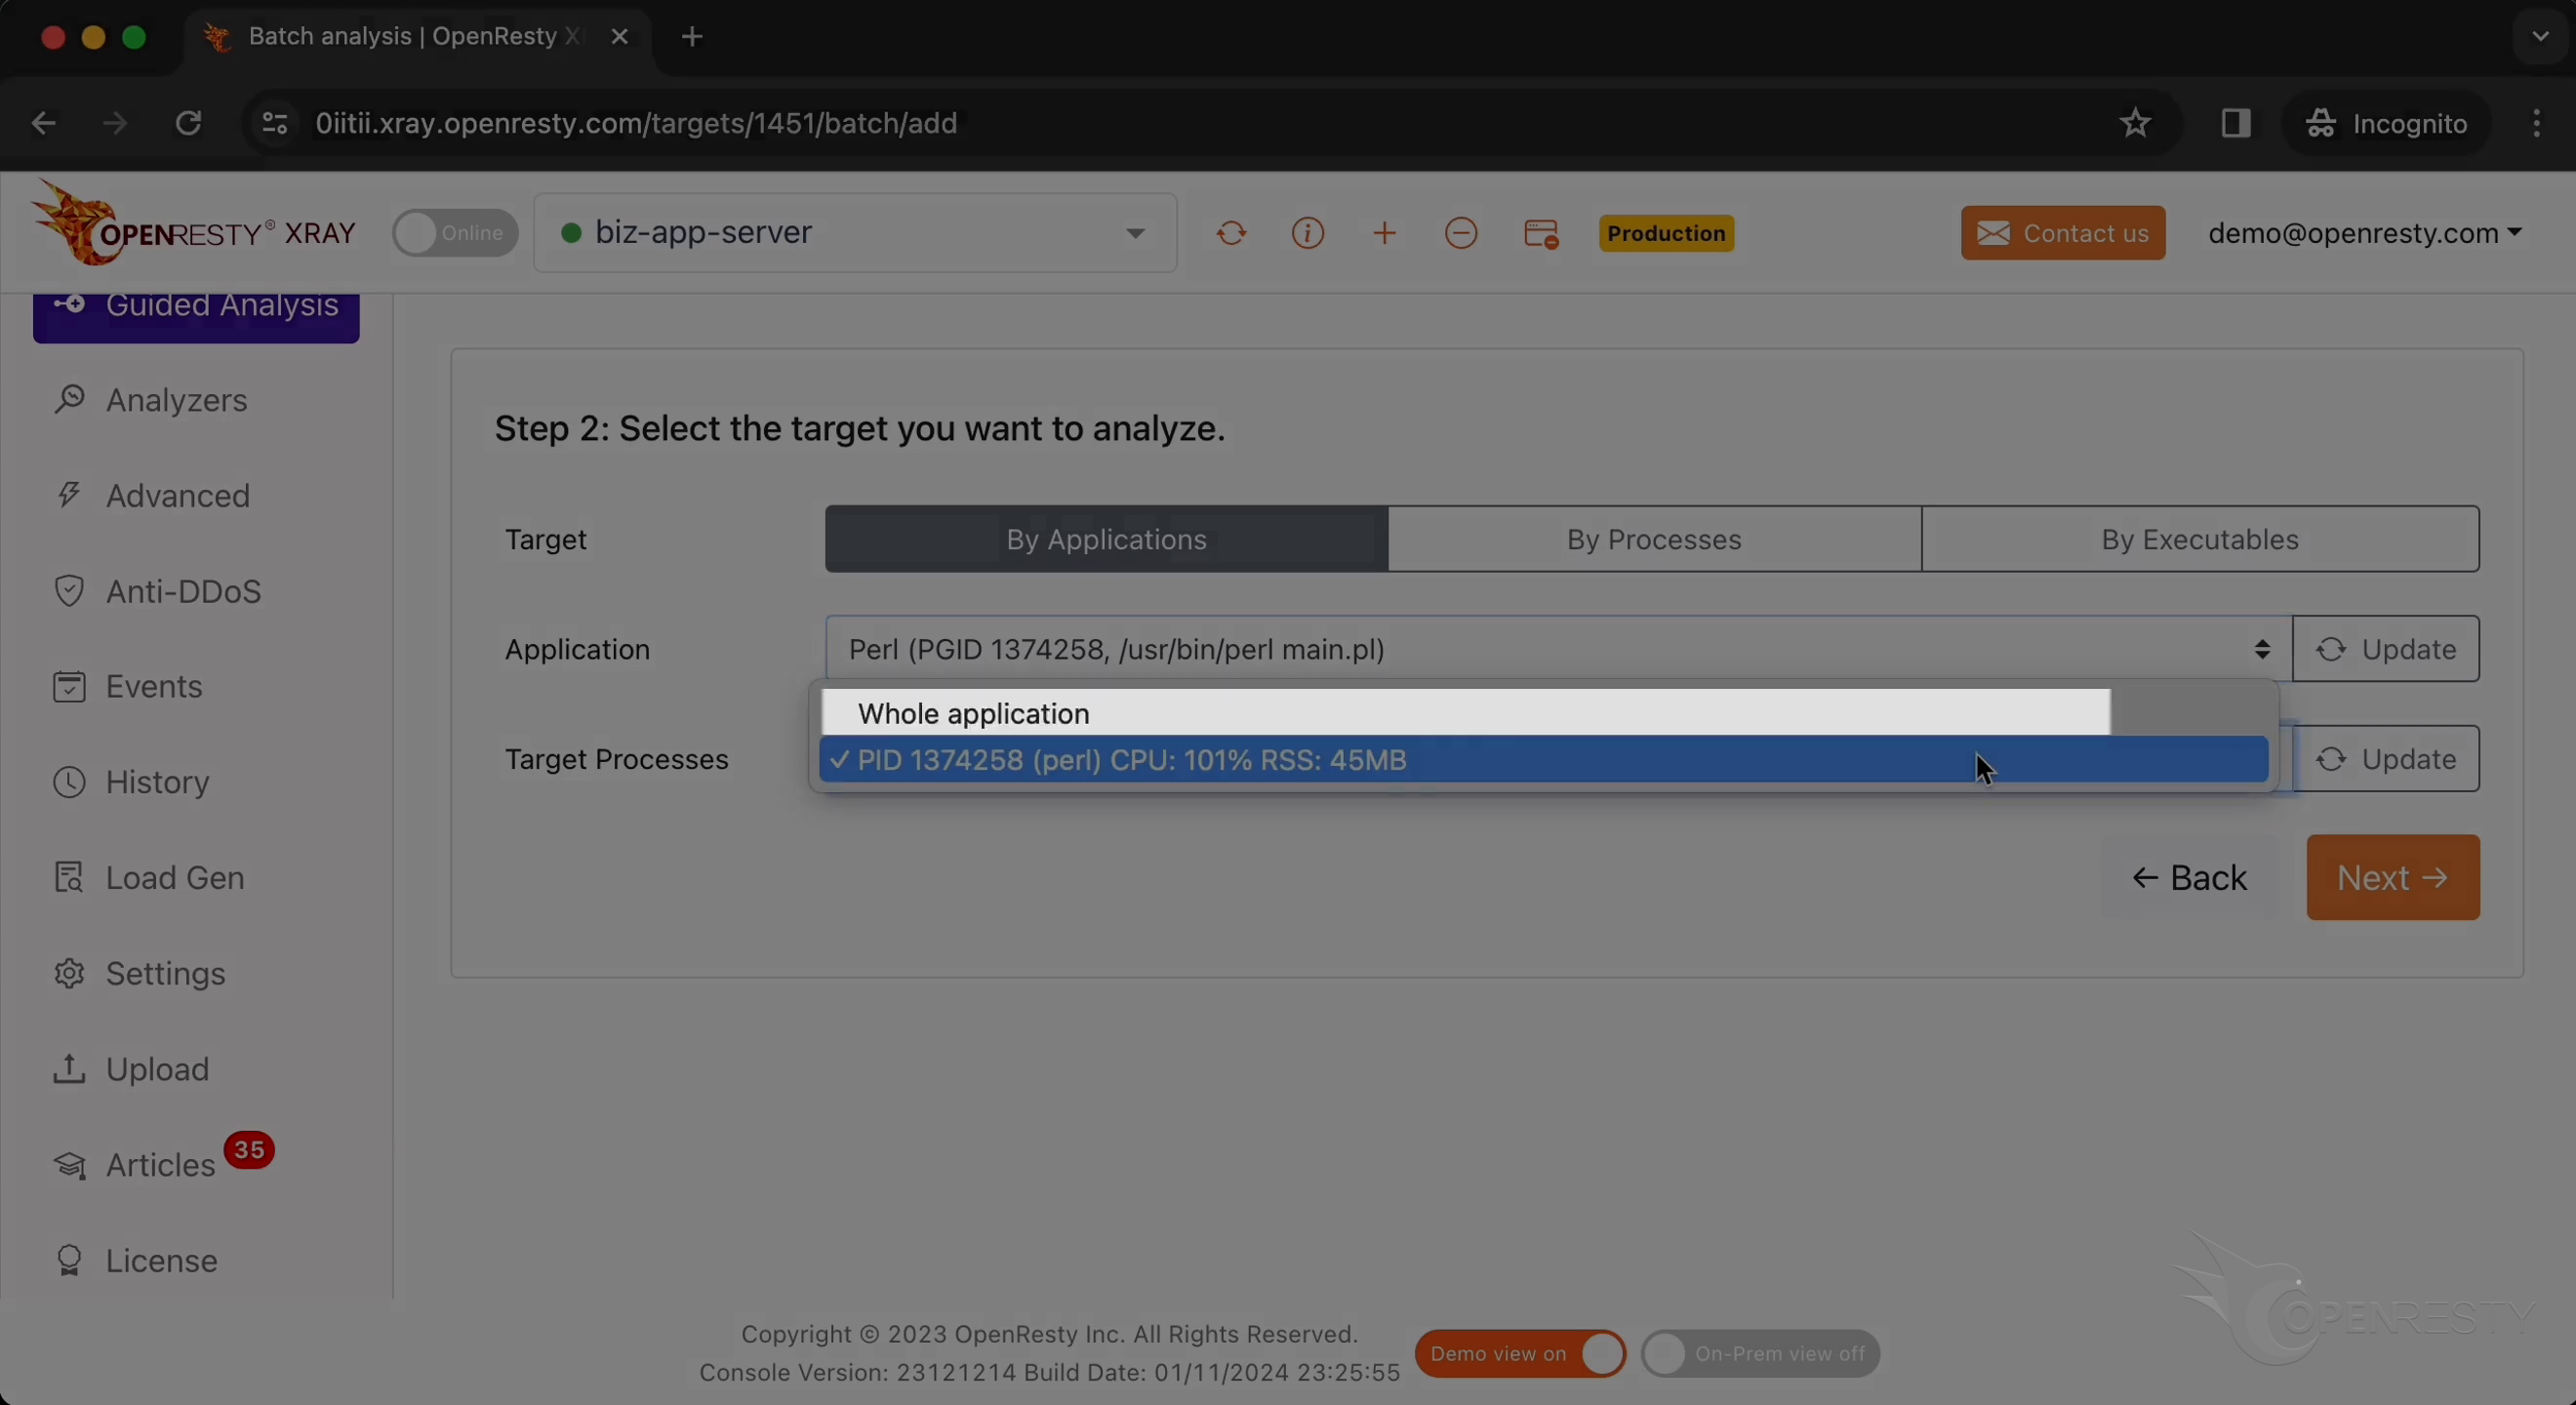
Select “Whole application”.
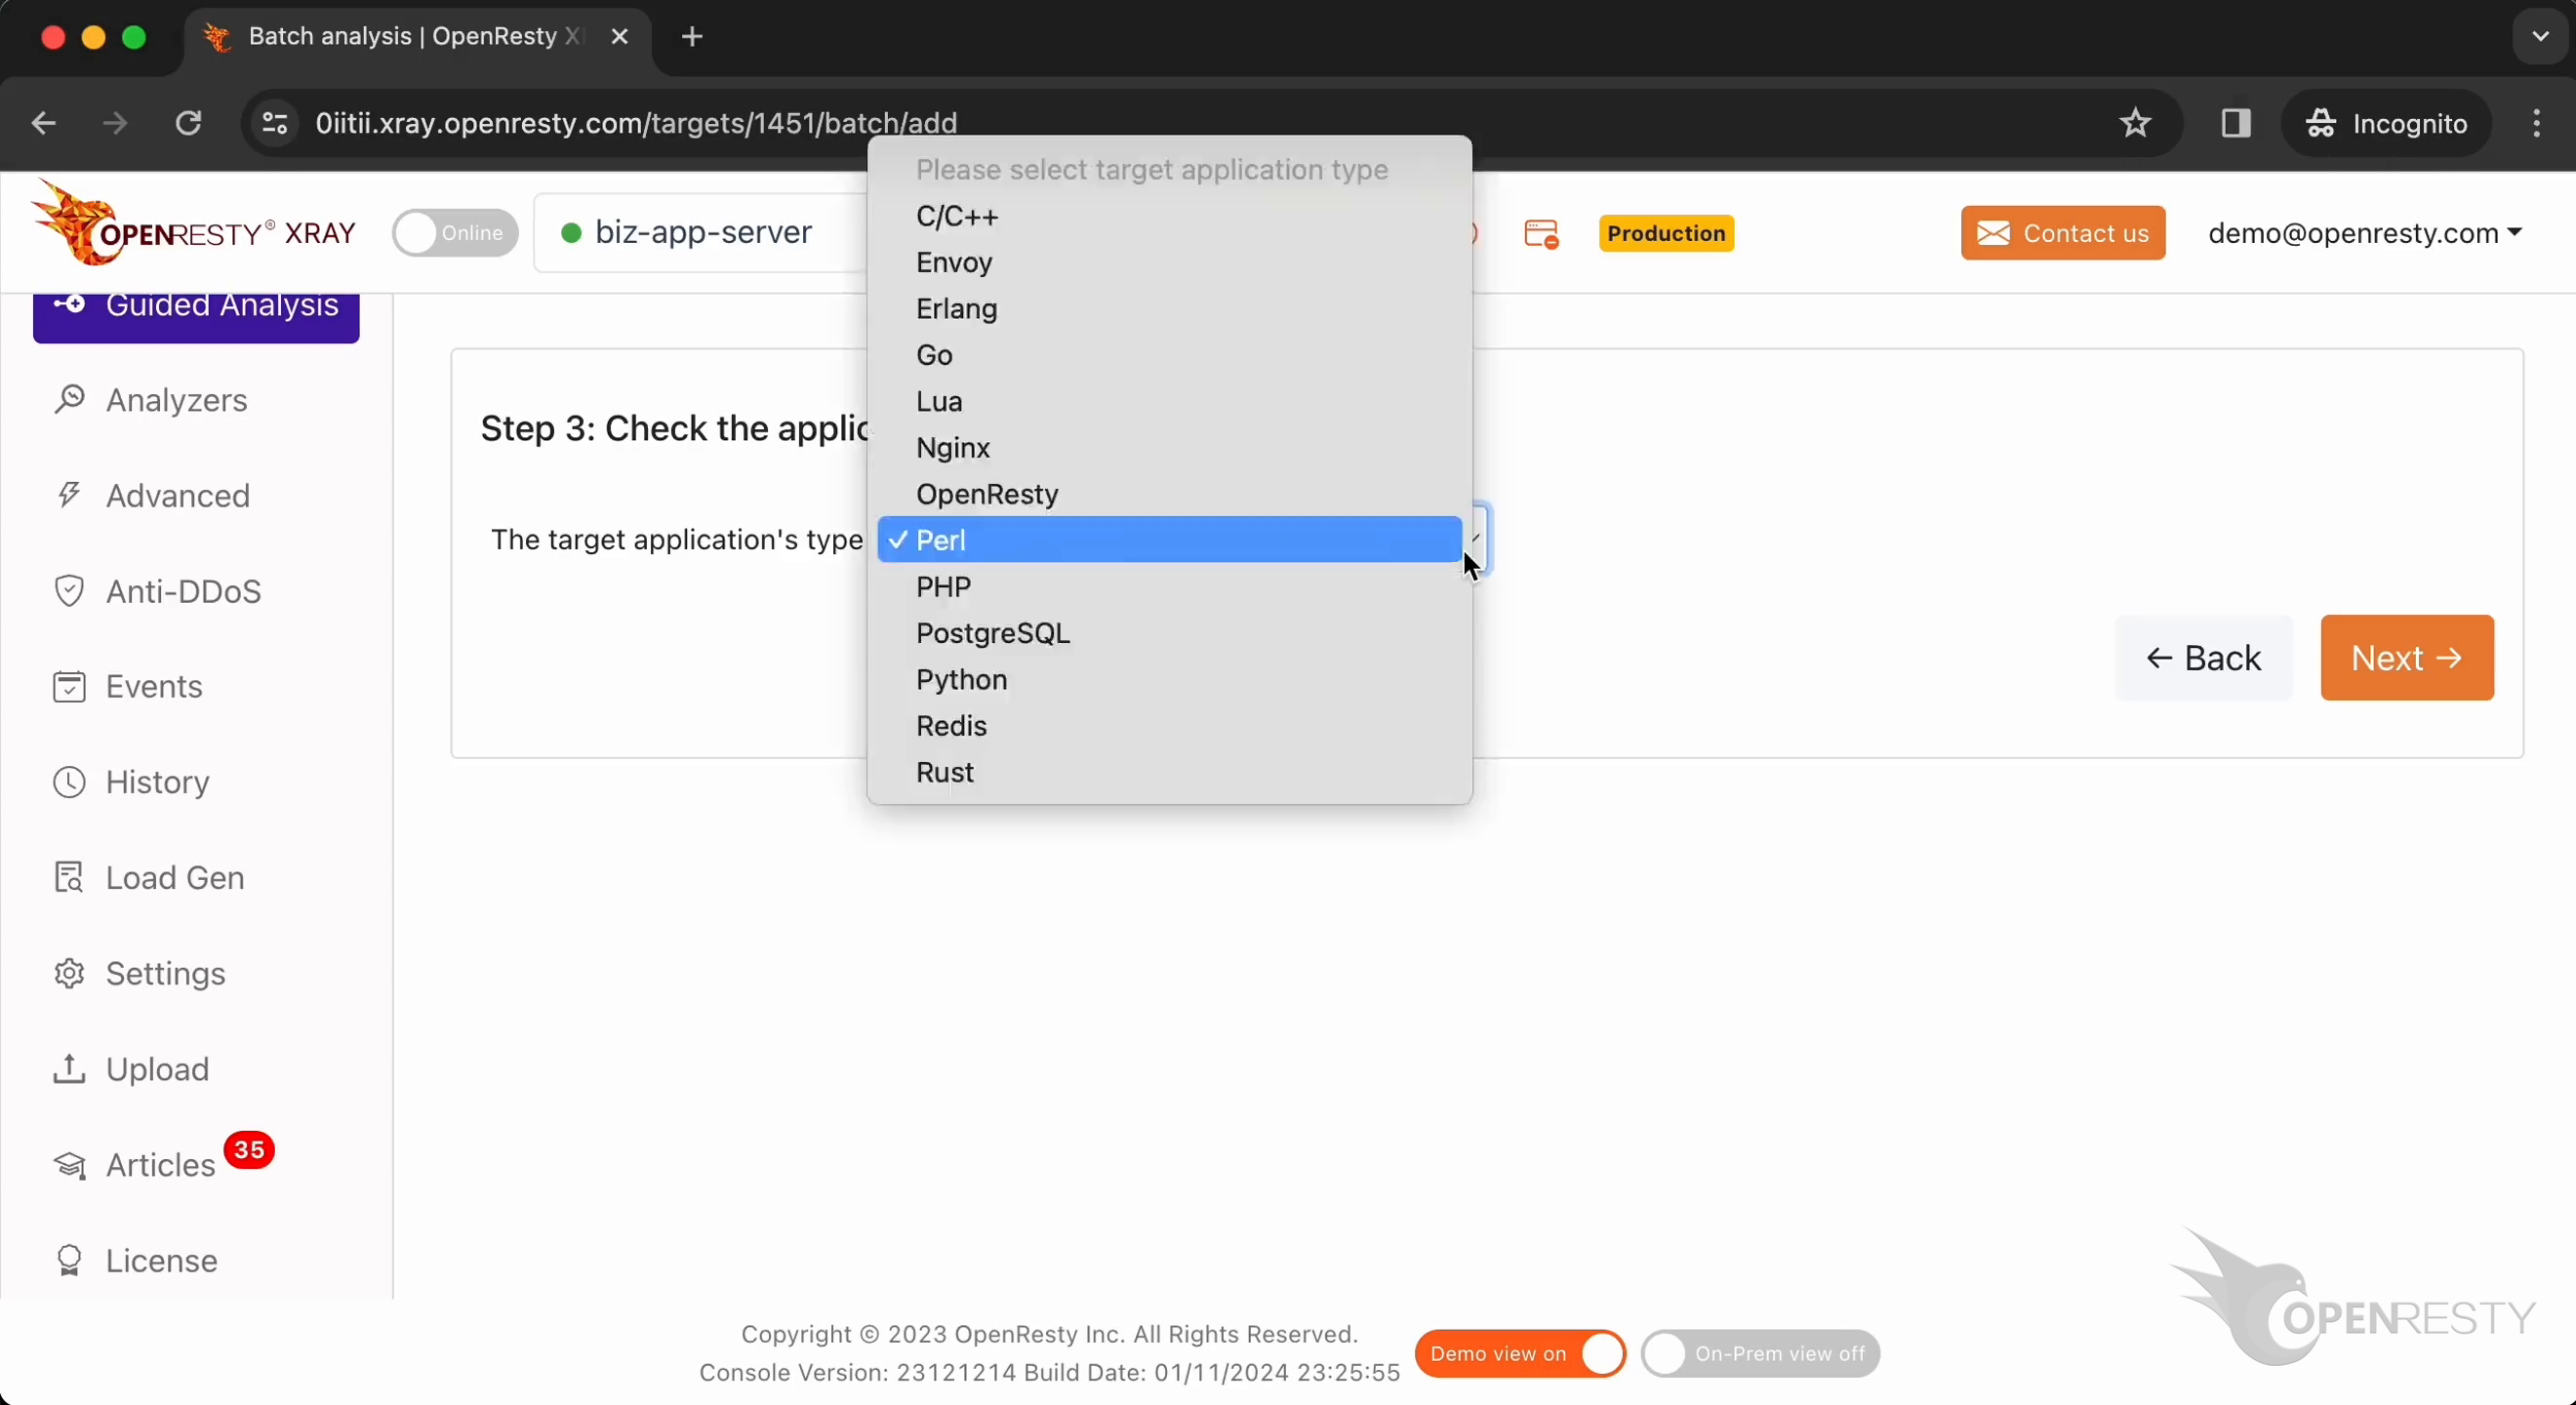
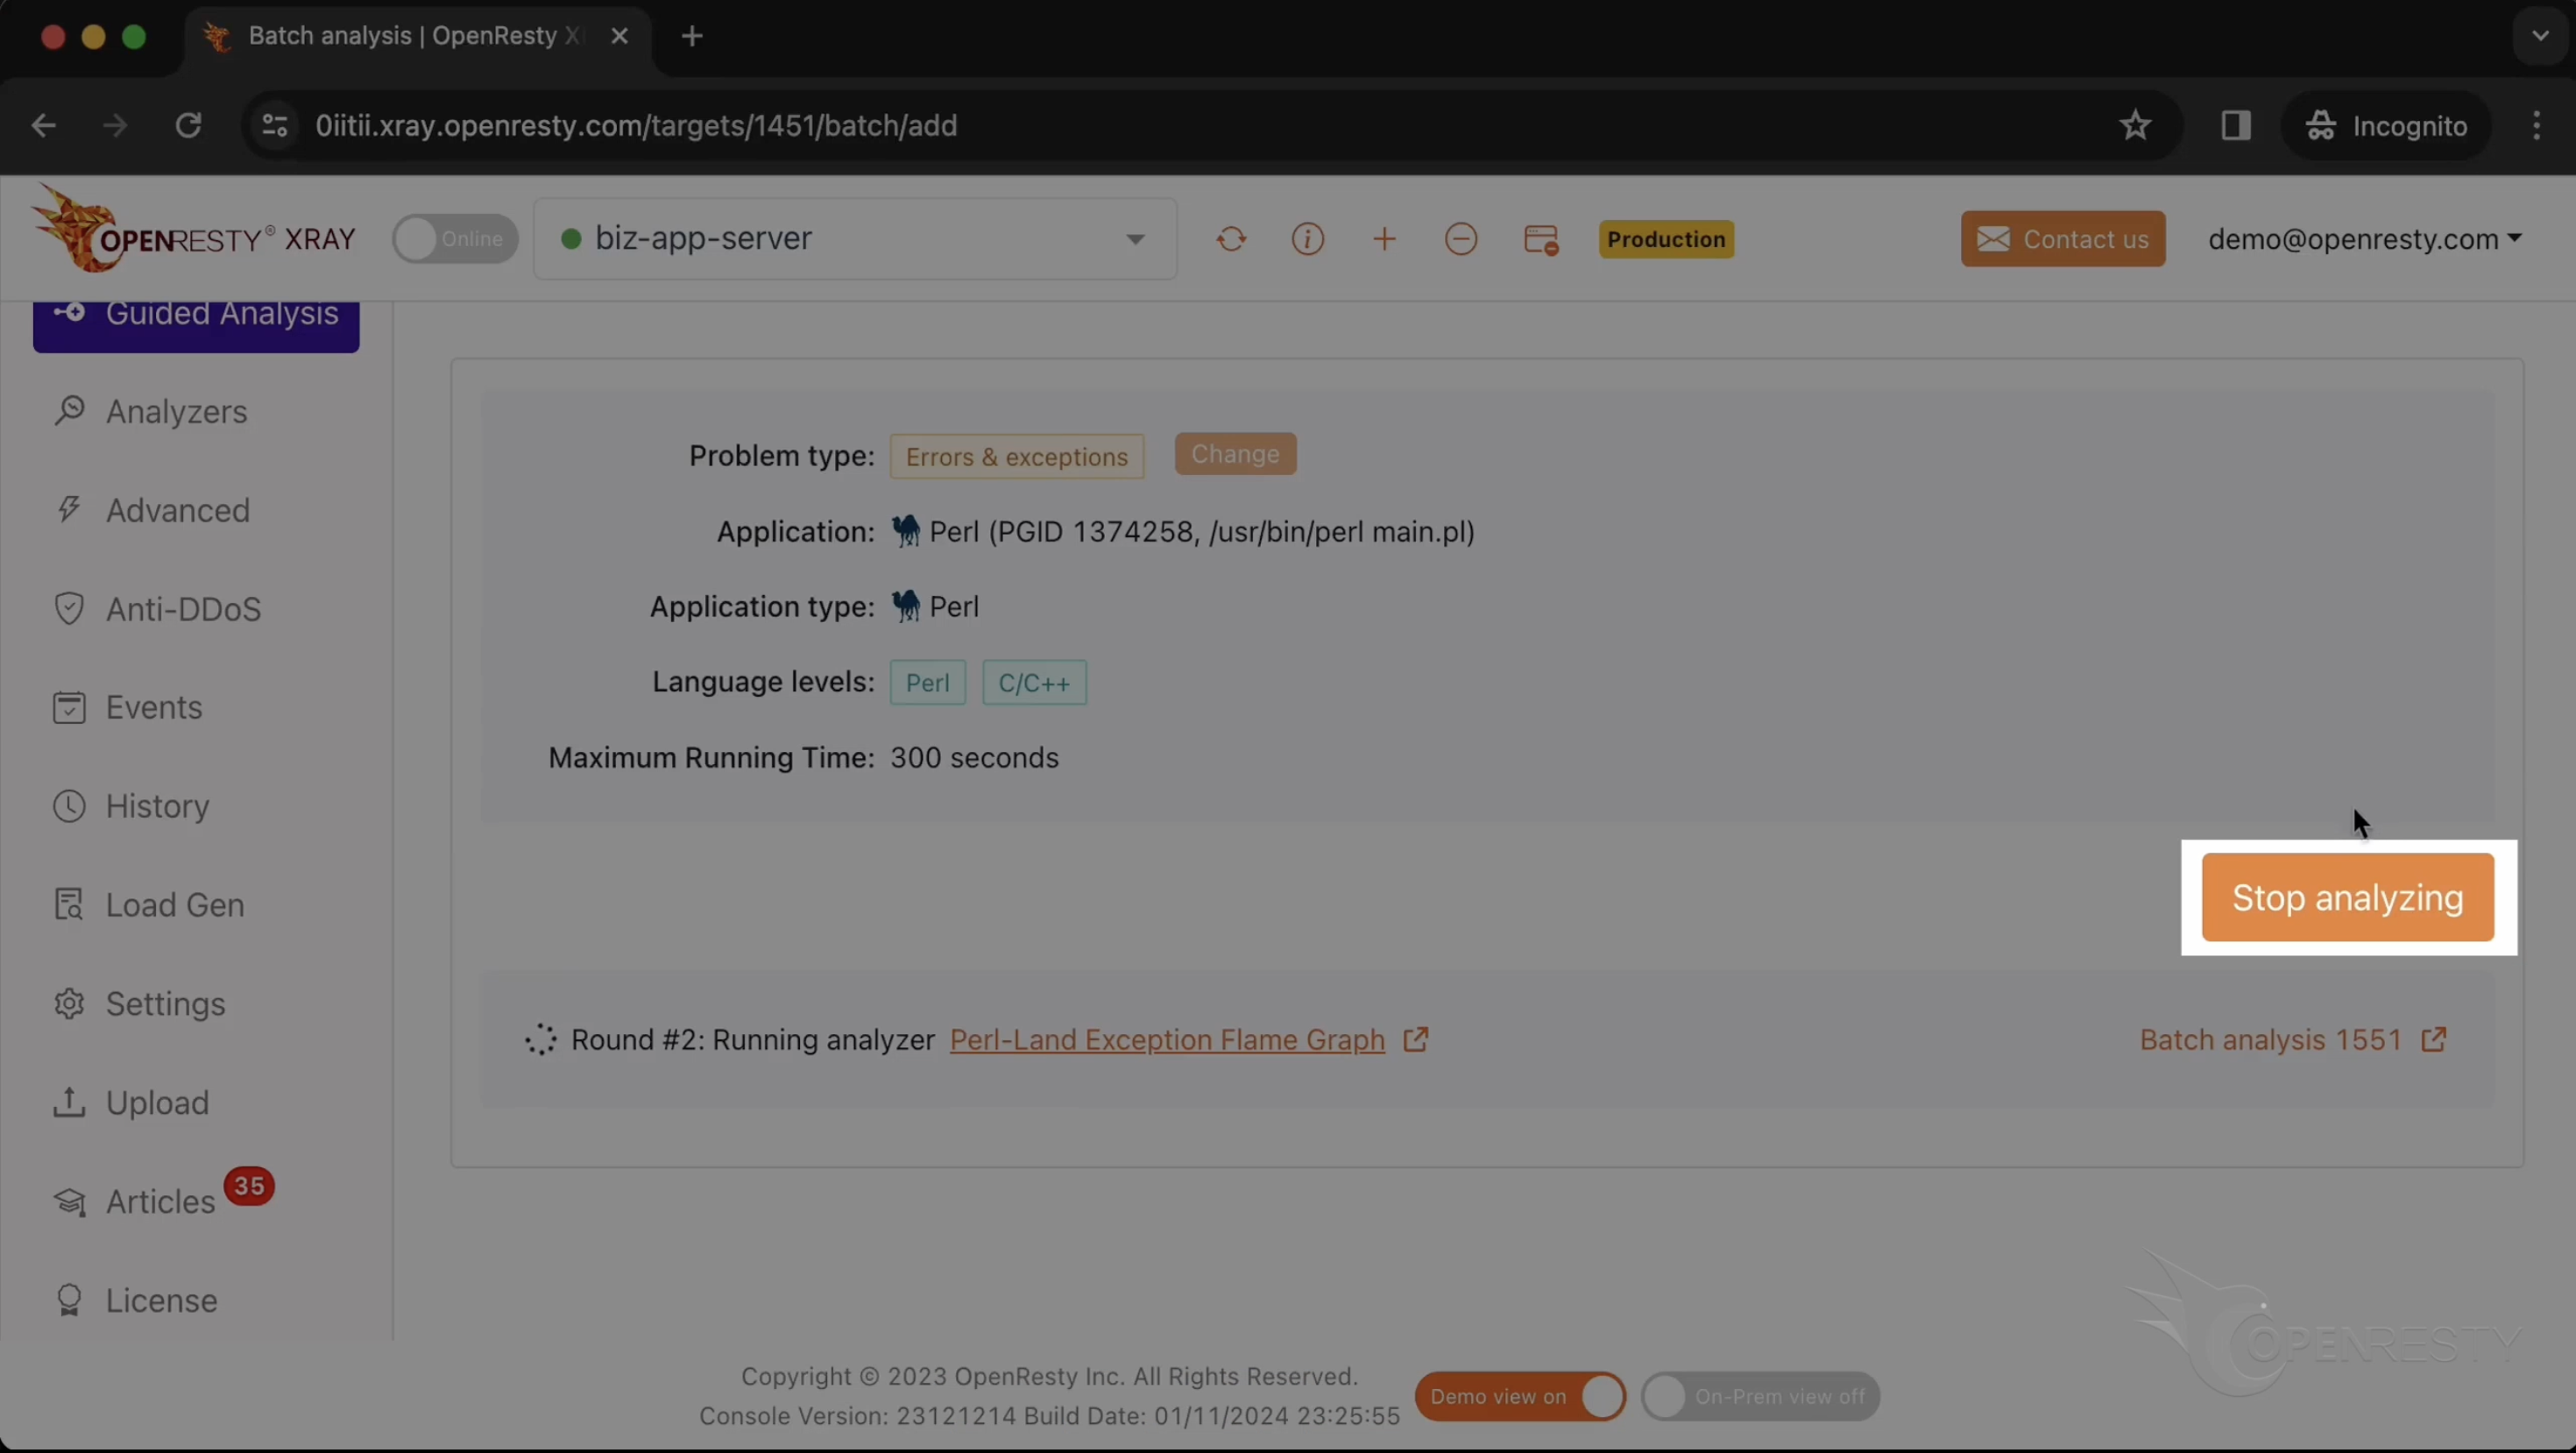
Make sure that the application type is right. Usually, the default should be correct.
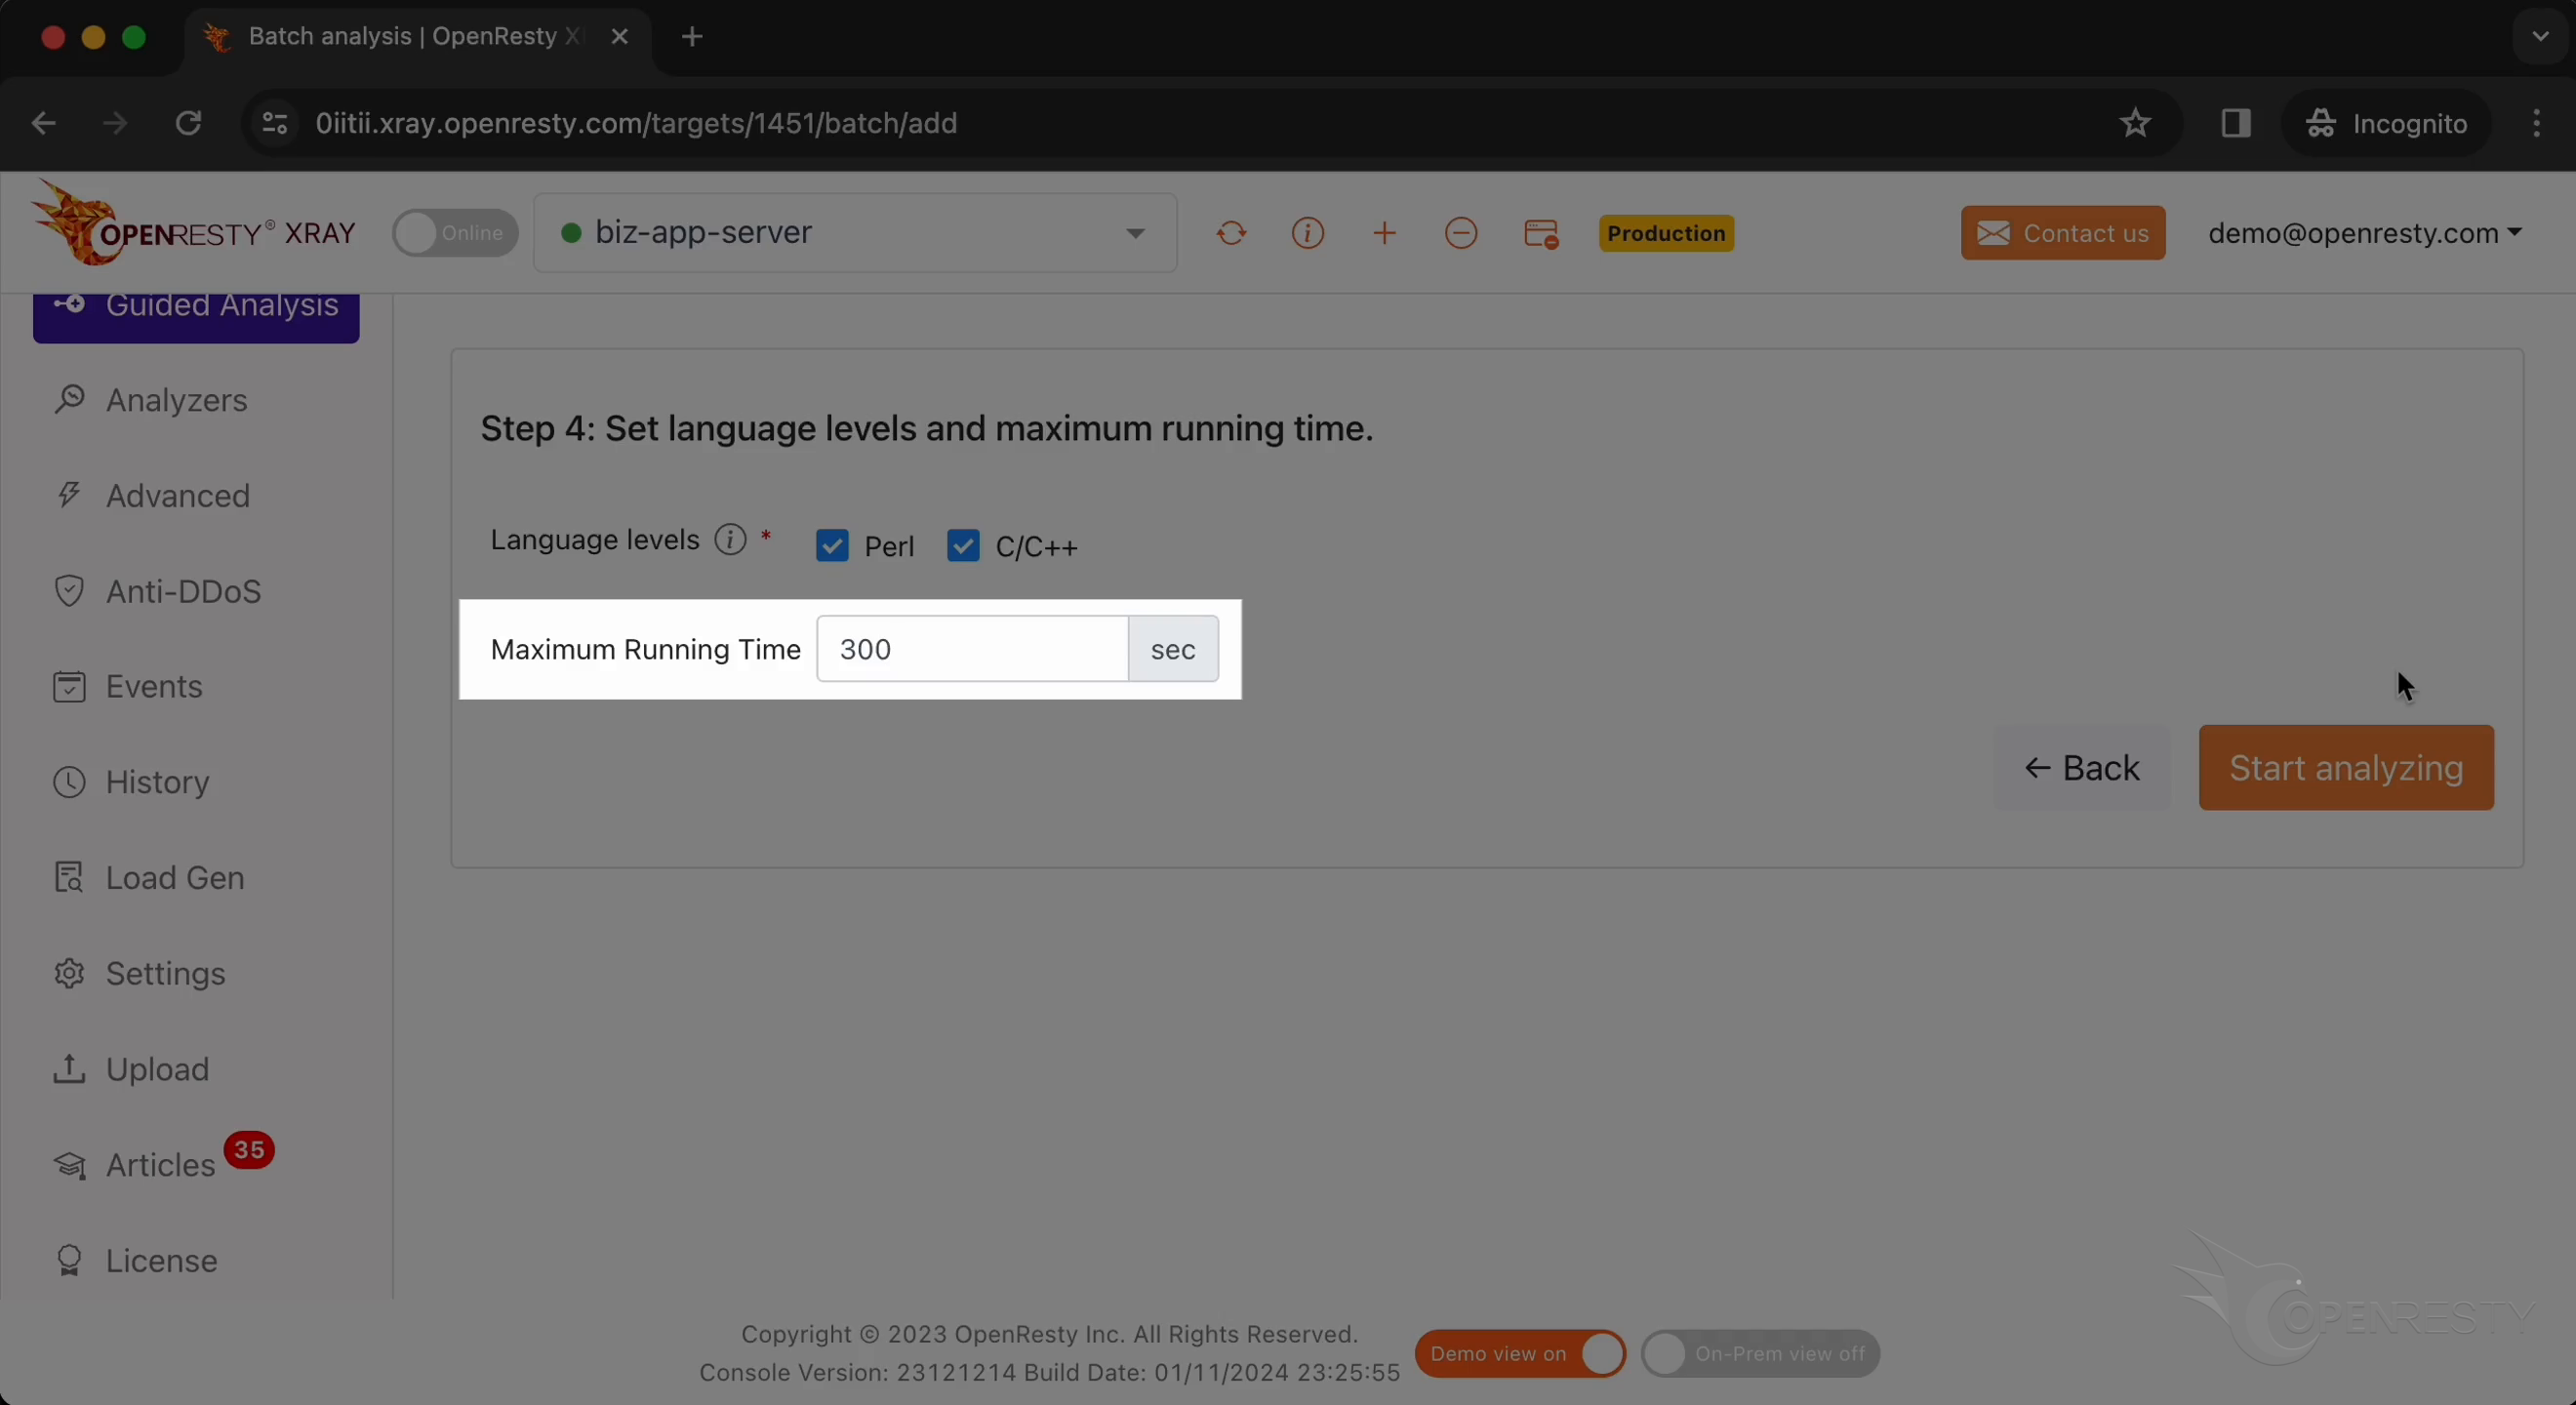
OpenResty XRay can analyze multiple language levels at the same time. We’ll keep both Perl and C/C++ selected.
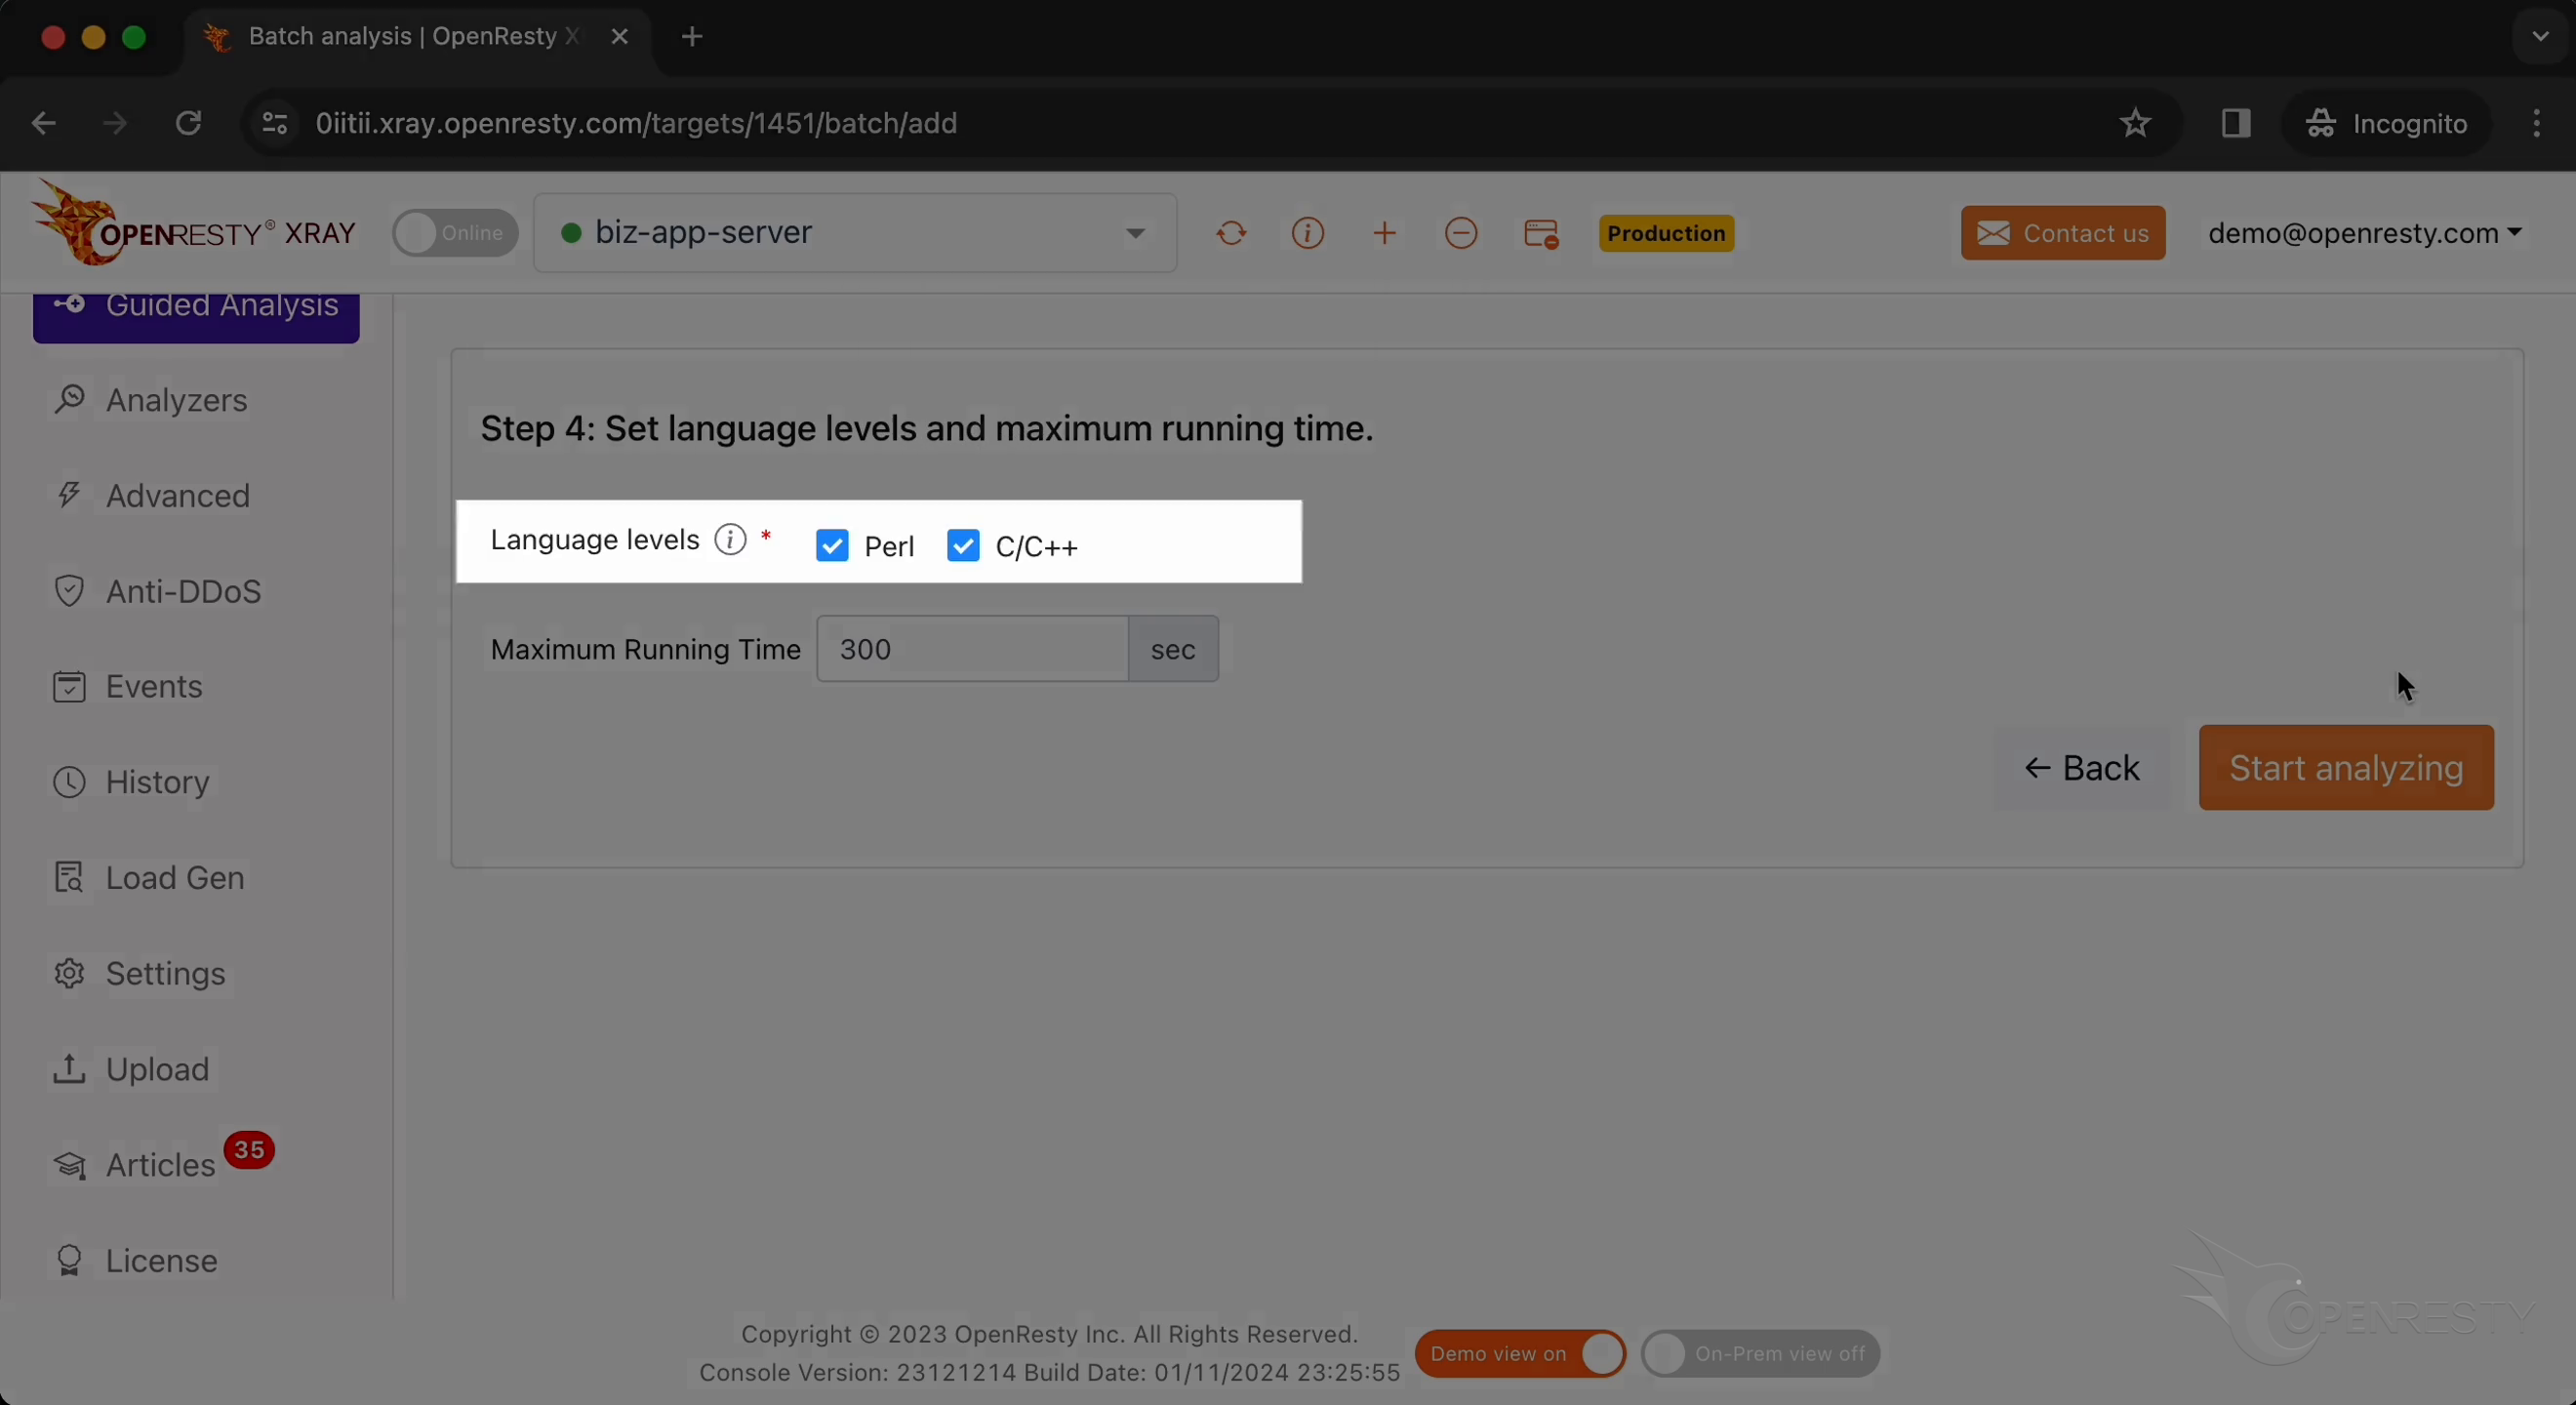
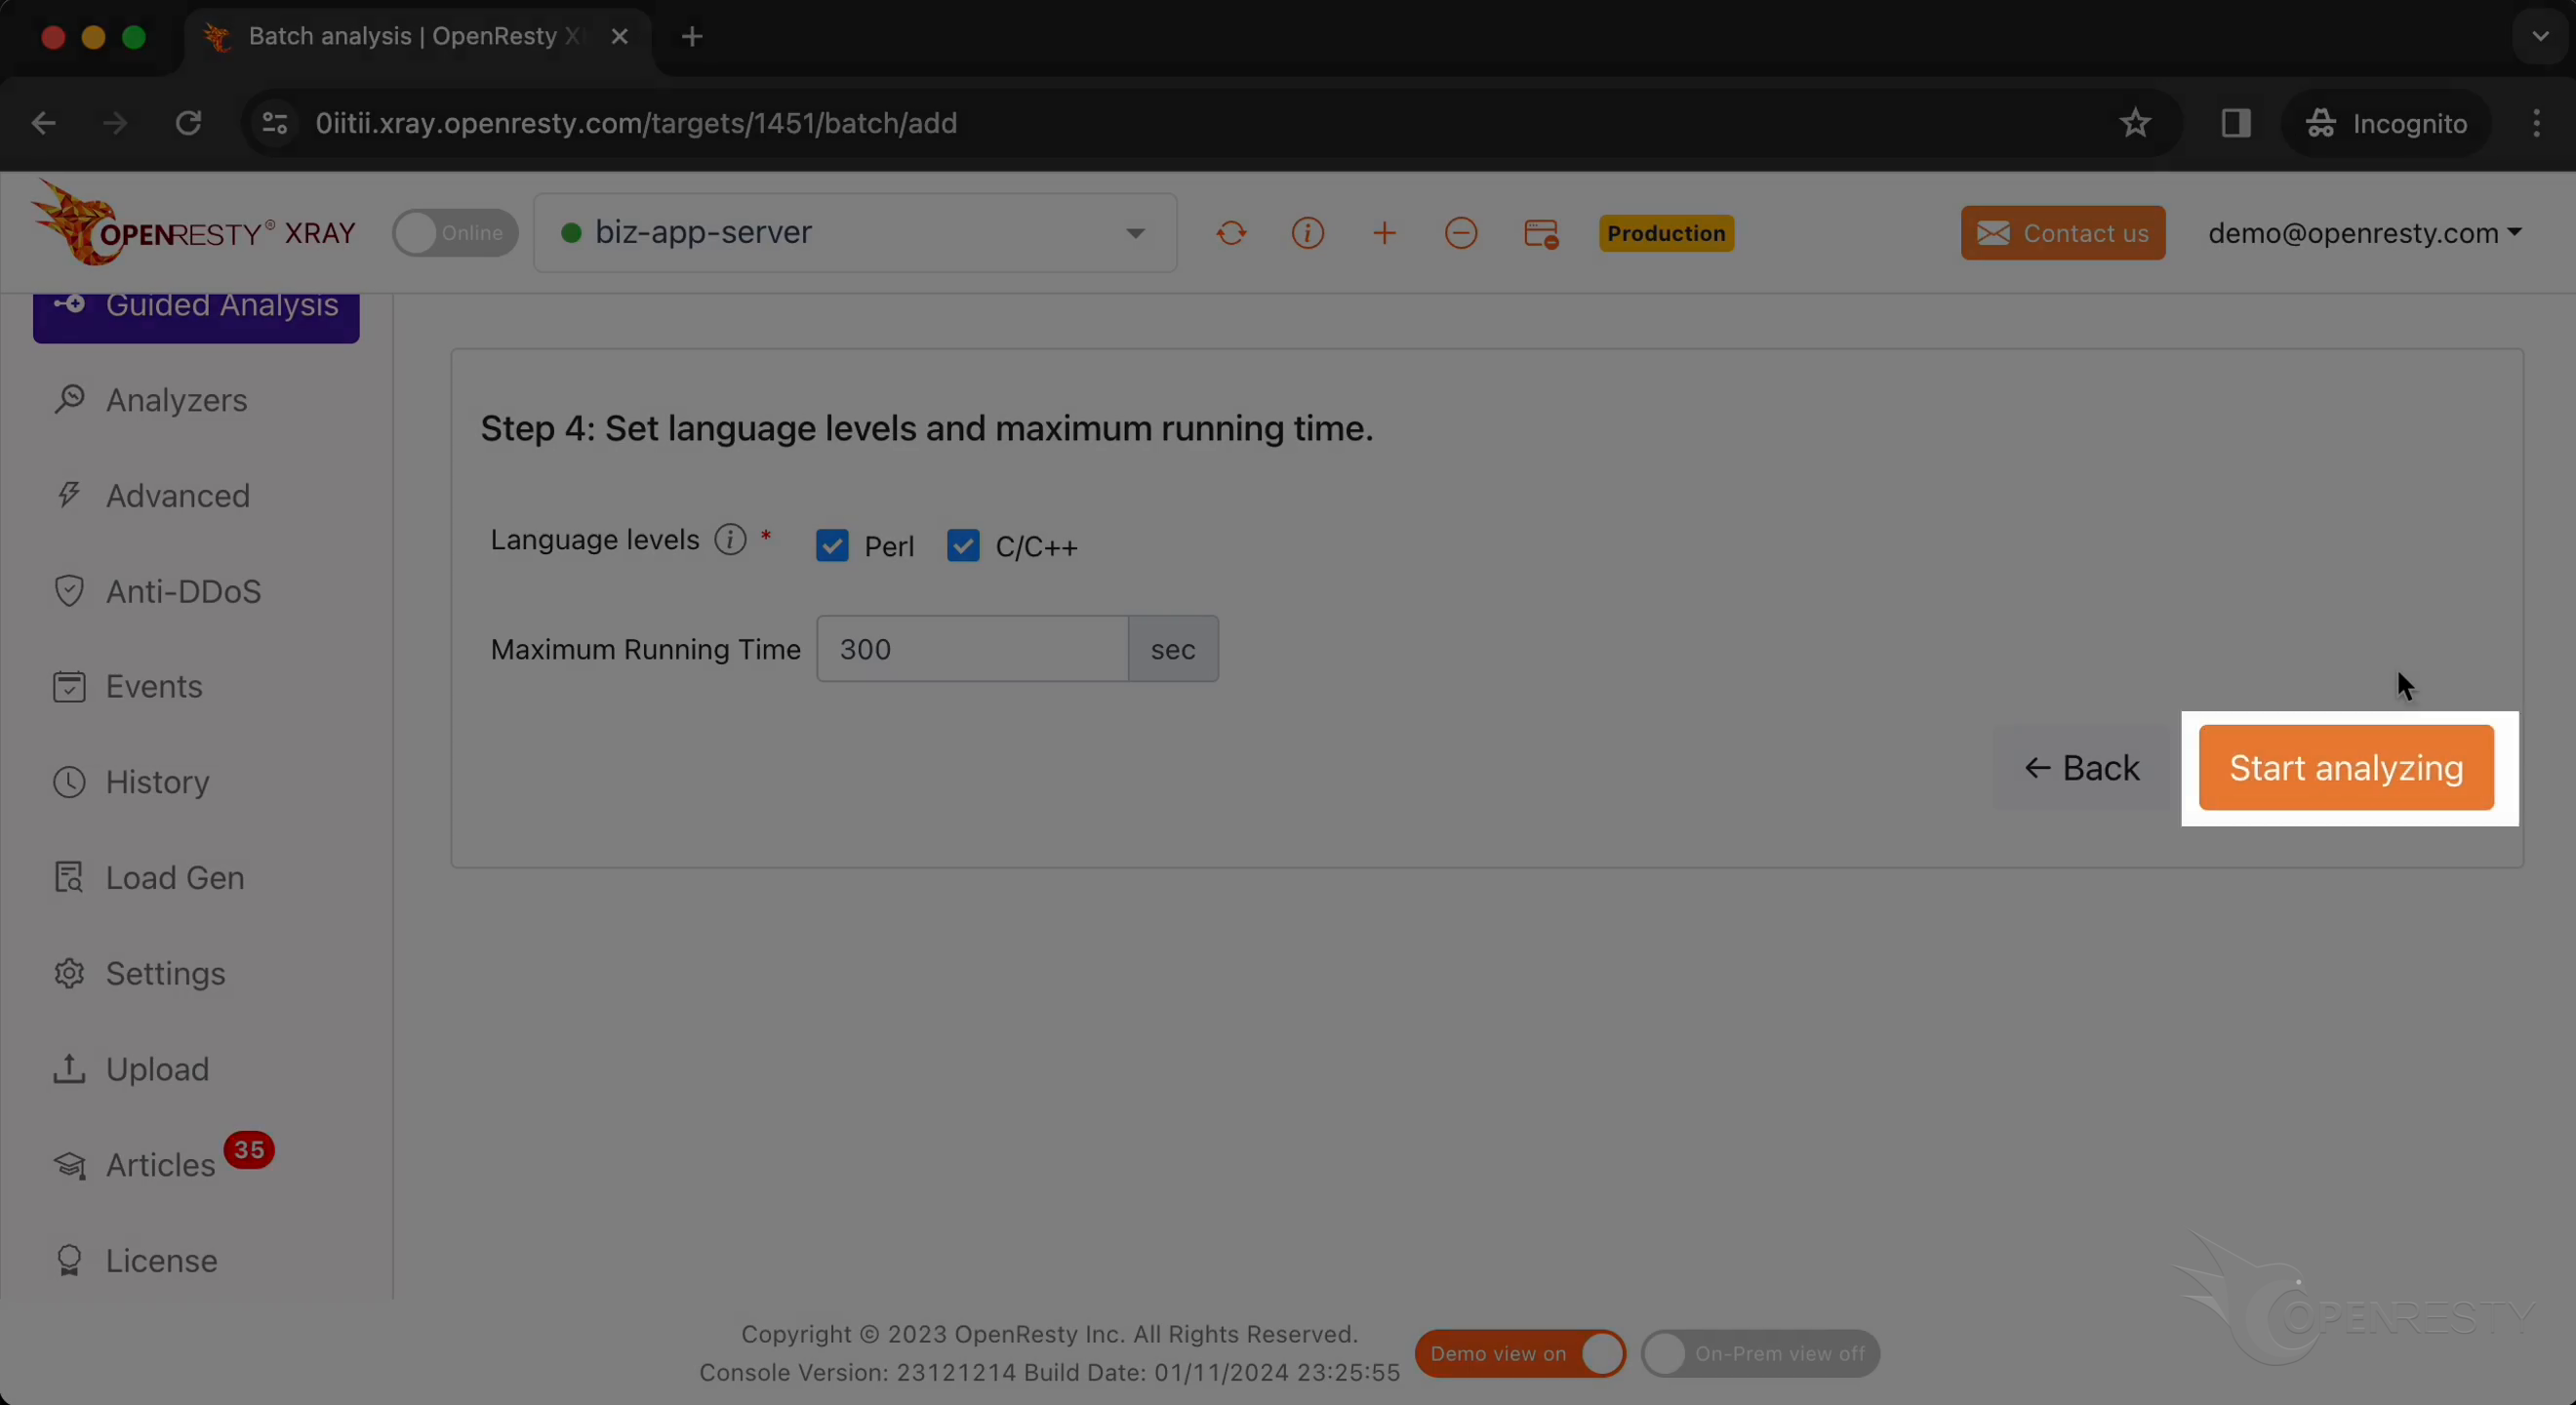
We can also set the maximum analyzing time. We’ll leave it as 300 seconds, which is the default value.
Let’s start analyzing.
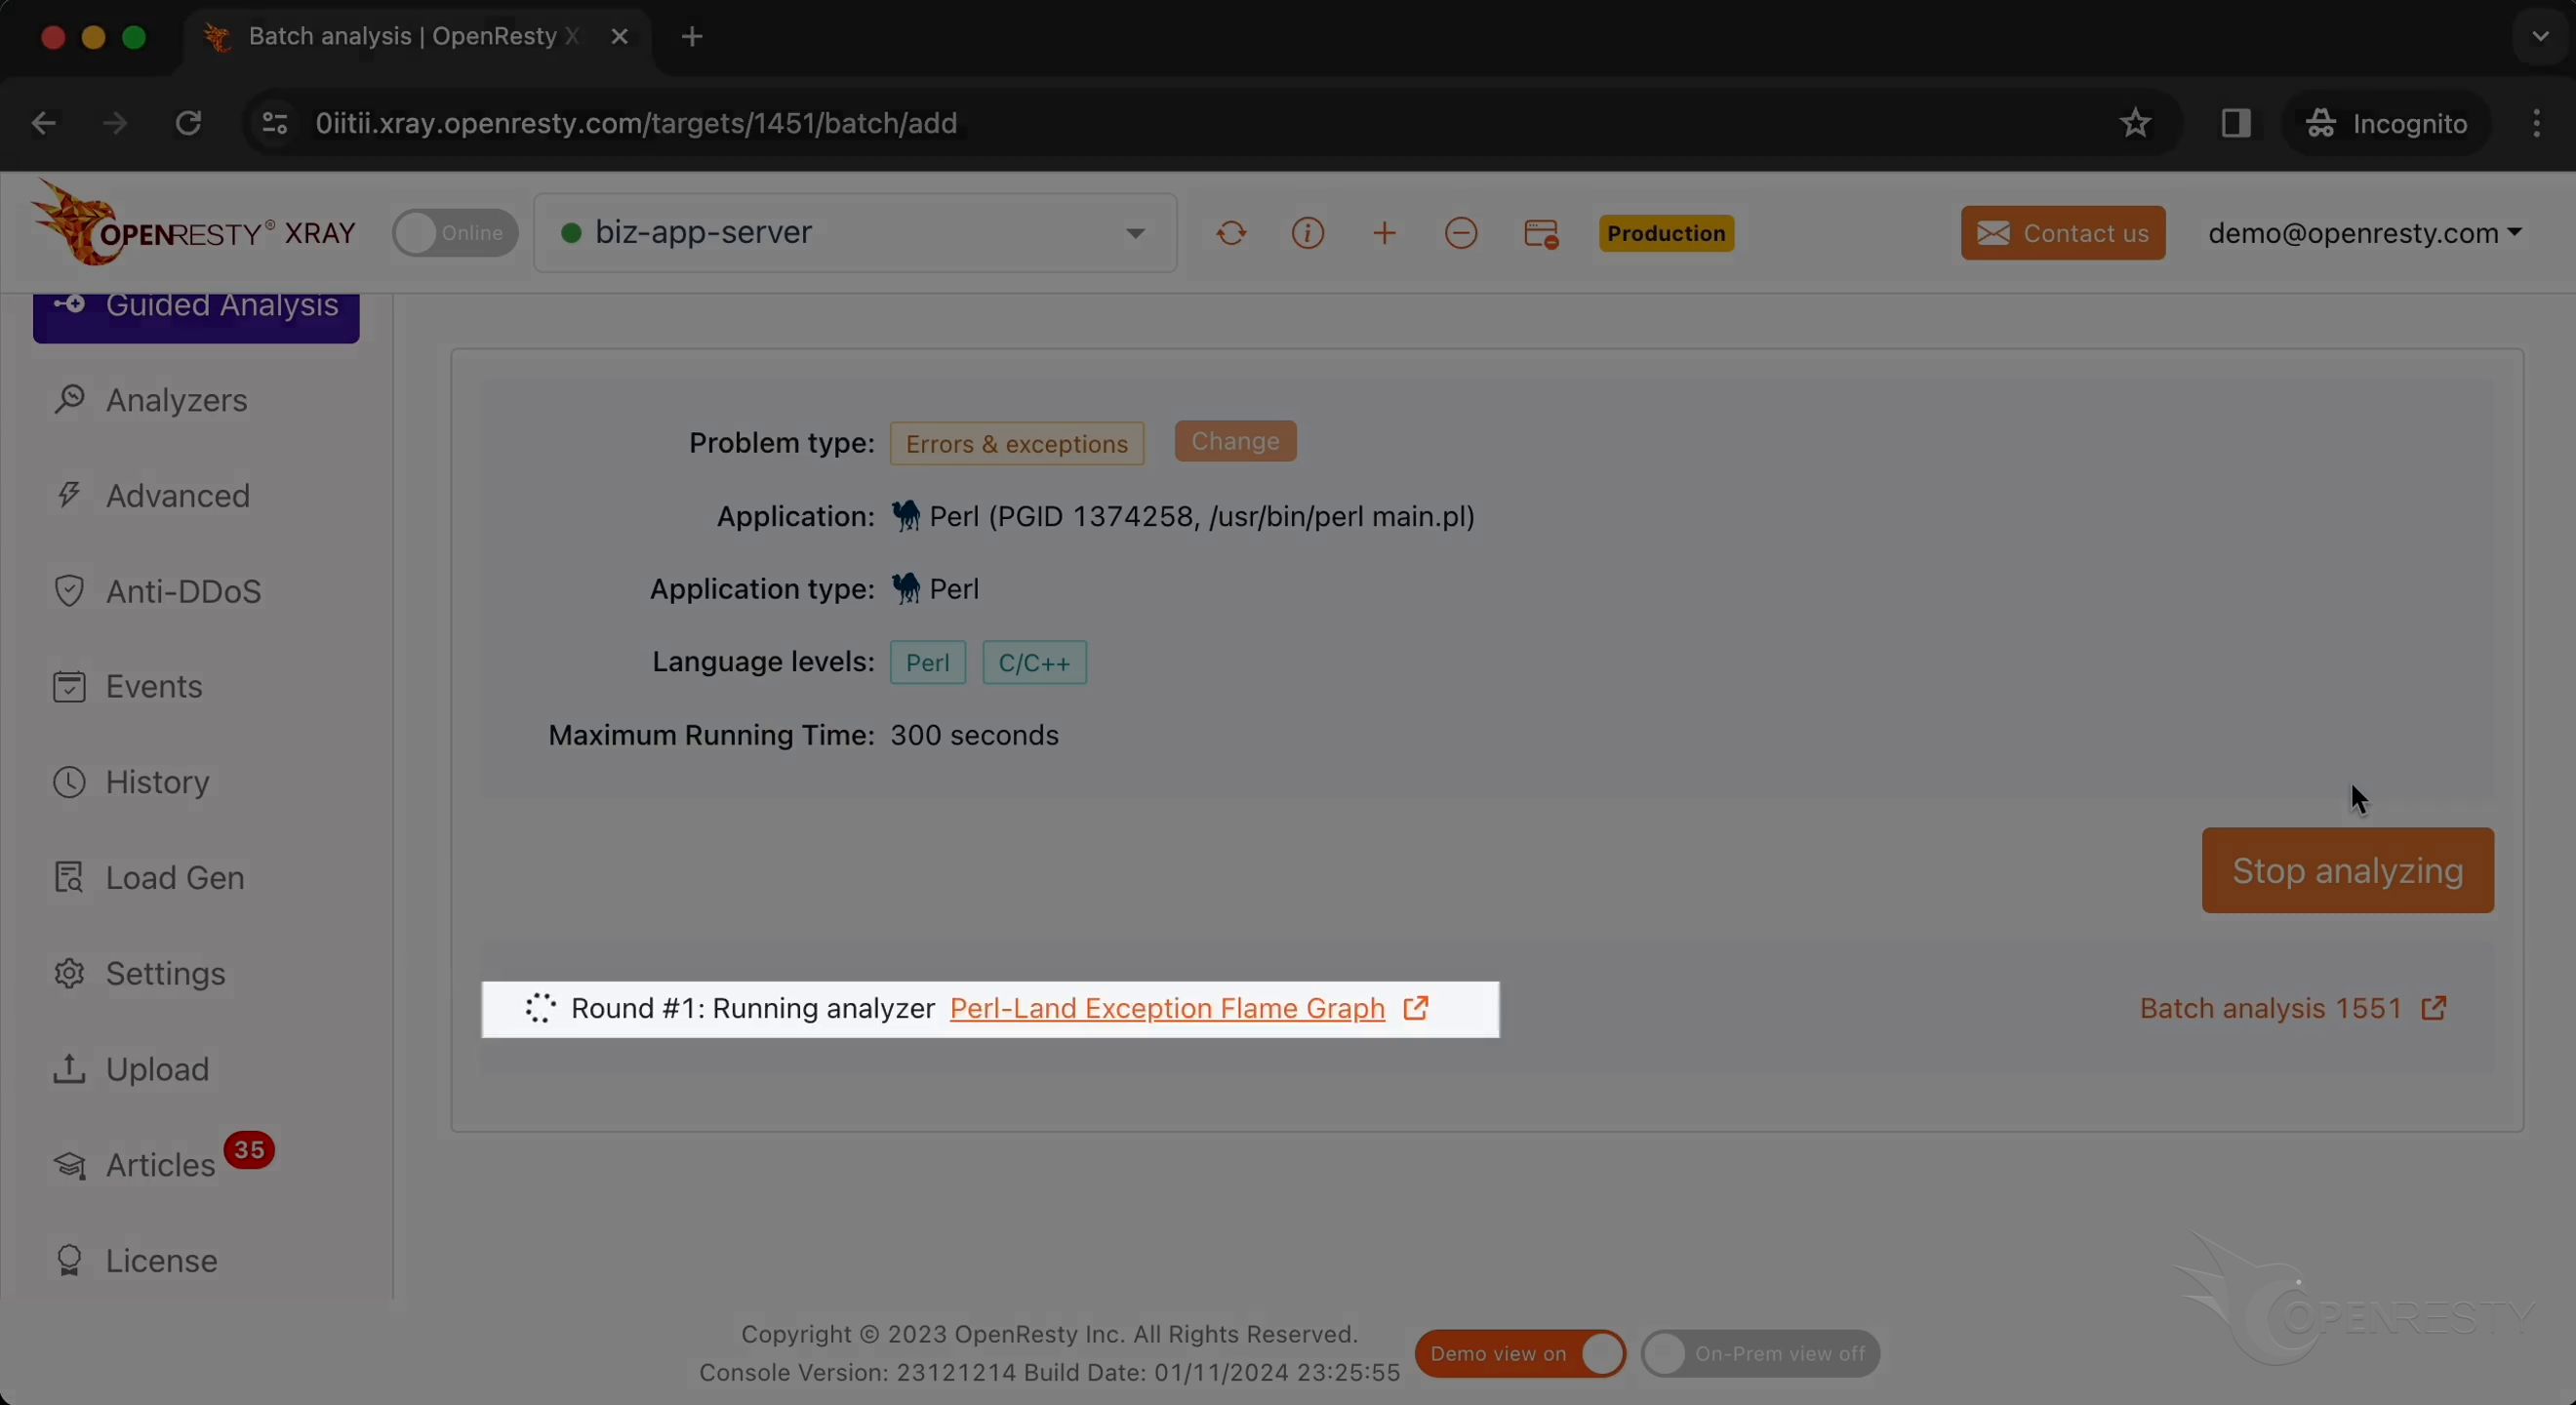
The system will keep performing different rounds of analysis. Now it’s executing the first round.
The first round is done and it’s already on the second one. That’s enough for this case.
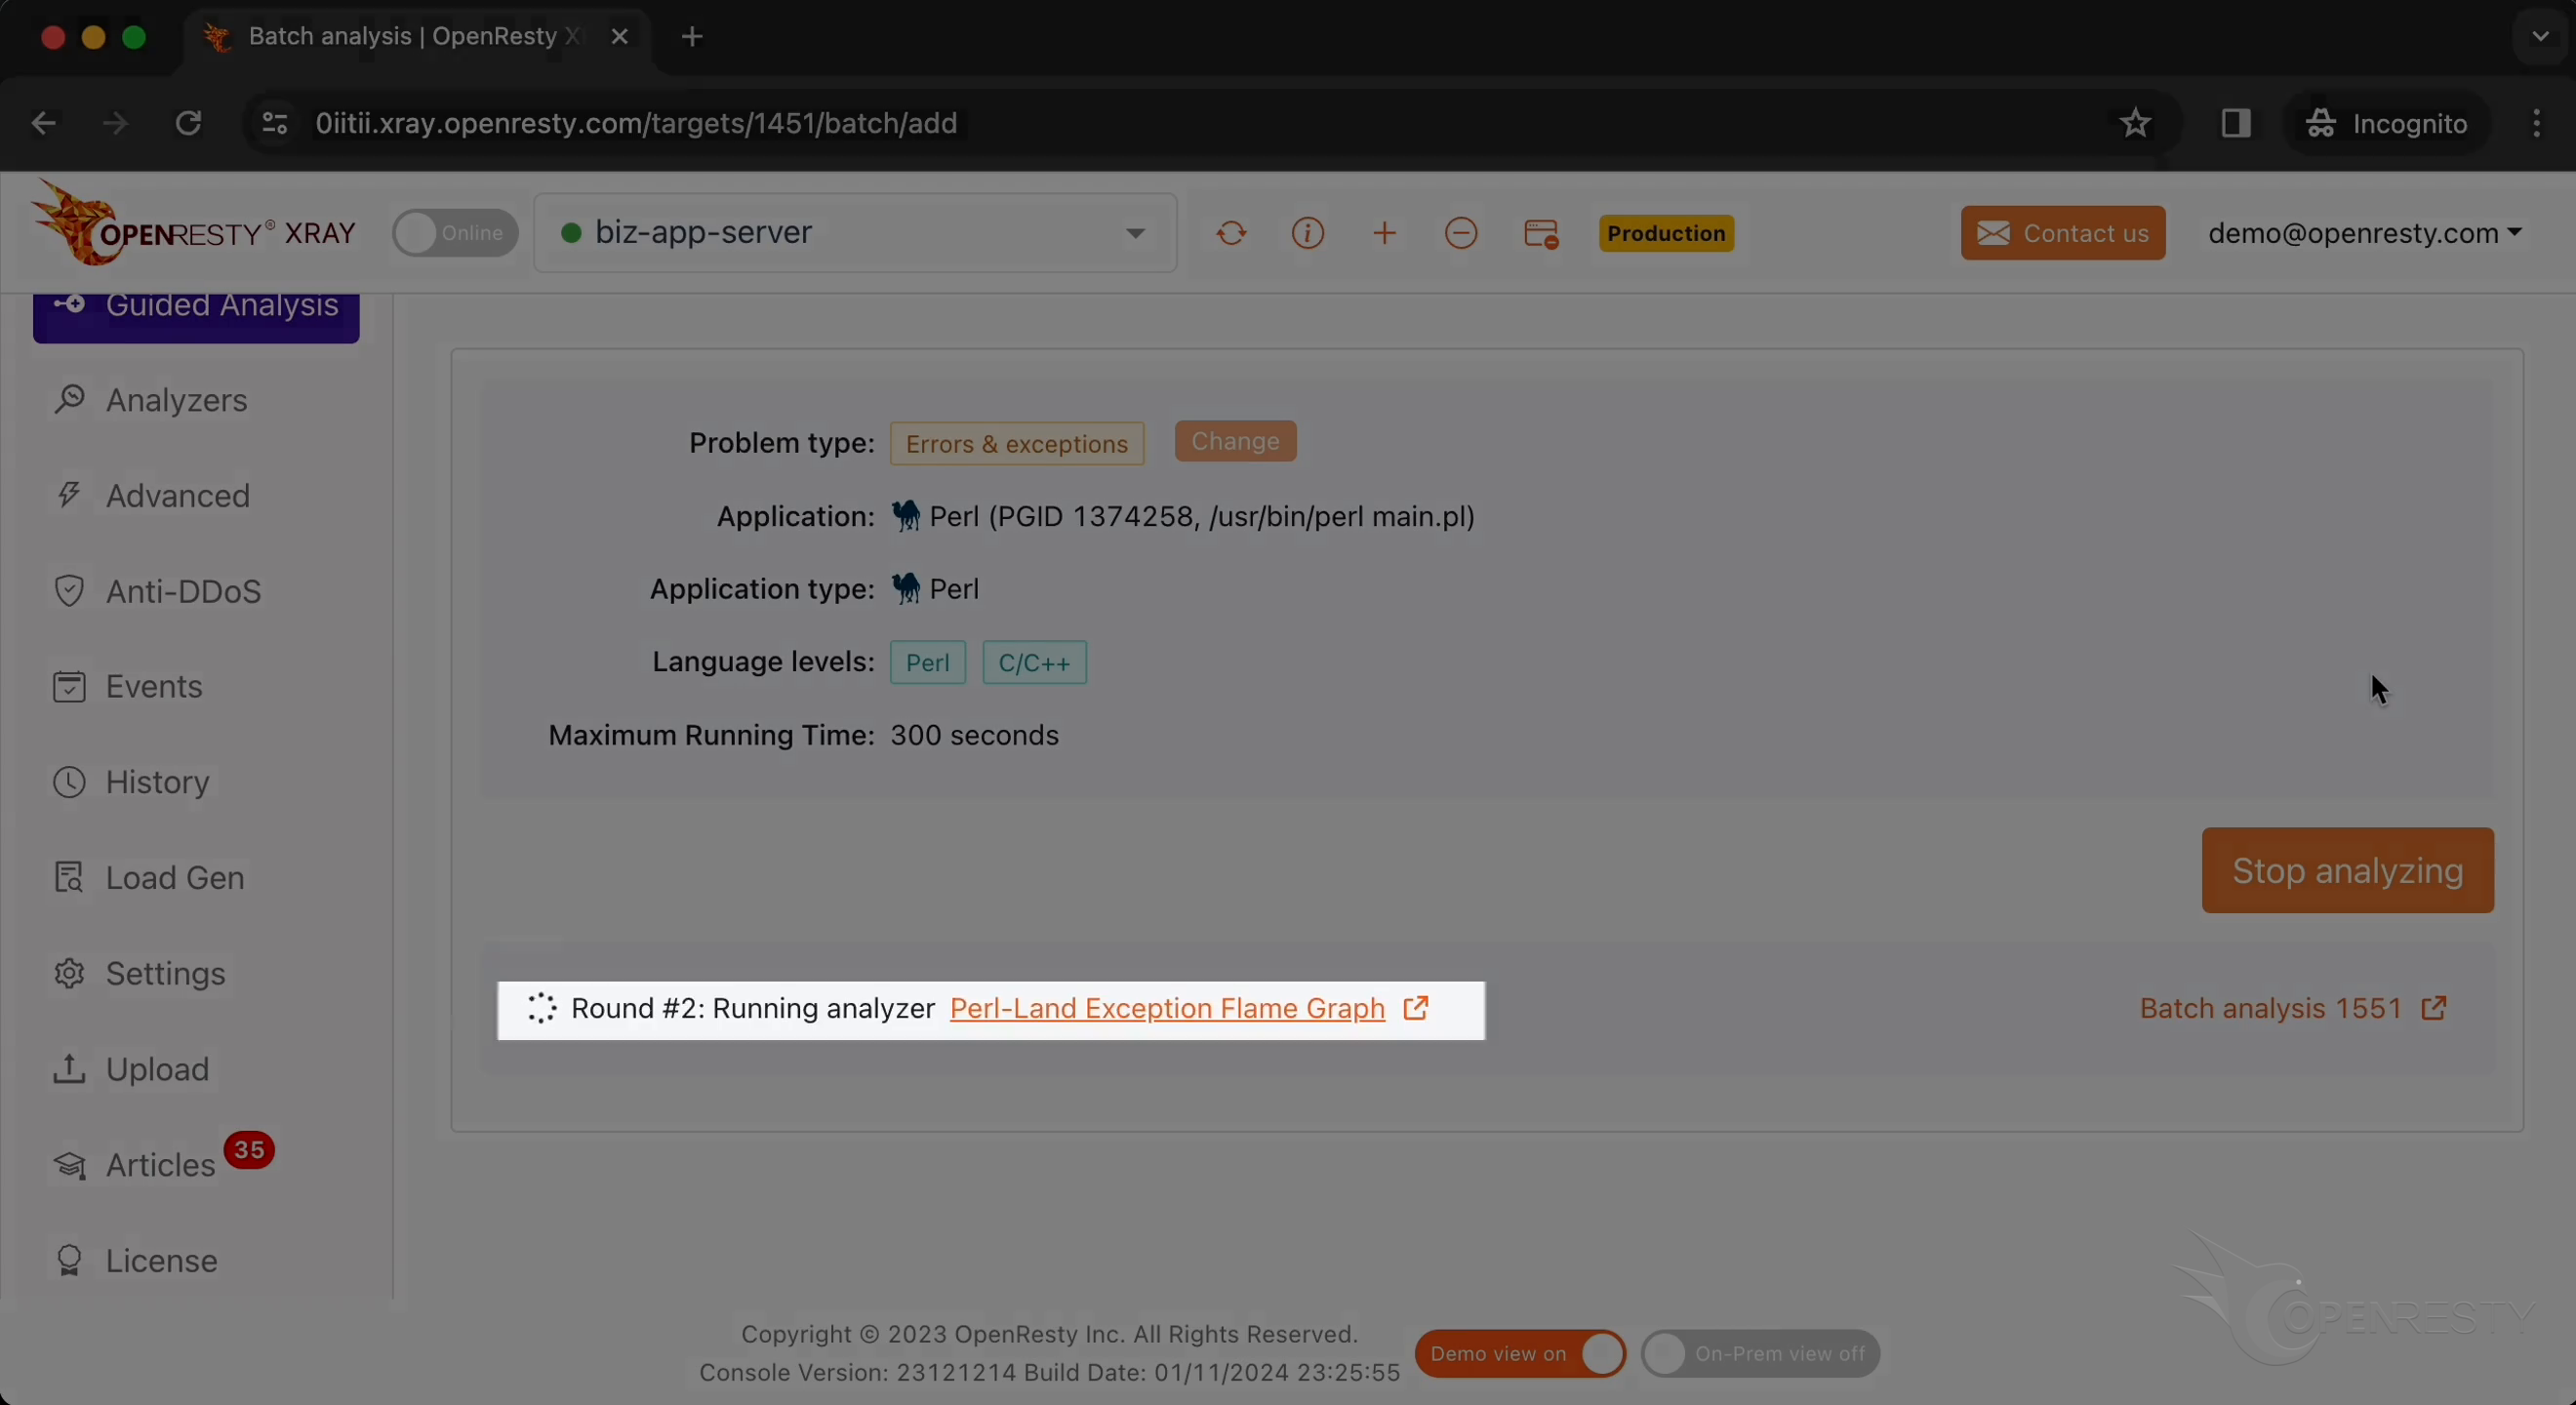
Stop analyzing.
It automatically generated an analysis report.
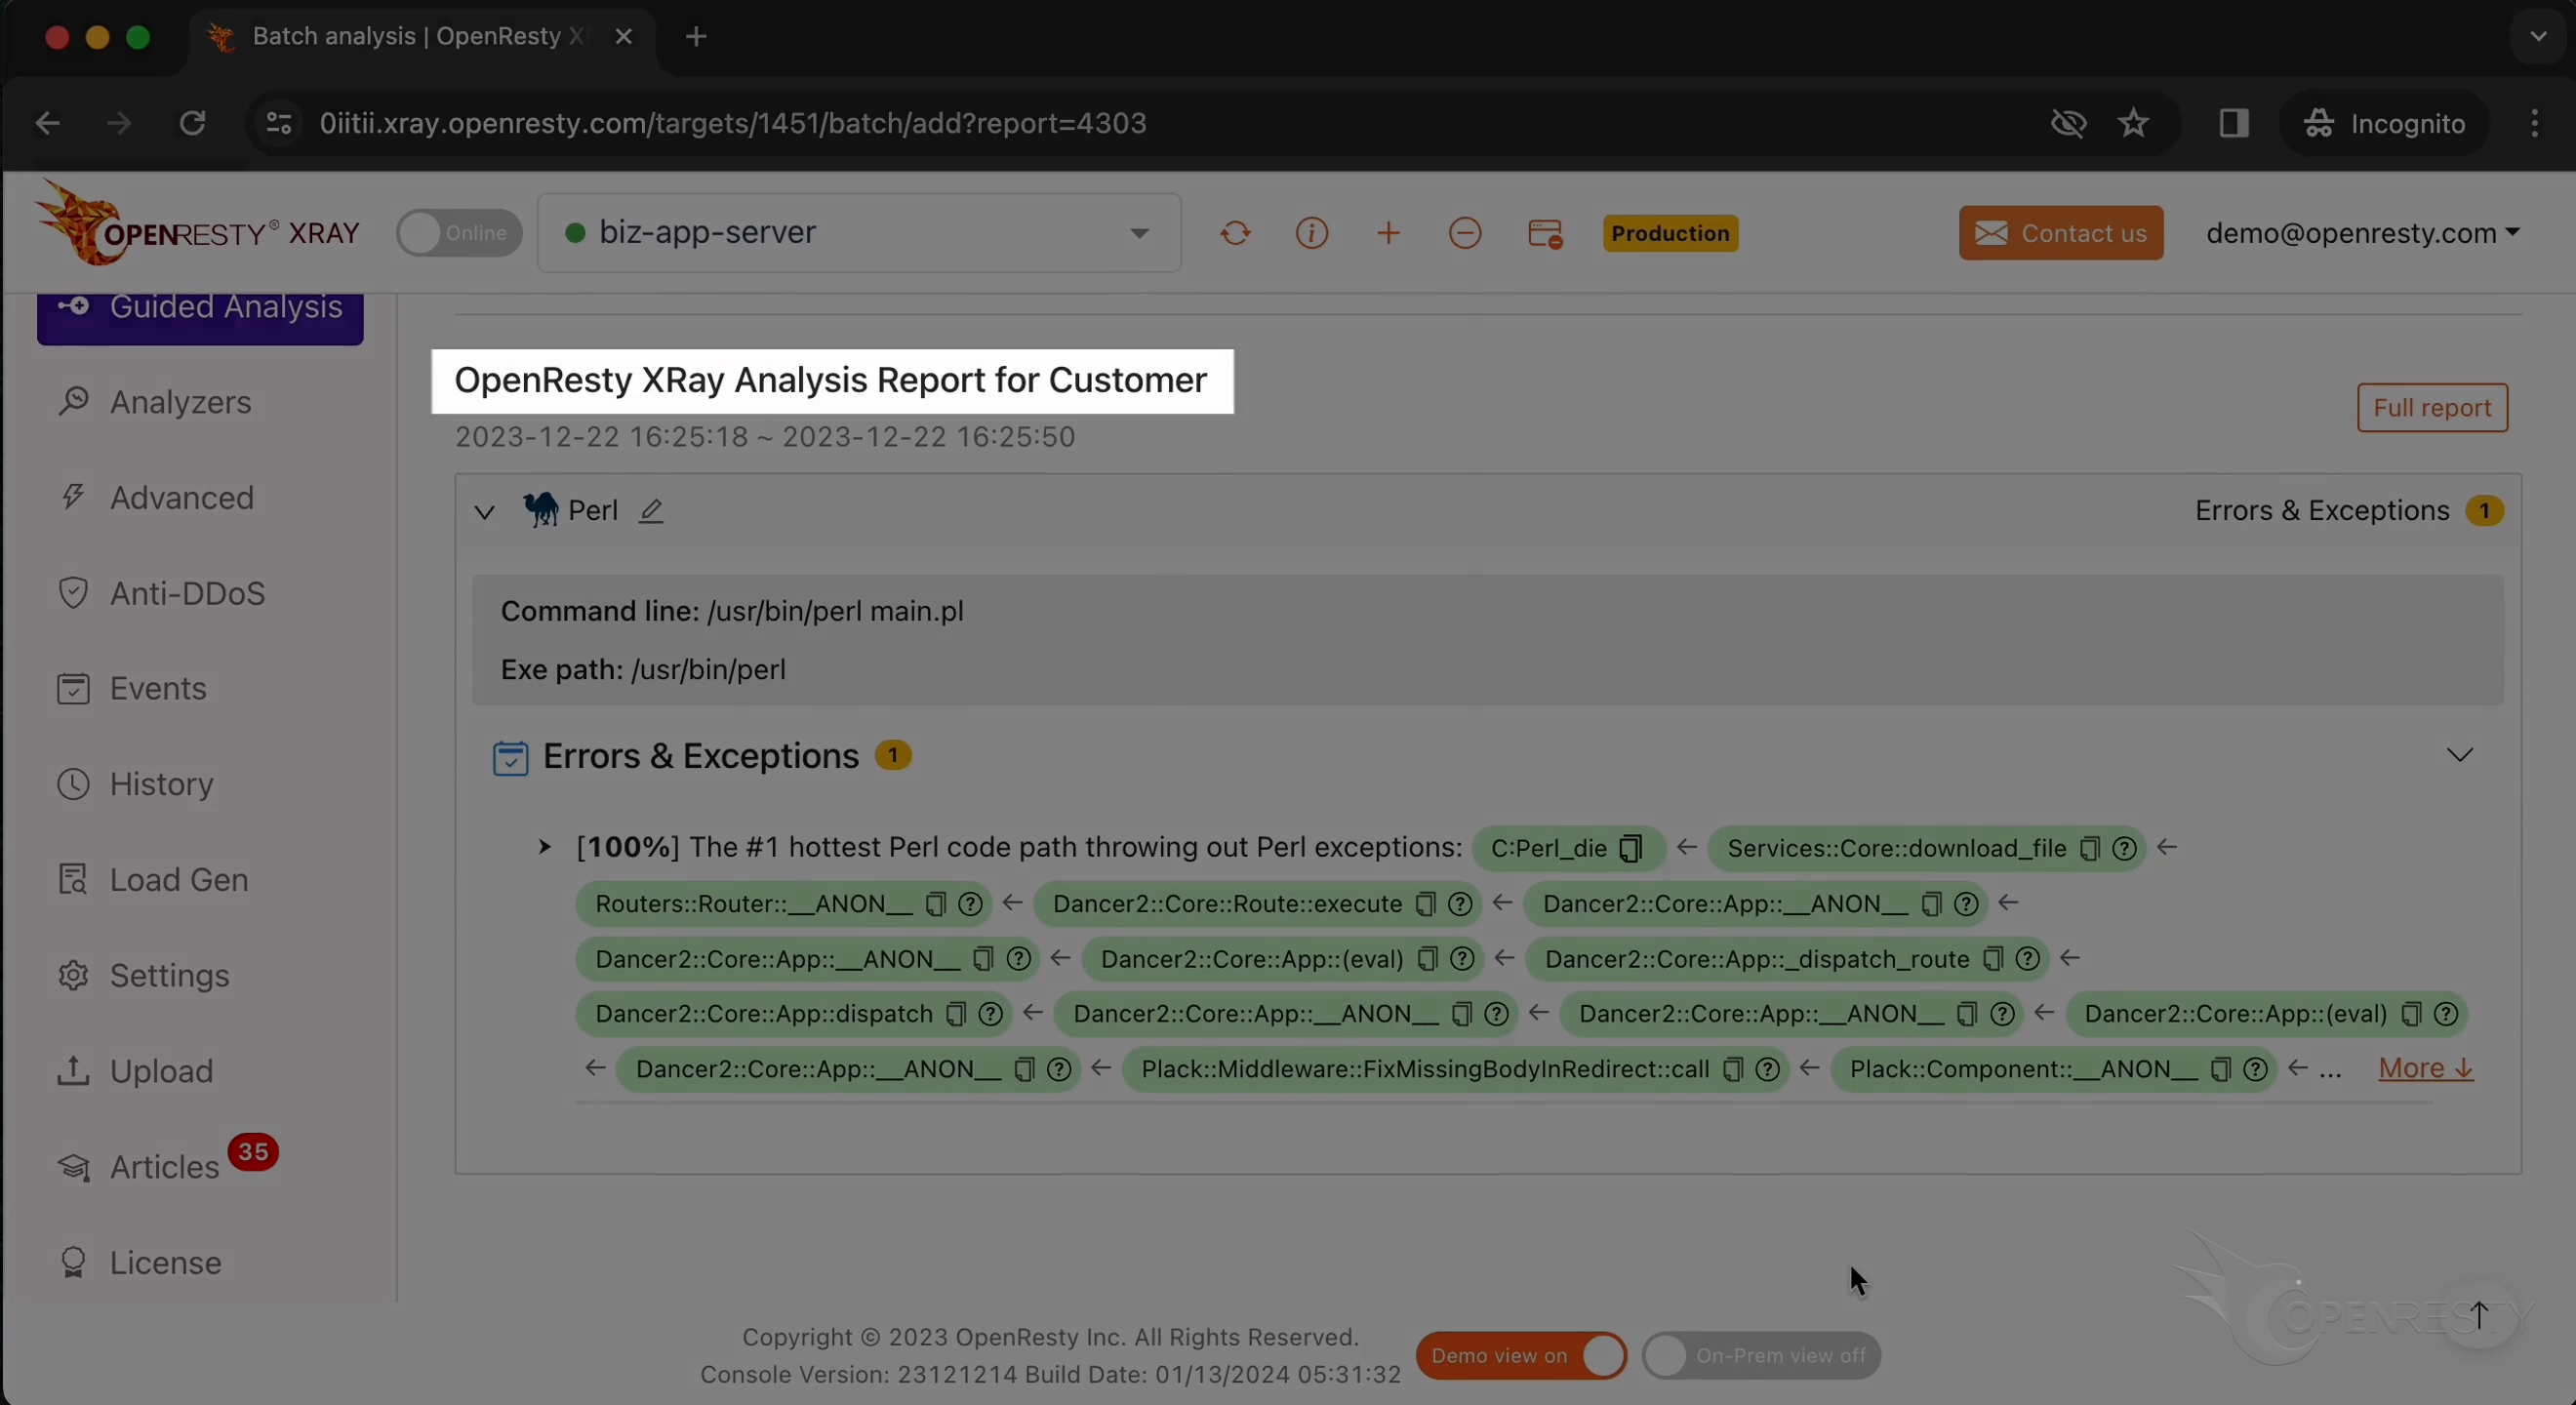
This is the type of problem we diagnose. It’s Errors & Exceptions.
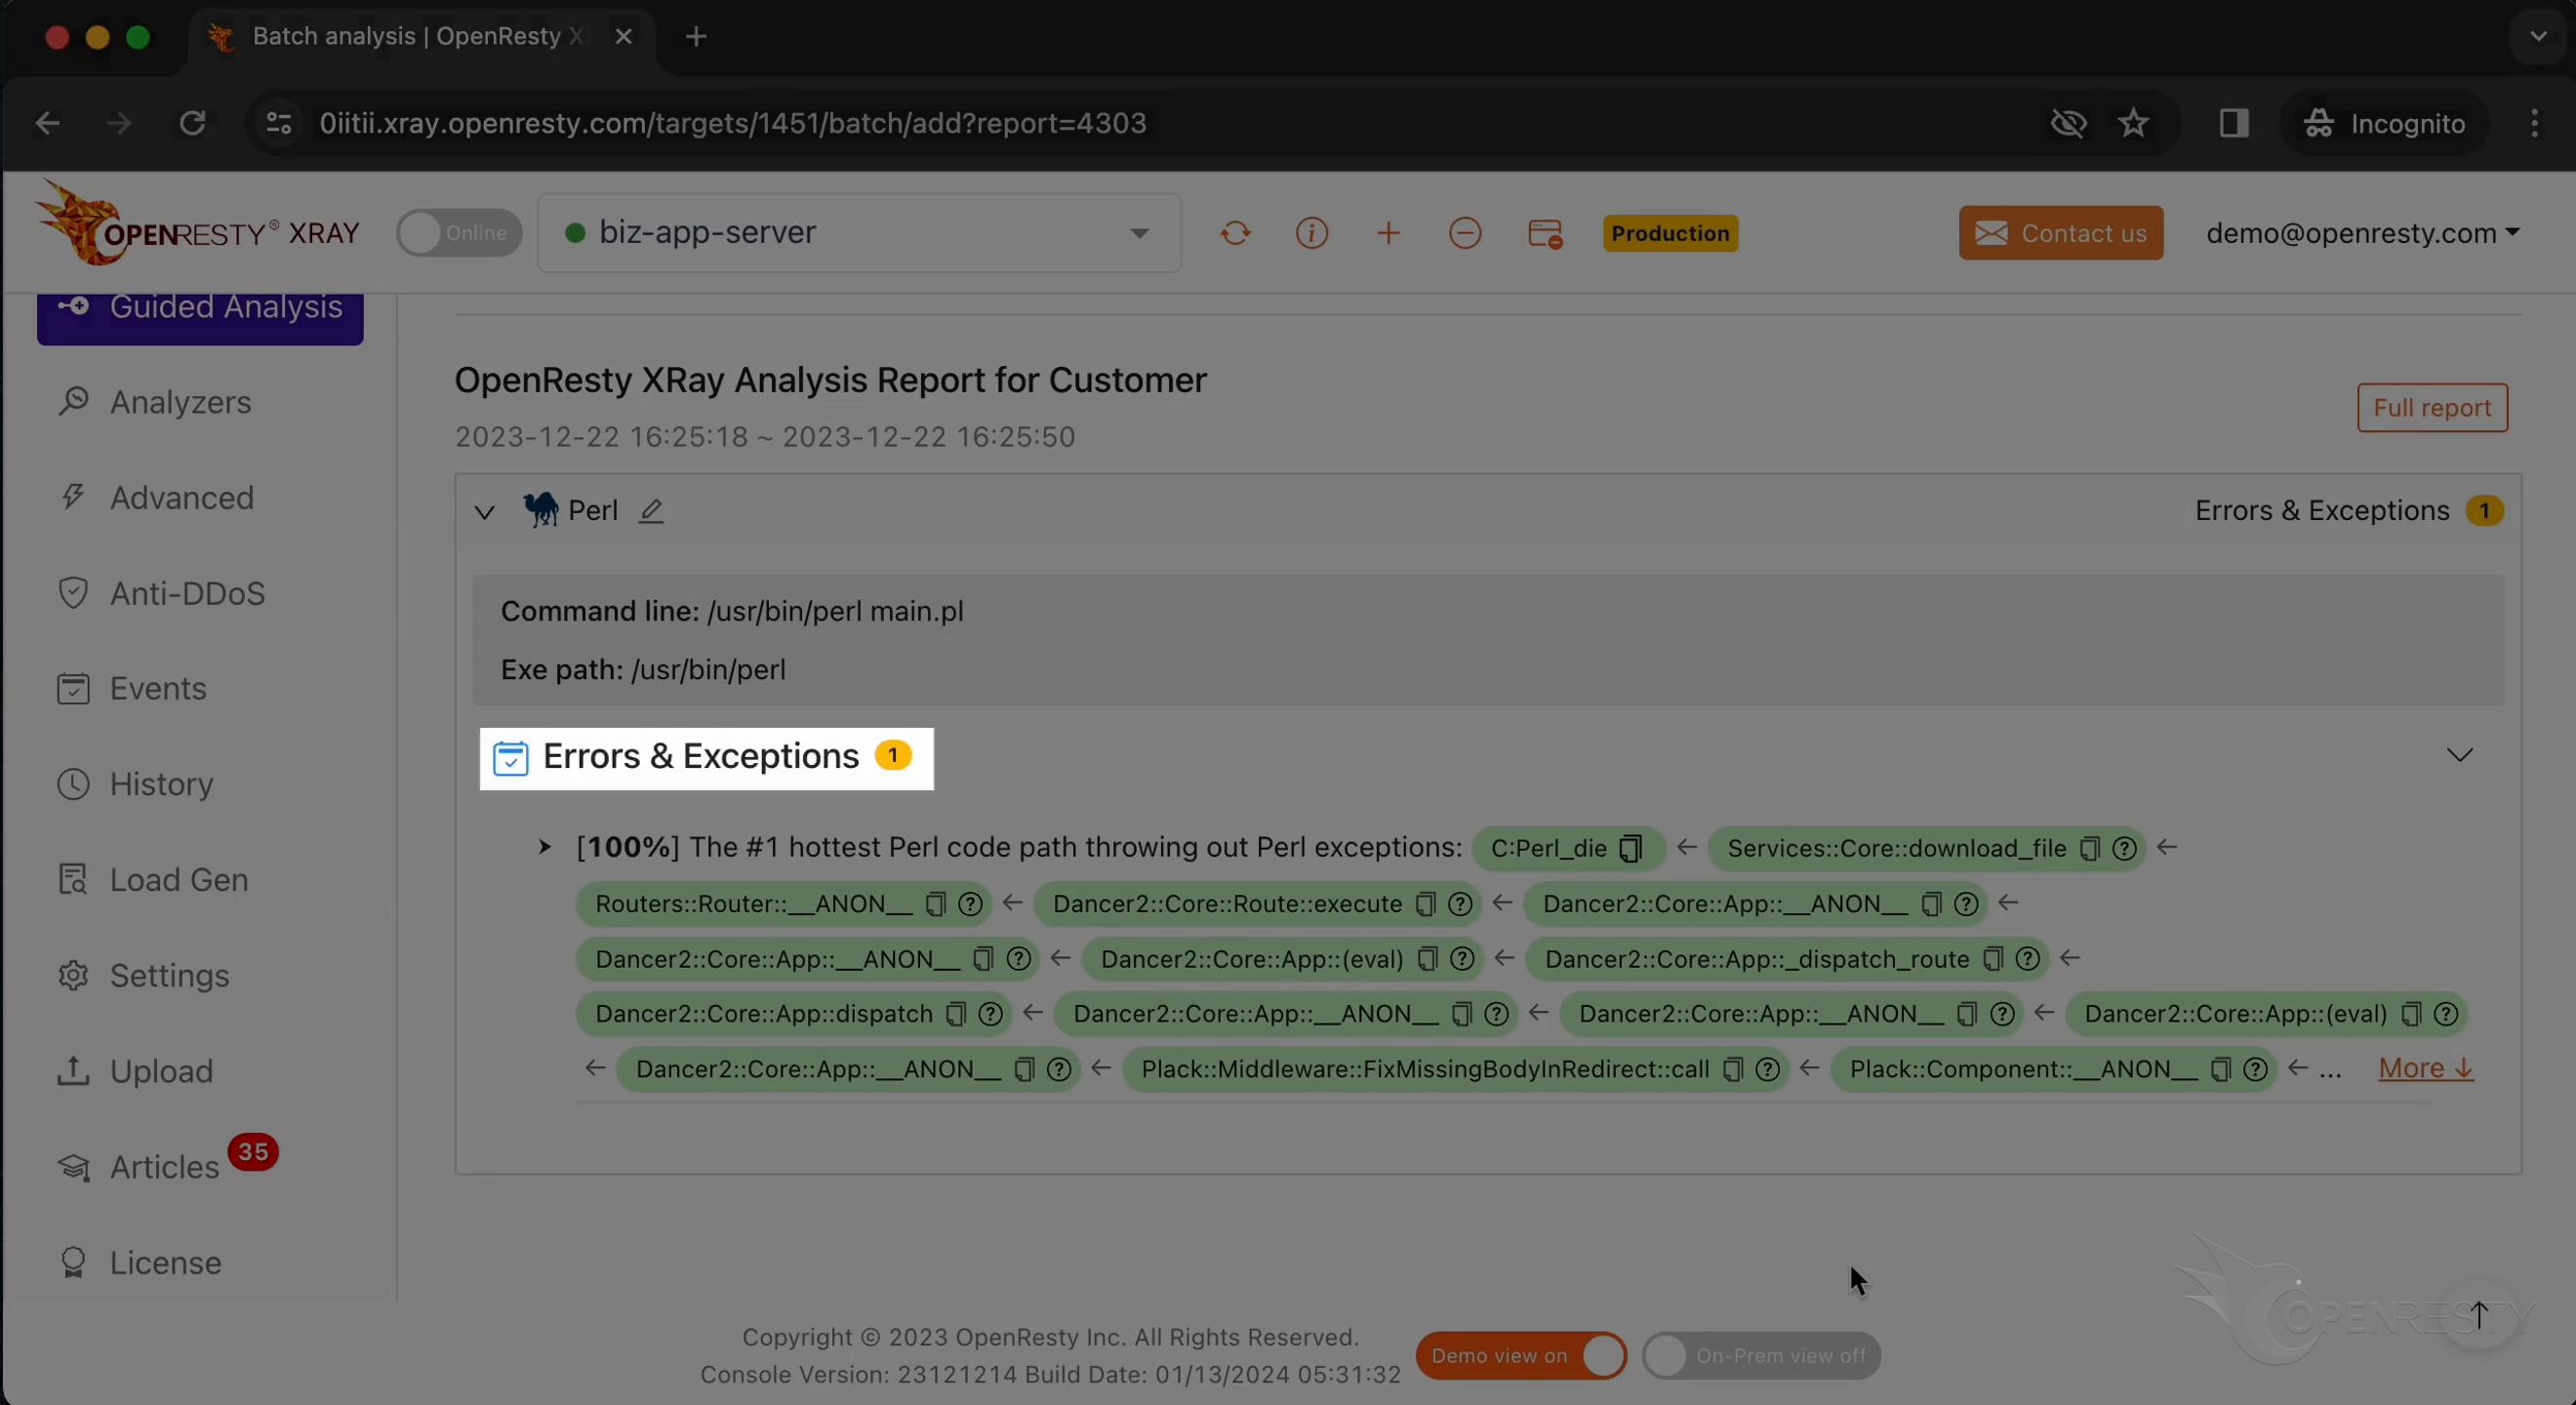
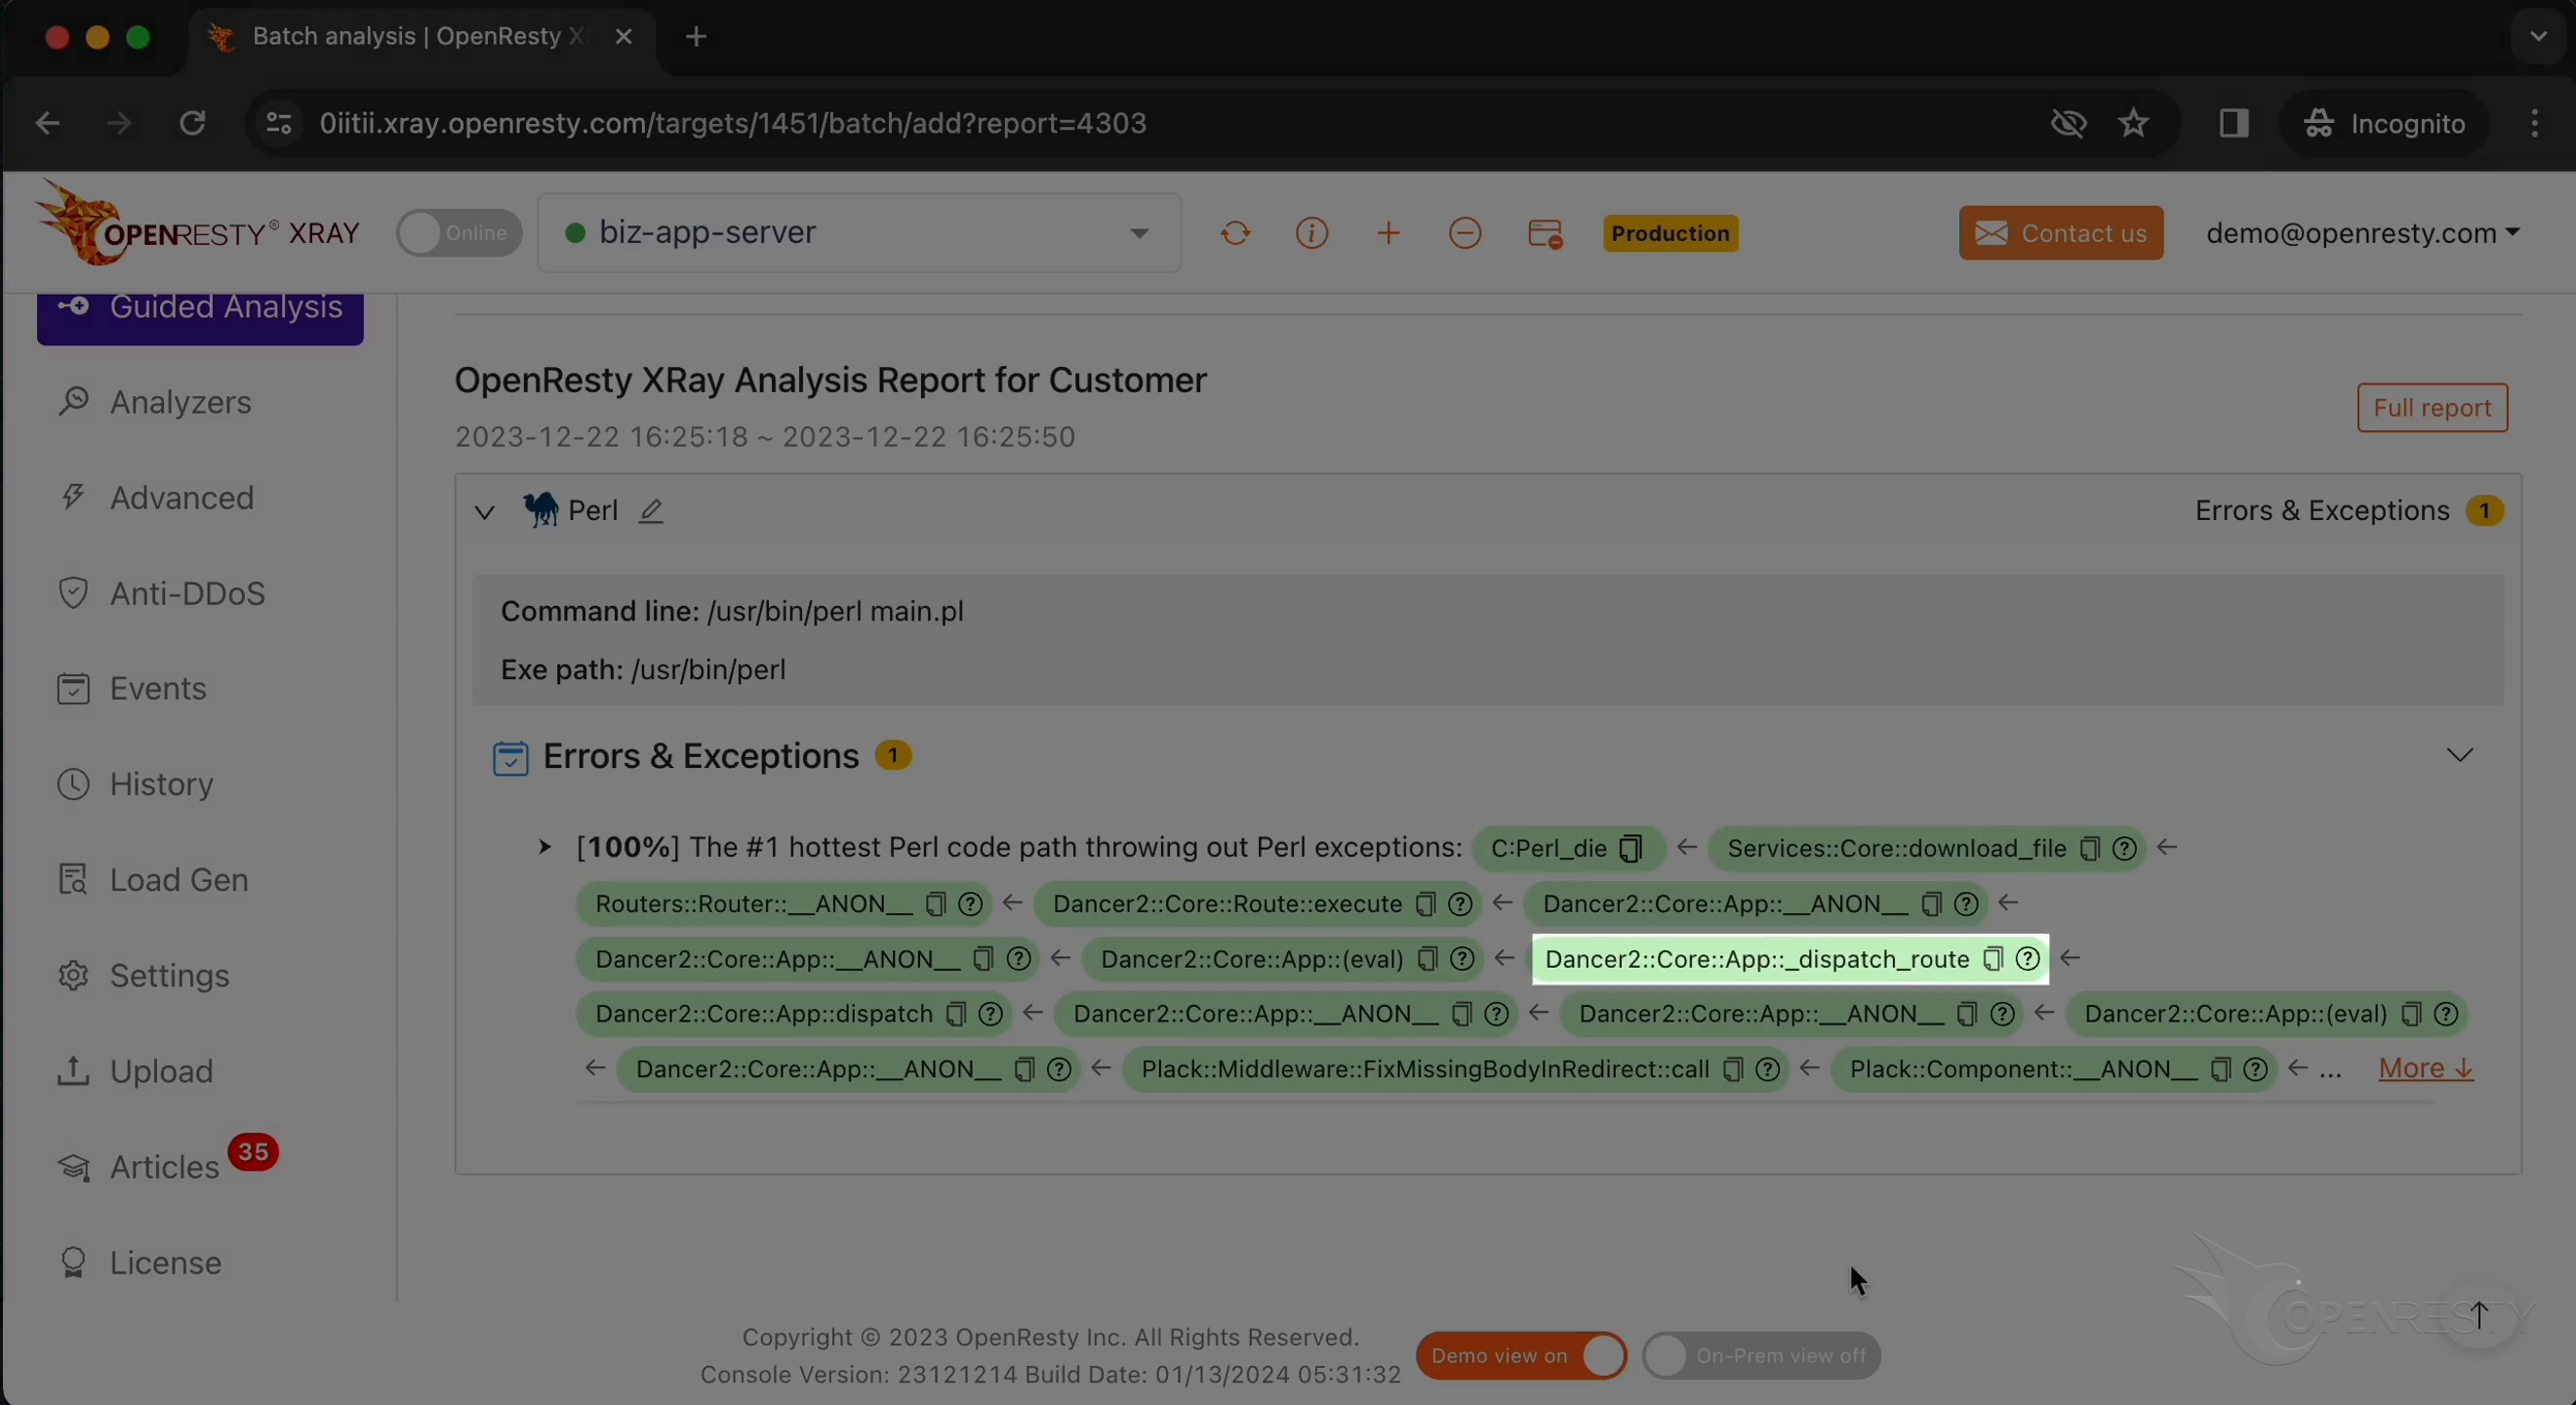
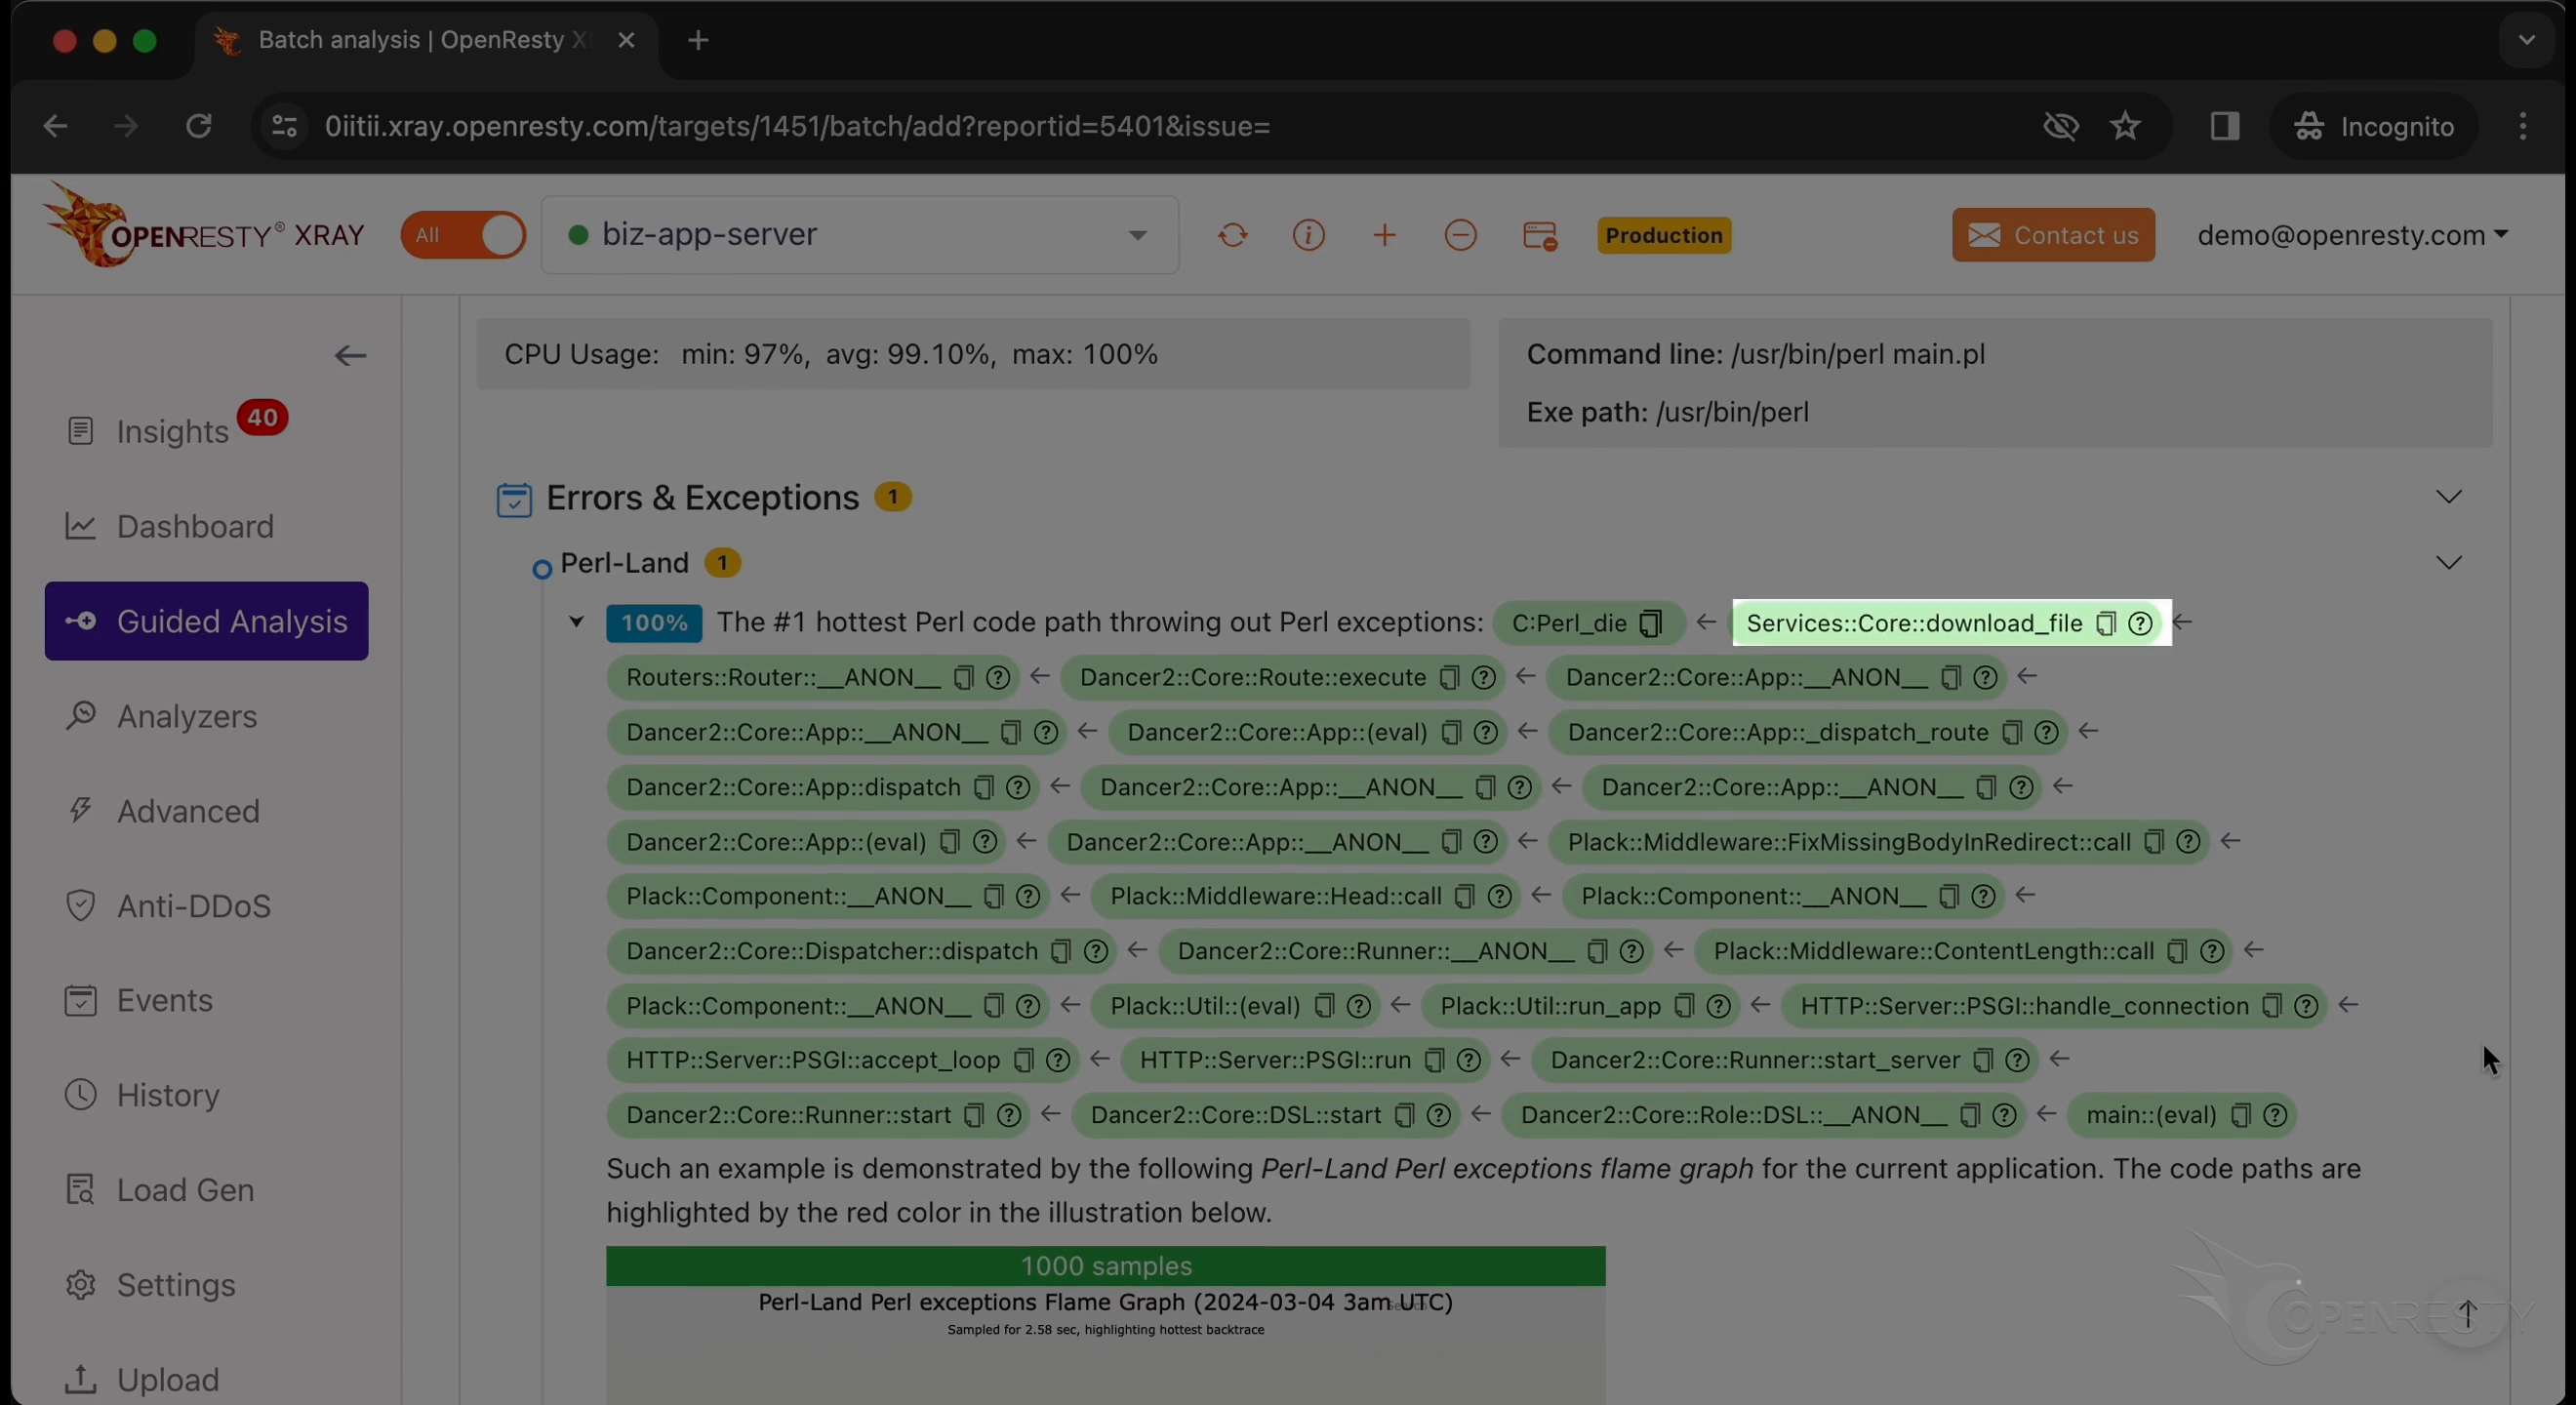
The report shows the code path that throws out the most Perl exceptions.
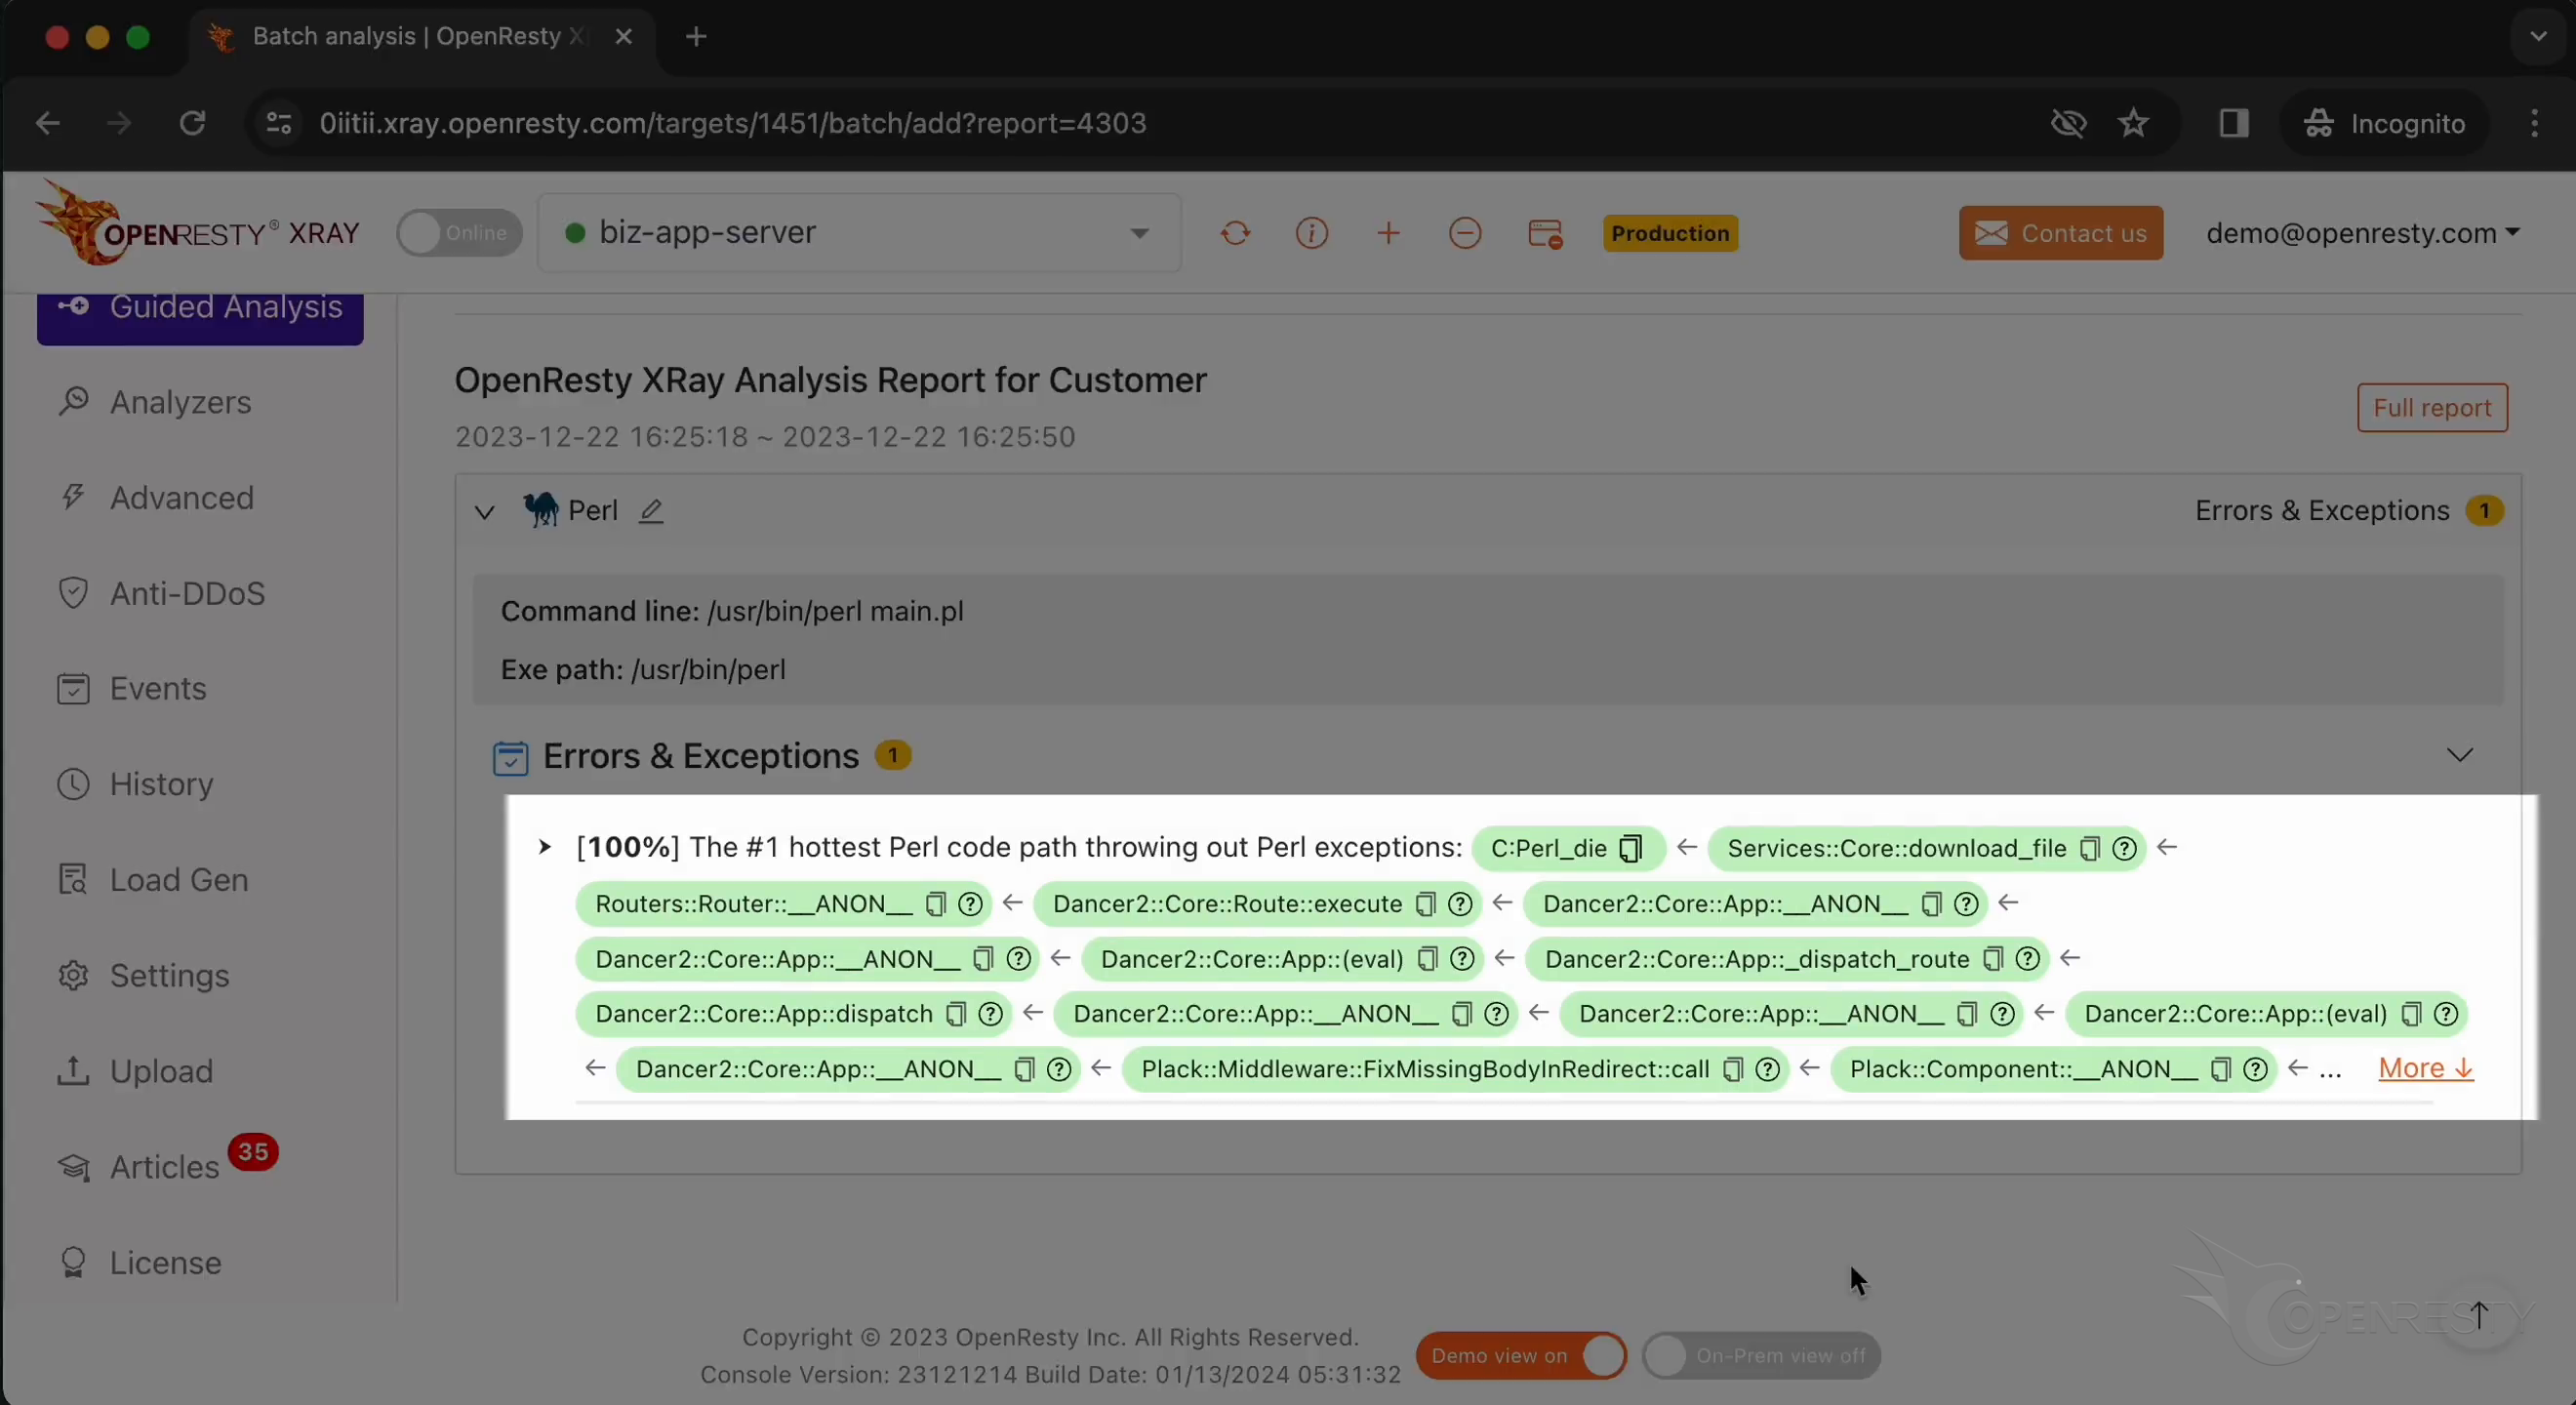
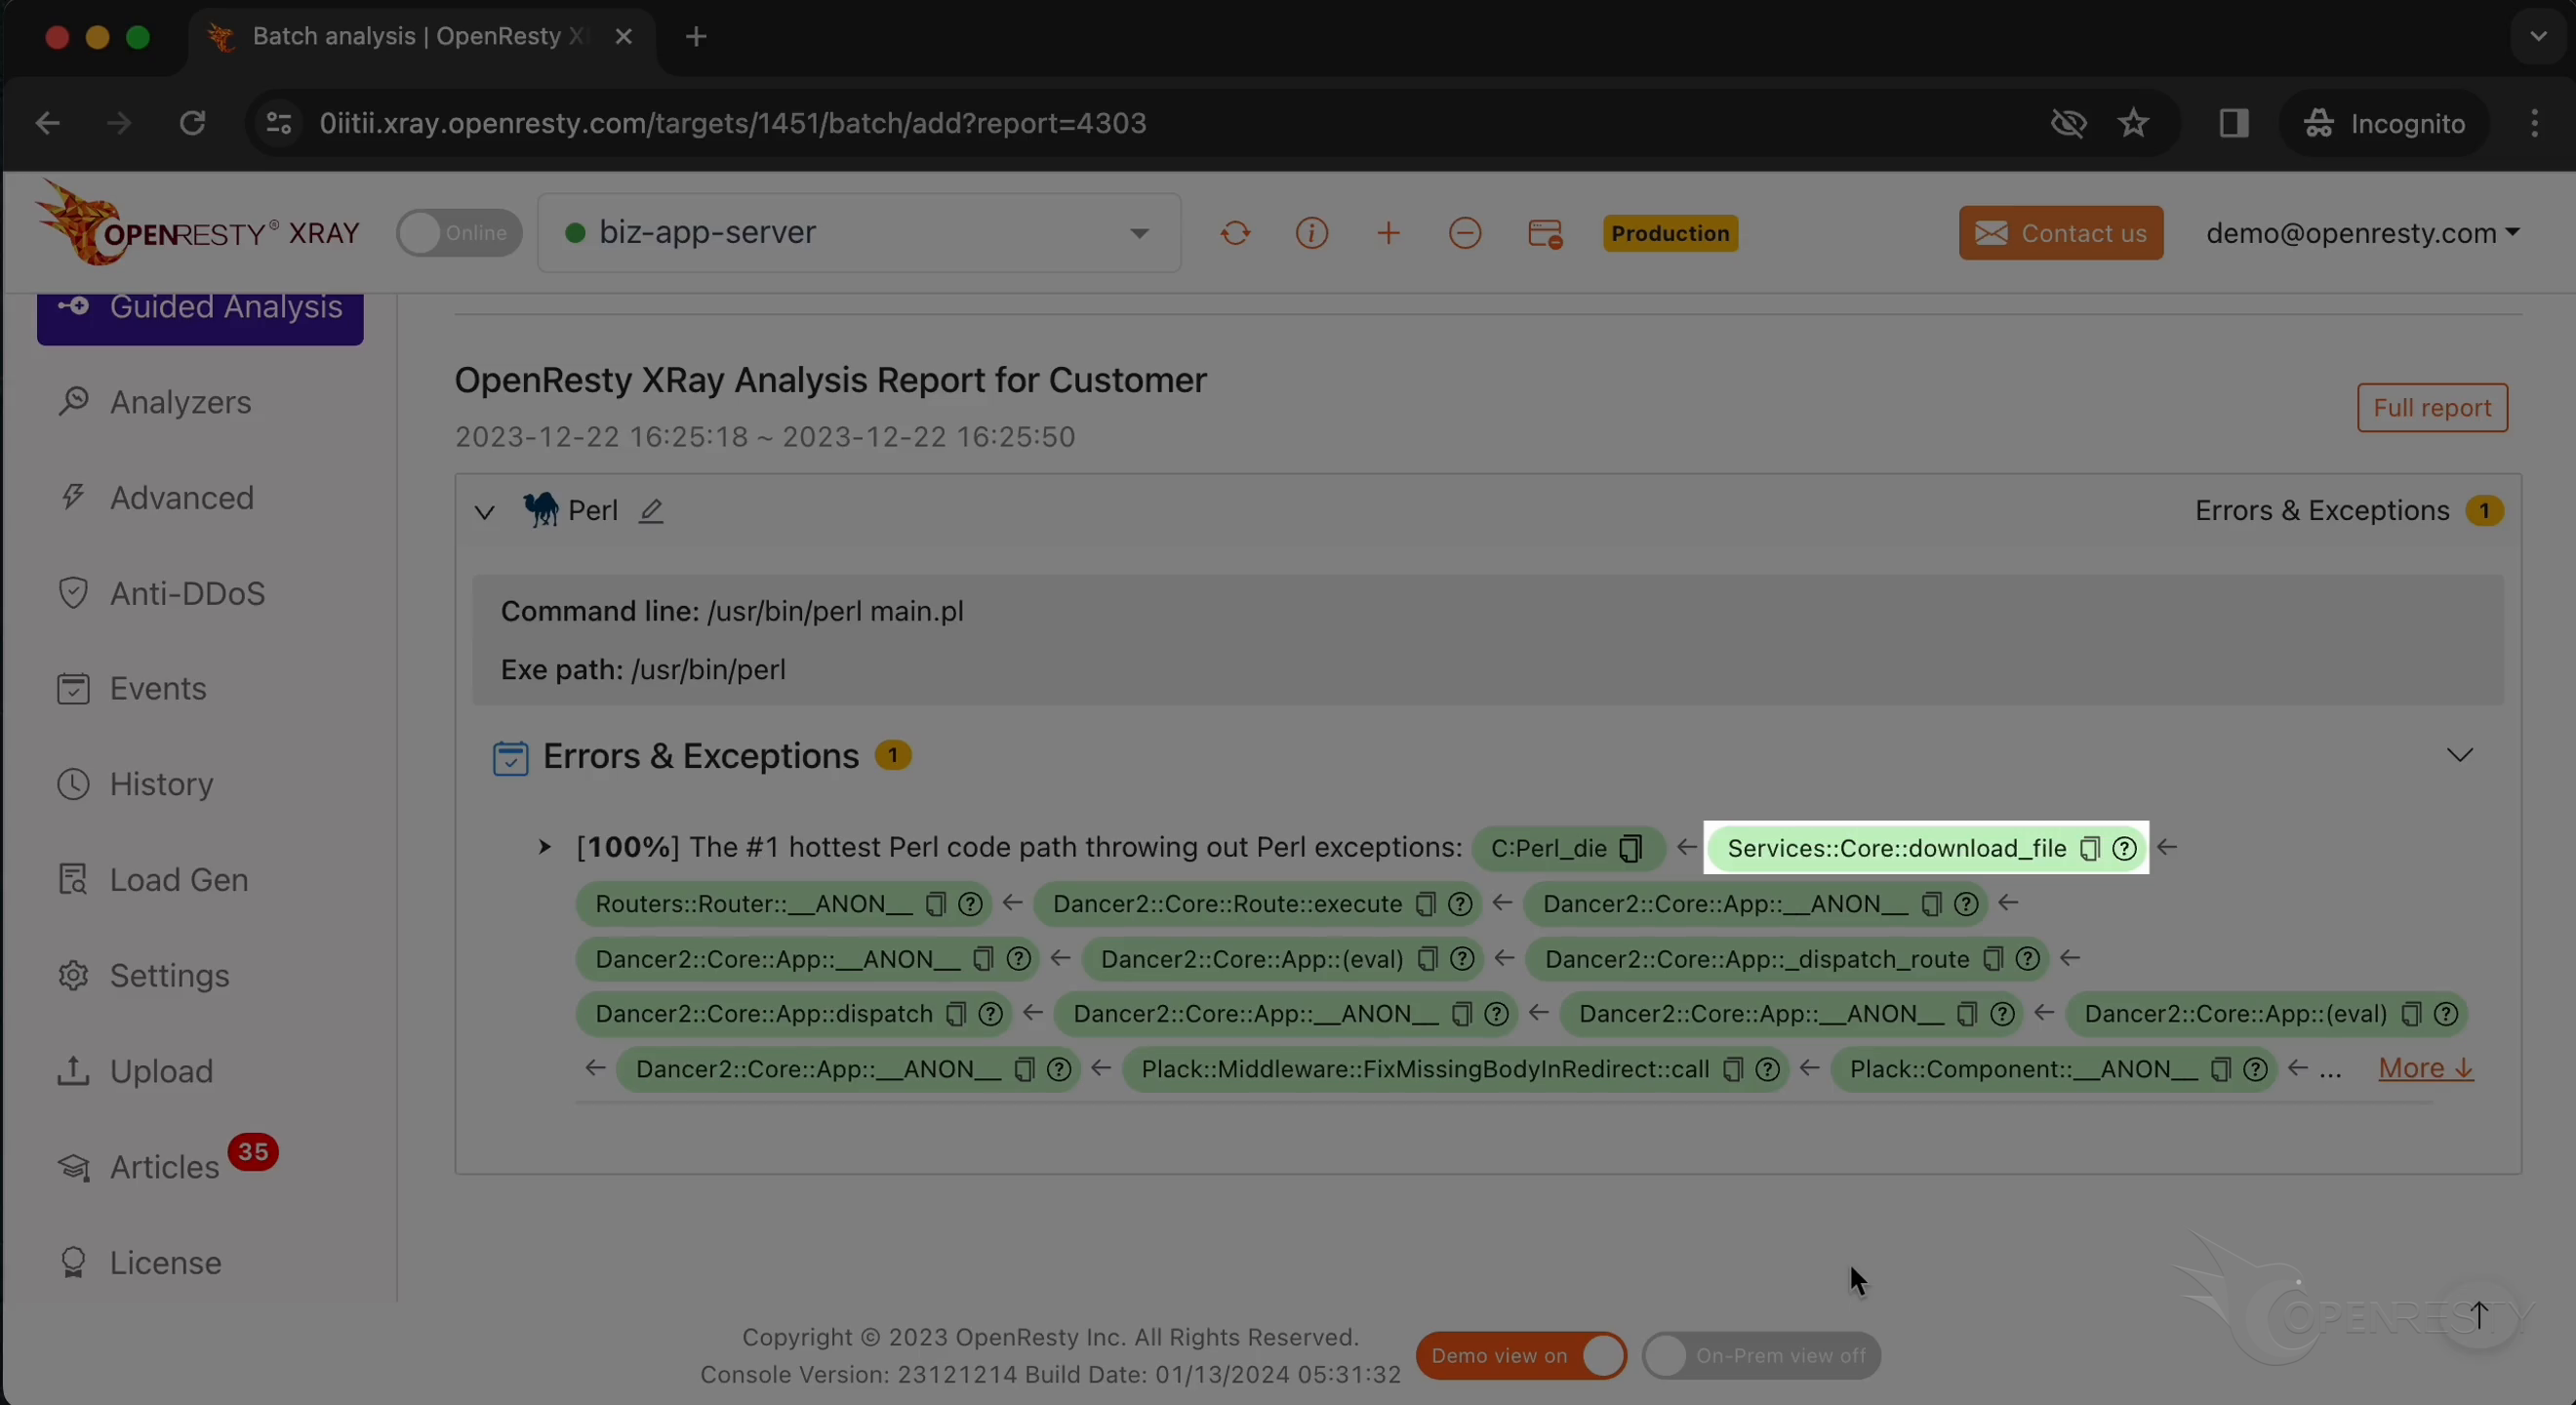
Perl_die is a function inside the Perl VM for throwing out exceptions.
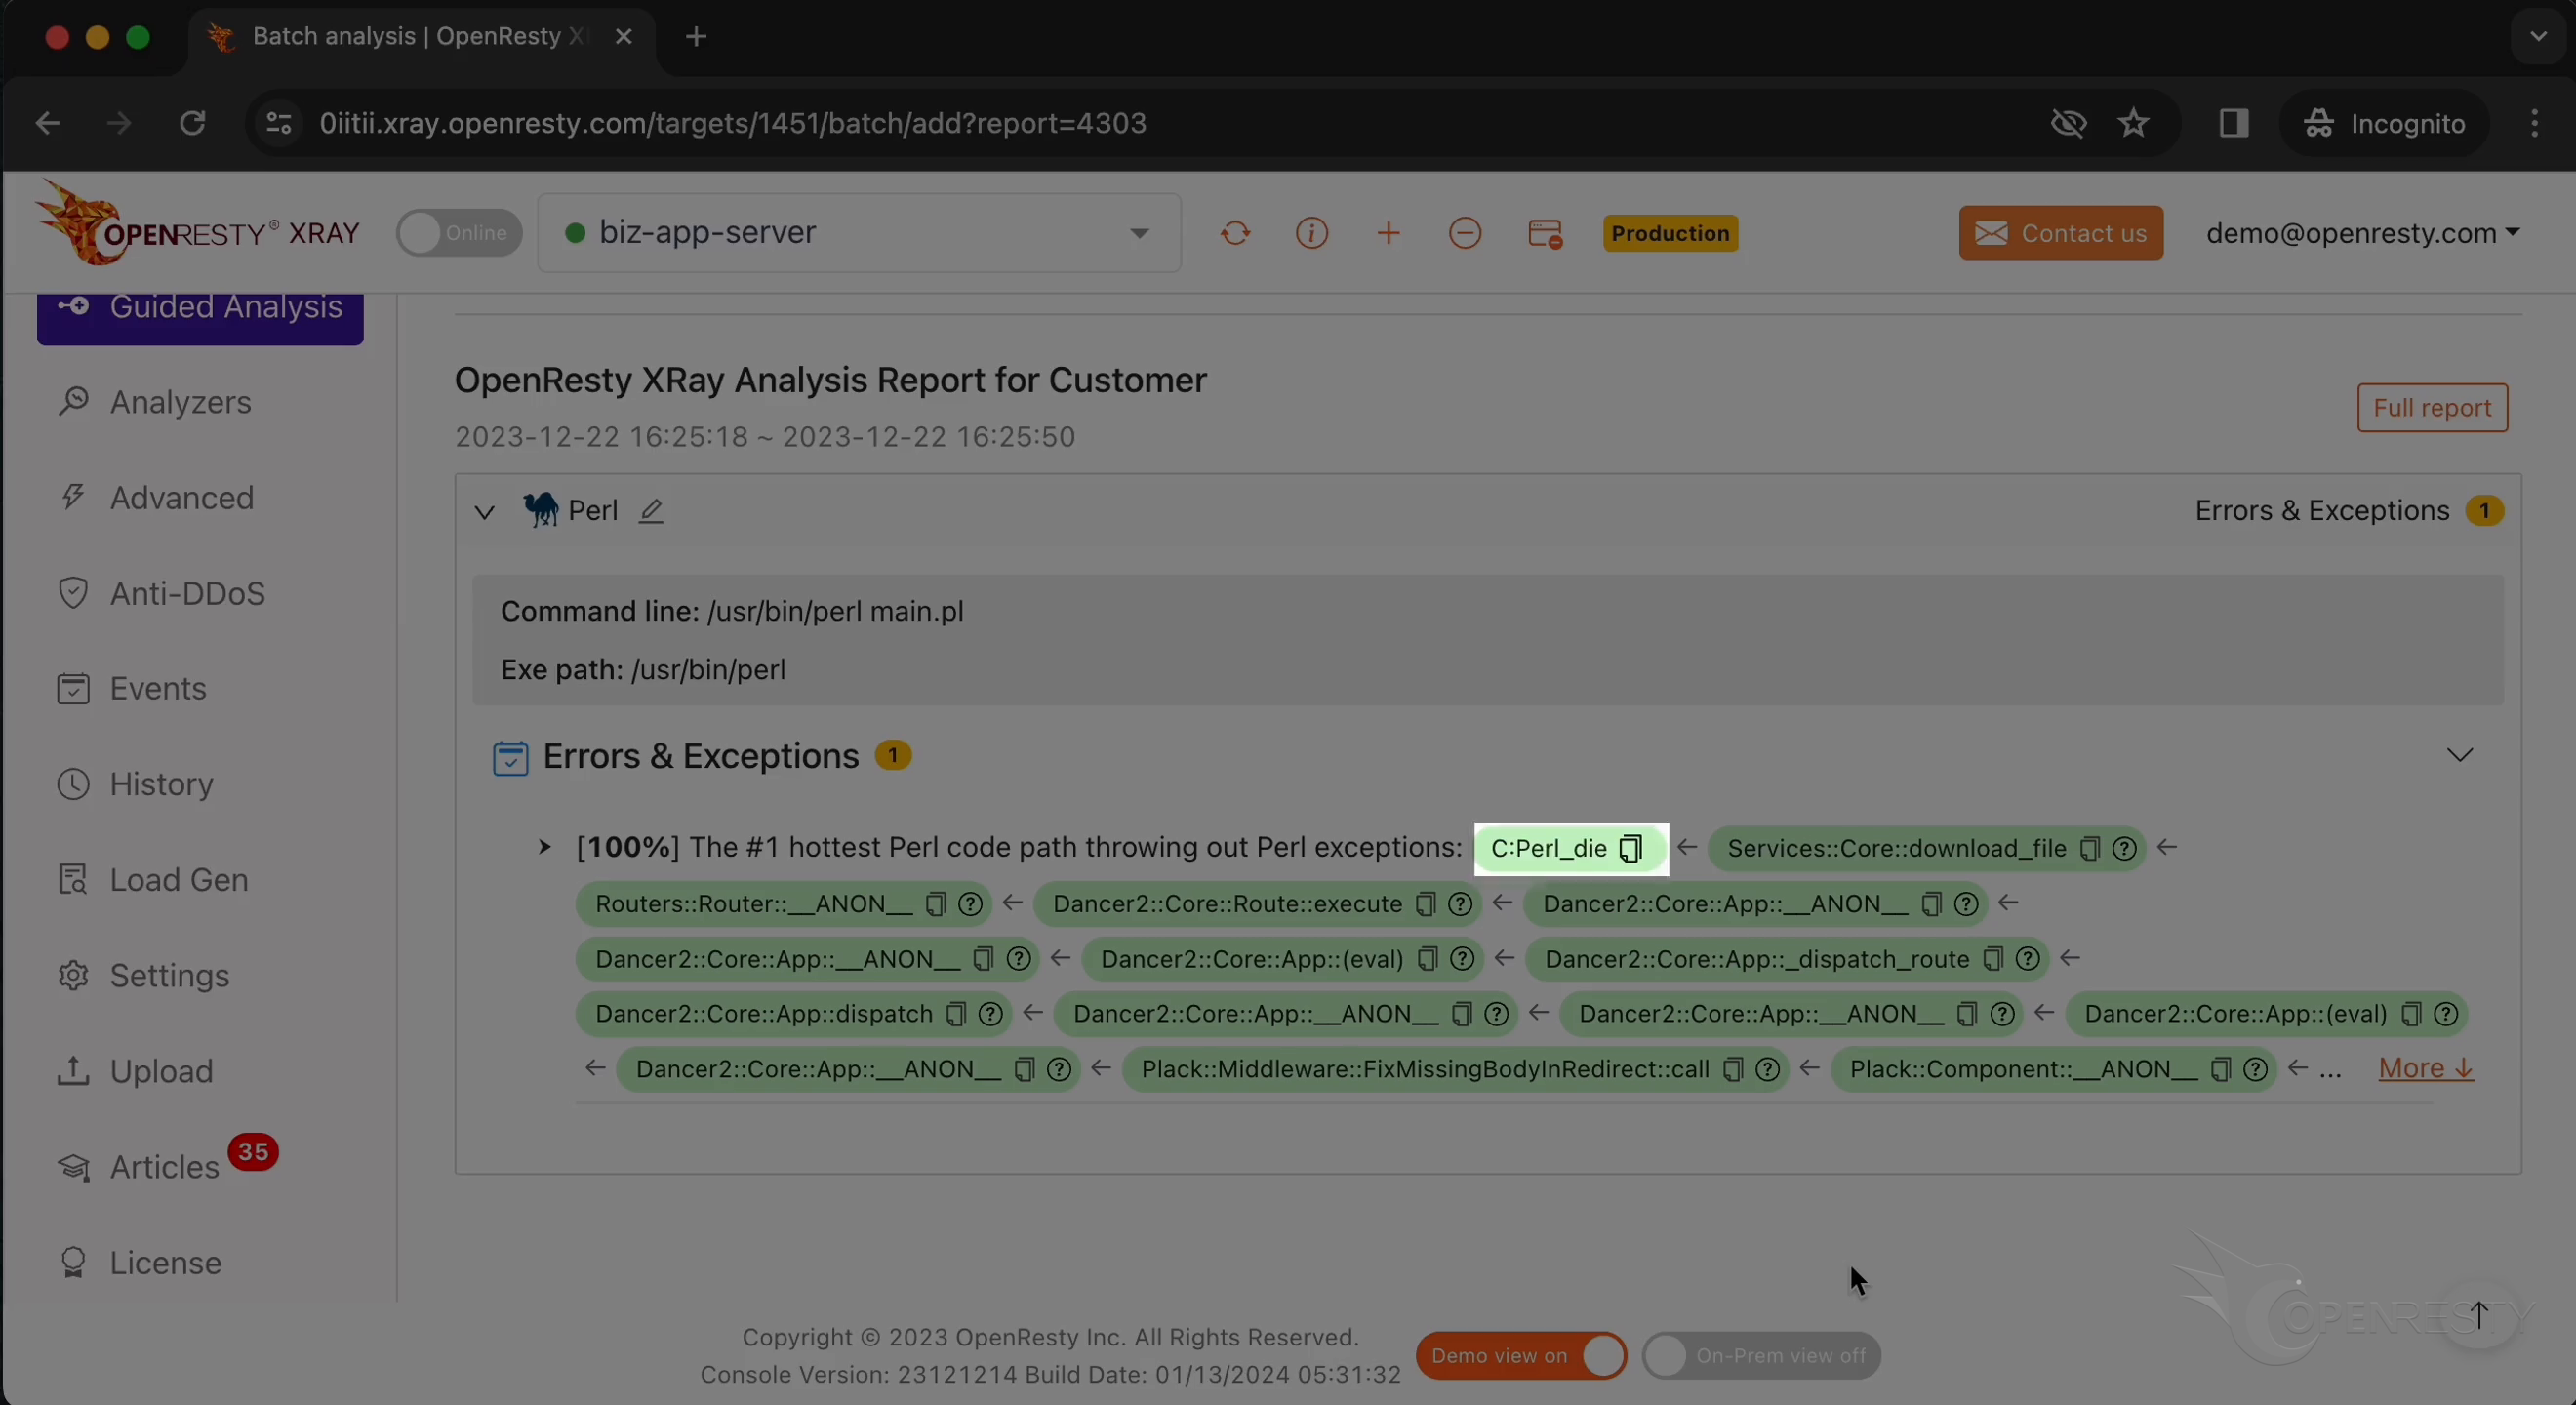
The download_file function under the Core module is a function in the business code for downloading files.
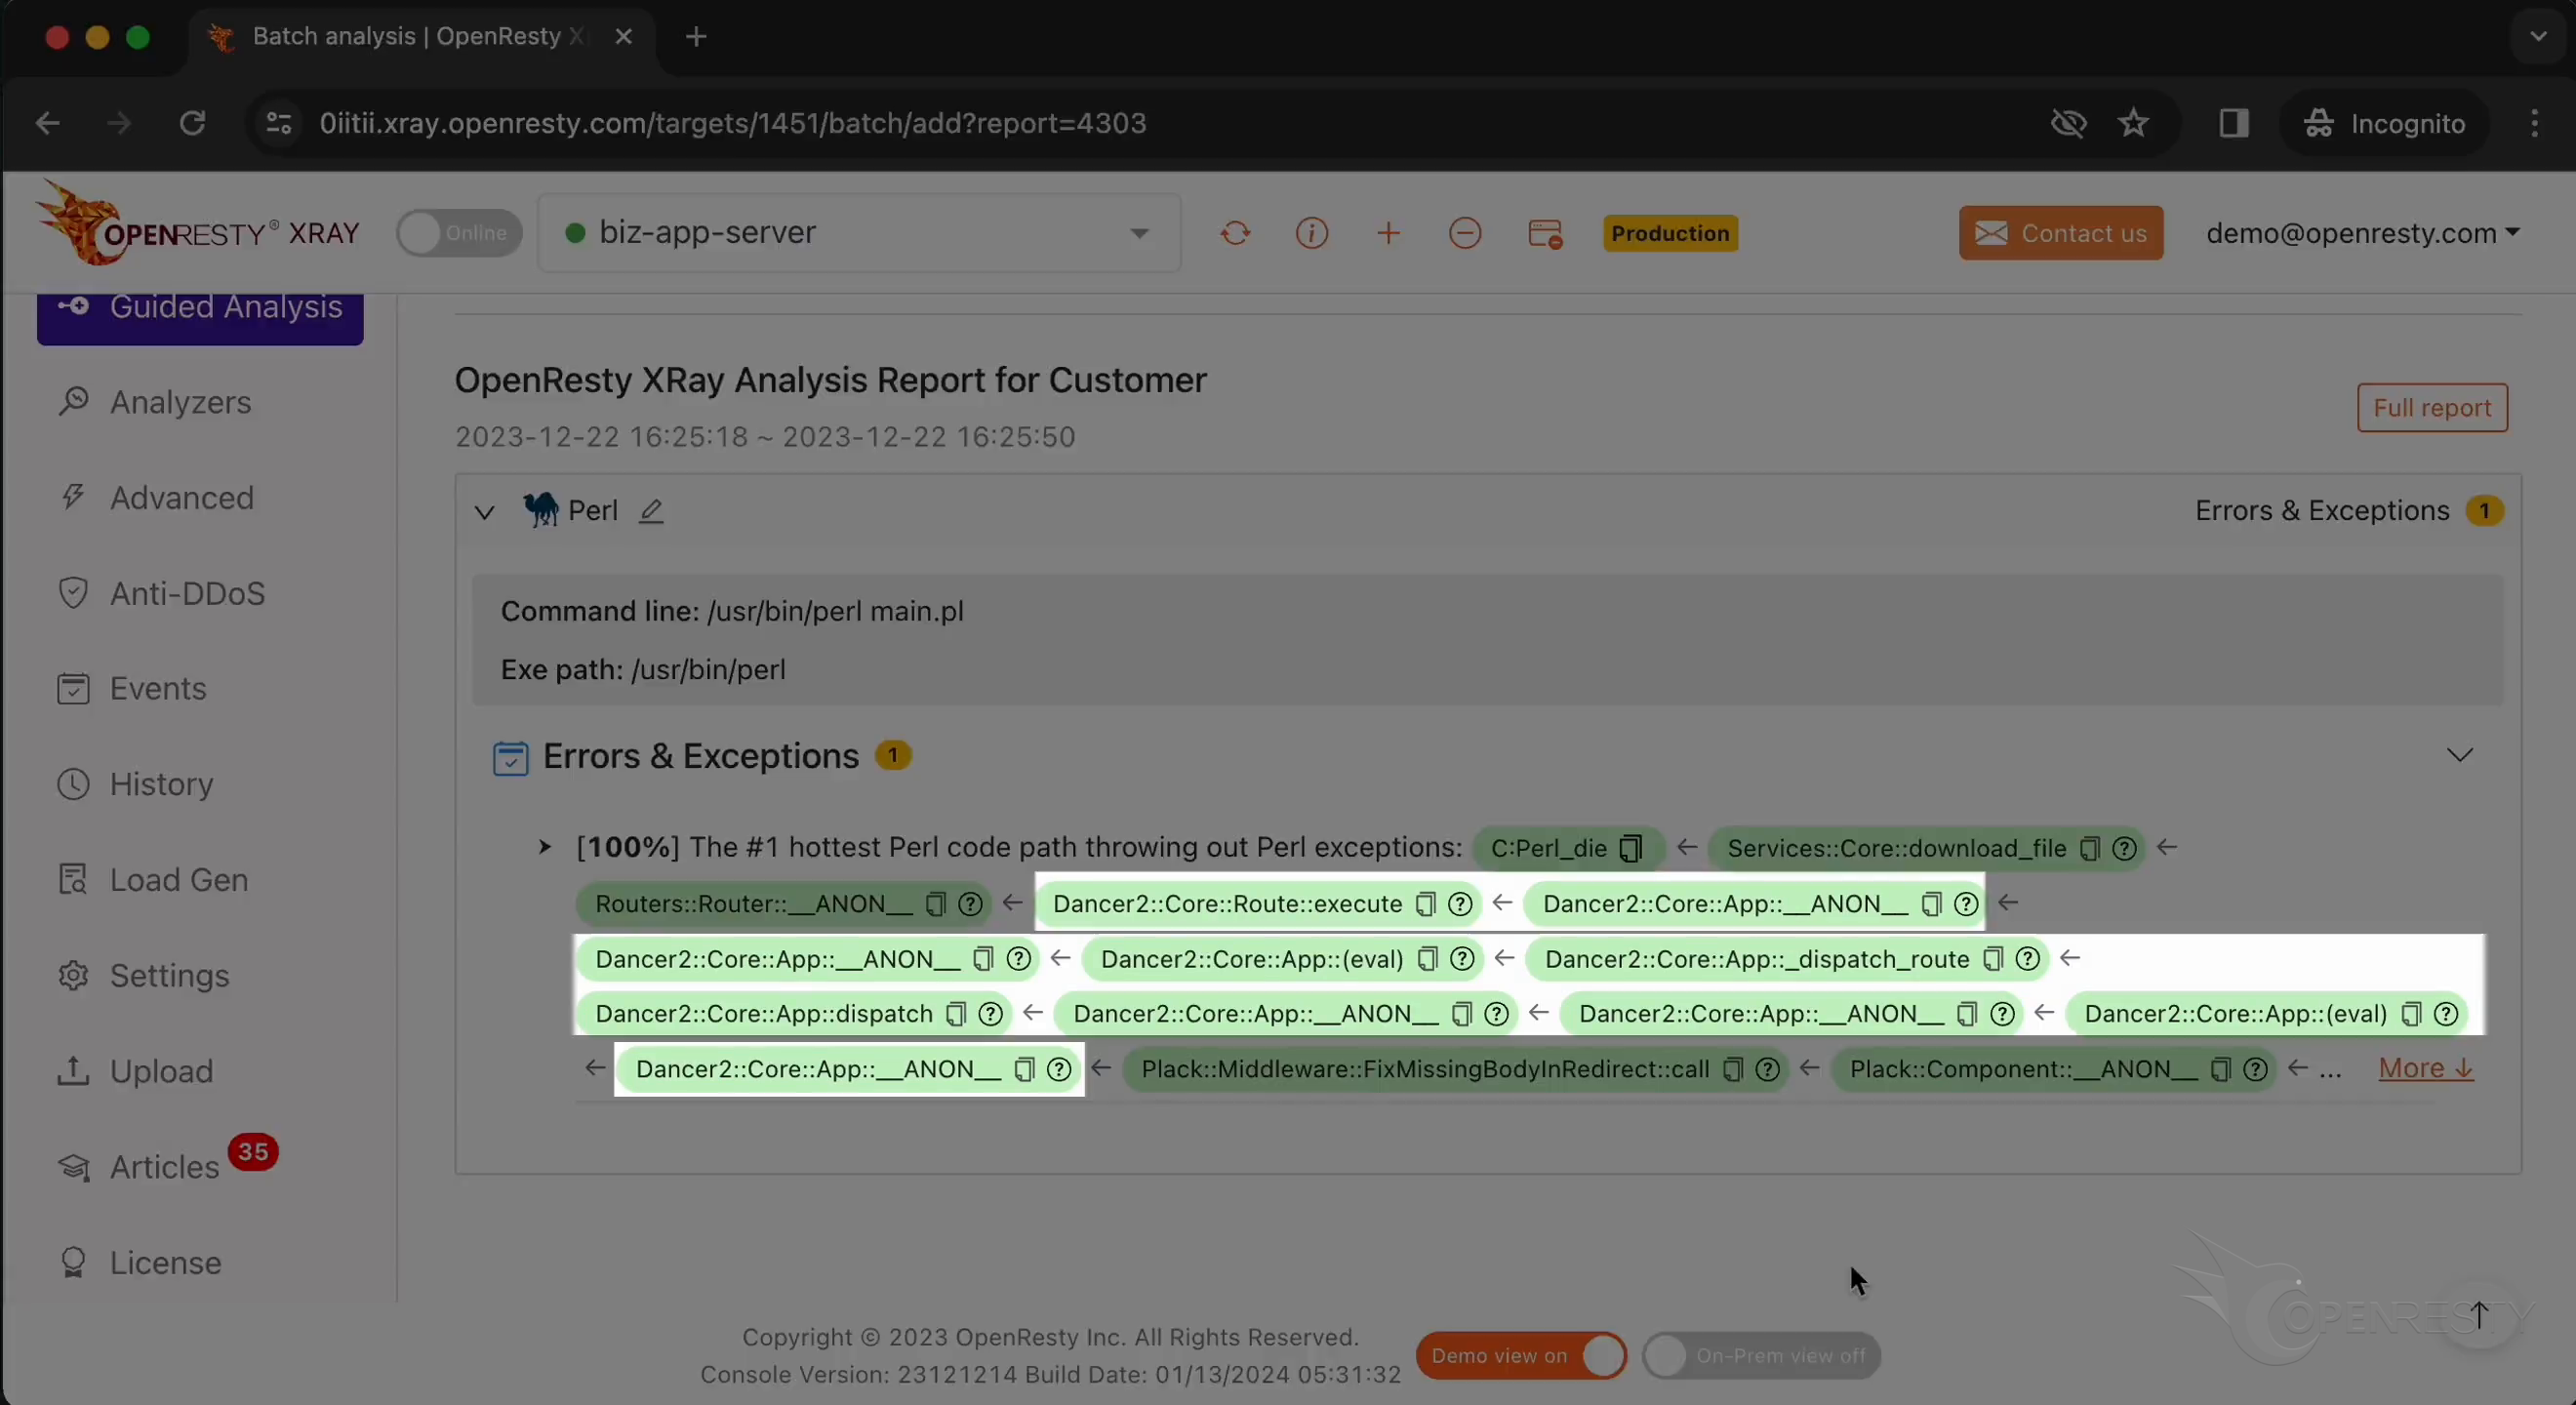
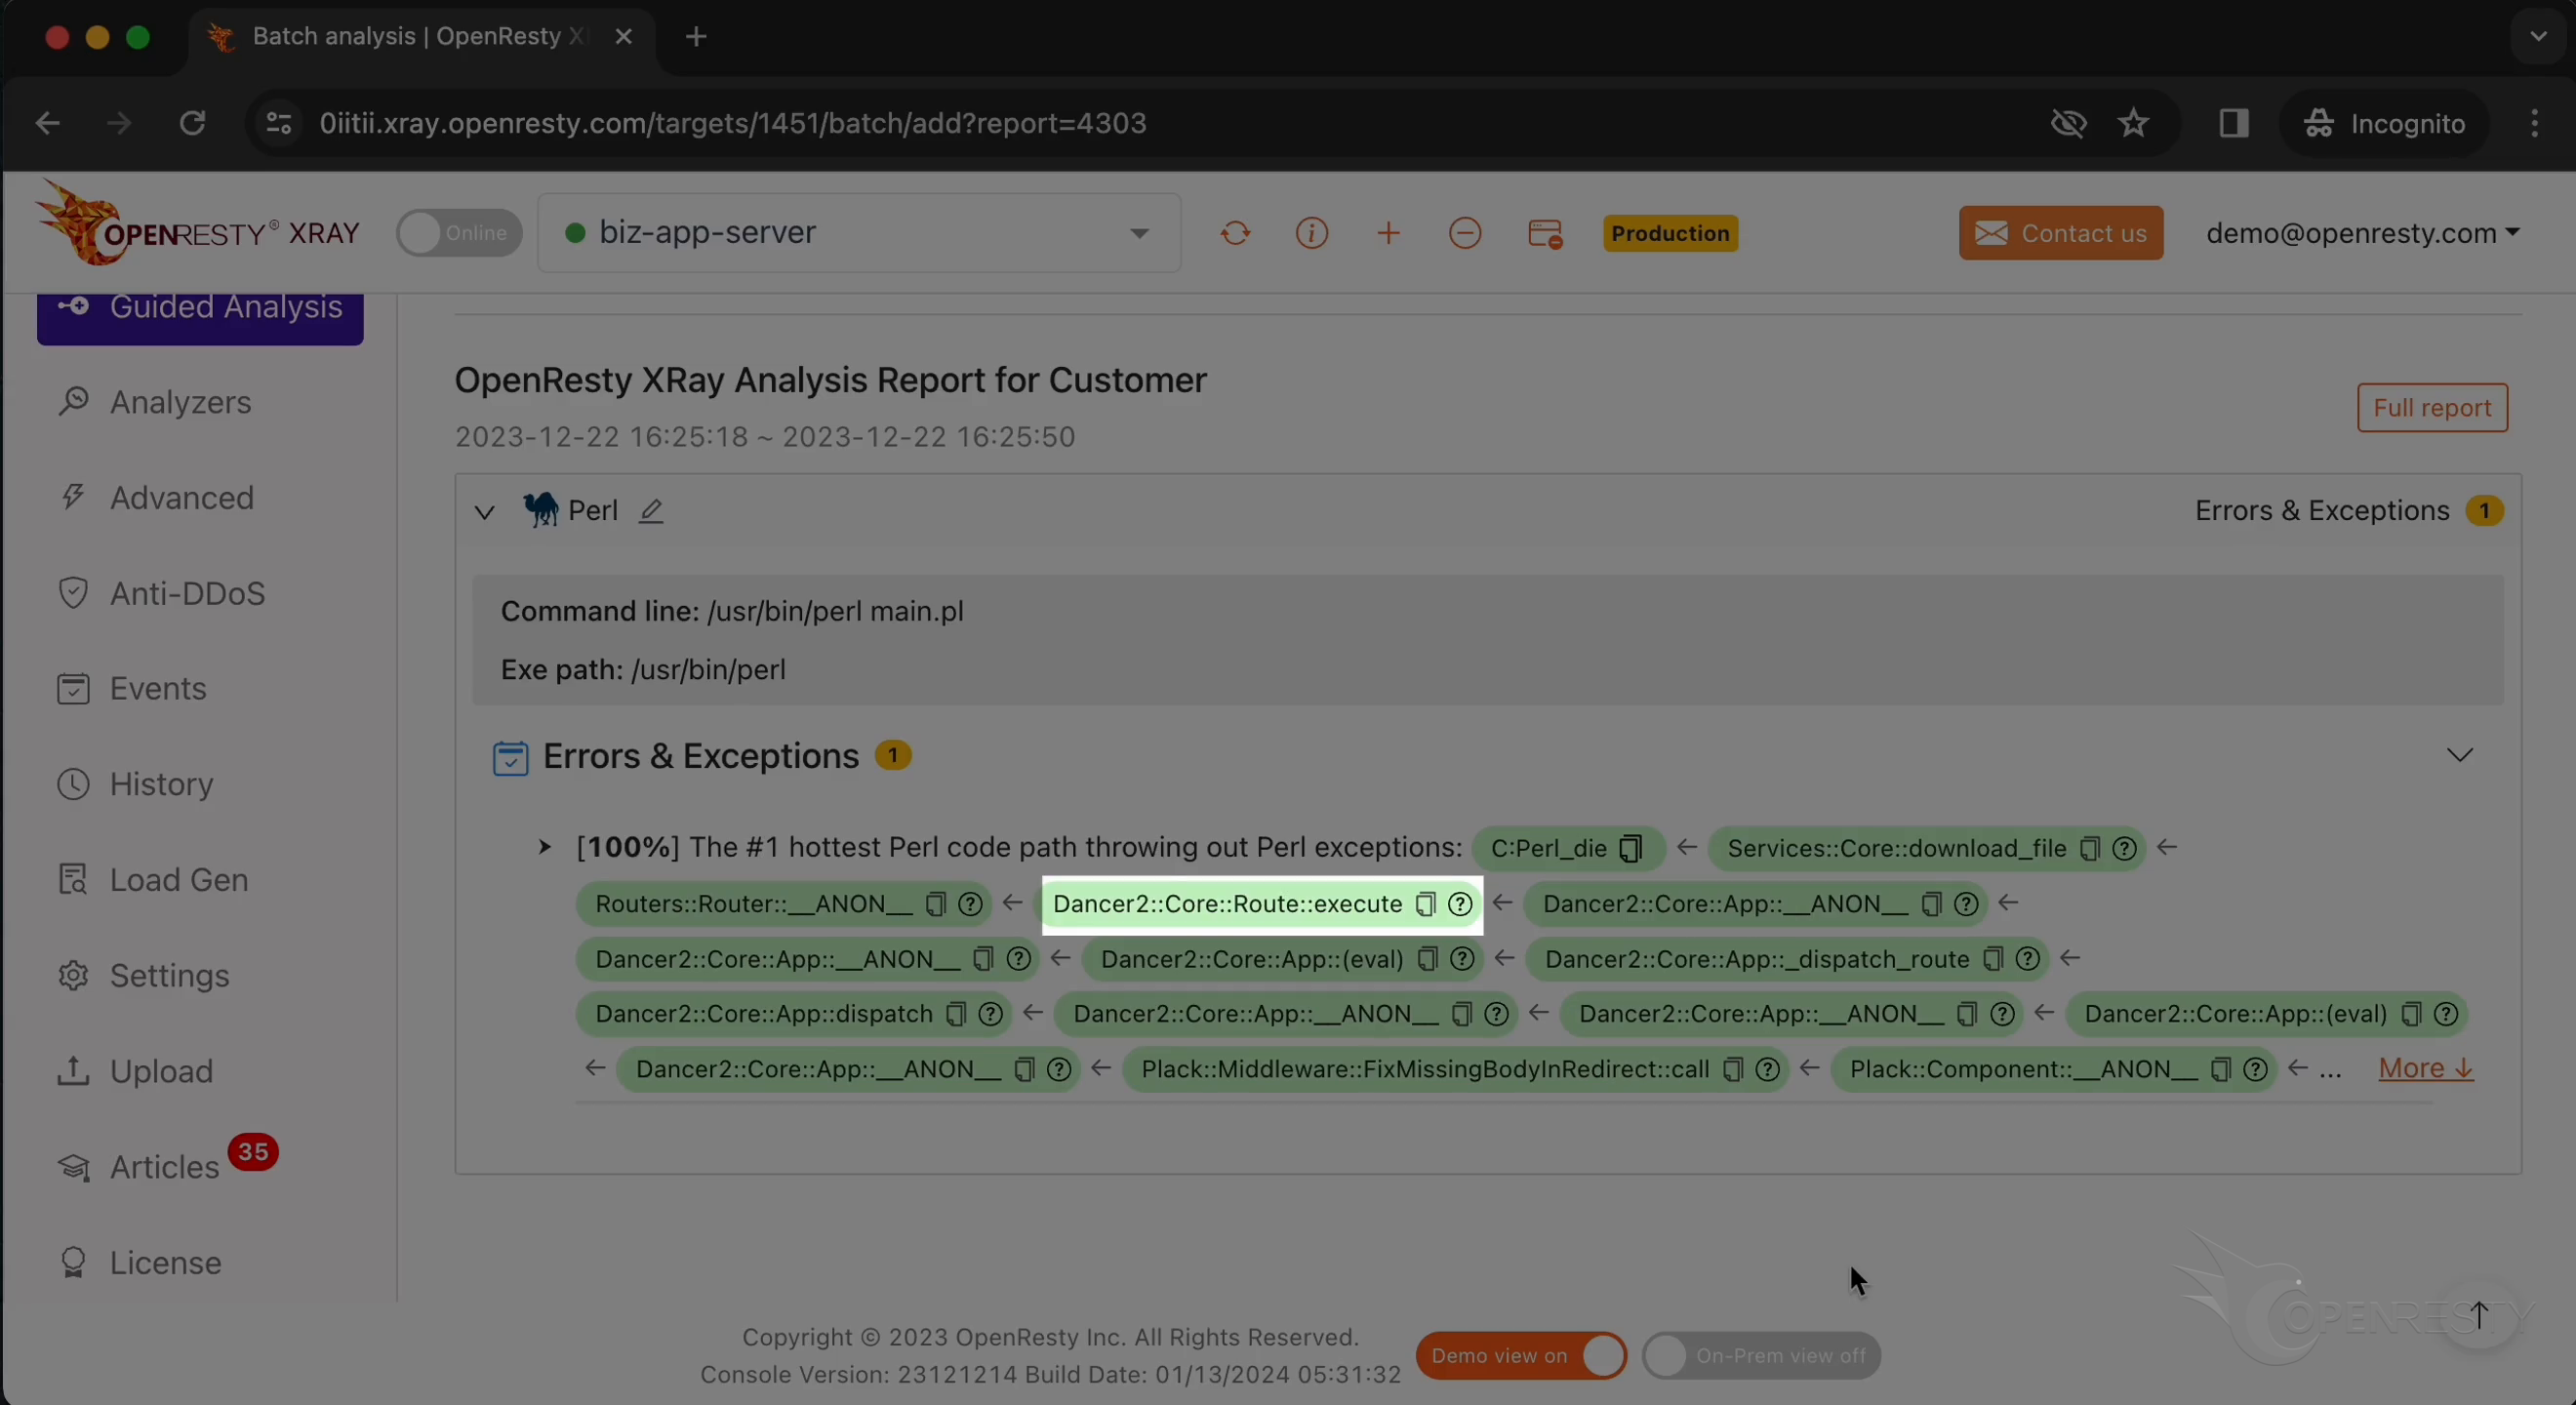
This series of functions belongs to the Dancer 2 web framework.
For example, Core::Route::execute executes the processing function of the matched route.
_dispatch_route is used to dispatch the current web request to the corresponding route handler.
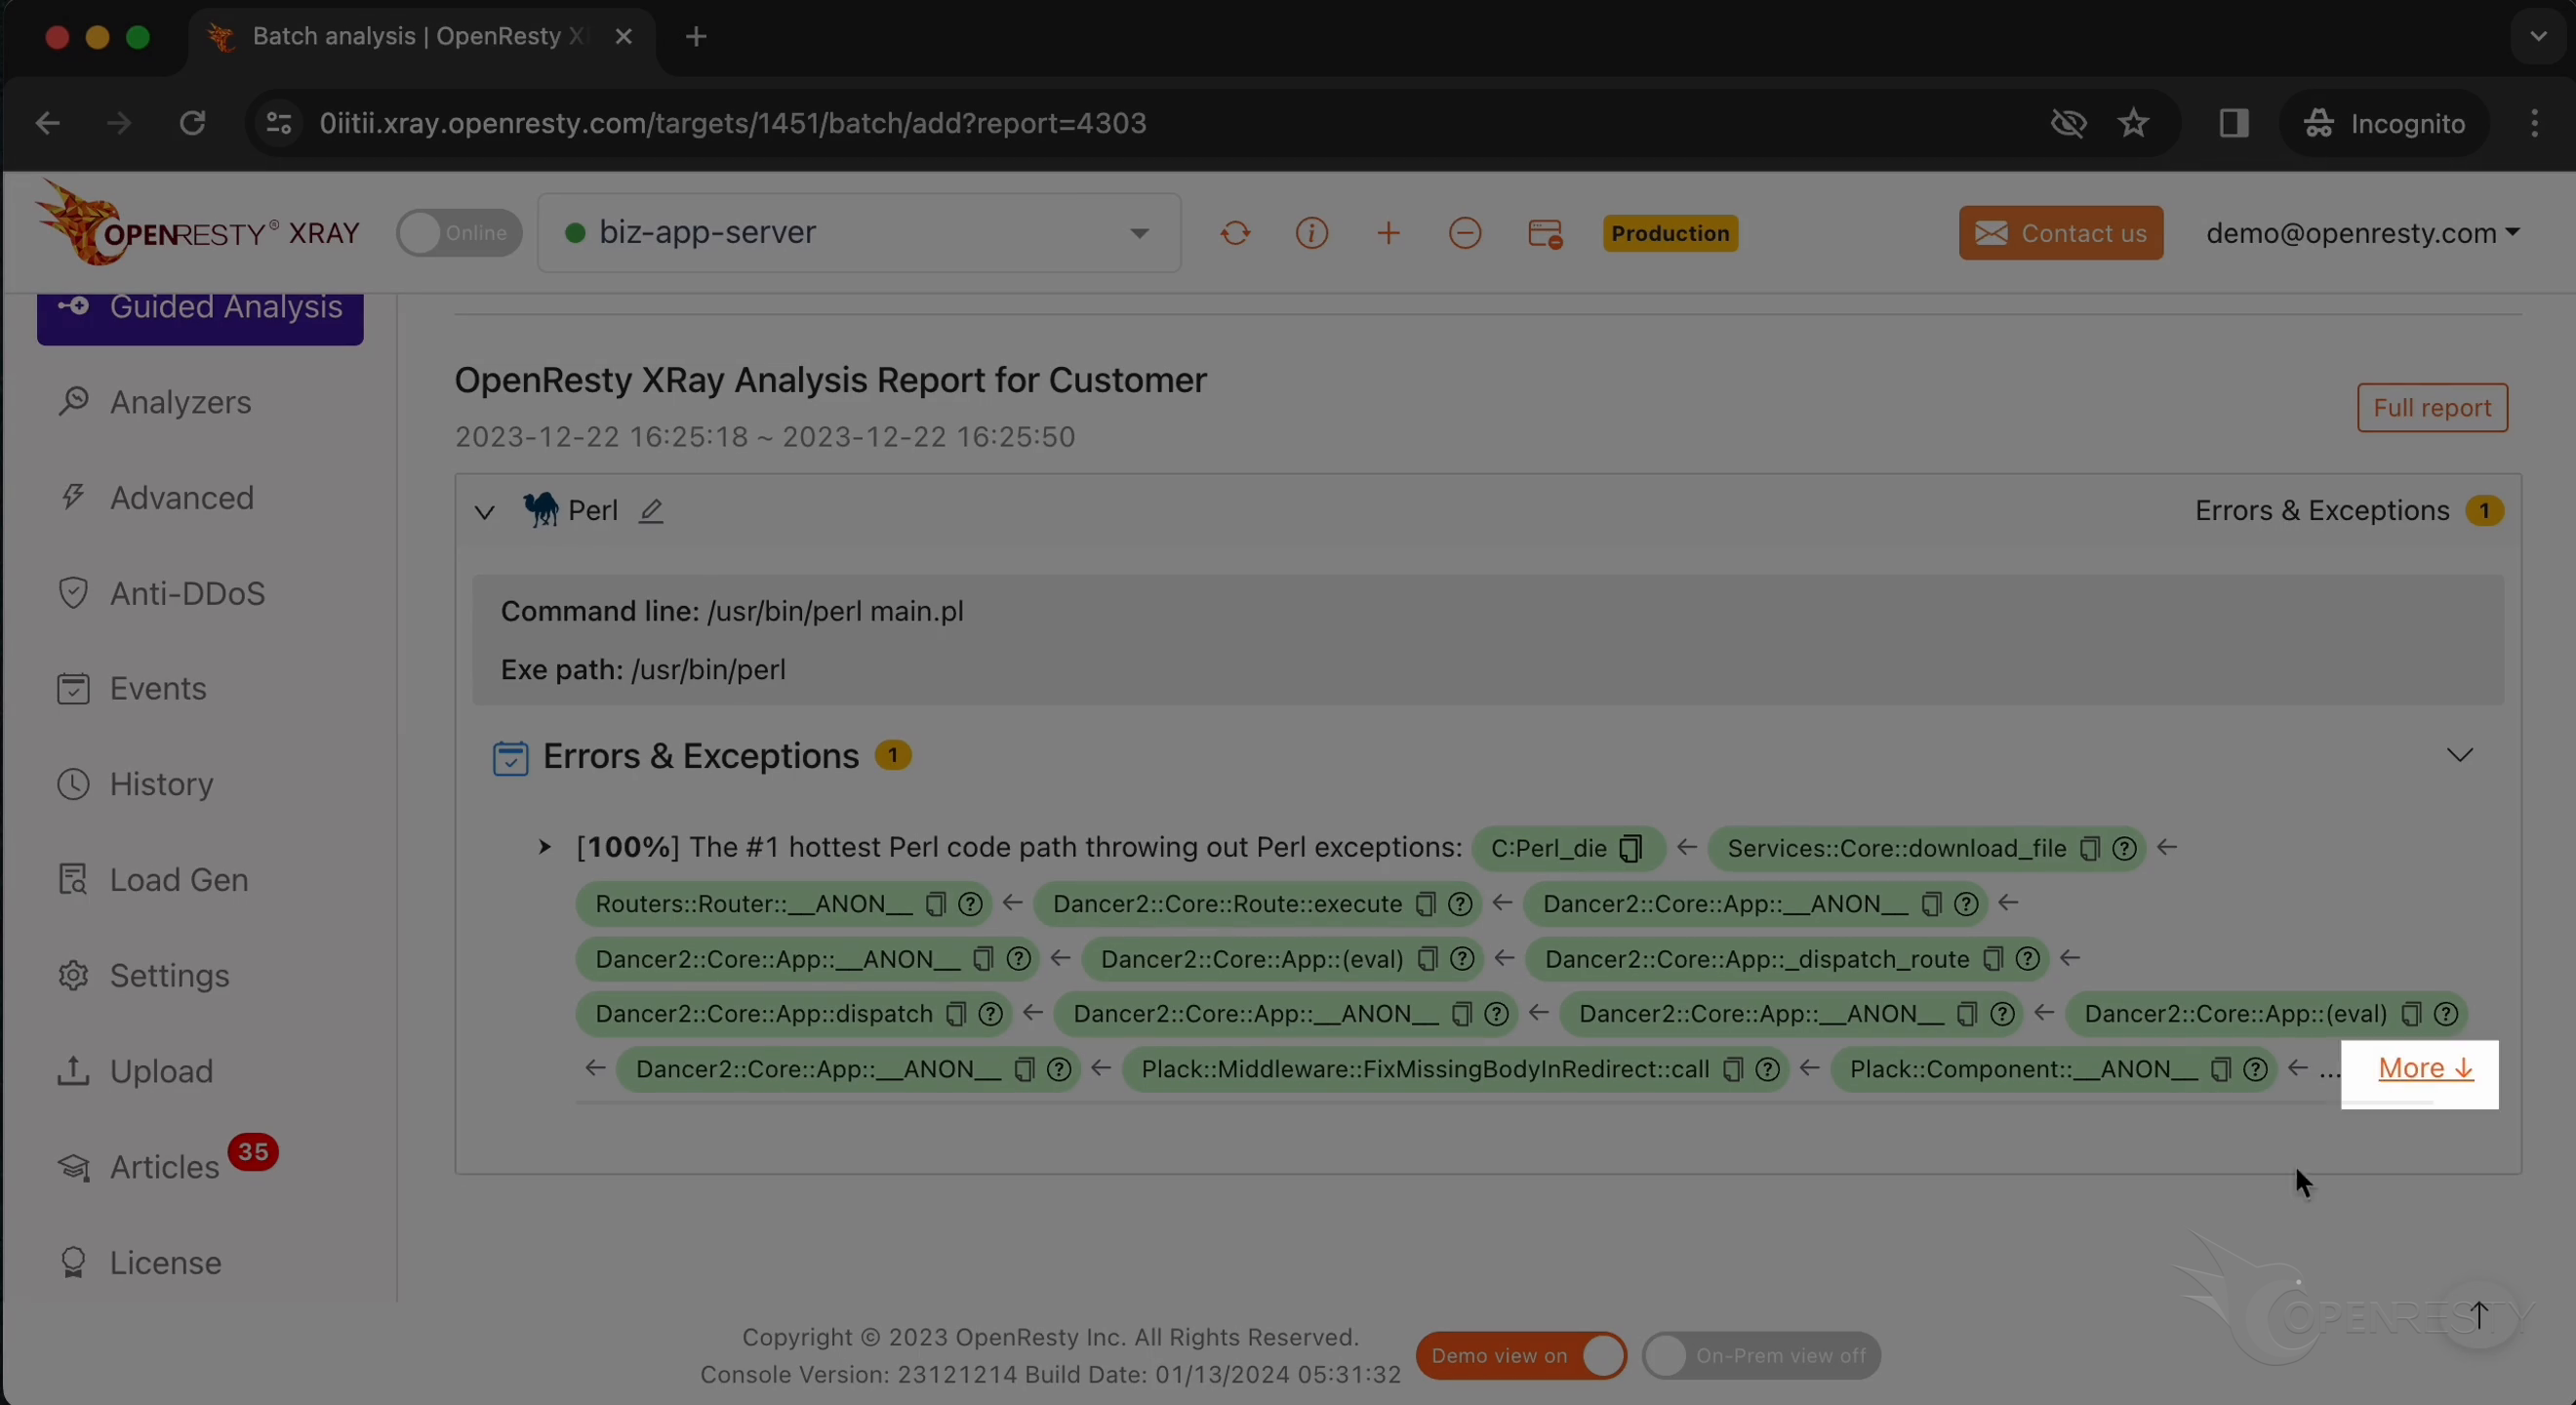
Click “More” to see more details.
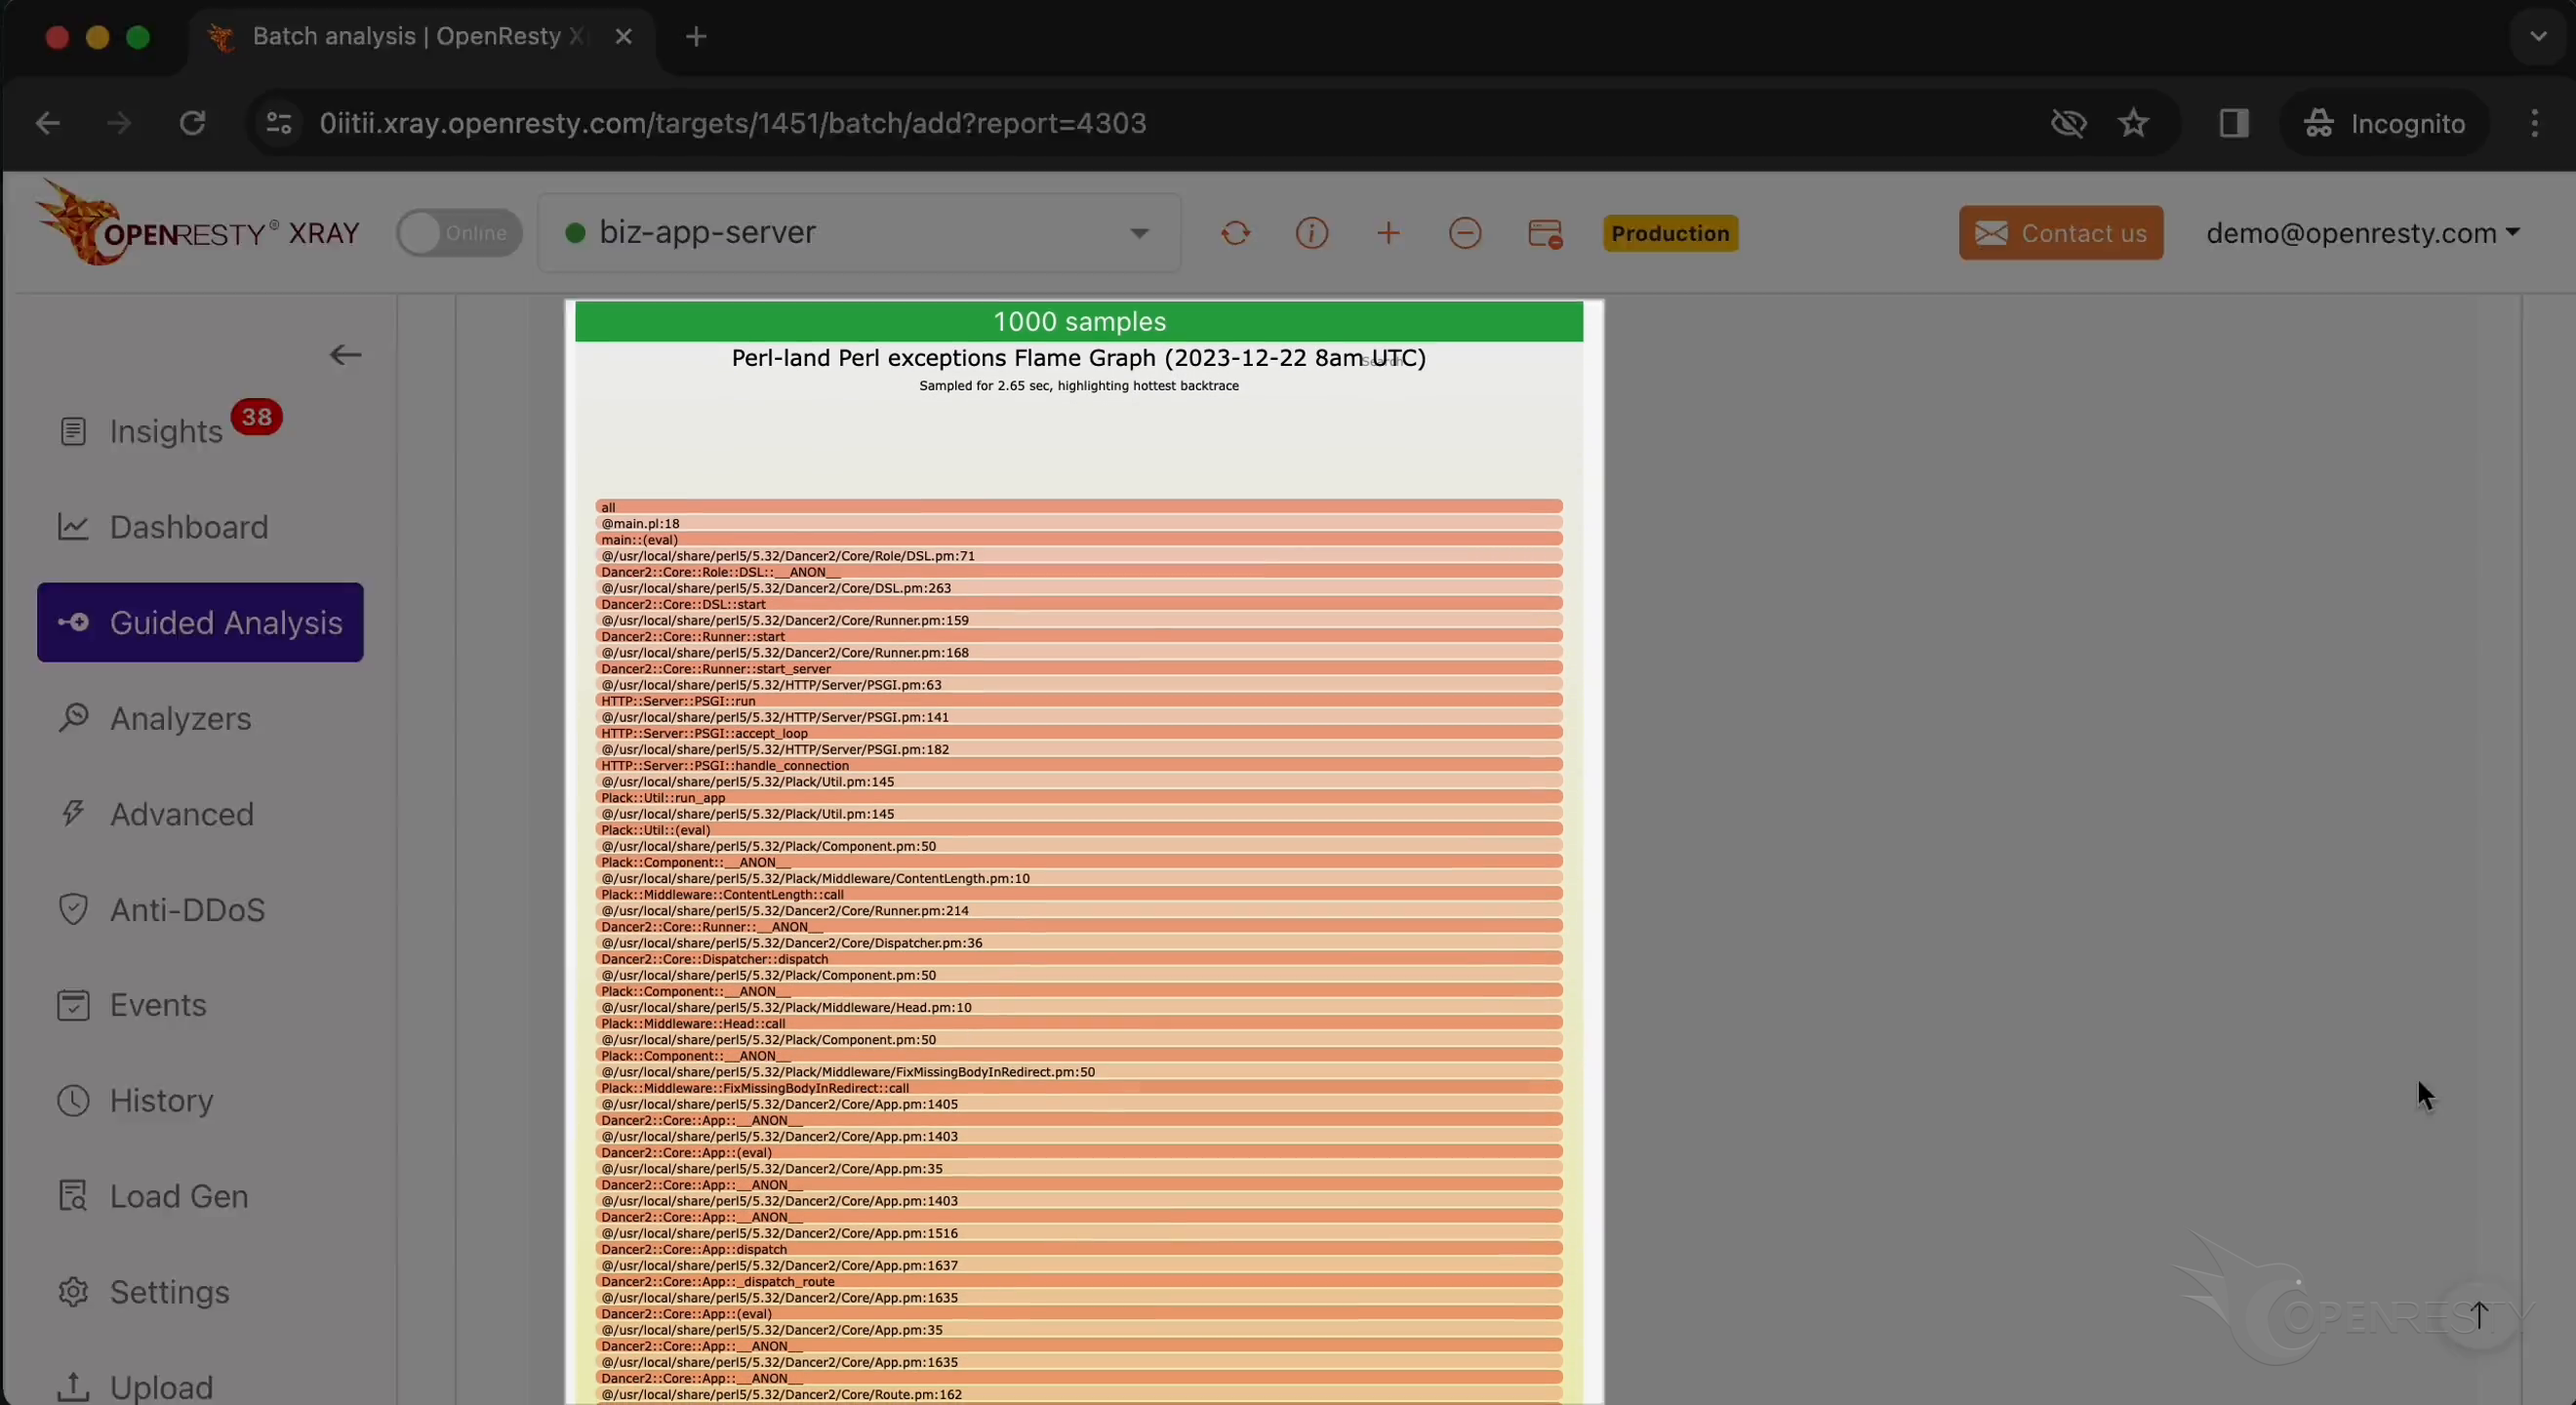
The hot code path was automatically inferred from this Perl_land exceptions Flame Graph.
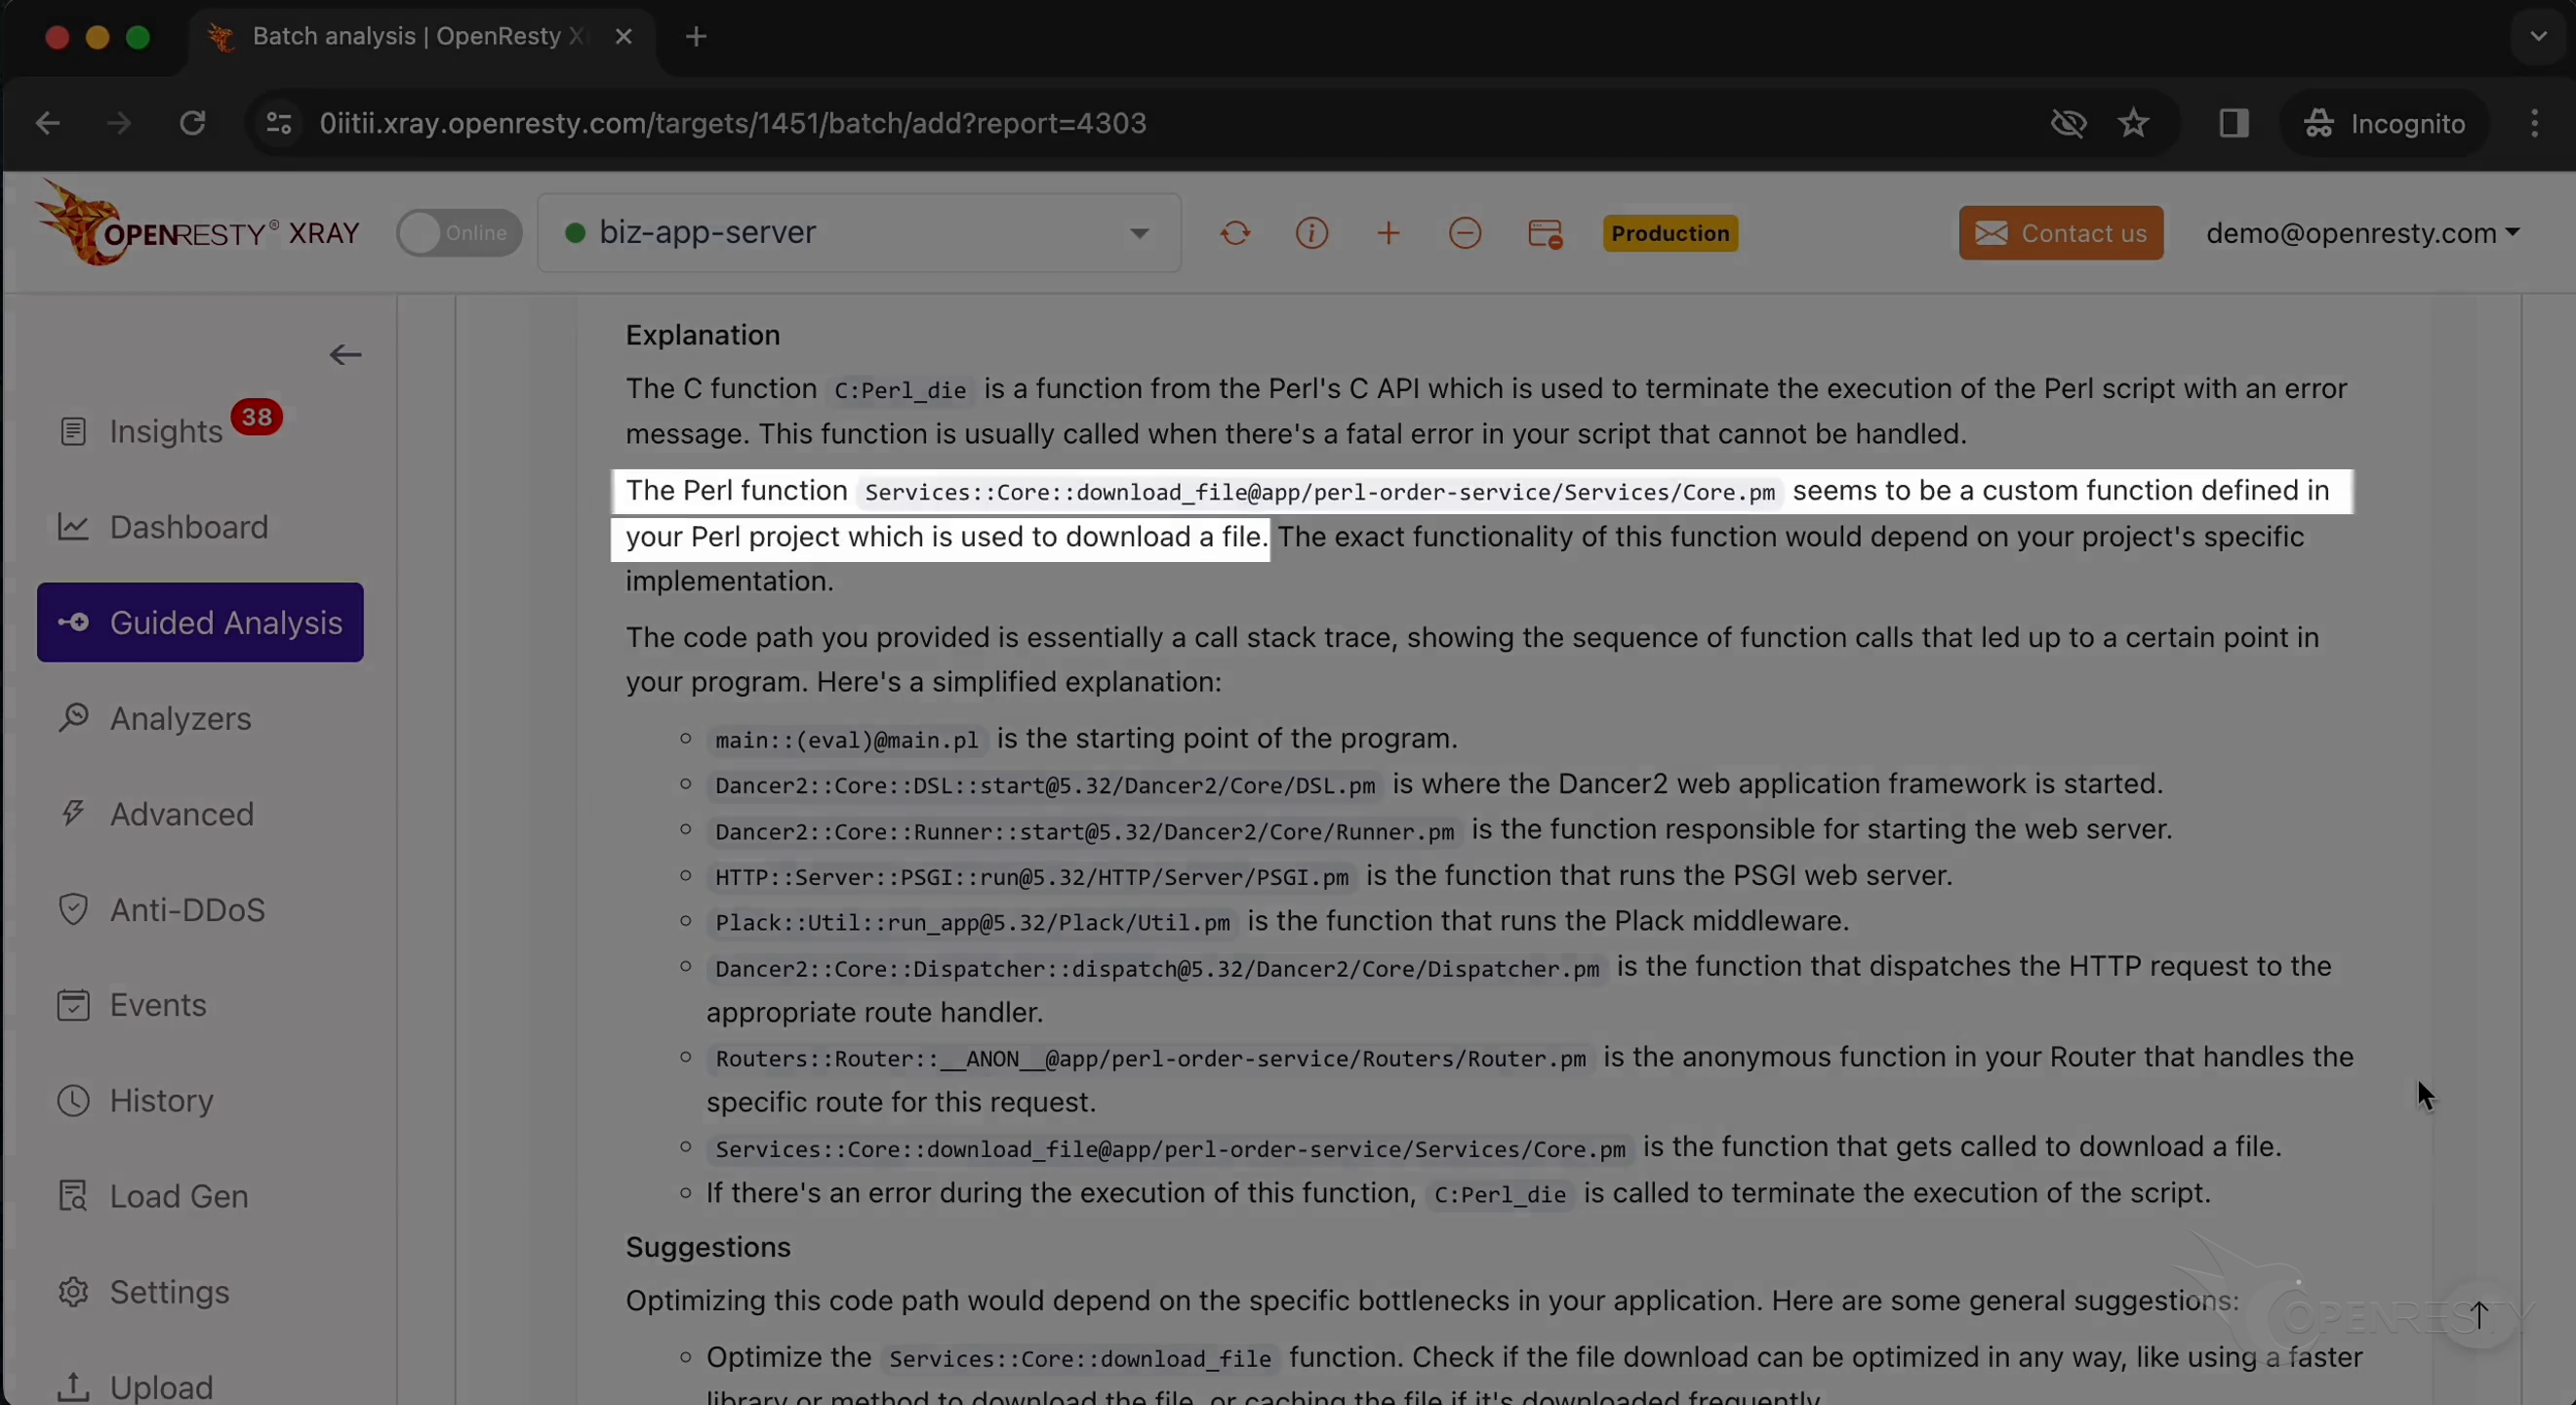
Below are more detailed explanations and suggestions regarding the current issue.
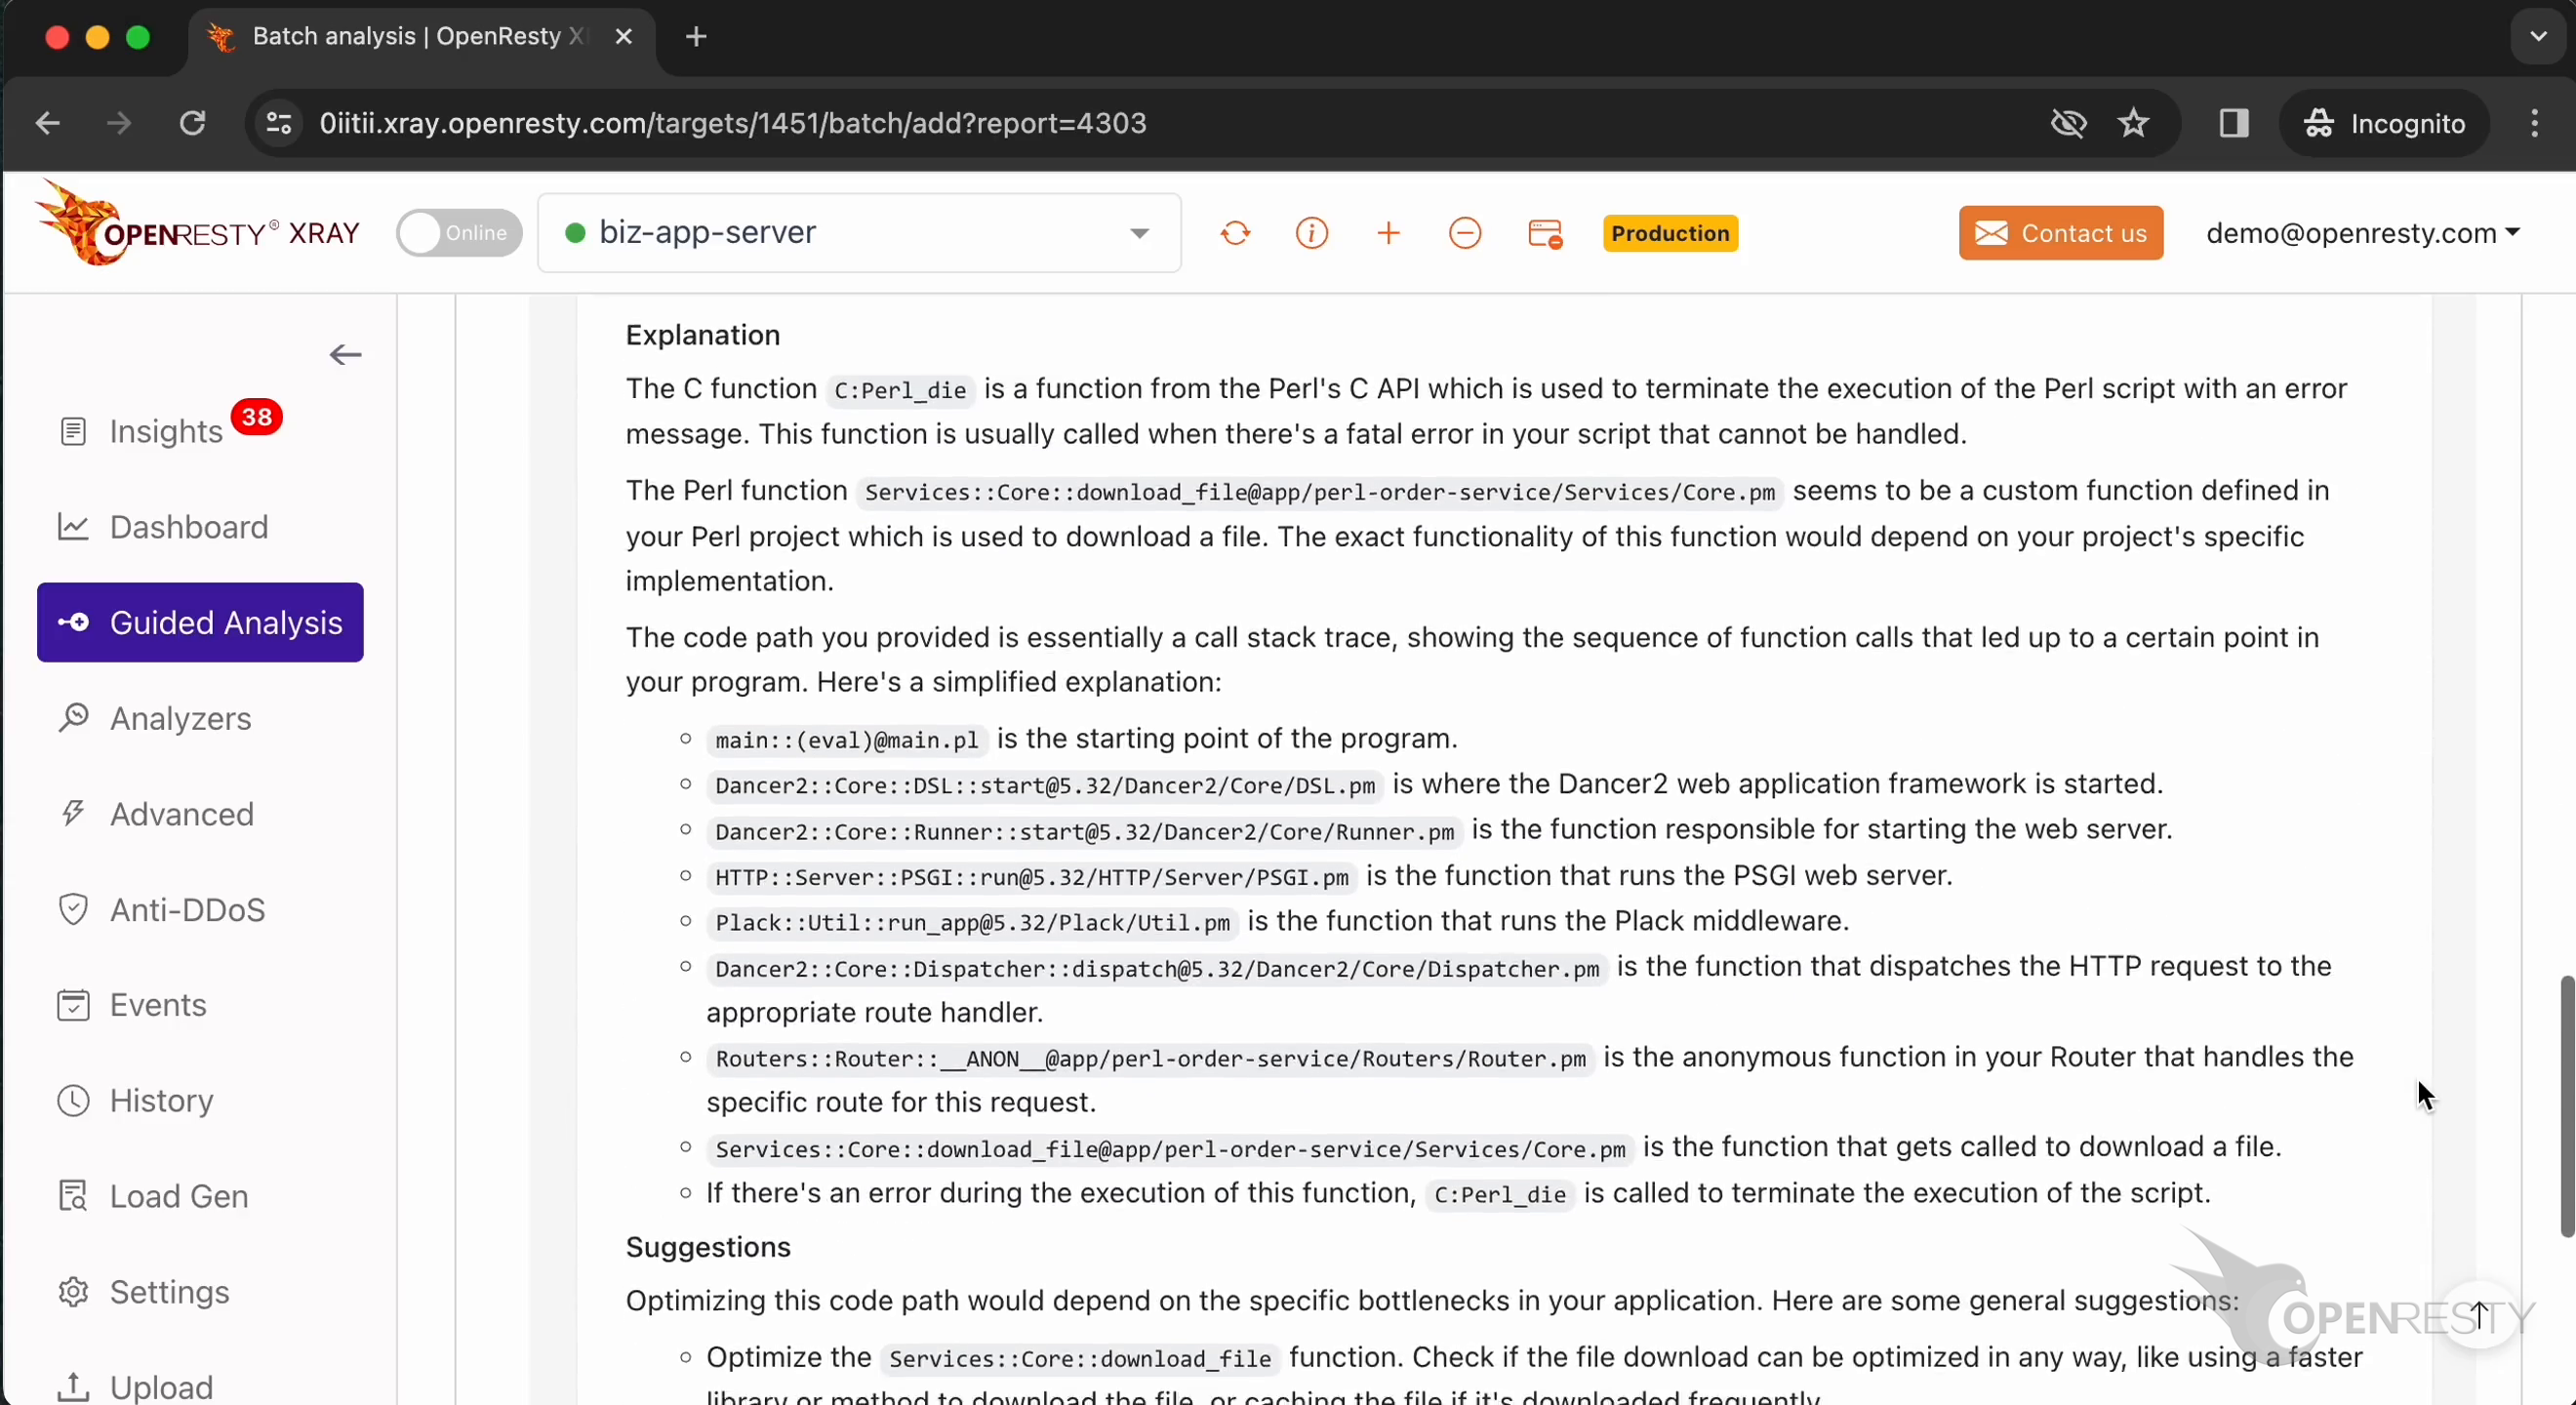
It mentions the perl_die function. It can detect exceptions during Perl script execution by checking error messages.
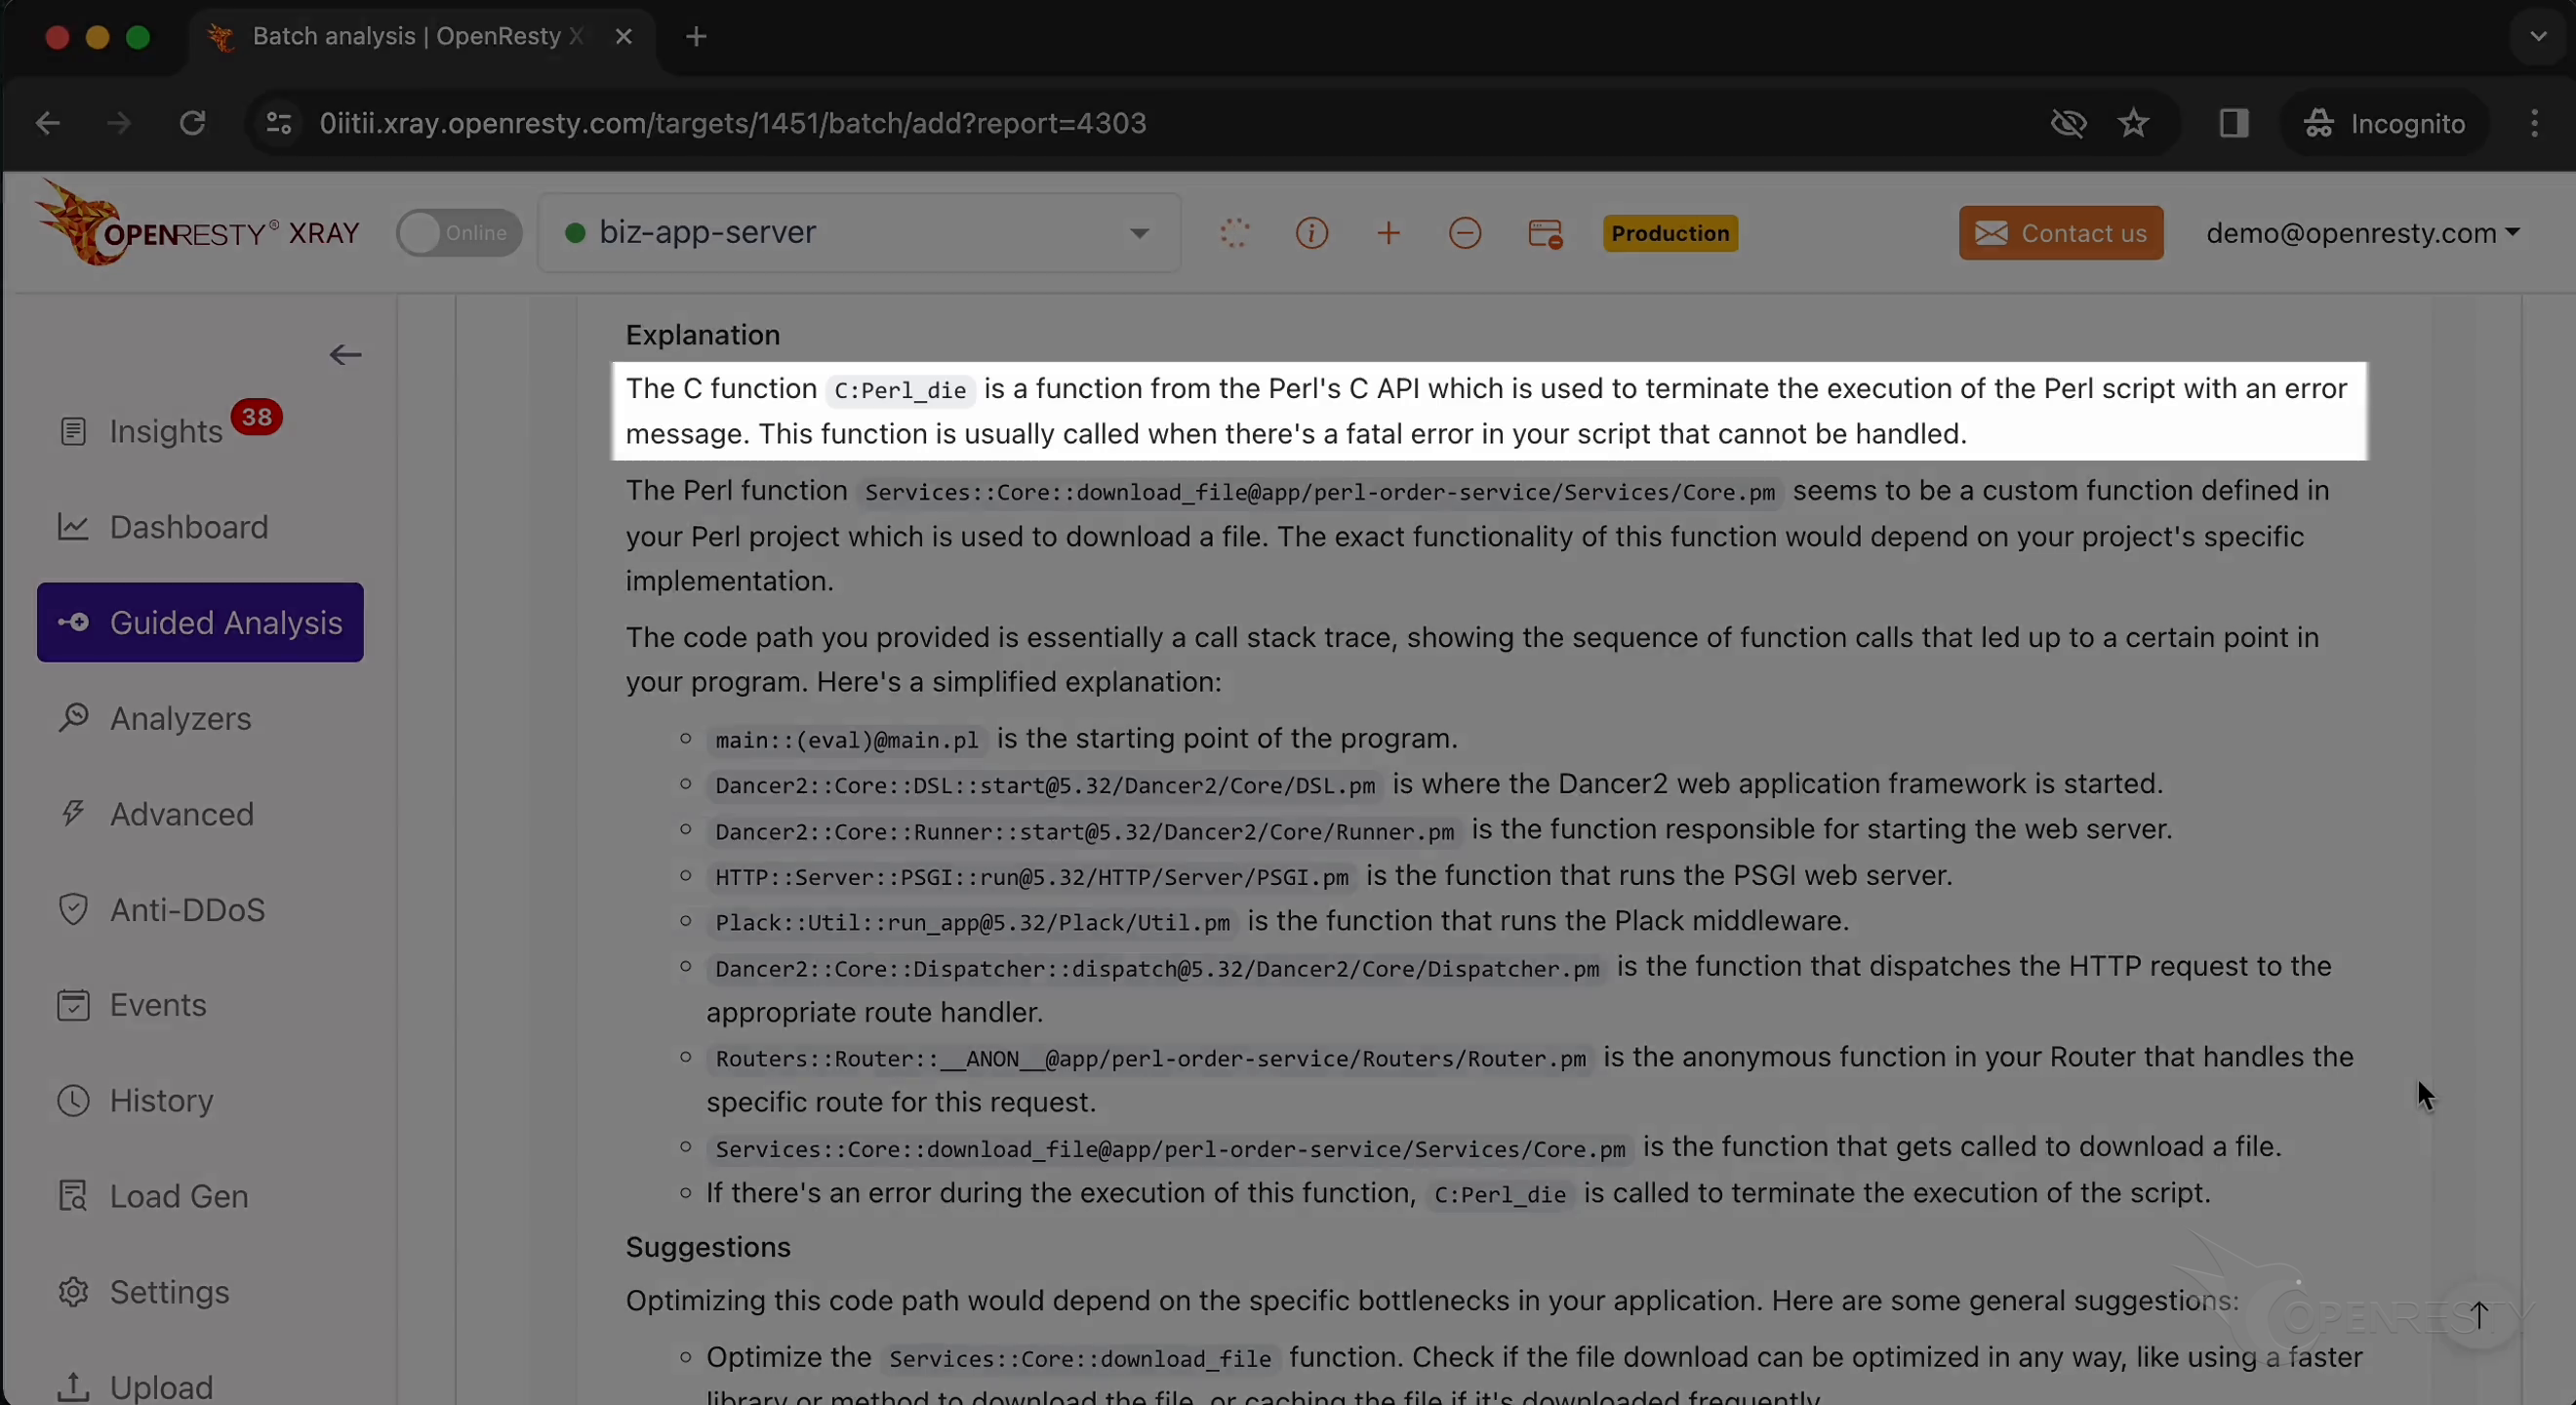
It explains the download_file function we saw earlier.
Let’s go back to the hot code path.
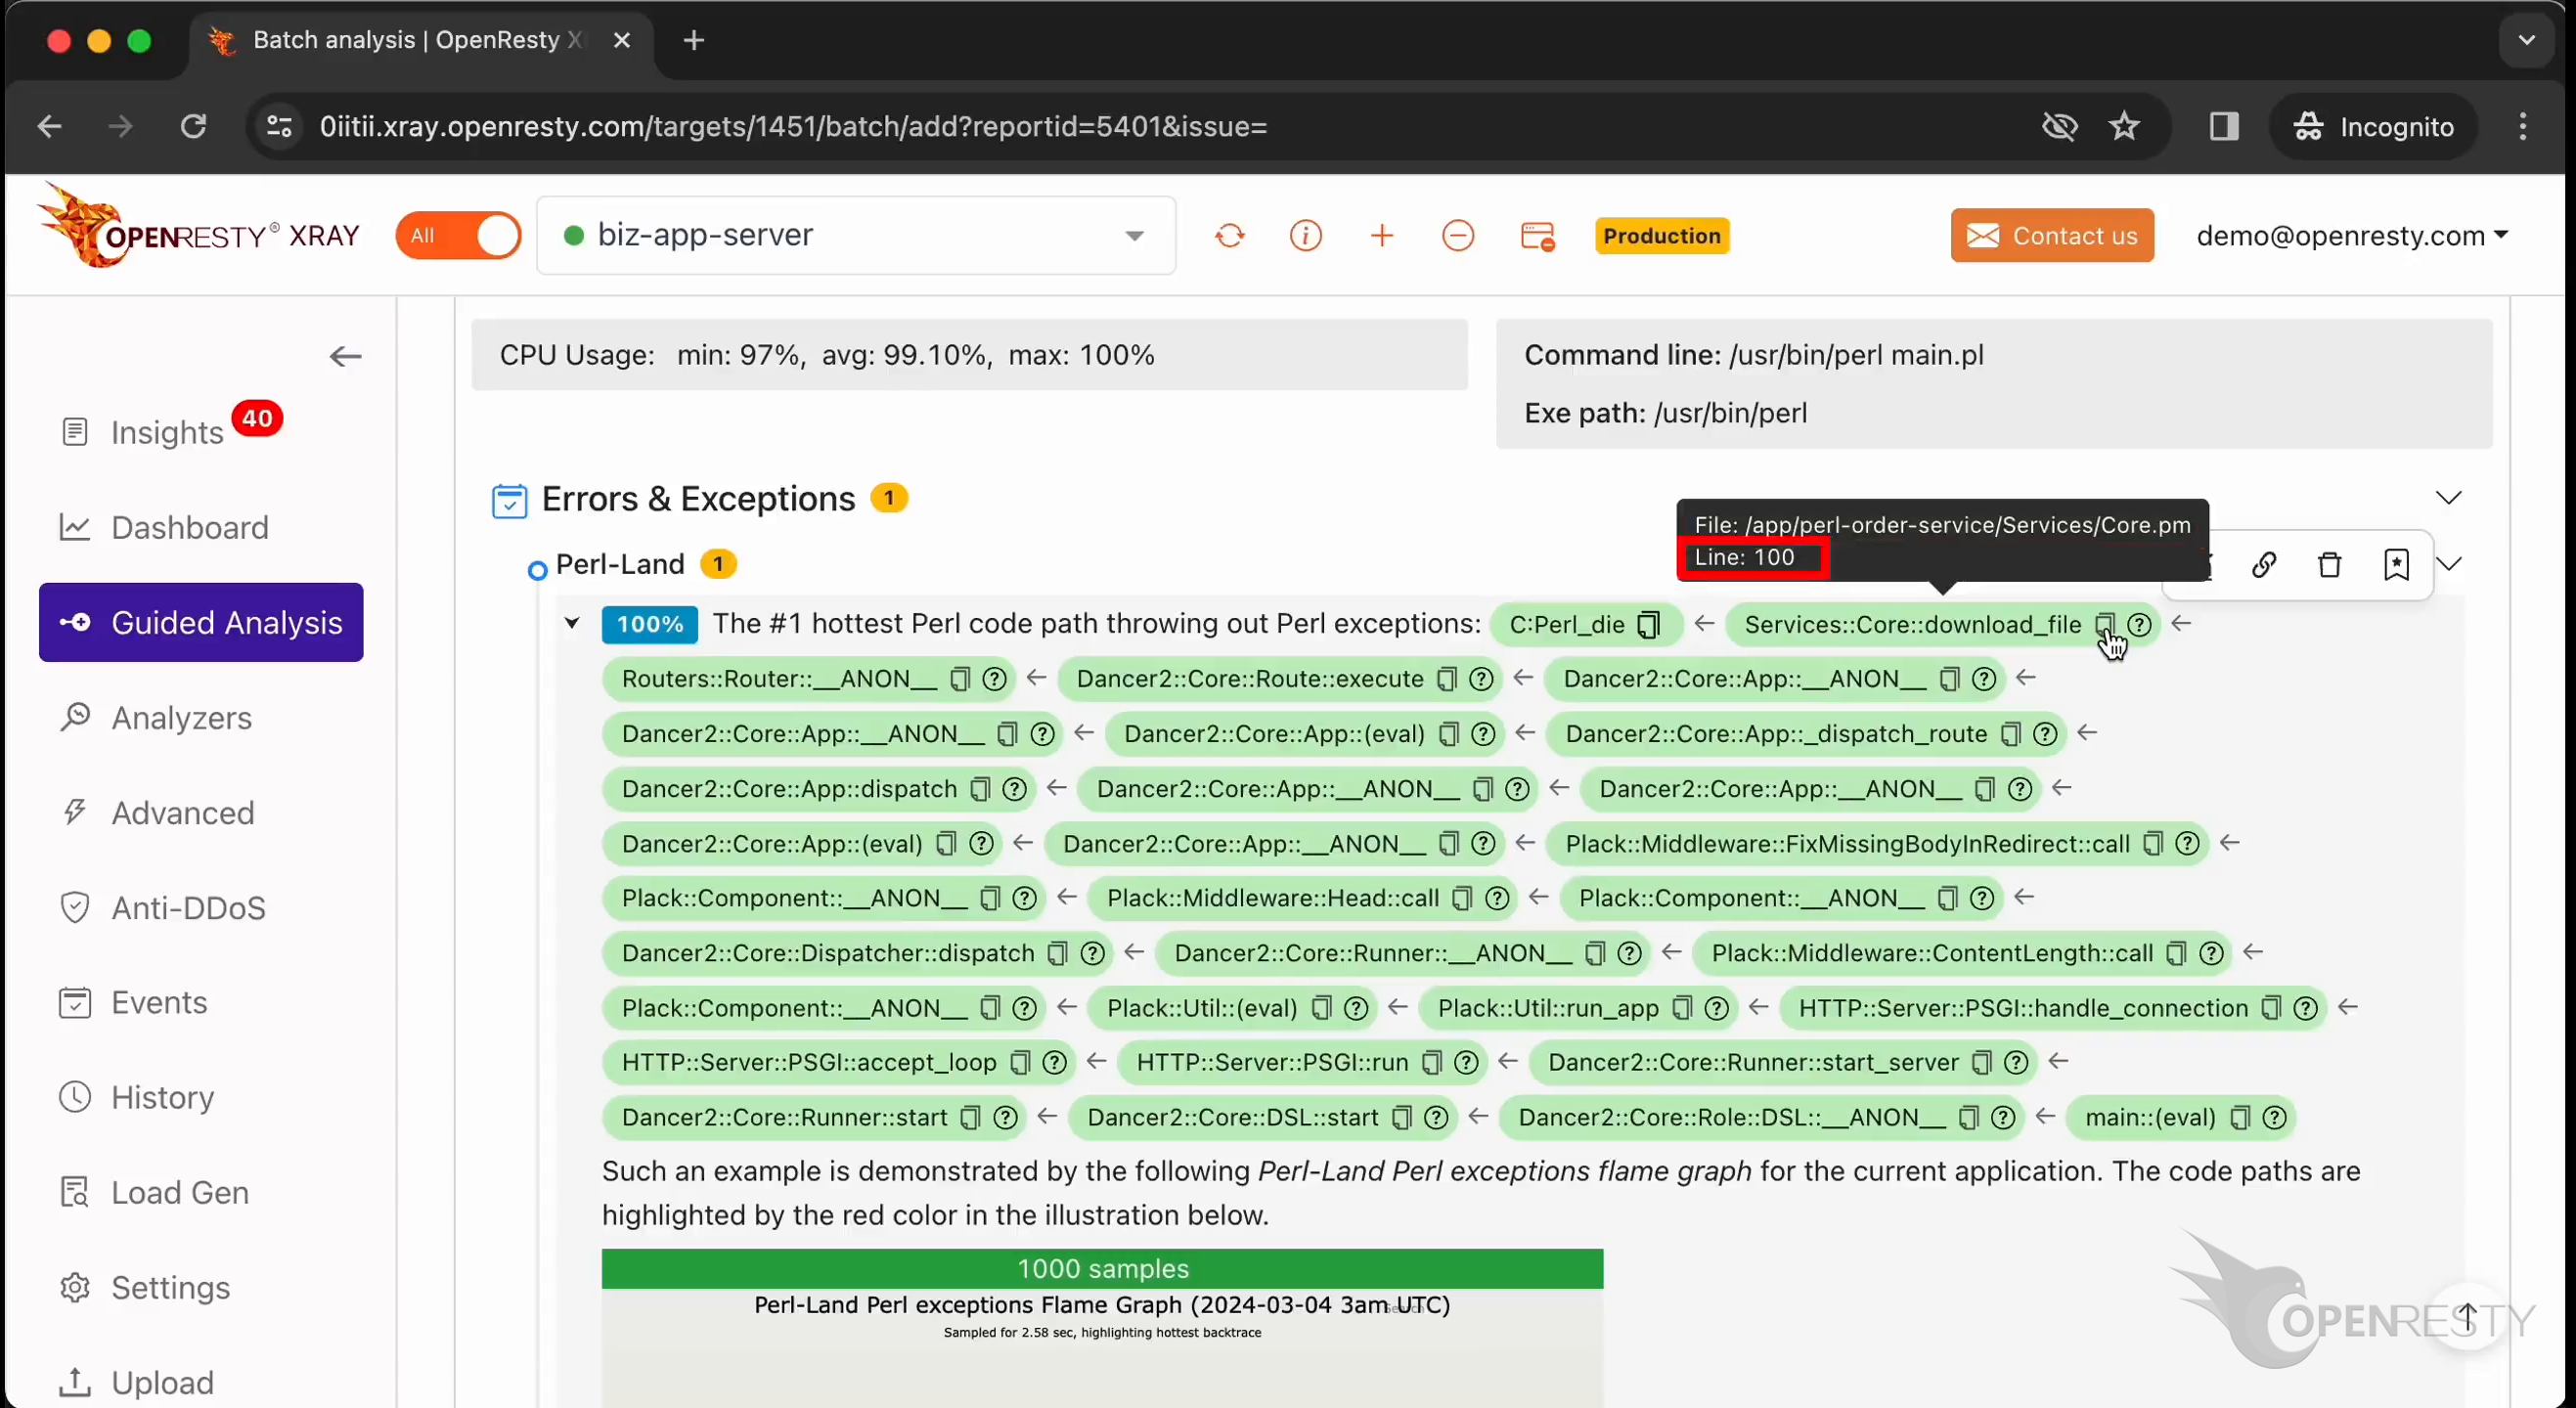
Hover the mouse over the green box for the function.
You can see the source file of this Perl function in the tooltip.
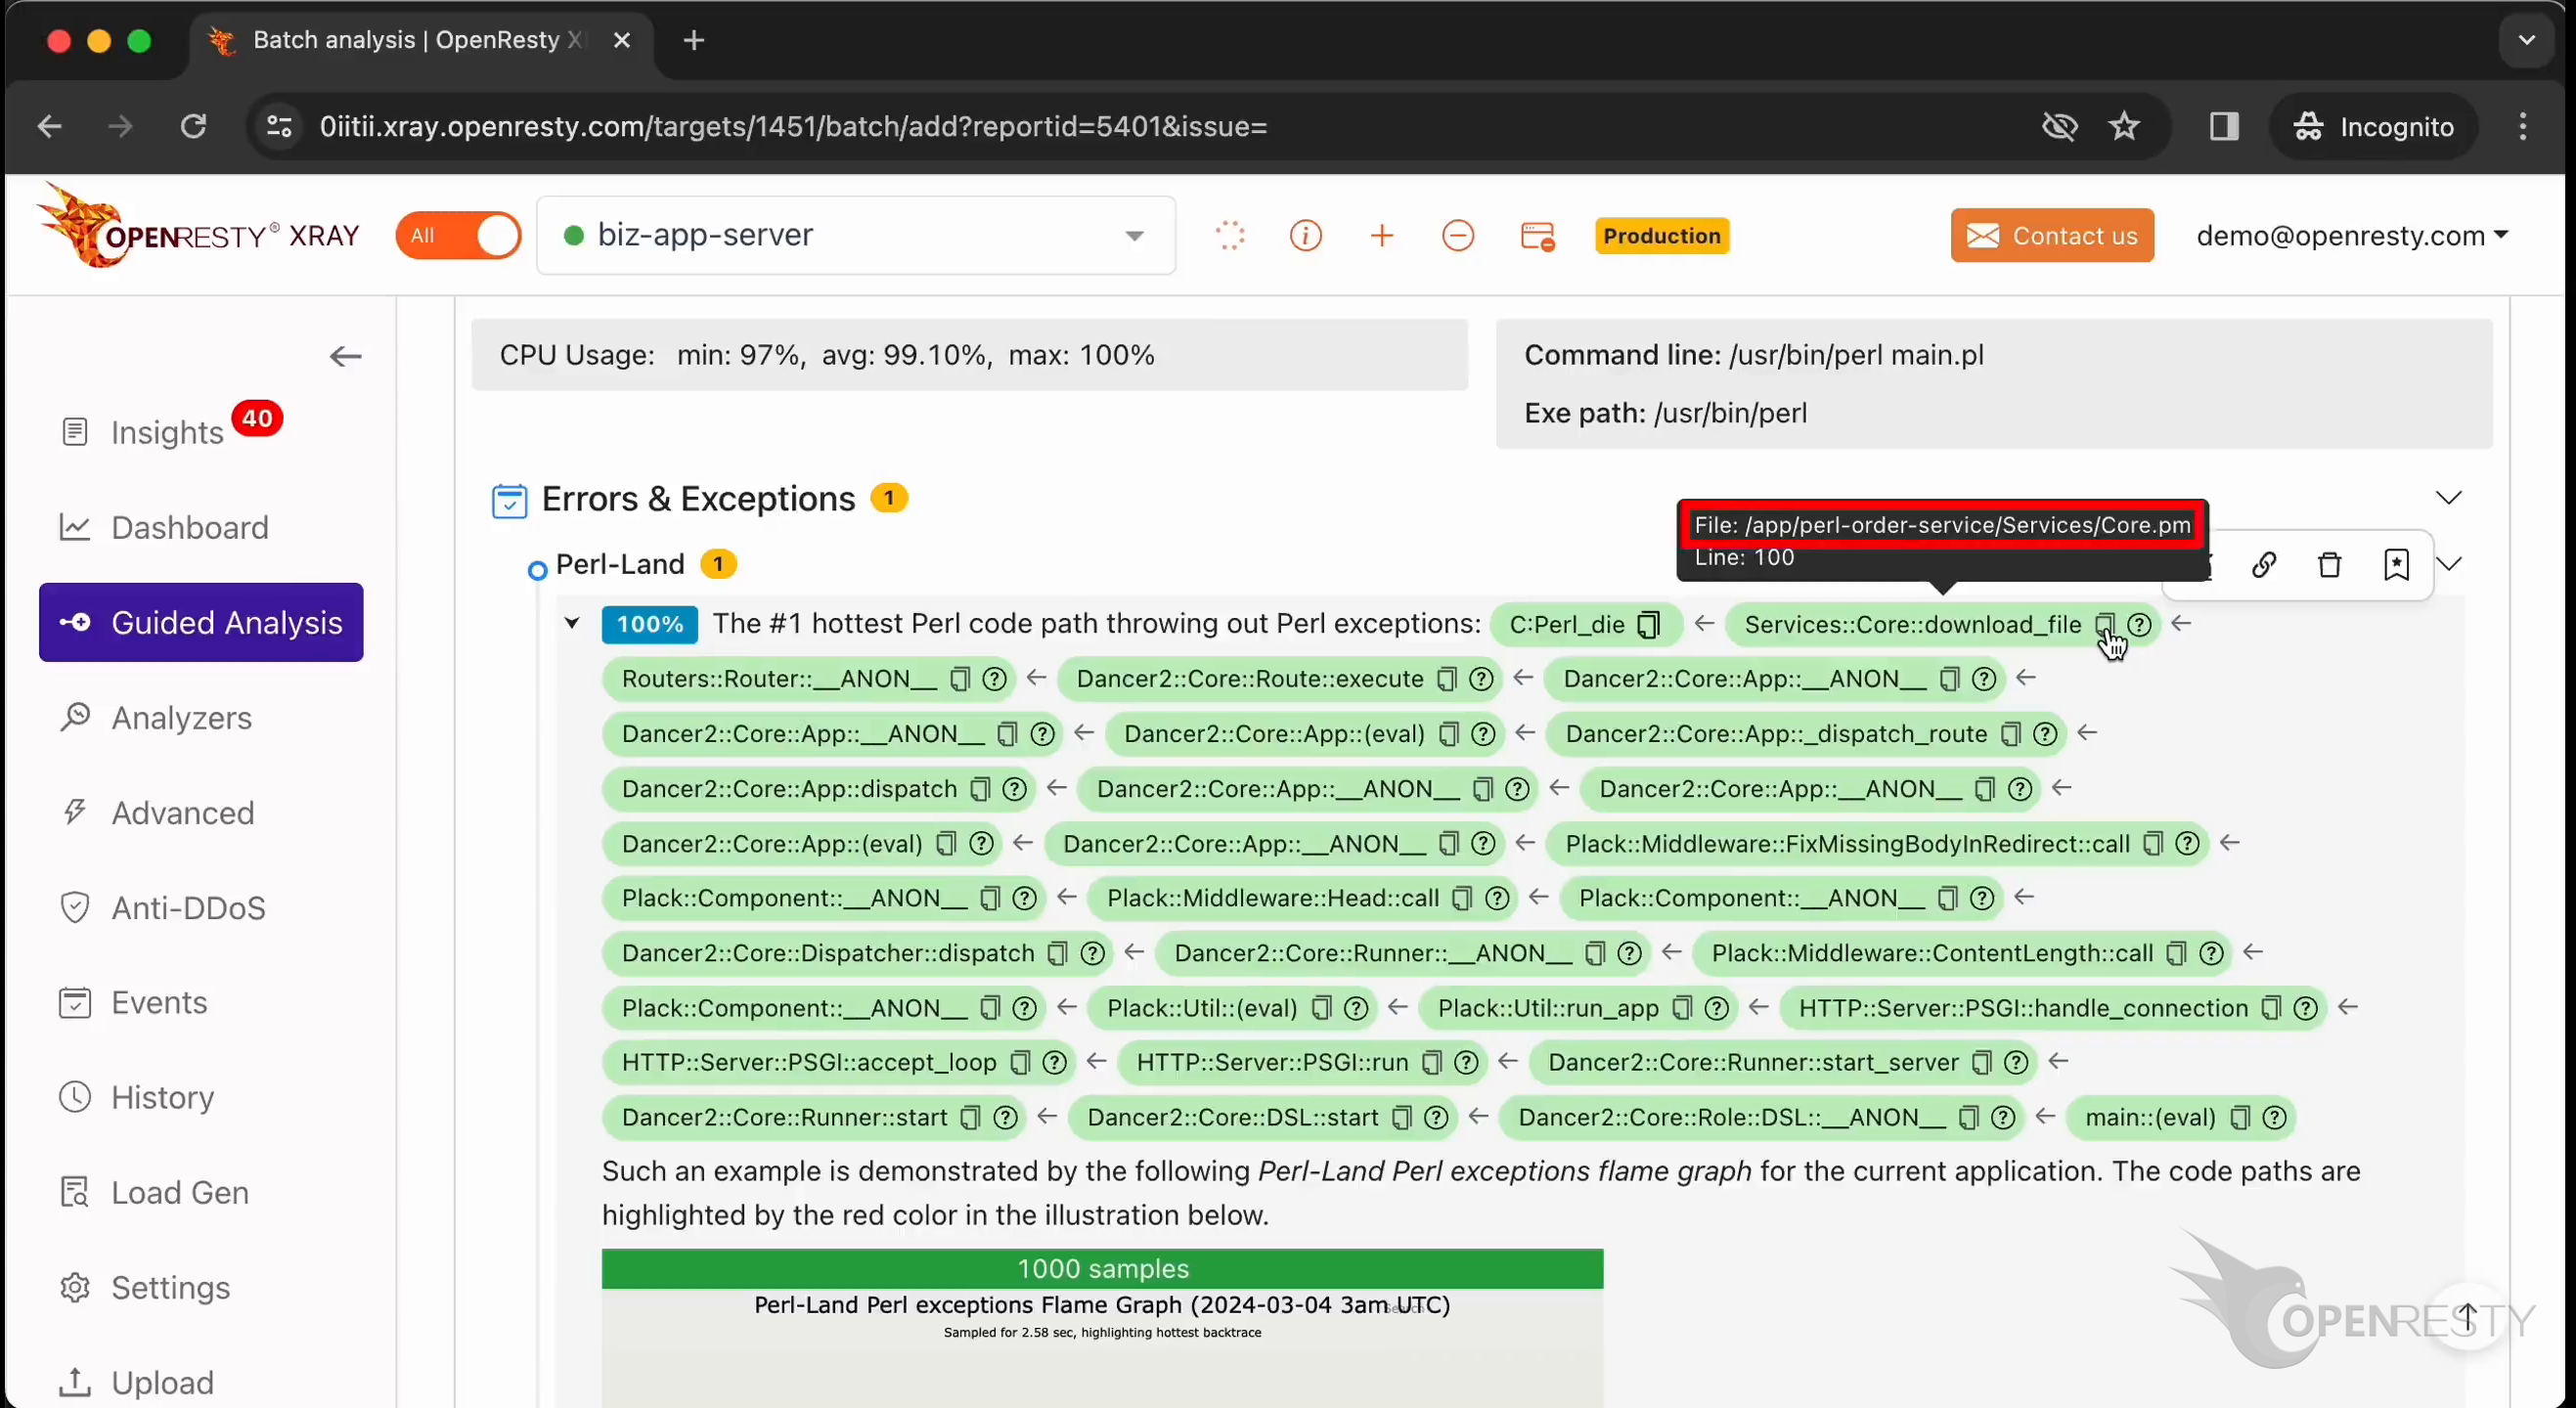
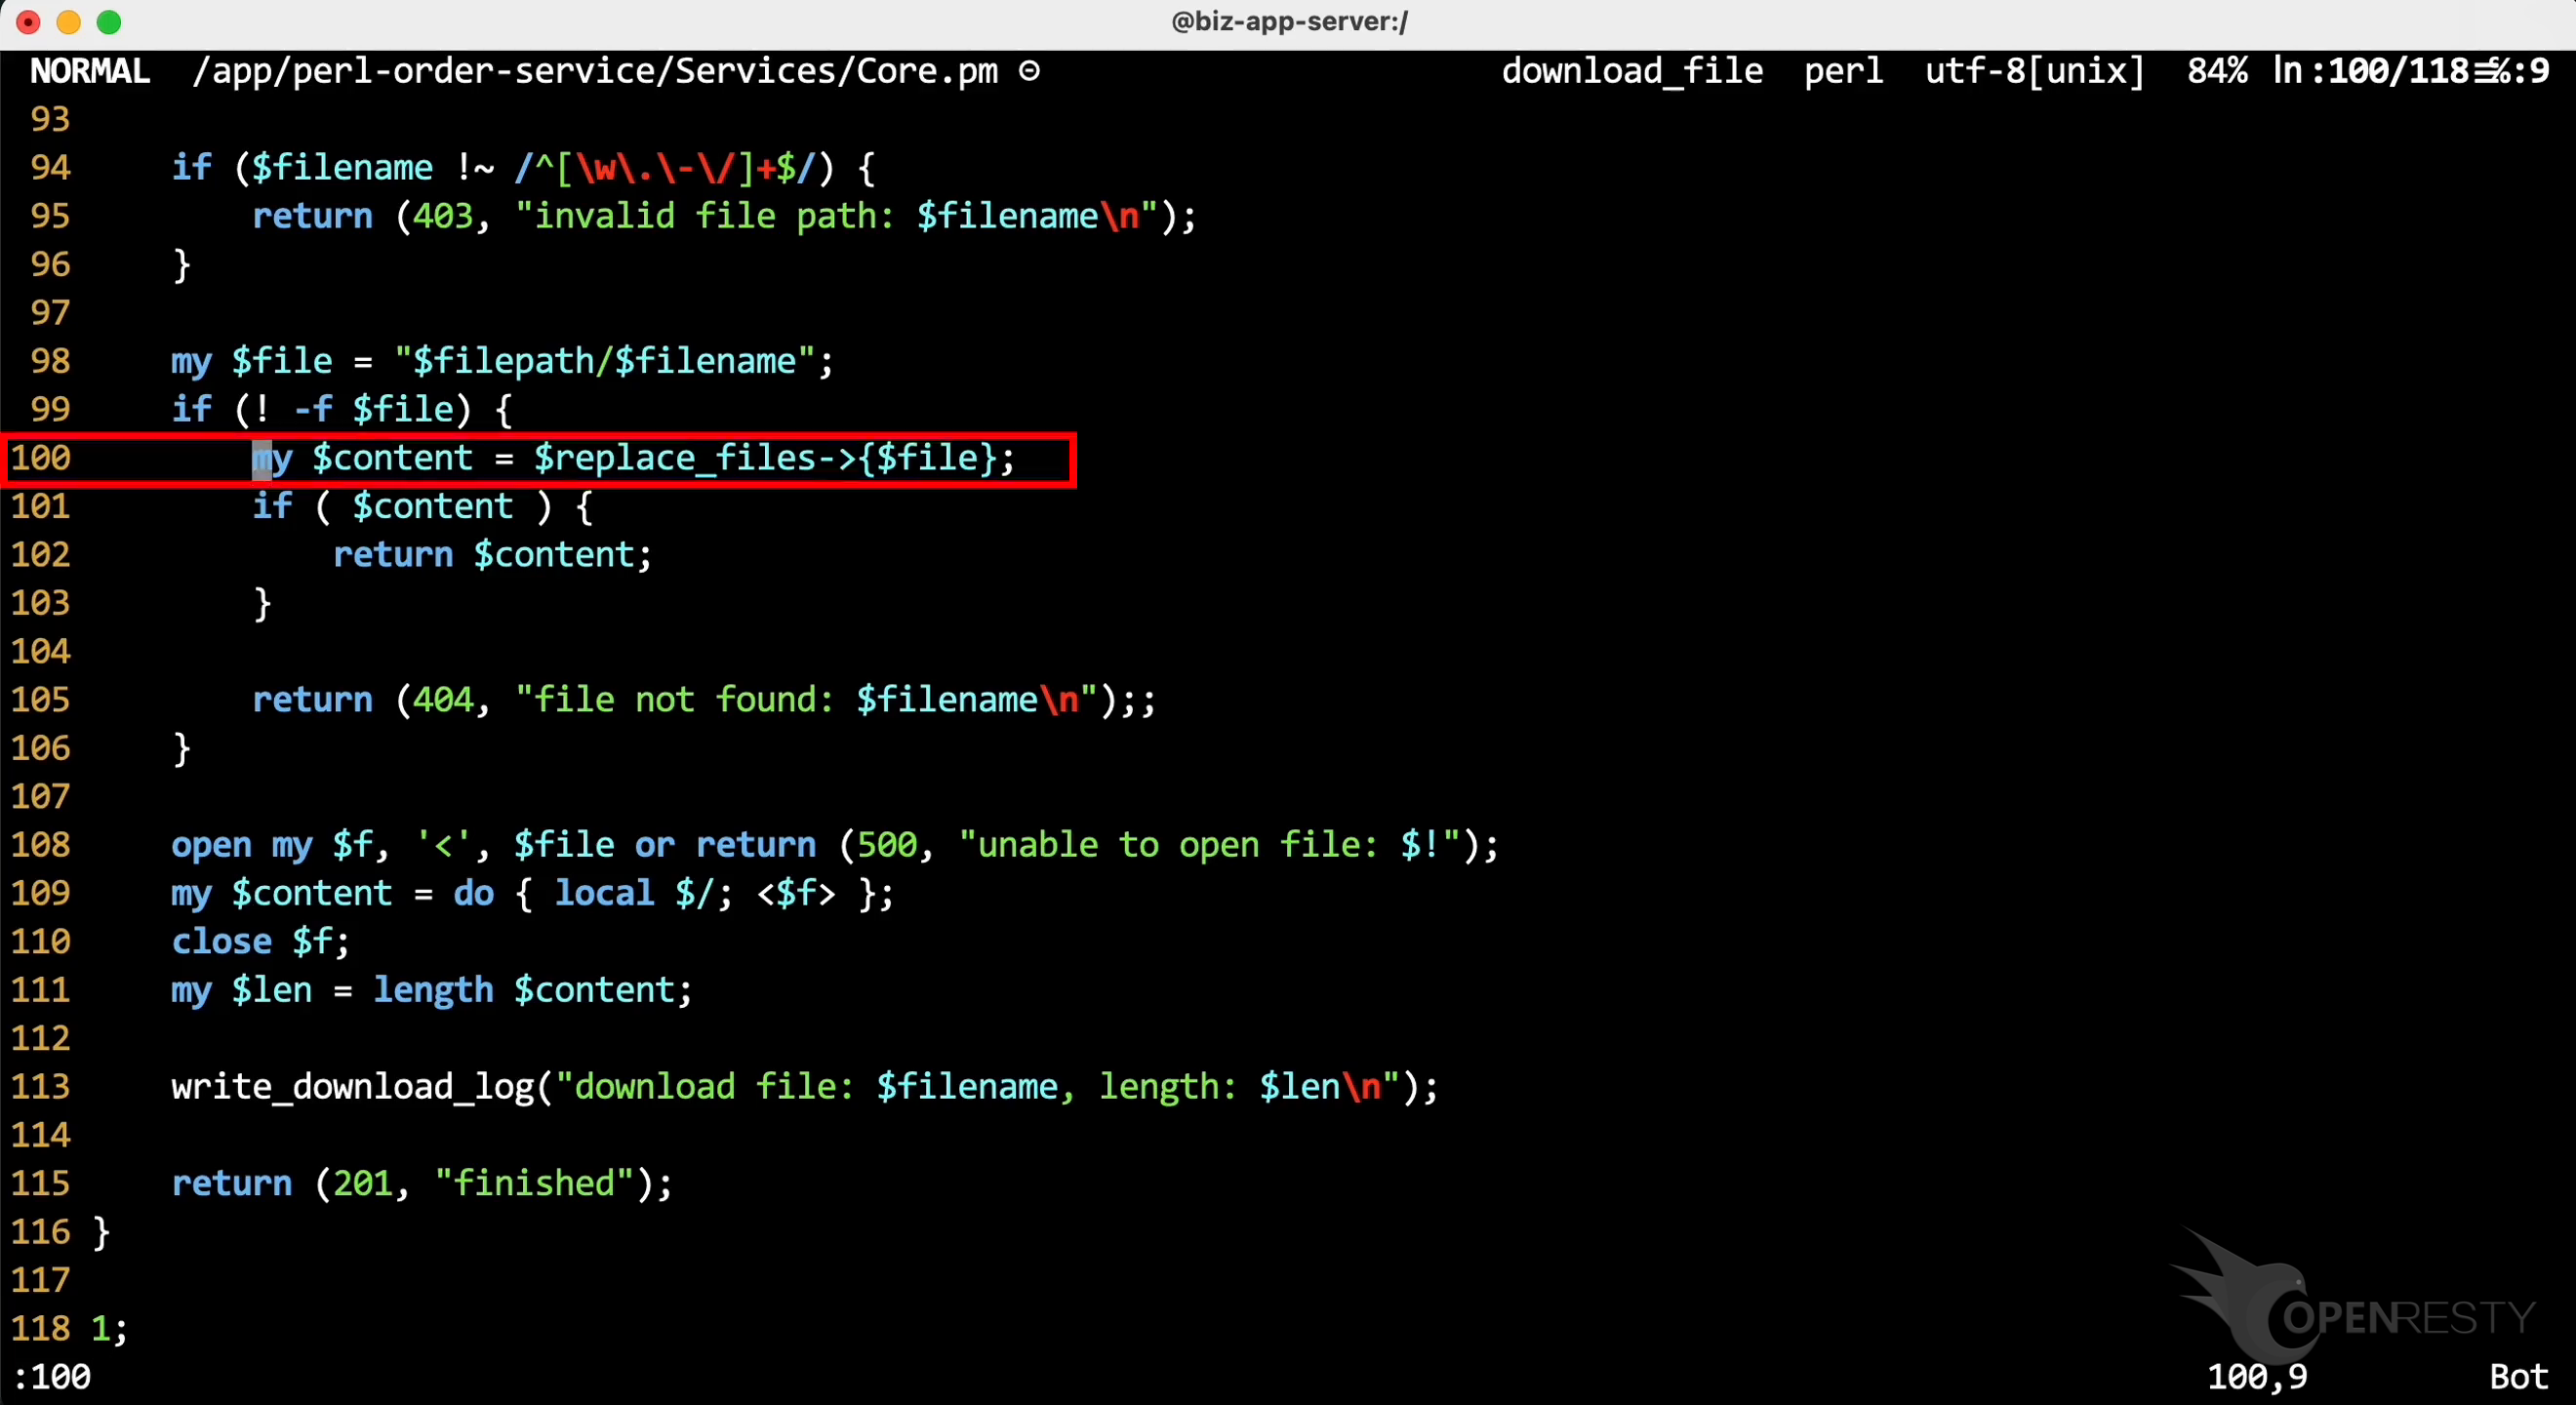
The Perl source line number is 100.
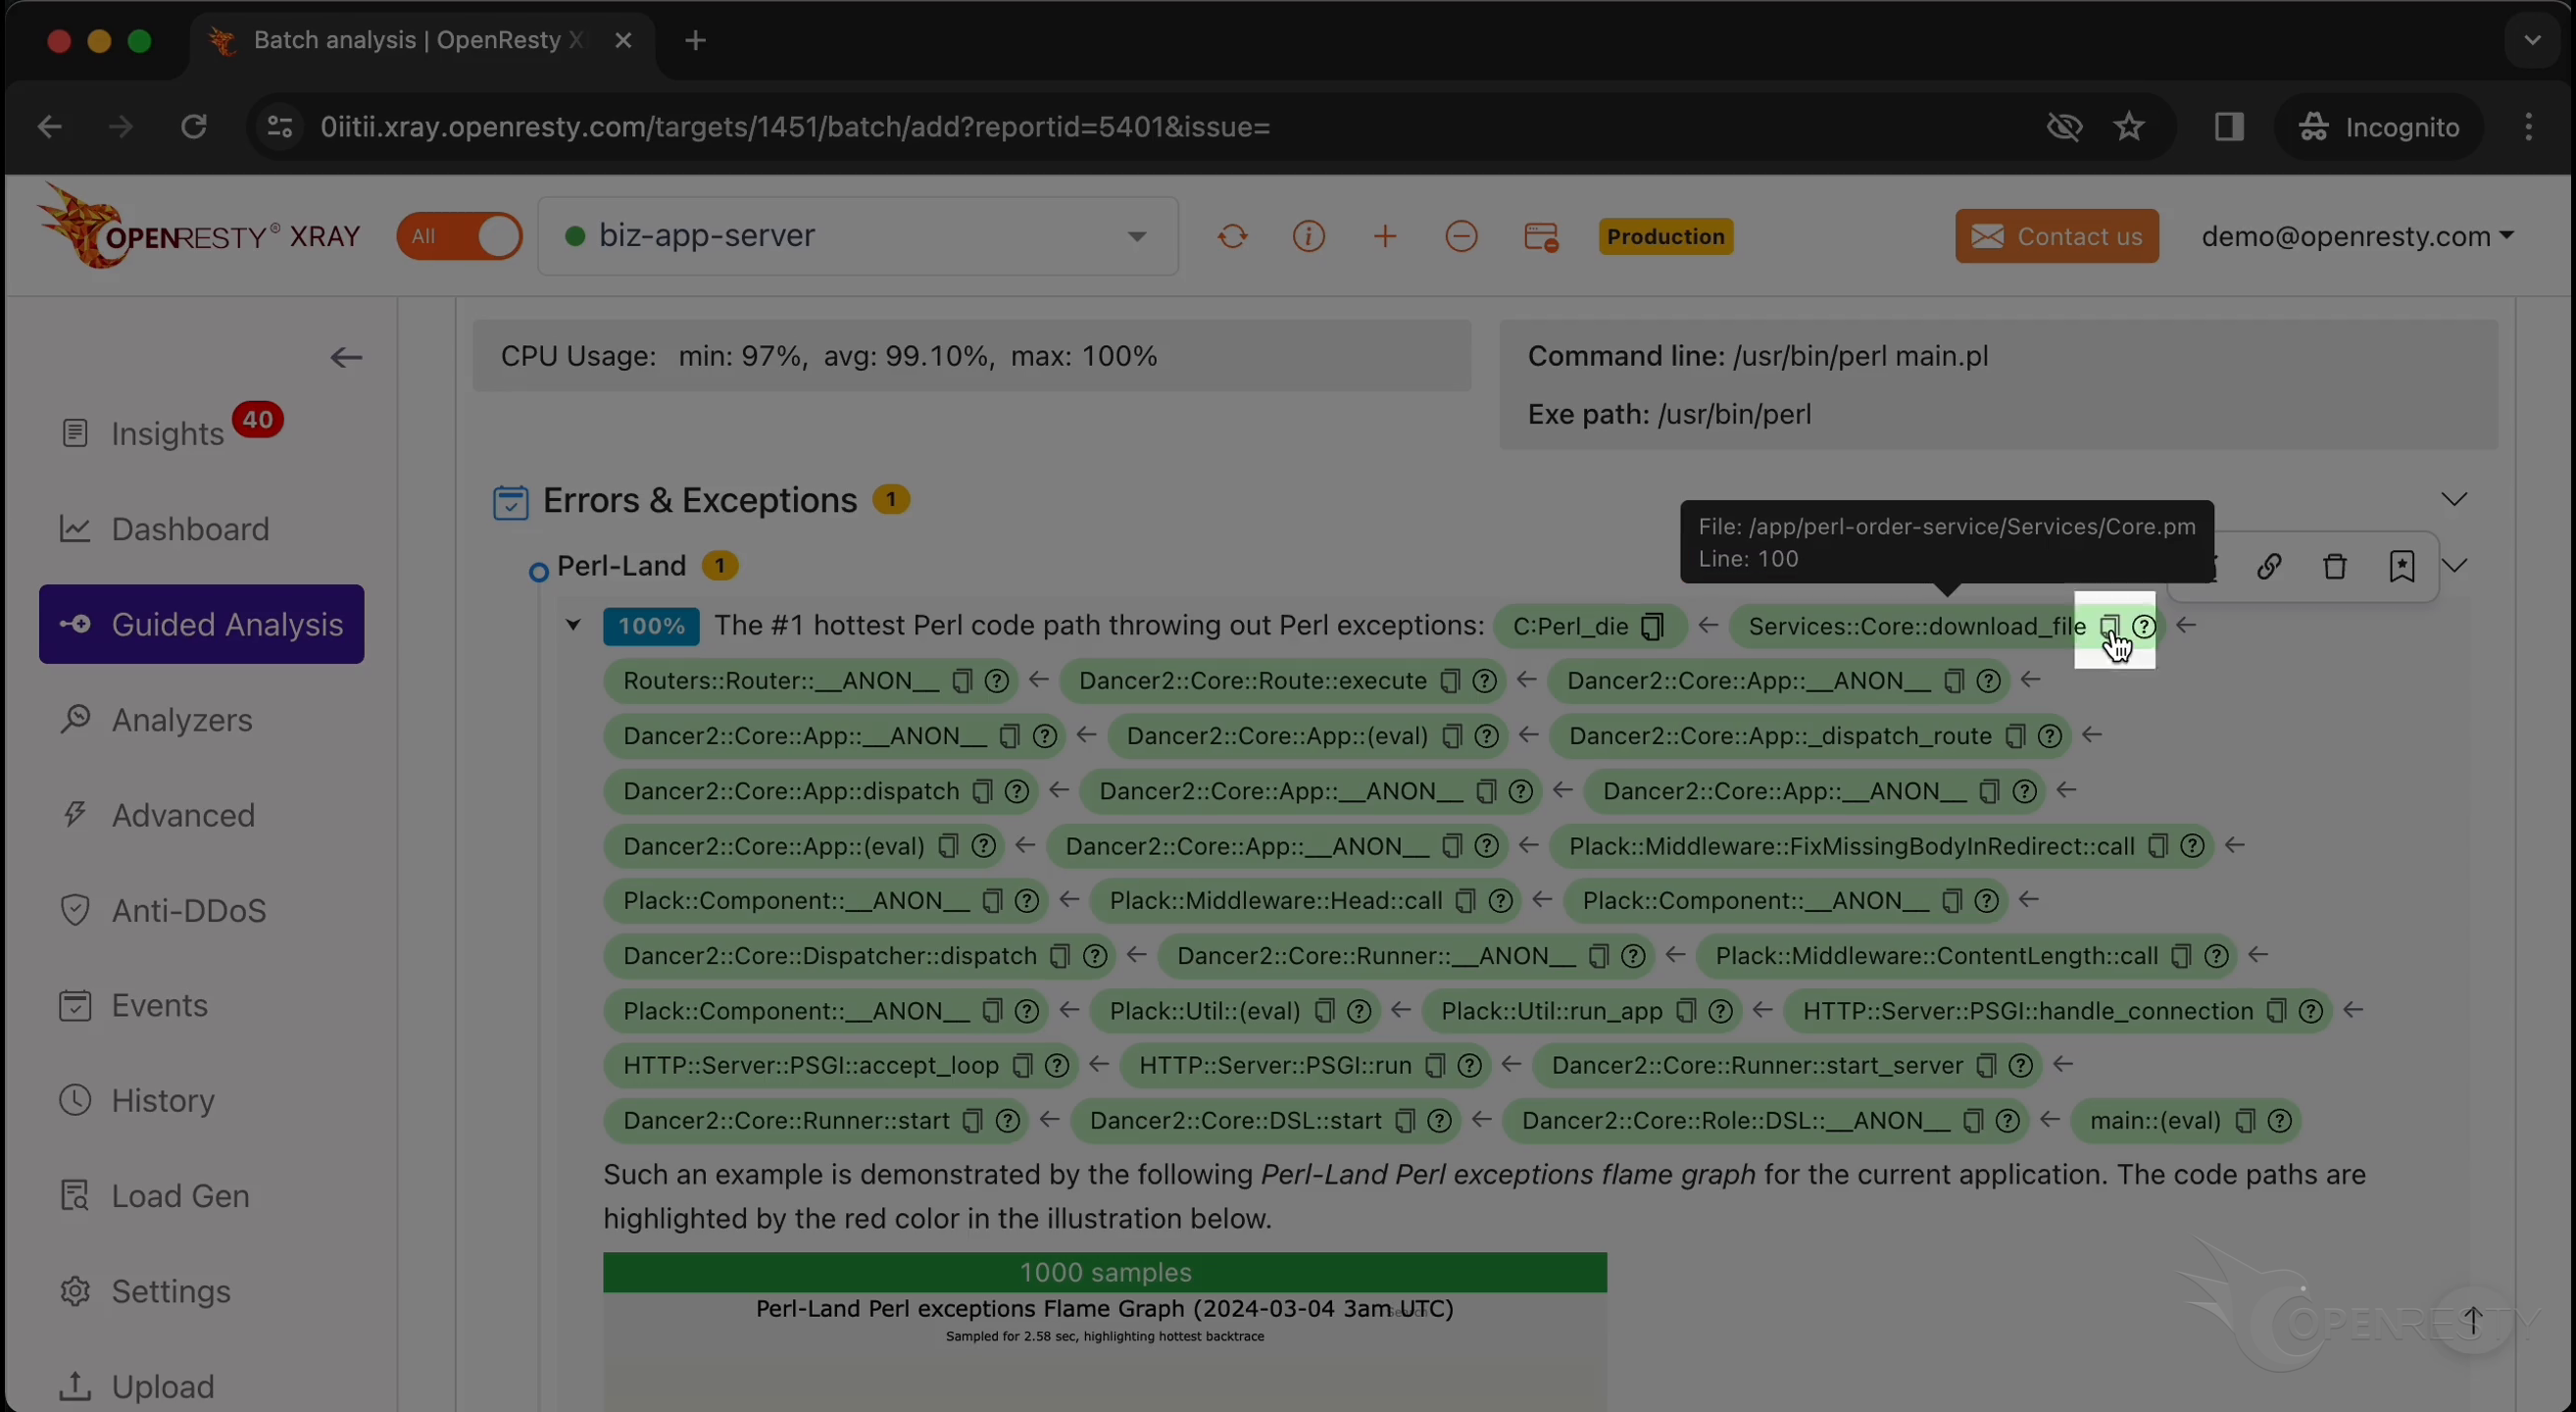
Click the icon to copy the source file path.
On the terminal, use the vim editor to open the source file. Paste the file path we just copied. You can use any editor you like.
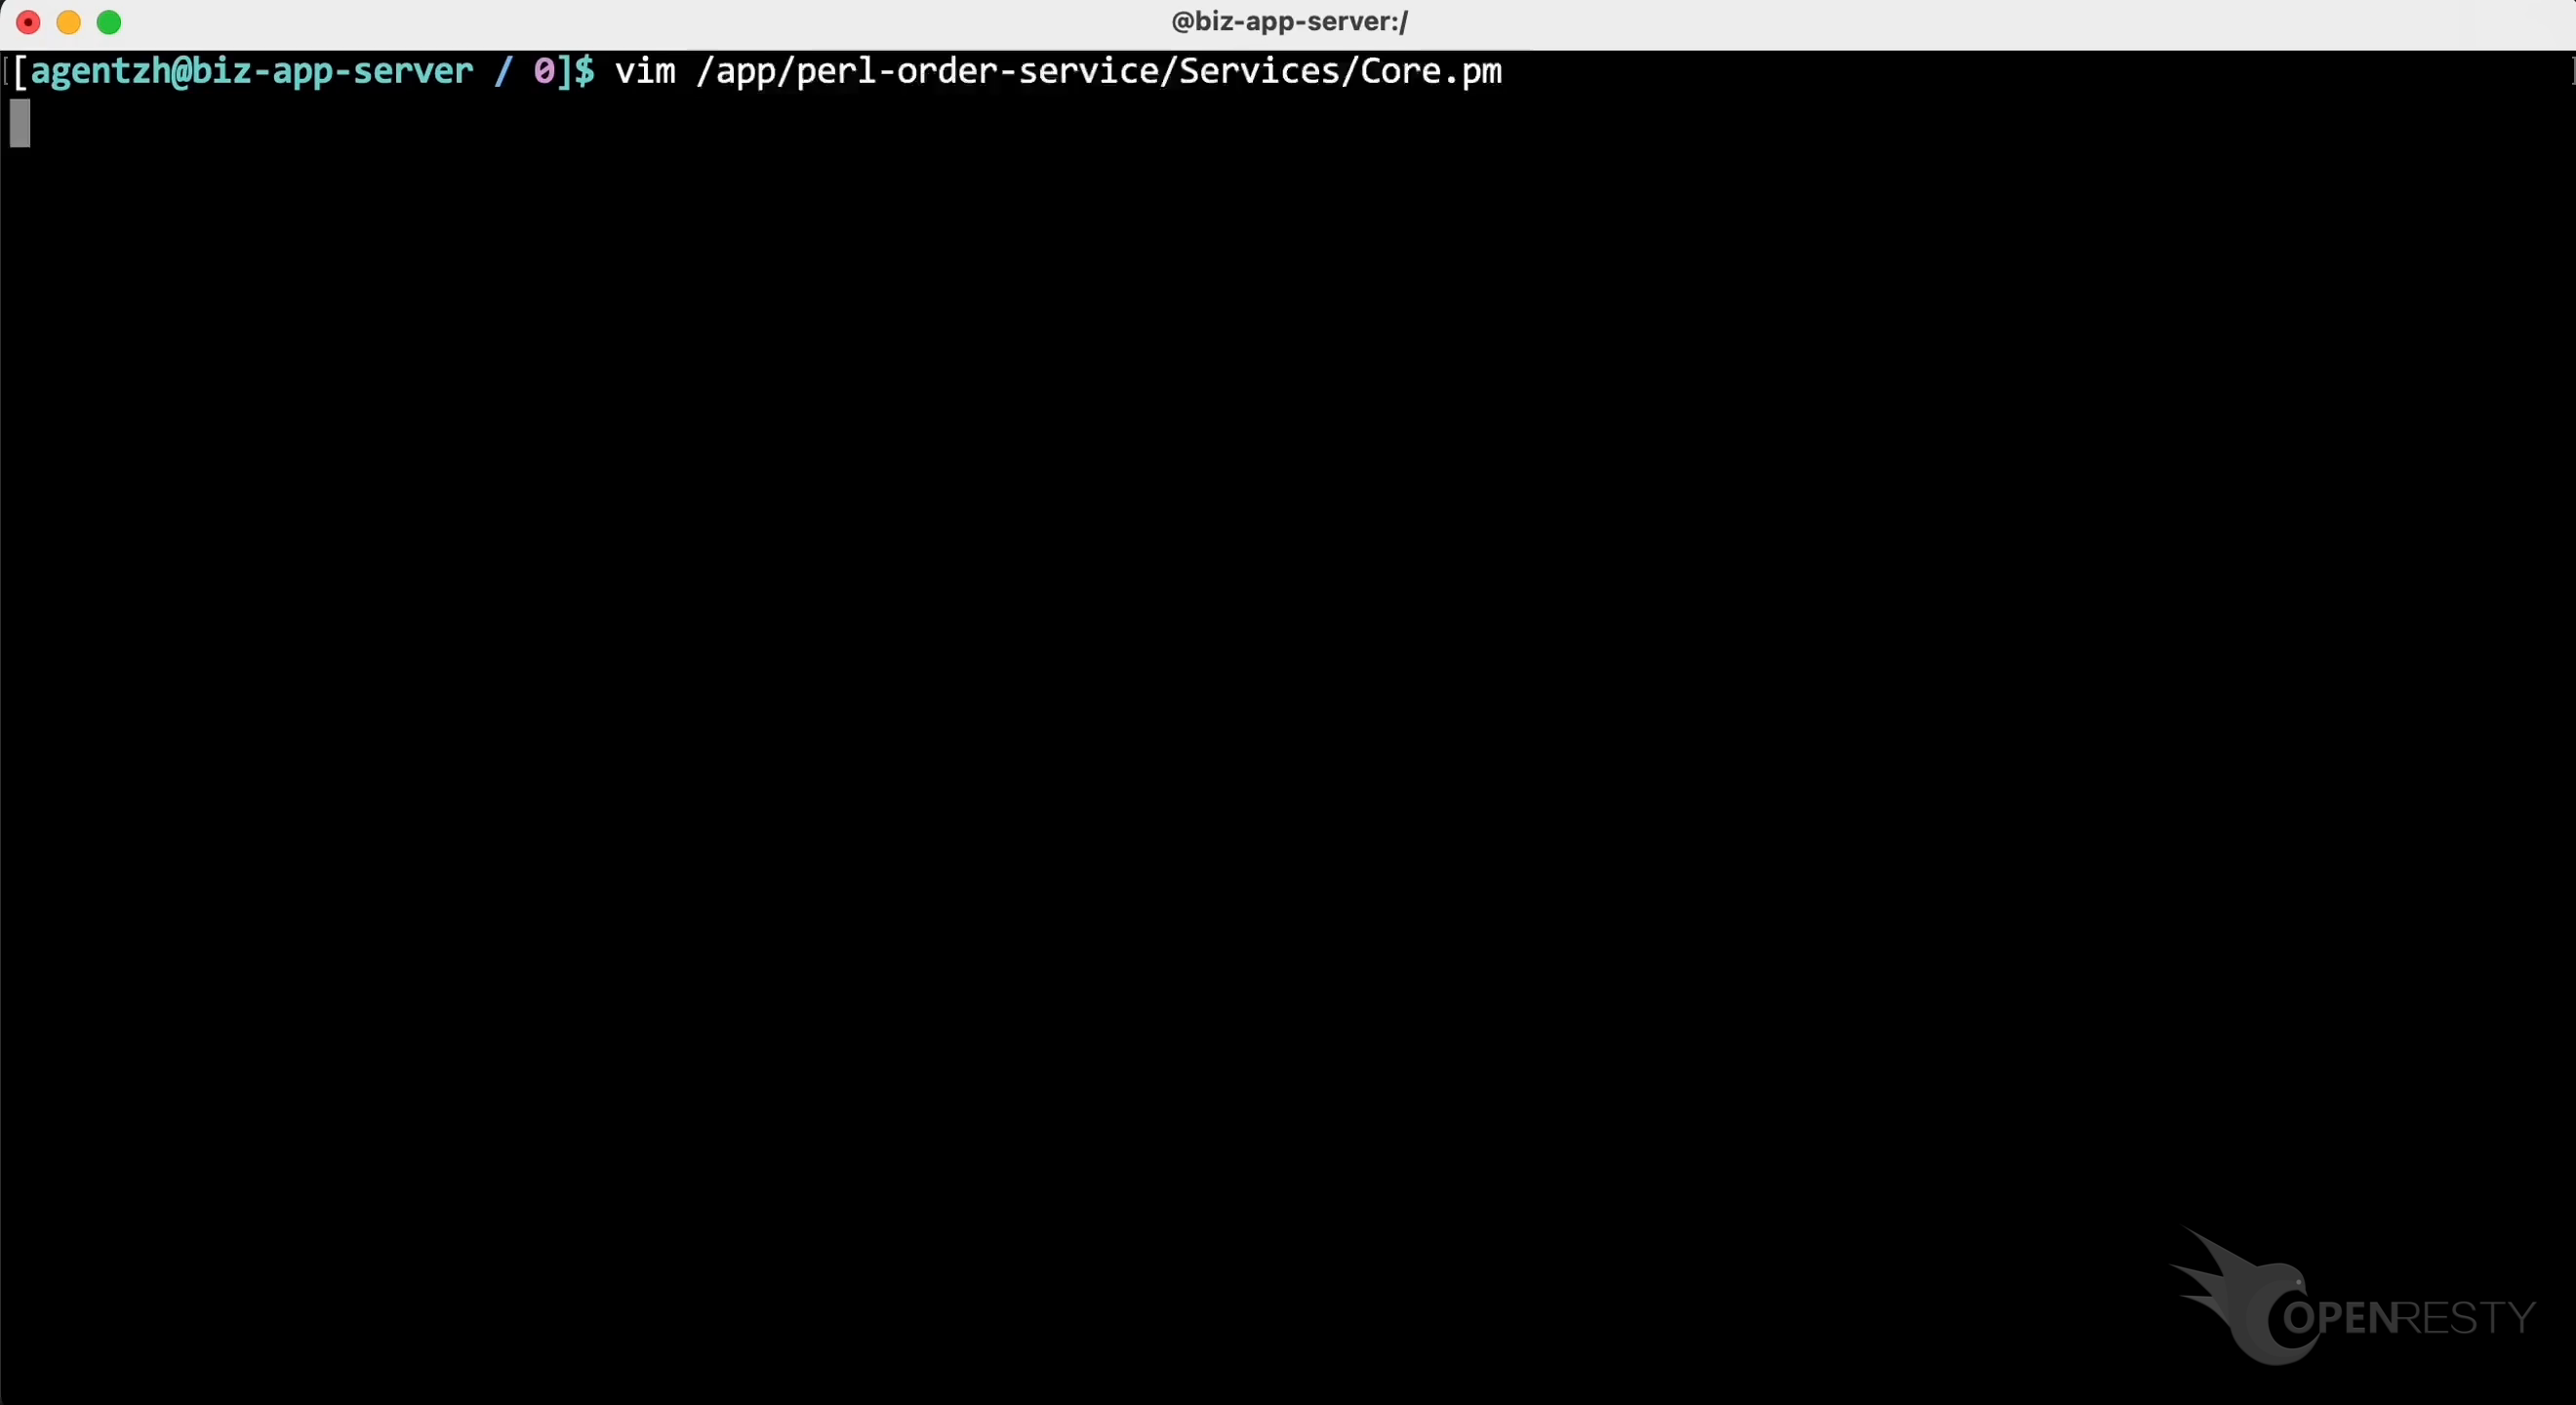
Go to line 100, as OpenResty XRay suggested.
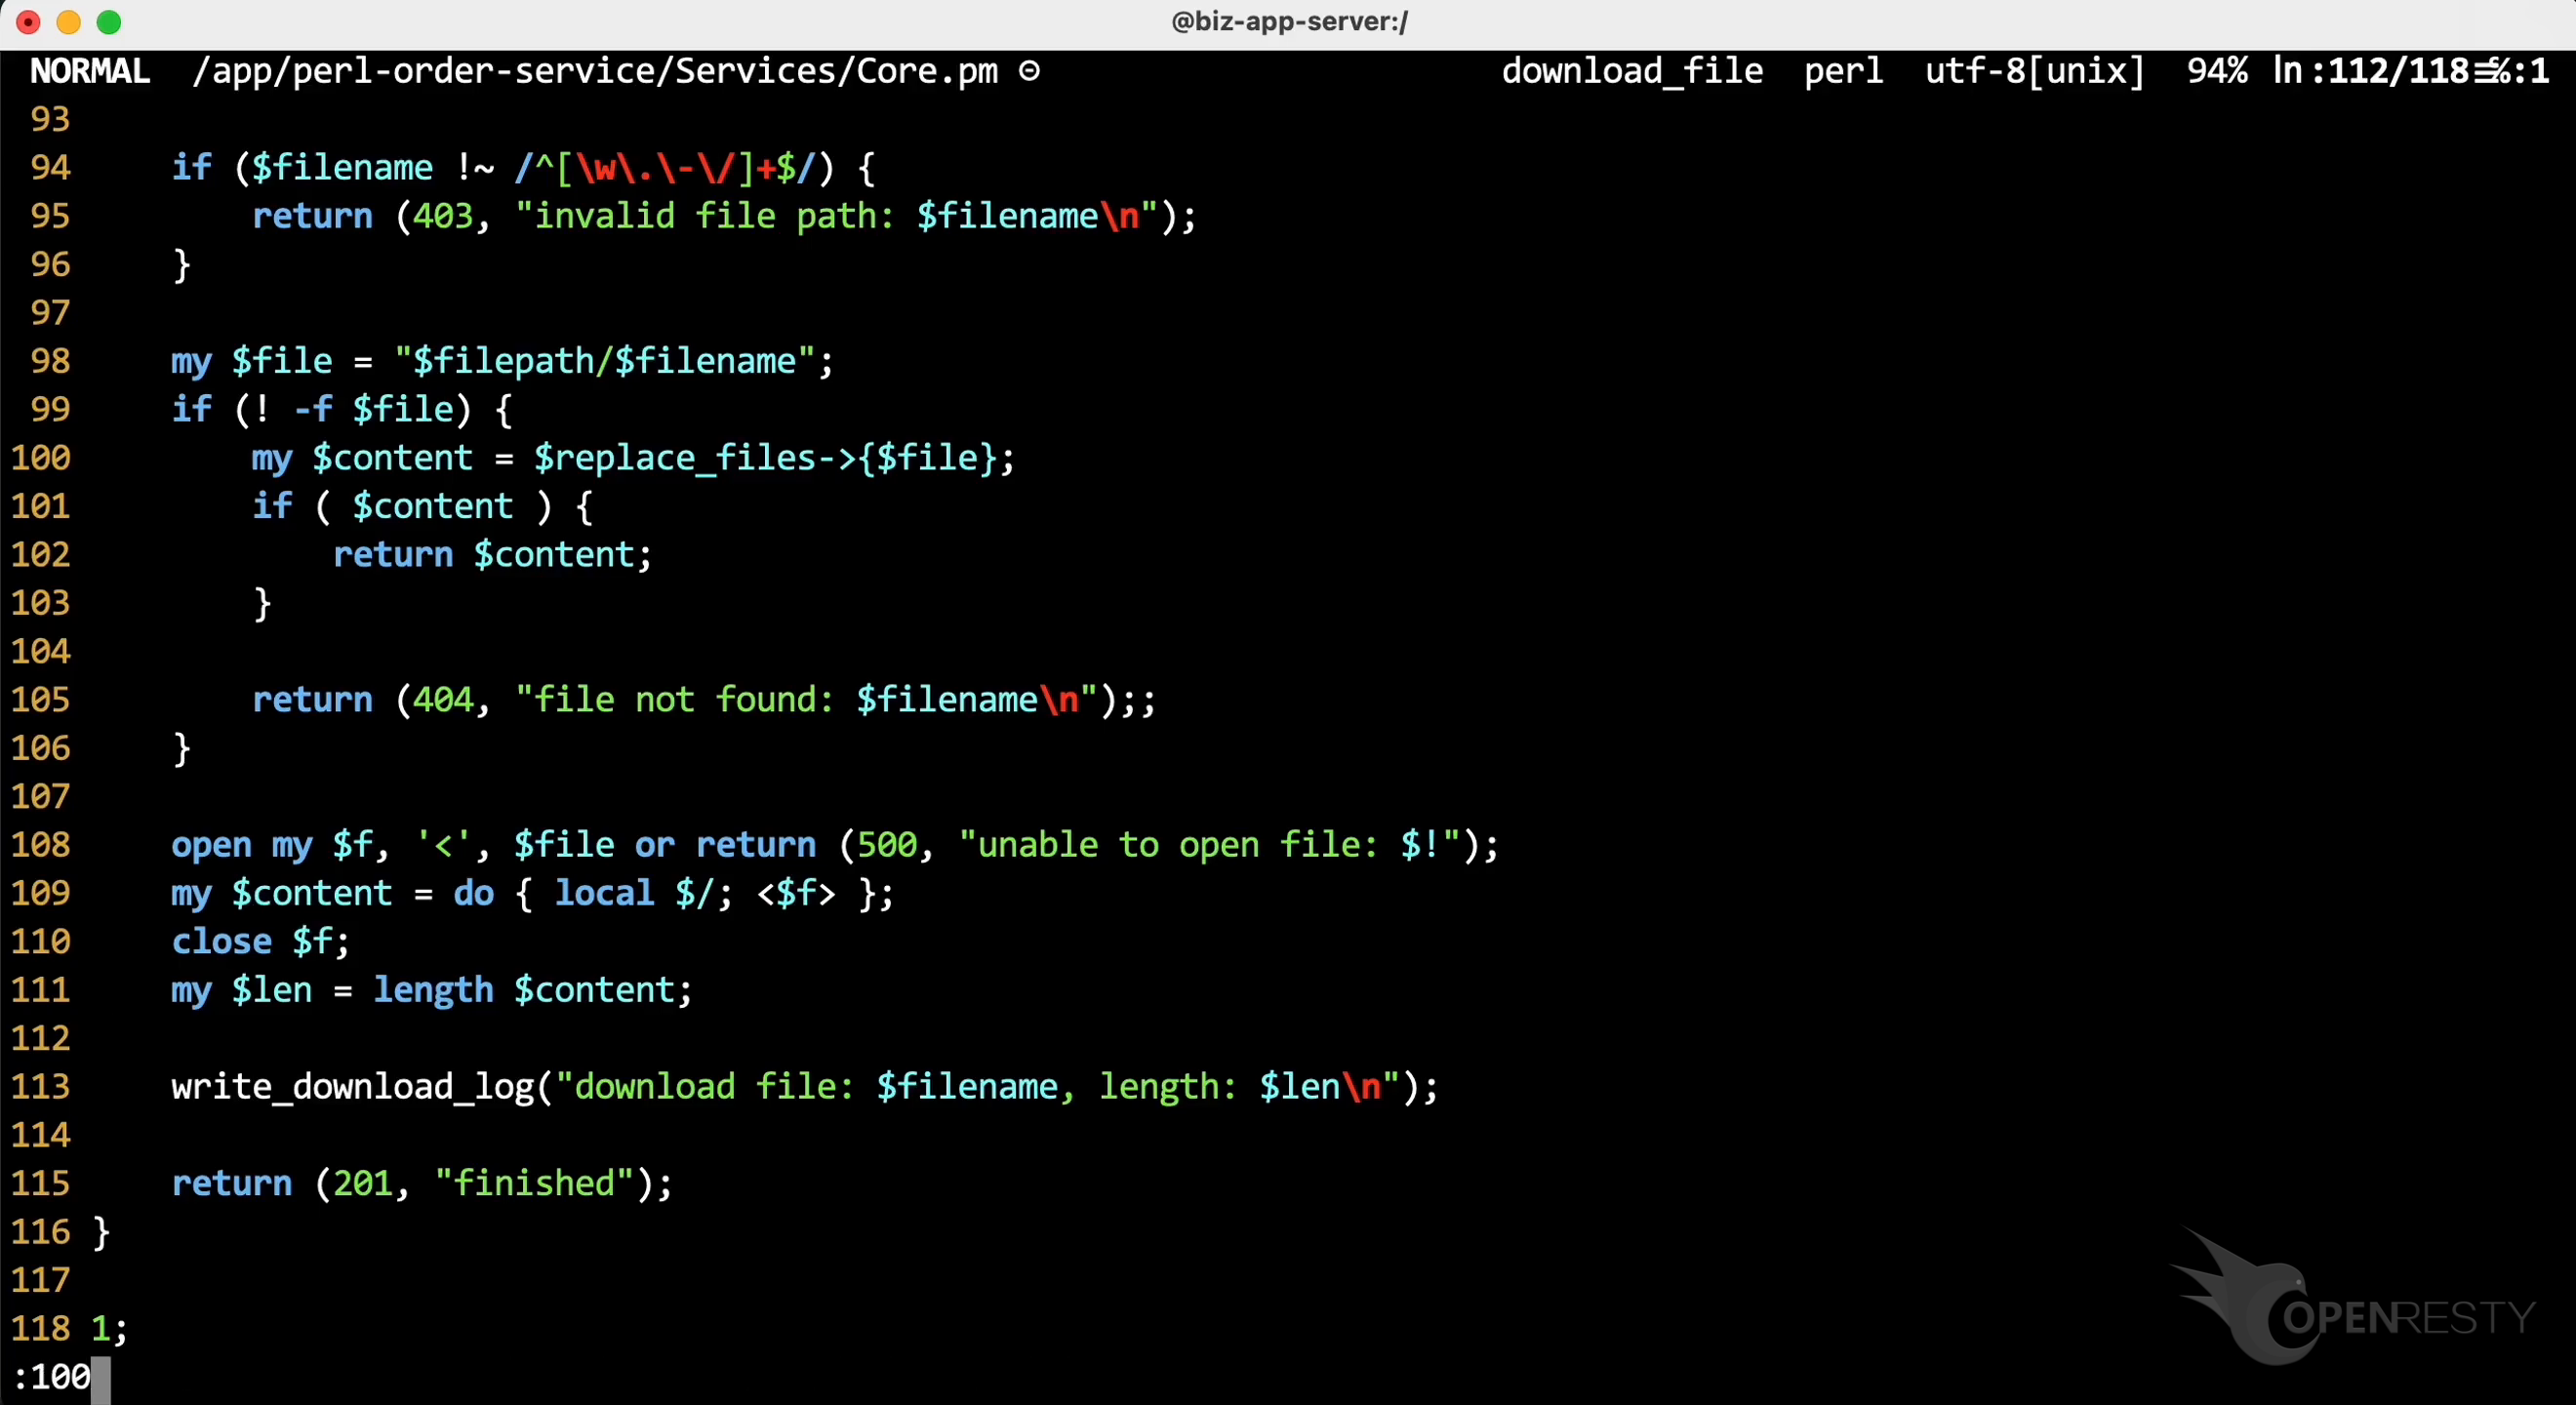
This is caused when using a Perl array variable reference as a hash table reference. The exception is actually caught by higher-level Perl code, so it doesn’t terminate the application. Nevertheless, OpenResty XRay can still accurately detect such exceptions and report them to the user.
Automatic analysis and reports
OpenResty XRay can also monitor online processes automatically and show analysis reports.
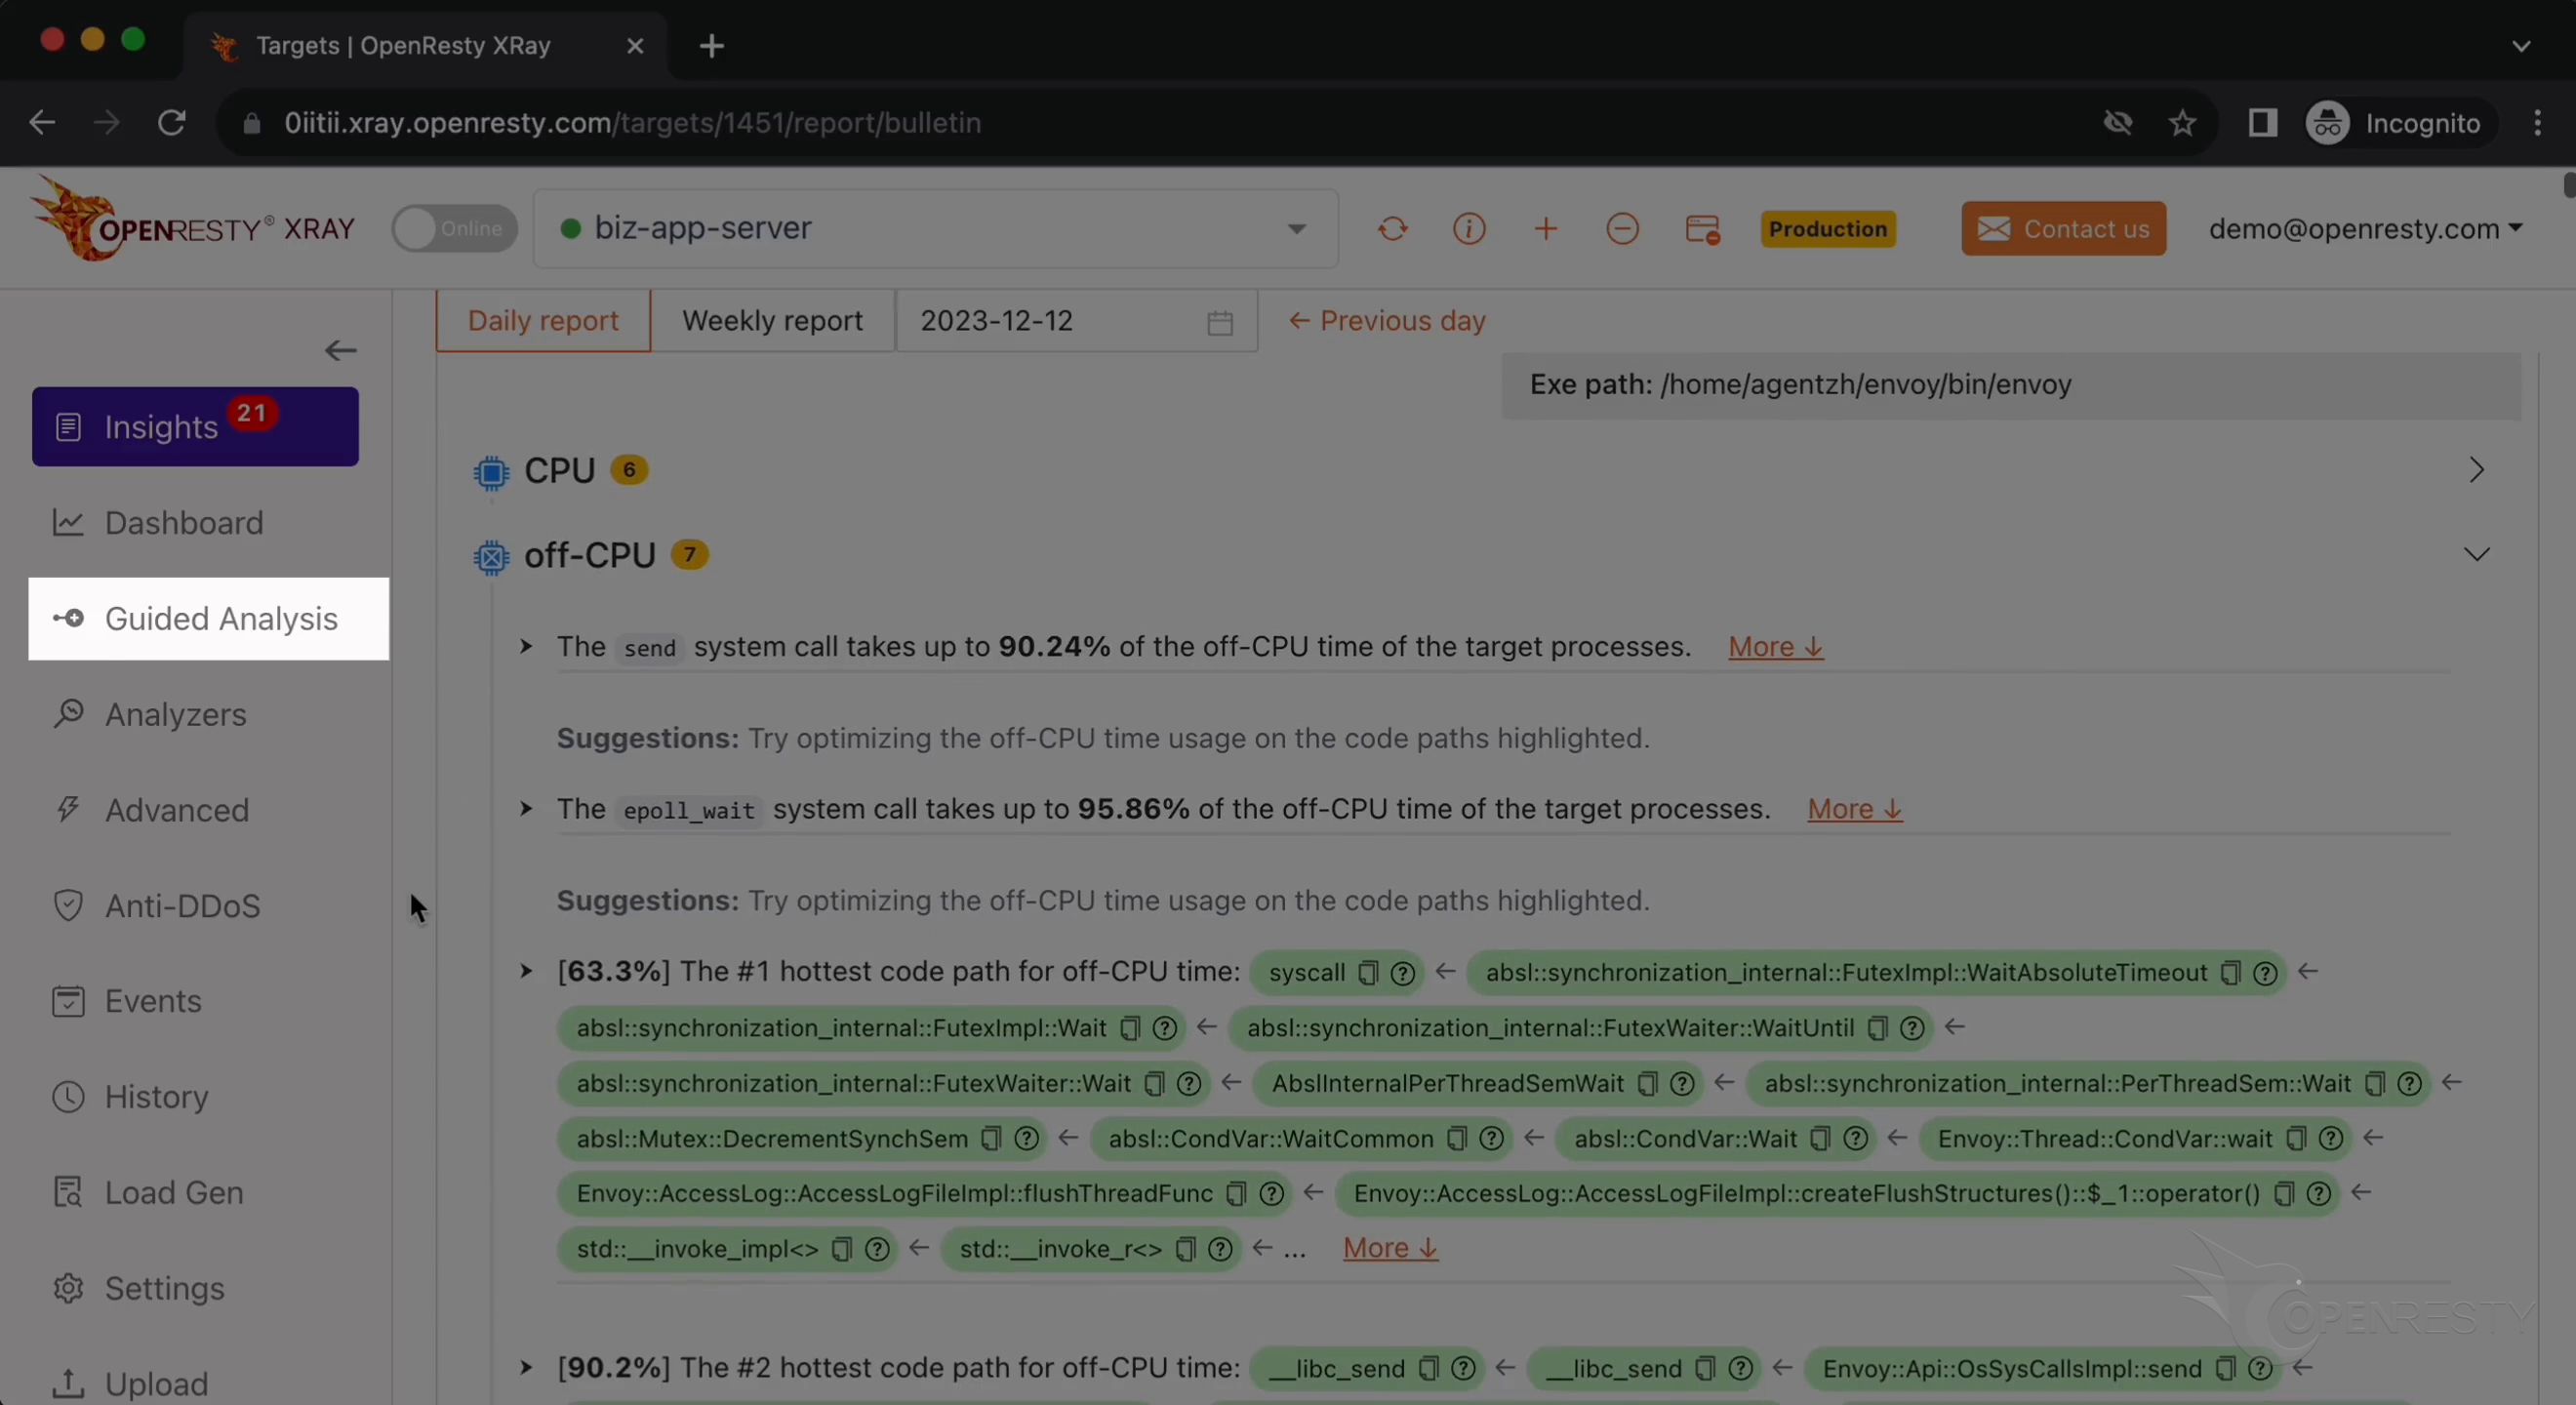
Go to the “Insights” page.
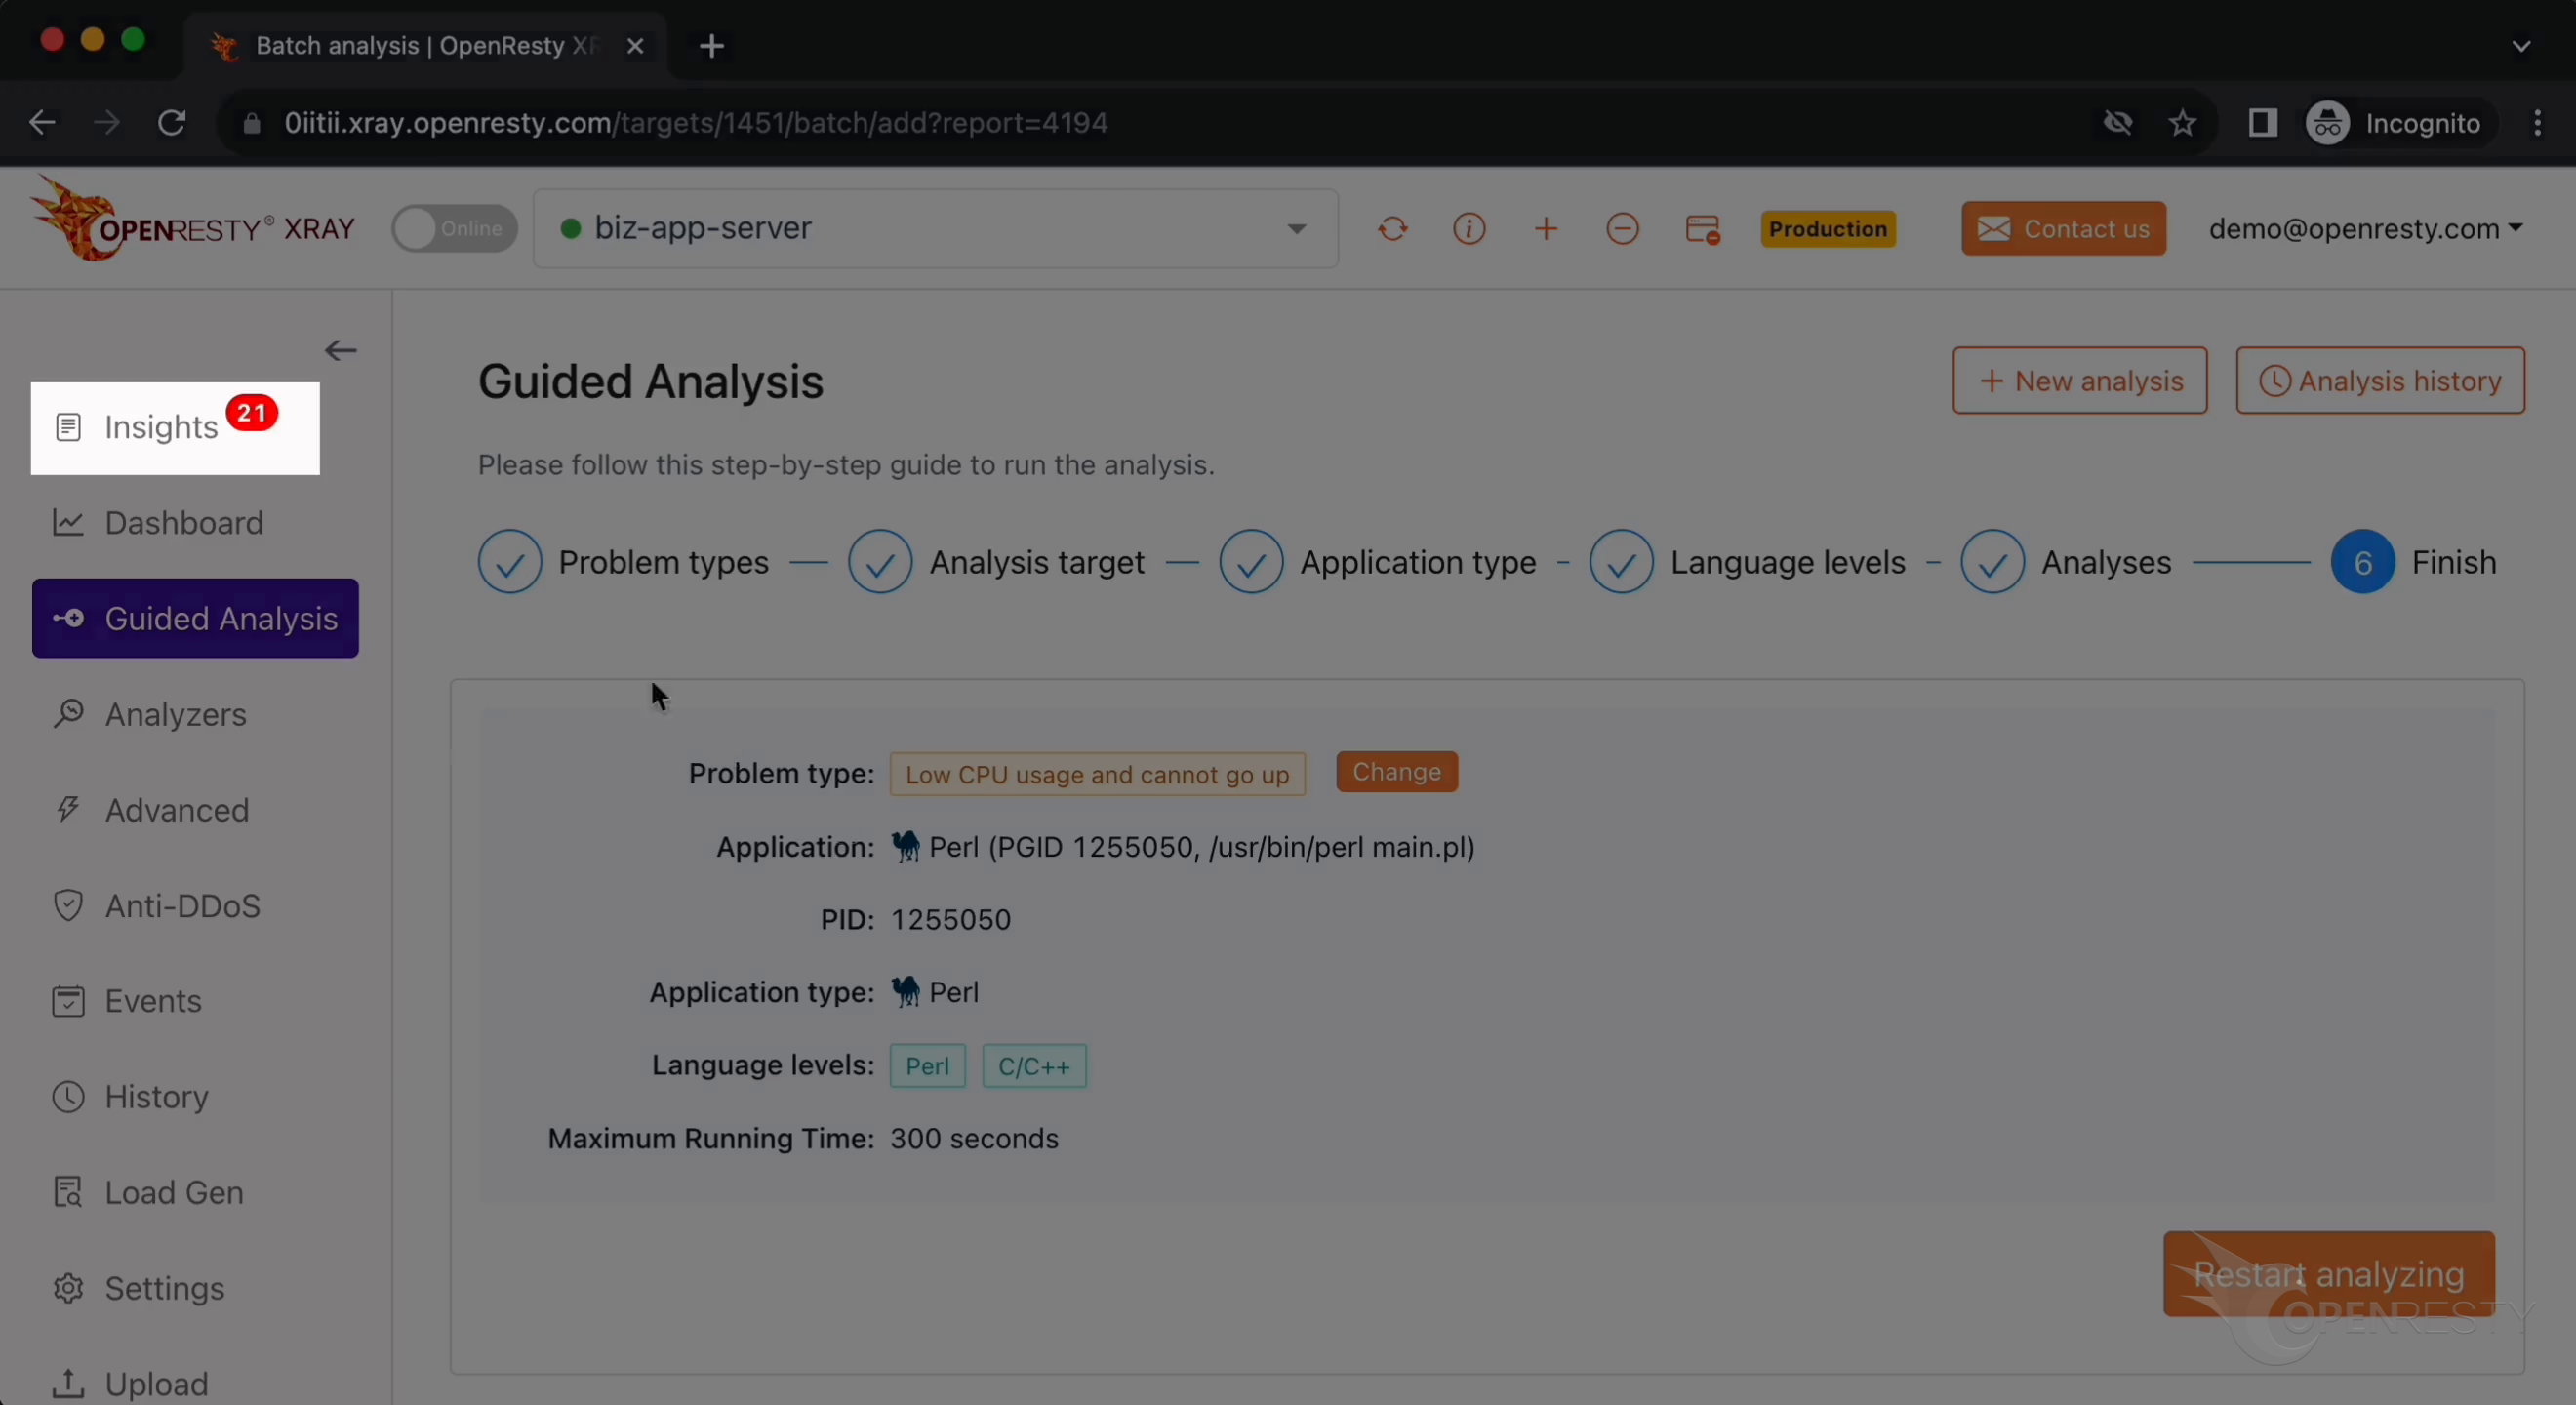
You can find the reports on the “Insights” page for daily and weekly periods. For this reason, you don’t have to use the “Guided Analysis” feature.
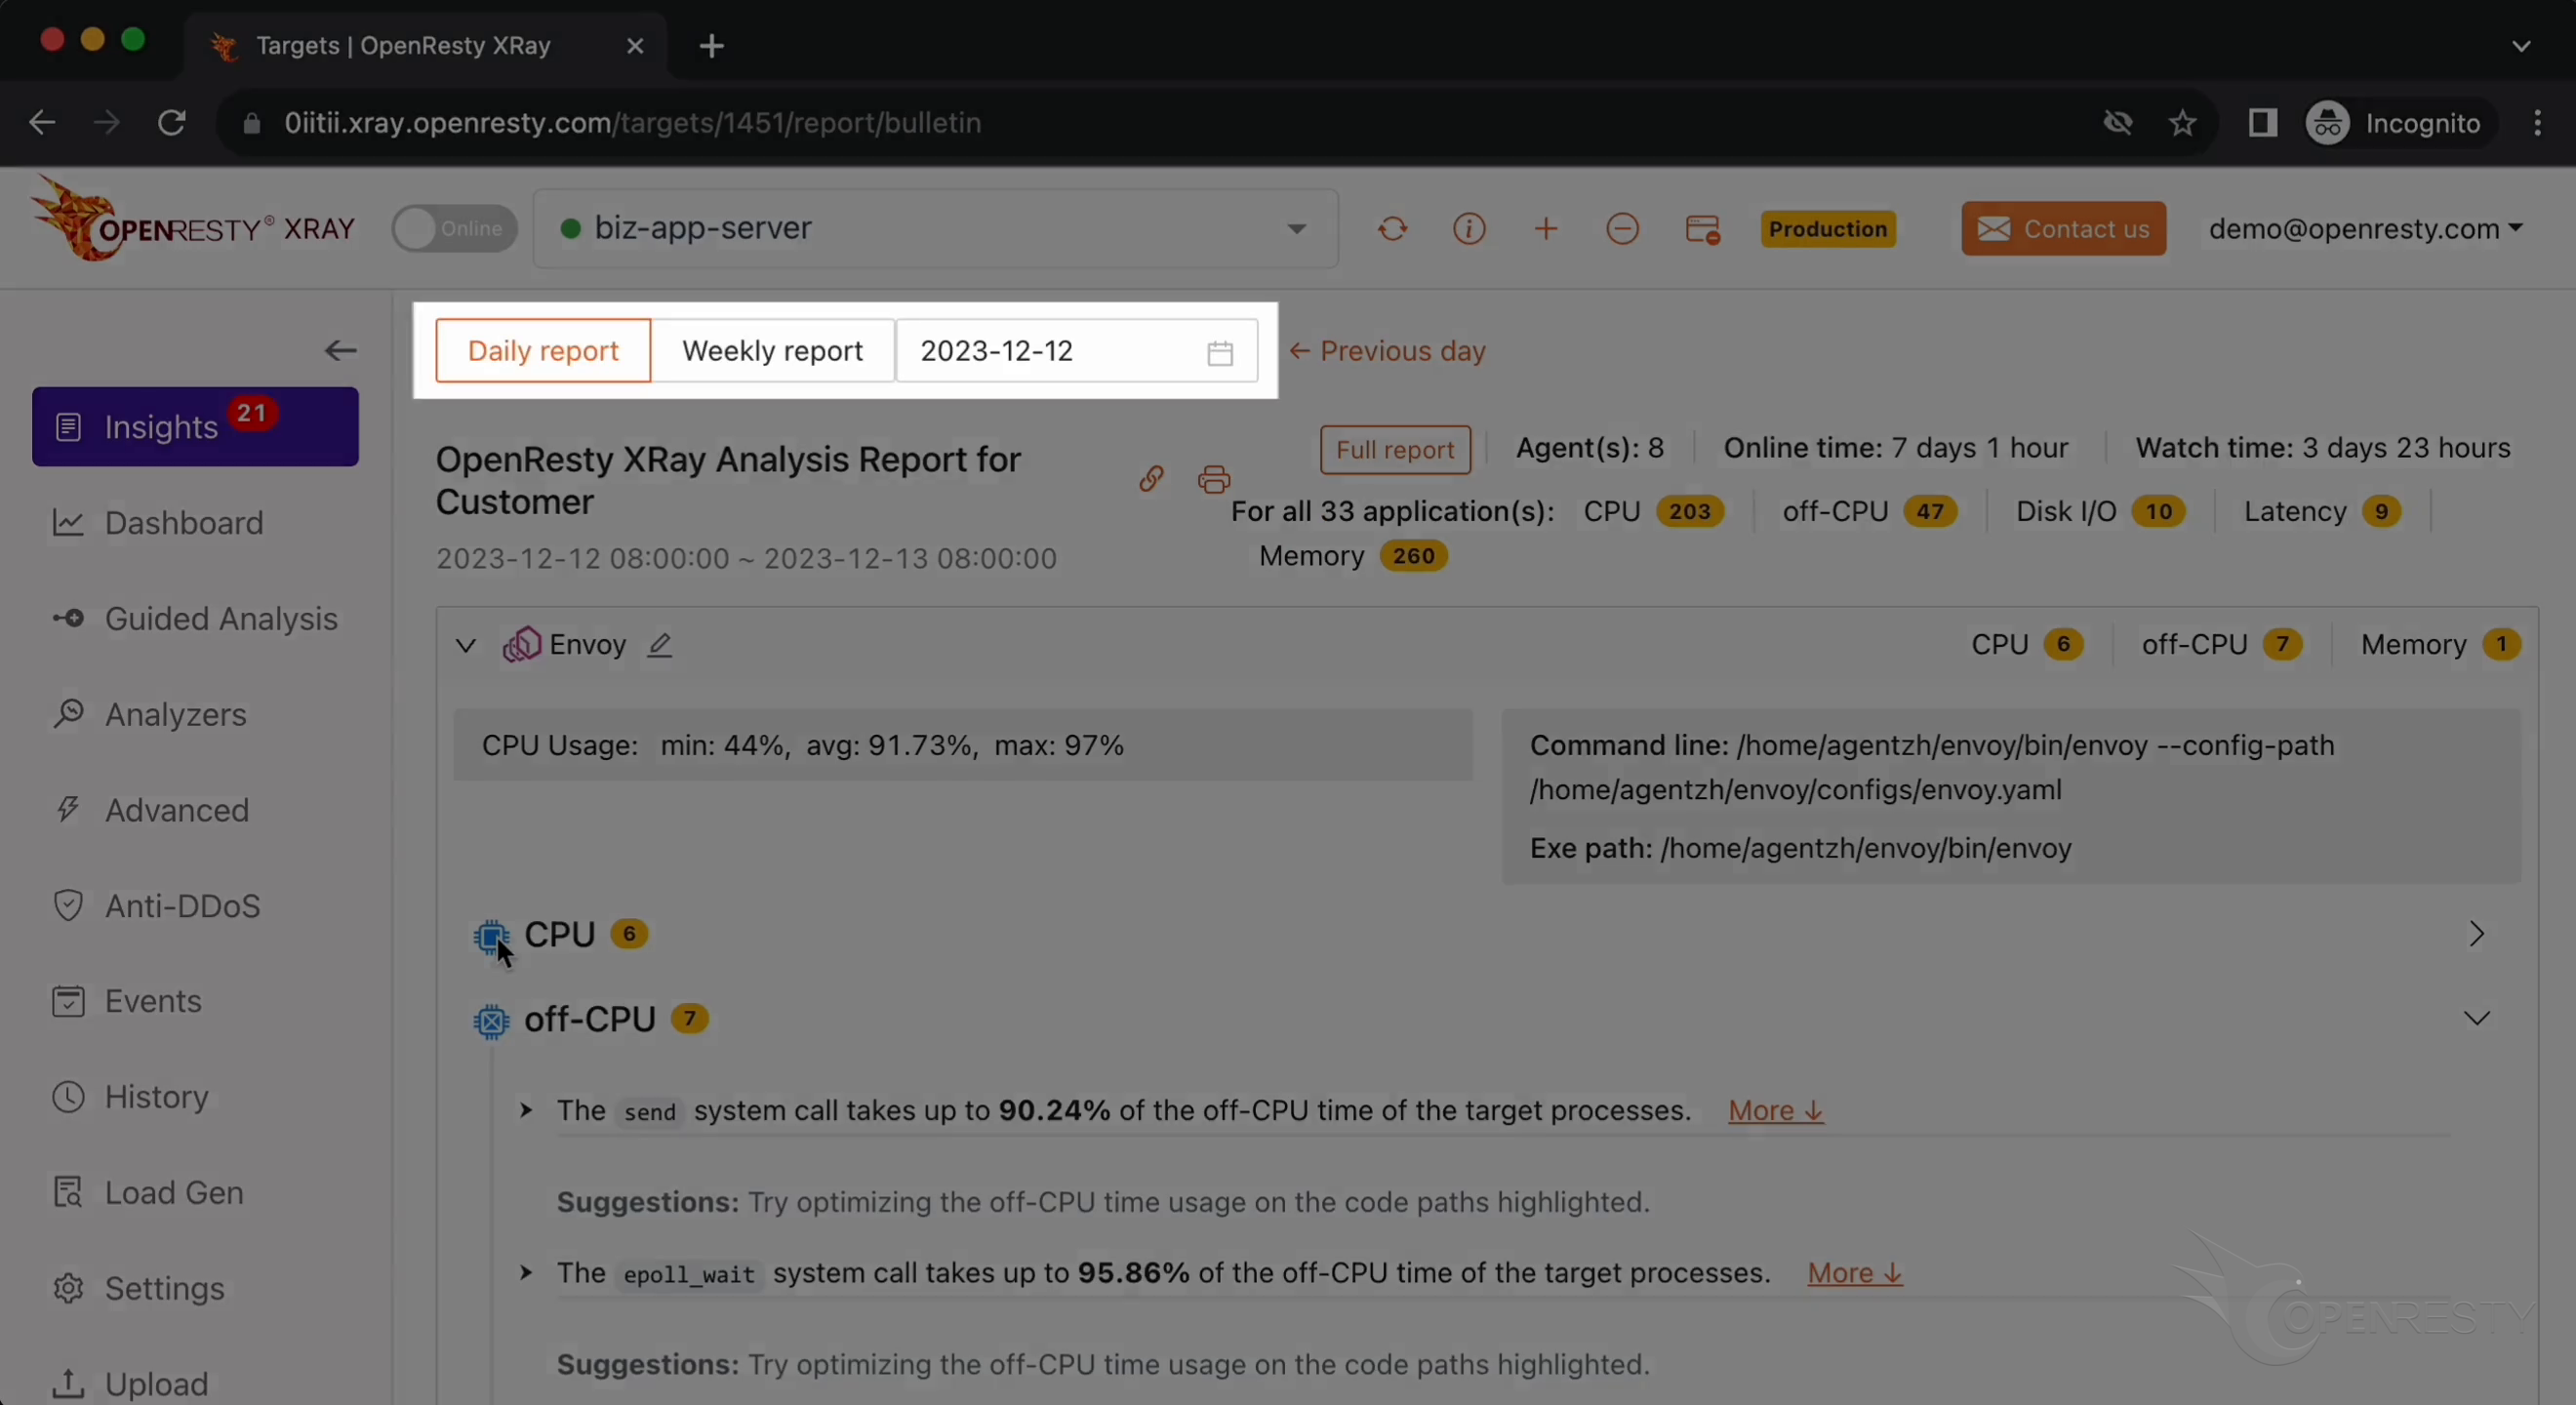
Though “Guided Analysis” is useful for application development and demonstration purposes.
What is OpenResty XRay
OpenResty XRay is a dynamic-tracing product that automatically analyzes your running applications to troubleshoot performance problems, behavioral issues, and security vulnerabilities with actionable suggestions. Under the hood, OpenResty XRay is powered by our Y language targeting various runtimes like Stap+, eBPF+, GDB, and ODB, depending on the contexts.
If you like this tutorial, please subscribe to this blog site and/or our YouTube channel. Thank you!
About The Author
Yichun Zhang (Github handle: agentzh), is the original creator of the OpenResty® open-source project and the CEO of OpenResty Inc..
Yichun is one of the earliest advocates and leaders of “open-source technology”. He worked at many internationally renowned tech companies, such as Cloudflare, Yahoo!. He is a pioneer of “edge computing”, “dynamic tracing” and “machine coding”, with over 22 years of programming and 16 years of open source experience. Yichun is well-known in the open-source space as the project leader of OpenResty®, adopted by more than 40 million global website domains.
OpenResty Inc., the enterprise software start-up founded by Yichun in 2017, has customers from some of the biggest companies in the world. Its flagship product, OpenResty XRay, is a non-invasive profiling and troubleshooting tool that significantly enhances and utilizes dynamic tracing technology. And its OpenResty Edge product is a powerful distributed traffic management and private CDN software product.
As an avid open-source contributor, Yichun has contributed more than a million lines of code to numerous open-source projects, including Linux kernel, Nginx, LuaJIT, GDB, SystemTap, LLVM, Perl, etc. He has also authored more than 60 open-source software libraries.
Related Articles
OpenResty XRay Aug 4, 2024
")
OpenResty XRay Feb 19, 2024
")
OpenResty XRay Jan 19, 2024
")
OpenResty XRay Sep 5, 2024

OpenResty XRay Aug 12, 2024
")


")
")
")

")