





Featured Articles

Photo by Yichun Zhang

How a Single "0" Took Down Bilibili — Every Server at 100% CPU, and Reboots Didn't Help

How a Single "0" Took Down Bilibili — Every Server at 100% CPU, and Reboots Didn't Help

Binary Vulnerability Scanning: Catch Backported Patches, Cut False Positives

Binary Vulnerability Scanning: Catch Backported Patches, Cut False Positives

Binary Vulnerability Scanning: Catch Backported Patches, Cut False Positives

Introduction to OpenResty XRay

Introduction to OpenResty XRay

Introduction to OpenResty XRay

Nginx Reverse Proxy QPS Dropped 15x: A Missing upstream keepalive and an -O0 Debug Build

Nginx Reverse Proxy QPS Dropped 15x: A Missing upstream keepalive and an -O0 Debug Build

Nginx Reverse Proxy QPS Dropped 15x: A Missing upstream keepalive and an -O0 Debug Build

Non-Invasive Java Profiler: Capture Method Arguments in Production Without a Java Agent

Non-Invasive Java Profiler: Capture Method Arguments in Production Without a Java Agent

Non-Invasive Java Profiler: Capture Method Arguments in Production Without a Java Agent

Photo by Philip Brown

The Wonderland of Dynamic Tracing (Part 1 of 3)

The Wonderland of Dynamic Tracing (Part 1 of 3)

Photo by Jose G. Ortega Castro

How OpenResty and Nginx Shared Memory Zones Consume RAM

How OpenResty and Nginx Shared Memory Zones Consume RAM

Photo by Harrison Broadbent

Nginx Memory Usage Explained: Where the RAM Actually Goes

Nginx Memory Usage Explained: Where the RAM Actually Goes

OpenResty XRay reduce your CPU usage up to  90%
OpenResty XRay reduce your CPU usage up to 90%
Request free trial

Latest Articles

Python Memory Profiler: Find the Largest Objects Eating RAM Without Code Changes

  • Find which Python process is using the most memory
  • Profile Python memory with guided analysis: find the largest objects and their modules
  • Automatically monitor Python memory usage with scheduled reports
  • What is OpenResty XRay
  • Find which Python process is using the most memory
  • Profile Python memory with guided analysis: find the largest objects and their modules
  • Automatically monitor Python memory usage with scheduled reports
  • What is OpenResty XRay

Rust CPU Profiling: Find the Hottest Code Paths in Sled with OpenResty XRay

  • The problem: a Sled-based cache service using over 100% CPU
  • Profile the running Rust process with Guided Analysis
  • Read the Rust CPU flame graph: the #1 hottest code path
  • The #2 hottest code path: get_inner and view_for_key
  • Automatic Rust CPU analysis reports
  • Frequently asked questions
  • The problem: a Sled-based cache service using over 100% CPU
  • Profile the running Rust process with Guided Analysis
  • Read the Rust CPU flame graph: the #1 hottest code path
  • The #2 hottest code path: get_inner and view_for_key
  • Automatic Rust CPU analysis reports
  • Frequently asked questions

etcd High CPU Usage: Find the Hottest Go Code Paths with Flame Graphs

  • Symptom: etcd consuming over 70% of a CPU core
  • Use OpenResty XRay Guided Analysis to find the hottest Go code paths
  • Automatic etcd CPU monitoring and reports
  • What is OpenResty XRay
  • Symptom: etcd consuming over 70% of a CPU core
  • Use OpenResty XRay Guided Analysis to find the hottest Go code paths
  • Automatic etcd CPU monitoring and reports
  • What is OpenResty XRay

llama.cpp CPU Usage: 400% CPU Traced to ggml Hot Functions

  • Running llama.cpp and Observing 400% CPU Usage
  • Profiling llama.cpp CPU Usage with OpenResty XRay
  • Findings: The Hottest C++ Code Paths
  • What is OpenResty XRay
  • Running llama.cpp and Observing 400% CPU Usage
  • Profiling llama.cpp CPU Usage with OpenResty XRay
  • Findings: The Hottest C++ Code Paths
  • What is OpenResty XRay

Go Off-CPU Analysis: Tracing a Running Process Stuck at 2% CPU to a Blocking Shell Call

  • The symptom: Go service CPU usage stays low under load
  • Running off-CPU analysis on the live Go process with OpenResty XRay
  • Root cause: a blocking shell command at a single source line
  • Automatic analysis and reports
  • The symptom: Go service CPU usage stays low under load
  • Running off-CPU analysis on the live Go process with OpenResty XRay
  • Root cause: a blocking shell command at a single source line
  • Automatic analysis and reports

Python Process Stuck at 8% CPU: Off-CPU Analysis Traces a Blocking subprocess.run Call

  • The symptom: Python process CPU usage stays low under heavy requests
  • Find the blocking Python code paths with OpenResty XRay’s Guided Analysis
  • Automatic analysis and reports in the Insights page
  • FAQ
  • What is OpenResty XRay
  • About The Author
  • The symptom: Python process CPU usage stays low under heavy requests
  • Find the blocking Python code paths with OpenResty XRay’s Guided Analysis
  • Automatic analysis and reports in the Insights page
  • FAQ
  • What is OpenResty XRay
  • About The Author

Lua High CPU Usage: Find the Hottest Lua Code Path in Nginx/OpenResty

  • The symptom: an Nginx worker process using almost 100% CPU
  • Find the hottest Lua code path with Guided Analysis
  • Monitor Lua CPU usage automatically with Insights reports
  • Frequently asked questions
  • The symptom: an Nginx worker process using almost 100% CPU
  • Find the hottest Lua code path with Guided Analysis
  • Monitor Lua CPU usage automatically with Insights reports
  • Frequently asked questions

Kong Plugin High CPU Usage: A Hidden Lua Exception Traced with Flame Graphs

  • The problem: Kong plugin high CPU usage under light traffic
  • Finding the CPU bottleneck with an OpenResty XRay flame graph
  • The result: Kong CPU usage cut from 80% to 50%
Photo by Yichun Zhang
  • The problem: Kong plugin high CPU usage under light traffic
  • Finding the CPU bottleneck with an OpenResty XRay flame graph
  • The result: Kong CPU usage cut from 80% to 50%

Find Leaked Lua Tables: the registry / _LOADED (package.loaded) Reference Path in OpenResty XRay

  • How LuaJIT manages memory
  • OpenResty XRay’s command-line tools
  • A leaking Lua table example
  • Breaking down memory by LuaJIT GC object type
  • Reading the lj-gco-ref flame graph: registry, _LOADED, package.loaded
  • Fully-automated Lua memory leak analysis
  • How LuaJIT manages memory
  • OpenResty XRay’s command-line tools
  • A leaking Lua table example
  • Breaking down memory by LuaJIT GC object type
  • Reading the lj-gco-ref flame graph: registry, _LOADED, package.loaded
  • Fully-automated Lua memory leak analysis

Real-Time Request Counting against Nginx Processes via YSQL

  • How to install the run-ysql tool
  • Count total requests served in real time
  • Filter out specific requests
  • Using YSQL in the Web Console
  • True non-invasive tracing
Photo by Yichun Zhang
  • How to install the run-ysql tool
  • Count total requests served in real time
  • Filter out specific requests
  • Using YSQL in the Web Console
  • True non-invasive tracing

How to Configure an SNI Proxy in OpenResty Edge: Route TLS by SNI Hostname Without Decryption

  • Create an SNI Proxy stream application
  • Create upstreams and SNI Server Name page rules
  • Add an SNI Proxy port to the gateway partition
  • Test the SNI proxy with curl and a browser
  • Create an SNI Proxy stream application
  • Create upstreams and SNI Server Name page rules
  • Add an SNI Proxy port to the gateway partition
  • Test the SNI proxy with curl and a browser
Contact us

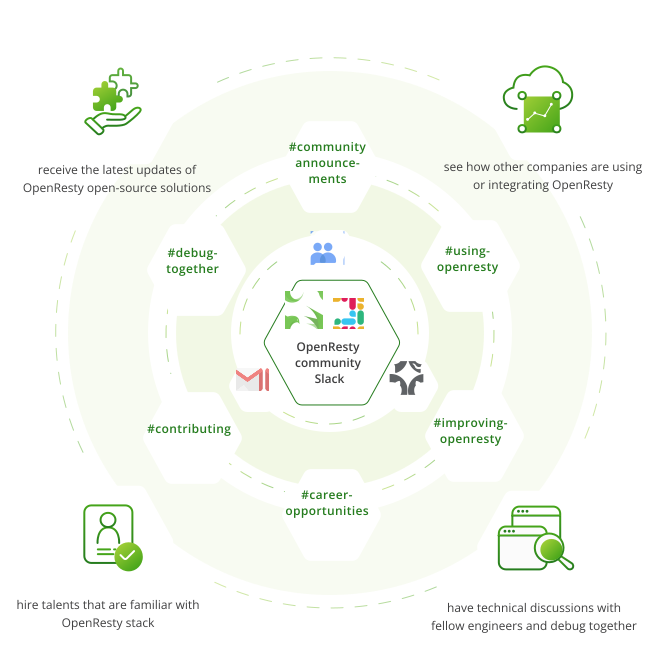
OpenResty open-source community workspace

Please join us here and share your thoughts and questions with us, we can't wait to see you there!


limited time offer

Request TRIAL today and receive a diagnostic REPORT
Learn more

Love to hear from you, Get in touch 👋

Message was sent successfully!

Our Team will get back to you within 24 hours.
x