



Featured Articles

Photo by Yichun Zhang

How a Single "0" Took Down Bilibili — Every Server at 100% CPU, and Reboots Didn't Help

How a Single "0" Took Down Bilibili — Every Server at 100% CPU, and Reboots Didn't Help

Binary Vulnerability Scanning: Catch Backported Patches, Cut False Positives

Binary Vulnerability Scanning: Catch Backported Patches, Cut False Positives

Binary Vulnerability Scanning: Catch Backported Patches, Cut False Positives

Introduction to OpenResty XRay

Introduction to OpenResty XRay

Introduction to OpenResty XRay

Nginx Reverse Proxy QPS Dropped 15x: A Missing upstream keepalive and an -O0 Debug Build

Nginx Reverse Proxy QPS Dropped 15x: A Missing upstream keepalive and an -O0 Debug Build

Nginx Reverse Proxy QPS Dropped 15x: A Missing upstream keepalive and an -O0 Debug Build

Non-Invasive Java Profiler: Capture Method Arguments in Production Without a Java Agent

Non-Invasive Java Profiler: Capture Method Arguments in Production Without a Java Agent

Non-Invasive Java Profiler: Capture Method Arguments in Production Without a Java Agent

Photo by Philip Brown

The Wonderland of Dynamic Tracing (Part 1 of 3)

The Wonderland of Dynamic Tracing (Part 1 of 3)

Photo by Jose G. Ortega Castro

How OpenResty and Nginx Shared Memory Zones Consume RAM

How OpenResty and Nginx Shared Memory Zones Consume RAM

Photo by Harrison Broadbent

Nginx Memory Usage Explained: Where the RAM Actually Goes

Nginx Memory Usage Explained: Where the RAM Actually Goes

OpenResty XRay reduce your CPU usage up to  90%
OpenResty XRay reduce your CPU usage up to 90%
Request free trial

Latest Articles

Locate the Largest Memory Objects in a Live Perl Process

  • Symptom: a Perl process using high memory in top
  • Profile the process with OpenResty XRay guided analysis to find the largest Perl objects
  • Trace the largest object back to its source file
  • Monitor Perl process memory automatically with Insights reports
  • FAQ
  • What is OpenResty XRay
  • Symptom: a Perl process using high memory in top
  • Profile the process with OpenResty XRay guided analysis to find the largest Perl objects
  • Trace the largest object back to its source file
  • Monitor Perl process memory automatically with Insights reports
  • FAQ
  • What is OpenResty XRay

Install OpenResty XRay’s Agents on Ubuntu via Deb Packages

  • Logging in to the Console
  • Installing the Agent via Deb Packages
  • Checking the Agent Status and Logs
  • Configuring and Detecting Applications
  • Initiating Analyzers and Viewing Insights
  • Install Another Agent
  • What is OpenResty XRay
  • Logging in to the Console
  • Installing the Agent via Deb Packages
  • Checking the Agent Status and Logs
  • Configuring and Detecting Applications
  • Initiating Analyzers and Viewing Insights
  • Install Another Agent
  • What is OpenResty XRay

Performance Impact of OpenResty XRay when Tracing PHP Apps

  • What Happens to CPU, Memory, and Load During Profiling?
  • How Much Does Profiling Affect Throughput and Latency?
  • OpenResty XRay vs. Always-On APM Agents
  • FAQ
  • What Happens to CPU, Memory, and Load During Profiling?
  • How Much Does Profiling Affect Throughput and Latency?
  • OpenResty XRay vs. Always-On APM Agents
  • FAQ

Tested in Production: The Performance Impact of OpenResty XRay When Tracing Rust Applications

  • What Happens to CPU, Memory, and Load During Profiling?
  • How Much Does Profiling Affect Throughput and Latency?
  • OpenResty XRay vs. Always-On APM Agents
  • FAQ
  • What Happens to CPU, Memory, and Load During Profiling?
  • How Much Does Profiling Affect Throughput and Latency?
  • OpenResty XRay vs. Always-On APM Agents
  • FAQ

Dynamic-Tracing Custom Go Programs with Custom Ylang Analyzers (using OpenResty XRay)

  • Insert two key-value Pairs into a Go Variable
  • Write a Customize Ylang Analyzer to Dynamically Trace the Go program
  • Test the Results
  • What is OpenResty XRay
  • Insert two key-value Pairs into a Go Variable
  • Write a Customize Ylang Analyzer to Dynamically Trace the Go program
  • Test the Results
  • What is OpenResty XRay

Adding Custom Response Headers in OpenResty Edge

  • Add New Respond Header and Use String As Value
  • Use “System Hostname” As a Built-in Variable for Value
  • Add New Respond Header and Use String As Value
  • Use “System Hostname” As a Built-in Variable for Value

Django Memory Profiler: Analyze Object-Level Memory Usage in a Live App

  • Spot a high-memory Django process with ps
  • Profile the Django app’s memory usage with Guided Analysis
  • Read the flame graph: which Python module uses the most memory
  • Monitor Django memory usage automatically with Insights
  • What is OpenResty XRay
  • Spot a high-memory Django process with ps
  • Profile the Django app’s memory usage with Guided Analysis
  • Read the flame graph: which Python module uses the most memory
  • Monitor Django memory usage automatically with Insights
  • What is OpenResty XRay

Install OpenResty XRay’s Agents on CentOS via RPM Packages

  • Logging in to the Console
  • Installing the Agent via RPM Packages
  • Checking the Agent Status and Logs
  • Configuring and Detecting Applications
  • Initiating Analyzers and Viewing Insights
  • Install Another Agent
  • What is OpenResty XRay
  • Logging in to the Console
  • Installing the Agent via RPM Packages
  • Checking the Agent Status and Logs
  • Configuring and Detecting Applications
  • Initiating Analyzers and Viewing Insights
  • Install Another Agent
  • What is OpenResty XRay

Python Memory Profiler: Find the Largest Objects Eating RAM Without Code Changes

  • Find which Python process is using the most memory
  • Profile Python memory with guided analysis: find the largest objects and their modules
  • Automatically monitor Python memory usage with scheduled reports
  • What is OpenResty XRay
  • Find which Python process is using the most memory
  • Profile Python memory with guided analysis: find the largest objects and their modules
  • Automatically monitor Python memory usage with scheduled reports
  • What is OpenResty XRay

Rust CPU Profiling: Find the Hottest Code Paths in Sled with OpenResty XRay

  • The problem: a Sled-based cache service using over 100% CPU
  • Profile the running Rust process with Guided Analysis
  • Read the Rust CPU flame graph: the #1 hottest code path
  • The #2 hottest code path: get_inner and view_for_key
  • Automatic Rust CPU analysis reports
  • Frequently asked questions
  • The problem: a Sled-based cache service using over 100% CPU
  • Profile the running Rust process with Guided Analysis
  • Read the Rust CPU flame graph: the #1 hottest code path
  • The #2 hottest code path: get_inner and view_for_key
  • Automatic Rust CPU analysis reports
  • Frequently asked questions

etcd High CPU Usage: Find the Hottest Go Code Paths with Flame Graphs

  • Symptom: etcd consuming over 70% of a CPU core
  • Use OpenResty XRay Guided Analysis to find the hottest Go code paths
  • Automatic etcd CPU monitoring and reports
  • What is OpenResty XRay
  • Symptom: etcd consuming over 70% of a CPU core
  • Use OpenResty XRay Guided Analysis to find the hottest Go code paths
  • Automatic etcd CPU monitoring and reports
  • What is OpenResty XRay

llama.cpp CPU Usage: 400% CPU Traced to ggml Hot Functions

  • Running llama.cpp and Observing 400% CPU Usage
  • Profiling llama.cpp CPU Usage with OpenResty XRay
  • Findings: The Hottest C++ Code Paths
  • What is OpenResty XRay
  • Running llama.cpp and Observing 400% CPU Usage
  • Profiling llama.cpp CPU Usage with OpenResty XRay
  • Findings: The Hottest C++ Code Paths
  • What is OpenResty XRay

Go Off-CPU Analysis: Tracing a Running Process Stuck at 2% CPU to a Blocking Shell Call

  • The symptom: Go service CPU usage stays low under load
  • Running off-CPU analysis on the live Go process with OpenResty XRay
  • Root cause: a blocking shell command at a single source line
  • Automatic analysis and reports
  • The symptom: Go service CPU usage stays low under load
  • Running off-CPU analysis on the live Go process with OpenResty XRay
  • Root cause: a blocking shell command at a single source line
  • Automatic analysis and reports
Contact us

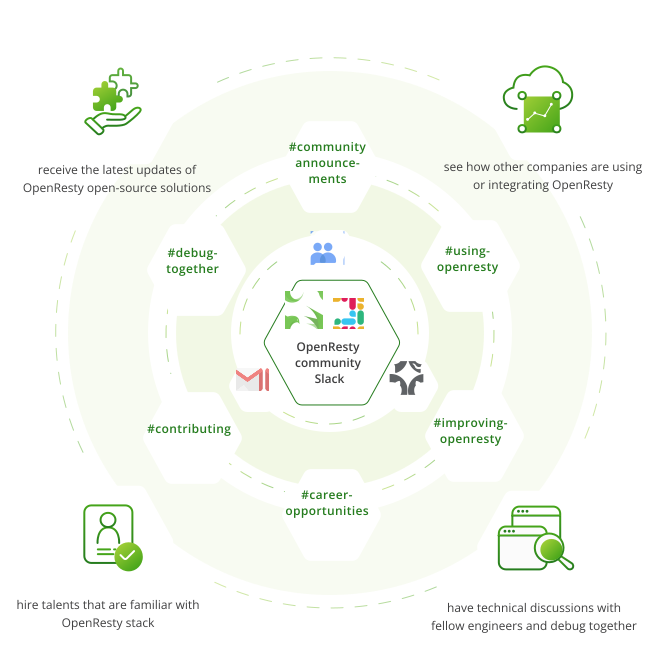
OpenResty open-source community workspace

Please join us here and share your thoughts and questions with us, we can't wait to see you there!


limited time offer

Request TRIAL today and receive a diagnostic REPORT
Learn more

Love to hear from you, Get in touch 👋

Message was sent successfully!

Our Team will get back to you within 24 hours.
x