



Featured Articles

Photo by Yichun Zhang

How a Single "0" Took Down Bilibili — Every Server at 100% CPU, and Reboots Didn't Help

How a Single "0" Took Down Bilibili — Every Server at 100% CPU, and Reboots Didn't Help

Binary Vulnerability Scanning: Catch Backported Patches, Cut False Positives

Binary Vulnerability Scanning: Catch Backported Patches, Cut False Positives

Binary Vulnerability Scanning: Catch Backported Patches, Cut False Positives

Introduction to OpenResty XRay

Introduction to OpenResty XRay

Introduction to OpenResty XRay

Nginx Reverse Proxy QPS Dropped 15x: A Missing upstream keepalive and an -O0 Debug Build

Nginx Reverse Proxy QPS Dropped 15x: A Missing upstream keepalive and an -O0 Debug Build

Nginx Reverse Proxy QPS Dropped 15x: A Missing upstream keepalive and an -O0 Debug Build

Non-Invasive Java Profiler: Capture Method Arguments in Production Without a Java Agent

Non-Invasive Java Profiler: Capture Method Arguments in Production Without a Java Agent

Non-Invasive Java Profiler: Capture Method Arguments in Production Without a Java Agent

Photo by Philip Brown

The Wonderland of Dynamic Tracing (Part 1 of 3)

The Wonderland of Dynamic Tracing (Part 1 of 3)

Photo by Jose G. Ortega Castro

How OpenResty and Nginx Shared Memory Zones Consume RAM

How OpenResty and Nginx Shared Memory Zones Consume RAM

Photo by Harrison Broadbent

Nginx Memory Usage Explained: Where the RAM Actually Goes

Nginx Memory Usage Explained: Where the RAM Actually Goes

OpenResty XRay reduce your CPU usage up to  90%
OpenResty XRay reduce your CPU usage up to 90%
Request free trial

Latest Articles

Case Study: OpenResty XRay Doubles Ylang Compiler Performance

  • Case Study: OpenResty XRay Doubles Ylang Compiler Performance
  • Significant Optimization Results
  • Ylang Language: The Ideal Tool for Dynamic Tracing
  • A Model of Technical Synergy
  • Further Reading
  • Case Study: OpenResty XRay Doubles Ylang Compiler Performance
  • Significant Optimization Results
  • Ylang Language: The Ideal Tool for Dynamic Tracing
  • A Model of Technical Synergy
  • Further Reading

Java Tomcat Slow Response Time: Pinpoint the Exact Slow Request with PCAP

  • Diagnose Tomcat slow response time by catching the exact slow request
  • Selective packet capture: filter by duration, status, and path
  • Per-request PCAP download for one specific slow request
  • Tell server-side latency from network delay
  • Works for Spring Boot apps with embedded Tomcat
Photo by Yichun Zhang
  • Diagnose Tomcat slow response time by catching the exact slow request
  • Selective packet capture: filter by duration, status, and path
  • Per-request PCAP download for one specific slow request
  • Tell server-side latency from network delay
  • Works for Spring Boot apps with embedded Tomcat

Java Application Profiling: CPU, Off-CPU & Disk I/O Without Safepoint Bias

  • Profiling Java CPU hotspots with flame graphs
  • Off-CPU Java profiling: lock contention and blocking analysis
  • Java disk I/O profiling: tracing file and socket writes
  • OpenJDK 8/11/17/21 application profiling support
  • Automated sampling and expert analysis
  • Performance impact and overhead
  • FAQ
Photo by Yichun Zhang
  • Profiling Java CPU hotspots with flame graphs
  • Off-CPU Java profiling: lock contention and blocking analysis
  • Java disk I/O profiling: tracing file and socket writes
  • OpenJDK 8/11/17/21 application profiling support
  • Automated sampling and expert analysis
  • Performance impact and overhead
  • FAQ

OpenResty XRay Web Console: Insights, Dashboards & Guided Root-Cause Analysis

  • What the Insights page shows
  • How to read an analysis report
  • What metrics the Dashboard shows
  • Diagnosing high CPU usage with Guided Analysis
  • Configuring an OpenResty XRay agent
  • What is OpenResty XRay
  • What the Insights page shows
  • How to read an analysis report
  • What metrics the Dashboard shows
  • Diagnosing high CPU usage with Guided Analysis
  • Configuring an OpenResty XRay agent
  • What is OpenResty XRay

Diagnosing High Disk I/O in Python Applications with XRay

  • Identifying the Python process with high disk I/O
  • Tracing Python disk read and write code paths with flame graphs
  • Automatic disk I/O analysis and reports
  • What is OpenResty XRay
  • Frequently Asked Questions
  • Identifying the Python process with high disk I/O
  • Tracing Python disk read and write code paths with flame graphs
  • Automatic disk I/O analysis and reports
  • What is OpenResty XRay
  • Frequently Asked Questions

Install OpenResty XRay’s Agents on Kubernetes cluster

  • Logging in to the Console
  • Installing the Agent on Kubernetes cluster
  • Configuring and Detecting Applications
  • Initiating Analyzers and Viewing Insights
  • Install Another Agent
  • What is OpenResty XRay
  • Logging in to the Console
  • Installing the Agent on Kubernetes cluster
  • Configuring and Detecting Applications
  • Initiating Analyzers and Viewing Insights
  • Install Another Agent
  • What is OpenResty XRay

Why Your Rust Process Has High Disk I/O (and How to Find the Cause)

  • Identifying the Rust process with high disk I/O
  • Tracing the hottest Rust disk write code paths with flame graphs
  • Automatic disk I/O analysis and reports
  • What is OpenResty XRay
  • Frequently Asked Questions
  • Identifying the Rust process with high disk I/O
  • Tracing the hottest Rust disk write code paths with flame graphs
  • Automatic disk I/O analysis and reports
  • What is OpenResty XRay
  • Frequently Asked Questions

OpenResty XRay Mobile Apps: Monitor and Troubleshoot Your Apps from Android & iOS

  • Download and install OpenResty XRay for Android
  • Sign into OpenResty XRay
  • Automatic analysis report
  • View the performance chart data on the dashboard page
  • Guided analysis feature
  • Frequently asked questions
  • What is OpenResty XRay
  • Download and install OpenResty XRay for Android
  • Sign into OpenResty XRay
  • Automatic analysis report
  • View the performance chart data on the dashboard page
  • Guided analysis feature
  • Frequently asked questions
  • What is OpenResty XRay

PHP Memory Profiler: Locate the Largest Memory Objects in a Live PHP Process

  • Symptom: a PHP process using high memory in top
  • Profile the process with OpenResty XRay guided analysis to find the largest PHP objects
  • Trace the largest object back to its source line
  • Monitor PHP process memory automatically with Insights reports
  • FAQ
  • What is OpenResty XRay
  • Symptom: a PHP process using high memory in top
  • Profile the process with OpenResty XRay guided analysis to find the largest PHP objects
  • Trace the largest object back to its source line
  • Monitor PHP process memory automatically with Insights reports
  • FAQ
  • What is OpenResty XRay

Accurately Restore the Real Client IP Address in OpenResty Edge

  • Set “Trusted hosts to set real IP” and “Real IP from” Globally
  • Configure the Application to Output the Client Address
  • Check the Client Address Received on OpenResty Edge
  • What is OpenResty Edge
Photo by Yichun Zhang
  • Set “Trusted hosts to set real IP” and “Real IP from” Globally
  • Configure the Application to Output the Client Address
  • Check the Client Address Received on OpenResty Edge
  • What is OpenResty Edge

Use C++ to Dynamic-Trace C++ Applications

  • Setting Up the Target C++ Program
  • Crafting the C++ (or Y++) Analyzer
  • Operationalizing the Target and Analyzer
  • Advancing Support for Complex C++ Applications
  • About the Debug Symbols
Photo by Yichun Zhang
  • Setting Up the Target C++ Program
  • Crafting the C++ (or Y++) Analyzer
  • Operationalizing the Target and Analyzer
  • Advancing Support for Complex C++ Applications
  • About the Debug Symbols

Erlang High CPU Usage: PCRE Regex Bottleneck Traced with Flame Graphs

  • Observing 200%+ CPU in an Erlang Process
  • Profiling Erlang CPU Usage with OpenResty XRay
  • C-Level Analysis: erts_pcre_exec and PCRE Backtracking
  • Why PCRE Regex Backtracking Is Expensive in the BEAM VM
  • Automatic Monitoring and Reports
  • FAQ: Erlang High CPU Usage
  • What is OpenResty XRay
  • Observing 200%+ CPU in an Erlang Process
  • Profiling Erlang CPU Usage with OpenResty XRay
  • C-Level Analysis: erts_pcre_exec and PCRE Backtracking
  • Why PCRE Regex Backtracking Is Expensive in the BEAM VM
  • Automatic Monitoring and Reports
  • FAQ: Erlang High CPU Usage
  • What is OpenResty XRay
Contact us

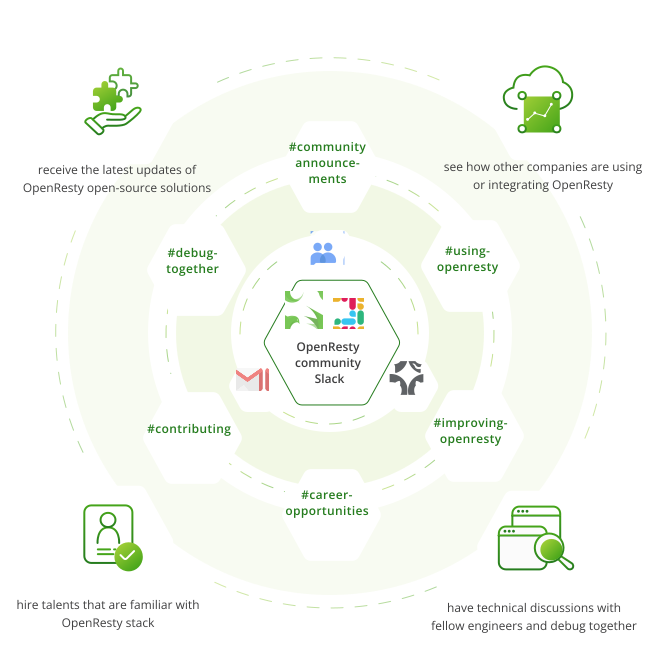
OpenResty open-source community workspace

Please join us here and share your thoughts and questions with us, we can't wait to see you there!


limited time offer

Request TRIAL today and receive a diagnostic REPORT
Learn more

Love to hear from you, Get in touch 👋

Message was sent successfully!

Our Team will get back to you within 24 hours.
x