Off-CPU Analysis: Four Root Causes Behind Low CPU Yet High Latency
Off-CPU analysis measures the time and call stacks of a thread while it is off the CPU — blocked, preempted, or waiting. It solves a class of problems invisible to top: CPU usage stays stubbornly low, yet latency climbs and throughput plateaus — requests are waiting, not computing. On-CPU profiling and off-CPU analysis are complementary: together they account for 100% of a thread’s time. In one real production case, OpenResty XRay traced 99.8% of a process’s off-CPU time to io.popen and read operations on its pipe handle. After the fix, single-core throughput jumped from 126 RPS to 18,537 RPS — a 150x improvement.
What Is Off-CPU Time?
When a thread (or process) is executing instructions on a CPU, it is in the on-CPU state. When it is removed from the CPU for any reason — network I/O waits, lock contention, subprocess waits, file or pipe I/O blocks, or even scheduler preemption — it enters the off-CPU state.
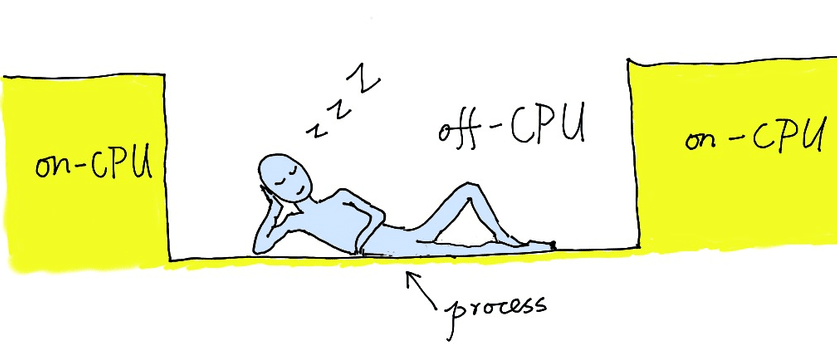
The figure above shows a thread alternating between on-CPU and off-CPU states. Off-CPU time is the sum of all those dark gaps — time the thread wanted to run but was stuck waiting.
For event-driven servers like Nginx/OpenResty, the only place a worker thread should block is the event loop’s own wait syscall (e.g., epoll_wait). Any off-CPU time at any other call site means the event loop is stalled, and every concurrent connection on that worker is waiting for nothing.
The Symptom: CPU Usage Won’t Climb, Yet Requests Are Queuing
Off-CPU bottlenecks leave a telltale triple signature on monitoring dashboards:
topshows CPU usage stuck at a low percentage — the process is running, but the CPU column never rises.- Access logs keep growing — requests are arriving; there is no traffic shortage.
- Adding load doesn’t help — no matter how much pressure you apply, CPU usage refuses to climb.
This pattern recurs across languages: a Perl process stuck at 13%, a Go service stuck at 2%, a Python gunicorn worker stuck at 8%. The exact percentages differ, but the root cause is the same: the thread is waiting, not computing.
If you are searching for “why is CPU usage low but latency high” — the answer almost always lies in the off-CPU direction: some code path is executing a synchronous blocking operation (a network call, a subprocess wait, a file read…), the thread is suspended, the CPU sits idle, and requests queue up. Finding which exact line of code is blocking requires off-CPU analysis.
This kind of blocking also manifests as periodic p99 tail-latency spikes — in event-driven servers, a single blocked worker means every concurrent request on that worker is affected simultaneously. But not every tail-latency spike is an off-CPU problem: when we traced a 244-millisecond latency spike in a 500k QPS OpenResty gateway, the root cause turned out to be on-CPU work — an inefficient regex backtracking mode burning CPU time, not a blocked wait. The symptom looks identical from the outside; telling whether the time went to waiting or to computing is exactly what off-CPU analysis and on-CPU profiling are each built to answer.
Four Categories of Off-CPU Root Causes with Real-World Root-Cause Chains
Off-CPU time can be grouped into four broad categories. For each one, we provide the mechanism and a real-world root-cause chain — traced from the system call all the way to the business code’s source file and line number.
1. Synchronous Network I/O
Mechanism: A thread issues a network request and synchronously waits for the response. The operating system suspends the thread until data arrives.
Real-world root-cause chain: In a case where a Perl process was stuck at only 13% CPU usage, the off-CPU flame graph showed the following blocking path:
selectsyscall →Perl_pp_select→Net::HTTP::Methods::can_read→read_response_headers→ the application’sremote_fetchfunction
Hovering over the remote_fetch frame in the flame graph reveals the source file path and line number in the tooltip. Jumping to line 66 shows the code issuing an HTTP GET request and synchronously waiting for the response.
2. Subprocess and Shell Invocations
Mechanism: A program spawns an external process via exec/subprocess and then calls waitpid to wait for it to exit. The calling thread is blocked for the entire duration.
Real-world root-cause chain 1 (Go): In a case where a Go service was stuck at only 2% CPU usage, the off-CPU report’s automatically inferred blocking path was:
Syscall6→Process.wait(i.e.,waitpid) →exec.Cmd.Run→chat.RateLimit
Source file chat/processor.go, line 46 — the RateLimit function calls exec.Command("/usr/bin/sleep", "0.01") followed by cmd.Run(), synchronously waiting for the shell command to complete.
Real-world root-cause chain 2 (Python): In a case where a Python gunicorn worker was stuck at only 8% CPU usage, the top-ranked C-level off-CPU path accounted for 96%, and the #1 Python-level blocking path consumed 92.4% of blocked time:
pollsyscall →subprocess.run→ the application’shandle_by_scriptfunction
Source file processor.py, line 12 — calling subprocess.run to execute an external bash script and waiting for its output.
3. Synchronous File and Pipe I/O
Mechanism: The standard library’s synchronous file/pipe APIs (e.g., Lua’s io.popen, file:read()) block the current thread until the I/O operation completes. In event-driven frameworks, this is especially devastating: it is not just one request that stalls, but the entire event loop.
Real-world root-cause chain: In a production OpenResty application, OpenResty XRay found two blocking call sites — the io.popen call at line 8 and the file:read() call at line 14 of cfg-utils.lua (the latter reading from the pipe handle opened by the former). OpenResty XRay traced 93.8% of the target process’s CPU time and 99.8% of its off-CPU time to these two call sites. Switching to OpenResty’s nonblocking lua-resty-shell library boosted single-core throughput from 126 RPS to 859 RPS (7x); further replacing the pipe with the nonblocking cosocket API brought it to 18,537 RPS (150x).
In addition, file I/O latency itself can sometimes be non-negligible. In another case, APR (Apache Portable Runtime) library functions called through the ModSecurity module inside Nginx showed a worst-case single-read latency of 1,494 microseconds (nearly 1.5 ms) for apr_generate_random_bytes and 953 microseconds for apr_sdbm_fetch. For a platform like Nginx, renowned for high concurrency and low latency, even a single millisecond of synchronous blocking is a serious concern.
4. CPU Contention: Runnable but Starved for a Core
Mechanism: Most off-CPU tutorials only cover “voluntary waits” — threads suspended by I/O or locks. But there is another, often overlooked category: the thread is ready to run, the OS has marked it as runnable, yet it sits in the run queue because no CPU core is free to schedule it. This is “involuntary descheduling,” not “voluntary parking.”
Real-world root-cause chain: In a C-level off-CPU analysis of an Nginx worker process, OpenResty XRay found that aside from the normal epoll_wait wait stacks, a significant amount of off-CPU time fell on pure CPU-computation functions such as mpi_mul_hlp and free.
When a thread shows off-CPU time while executing pure computation, it is not waiting on I/O — it is runnable but cannot get a time slice. This is the classic symptom of CPU resource contention. Further analysis revealed the root cause: the Nginx configuration was missing the worker_cpu_affinity directive, which caused the Linux kernel to frequently reschedule worker processes across CPU cores, incurring unnecessary context-switch overhead. In this case, individual worker RPS was only 227–286, yet system load was already approaching 4 (equal to the logical CPU core count).
Identifying this category of off-CPU root cause requires a different approach from the previous three: instead of looking for which I/O syscall the thread blocks on, look for off-CPU time appearing in functions that should be purely on-CPU.
How to Quantify Off-CPU Time
Pinpointing off-CPU bottlenecks requires two layers of measurement:
Two-Layer Call-Stack Analysis: From System Call to Source Line
The core technique in off-CPU analysis is sampling the call stacks of a thread during its blocked periods. Effective analysis typically requires both layers, used in tandem:
- C / system level: Shows the system call stack (
select,poll,waitpid,read, etc.), revealing the type of blocking. - Language level (Perl / Python / Go / Lua…): Shows the application-level call stack, mapping the system call back to a specific function, source file, and line number.
Looking at the C level alone only tells you “stuck on poll” — but which line of business code triggered that poll? Only the language-level call stack can answer that. In all three cases above, the off-CPU analysis terminated at a source file line that can be opened in an editor: Perl source line 66, Go processor.go line 46, Python processor.py line 12. This “trace it to the line number” actionability is the core value of off-CPU analysis.
Event-Loop Blocking Latency Distribution: Quantifying the Impact
For event-driven servers, knowing that “there is blocking” is not enough — you need to quantify how severe it is. OpenResty XRay can sample the distribution of blocking durations for each event-loop iteration. In one real case, a 20-second sampling window captured 43,952 blocking samples, with the longest single block reaching 75,165 microseconds (75 ms). That means every time the event loop was blocked for 75 ms, every concurrent connection on that worker was waiting — this is the direct cause of tail-latency spikes.
On-CPU + Off-CPU = Wall-Clock Time: The Bigger Picture and the Tool Ecosystem
A thread’s wall-clock time = on-CPU time + off-CPU time. Optimizing on-CPU time improves throughput (more useful work per unit of time); optimizing off-CPU time reduces latency (less time spent waiting). The two dimensions are complementary — you need both.
There are many off-CPU analysis tools out there, but deploying them in production typically involves hurdles: installing agents or kernel modules, requiring a specific kernel version, modifying the application’s startup parameters, or supporting only a particular language runtime.
OpenResty XRay offers an automated path: use its Guided Analysis feature with the “Low CPU usage and cannot go up” problem type to analyze a running process directly — no need to install perf or eBPF tools, no code changes, no process restarts. It generates off-CPU call-stack analyses at both the C level and the language level (Perl / Python / Go / Lua / Java…) simultaneously, and automatically infers the most significant blocking code paths. The Insights page also monitors online processes automatically, generating daily and weekly reports to track off-CPU trends continuously.
FAQ
What is off-CPU time?
Off-CPU time is the time a thread spends after leaving the CPU and before returning to it — the thread cannot execute any instructions during this interval. Common causes include network I/O waits, subprocess waits, file/pipe read/write blocks, lock contention, and CPU scheduling contention. The sum of on-CPU time and off-CPU time equals the thread’s wall-clock time.
Why is CPU usage low but latency high?
Because the thread is spending most of its time blocked on waits rather than doing useful work on the CPU. Typical root causes include synchronous network calls (e.g., waiting for HTTP responses), synchronous subprocess calls (e.g., subprocess.run, exec.Cmd.Run), synchronous file/pipe I/O (e.g., io.popen), and CPU resource contention (runnable threads starved for a core). Off-CPU analysis can trace the blocking path to the exact source file and line number.
How can I find what my program is waiting on without modifying the code?
Use OpenResty XRay’s Guided Analysis feature, select the “Low CPU usage and cannot go up” problem type, and point it at the unmodified running process. The system automatically generates off-CPU call-stack analyses and infers the most significant blocking code paths — hover over a frame to see the source file and line number. No extra tooling, no code changes, no process restarts required.
What is the difference between off-CPU analysis and wall-clock profiling?
Wall-clock profiling samples a thread’s entire time without distinguishing whether it is executing on the CPU or waiting. Off-CPU analysis focuses exclusively on the time and call stacks of a thread while it is blocked — it is the complementary view to on-CPU profiling. When your problem is “CPU won’t go up” or “latency is high but CPU is low,” off-CPU analysis aims directly at the root cause.
What is OpenResty XRay
OpenResty XRay is a dynamic-tracing product that automatically analyzes your running applications to troubleshoot performance problems, behavioral issues, and security vulnerabilities with actionable suggestions. Under the hood, OpenResty XRay is powered by our Y language targeting various runtimes like Stap+, eBPF+, GDB, and ODB, depending on the contexts.
About The Author
Yichun Zhang (Github handle: agentzh), is the original creator of the OpenResty® open-source project and the CEO of OpenResty Inc..
Yichun is one of the earliest advocates and leaders of “open-source technology”. He worked at many internationally renowned tech companies, such as Cloudflare, Yahoo!. He is a pioneer of “edge computing”, “dynamic tracing” and “machine coding”, with over 22 years of programming and 16 years of open source experience. Yichun is well-known in the open-source space as the project leader of OpenResty®, adopted by more than 40 million global website domains.
OpenResty Inc., the enterprise software start-up founded by Yichun in 2017, has customers from some of the biggest companies in the world. Its flagship product, OpenResty XRay, is a non-invasive profiling and troubleshooting tool that significantly enhances and utilizes dynamic tracing technology. And its OpenResty Edge product is a powerful distributed traffic management and private CDN software product.
As an avid open-source contributor, Yichun has contributed more than a million lines of code to numerous open-source projects, including Linux kernel, Nginx, LuaJIT, GDB, SystemTap, LLVM, Perl, etc. He has also authored more than 60 open-source software libraries.
Related Articles
OpenResty XRay Jan 26, 2024

OpenResty XRay Aug 8, 2023

OpenResty XRay Dec 23, 2025

OpenResty XRay Sep 12, 2025

OpenResty XRay Sep 1, 2025