OpenResty XRay AI Assistant: Making Every Piece of Analysis Data Speak
The OpenResty XRay AI Assistant is an AI interpretation engine built into the OpenResty XRay console: it reads the real runtime data collected through dynamic tracing and automatically interprets flame graphs, sampling results, and analysis reports, giving you conclusions and recommended next steps. It is currently in Beta and open to all users.
Reading a flame graph takes experience; explaining it to someone else takes time. On many teams, only one or two people can truly read an OpenResty XRay analysis report. When CPU spikes in production, the report is ready in five minutes—but “what the report means and what to do next” still has to wait until your most senior engineer is free.
The AI Assistant exists to eliminate that bottleneck. It stands directly on top of the real runtime data OpenResty XRay collects and translates flame graphs, sampling results, and analysis reports into conclusions and actionable advice—so everyone on the team can independently complete a professional-grade performance diagnosis.
Early Beta access: The AI Assistant is currently in Beta and open to all users. At this stage, every piece of feedback you give directly shapes where the feature goes next—we want to work with our earliest power users to hone it into a tool that genuinely fits your hand.
How Is It Different from Pasting a Report into ChatGPT?
A general-purpose chatbot can only see the text you paste into it. The OpenResty XRay AI Assistant, by contrast:
- Accesses analysis data directly. What it reads is the real runtime data OpenResty XRay collects through non-invasive dynamic tracing—not a log summary, not a description you assembled by hand, but sampling-level ground truth.
- Senses context automatically. It knows which target machine, which application, and which report you are currently looking at. No copy-pasting, no explaining the background to it.
- Understands OpenResty XRay’s analyzer system. It knows what each analyzer measures, the causal relationships between metrics, and the meaning of OpenResty/Nginx internals.
Put another way: a general-purpose AI is a consultant who has never been on site; the OpenResty XRay AI Assistant is a colleague who has been standing in the server room the whole time.
Three Typical Scenarios
Scenario 1: A Production Incident—Ask While You Look at the Page
2 a.m., and an application’s CPU is suddenly maxed out. You open the target machine page, and OpenResty XRay has already completed its sampling analysis automatically.
Click the AI Assistant pop-up in the bottom-right corner—it automatically brings in the full context of the current page, and you can ask directly. Here is a real conversation with the AI Assistant, taken after we reproduced a typical CPU incident on a demo machine.
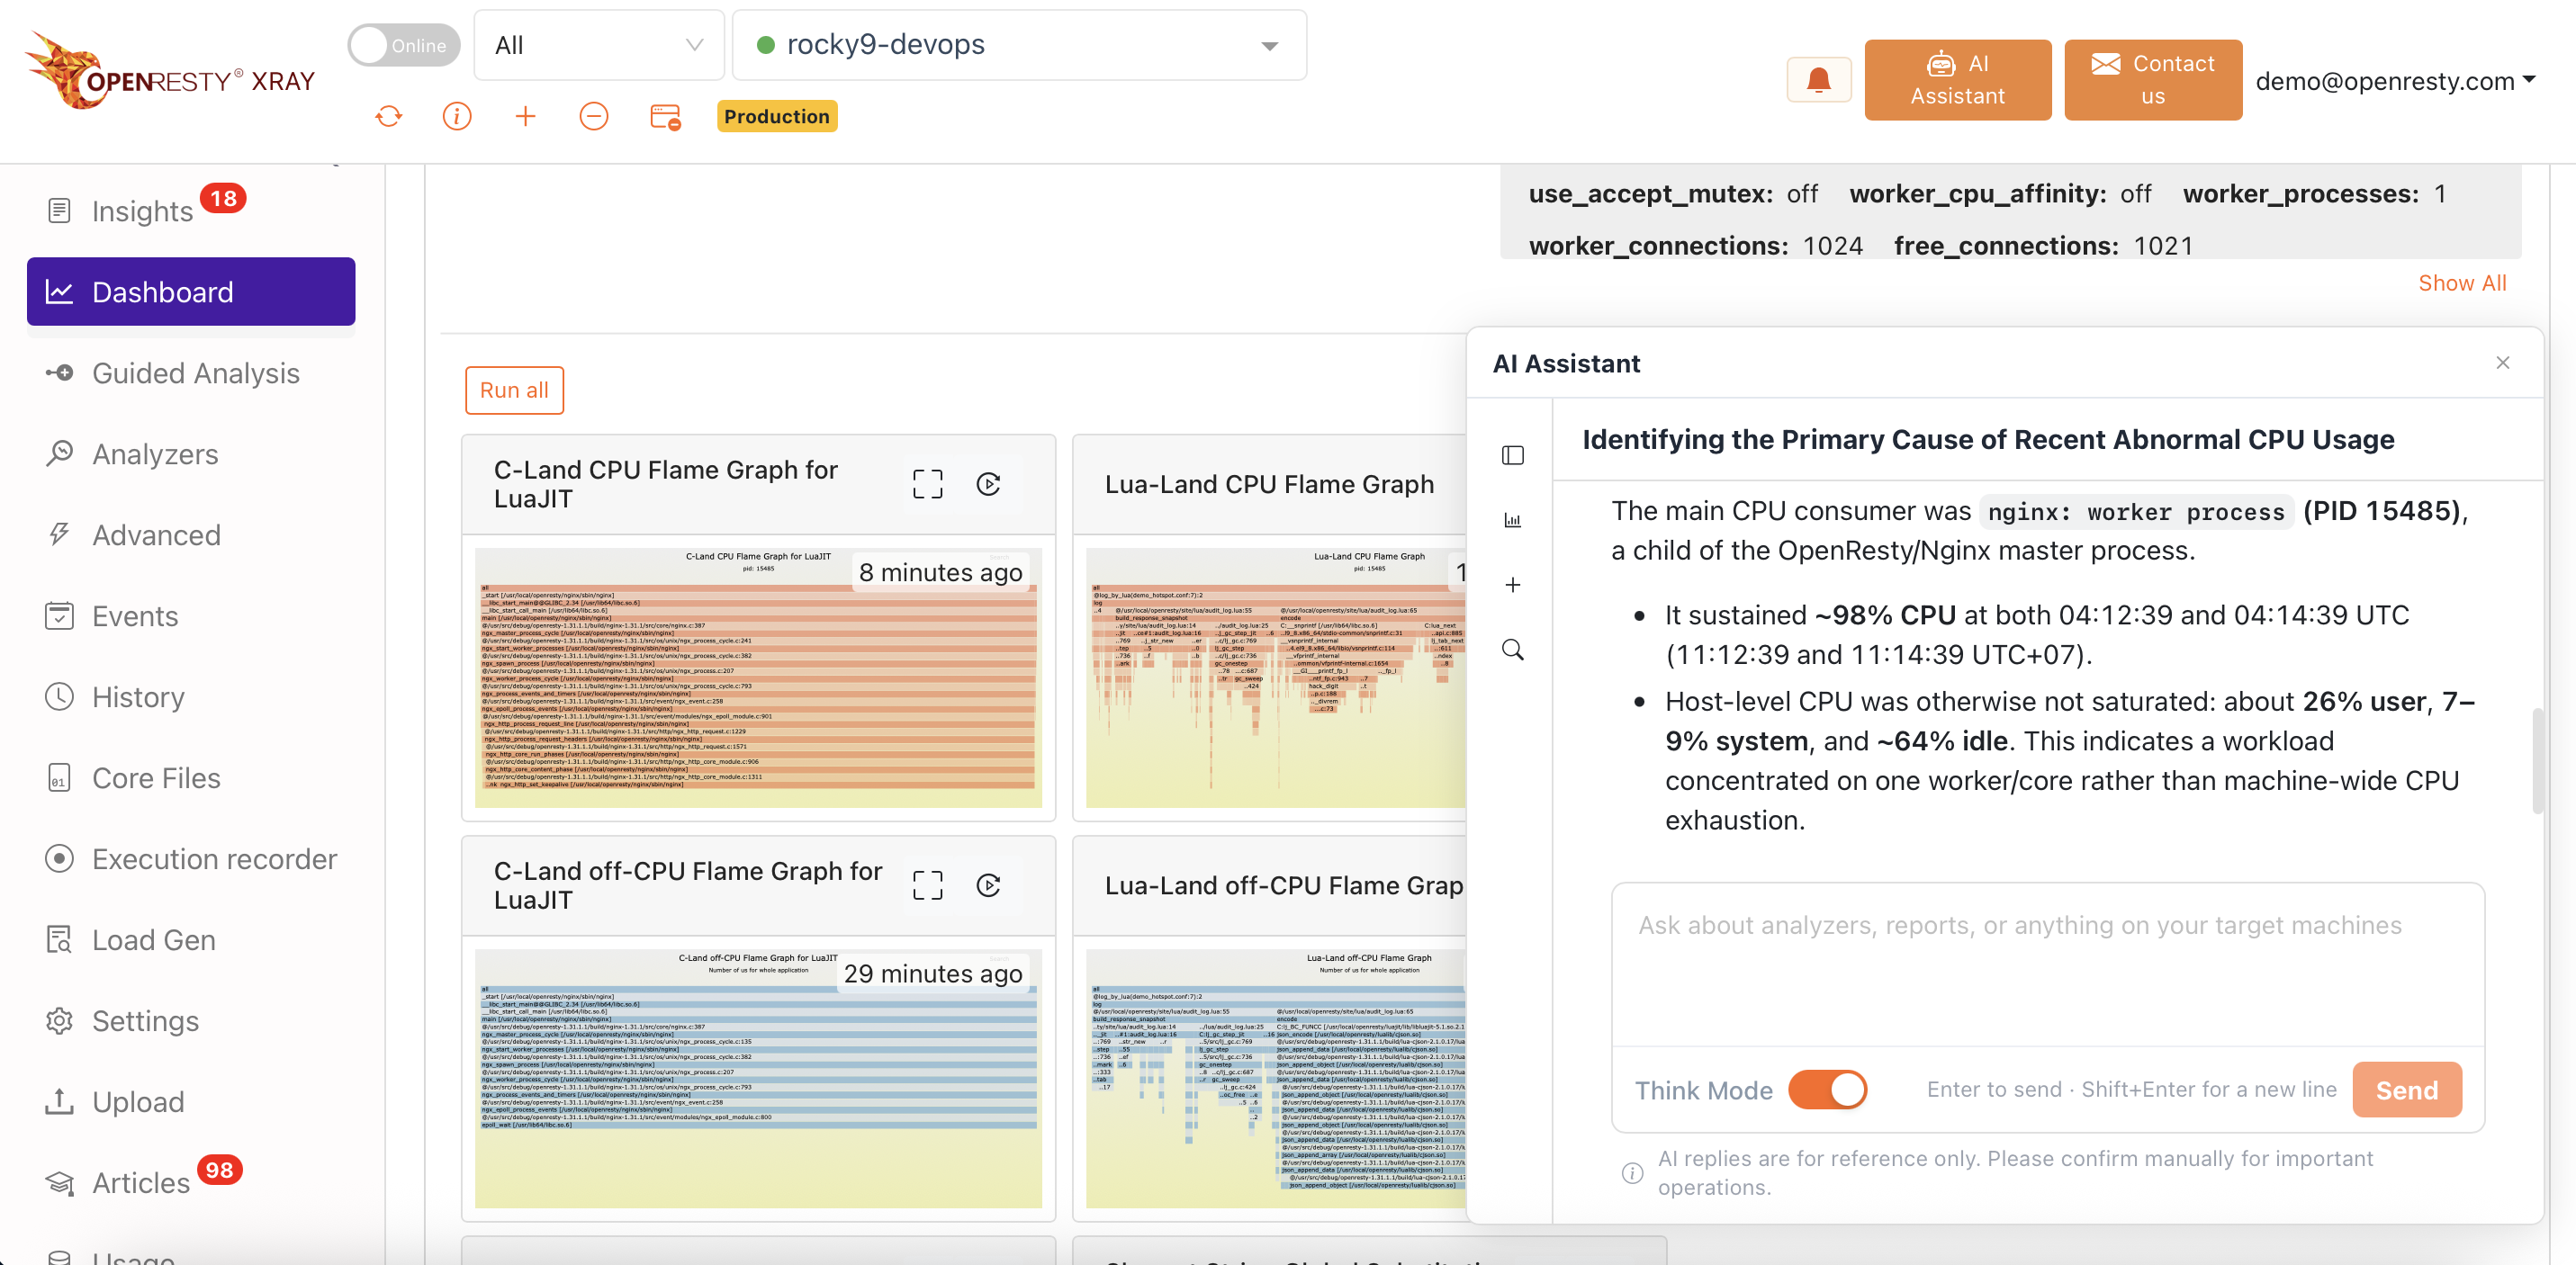
First question: “What is the main source of the abnormal CPU usage on this machine over the past hour?”
The AI Assistant pinpoints the culprit right away, with every conclusion drawn from the sampled data:
- The main CPU consumer was
nginx: worker process(PID 15485), a child of the OpenResty/Nginx master process, sustaining ~98% CPU across multiple sampling points; - Host-level CPU was otherwise not saturated—about 26% user, 7–9% system, and ~64% idle—which indicates a workload concentrated on one worker/core rather than machine-wide CPU exhaustion.
Then we asked for optimization suggestions. Instead of dumping a generic tuning checklist, the AI Assistant laid out a concrete diagnostic path:
- Profile Lua execution first with
lj-lua-on-cpu—the most relevant basic diagnostic for OpenResty. If its flame graph shows Lua application frames at the top, optimize that specific hot handler: eliminate repeated per-request computation, cache safe reusable results, and reduce unnecessary parsing or serialization in that path; - Check native CPU with
lj-c-on-cpuorc-on-cpuif Lua is not dominant—lj-c-on-cpufor LuaJIT-related native work,c-on-cpufor Nginx/native-library work.
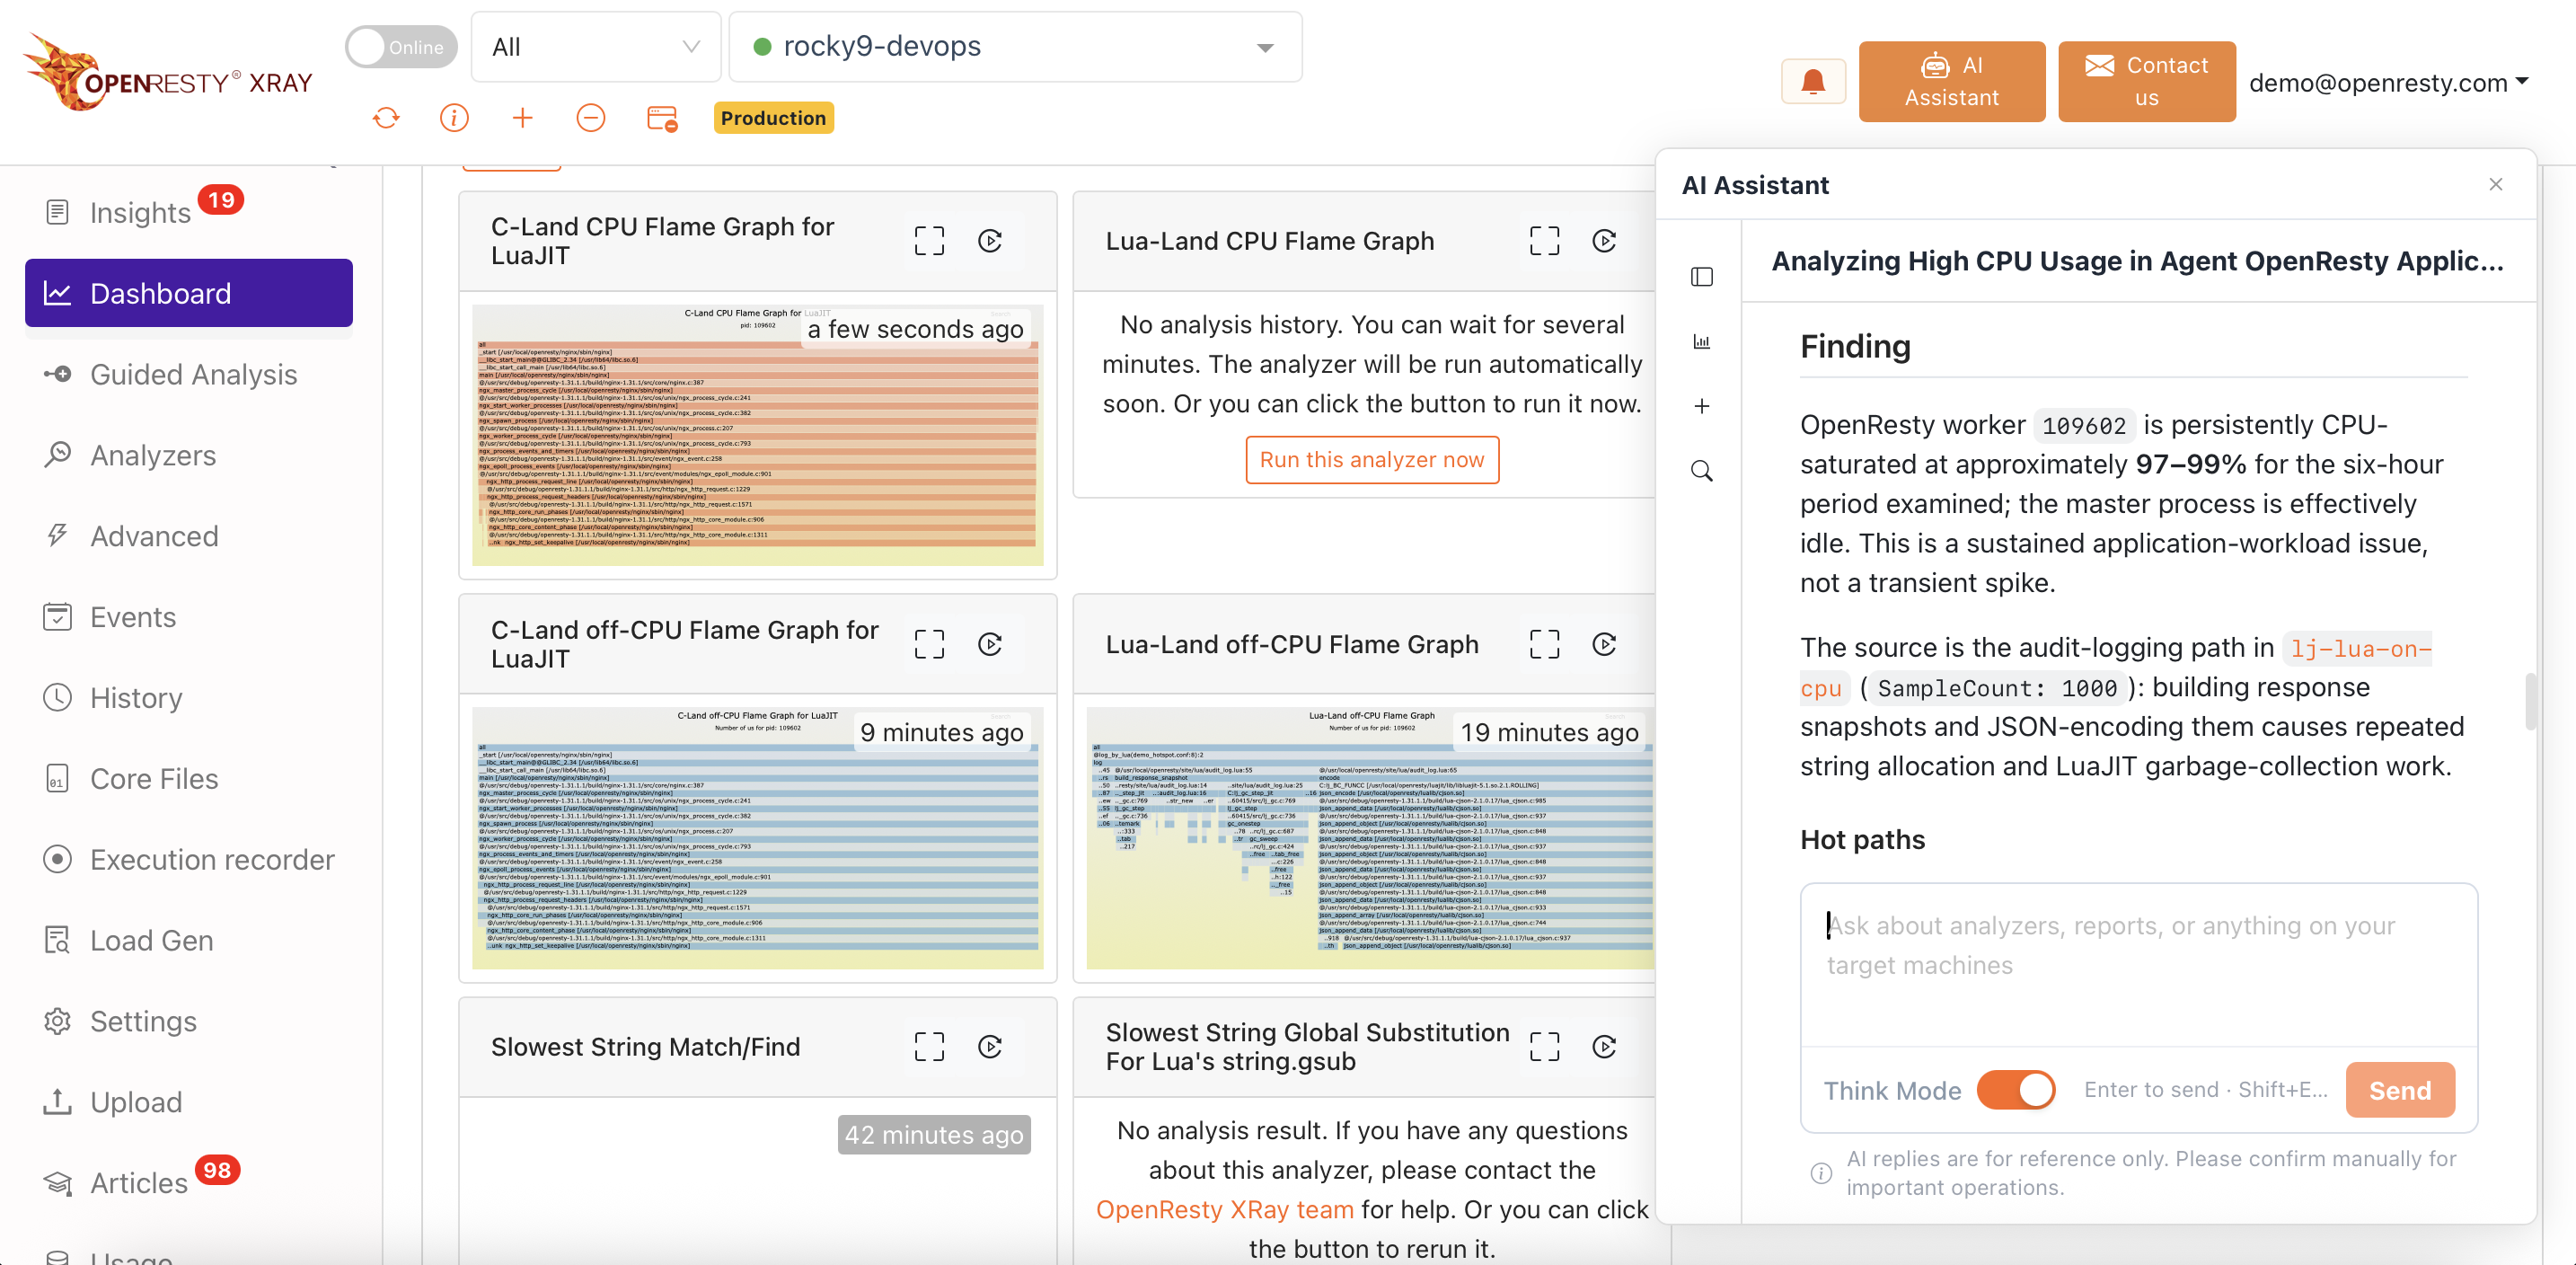
And that was exactly this machine’s actual “lesion”: a piece of audit-logging code in the log phase was serializing the full request/response context into JSON on every request, and the cjson encoding calls stand out clearly in the Lua-Land CPU flame graph—the very first diagnostic step the AI suggested points straight at the root cause.
No leaving the current page, no copying any data—the answer is right there at the scene of the troubleshooting. Conversations in the pop-up are saved automatically, and afterward you can keep asking follow-up questions on the AI Assistant page or share them with a colleague.
Scenario 2: Reviewing Routine Reports—Grasp the Whole Picture in Two Minutes
OpenResty XRay continuously generates analysis reports for your target machines. Reading every entry one by one takes time, especially when you manage dozens of machines.
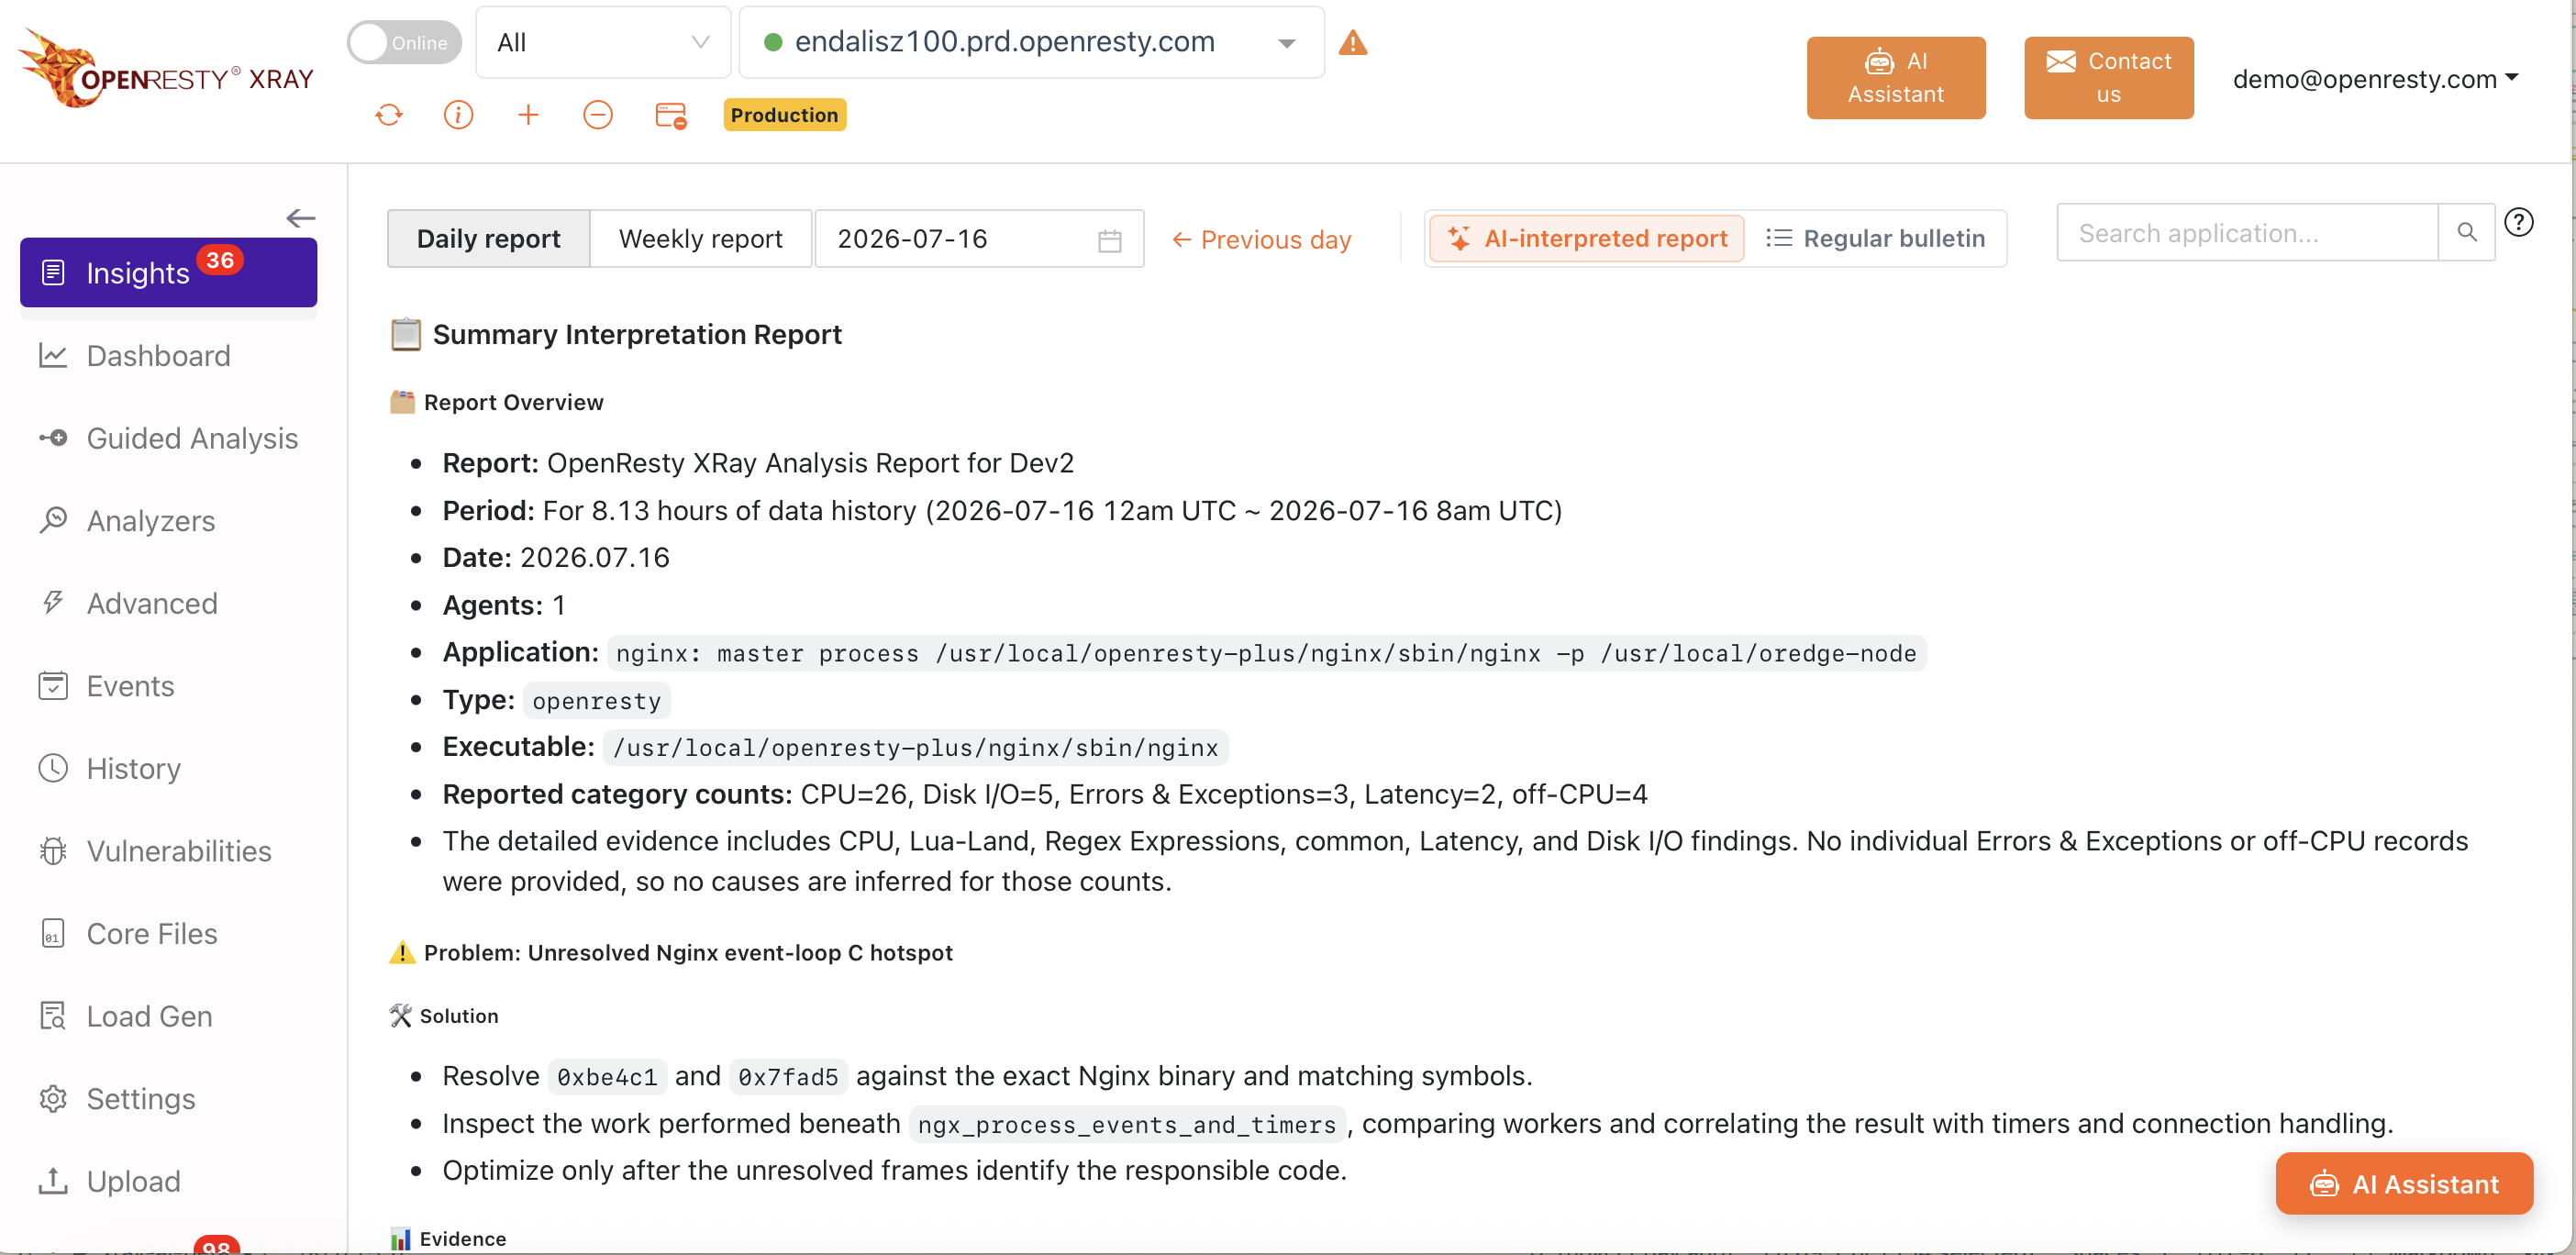
In the new “Report Interpretation” tab on the Report Insights page, the AI reads through it first for you:
- Summarizes the machine’s overall health in a single paragraph;
- Picks out the two or three issues genuinely worth attention from among dozens of report entries;
- Points out the connections between issues—for example, the relationship between memory growth and the behavior of a particular Lua module.
Think of it as your morning “on-call handoff summary”: read the interpretation first to grasp the big picture, then drill down into the raw entries wherever something looks off.
Scenario 3: Digging into a Single Analysis Job
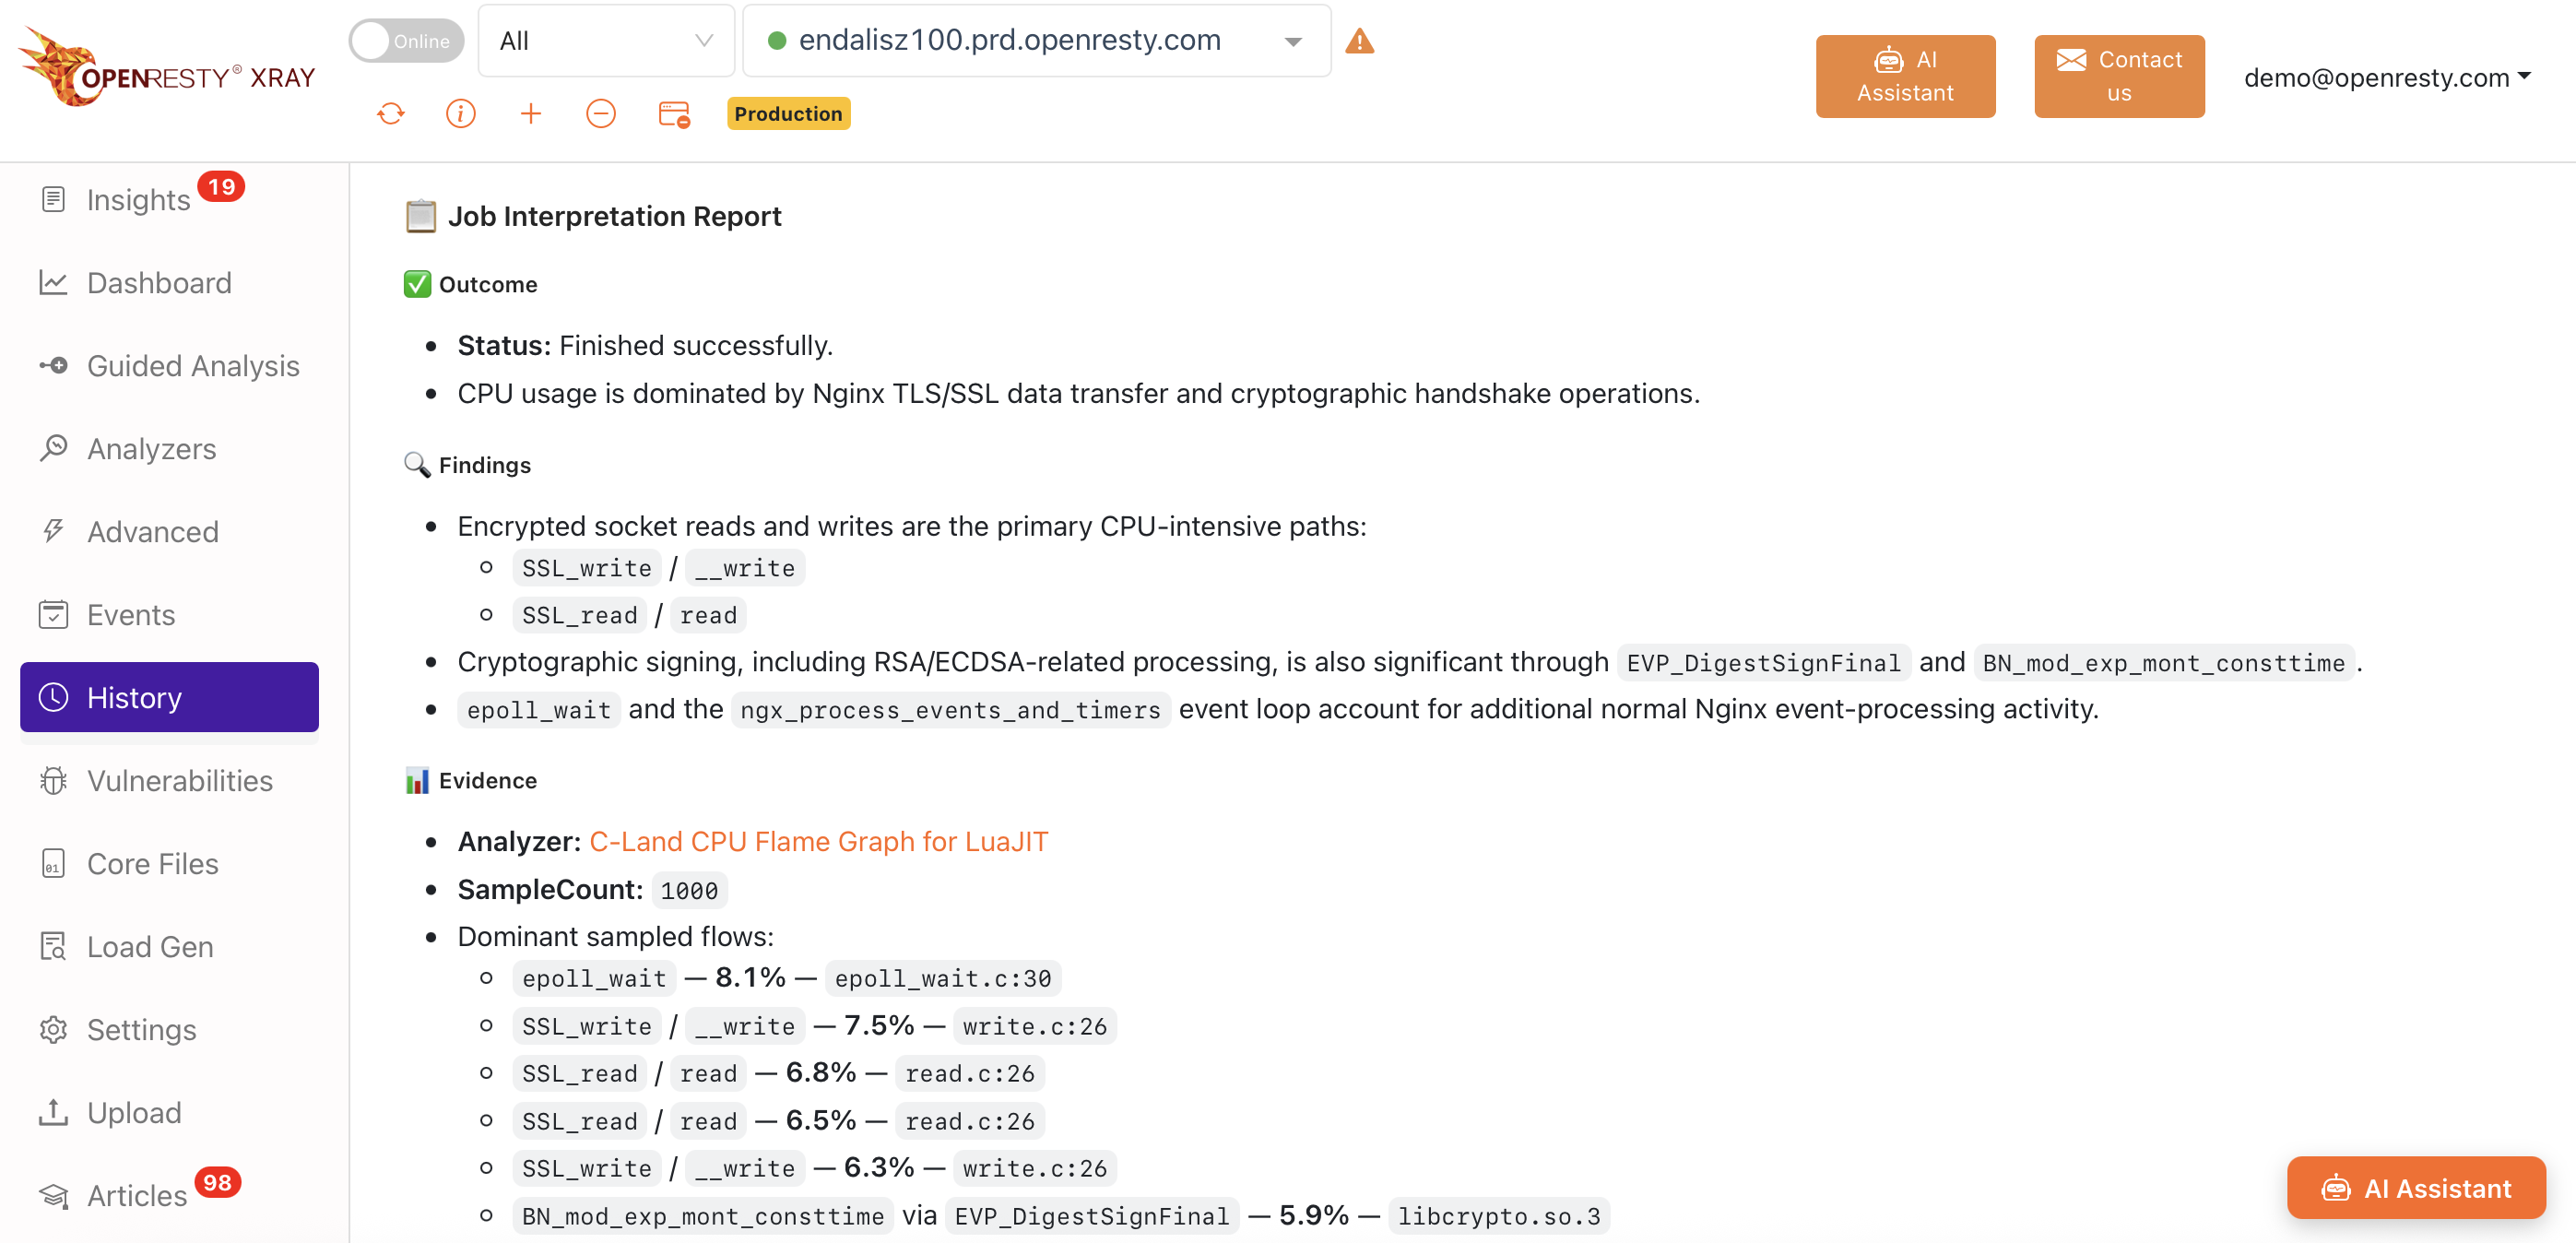
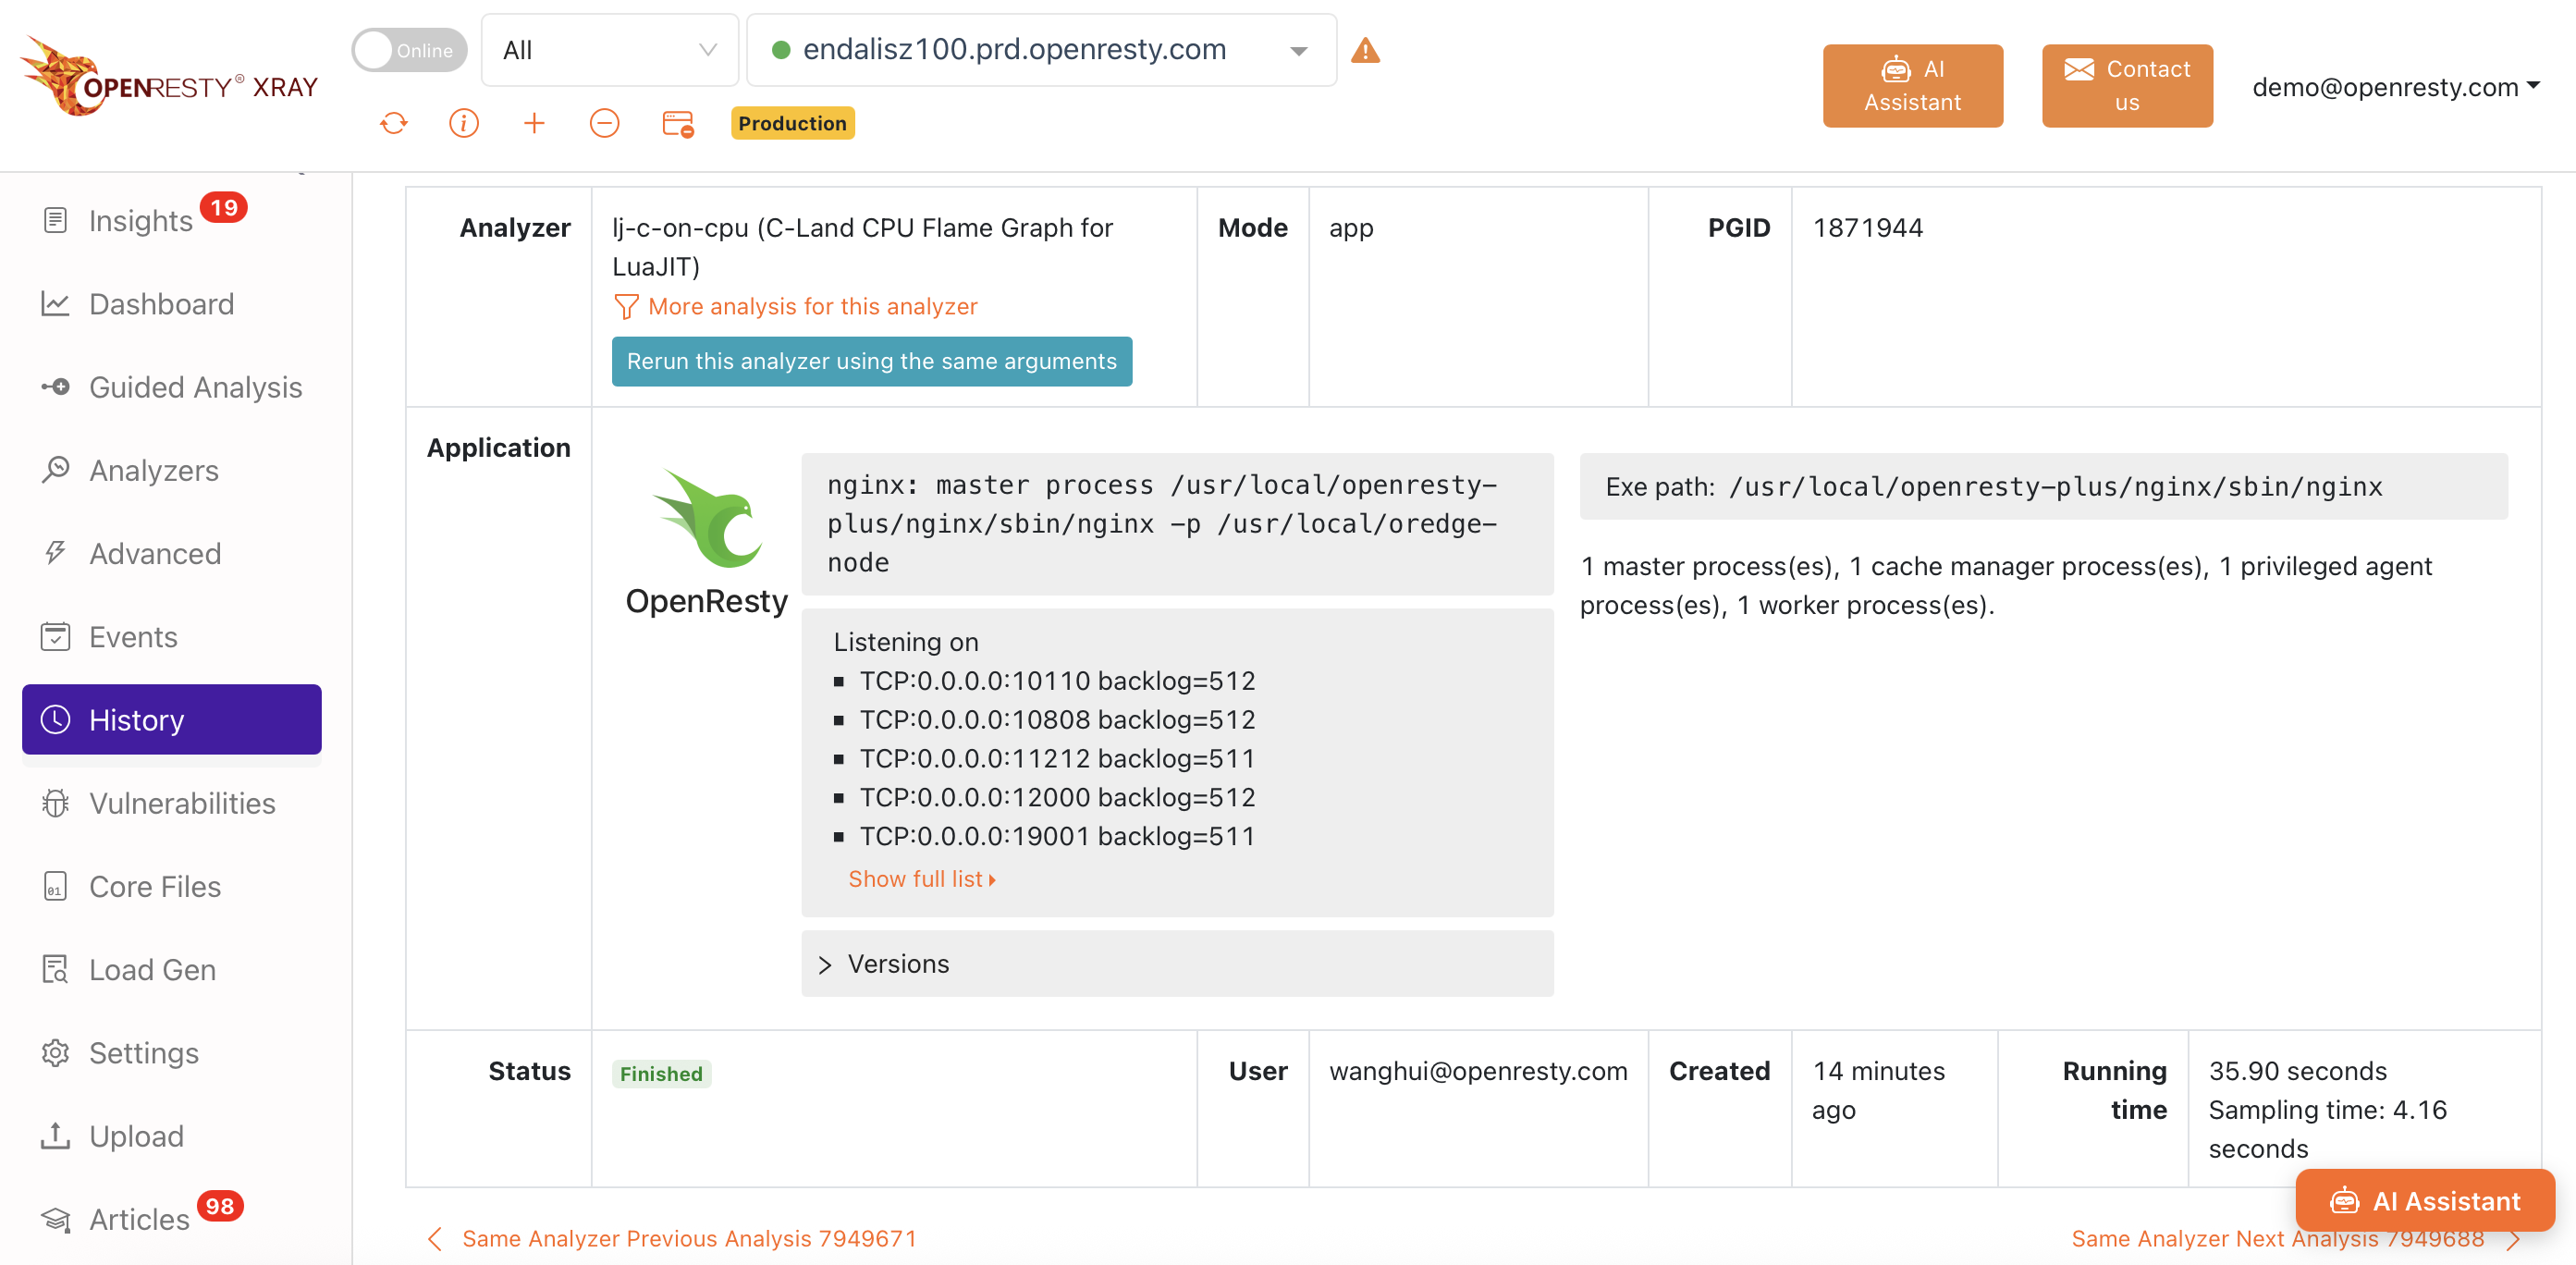
For a specific sampling analysis (a Job), open any job from the History page and switch to the AI Analysis tab in the top-right corner. It answers three questions about the result of this one job:
- What was found—the core facts this sampling captured;
- What it means—the specific problems reflected by the flame graph, call paths, and sampling distribution;
- What to do next—a ranking of possible causes, plus a suggested next analysis action (for example, “recommend running an off-CPU analysis on this process again to confirm lock contention”).
This is especially valuable for newer team members: analysis results that used to require a senior engineer to walk through now come with their own expert commentary.
The AI Assistant Page: Your Performance Diagnosis Workbench
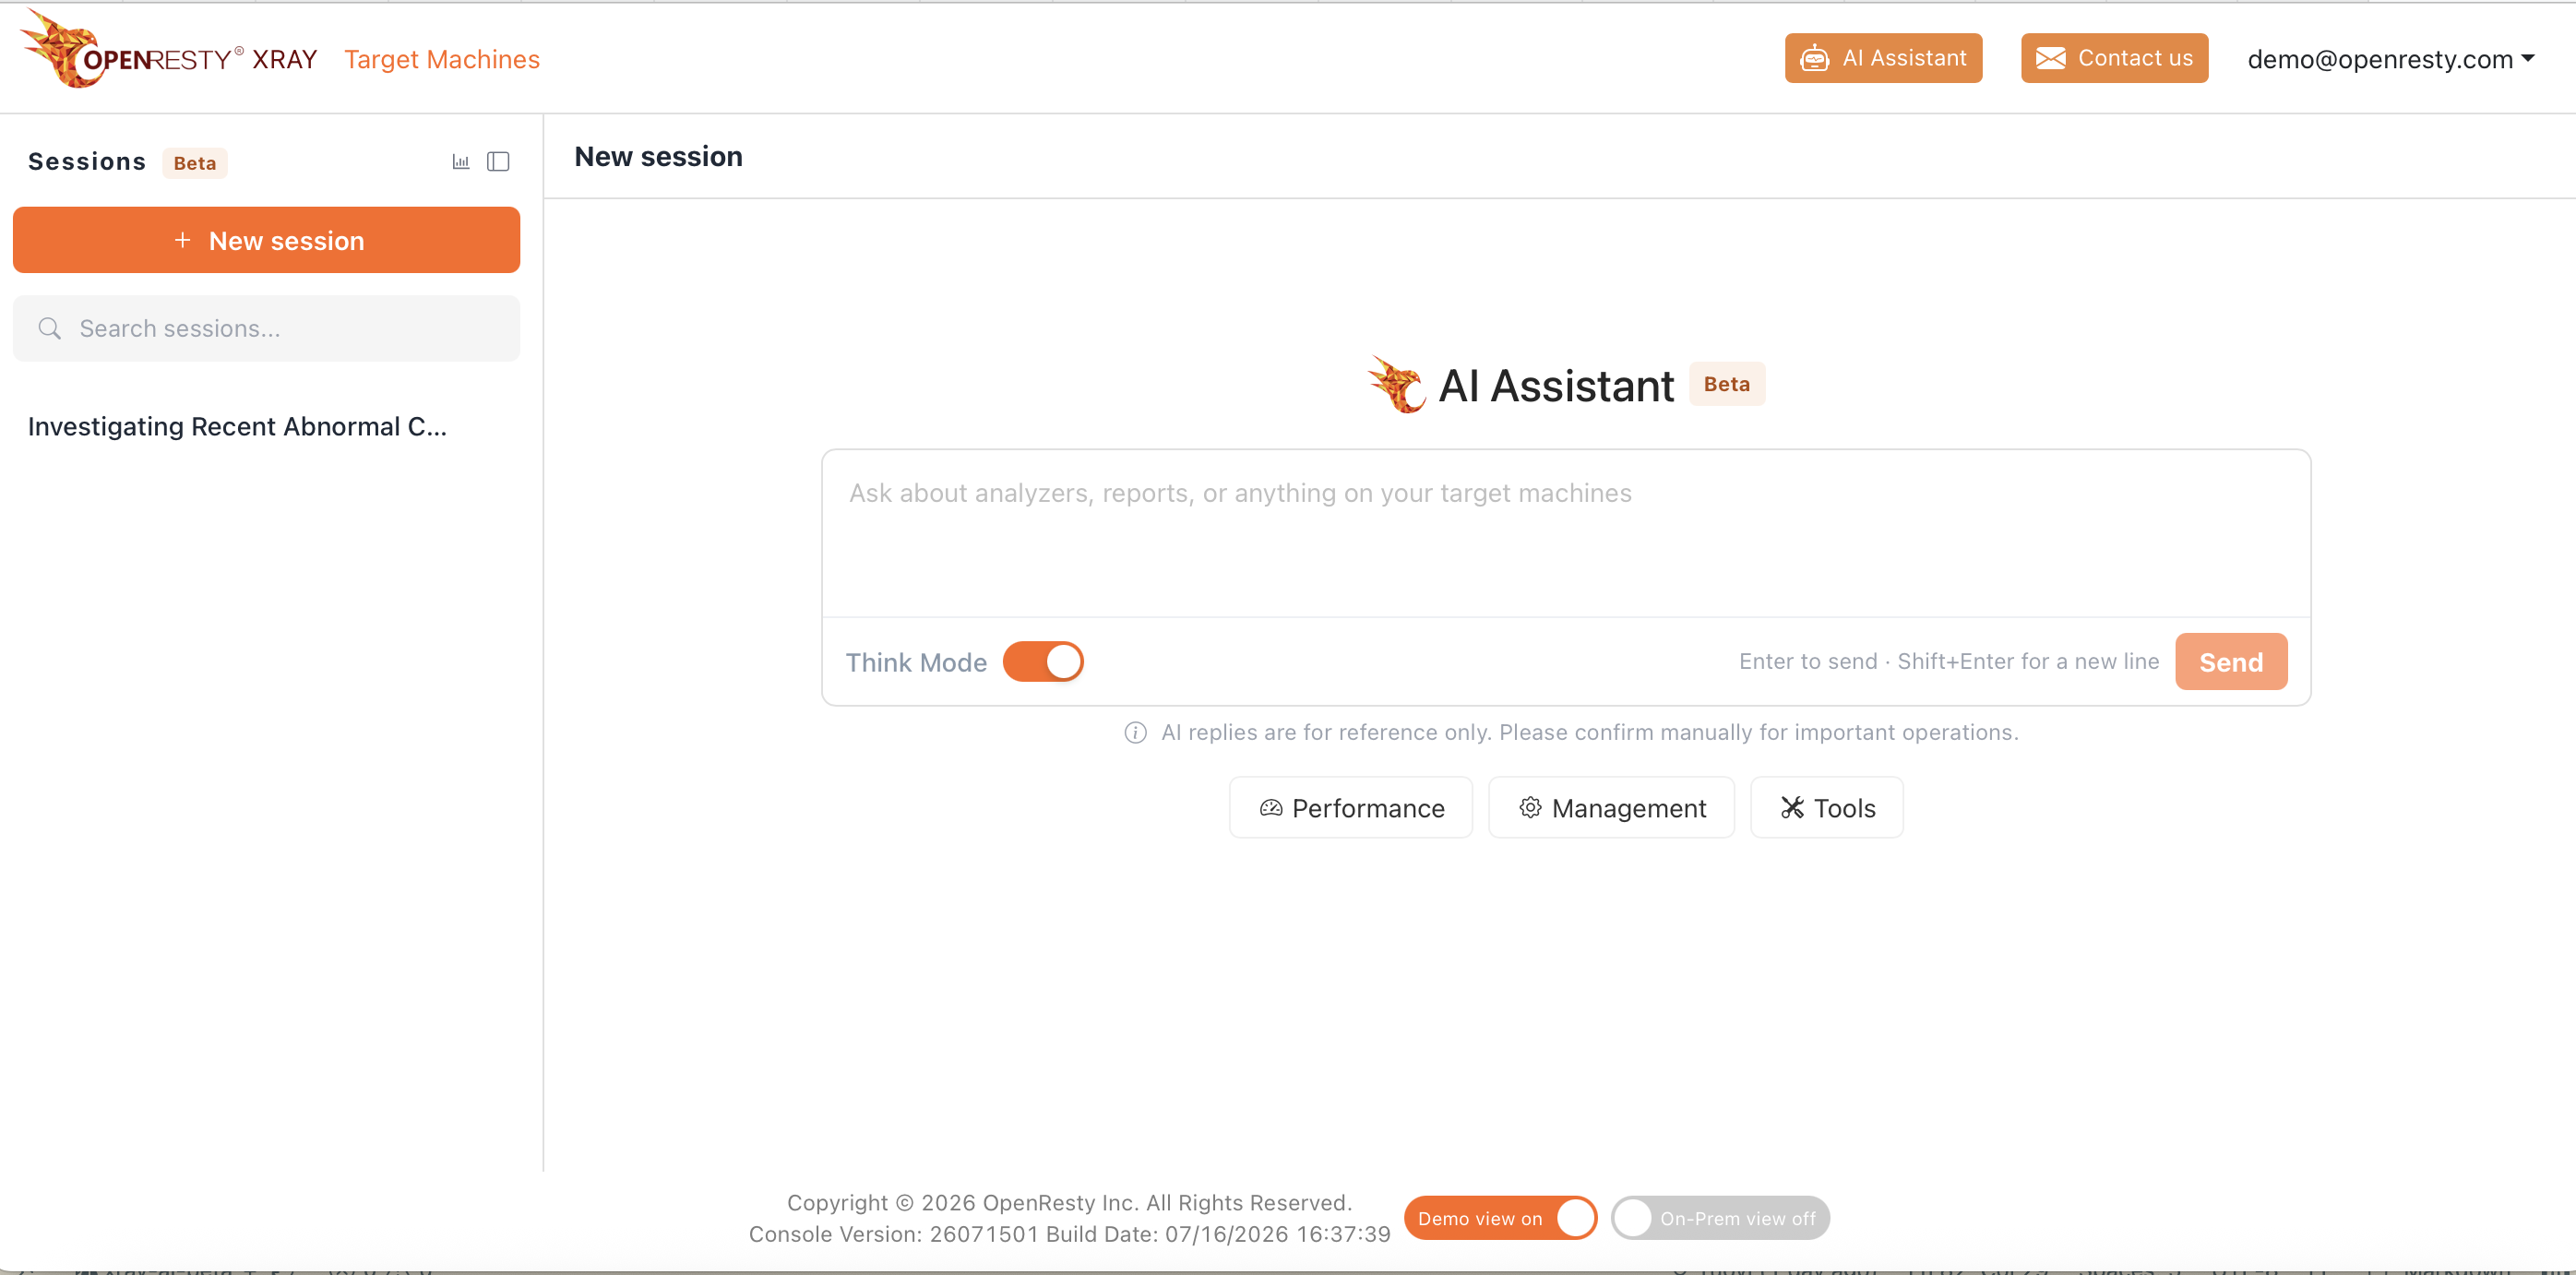
Beyond the entry points embedded throughout the product, the AI Assistant also has a standalone page, reached via the AI Assistant icon in the top-right corner of the console. It’s suited to open-ended consultation and long conversations that aren’t tied to a specific page.
On the left is your conversation history; on the right is the chat area. Conversations from all entry points (including the pop-up) are gathered here, and you can pick any of them back up at any time. The conversation list also supports viewing your Beta quota usage, copying a conversation ID (use it to pinpoint an issue precisely when reporting feedback), sharing a whole troubleshooting session with a colleague in one click, and more.
The Other Direction: Bring OpenResty XRay into Your Own AI Agent
Everything above is about using the AI Assistant inside the OpenResty XRay console. The reverse works too: AI Agents can now connect to OpenResty XRay over MCP, and you can install the AI Assistant skill for smarter diagnostics.
That means Claude Code, Codex, Cursor, and other MCP-compatible clients can drive OpenResty XRay directly—running analyzers and reading diagnostic data. Performance diagnosis no longer means switching over to a separate OpenResty XRay console; it folds into the development and troubleshooting workflow you already have. While you’re chasing a production issue in your IDE or terminal, the same agent can kick off a dynamic-tracing run, read the flame graph back, and give you a conclusion—no shuttling context back and forth.
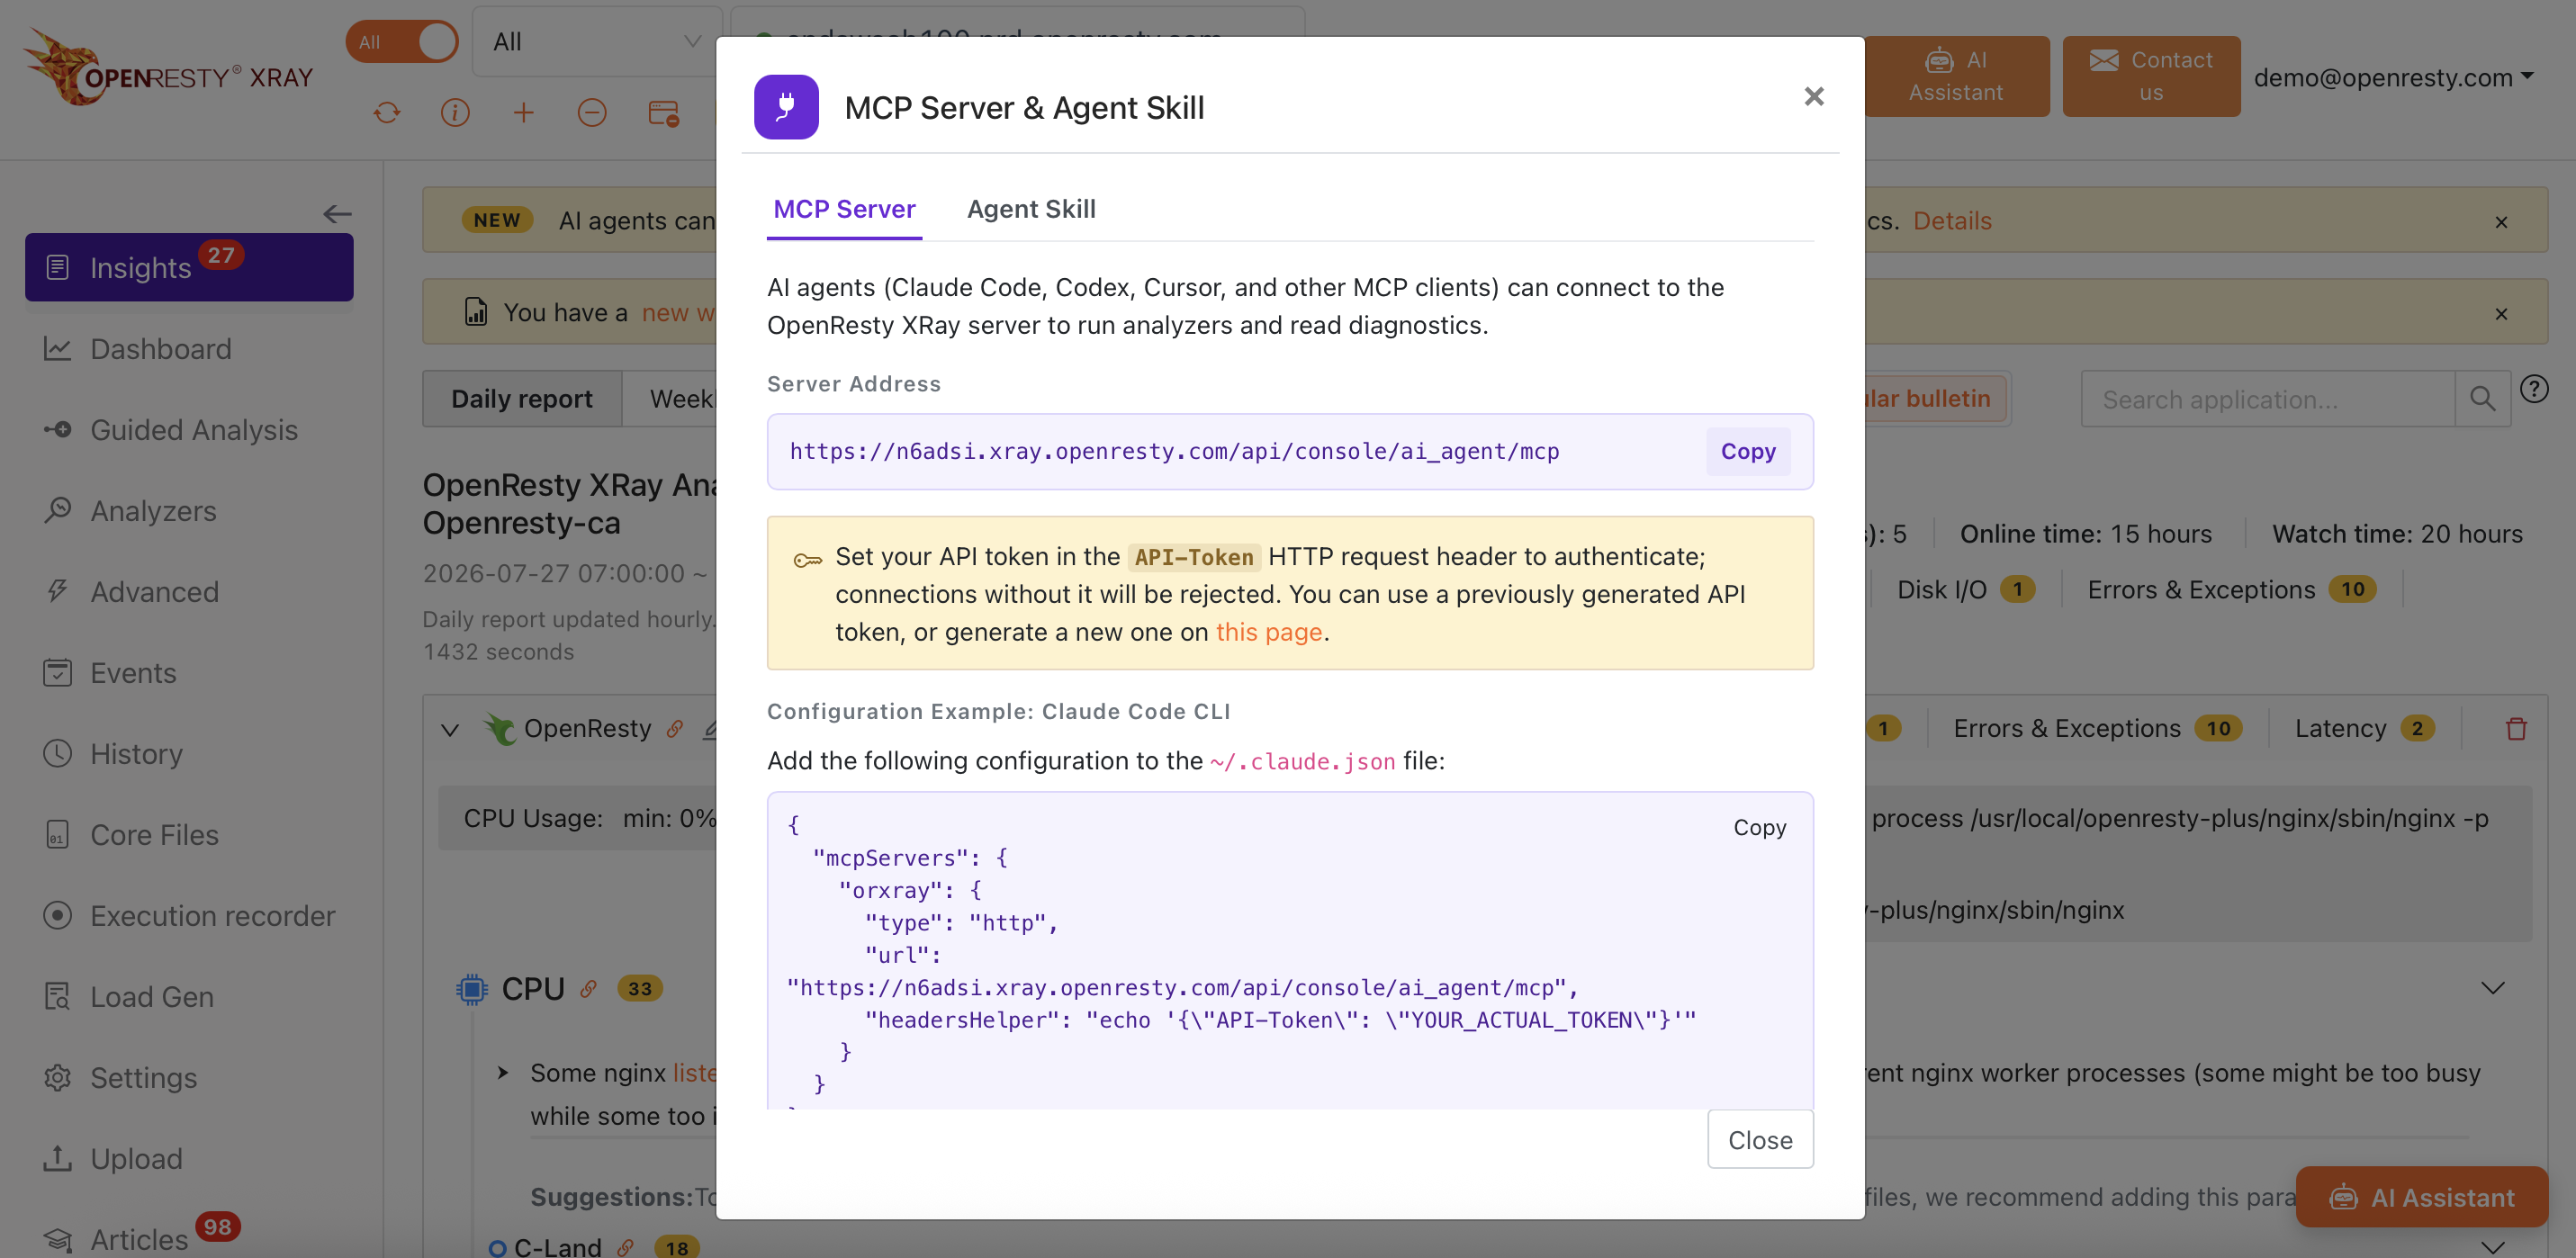
The entry point is the “MCP Server & Agent Skill” pop-up in the console, which offers two ways to connect that work together.
Option 1: Connect to the MCP Server
The “MCP Server” tab shows the MCP server address tied to your account, the API-Token header authentication instructions, and a ready-to-use configuration example for Claude Code that you can drop straight into ~/.claude.json. Fill in your token as shown and your agent can connect to the OpenResty XRay server, run analyzers, and read diagnostic information.
Option 2: Install the AI Assistant Skill
Once you’re connected over MCP, installing the AI Assistant Skill lets Claude Code and other agents produce smarter diagnostics. The “Agent Skill” tab provides the download button for the skill package along with installation examples—just follow along.

FAQ
Can AI really read a flame graph?
Yes—and this is exactly where it shines. Every stack frame in a flame graph is structured sampling data, and the OpenResty XRay AI Assistant understands what each analyzer measures as well as OpenResty/Nginx internals. So its reading of a flame graph isn’t “describing a picture”—it’s analysis grounded in the raw sampling data: what a wide bar means, which call path is worth chasing, which analyzer to run next—it tells you directly.
How reliable are the AI’s interpretations?
The AI Assistant’s interpretations are grounded in the runtime data OpenResty XRay actually collected, and each answer annotates the data sources it cites so you can cross-check. That said, it is built on a large language model and can still misread data or draw an unsound inference—treat its causal analysis and optimization suggestions as evidence-backed hypotheses rather than final conclusions. Before any important production change, return to the original flame graph and report entries for confirmation. Interpretation quality is still iterating during the Beta; when you hit an inaccurate answer, please send it to us with the conversation ID.
On which pages can I use it?
Four entry points: the AI Assistant pop-up in the bottom-right corner of any page (automatically carrying the current page’s context), the “Report Interpretation” tab on the Report Insights page, the AI Interpretation on a single analysis job’s detail page, and the standalone AI Assistant page reached from the top-right corner of the console. Conversations from all entry points are gathered on the standalone page.
Try It Now
If you’re already an OpenResty XRay user, the fastest way to get started takes under two minutes: open the OpenResty XRay console, go to the report page of any target machine, click the AI Assistant pop-up in the bottom-right corner, and ask “What’s the single issue most worth attention on this machine right now?"—then see its answer and compare it against your own judgment.
If you haven’t started using OpenResty XRay yet, you can request a trial first, connect it to your own production environment, and let the AI Assistant stand directly on top of your real runtime data to give you a diagnosis:
During Beta, we especially want to hear: which kinds of questions it answers well, which kinds it answers poorly, and which data sources you’d like it to cover that it doesn’t yet. When you send feedback, include the conversation ID (copyable at the top of the conversation list), or reach out to your technical support contact directly.
Every piece of feedback you give today defines what this tool becomes tomorrow.
What is OpenResty XRay
OpenResty XRay is a dynamic-tracing product that automatically analyzes your running applications to troubleshoot performance problems, behavioral issues, and security vulnerabilities with actionable suggestions. Under the hood, OpenResty XRay is powered by our Y language targeting various runtimes like Stap+, eBPF+, GDB, and ODB, depending on the contexts.
If you like this tutorial, please subscribe to this blog site and/or our YouTube channel. Thank you!
About The Author
Yichun Zhang (Github handle: agentzh), is the original creator of the OpenResty® open-source project and the CEO of OpenResty Inc..
Yichun is one of the earliest advocates and leaders of “open-source technology”. He worked at many internationally renowned tech companies, such as Cloudflare, Yahoo!. He is a pioneer of “edge computing”, “dynamic tracing” and “machine coding”, with over 22 years of programming and 16 years of open source experience. Yichun is well-known in the open-source space as the project leader of OpenResty®, adopted by more than 40 million global website domains.
OpenResty Inc., the enterprise software start-up founded by Yichun in 2017, has customers from some of the biggest companies in the world. Its flagship product, OpenResty XRay, is a non-invasive profiling and troubleshooting tool that significantly enhances and utilizes dynamic tracing technology. And its OpenResty Edge product is a powerful distributed traffic management and private CDN software product.
As an avid open-source contributor, Yichun has contributed more than a million lines of code to numerous open-source projects, including Linux kernel, Nginx, LuaJIT, GDB, SystemTap, LLVM, Perl, etc. He has also authored more than 60 open-source software libraries.
Related Articles
OpenResty XRay Sep 18, 2026

OpenResty XRay Sep 24, 2025

OpenResty XRay Apr 7, 2025

OpenResty XRay Mar 31, 2025

OpenResty XRay Nov 24, 2023