Analyze OpenResty/Nginx Applications without Debug Symbols (using OpenResty XRay)
We will show how to analyze your OpenResty or Nginx applications without debug symbols. Even in the absence of any debug information, it can analyze executables through machine learning, reconstruct debug symbols, and perform in-depth and comprehensive analysis through dynamic tracing. OpenResty XRay has the superpower of generating debug symbols from stripped executables, which makes it possible to get detailed information about C and Lua functions, source files, and source lines even without debug symbols.
Problem: Debug Symbols are missing
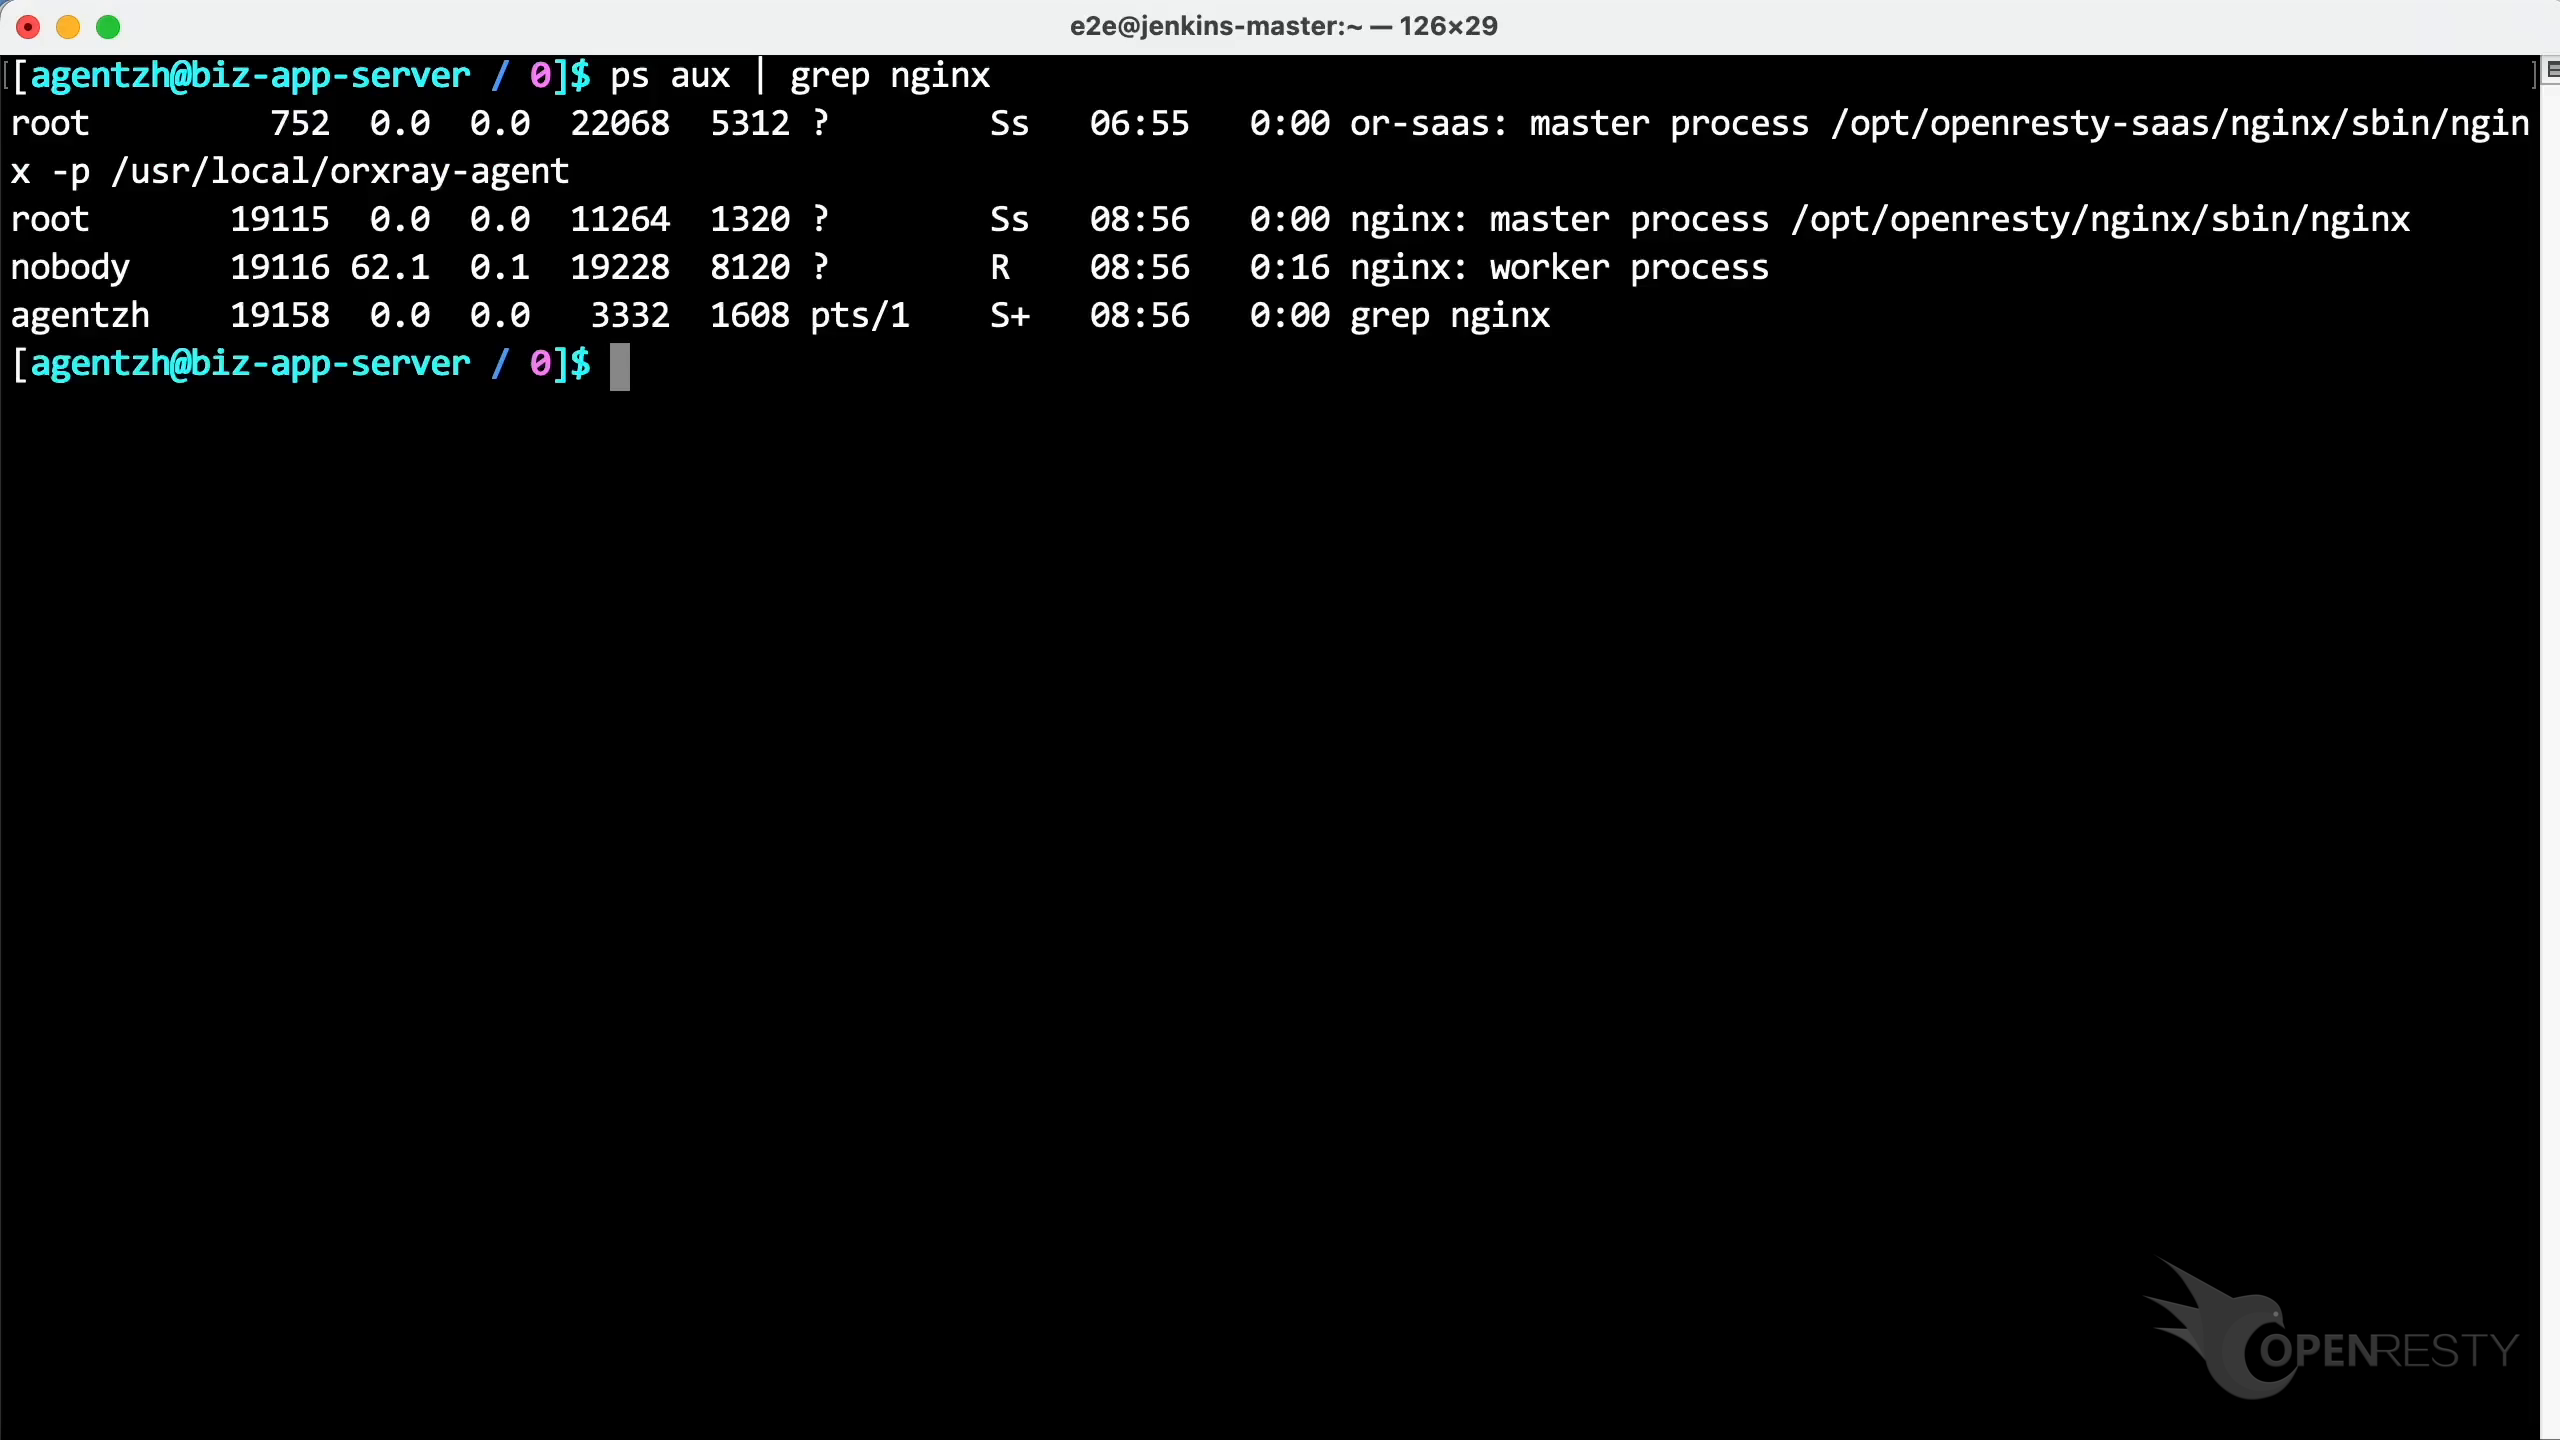
Run the ps command to inspect the target process and confirm the path of the executable file (in this example, OpenResty was built from source by the user).
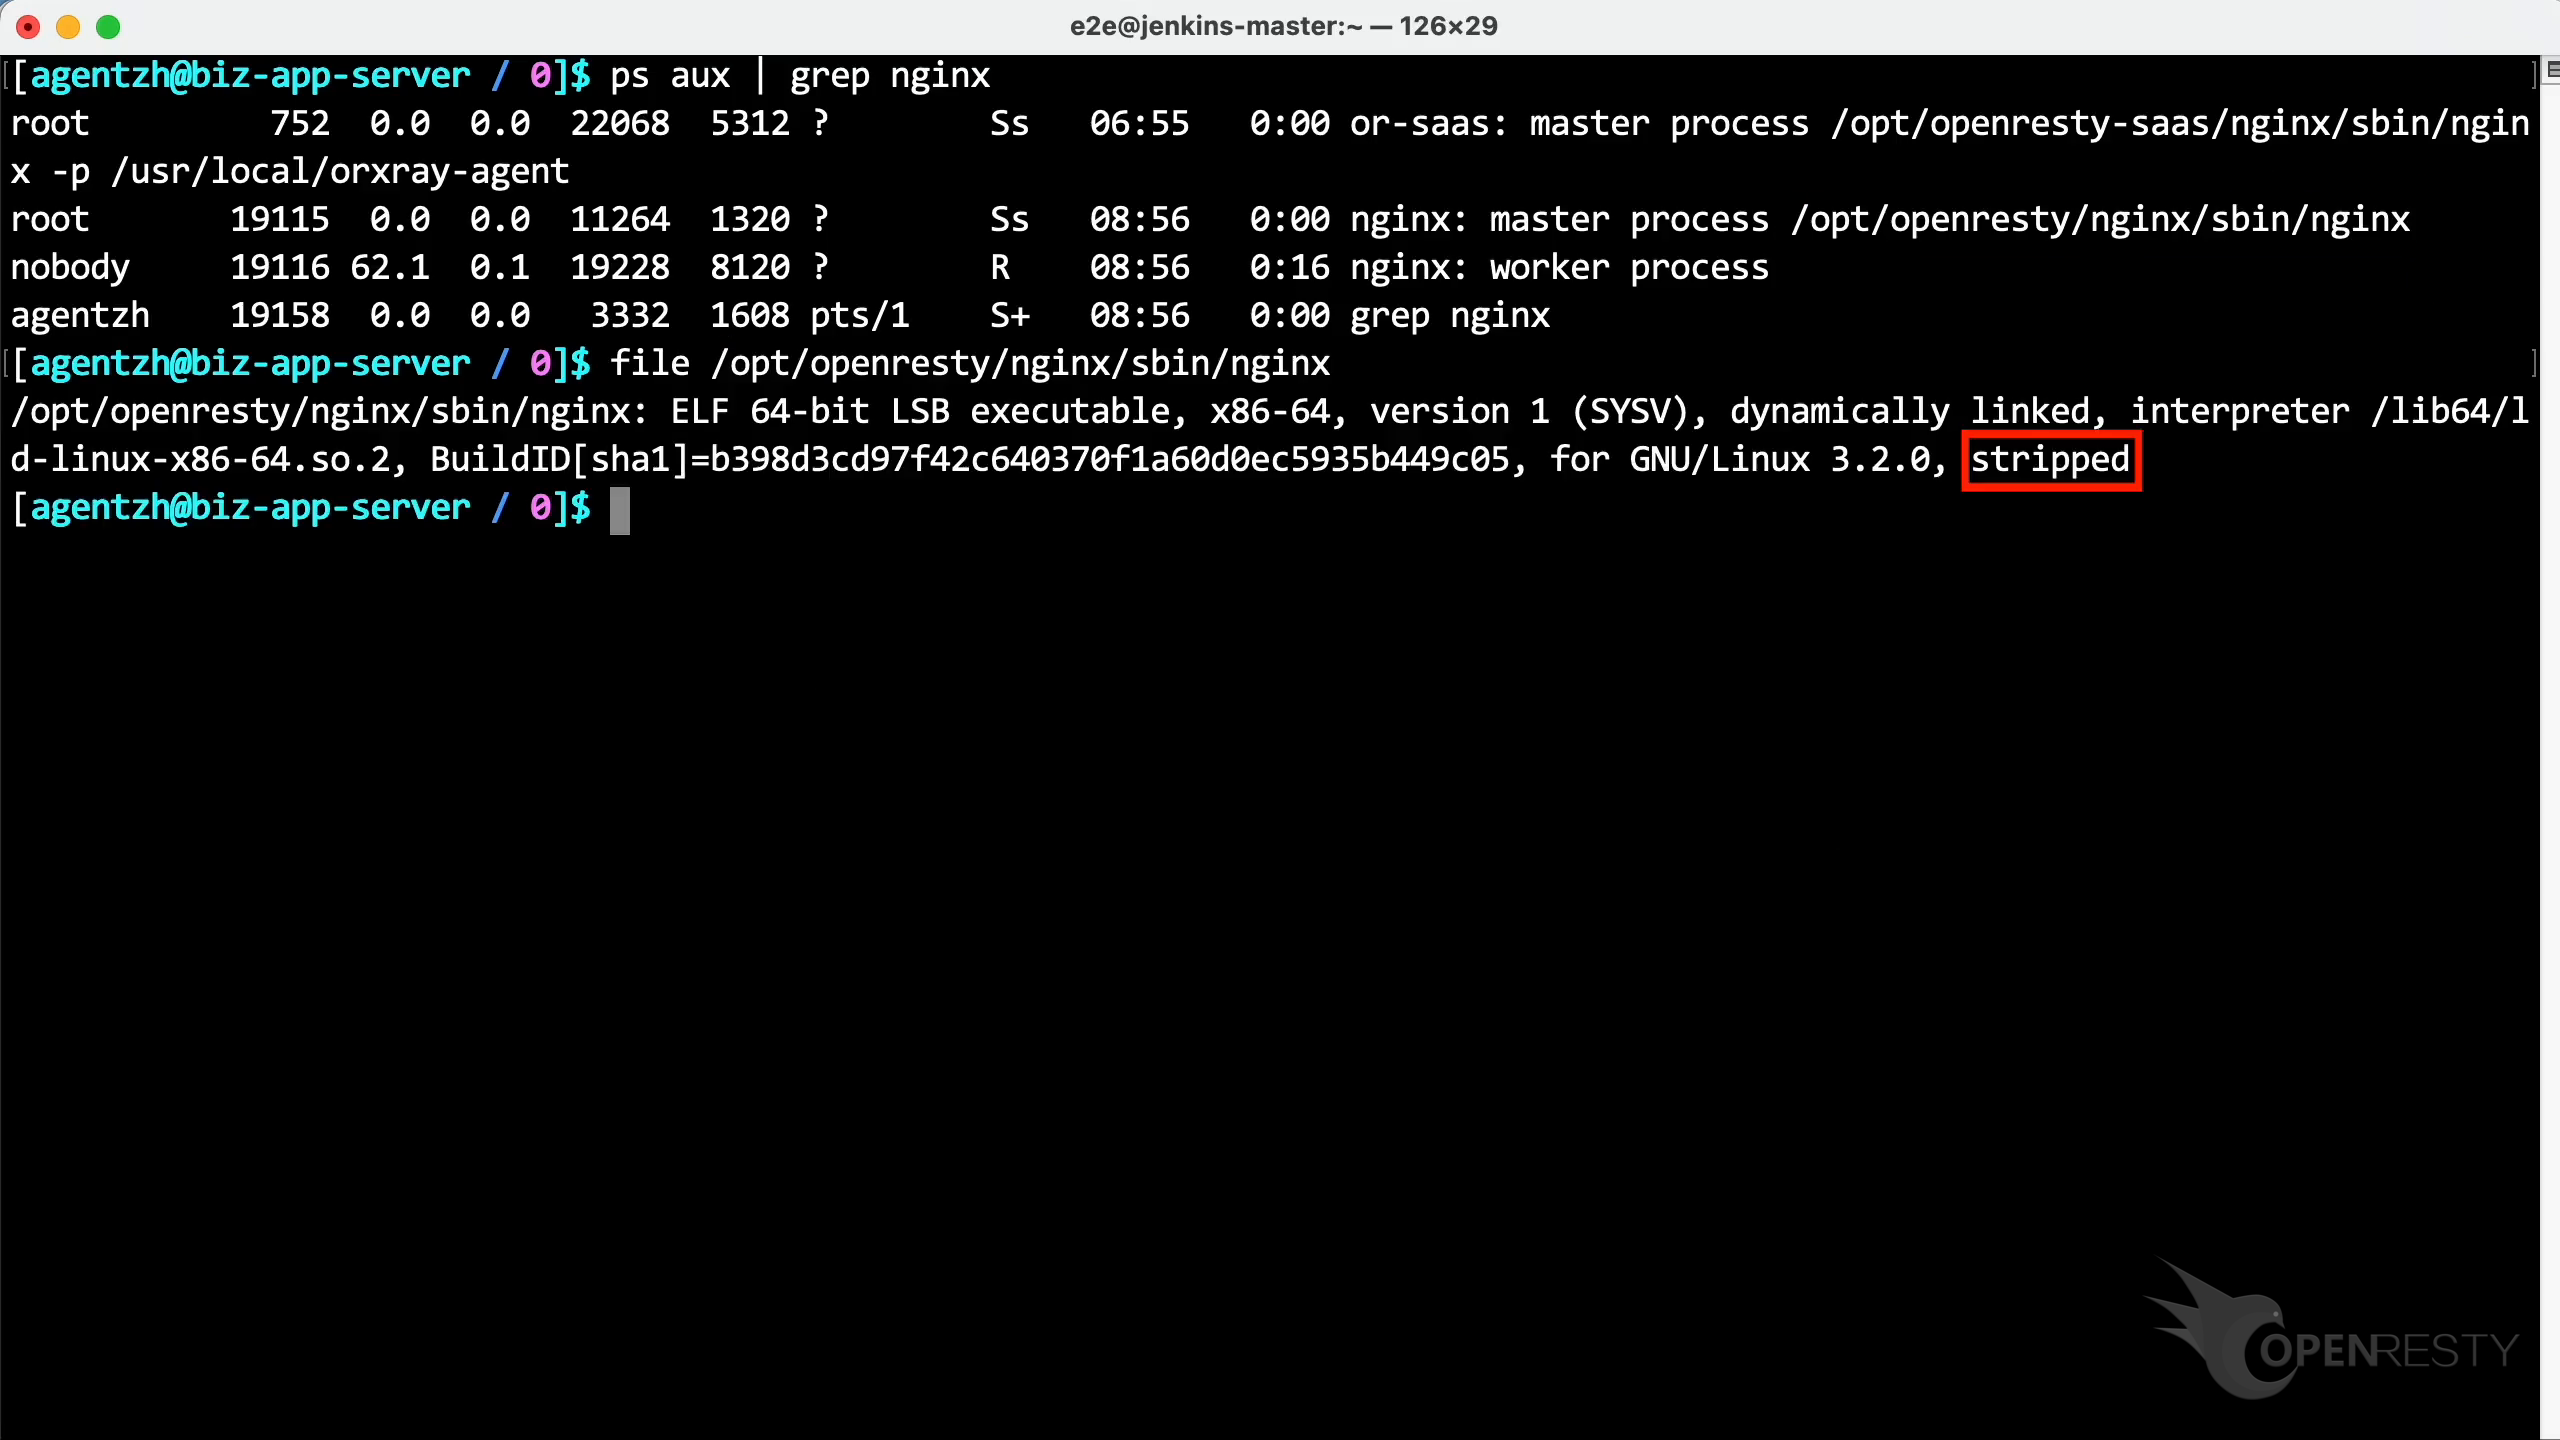
Use the file command to inspect the main executable. The output shows that the file is stripped and lacks any debug symbols or symbol table. We cannot find the corresponding debug symbol installation packages for this program either.
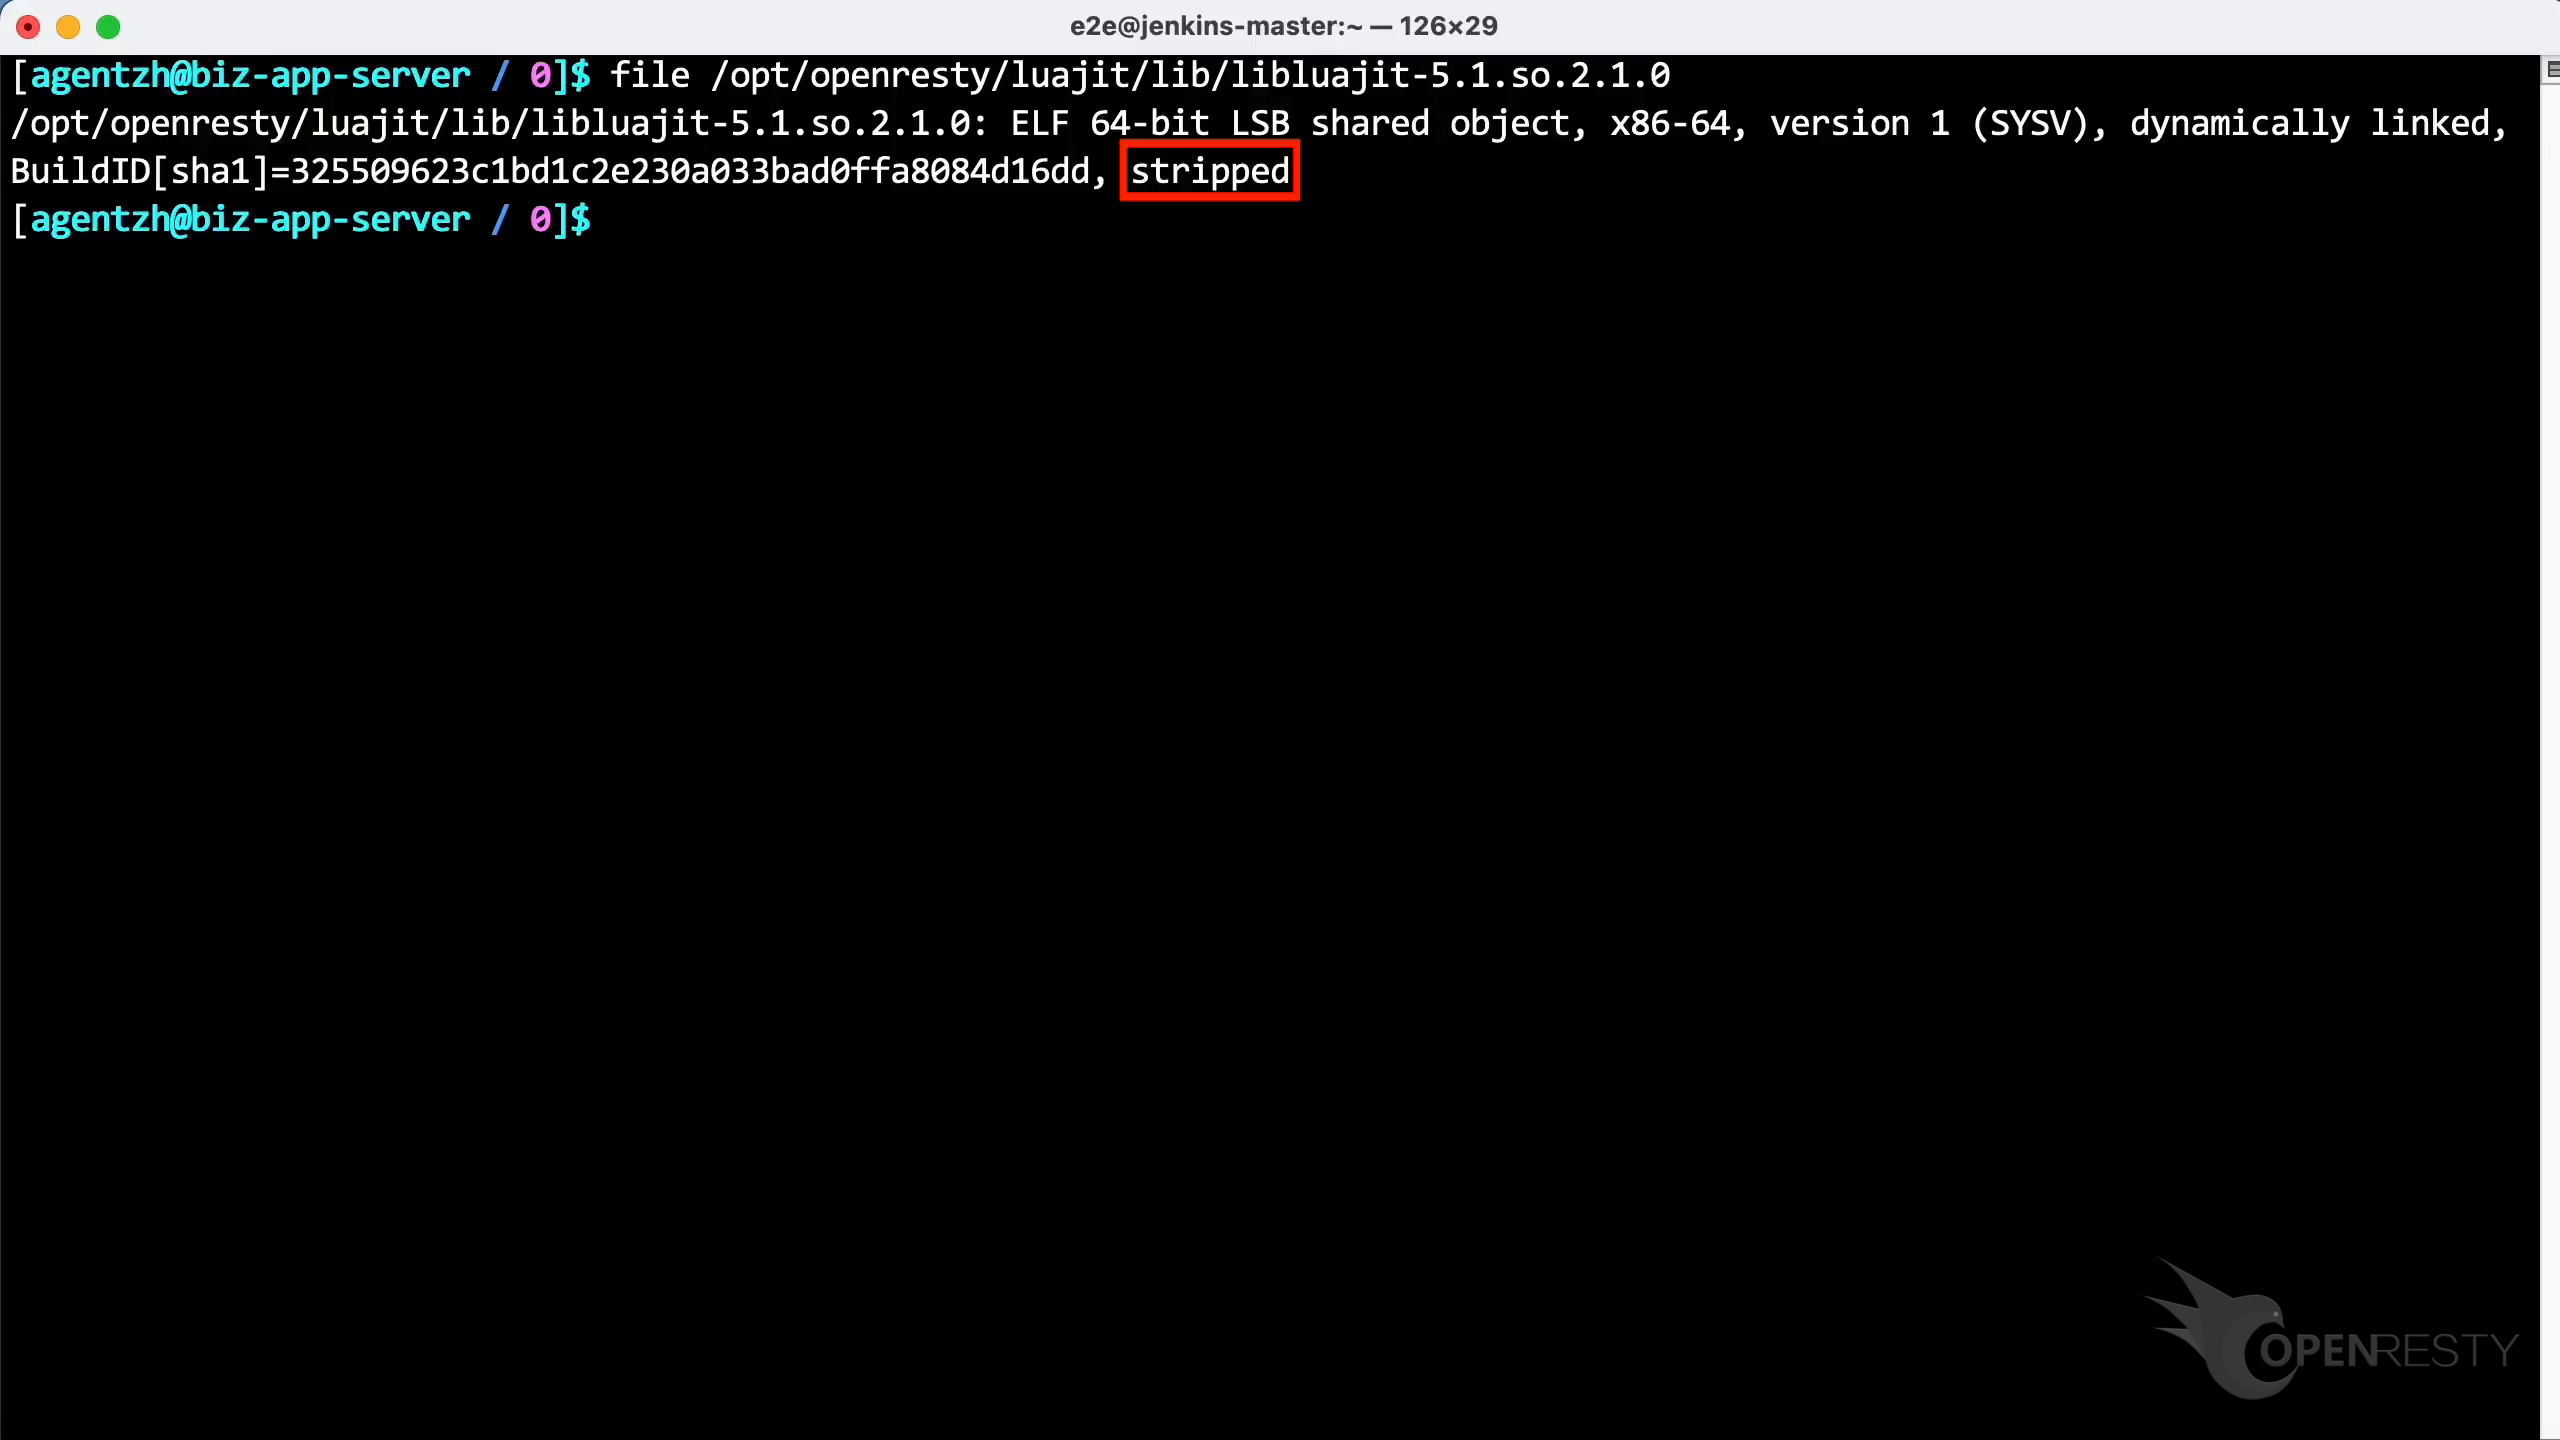
Use the file command again on the LuaJIT dynamic linked library loaded by the process. Once again, the debug symbols for the LuaJIT file are also missing.
Automatically Analyze and Rebuild Debug Symbols
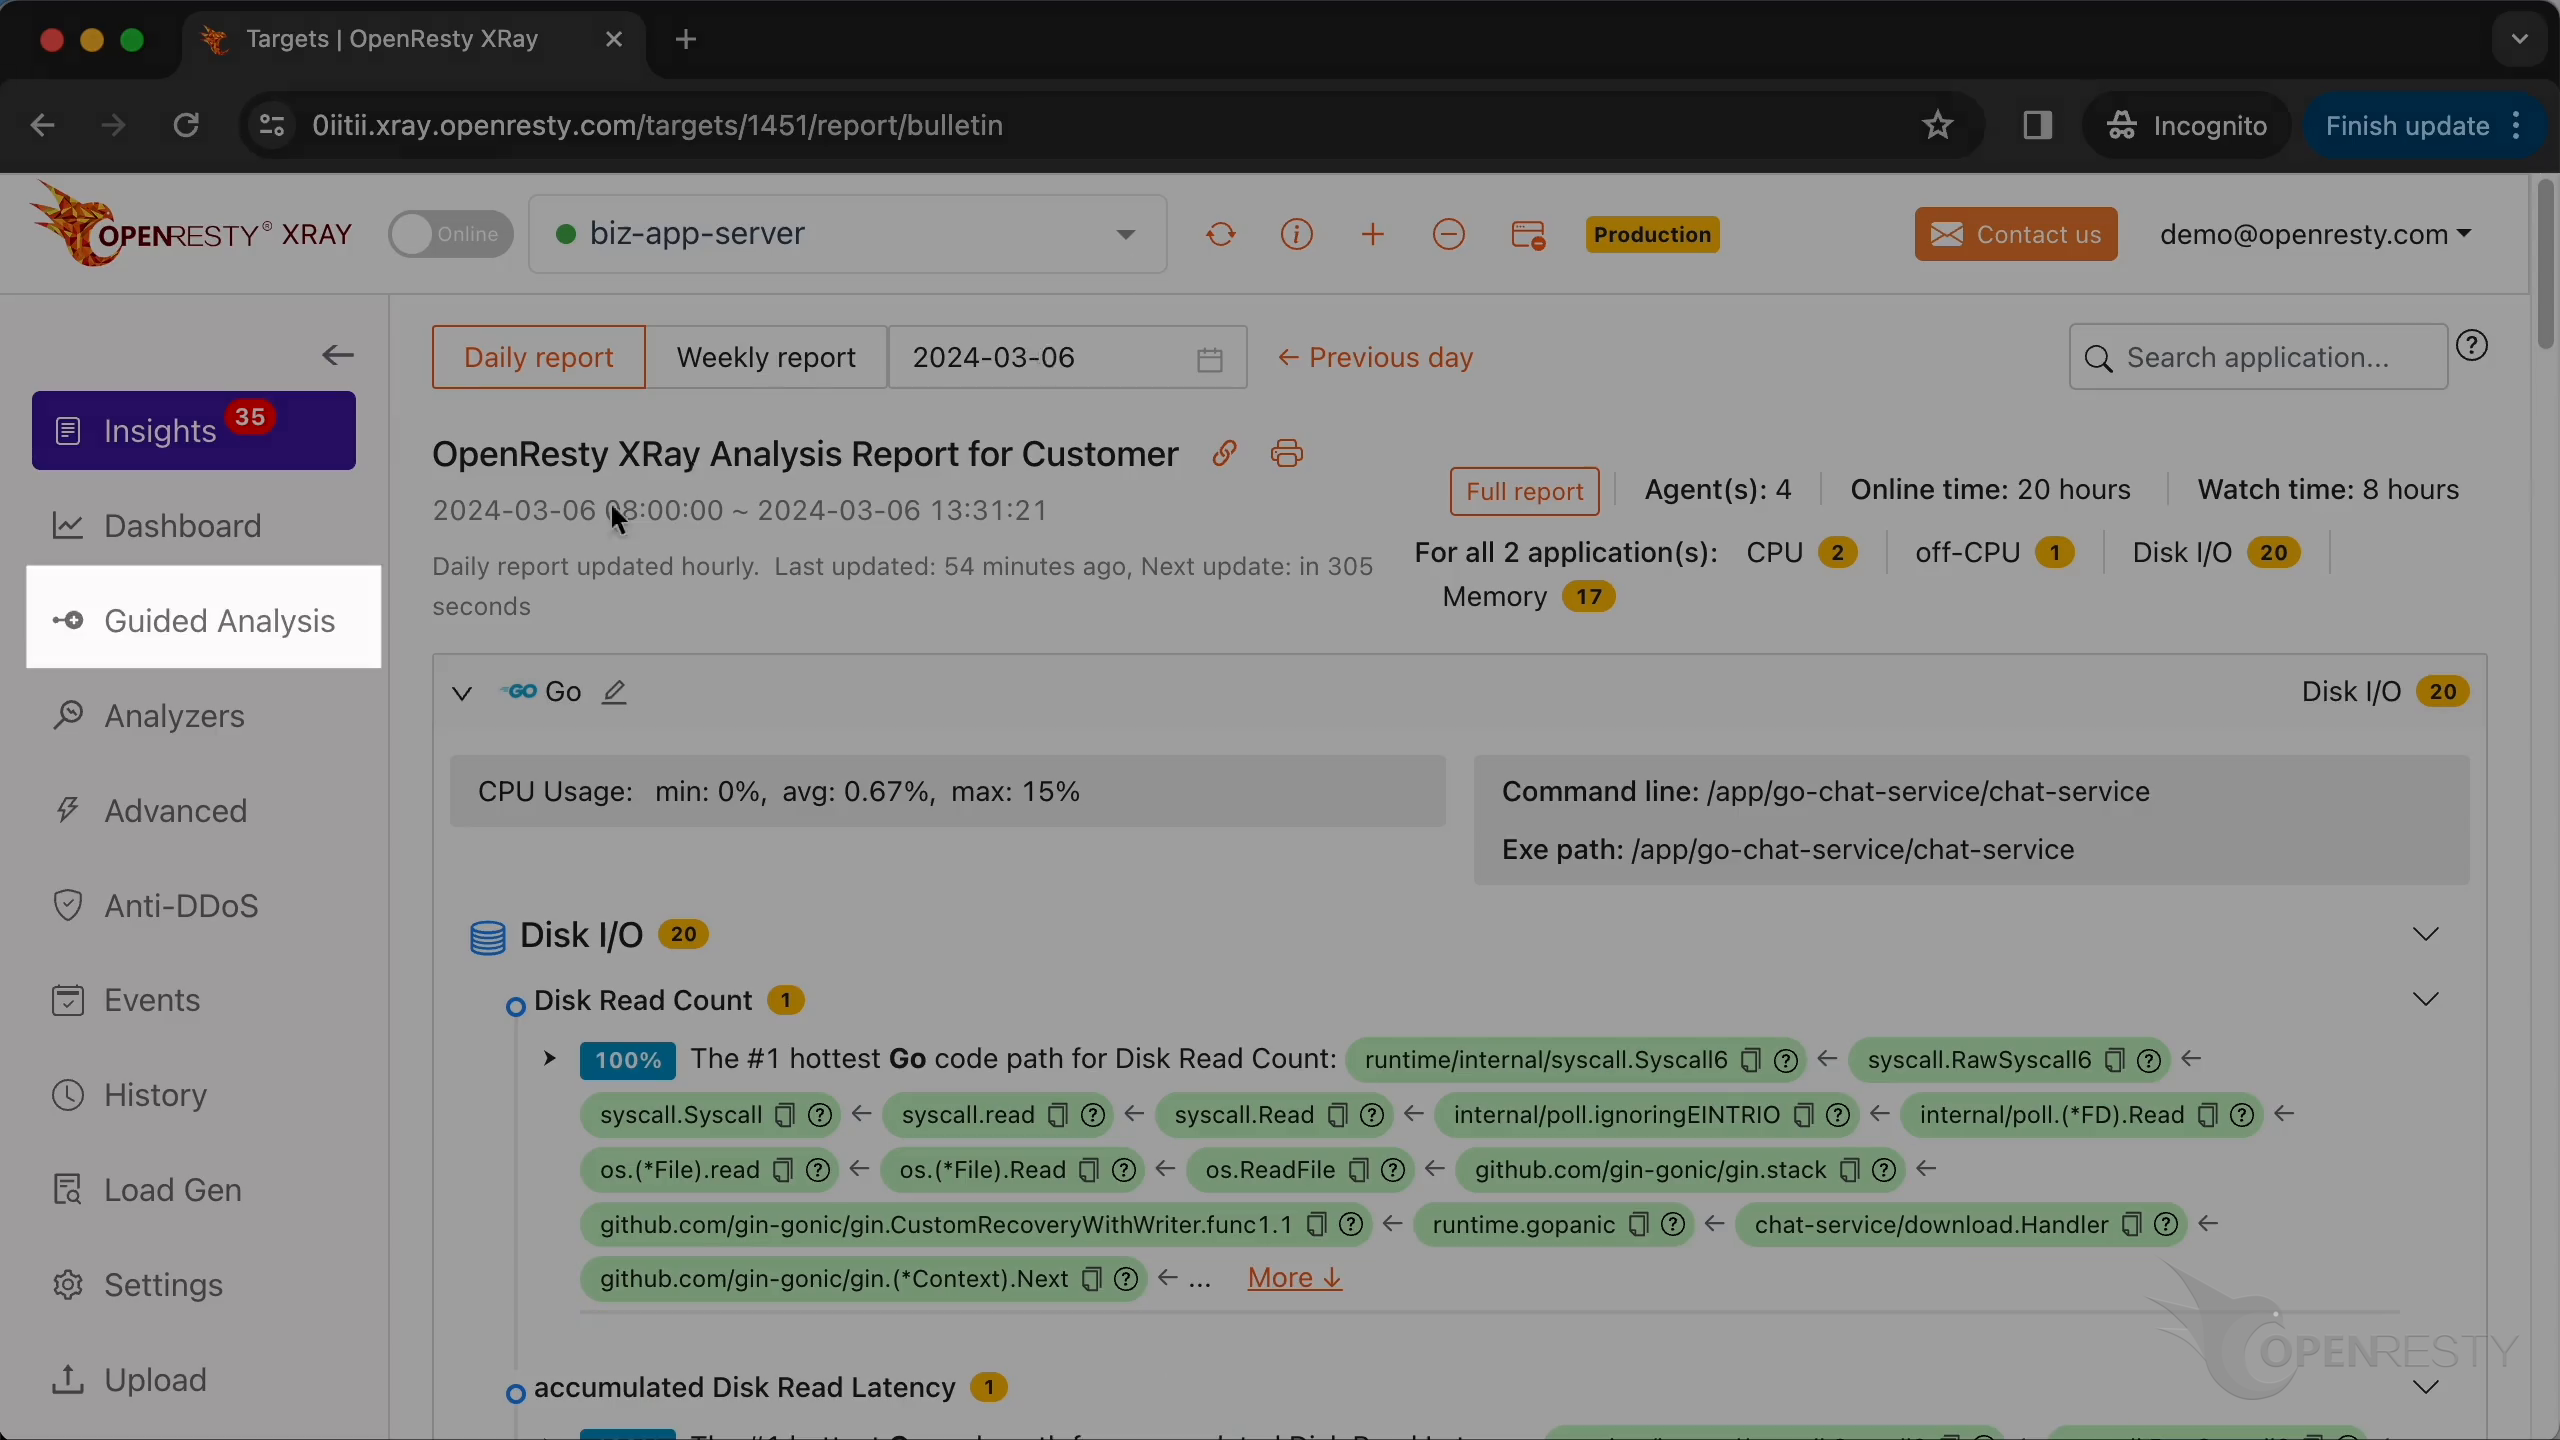
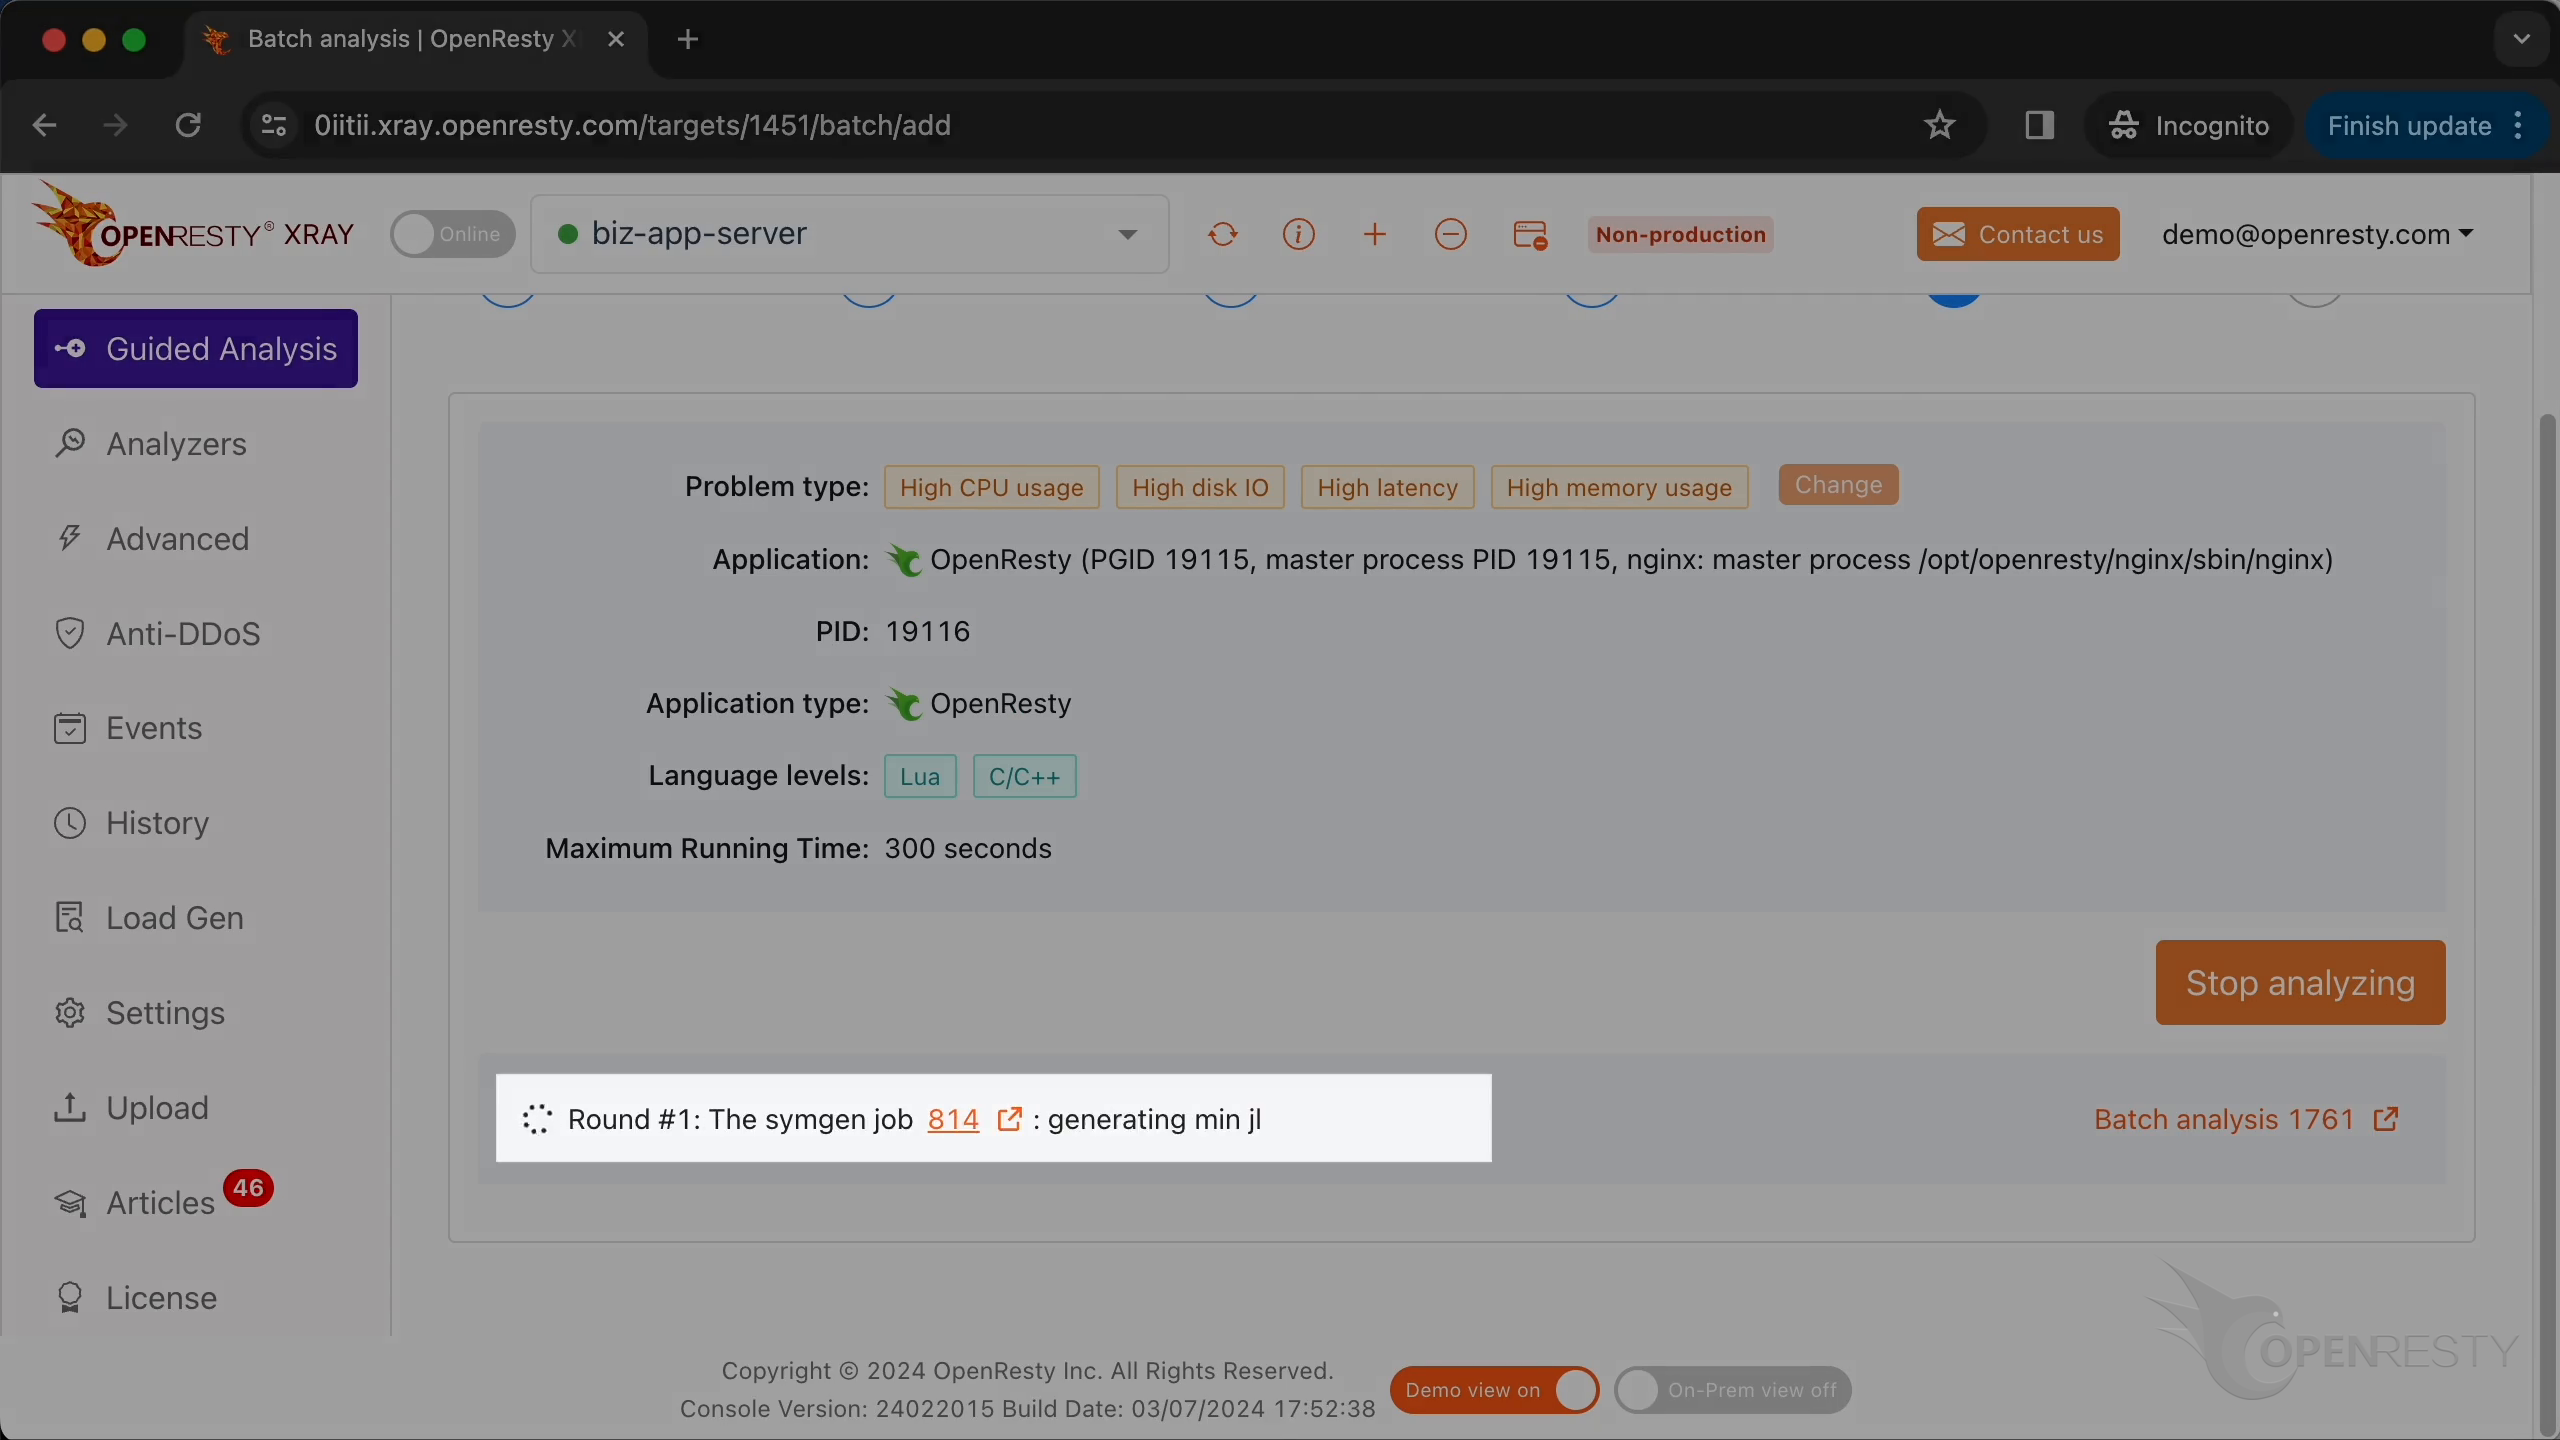
Open the OpenResty XRay Web console in your browser, go to Guided Analysis, and follow the wizard to choose the problem types, the target application, and the worker process; keep both Lua and C/C++ selected at the language level, then start the analysis. The Guided Analysis page is shown below (for the full sequence of options, refer to the video at the top).
After analysis starts, OpenResty XRay checks whether any executable is missing debug symbols and automatically kicks off a symbol rebuild. When the rebuild finishes, it runs all relevant analyzers in parallel as usual.
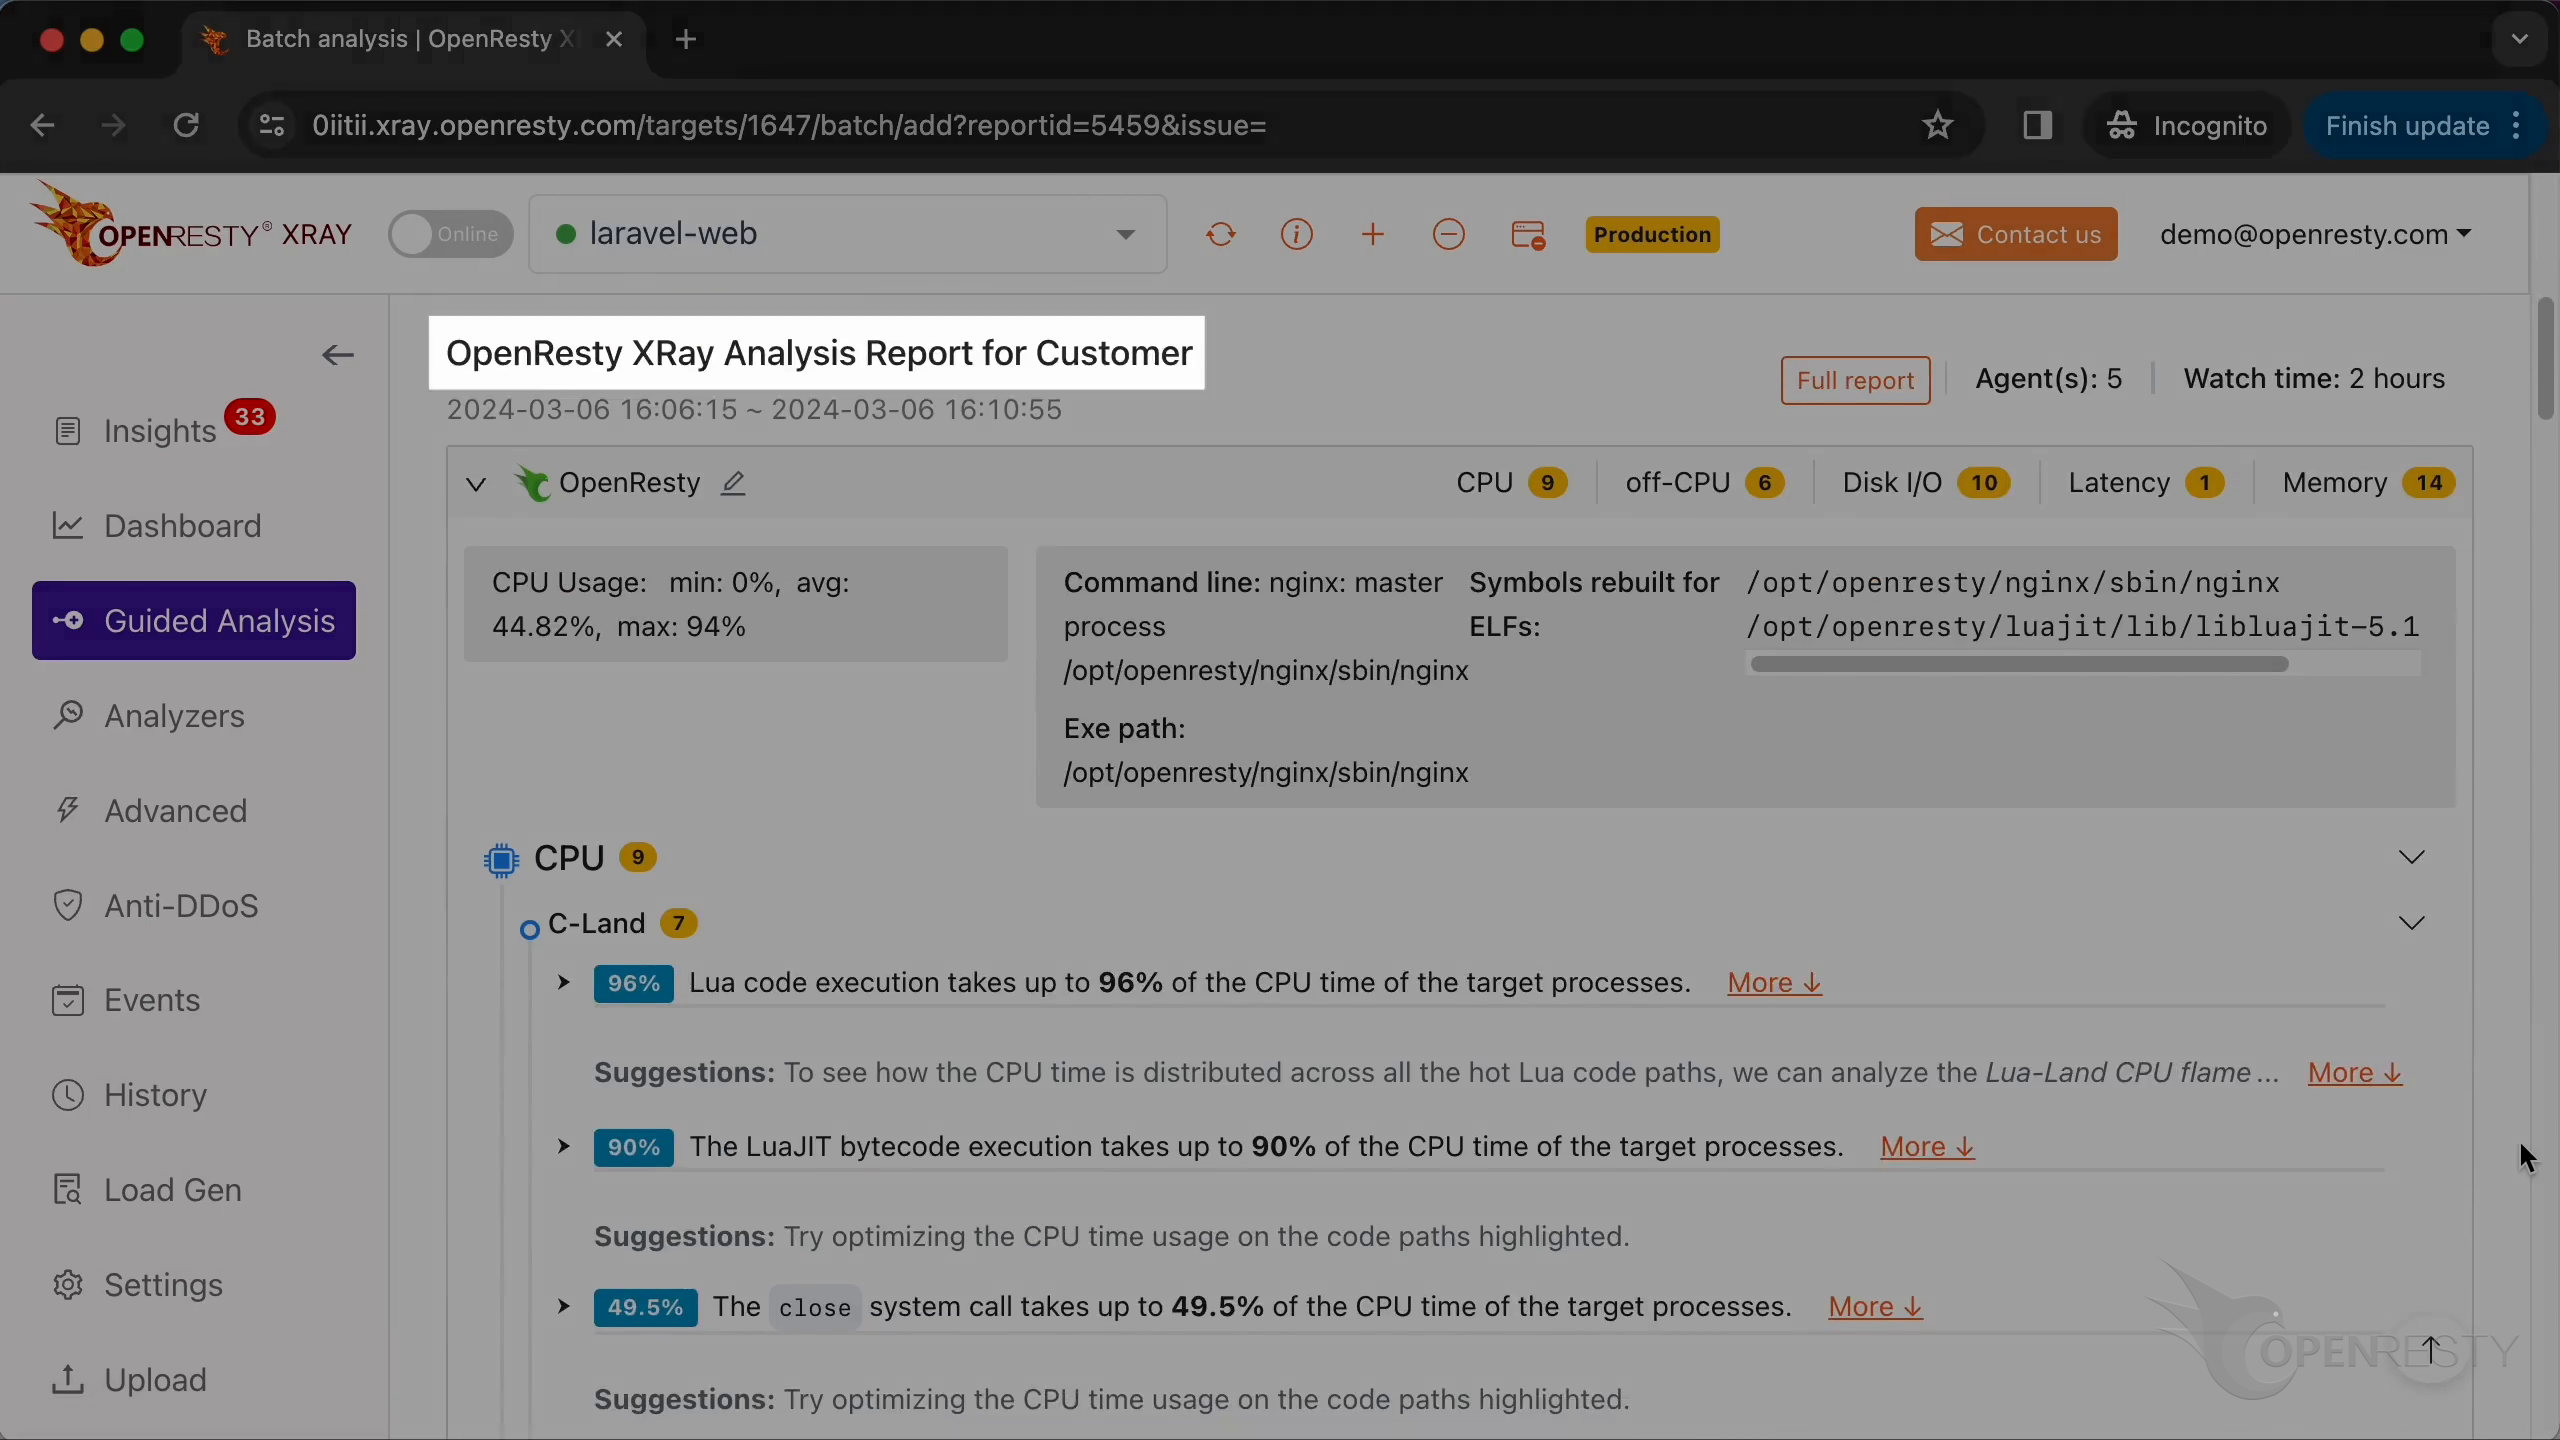
When you stop sampling, the console generates a consolidated analysis report. The sections below focus on how to read the CPU and memory parts.
CPU: Flame graphs and Lua hot paths
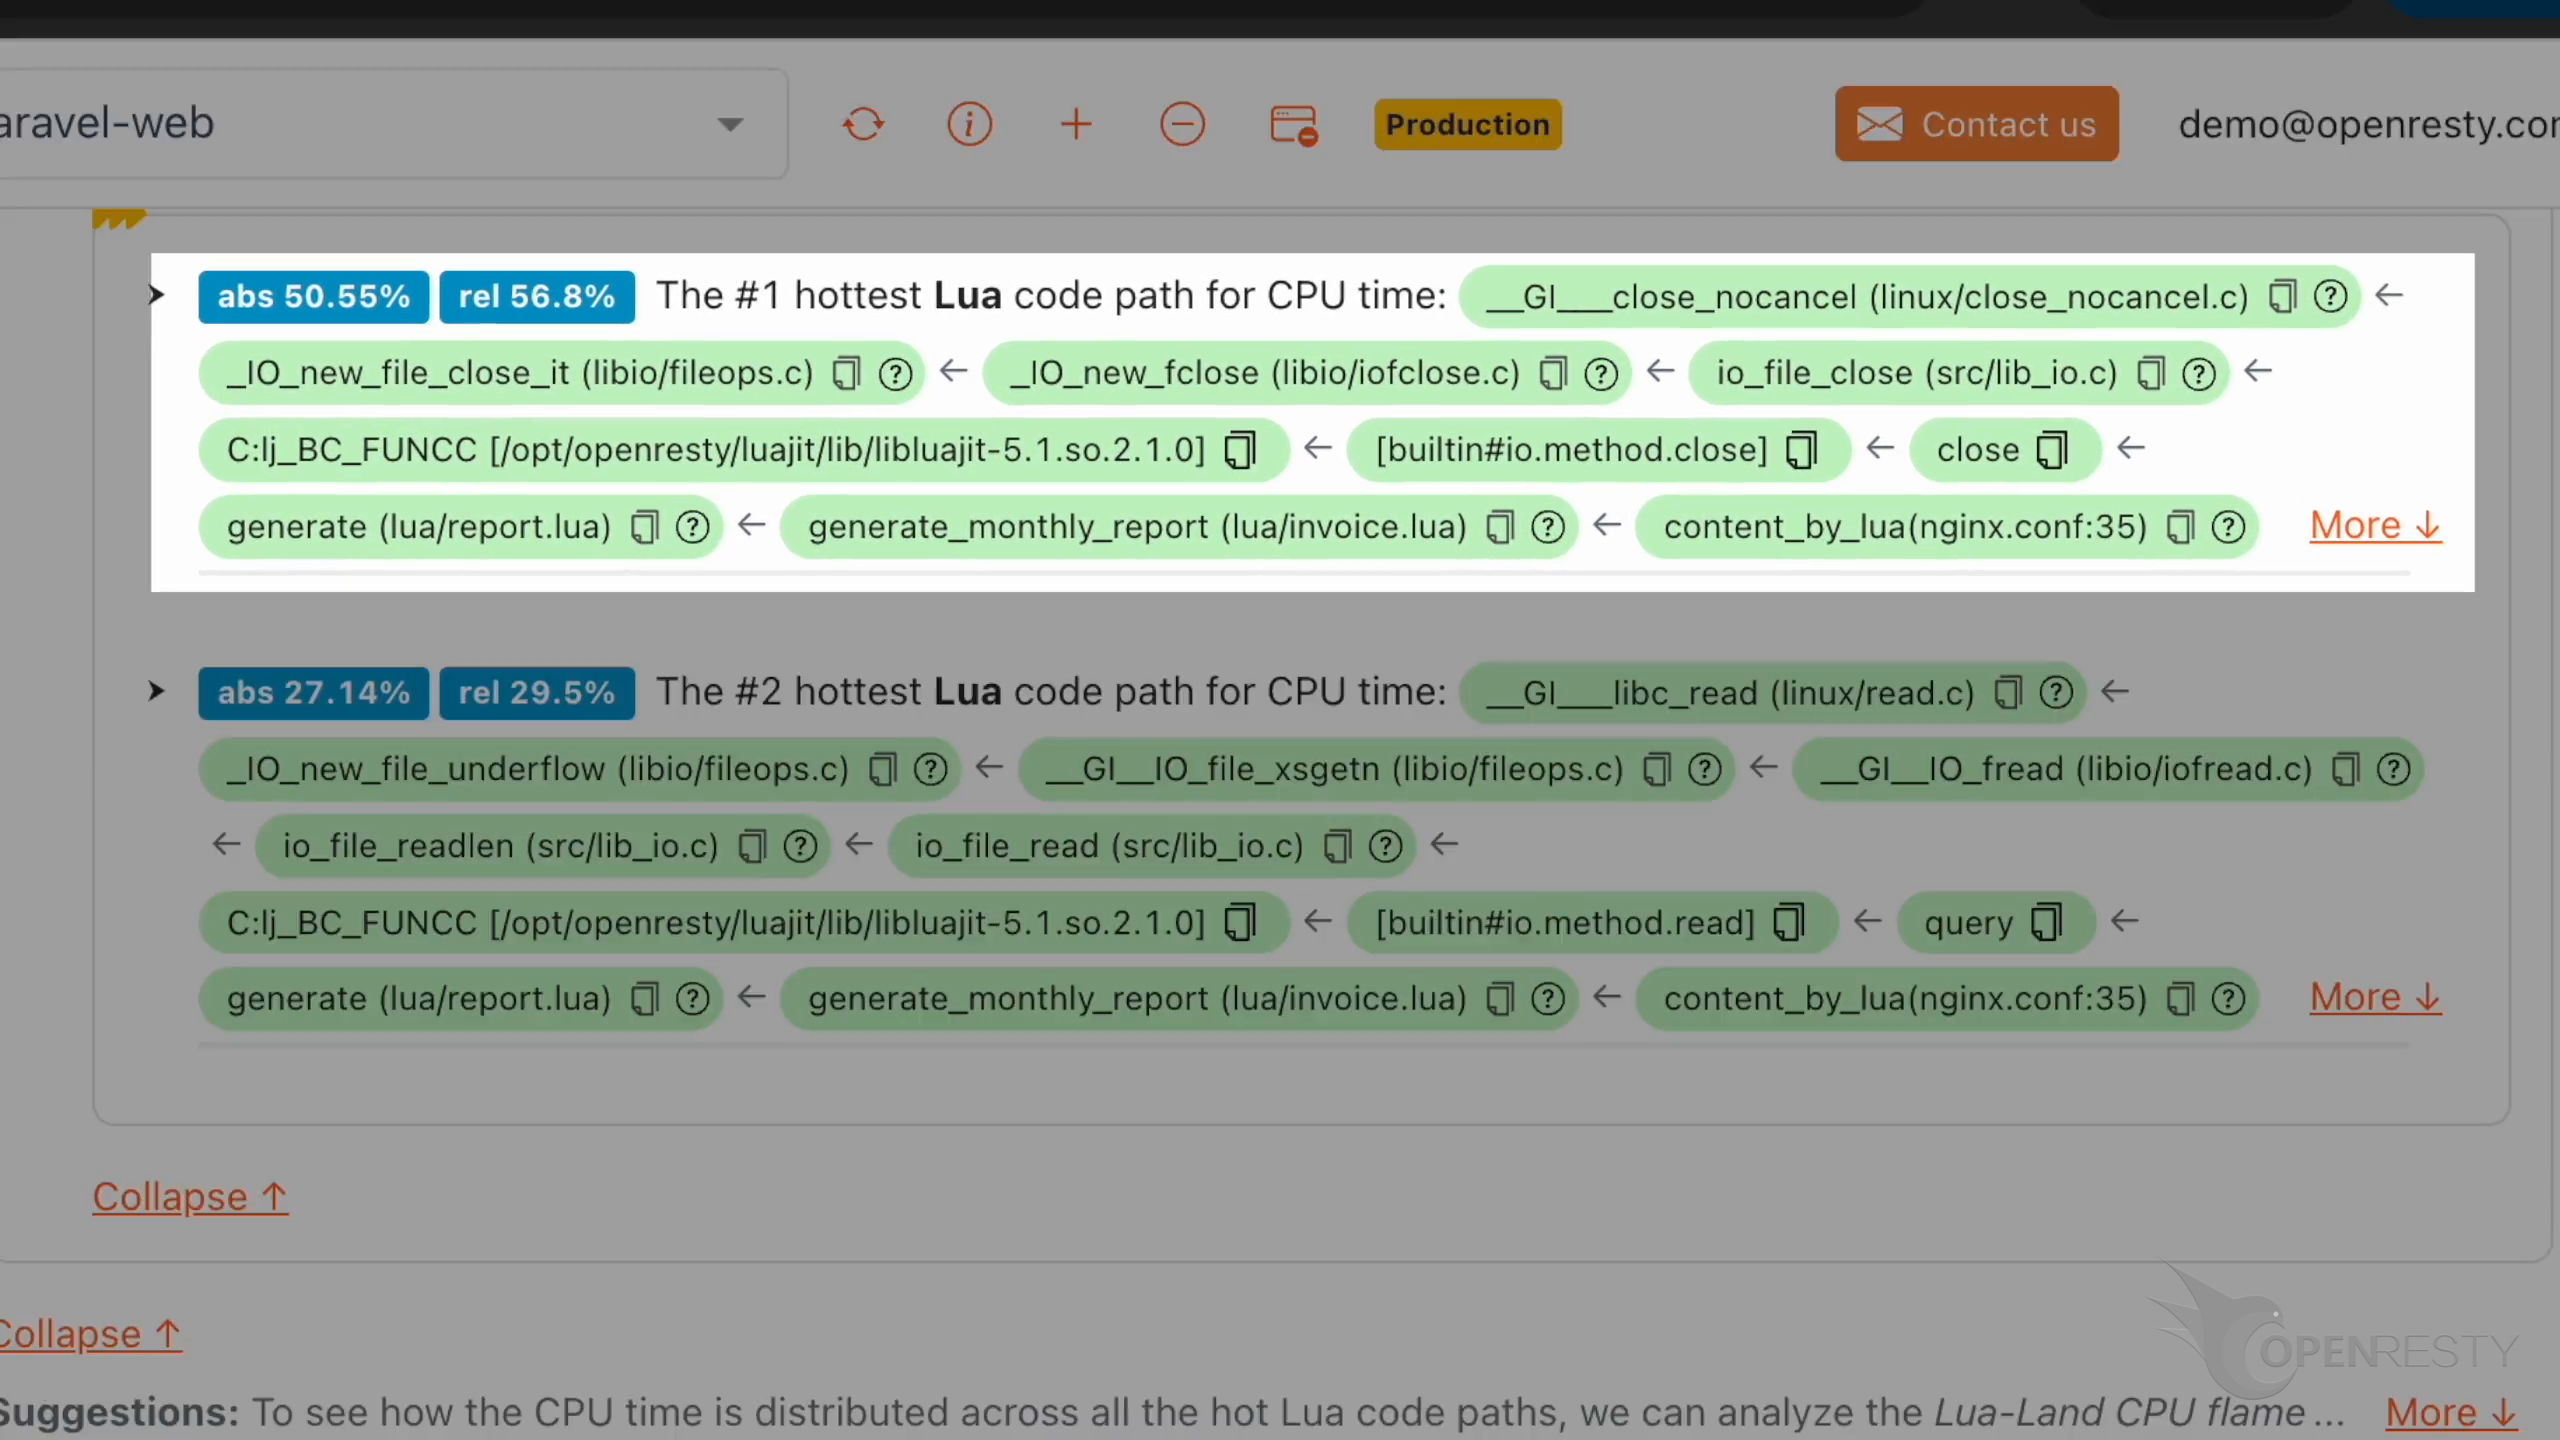
In the CPU section of the report, first check out Lua’s performance hotspots, then inspect the related C-land CPU flame graph for function names. With rebuilt symbols, the flame graph resolves to C source file names and line numbers. The hot code path was automatically inferred from this C-land CPU flame graph.
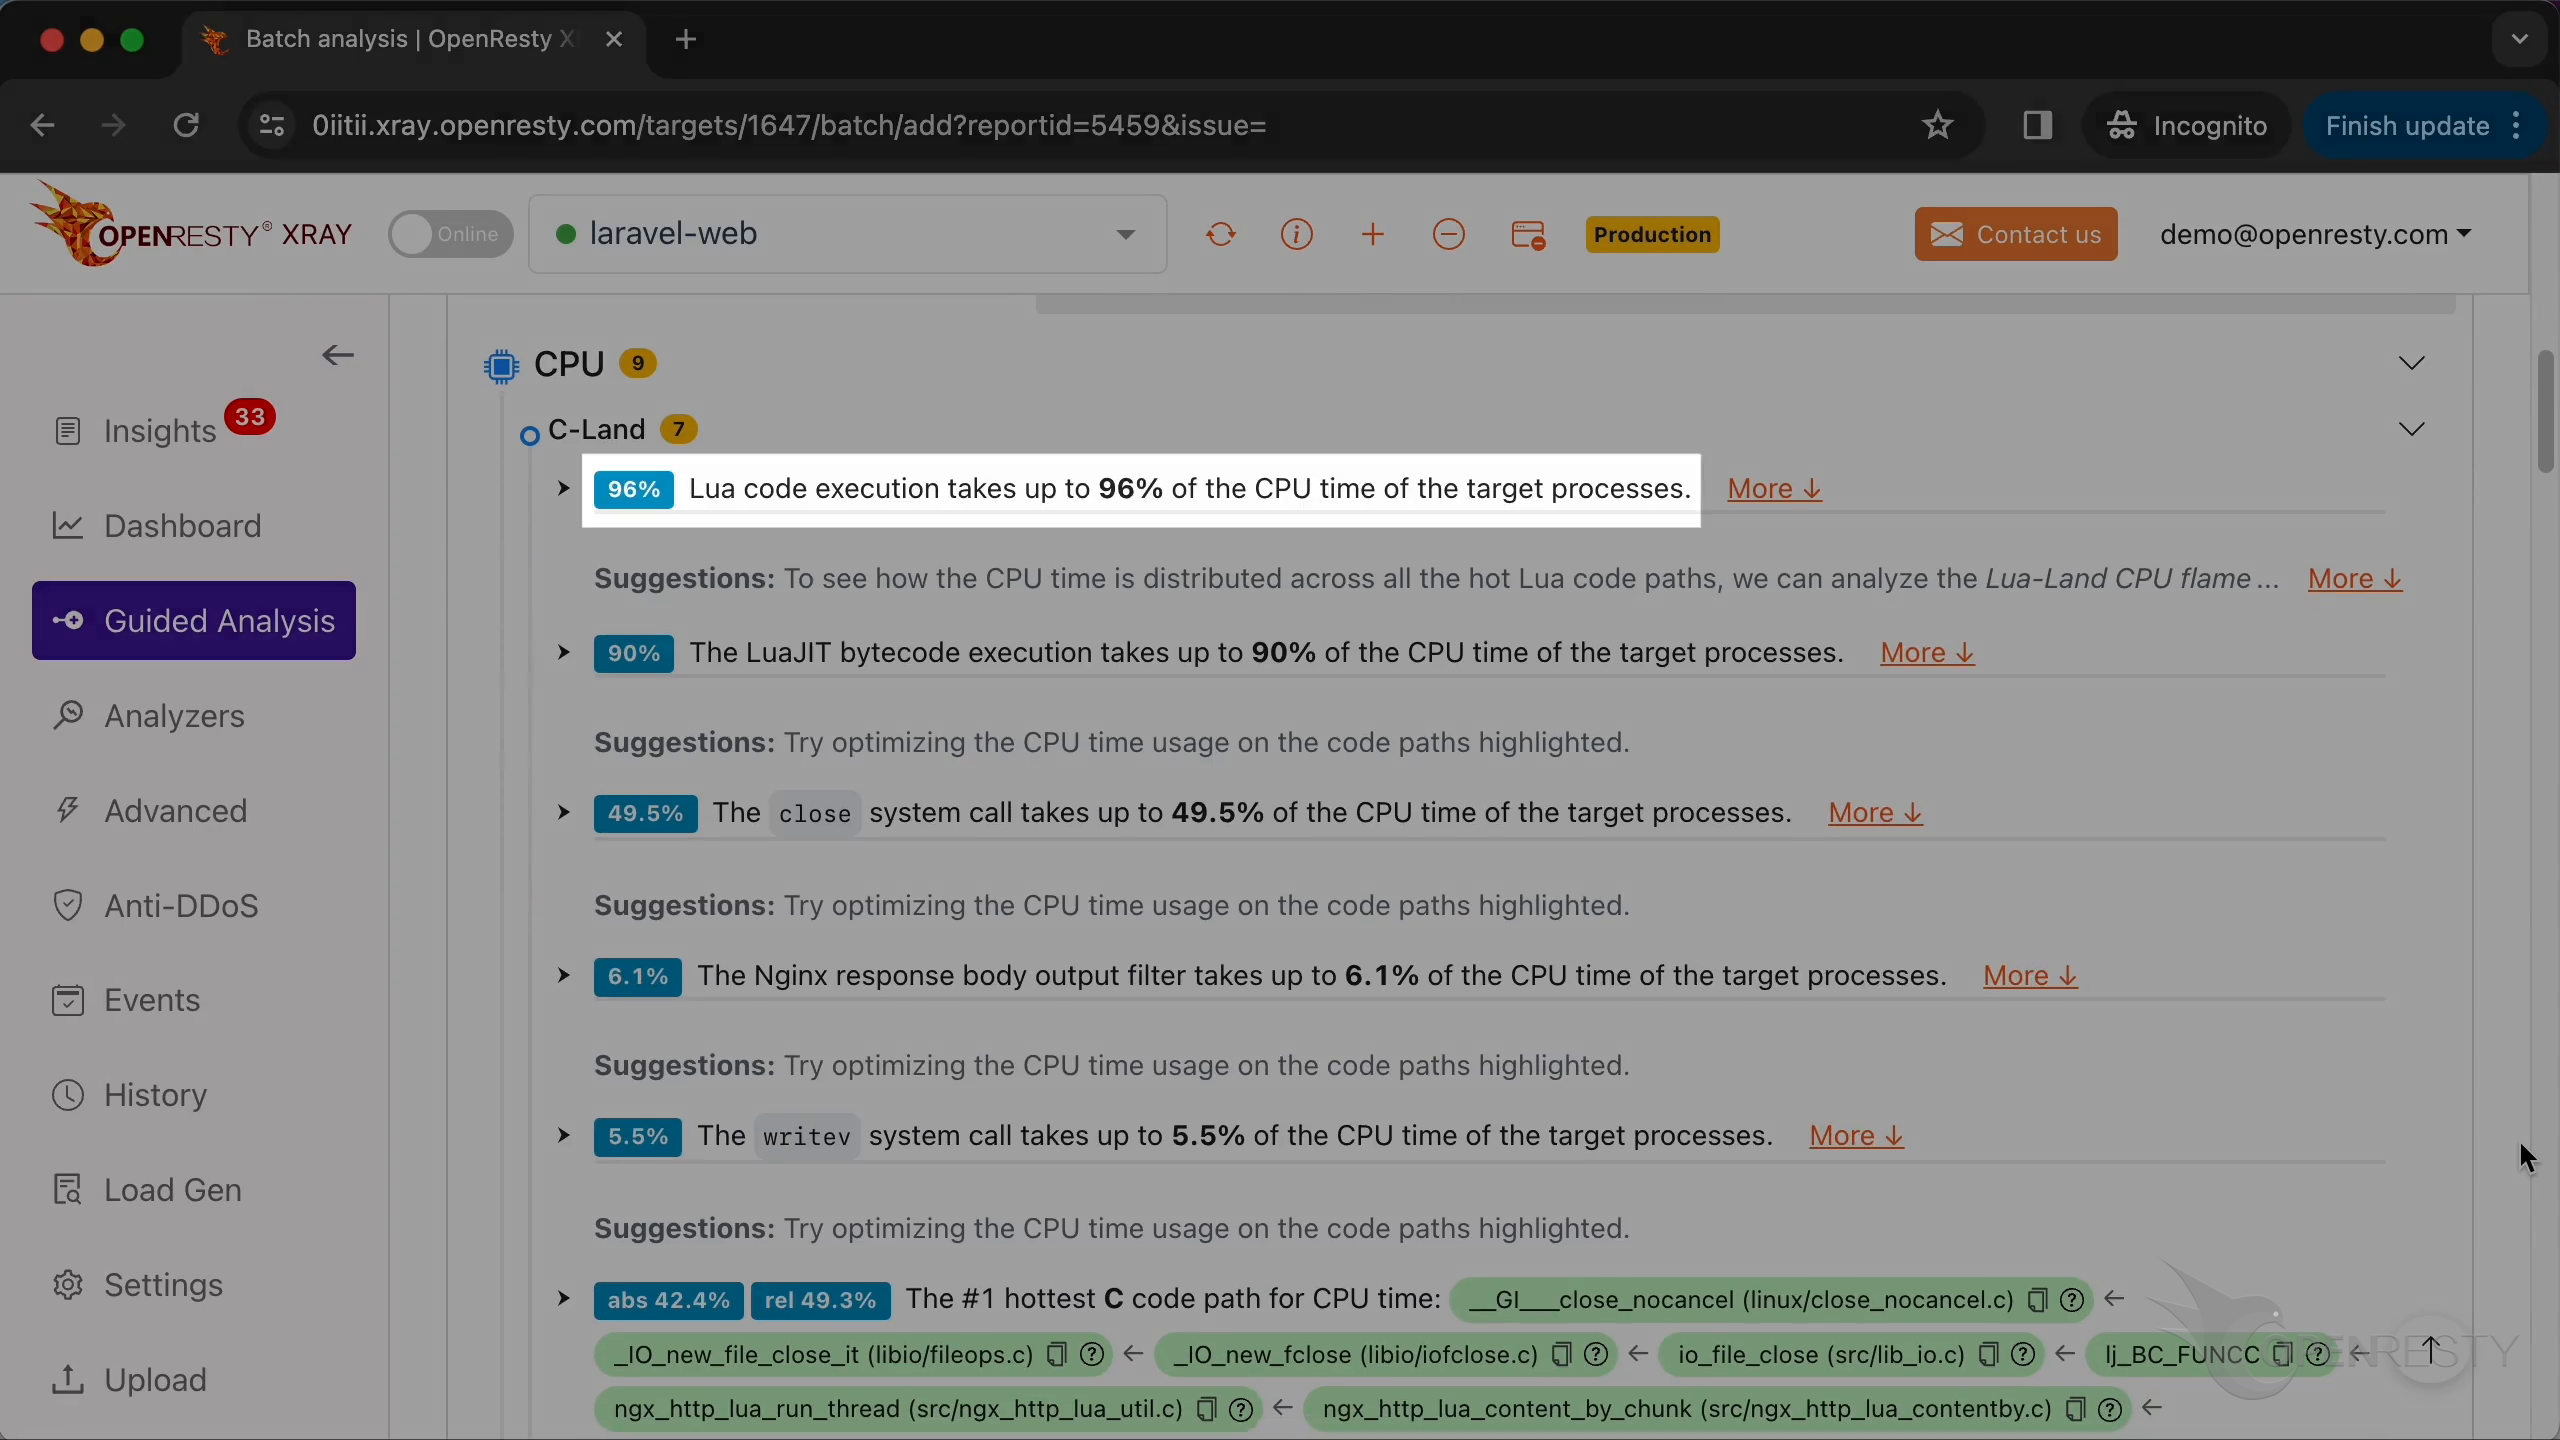
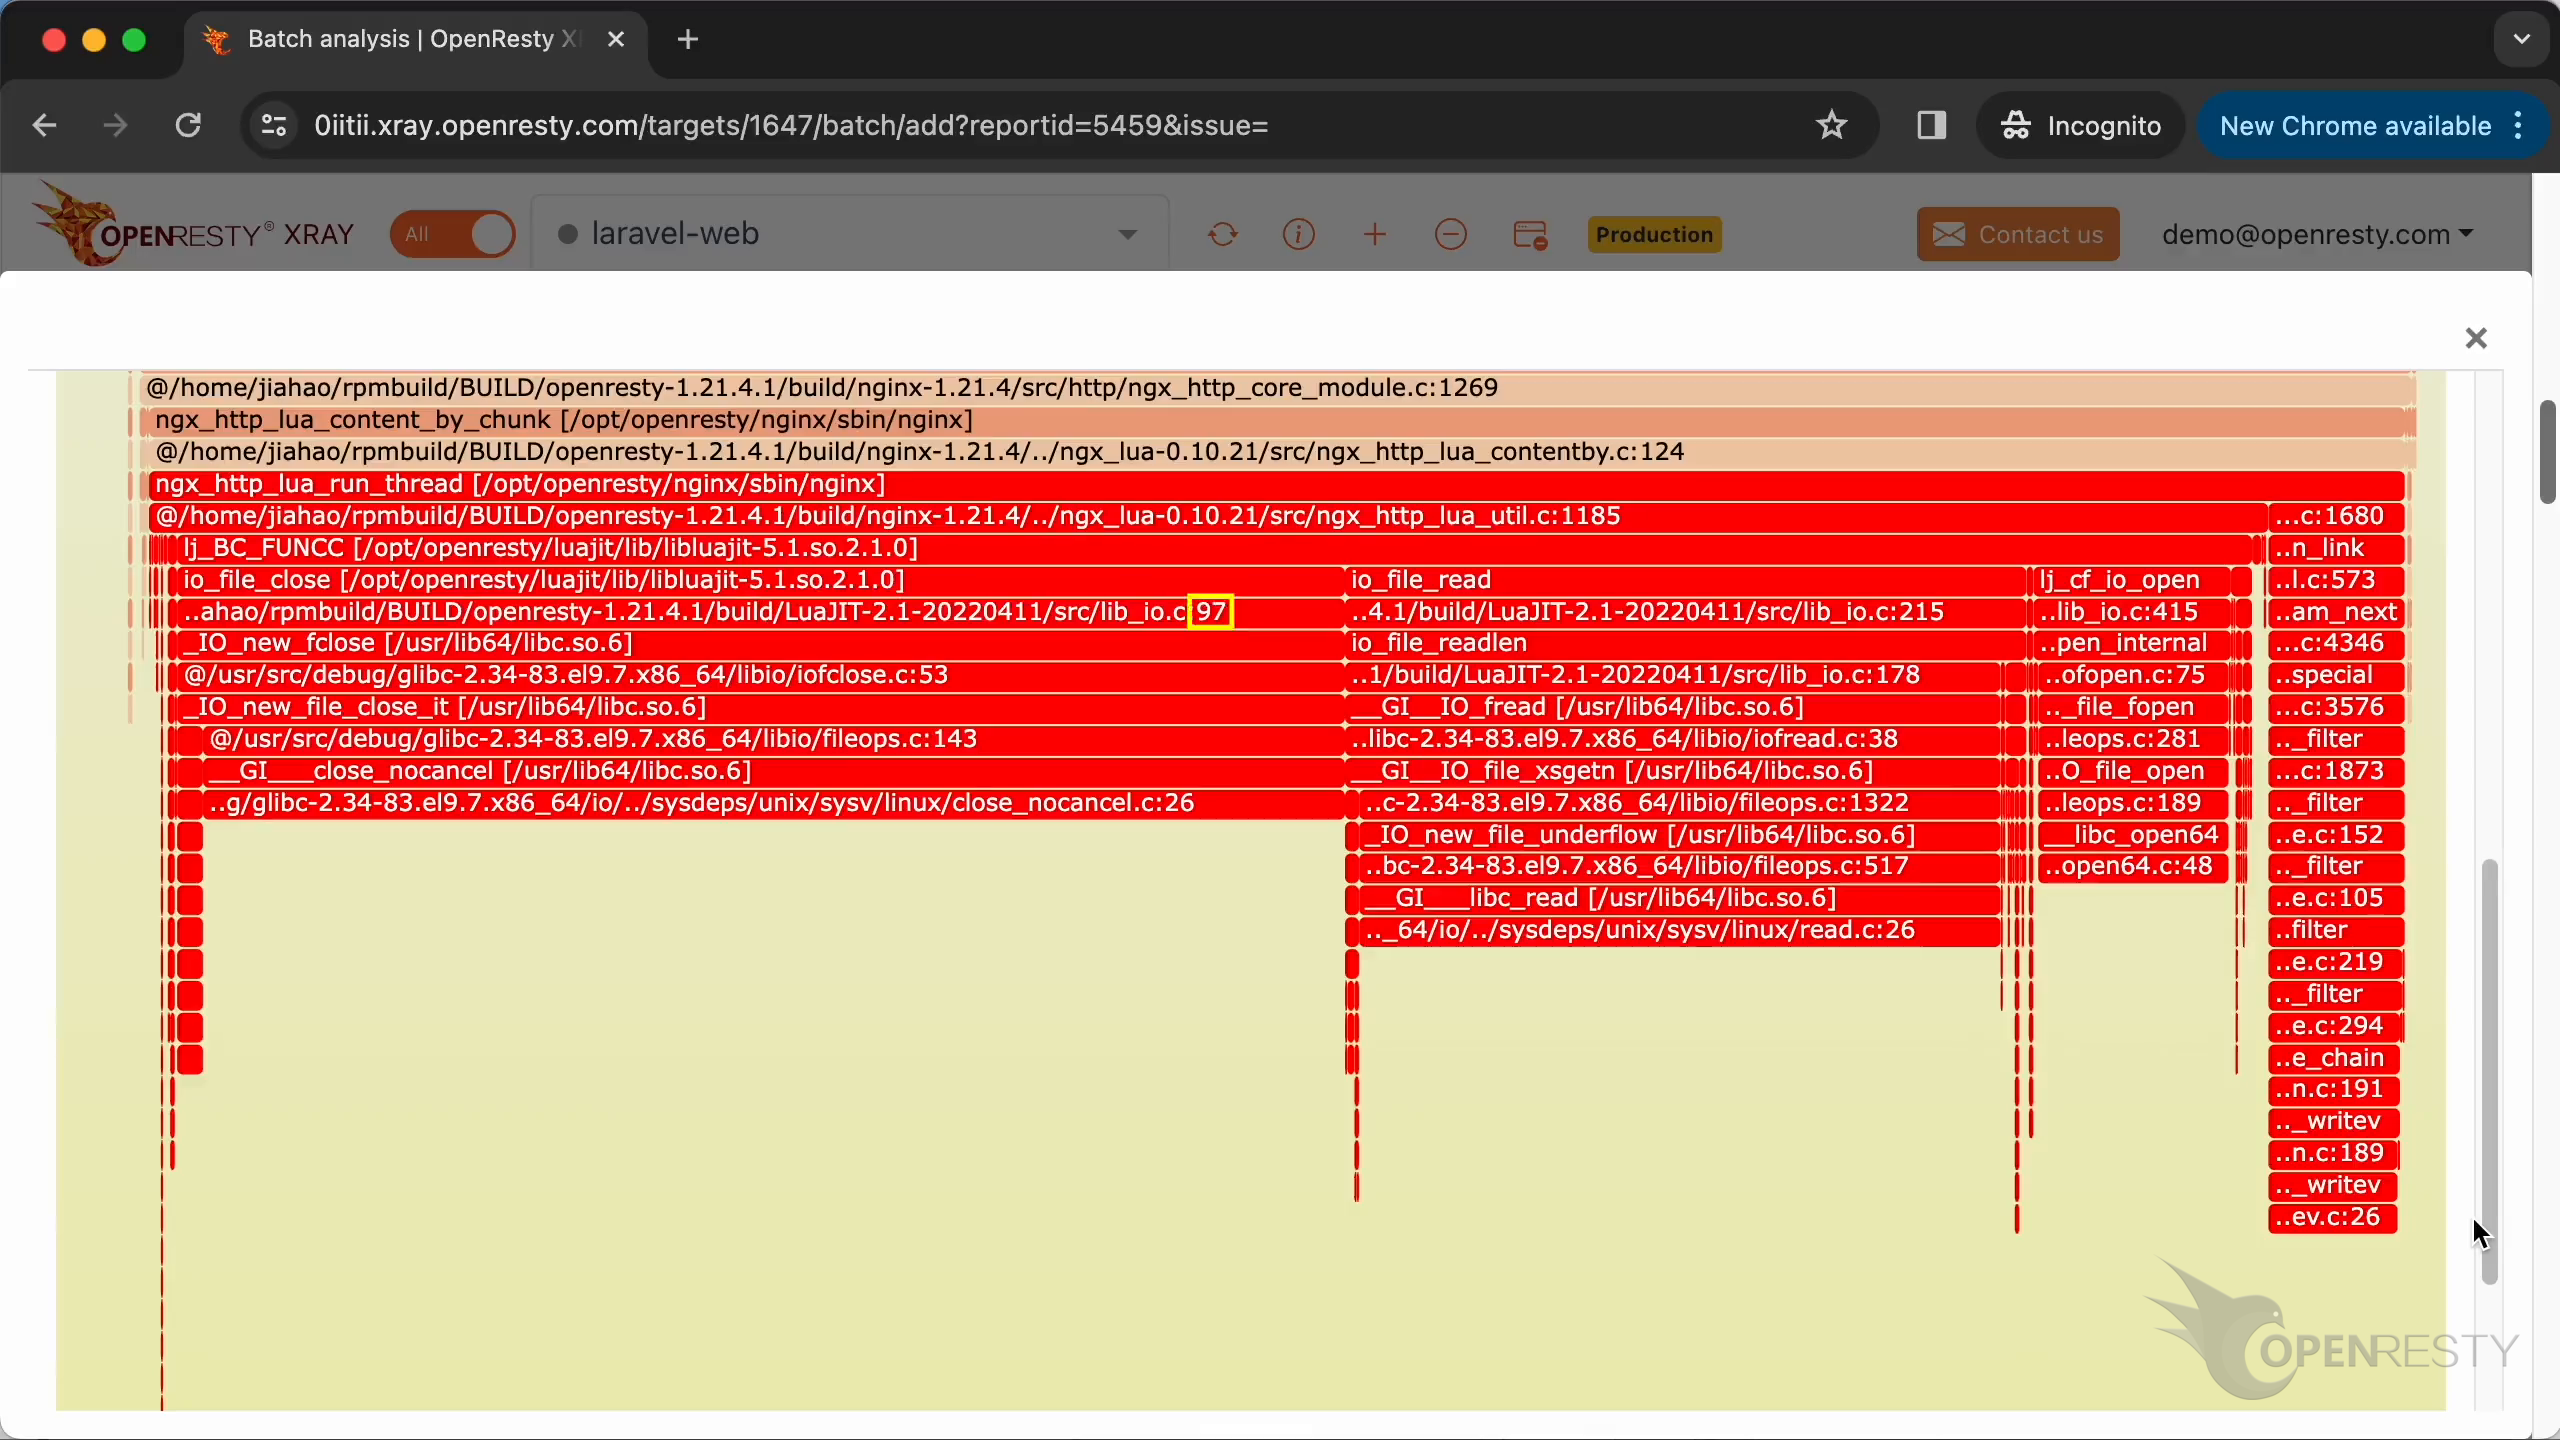
This is the #1 hottest Lua code path using the most CPU time. The close function is called by the generate function. This is a Lua function called generate. It is defined in the Lua source file lua/report.lua. The generate function was called by the generate_monthly_report defined in the lua/invoice.lua file.
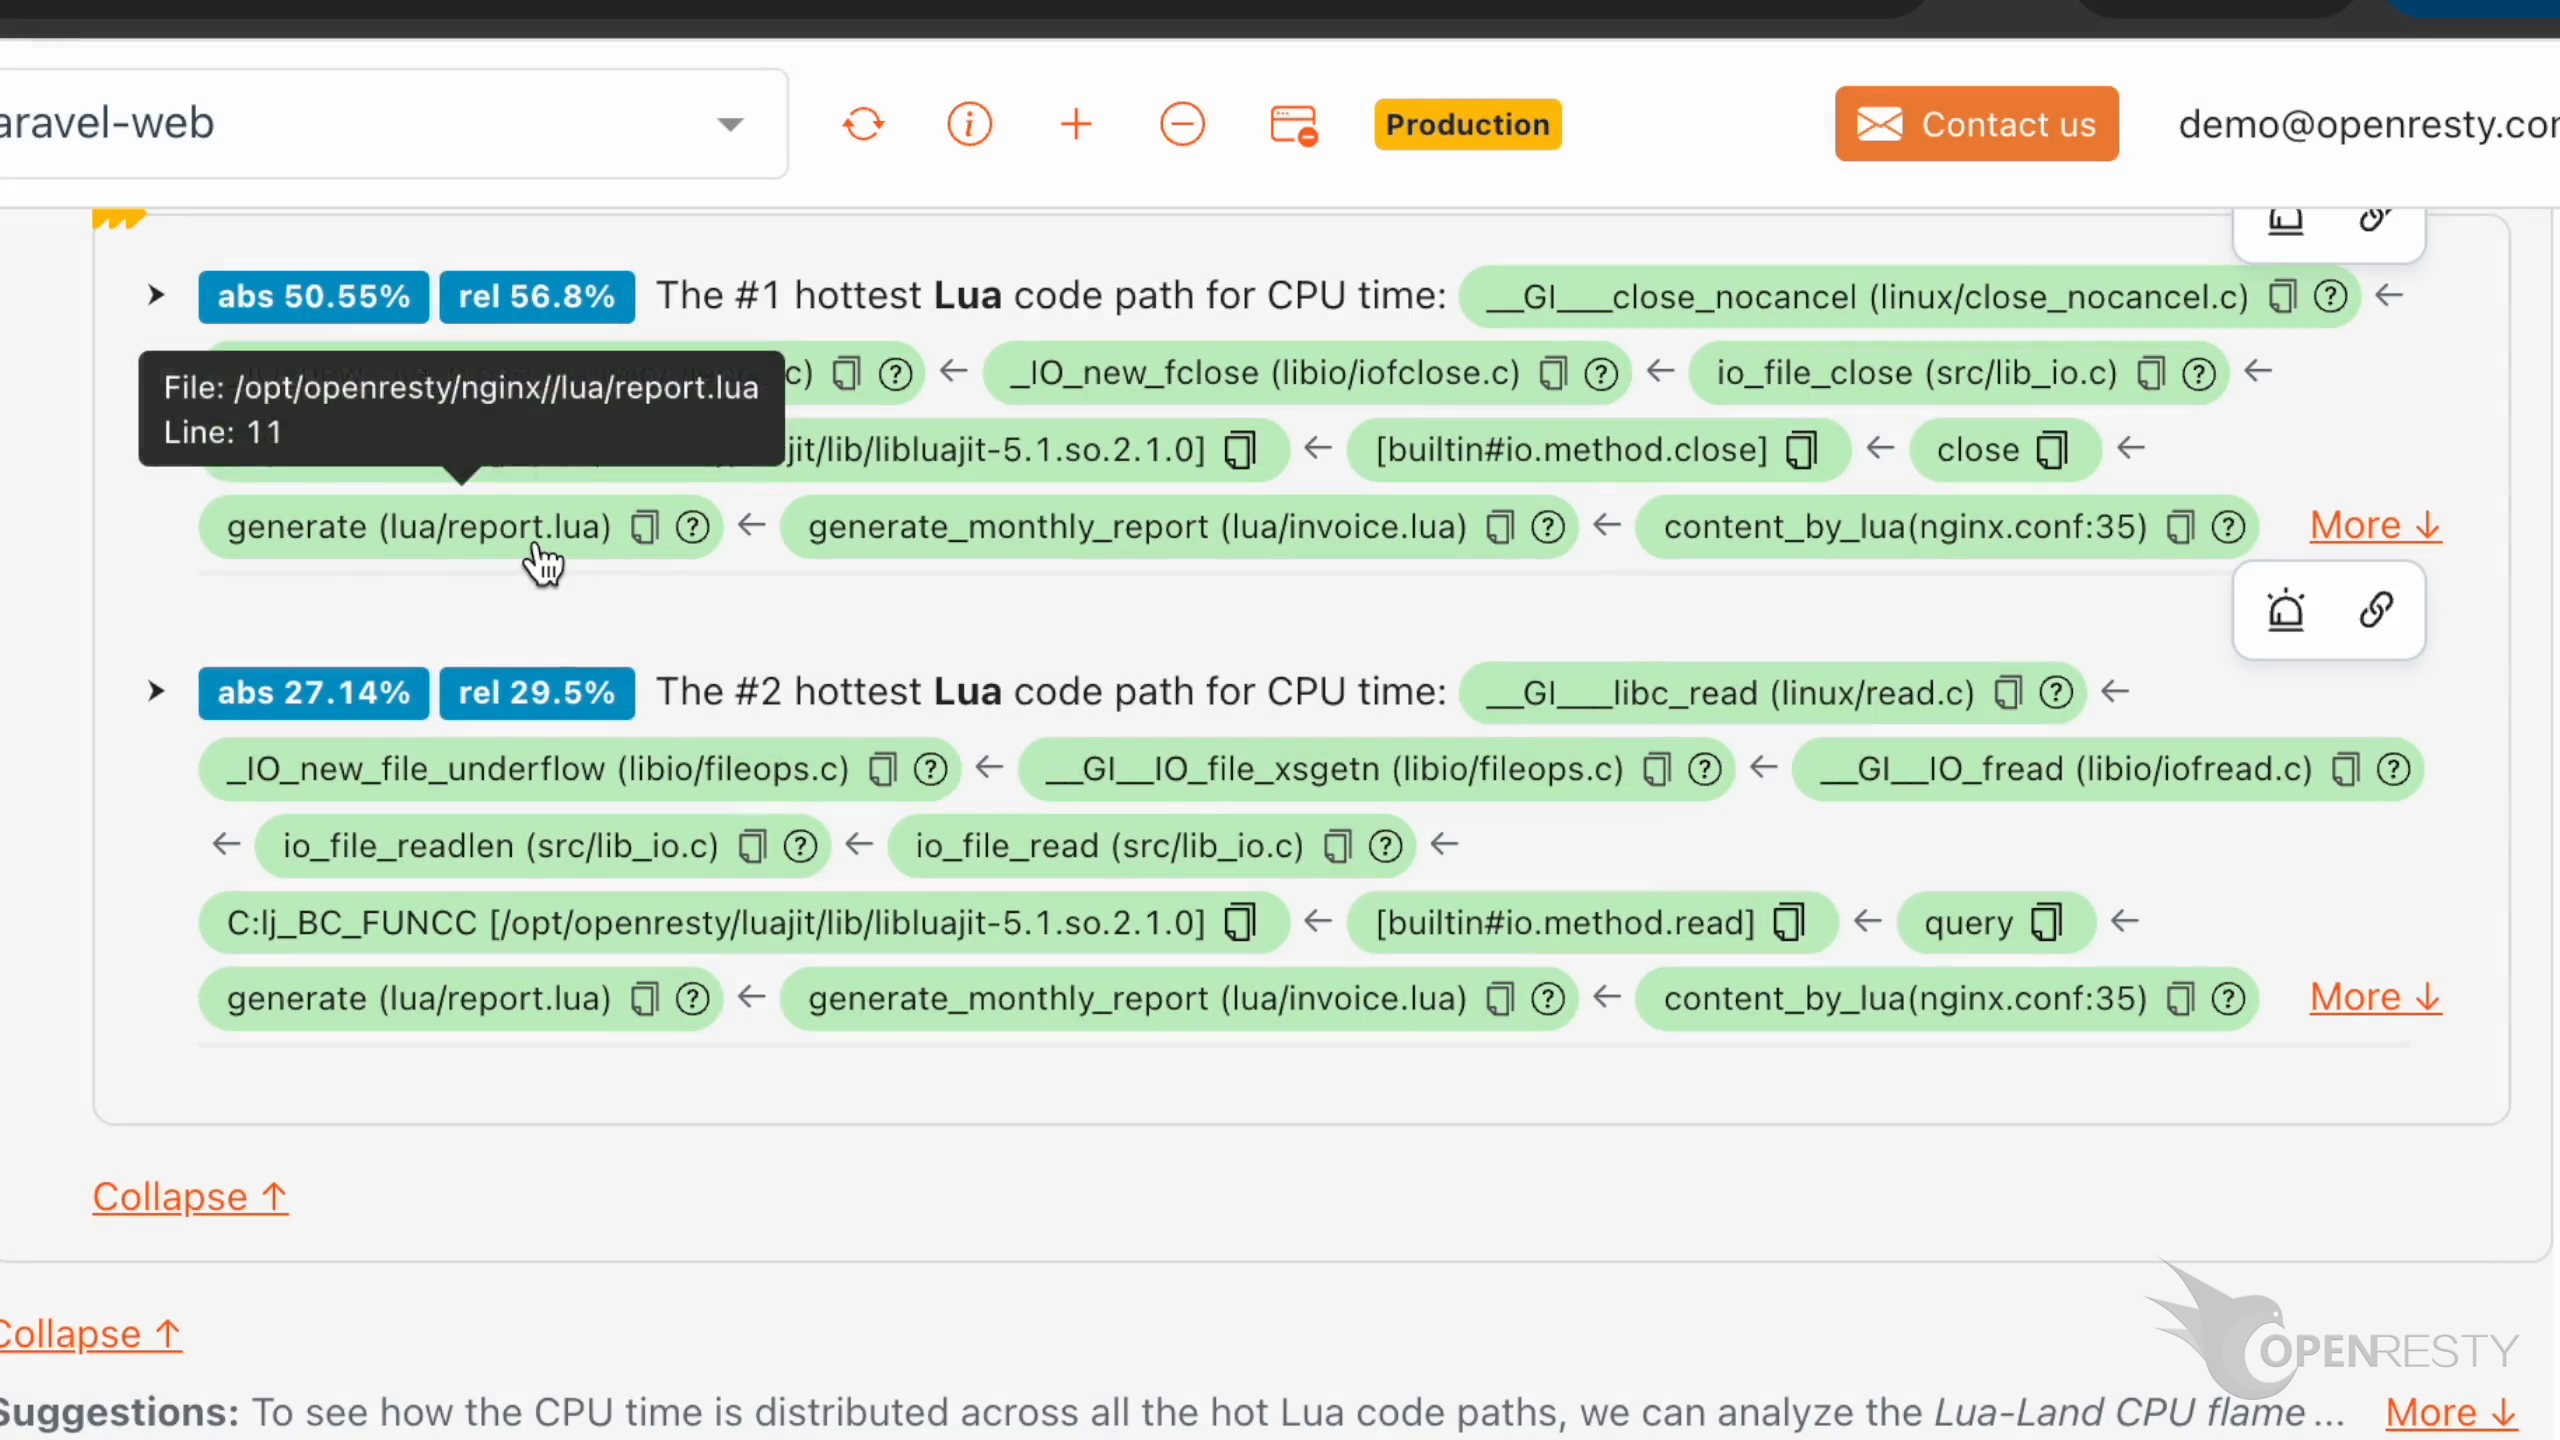
Hover the mouse over the green box for the generate function. We can see the full path for the Lua source file in the tooltip. The Lua source line number is 11.
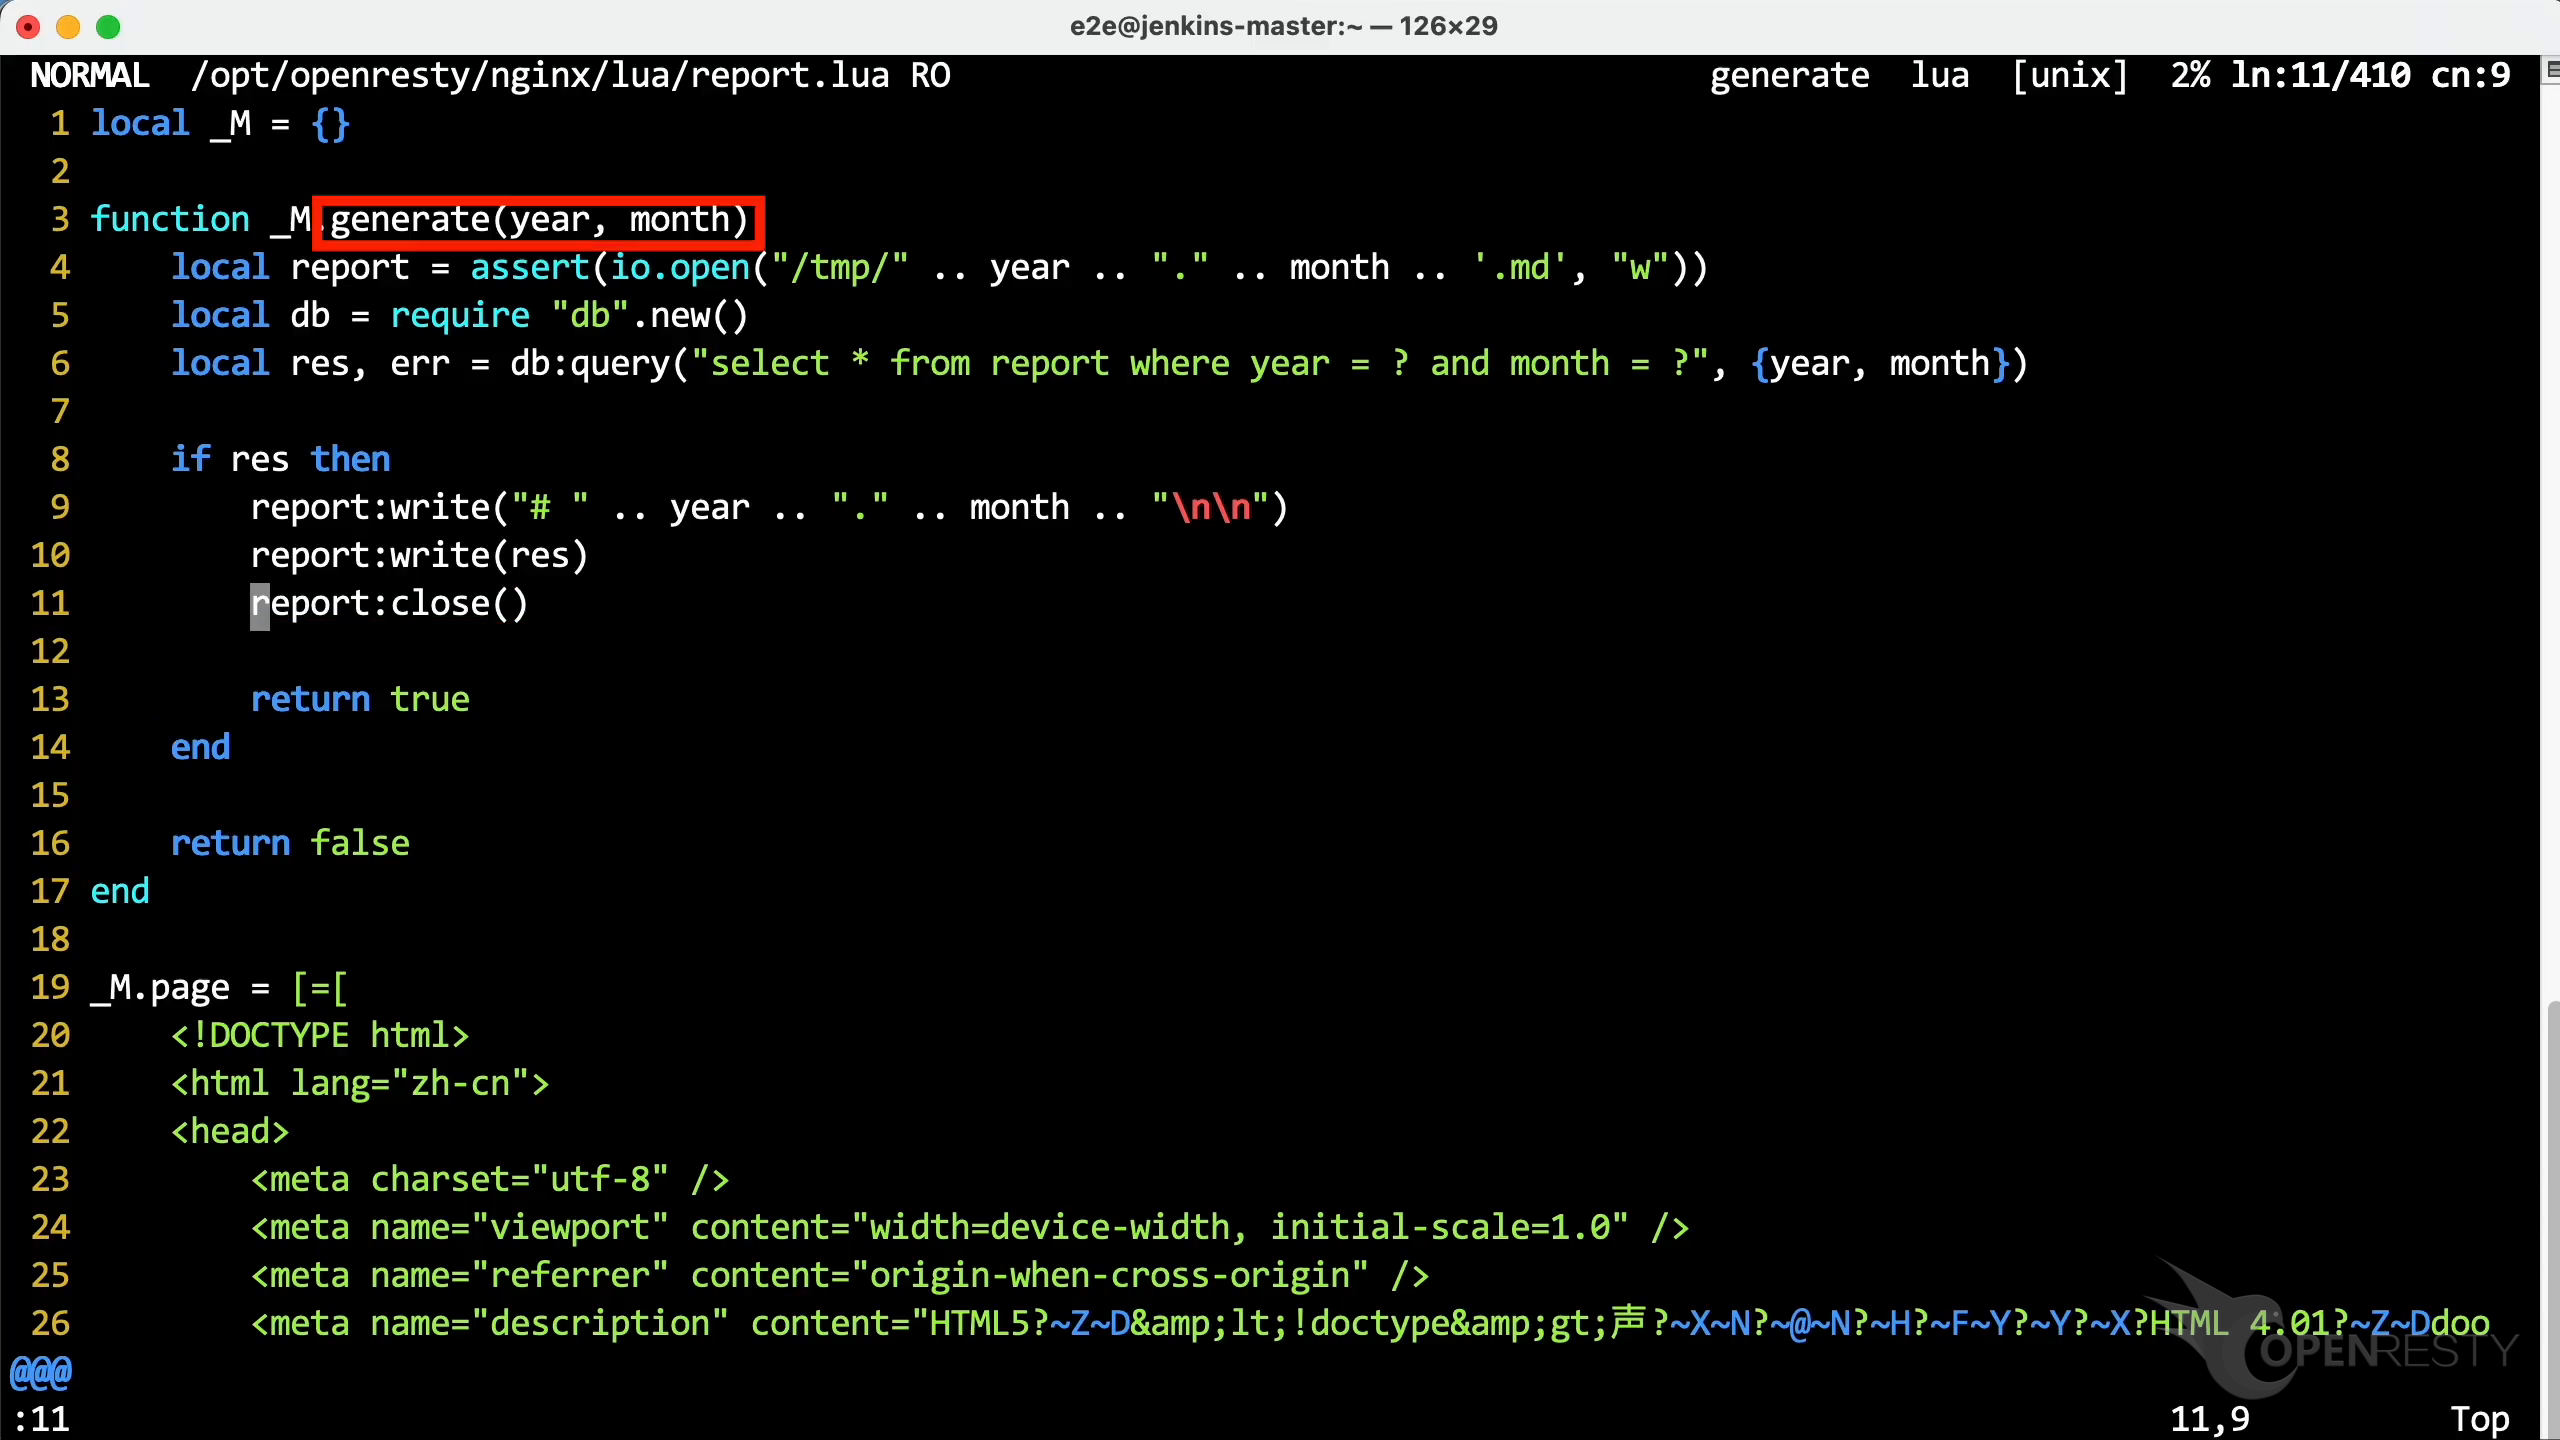
Go to line 11, as OpenResty XRay suggested. You can see the close function in the report. Even without the debug symbols, we can still get details about the hot Lua function and source line.
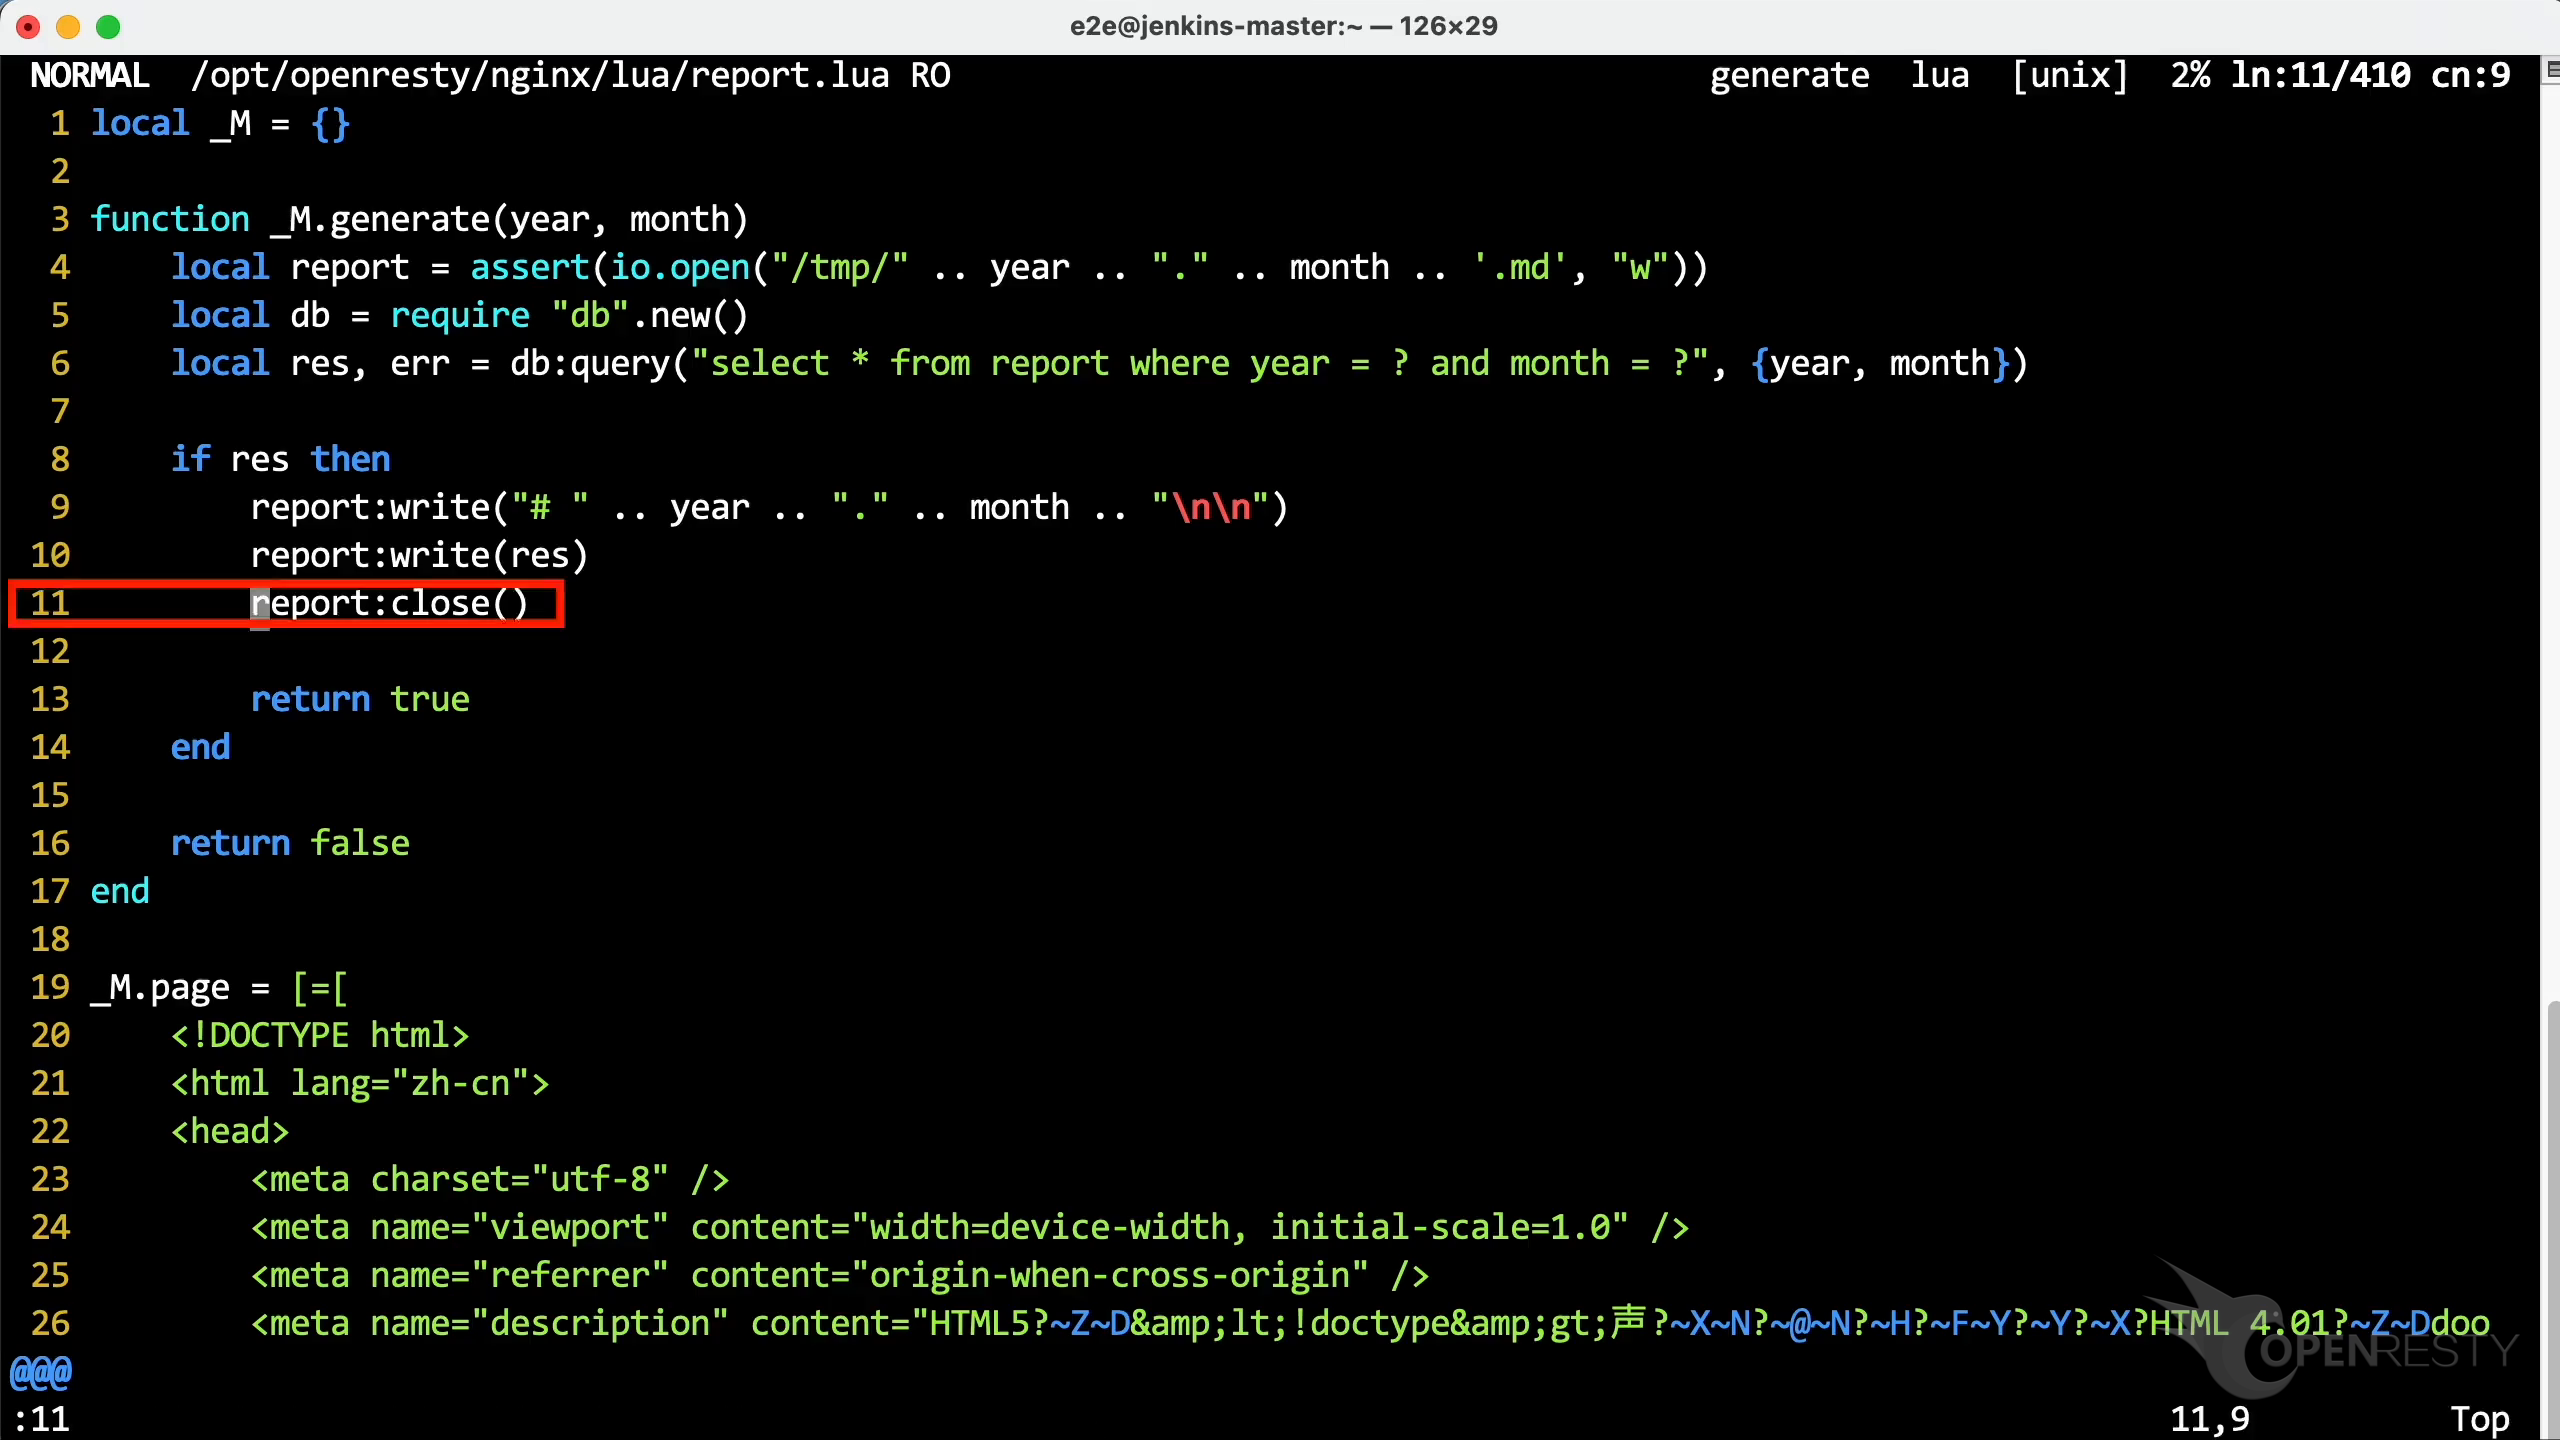
The generate function is used to query the database and generate reports.
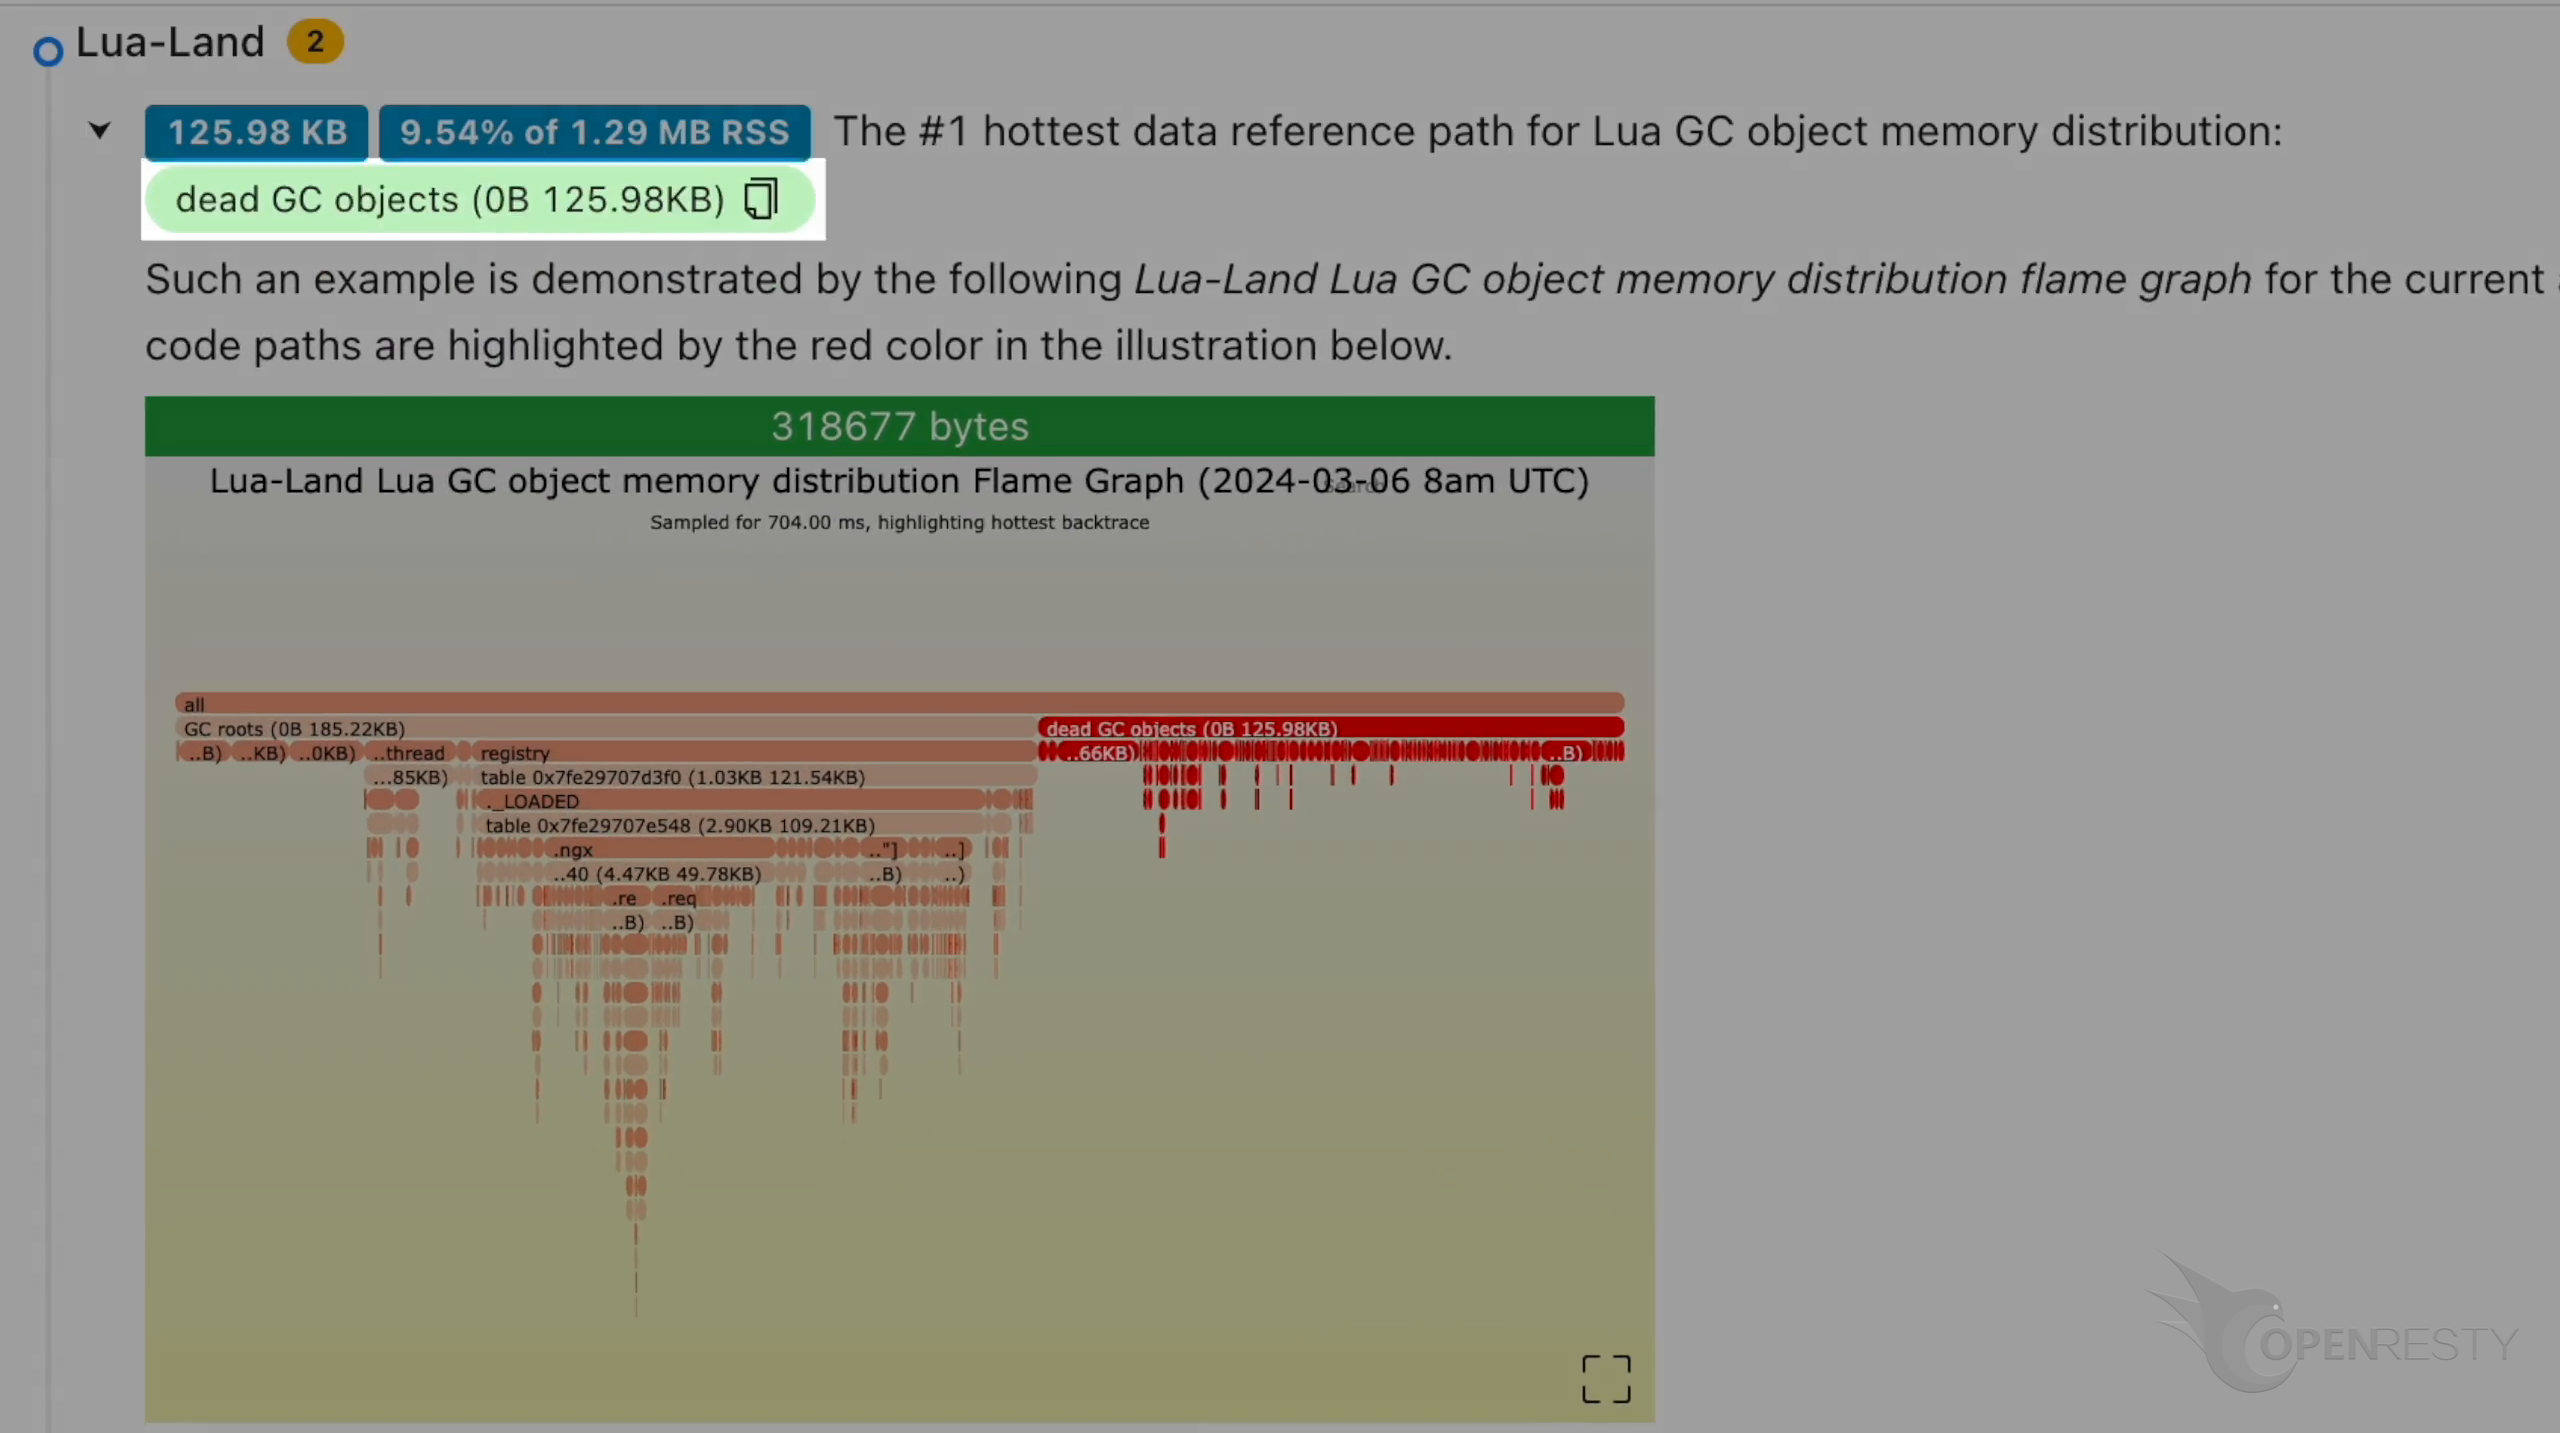
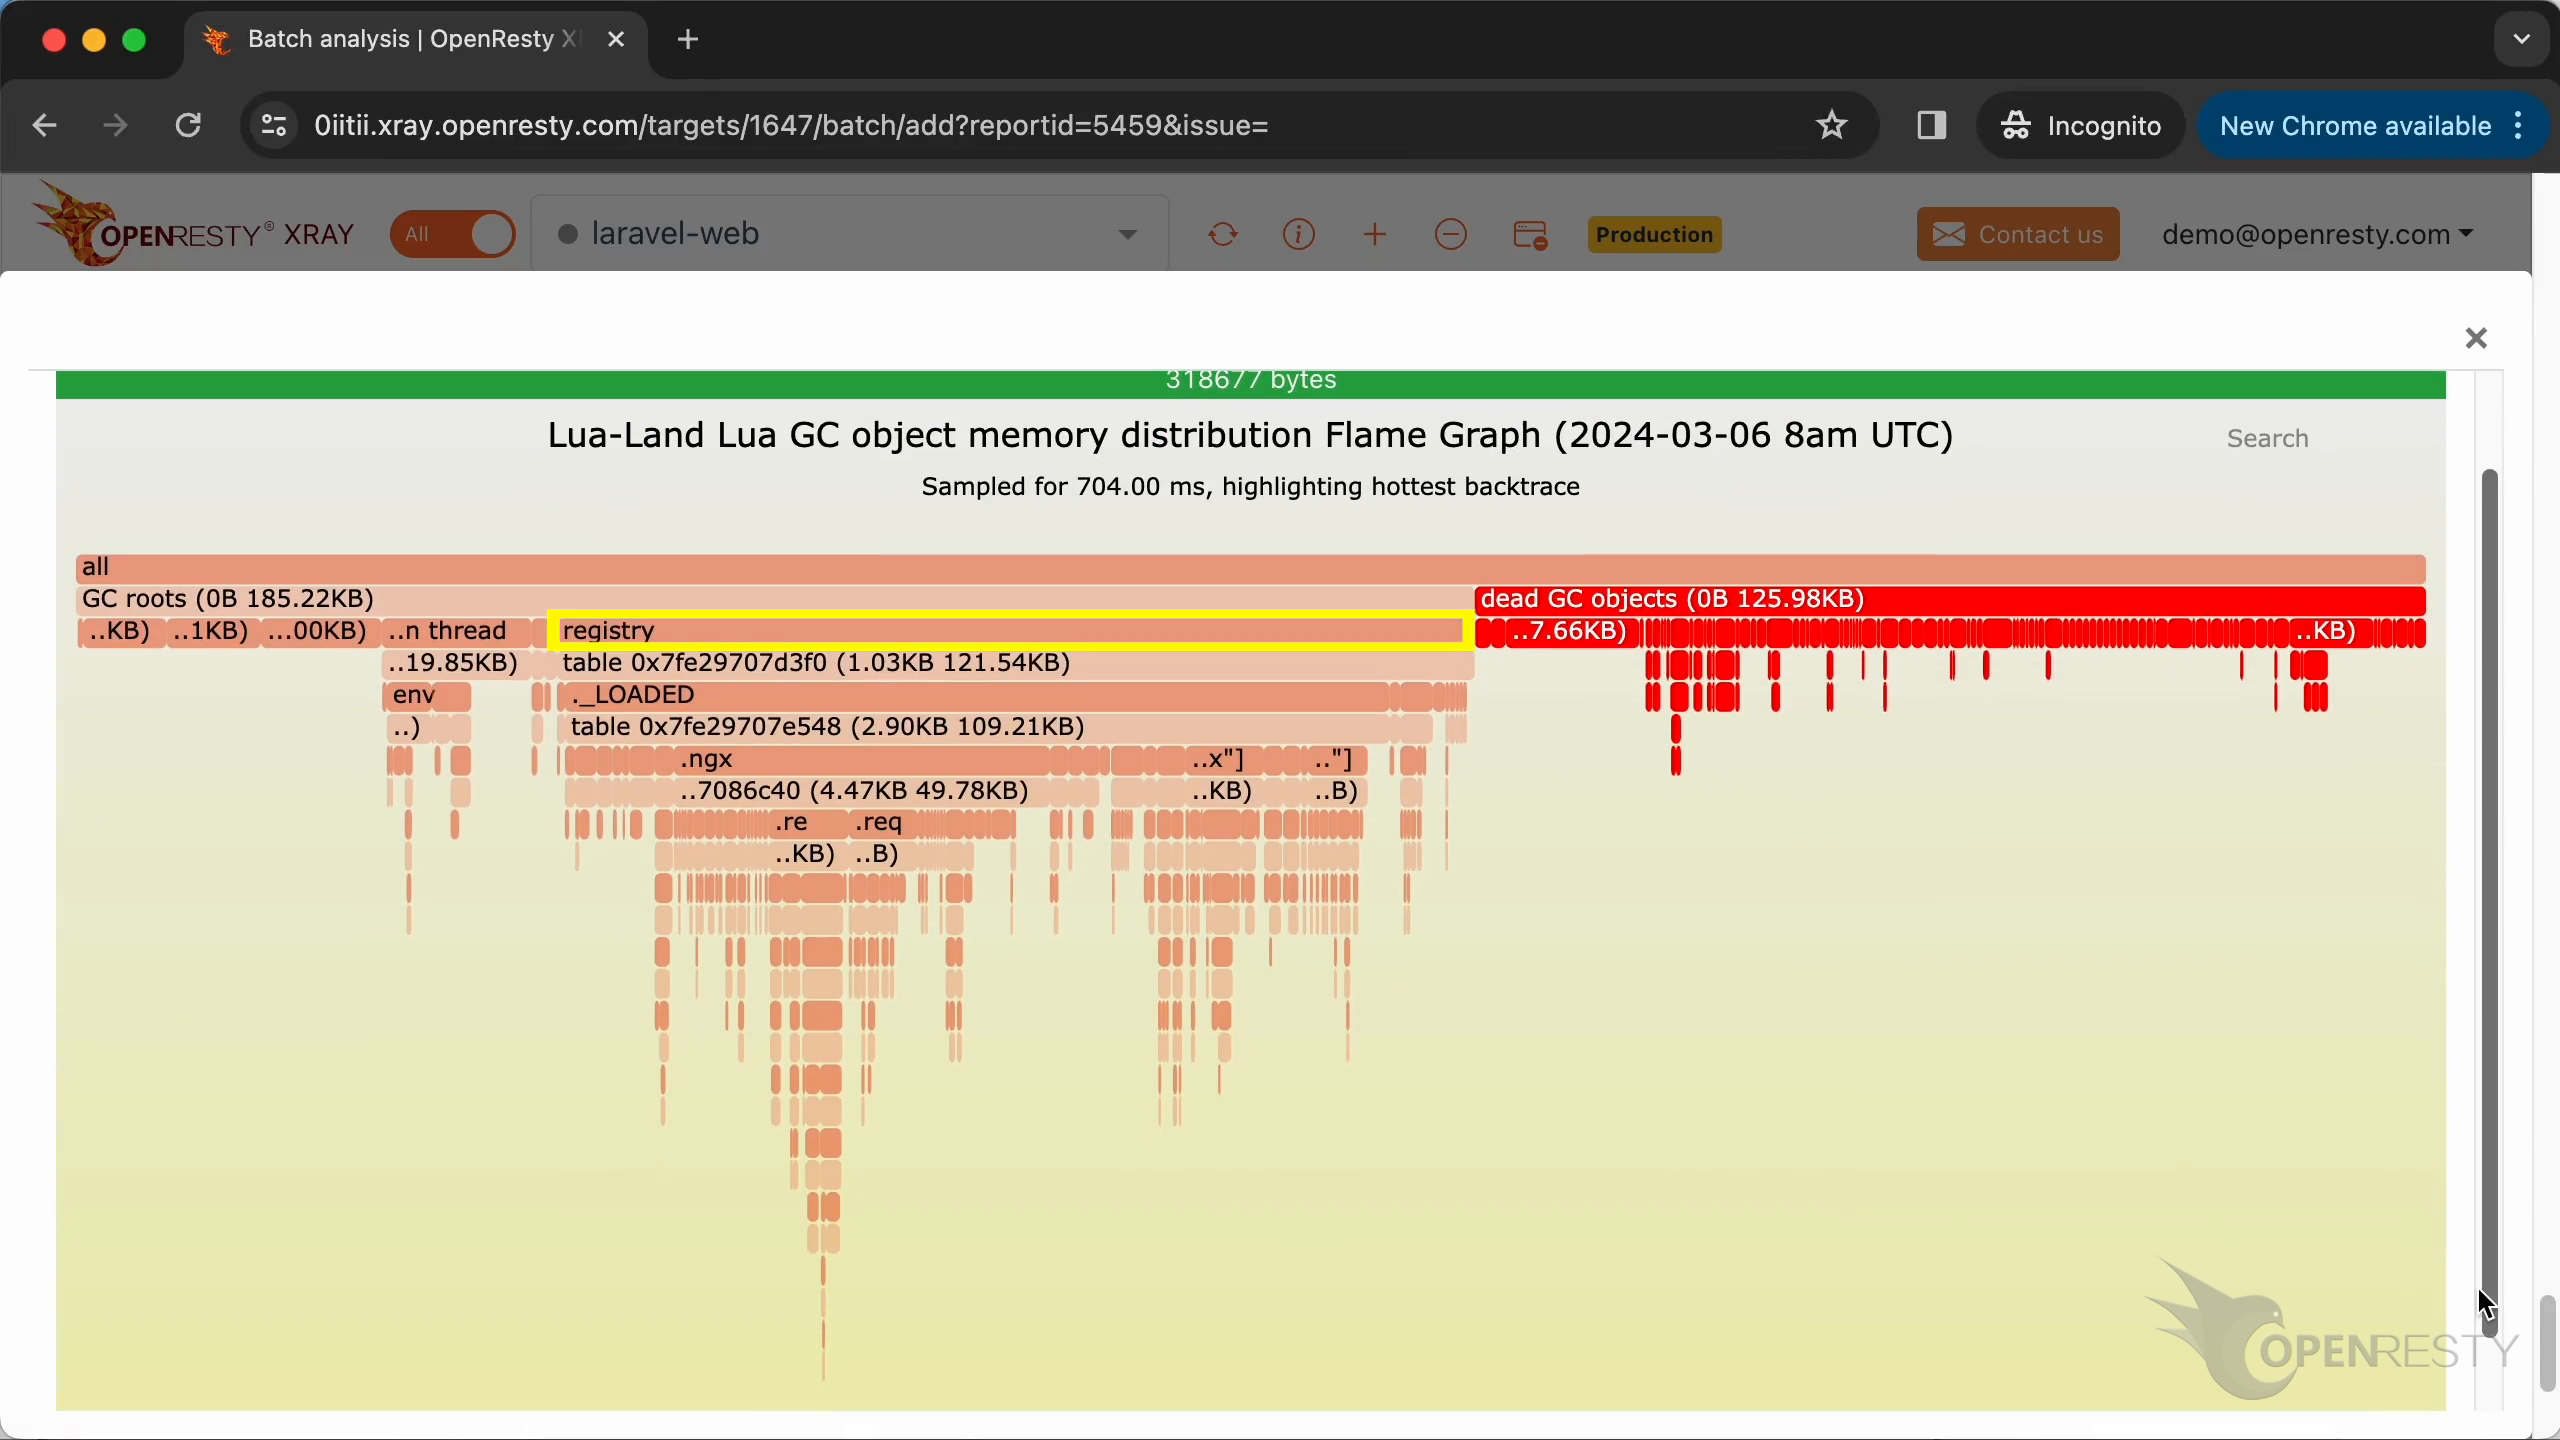
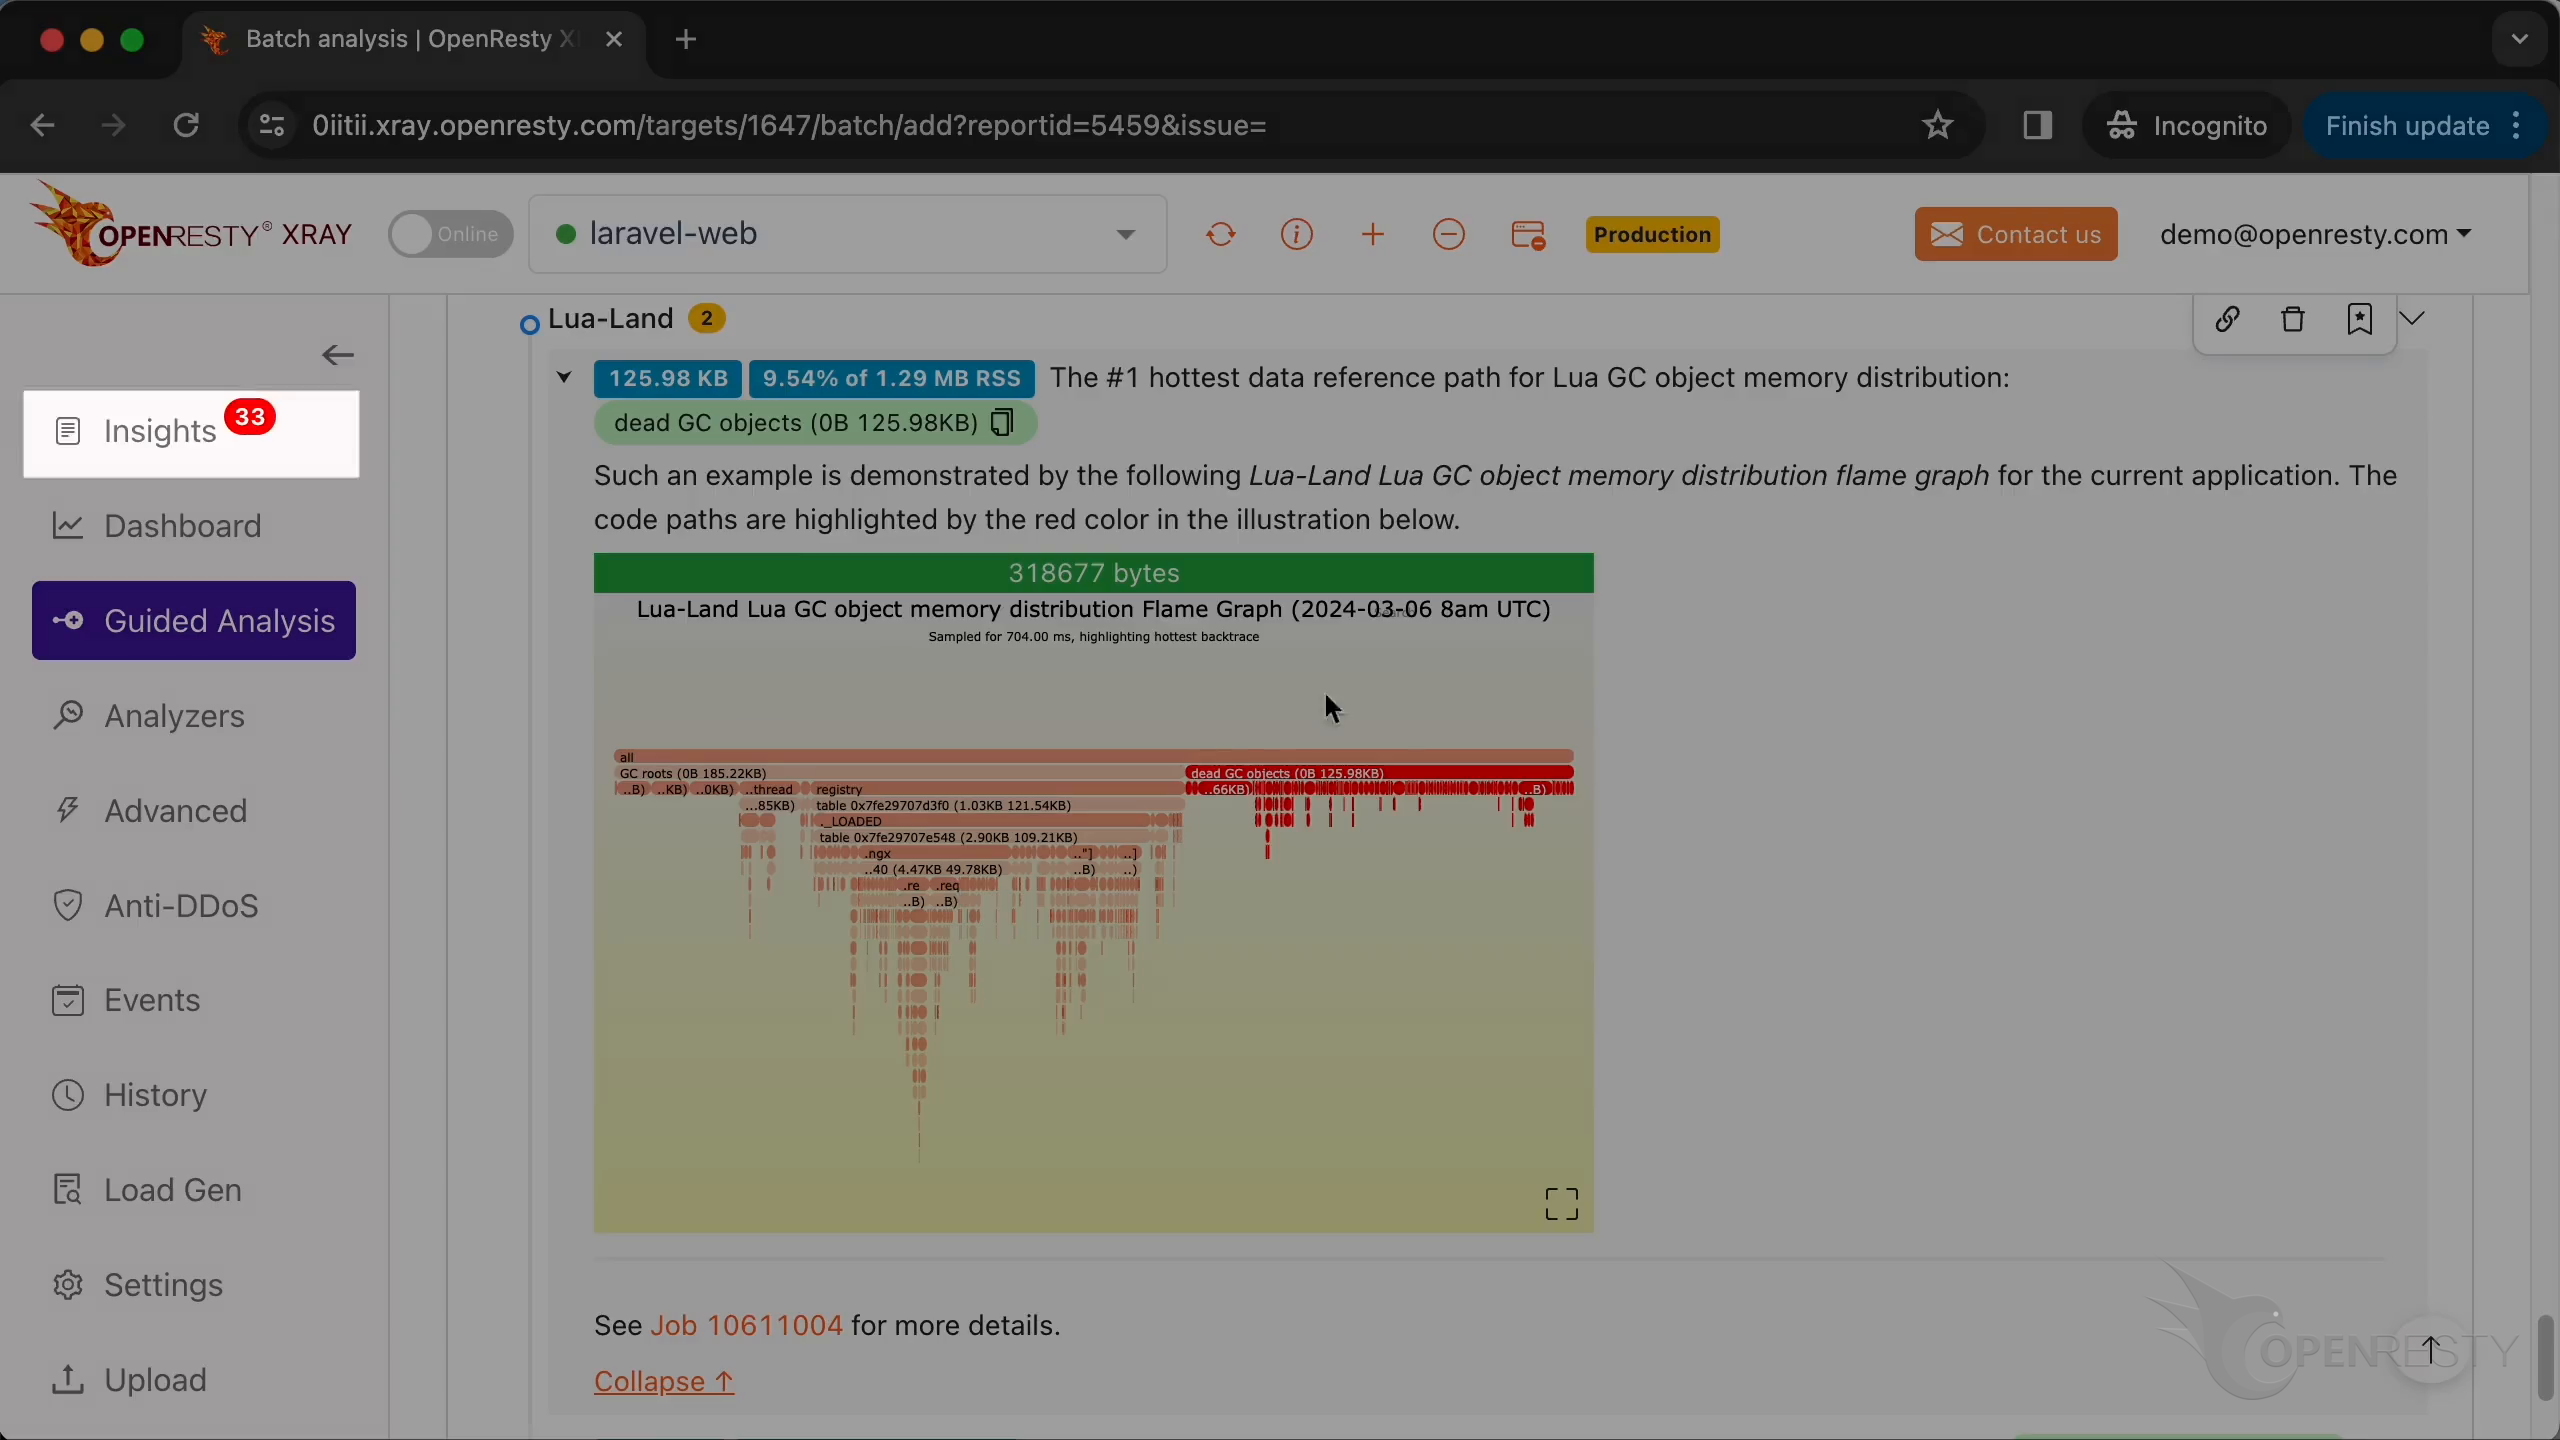
Memory: GC object reference paths
On the Lua land, a good portion of the memory is taken up by dead Lua objects not yet released by the LuaJIT garbage collector.
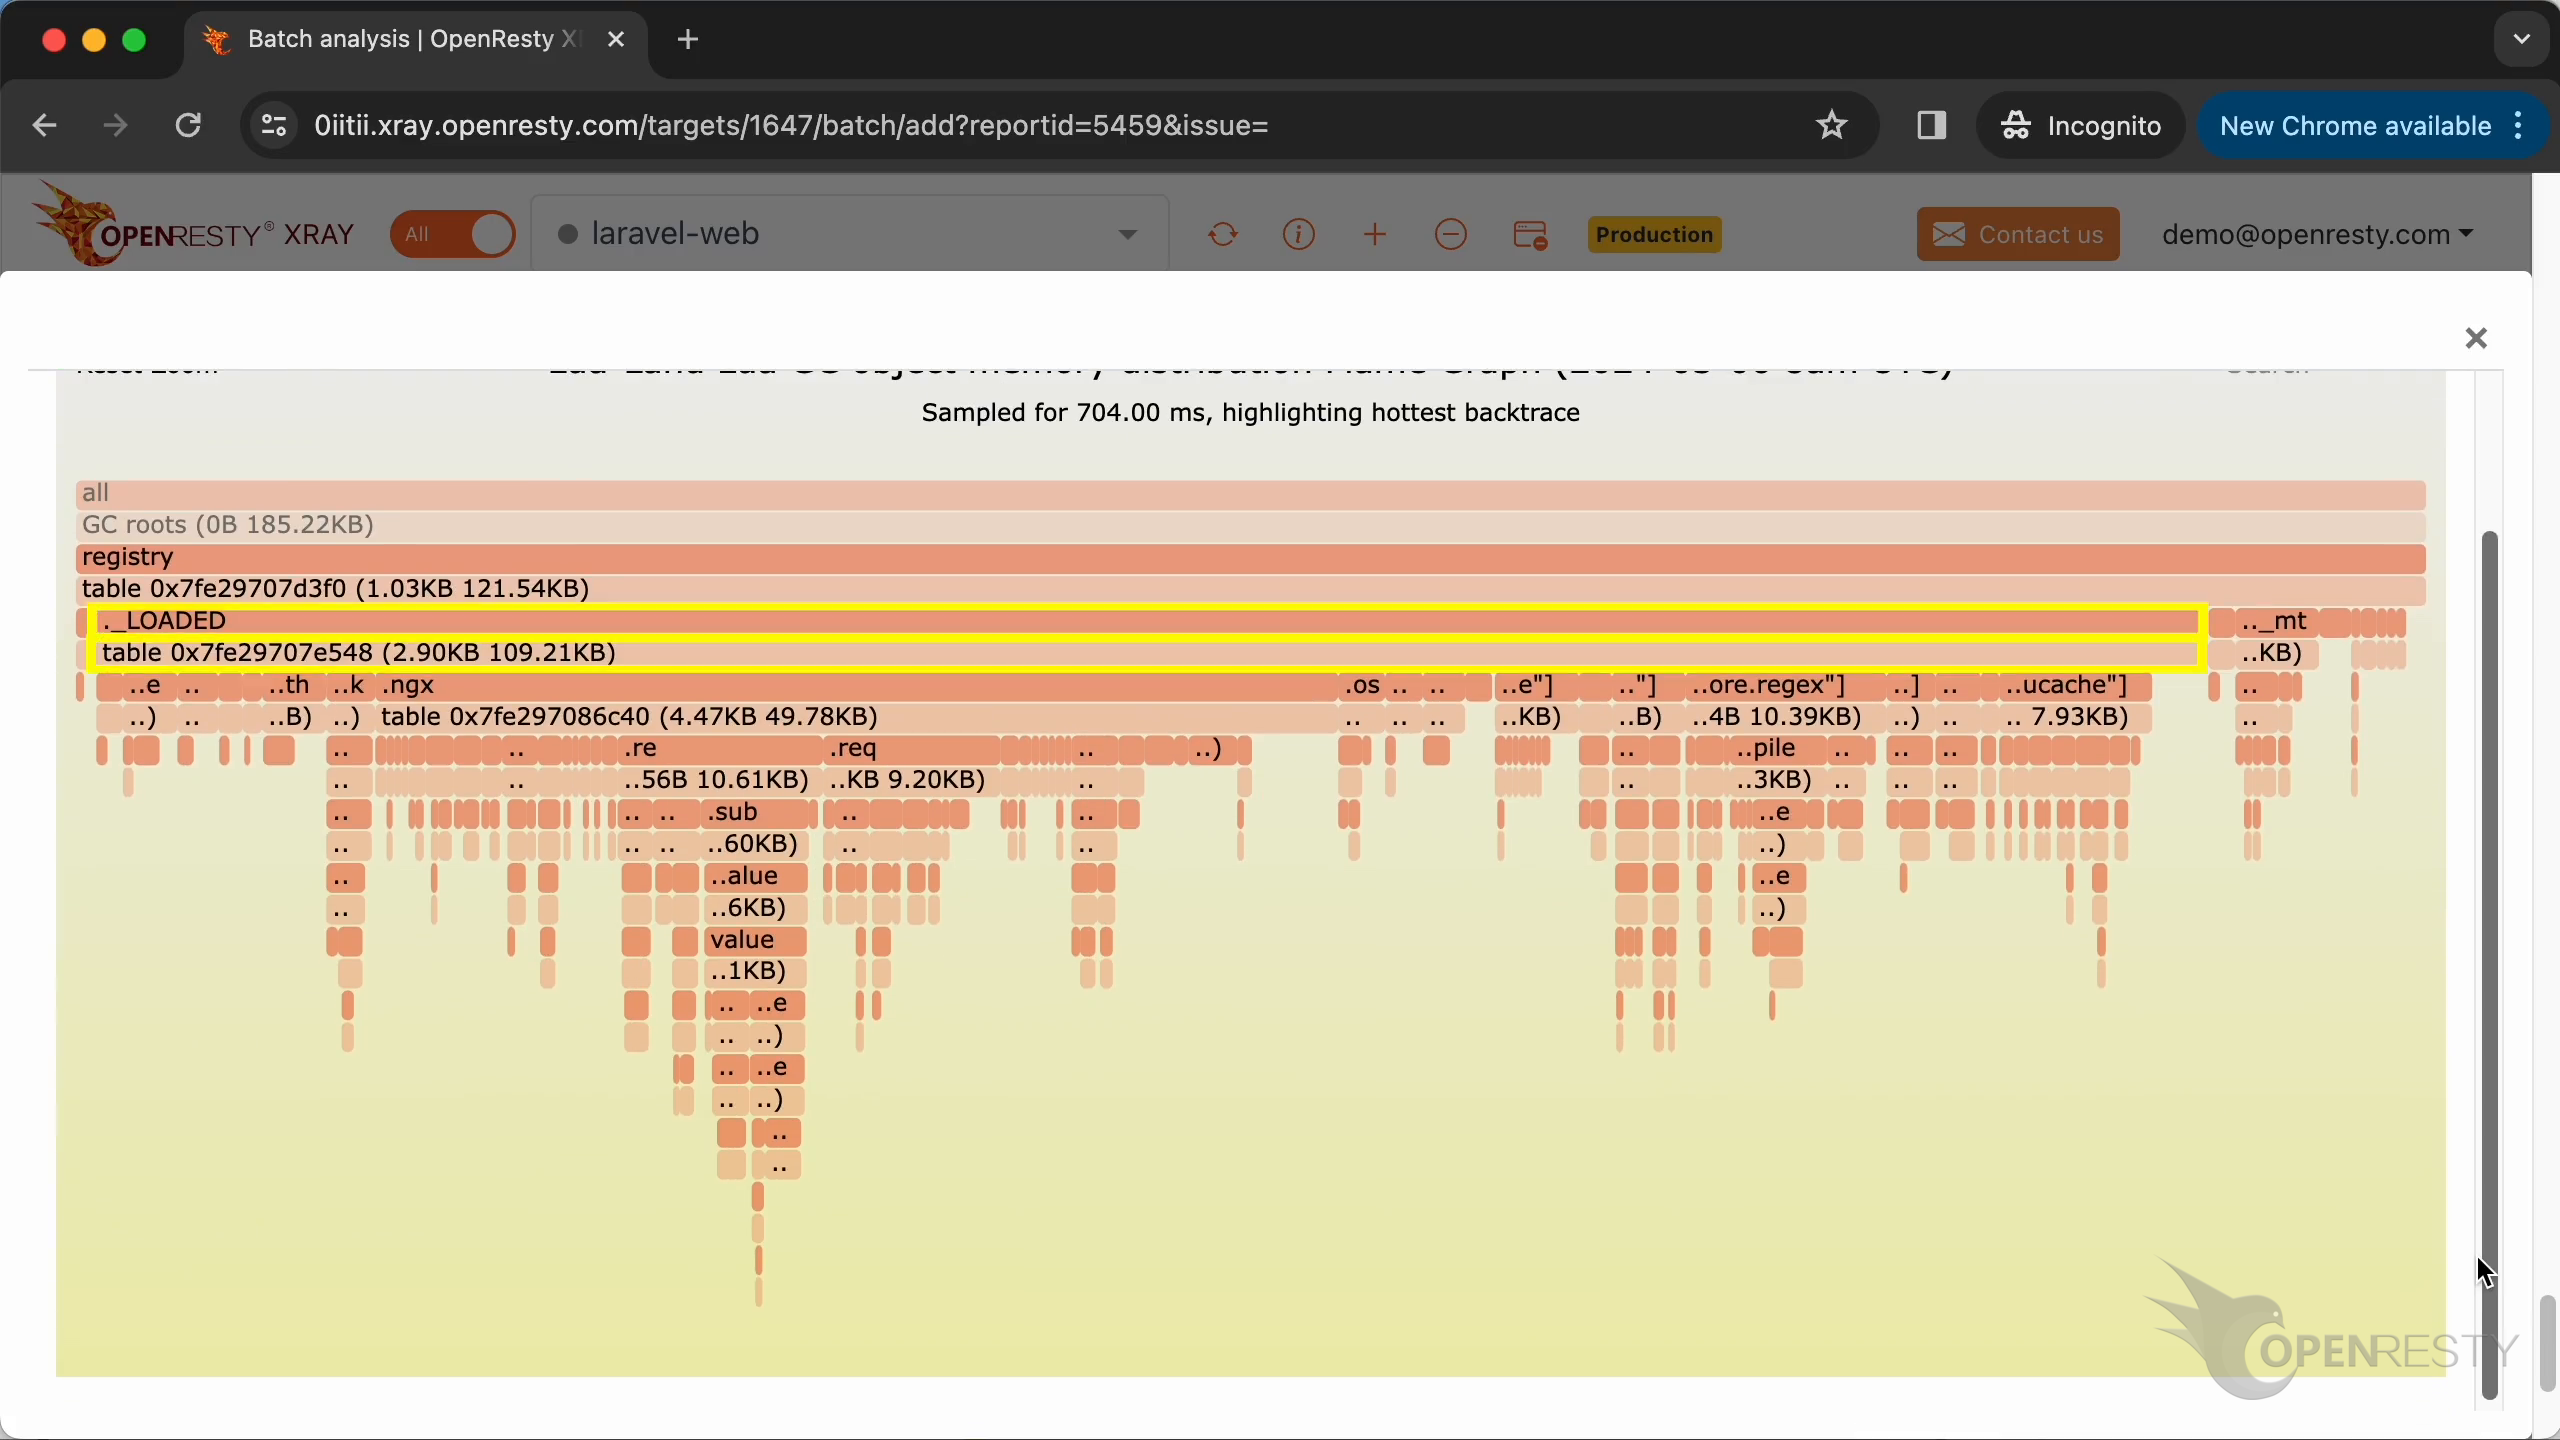
Zooming into paths such as registry -> ._LOADED, we can see that in this path, the table is the data structure of all Lua modules loaded by the current Lua application. Apparently, these loaded Lua modules also take up a lot of memory.
Automatic analysis and reports
Besides one-off Guided Analysis, OpenResty XRay can also keep producing insights for online processes. Switch to Insights for automatic daily and weekly reports suited to long-term monitoring; the interactive wizard remains useful for development and demos.
About OpenResty XRay
OpenResty XRay is a dynamic-tracing product that automatically analyzes your running applications to troubleshoot performance problems, behavioral issues, and security vulnerabilities with actionable suggestions. Under the hood, OpenResty XRay is powered by our Y language targeting various runtimes like Stap+, eBPF+, GDB, and ODB, depending on the contexts.
About The Author
Yichun Zhang (Github handle: agentzh), is the original creator of the OpenResty® open-source project and the CEO of OpenResty Inc..
Yichun is one of the earliest advocates and leaders of “open-source technology”. He worked at many internationally renowned tech companies, such as Cloudflare, Yahoo!. He is a pioneer of “edge computing”, “dynamic tracing” and “machine coding”, with over 22 years of programming and 16 years of open source experience. Yichun is well-known in the open-source space as the project leader of OpenResty®, adopted by more than 40 million global website domains.
OpenResty Inc., the enterprise software start-up founded by Yichun in 2017, has customers from some of the biggest companies in the world. Its flagship product, OpenResty XRay, is a non-invasive profiling and troubleshooting tool that significantly enhances and utilizes dynamic tracing technology. And its OpenResty Edge product is a powerful distributed traffic management and private CDN software product.
As an avid open-source contributor, Yichun has contributed more than a million lines of code to numerous open-source projects, including Linux kernel, Nginx, LuaJIT, GDB, SystemTap, LLVM, Perl, etc. He has also authored more than 60 open-source software libraries.
Related Articles
OpenResty XRay Sep 5, 2024

OpenResty XRay Aug 12, 2024
")
OpenResty XRay Aug 4, 2024
")
OpenResty XRay Jul 26, 2024

OpenResty XRay May 24, 2024
")


")
")

")