Analyzing CPU Usage in Online Node.js Applications (Using OpenResty XRay)
OpenResty XRay is a dynamic tracing product that allows you to analyze online applications without modifying them. It’s highly efficient and safe to use. You can gain deep insights into any running process at any time, just like performing an X-ray examination of your software.
The core technology of OpenResty XRay is based on our independently enhanced dynamic tracing technologies, such as eBPF+ and Stap+. These advanced technologies enable XRay to provide deeper and more precise analysis capabilities while maintaining extremely low system overhead. Notably, OpenResty XRay supports both the older 3.10 kernel of RHEL/CentOS Linux 7 and newer 6.x kernels, offering users broad system compatibility.
Node.js is one of the applications supported by OpenResty XRay. Using advanced dynamic tracing technology, OpenResty XRay offers the following unique advantages:
- Zero intrusiveness: No need to modify your Node.js application code or configuration, nor add new plugins or libraries.
- No special startup options required: You can use existing Node.js software without adding any special startup options.
- Wide system compatibility: Supports various operating systems from modern Linux distributions to older systems like CentOS 7.
- Minimal performance overhead: The additional load on Node.js applications during sampling is negligible, and there’s no impact when not sampling.
These features make OpenResty XRay a truly “plug-and-play” solution, allowing you to perform in-depth analysis of Node.js applications in any environment at any time, just like giving your software an X-ray examination.
In this article, we will demonstrate how to use OpenResty XRay to analyze CPU performance issues in Node.js applications.
High CPU Usage Issues in Node.js Applications
When a Node.js application shows abnormally high CPU usage, it typically indicates that certain code paths are consuming excessive computational resources. OpenResty XRay’s Guided Analysis can help you quickly identify these hotspots in your code.
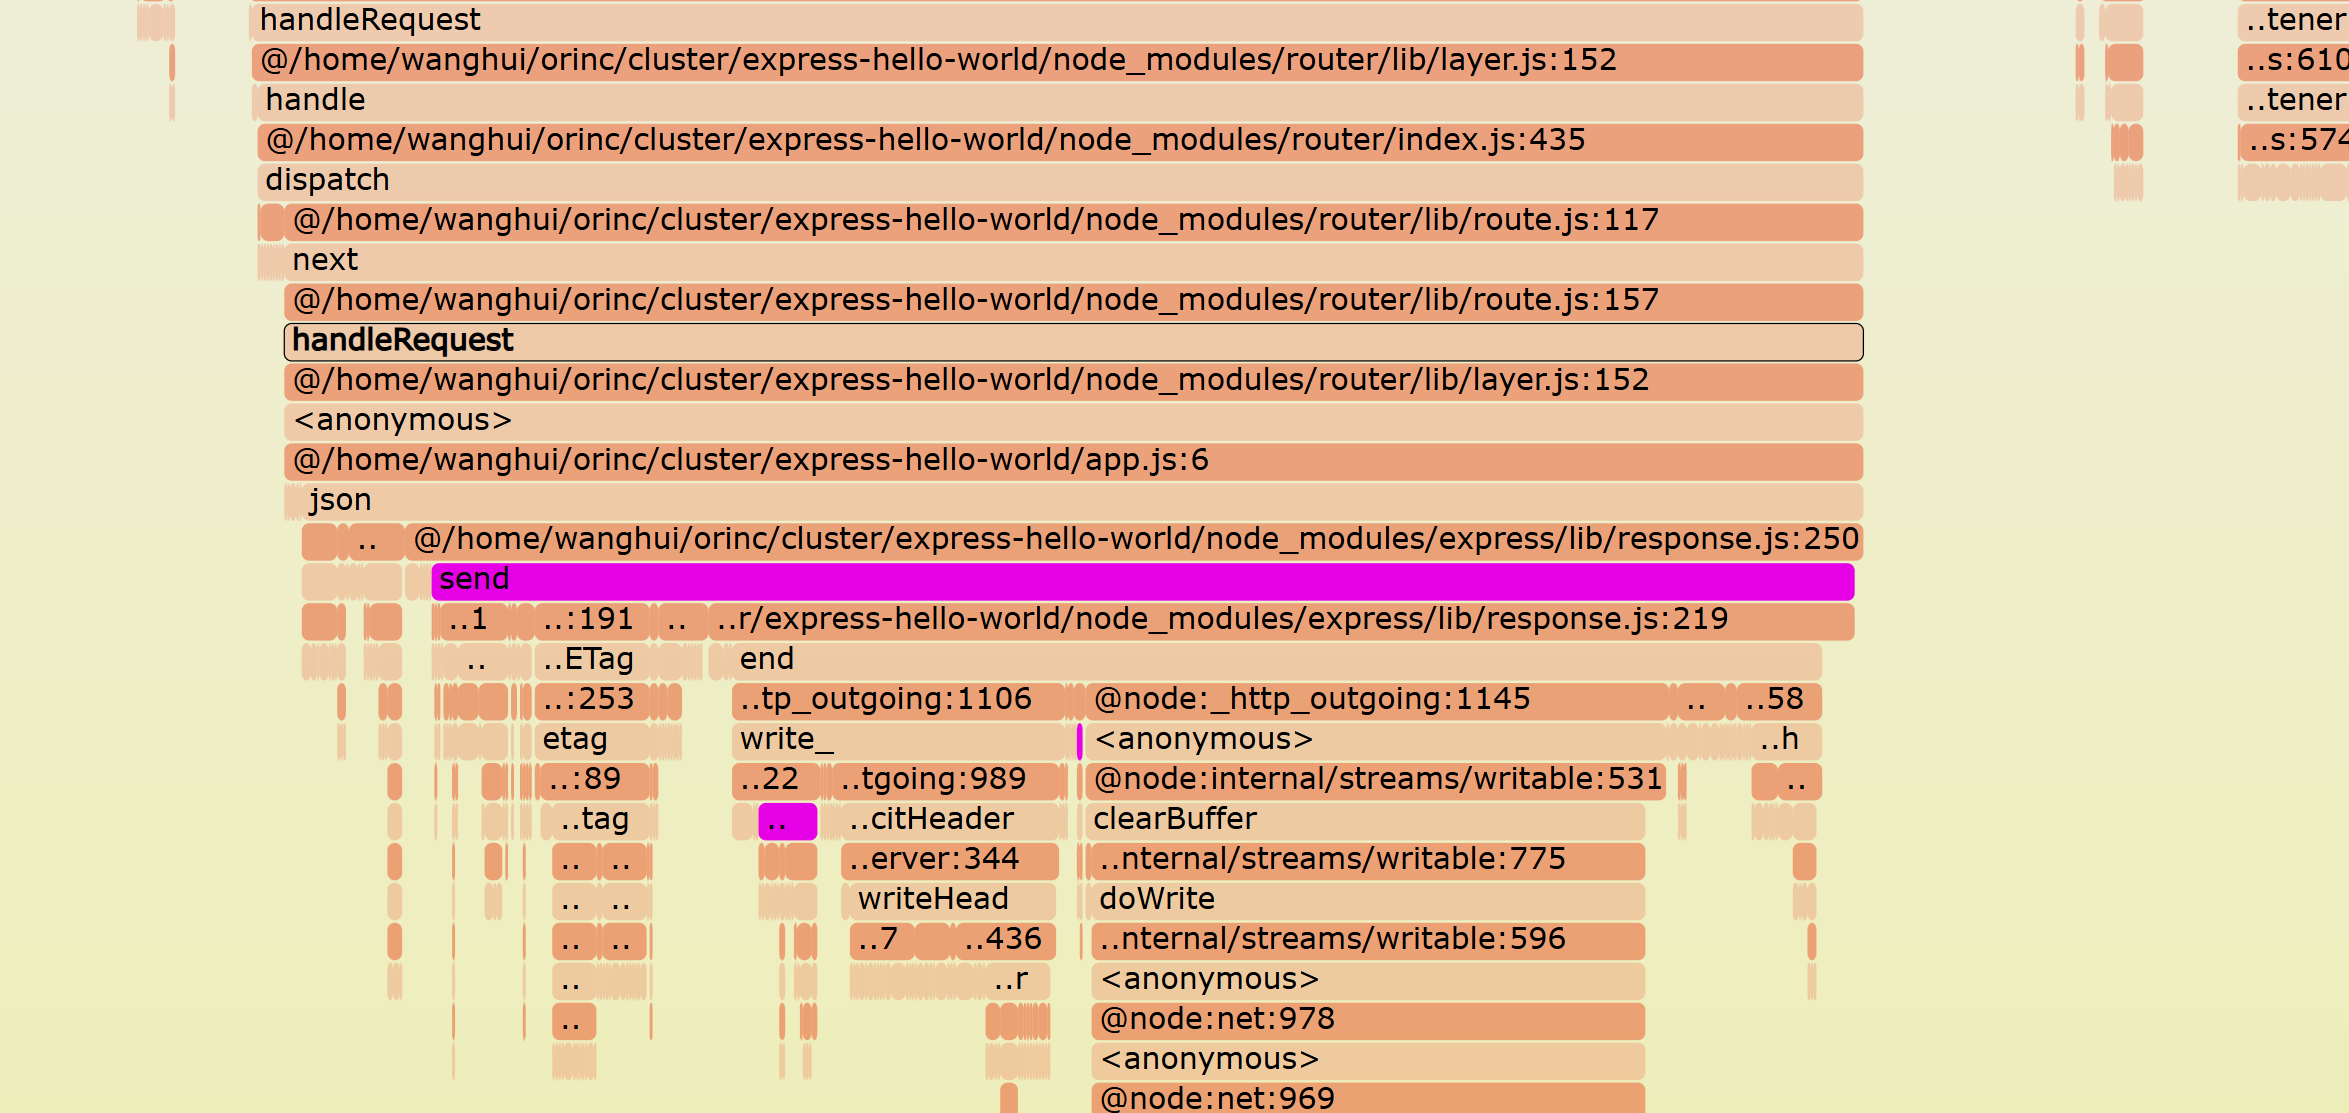
For example, here’s a CPU flame graph generated by OpenResty XRay for a Node.js application under load testing (in this example, an Express.js application, though this applies to any unmodified Node.js application):
In this flame graph, each bar represents a function call, with the width of the bar indicating the proportion of CPU time consumed by that function. The wider the bar, the more CPU time the function consumes.
Upon careful analysis of this graph, We can clearly see that the send function at express/lib/response.js:250 occupies the largest share of CPU time. This is a native method used internally by the Node.js virtual machine, primarily for writing data to files or network sockets. This finding aligns perfectly with our stress testing scenario, as during the stress test, a significant amount of CPU resources are used for returning response data. It’s worth noting that OpenResty XRay can precisely locate specific Node.js source files down to the line number level, and this line number accurately points to the code line currently being executed, not just the function definition location. This level of precision allows you to directly find the exact location of performance hotspots, greatly improving the efficiency of problem identification and optimization.
Based on these in-depth analysis results, you can strategically optimize these performance hotspots. Potential optimization strategies include, but are not limited to: improving algorithm efficiency, reducing unnecessary computations, implementing appropriate caching mechanisms, or optimizing I/O operations. Through these targeted optimizations, you can effectively reduce your application’s CPU usage and enhance overall performance.
CPU Blocking Issues in Node.js Applications
Sometimes, low CPU utilization in Node.js applications can actually indicate a problem, typically caused by IO blocking or other resource contention. OpenResty XRay can help you identify these bottlenecks.
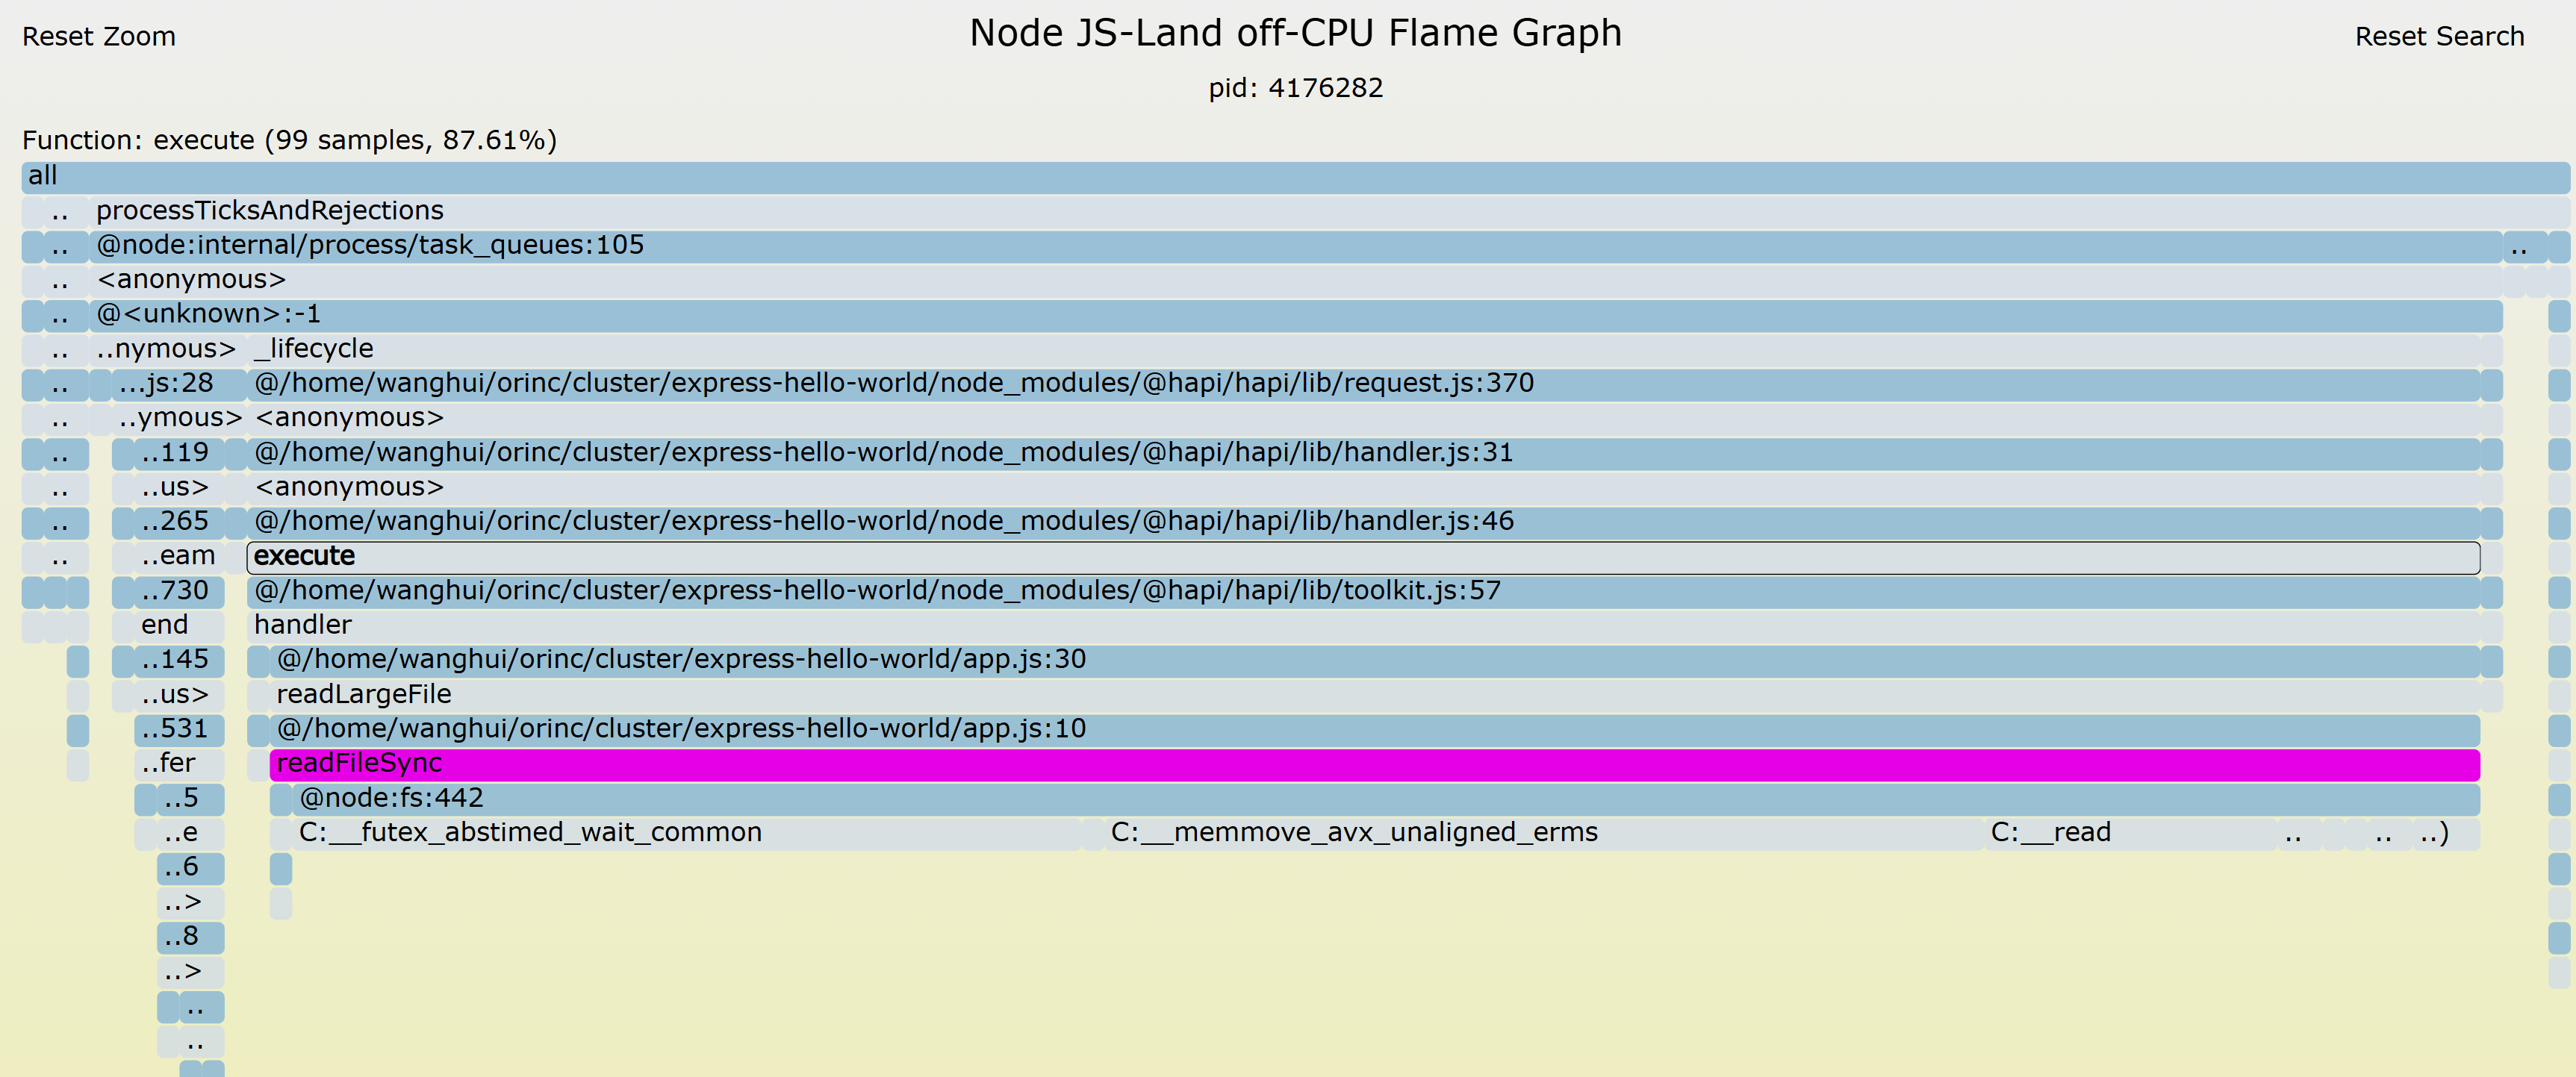
For example, here’s an off-CPU flame graph generated by OpenResty XRay for a Node.js application with low CPU utilization:
In this flame graph, each bar represents a function call, and the width of the bar indicates how long that function blocked the CPU. Wider bars mean the function blocked the CPU for longer periods.
Looking closely at the widest sections of the flame graph, we can identify that the issue occurs at the readFileSync function call at app.js:10. This synchronous file reading operation blocks the CPU, causing overall application performance degradation.
By analyzing these details, you can quickly identify the root causes of low CPU utilization. Depending on the specific situation, you can implement appropriate optimizations, such as improving IO operations or introducing asynchronous programming techniques, to enhance your application’s performance comprehensively.
Automated Sampling and Expert Analysis
OpenResty XRay not only offers powerful analysis capabilities but also features automated sampling and report generation to streamline your performance optimization work:
Automated On-demand Production Sampling: XRay can automatically trigger sampling based on preset conditions without manual intervention. This means you can automatically start collecting data when specific load or performance metrics reach certain thresholds, ensuring you capture the most critical performance issues.
AI-Powered Analysis: Our AI system automatically analyzes generated flame graphs, intelligently identifying performance bottlenecks and anomalous patterns. Based on analysis results, the system runs appropriate flame graph tools on demand to ensure the most relevant performance data is captured.
Automated Analysis Reports: Based on collected data and AI analysis results, XRay automatically generates detailed analysis reports. These reports contain key information such as performance hotspots, resource utilization, and potential optimization recommendations, allowing you to understand your application’s performance status quickly.
Expert Team Support: Beyond automated features, our expert team is ready to provide deeper support:
- We can create custom analyzers tailored to your specific needs to meet particular performance monitoring requirements.
- Our experts will help you interpret automatically generated reports, providing professional insights and optimization suggestions.
- For complex performance issues, our team can deliver more in-depth analysis and solutions.
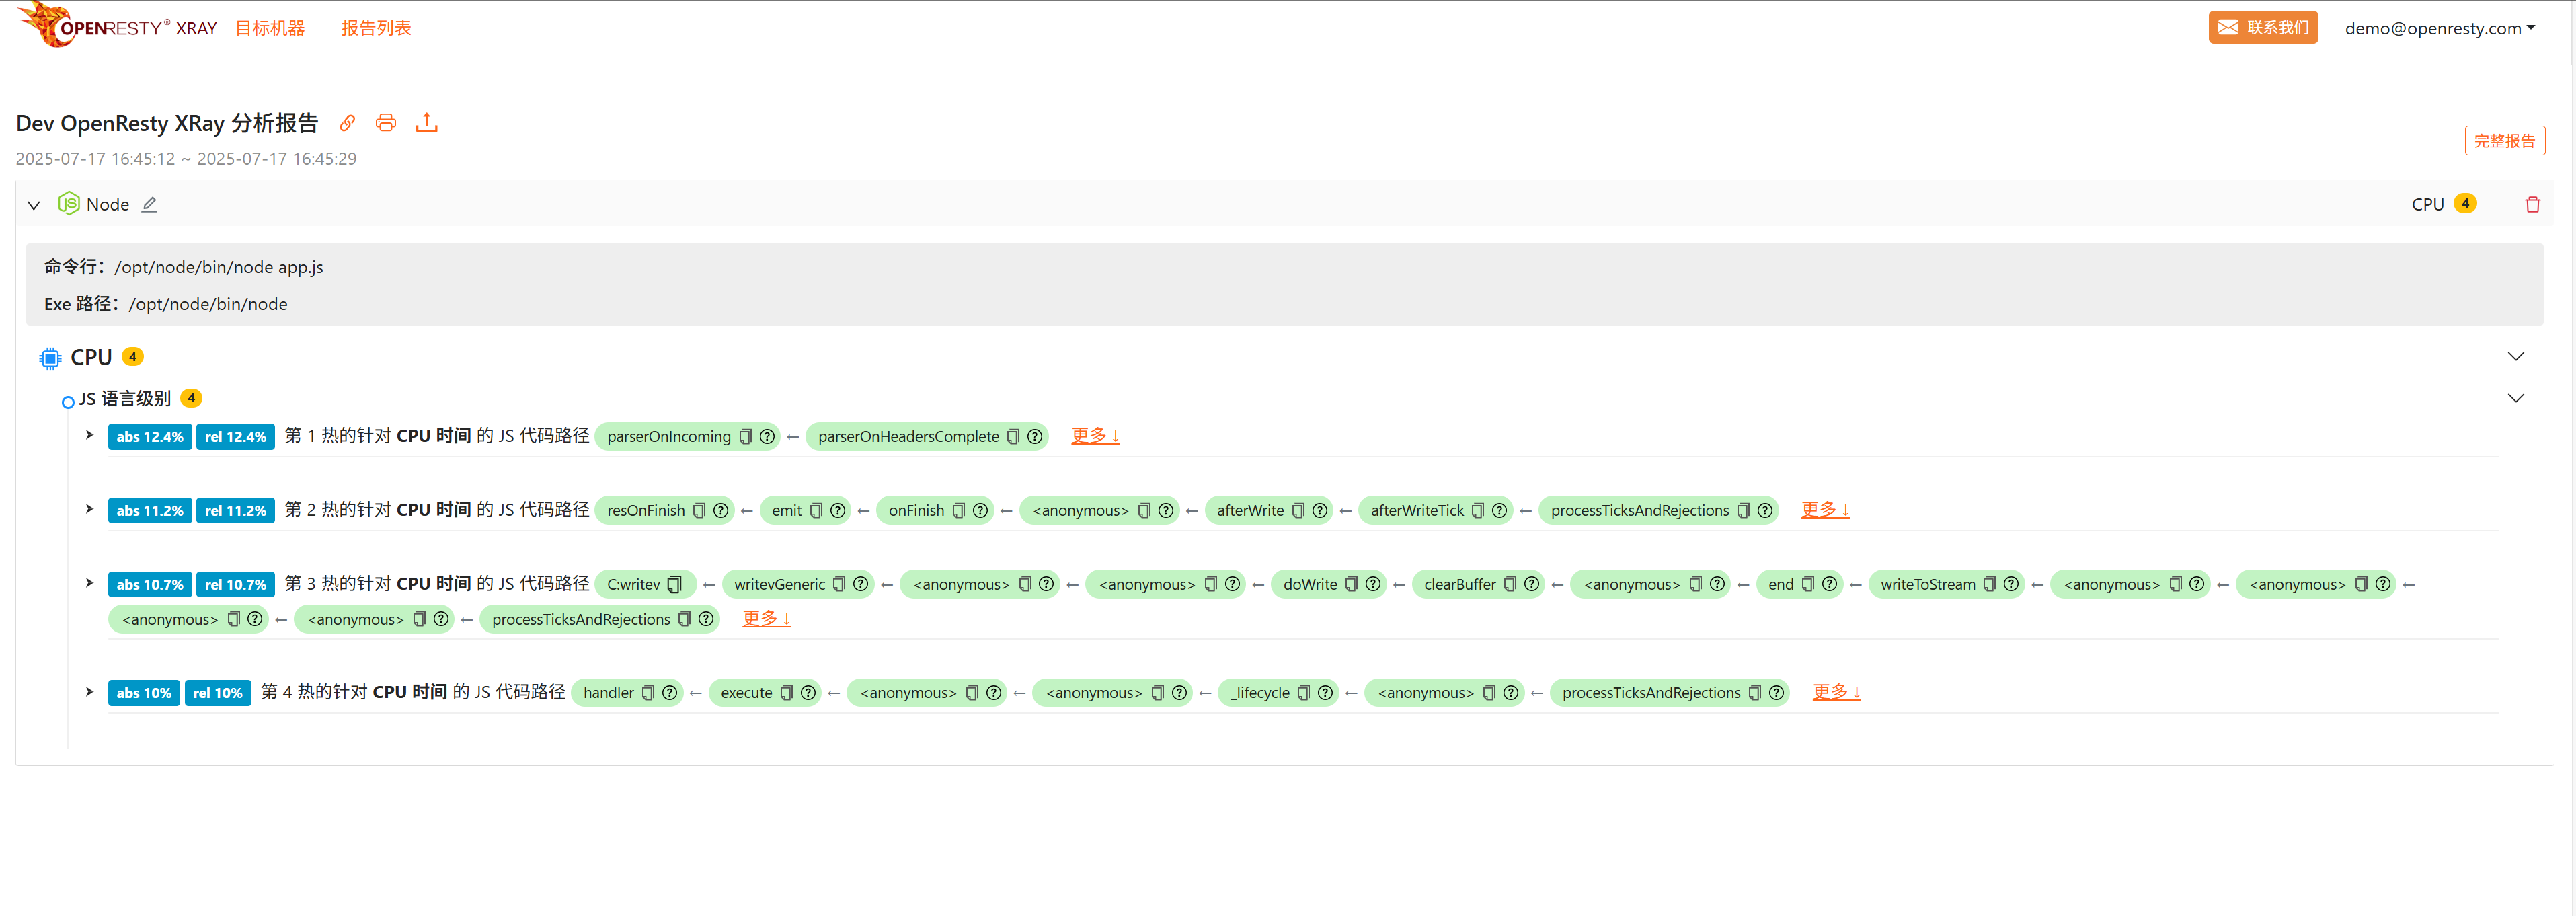
Here’s a sample report generated by OpenResty XRay:
By combining automated tools with expert support, OpenResty XRay provides a comprehensive performance optimization solution to help your Node.js applications maintain optimal performance at all times.
Performance Impact and Overhead
OpenResty XRay is designed to be non-intrusive and lightweight. During sampling, the additional overhead added to Node.js application processes is typically negligible. When not sampling, the process runs at full speed without any impact whatsoever.
This low-overhead characteristic makes OpenResty XRay an ideal monitoring tool for production environments, allowing you to perform performance analysis anytime, anywhere without worrying about significant impact on your applications.
Future Plans
We’re not stopping here. We have more plans to make OpenResty XRay even more powerful and useful for you. Some features we’re developing include:
- Analyzing latency statistics for Node.js application network requests and intelligently capturing packet data for problematic requests.
- Supporting additional technology stacks and open-source software. We aim to make OpenResty XRay a universal tool that can analyze any online application regardless of the underlying technology. Some targets we’re considering include Nginx modules, Envoy extensions, PostgreSQL extensions, Perl/Python/Ruby modules and libraries, and more.
If you have any suggestions or requirements for additional metrics or features, please let us know. We’re always listening to your feedback and continuously improving our product to meet your needs.
Conclusion
In this article, we’ve shown you how to use OpenResty XRay to analyze CPU and disk I/O usage in Node.js applications. We’ve also shown you examples of the results and explained what they mean.
By using OpenResty XRay, you can easily identify code paths that consume CPU and disk resources, and how much they impact overall performance. You can then use this information to optimize your Node.js applications to run faster and more smoothly.
If you want to learn more about the OpenResty XRay product and how it can help you with other aspects of your online applications, visit our website or contact us for more details.
What is OpenResty XRay
OpenResty XRay is a dynamic-tracing product that automatically analyzes your running applications to troubleshoot performance problems, behavioral issues, and security vulnerabilities with actionable suggestions. Under the hood, OpenResty XRay is powered by our Y language targeting various runtimes like Stap+, eBPF+, GDB, and ODB, depending on the contexts.
If you like this tutorial, please subscribe to this blog site and/or our YouTube channel. Thank you!
About The Author
Yichun Zhang (Github handle: agentzh), is the original creator of the OpenResty® open-source project and the CEO of OpenResty Inc..
Yichun is one of the earliest advocates and leaders of “open-source technology”. He worked at many internationally renowned tech companies, such as Cloudflare, Yahoo!. He is a pioneer of “edge computing”, “dynamic tracing” and “machine coding”, with over 22 years of programming and 16 years of open source experience. Yichun is well-known in the open-source space as the project leader of OpenResty®, adopted by more than 40 million global website domains.
OpenResty Inc., the enterprise software start-up founded by Yichun in 2017, has customers from some of the biggest companies in the world. Its flagship product, OpenResty XRay, is a non-invasive profiling and troubleshooting tool that significantly enhances and utilizes dynamic tracing technology. And its OpenResty Edge product is a powerful distributed traffic management and private CDN software product.
As an avid open-source contributor, Yichun has contributed more than a million lines of code to numerous open-source projects, including Linux kernel, Nginx, LuaJIT, GDB, SystemTap, LLVM, Perl, etc. He has also authored more than 60 open-source software libraries.
Related Articles
OpenResty XRay Sep 20, 2024

OpenResty XRay Jul 15, 2023

OpenResty XRay Dec 4, 2025

OpenResty XRay Nov 18, 2025

OpenResty XRay Nov 10, 2025


