Troubleshooting the extra 200-ms request latency online
Have you ever felt annoyed by slow requests that take forever to load? That’s what happened to one of our customers in the travel industry recently. They had some web APIs that took 200 milliseconds and they were clueless about the reason.
Luckily, OpenResty XRay came to the rescue and helped them find out the root cause of the long latency issue in no time. In this demo, we will show you how OpenResty XRay uses the “smart packet capturing” feature to only capture packets on slow (or other erroneous) TCP connections without affecting the production server performance.
The Problem
Some of the API requests take way too long, about 200 milliseconds, even though the application servers should handle them very fast.
The long latency issue can have many different causes, such as slow disk I/O, packet loss in the kernel network stack or other network devices, high CPU usage that slows down the applications or web servers, or just poor network links and connectivity. With so many possible suspects, dynamic tracing tools like OpenResty XRay can make it much easier to solve these tricky problems.
The Analsysis Process
Response latency distribution
OpenResty XRay starts by sampling the requests that the web server processes (in this case, it is an OpenResty or Nginx web server) in the customer’s production environment. One of the great things about OpenResty XRay is that it can safely analyze online applications and servers without any changes in the running user processes.
It then automatically creates the following logarithmic distribution chart for the response latencies.
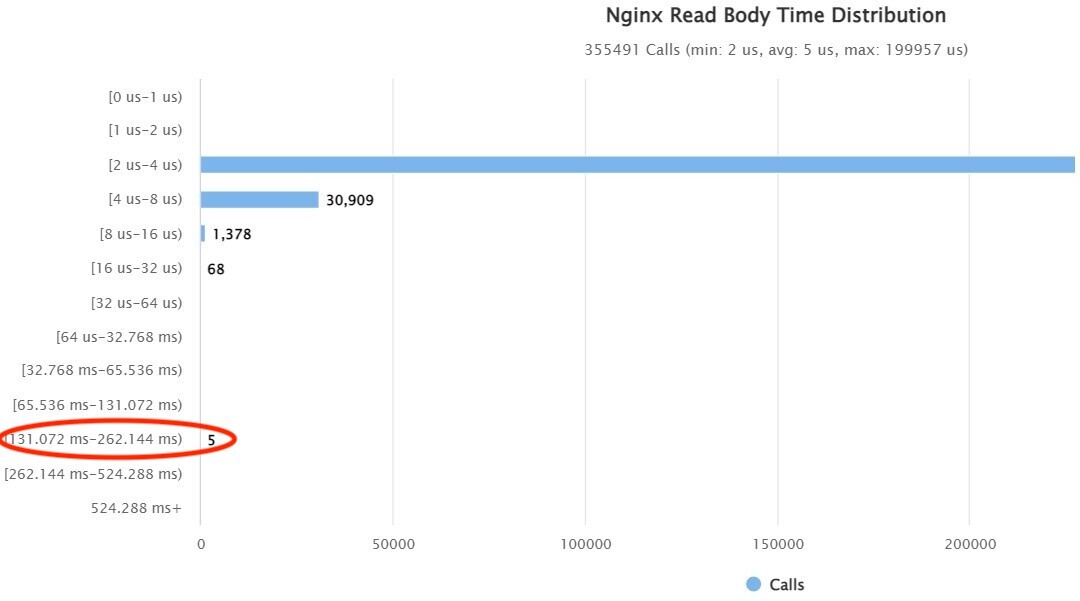
We can notice that 5 requests with a long latency fall into the range of 131ms ~ 262ms.
The slowest requests
OpenResty XRay also automatically collected the URI and other info about those slowest requests.
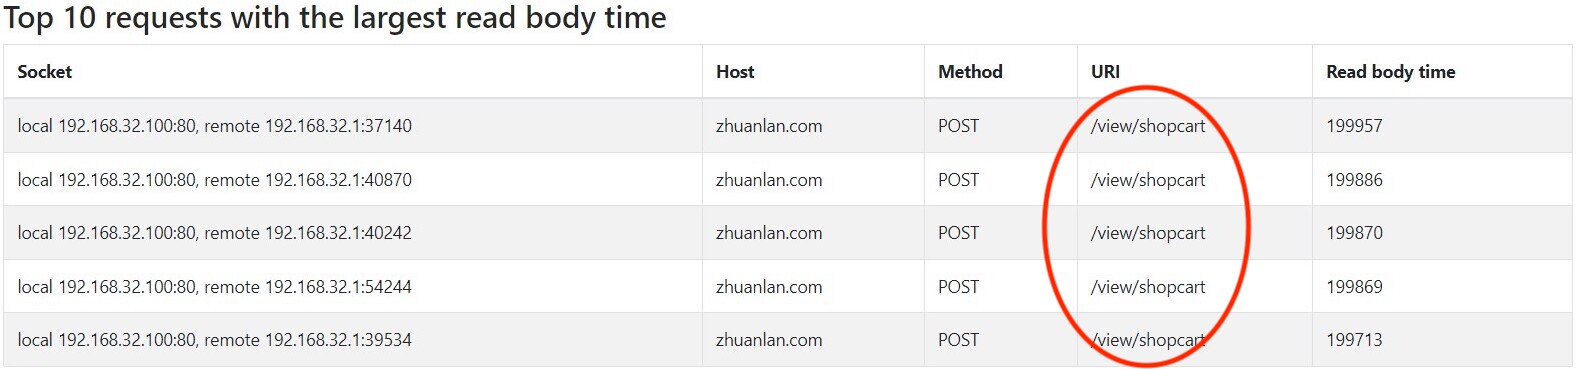
We changed the Host column name so that we can share the sample here.
We can tell from the table above that all the slow requests are for the URI /view/shopcart/.
Smart packet capturing
OpenResty XRay has the unique feature of capturing and analyzing network packets only on TCP connections that we are interested in. In this case, we only want to see TCP connections with request latency longer than 100 milliseconds, for example.
OpenResty XRay automatically identified those slow TCP connections and captured the TCP packets on them. One of the samples looks like this in the web console of OpenResty XRay.
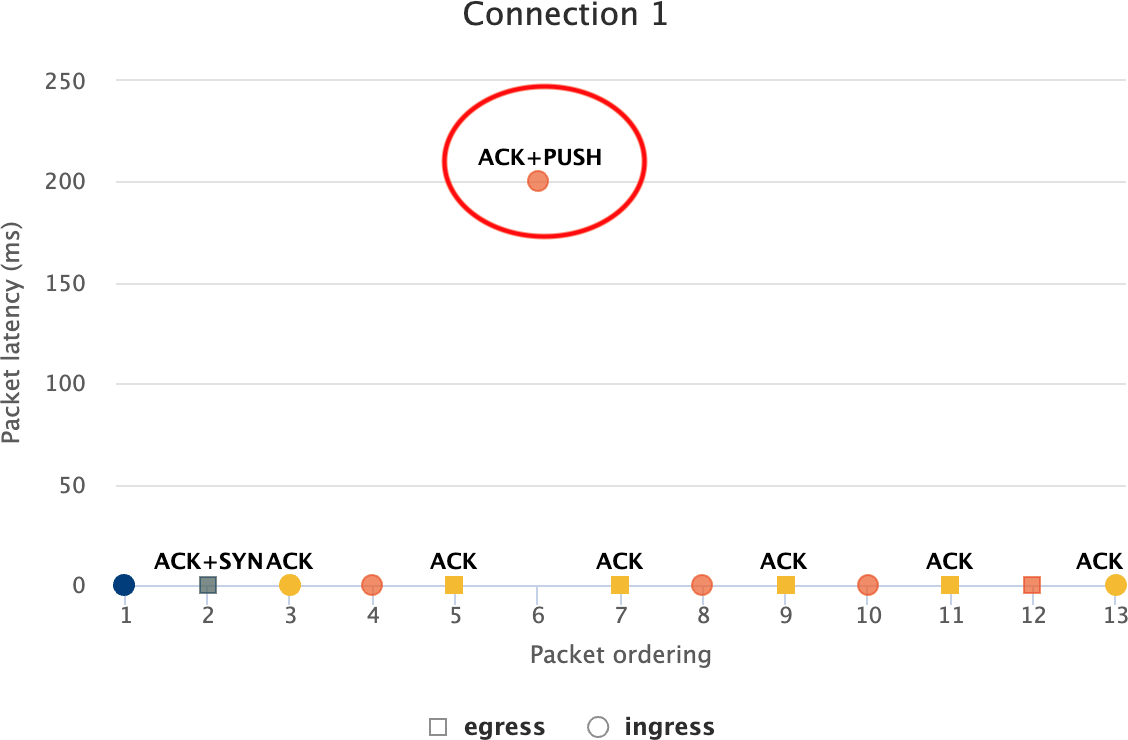
On this chart, the small circles represent the ingress packets for the server, while the squares represent the egress packets.
One packet stands out in the chart with a strangely long latency, about 200ms. It is the ACK+PUSH packet in a small circle, which means it is an incoming or ingress packet sent from the client.
At this point, we can rule out the application server or the gateway web server as the cause. It must be the client or the network links between the client and the server that add this extra 200ms latency.
The culprit
It is simple to check that the network link between the client and the server is flawless. And our customer then turns their attention to the client applications for their Android mobile apps.
And soon they discover that the client software deliberately adds a 200ms delay between sending the request header and sending the request body. The mystery is solved!
The improvement after fixes
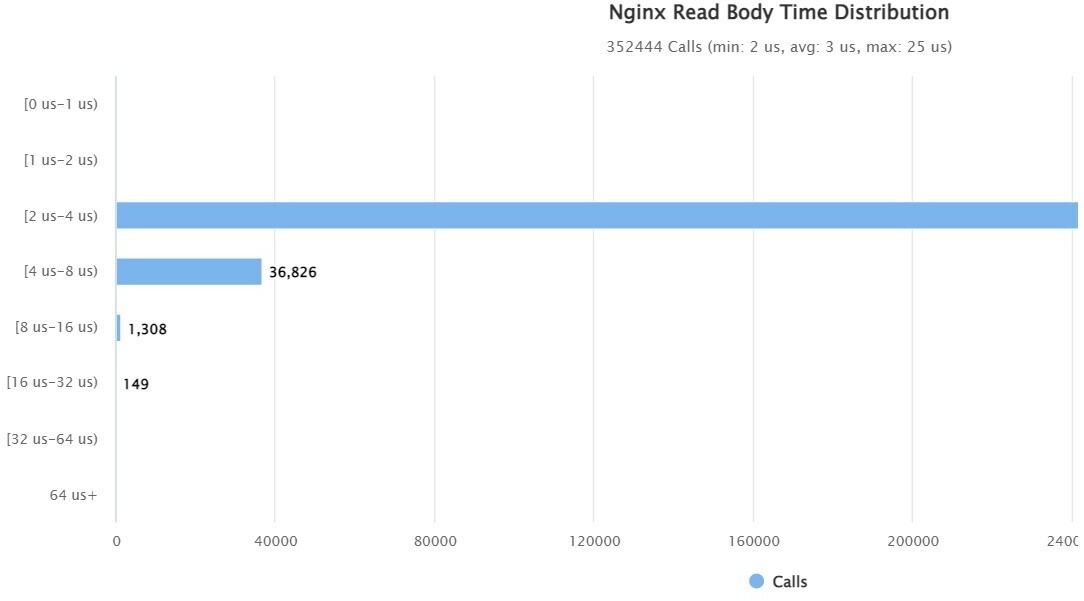
After the customer fixed the extra delay in their client application, the 200ms-long latency issue is gone, as evidenced by the new OpenResty XRay request latency distribution chart below.
Fully-automated analysis
OpenResty XRay can automatically choose the right analyzers to sample the target process, automatically analyze the generated flame graph, and finally present the findings in a human-friendly form in the automatic analysis reports. This makes it much easier for our users, who do not have to monitor their servers, or manually run the suitable analyzer, or even understand the results sampled by the analyzers themselves.
What is OpenResty XRay
OpenResty XRay is a dynamic-tracing product that automatically analyzes your running applications to troubleshoot performance problems, behavioral issues, and security vulnerabilities with actionable suggestions. Under the hood, OpenResty XRay is powered by our Y language targeting various runtimes like Stap+, eBPF+, GDB, and ODB, depending on the contexts.
About The Author
Yichun Zhang (Github handle: agentzh), is the original creator of the OpenResty® open-source project and the CEO of OpenResty Inc..
Yichun is one of the earliest advocates and leaders of “open-source technology”. He worked at many internationally renowned tech companies, such as Cloudflare, Yahoo!. He is a pioneer of “edge computing”, “dynamic tracing” and “machine coding”, with over 22 years of programming and 16 years of open source experience. Yichun is well-known in the open-source space as the project leader of OpenResty®, adopted by more than 40 million global website domains.
OpenResty Inc., the enterprise software start-up founded by Yichun in 2017, has customers from some of the biggest companies in the world. Its flagship product, OpenResty XRay, is a non-invasive profiling and troubleshooting tool that significantly enhances and utilizes dynamic tracing technology. And its OpenResty Edge product is a powerful distributed traffic management and private CDN software product.
As an avid open-source contributor, Yichun has contributed more than a million lines of code to numerous open-source projects, including Linux kernel, Nginx, LuaJIT, GDB, SystemTap, LLVM, Perl, etc. He has also authored more than 60 open-source software libraries.
Related Articles
OpenResty XRay Jul 15, 2023

OpenResty XRay Jul 15, 2023

OpenResty XRay Jun 23, 2023

OpenResty XRay Feb 18, 2023

OpenResty XRay Feb 14, 2023


