Analyzing the Most CPU-Consuming Requests in OpenResty or Nginx
It’s common for nonblocking web servers like OpenResty and Nginx to consume
a lot of CPU resources. Thanks to the I/O multiplexing feature of operating
system features like epoll and kqueue. Sometimes it is helpful for DevOps
and SRE folks to quickly find out precisely what request URIs or what request
hostnames are consuming the most CPU time in an online server or several servers.
In this article, we will demonstrate how to use the dynamic-tracing tools in
OpenResty XRay to analyze unmodified OpenResty
and Nginx web servers for such statistics in real-time.
We will use both the standard dynamic-tracing tools and custom tools created by a SQL-like language (called YSQL) to show real-world examples with data and graphics automatically generated by OpenResty XRay.
System Environment
Here we use a Red Hat Enterprise Linux 7 system as an example. Any Linux distributions supported by OpenResty XRay should work equally fine, like Ubuntu, Debian, Fedora, Rocky, Alpine, etc.
We use an unmodified open-source OpenResty binary build as the target application. You can use any OpenResty or Nginx binaries, including those compiled by yourself. No special build options, plugins, or libraries are needed in your existing server installation or processes. It is the beauty of dynamic tracing technologies. It’s genuinely non-invasive.
We also have the OpenResty XRay’s Agent daemon
running on the same system and have the command-line utilities from the openresty-xray-cli
package installed and configured.
CPU-Hottest Request Hostnames
Using Standard Tools
The most convenient way is just to run the standard tool ngx-cpu-hottest-hosts.
We first find out the PID for the master process of the OpenResty or Nginx server instance.
$ ps aux | grep nginx:
root     1691450  0.0  0.0  28868  4140 ?        Ss   Jul05   0:00 nginx: master process /usr/local/openresty/nginx/sbin/nginx
nobody   3055159  1.5  0.0  40868  4096 ?        S    14:38   4:58 nginx: worker process
The PID of the master process is 1059. We use this to trace all the processes, including the Nginx worker processes, in this process group.
$ orxray analyzer run ngx-cpu-hottest-hosts -p -1691450 -t 10
Start tracing...
Go to https://x5vrki.xray.openresty.com/targets/68/history/582346 for charts
Here we use the orxray command-line utility to run the standard tool ngx-cpu-hottest-hosts
against the process group specified by the master process’s PID, 1059, via the
-p option. Note the minus sign before the PID, which indicates it is the whole
process group of that process we want to trace in real-time. Note the -t option
specifies the number of seconds we want to trace. As a general rule of thumb,
we should use a longer sampling time window when the target applications are
less busy and a shorter window for busier ones.
The output above shows a link to the web console of OpenResty XRay, where we can see pretty charts generated for this run. You’ll have a different URI for your web console, though.
We can see that the hottest one is the openresty.org hostname. And openresty.com
comes next. Please remember that we’re only counting requests hitting the operating
system’s CPU profiler, not counting all the requests. So only the relative
numbers make sense here. For instance, openresty.org consumes about 19% more
CPU time than openresty.com, given their sample counts, 733 and 612.
Sometimes we may only want to analyze a single Nginx worker process, when just
a single worker process consumes more CPU time than others, or when we want
to minimize the tracing overhead introduced. Then we can use that worker process'
s PID as the value of the -p option for the orxray command, as in
$ orxray analyzer run ngx-cpu-hottest-hosts -p 3055159 -t 10
It’s important to omit the minor sign (-) before the PID this time.
By default, the tool analyzes the processes on the current machine. If you like
to analyze processes on other servers, you can add the -a agent_ID option
to specify the server you want to run on. Just use the orxray agent list command
to get the list of agent IDs visible to your OpenResty XRay
web console.
Creating Custom Tools with YSQL
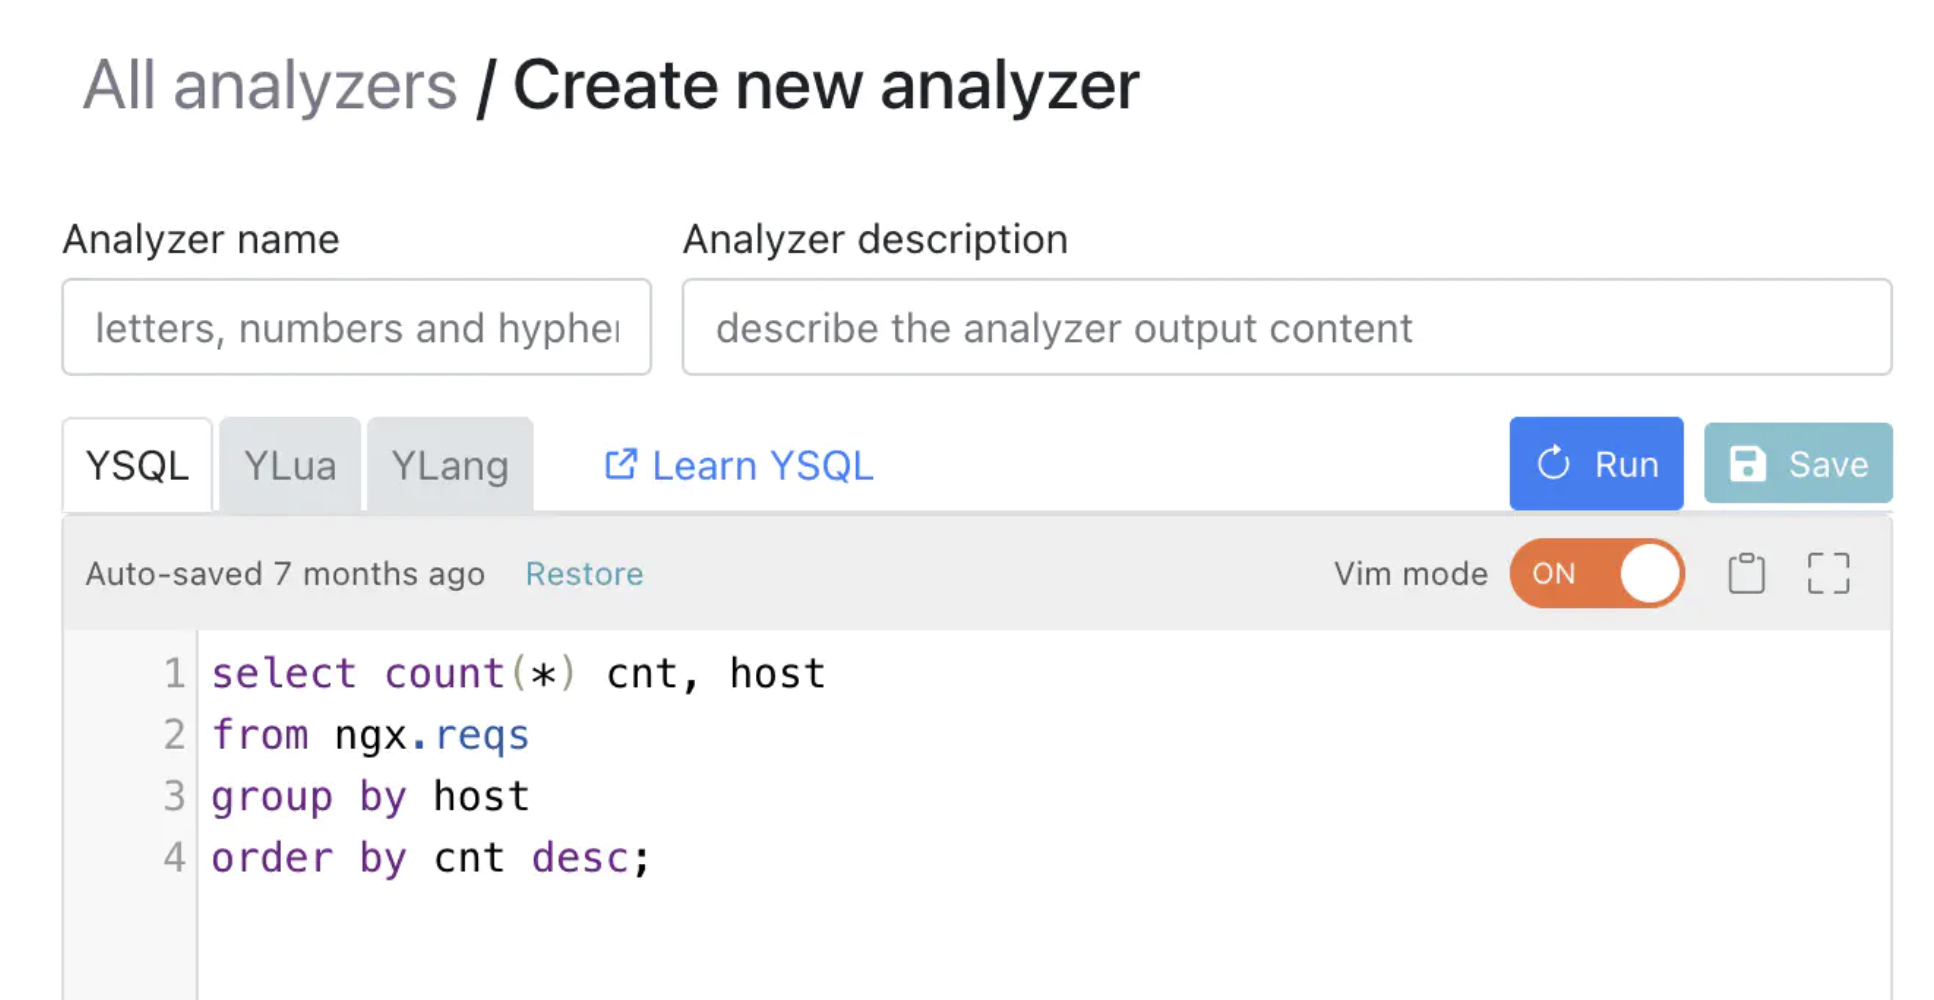
It is more fun to create custom dynamic-tracing tools with a SQL-like language called YSQL for maximum flexibility. The YSQL language is never for querying any relational databases; instead, it is always compiled to dynamic tracing tools which perform real-time inspection and analytics against live processes and running applications.
Let’s create a plain text file named my-cpu-hottest-hosts.ysql with the following
content. Feel free to use your favorite code editor.
select count(*) count, host
from cpu.profile inner join ngx.reqs
group by host
order by count desc
limit 10;
The SQL query is mostly self-explanatory. The most intriguing part is the from
clause, which uses inner join to count Nginx requests against the operating
system’s CPU profiler. The CPU profiler corresponds to the virtual table cpu.profile.
The host column is the value from the HTTP host header. We added the limit 10
clause since we only care about the top 10.
Now let’s run this YSQL tool. Assuming the worker process’s PID is 3055159, we have the following command.
$ run-ysql -p 3055159 ./my-cpu-hottest-hosts.ysql -t 10
Start tracing...
Go to https://x5vrki.xray.openresty.com/targets/68/history/583188 for charts
Note that we use the run-ysql command-line utility this time.
We can browse the web link for a similar output chart as with the standard tool above.
One-Liner YSQL
We can also run the YSQL as a one-liner without creating a local file.
$ run-ysql -p 3055159 -t 10 -e 'select count(*) count, host from cpu.profile inner join ngx.reqs group by host order by count desc limit 10;'
CPU-Hottest Request URIs
We can also trace the CPU-hottest request URIs in the target process.
Using Standard Tools
We can run the standard tool ngx-cpu-hottest-uris:
$ orxray analyzer run ngx-cpu-hottest-uris -p 3055159 -t 10
Start tracing...
Go to https://x5vrki.xray.openresty.com/targets/68/history/622478 for charts
We can see the top 2 CPU-hottest request URIs are openresty.org’s / and
openresty.com’s /en, respectively.
Creating Custom YSQL Tools
The YSQL query this time is slightly
different. We use the uri column instead.
select count(*) count, host, uri
from cpu.profile inner join ngx.reqs
group by host, uri
order by count desc
limit 10
Now let’s run this YSQL tool. Assuming the worker process’s PID is 3055159, we have the following command.
$ run-ysql -p 3055159 ./my-cpu-hottest-uris.ysql -t 10
Start tracing...
Go to https://x5vrki.xray.openresty.com/targets/68/history/622204 for charts
We can browse the web link for a similar output chart as with the custom tool above.
Digging Deeper
One natural cause for hostnames or URIs taking more CPU resources than others is that they have more requests than others. We can verify this by counting all the requests grouped by hostnames or URIs during a time window.
Busiest Hostnames with the most requests
Using Standard Tools
We can use the standard tool ngx-req-counts-by-hosts to do the counting.
$ orxray analyzer run ngx-req-counts-by-hosts -p 3055159
Start tracing...
Go to https://x5vrki.xray.openresty.com/targets/68/history/584324 for charts
We can browse the web page as instructed:
We can see that the top domain, openresty.org, also has the most requests.
But the second place is doc.openresty.com instead of openresty.com. It means
that, on average, each request of openresty.com may take more CPU time than
that of doc.openresty.com.
Creating Custom Tools with YSQL
Just for demonstration purposes, we can create a simple YSQL
tool file to create a custom tool that emulates the standard tool ngx-req-counts-by-hosts:
select count(*) count, host
from ngx.reqs
group by host
order by count desc
limit 10;
Note the from clause. We no longer do an inner join with the virtual table
cpu.profile. So now we count all the requests served by Nginx or OpenResty
during that sampling time window.
Now let’s run this YSQL tool against
an Nginx worker process with the PID 3055159.
$ run-ysql -p 3055159 ./top-10-hosts-req.ysql
Start tracing...
Go to https://x5vrki.xray.openresty.com/targets/68/history/584615 for charts
We shall then get a similar chart to the bar chart shown above.
Busiest Hostnames with the most network data
We also have the ngx-req-size-by-hosts standard tool to sample the busiest
request hostnames with the large accumulated network traffic data volume (or request size, including both the request headers and request bodies).
$ orxray analyzer run ngx-req-size-by-hosts -p 3055159
Start tracing...
Go to https://x5vrki.xray.openresty.com/targets/68/history/584675 for charts
We can see that both openresty.org and doc.openresty.com also take most
of the network data volume, similar to the request counts.
And a custom YSQL tool may look like this:
select sum(req_size) request_size, host
from ngx.reqs
group by host
order by request_size desc
limit 10;
The req_size column from the ngx.reqs virtual table represents the total
request size (request headers + request bodies). It does not contain any TLS/SSL
handshake traffic, though.
Finding Bottlenecks & doing optimizations
To analyze concrete performance bottlenecks and obtain optimization suggestions, we can further use the CPU flame graph tools for C-land and Lua-land, respectively.
OpenResty XRay can automatically profile any busy applications (not just OpenResty and Nginx applications!), and our human experts can also provide rich analysis reports with actionable suggestions. This way, average users don’t even need to know when and where to run what tools. And they don’t need to interpret the analyzers’ output either.
Running Directly in the Web Console
The user may choose to execute any of the tools covered in this tutorial directly
in the web console of OpenResty XRay. They
can even be triggered automatically upon interesting events like high CPU usage.
The command-line utilities from the openresty-xray-cli are handy for demonstration
purposes. And they are also easy to automate and integrate into other systems
by the DevOps and SRE people.
Tracing Applications inside Containers
OpenResty XRay tools support tracing containerized applications transparently. Both Docker and Kubernetes (K8s) containers work transparently. Just as with normal application processes, the target containers do not need any applications or extra privileges. The OpenResty XRay Agent daemon should run outside the target containers (like in the host operating system directly or in its own privileged container).
Let’s see an example. We first check the container name or container ID with
the docker ps command.
$ docker ps
CONTAINER ID   IMAGE                                       COMMAND                  CREATED         STATUS          PORTS     NAMES
4465297209d9   openresty/openresty:1.19.3.1-2-alpine-fat   "/usr/local/openrest…"   18 months ago   Up 11 minutes             angry_mclaren
Here the container name is angry_mclaren. We can then find out the target
process’s PID in this container.
$ docker top angry_mclaren
UID                 PID                 PPID                C                   STIME               TTY                 TIME                CMD
root                3310154             3310133             0                   14:22               ?                   00:00:00            nginx: master process /usr/local/openresty/bin/openresty -g daemon off;
nobody              3310209             3310154             0                   14:22               ?                   00:00:00            nginx: worker process
The PID for the openresty worker process is 3310209. We then run the OpenResty
XRay analyzer against this PID as usual.
$ orxray analyzer run ngx-cpu-hottest-hosts -p 3310209 -t 10
Start tracing...
...
Go to https://x5vrki.xray.openresty.com/targets/68/history/600752 for charts
OpenResty XRay is also able to automatically detect long-running processes as “applications” of a particular type (like “OpenResty”, “Python”, etc.).
How The Tools are Implemented
All the tools are implemented in the Y language.
OpenResty XRay executes them with either the Stap+1 or eBPF2 backends
of OpenResty XRay, both of which use the 100%
non-invasive dynamic tracing
technologies based on the Linux kernel’s uprobes and kprobes facilities.
The YSQL queries are first compiled
down to the Y language and
then further down to the executable dynamic tracing
tools.
We don’t require any collaborations from the target applications and processes. No log data or metrics data is used or needed. We directly analyze the running processes’ process space in a strictly read-only way. And we also never inject any byte-code or other executable code into the target processes. It is 100% clean and safe.
The Overhead of the Tools
The dynamic-tracing tools demonstrated in this tutorial are very efficient and suitable for online execution.
When the tools are not running and actively sampling, the overhead on the system and the target processes are strictly zero. We never inject any extra code or plugins into the target applications and processes; thus, there’s no inherent overhead.
During sampling, the request latency only increases by less than 1 microsecond (us) on average on typical server hardware. And the reduction in the maximum request throughput for the fastest OpenResty/Nginx server serving tens of thousands of requests per second on each CPU core is also just about 4%.
About The Author
Yichun Zhang (Github handle: agentzh), is the original creator of the OpenResty® open-source project and the CEO of OpenResty Inc..
Yichun is one of the earliest advocates and leaders of “open-source technology”. He worked at many internationally renowned tech companies, such as Cloudflare, Yahoo!. He is a pioneer of “edge computing”, “dynamic tracing” and “machine coding”, with over 22 years of programming and 16 years of open source experience. Yichun is well-known in the open-source space as the project leader of OpenResty®, adopted by more than 40 million global website domains.
OpenResty Inc., the enterprise software start-up founded by Yichun in 2017, has customers from some of the biggest companies in the world. Its flagship product, OpenResty XRay, is a non-invasive profiling and troubleshooting tool that significantly enhances and utilizes dynamic tracing technology. And its OpenResty Edge product is a powerful distributed traffic management and private CDN software product.
As an avid open-source contributor, Yichun has contributed more than a million lines of code to numerous open-source projects, including Linux kernel, Nginx, LuaJIT, GDB, SystemTap, LLVM, Perl, etc. He has also authored more than 60 open-source software libraries.
Stap+ is OpenResty Inc’s greatly enhanced version of SystemTap. ↩︎
This is actually the greatly enhanced version of OpenResty Inc.’s eBPF implementation called ORBPF. ↩︎


