Hunting Down a Silent Memory Leak in OpenResty Without a Reboot
Have you ever encountered such a problem in your production environment? A core gateway based on Nginx or OpenResty, with no apparent traffic anomalies, yet its memory usage steadily climbs as if under a spell.
Within just a few days, the memory for a single worker process can surge from hundreds of megabytes to over 1GB, and a system OOM (Out of Memory) alert could be triggered at any moment. The only viable solution often seems to be the “reboot fix,” but for core business operations, this is akin to drinking poison to quench thirst—it offers temporary relief but doesn’t address the root cause. More importantly, you never know when the next crisis will strike. This is a real case we recently handled, involving a high-concurrency API gateway facing the exact same predicament. This article will share how we precisely located and resolved this elusive memory leak problem deep within Nginx, all without restarting the service or impacting business operations.
To resolve this challenge, the key isn’t “which tool to use,” but rather to first establish a clear, verifiable analysis path. We employ a top-down, layered convergence methodology. This approach isn’t for speed, but to achieve certainty in a production environment.
A Complete Dissection of a Production Memory Leak
Step 1: System-Level Observation → Allocator Attribution
First, we begin at the system level to identify the true source of memory growth. By utilizing the guided analysis feature of OpenResty XRay, we automatically analyze high memory issues. The automatic analysis report clearly shows that the Nginx worker process’s memory usage has already exceeded 1GB and continues to grow.
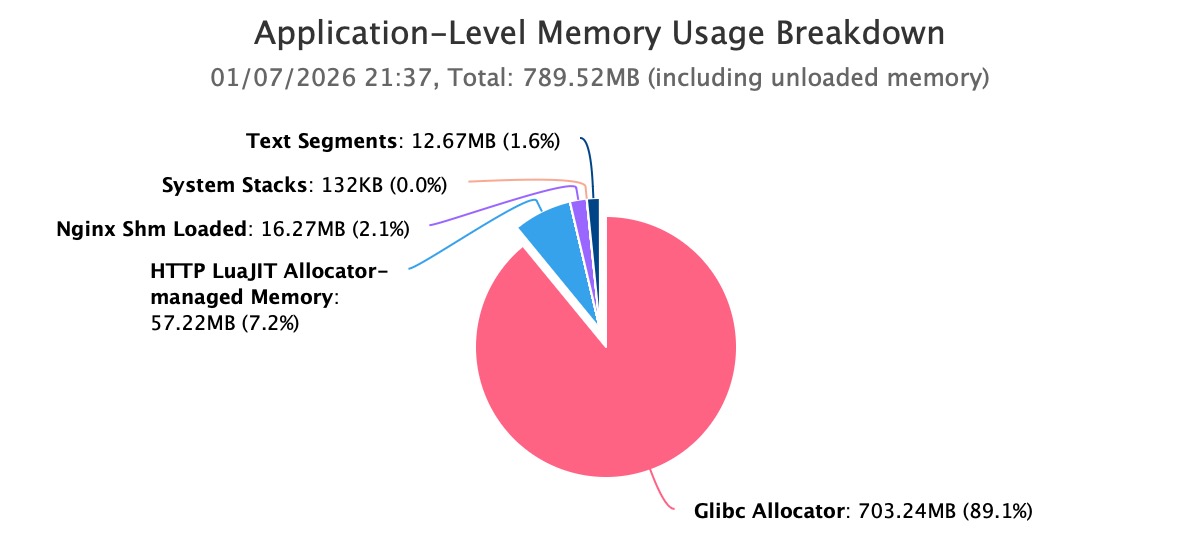
Further analysis reveals that the vast majority of this memory consumption is held by the Glibc Allocator. This step directly eliminates issues related to kernel cache, file systems, or other peripheral components, firmly narrowing the focus to the application process’s own memory allocation behavior.
This conclusion is crucial. It rules out possibilities such as kernel-level leaks, file caching, or external process interference, clearly defining the problem’s scope as the application’s own memory allocation behavior.
Step 2: Allocator Attribution → Focusing on Nginx Memory Pools
Given that memory is primarily held by Glibc and the process is Nginx, it’s highly probable that this memory serves Nginx’s memory pool architecture. The real challenge was to determine which specific Nginx memory pools were consuming the memory managed by Glibc.
Through a dedicated analysis of Nginx memory pools, we quickly identified unusual hotspots.
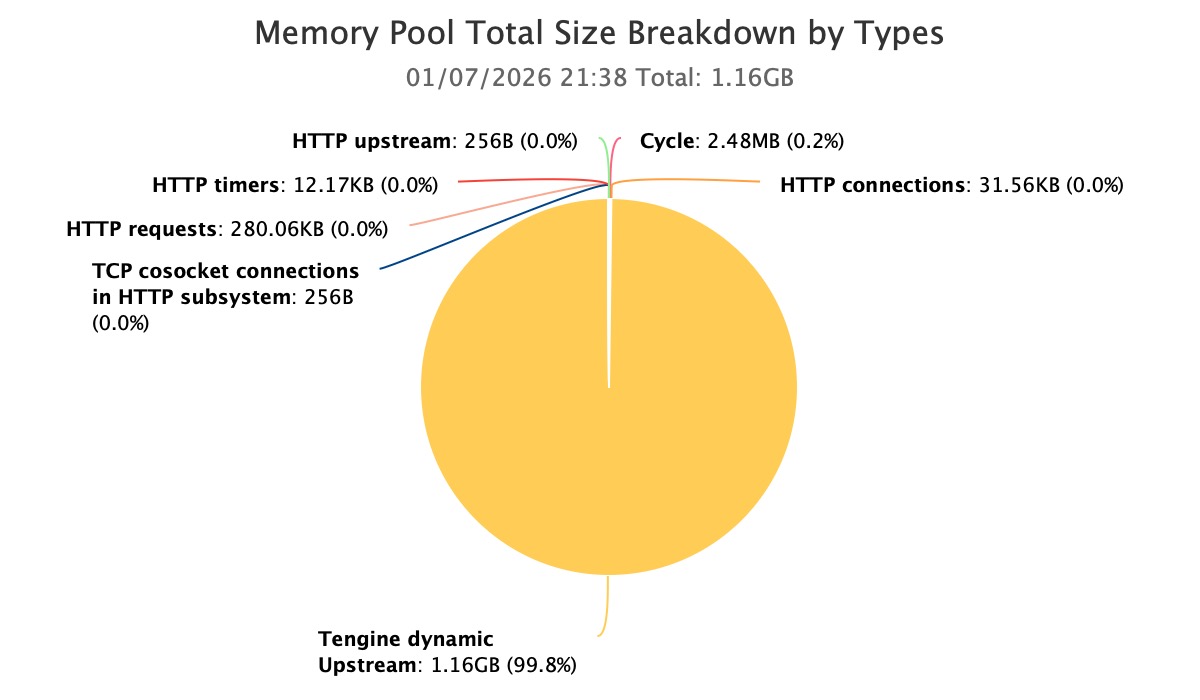
Within the current process, the primary memory consumption originated from Nginx memory pools created by the Tengine dynamic upstream module.
At this juncture, the problem was narrowed down for the first time from “uncontrolled process-level memory” to “abnormal growth in a specific type of memory pool.”
Step 3: Nginx Memory Pool Focus → Pinpointing Module-Level Issues
After confirming that the problem was concentrated in the dynamic upstream memory pool, we further drilled down to the Glibc allocator layer. We then re-ran OpenResty XRay to analyze the memory block size distribution.
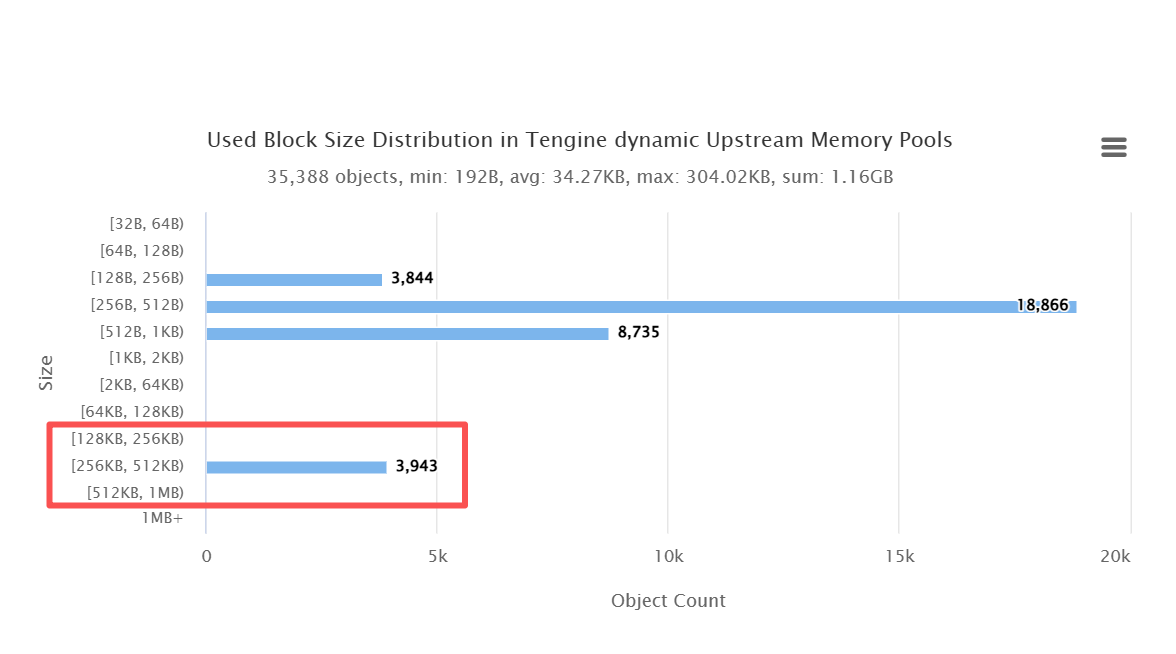
The results were unambiguous: within the 256k–512k range, there were 2240 memory blocks. This quantity significantly deviated from the typical distribution characteristics observed during normal operation. This substantial accumulation of blocks in this size range indicates that these memory objects are not short-lived; instead, they are being held long-term and have not been released.
This discovery provided strong, quantifiable evidence of a memory leak, moving beyond mere empirical judgment.
Step 4: Module-Level Diagnosis → C Code Call Chain Tracing
After identifying the anomalous memory pool and confirming the characteristics of the problematic memory blocks, the final step is to answer the most critical question: on which specific code path were these memory blocks allocated, and why were they ultimately not released?
By utilizing the c-memory-leak-fgraph tool, we comprehensively mapped the memory pool’s allocation behavior back to the C-level function call relationships. This revealed a clear and complete memory leak call chain, starting from the memory allocation point, traversing the module’s logic, and extending to the exact location where its lifecycle should have ended without deallocation.
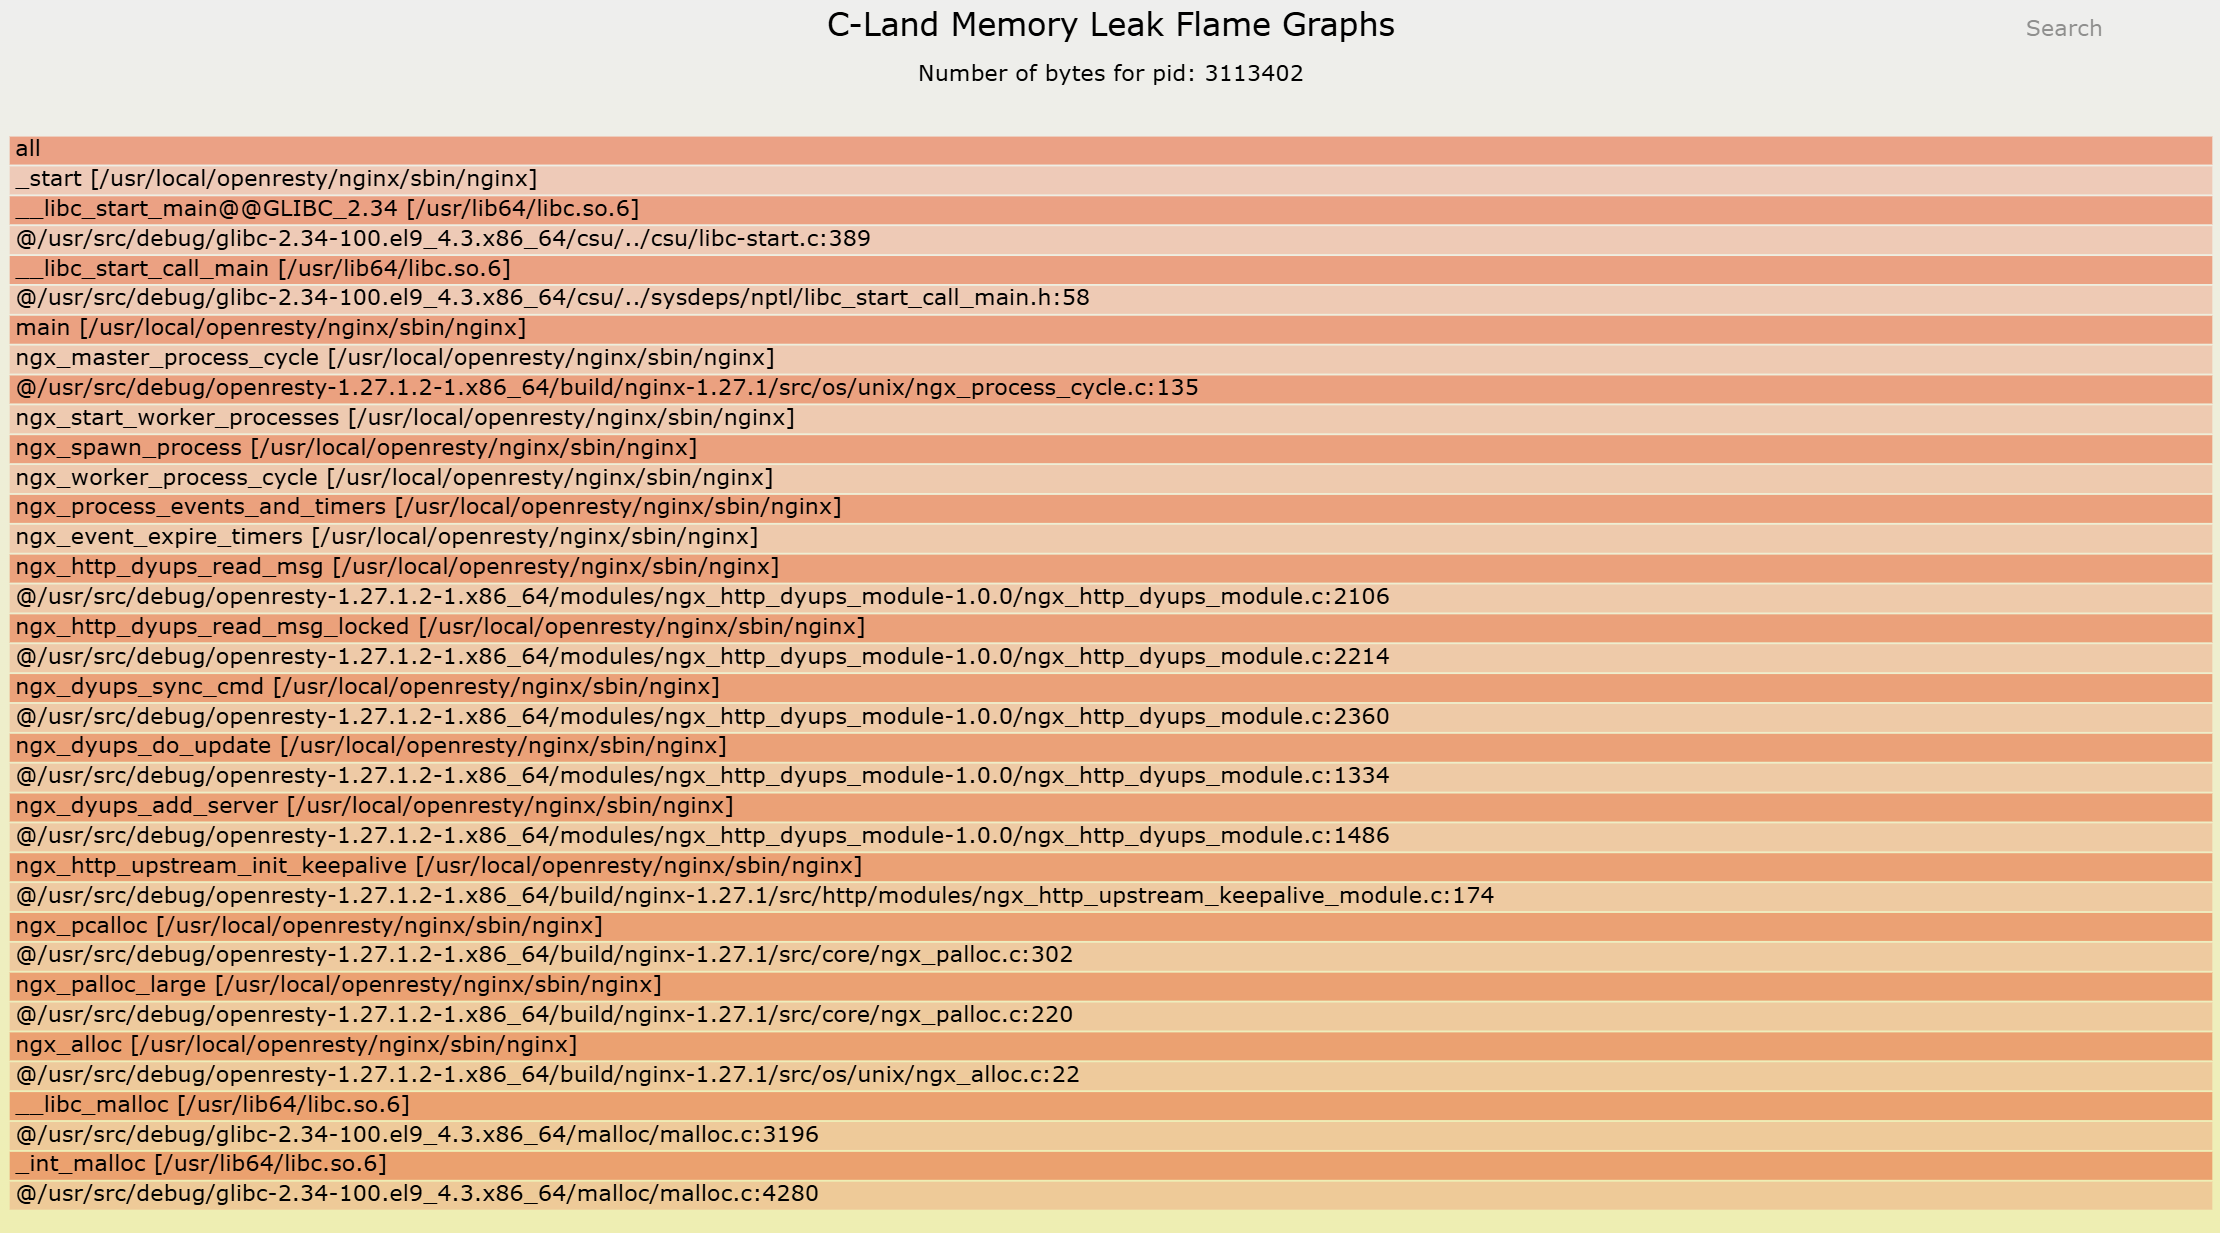
At this moment, the problem is no longer “where it might be,” but “it is definitely happening right here.”
Without restarting or impacting production traffic, completely and accurately pinpoint a memory leak problem deeply embedded within the Nginx memory pool, tracing it back to a verifiable C code call path. We no longer rely on guesswork or temporary fixes like restarting; instead, we possess definitive, verifiable, and fixable evidence.
While this analysis approach itself is not overly complex, it hinges on a strict prerequisite: the ability to safely observe and correlate data across three distinct layers—the Glibc allocator, the Nginx memory pool, and the C code—all within a live production environment.
It is precisely in such real-world and demanding scenarios that the true value of OpenResty XRay’s professional performance engineering capabilities truly shines.
Why Are These Problems Nearly Unsolvable?
Most teams find themselves at a loss when confronting issues of this nature. This isn’t due to a lack of technical expertise, but rather because the problem’s complexity extends beyond the capabilities of conventional tools and knowledge.
1. Nginx Memory Pool: A Black Box
Unlike the familiar malloc/free paradigm, Nginx, for performance optimization, implements its own memory pool. Memory allocation and deallocation are managed internally by Nginx. This design renders traditional memory leak detection tools like valgrind largely ineffective. These tools lack the ability to understand the Nginx memory pool’s lifecycle, and deploying valgrind in a production environment is a highly risky endeavor, leading to devastating performance degradation.
2. Glibc Allocator: The Problem’s Obscuring Layer
Delving deeper, the Nginx memory pool itself is built upon Glibc’s malloc. When a leak occurs, top or pmap will only show an increase in the total memory held by the Glibc allocator. In this particular case, the issue was subtly concealed within numerous 256KB-512KB memory blocks. From an external perspective, it’s impossible to associate these memory blocks with any specific internal Nginx object.
3. The Intricacies of Dynamic Modules
The service in this case leverages Tengine’s dynamic upstream module. A key characteristic of such modules is their complex lifecycle management for internal, long-lived objects. When this intricate logic is coupled with Nginx’s event-driven, asynchronous I/O model, the challenge of tracing memory allocation and deallocation across various code paths and execution times escalates exponentially.
These formidable challenges trap engineers in a cycle of futile attempts: Tweaking the kernel parameter drop_caches? That’s merely a band-aid solution. Increasing worker_rlimit? It only delays the inevitable crash. Ultimately, the only remaining option is the dreaded systemctl restart nginx, a recurring nightmare for the SRE team.
In such moments, engineers often arrive at a stark but helpless consensus: We know there’s a problem, but we can’t pinpoint it. It’s not that we’re unaware of memory growth; rather, we’re clueless as to why it’s growing, and even less certain about how to effectively address it.
From Reactive to Proactive: A System Transformation
The value derived from identifying and resolving this bug extends far beyond mere memory savings. It signifies a fundamental shift, transforming our system from a state of “operating by chance” to one that is “robust and predictable.” Based on our experience, such critical fixes consistently deliver substantial, quantifiable benefits:
Memory & Availability Gains:
- 70-90% Reduction in Memory Footprint: Worker process memory consistently stabilizes at 200-300MB, down from over 1GB.
- Elimination of OOM Crashes: Service availability improves from 99.5% (previously reliant on frequent restarts) to a sustained 99.9%+.
Performance & Cost Efficiencies:
- 50%+ Decrease in Operational Costs: The cessation of alert storms frees SRE teams from unproductive troubleshooting and repetitive restart cycles for memory-related issues.
- Optimized Hardware Expenditure: Lower memory consumption enables future savings of 30-50% on server memory provisioning.
The ultimate impact: This fix effectively disarms a critical “time bomb” that previously posed a risk of tens of thousands of RMB in business losses each month.
When Performance Issues Go Beyond Just “Tools”
This case perfectly illustrates a crucial point: when system complexity surpasses a certain threshold, performance issues are no longer merely “tool-solvable problems.” Instead, they become a comprehensive challenge demanding a blend of “methodology + deep experience.”
Traditional tools often fall short because they are designed for simpler, more generic problems. When confronted with intricate scenarios where Nginx memory pools and Glibc allocators intertwine, what’s truly needed is the profound insight provided by solutions like OpenResty XRay. This insight allows you to delve into the system’s “capillaries” – its most intricate details – coupled with the engineering expertise to diagnose issues without interrupting service.
This also explains why even highly skilled technical teams, when facing stubborn performance bottlenecks, still require the intervention of professional performance engineers. They bring more than just tools; they offer an engineering methodology capable of systematizing and visualizing complex problems.
What is OpenResty XRay
OpenResty XRay is a dynamic-tracing product that automatically analyzes your running applications to troubleshoot performance problems, behavioral issues, and security vulnerabilities with actionable suggestions. Under the hood, OpenResty XRay is powered by our Y language targeting various runtimes like Stap+, eBPF+, GDB, and ODB, depending on the contexts.
About The Author
Yichun Zhang (Github handle: agentzh), is the original creator of the OpenResty® open-source project and the CEO of OpenResty Inc..
Yichun is one of the earliest advocates and leaders of “open-source technology”. He worked at many internationally renowned tech companies, such as Cloudflare, Yahoo!. He is a pioneer of “edge computing”, “dynamic tracing” and “machine coding”, with over 22 years of programming and 16 years of open source experience. Yichun is well-known in the open-source space as the project leader of OpenResty®, adopted by more than 40 million global website domains.
OpenResty Inc., the enterprise software start-up founded by Yichun in 2017, has customers from some of the biggest companies in the world. Its flagship product, OpenResty XRay, is a non-invasive profiling and troubleshooting tool that significantly enhances and utilizes dynamic tracing technology. And its OpenResty Edge product is a powerful distributed traffic management and private CDN software product.
As an avid open-source contributor, Yichun has contributed more than a million lines of code to numerous open-source projects, including Linux kernel, Nginx, LuaJIT, GDB, SystemTap, LLVM, Perl, etc. He has also authored more than 60 open-source software libraries.
Related Articles
OpenResty XRay Jul 16, 2025

OpenResty XRay Dec 23, 2025

OpenResty XRay Sep 1, 2025

OpenResty XRay Jul 8, 2025

OpenResty XRay Jul 15, 2023


