How to use OpenResty XRay to quickly pinpoint memory leaks in C++ process
At critical junctures, the stability of core services directly impacts business success or failure. Recently, one of our clients encountered a persistent issue that gave their operations team a major headache: the Nginx service’s memory usage was ballooning uncontrollably, much like a “black hole” devouring resources. While temporary restarts offered brief relief, the problem always resurfaced. In this article, we will share how to leverage OpenResty XRay to swiftly discover and pinpoint this elusive memory leak. We’ll also demonstrate how to transform the complex and time-consuming memory leak troubleshooting process into a repeatable, closed-loop methodology of “diagnose → plan → verify.”
Technical Predicament and Initial Diagnosis
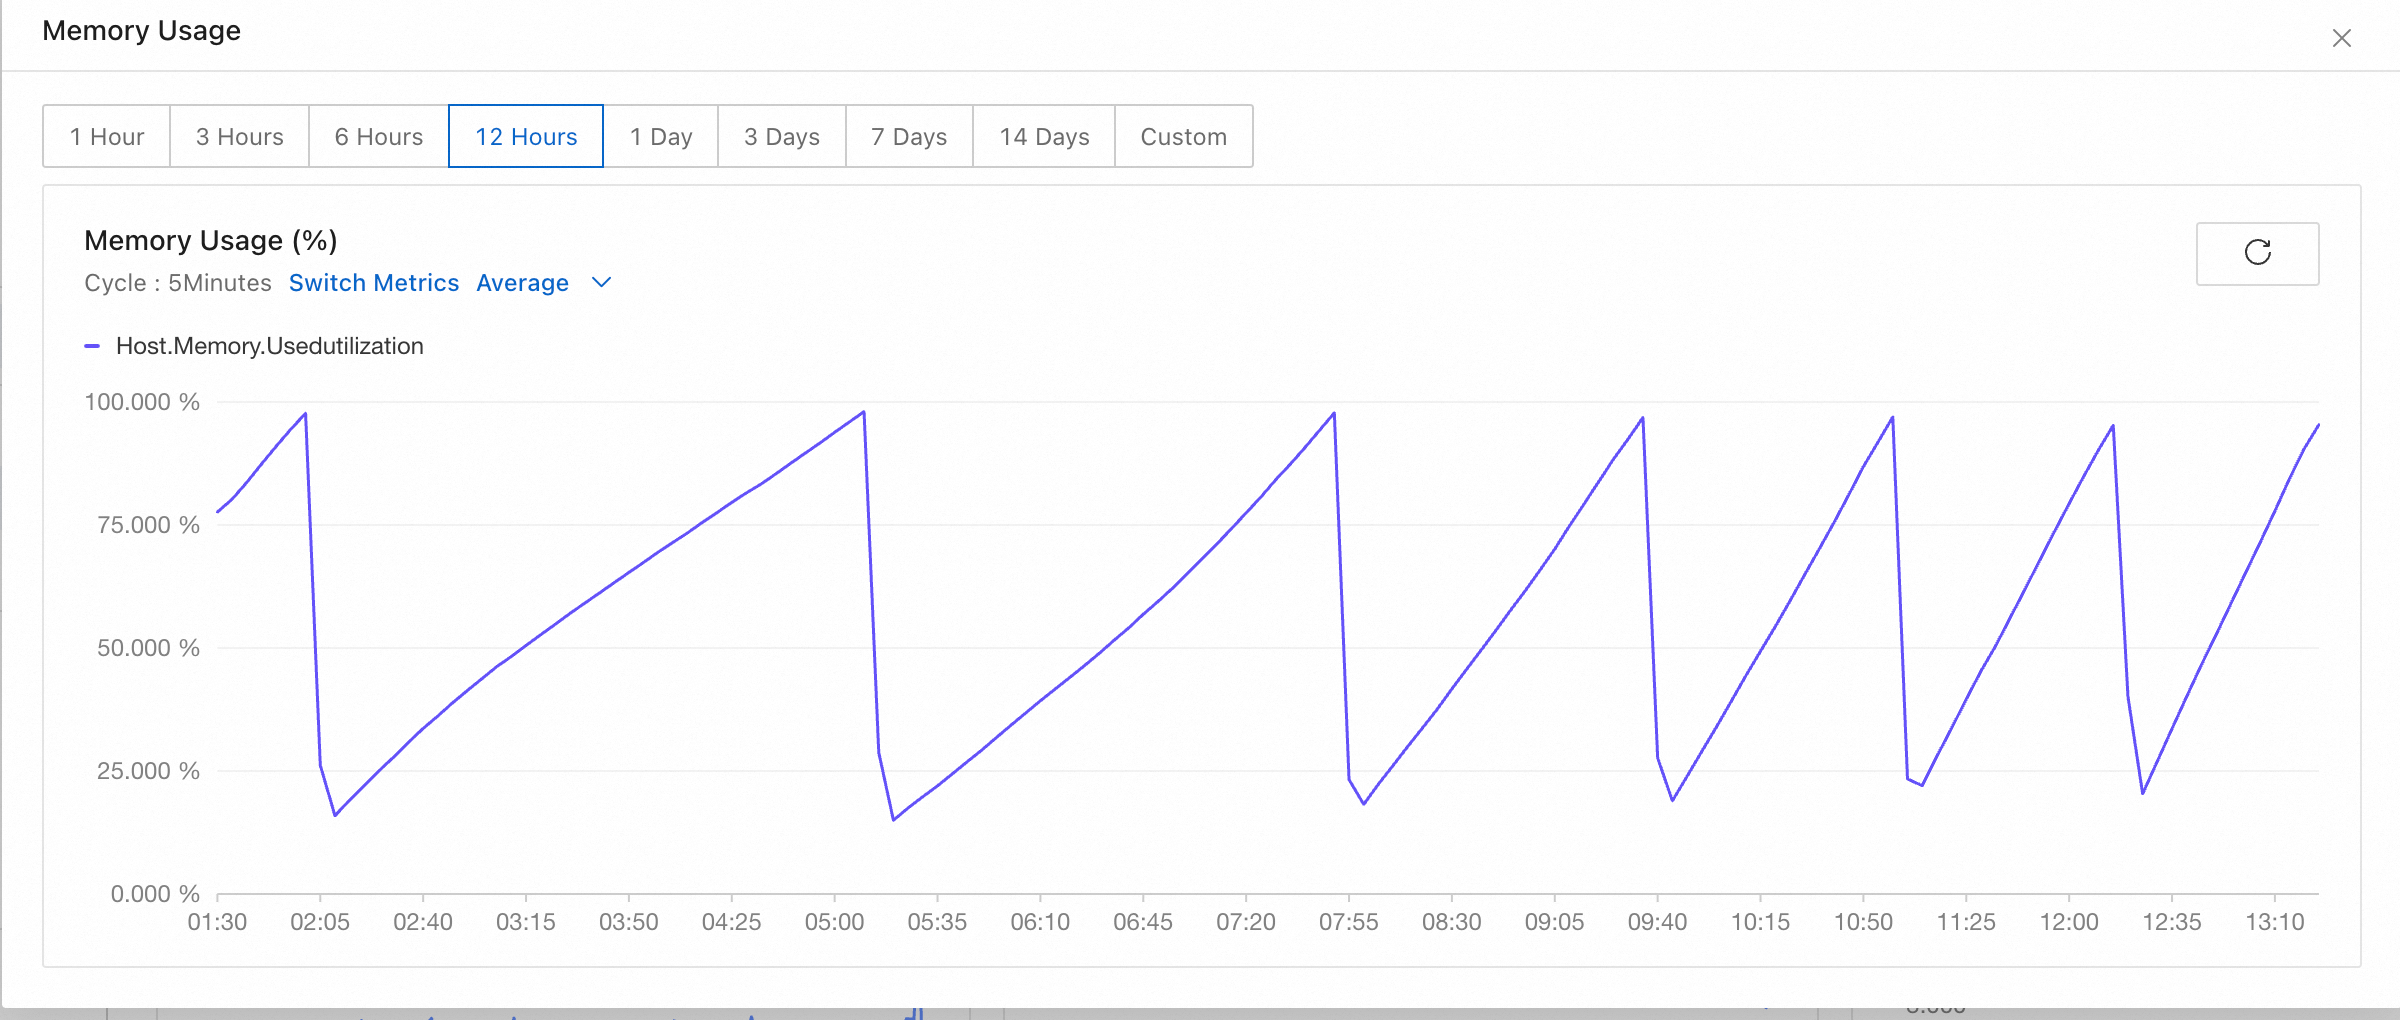
One of our clients’ core Nginx services experienced continuously rising memory usage, akin to a “memory black hole.” Although temporary restarts offered brief relief, the problem quickly resurfaced.
Challenges and Risks:
- Technical Perspective: A C/C++ process memory leak in a production environment is notoriously one of the most challenging issues to resolve. Traditional debugging tools (like GDB) cannot be directly deployed on live systems, and code auditing is akin to finding a needle in a haystack—time-consuming and inefficient.
- Business Impact: If left unaddressed, memory consumption would continue to escalate, leading to slow responses, frequent crashes, and ultimately jeopardizing core business continuity. This would result in: degraded user experience, gradual user churn, damage to brand reputation, and direct economic losses.
Relying on scheduled restarts to “keep the system alive” is merely a stopgap measure, akin to drinking poison to quench thirst, leaving the entire business perpetually exposed to risk. Upon receiving the request for assistance, we immediately utilized our dynamic tracing product, OpenResty XRay, to directly analyze memory allocation in the production environment. Within minutes, the tool automatically generated a memory leak flame graph, providing a clear breakthrough for troubleshooting the issue.
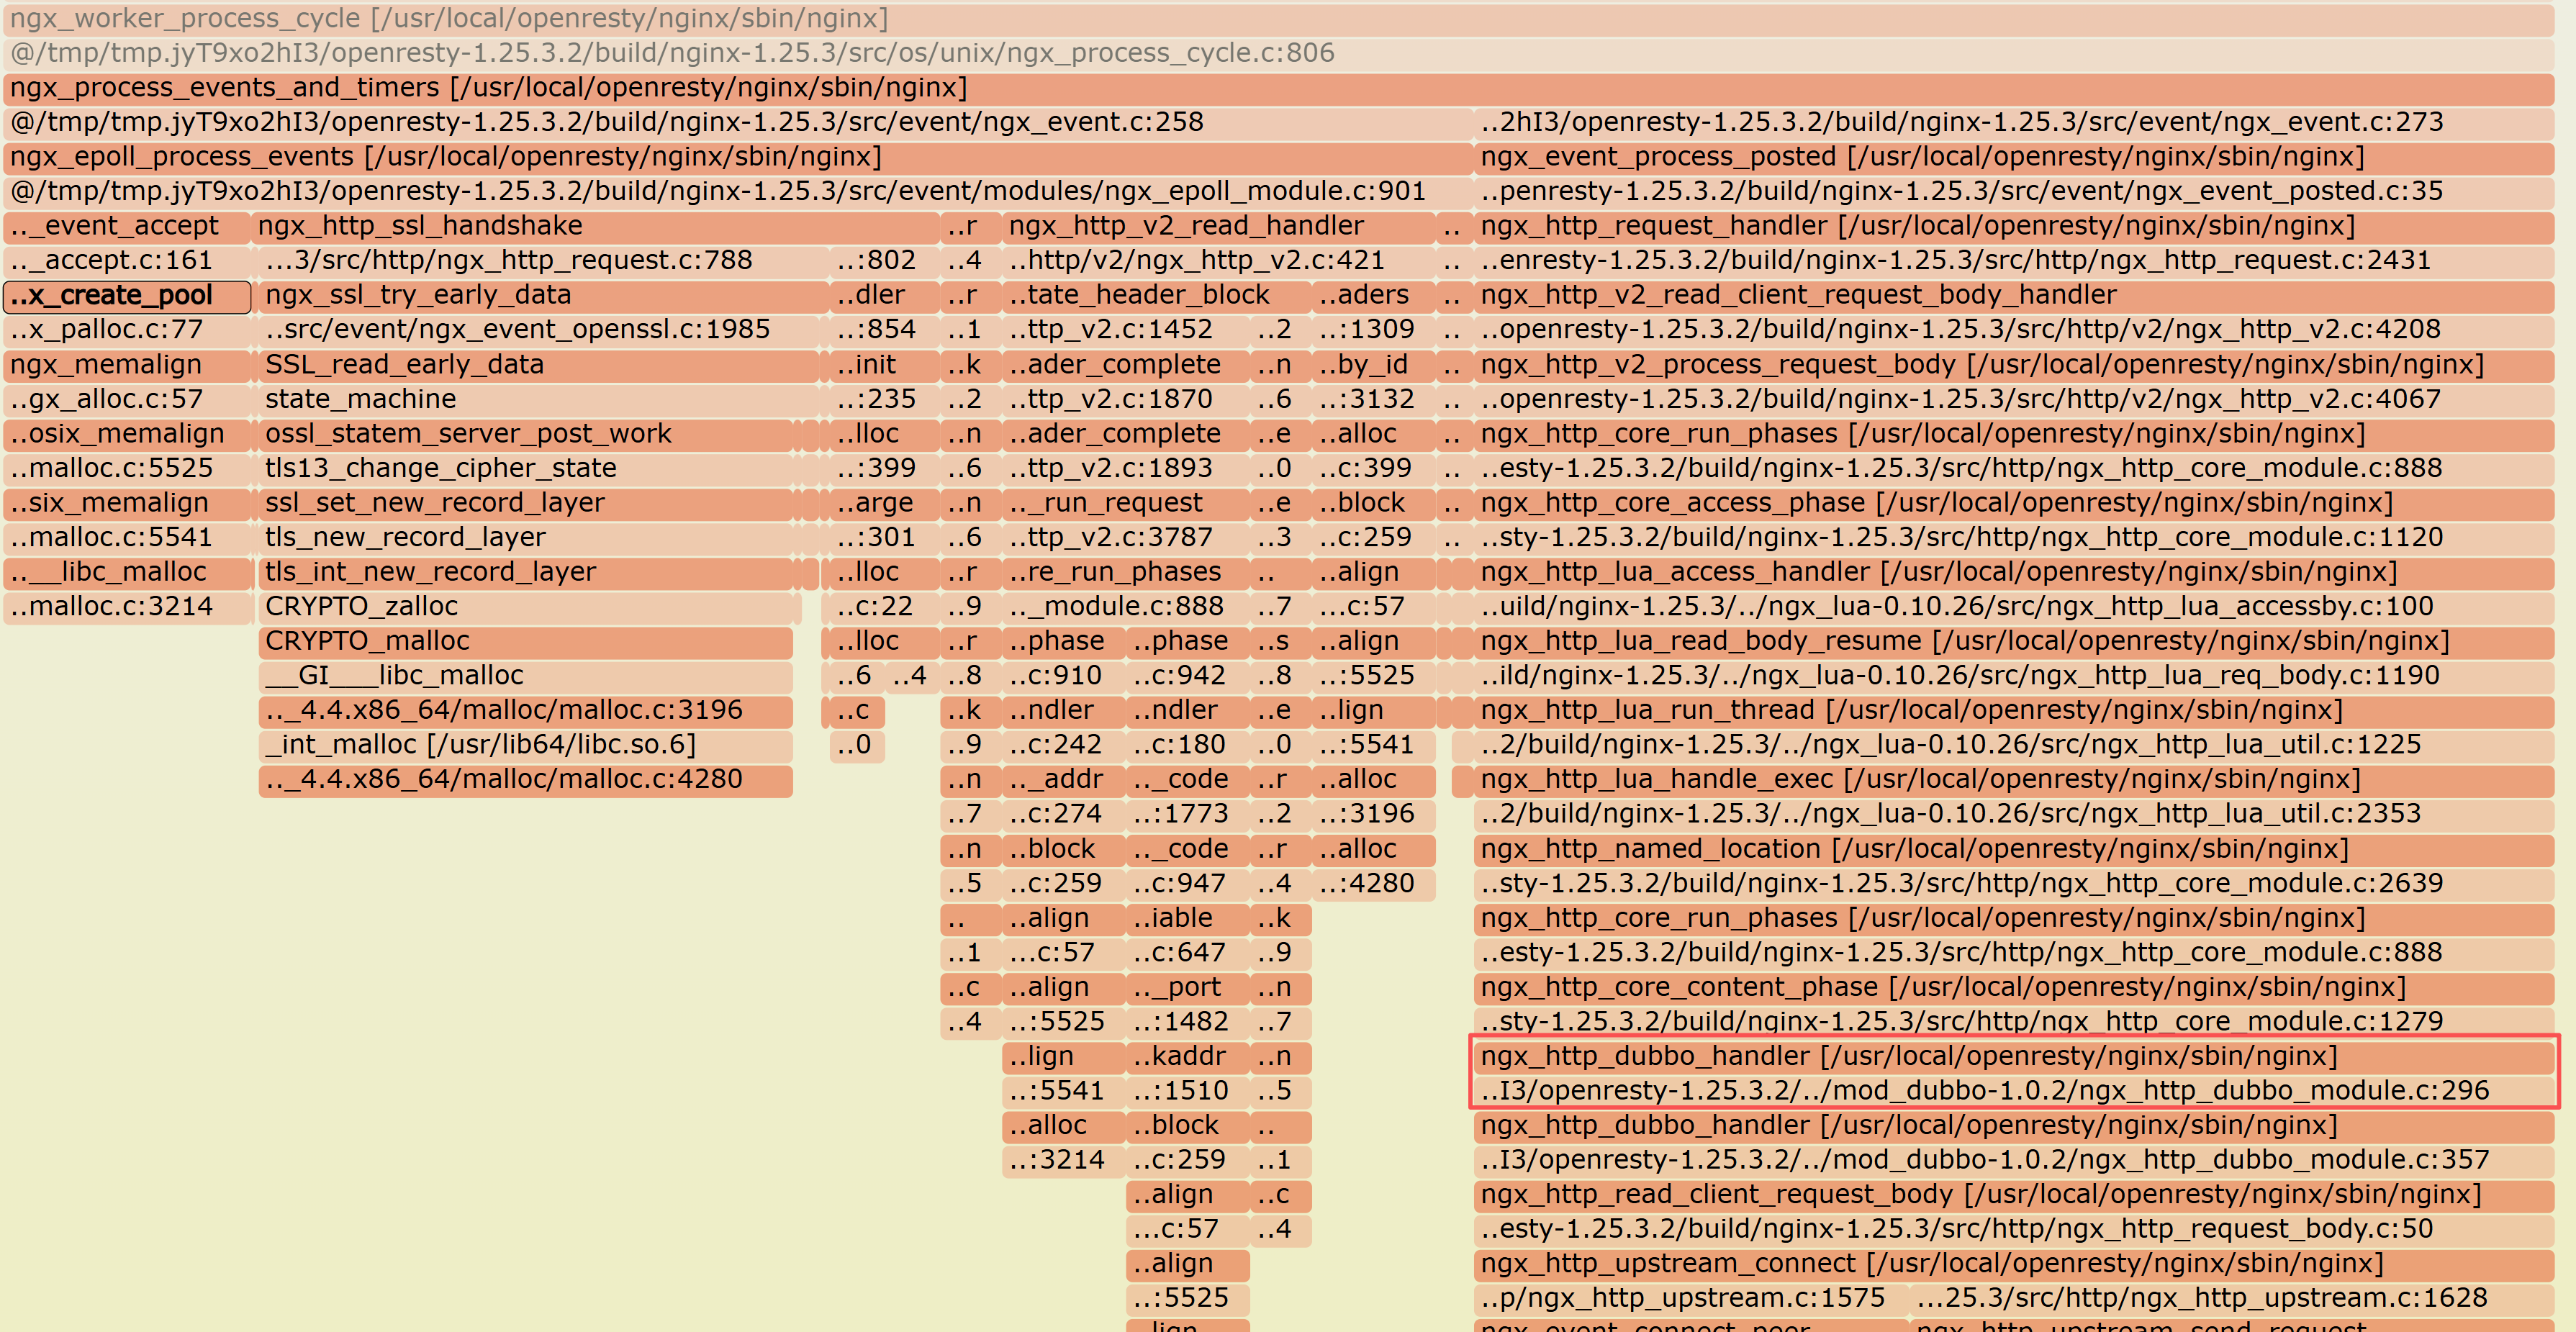
The flame graph clearly illustrated that memory allocation was primarily concentrated in three areas:
- Nginx memory pool
- TLS-related memory
ngx_dubbo_modulefunction
Both the Nginx memory pool and TLS are well-established, mature components with an extremely low probability of memory leaks. Therefore, we swiftly narrowed our analysis to the most suspect component: the ngx_dubbo_module function.
Flame Graphs: Pinpointing Memory Leak Hotspots
Step One: Identify the Culprit Function.
Leveraging the powerful dynamic tracing capabilities of OpenResty XRay, we can efficiently dissect problems with surgical precision, eliminating the need to sift through massive logs or conduct exhaustive code audits. Our focus then narrows down to the most suspect ngx_dubbo_module function.
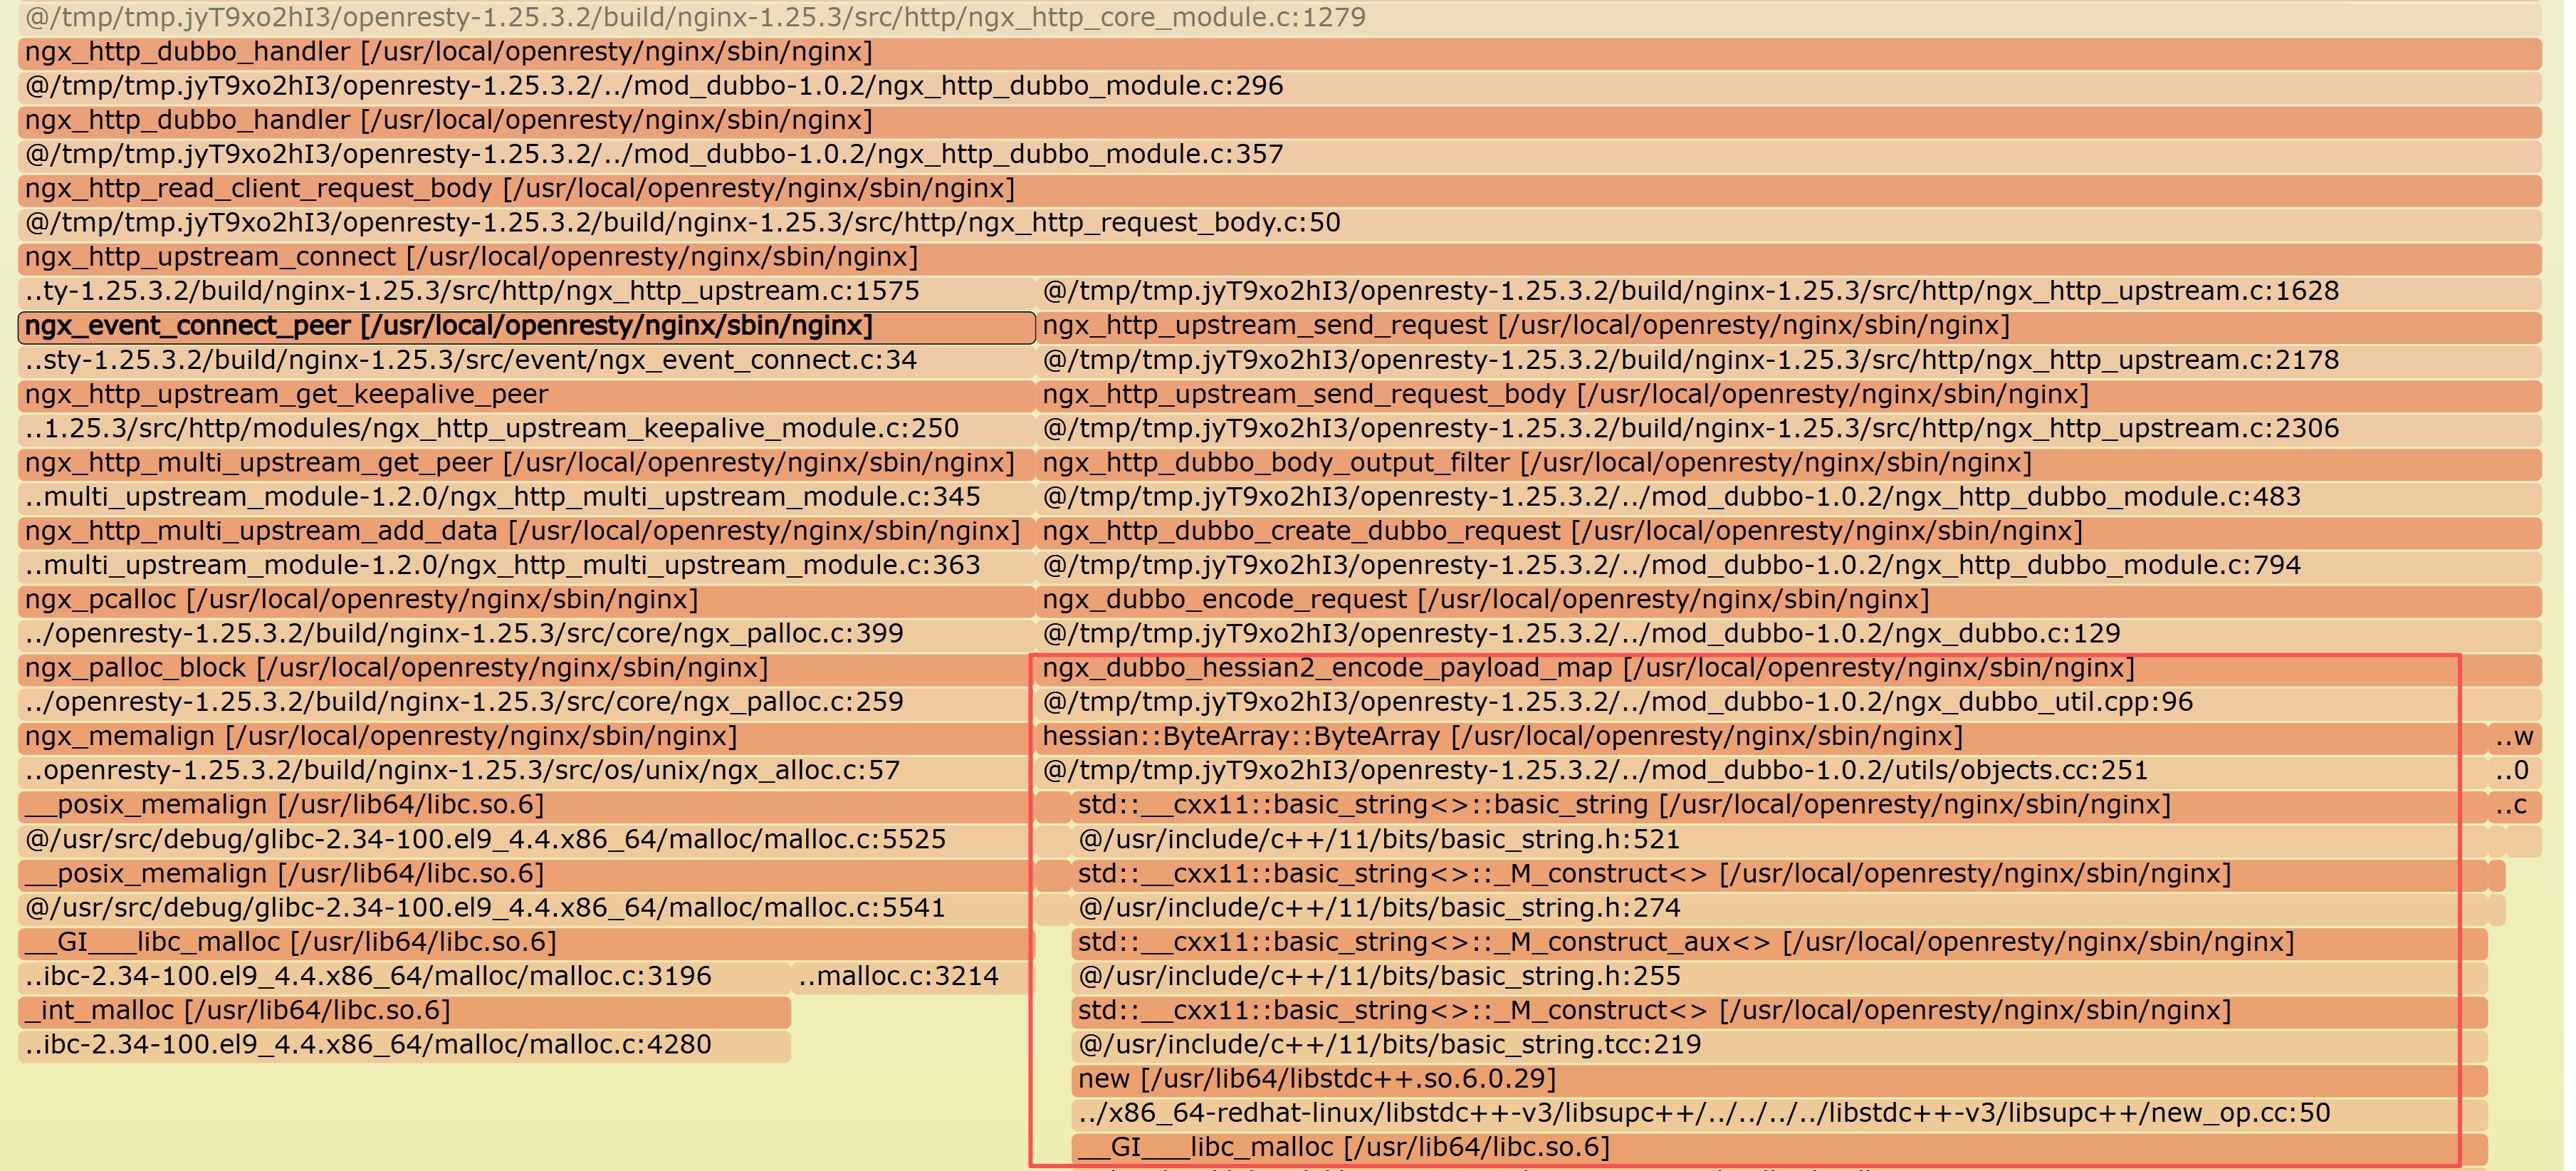
The memory leak flame graph clearly indicates that the peak of memory allocation points directly to the ngx_dubbo_hessian2_encode_payload_map function, marking it as the primary hotspot for the memory leak.
Step 2: Delving into the Code to Uncover Anomalies.
Leveraging the flame graph, we directly pinpointed the most suspect function. Upon deeper examination of its source code, we quickly identified the core issue: during data processing, the code would specifically allocate a new block of memory to store a portion of the content.
However, after reviewing the entire processing flow, we found no operation to release this memory block. Our intuition strongly suggested this was the source of the problem. This newly allocated memory, once encapsulated, was then passed to subsequent modules for processing. The critical question arose: who was truly responsible for managing its lifecycle?
Step 3: Tracing the Clues to Unveil the Truth.
To fully understand the situation, we traced the propagation path of this memory block within the subsequent modules. We discovered that the module receiving this memory block possessed its own memory reclamation mechanism, designed to automatically clean up objects no longer in use.
The crux of the problem lay in how an object’s management status was communicated to this mechanism. In the customer’s specific scenario, when this memory block was passed in, due to its unique creation method, it was mistakenly marked as “not to be managed by this module.” This effectively instructed the reclamation mechanism: “This memory block is handled externally; no action is required from you.” Yet, in reality, no other entity was designated to release it.
Consequently, due to this erroneous signal, the automatic reclamation mechanism completely bypassed this memory block. As requests continued to flood in, countless such memory blocks were allocated but never released, resulting in a significant memory leak. We used the flame graph to directly pinpoint the exact code line within the memory allocation function and clearly articulated why this block failed to be automatically reclaimed. Based on this precise insight, the customer quickly confirmed the fundamental cause of the memory leak through analysis of the relevant source code.
From Reactive to Proactive: XRay’s New Approach to Troubleshooting
In the pursuit of system stability, many teams find themselves caught in a vicious cycle: to solve problems, they collect more data for more clues; to collect more data, they add more monitoring metrics, build more complex dashboards, and invest huge budgets in additional monitoring tools. The result is an overwhelming amount of fragmented information, with data proliferating while the signal-to-noise ratio plummets. Engineers are left sifting through a “data graveyard,” searching for valuable insights like prospectors panning for gold.
The fundamental flaw of this model is its failure to adequately connect technical problems, such as memory leaks, with their true business costs:
- A memory leak alert, seemingly just a fluctuation in technical metrics, actually represents a significant drain on engineers’ valuable time.
- A frequent production incident not only threatens system stability but also carries the potential for business disruption.
- Continuous, high monitoring investment often fails to yield commensurate actionable insights.
Ultimately, the issue isn’t “too little data,” but “too few useful answers.” A truly efficient observability tool should act like a “scalpel,” directly pinpointing the root cause of a problem, rather than handing teams another “shovel” and forcing them to endlessly dig through data day and night. This is precisely the core challenge that the next-generation observability platform aims to solve:
- Moving from surface-level metrics to causal chains
- Shifting from passive alerts to active analysis and insights
- Evolving from consuming human resources to truly unlocking R&D productivity
The OpenResty XRay Closed-Loop Approach
In this context, OpenResty XRay introduces a transformative methodology: converting complex, time-consuming processes into a repeatable, self-sustaining cycle. We define this as “Diagnose → Plan → Verify”.
- Pinpoint Accuracy: Traditional methods often involve “sifting through more data, hoping to find a clue.” XRay’s approach is fundamentally different. Utilizing advanced visualization tools like flame graphs, it directly identifies the problem’s location, enabling teams to uncover the root cause within minutes. It delivers not just more monitoring metrics, but critical, actionable insights that drive immediate resolution.
- Evidence-Based Solutioning: When a problem is precisely traced to a specific line of code or a particular C/C++ process, the remediation plan becomes direct and targeted. Teams can bypass iterative trial and error, instead formulating clear, effective action steps based on irrefutable evidence.
- Instant Validation for a Complete Cycle: After a fix is deployed, XRay can re-analyze the system to confirm the issue has been thoroughly resolved. This rapid validation mechanism ensures a truly closed-loop process: diagnosis, action, and verification are seamlessly integrated.
The value derived from this closed-loop capability extends far beyond resolving individual bugs:
- Technical Empowerment: It empowers teams to non-invasively gain deep insights into C/C++ processes within production environments, simplifying and visualizing inherently complex issues.
- Strategic Business Impact:
- Enhanced Business Stability: Proactively eliminates potential failures, ensuring robust service high availability.
- Accelerated R&D Efficiency: Frees engineers from tedious, inefficient debugging cycles, allowing them to focus on higher-value business innovation.
- Optimized Resource Utilization: Prevents over-provisioning of resources due to unidentified performance bottlenecks, leading to genuine cost control.
In an era of data overload, technical teams no longer need just more monitoring dashboards. What they truly require is a smarter, more dependable approach to quickly identify and resolve problems. This, fundamentally, is the true power of observability.
What is OpenResty XRay
OpenResty XRay is a dynamic-tracing product that automatically analyzes your running applications to troubleshoot performance problems, behavioral issues, and security vulnerabilities with actionable suggestions. Under the hood, OpenResty XRay is powered by our Y language targeting various runtimes like Stap+, eBPF+, GDB, and ODB, depending on the contexts.
About The Author
Yichun Zhang (Github handle: agentzh), is the original creator of the OpenResty® open-source project and the CEO of OpenResty Inc..
Yichun is one of the earliest advocates and leaders of “open-source technology”. He worked at many internationally renowned tech companies, such as Cloudflare, Yahoo!. He is a pioneer of “edge computing”, “dynamic tracing” and “machine coding”, with over 22 years of programming and 16 years of open source experience. Yichun is well-known in the open-source space as the project leader of OpenResty®, adopted by more than 40 million global website domains.
OpenResty Inc., the enterprise software start-up founded by Yichun in 2017, has customers from some of the biggest companies in the world. Its flagship product, OpenResty XRay, is a non-invasive profiling and troubleshooting tool that significantly enhances and utilizes dynamic tracing technology. And its OpenResty Edge product is a powerful distributed traffic management and private CDN software product.
As an avid open-source contributor, Yichun has contributed more than a million lines of code to numerous open-source projects, including Linux kernel, Nginx, LuaJIT, GDB, SystemTap, LLVM, Perl, etc. He has also authored more than 60 open-source software libraries.
Related Articles
OpenResty XRay Apr 4, 2024

OpenResty XRay Jun 27, 2023

OpenResty XRay Dec 23, 2025

OpenResty XRay Dec 4, 2025

OpenResty XRay Nov 18, 2025


