Introduction to Lua-Land CPU Flame Graphs
Check out how OpenResty XRay helps organizations troubleshoot issues and optimize the performance of their applications.
 Learn More
LIVE DEMO
Learn More
LIVE DEMOLua code running inside OpenResty or Nginx servers is very common nowadays since people want both performance and flexibility out of their nonblocking web servers. Some people use Lua for very simple tasks like checking and modifying certain request headers and response bodies while other people use Lua to build very complicated web applications, CDN software, and API gateways. Lua is known for its simplicity, small memory footprint, and high execution efficiency, especially when using Just-in-Time (JIT) compilers like LuaJIT. But still some times the Lua code running atop OpenResty or Nginx servers may consume too much CPU resources due to the programmer’s coding mistakes, calling out to some expensive C/C++ library code, or some other reasons.
The best way to quickly find all the CPU performance bottlenecks in an online OpenResty or Nginx instance is the Lua-land CPU flame graph sampling tool as provided by the OpenResty XRay product. It does not require any changes to the target OpenResty or Nginx processes nor have any noticeable impact to the processes in production.
This article will introduce the idea of Lua-land CPU flame graphs and use OpenResty XRay to produce real flame graphs for several small and standalone Lua examples. We choose small examples because it is much easier to predict and verify the profiling results. The same idea and tools do apply equally well to those most complex Lua applications in the wild. And we have had many successes in using this technique and visualization to help our enterprise customers with very busy sites and applications in the past few years.
What is a Flame Graph
Flame graphs are a visualization method invented by Brendan Gregg for showing how a system resource or a performance metric is quantitatively distributed across all the code paths in the target software.
The system resource or metric could be CPU time, off-CPU time, memory usage, disk usage, latency, or any other things you can imagine.
The code paths here are defined by the backtraces in the target software’s code. A backtrace
is usually a stack of function call frames as in the output of the bt GDB
command and in an exception error message of a Python or Java program. For example,
below is a Lua program’s backtrace sample:
C:ngx_http_lua_ngx_timer_at
at
cache.lua:43
cache.lua:record_timing
router.lua:338
router.lua:route
v2_routing.lua:1214
v2_routing.lua:route
access_by_lua.lua:130
In this sample, the Lua stack grows from the base frame access_by_lua.lua:130 all the way to the top frame C:ngx_http_lua_ngx_timer_at. It clearly shows how various different Lua or C functions call each other, forming an approximate representation of “code path”.
When we say “all code paths”, we actually mean it from a statistical perspective instead of literally iterating through every single code path in a program. Obviously the latter would be prohibitively expensive to do in reality due to combinatorial explosions. We just make sure all code paths with nontrivial overhead are showing up in our graphs and we can identify their cost quantitatively with good enough confidence.
In this article we just focus on the type of flame graphs which show how the CPU time (or CPU resources) is quantitatively distributed across all the Lua code paths in a target OpenResty or Nginx process (or processes), hence the name “Lua-Land CPU Flame Graphs”.
The header picture of this article shows a sample flame graph and we will see several more in later parts of this post.
Why Flame Graphs
Flame Graphs are a great way to show the “big picture” of all the bottlenecks quantitatively in a single small graph, no matter how complex the target software is.
Traditional profilers would usually throw a ton of details and numbers at the user’s face. And the user may lose insight of the whole picture and go through rabbit holes for things that do not really matter. Another drawback of traditional profilers is that they just give you latencies of all the functions while it’s hard to see the contexts of these function calls, not to mention the user also has to distinguish the exclusive time and inclusive time of a function call.
On the other hand, Flame Graphs can squeeze a great deal of information very compactly into a limited size graph (usually fit in a single screen). Code paths which do not matter fade out naturally while code paths truly important would stand out. No more, no less, just the right amount of information for the user.
How to read a Flame Graph
Flame Graphs might be a bit tricky to read for a newcomer. But with a little guidance the user would find it so intuitive to understand. A Flame Graph is two-dimensional graph. The y-axis shows the code (or data) context, i.e., the backtraces of the target programming language while the x-axis shows how much percentage of the system resource a particular backtrace takes. The full x-axis usually means 100% of the system resource (like the CPU time) spent on the target software. The order of backtraces along the x-axis usually do not matter since they are usually simply sorted by function frame names alphabetically. There are exceptions however, where I invented a type of Time-Series Flame Graphs where the x-axis actually means the time axis instead and the order of backtraces are in the time order. For this article, we only care about the classic type of flame graphs where the order along the x-axis does not matter at all.
The best way to learn how to read a flame graph is to read sample flame graphs. We will see several examples below with detailed explanation for OpenResty and Nginx’s Lua applications.
Simple Lua samples
In this section, we will consider several simple Lua samples with obvious performance characteristics and we will use OpenResty XRay to profile the real nginx processes to show Lua-land CPU Flame Graphs and verify the performance behaviors in the graphs. We will check different cases like with and without JIT compilation enabled for the Lua code, as well as Lua code calling into external C library code.
JIT compiled Lua code
We will first investigate a Lua sample program with JIT compilation enabled (which is enabled by default in LuaJIT).
Let’s consider the following standalone OpenResty application. We will use this example throughout this section with minor modifications for different cases.
We first prepare the applications’ directory layout:
mkdir -p ~/work
cd ~/work
mkdir conf logs lua
And then we create the conf/nginx.conf configuration file as follows:
master_process on;
worker_processes 1;

events {
    worker_connections 1024;
}

http {
    lua_package_path "$prefix/lua/?.lua;;";

    server {
        listen 8080;

        location = /t {
            content_by_lua_block {
                require "test".main()
            }
        }
    }
}
Here we load the external Lua module named test and immediately calls its
main function in our Lua handler for the location /t. We use the lua_package_path
directive to add the lua/ directory into the Lua module search paths since
we will shortly put the aforementioned test Lua module into lua/.
The test Lua module is defined in the lua/test.lua file as follows:
local _M = {}

local N = 1e7

local function heavy()
    local sum = 0
    for i = 1, N do
        sum = sum + i
    end
    return sum
end

local function foo()
    local a = heavy()
    a = a + heavy()
    return a
end

local function bar()
    return (heavy())
end

function _M.main()
    ngx.say(foo())
    ngx.say(bar())
end

return _M
Here we define a computation-heavy Lua function, heavy(), which computes the
sum of numbers from 1 to 10 million (1e7). Then we call this heavy() function
twice in function foo() and just once in function bar(). Finally, the module
entry function _M.main() calls foo and bar just for once in turn and print
out their return values respectively to the HTTP response body via ngx.say.
Intuitively, for this Lua handler, the foo() function would takes exactly
twice of the CPU time taken by the bar() function because foo() calls heavy()
twice while bar() only calls heavy() once. We can easily verify this observation
in the Lua-land CPU flame graphs sampled by OpenResty XRay below.
Because we did not touch LuaJIT’s JIT compiler settings in this example, the JIT compilation is turned on by default since modern OpenResty platform versions always use LuaJIT anyway (the support for the standard Lua 5.1 interpreter has been removed for long).
Now we can start this OpenResty web application like this:
cd ~/work/
/usr/local/openresty/bin/openresty -p $PWD/
assuming OpenResty is installed under /usr/local/openresty/ in the current system (which is the default installation location).
To make this OpenResty application busy, we can use tools like ab and weighttp
to load the URI http://localhost:8080/t or the load generator provided by
the OpenResty XRay product. Either way, while the target OpenResty applications'
nginx worker process is busy, we can get the following Lua-land CPU flame graph
in OpenResty XRay’s web console:
From this graph we can make the following observations:
All Lua backtraces in this graph stem from the same entry point,
content_by_lua(nginx.conf:24), which is expected.There are mainly two code paths shown in the graph, which are
content_by_lua -> test.lua:main -> test.lua:bar -> test.lua:heavy -> trace#2:test.lua:8and also
content_by_lua -> test.lua:main -> test.lua:foo -> test.lua:heavy -> trace#2:test.lua:8The only difference in these two code paths are
foovsbar. This is also expected.The left-hand-side code path involving
baris just half as wide as the right-hand-side code path involvingfoo. In other words, their width ratio along the x-axis is 1:2, which means that thebarcode path takes only 50% of the time taken byfoo. By putting your mouse onto thetest.lua:barframe (or box) in the graph, we can see that it takes 33.3% of the total samples (or total CPU time) while thetest.lua:fooframe shows 66.7%. Obviously it is very accurate as compared to our predictions even though it takes a sampling and statistical approach.We did not see other code paths like
ngx.say()in the graph since such code paths simply take too little CPU time as compared to the two dominating Lua code paths involvingheavy(). Trivial things are simply noises which won’t catch our attention in the flame graph. We always focus on really important things and cannot get distracted.The top frames for both code paths (or backtraces) are the same, which is
trace#2:test.lua:8. This is not a really Lua function call frame, but rather a pseudo frame indicating that it is running a JIT compiled Lua code path which is called “trace” in LuaJIT’s terminology (because LuaJIT is a tracing JIT compiler). And this “trace” has the ID number 2 and the compiled Lua code path starting from the Lua source code line 8 of thetest.luafile.test.lua:8is this Lua code line:sum = sum + i
It is wonderful to see our noninvasive sampling tool can get such accurate flame
graphs from a standard binary build of OpenResty without any extra modules,
modifications, or special build flags. The tool does not use any special features
or interfaces of the LuaJIT runtime at all, not even the LUAJIT_USE_PERFTOOLS
feature or its built-in profiler. Instead it uses advanced dynamic tracing
technologies which simply read the information already available in the target
process itself. And we are able to get good enough information even from JIT
compiled Lua code.
Interpreted Lua code
Interpreted Lua code can usually result in perfectly accurate backtraces and flame graphs. If the sampling tool can handle JIT-compiled Lua code just fine, then it can only do a better job when dealing with interpreted Lua code. One interesting thing about LuaJIT’s interpreter is that the interpreter is written almost completely in hand-crafted assembly code (of course, LuaJIT introduces its own assembly language syntax named DynASM).
For our continuing Lua example, we simply add the following nginx.conf snippet
inside the server {} configuration block:
init_by_lua_block {
    jit.off()
}
And then reload or restart the server processes and still keep the traffic load.
This time we get the following Lua-land CPU flame graph:
This graph is very similar to the previous one in that:
- We are still only seeing two main code paths, the
barone and thefooone. - The
barcode path still takes approximately one third of the total CPU time and thefooone still takes almost all the remaining part (i.e., about two-thirds). - The entry point for all the code paths shown in the graph is the
content_by_luathing.
This graph still has an important difference, however: the tips of the code
paths (or backtraces) are no longer “traces”. This is expected since no JIT
compiled Lua code paths are possible this time. The tips or top frames are now
C function frames like lj_BC_IFORL and lj_BC_ADDVV. These C functions frames marked by the C: prefix
are actually not C functions per se. Instead they are assembly code frames corresponding
to LuaJIT byte code interpretation handlers specially annotated by symbols like
lj_BC_IFORL. Naturally, lj_BC_IFORL is for the LuaJIT byte code instruction
IFORL while lj_BC_ADDVV is for the byte code instruction ADDVV. The IFORL
is for interpreted Lua for loops while ADDVV is for arithmetic additions.
All these are expected according to our Lua function heavy(). There are also
some auxiliary assembly routines like lj_meta_arith and lj_vm_foldarith.
By looking at the percentage numbers for these function frames, we can also understand how the CPU time is distributed across inside the LuaJIT virtual machine and interpreter, paving the way to optimize the VM and the interpreter themselves.
Calling external C/C++ functions
It is very common for Lua code to invoke external C/C++ library functions. We also want to see their proportional parts in the Lua-land CPU flame graphs, because such C function calls are initiated from within the Lua code anyway. This is also where dynamic-tracing-based profiling really shines where such external C function calls would never become the blind spots for the profiler1.
Let’s modify the heavy() Lua function in our ongoing example as follows:
local ffi = require "ffi"
local C = ffi.C

ffi.cdef[[
    double sqrt(double x);
]]

local function heavy()
    local sum = 0
    for i = 1, N do
        -- sum = sum + i
        sum = sum + C.sqrt(i)
    end
    return sum
end
Here we first use LuaJIT’s FFI API to declare the standard C library function
sqrt(), and then invoke it directly from within the Lua function heavy(). It should show up
in the corresponding Lua-land CPU flame graphs.
This time we got the following flame graph:
Interestingly we indeed see the C function frame C:sqrt showing up as the
tips of those two main Lua code paths. It’s also worth noting that we still
see the trace#N frames near the top, which means that our FFI calls into the
C function can also be JIT compiled (this time we removed the jit.off() statement
from the init_by_lua_block directive).
Line-Level Flame Graphs
The previous flame graphs we have seen are all function-level flame graphs because almost all the function frames shown in the flame graphs have only function names instead of the source lines initiating the calls.
Fortunately OpenResty XRay’s Lua-land profiling tools can also generate Lua source lines’ file names and line numbers in its line-level flame graphs by which we can easily know exactly what Lua source lines are hot. Below is such an example for our ongoing Lua example:
We can see that now there are one more source-line frame added above each corresponding
function name frame. For example, inside function main, on line 32 of file test.lua, there
comes the call to the foo() function. And inside the foo() function, on
line 22 of file test.lua, there is the call to the heave() function, and etc.
Line-level flame graphs are very useful to pinpoint the hottest source line and Lua statements. This can save a lot of time when the corresponding Lua function body is large.
Multiple processes
It is common to configure multiple nginx worker processes for a single OpenResty or Nginx server instance on a system with multiple CPU cores. OpenResty XRay’s profiling tools support sampling all the processes in a specific process group at the same time. This is useful when the incoming traffic is moderate and is spread across arbitrary nginx worker processes.
Complicated Lua applications
We can also get Lua-land CPU flame graphs from very complicated OpenResty/Lua applications in the wild. For example, below is a Lua-land CPU flame graph sampled on one of our mini-CDN server running our OpenResty Edge product, which is a complex Lua application, including a dynamic CDN gateway, a geo-sensitive DNS server, and a web application firewall (WAF):
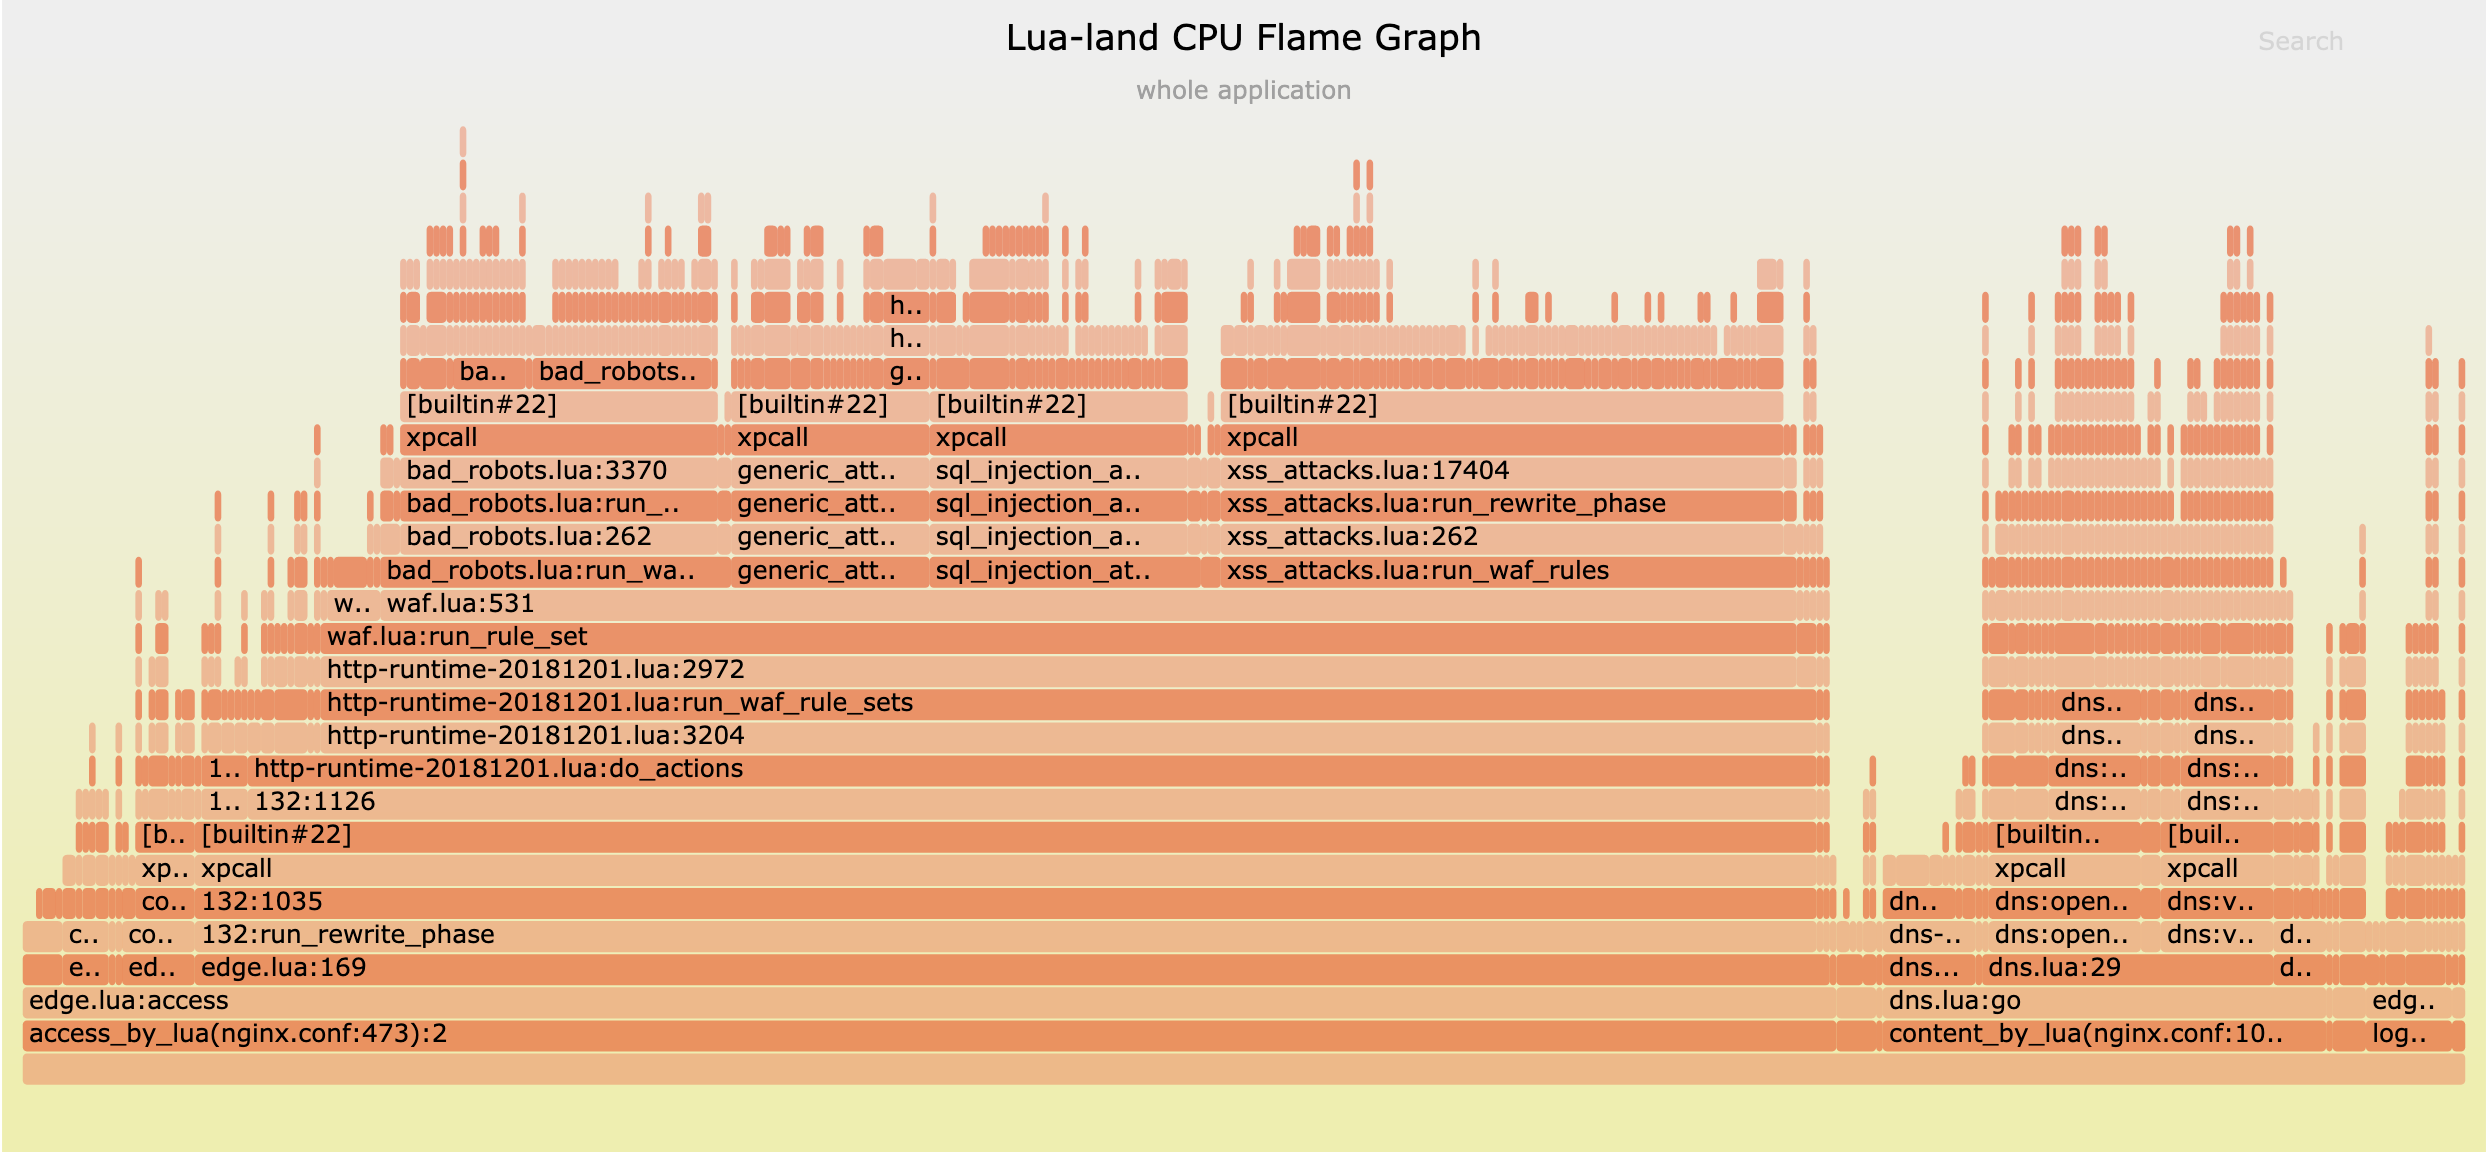
From this graph, we can see that the WAF takes most of the CPU time while the built-in DNS server also takes a good portion. Our global mini-CDN network is also securing and speeding up our own web sites like openresty.org and openresty.com.
It can surely analyze OpenResty-based API gateway software like Kong as well.
Sampling overhead
Because we use the sampling-based approach instead of full instrumentation, the overhead involved with the sampling for generating Lua-land CPU flame graphs is usually negligible which makes such tools usable in production or online environments. Both the data volume and CPU overhead are minimal.
If we load the target nginx worker process with requests of a constant rate, the CPU usage changes of the target process while the Lua-land CPU flame graph sampling is frequently performed is like this:
This CPU usage line graph is also generated and rendered by OpenResty XRay automatically.
And then we stop sampling at all and the CPU usage curve of the same nginx worker process is very similar:
We cannot really see any differences between these two curves with human eyes. So the profiling and sampling cost is indeed very small.
When the tools are not sampling, the performance impact is strictly zero since we never change anything in the target processes anyway.
Safety
Because we use dynamic tracing technologies, we do not change any state in the target processes, not even a single bit of information2. This makes sure that the target process behaves (almost) exactly the same as the case when no sampling is performed. This guarantees that the target process’s reliability (no unexpected behavior changes or process crashes) and behaviors won’t get compromised by the profiling tool. They stay exactly the same as when no one is watching, just like taking an X-ray image against a live animal.
Traditional Application Performance Manager (APM) products may require loading special modules or plugins into the target software, or even bloodily patching or injecting machine code or byte code into the target software’s executable or process space, severely compromising the stability and correctness of the user systems.
For these reasons, these tools are safe to use in production environments to analyze those really hard problems which cannot be easily reproduced offline.
Compatibility
The Lua-land CPU flame graph sampling tool provided by the OpenResty XRay product supports any OpenResty or Nginx binaries including those compiled by the users themselves with aribitrary build options, optimized or unoptimized, using the GC64 mode or non-GC64 mode in the LuaJIT library, and etc.
OpenResty and Nginx server processes running inside Docker or Kubernetes containers can also be analyzed transparently by OpenResty XRay and perfect Lua-land CPU flame graphs can be rendered without problems.
Our tool can also analyze console-based user Lua programs run by the resty
or luajit command-line utilities.
We also support old Linux operating systems and old kernels, like CentOS 6 with the kernel 2.6.32.
Other types of Lua-land Flame Graphs
As mentioned earlier in this post, flame graphs can be used for visualizing any system resources or performance metrics, not just CPU time. Naturally we do have other types of Lua-land flame graphs in our OpenResty XRay product, like off-CPU flame graphs, garbage collectable (GC) object size and data reference path flame graphs, new GC object allocation flame graphs, Lua coroutine yielding time flame graphs, file I/O latency flame graphs, and many more.
We will cover these different kinds of flame graphs in future articles on our blog site.
Conclusion
In this article we introduce the very useful visualization, Flame Graphs, for profiling software performance. And we have a deep look at one particular type of flame graphs, Lua-land CPU Flame Graphs, for profiling Lua applications running atop OpenResty and Nginx. We investigate several small Lua sample programs using real flame graphs produced by OpenResty XRay to demonstrate the strength of our sampling tools based on dynamic tracing technologies. Finally we look at the performance overhead of sampling and the safety of online uses.
About The Author
Yichun Zhang (Github handle: agentzh), is the original creator of the OpenResty® open-source project and the CEO of OpenResty Inc..
Yichun is one of the earliest advocates and leaders of “open-source technology”. He worked at many internationally renowned tech companies, such as Cloudflare, Yahoo!. He is a pioneer of “edge computing”, “dynamic tracing” and “machine coding”, with over 22 years of programming and 16 years of open source experience. Yichun is well-known in the open-source space as the project leader of OpenResty®, adopted by more than 40 million global website domains.
OpenResty Inc., the enterprise software start-up founded by Yichun in 2017, has customers from some of the biggest companies in the world. Its flagship product, OpenResty XRay, is a non-invasive profiling and troubleshooting tool that significantly enhances and utilizes dynamic tracing technology. And its OpenResty Edge product is a powerful distributed traffic management and private CDN software product.
As an avid open-source contributor, Yichun has contributed more than a million lines of code to numerous open-source projects, including Linux kernel, Nginx, LuaJIT, GDB, SystemTap, LLVM, Perl, etc. He has also authored more than 60 open-source software libraries.
Translations
We provide a Chinese translation for this article on our blog.openresty.com site. We also welcome interested readers to contribute translations in other natural languages as long as the full article is translated without any omissions. We thank them in advance.
We are hiring
We always welcome talented and enthusiastic engineers to join our team at OpenResty Inc.
to explore various open source software’s internals and build powerful analyzers and
visualizers for real world applications built atop the open source software. If you are
interested, please send your resume to talents@openresty.com . Thank you!
Similarly any primitive routines belonging to the VM itself won’t be blind spots either. So we can profile the VM itself at the same time just fine. ↩︎
The Linux kernel’s uprobes facility would still change some minor memory state inside the target process in a completely safe way (guaranteed by the kernel) and such modifications are completely transparent to the target processes. ↩︎
Related Articles
OpenResty XRay Aug 10, 2020

OpenResty XRay Aug 4, 2020

OpenResty XRay Jan 21, 2020

OpenResty XRay Jul 8, 2026

OpenResty XRay Jul 15, 2023


