llama.cpp CPU Usage: 400% CPU Traced to ggml Hot Functions
When llama.cpp runs a LLaMA 2 model on CPU, it can easily consume 400% of available CPU cores. Where does all that CPU time actually go? We profiled a live, unmodified llama.cpp process running the quantized 7B model with OpenResty XRay and traced the CPU usage to two dominant code paths: ggml_compute_forward_mul_mat (general matrix multiplication) and ggml_vec_dot_q4_K_q8_K (quantized dot product in k_quants.c).
This walkthrough shows the complete profiling process — from observing the high CPU usage to pinpointing the exact source file and line number responsible.
Running llama.cpp and Observing 400% CPU Usage
First, compile llama.cpp with debug symbols enabled so the profiler can resolve function names and source locations:
cd llama.cpp
make -j4 OPT="-g -O3"
Then run the main program with the quantized LLaMA 2 7B model. LLaMA 2 is an open-source large language model released by Meta. Here we use the Q4_K_M quantization variant, which reduces the 7B model to about 4 GB — small enough to run entirely on CPU via llama.cpp:
./main -m models/llama-2-7b-chat.ggmlv3.q4_K_M.bin -n 4096 -p "Linux"
The -n 4096 option specifies the number of tokens to generate, and -p "Linux" sets the prompt used to generate the content.
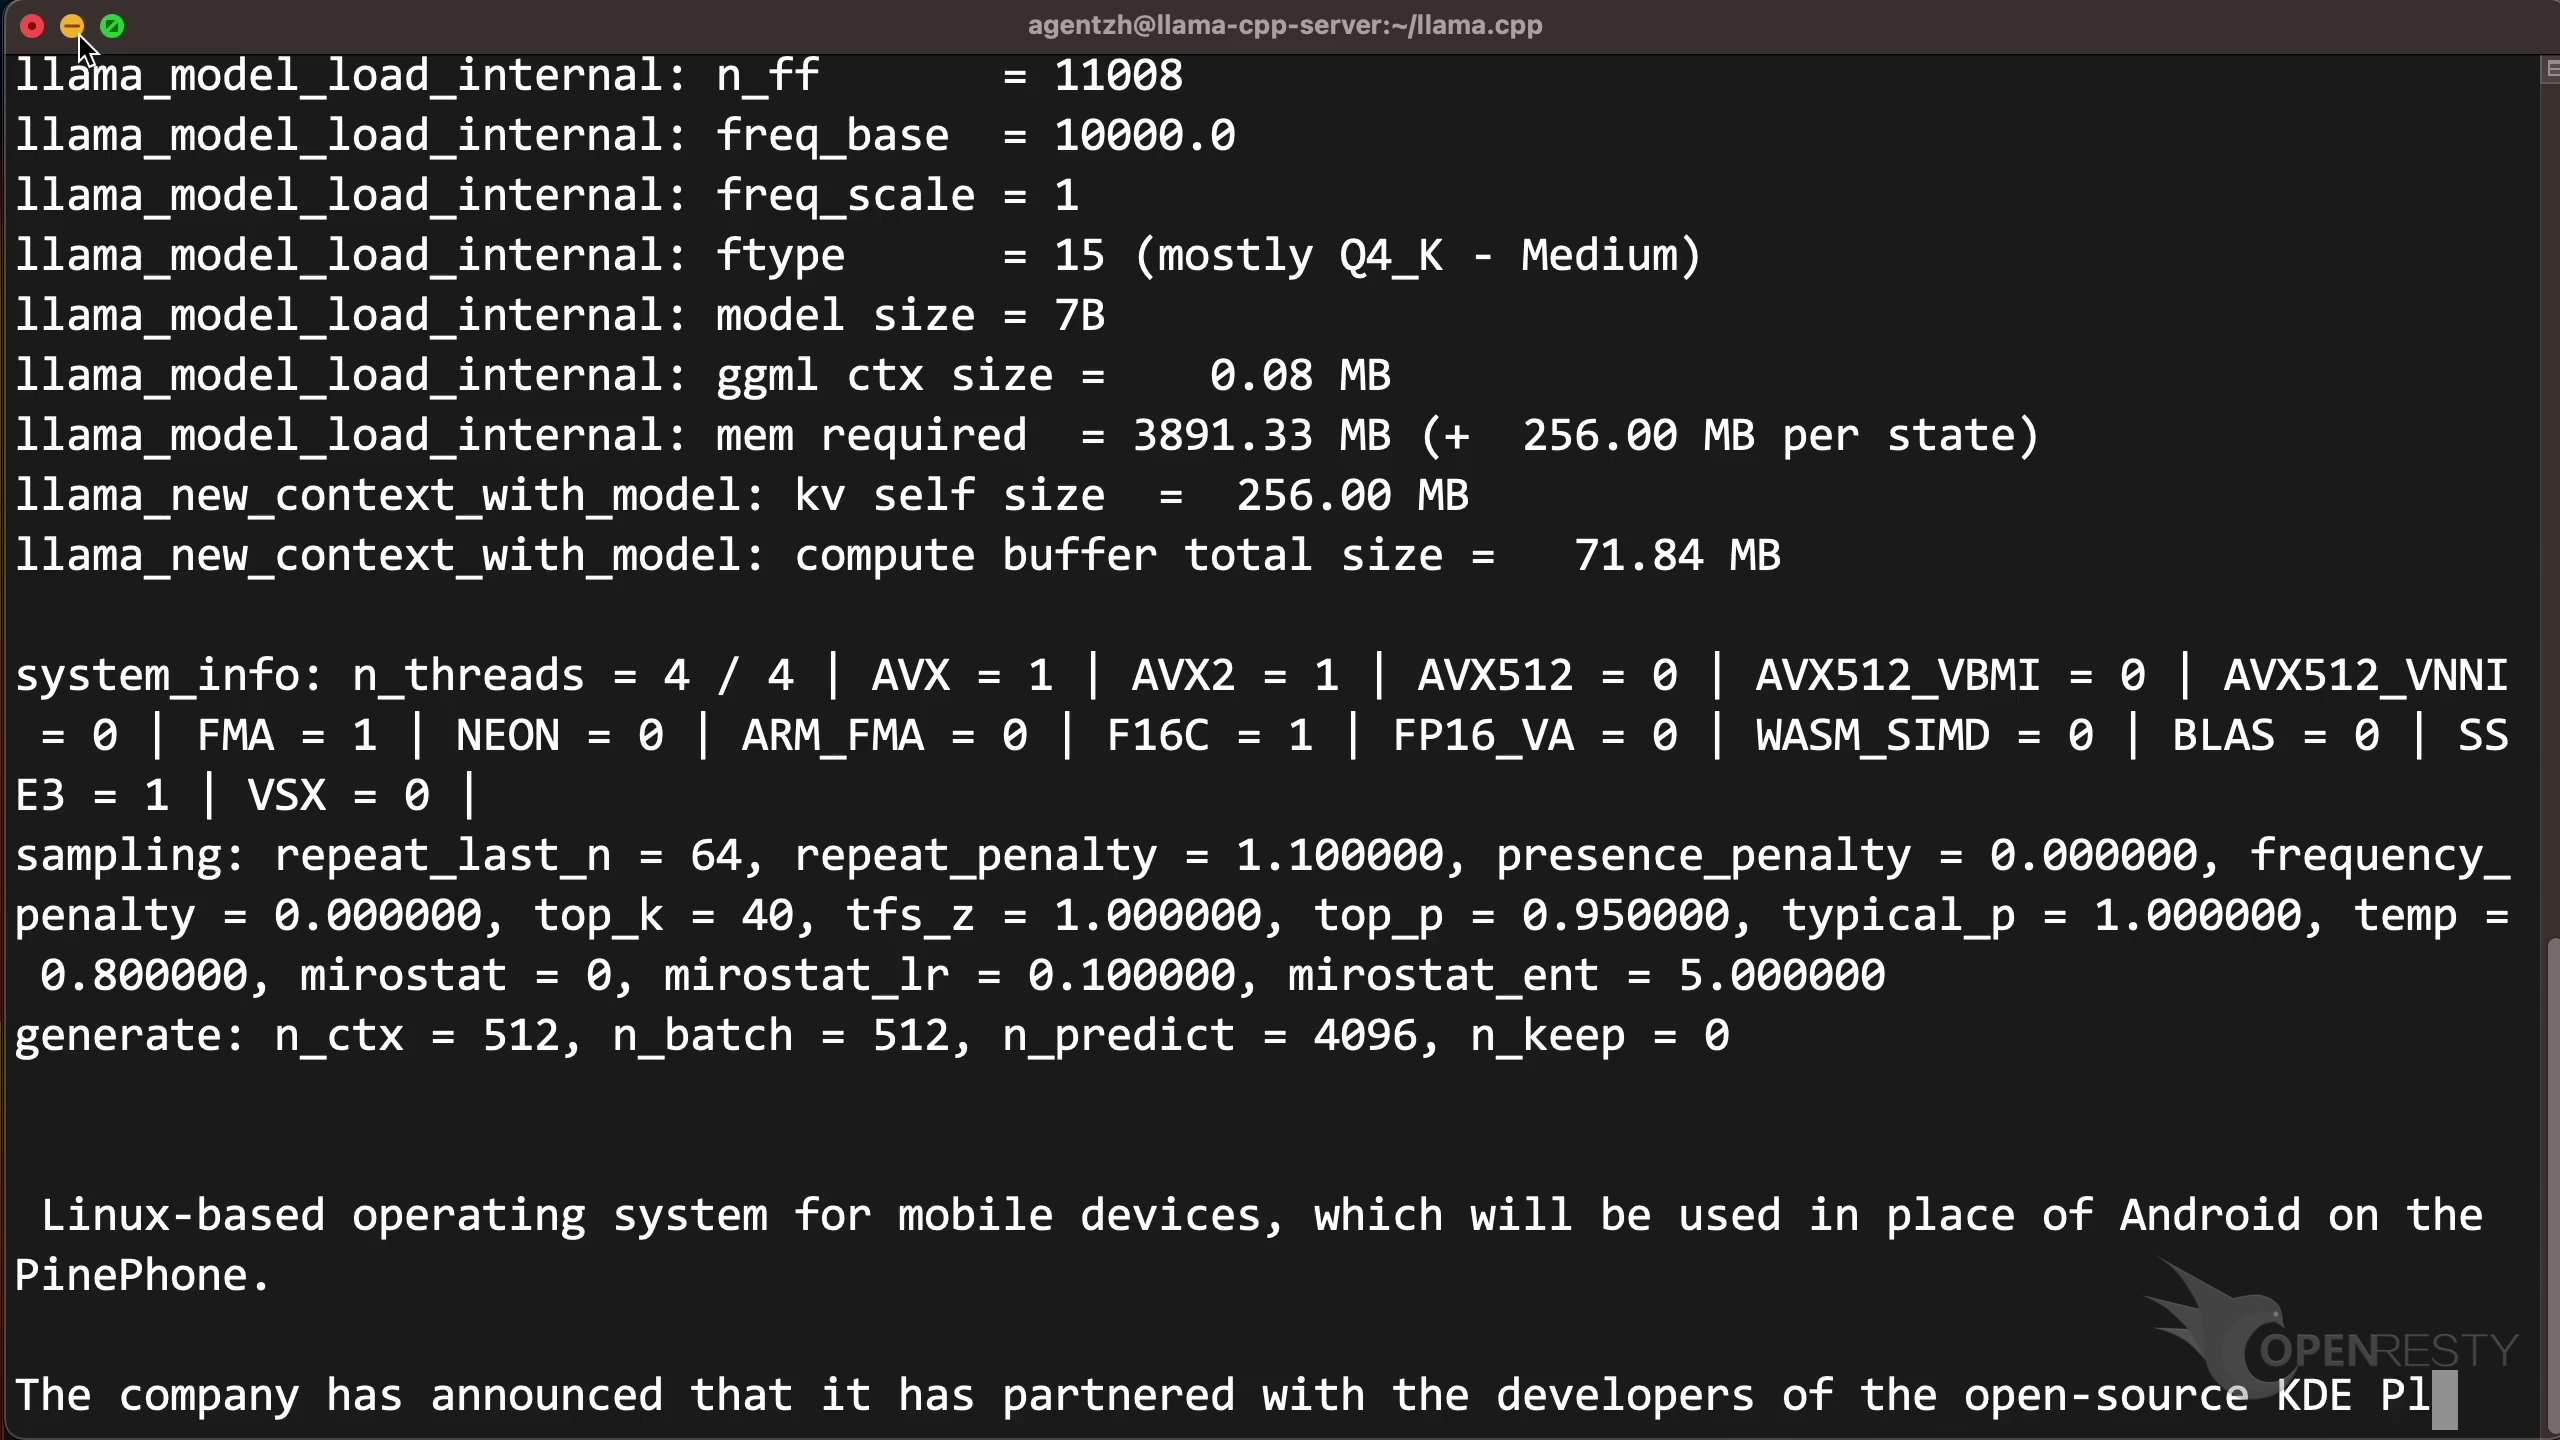
The process loads the model and begins generating text. Note the system_info line in the output — it shows n_threads = 4, AVX = 1, AVX2 = 1, and BLAS = 0, meaning this build uses AVX2 SIMD instructions but no external BLAS library:
In a separate terminal, top reveals the main process consuming nearly 400% CPU — saturating all 4 cores:
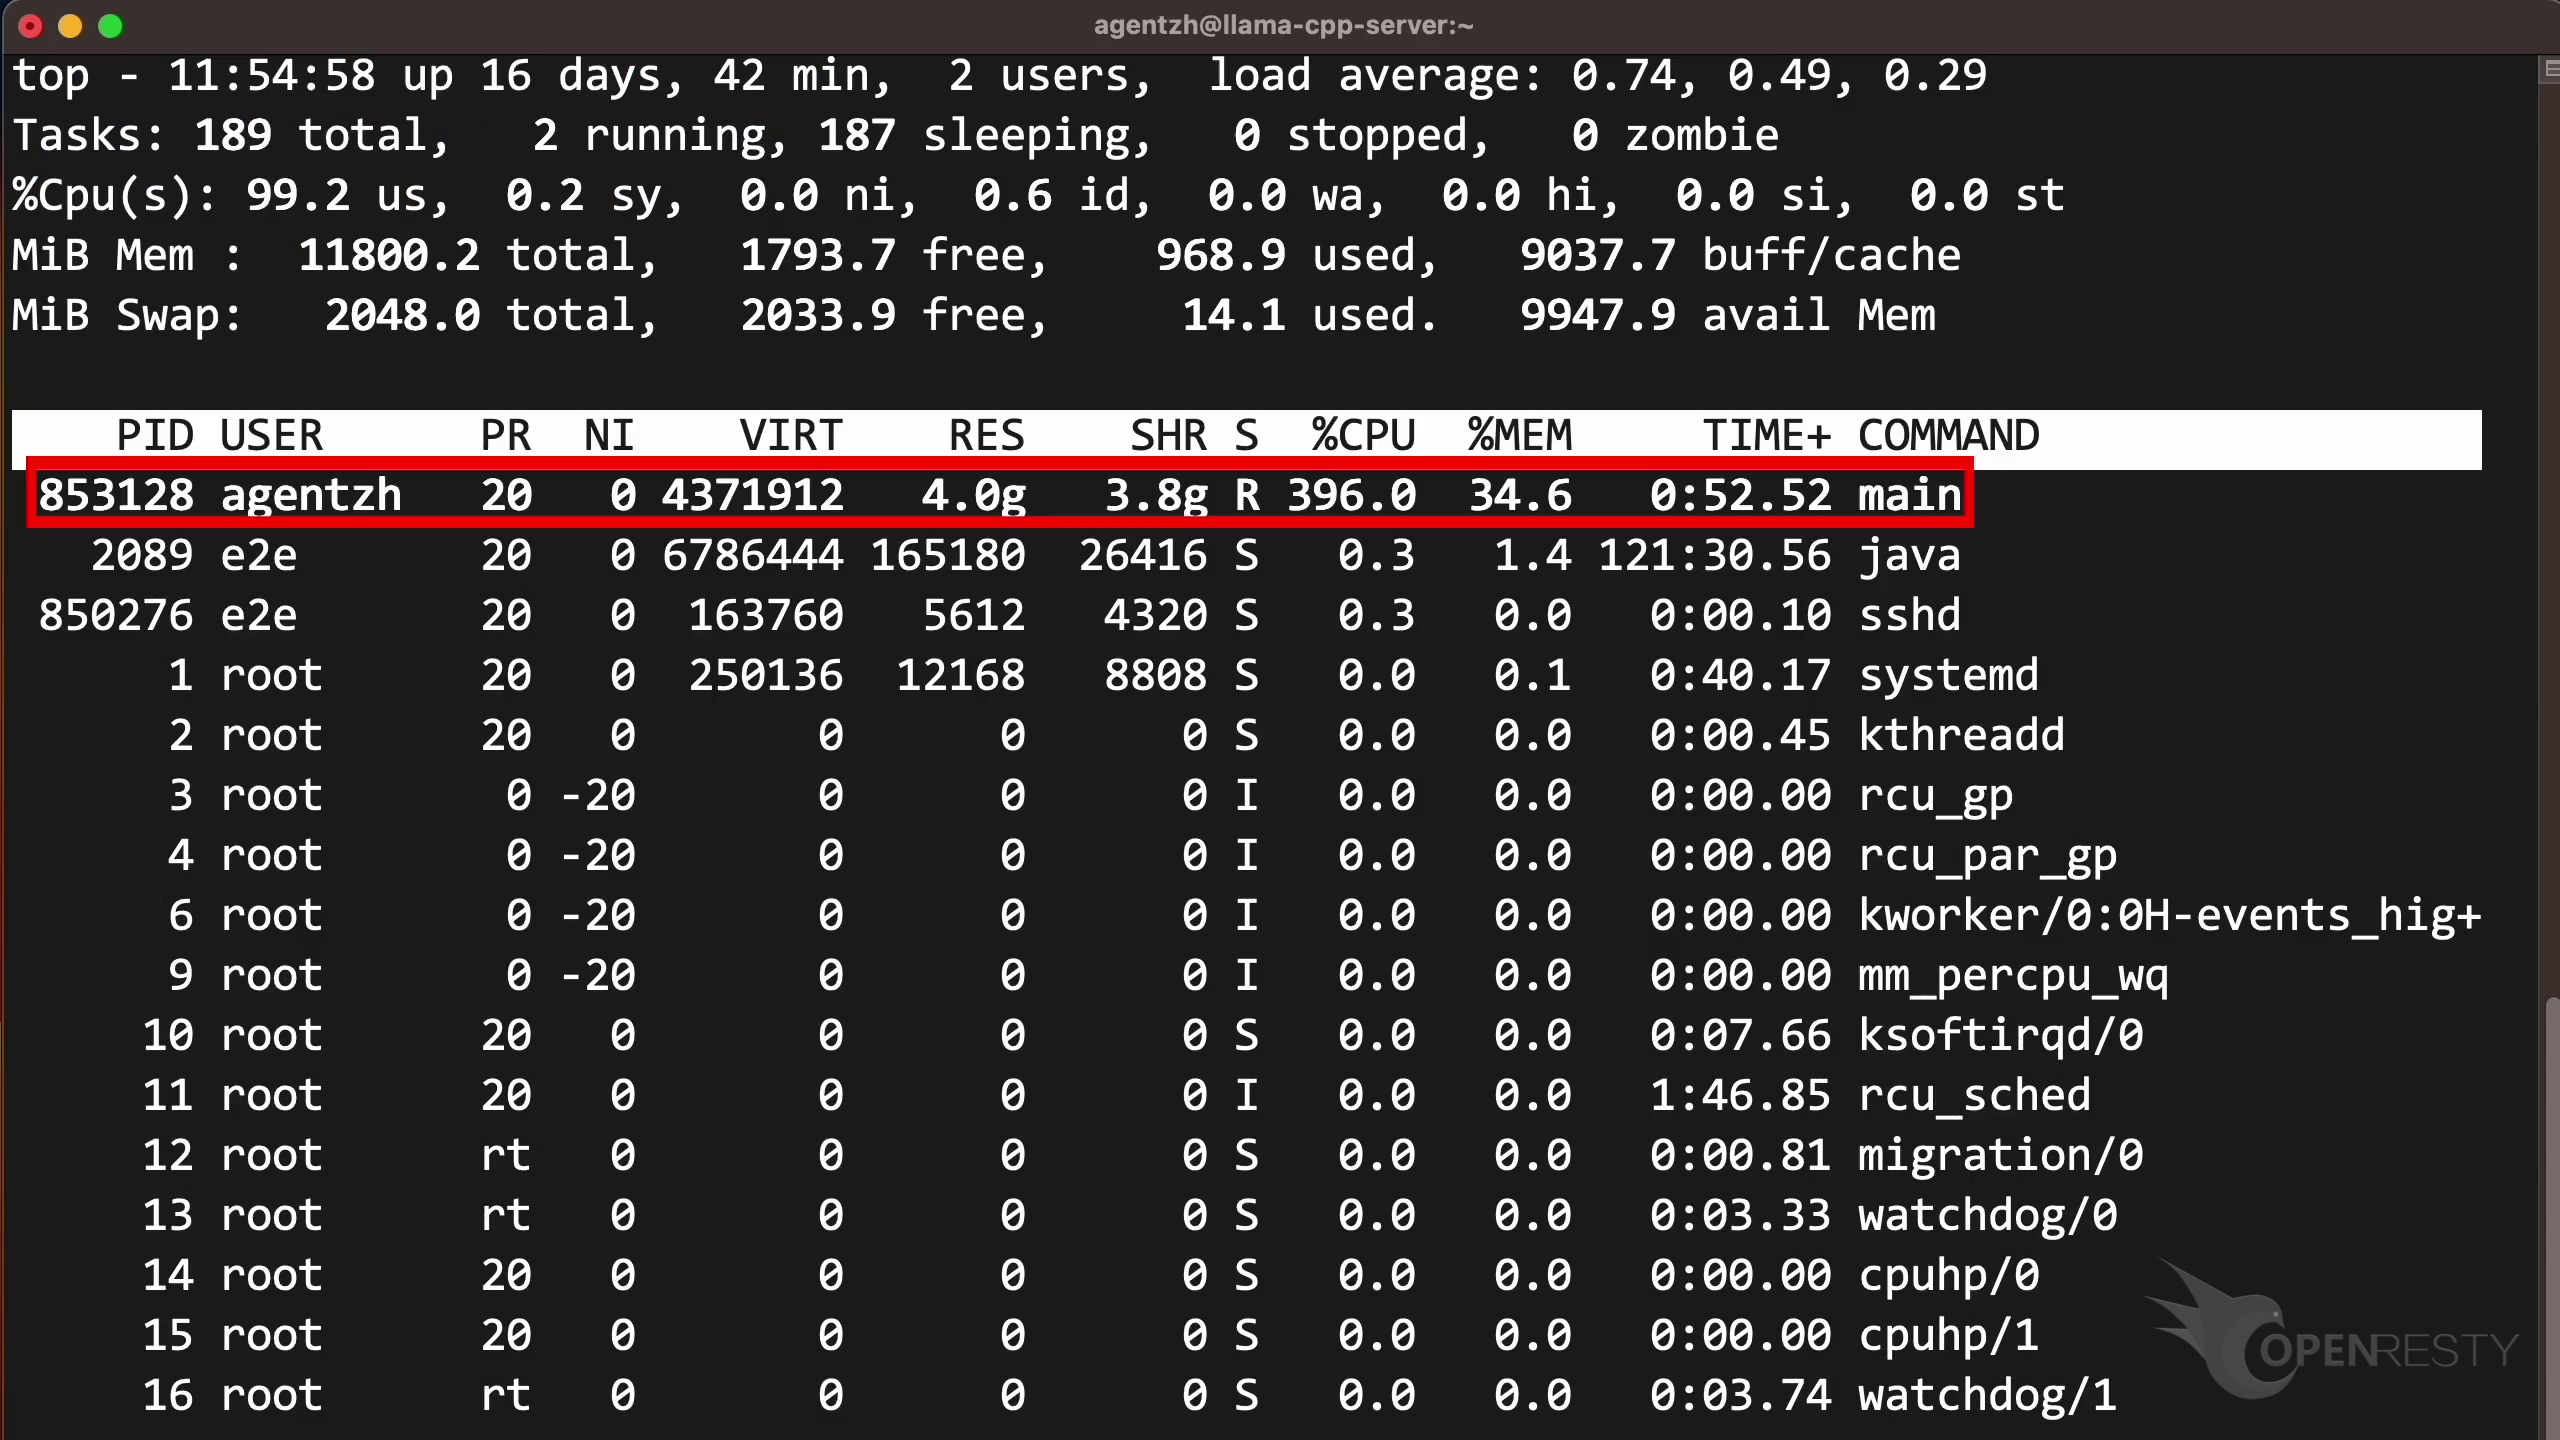
The question is: which C++ functions inside llama.cpp are responsible for this CPU usage?
Profiling llama.cpp CPU Usage with OpenResty XRay
We use OpenResty XRay to answer that question. OpenResty XRay can attach to a running, unmodified process and generate CPU flame graphs through dynamic tracing — no recompilation or instrumentation required.
In the OpenResty XRay web console, navigate to Guided Analysis, select High CPU usage as the problem type, then choose the llama.cpp main process from the process list. The console shows it at 320.4% CPU with the full command line visible:
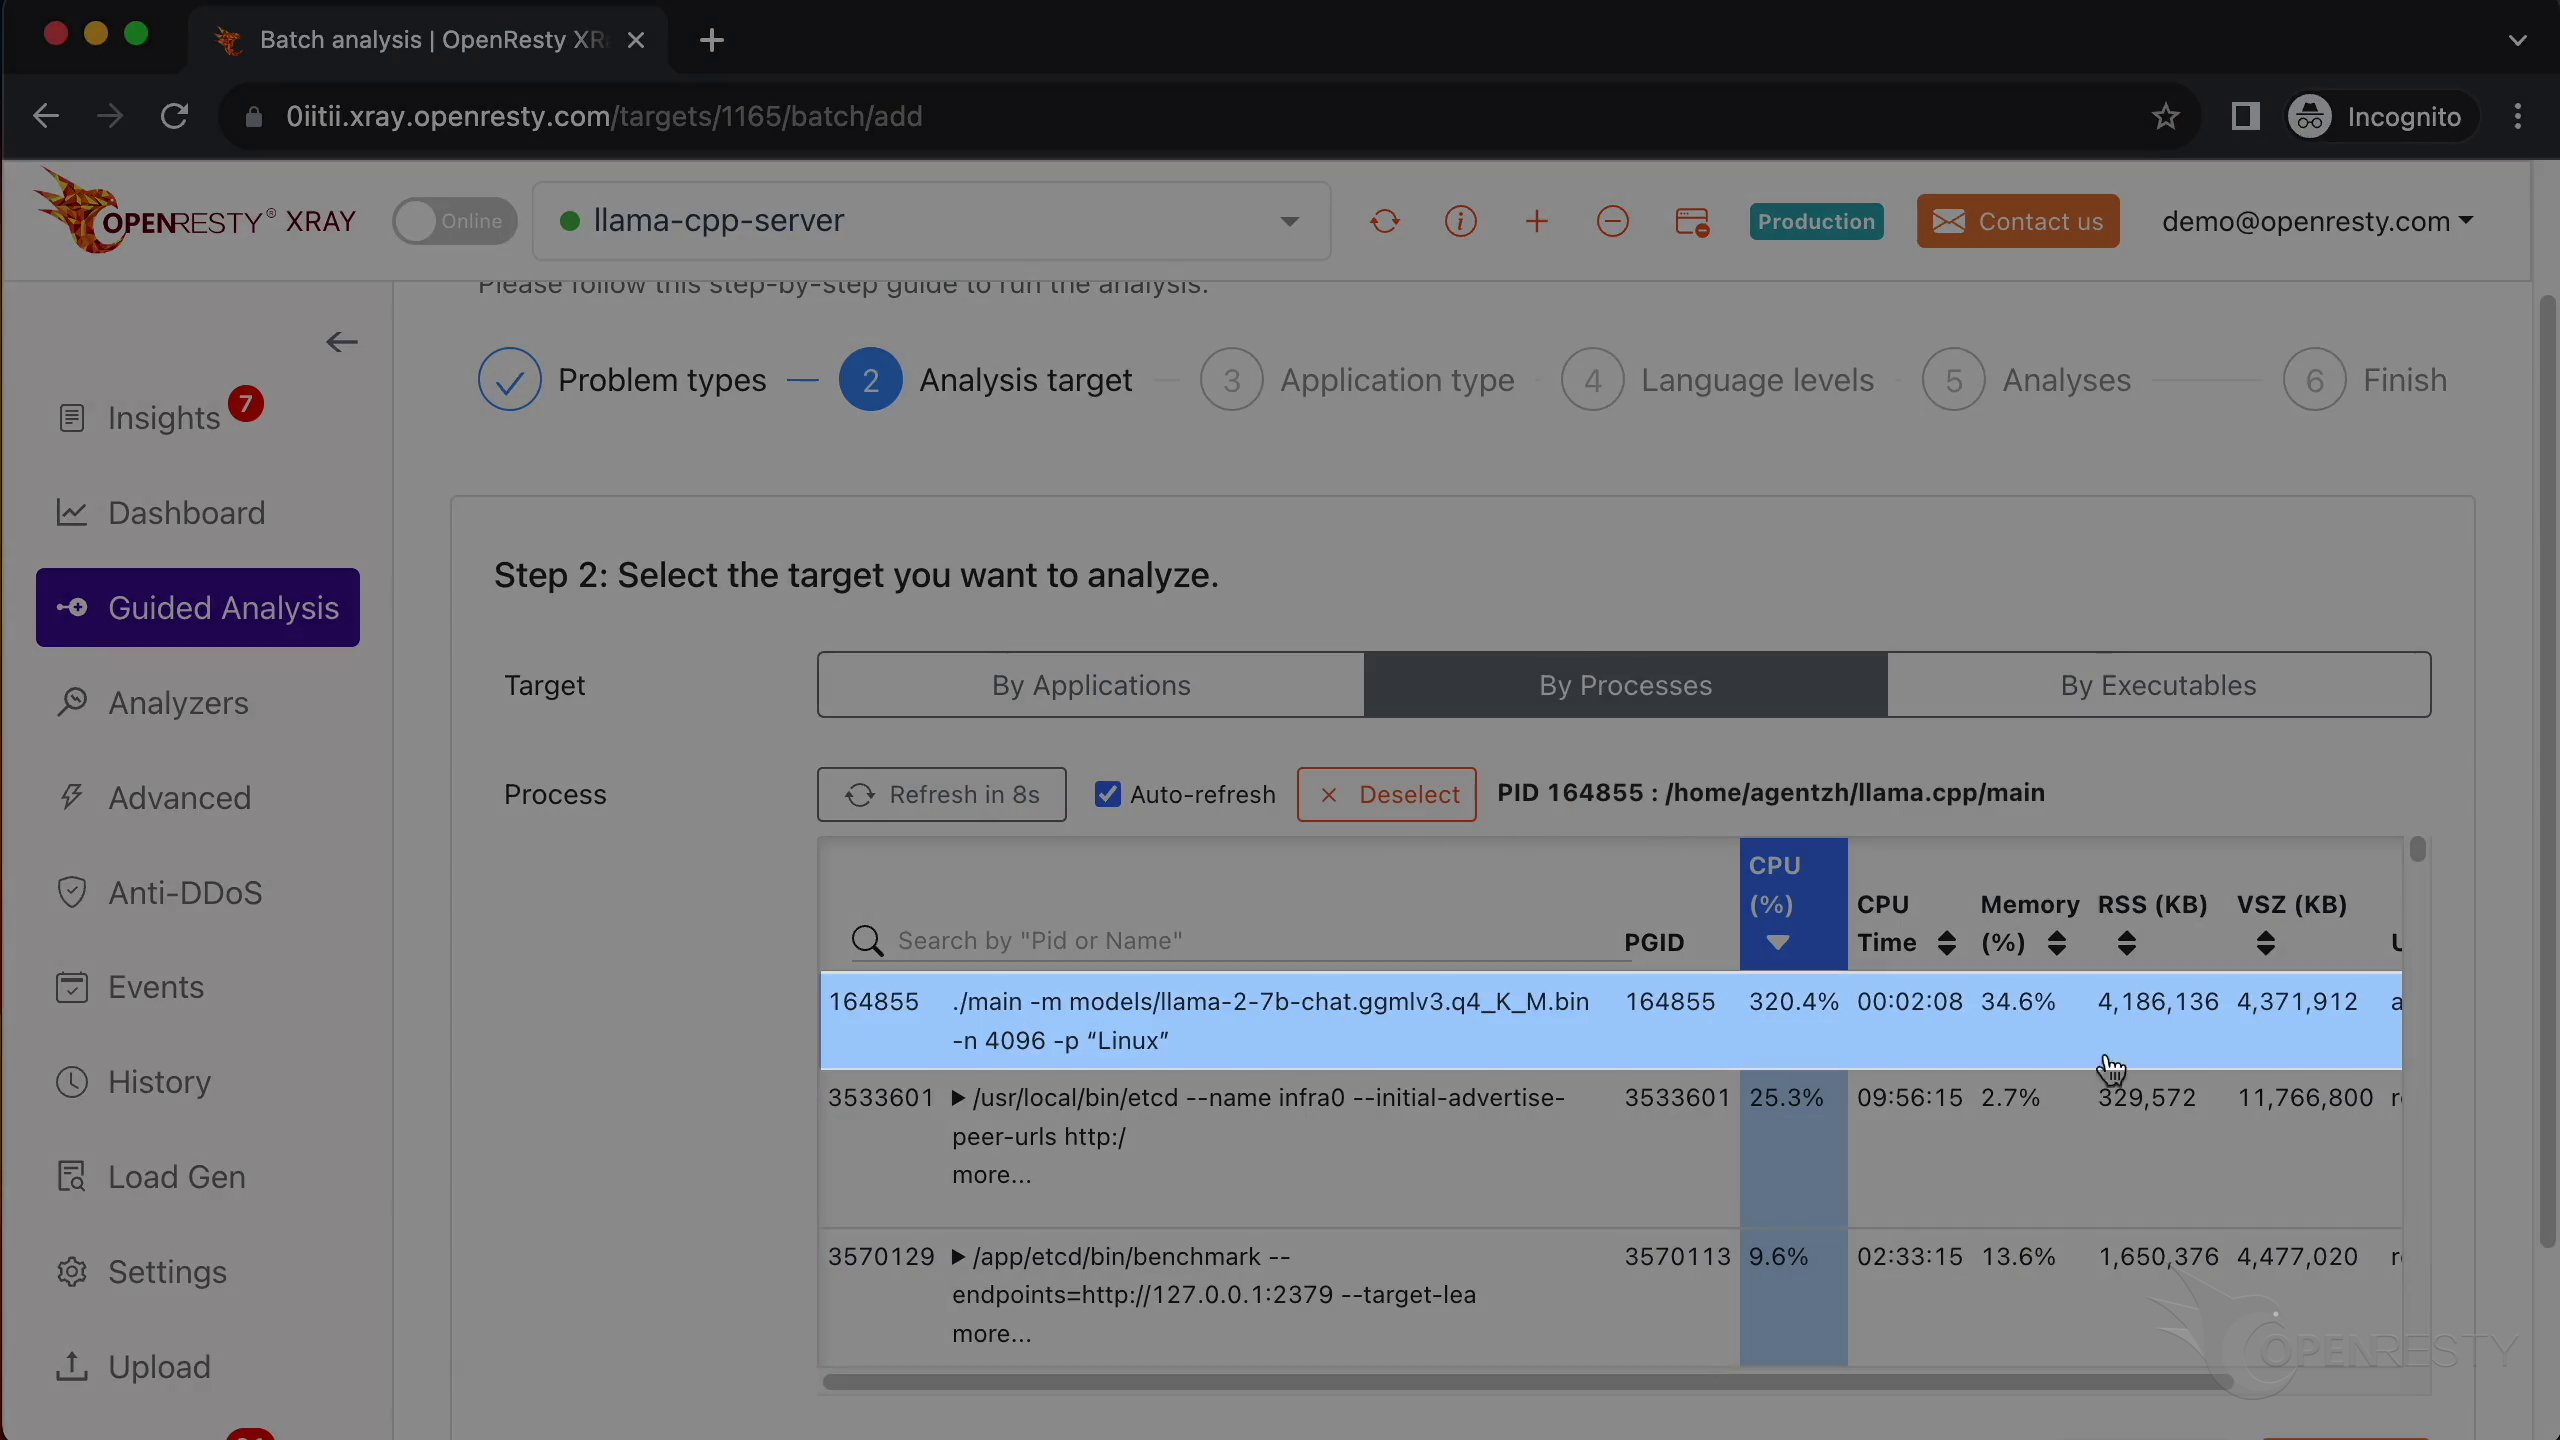
Set the application type to C/C++ and leave the maximum analysis time at the default 300 seconds. After clicking Start analyzing, the system runs multiple rounds of sampling. Two rounds are sufficient for this case. Stopping the analysis triggers automatic report generation.
Findings: The Hottest C++ Code Paths
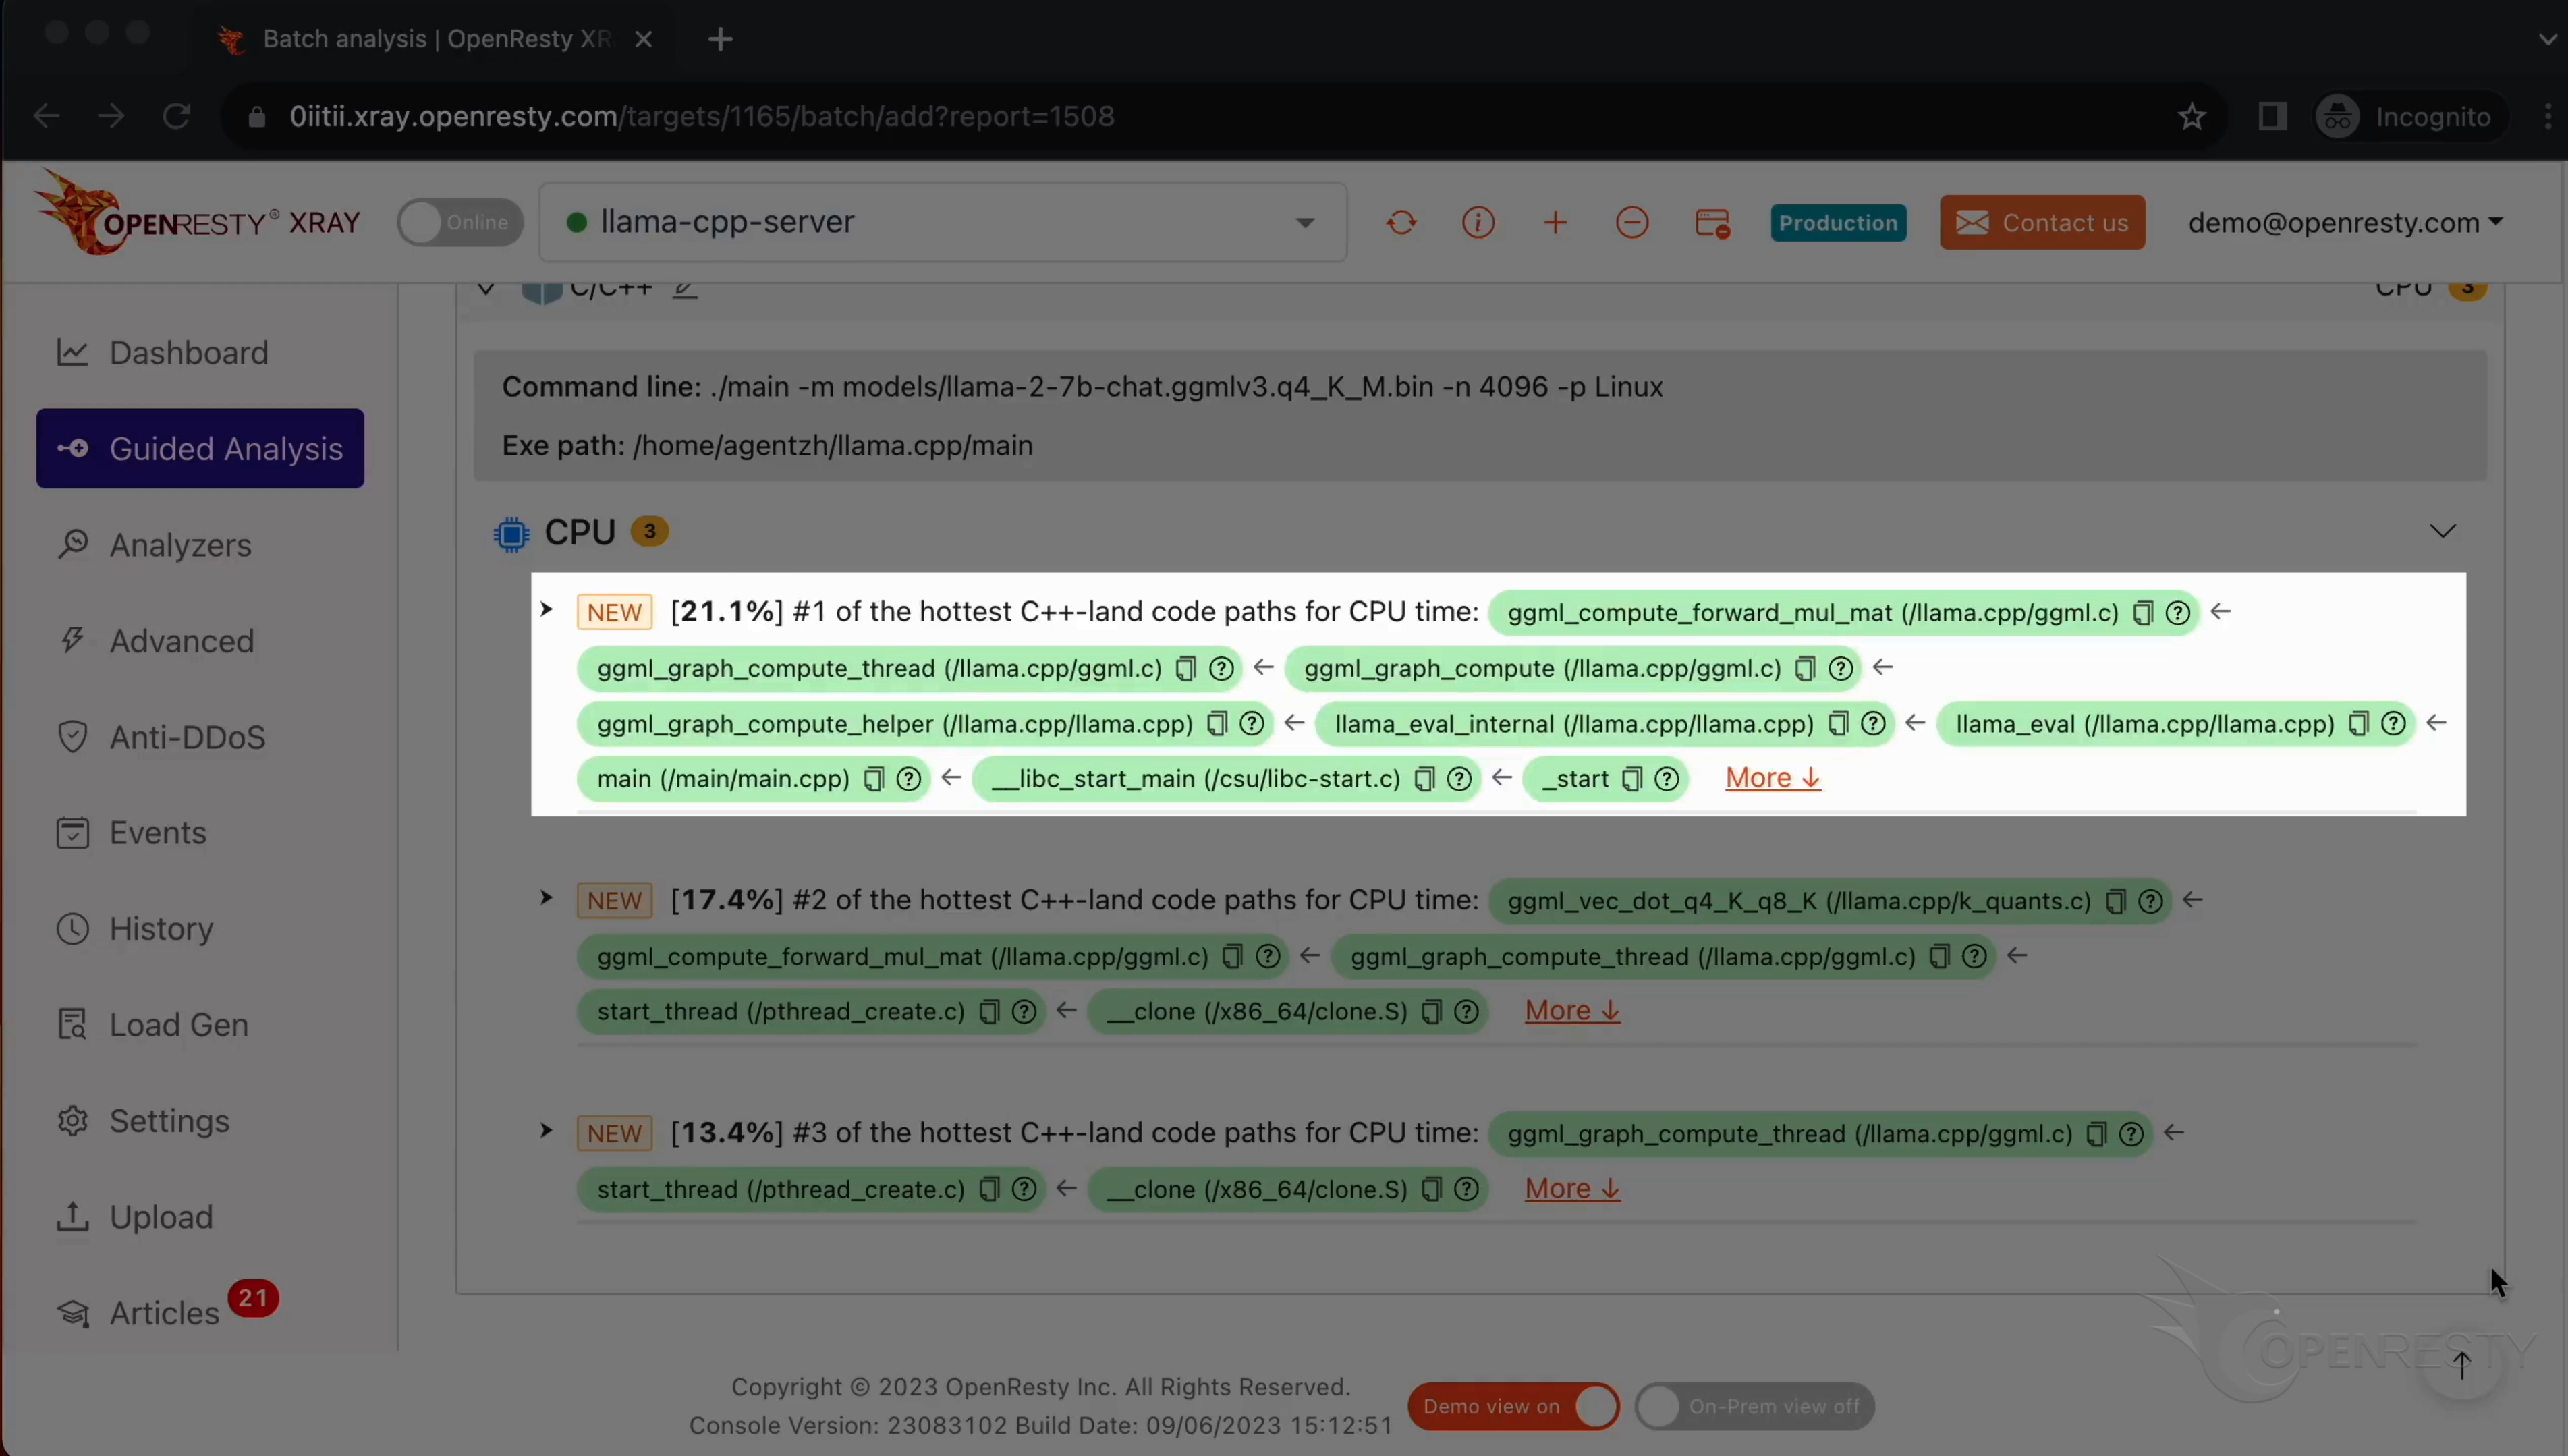
The generated report identifies three hot C++ code paths, each showing the percentage of total CPU time and the full call chain:
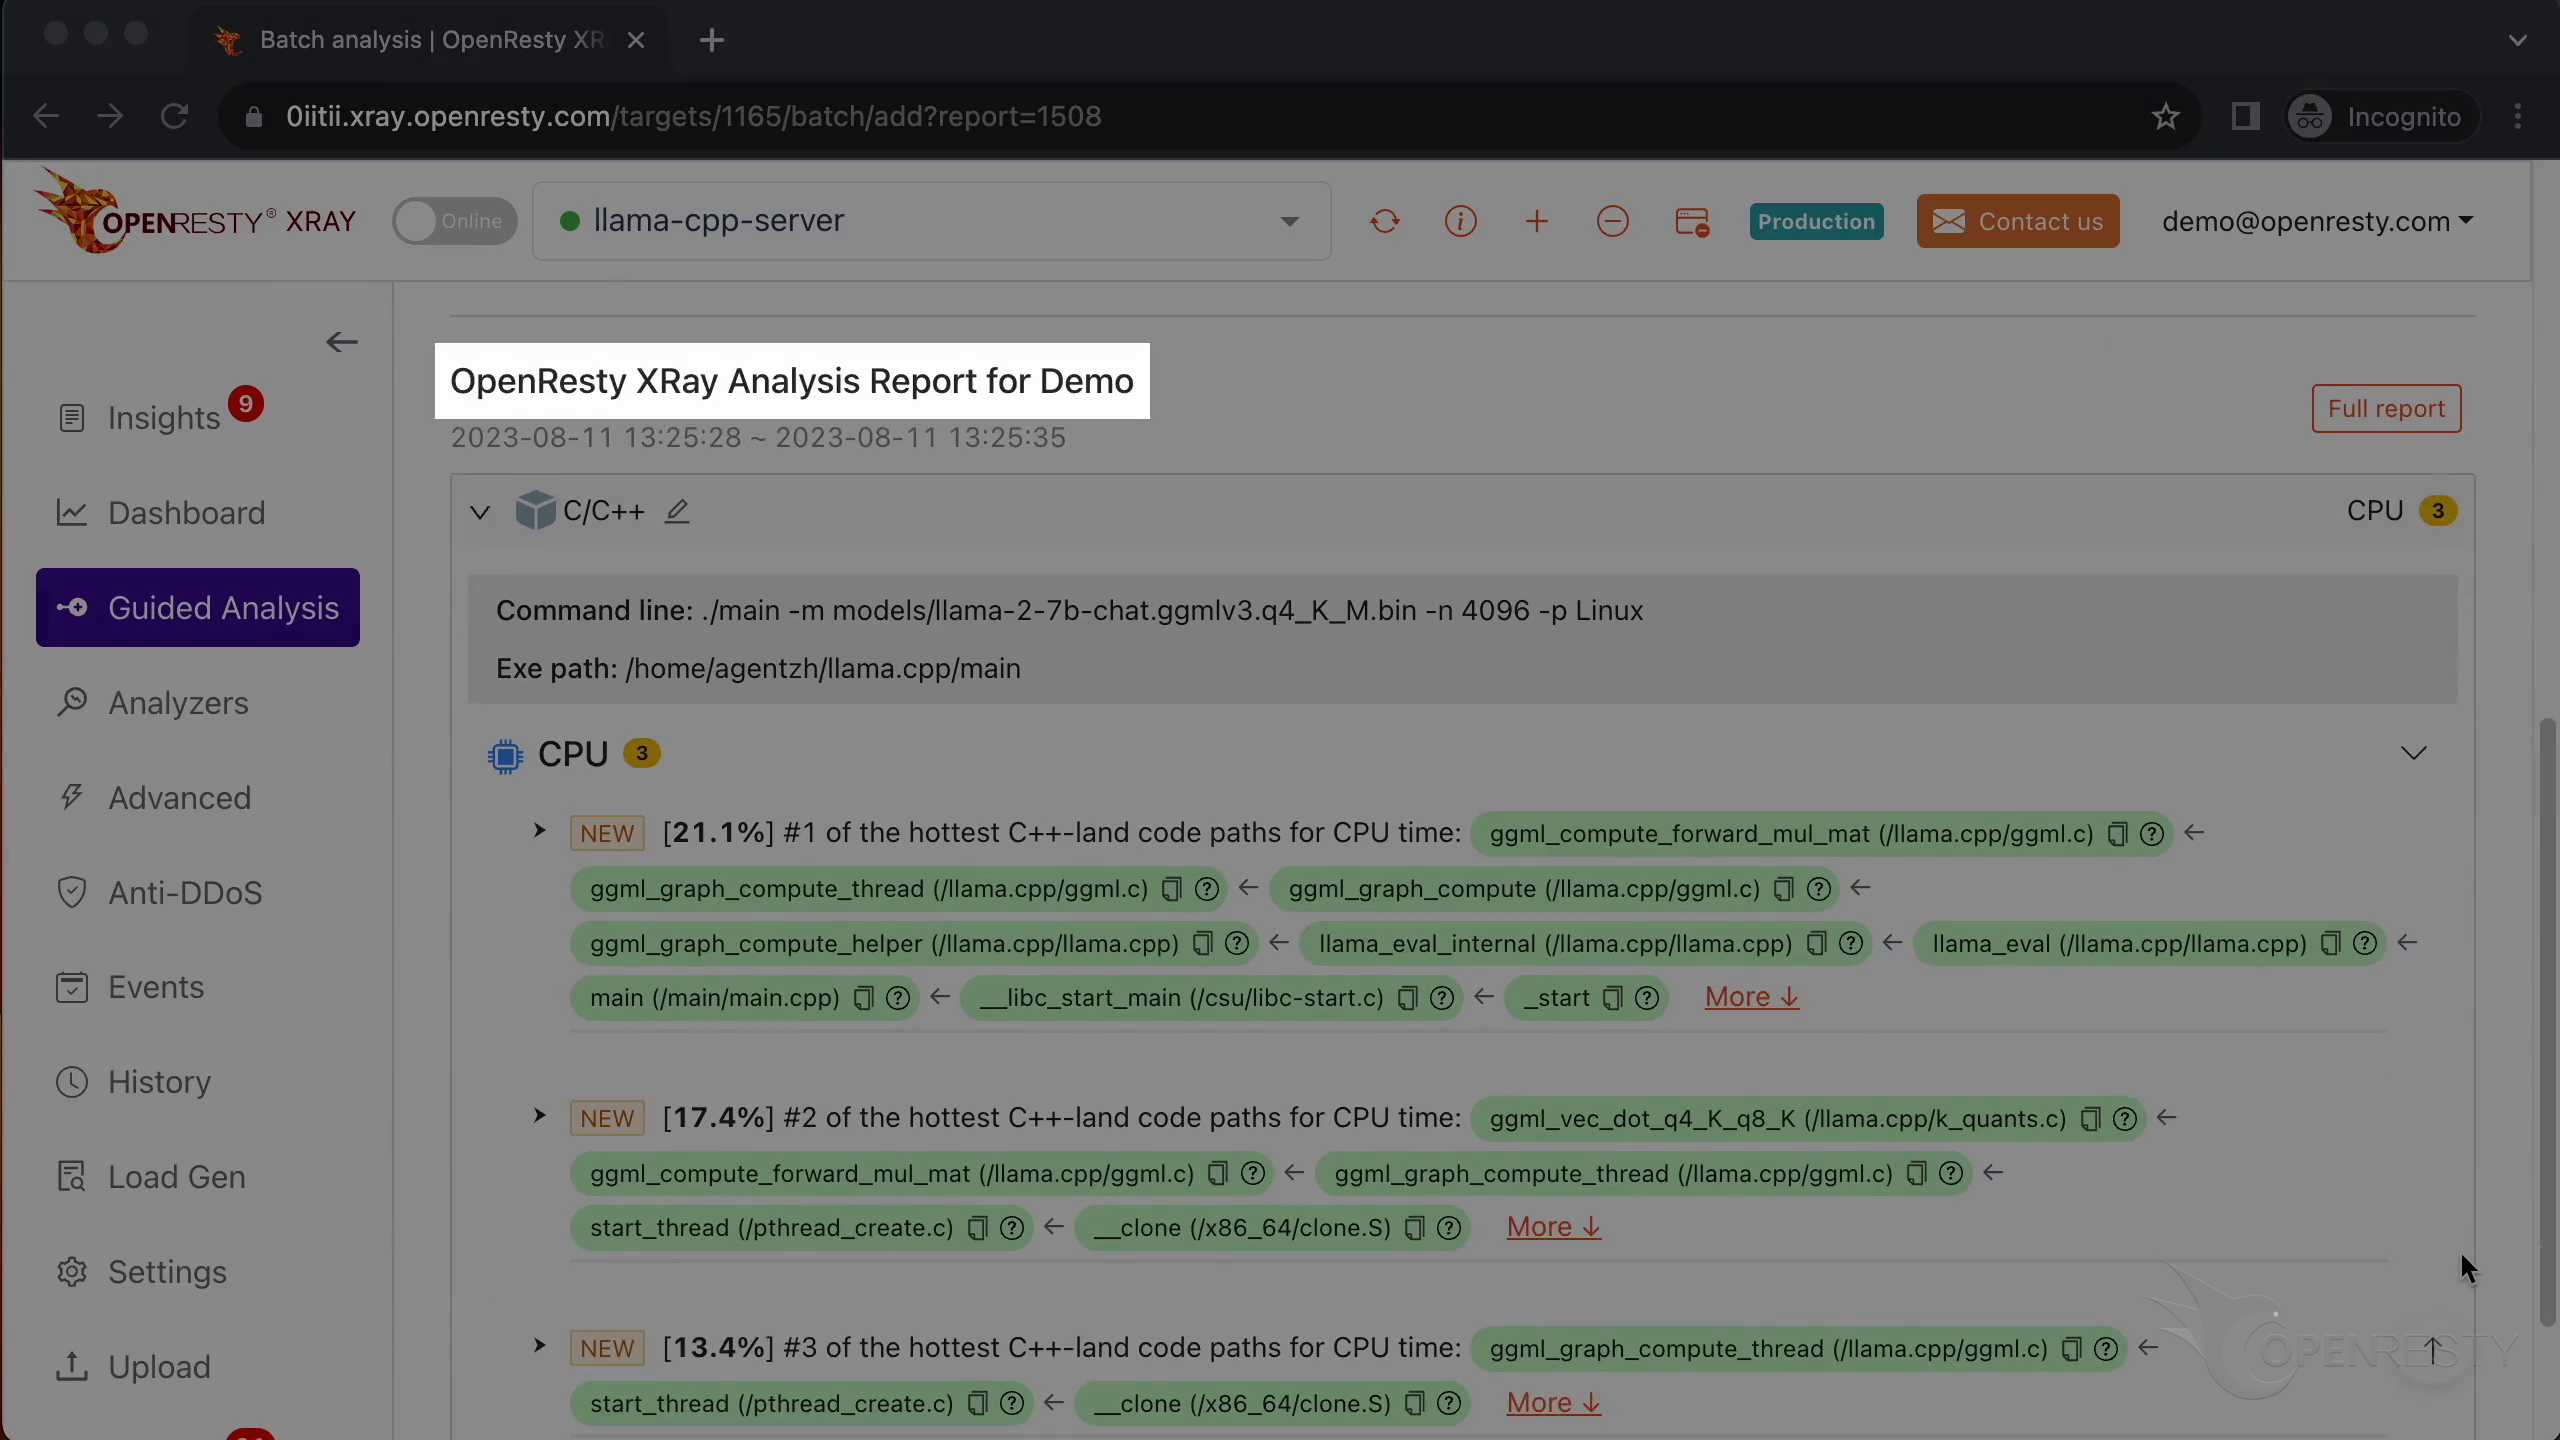
#1: ggml_compute_forward_mul_mat — 21.1% of CPU time
The hottest code path leads to ggml_compute_forward_mul_mat in ggml.c. This is the general matrix multiplication (GEMM) kernel in the ggml library — the core operation behind both the attention mechanism and the feed-forward layers in transformer inference. Its caller, ggml_graph_compute_thread, is responsible for performing the computation in a single thread:
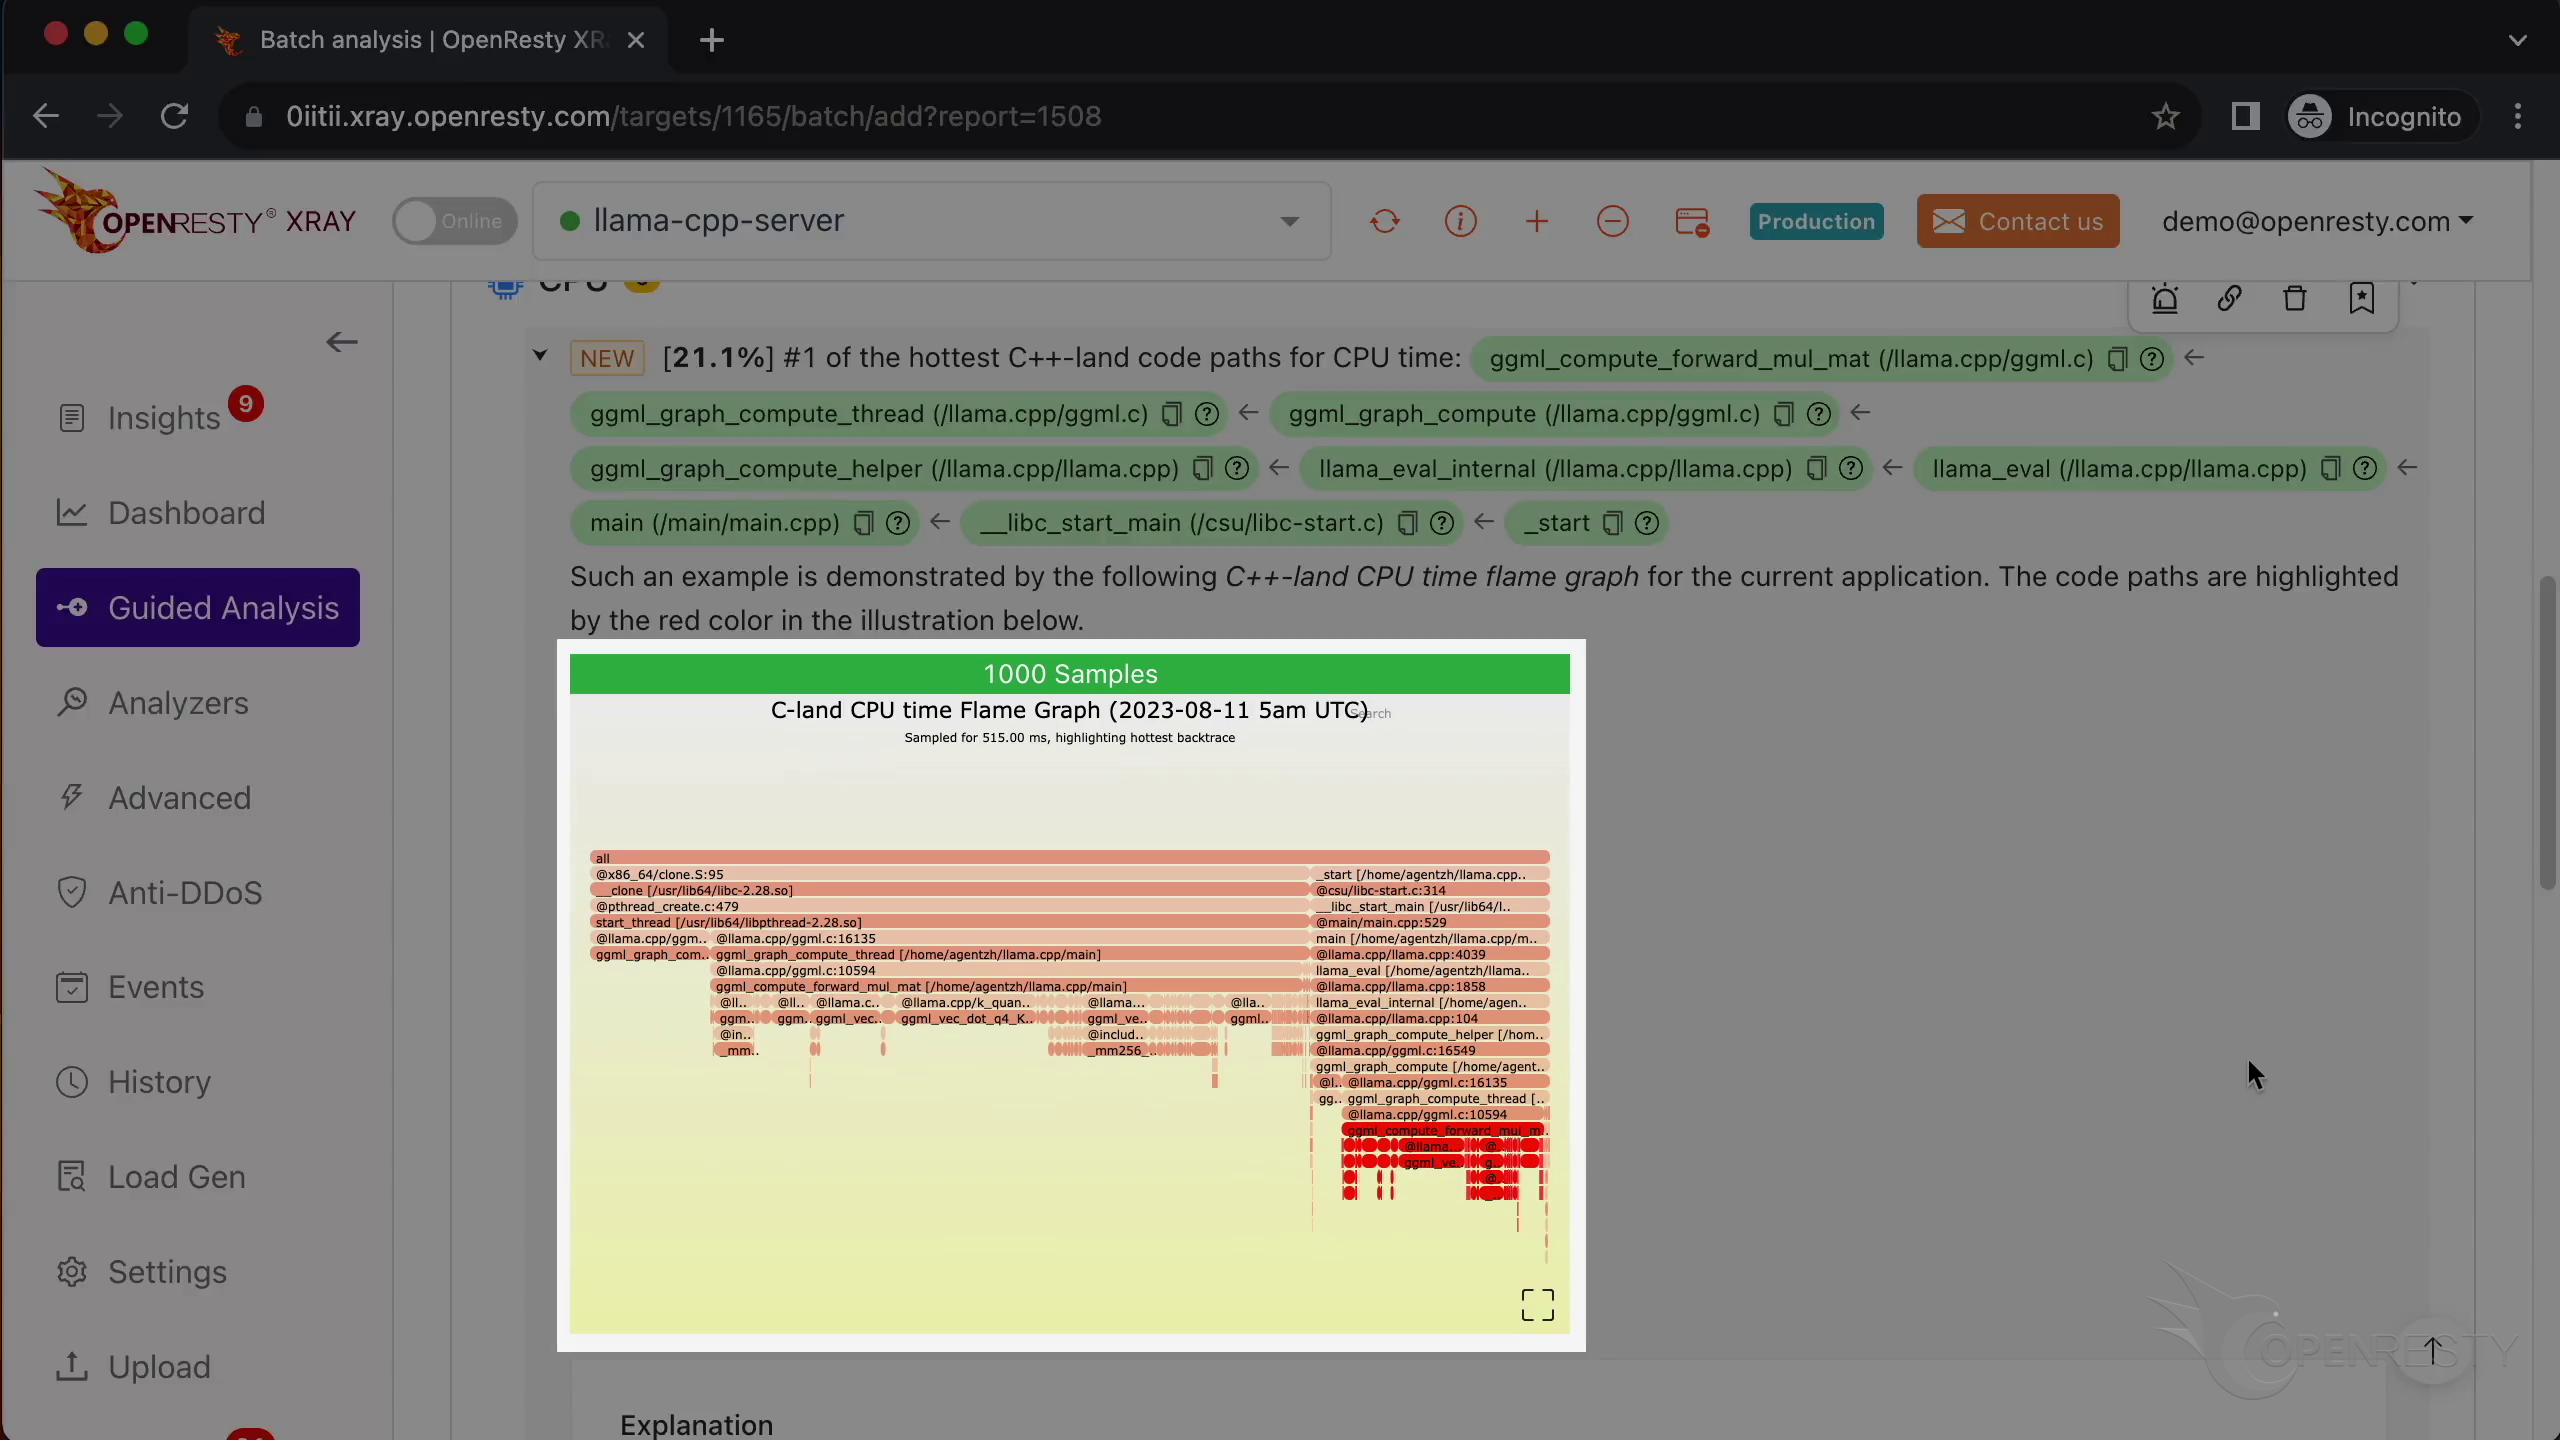
Clicking More expands the details, revealing the CPU flame graph that this code path was derived from. The flame graph gives a visual representation of the entire call stack, with wider bars indicating more CPU time:
OpenResty XRay also generates an automated explanation and optimization suggestions for this code path. It identifies that ggml_compute_forward_mul_mat computes the matrix multiplication of two tensors, and suggests strategies including parallelization, memory access optimization, and using optimized libraries like BLAS or LAPACK:
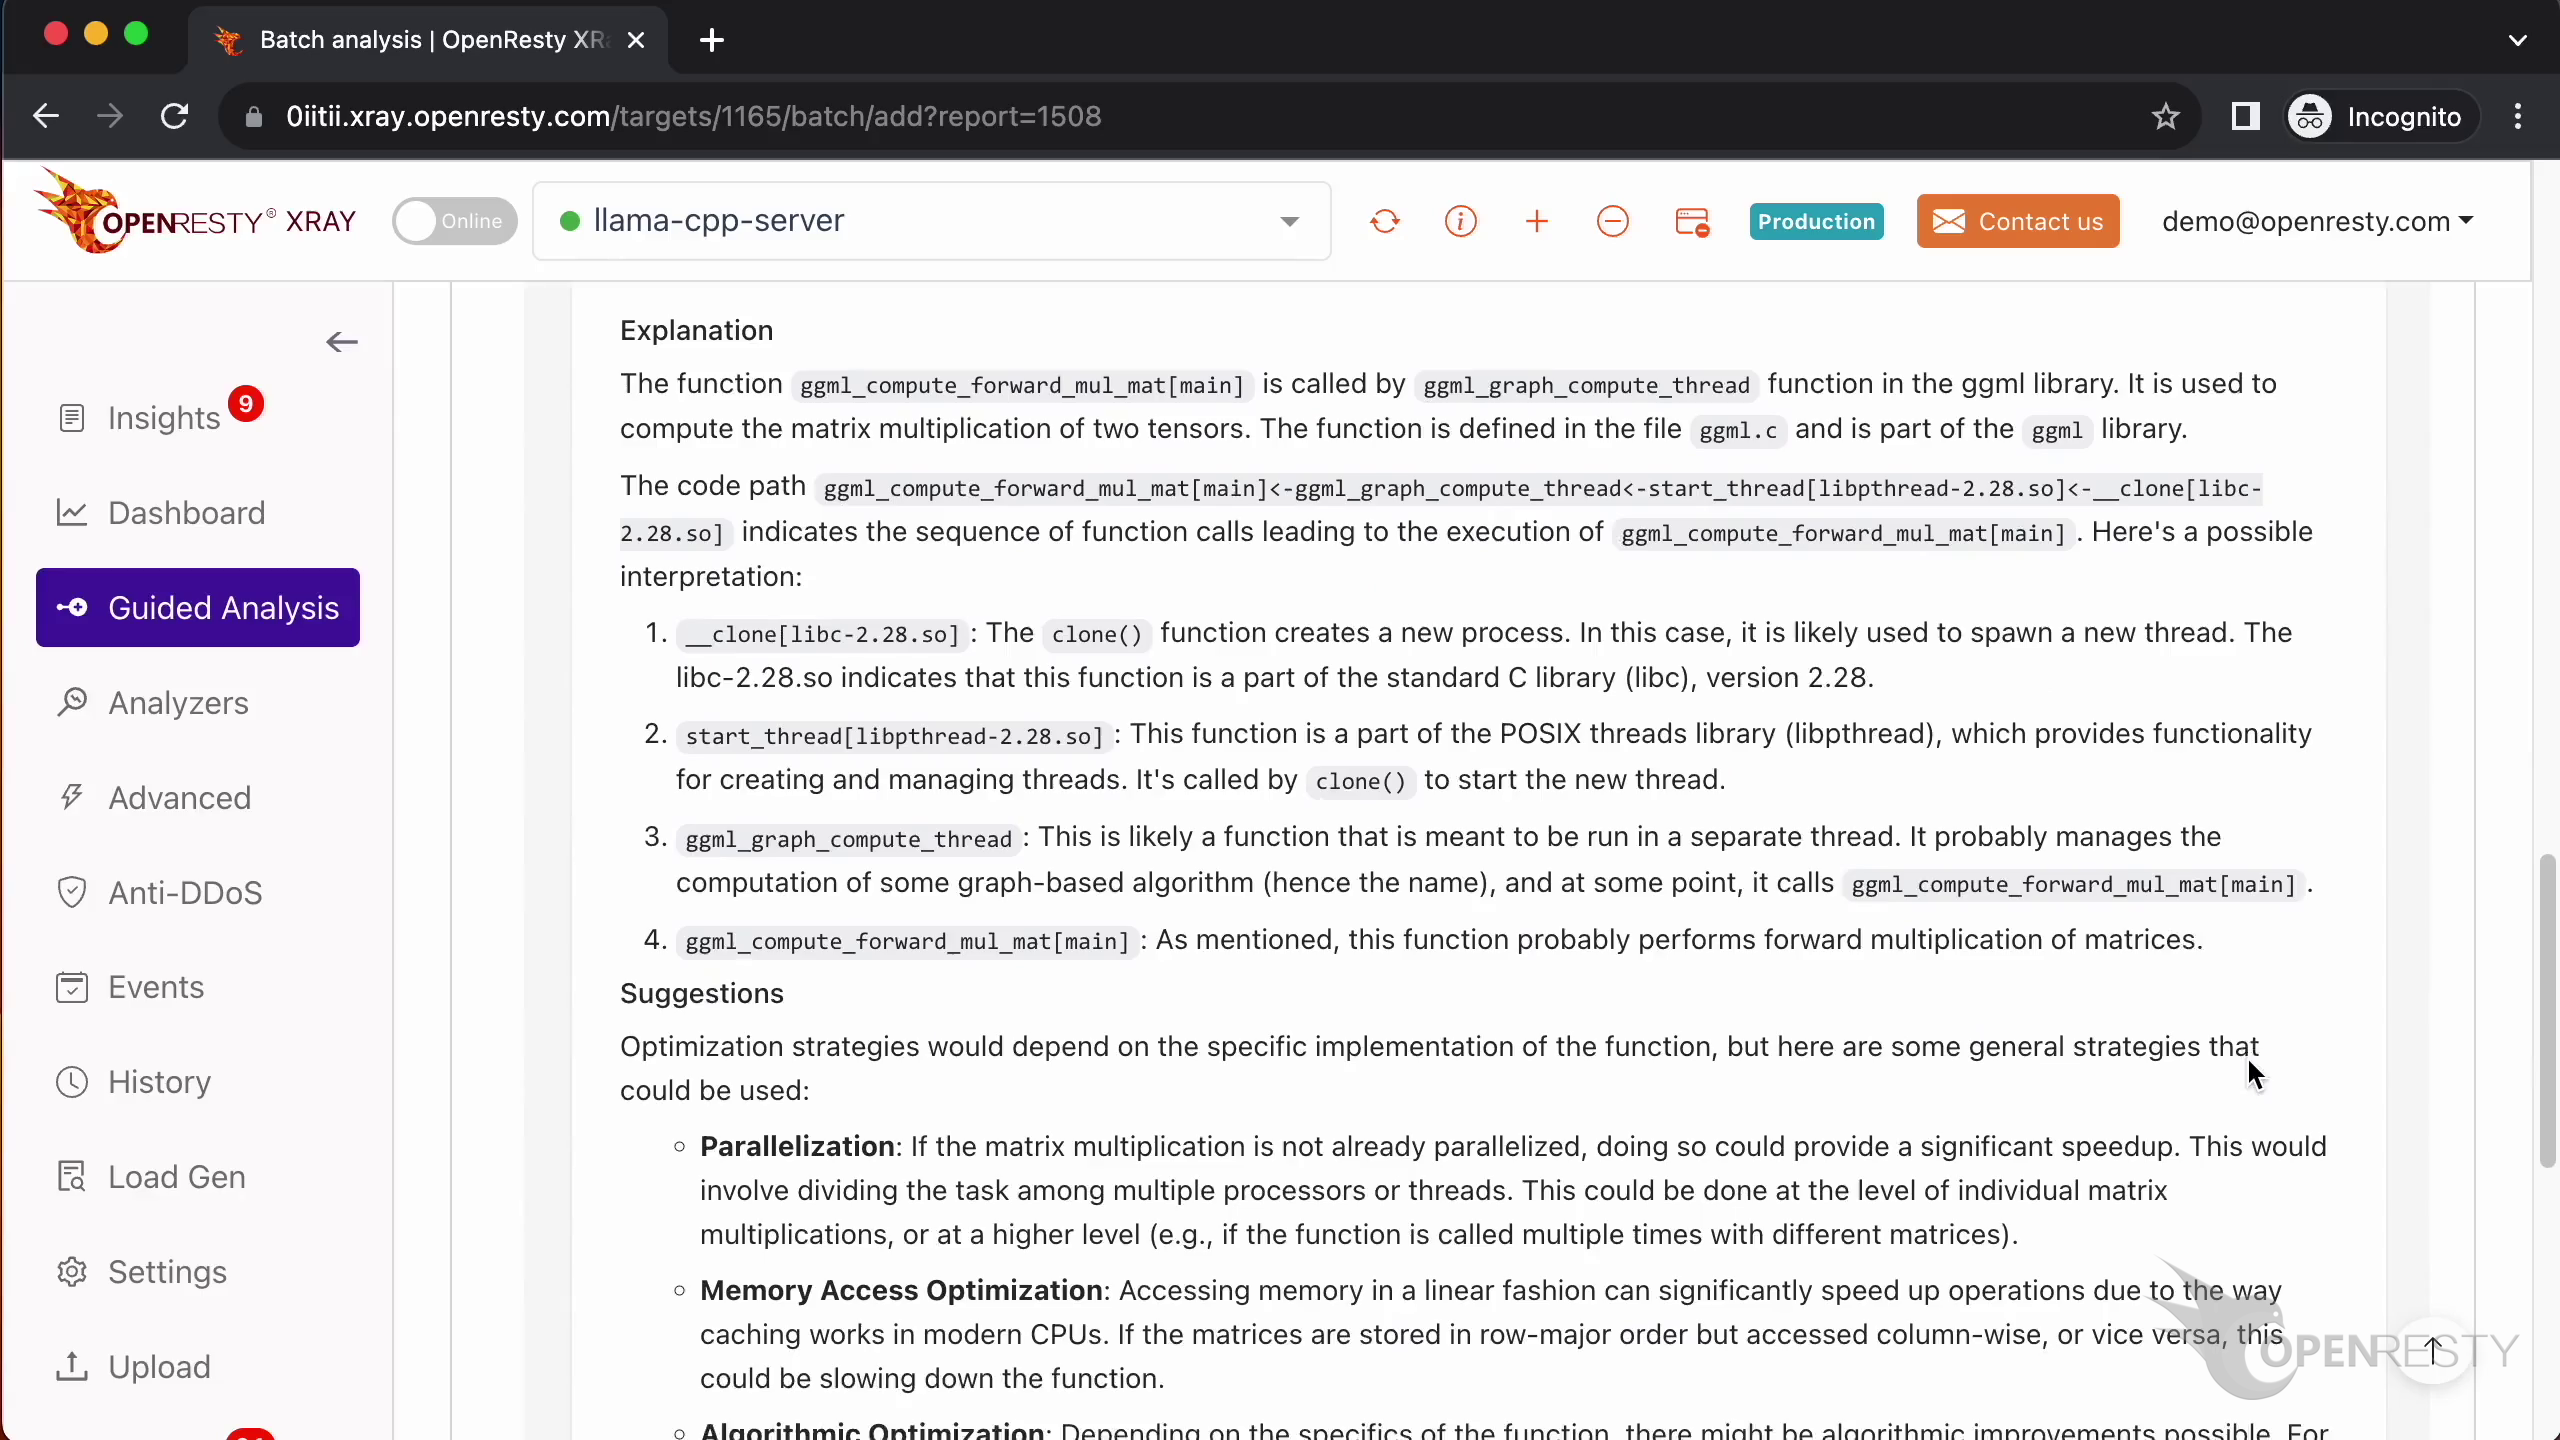
The BLAS suggestion is particularly relevant here — recall that the system_info output showed BLAS = 0, meaning llama.cpp is using its own GEMM implementation rather than an optimized BLAS library. Enabling OpenBLAS or Intel MKL at compile time could significantly reduce this hot path’s CPU share.
#2: ggml_vec_dot_q4_K_q8_K — 17.4% of CPU time
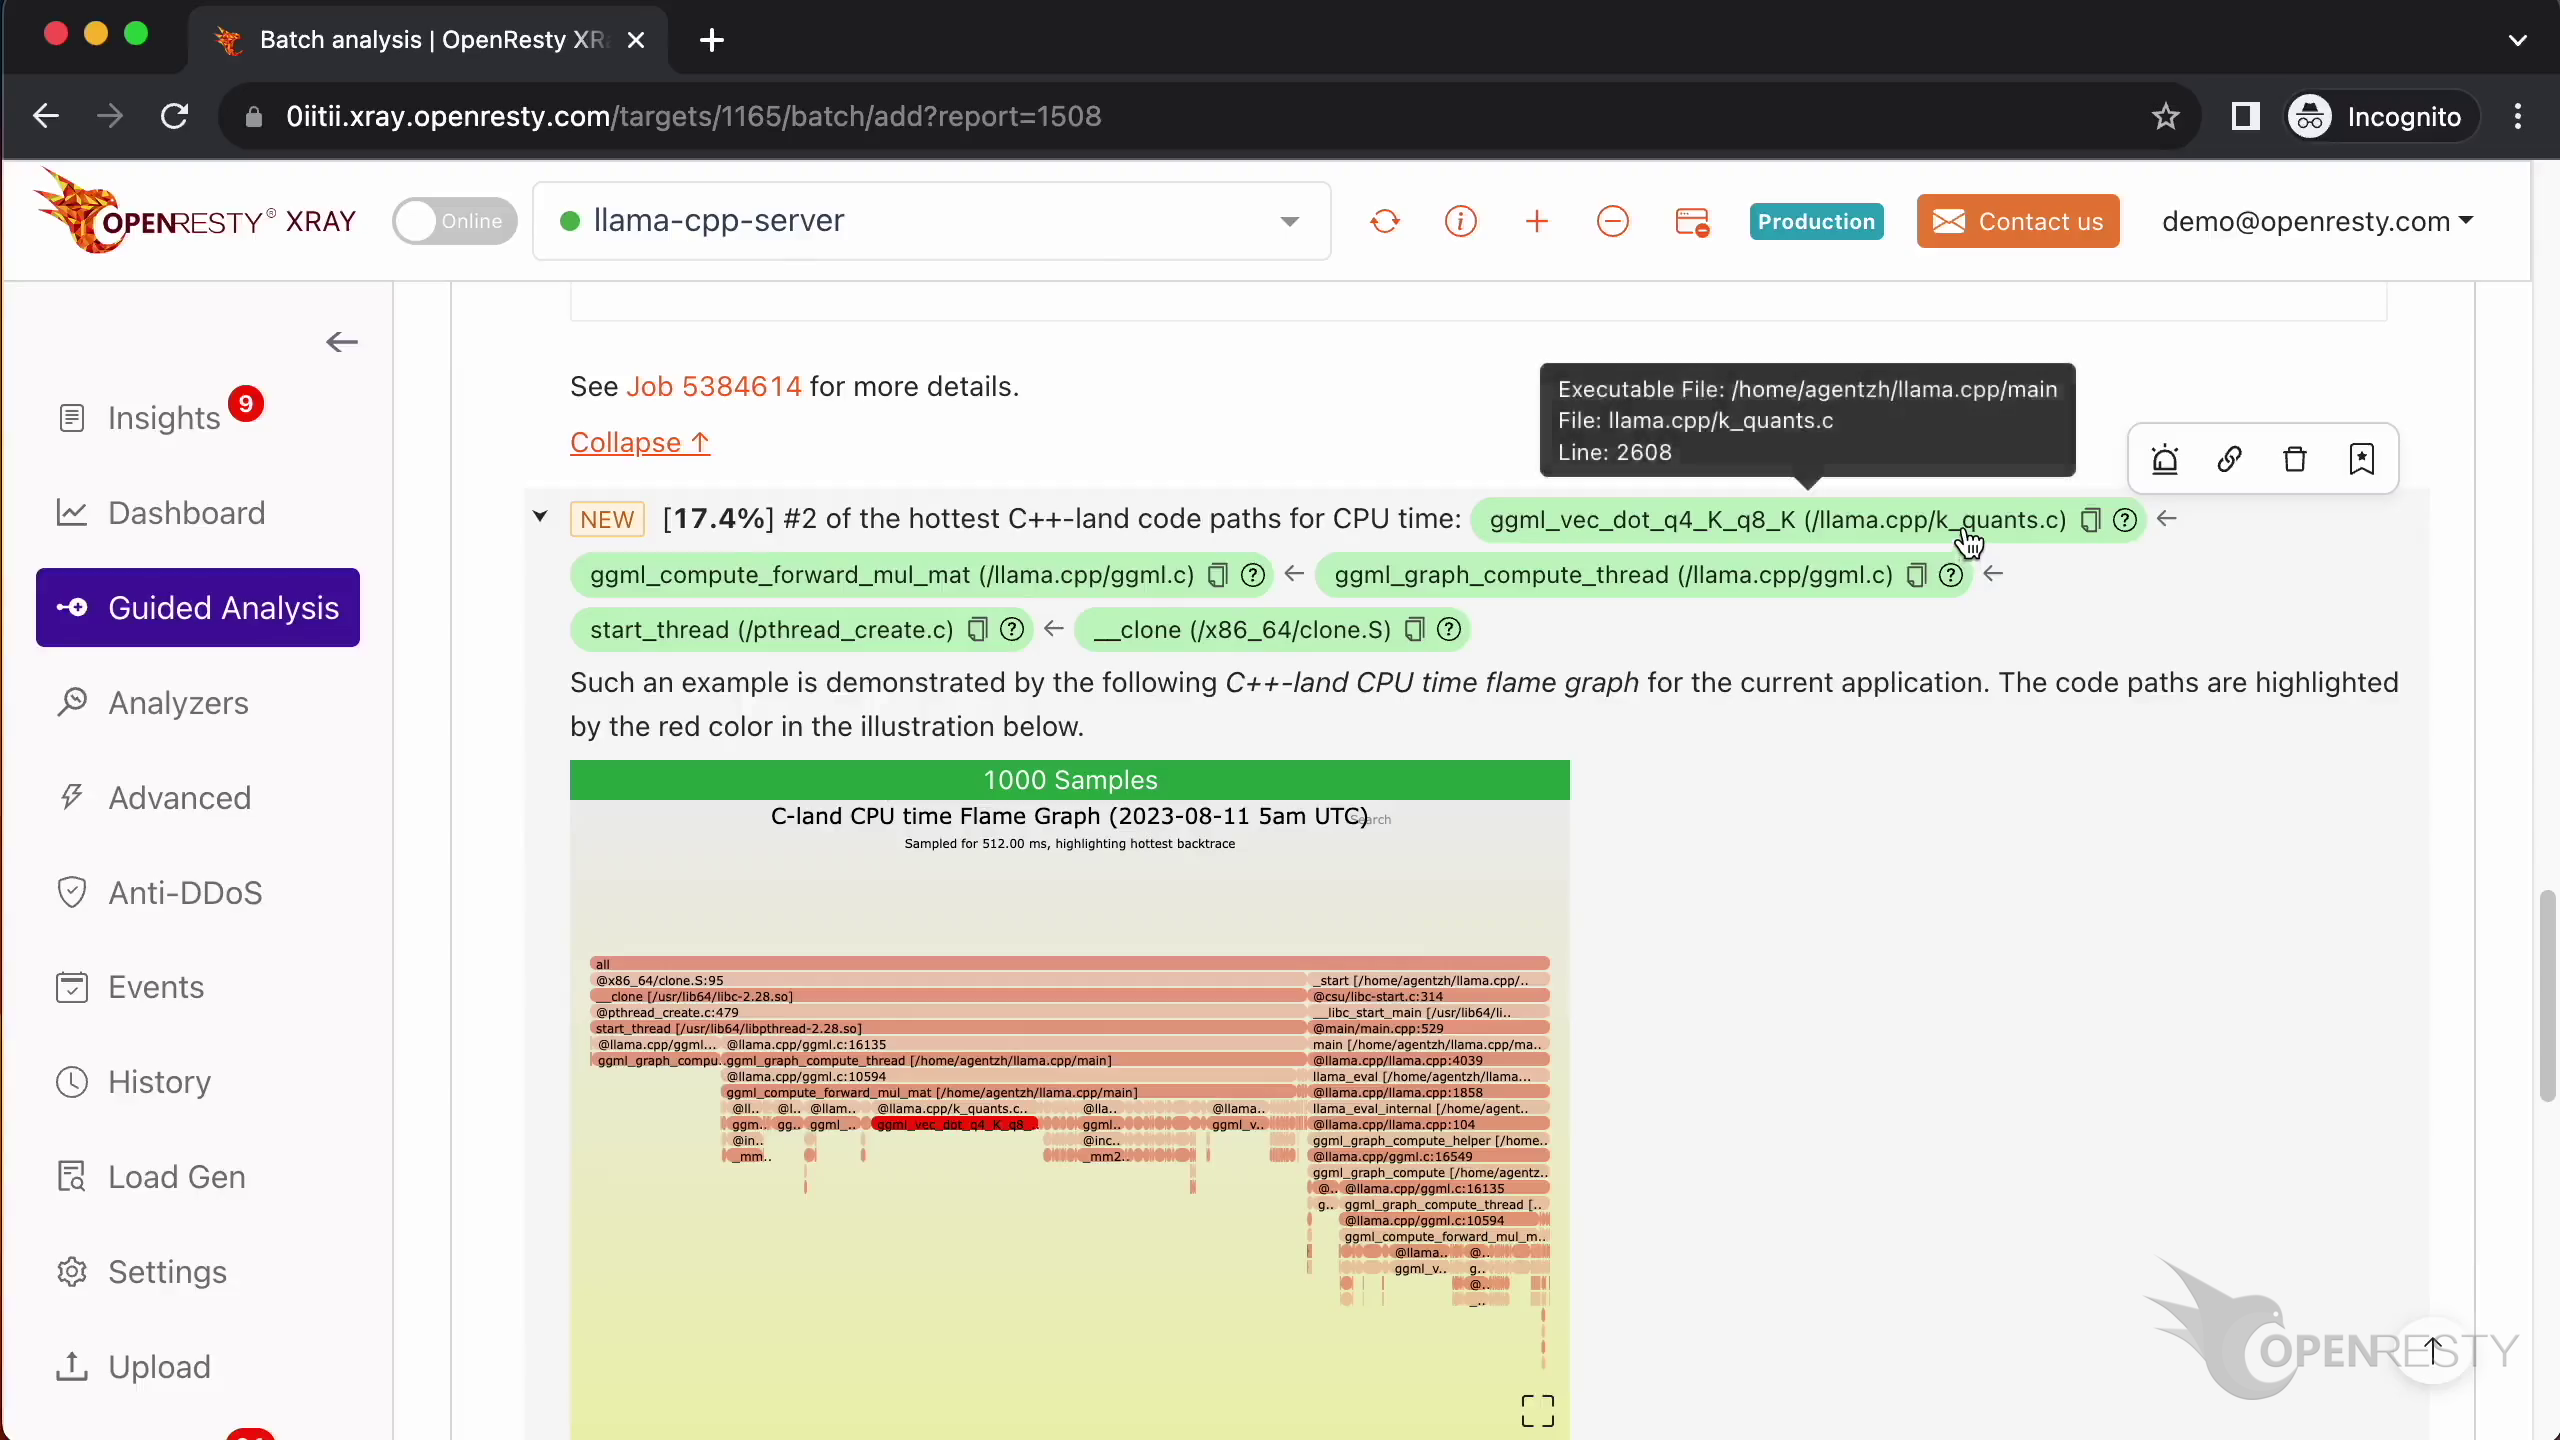
The second hottest path leads to ggml_vec_dot_q4_K_q8_K in k_quants.c:
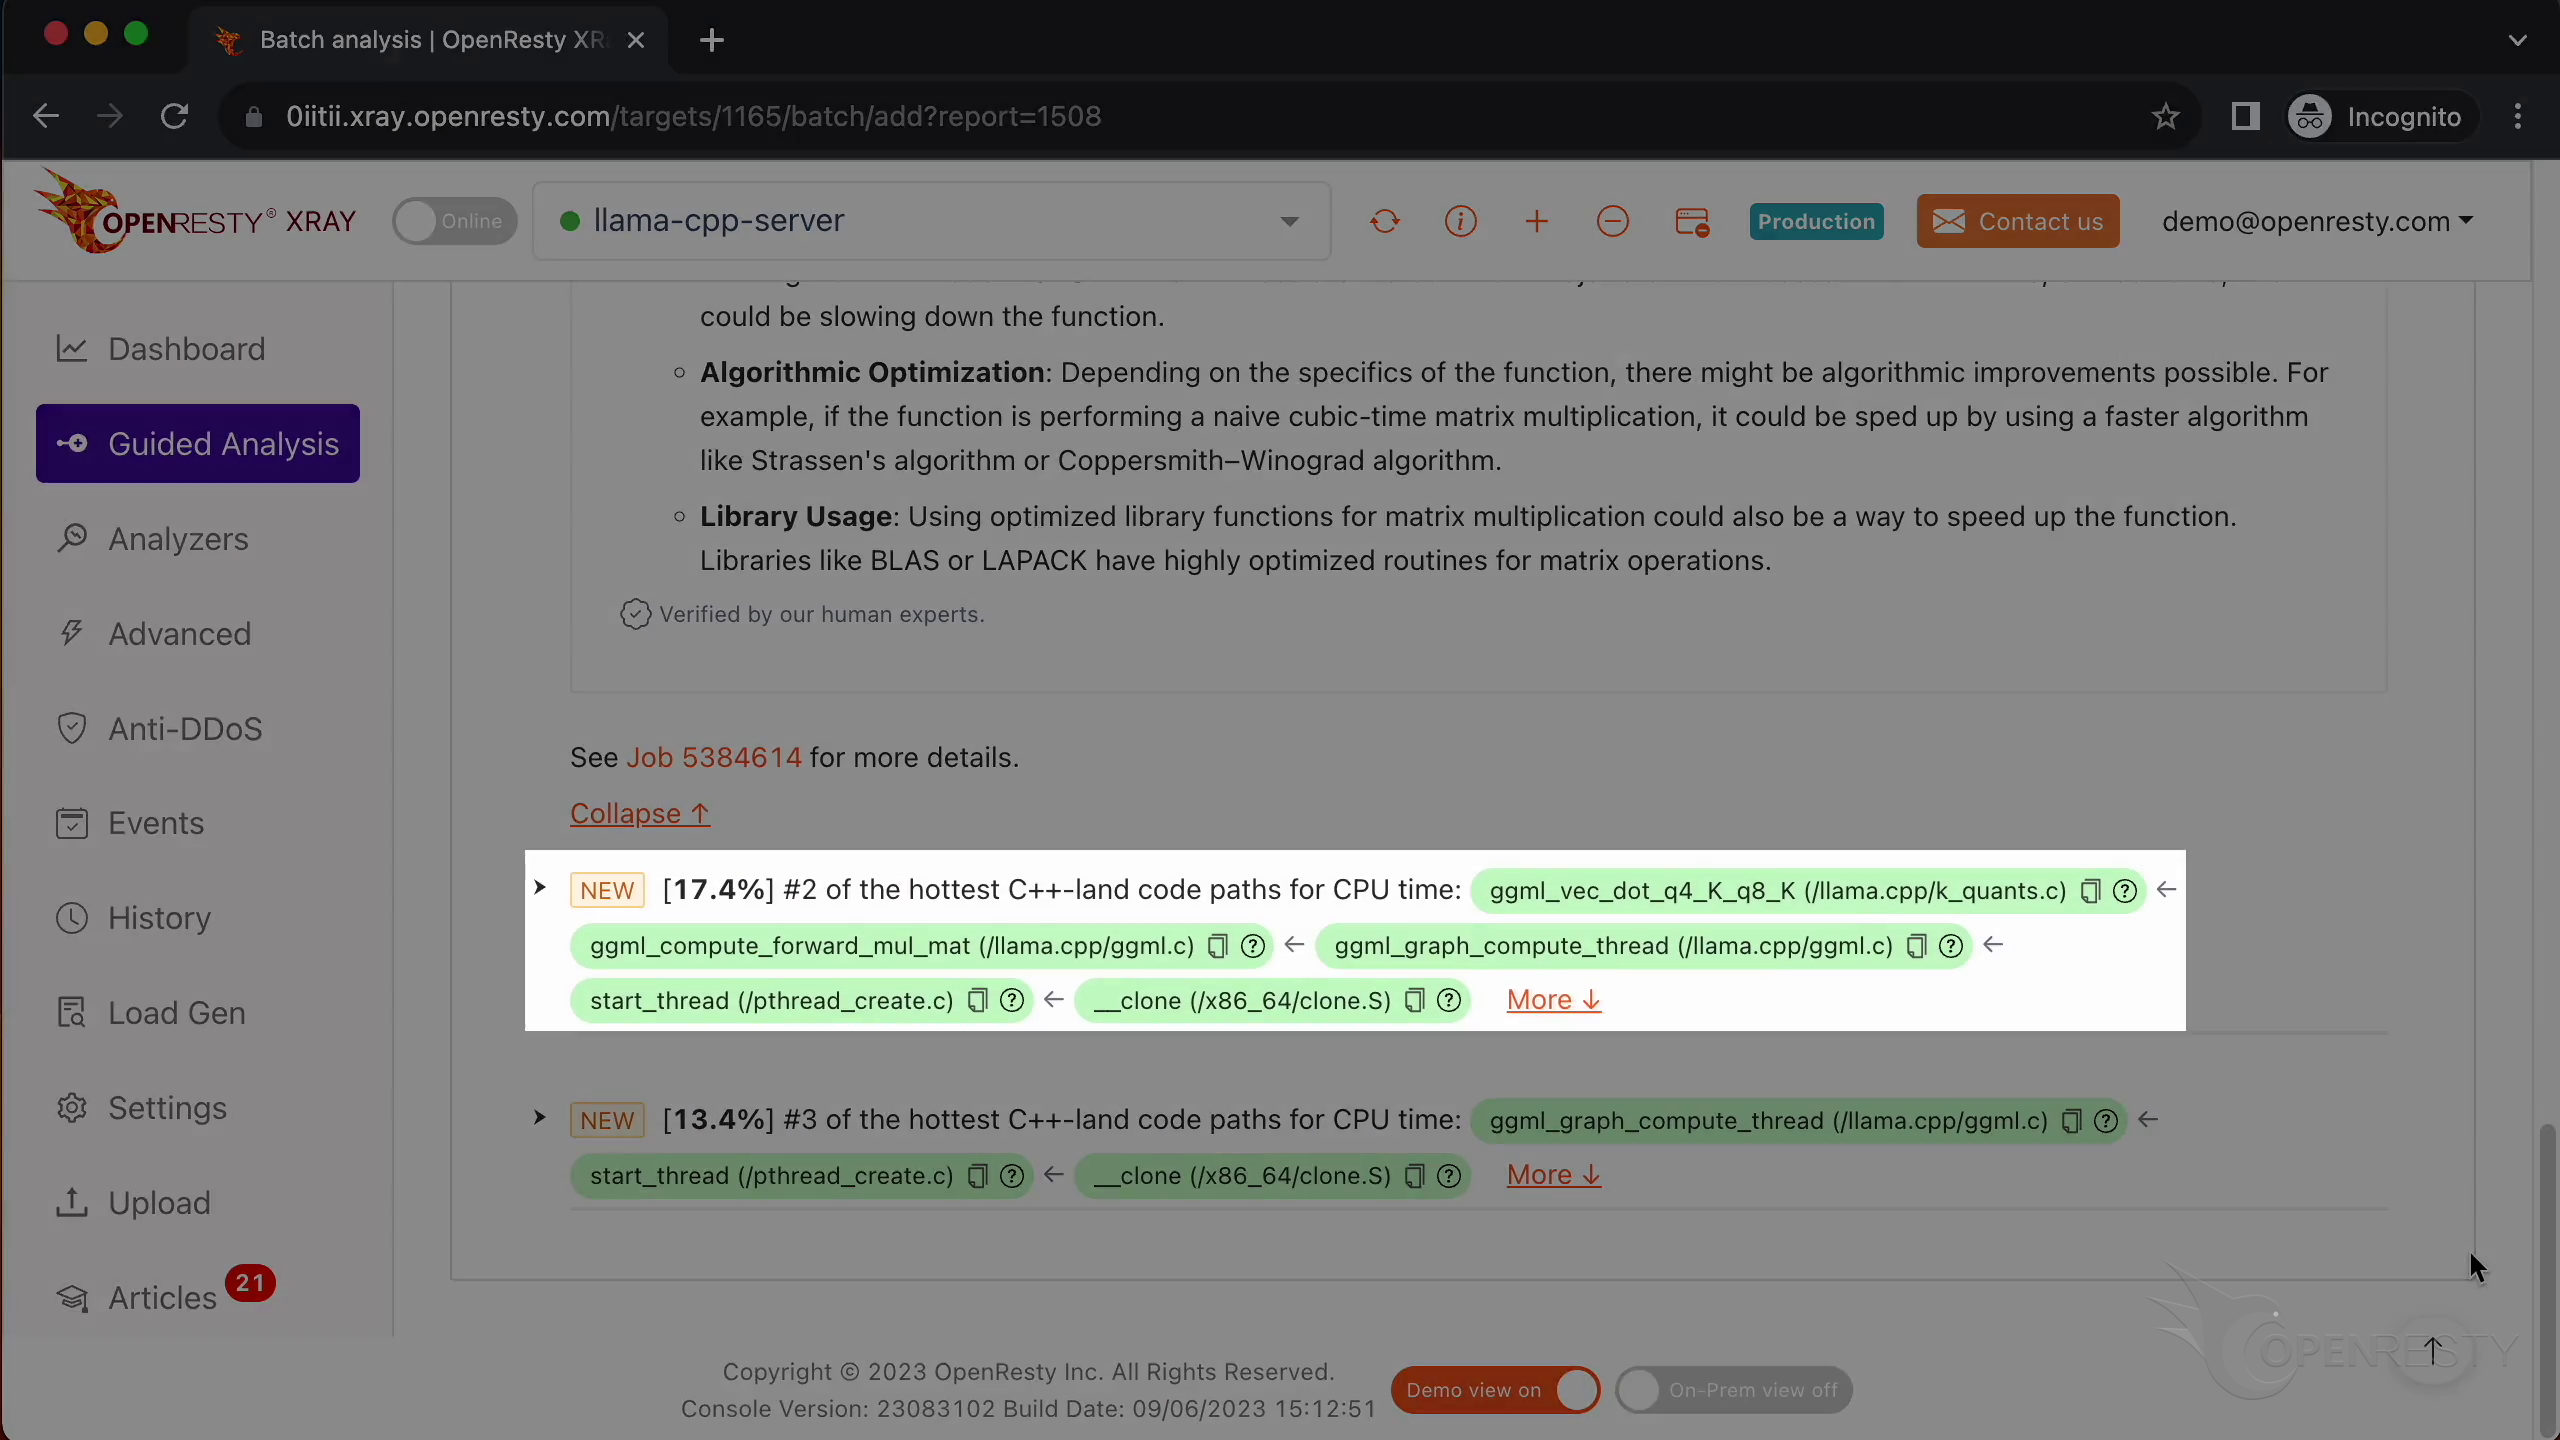
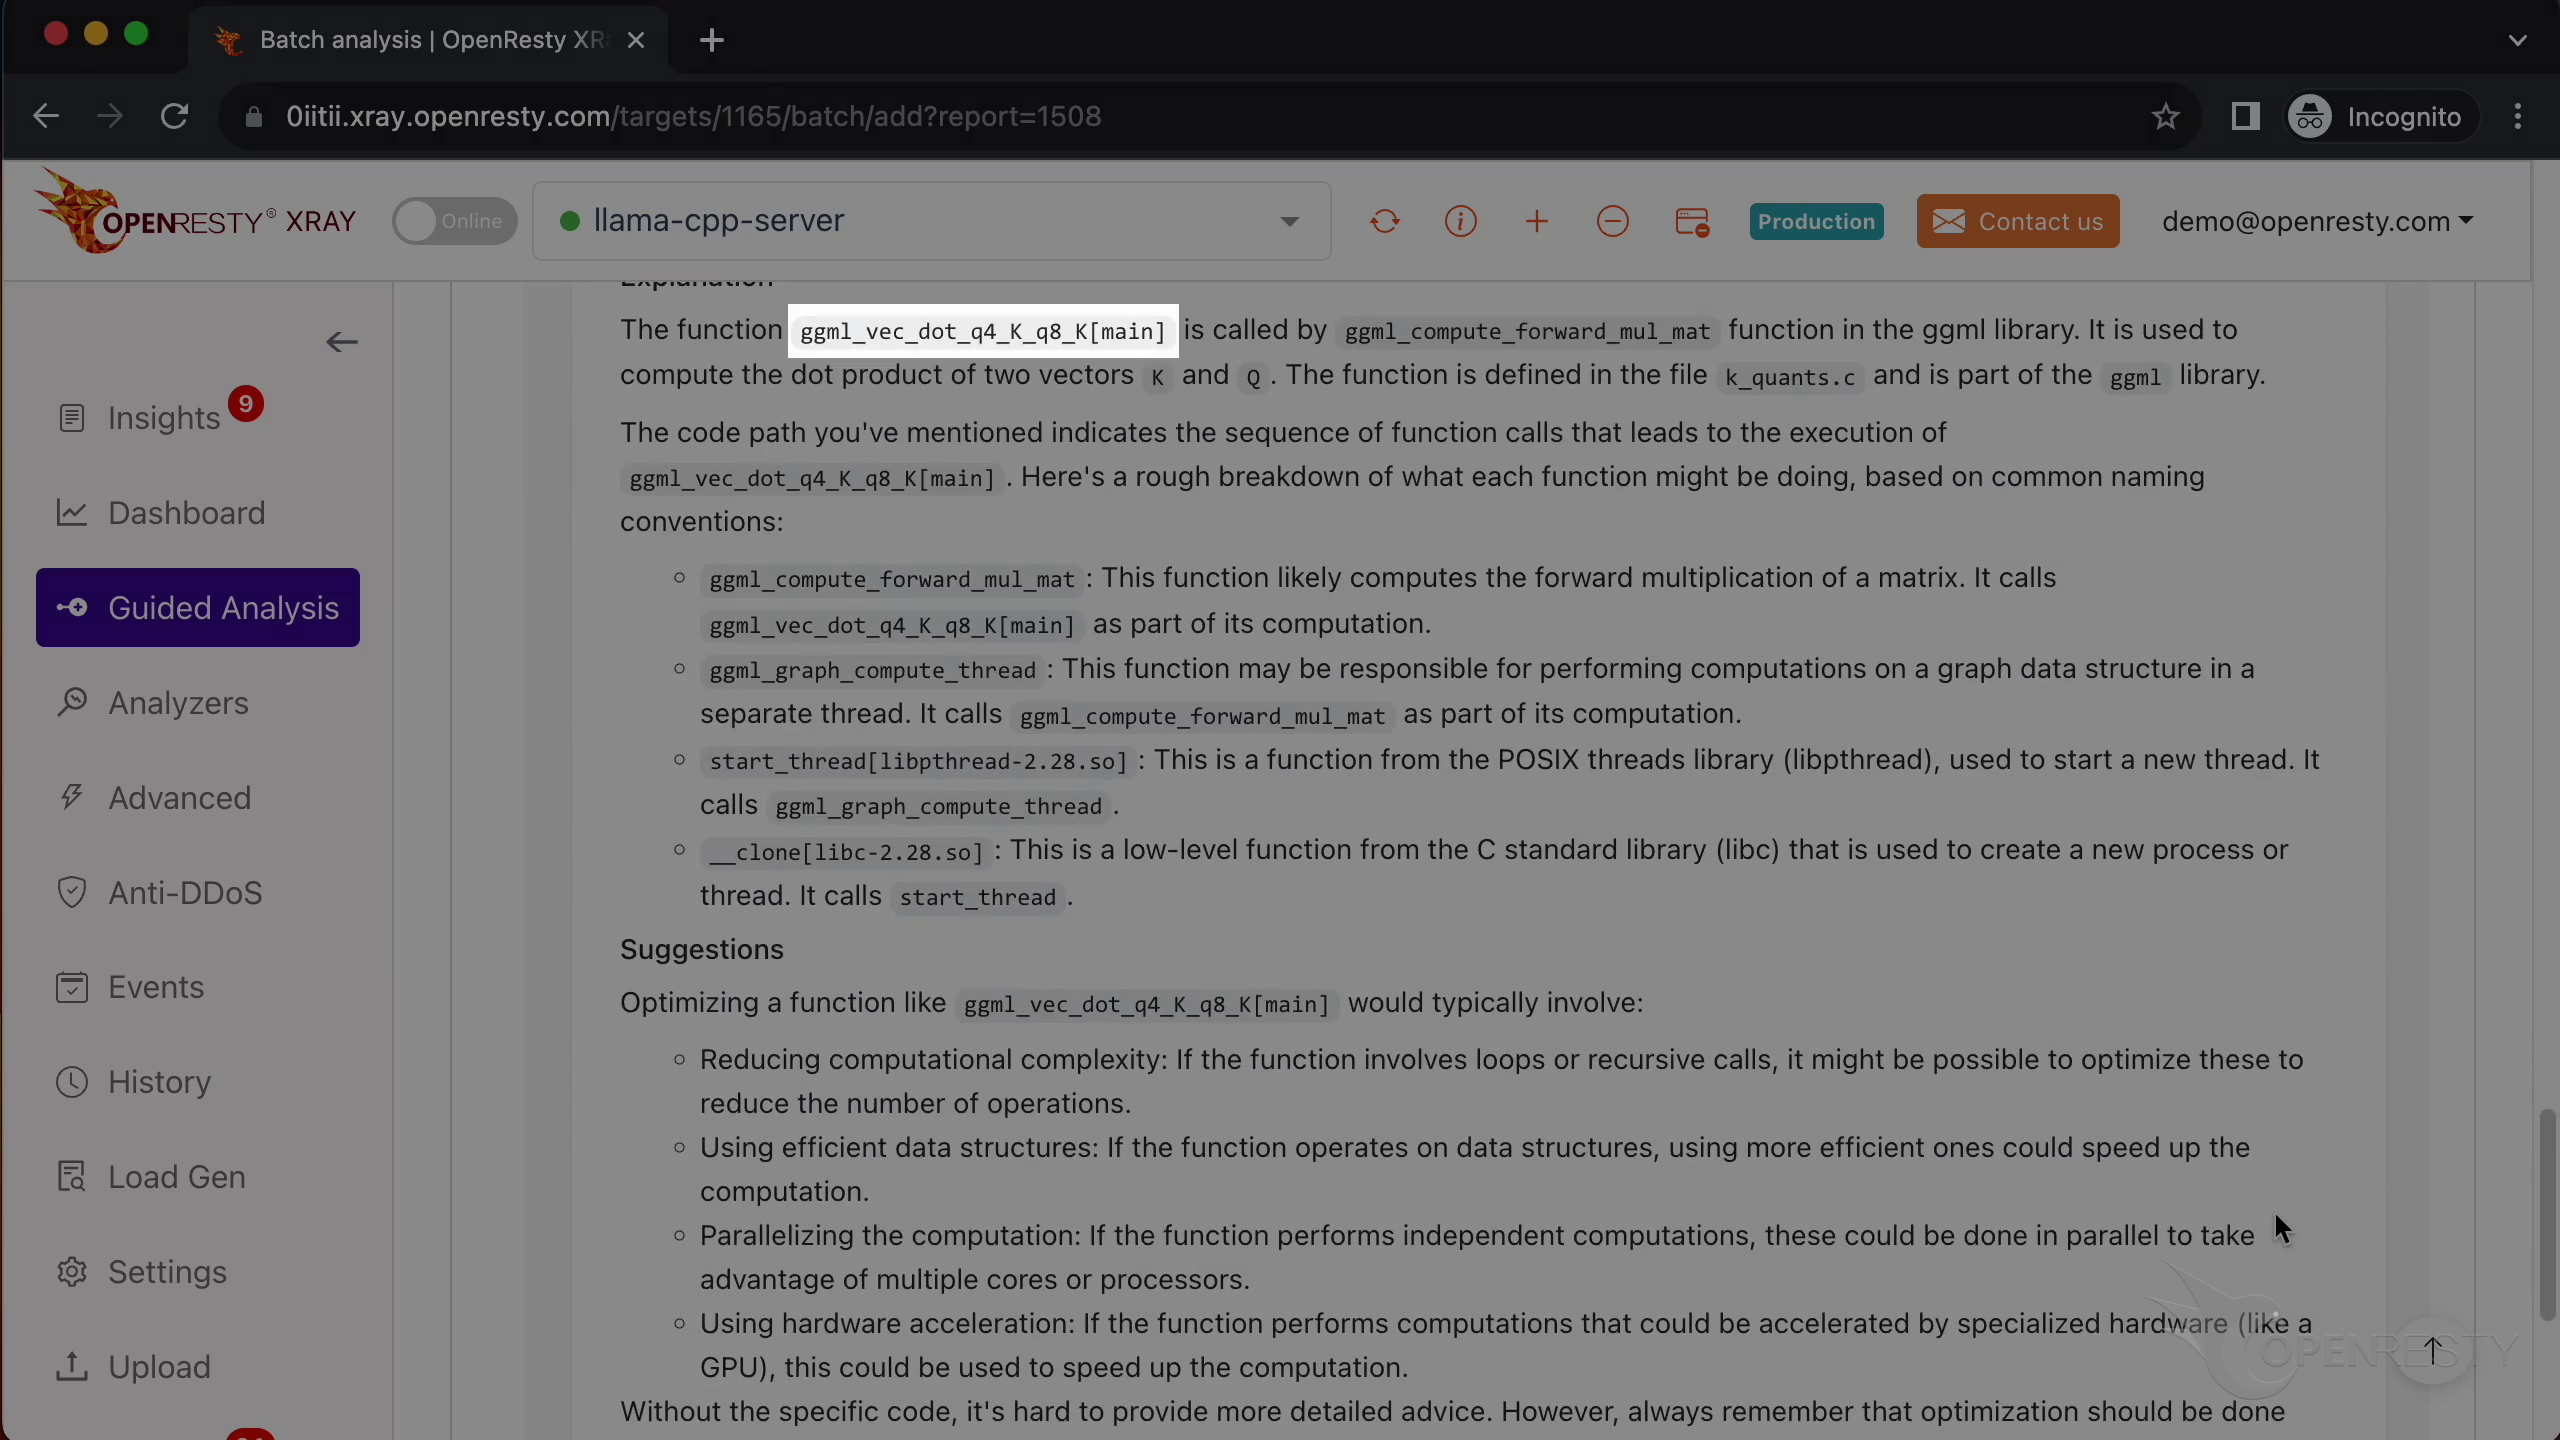
This function computes the dot product of two quantized vectors — K in 4-bit quantization (q4_K) and Q in 8-bit quantization (q8_K). Quantized dot products are how llama.cpp achieves the speed and memory savings that make running a 7B model on CPU feasible in the first place:
From profiling report to source code
OpenResty XRay maps each hot function back to its source file and line number. Hovering over the ggml_vec_dot_q4_K_q8_K function box in the report reveals a tooltip showing the exact location: llama.cpp/k_quants.c, line 2608:
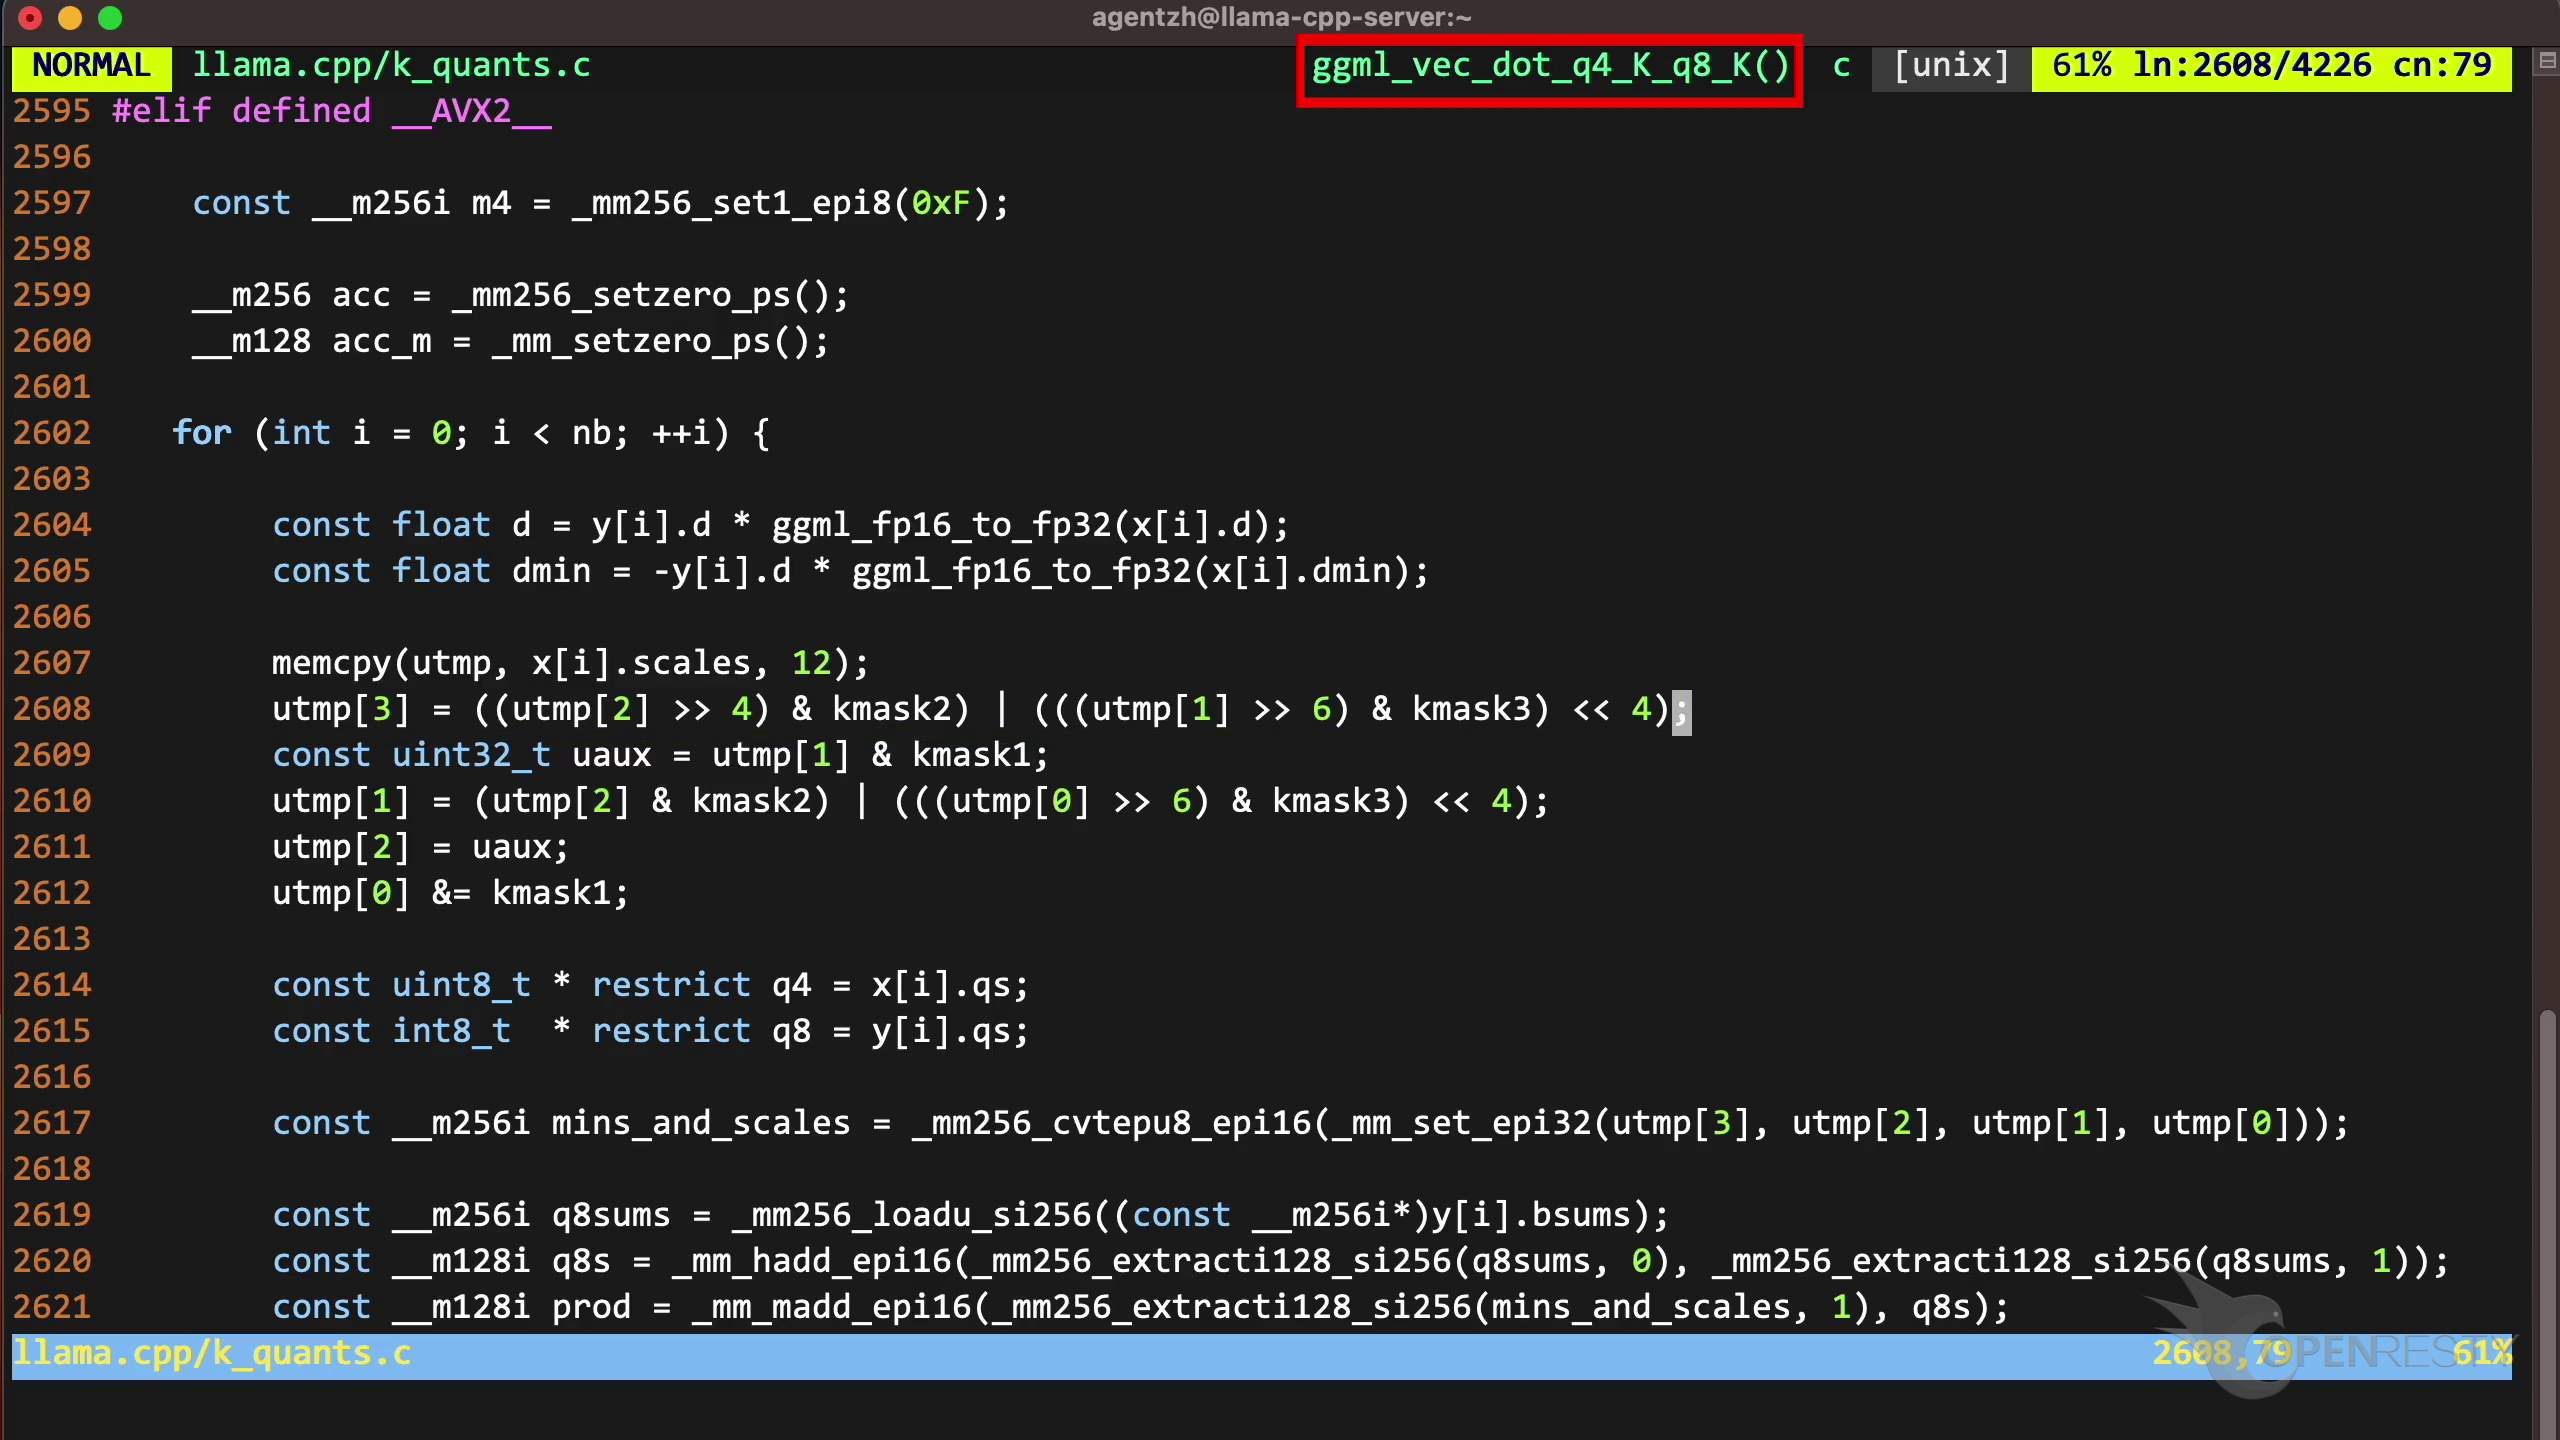
Opening k_quants.c and jumping to line 2608 as shown in the report tooltip:
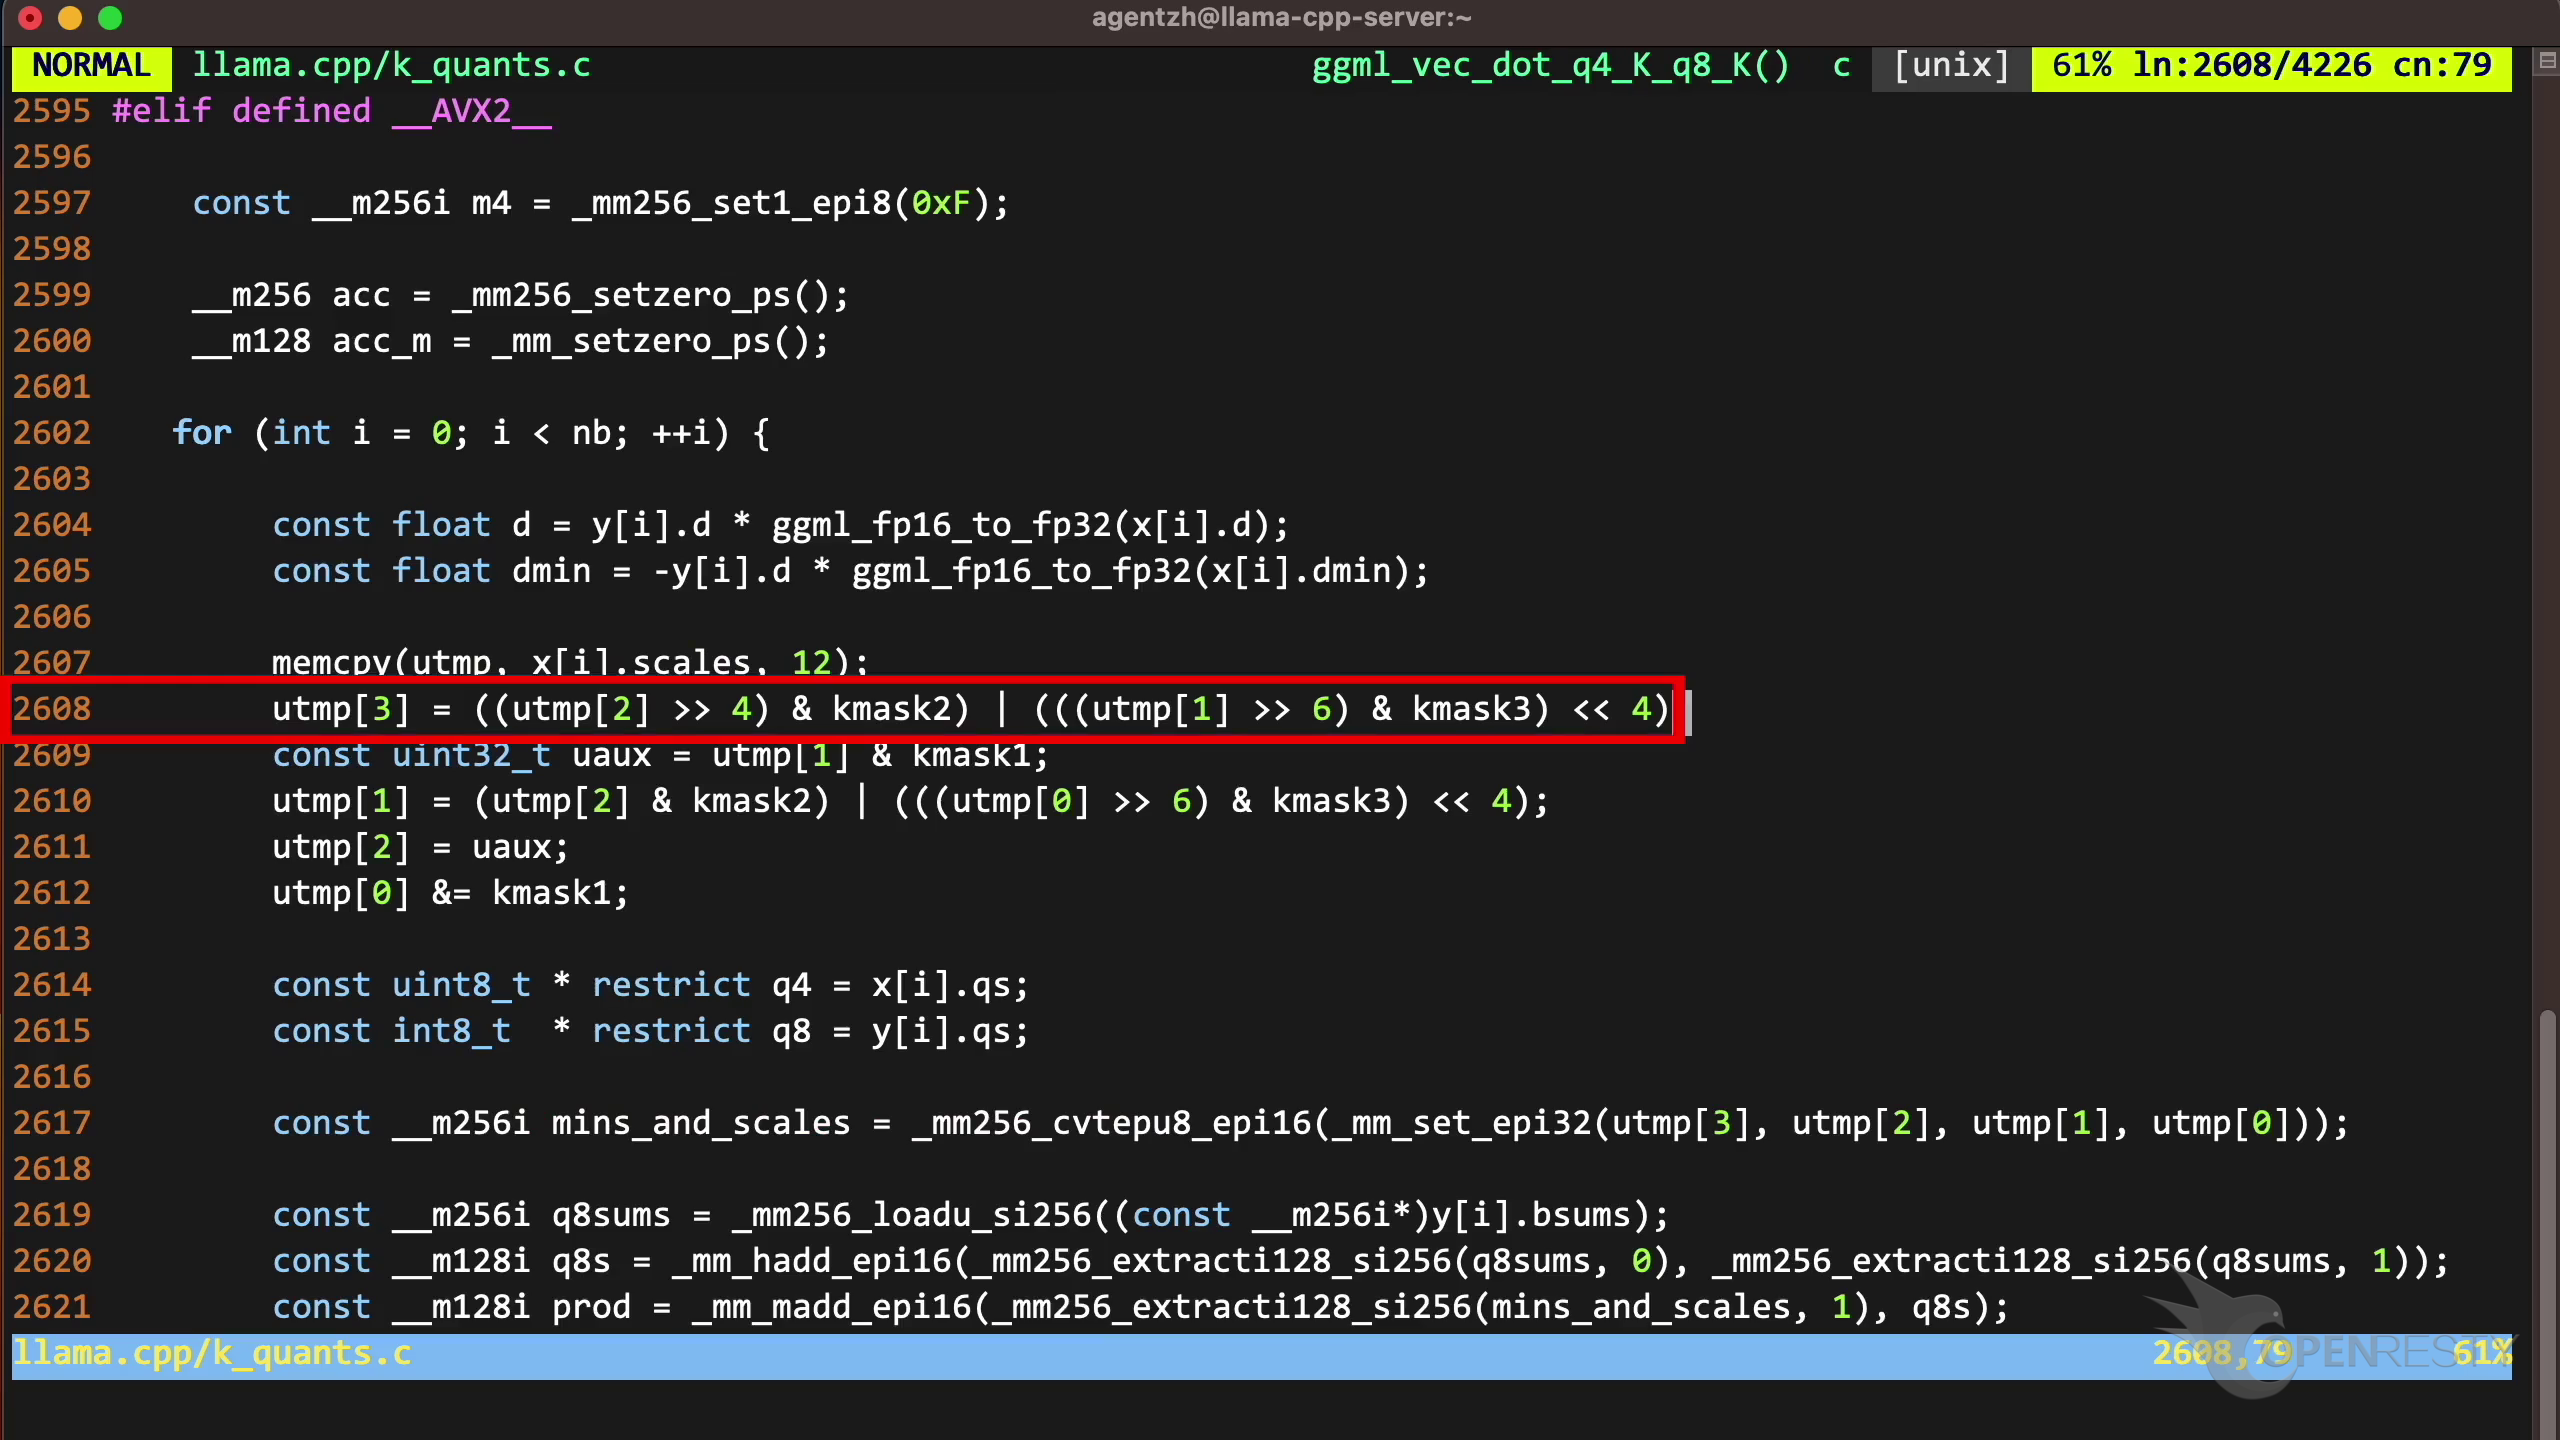
We can see that this line of code is using bitwise operations in C to perform some operations on the elements of an array — unpacking quantized scale factors from the packed 12-byte scales representation:
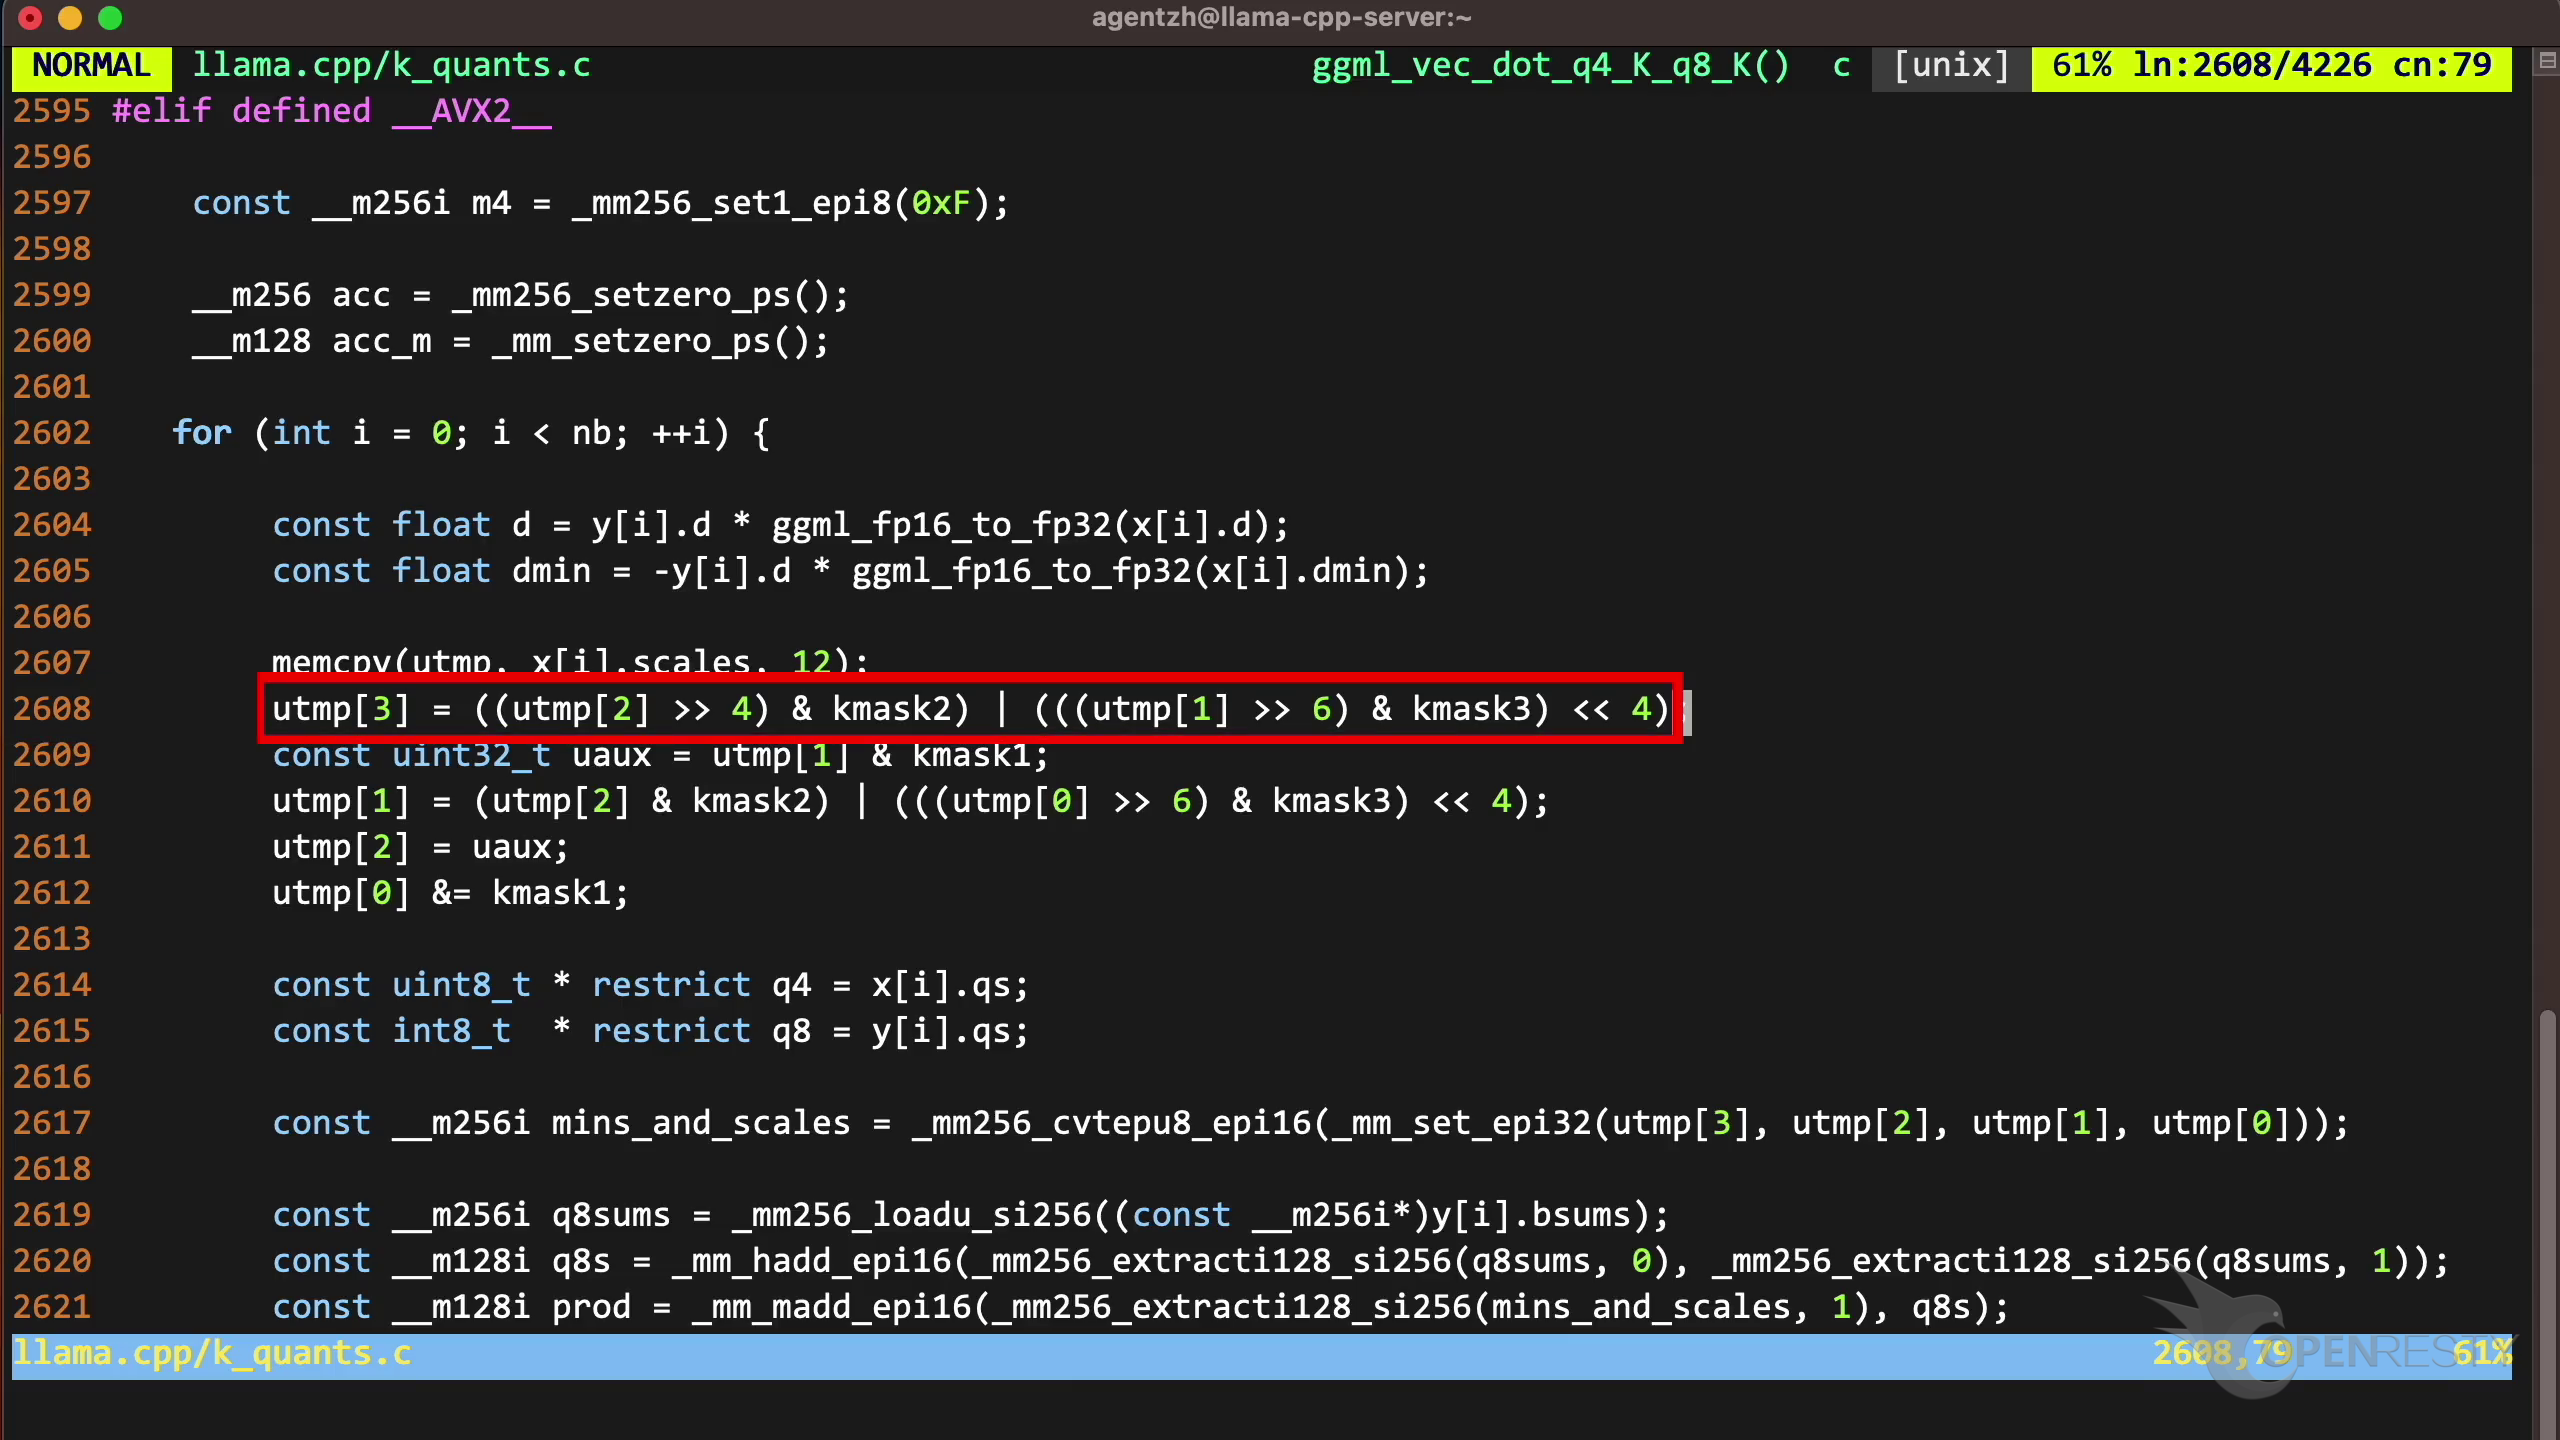
We see in the status bar that this line is in the function ggml_vec_dot_q4_K_q8_K, as shown in the report:
This level of precision — from a running process to the exact source line consuming CPU — is what makes dynamic-tracing profilers valuable for understanding where CPU time goes in compute-intensive applications like LLM inference.
Frequently Asked Questions
Why does llama.cpp use so much CPU?
llama.cpp performs inference on large language models primarily through matrix multiplications and quantized vector dot products. In our profiling of a LLaMA 2 7B run, the top CPU consumer was ggml_compute_forward_mul_mat — the general matrix multiplication kernel in the ggml library — followed by ggml_vec_dot_q4_K_q8_K, which computes the dot product of two quantized vectors. These operations are inherently compute-intensive; running inference on CPU easily reaches 400% utilization across multiple cores.
How can I profile llama.cpp CPU usage?
One approach is to use a dynamic-tracing profiler like OpenResty XRay, which can attach to a running, unmodified llama.cpp process and generate CPU flame graphs. The flame graph reveals exactly which C++ functions consume the most CPU time — down to the source file and line number — without modifying or instrumenting the running application.
What are the hottest C++ functions in llama.cpp?
In our analysis of llama.cpp running the quantized LLaMA 2 7B model, the #1 hottest code path was ggml_compute_forward_mul_mat (21.1% of CPU time), called from ggml_graph_compute_thread. The #2 path was ggml_vec_dot_q4_K_q8_K (17.4%) in k_quants.c (line 2608), performing bitwise operations on quantized array elements. Together with the #3 path (13.4%), these three code paths account for over half of all CPU time.
What is OpenResty XRay
OpenResty XRay is a dynamic-tracing product that automatically analyzes your running applications to troubleshoot performance problems, behavioral issues, and security vulnerabilities with actionable suggestions. Under the hood, OpenResty XRay is powered by our Y language targeting various runtimes like Stap+, eBPF+, GDB, and ODB, depending on the contexts.
If you like this tutorial, please subscribe to this blog site and/or our YouTube channel. Thank you!
About The Author
Yichun Zhang (Github handle: agentzh), is the original creator of the OpenResty® open-source project and the CEO of OpenResty Inc..
Yichun is one of the earliest advocates and leaders of “open-source technology”. He worked at many internationally renowned tech companies, such as Cloudflare, Yahoo!. He is a pioneer of “edge computing”, “dynamic tracing” and “machine coding”, with over 22 years of programming and 16 years of open source experience. Yichun is well-known in the open-source space as the project leader of OpenResty®, adopted by more than 40 million global website domains.
OpenResty Inc., the enterprise software start-up founded by Yichun in 2017, has customers from some of the biggest companies in the world. Its flagship product, OpenResty XRay, is a non-invasive profiling and troubleshooting tool that significantly enhances and utilizes dynamic tracing technology. And its OpenResty Edge product is a powerful distributed traffic management and private CDN software product.
As an avid open-source contributor, Yichun has contributed more than a million lines of code to numerous open-source projects, including Linux kernel, Nginx, LuaJIT, GDB, SystemTap, LLVM, Perl, etc. He has also authored more than 60 open-source software libraries.
Related Articles
OpenResty XRay Dec 25, 2023

OpenResty XRay Sep 28, 2023

OpenResty XRay Aug 23, 2023

OpenResty XRay Aug 4, 2023

OpenResty XRay Jul 28, 2023