Laravel High CPU Usage: Why Even Hello World Burns Half Its CPU
Why Does Laravel Use So Much CPU?
Even a minimal Laravel “hello world” application spends the majority of its CPU time outside your application code. Laravel CPU profiling with OpenResty XRay reveals that service provider boot and registration is the number one CPU consumer — not your route handler. Specifically:
- #1 hottest PHP code path (36.4% CPU):
bootProvider— Laravel boots every registered service provider (the Carbon date library, Ignition, and others) on every single request. - #2 hottest PHP code path (14.5% CPU):
register— the service provider registration and resolution process (resolveProvider,DatabaseServiceProvider::register, etc.) also runs on every new request. - #3 hottest PHP code path (12.8% CPU): the actual “hello world” response — only a fraction of the CPU goes to your own code.
In other words, in a typical Laravel high CPU usage scenario, framework bootstrap overhead dominates. The tutorial below walks through exactly how to identify these hot paths using OpenResty XRay CPU flame graphs, so you can see where optimization effort should go in your own application.
If you are troubleshooting high CPU in PHP applications more broadly, many of the same profiling techniques apply.
The walkthrough below shows how we produced these findings — from selecting the target PHP process to reading the PHP-land CPU flame graphs — so you can repeat the same analysis on your own Laravel application.
The Test Setup: A Hello World App at 100% CPU
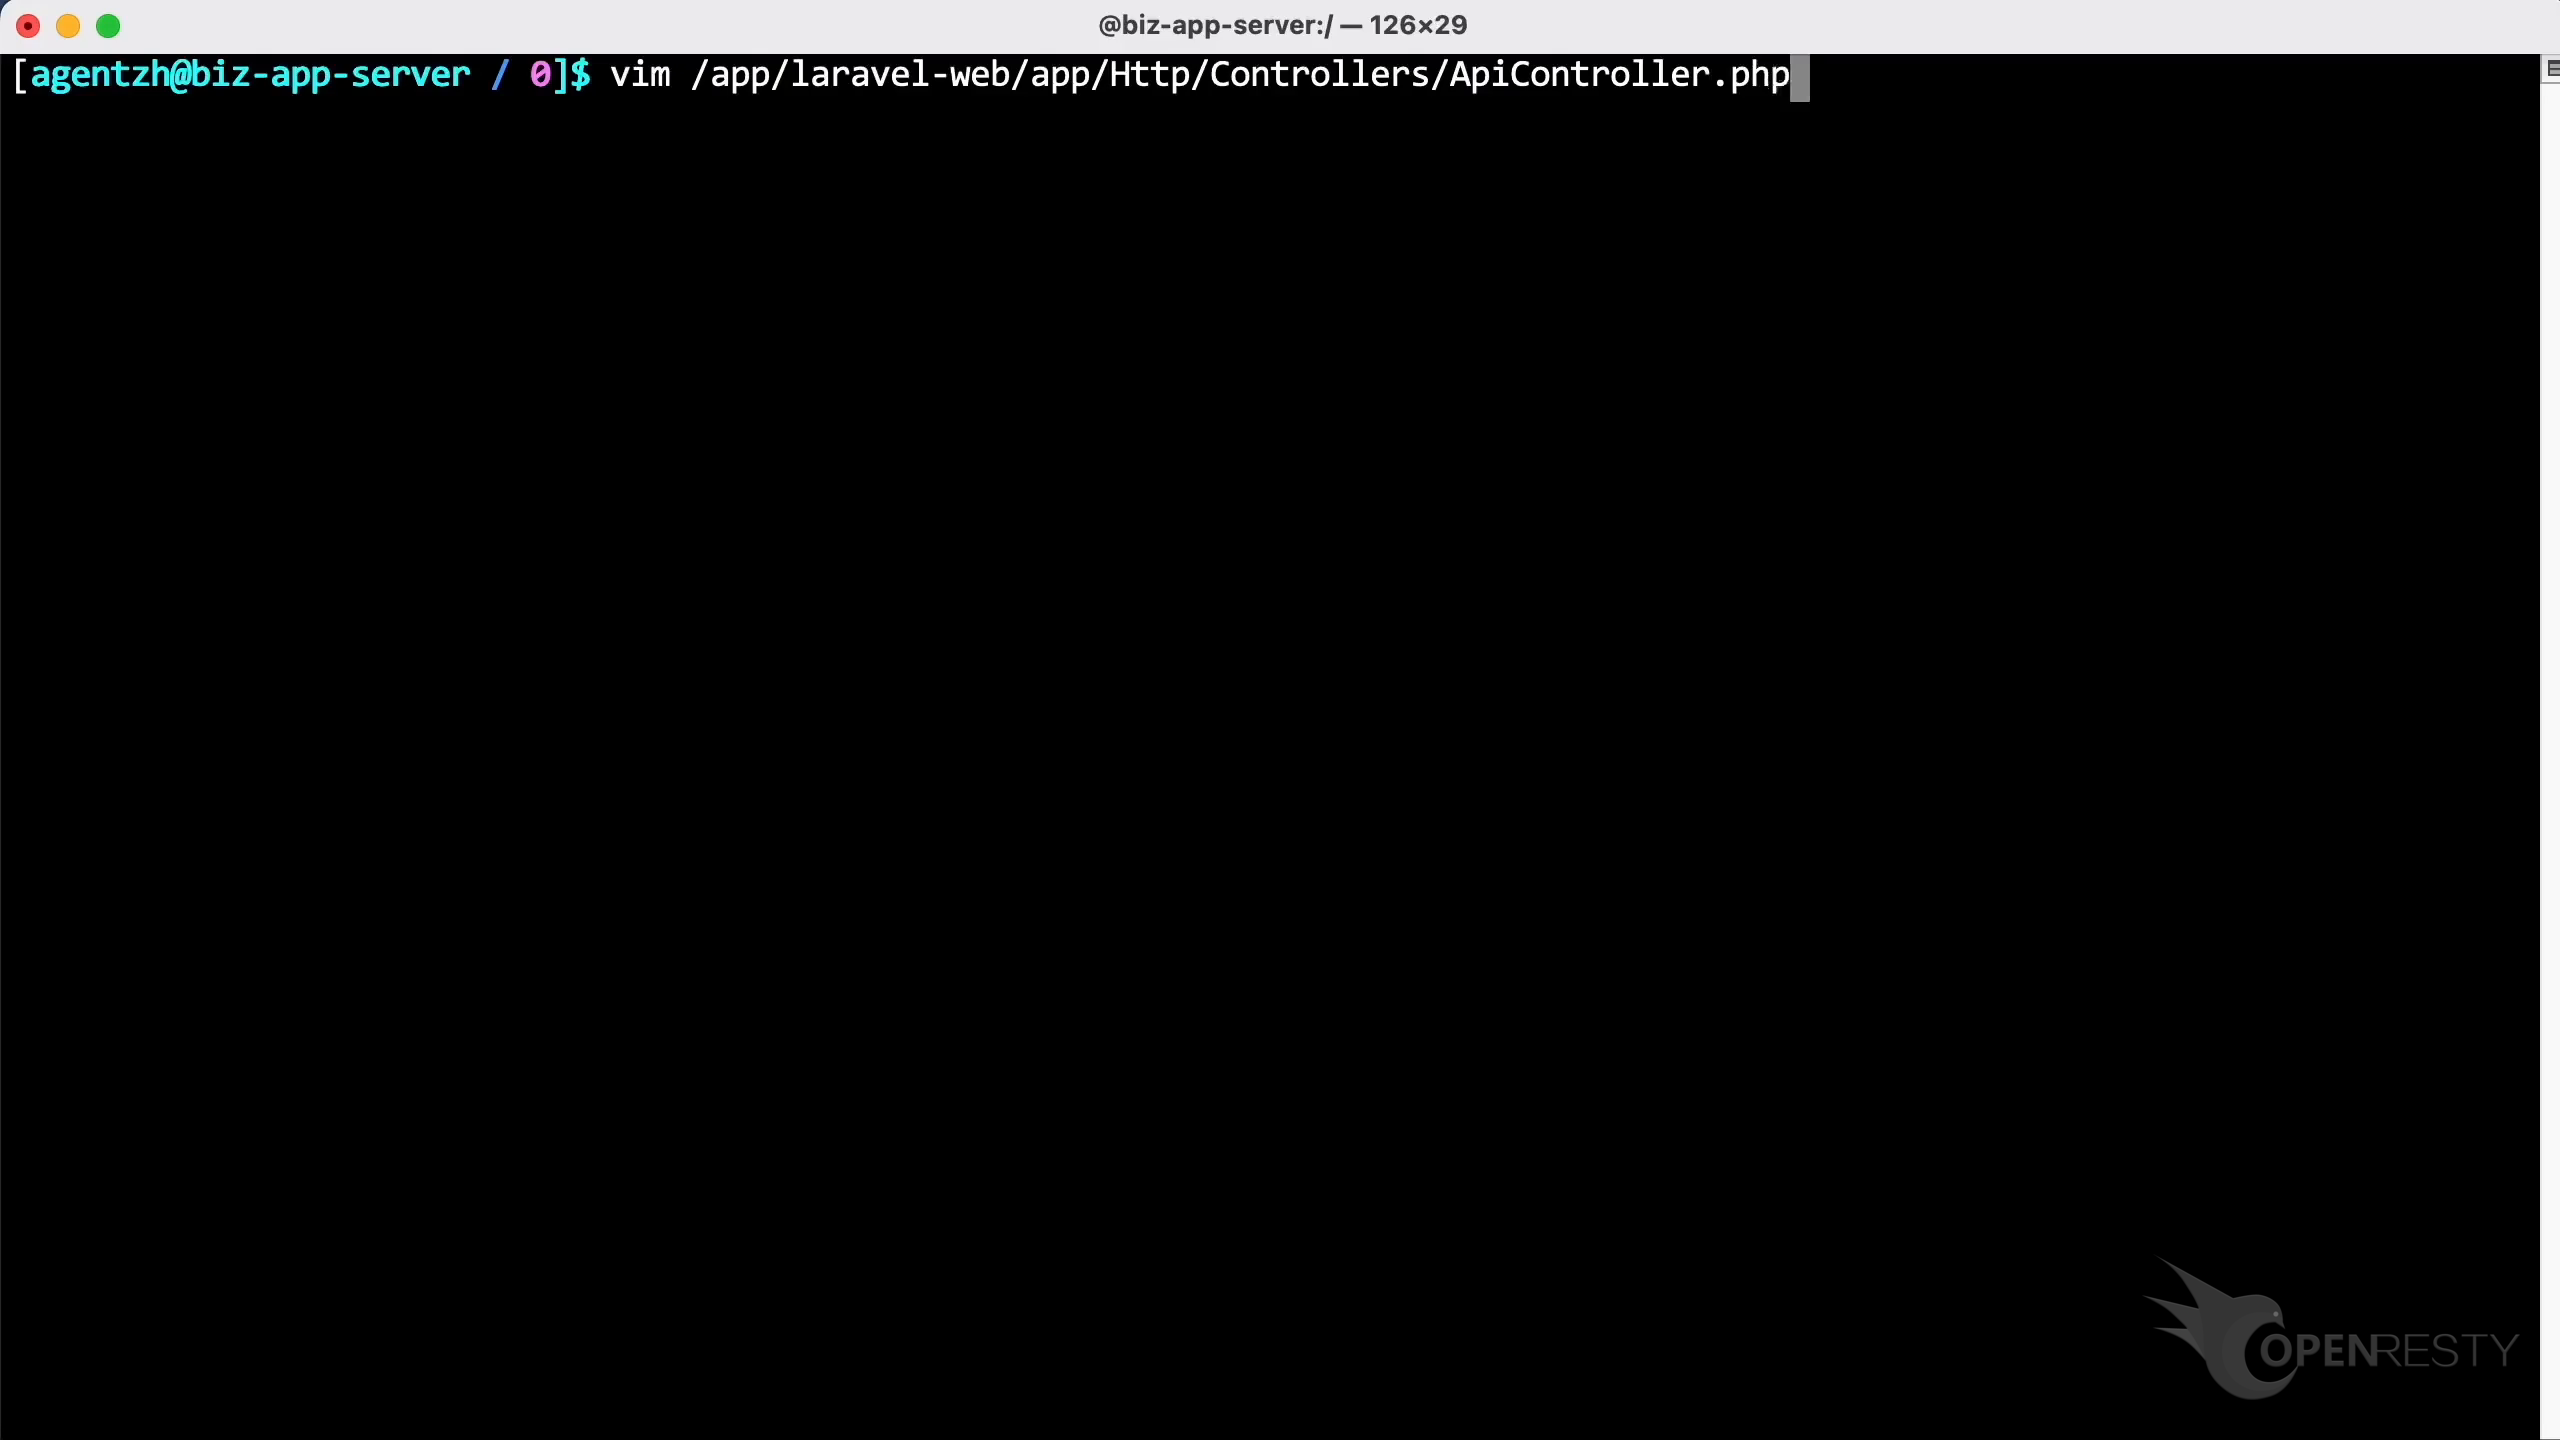
We prepared a hello world web application using PHP’s Laravel framework.
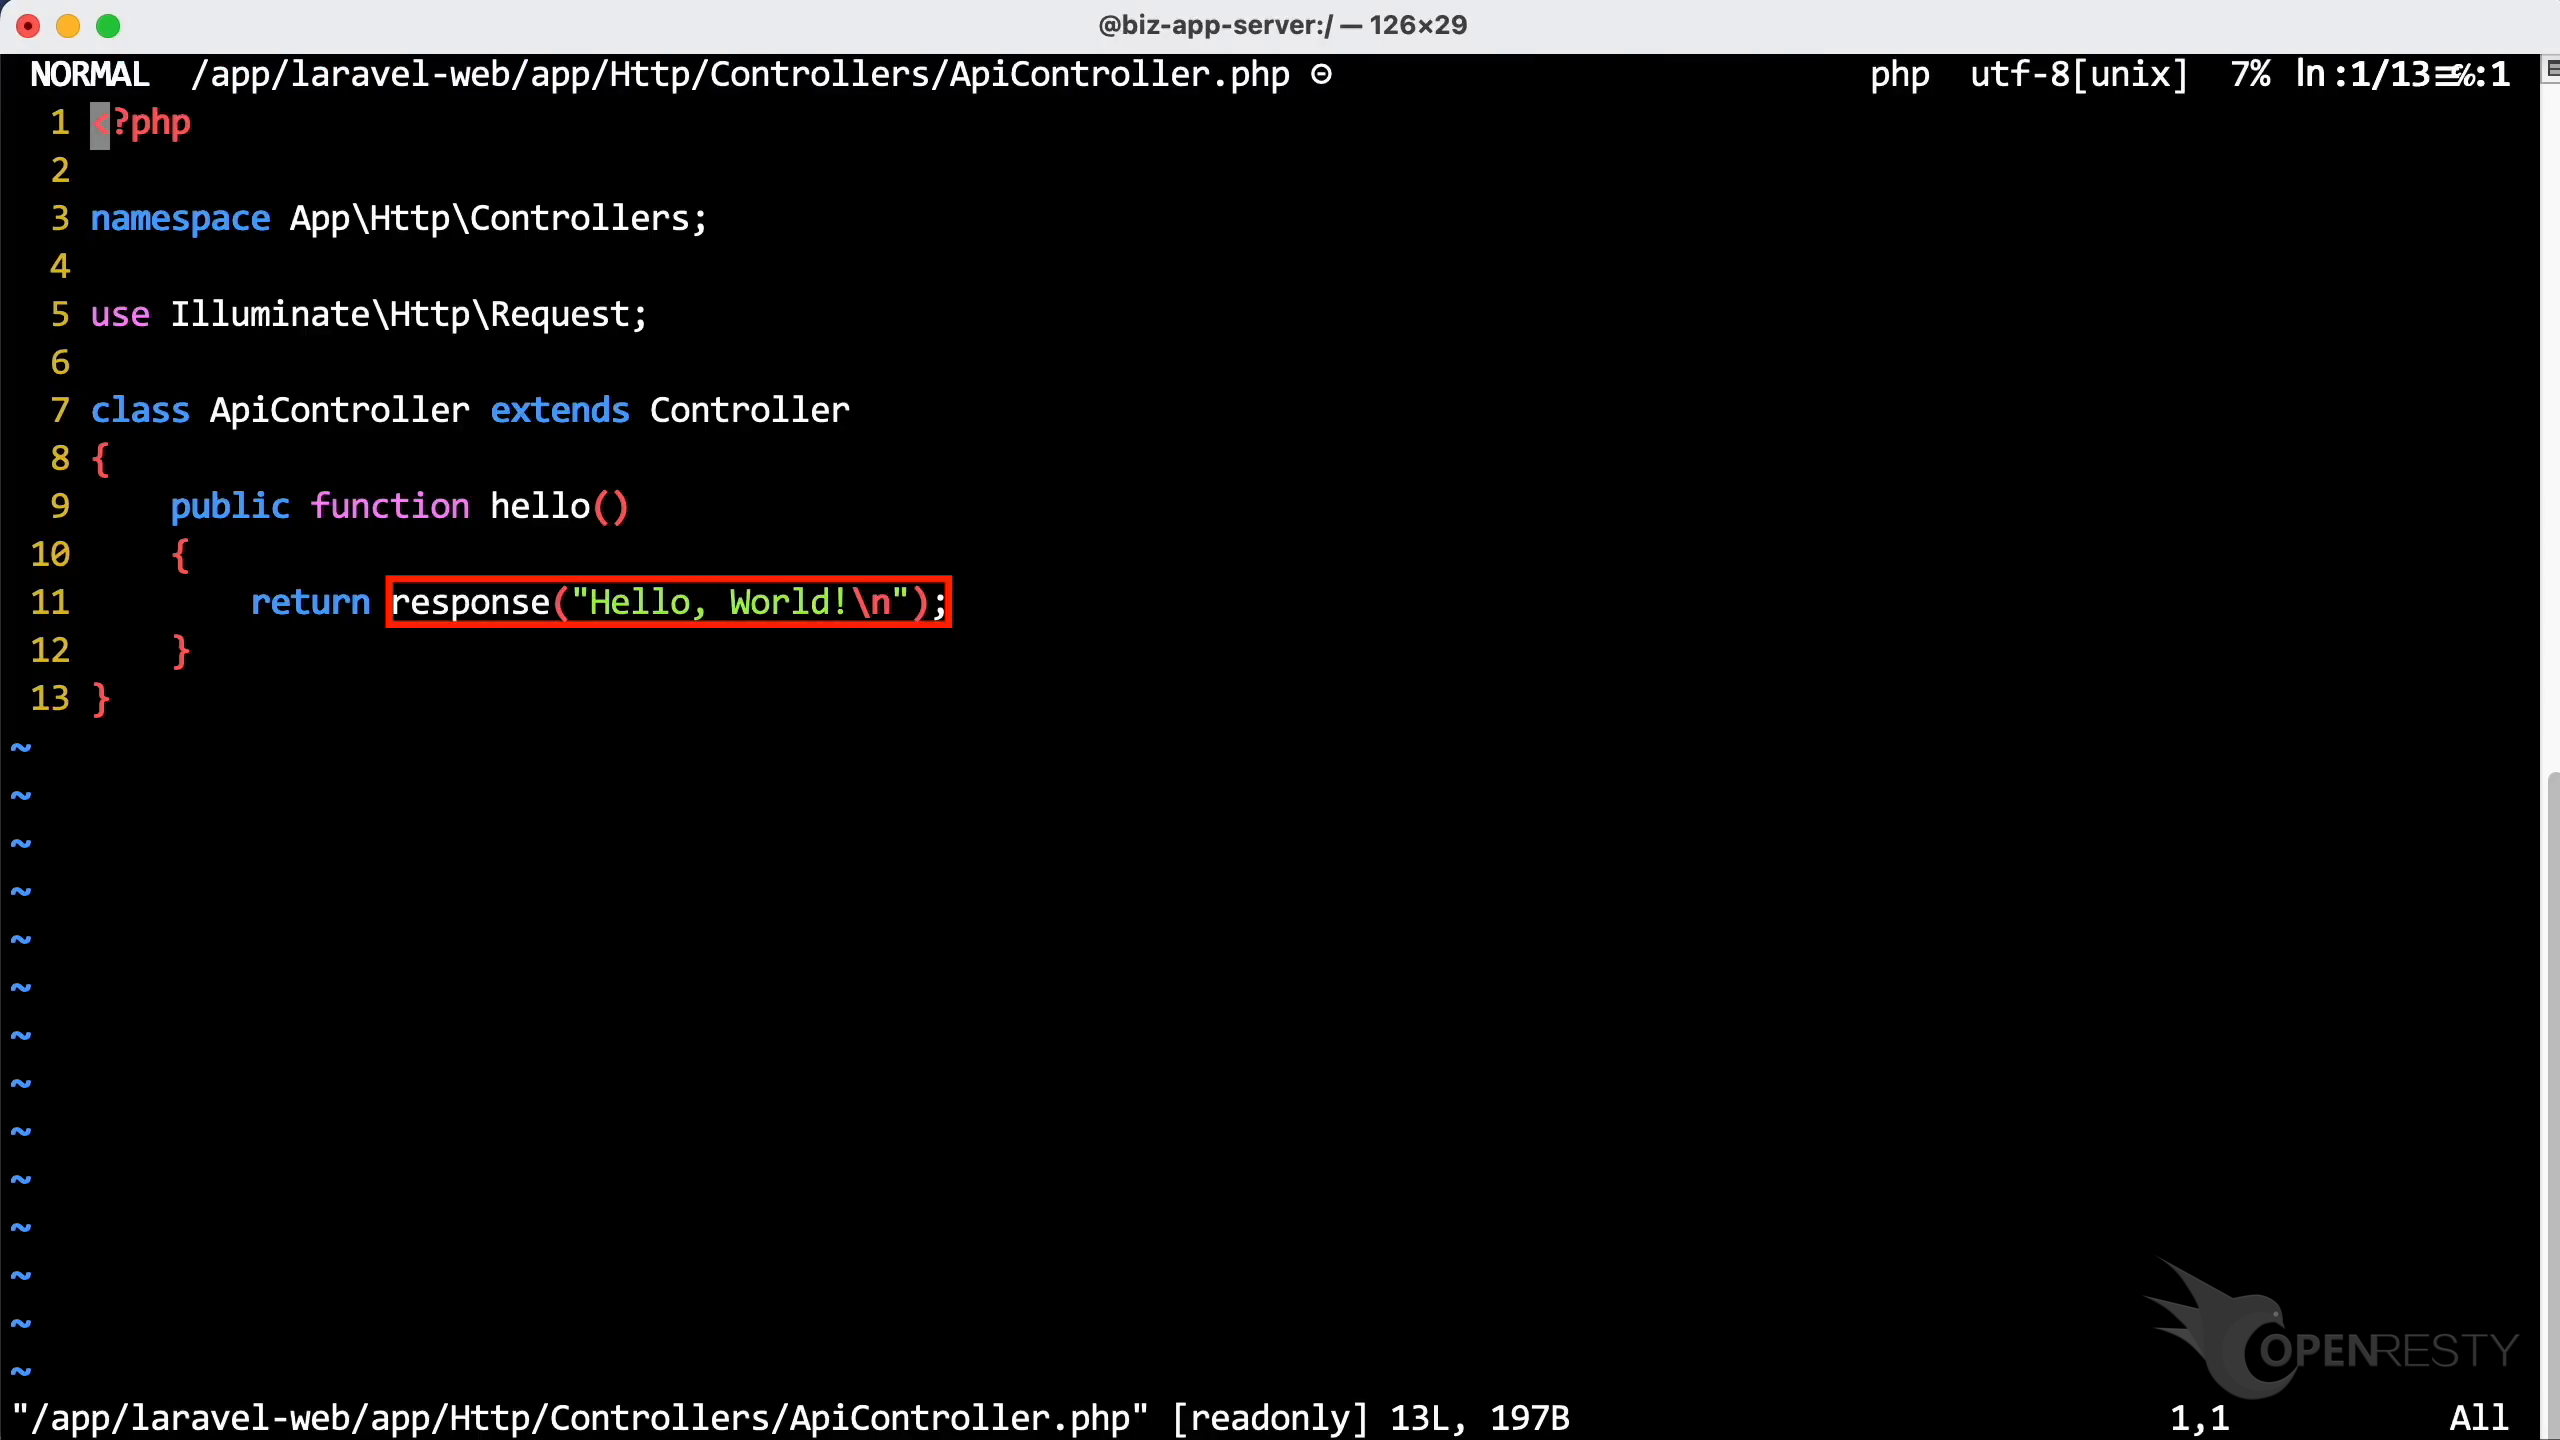
Here we defined a request handler that emits a response, “Hello, world”.
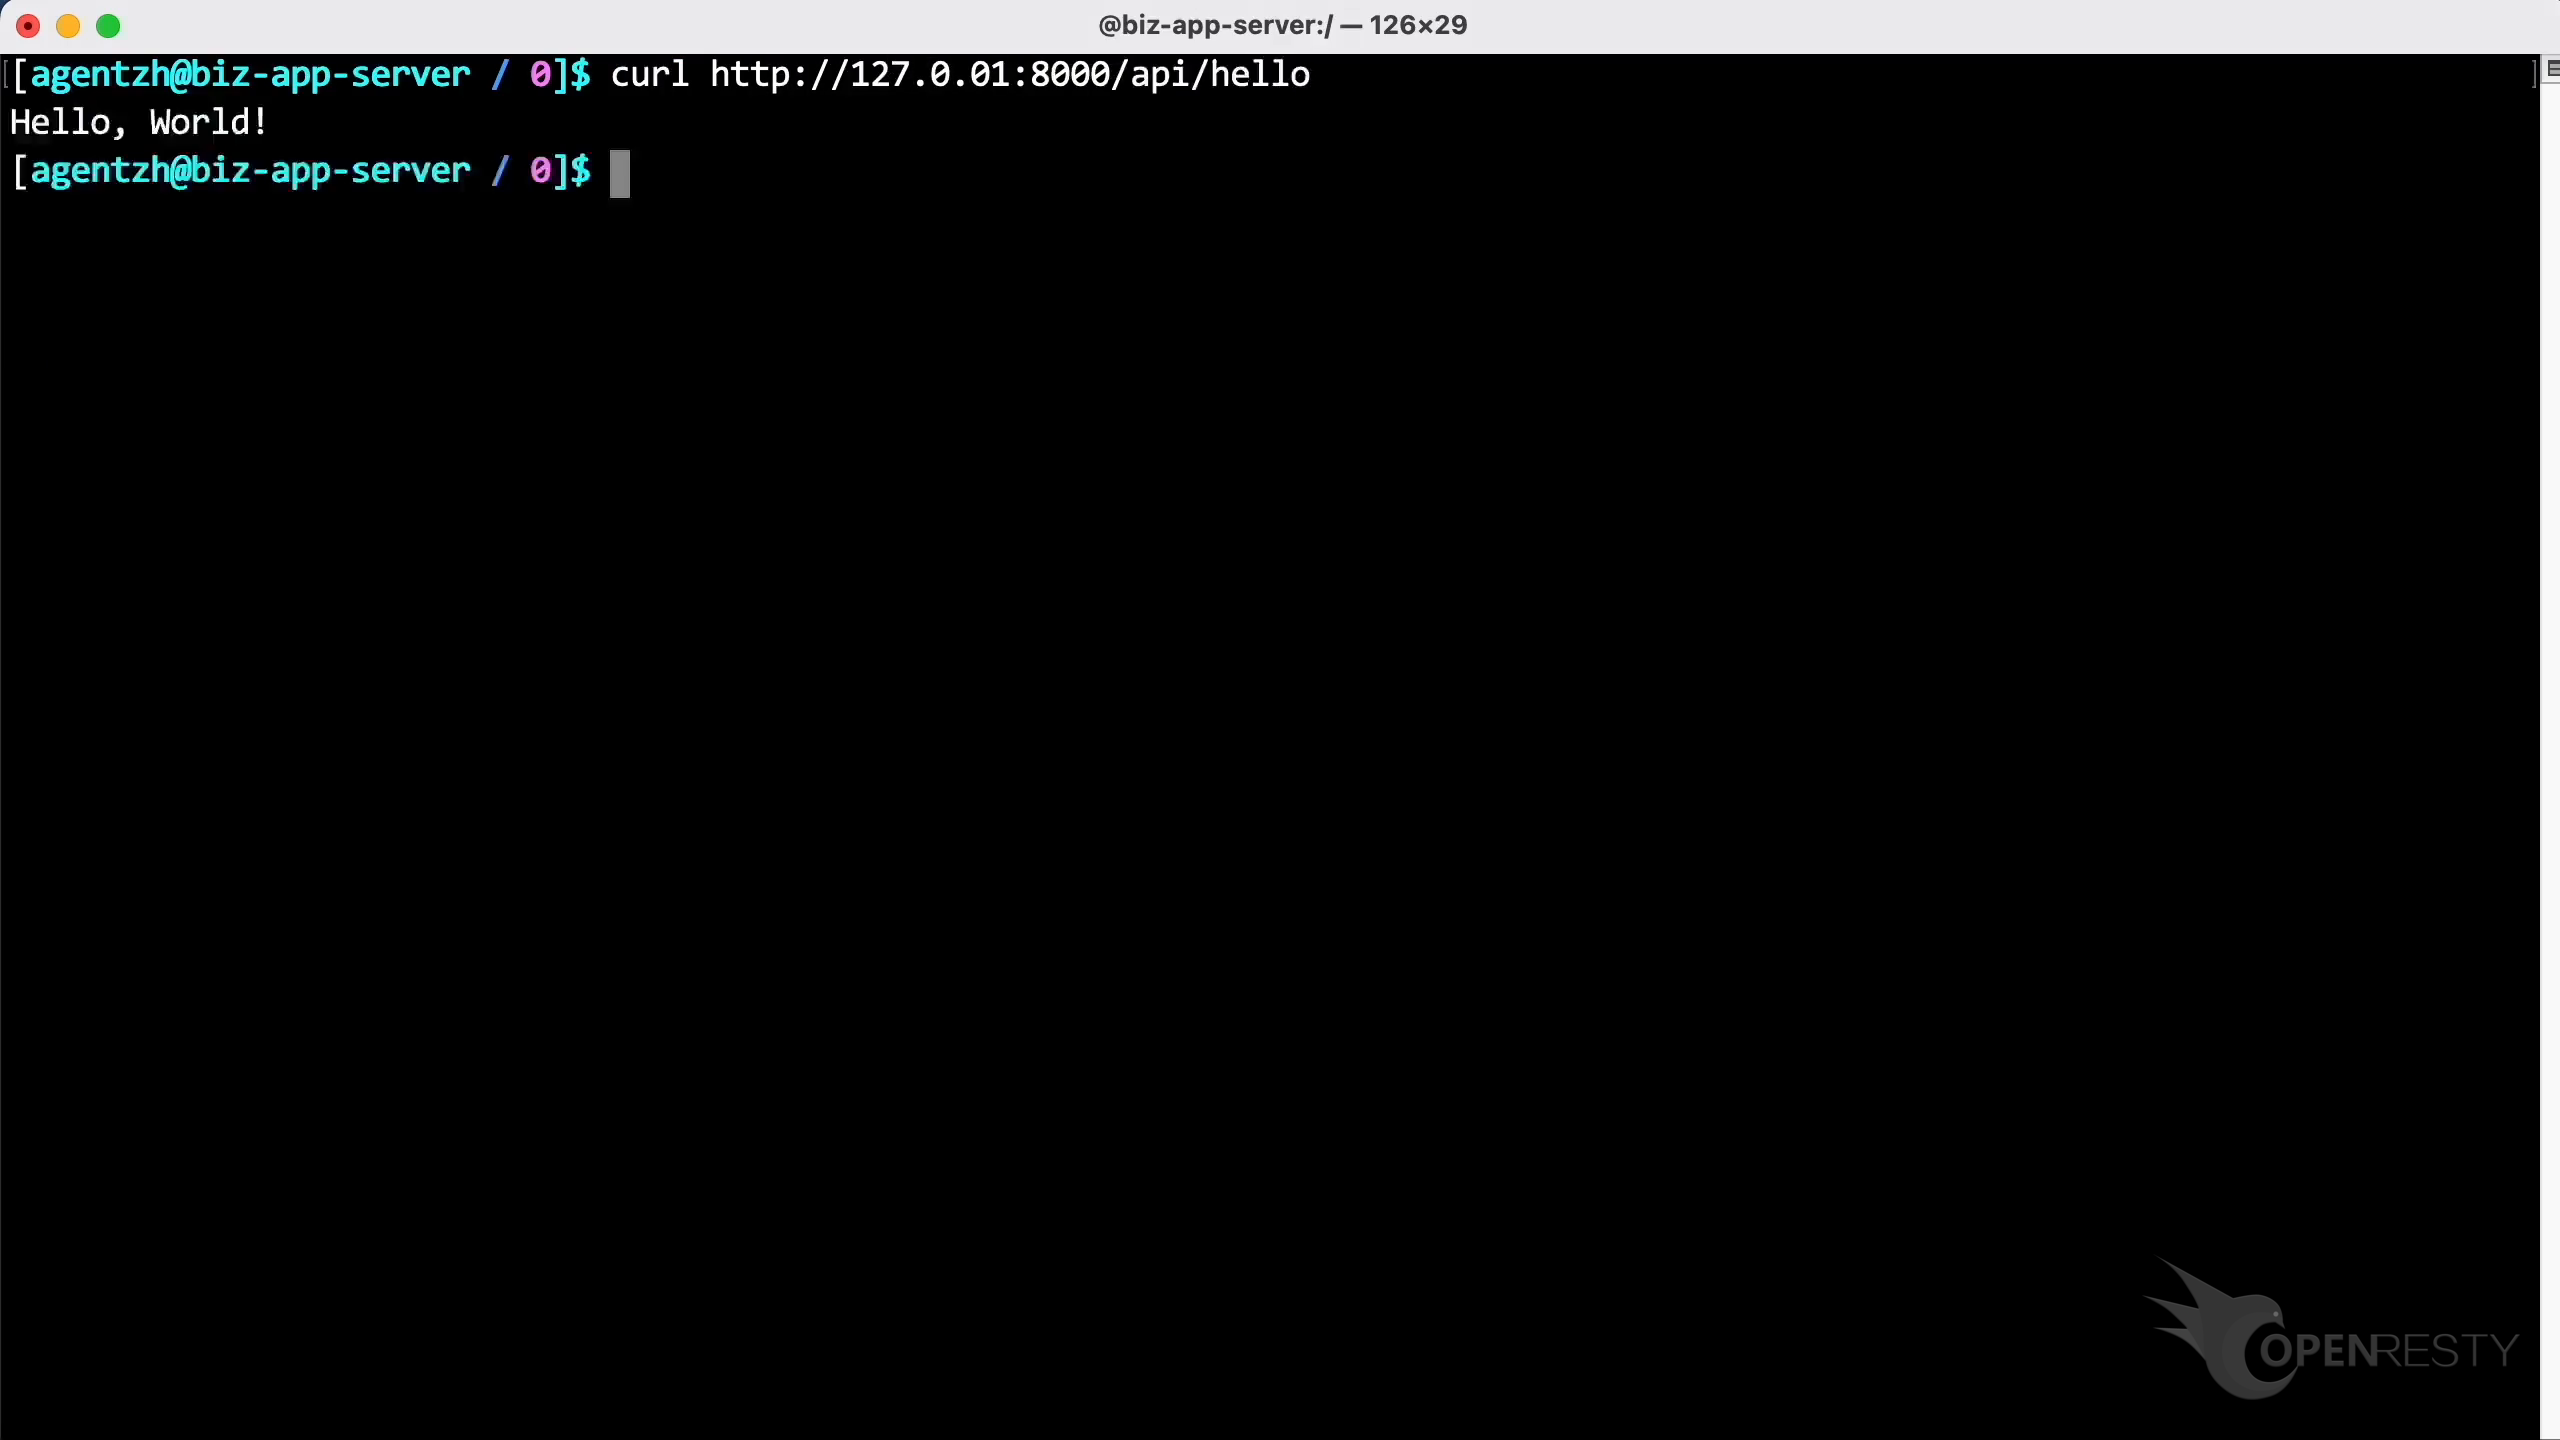
Use the curl command to access the Laravel HTTP endpoint.
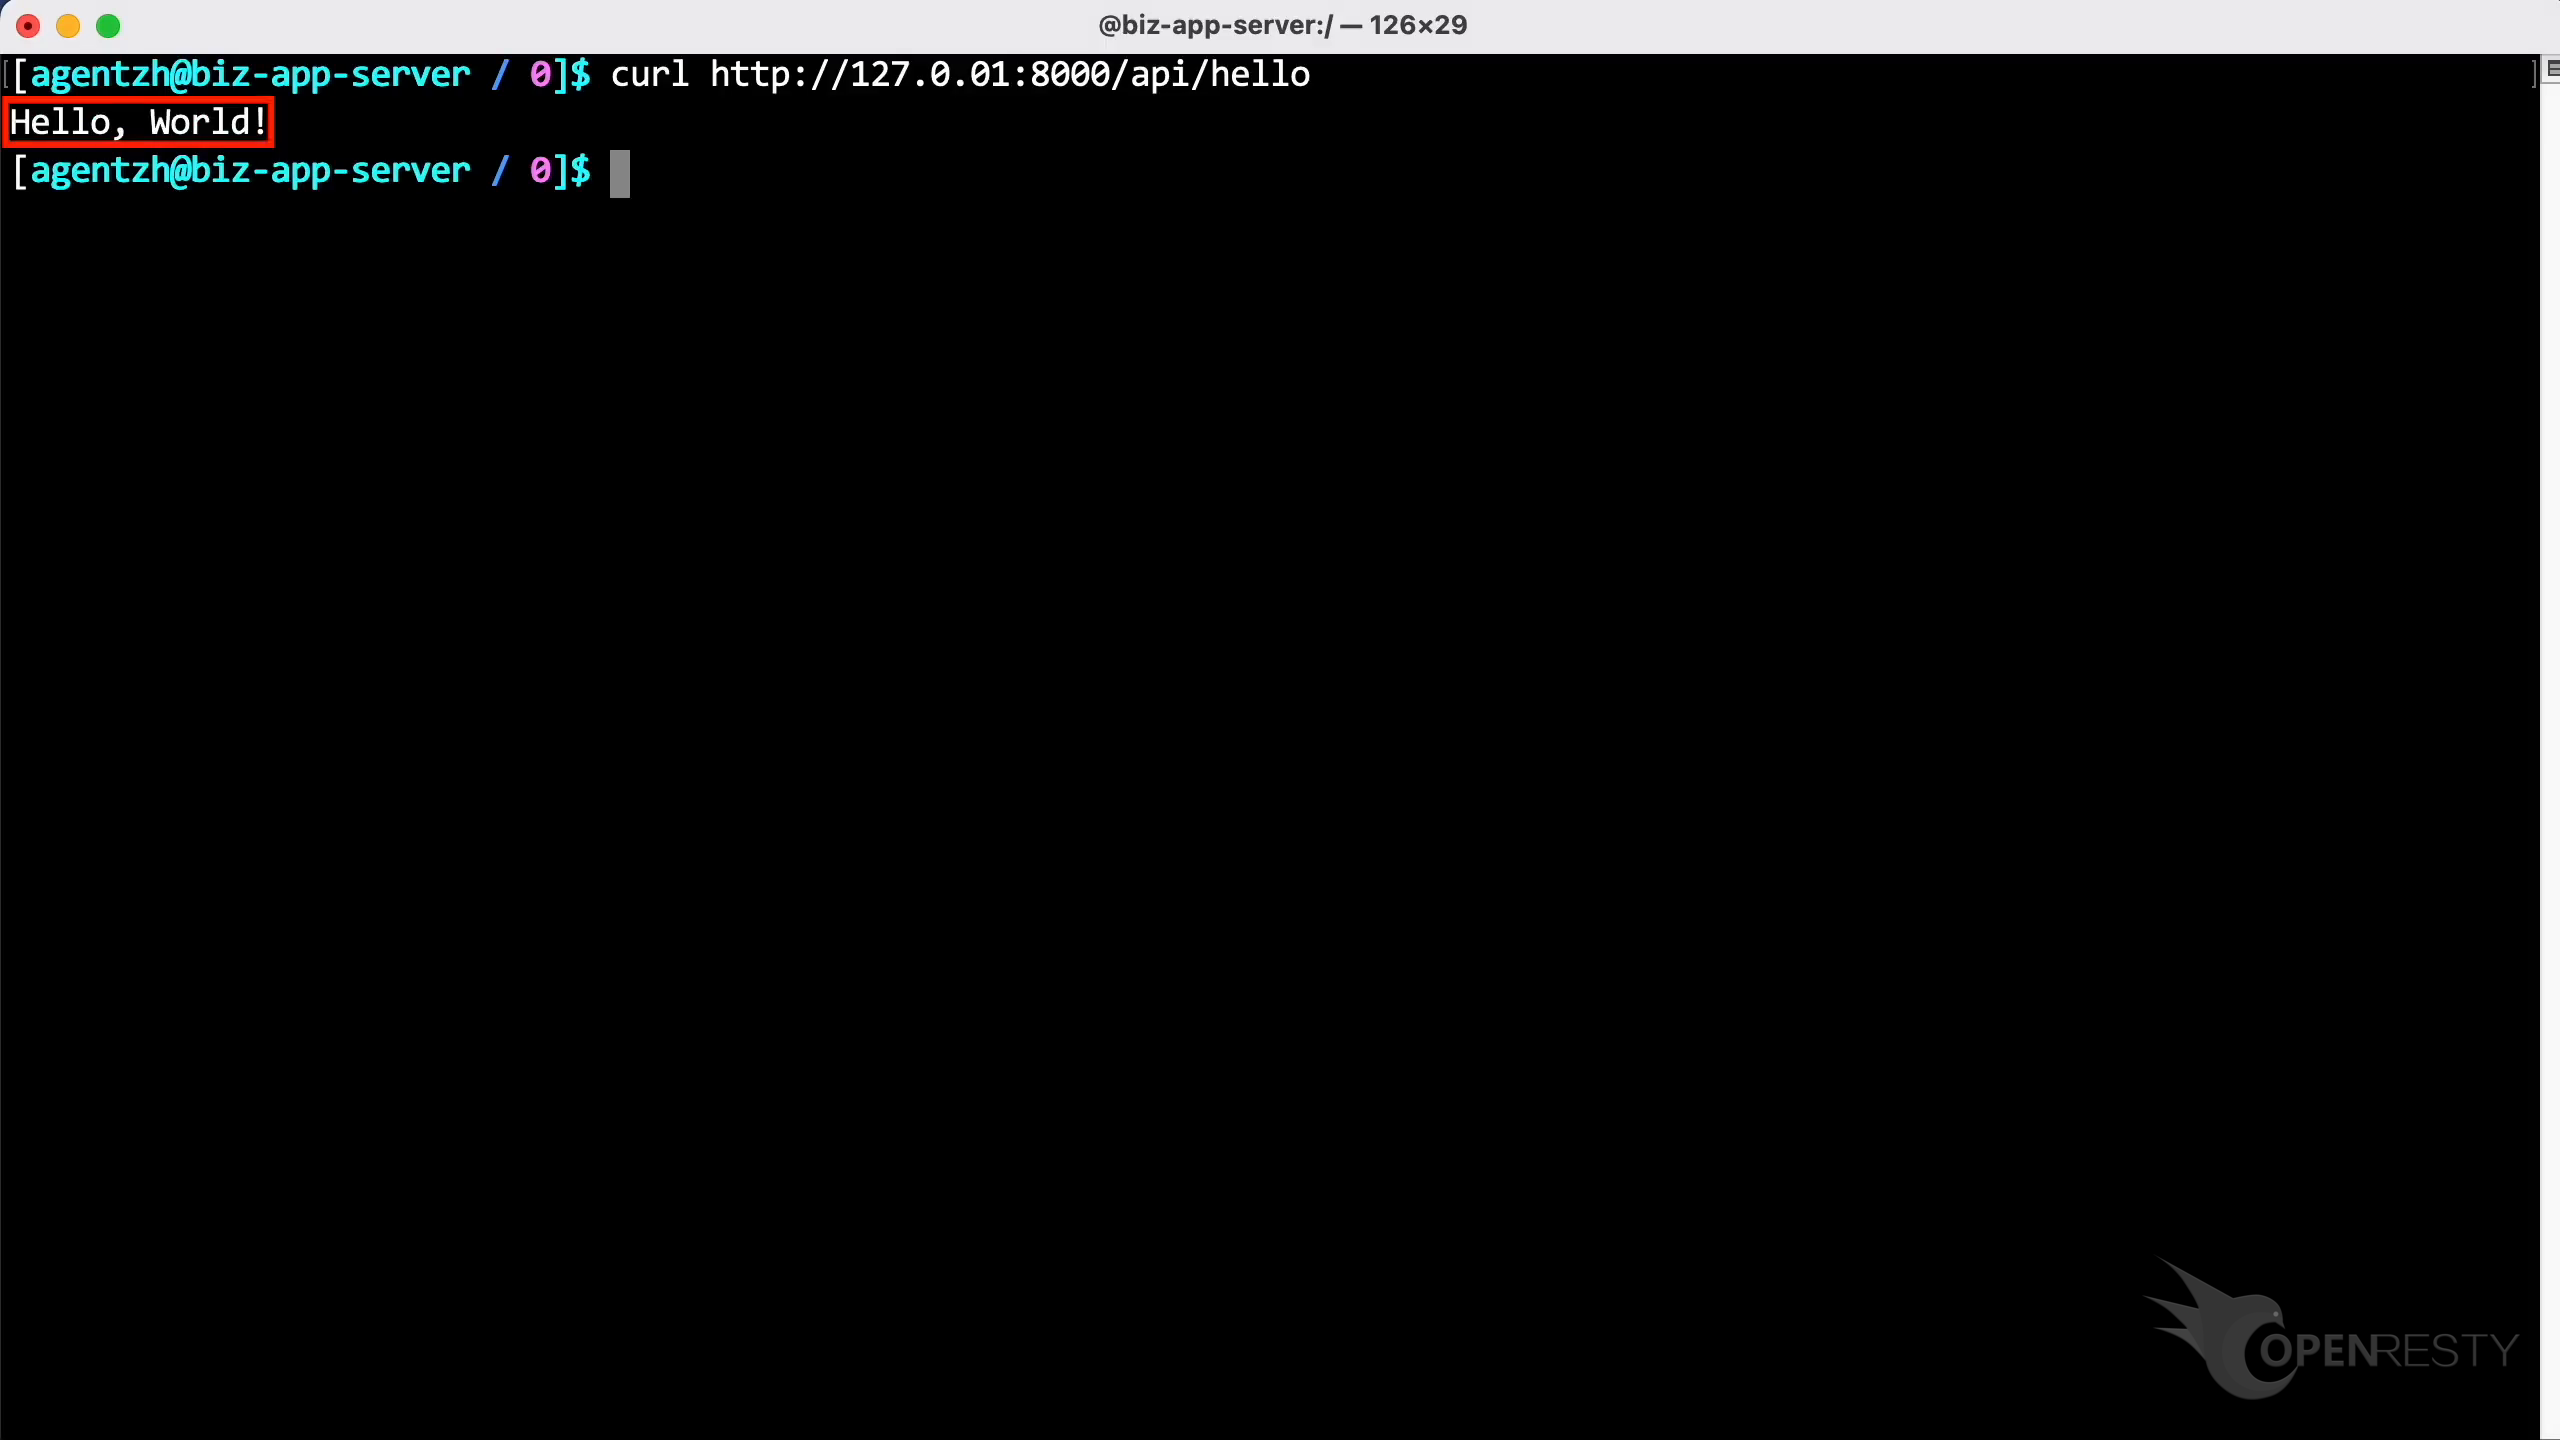
The response body is “hello world” indeed.
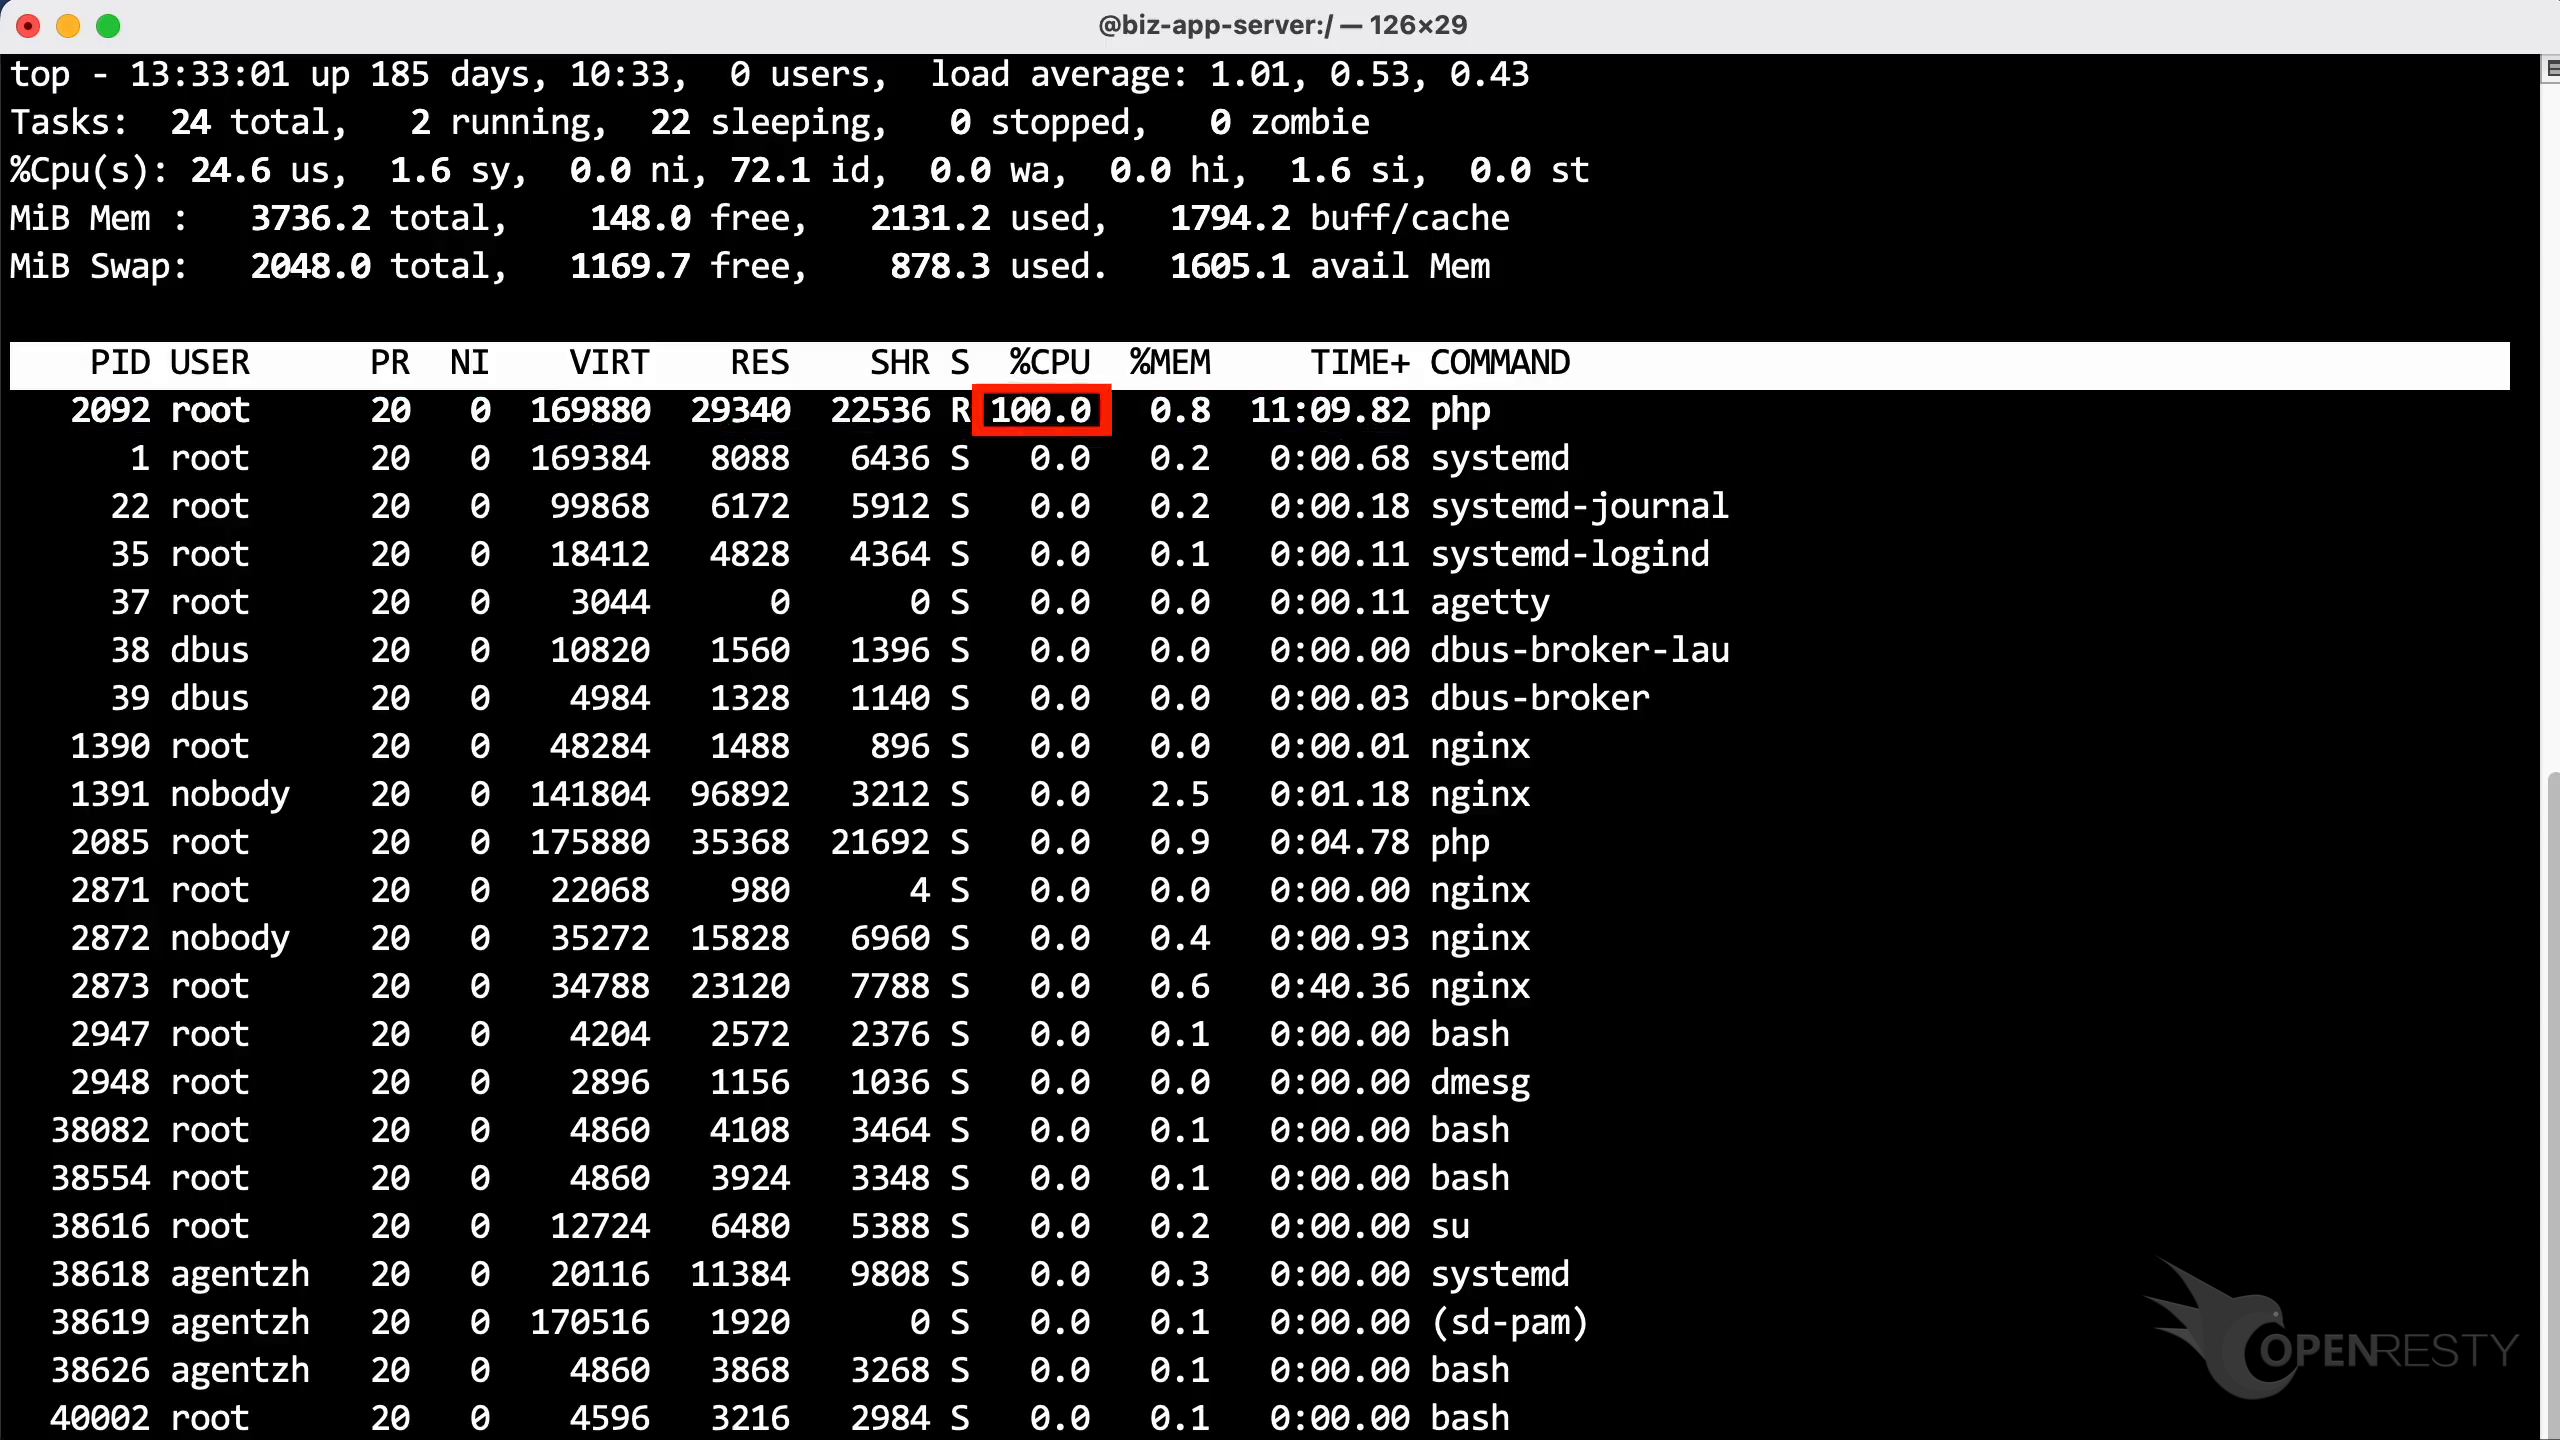
Let’s run the top command to check the CPU usage of the target PHP process.
This is the PHP hello world service process we demonstrated earlier.
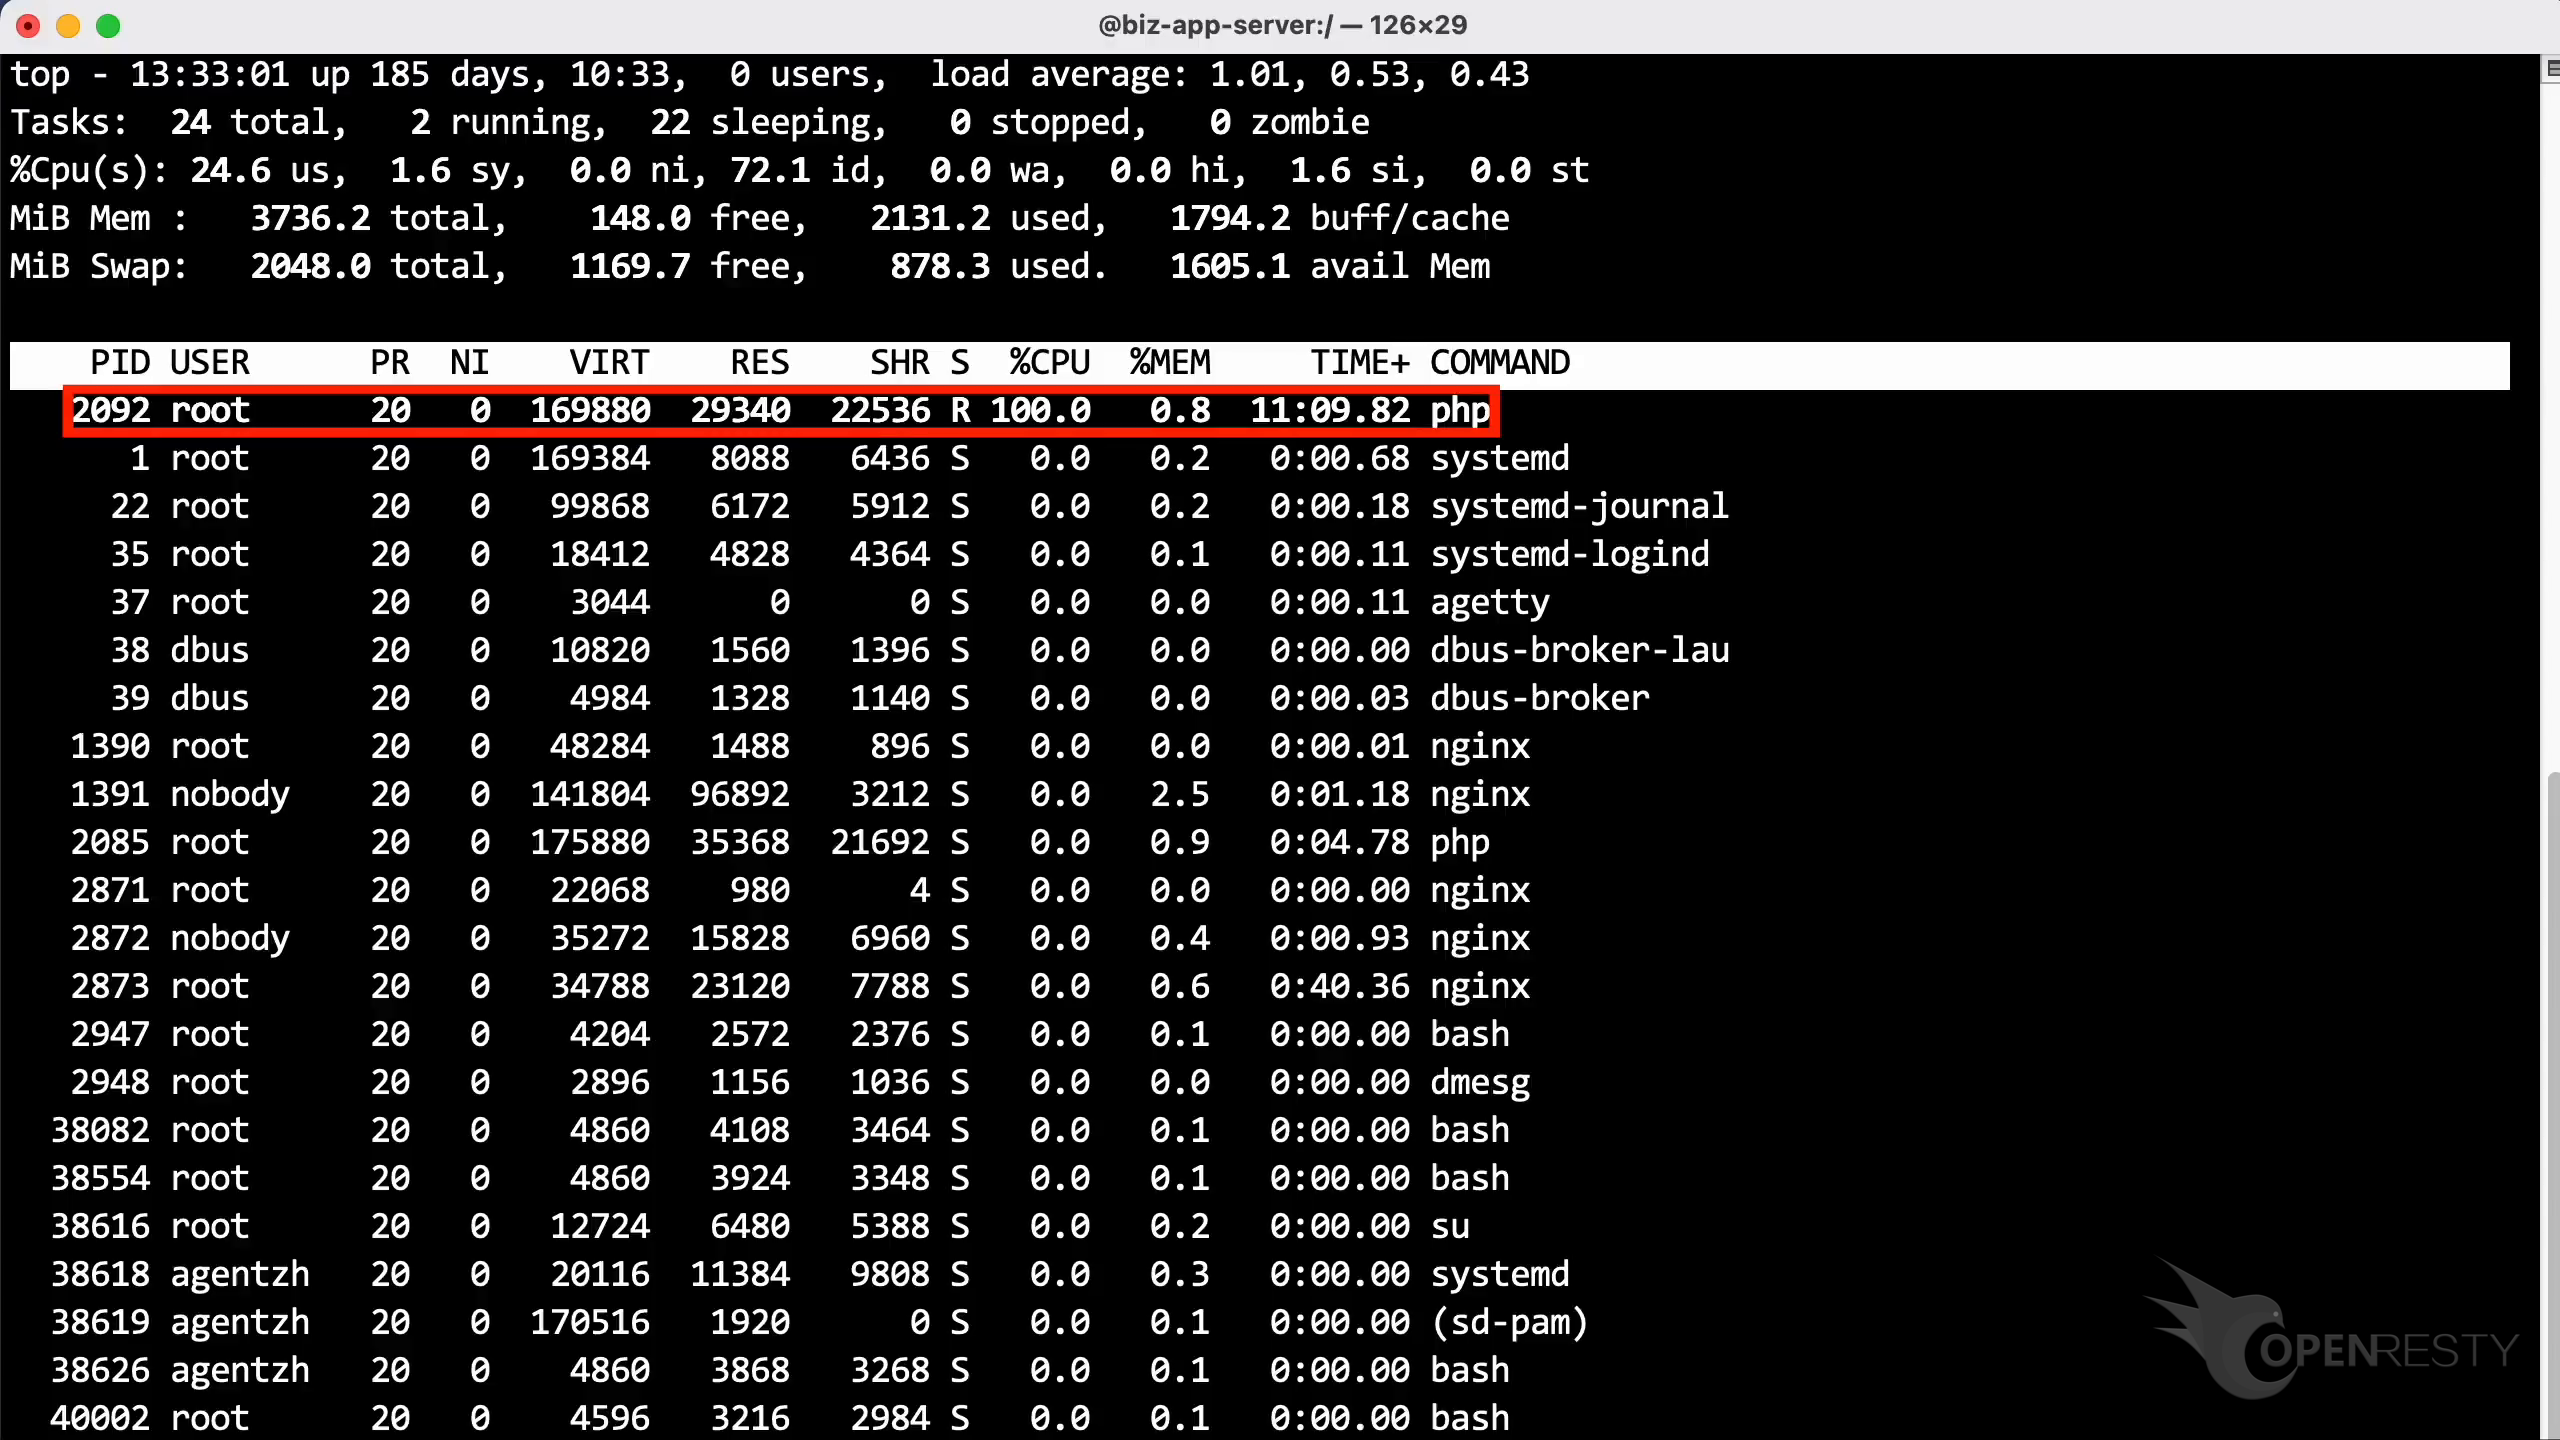
To produce a clear CPU profile, we drove the endpoint with a client-side load-testing tool beforehand, saturating the process at 100% CPU.
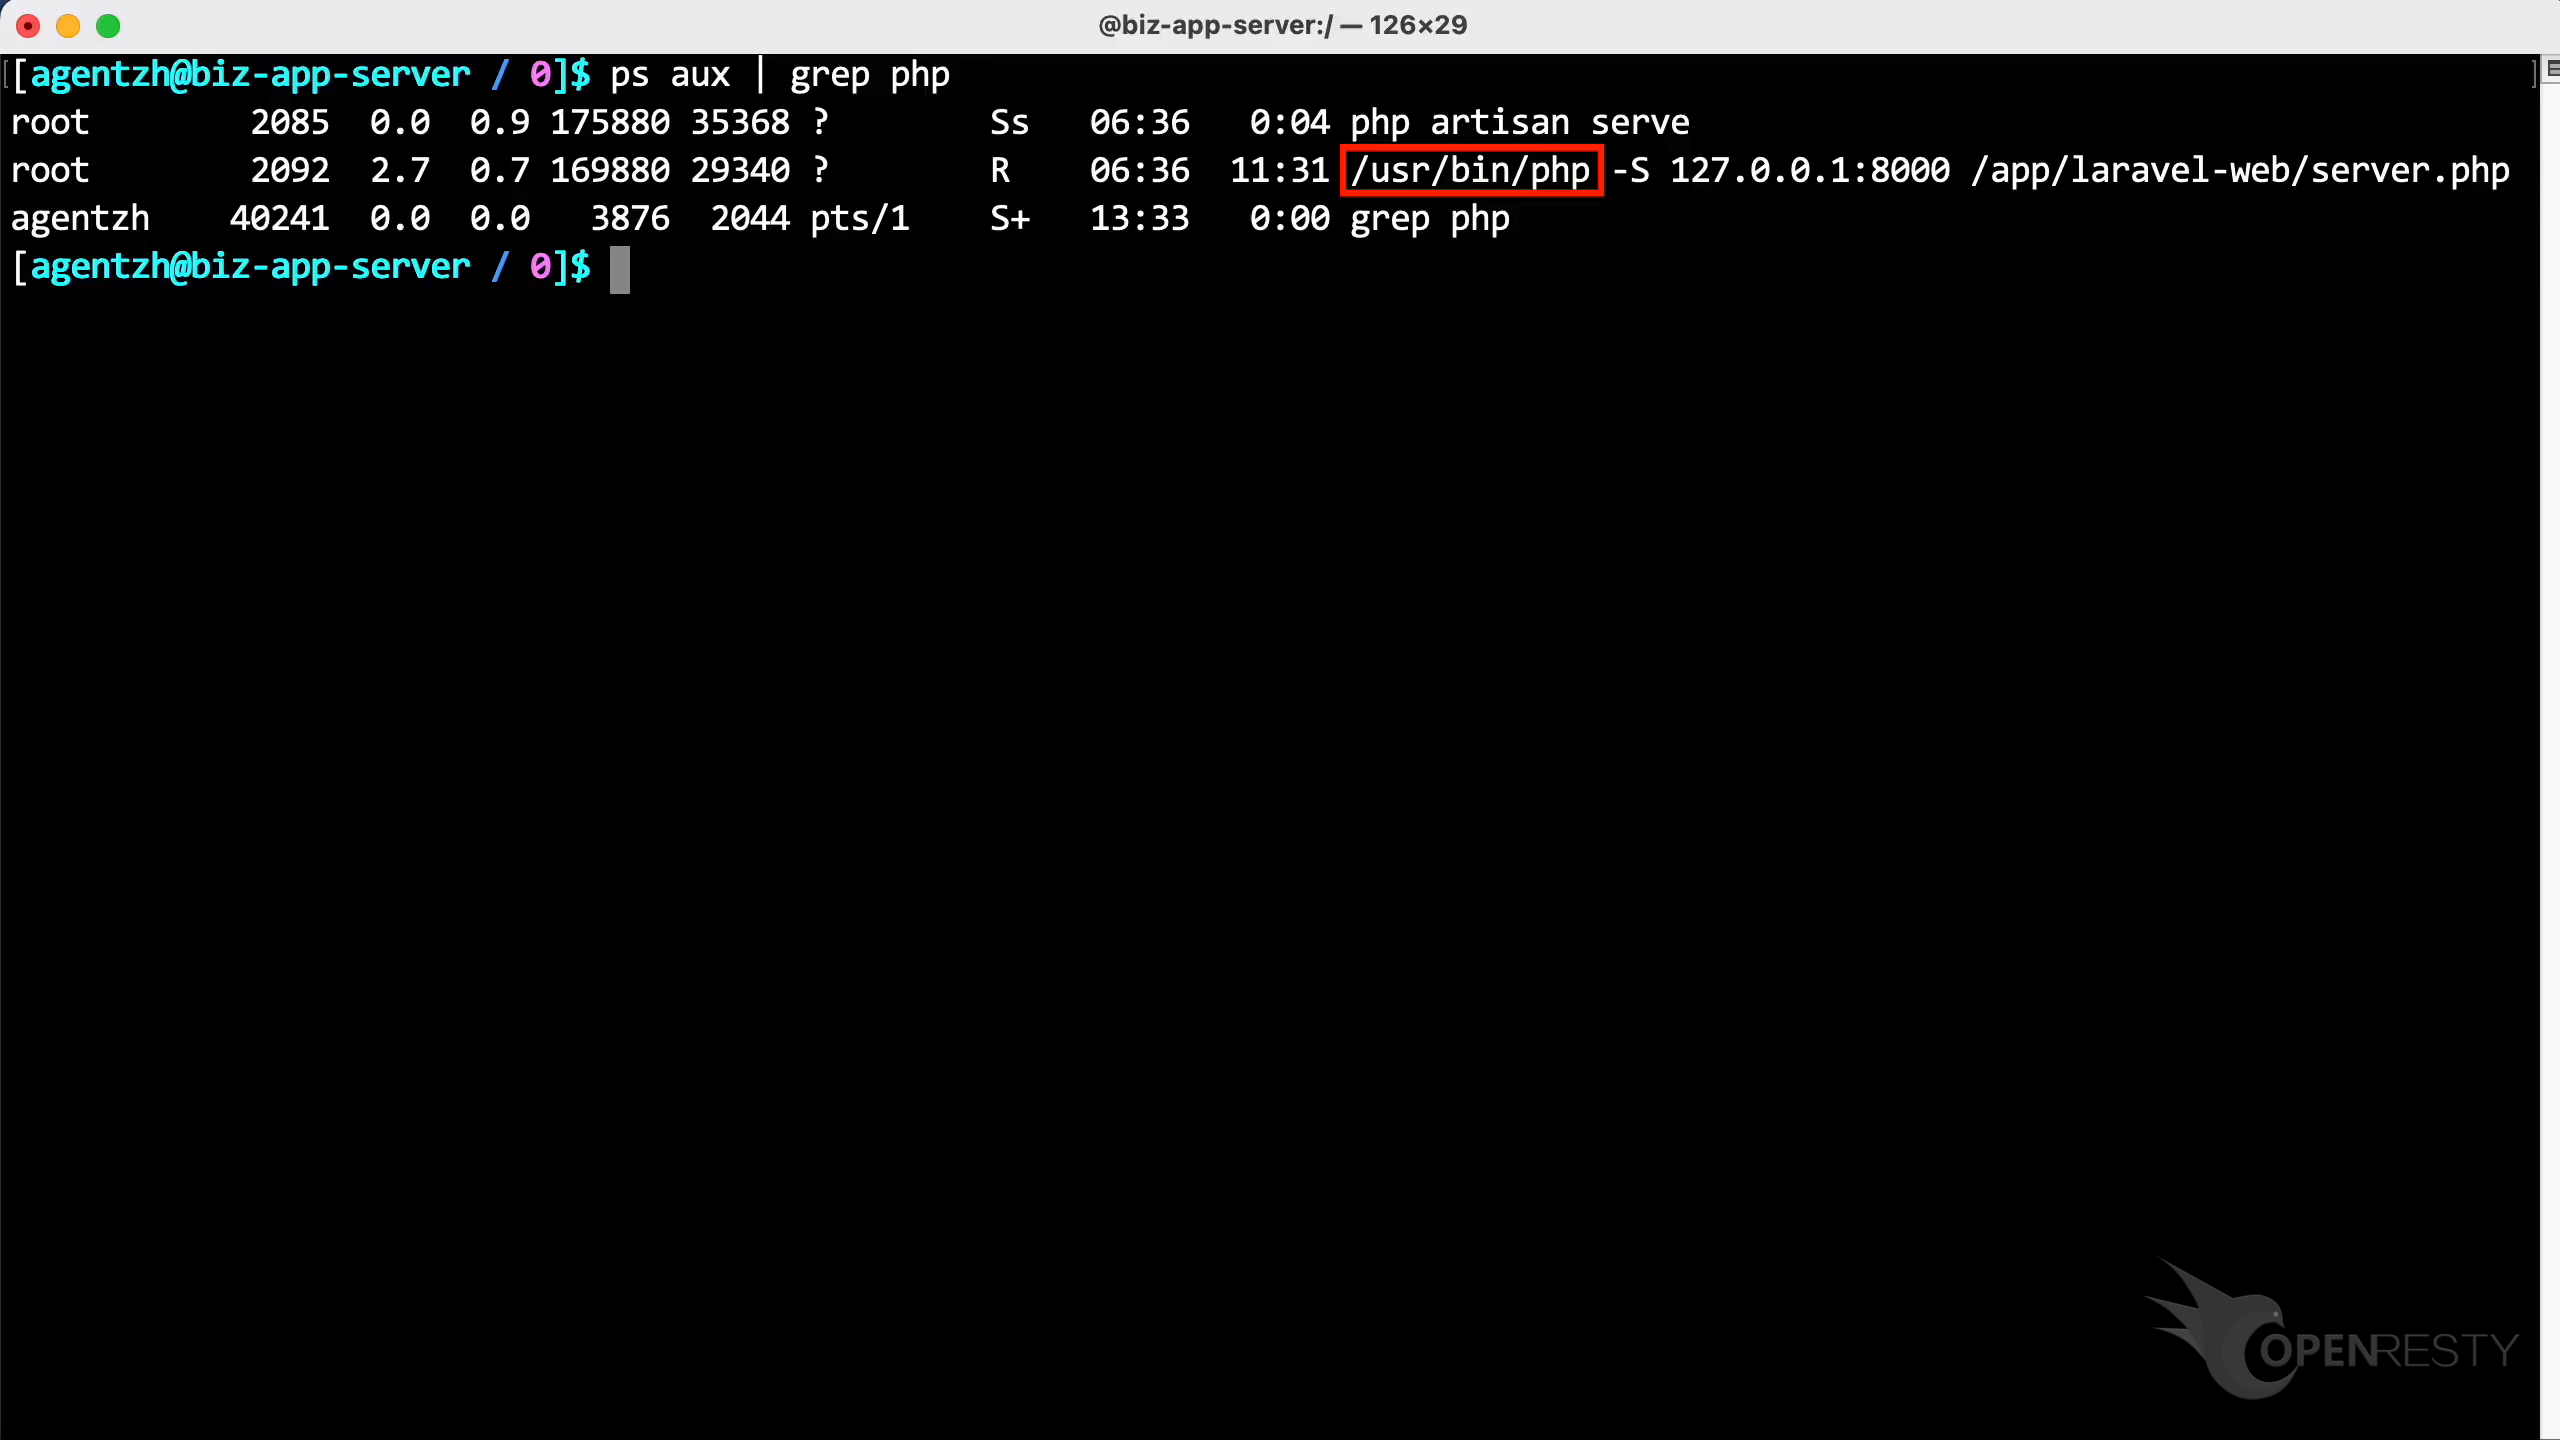
The ps command confirms the process runs the standard php binary that ships with the Linux distribution.
Laravel CPU Profiling: The Three Hottest Code Paths
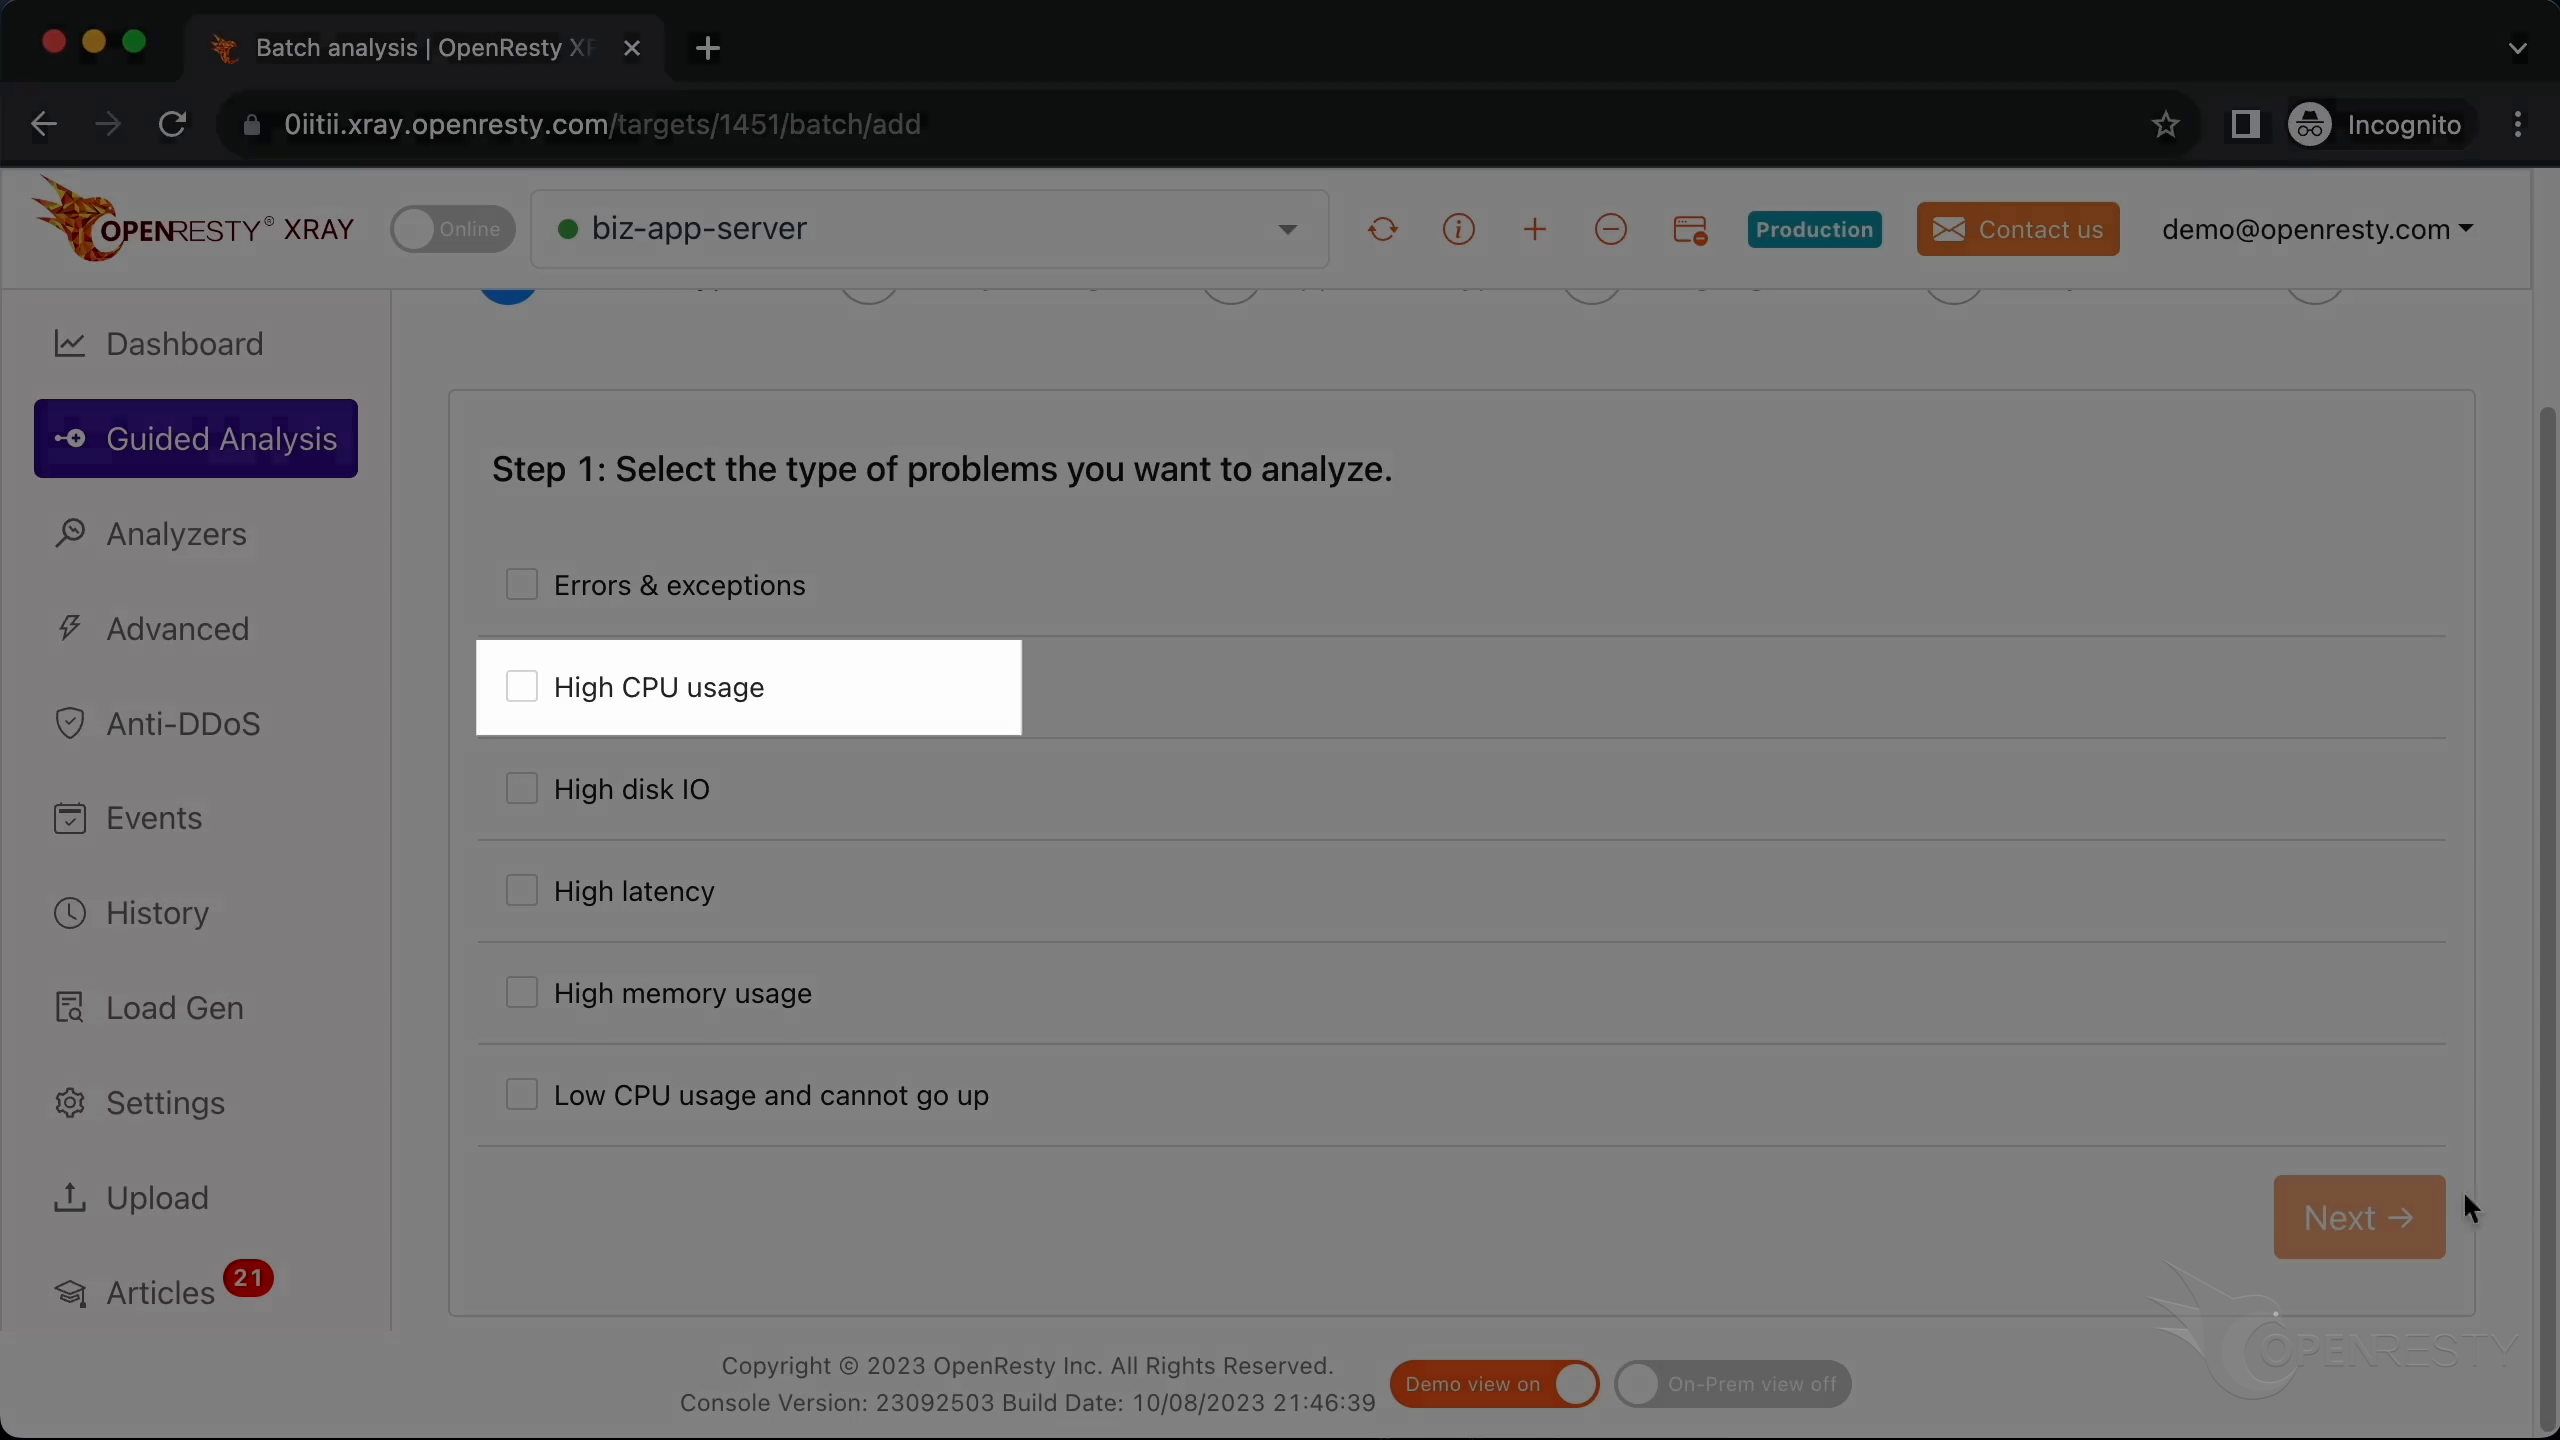
Let’s use OpenResty XRay to check how CPU time is spent inside the PHP process. In the OpenResty XRay web console, confirm you are watching the right machine, open the “Guided Analysis” page, and choose “High CPU usage” as the problem type to diagnose.
Next, select the PHP application and pick the worker process that consumes almost 100% of the CPU — the same process we saw earlier in top (here, PID 2092 at 93% CPU).
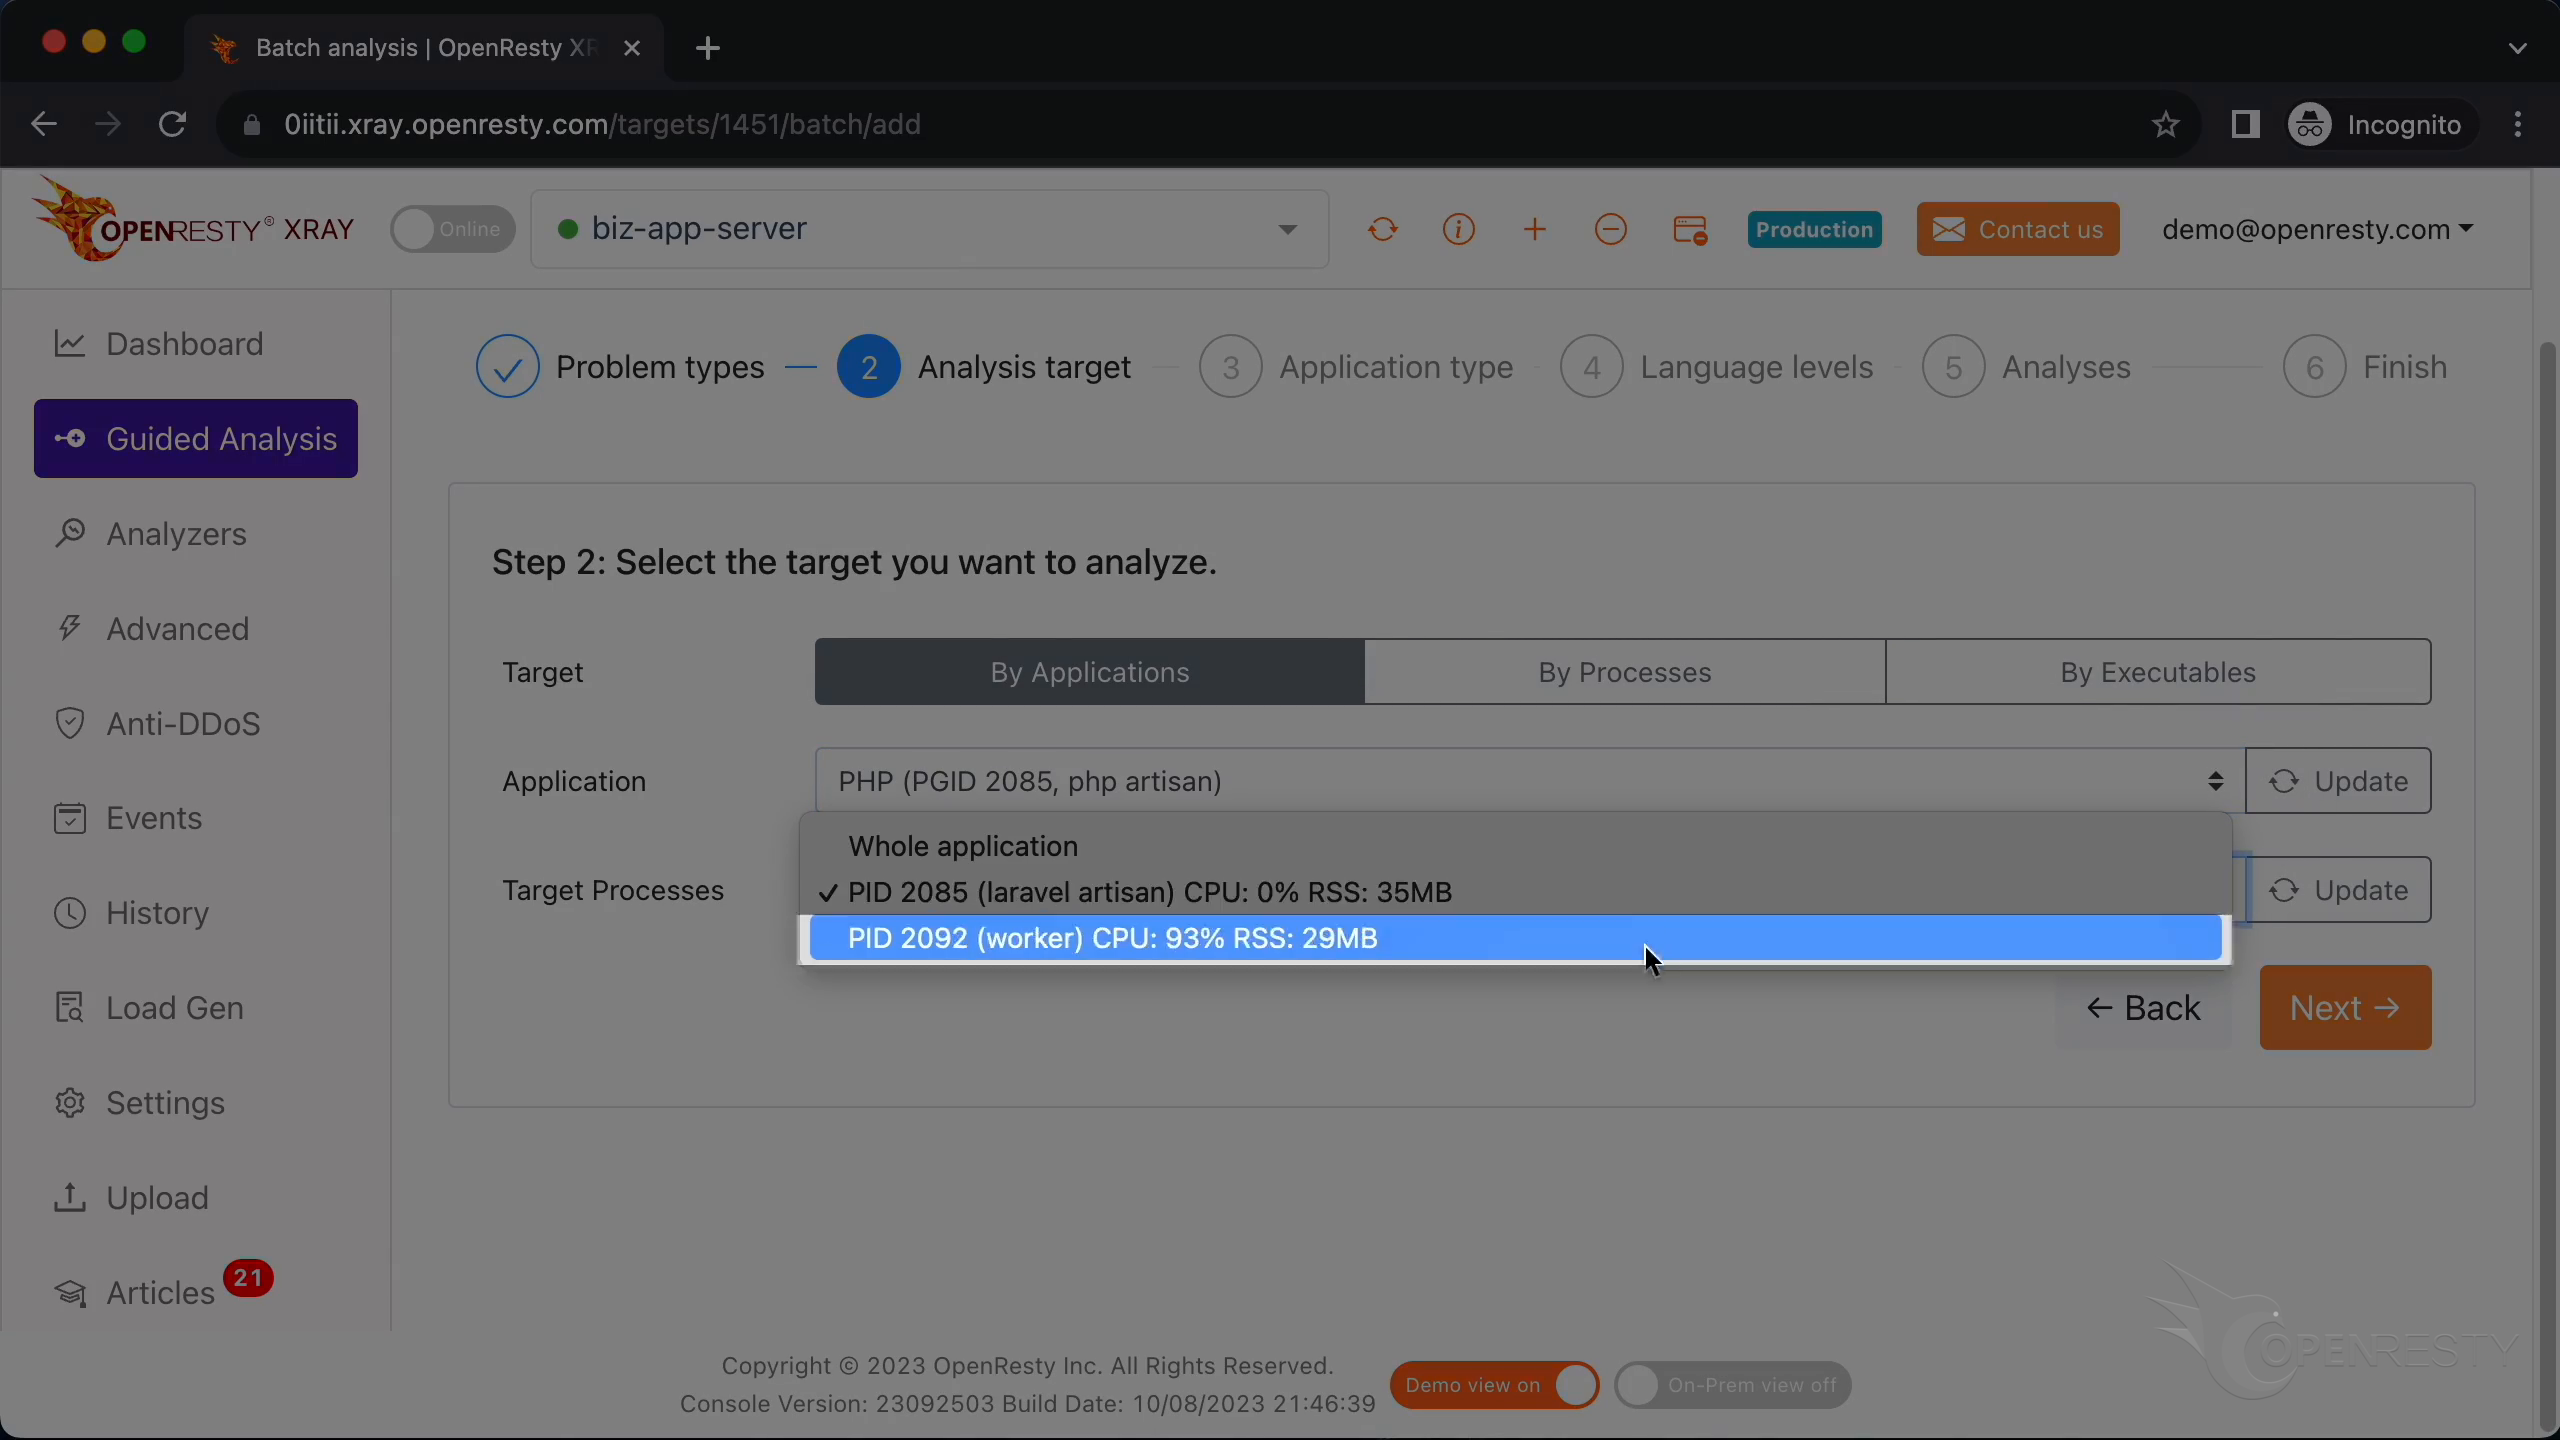
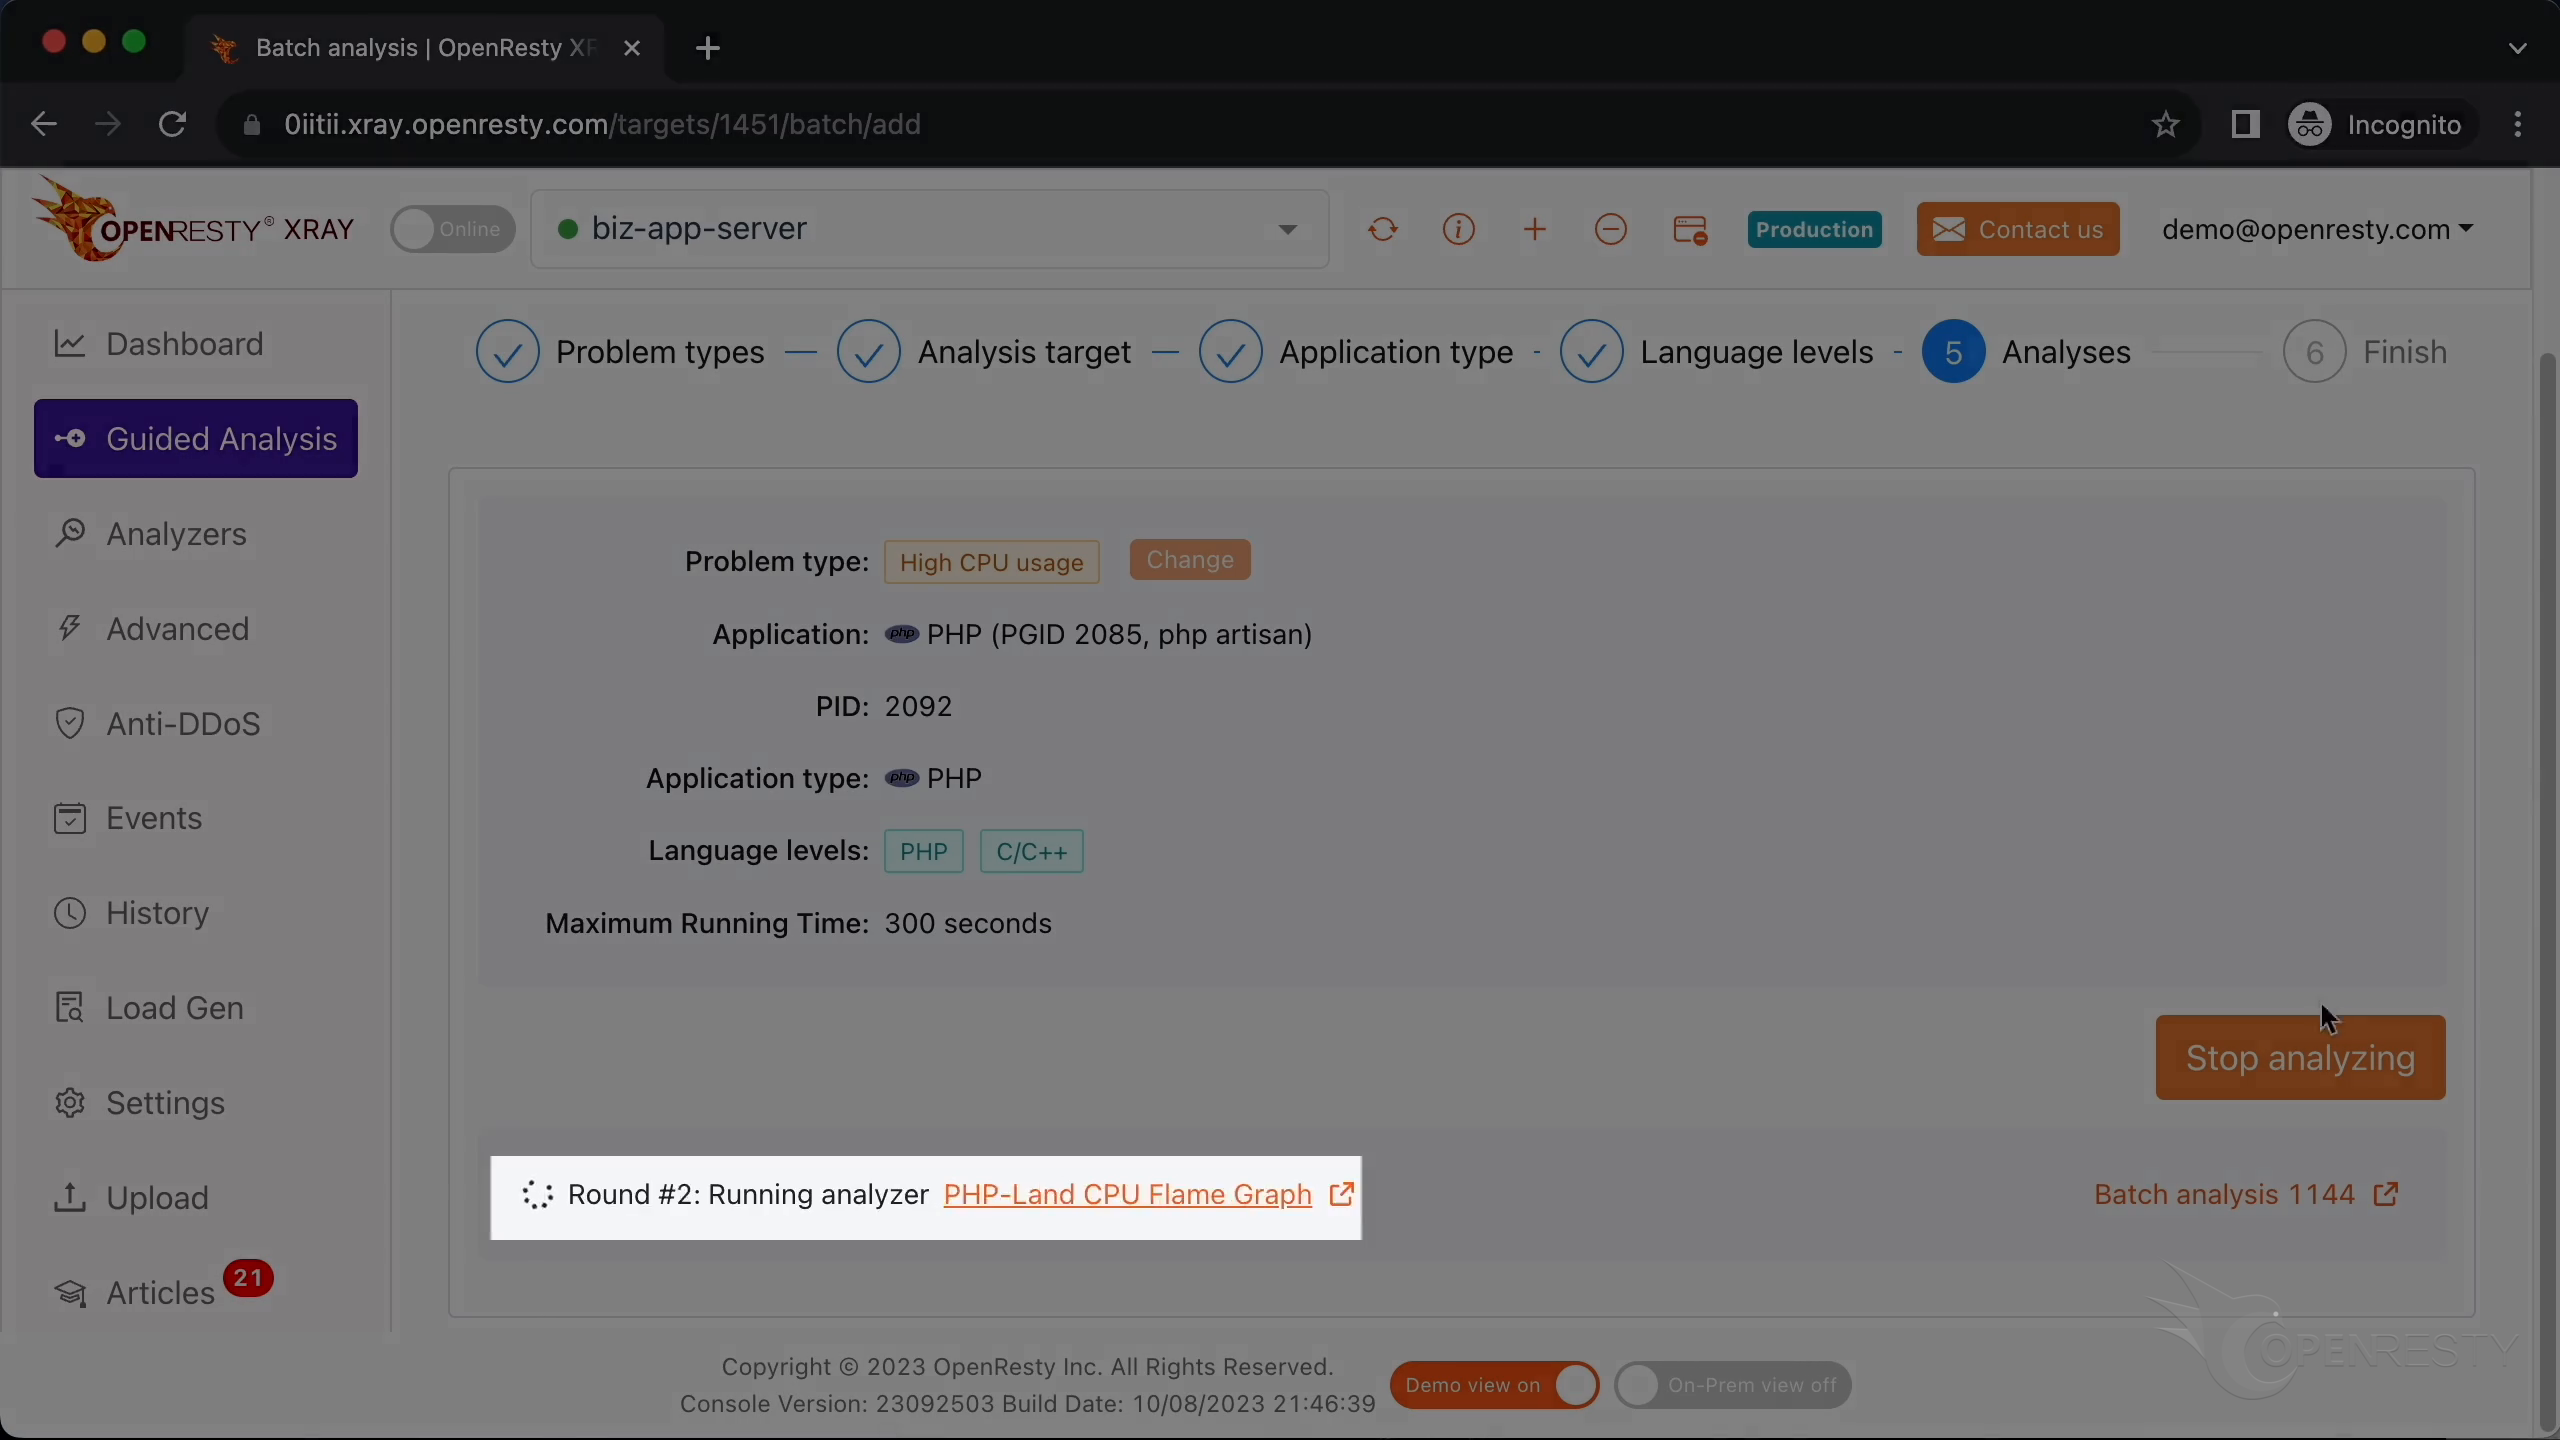
OpenResty XRay auto-detects the application type and can analyze multiple language levels at the same time, so we keep both PHP and C/C++ selected and leave the maximum analyzing time at the default 300 seconds. Once started, the system performs successive rounds of analysis, sampling C-land and PHP-land CPU flame graphs in turn. Two rounds are enough for this case, so we stop the analysis there.
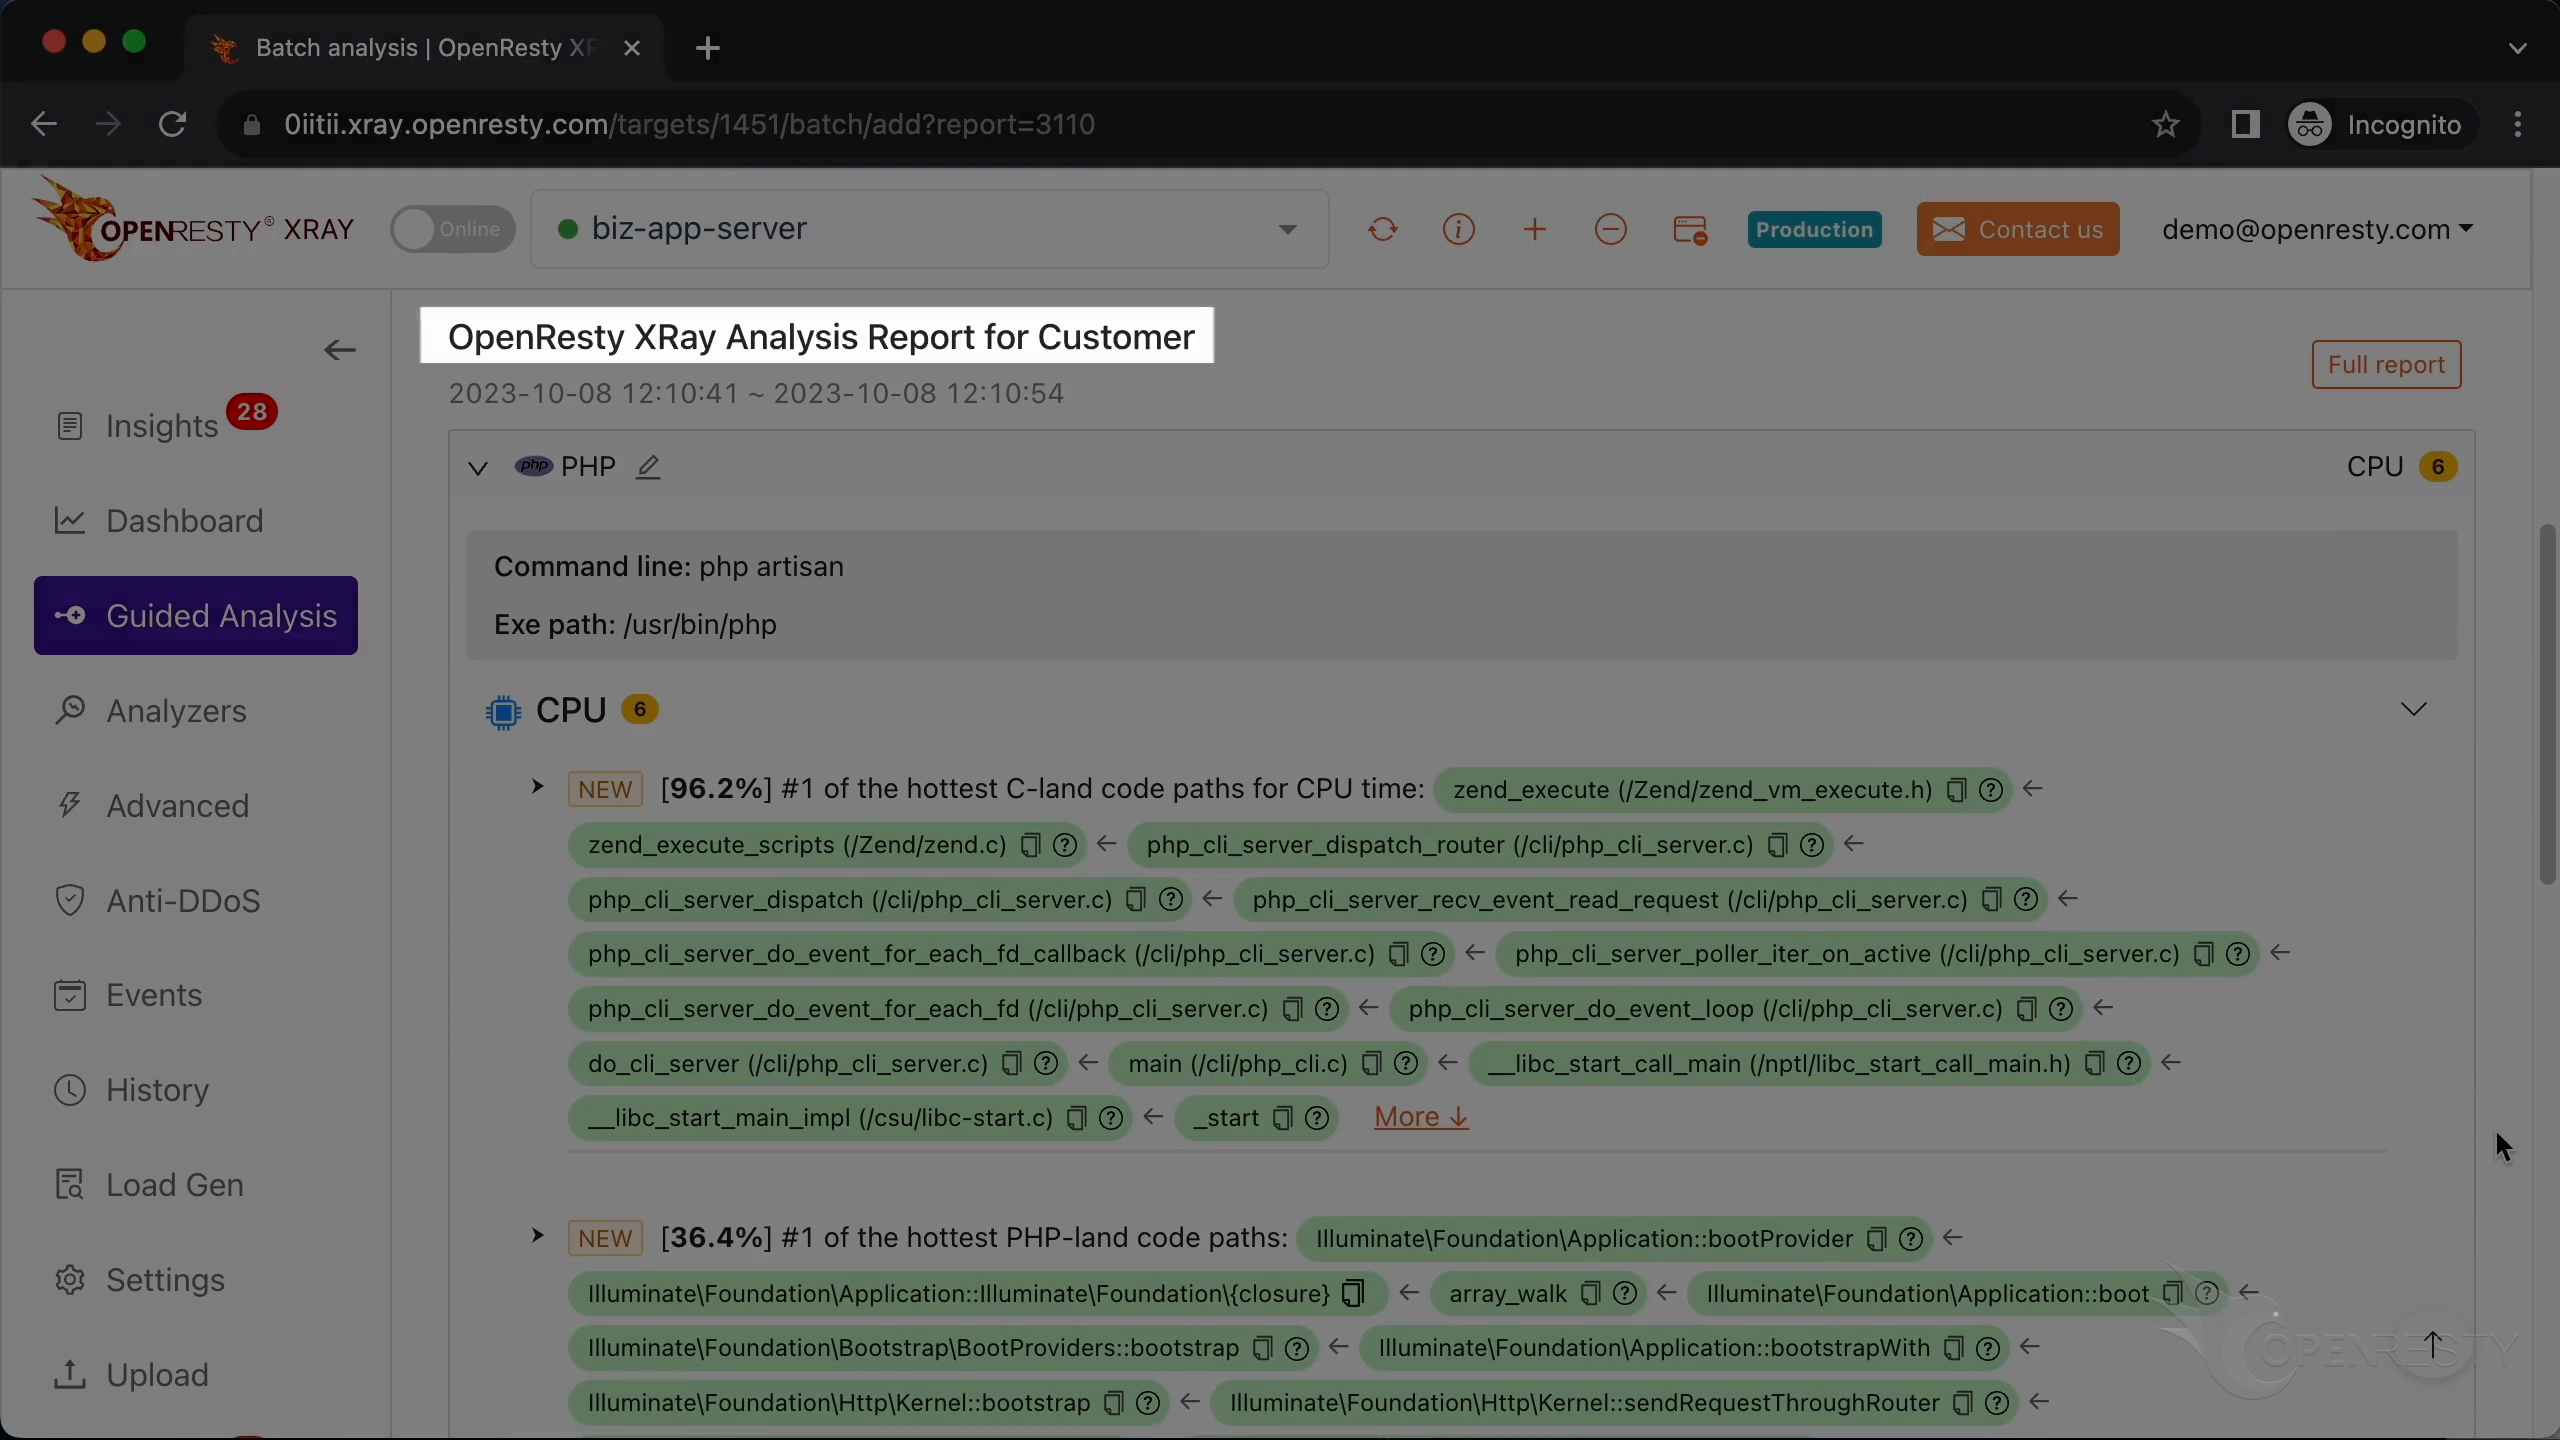
OpenResty XRay then automatically creates an analysis report.
The report is tagged with the problem type we diagnosed: CPU.
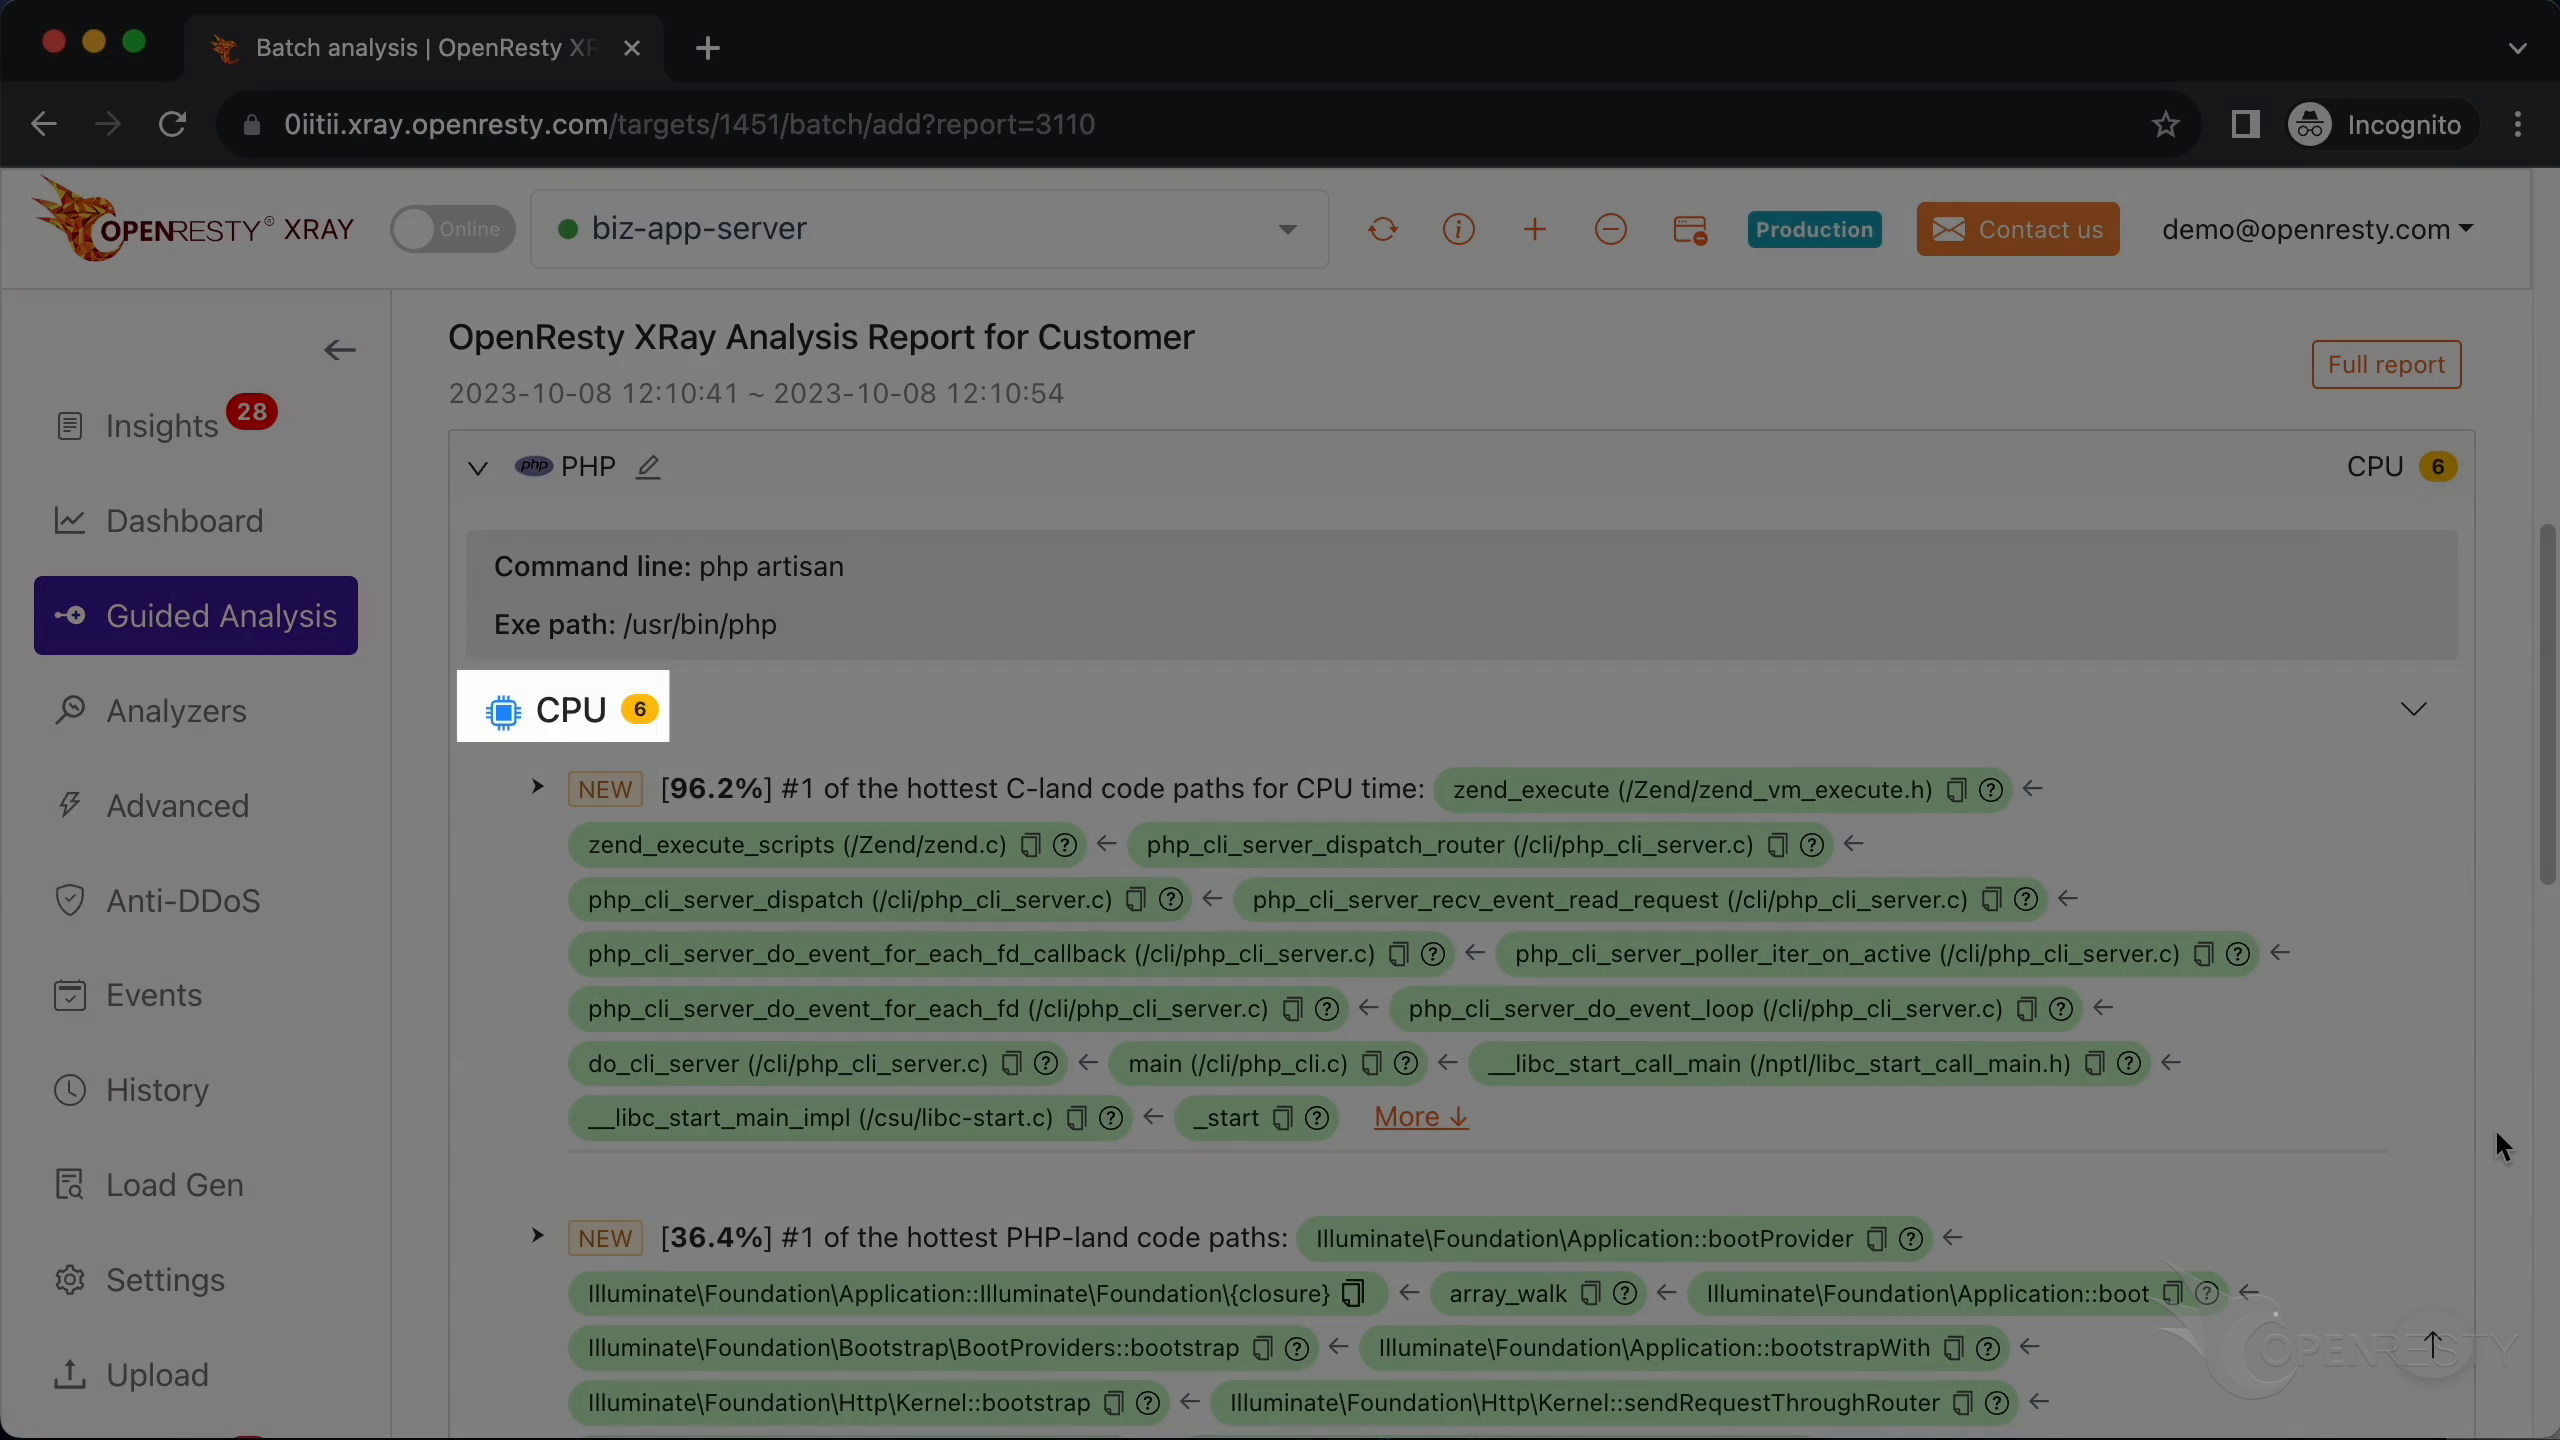
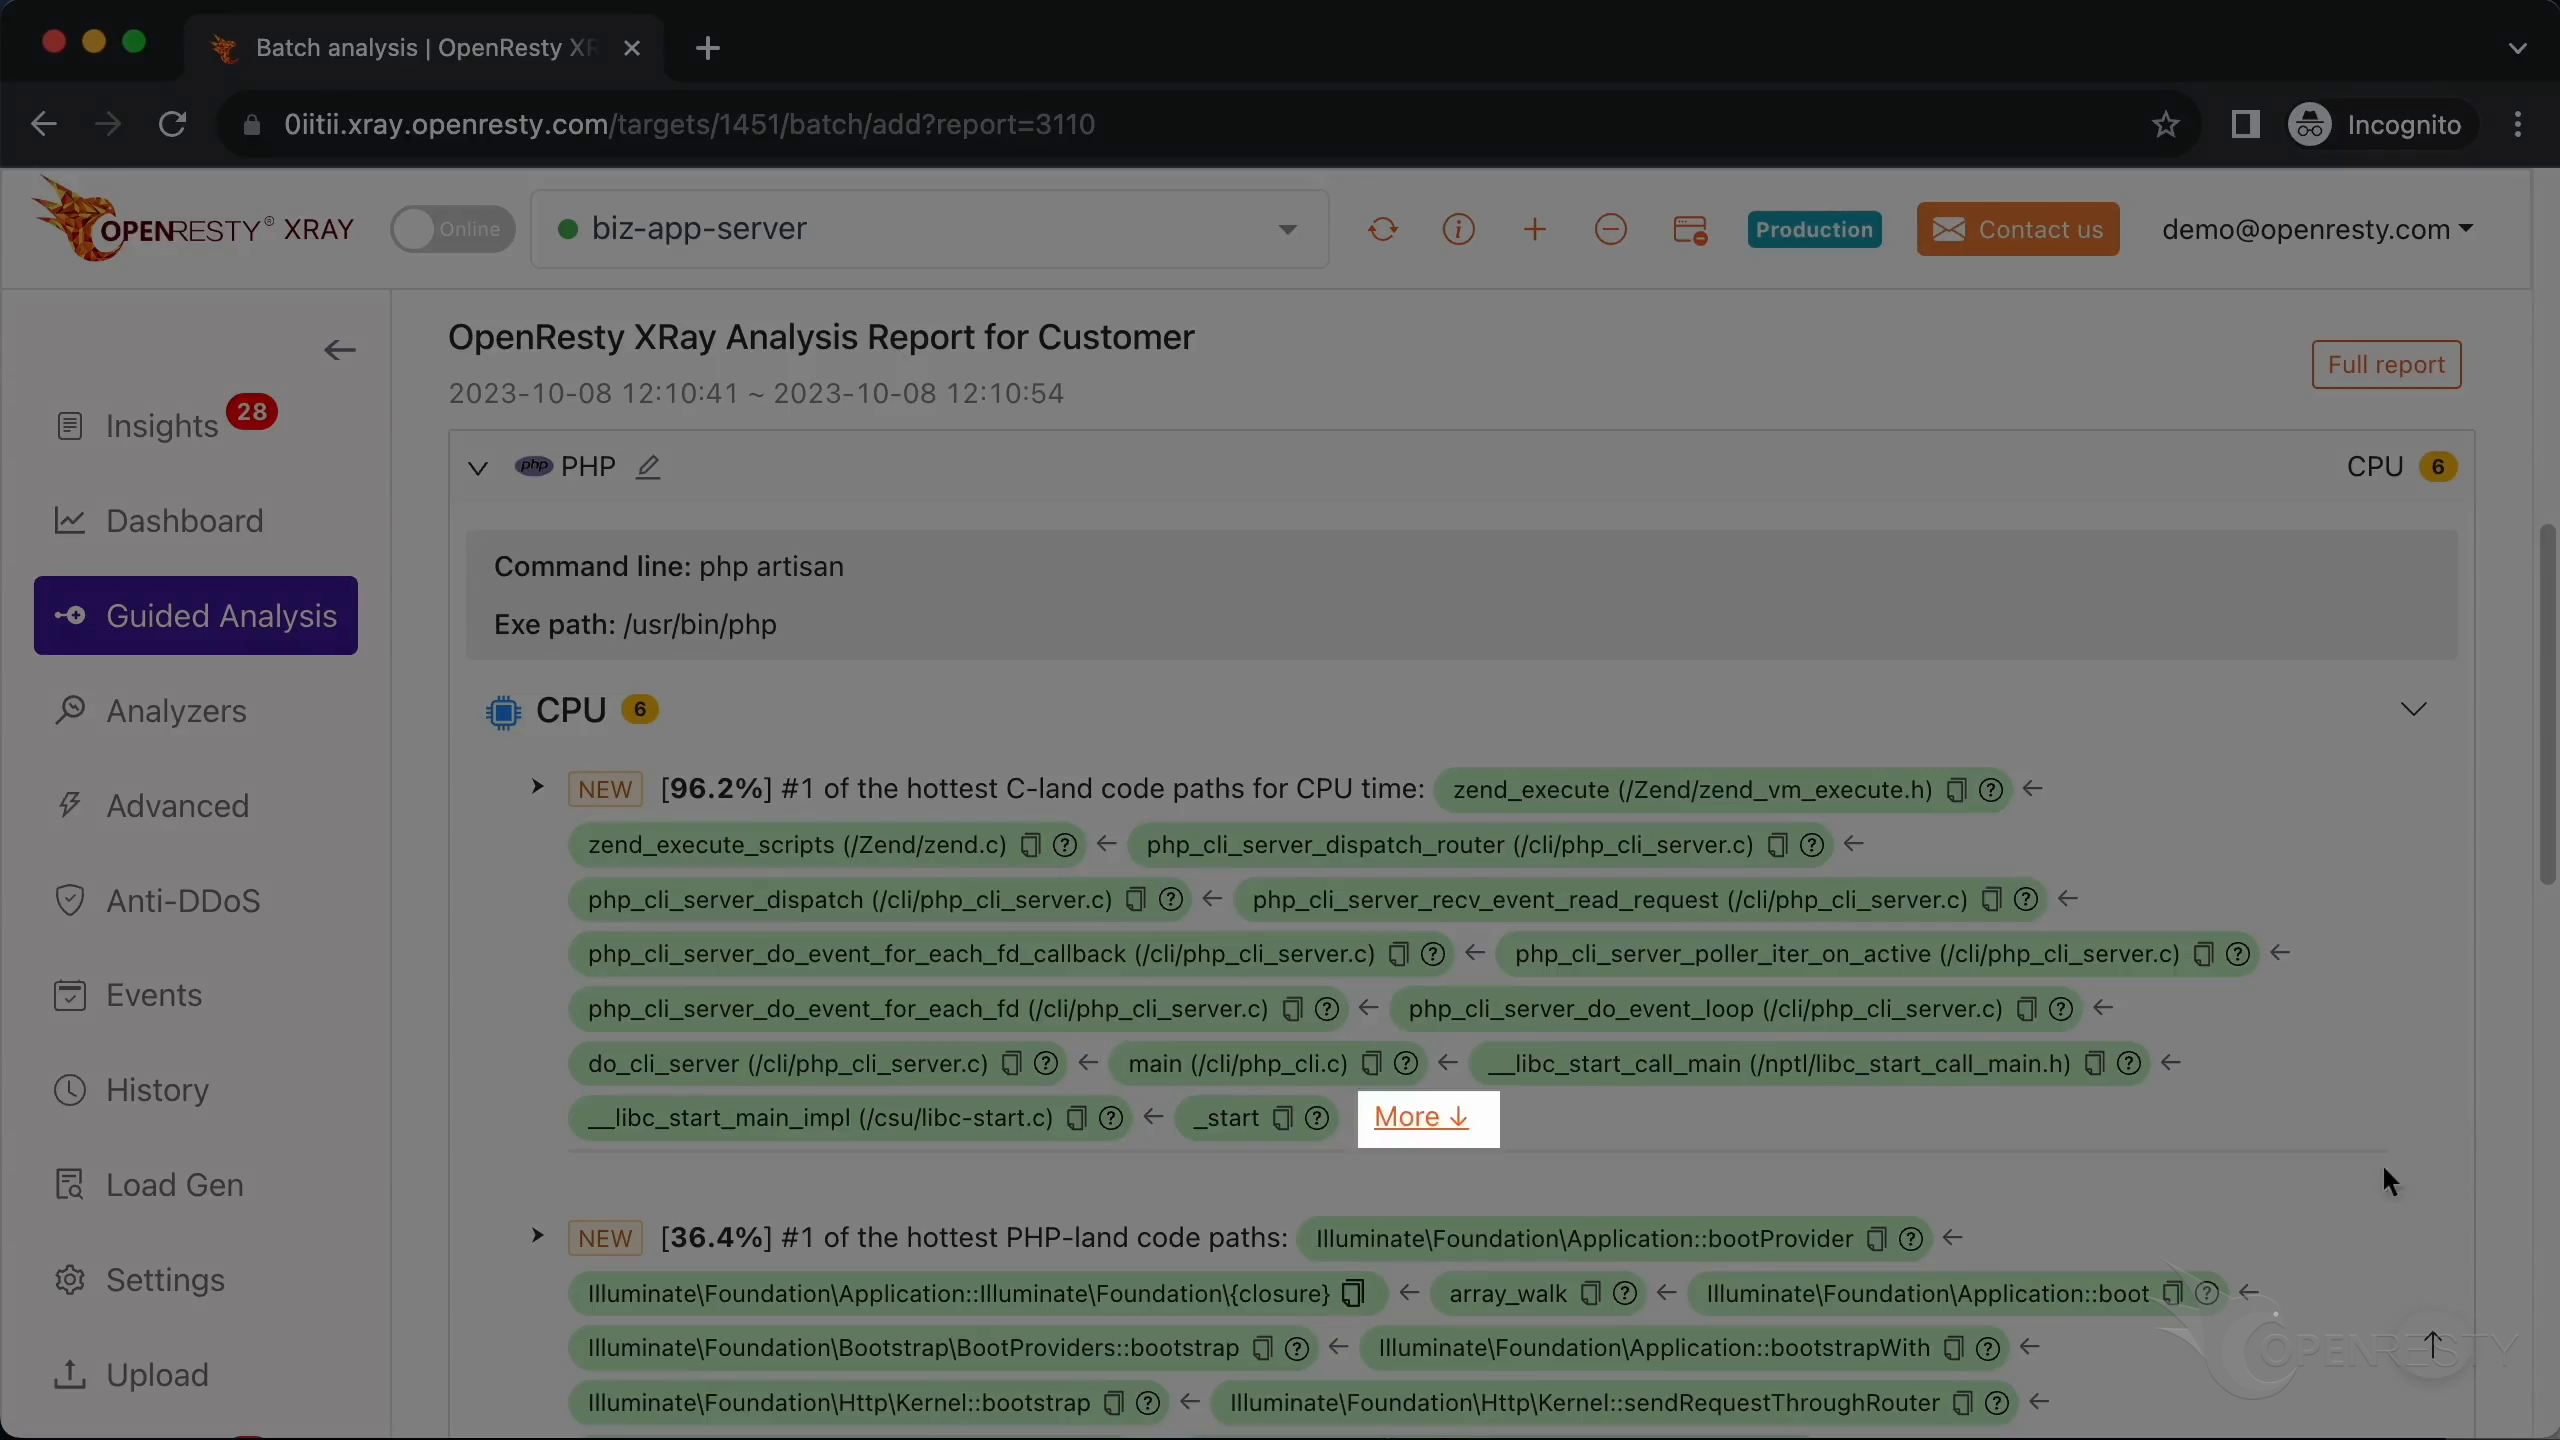
This is the #1 hottest C code path for the CPU resources, accounting for 96.2% of the CPU time.
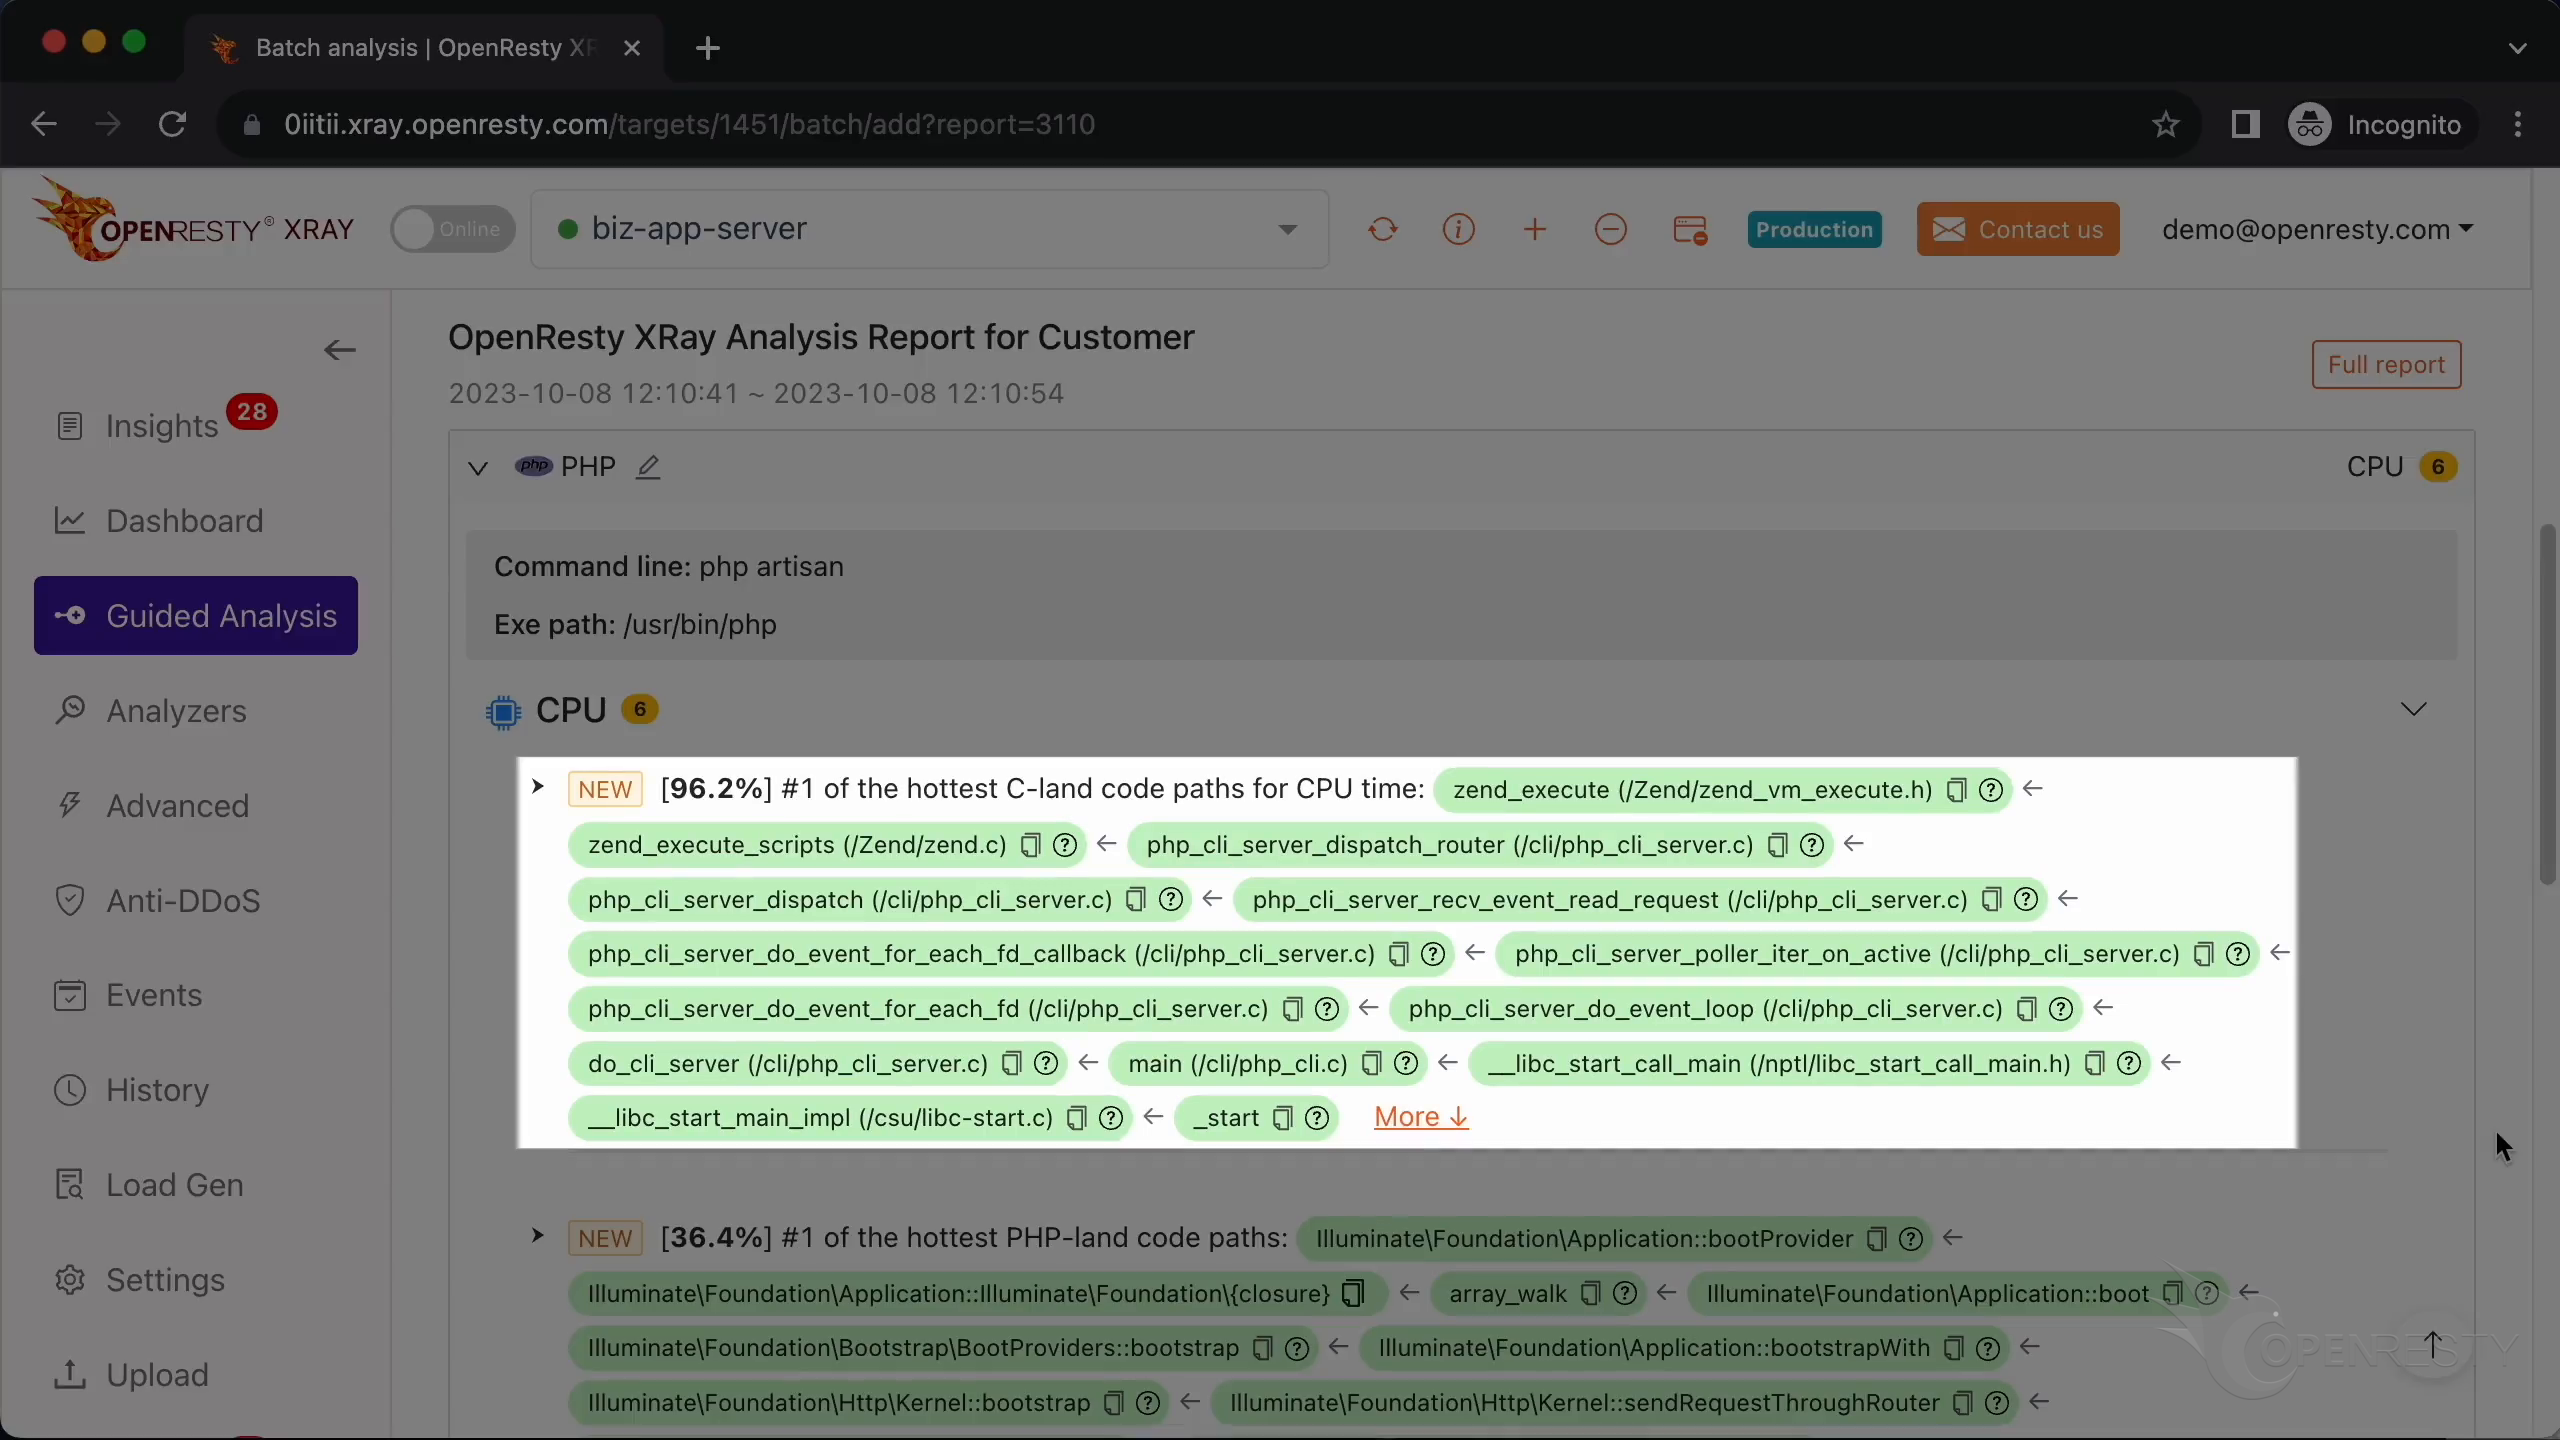
The first zend_execute function is used to interpret and execute PHP opcodes.
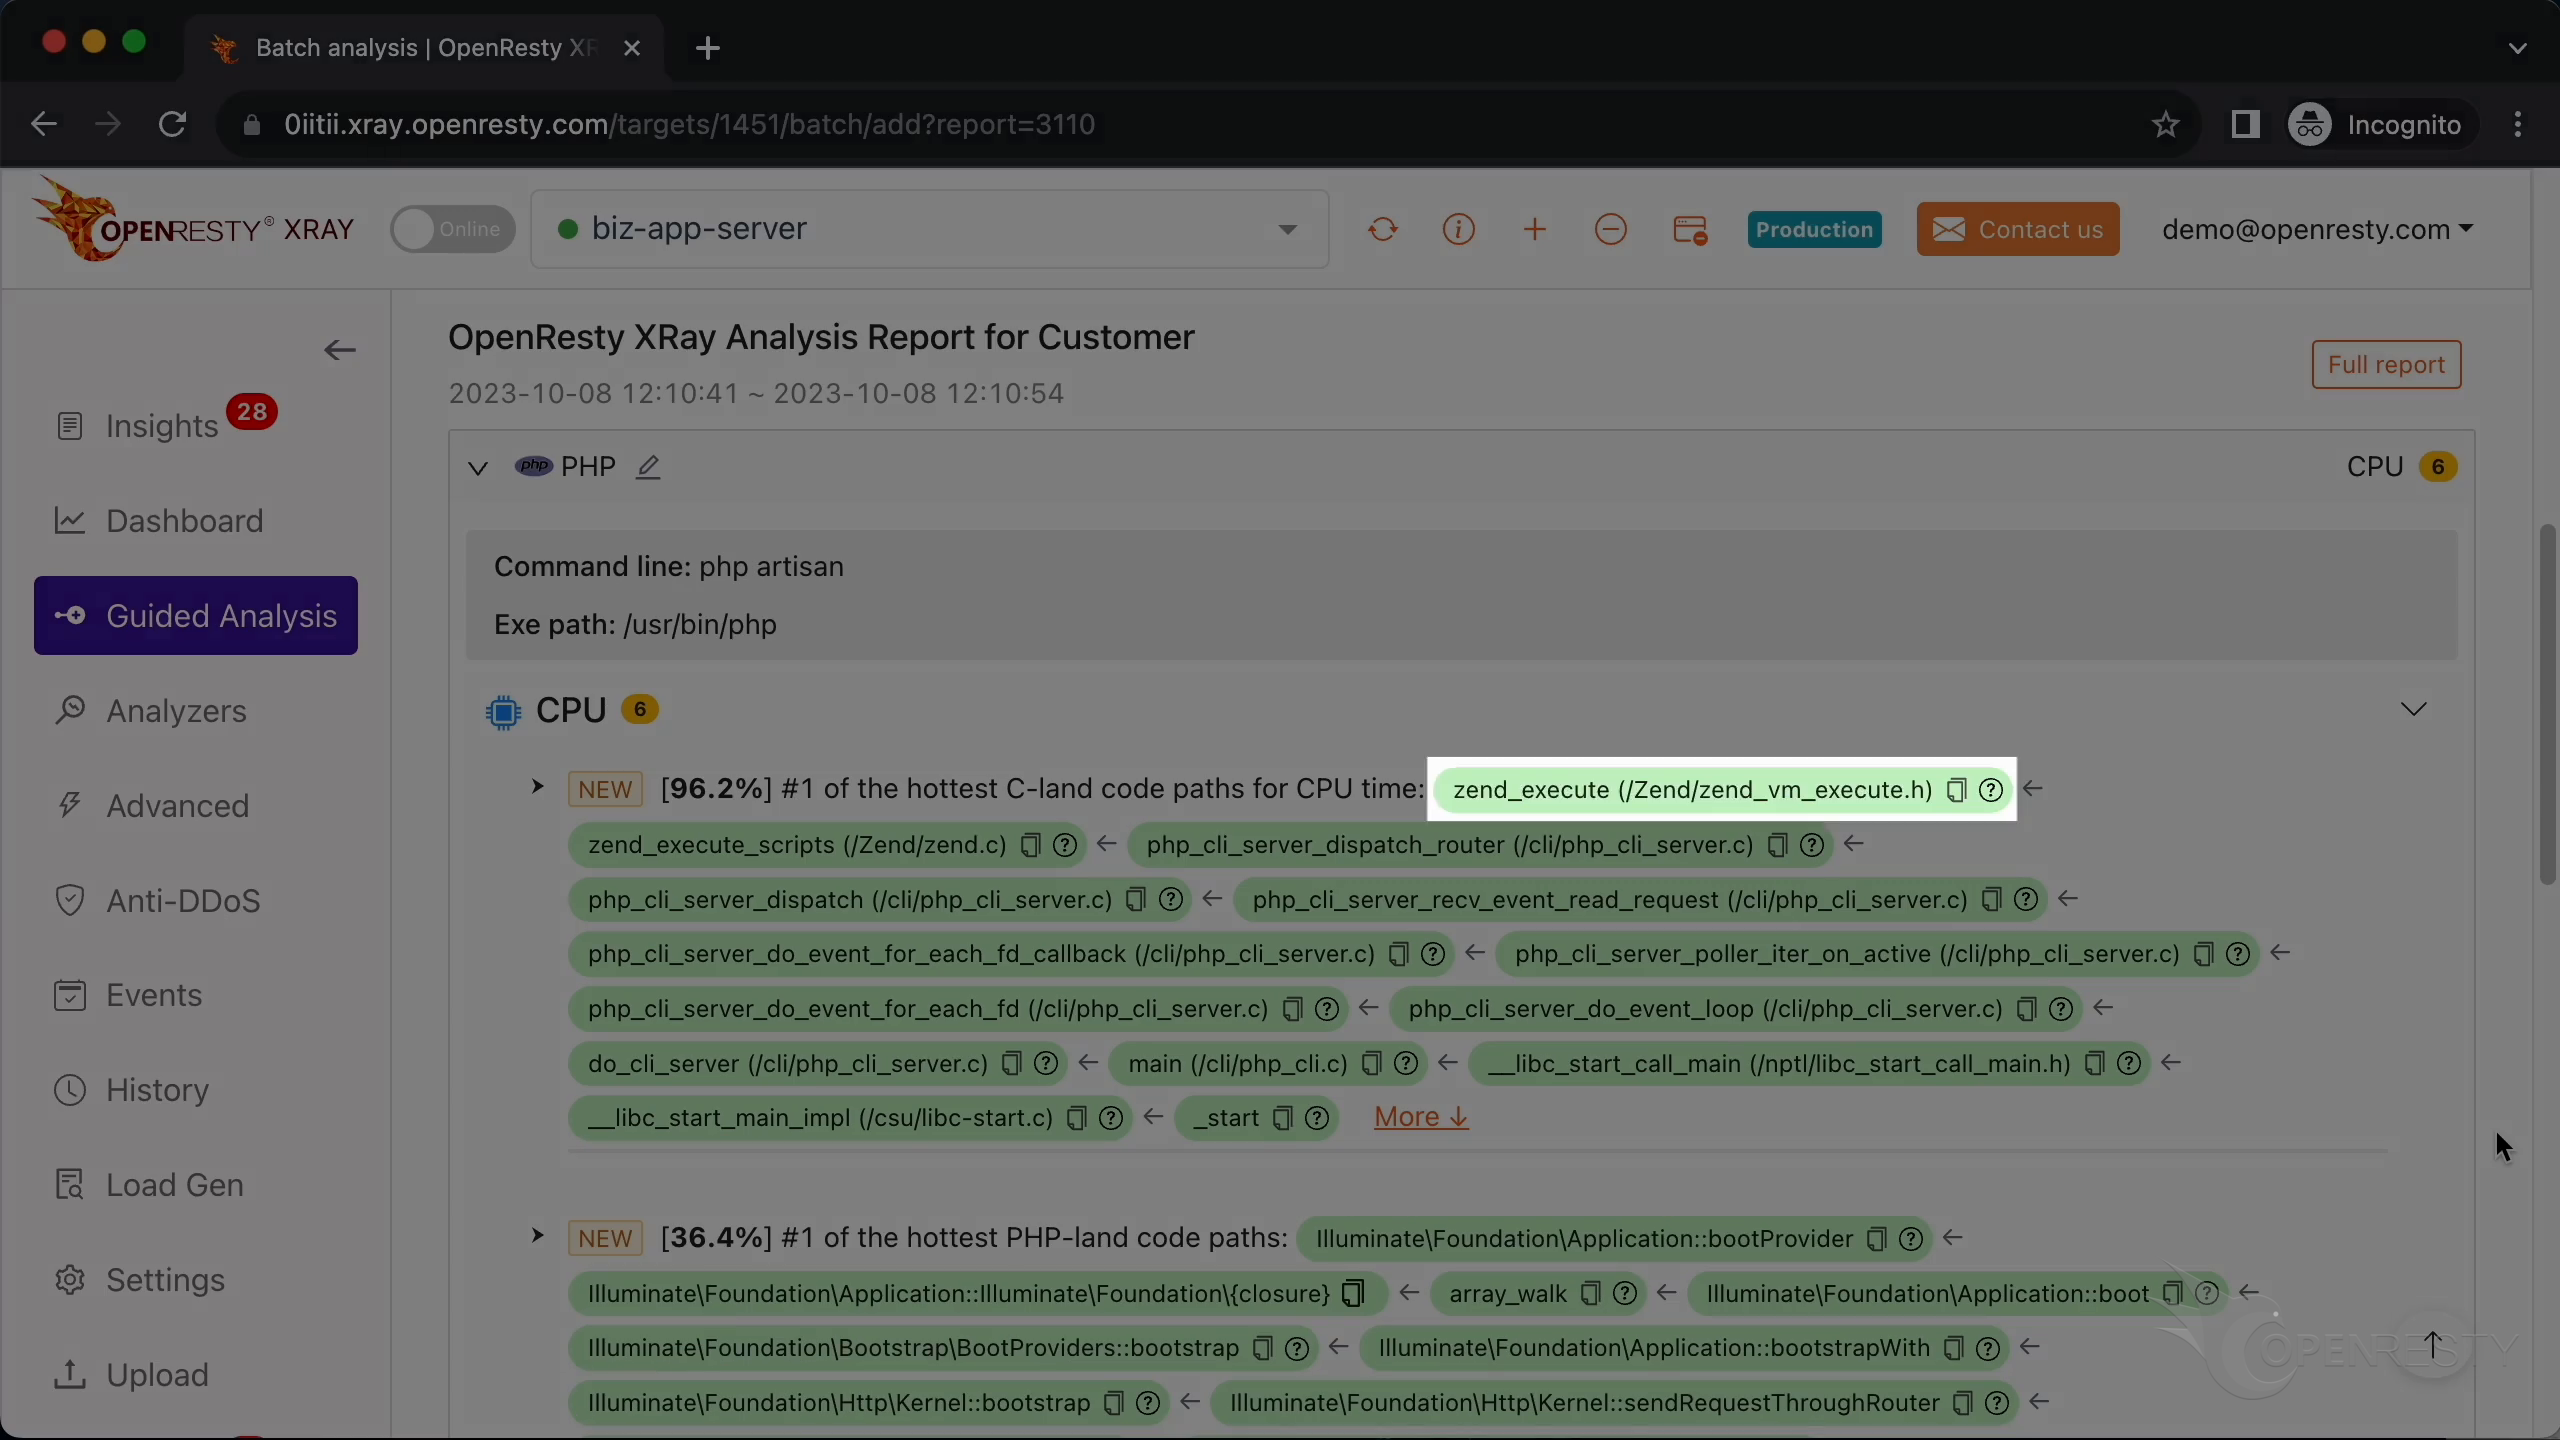
When the server receives a new HTTP request, the php_cli_server_dispatch_router function is called to read and parse the request data.
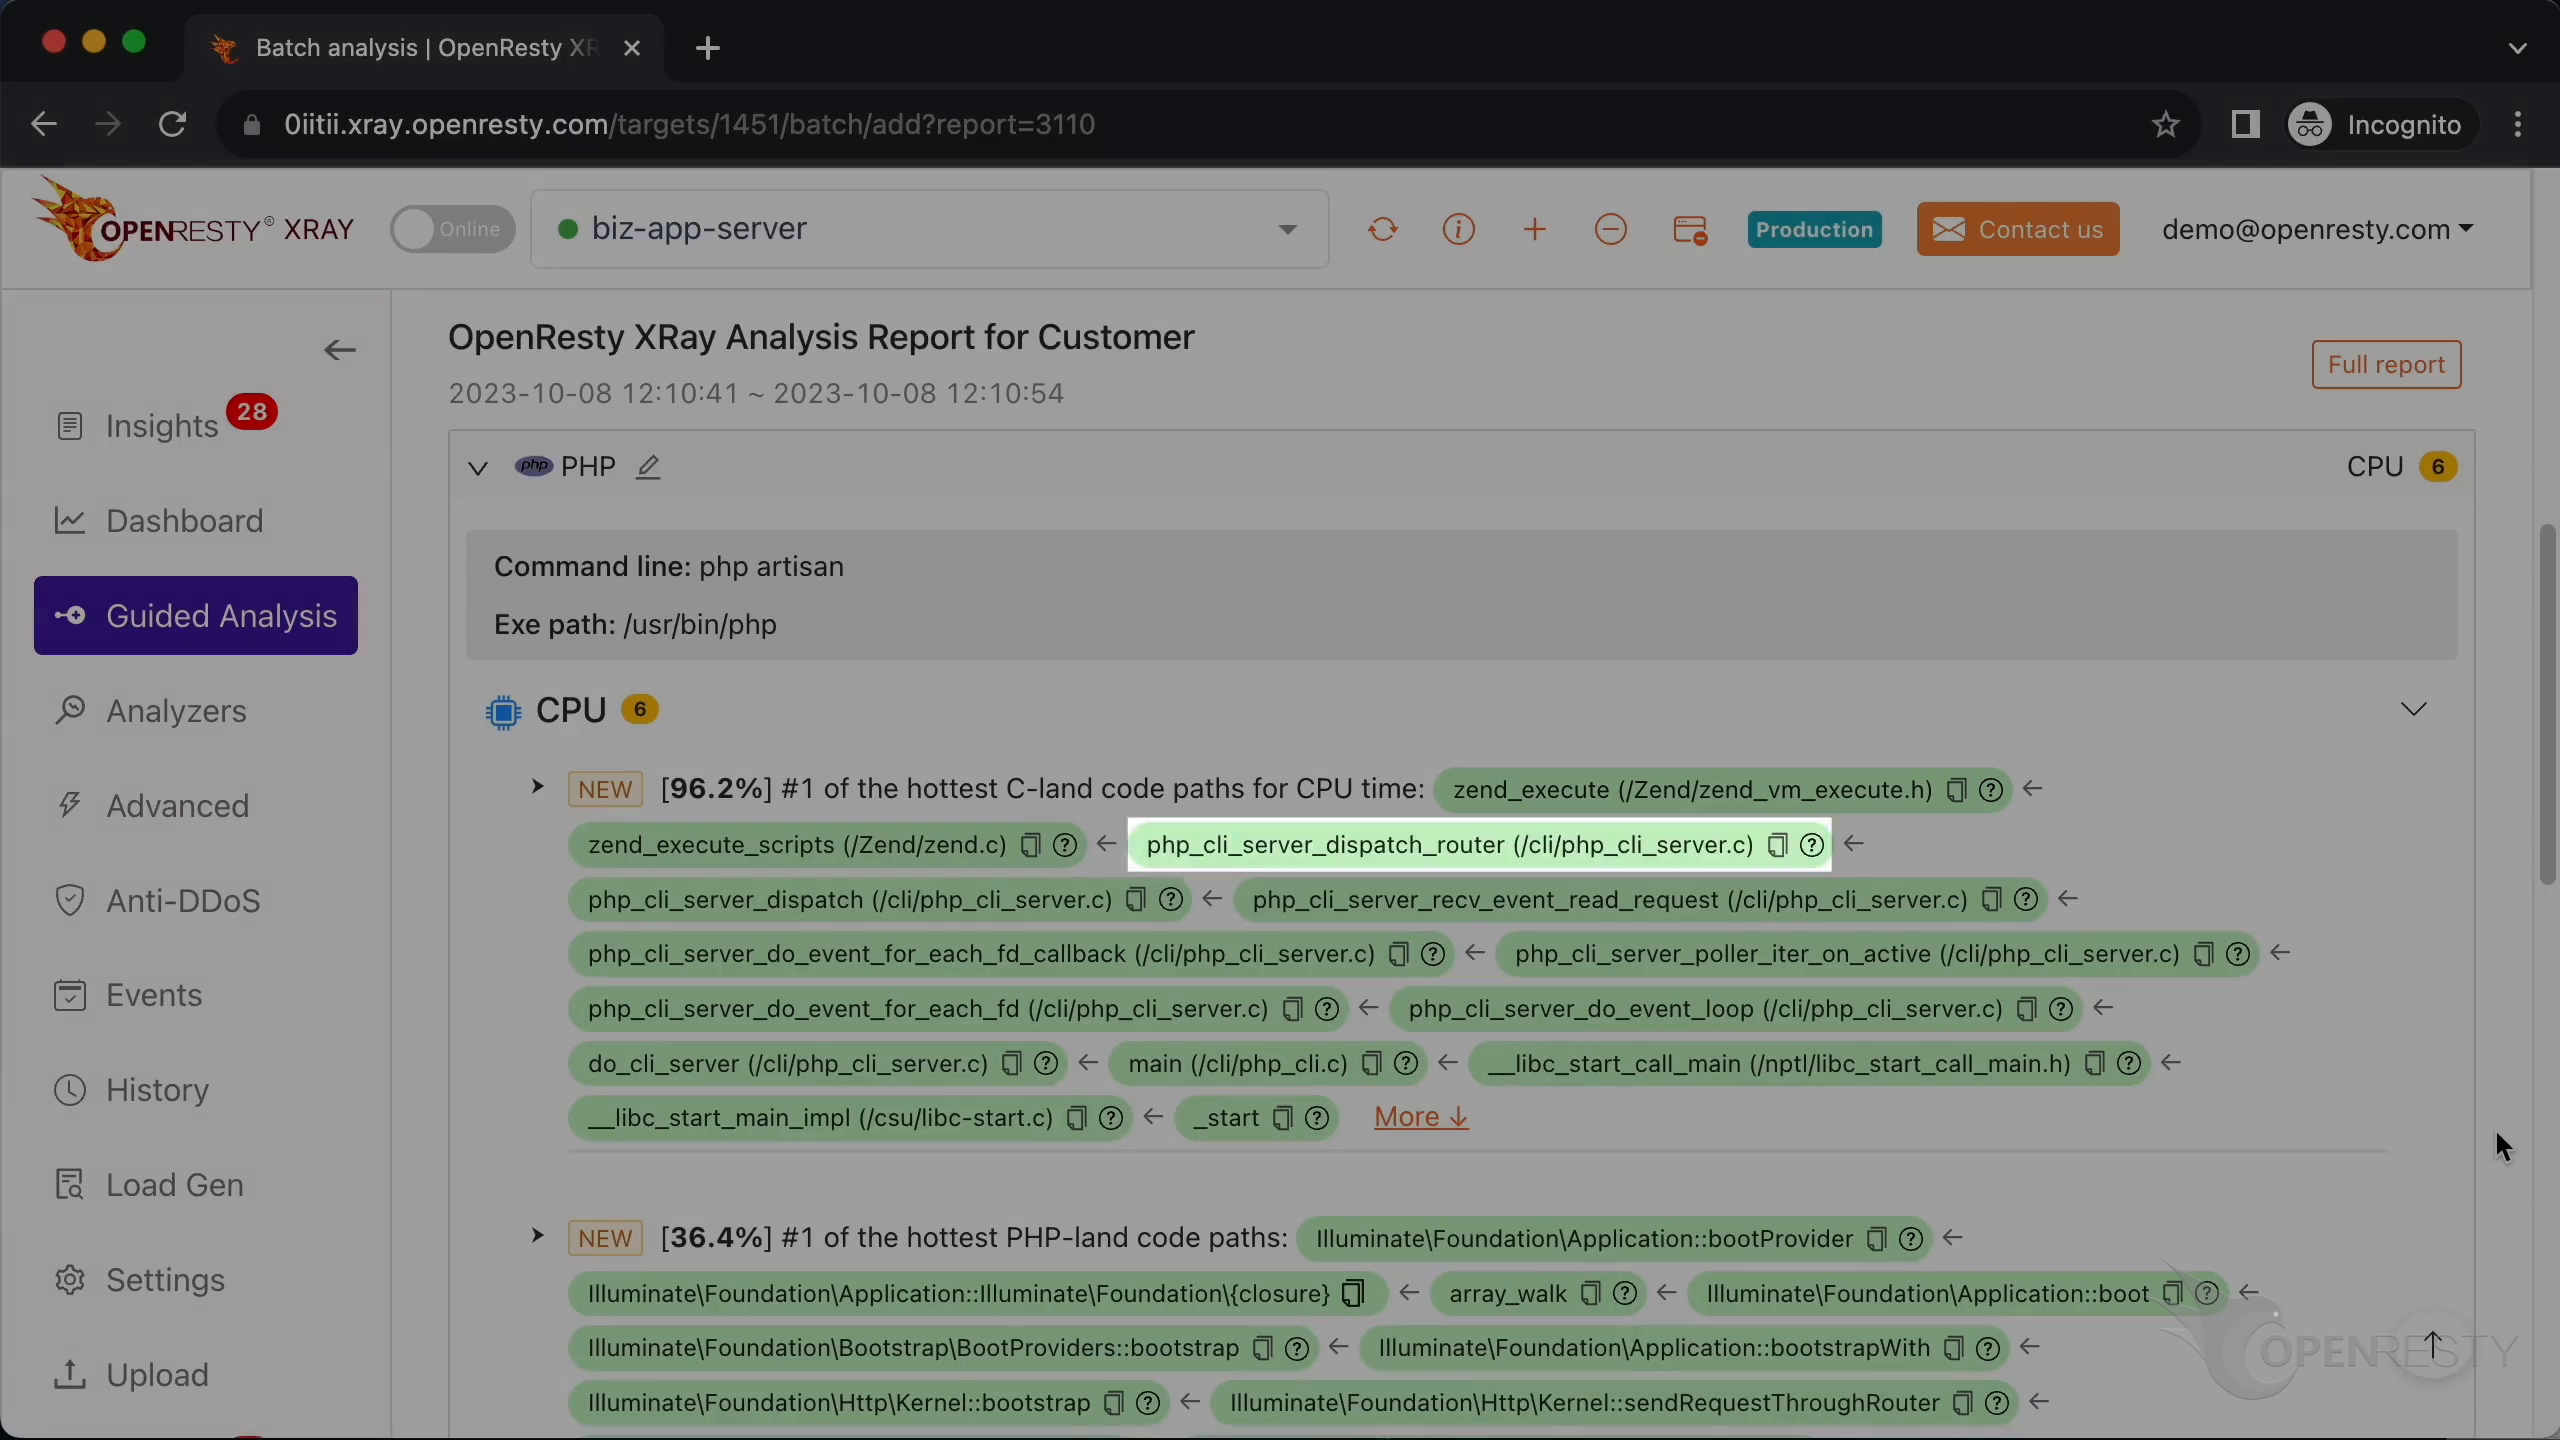
The main function frame shows this demo runs on the built-in web server started by the PHP CLI. A production deployment on php-fpm would show different server-dispatch frames at this C level, but the Laravel-framework hotspots at the PHP level below are the ones to focus on either way.
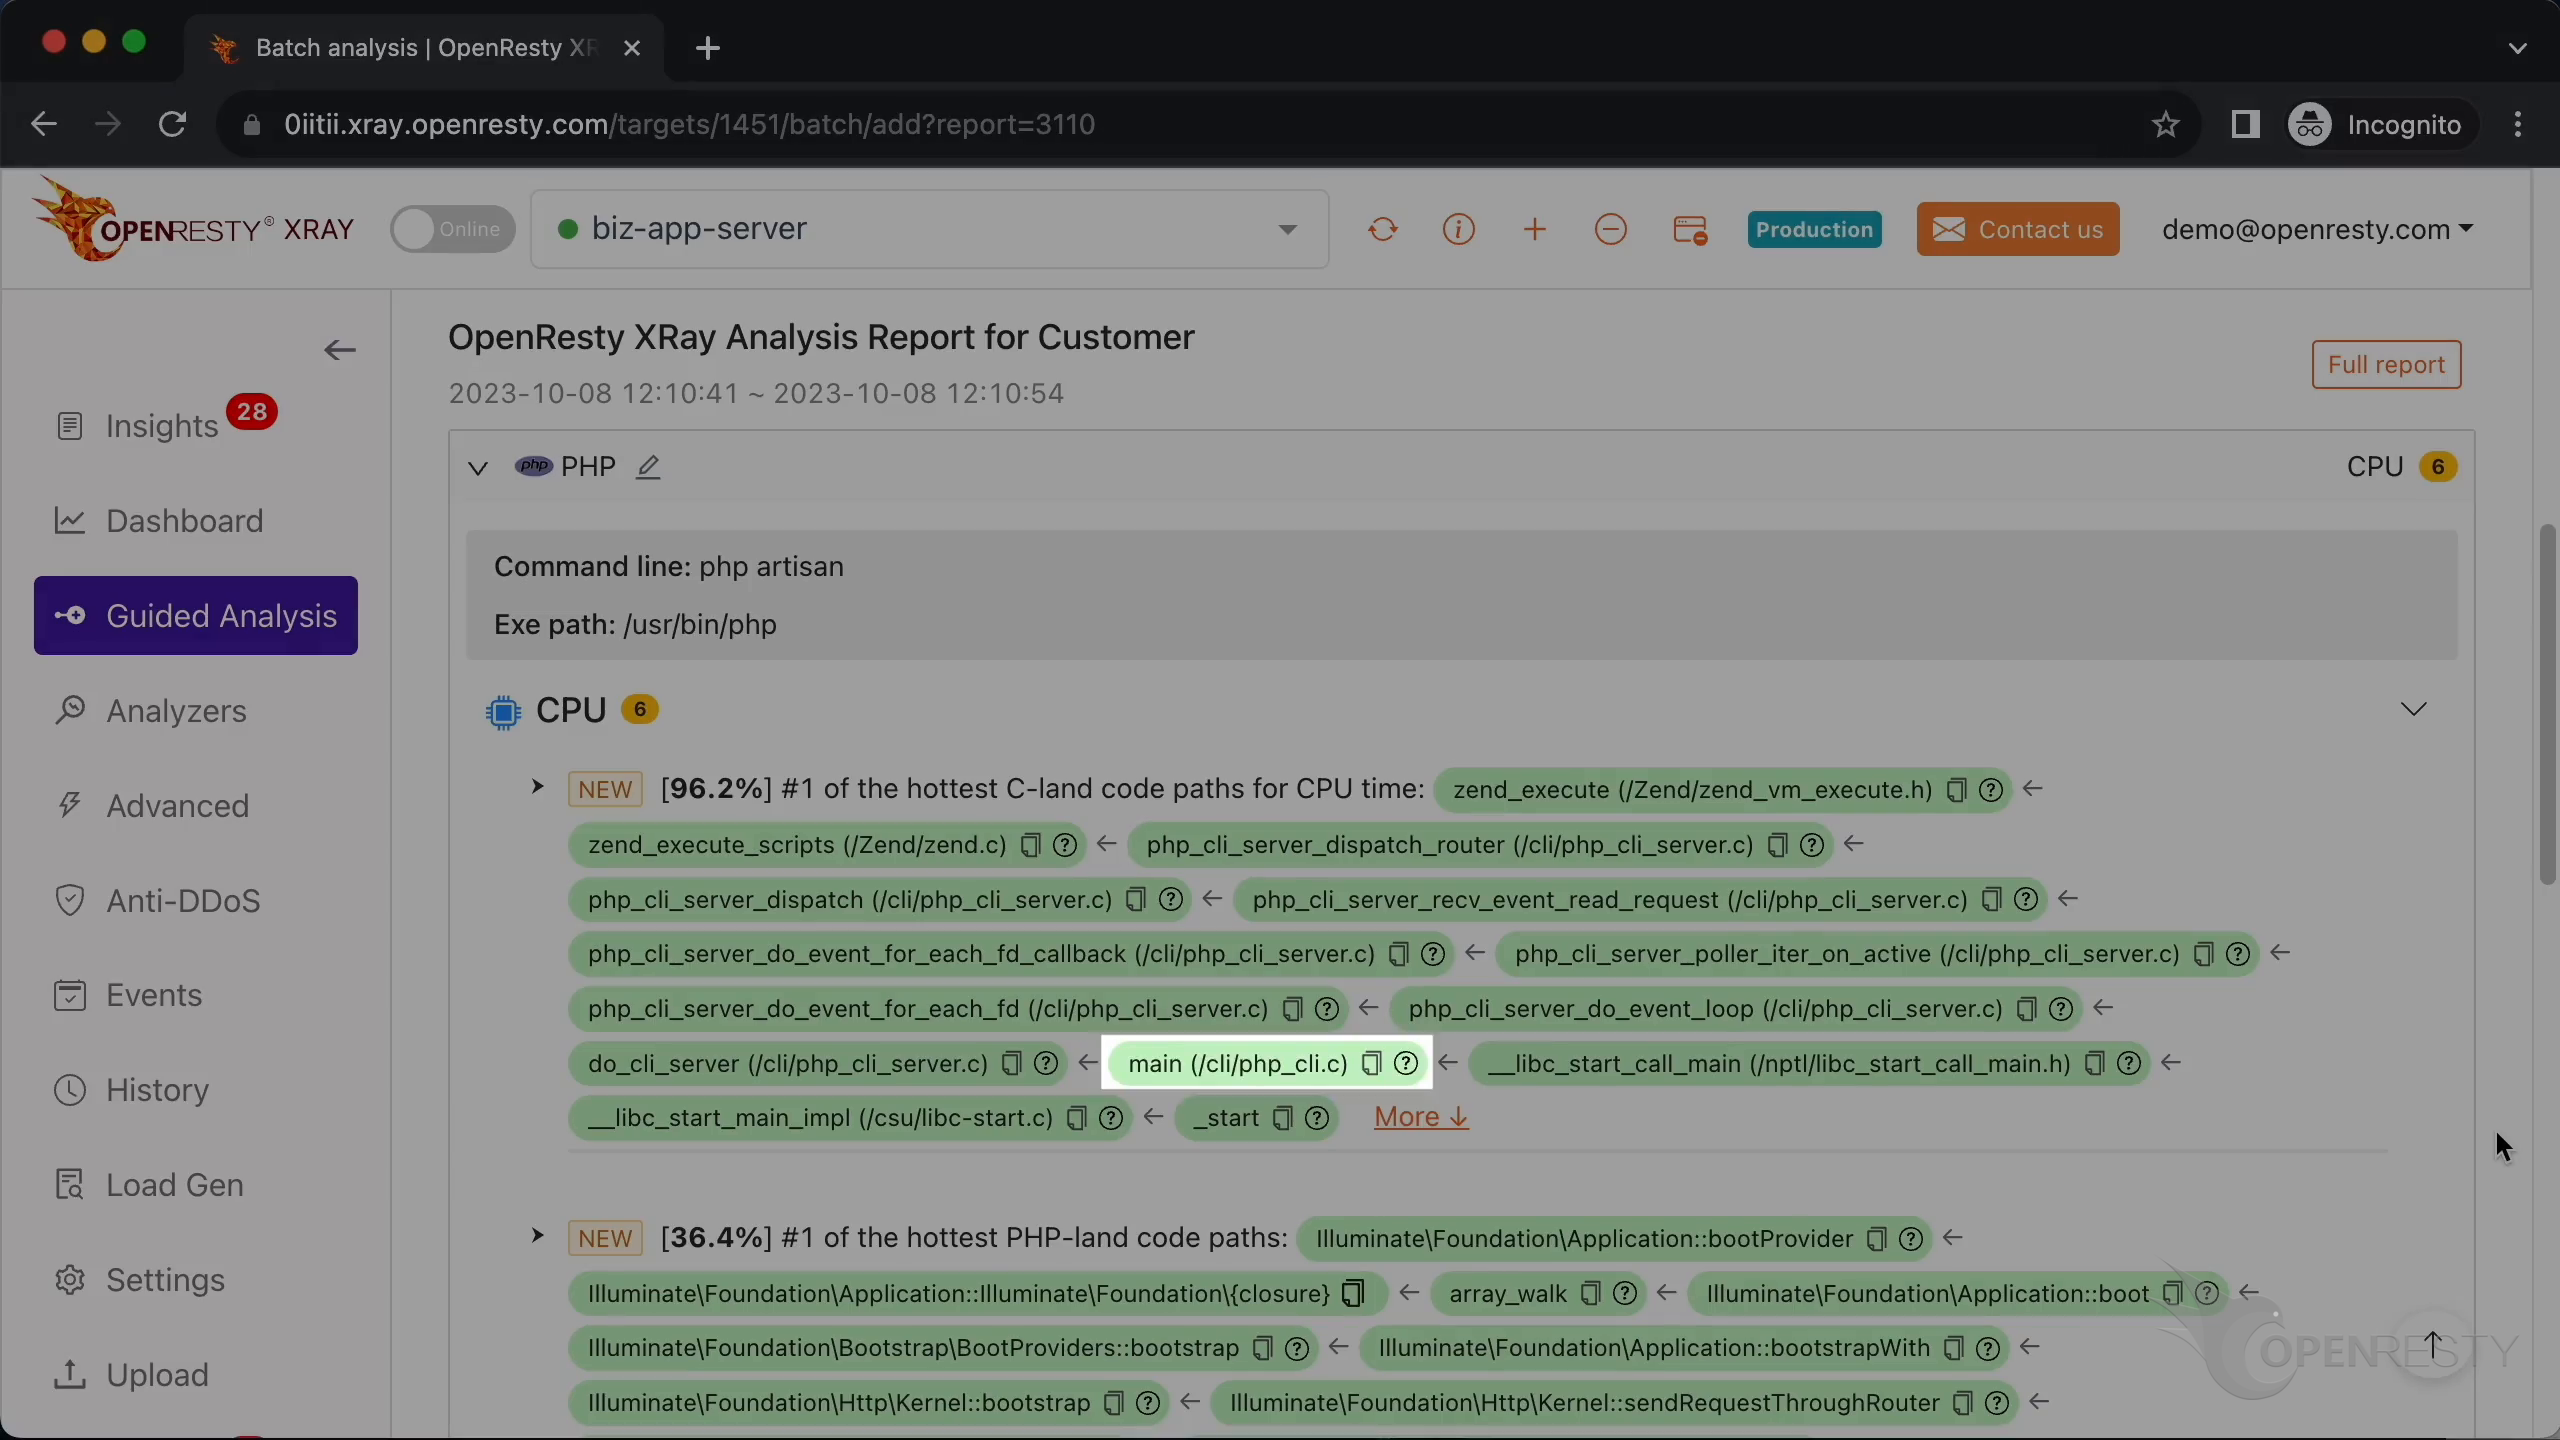
Expanding the entry reveals the complete C-land call path, from the _start process entry point up through the server’s event loop into the PHP opcode interpreter.
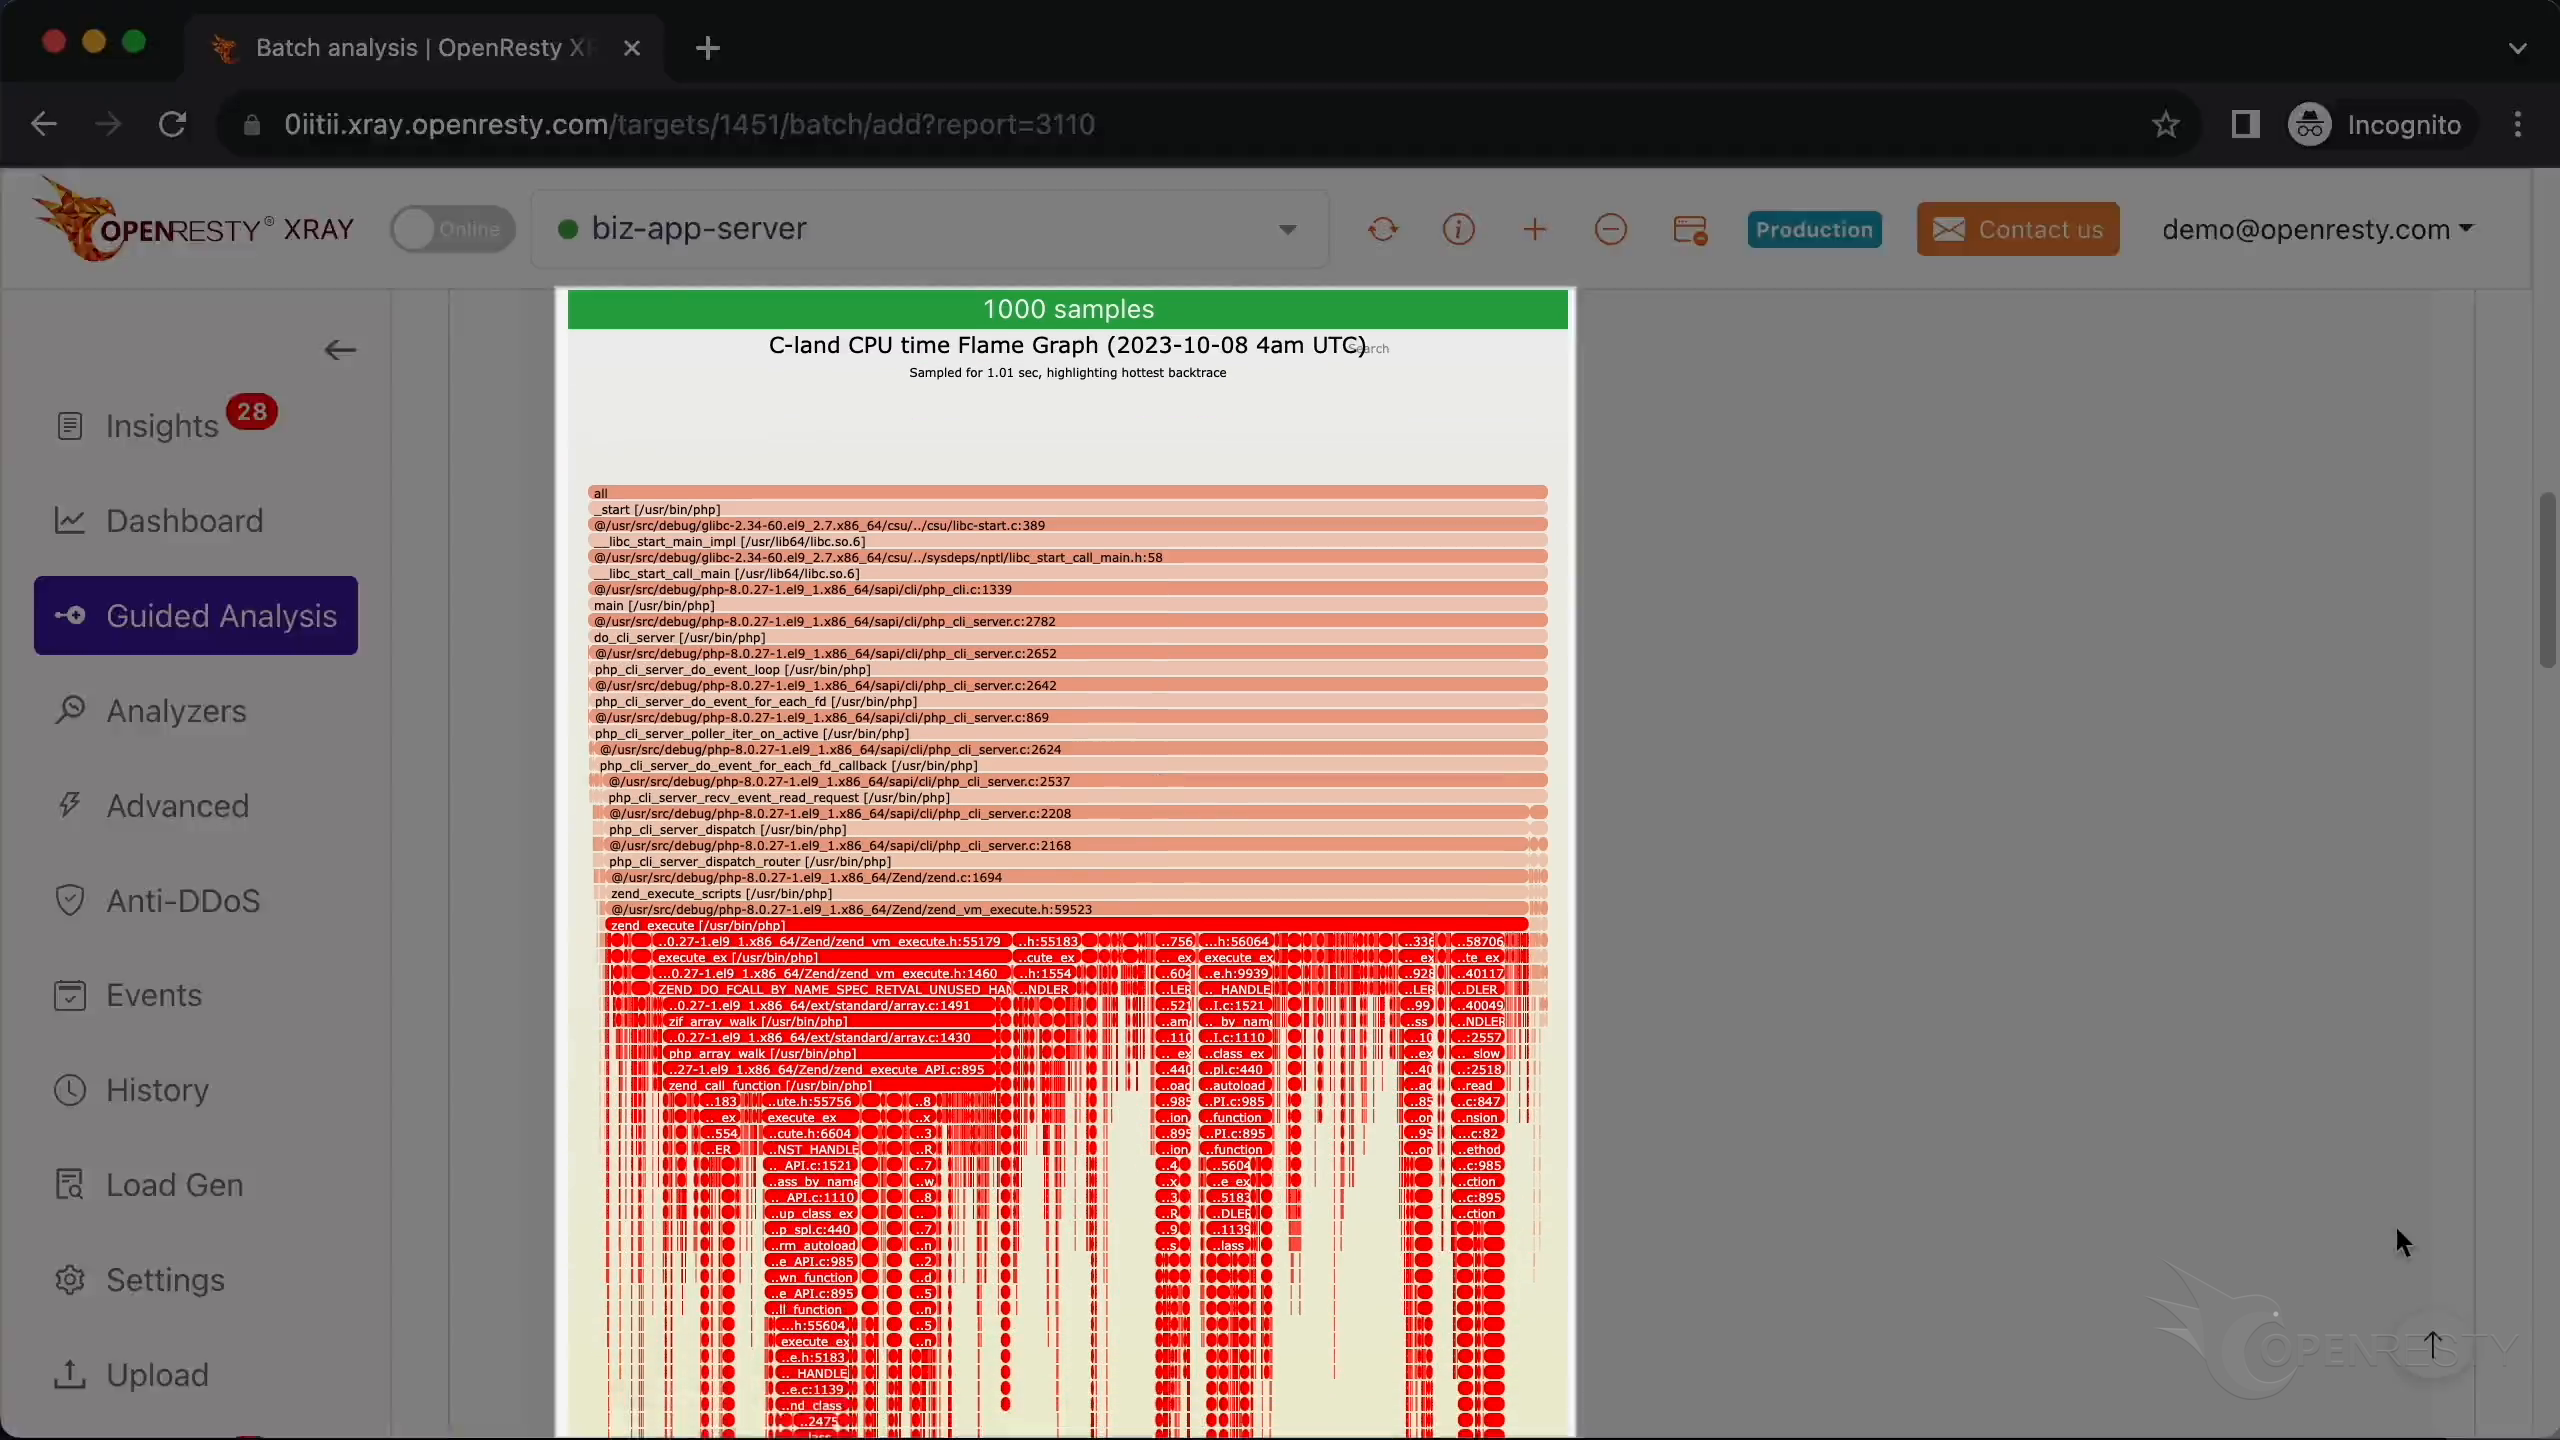
The hot code path was automatically derived from this C-land CPU flame graph.
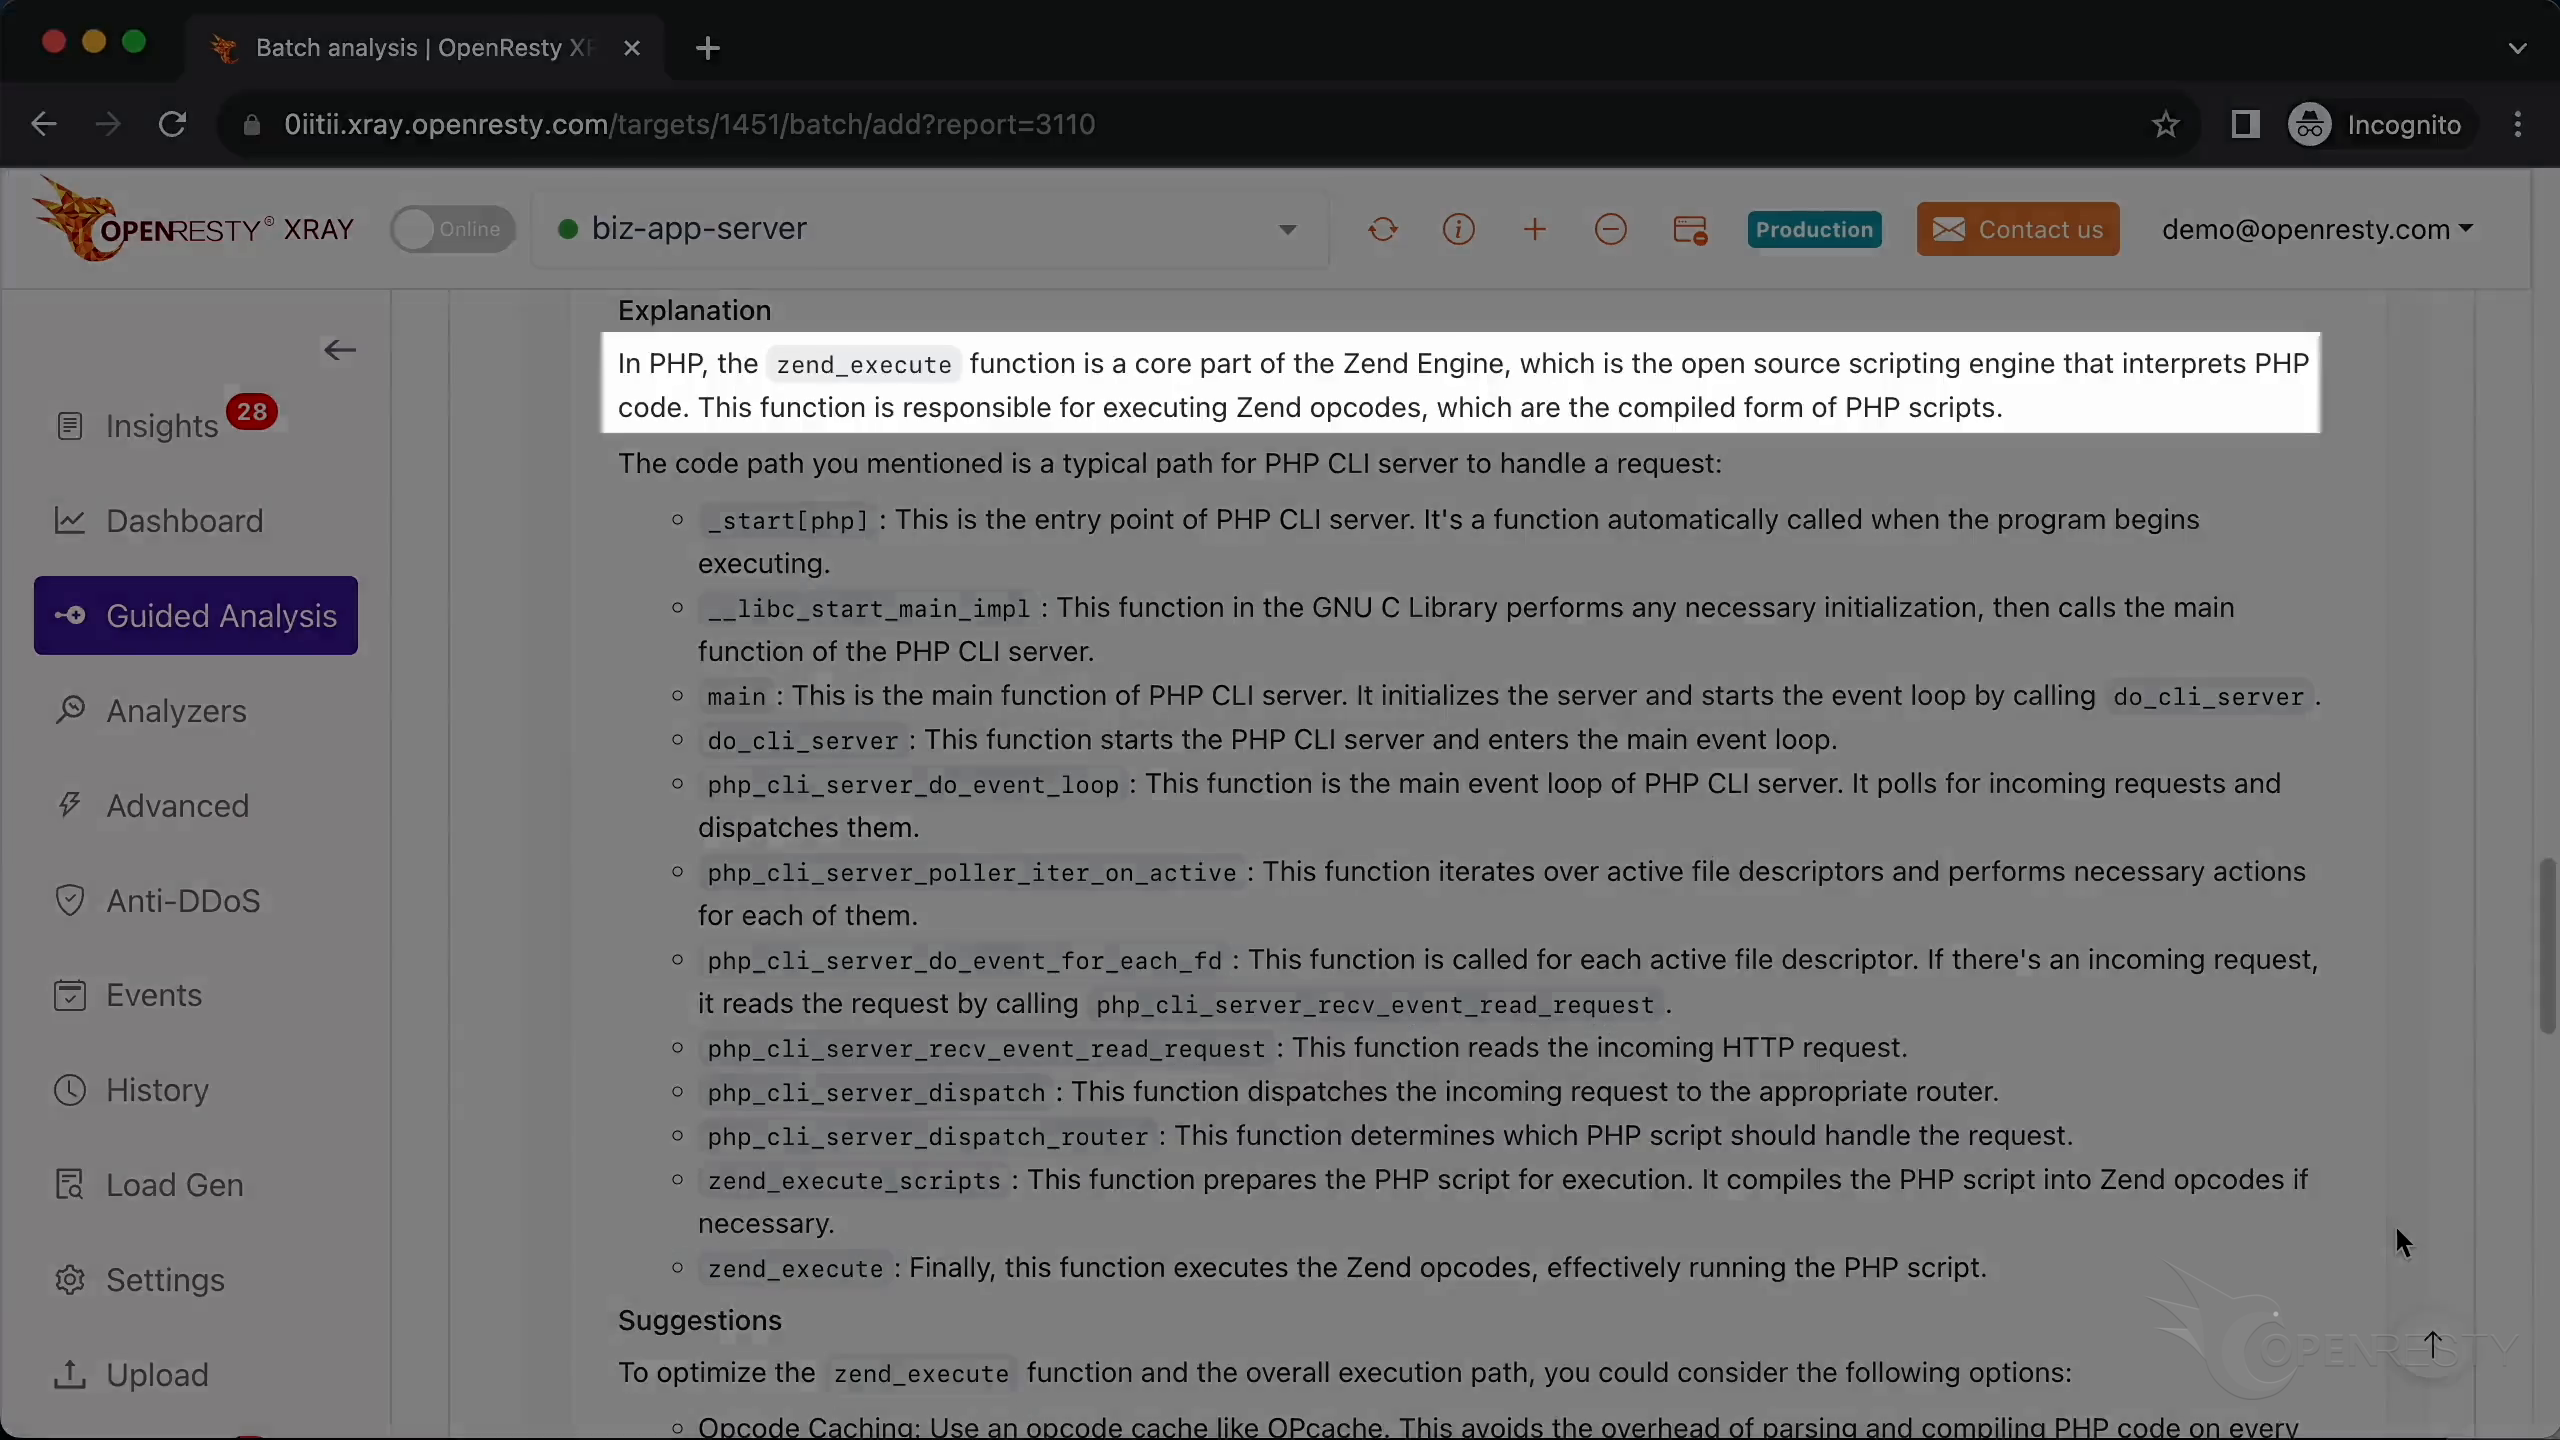
Below are more detailed explanations and suggestions regarding the current issue.
It mentions the zend_execute function we saw earlier.
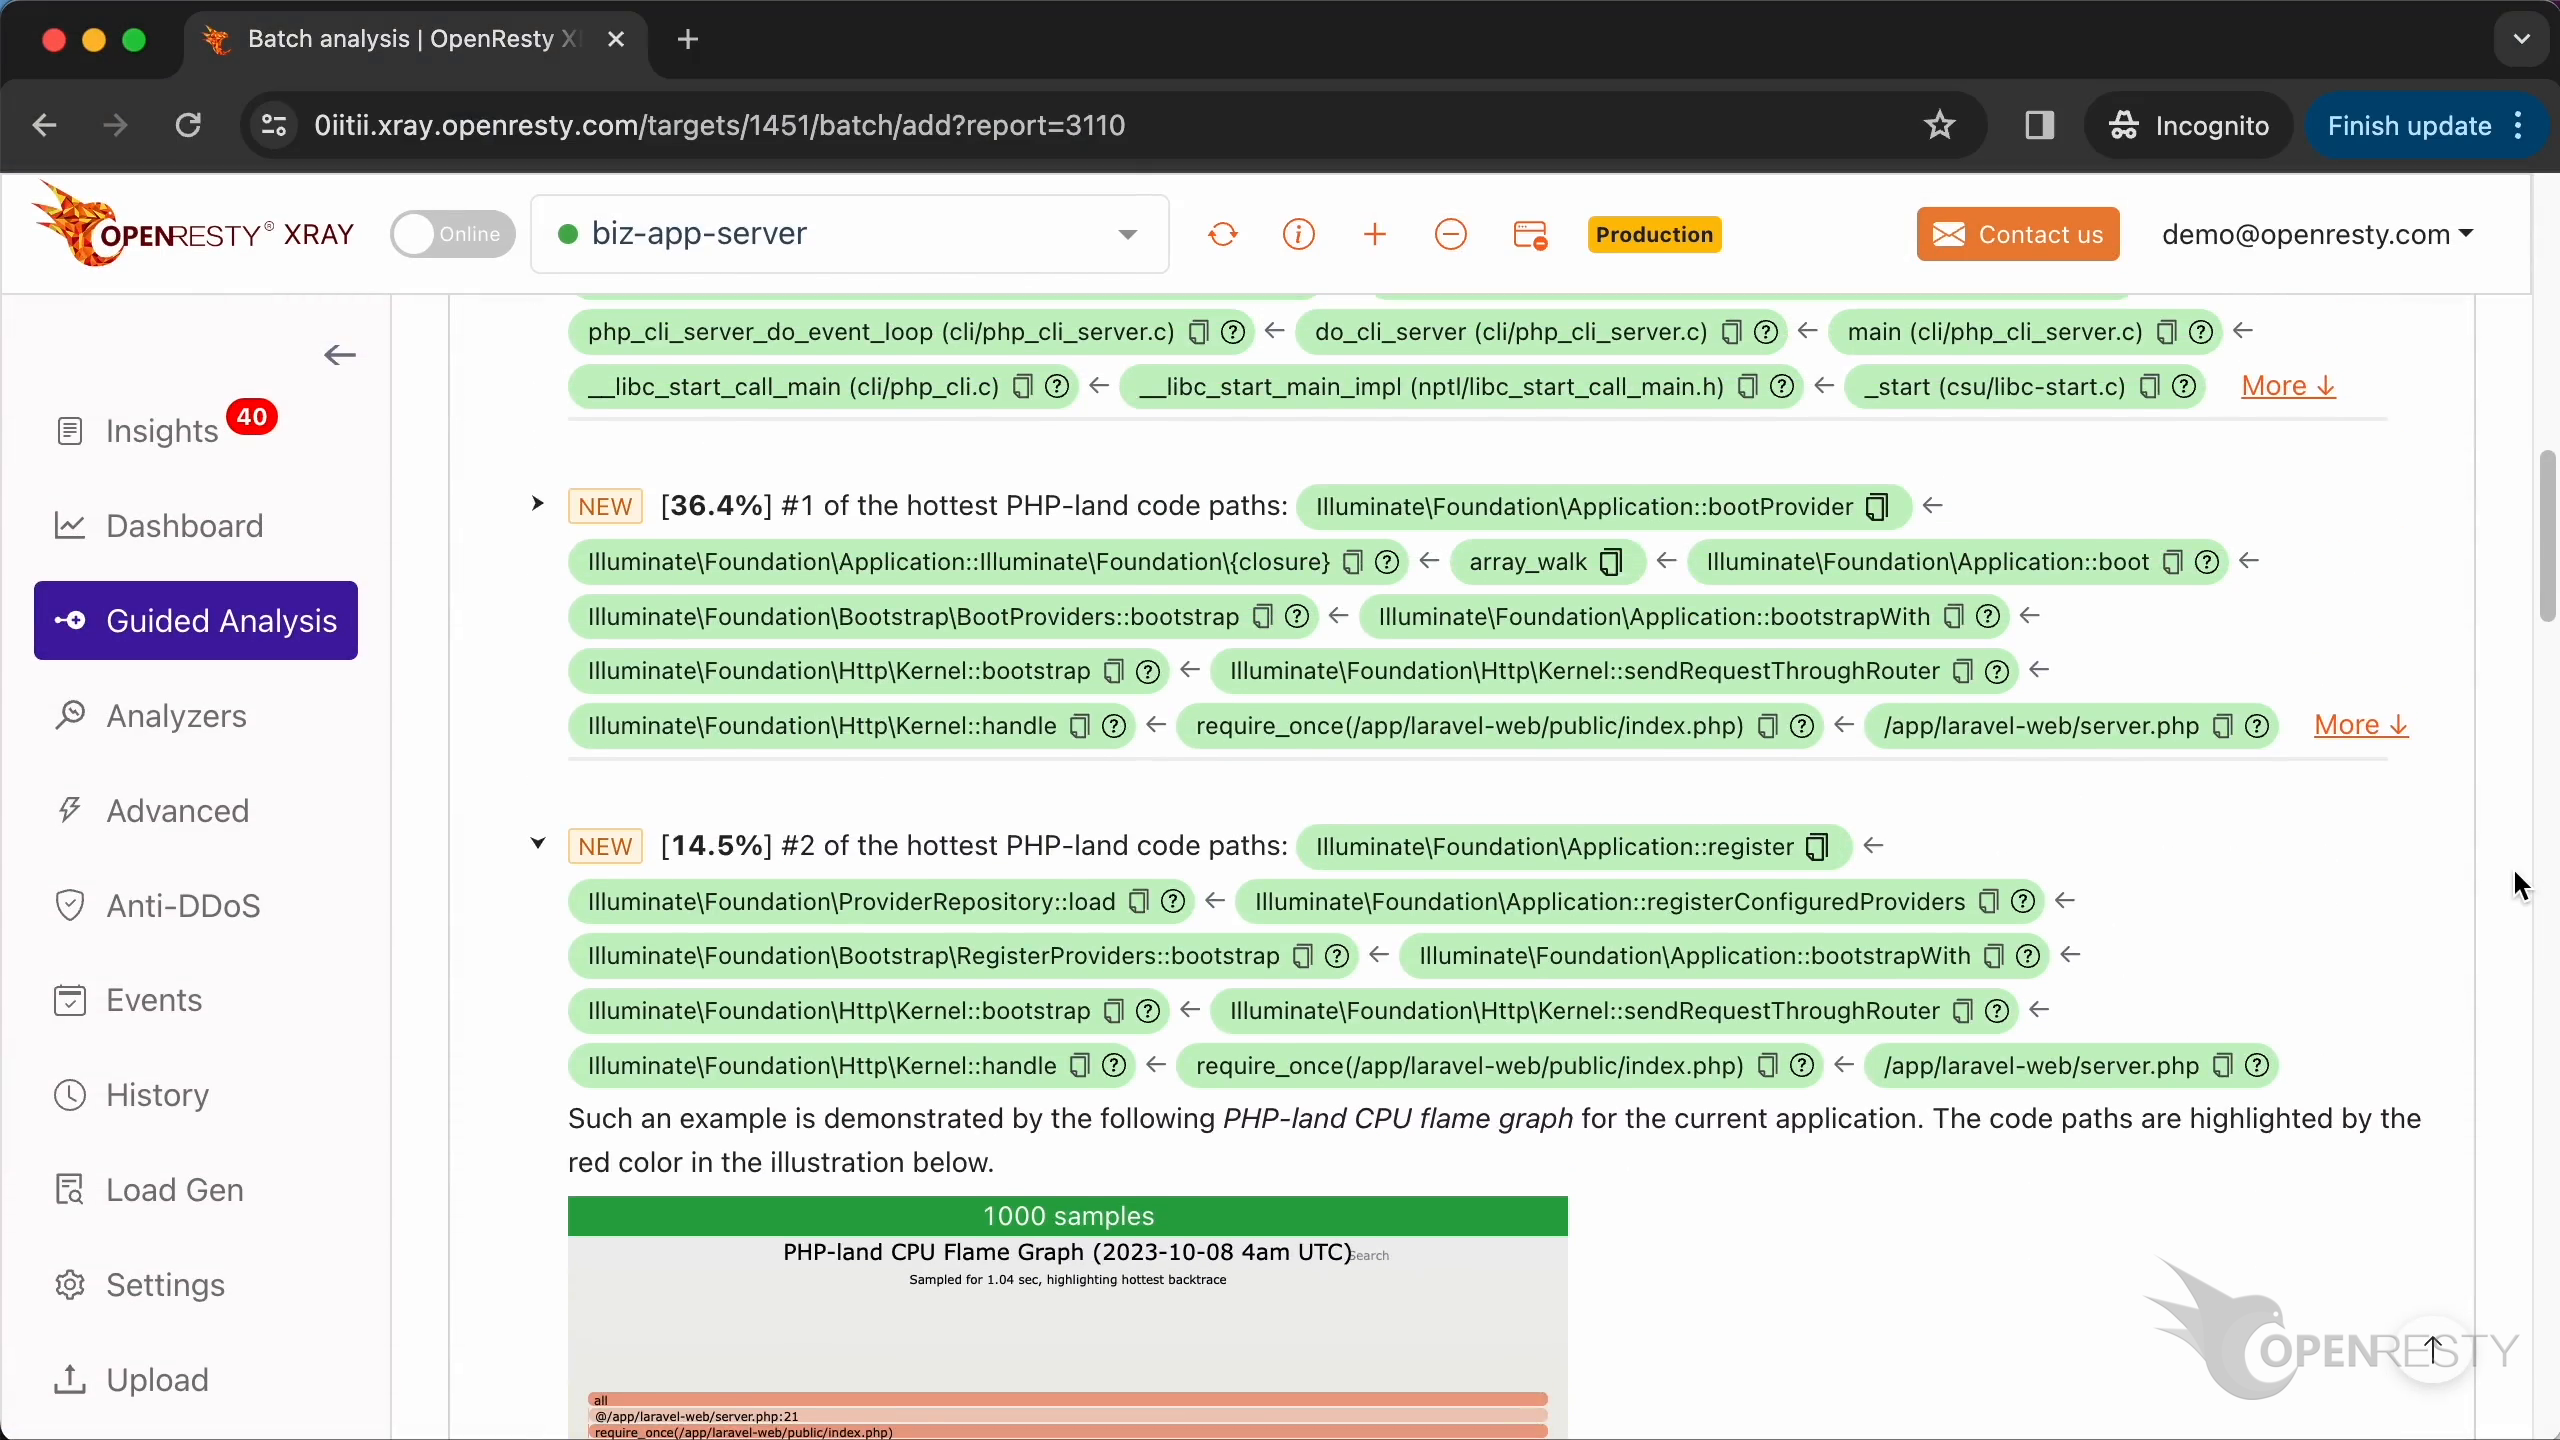
Now for the PHP-land results. The #1 hottest PHP code path alone consumes 36.4% of the CPU time.
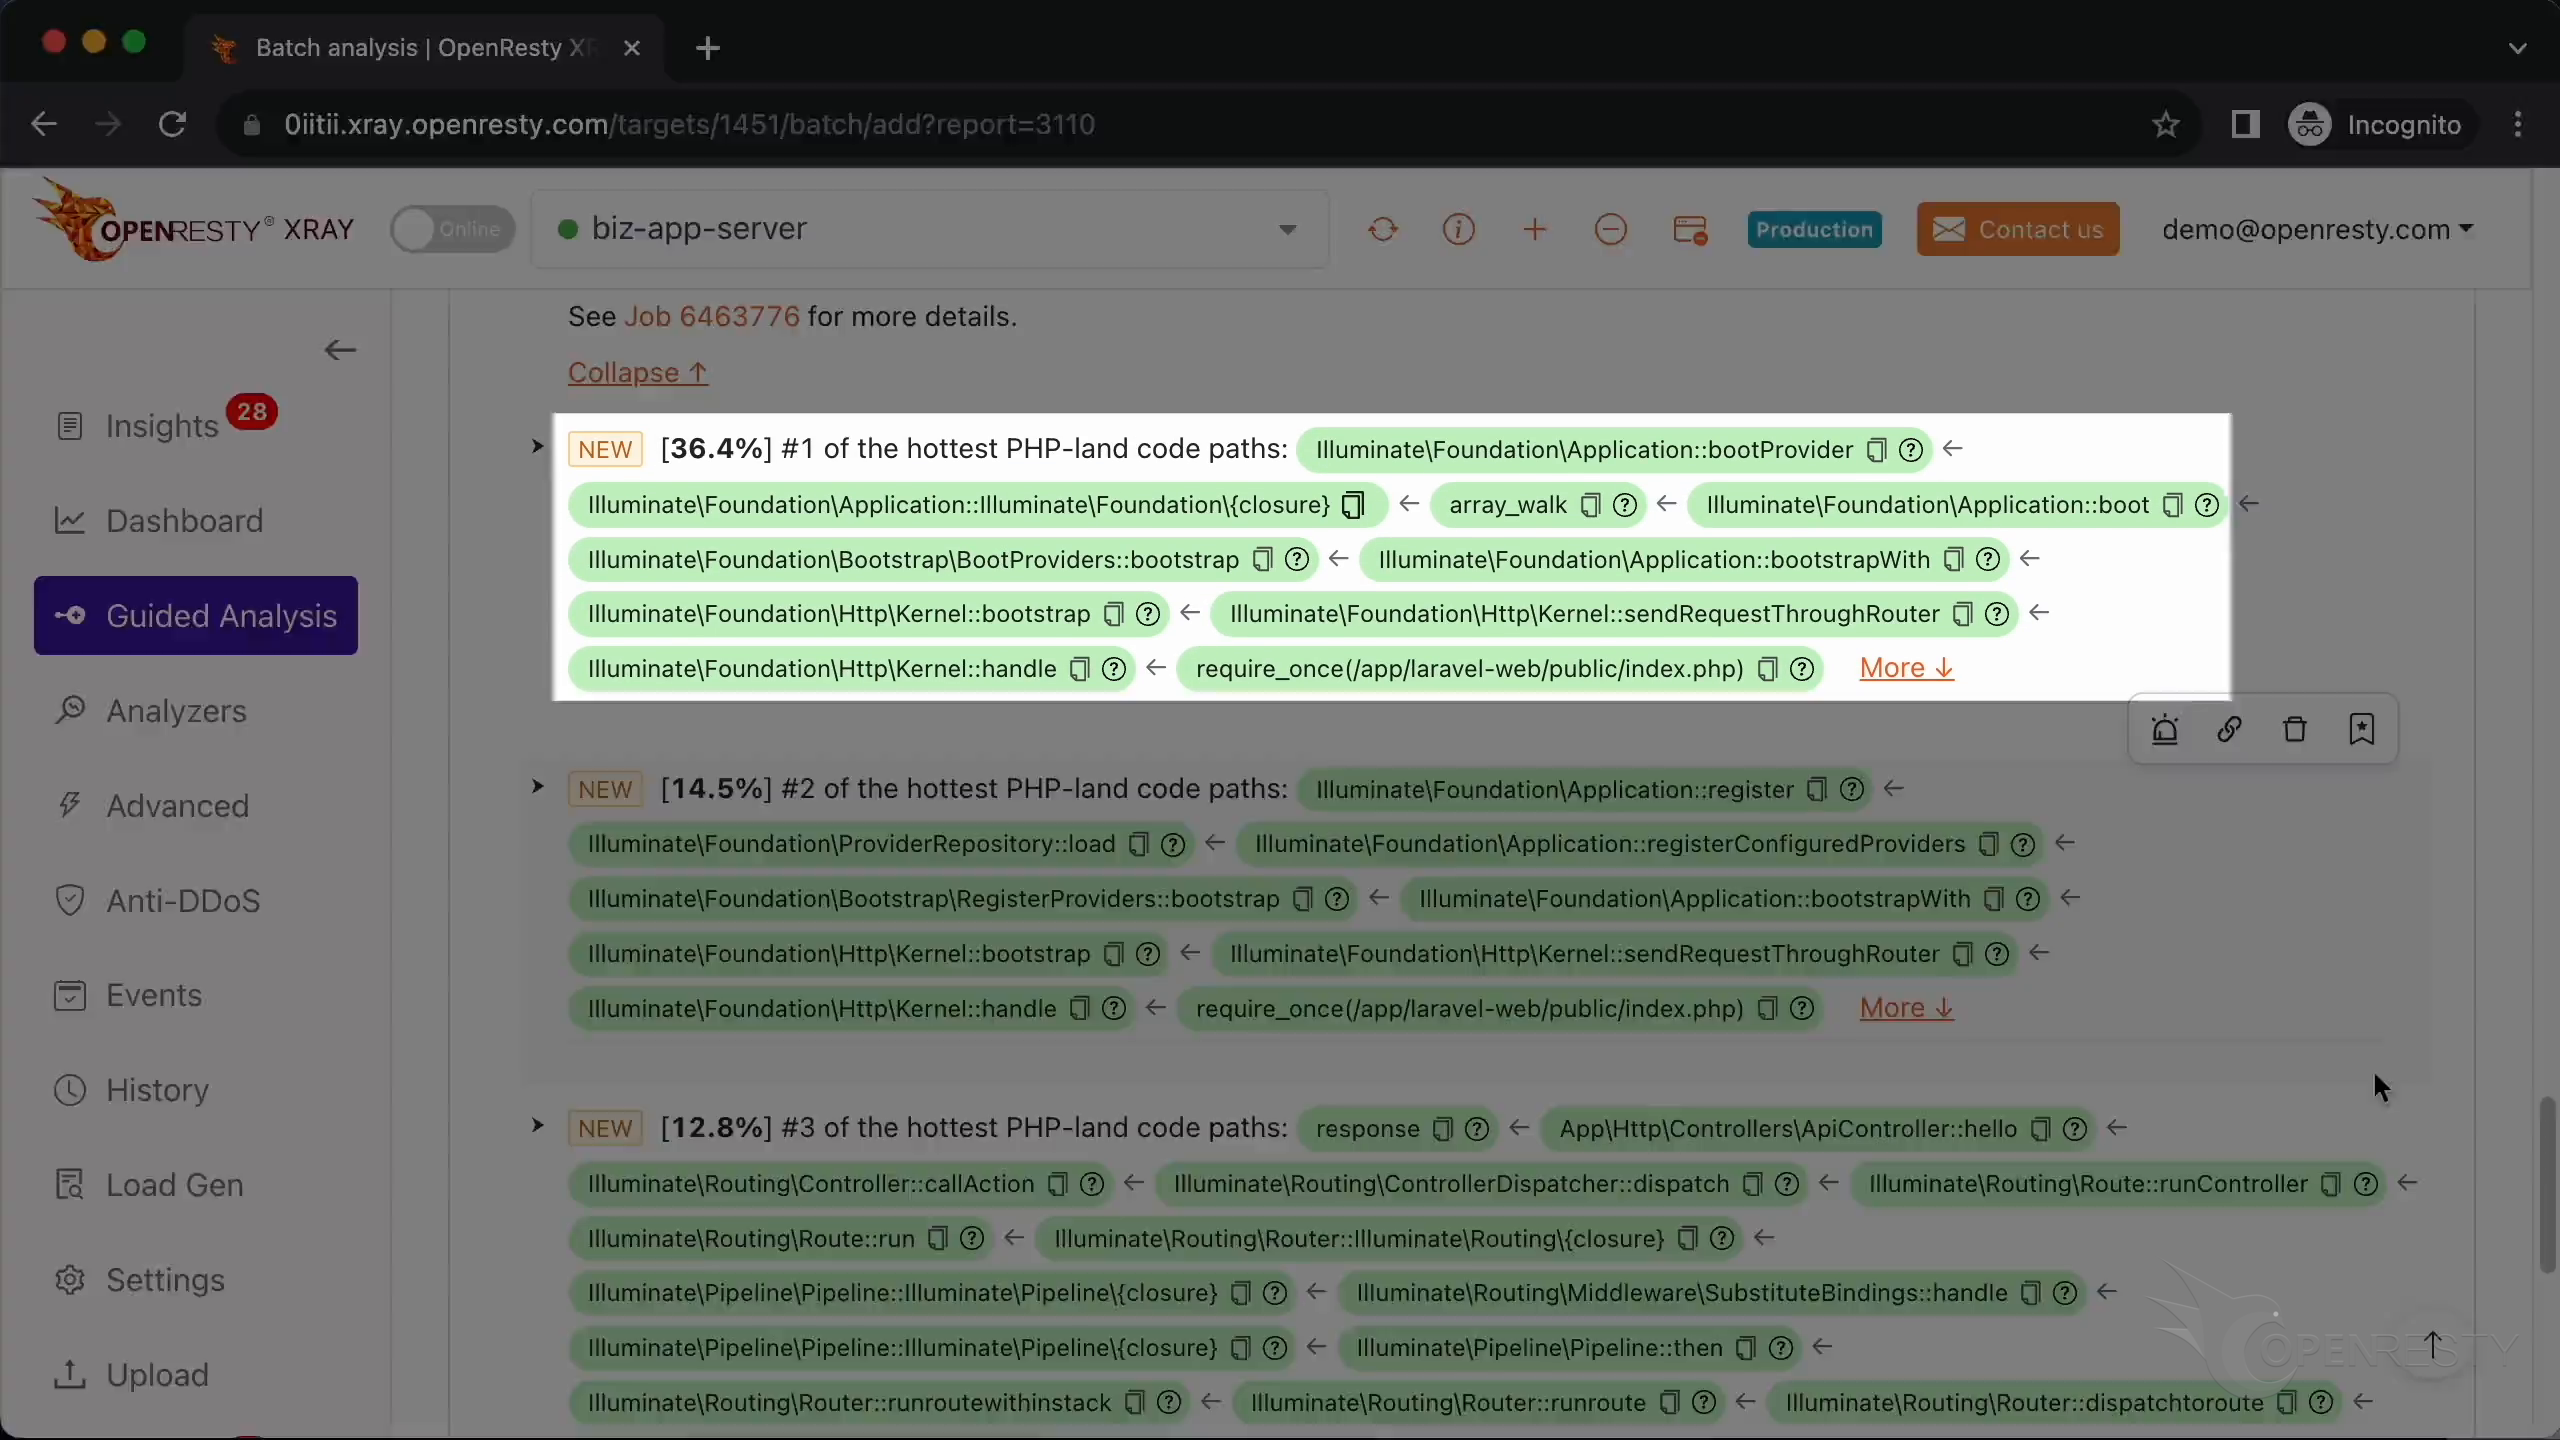
The bootProvider function is a part of the Laravel framework. It boots a service provider that is registered with the application.
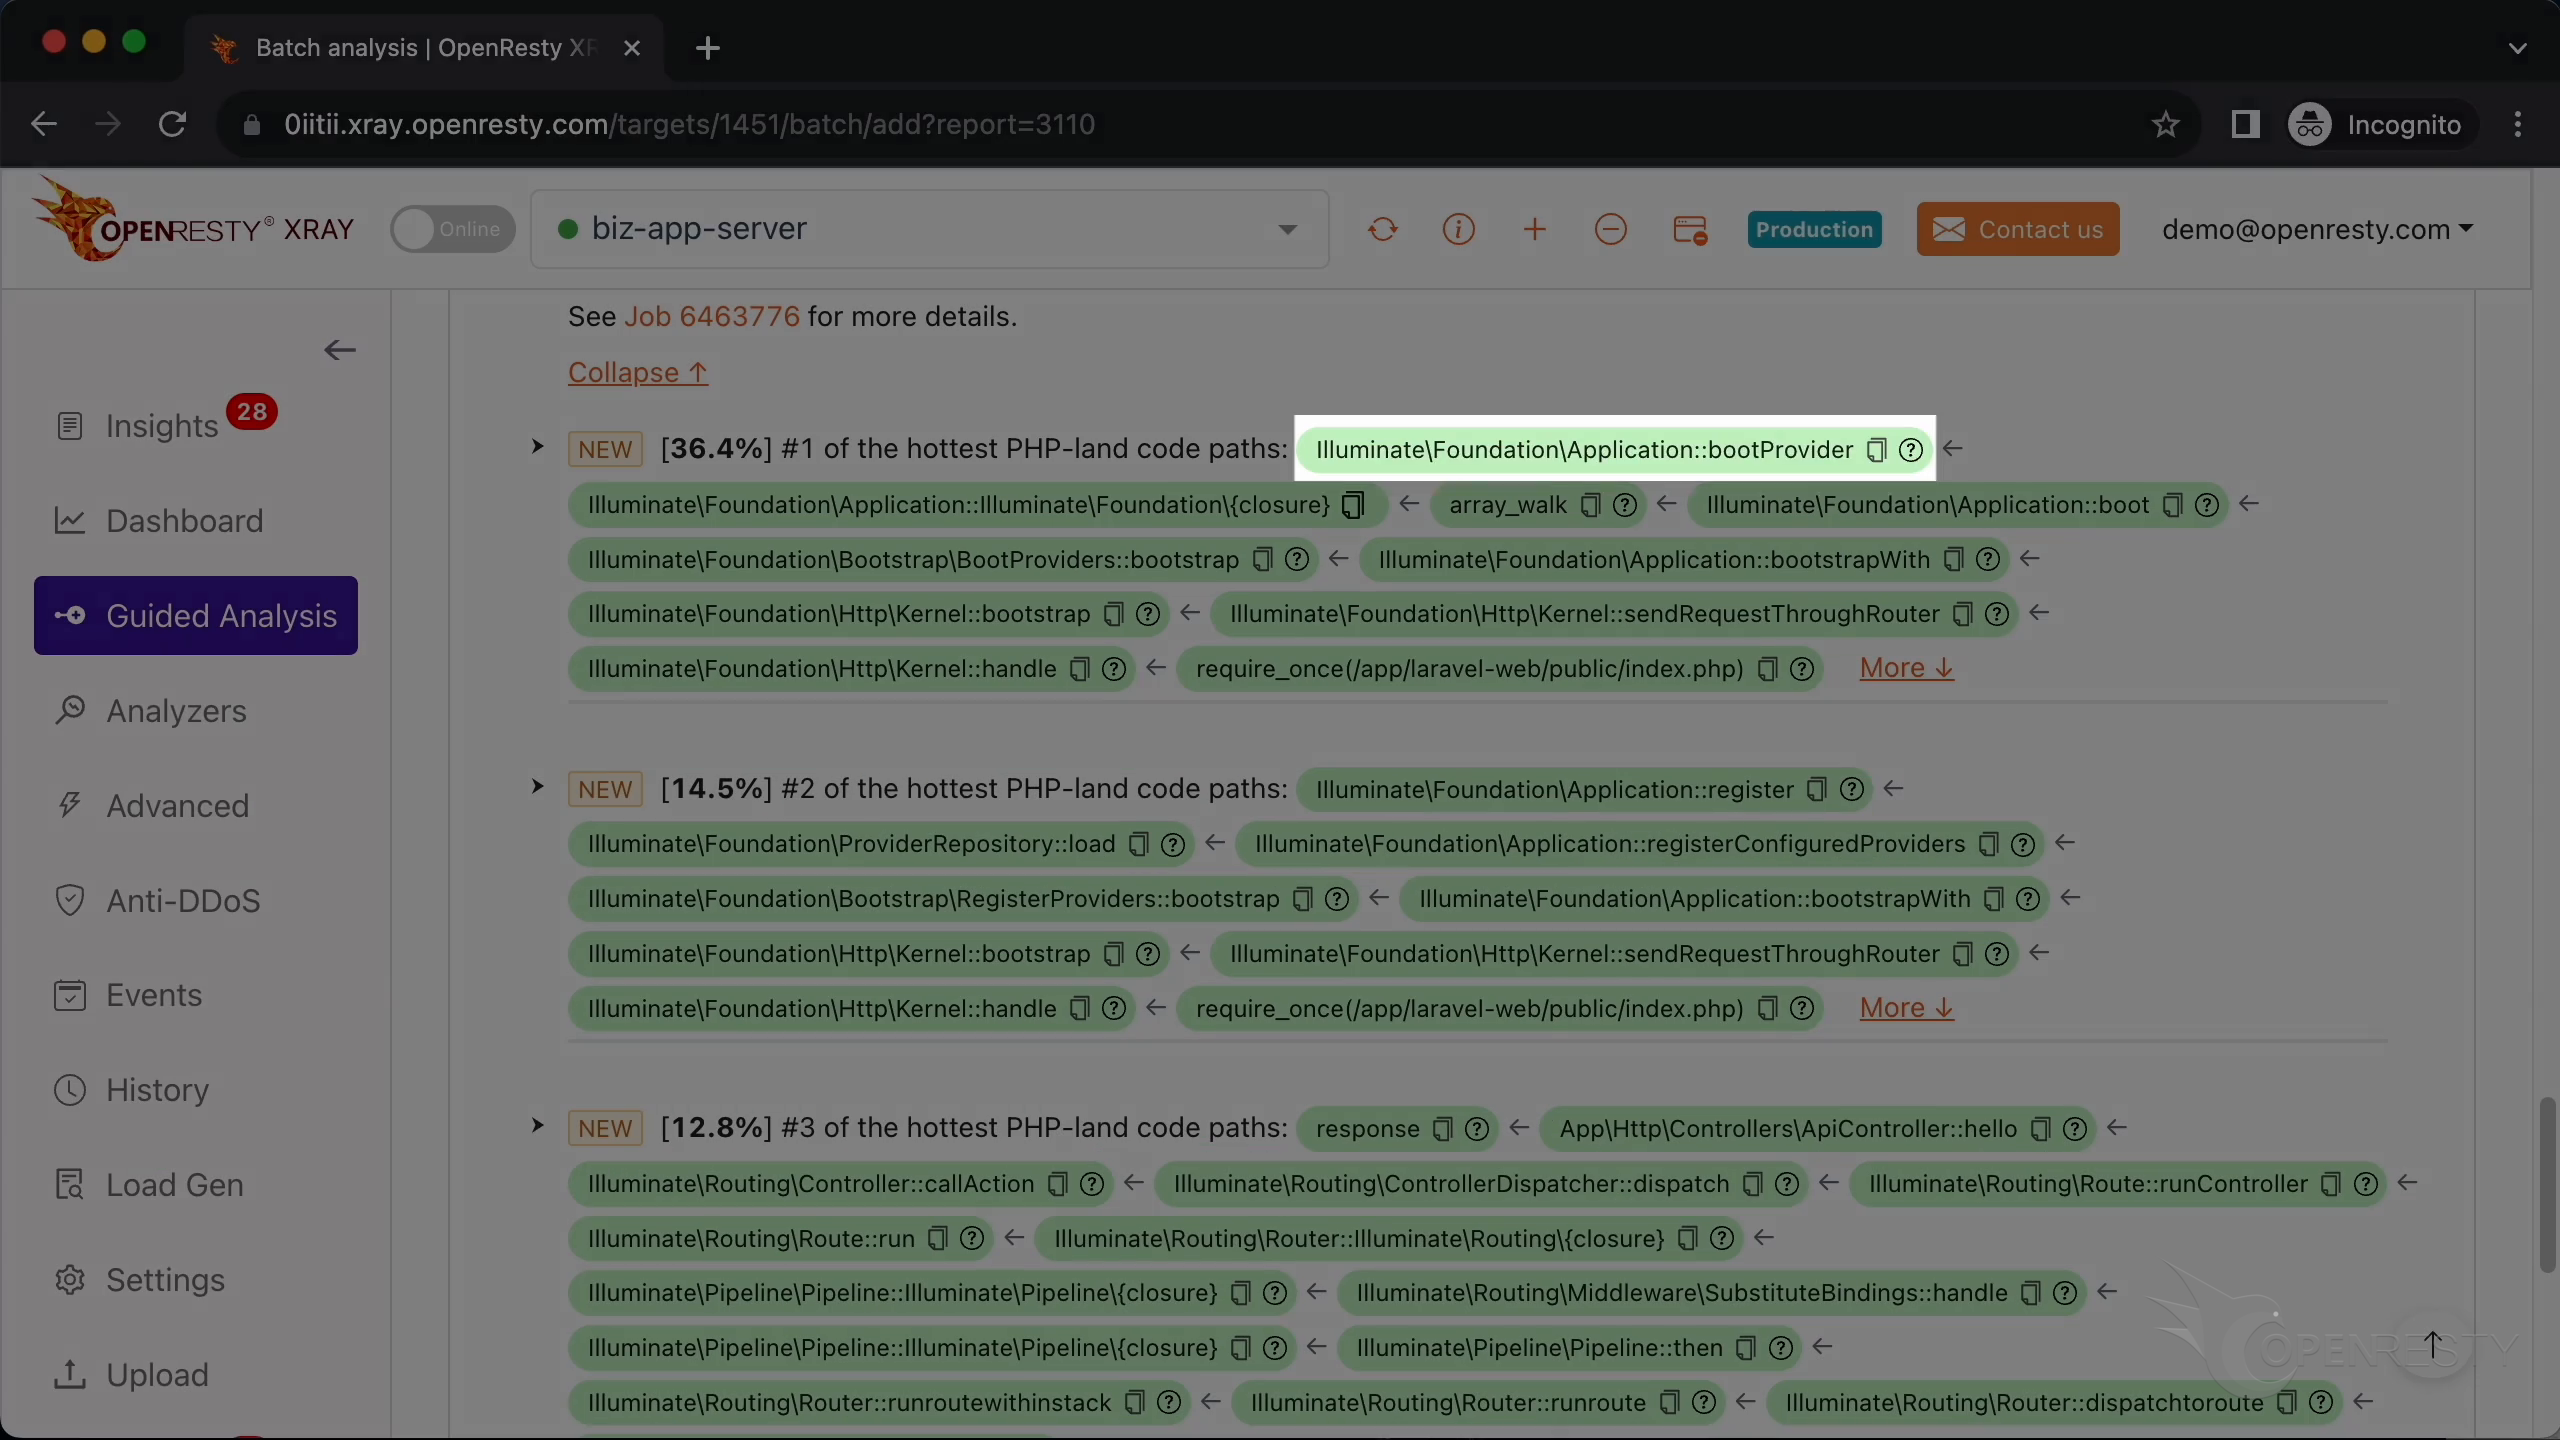
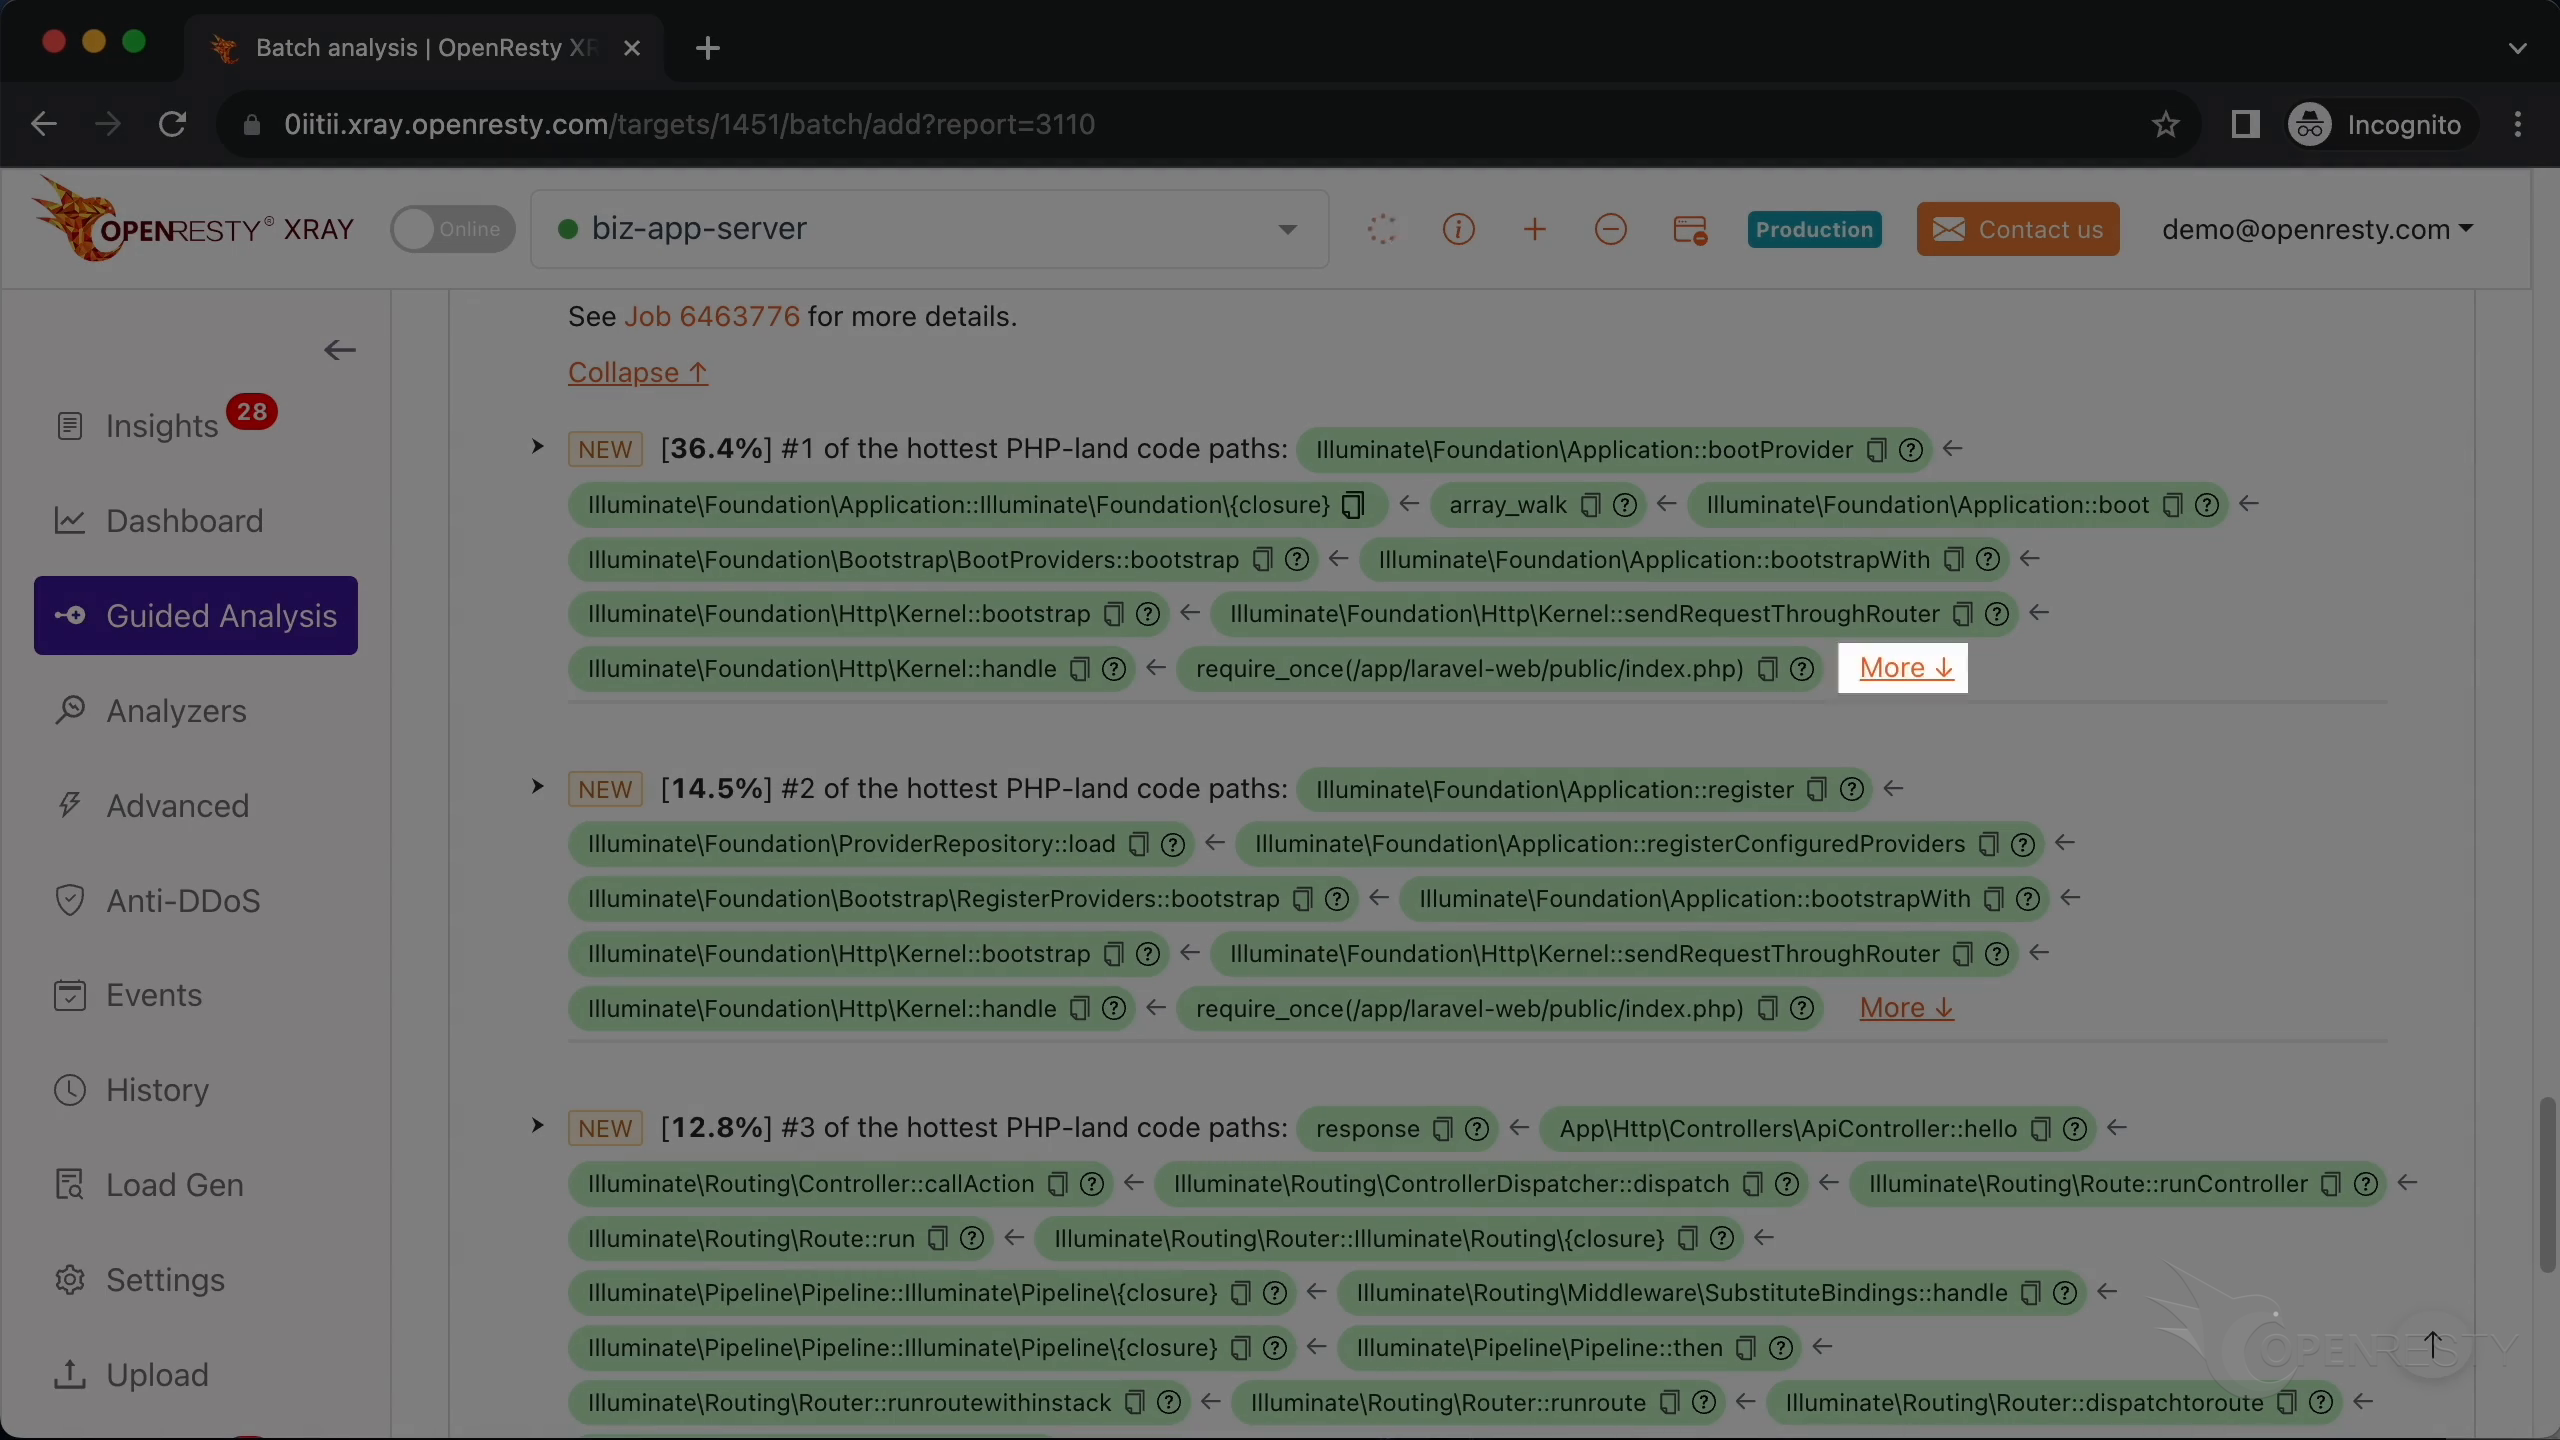
The full path shows the request entering through public/index.php and the HTTP kernel, then fanning out into service-provider booting via array_walk over all registered providers.
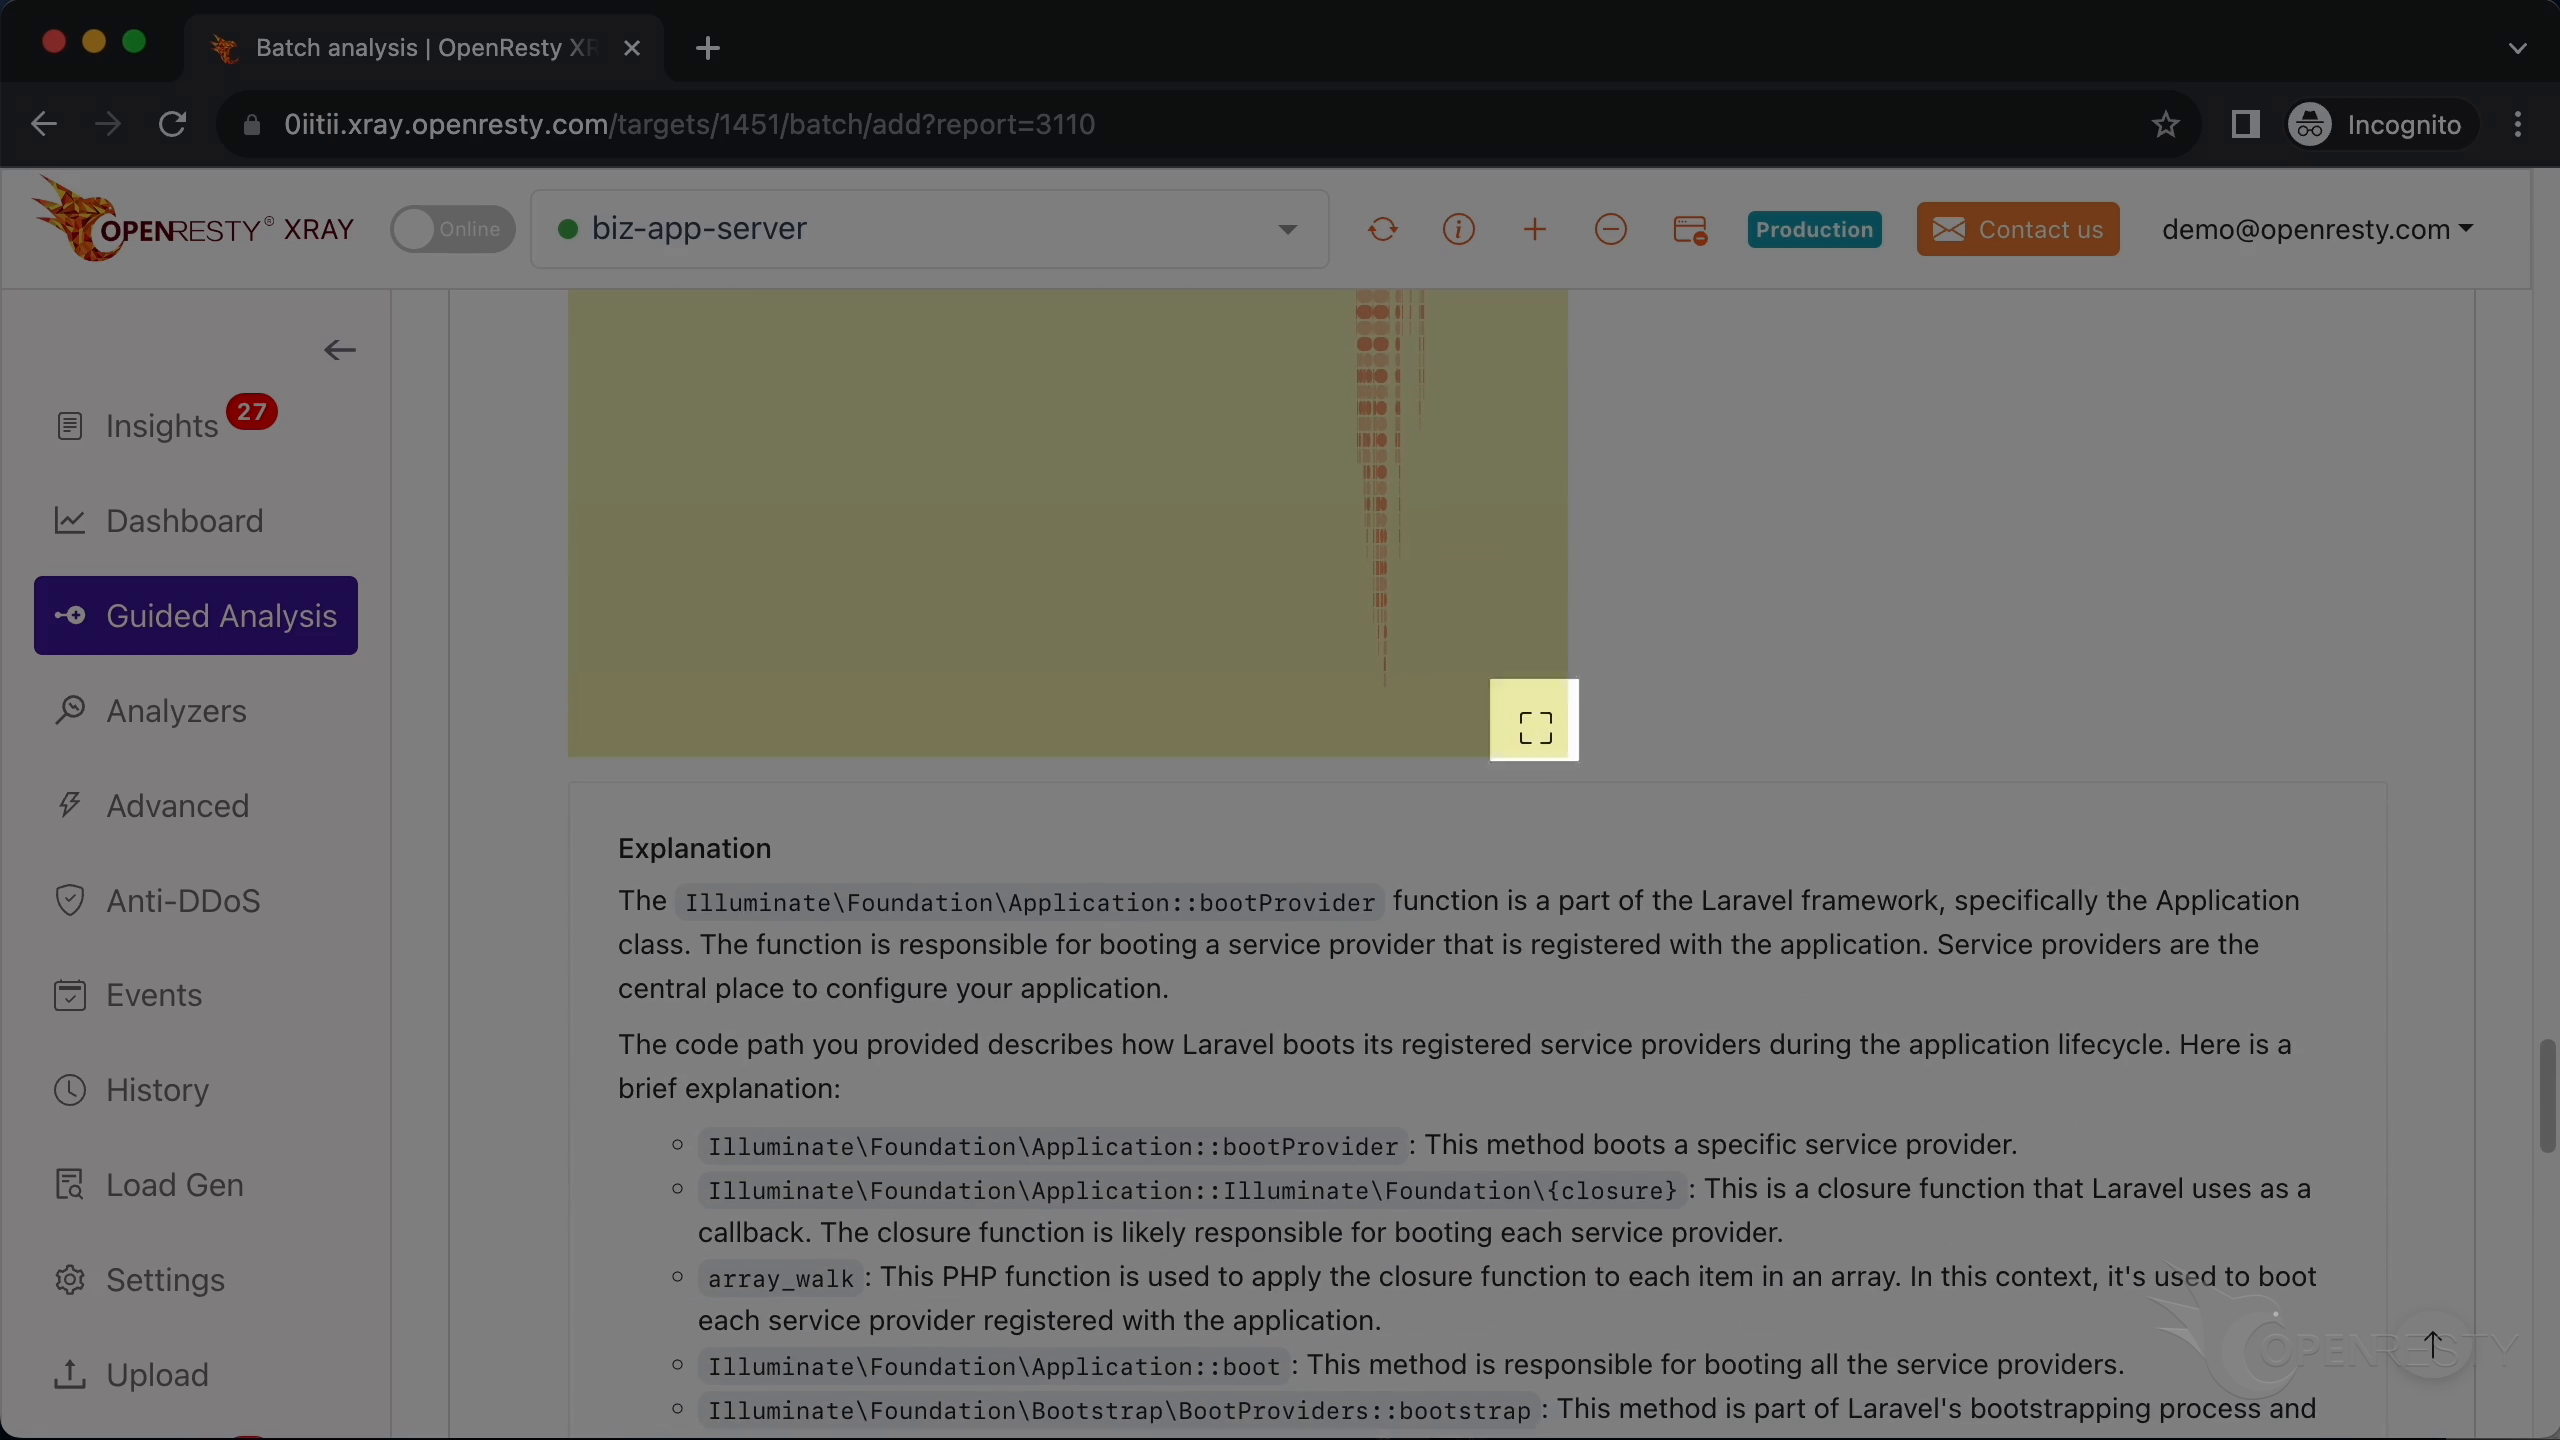
The report also includes an auto-generated explanation of this code path: bootProvider boots each service provider registered with the application, and service providers are the central place where a Laravel application is configured.
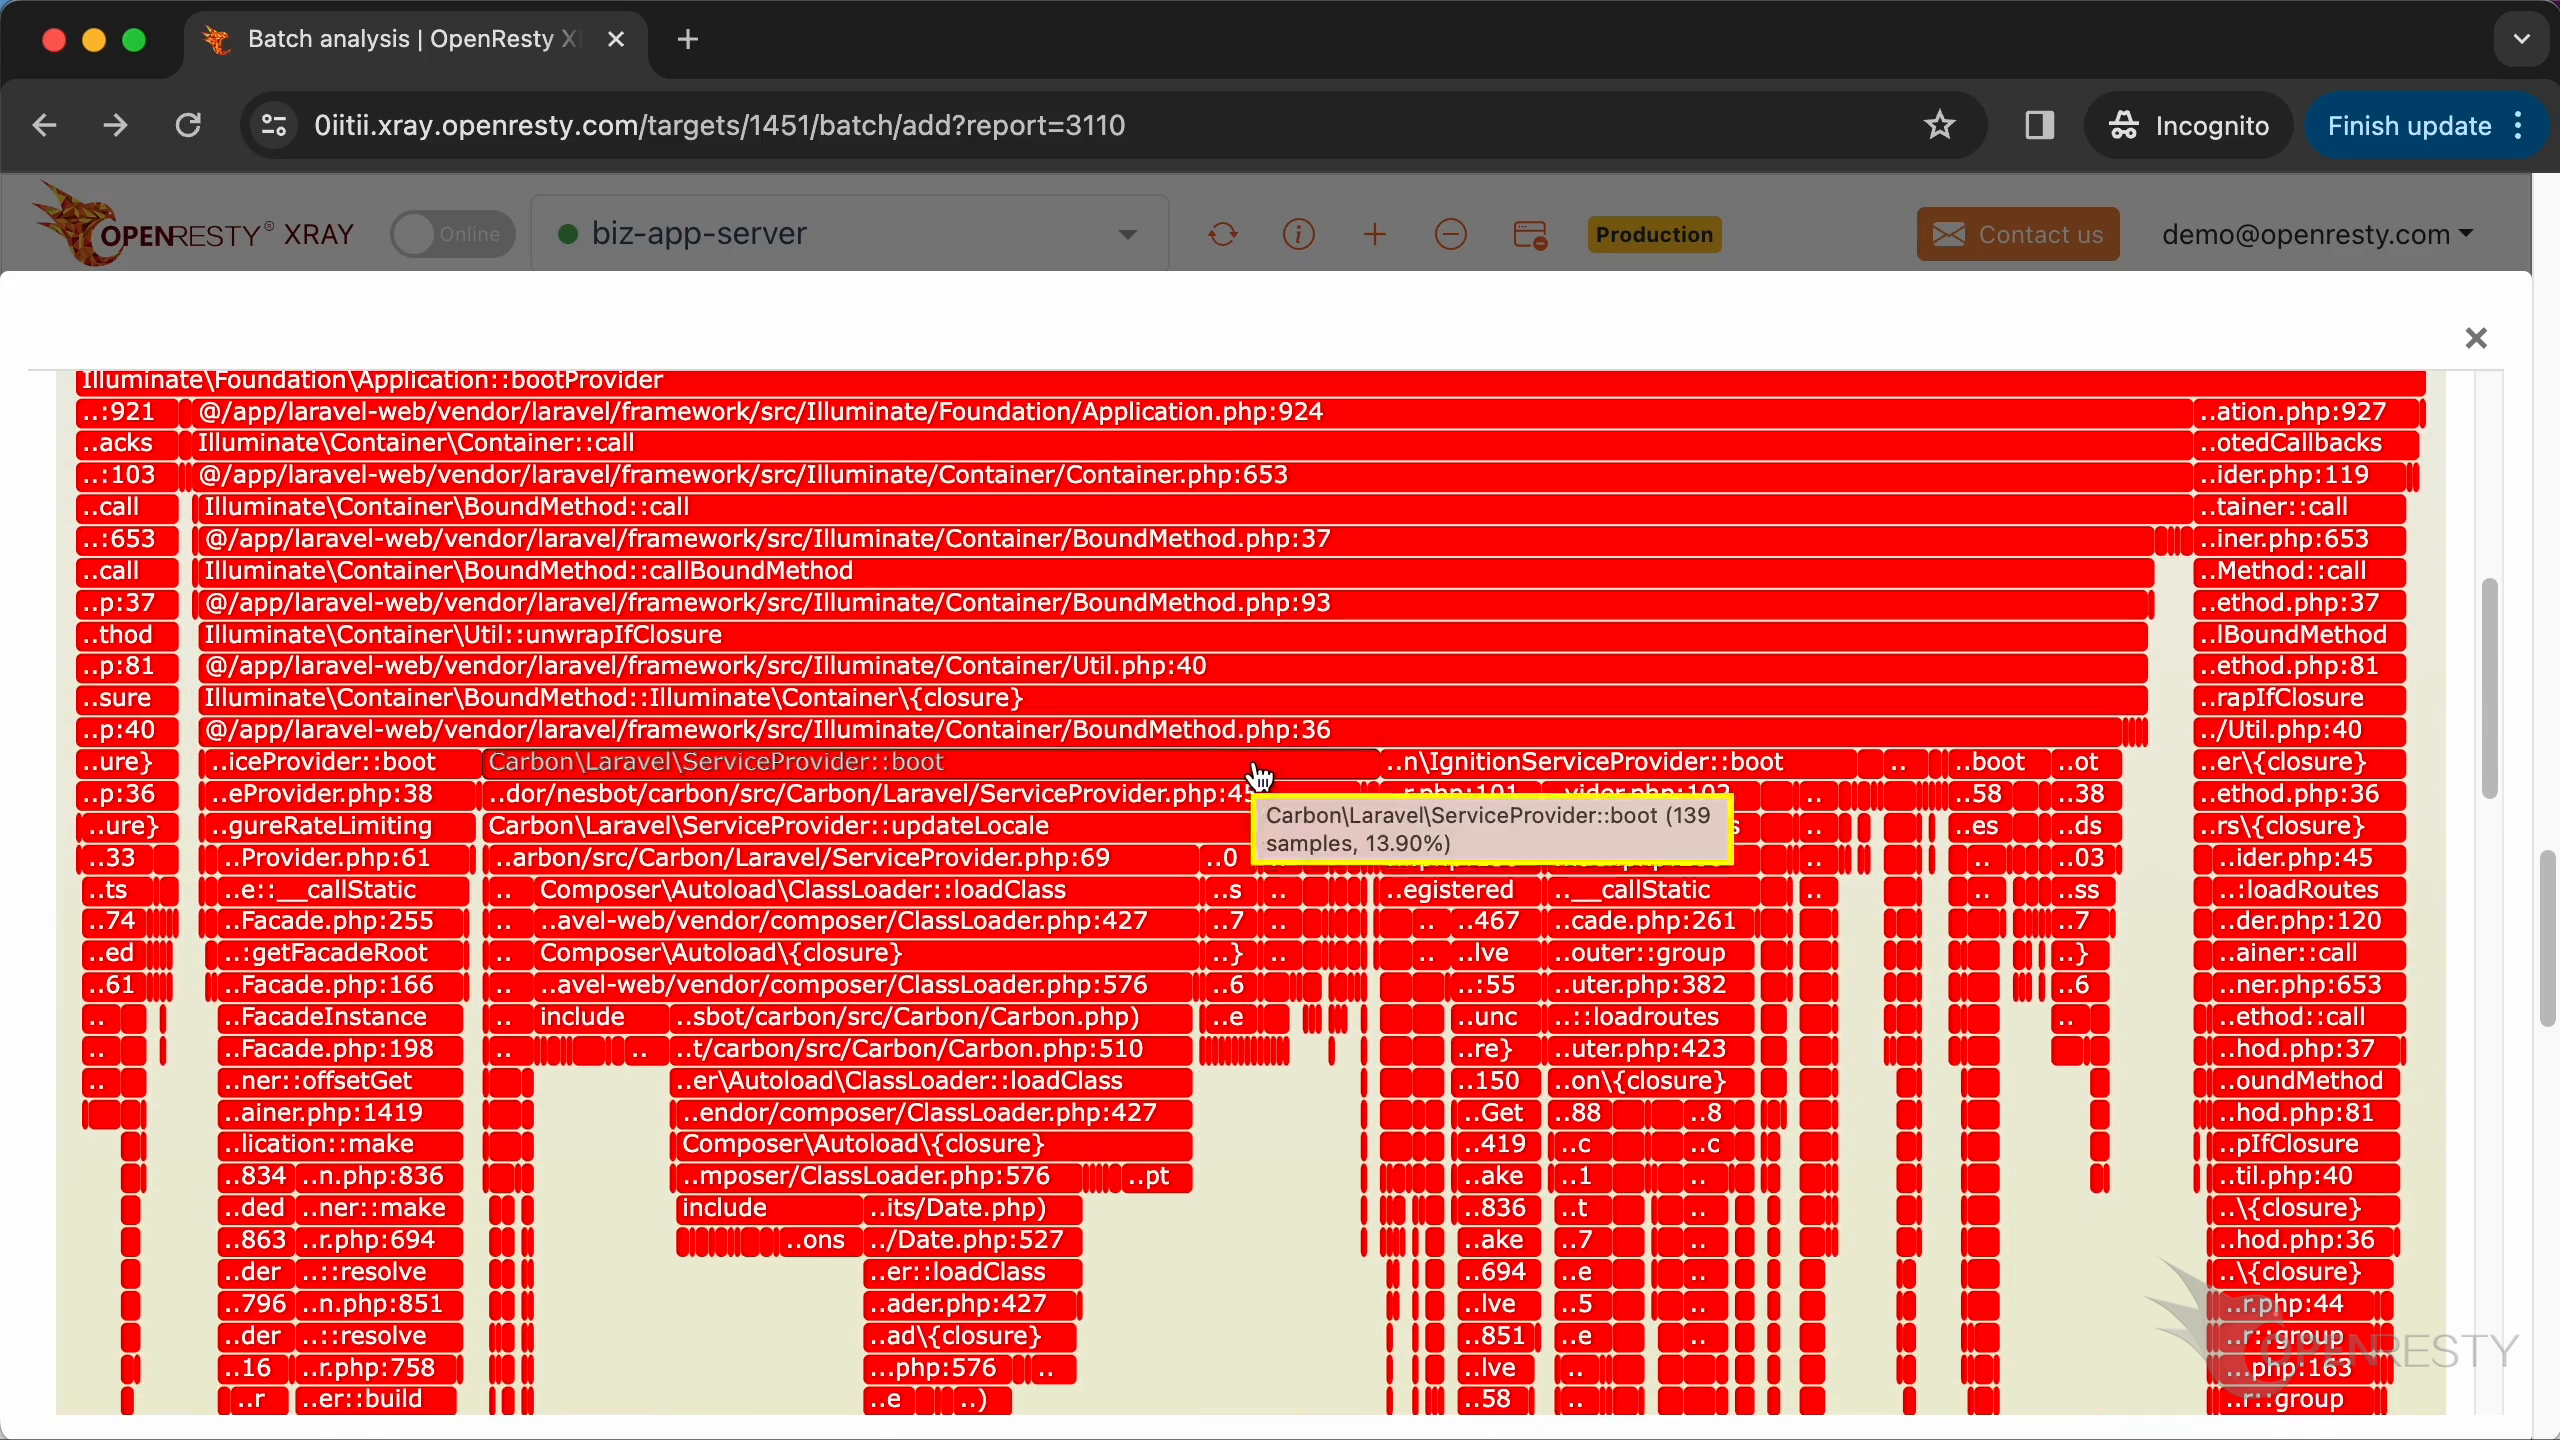
Zooming into the PHP-land CPU flame graph shows the bootProvider frame and the individual service providers being booted beneath it.
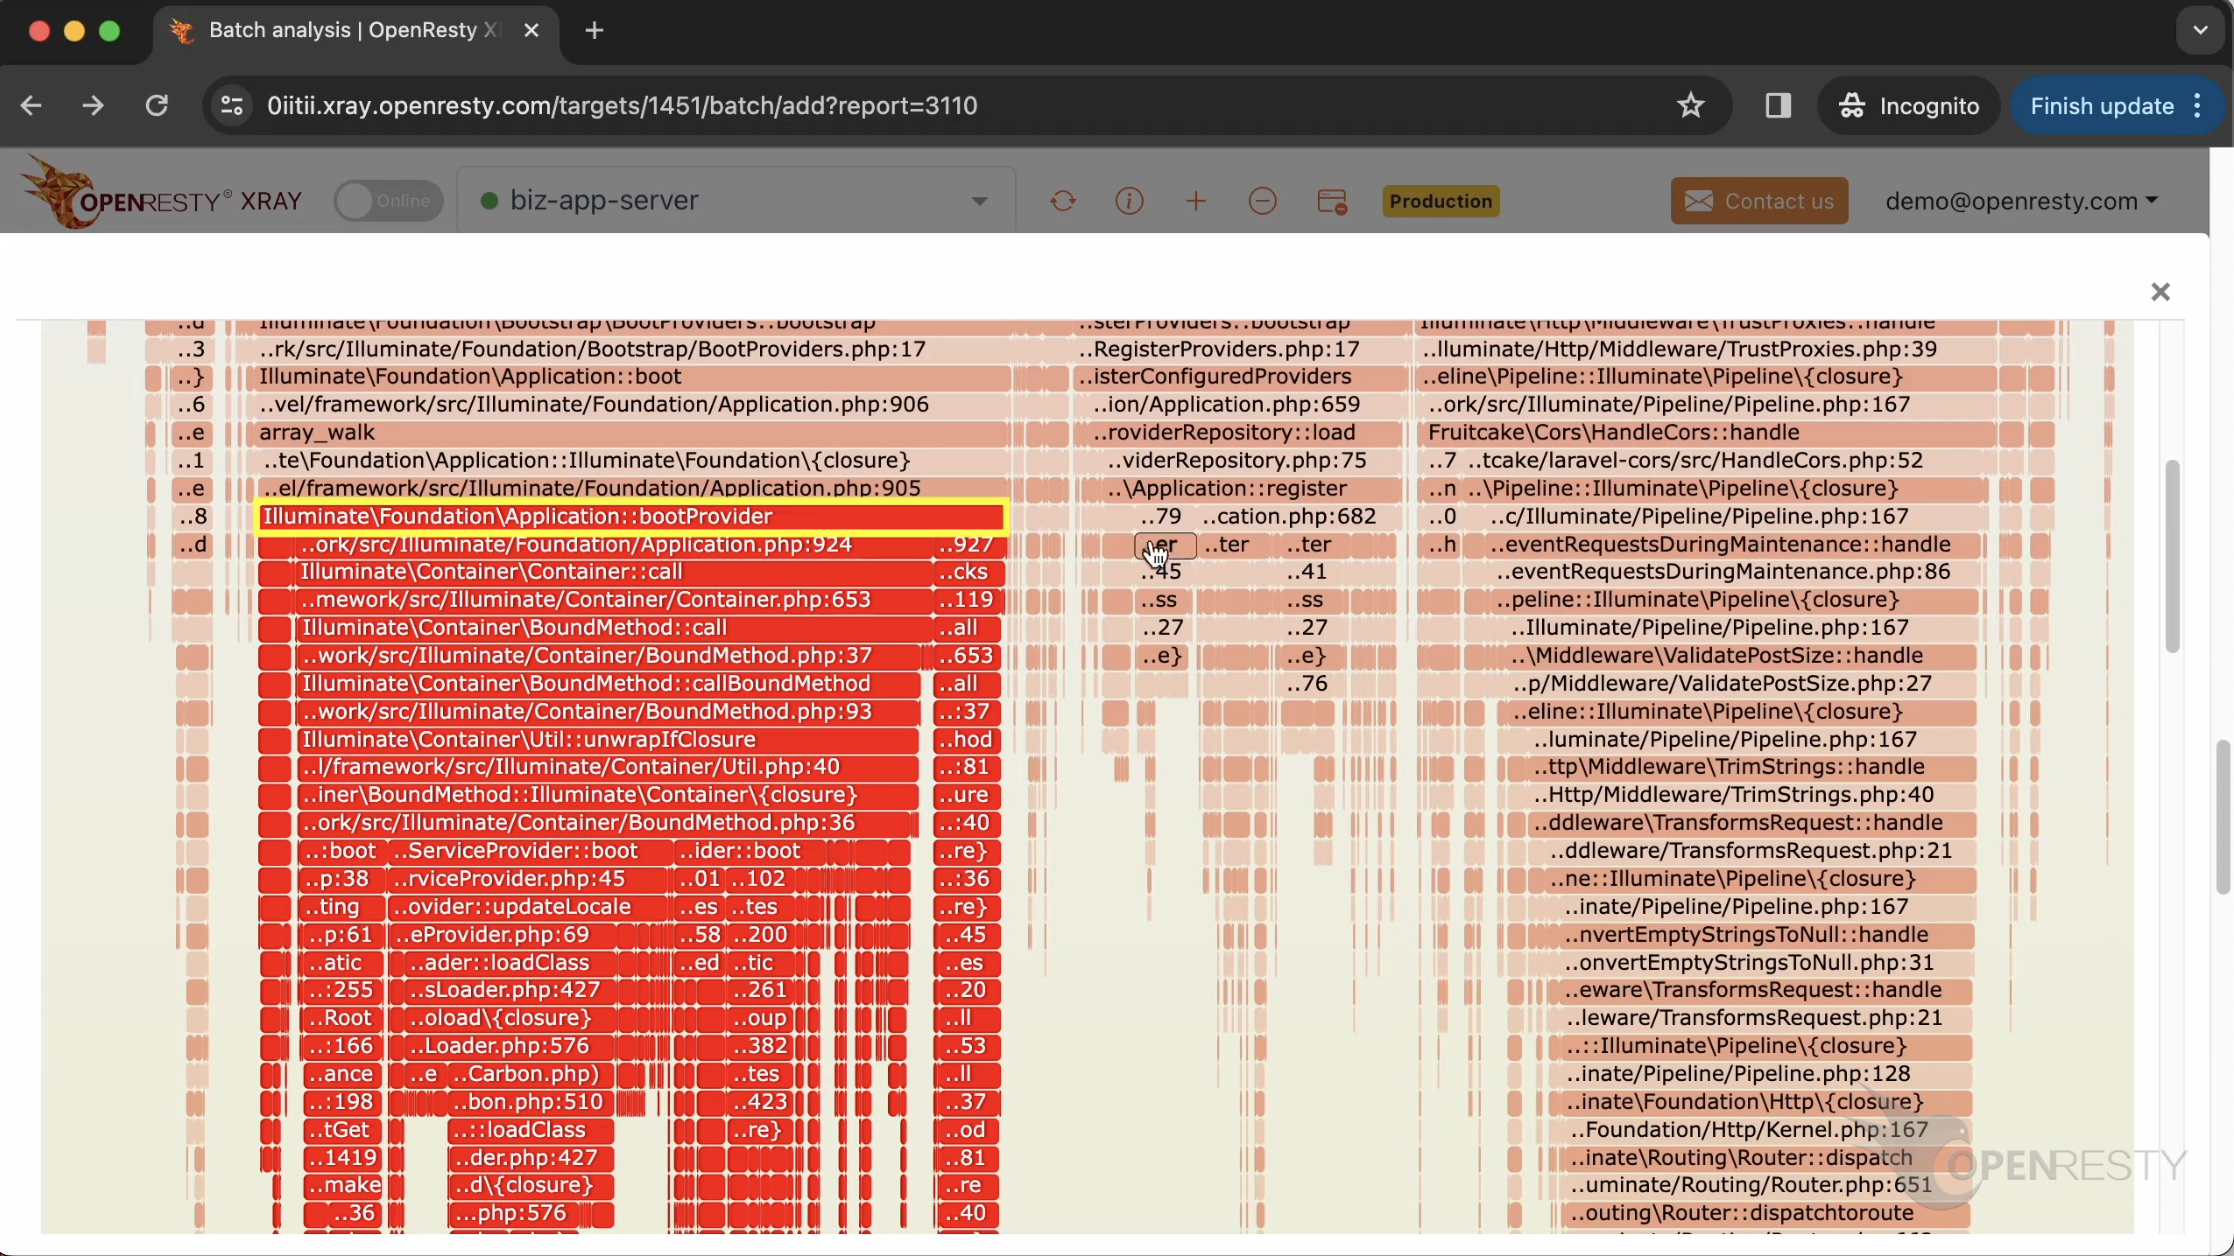
The Laravel service provider uses the ServiceProvider::boot method to register macros and configurations for the Carbon date library. The corresponding boot method is used to initialize settings such as timezone.
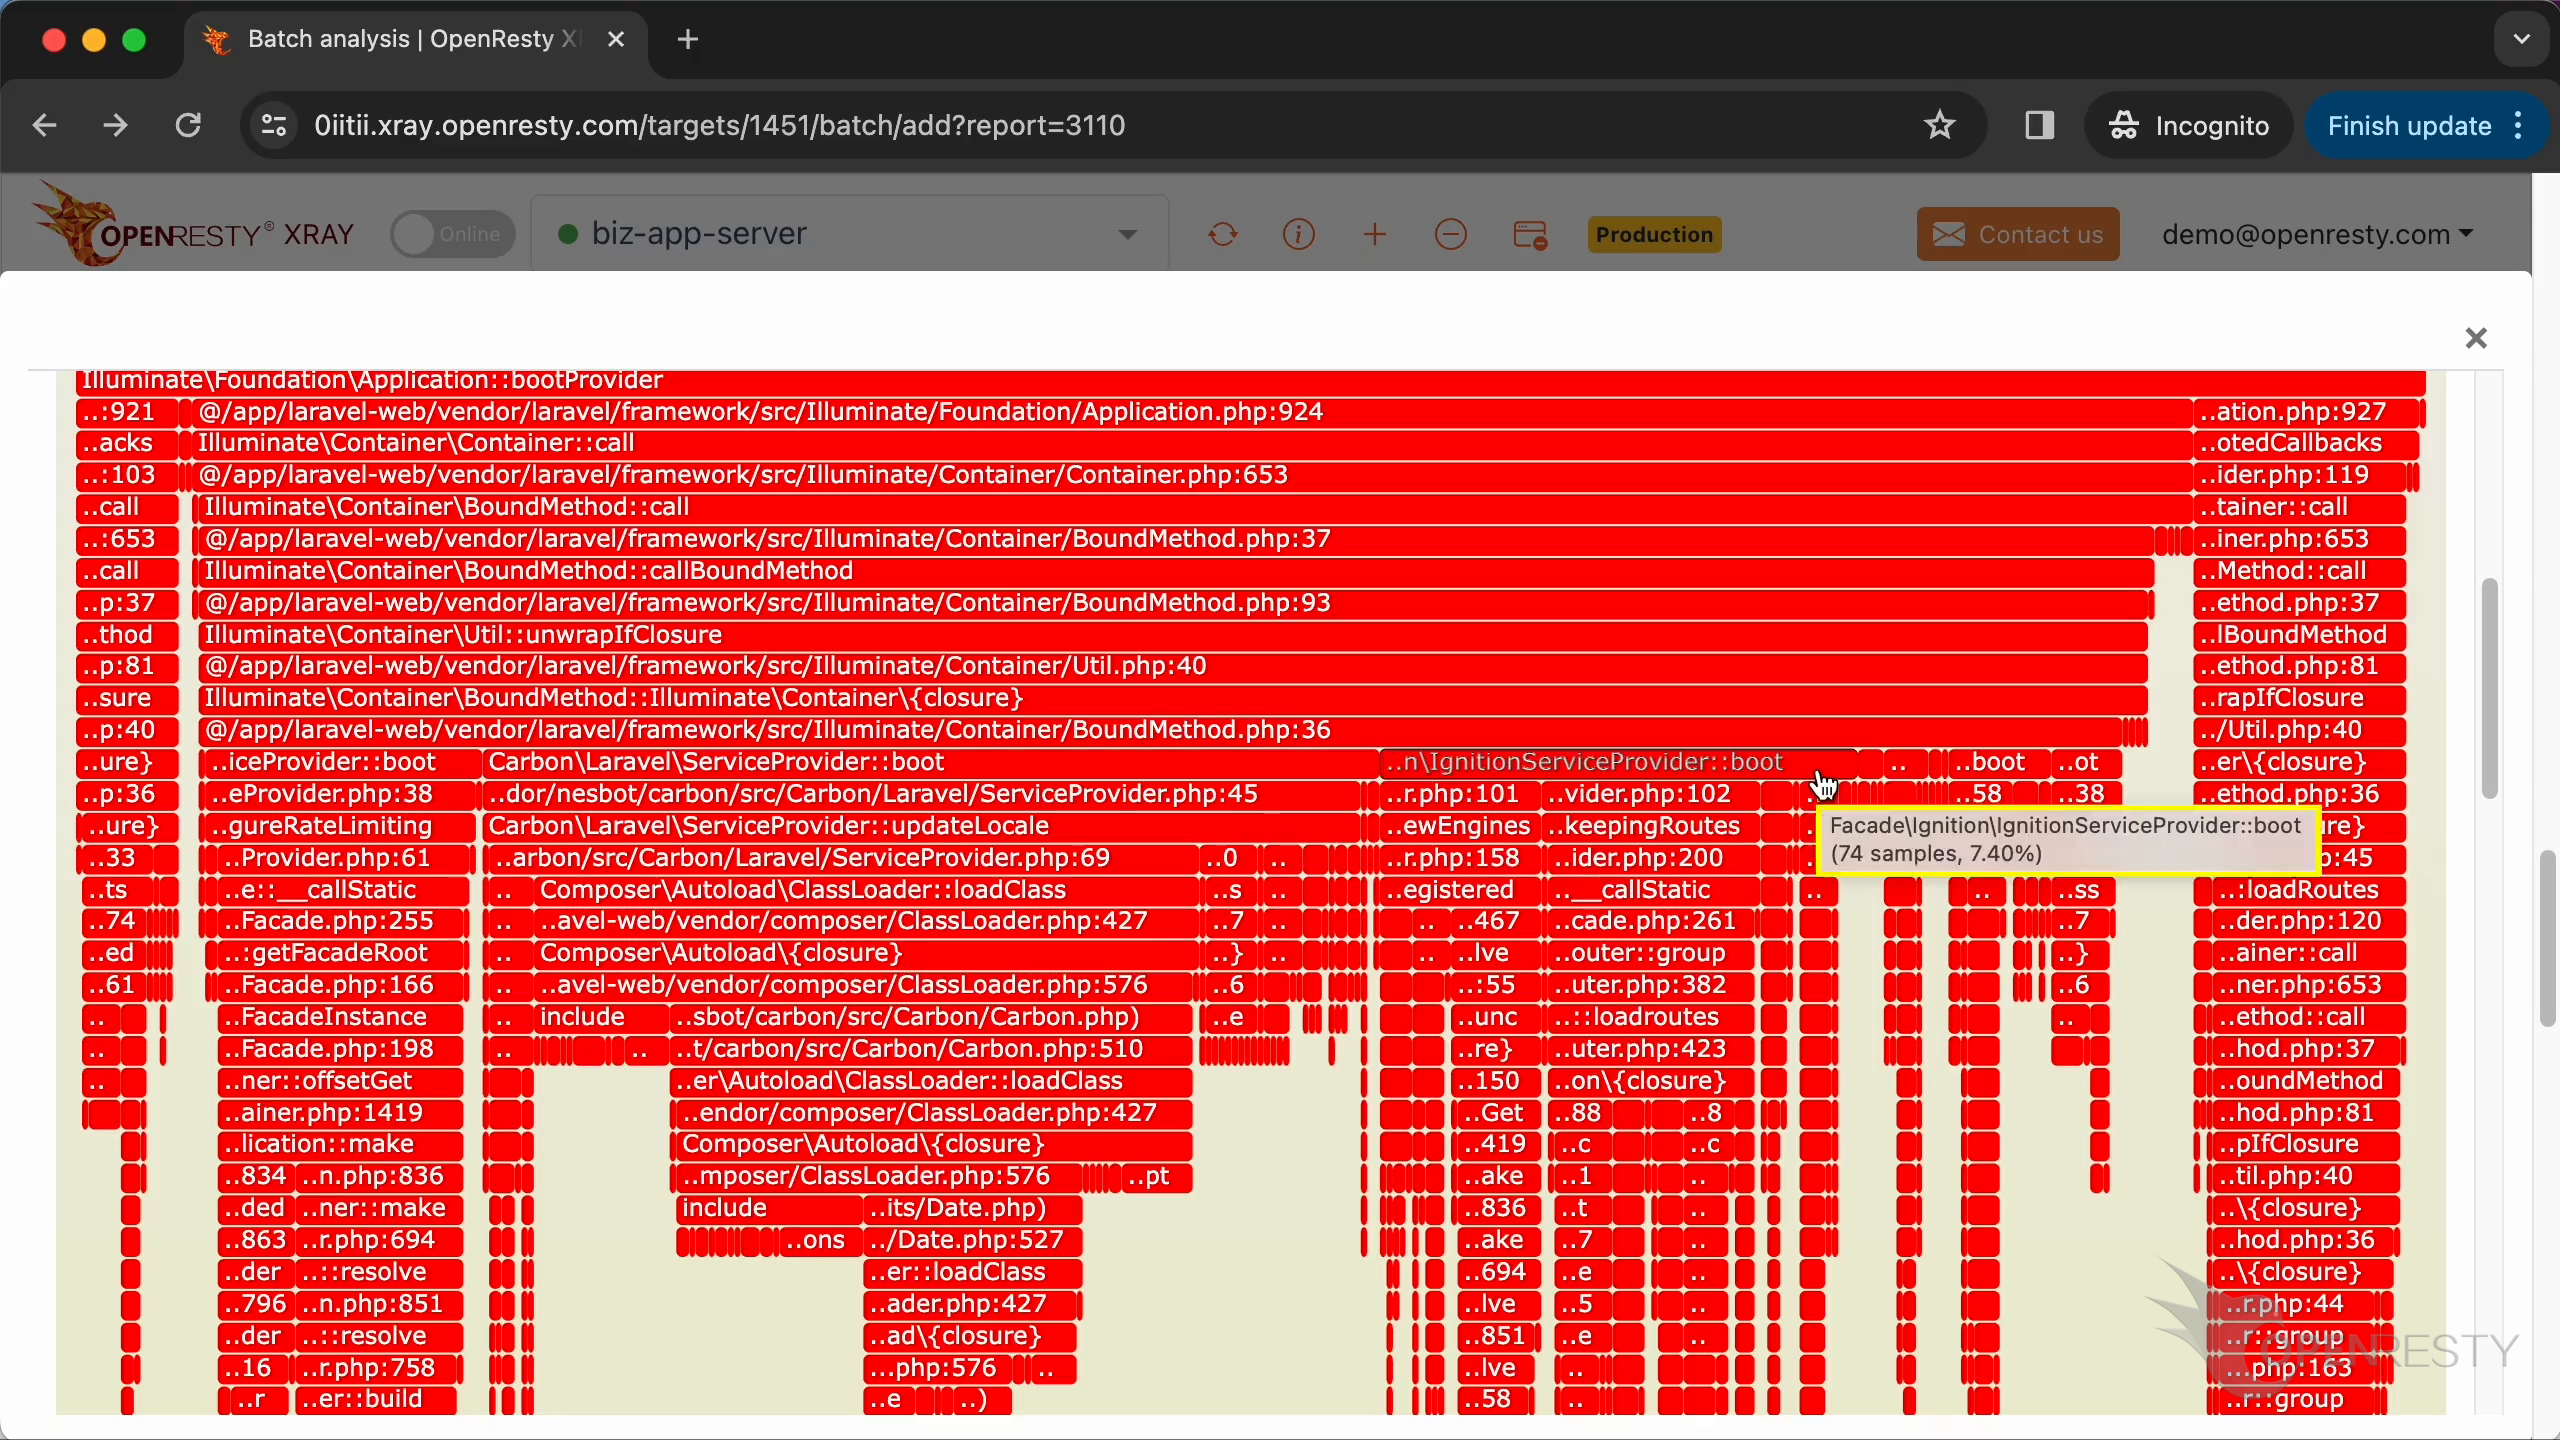
IgnitionServiceProvider::boot method is responsible for booting all the service providers.
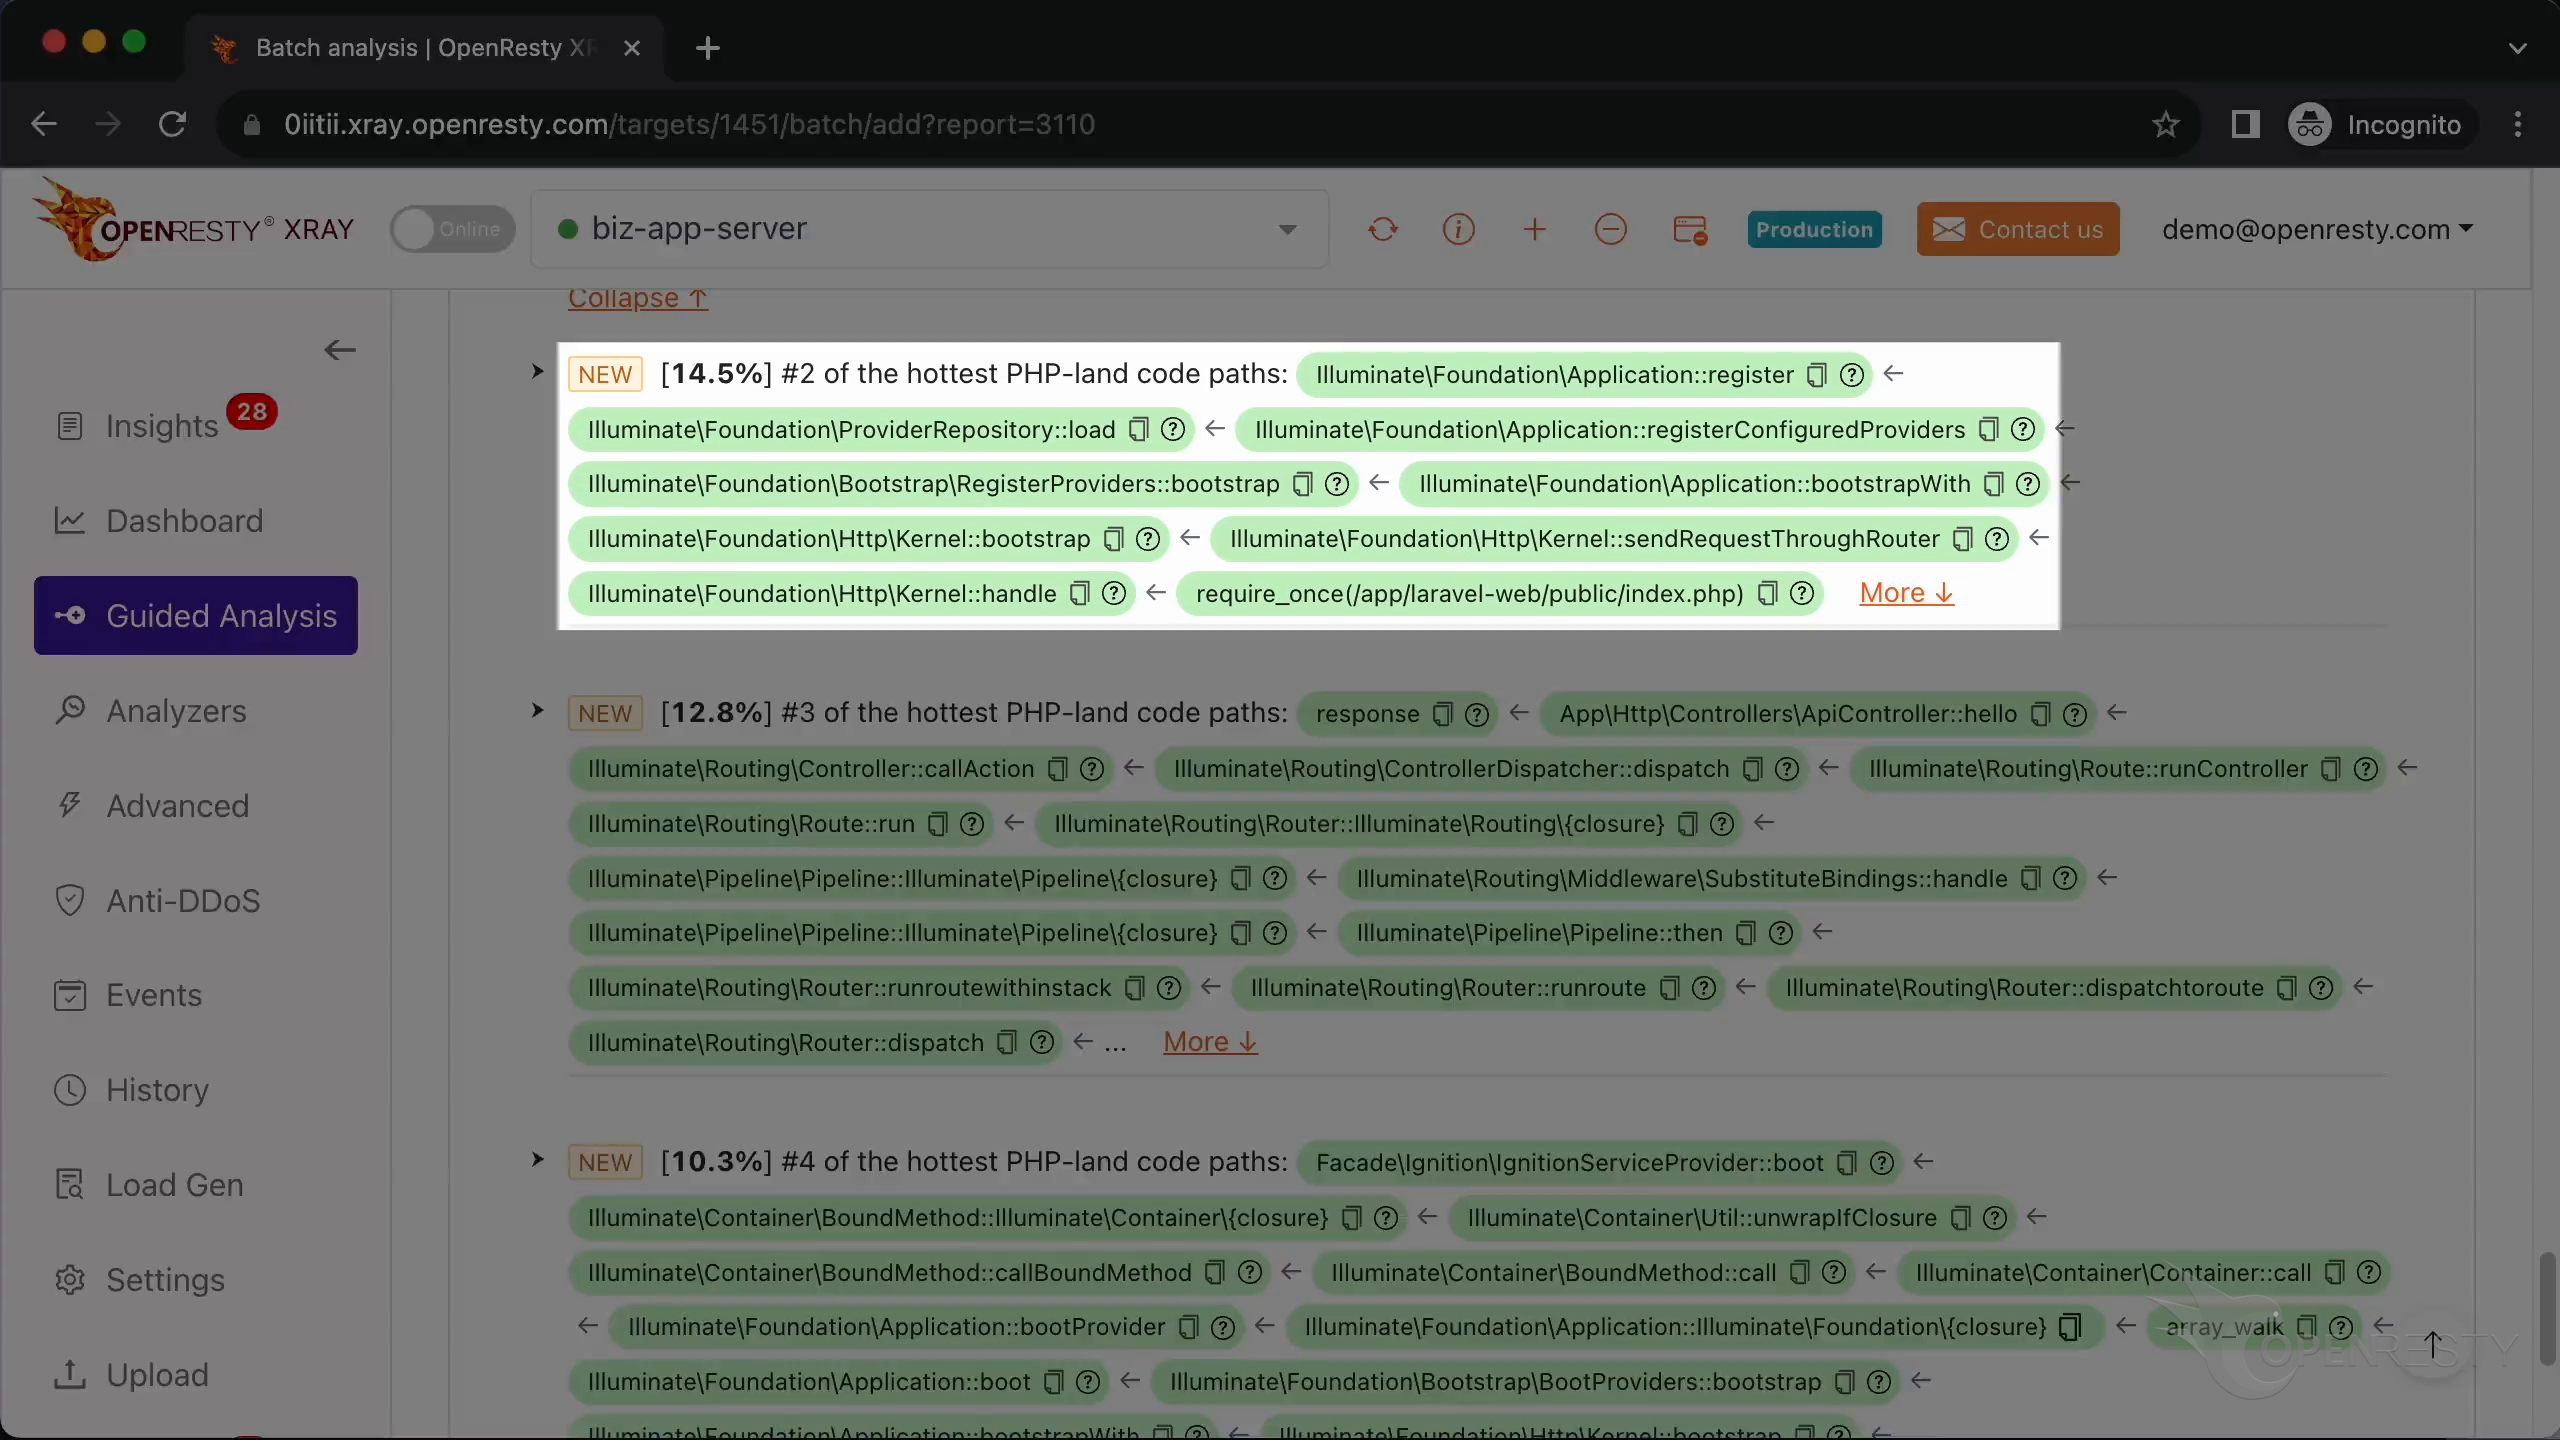
Let’s check out the #2 hottest PHP code path, which consumes 14.5% of the CPU time.
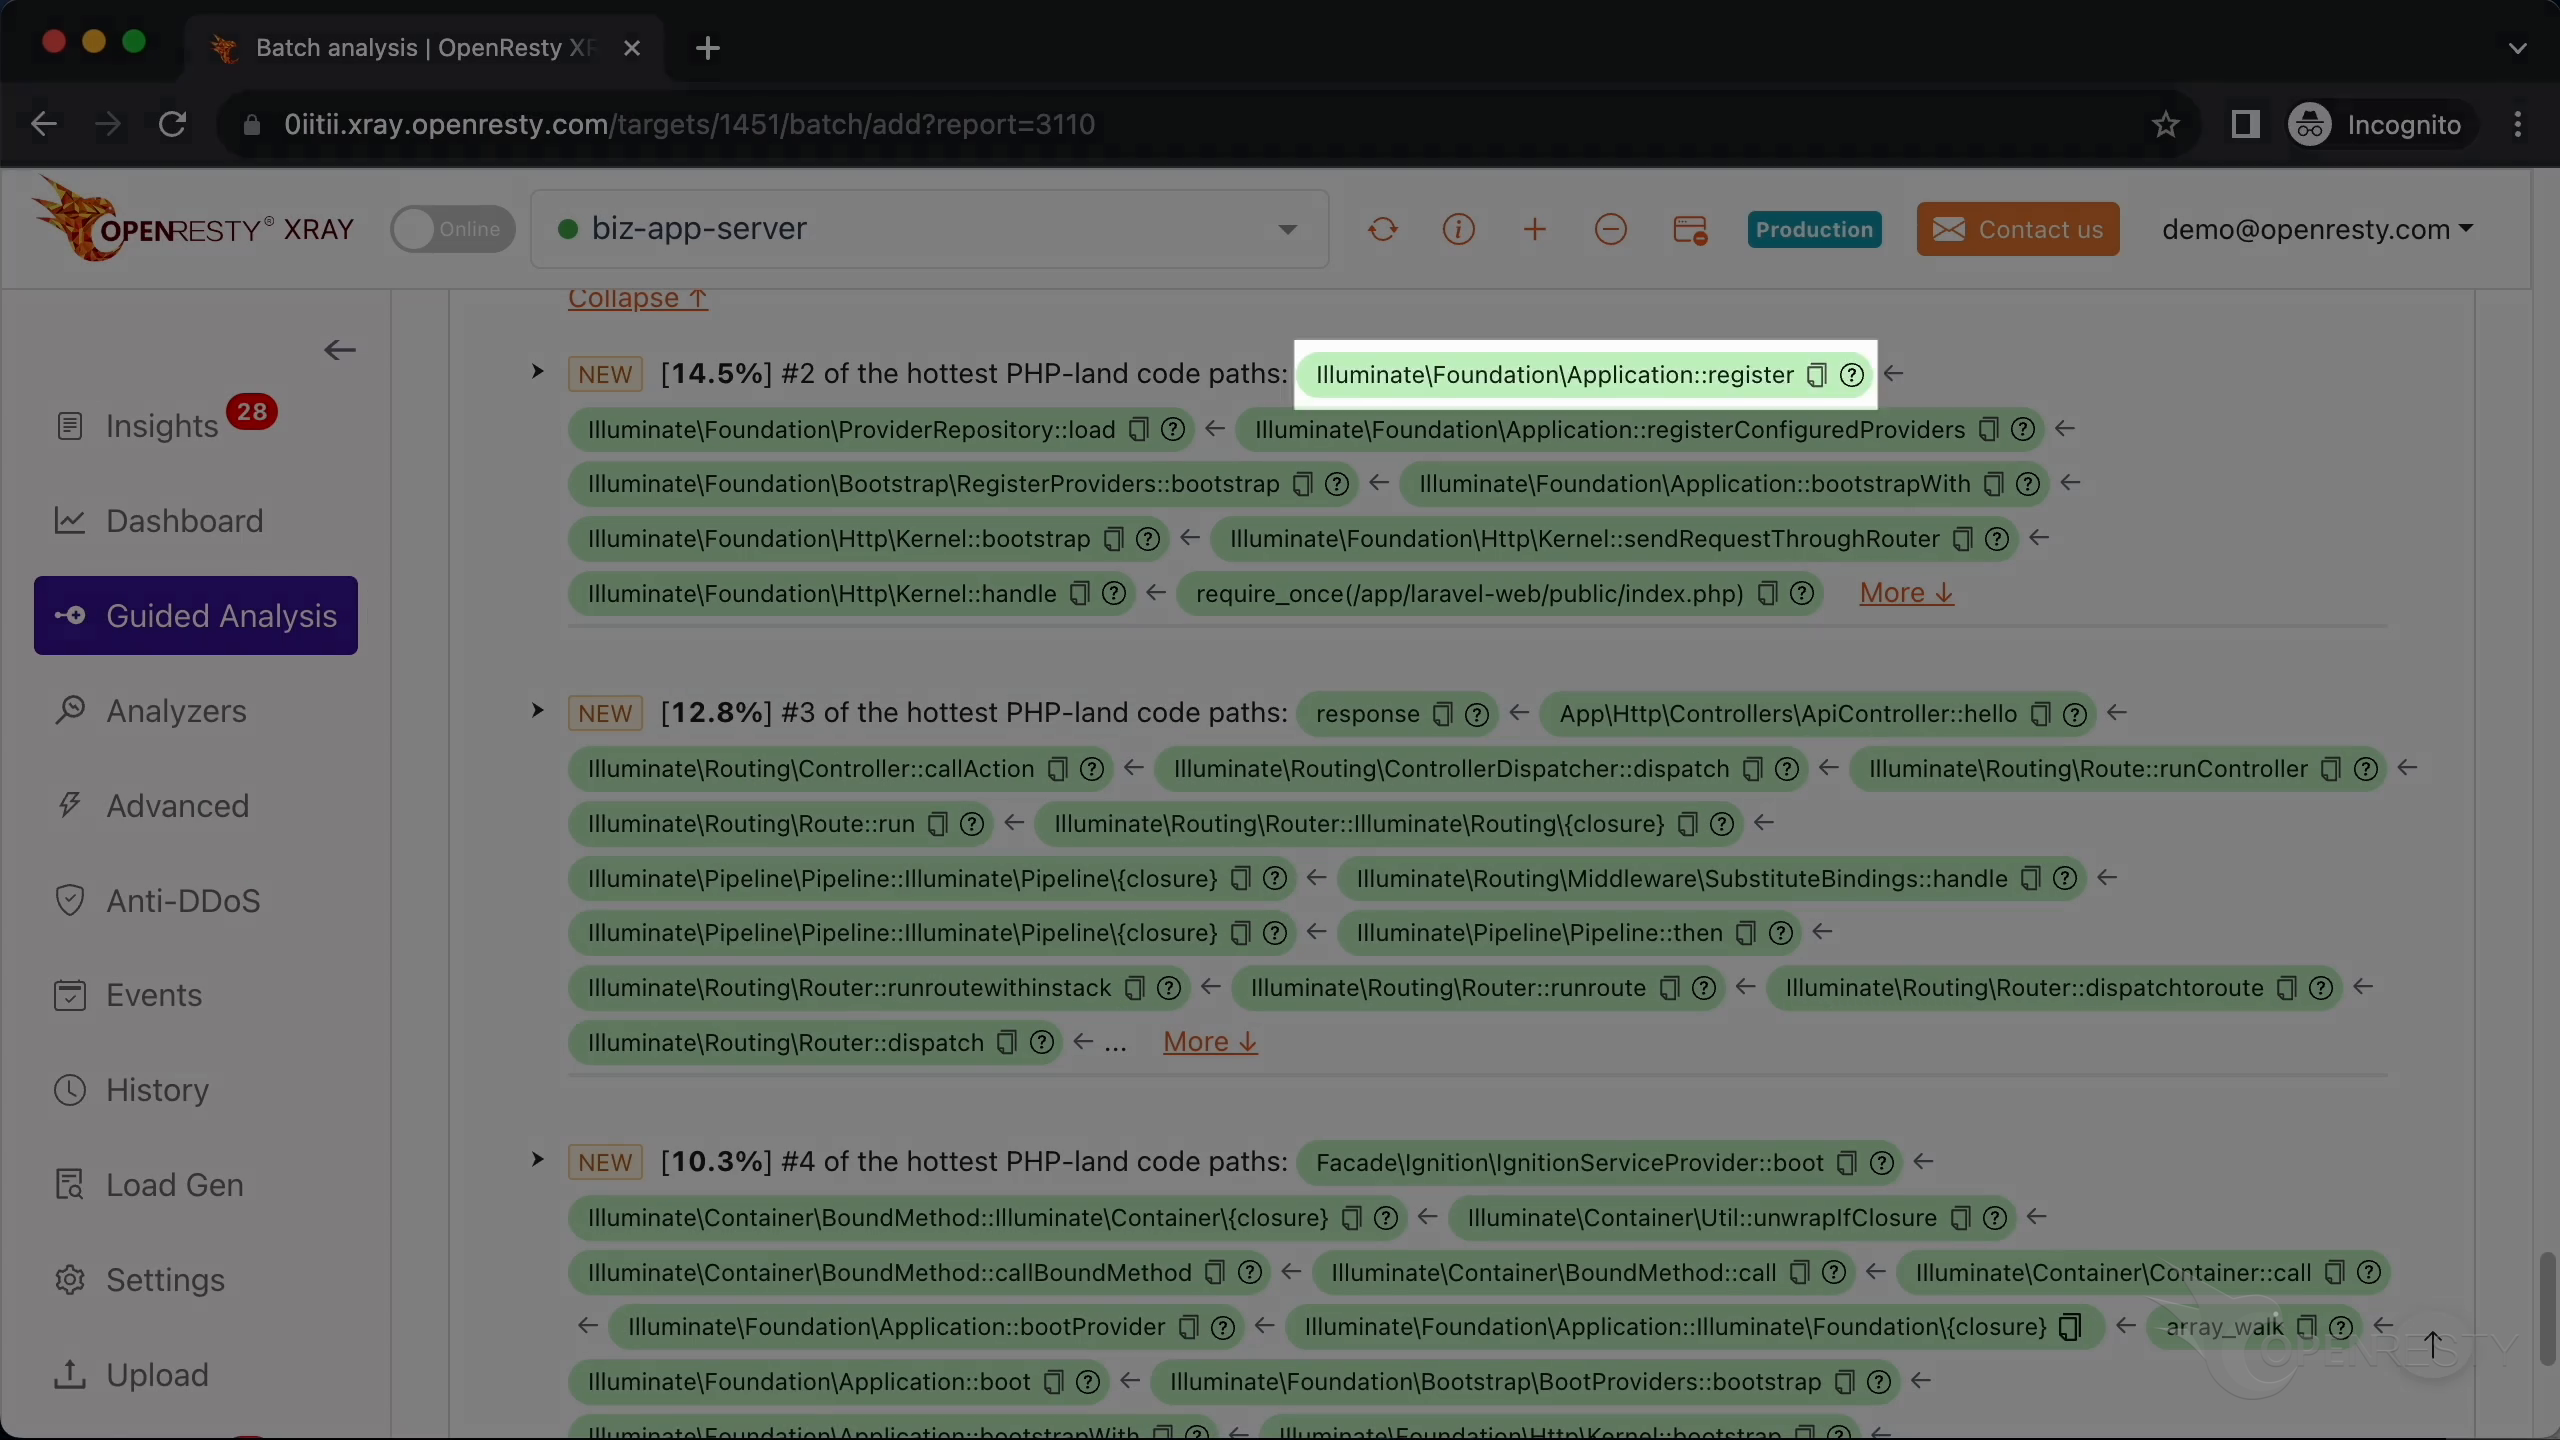
This register function runs during application bootstrap, resolving and registering the service providers. Because Laravel creates a new application instance on every request (unless you use a long-running setup such as Laravel Octane), this cost is paid again and again.
The full path mirrors the boot path above: the request enters through public/index.php and the HTTP kernel, then descends into registerConfiguredProviders.
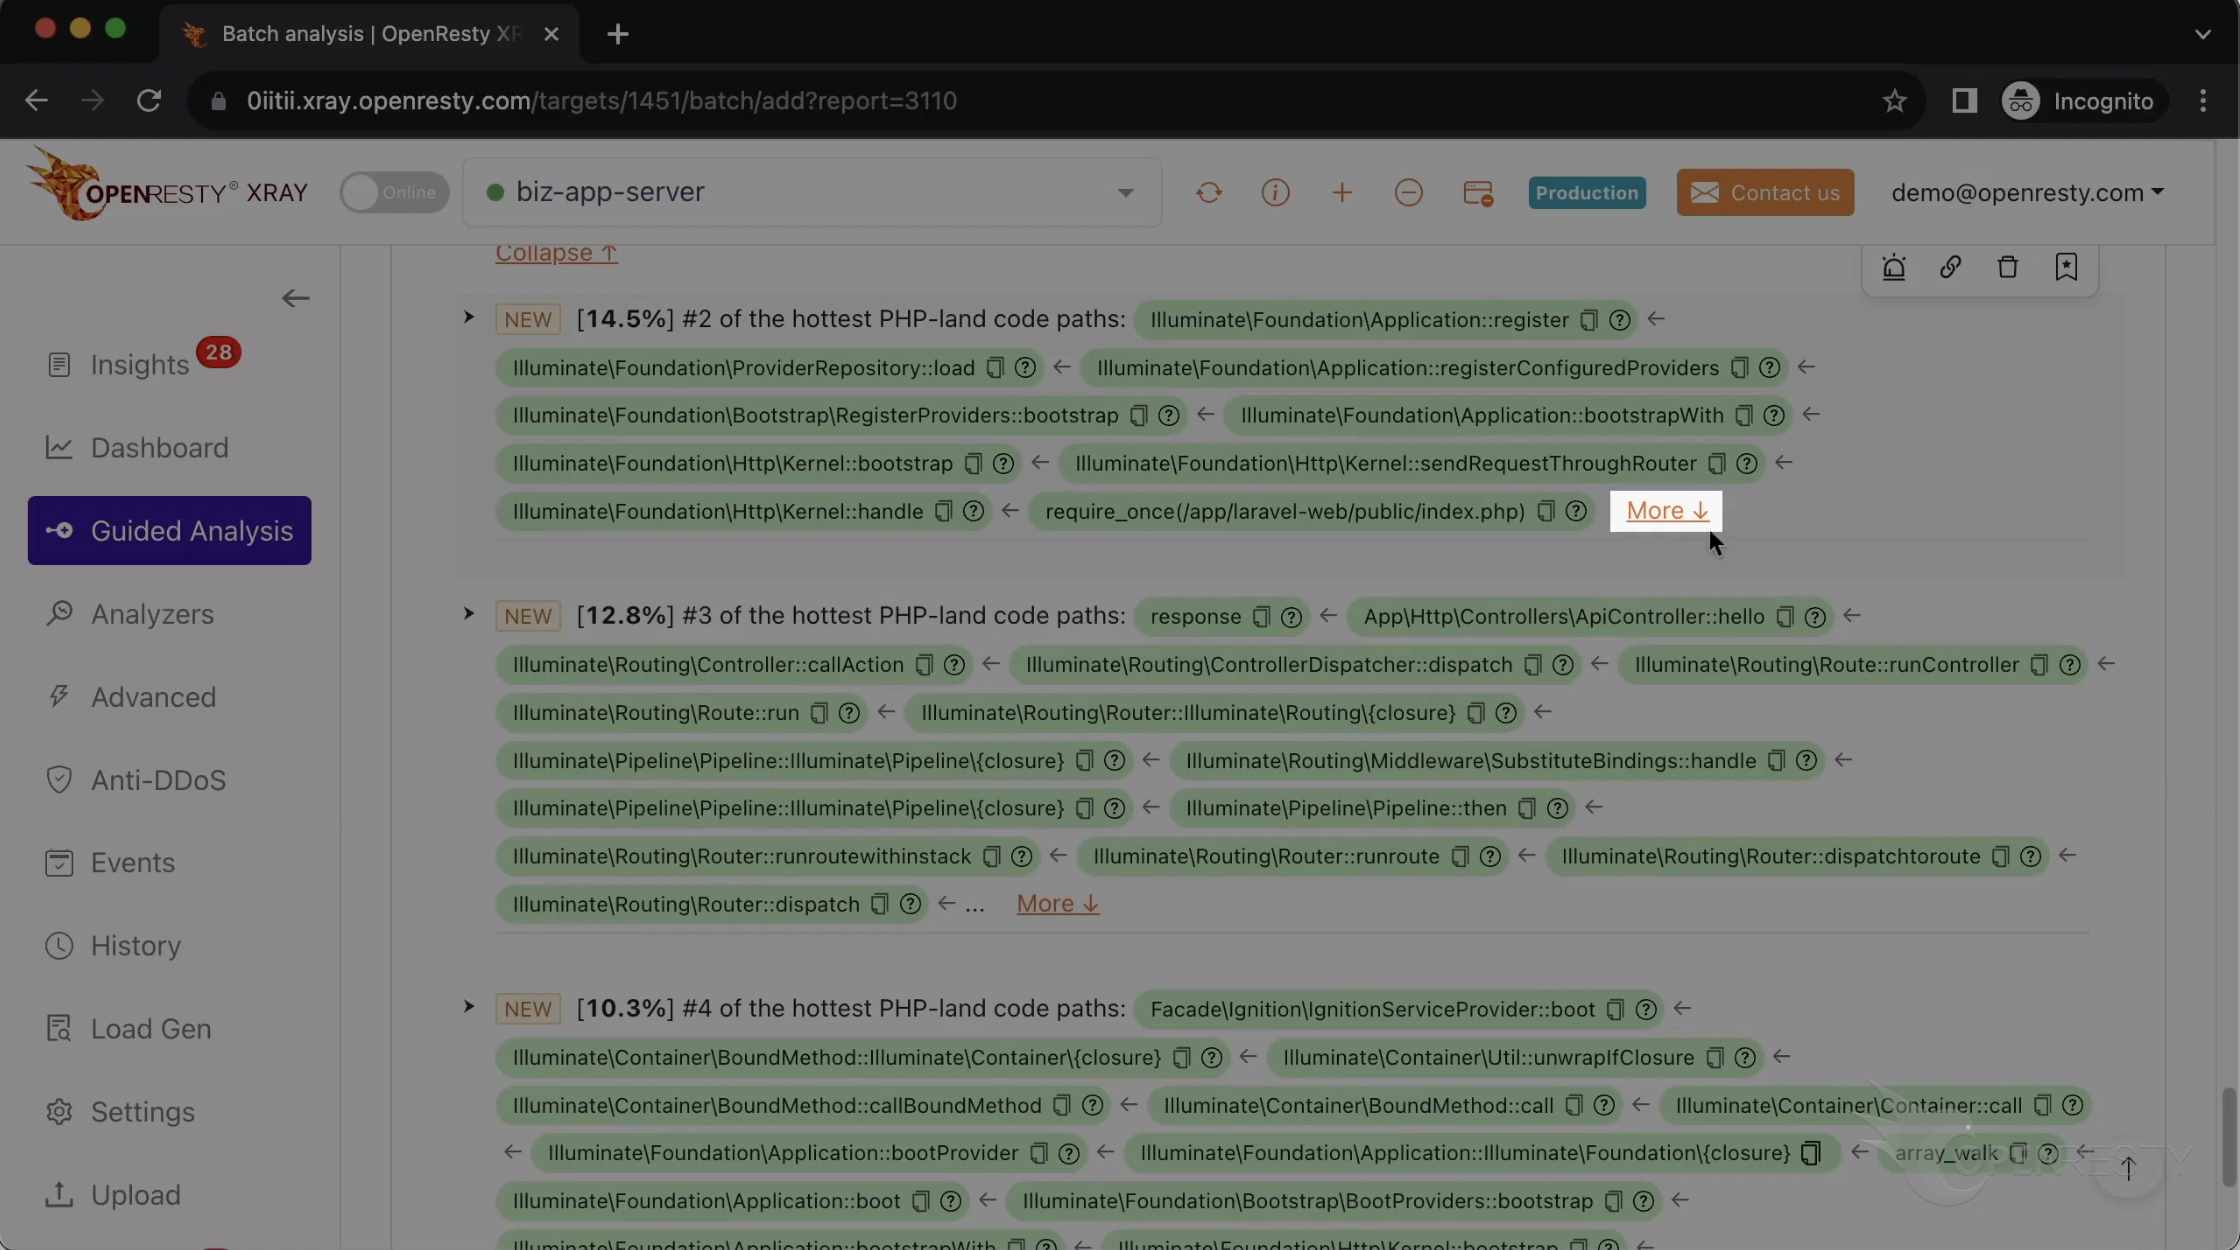
The auto-generated explanation breaks down the same sequence of calls, starting from the application’s entry point in index.php.
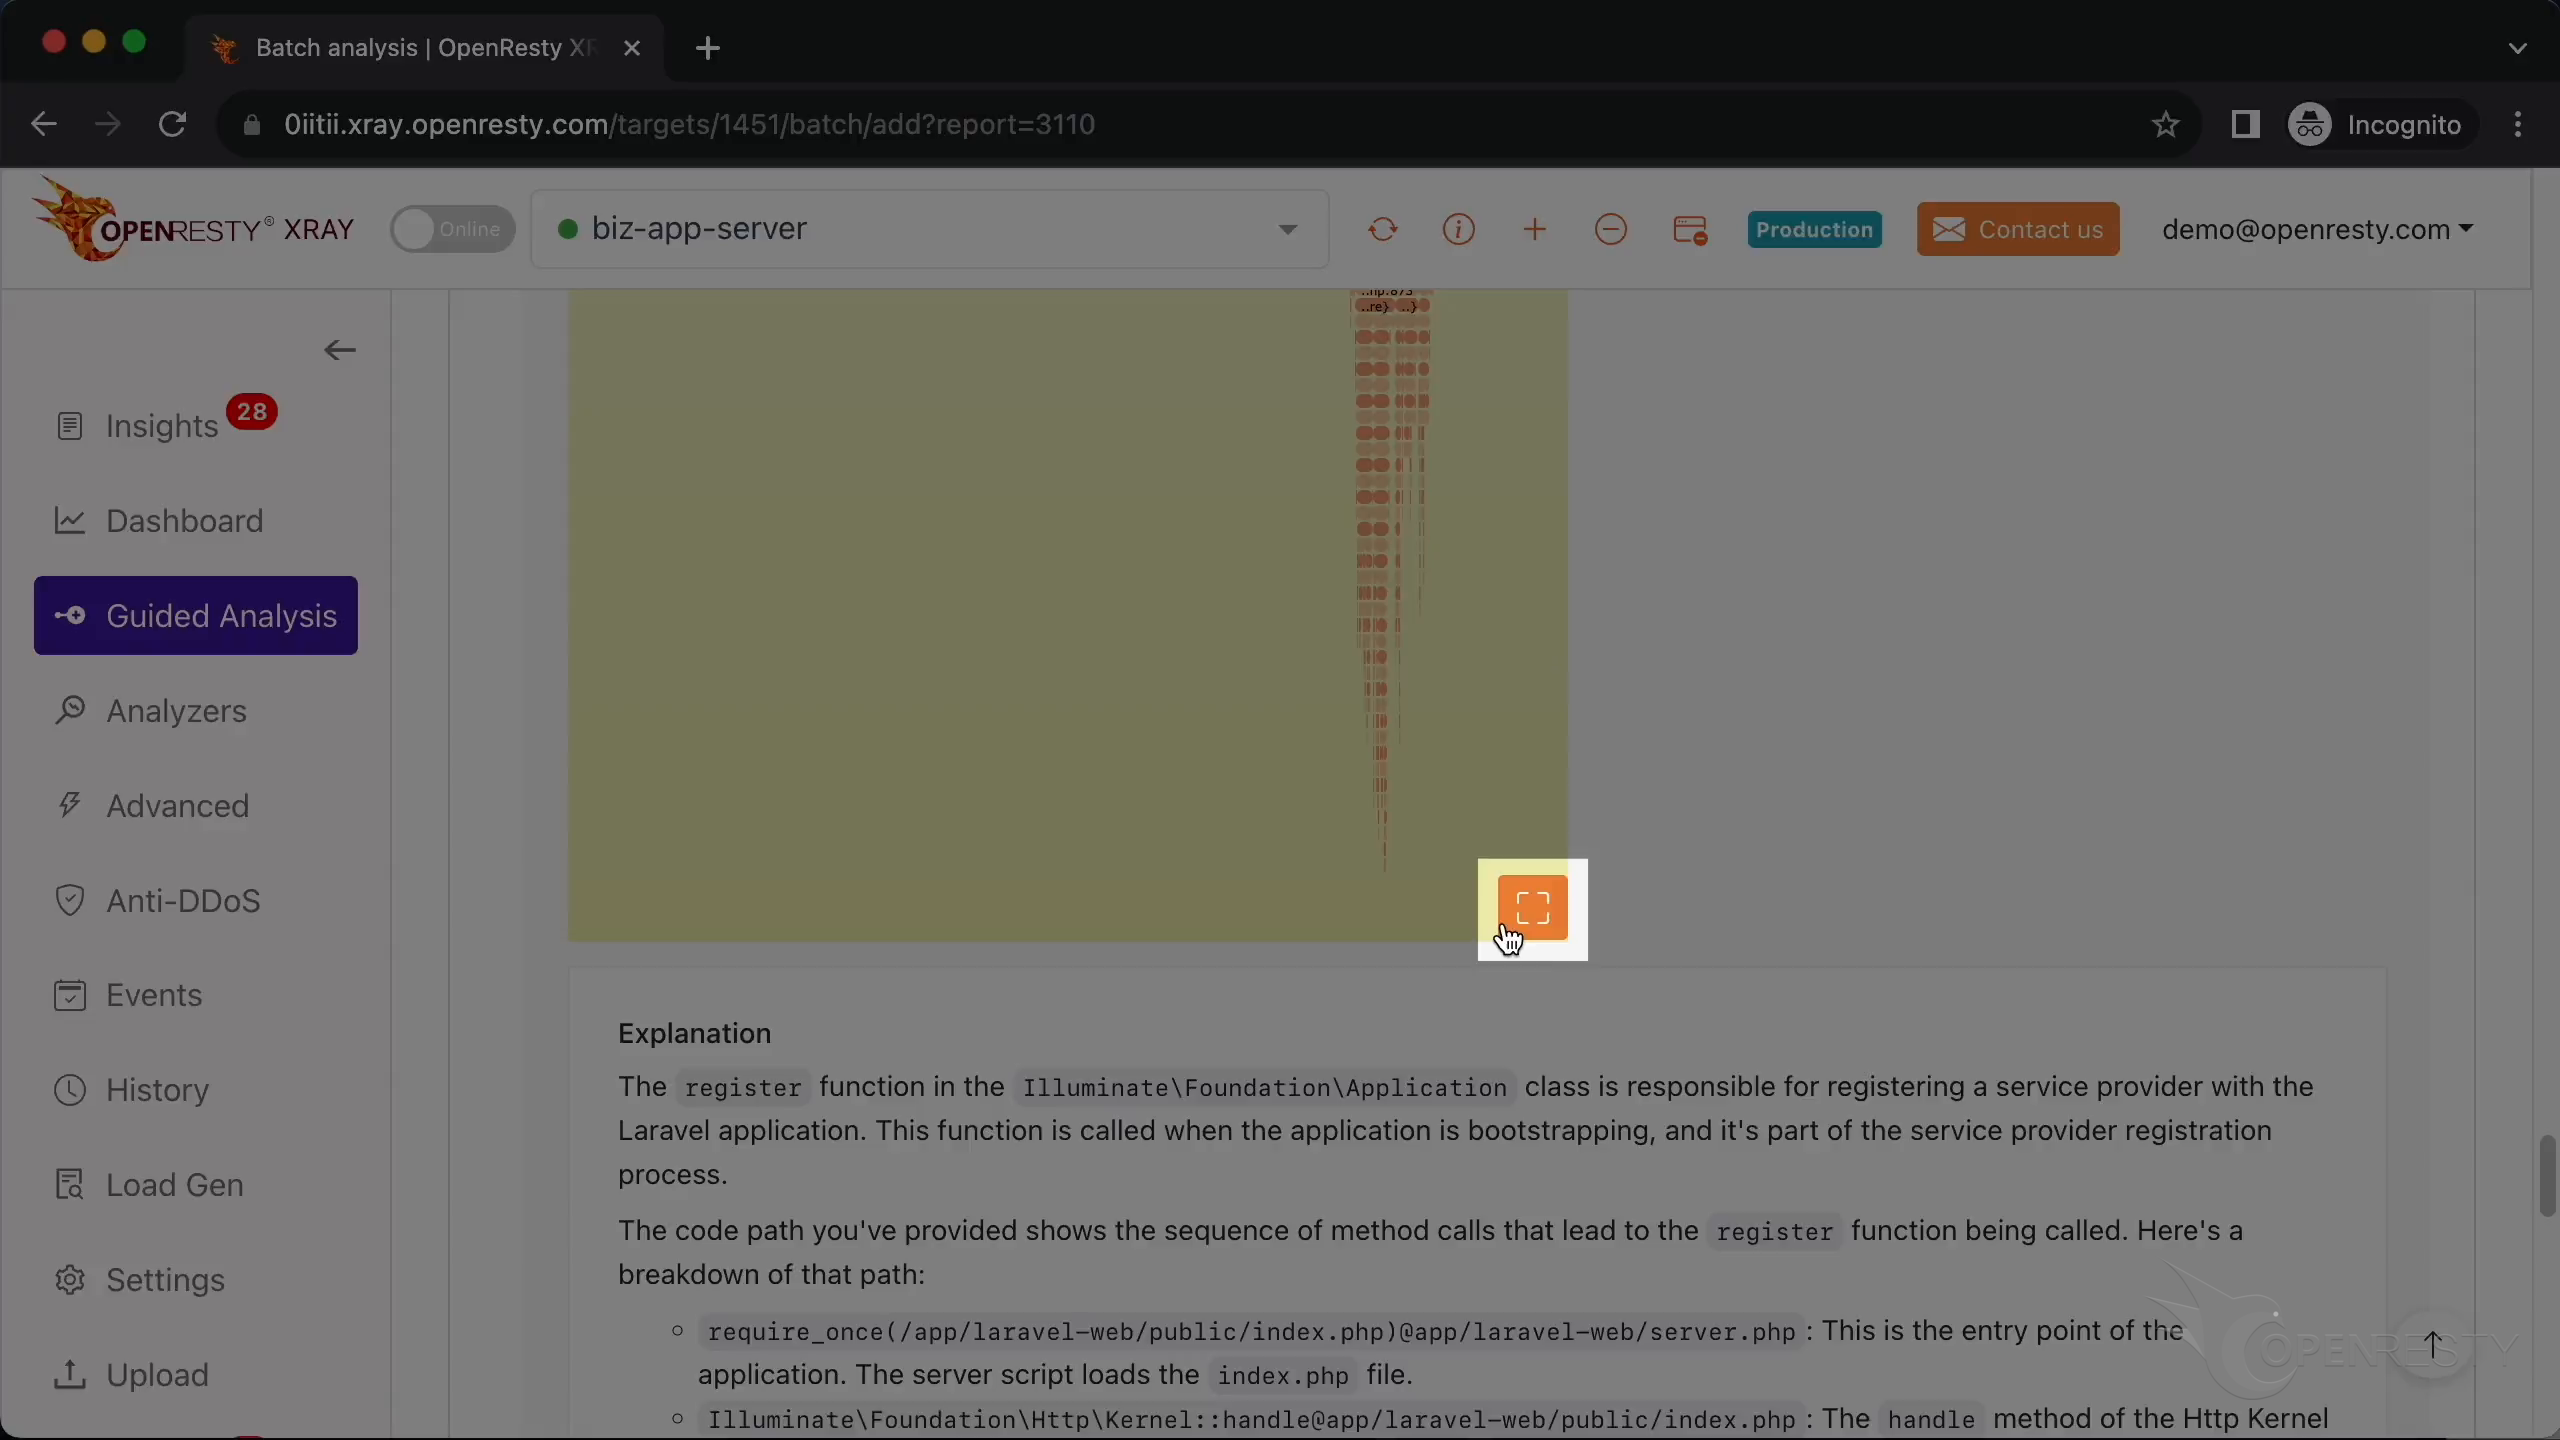
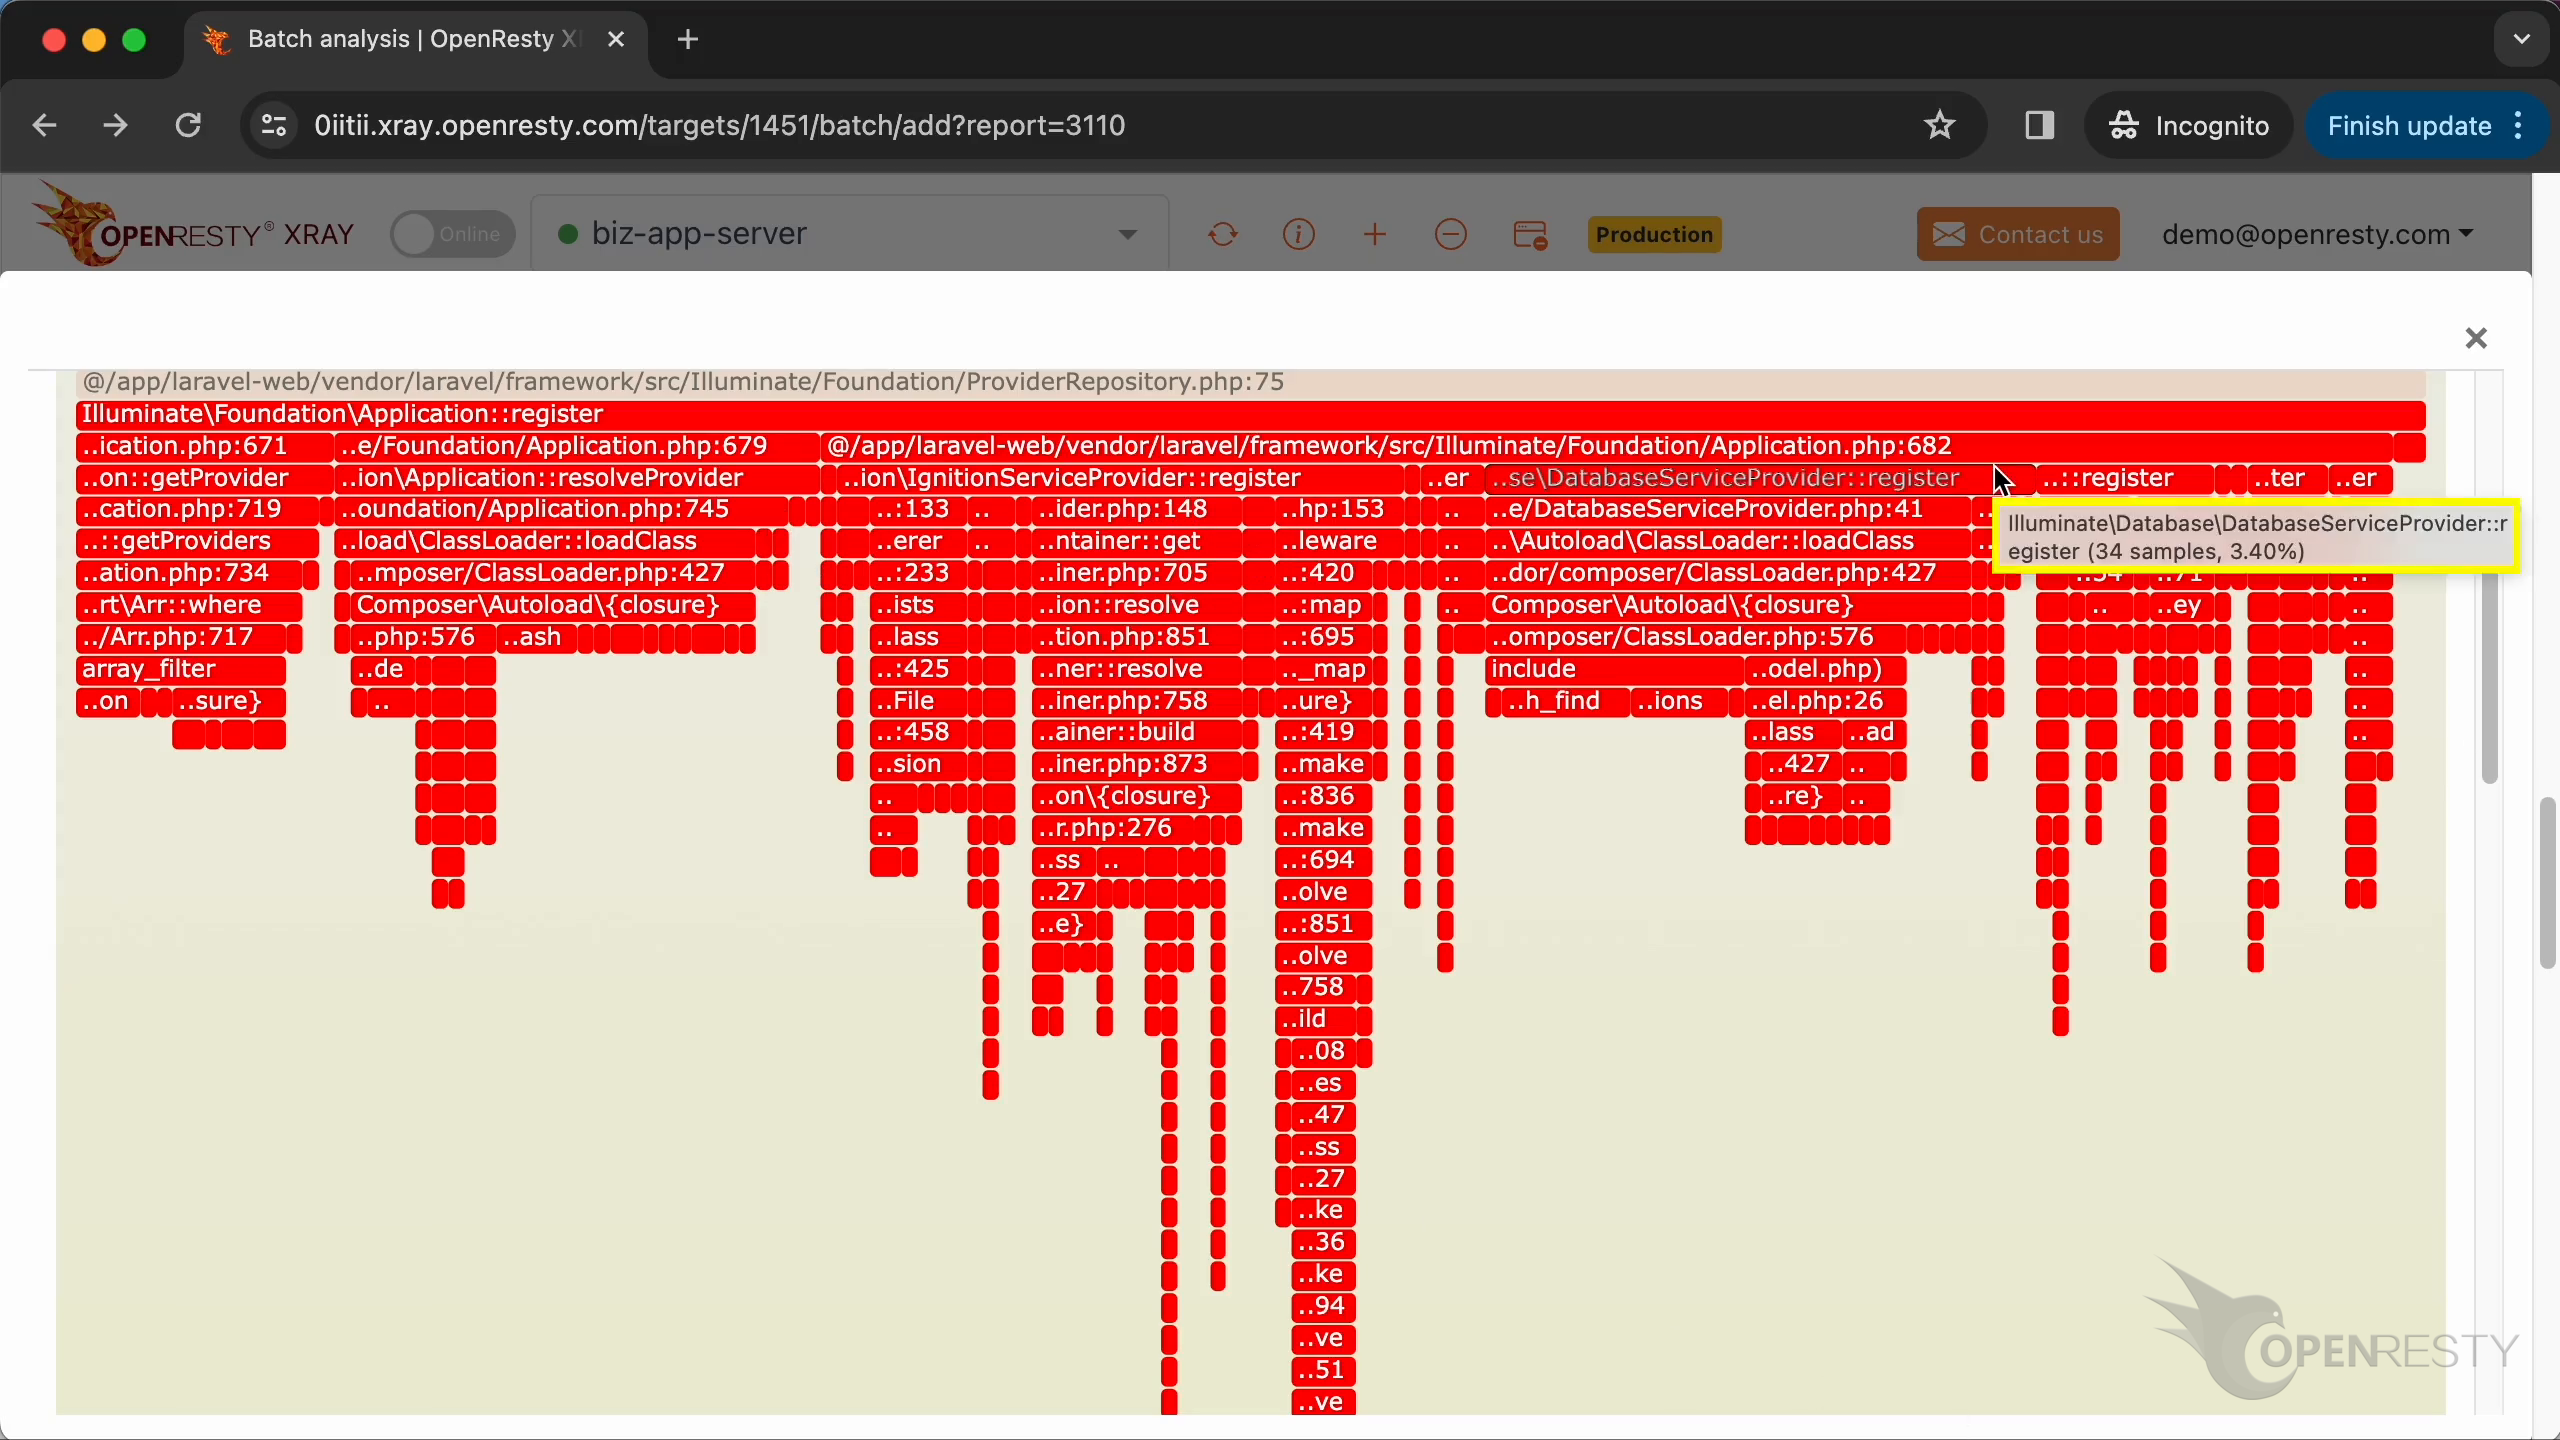
In the enlarged PHP-land CPU flame graph, the Application::register frame is highlighted among the surrounding bootstrap frames.
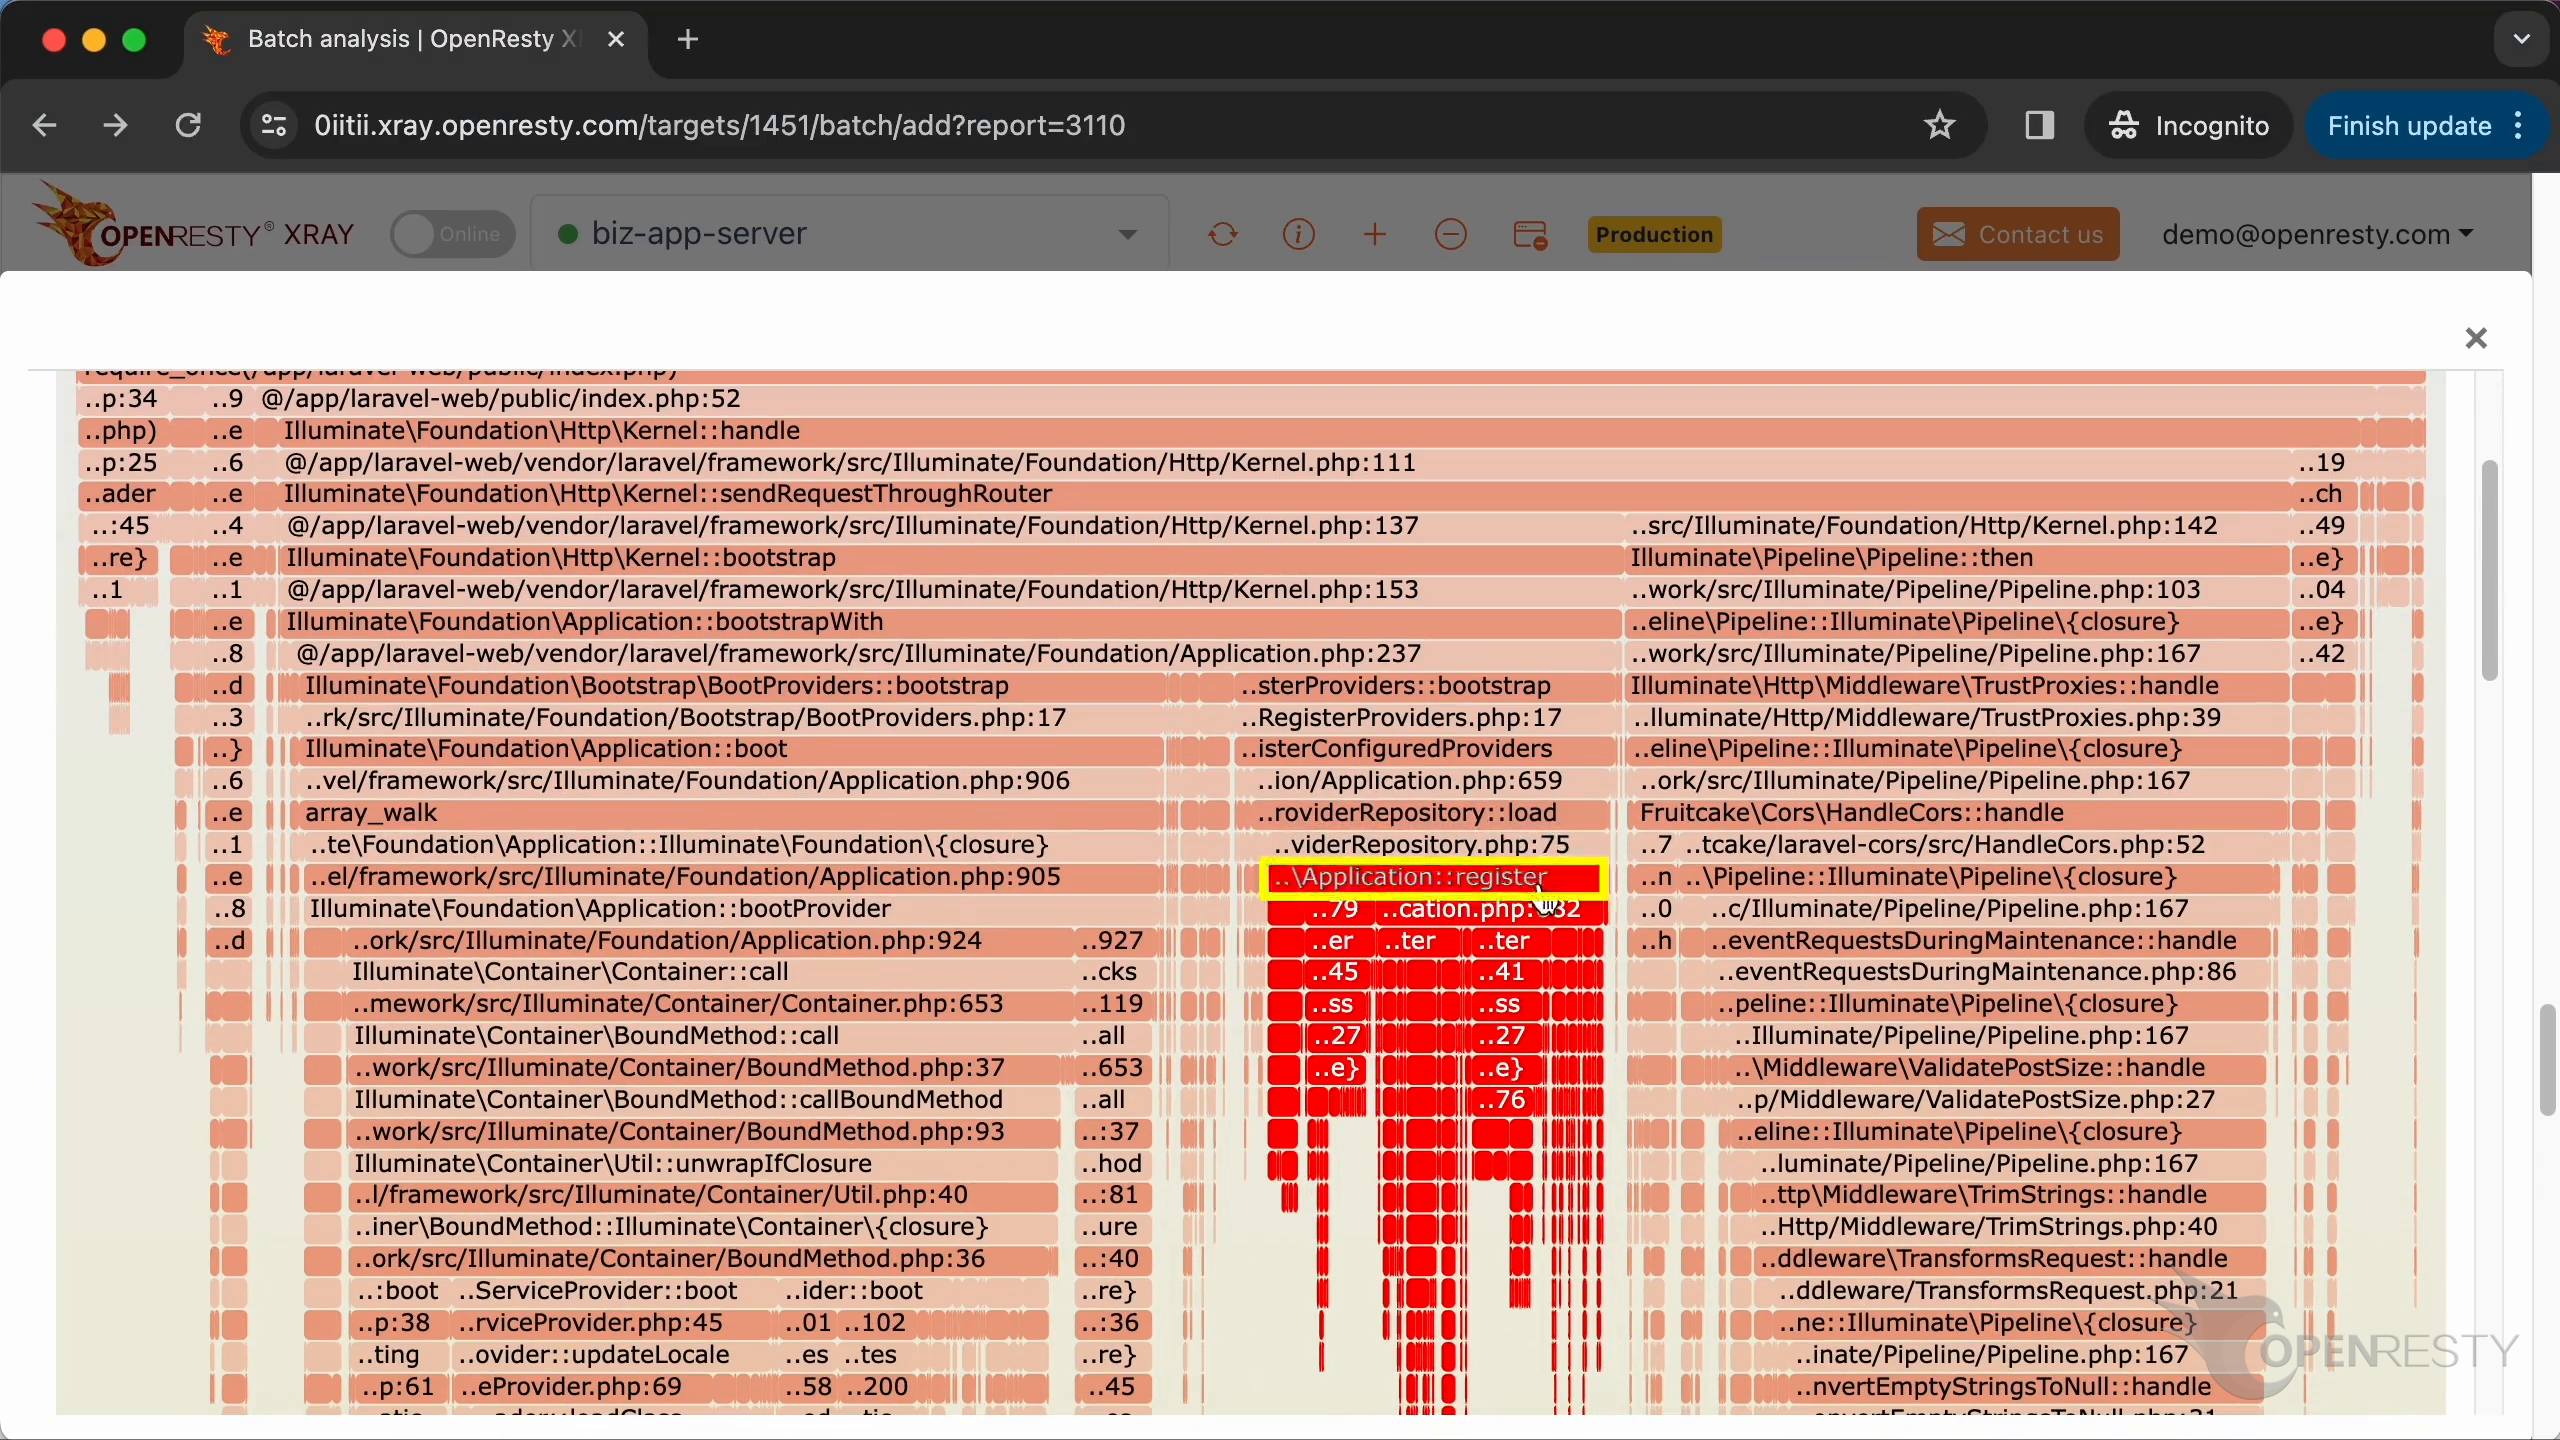
resolveProvider is a method in the Laravel framework for resolving and registering Service Providers.
DatabaseServiceProvider::register is a method used in the Laravel framework. It is part of the service container and is responsible for registering the database services.
The third hottest code path consumes 12.8% of the CPU time.
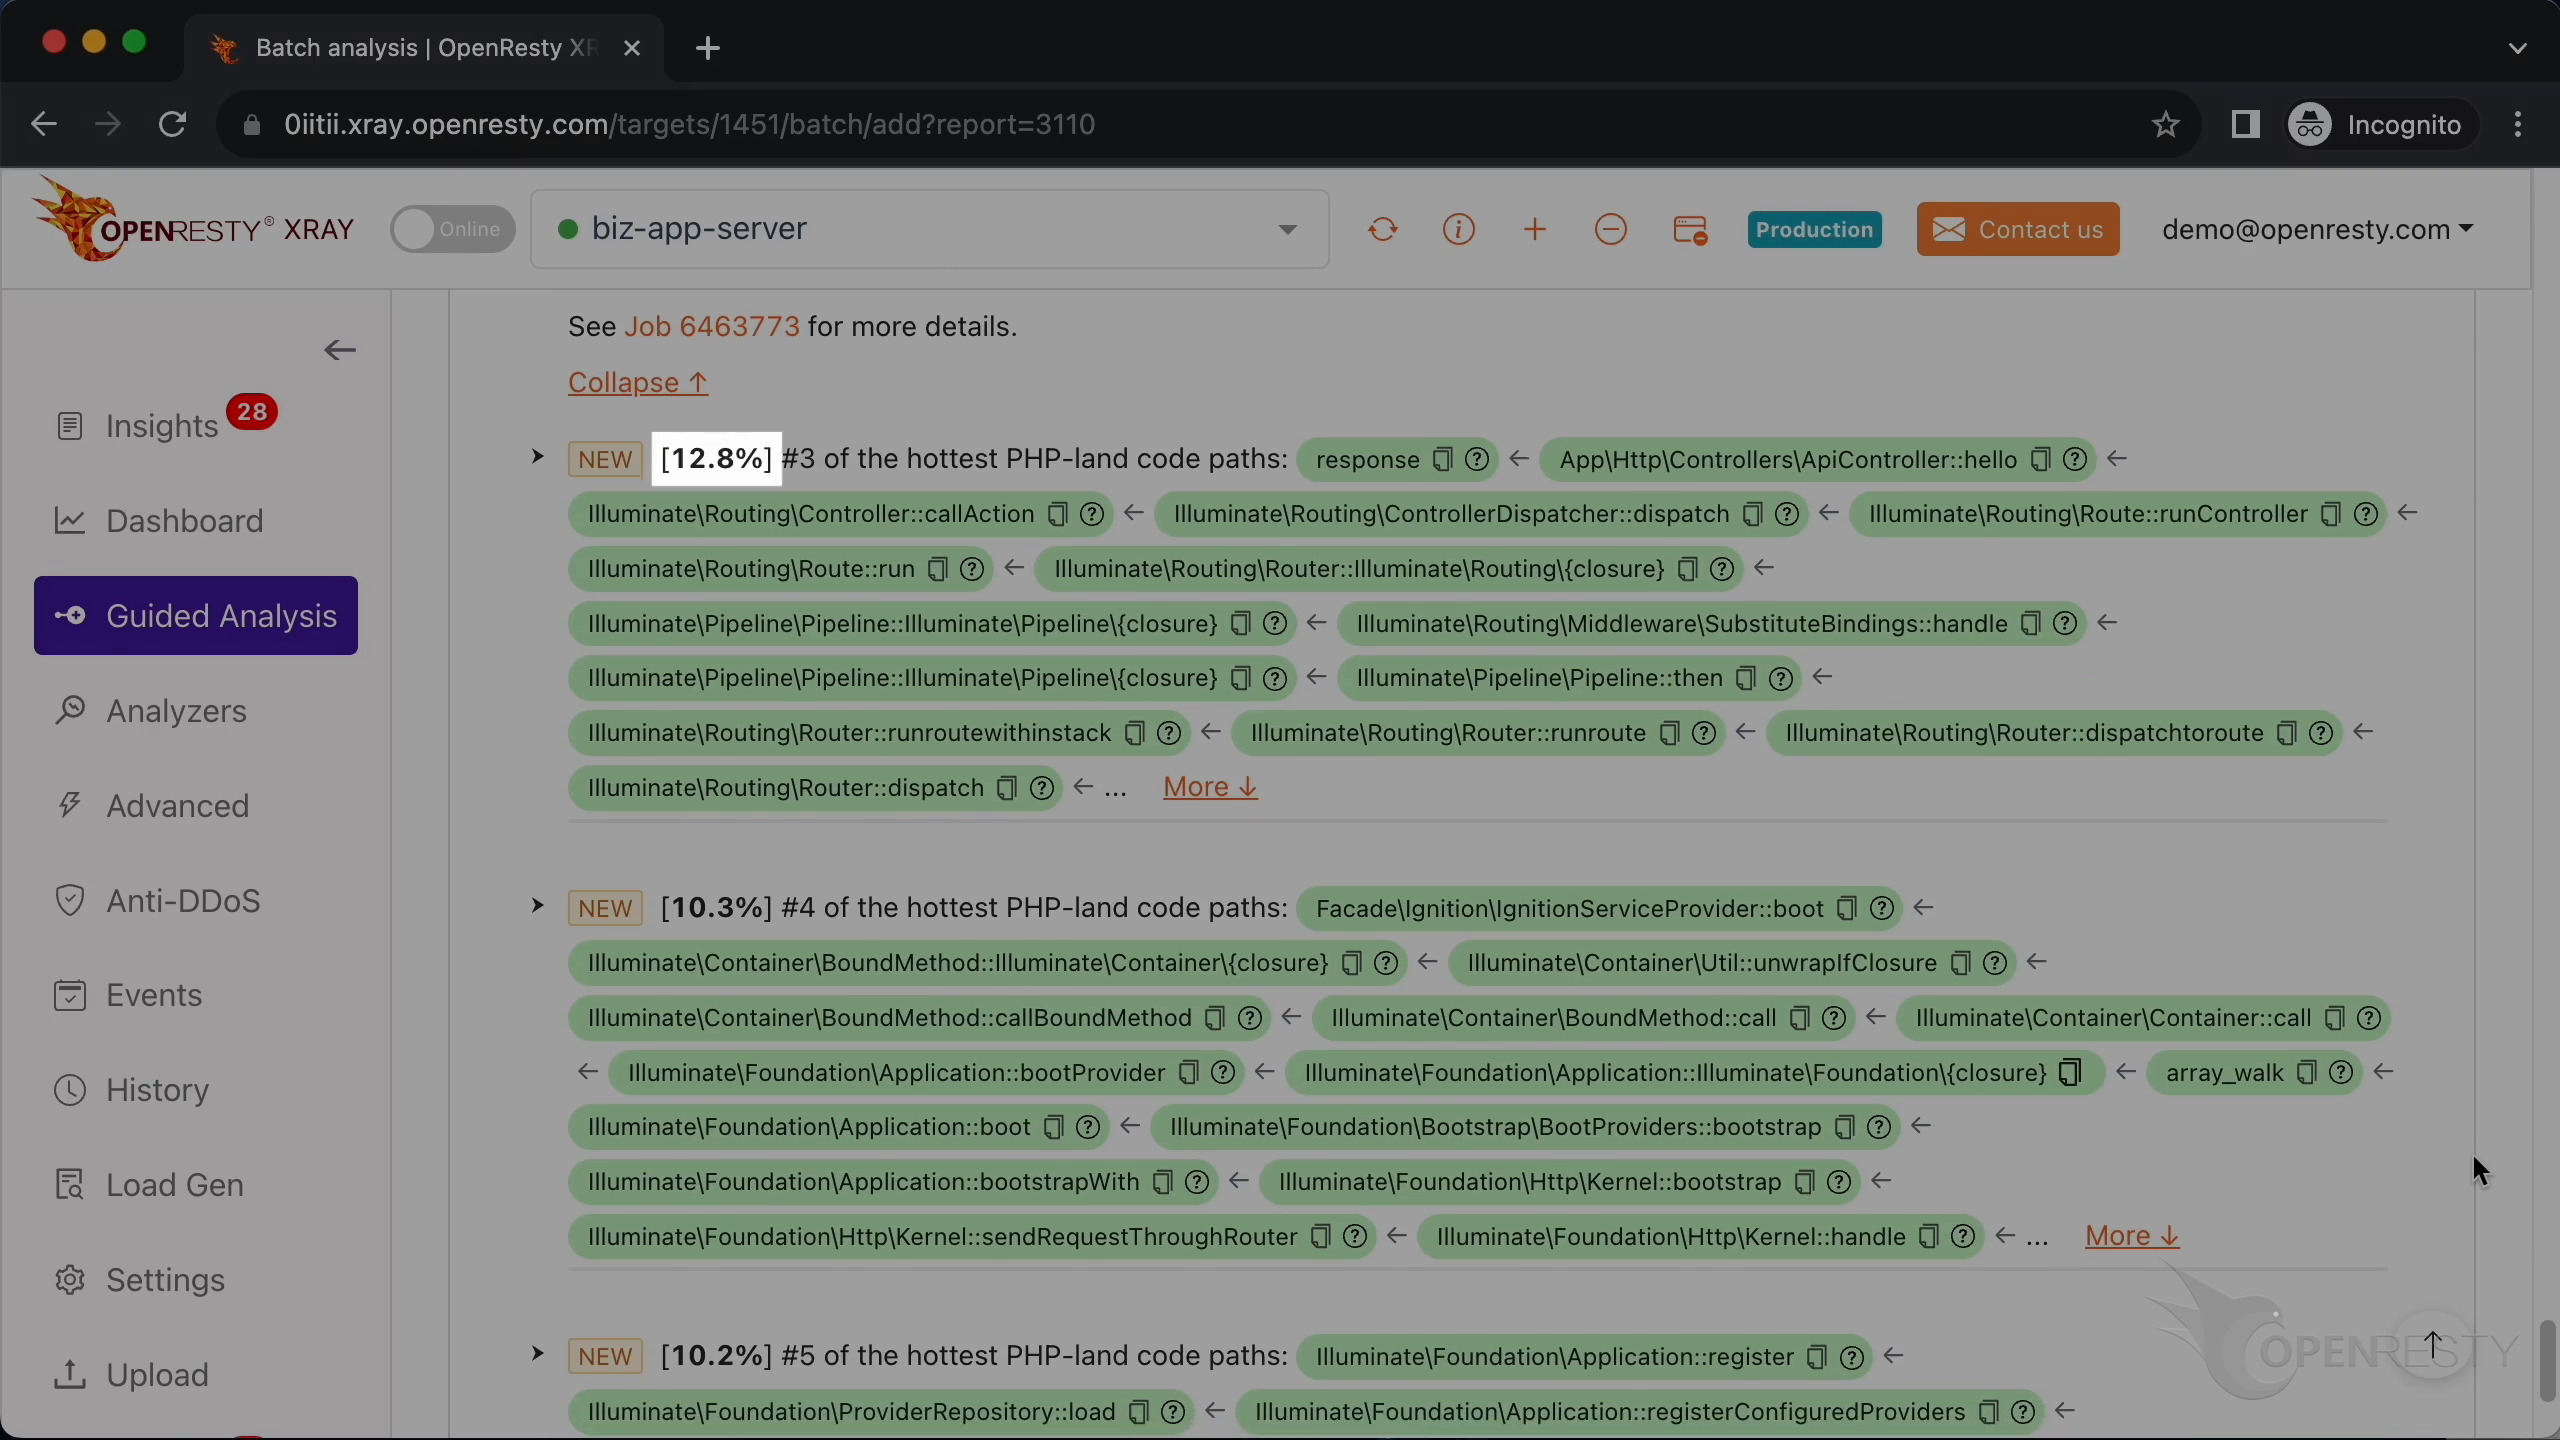
Its call chain runs through Laravel’s routing pipeline — Router::dispatch, the middleware stack, and ControllerDispatcher — before reaching the controller.
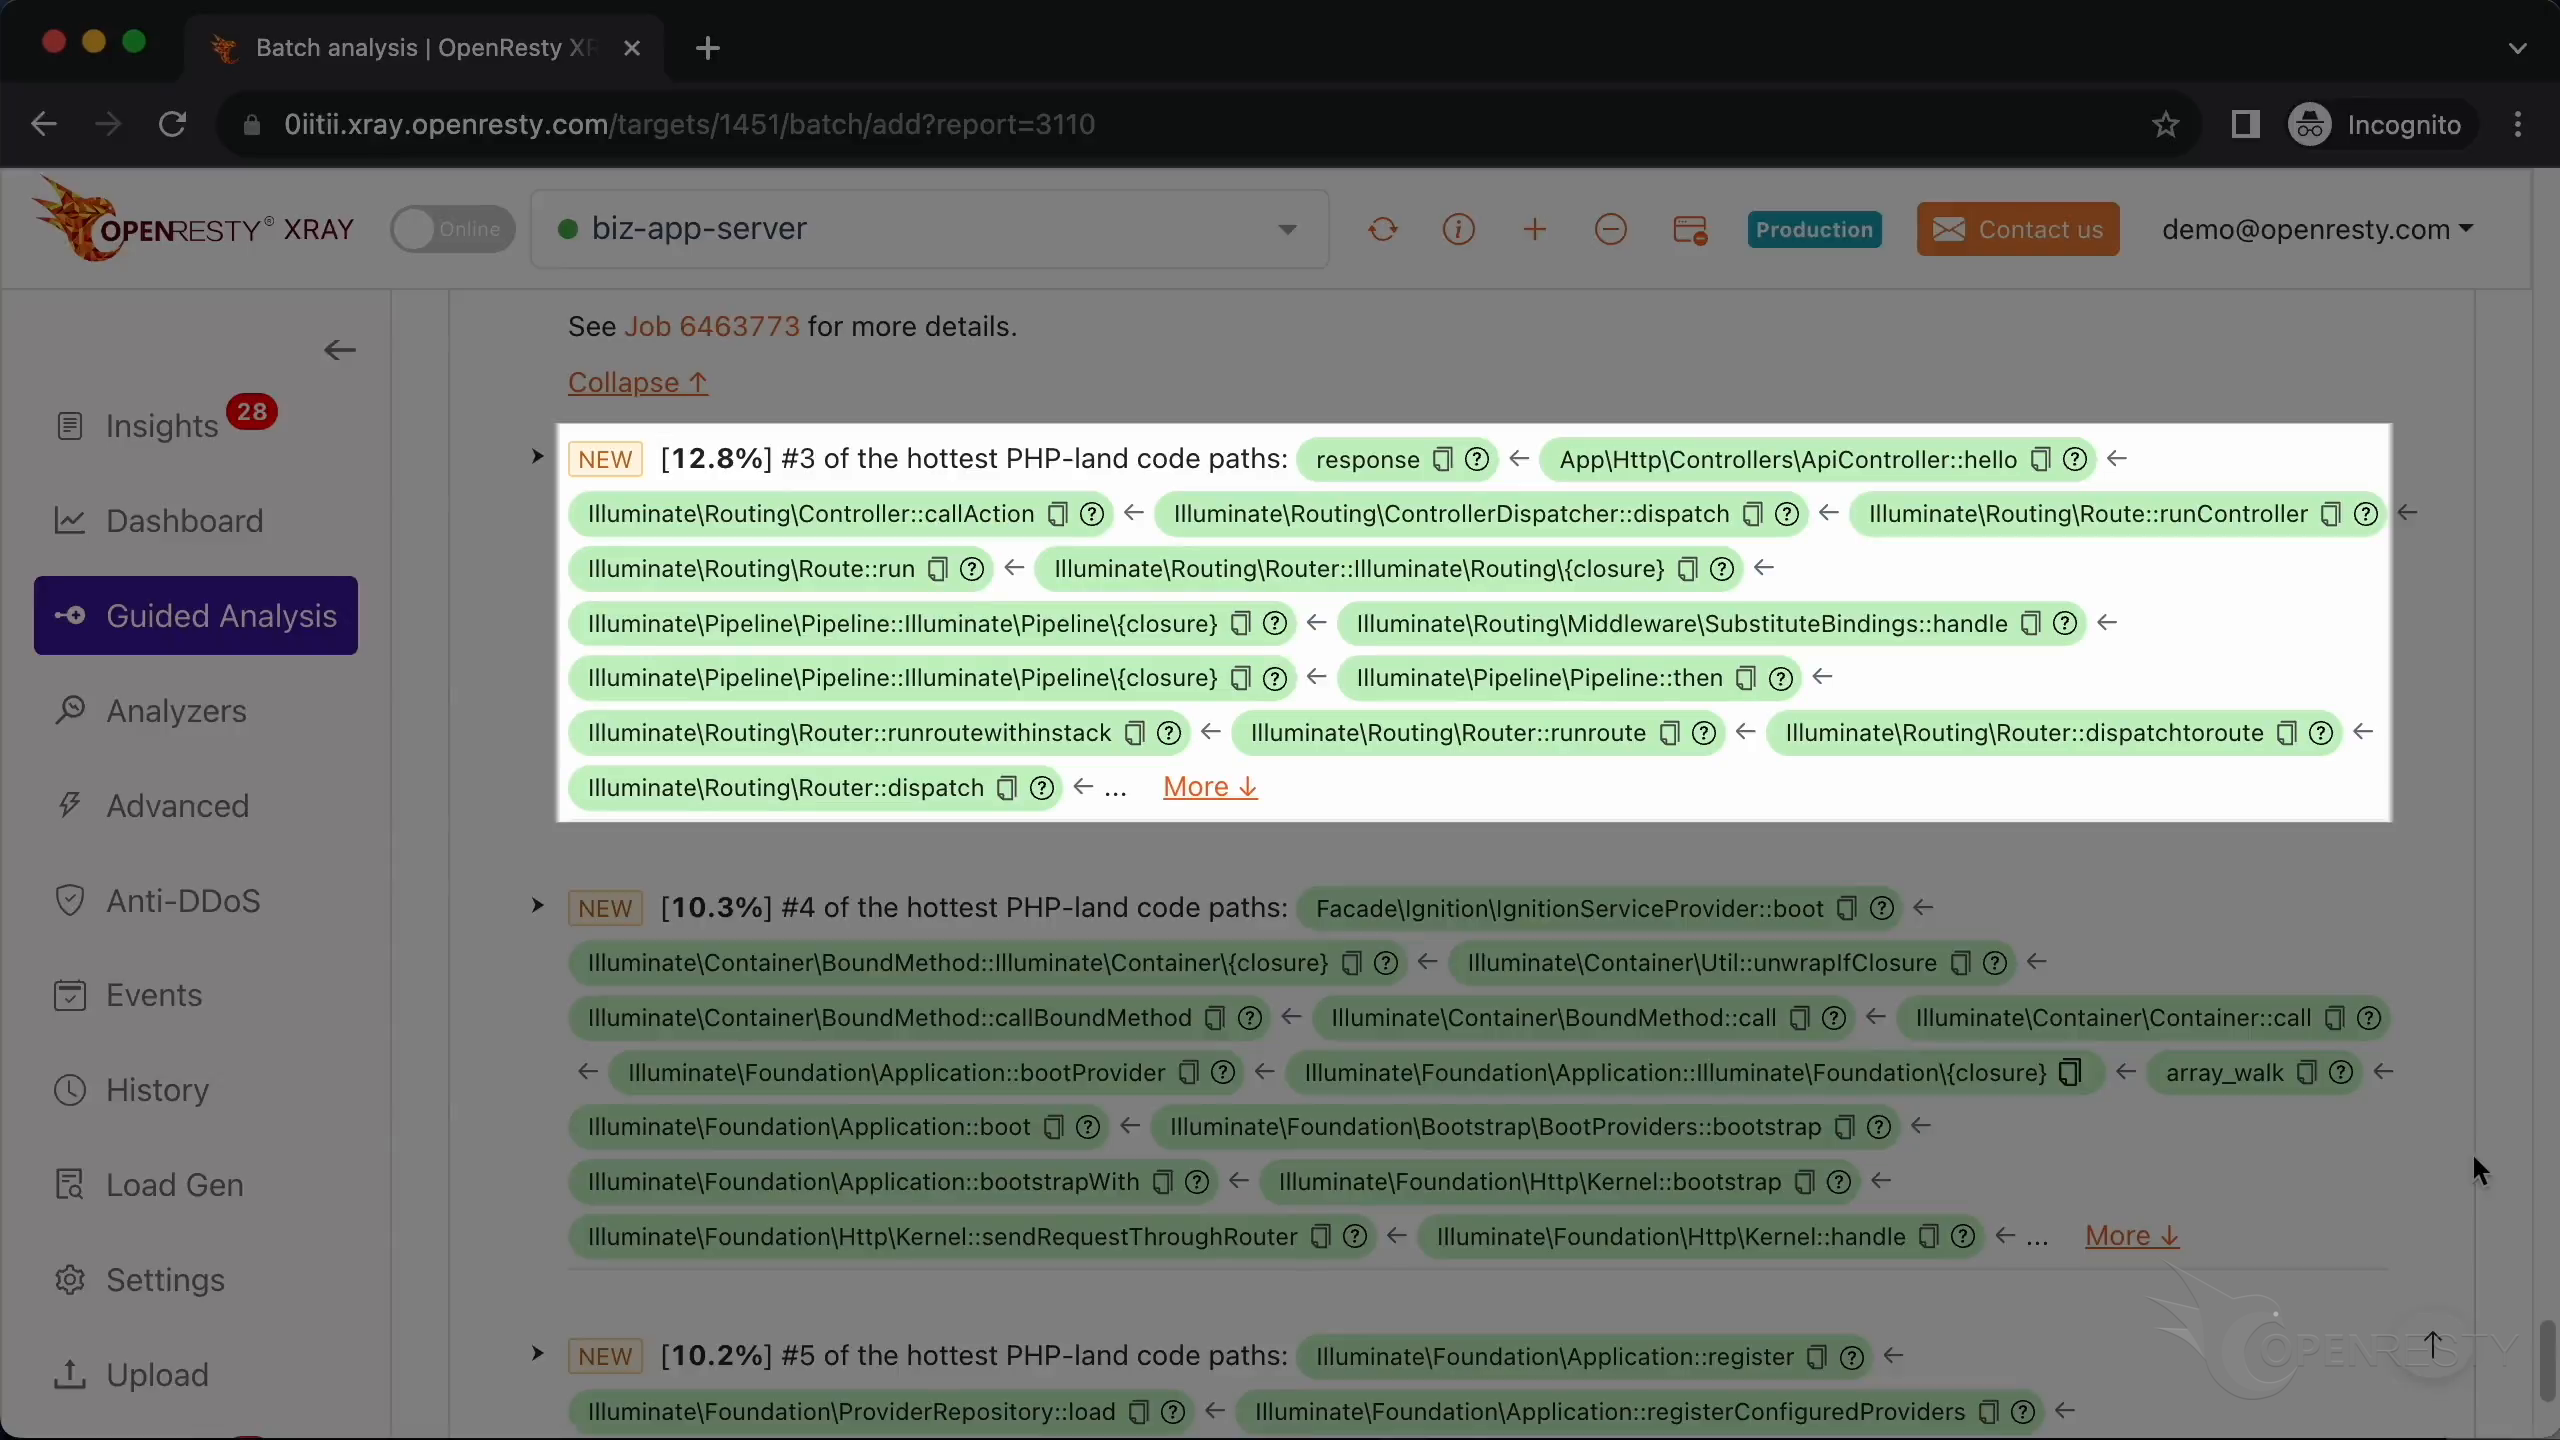
This is the path that actually implements the “hello world” response: our own handler code, plus the routing and response machinery around it.
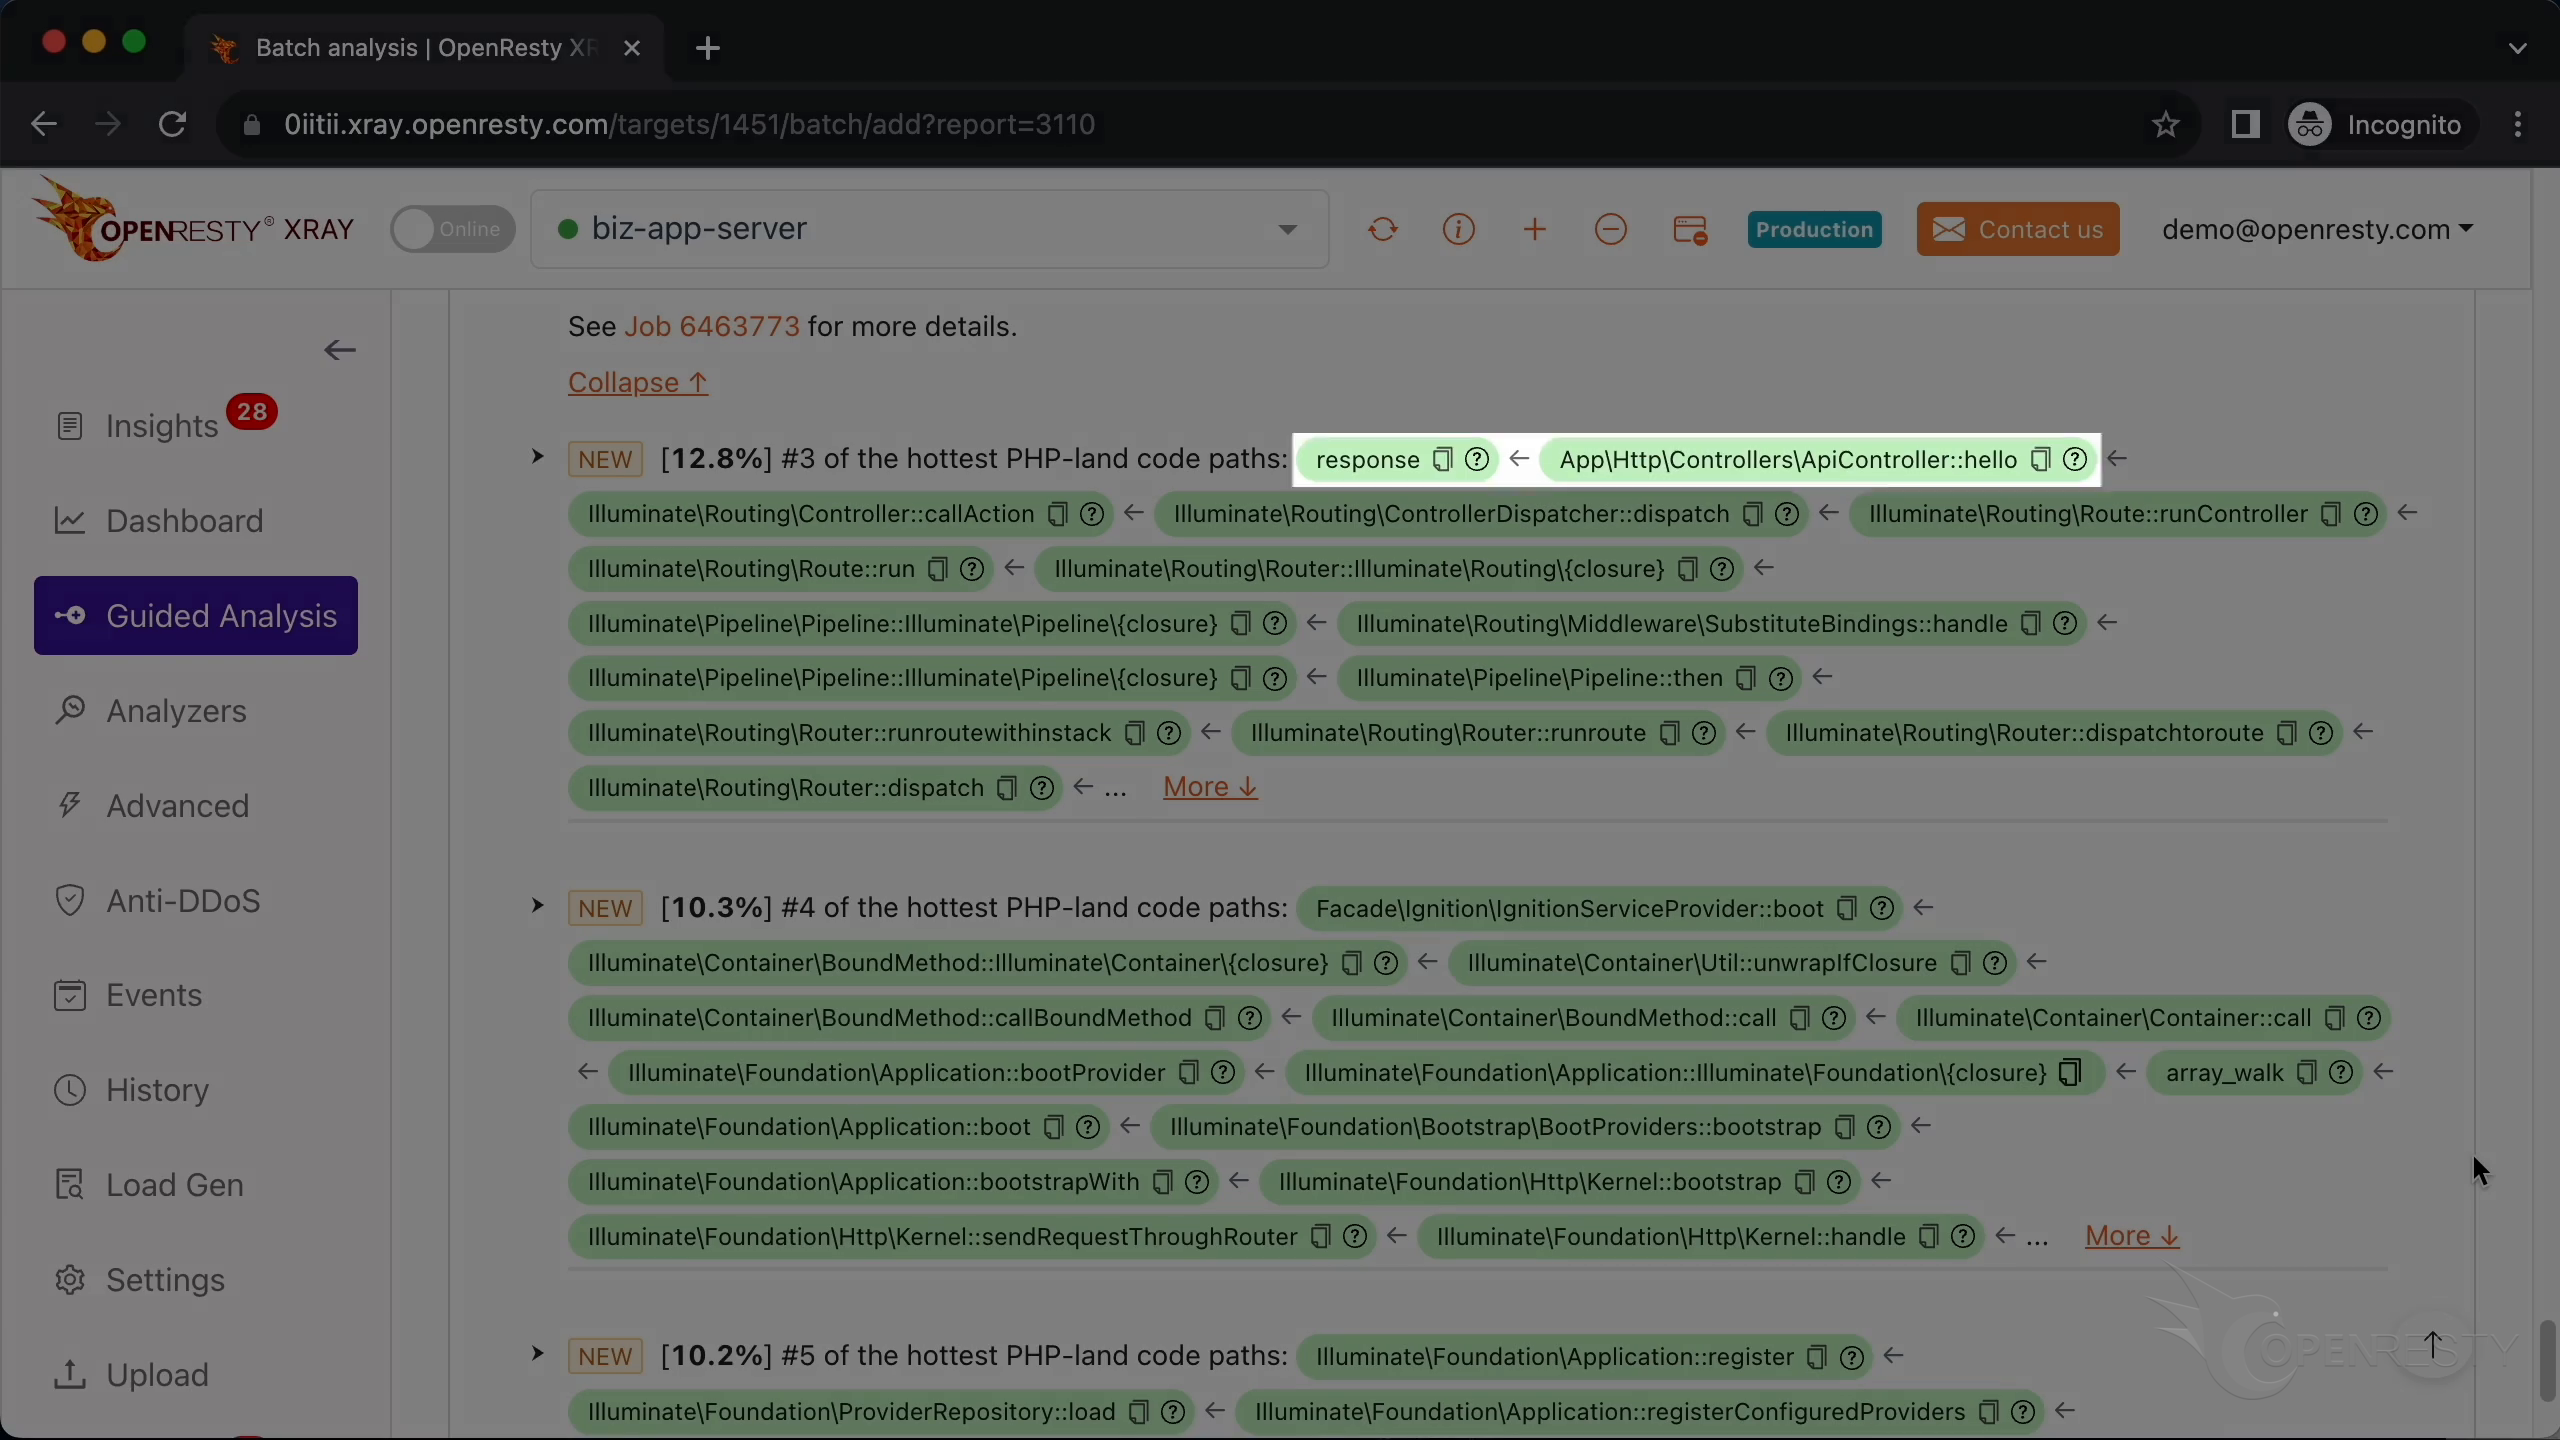
Note that the #1 and #2 paths both belong to the same per-request bootstrap: one boots the service providers while the other registers them, and together they account for over half of the total CPU time — before any application logic runs.
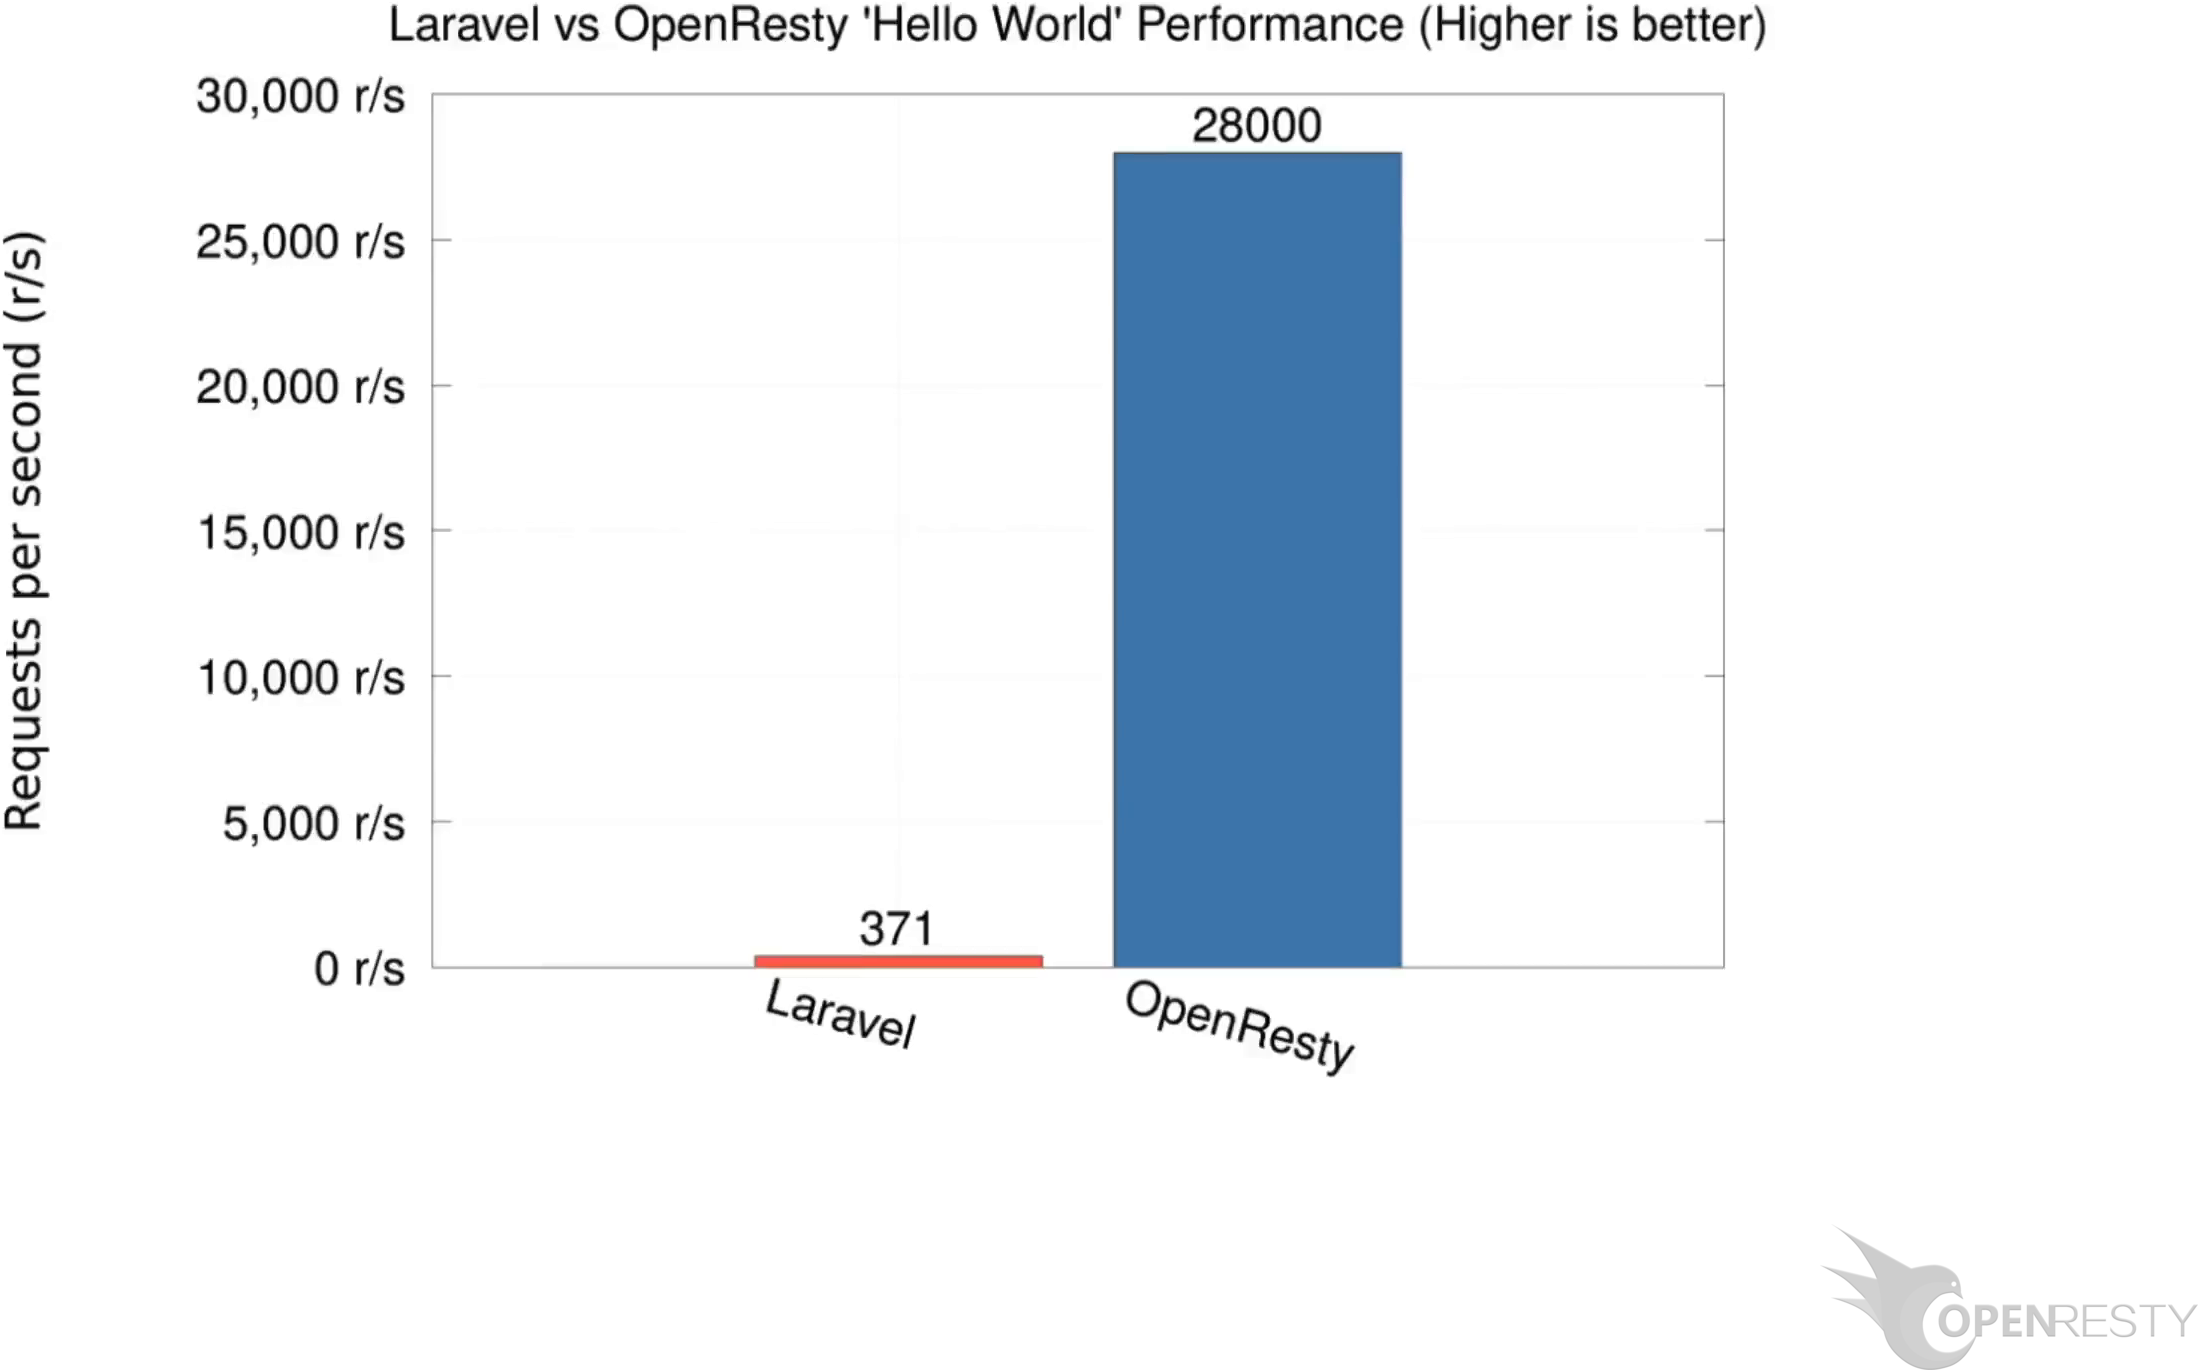
For reference, here is a throughput comparison between this Laravel “hello world” app and an equivalent OpenResty handler: 371 requests per second versus 28,000 — roughly a 75x gap. The comparison is not apples-to-apples, since Laravel is a full-stack framework while OpenResty carries far less per-request abstraction, but it illustrates how much the framework overhead measured above costs in practice. If your Laravel application also suffers from high memory consumption, OpenResty XRay can profile that as well.
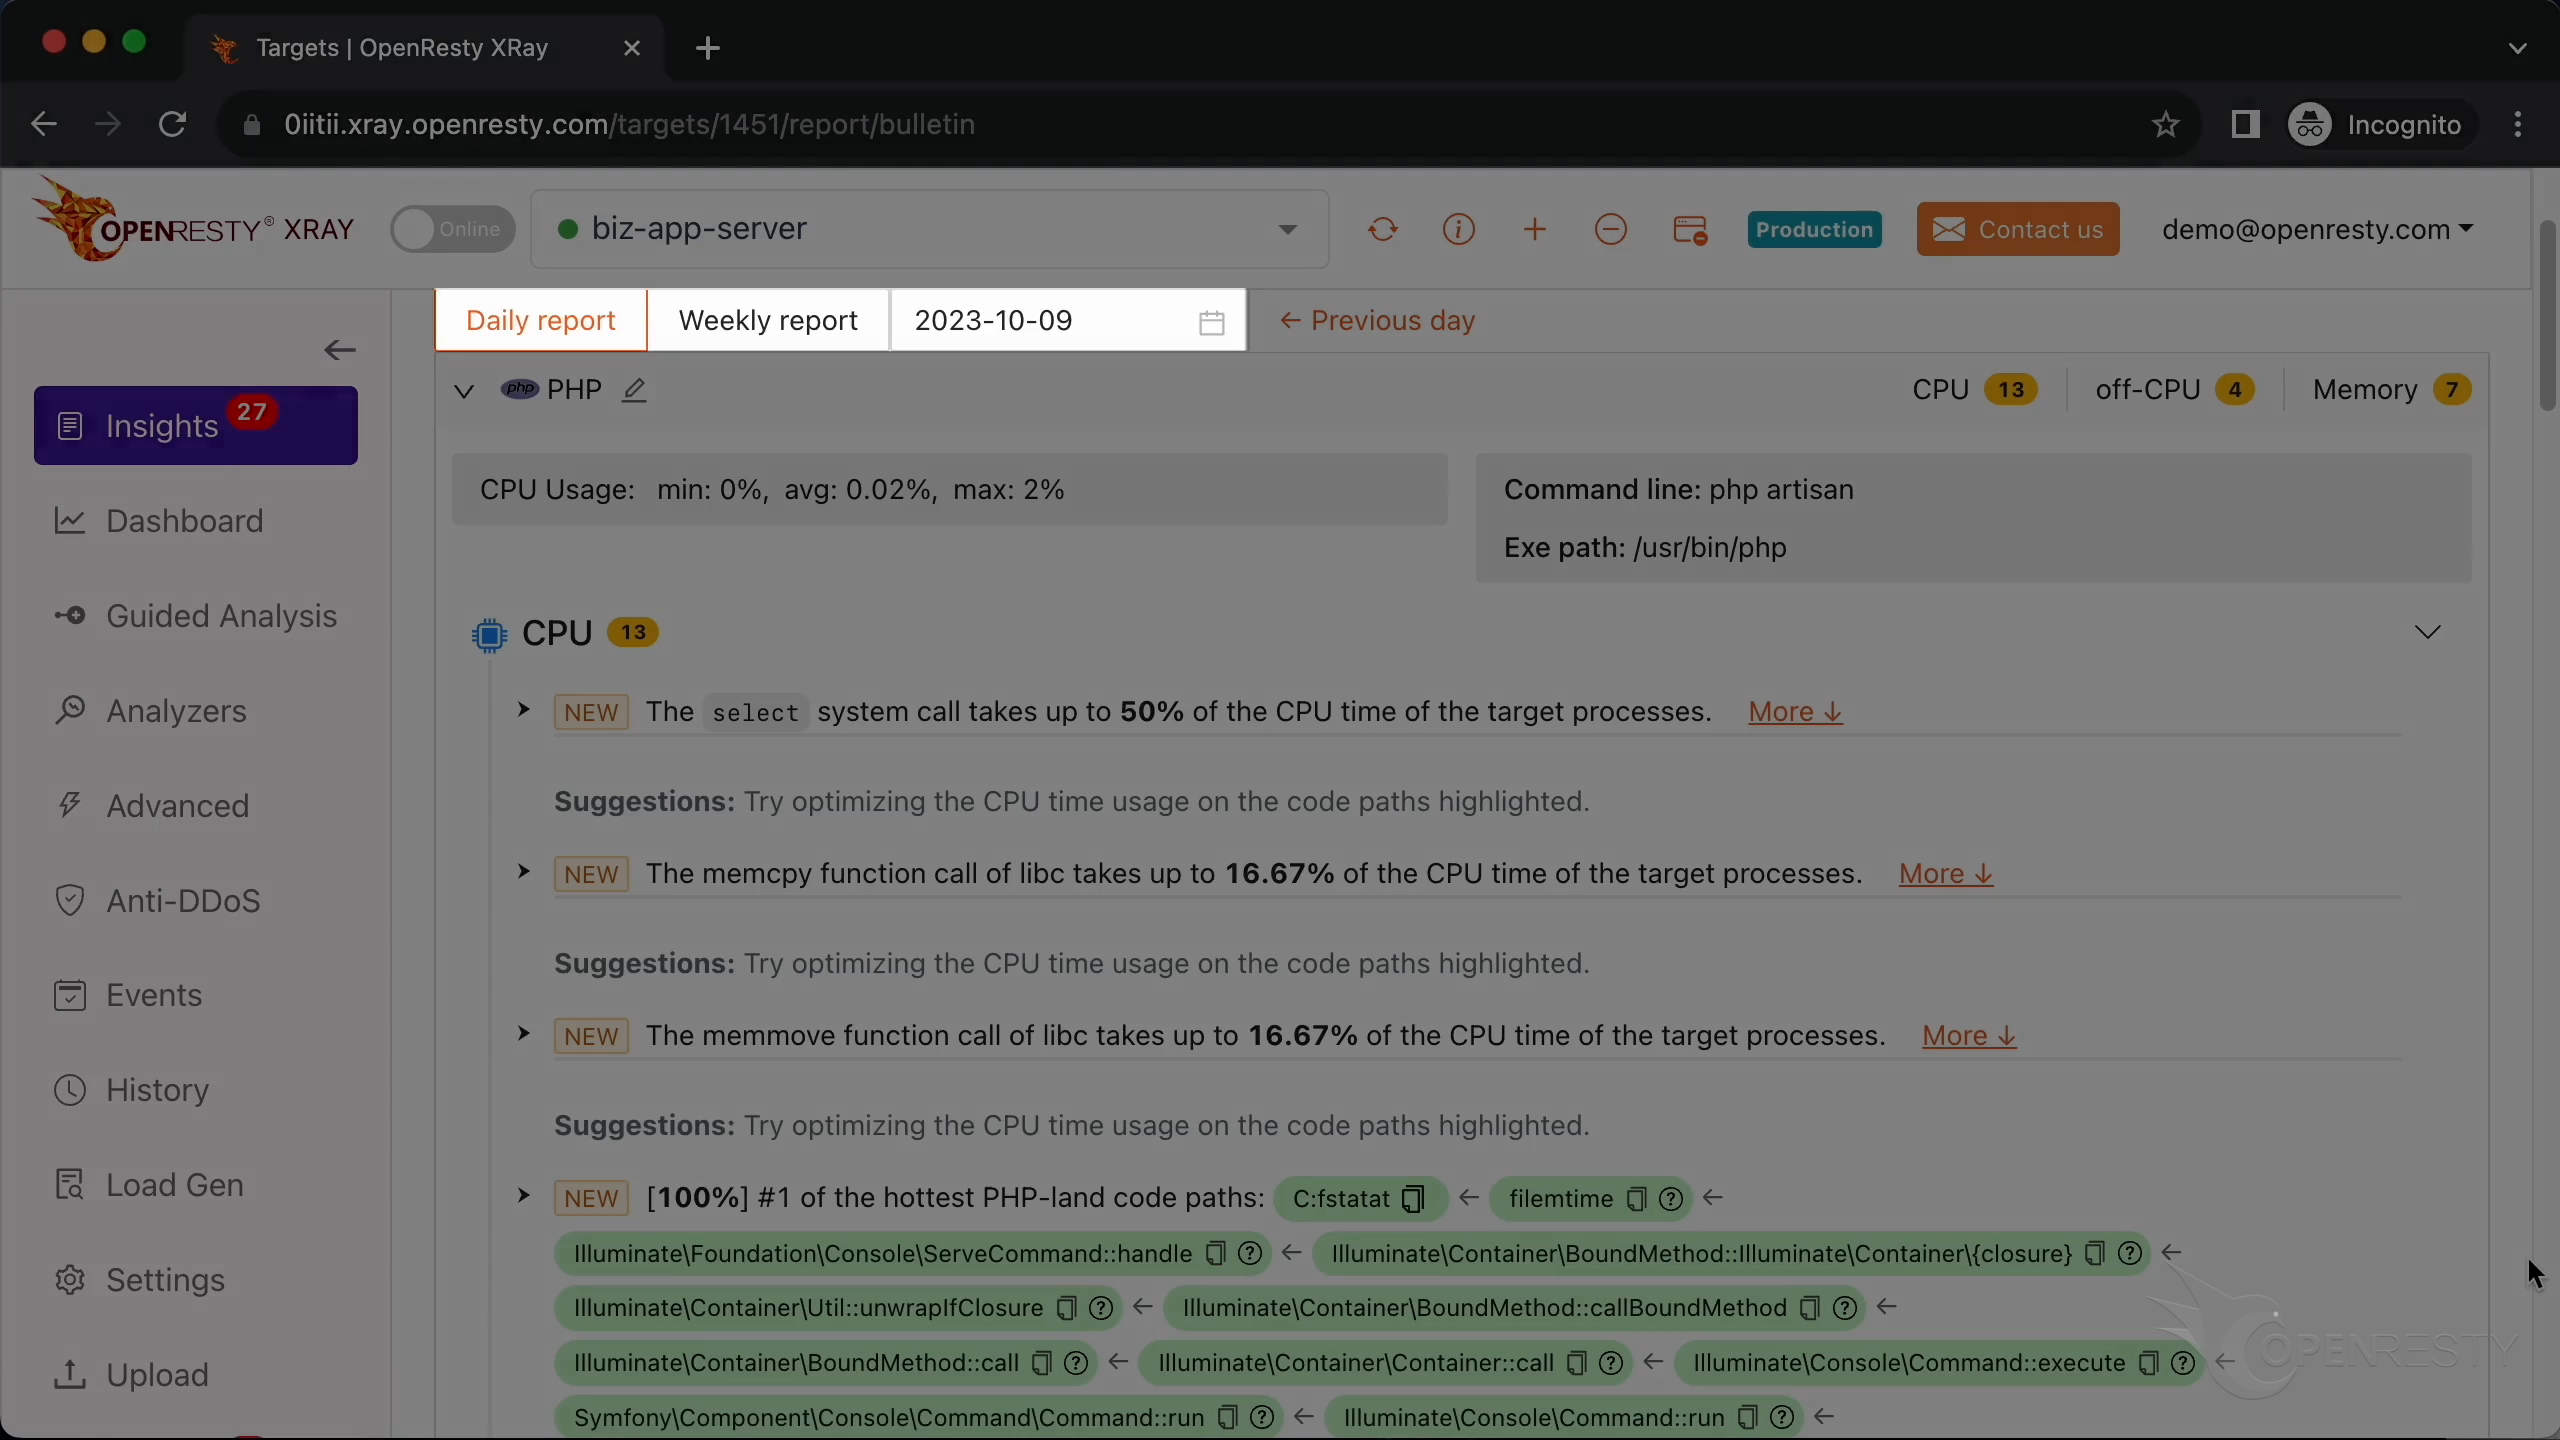
Automatic CPU Usage Analysis and Reports
OpenResty XRay can also monitor online processes automatically, without any manual steps. The “Insights” page collects daily and weekly analysis reports for each application — the same CPU findings and hottest-code-path breakdowns shown above — so in day-to-day operation you don’t need to run “Guided Analysis” at all. Guided Analysis remains handy during development and for on-demand deep dives like this one.
Laravel High CPU Usage FAQ
Do Laravel service providers run on every request?
Yes. In a standard Laravel setup, a new application instance is created on every request, so the service providers are both registered and booted each time. In the profile above, register (14.5% CPU) and bootProvider (36.4% CPU) run per request — together over half the CPU — before any of your route logic executes. This per-request bootstrap is the dominant cost in a Laravel high CPU usage scenario.
Can Laravel Octane reduce this CPU overhead?
The high cost measured here comes from repeating service-provider registration and booting on every single request. A long-running setup such as Laravel Octane keeps the application resident in memory instead of rebuilding it per request, so that bootstrap work is not paid again and again. If your Laravel high CPU usage is dominated by the register and bootProvider paths, this is the overhead such a setup targets.
How do I find the hottest code paths in a Laravel app?
Use OpenResty XRay’s guided analysis on the running PHP process. It generates CPU flame graphs at both the C level (zend_execute and the PHP VM) and the PHP level (Laravel framework functions), then ranks the hottest paths by their share of CPU time — here bootProvider (36.4%), register (14.5%), and the route response (12.8%). This shows exactly which framework functions dominate CPU instead of guessing.
How much faster is OpenResty than Laravel for a hello world response?
In the throughput comparison above, this Laravel “hello world” app served 371 requests per second versus roughly 28,000 for an equivalent OpenResty handler — about a 75x gap. The comparison is not apples-to-apples, since Laravel is a full-stack framework while OpenResty carries far less per-request abstraction, but it illustrates how much the framework bootstrap overhead costs in practice.
What is OpenResty XRay
OpenResty XRay is a dynamic-tracing product that automatically analyzes your running applications to troubleshoot performance problems, behavioral issues, and security vulnerabilities with actionable suggestions. Under the hood, OpenResty XRay is powered by our Y language targeting various runtimes like Stap+, eBPF+, GDB, and ODB, depending on the contexts.
If you like this tutorial, please subscribe to this blog site and/or our YouTube channel. Thank you!
About The Author
Yichun Zhang (Github handle: agentzh), is the original creator of the OpenResty® open-source project and the CEO of OpenResty Inc..
Yichun is one of the earliest advocates and leaders of “open-source technology”. He worked at many internationally renowned tech companies, such as Cloudflare, Yahoo!. He is a pioneer of “edge computing”, “dynamic tracing” and “machine coding”, with over 22 years of programming and 16 years of open source experience. Yichun is well-known in the open-source space as the project leader of OpenResty®, adopted by more than 40 million global website domains.
OpenResty Inc., the enterprise software start-up founded by Yichun in 2017, has customers from some of the biggest companies in the world. Its flagship product, OpenResty XRay, is a non-invasive profiling and troubleshooting tool that significantly enhances and utilizes dynamic tracing technology. And its OpenResty Edge product is a powerful distributed traffic management and private CDN software product.
As an avid open-source contributor, Yichun has contributed more than a million lines of code to numerous open-source projects, including Linux kernel, Nginx, LuaJIT, GDB, SystemTap, LLVM, Perl, etc. He has also authored more than 60 open-source software libraries.
Related Articles
OpenResty XRay Aug 4, 2024

OpenResty XRay May 11, 2024

OpenResty XRay Feb 27, 2024

OpenResty XRay Dec 1, 2023

OpenResty XRay Sep 5, 2024