Memory and CPU usage statistics among Kong plugins online (using OpenResty XRay)
OpenResty XRay is a dynamic-tracing product that lets you analyze online applications without modifying them. It is very efficient and safe to use. You can get deep insights into any running processes at any time, like taking an X-ray image of your software.
One of the applications that OpenResty XRay supports is Kong, a popular API gateway software built on top of our open-source OpenResty framework. Kong has a flexible extension mechanism that allows you to use many plugins, including ones built by the community and yourself. But sometimes, these plugins can cause problems, such as CPU bottlenecks, high memory usage, or memory leaks. How can you find out which plugin is causing trouble and how much impact it has?
That’s where OpenResty XRay comes in handy. It can sample CPU and memory usage statistics among all the loaded plugins in any running Kong server instances. You don’t need to install any special plugins or build options for Kong. You just need to run OpenResty XRay and point it to your Kong process. It will do the magic for you.
In this article, we will show you how to use OpenResty XRay to analyze the CPU and memory usage of Kong plugins in a server process. We will also show you some examples of the results and explain what they mean.
CPU usage among all Kong plugins in a server process
OpenResty XRay can sample a Kong process for some time, from a few seconds to a couple of minutes, depending on how busy the process is. It will then show you how the CPU time is distributed across all the plugins currently loaded.
For example, here is a pie chart generated by OpenResty XRay for a Kong process:
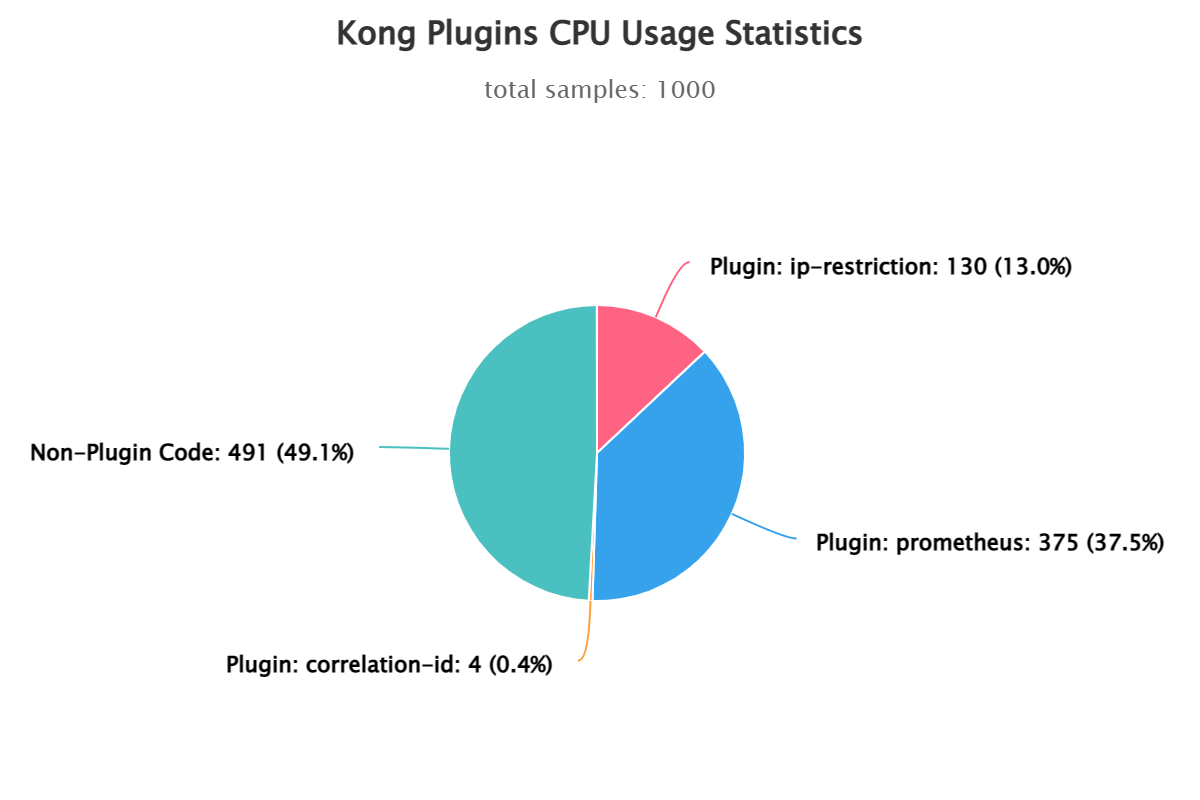
As you can see, the prometheus plugin takes most of the CPU time in this case, followed by the ip-restriction plugin. The other plugins have negligible CPU usage. This means that if you want to optimize the CPU performance of your Kong server, you should focus on these two plugins and see if they can be improved or replaced.
Of course, this is just one example. In more complex Kong servers, you may see more plugins show up here, and the distribution may vary depending on the traffic and configuration.
CPU usage inside a Kong plugin
OpenResty XRay can also help you drill down into the details of any Kong plugins and see which Lua or C code paths are consuming more CPU time. One easy way to do this is to look at the Lua-land CPU flame graphs like this:
This graph shows you the call stacks of the Lua code that are running on the CPU during the sampling period. The wider the bar, the more CPU time it takes. You can hover over any bar to see more information, such as the function name, file name, line number, and percentage of CPU time.
By looking at this graph, you can quickly spot any hot spots or performance issues in your Lua code and optimize them accordingly. You can also compare different plugins or different versions of the same plugin and see how they differ in terms of CPU usage.
Memory usage among all Kong plugins in a server process
Similarly, OpenResty XRay can sample the memory usage inside any Kong server processes with ease.
Below is another pie chart generated by OpenResty XRay for the same Kong process:
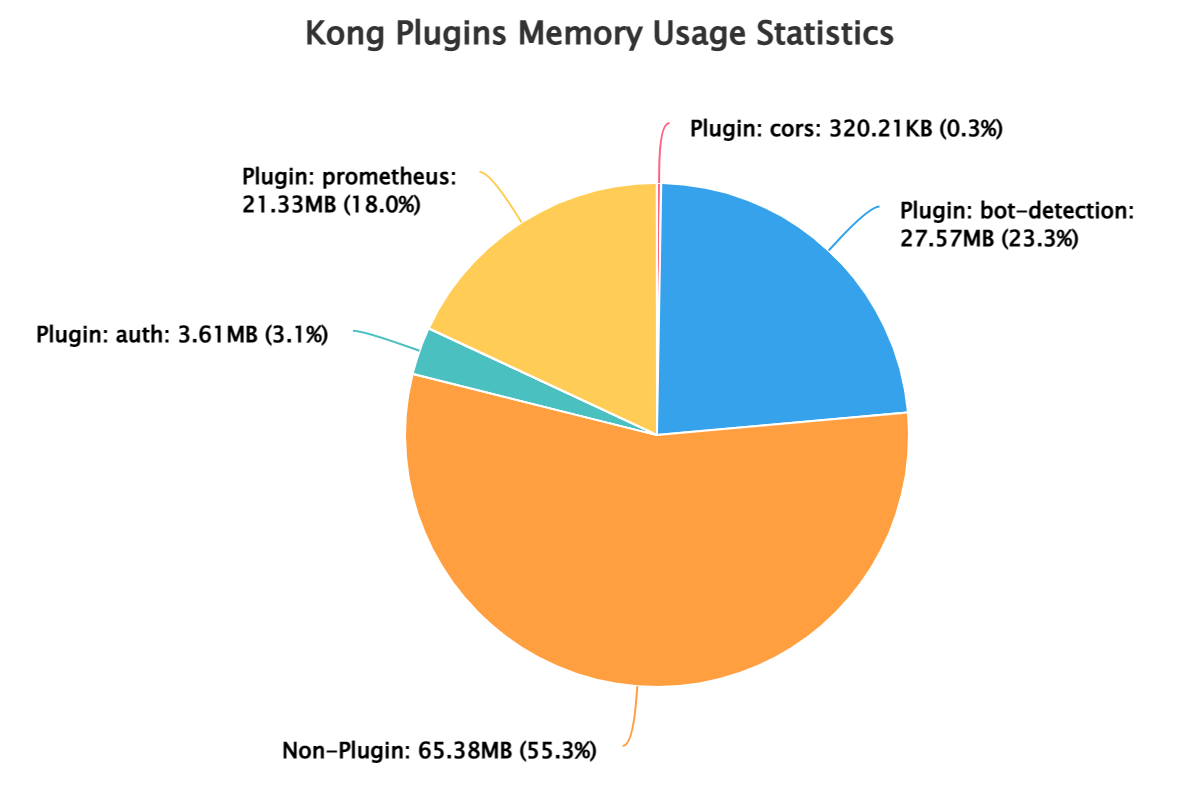
Here we can see that the bot-detection plugin takes most of the memory in this case, while the prometheus plugin comes next. The other plugins have much lower memory usage. This means that if you want to reduce the memory footprint of your Kong server, you should look into these two plugins and see if they can be optimized or replaced.
Again, this is just one example. In different Kong servers, you may see different results depending on the plugins and settings.
Memory usage inside a Kong plugin
OpenResty XRay can also help you analyze memory usage across all the Lua GC objects inside any of the Kong plugins. One easy way to do this is to look at the GC object reference flame graphs showing how memory is quantitatively distributed across all the GC object reference paths.
This graph shows you the reference paths of the Lua GC objects that are occupying memory during the sampling period. The wider the bar, the more memory it takes. You can hover over any bar to see more information, such as the object type, size, and percentage of memory.
By looking at this graph, you can quickly spot any memory leaks or inefficiencies in your Lua code and optimize them accordingly. You can also compare different plugins or different versions of the same plugin and see how they differ in terms of memory usage.
Extra overhead for the servers
You may wonder if using OpenResty XRay will affect the performance of your Kong servers. The answer is no. The extra overhead added to the Kong server processes when sampling is usually so small that it can be ignored. And when not sampling, the processes are running at absolute full speed.
OpenResty XRay is designed to be noninvasive and lightweight. It does not interfere with your normal operations or require any changes to your code or configuration.
What’s next?
We are not stopping here. We have more plans to make OpenResty XRay even more powerful and useful for you. Some of the features we are working on include:
- Showing real-time distribution of disk I/O, network I/O, and other resource metrics among Kong plugins. This will help you identify any bottlenecks or hotspots in your system and optimize them accordingly.
- Supporting other technical stacks and open-source software. We want to make OpenResty XRay a universal tool that can analyze any online applications, regardless of the underlying technologies. Some of the targets we have in mind are Nginx modules, Envoy extensions, PostgreSQL extensions, Perl/Python/Ruby modules and libraries, and many more.
If you have any suggestions or requests for more metrics or features, please let us know. We are always listening to your feedback and improving our product to meet your needs.
Conclusion
In this article, we showed you how to use OpenResty XRay to analyze the CPU and memory usage of Kong plugins in a server process. We also showed you some examples of the results and explained what they mean.
With OpenResty XRay, you can easily find out which plugins are consuming more resources than others and how much impact they have on your overall performance. You can then use this information to optimize your Kong servers and make them run faster and smoother.
If you want to learn more about OpenResty XRay and how it can help you with other aspects of your online applications, please visit our website or contact us for more details.
About The Author
Yichun Zhang (Github handle: agentzh), is the original creator of the OpenResty® open-source project and the CEO of OpenResty Inc..
Yichun is one of the earliest advocates and leaders of “open-source technology”. He worked at many internationally renowned tech companies, such as Cloudflare, Yahoo!. He is a pioneer of “edge computing”, “dynamic tracing” and “machine coding”, with over 22 years of programming and 16 years of open source experience. Yichun is well-known in the open-source space as the project leader of OpenResty®, adopted by more than 40 million global website domains.
OpenResty Inc., the enterprise software start-up founded by Yichun in 2017, has customers from some of the biggest companies in the world. Its flagship product, OpenResty XRay, is a non-invasive profiling and troubleshooting tool that significantly enhances and utilizes dynamic tracing technology. And its OpenResty Edge product is a powerful distributed traffic management and private CDN software product.
As an avid open-source contributor, Yichun has contributed more than a million lines of code to numerous open-source projects, including Linux kernel, Nginx, LuaJIT, GDB, SystemTap, LLVM, Perl, etc. He has also authored more than 60 open-source software libraries.
Related Articles
OpenResty XRay Jul 15, 2023

OpenResty XRay Aug 31, 2020

OpenResty XRay Jul 28, 2023
")
OpenResty XRay Feb 18, 2023

OpenResty XRay Jul 8, 2026


")
