Java Tomcat Slow Response Time: Pinpoint the Exact Slow Request with PCAP
To diagnose Tomcat slow response time, you need to catch the exact slow requests as they happen — not aggregated averages. OpenResty XRay does this by selectively capturing only requests that cross a duration threshold (for example, >250ms), attaching the full HTTP details and a per-request PCAP file — so you can tell whether the delay came from the server or the network.
Tomcat slow response time is usually caused by a mix of factors — thread pool contention, GC pauses, slow downstream calls, or the request logic itself. General monitoring dashboards show that latency exists, but not which request or which stage is responsible. That’s the gap this walkthrough fills: capture the exact slow request, then read the PCAP to see whether the delay is in the server or the network. If this slow Tomcat backend is what surfaces as a 504 Gateway Timeout at the OpenResty or Nginx proxy in front of it, this is the backend-side half of that diagnosis.
Request-level capture for Tomcat and Spring Boot
OpenResty XRay can now capture and analyze requests from Java applications using Tomcat. This feature allows us to precisely locate and capture problematic specific requests, not only for applications directly using Tomcat but also for frameworks with built-in Tomcat, such as Spring Boot. By capturing detailed information about these requests and corresponding PCAP packets, OpenResty XRay provides rich data support for in-depth analysis of Java Web application performance, becoming an ideal tool for solving complex performance issues.
To achieve this functionality, OpenResty XRay implements intelligent packet capture technology, making performance analysis more efficient and precise.
Selective packet capture: filter by duration, status, and path
OpenResty XRay provides intelligent packet capture functionality, which is a powerful and unique feature that greatly improves the efficiency and accuracy of performance analysis. Here are the main advantages and characteristics of intelligent packet capture:
Selective Capture: OpenResty XRay can capture and analyze network packets only on TCP connections we’re interested in. By capturing only relevant network traffic, OpenResty XRay effectively reduces noise in the analysis process, making problem localization more accurate and rapid. OpenResty XRay offers various flexible filtering conditions, allowing you to precisely target the requests you need to analyze. The main filtering conditions include but are not limited to: - Hostname (Host) - Request port - URL path - Request response time threshold (milliseconds) - Response status code …
Resource Efficiency: Selective capture greatly reduces storage and processing overhead, making long-term continuous monitoring possible, even in high-traffic production environments.
Detailed Request Information: You can obtain detailed information for each request, including but not limited to: - Hostname (Host) - URL path - URI parameters - Request method (GET, POST, etc.) - Request protocol (HTTP/1.1, HTTP/2, etc.) - Request timestamp - Request processing time
This detailed information allows you to comprehensively understand the characteristics and performance of each request.
- PCAP Packet Capture Functionality: In addition to basic request information, OpenResty XRay can generate corresponding PCAP (Packet Capture) files for each captured request. This feature allows you to conduct more in-depth network-level analysis, helping to troubleshoot complex performance issues and network anomalies.
Through these features, OpenResty XRay’s intelligent packet capture functionality provides powerful support for performance analysis, making problem localization and resolution more efficient and precise.
Walkthrough: pinpoint the exact slow request with PCAP
To better demonstrate OpenResty XRay’s capabilities in analyzing request latency for Tomcat applications, let’s look at a specific example of how to use OpenResty XRay to analyze request latency issues.
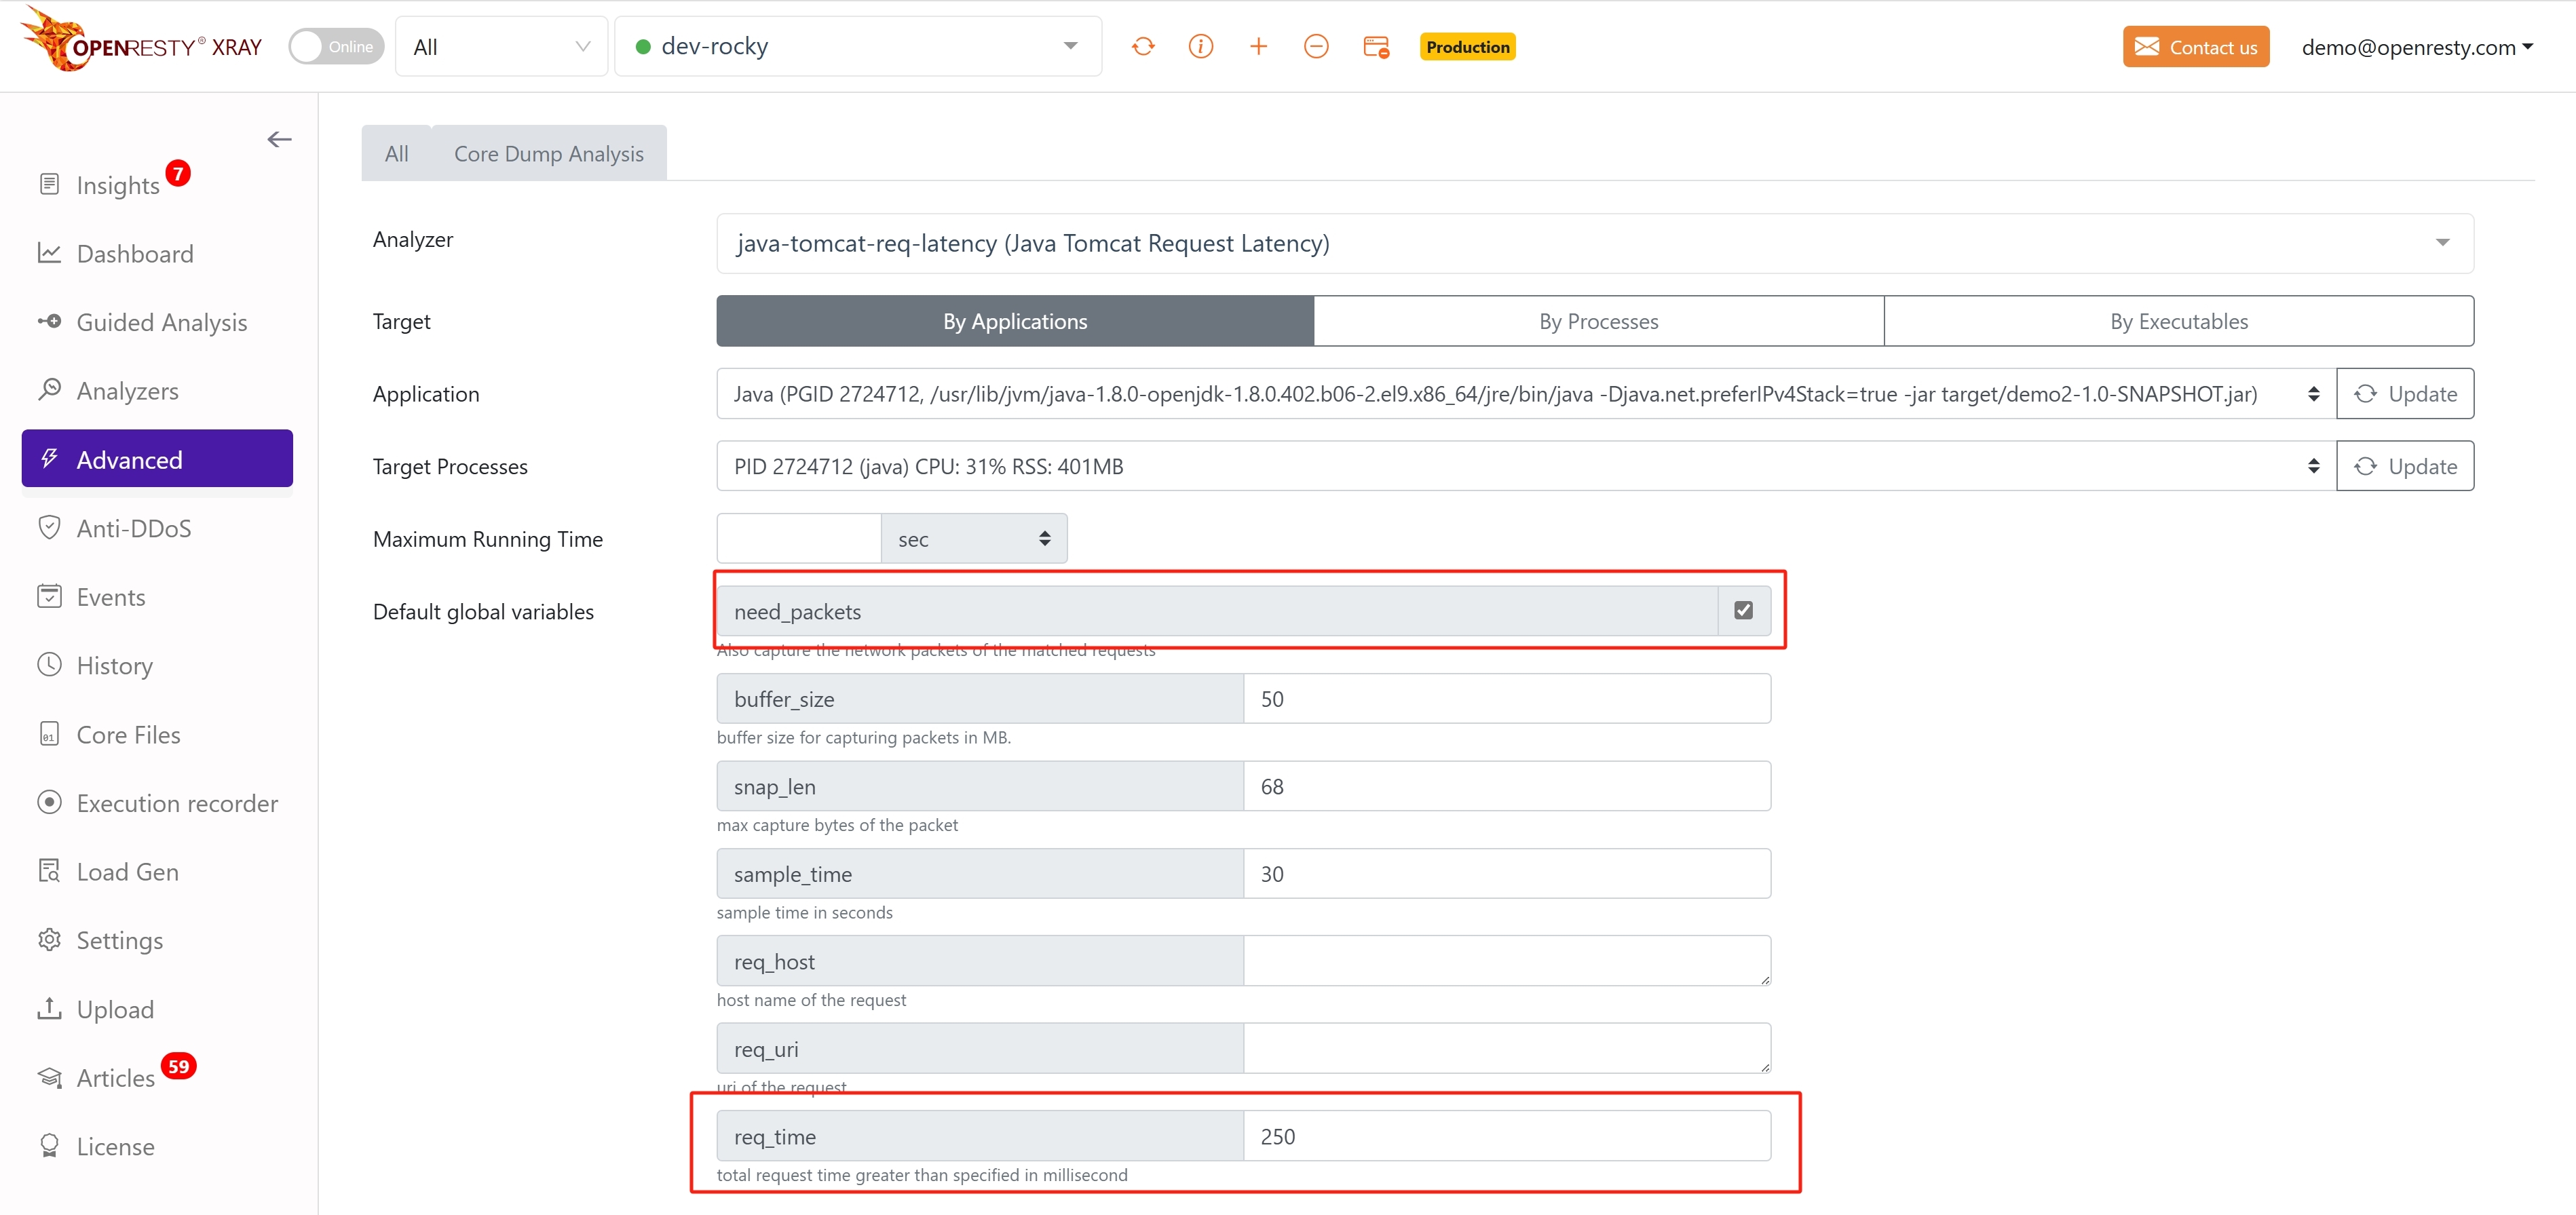
- First, we start the OpenResty XRay analyzer, enabling the option to capture PCAP packets. We can also set some filtering conditions to help us screen requests, such as setting the filter condition to requests with a duration greater than 250ms.
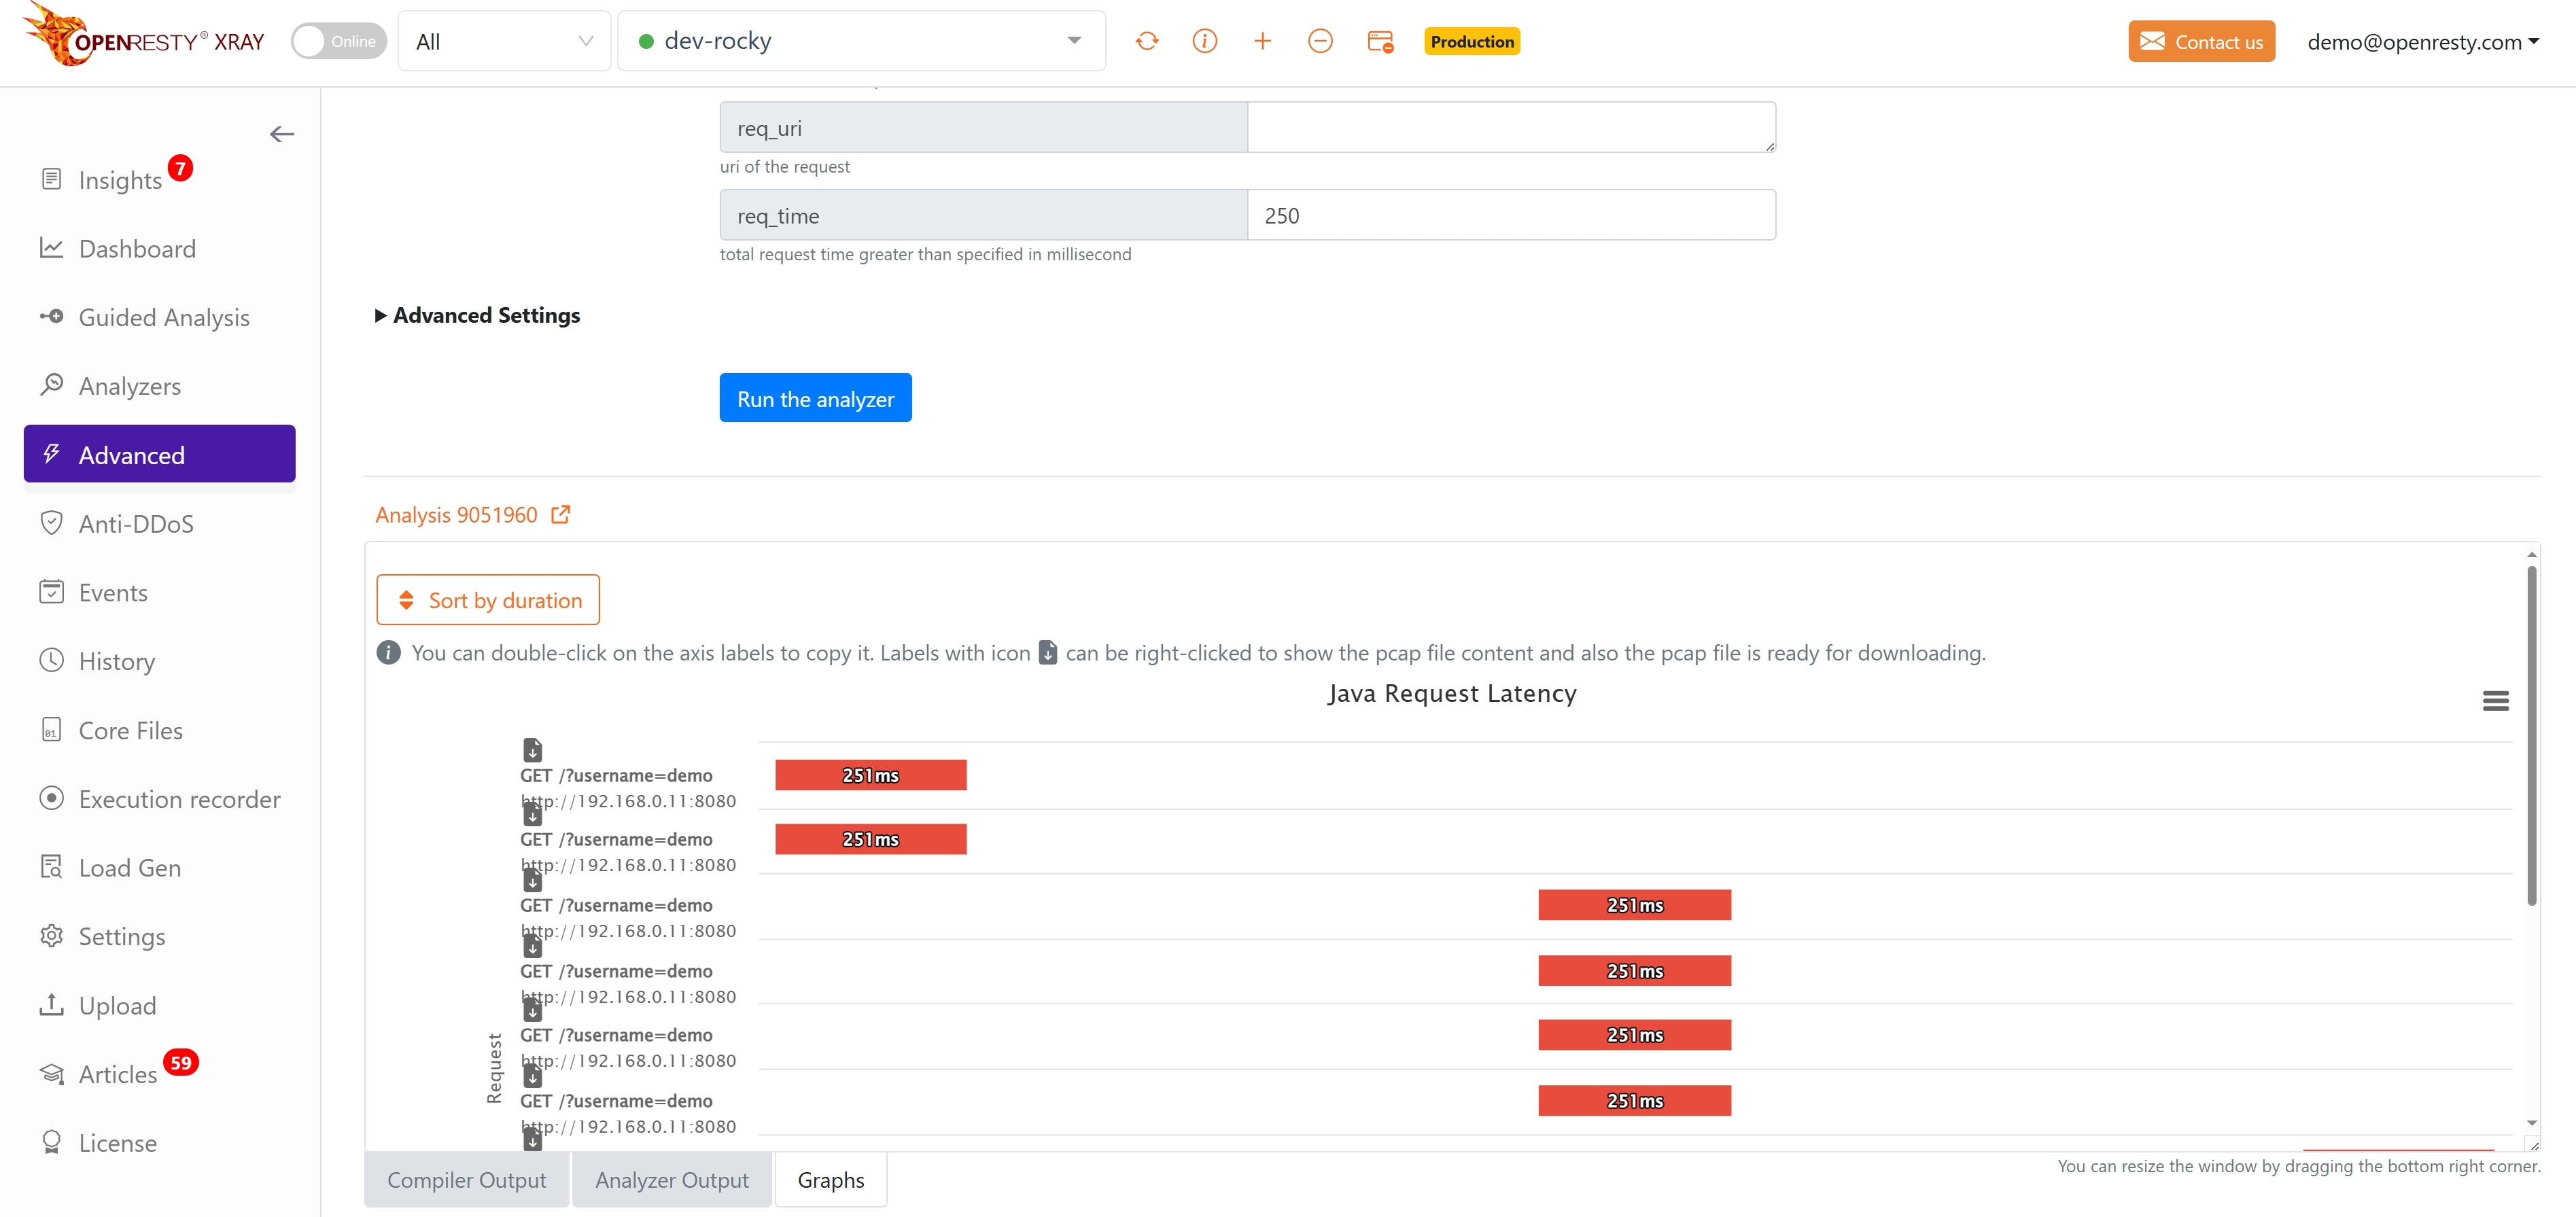
- After running the analyzer, we quickly capture some problematic requests. On the OpenResty XRay interface, we can clearly see detailed information about these requests.
- For each captured request, we can view the following key information: - Request URL path - HTTP protocol version used - Request parameters - Exact request processing time
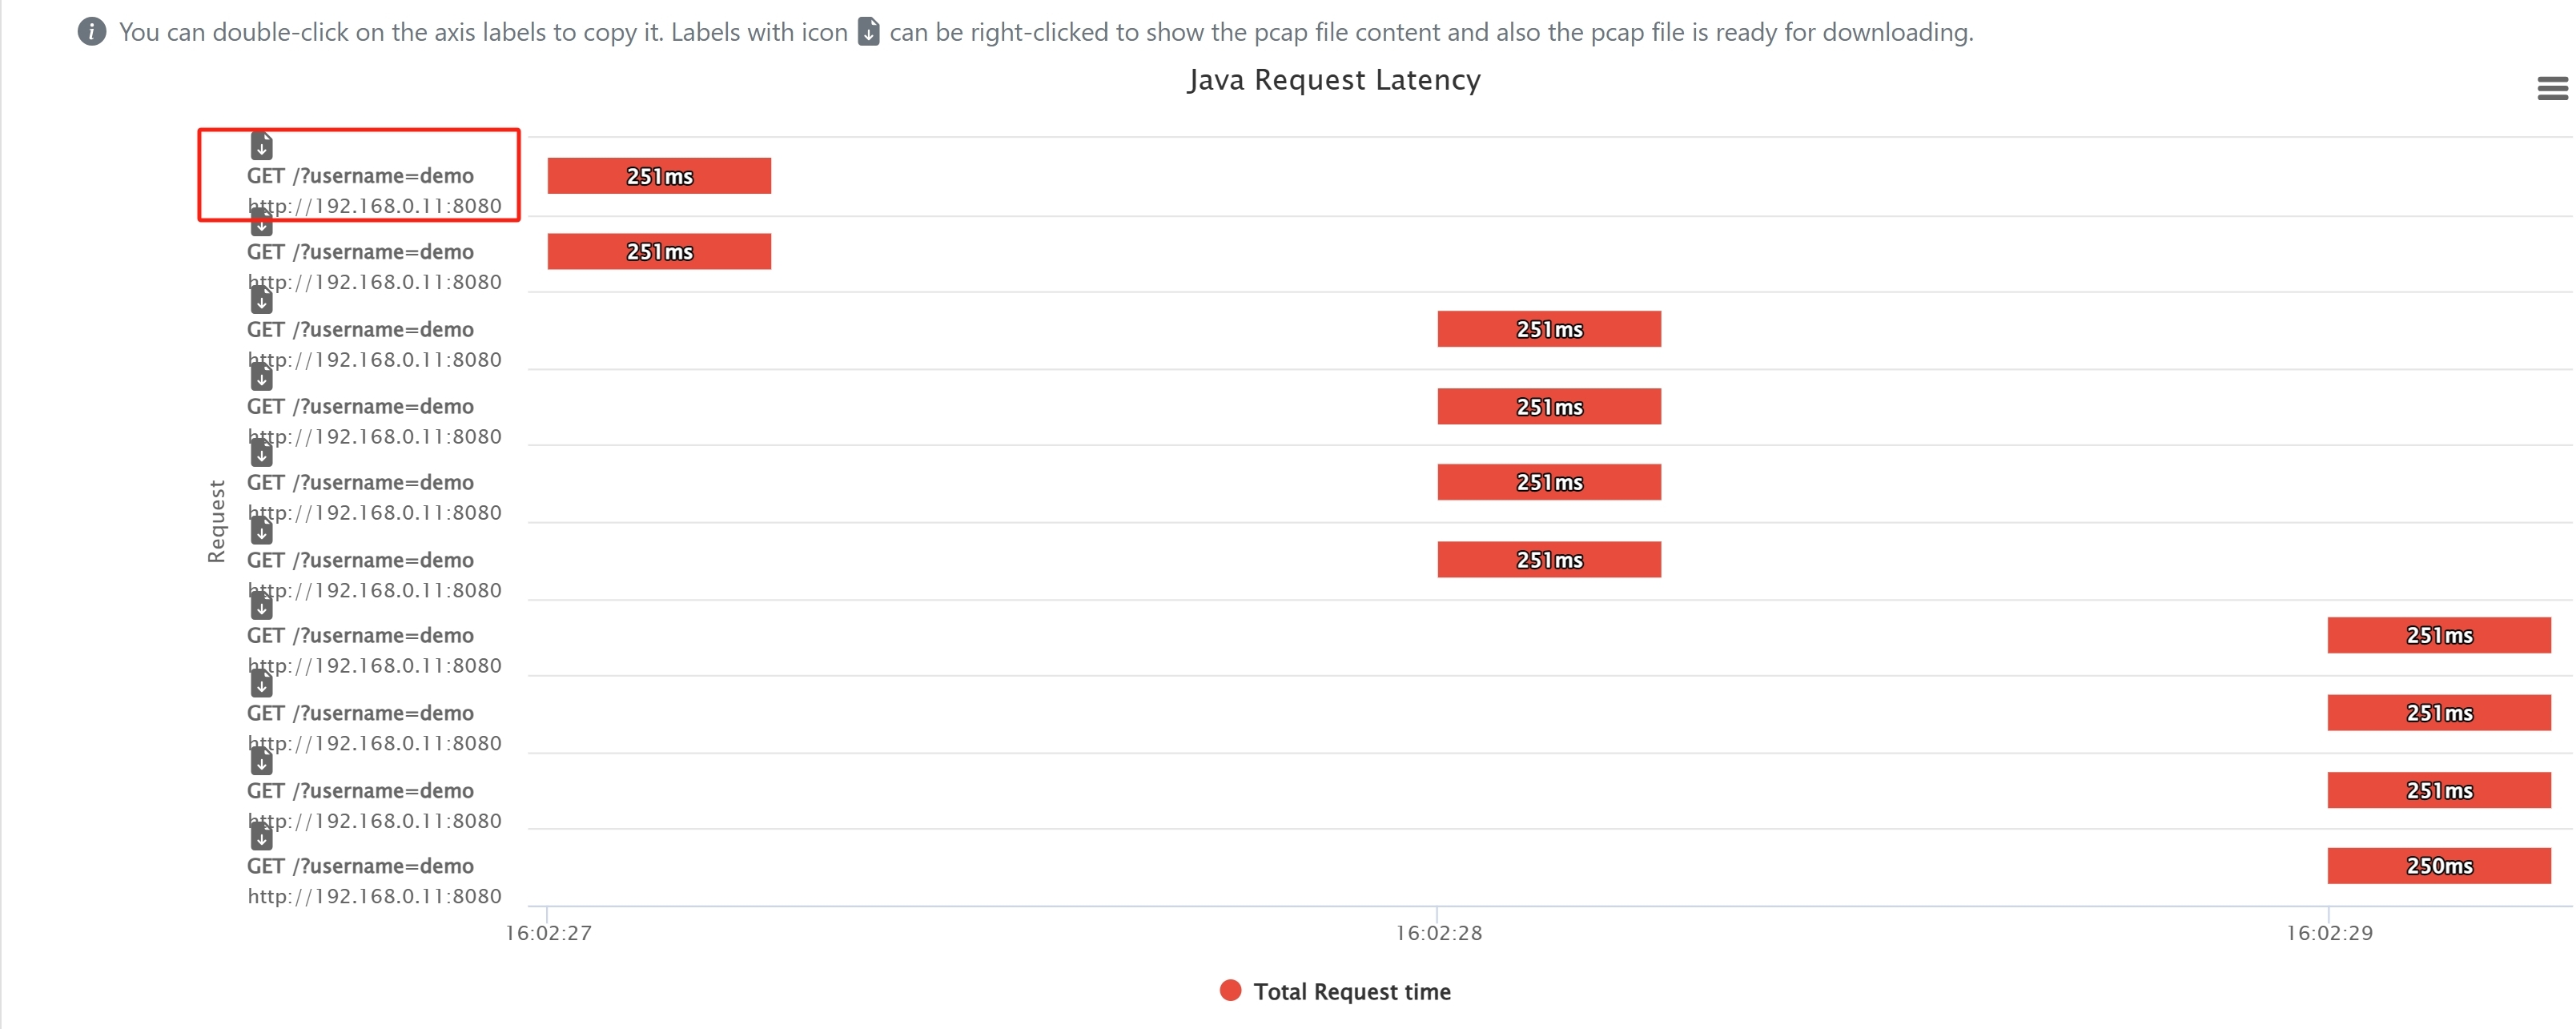
- OpenResty XRay also provides the functionality to obtain the corresponding PCAP packet for each request. Simply right-click on the request information to download the PCAP file for that request.
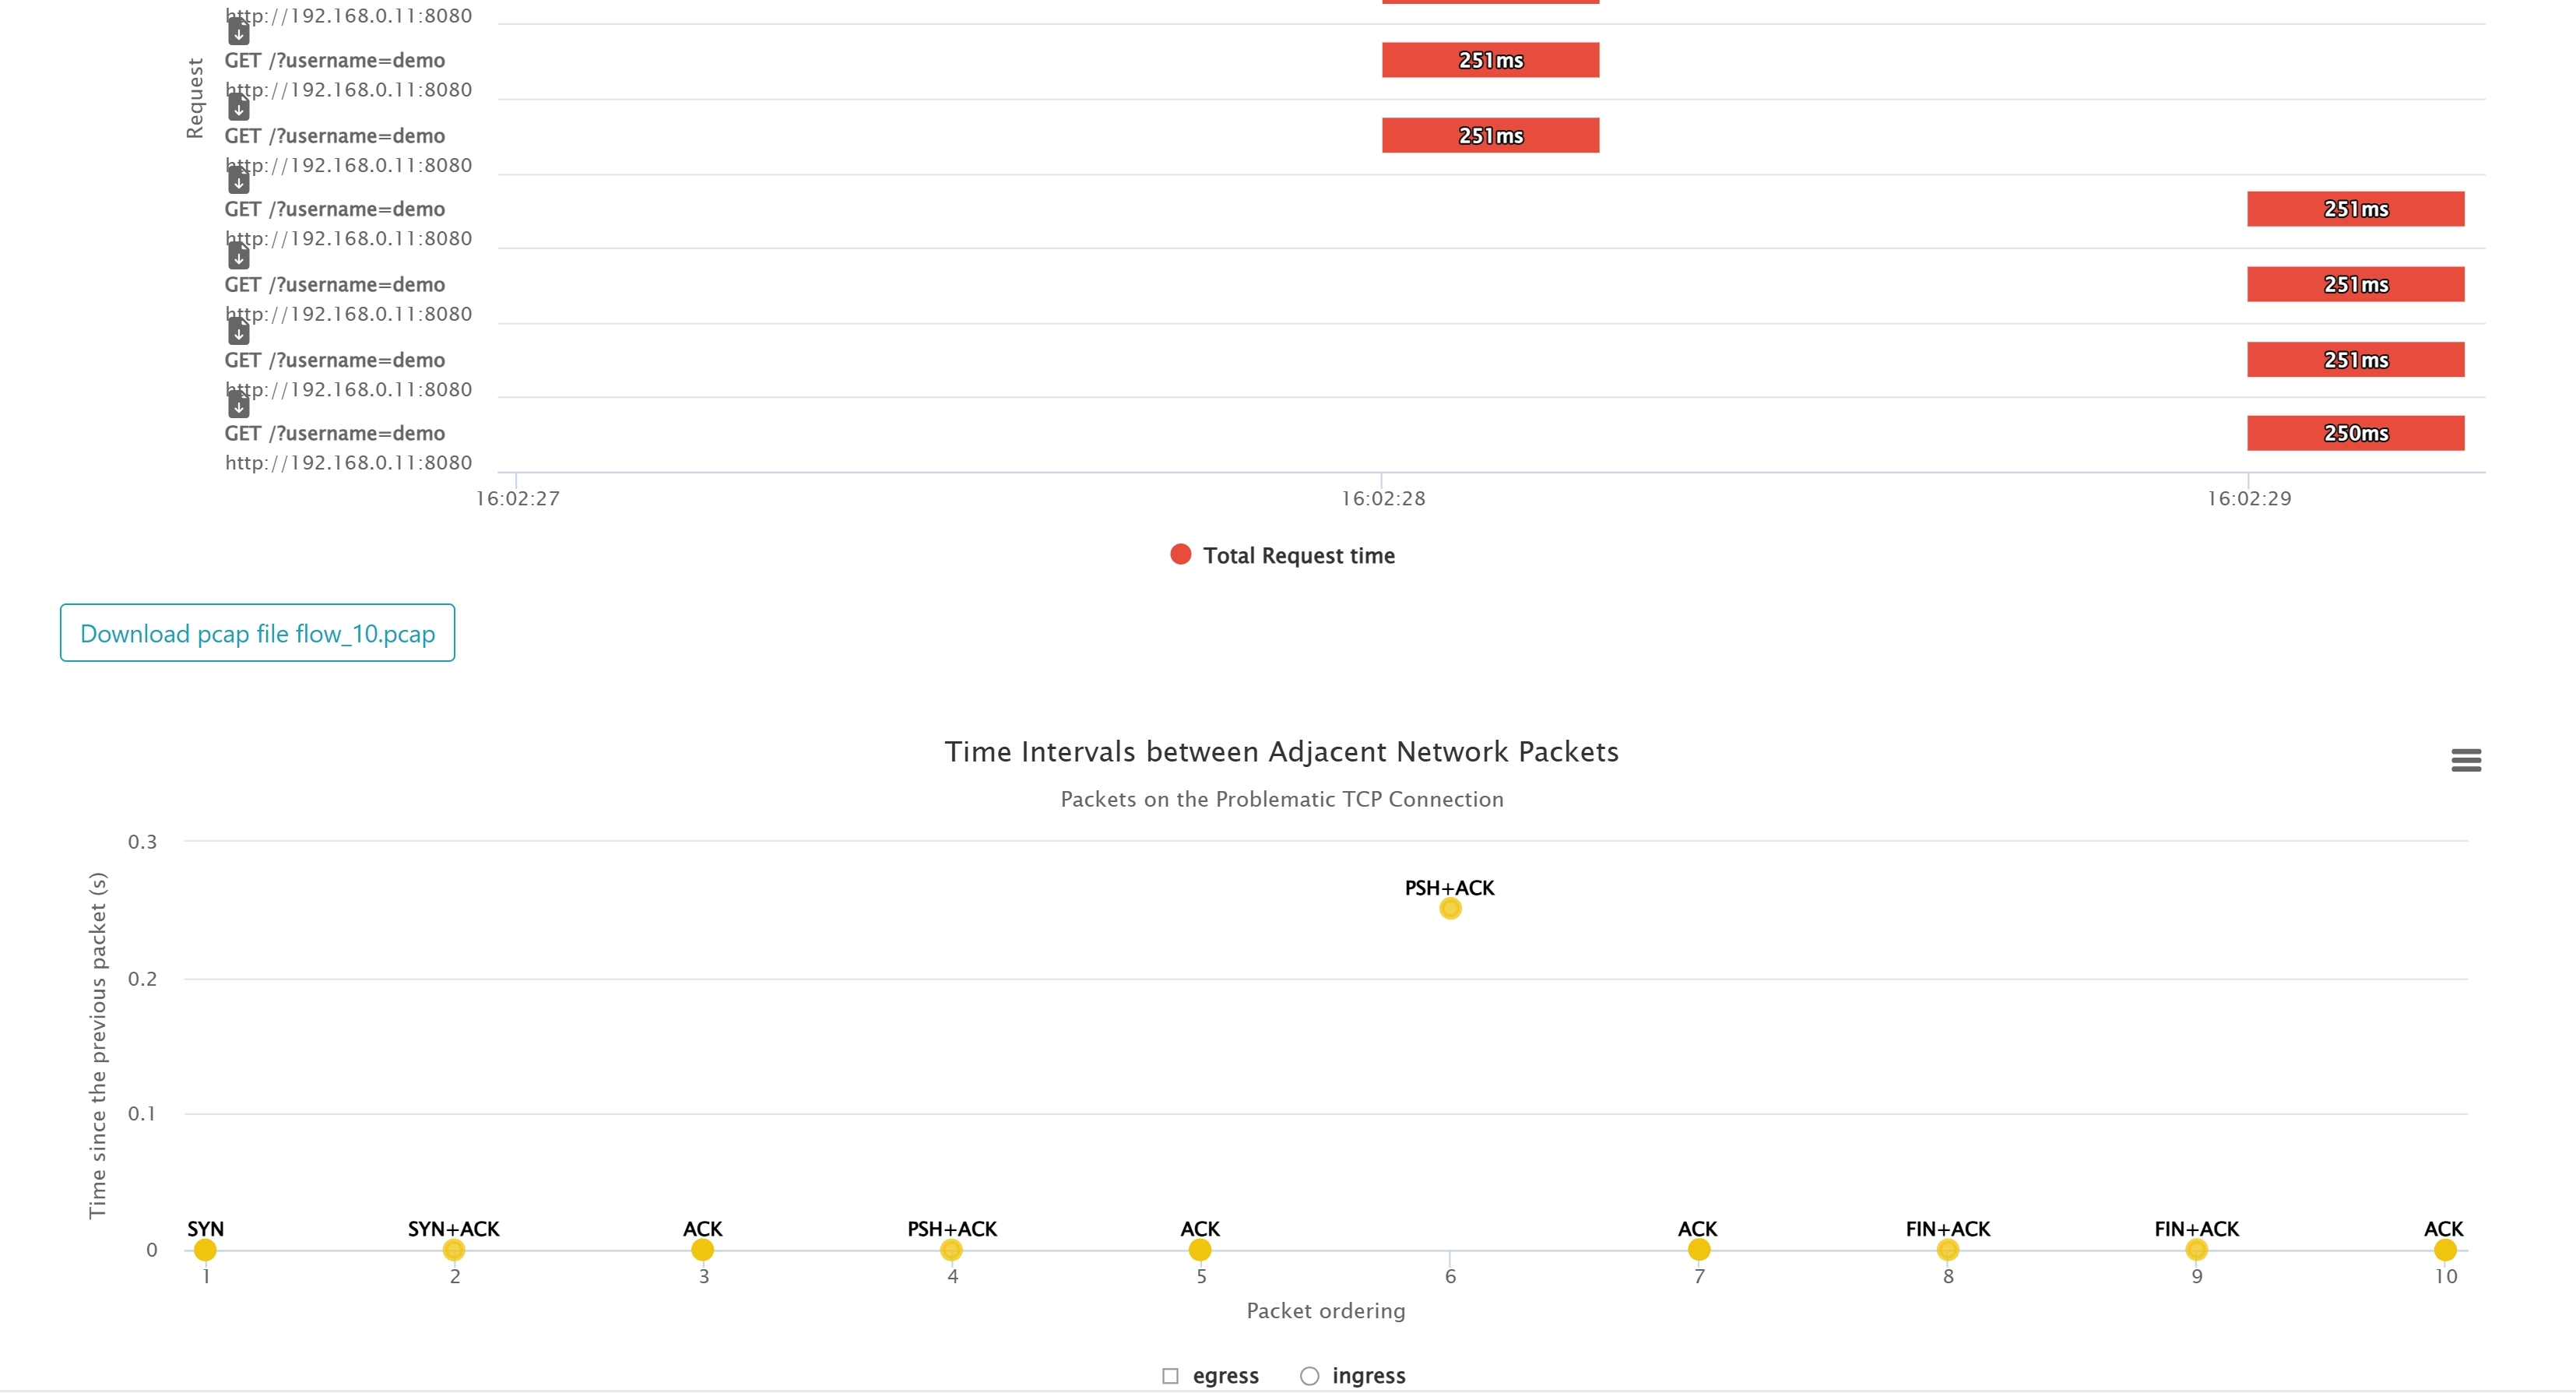
Server-side vs network delay: reading the captured PCAP
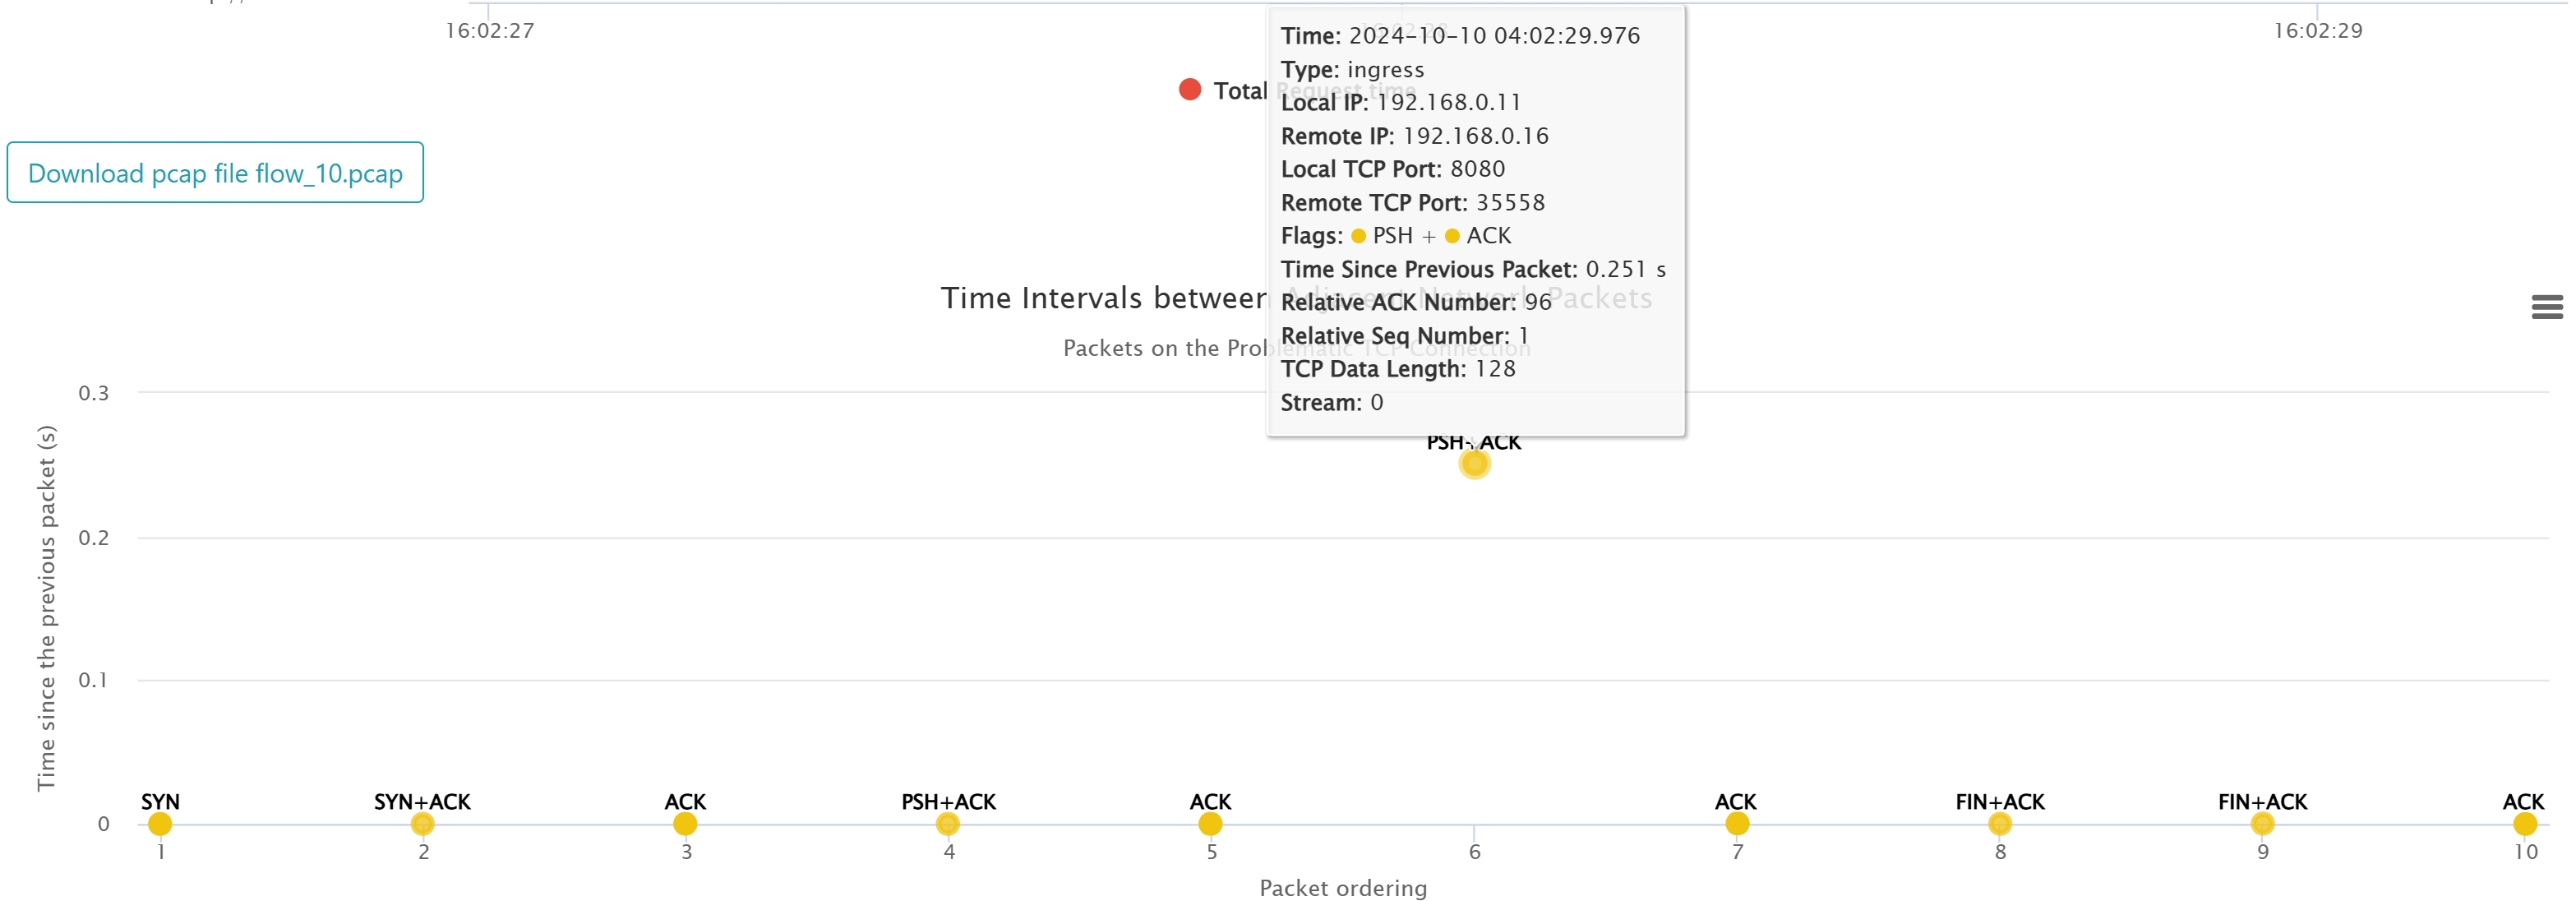
In this graph, the horizontal axis represents the sequence number of data packets (starting from 1), and the vertical axis represents the time interval between adjacent data packets (in seconds). Each data point is labeled with the corresponding TCP flags (such as SYN, ACK, PSH+ACK, FIN+ACK, etc.) to identify the packet type.
In this example, the server IP is 192.168.0.11:8080, and the client IP is 192.168.0.16:35558. From the chart, we can clearly see that there is a significant delay in the PSH+ACK packet sent from the server to the client. This indicates that the delay is likely caused by the server, such as prolonged server processing time or other issues.
By analyzing network packet capture results in this way, we can quickly locate the source of latency, providing clear direction for further performance optimization.
Conclusion
OpenResty XRay provides powerful request latency analysis capabilities for Tomcat Java applications. Flexible filtering conditions, detailed request information capture, and PCAP packet analysis enable developers and operations personnel to quickly locate and resolve performance bottlenecks. Whether you are in a development or production environment, OpenResty XRay is a reliable performance analysis tool.
For the full Java application performance analysis workflow across CPU, memory, and I/O with OpenResty XRay, see our overview guide Using OpenResty XRay to Analyze Java Applications. For an Nginx-specific case where smart packet capture traced a 200ms delay to the client app, see TCP Packet Capture on Slow Connections.
FAQ
How do I find slow requests in Tomcat?
Set a request-duration threshold in OpenResty XRay’s selective packet capture (for example, >250ms). The analyzer only captures requests that cross the threshold, along with the URL path, HTTP method, protocol version, query parameters, and exact processing time — so you can immediately see which endpoints are slow instead of hunting through logs.
Can I capture the raw packets for one specific slow request?
Yes. OpenResty XRay generates a PCAP file for every captured request. Right-click a request in the captured list to download its PCAP, then open it in your usual analyzer to inspect the exact packet sequence and timing for that single request — without capturing traffic from unrelated connections.
How do I tell if the latency is server-side or on the network?
Plot the interval between adjacent TCP packets from the captured PCAP, labeled with their TCP flags (SYN, ACK, PSH+ACK, FIN+ACK). A large gap before a PSH+ACK sent from the server points to server-side latency — for example, prolonged request processing. A large gap between client packets or ACKs points to network delay.
Does this work for Spring Boot apps?
Yes. The capture applies to Java web applications running on Tomcat, including frameworks that embed Tomcat such as Spring Boot. The same duration filter, per-request detail, and PCAP download flow work identically.
Automated Sampling and Expert Analysis
OpenResty XRay not only provides powerful analysis functions but also has automated sampling and report generation capabilities. This brings more convenience to your performance optimization work:
Automatic Online On-Demand Sampling: XRay can automatically trigger sampling based on preset conditions, without manual intervention. This means you can automatically start collecting data when specific load or performance indicators reach a certain threshold, ensuring that the most critical performance issues are captured.
Automatic Generation of Analysis Reports: Based on the collected data, XRay can automatically generate detailed analysis reports. These reports contain key information such as performance hotspots, resource usage, potential optimization suggestions, etc., allowing you to quickly understand the performance status of your application.
Expert Team Support: In addition to automated features, our expert team is always ready to provide more in-depth support: - We can customize new analyzers for you based on your specific needs to meet specific performance monitoring requirements. - Our experts will assist you in interpreting automatically generated reports, providing professional insights and optimization suggestions. - When encountering complex performance issues, our team can provide more in-depth analysis and solutions.
By combining automated tools and expert support, OpenResty XRay provides you with a comprehensive performance optimization solution, helping your Java applications maintain optimal performance at all times.
If you want to learn more about the OpenResty XRay product and how it can help you optimize Java application performance, please visit our website or contact us for more details.
What is OpenResty XRay
OpenResty XRay is a dynamic-tracing product that automatically analyzes your running applications to troubleshoot performance problems, behavioral issues, and security vulnerabilities with actionable suggestions. Under the hood, OpenResty XRay is powered by our Y language targeting various runtimes like Stap+, eBPF+, GDB, and ODB, depending on the contexts.
If you like this tutorial, please subscribe to this blog site and/or our YouTube channel. Thank you!
About the Author
Yichun Zhang (Github handle: agentzh), is the original creator of the OpenResty® open-source project and the CEO of OpenResty Inc..
Yichun is one of the earliest advocates and leaders of “open-source technology”. He worked at many internationally renowned tech companies, such as Cloudflare, Yahoo!. He is a pioneer of “edge computing”, “dynamic tracing” and “machine coding”, with over 22 years of programming and 16 years of open source experience. Yichun is well-known in the open-source space as the project leader of OpenResty®, adopted by more than 40 million global website domains.
OpenResty Inc., the enterprise software start-up founded by Yichun in 2017, has customers from some of the biggest companies in the world. Its flagship product, OpenResty XRay, is a non-invasive profiling and troubleshooting tool that significantly enhances and utilizes dynamic tracing technology. And its OpenResty Edge product is a powerful distributed traffic management and private CDN software product.
As an avid open-source contributor, Yichun has contributed more than a million lines of code to numerous open-source projects, including Linux kernel, Nginx, LuaJIT, GDB, SystemTap, LLVM, Perl, etc. He has also authored more than 60 open-source software libraries.
Related Articles
OpenResty XRay Aug 27, 2026

OpenResty XRay Sep 20, 2024

OpenResty XRay Aug 27, 2026

OpenResty XRay Nov 10, 2025

OpenResty XRay Oct 10, 2025