Pinpointing the Hottest Go Code Paths with High Disk I/O (using OpenResty XRay)
In this tutorial, you will learn how to use OpenResty XRay to quantitatively analyze high disk I/O issues in an online Go (golang) application. With the Go-level disk read/write count, latency, and throughput flame graphs generated by OpenResty XRay, you can identify the Go code paths with the most significant disk latency and read/write volume. Plus, it offers precise line-by-line code insights to locate the problem’s root cause swiftly and guide optimizations.
Problem: high disk I/O
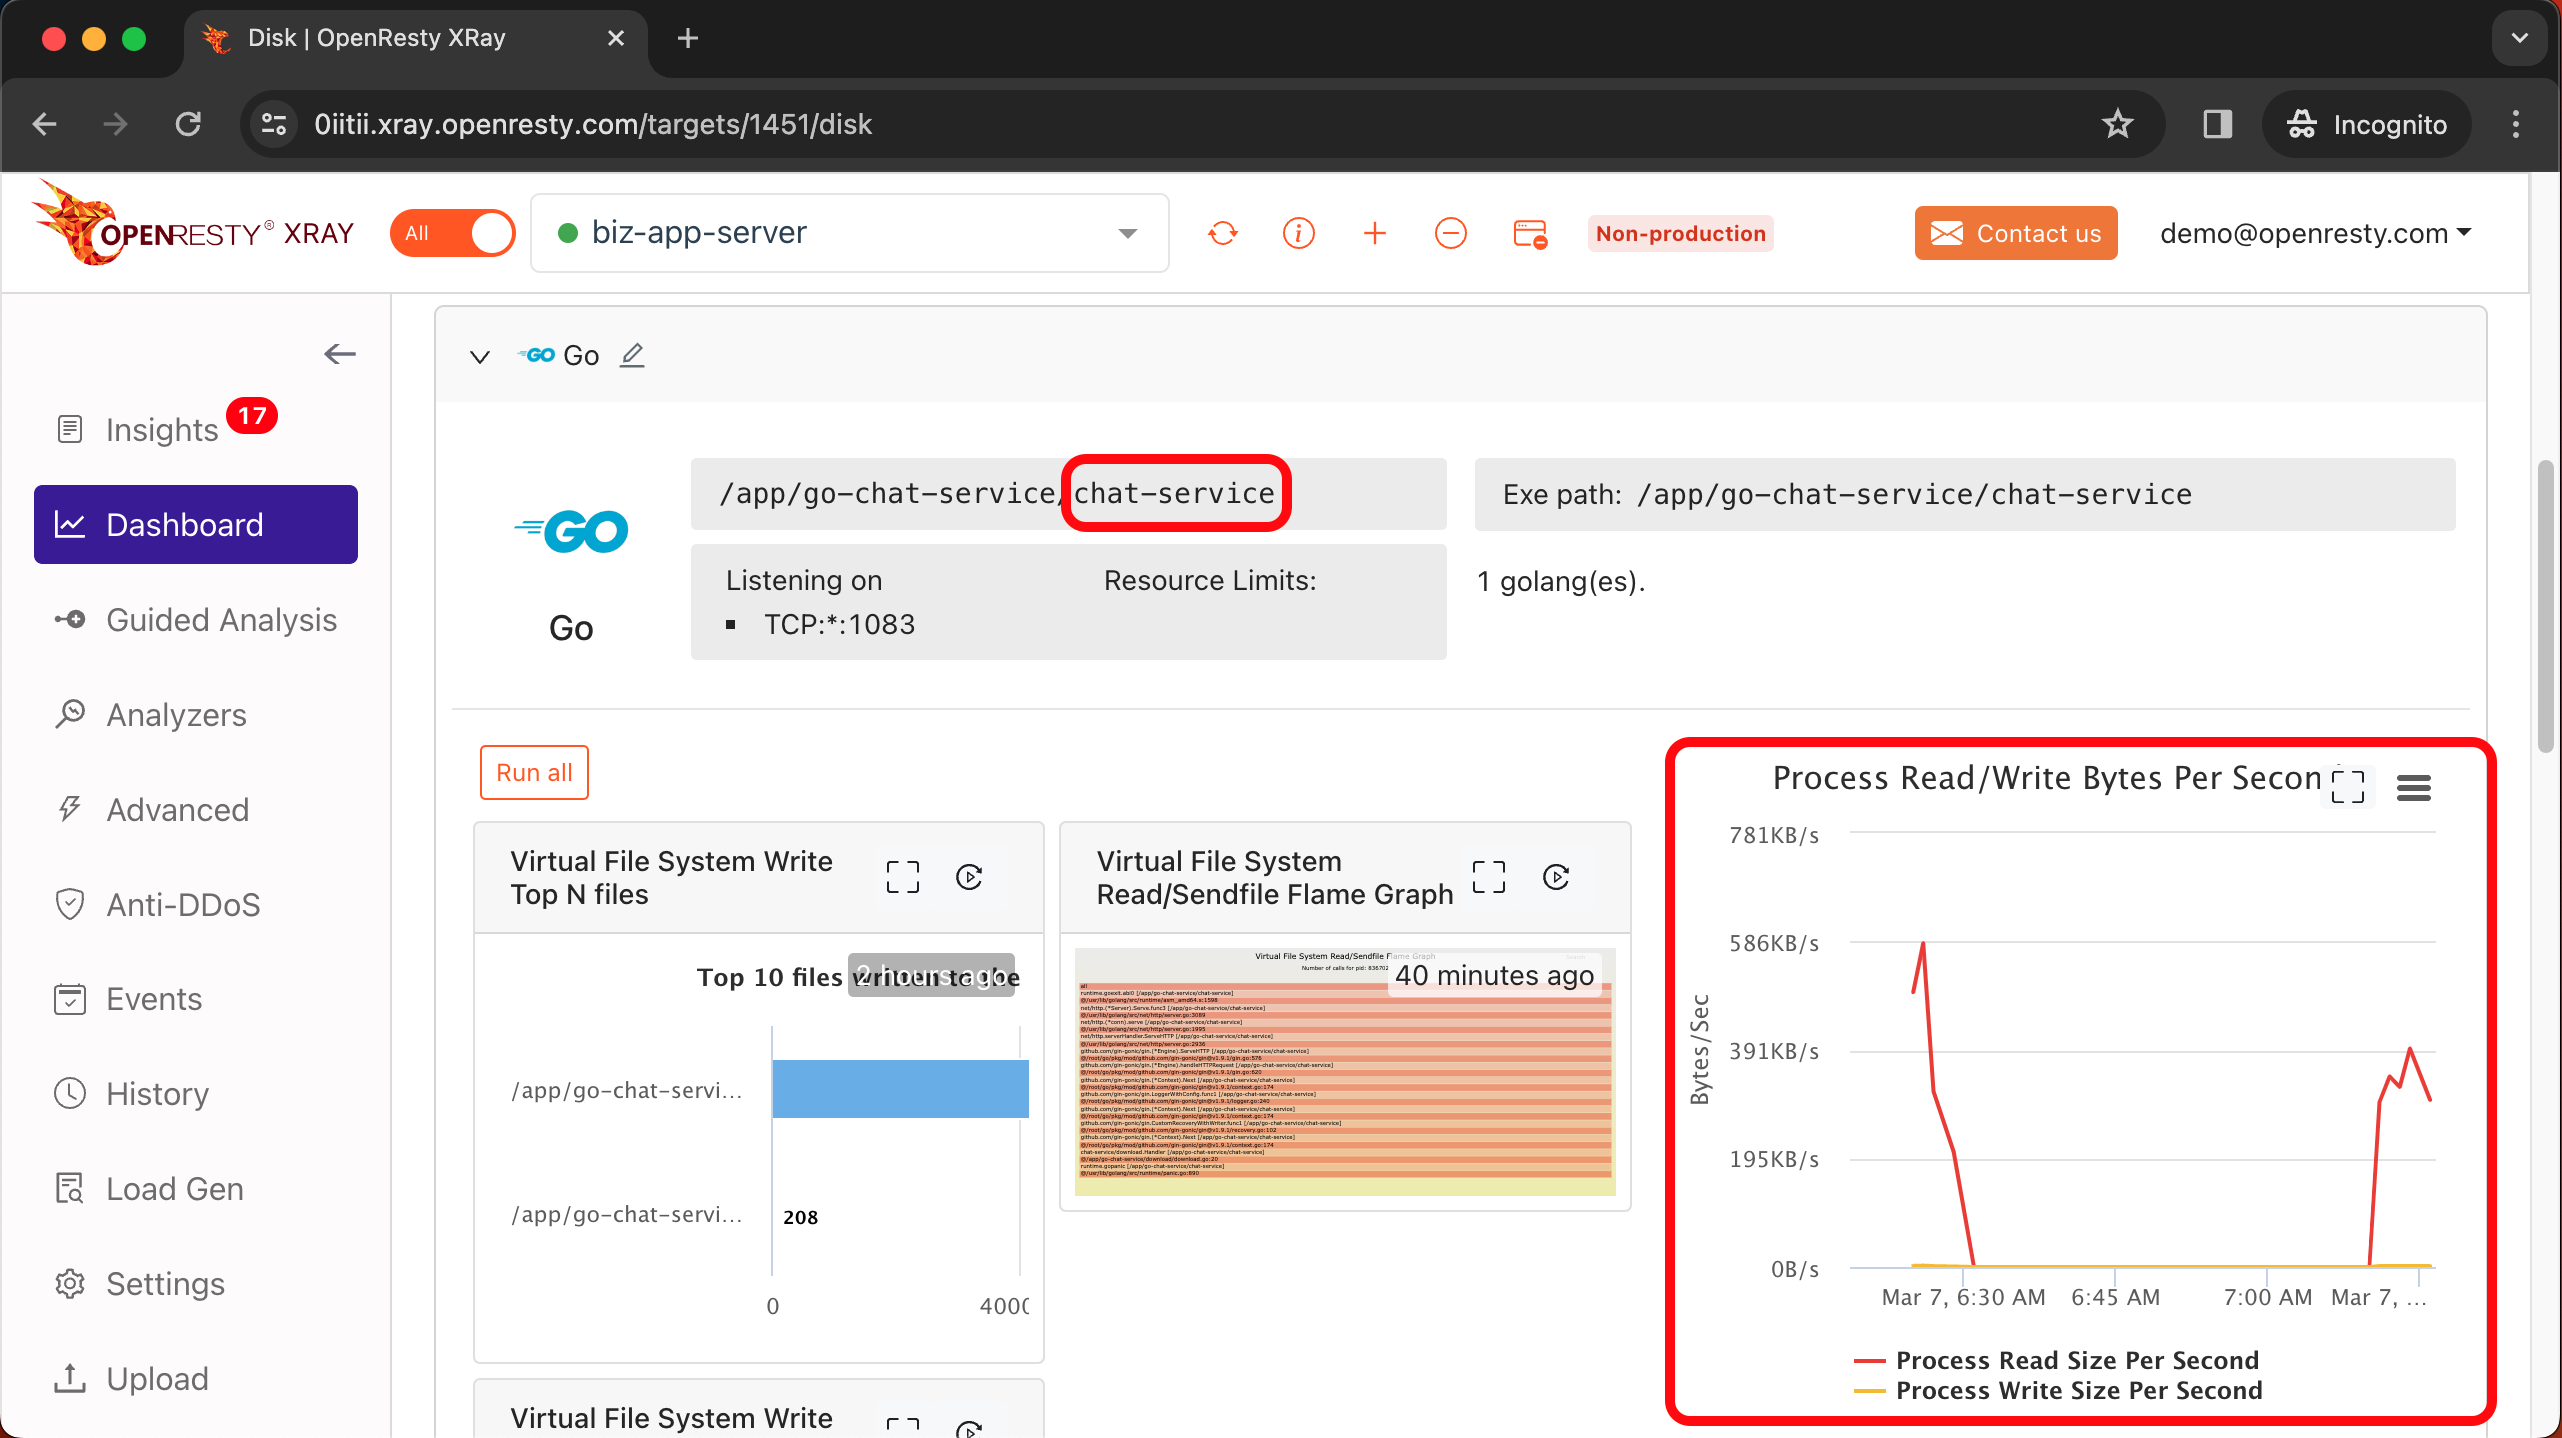
On the OpenResty XRay dashboard, we discovered a Go application named ‘chat-service’ performing frequent read and write operations on the hard disk.
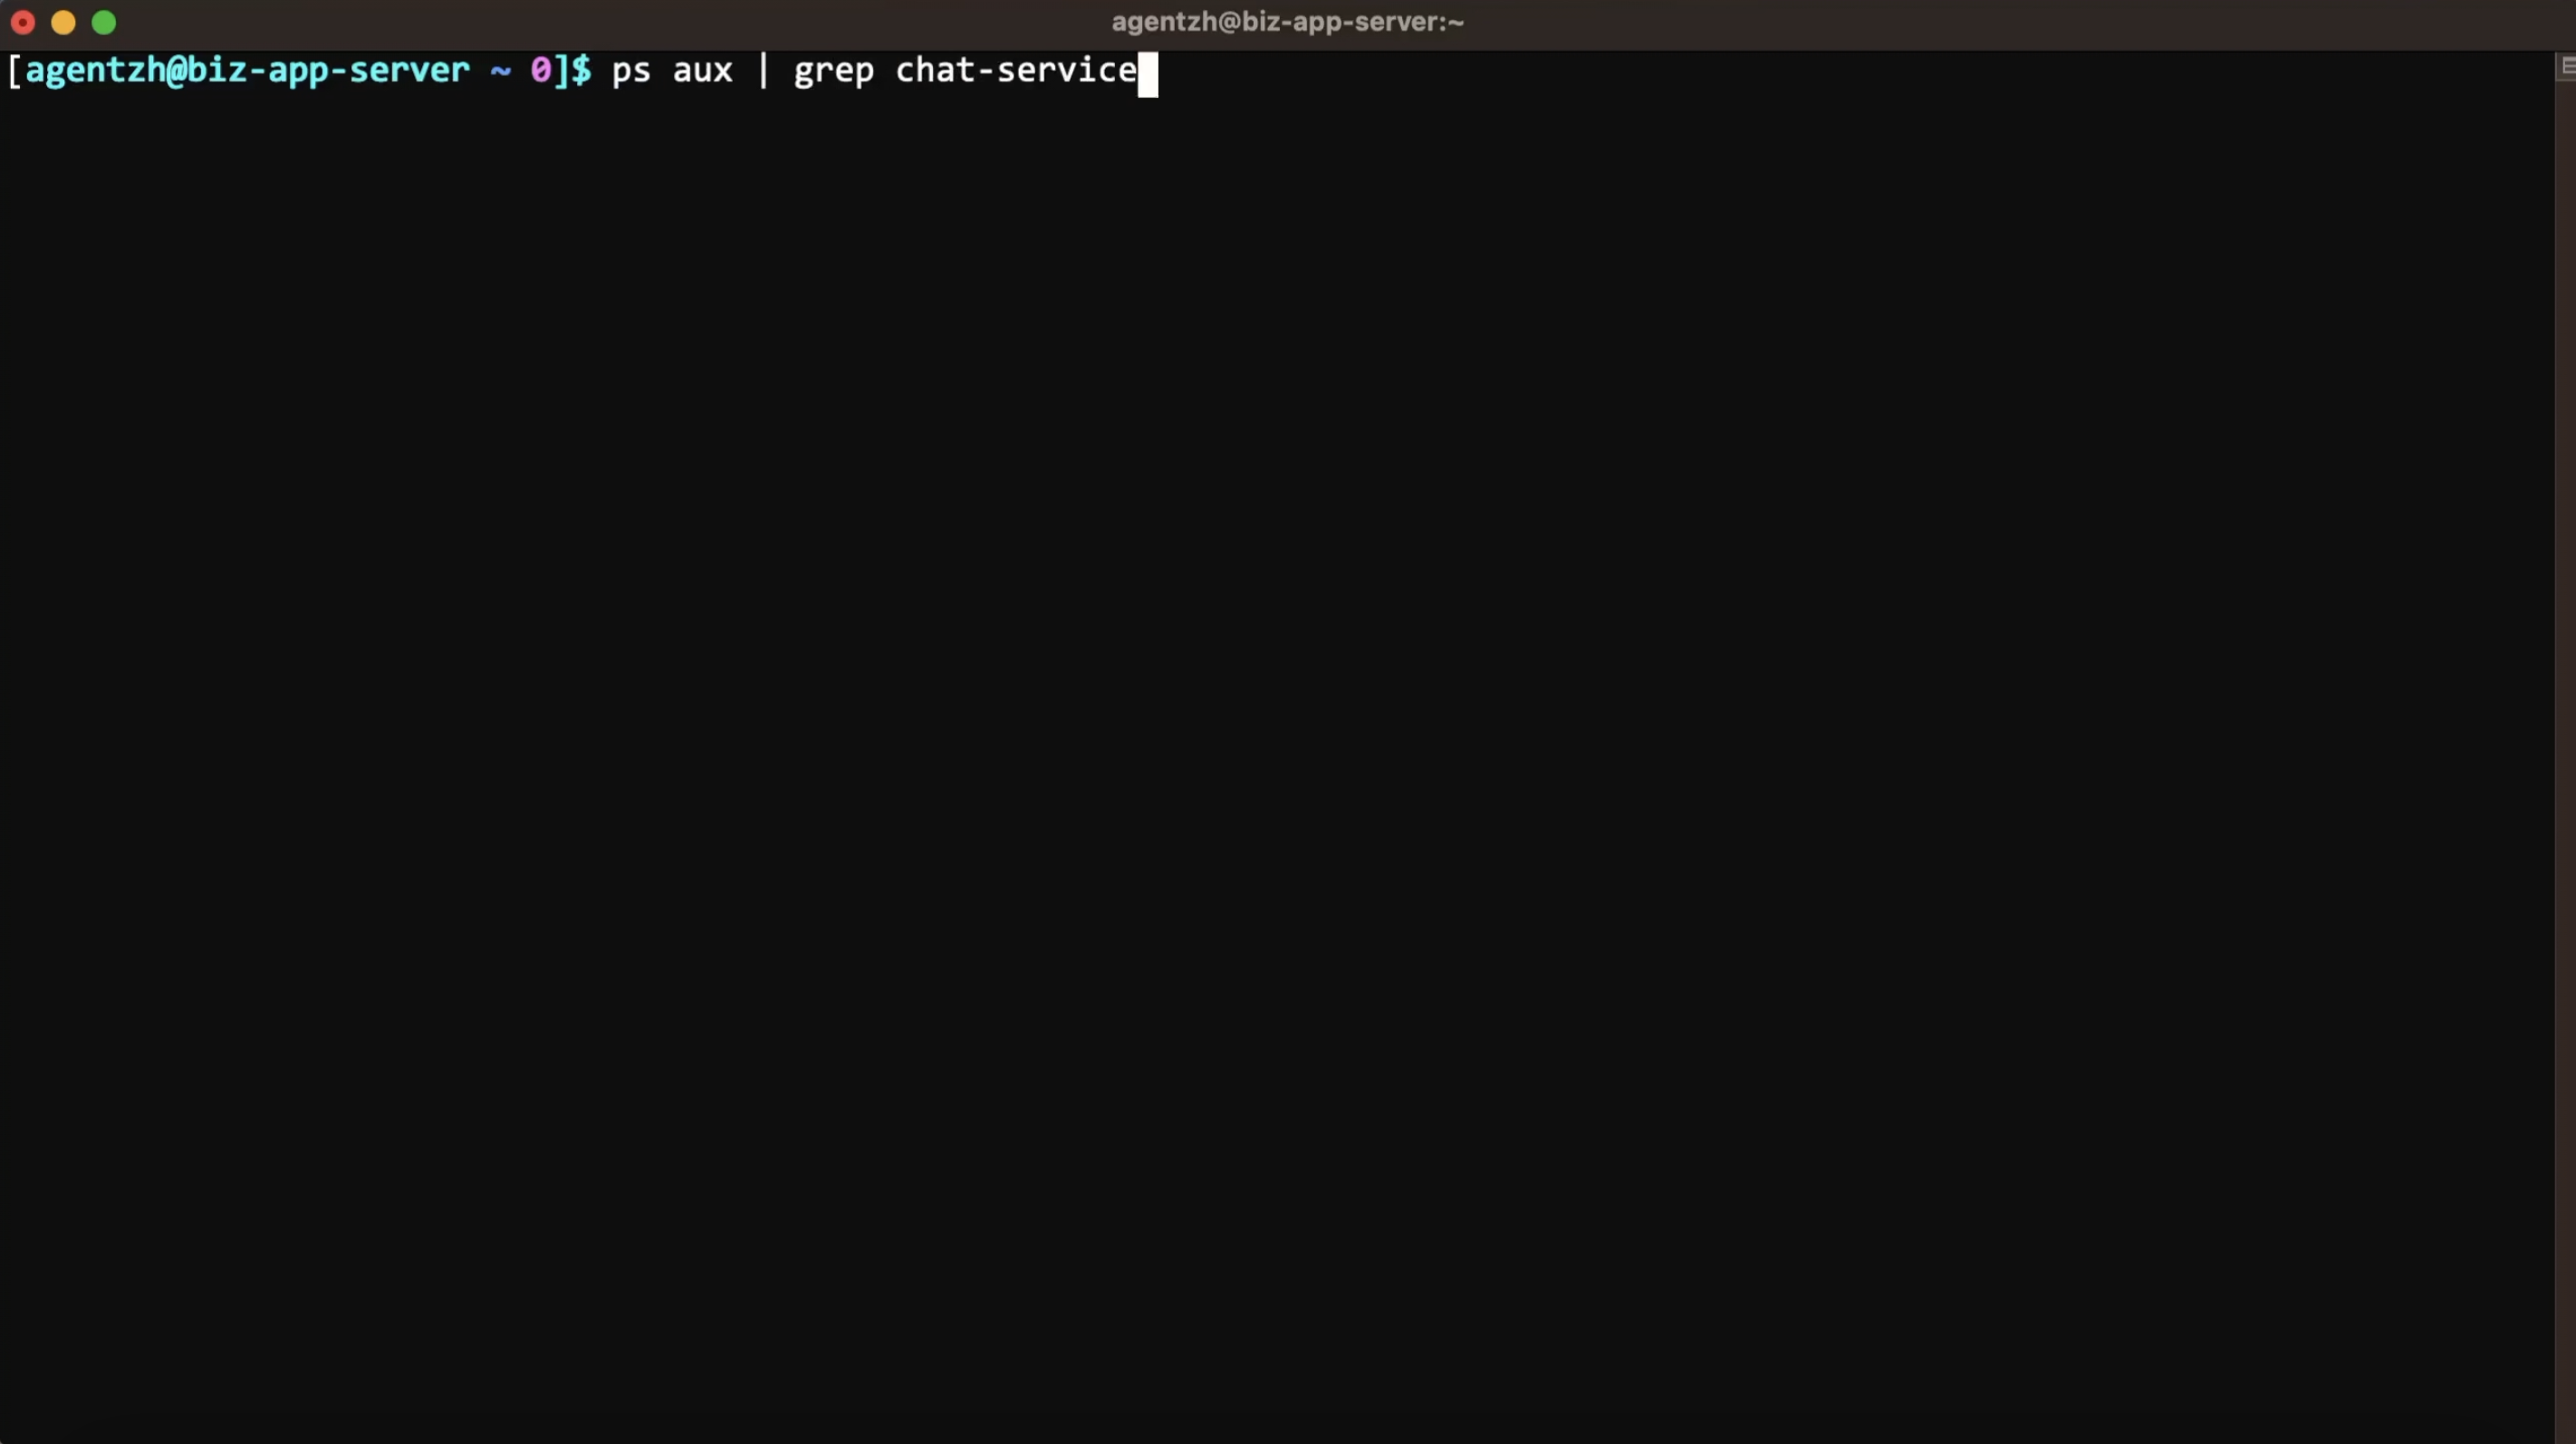
First, run the ps command to check this application.
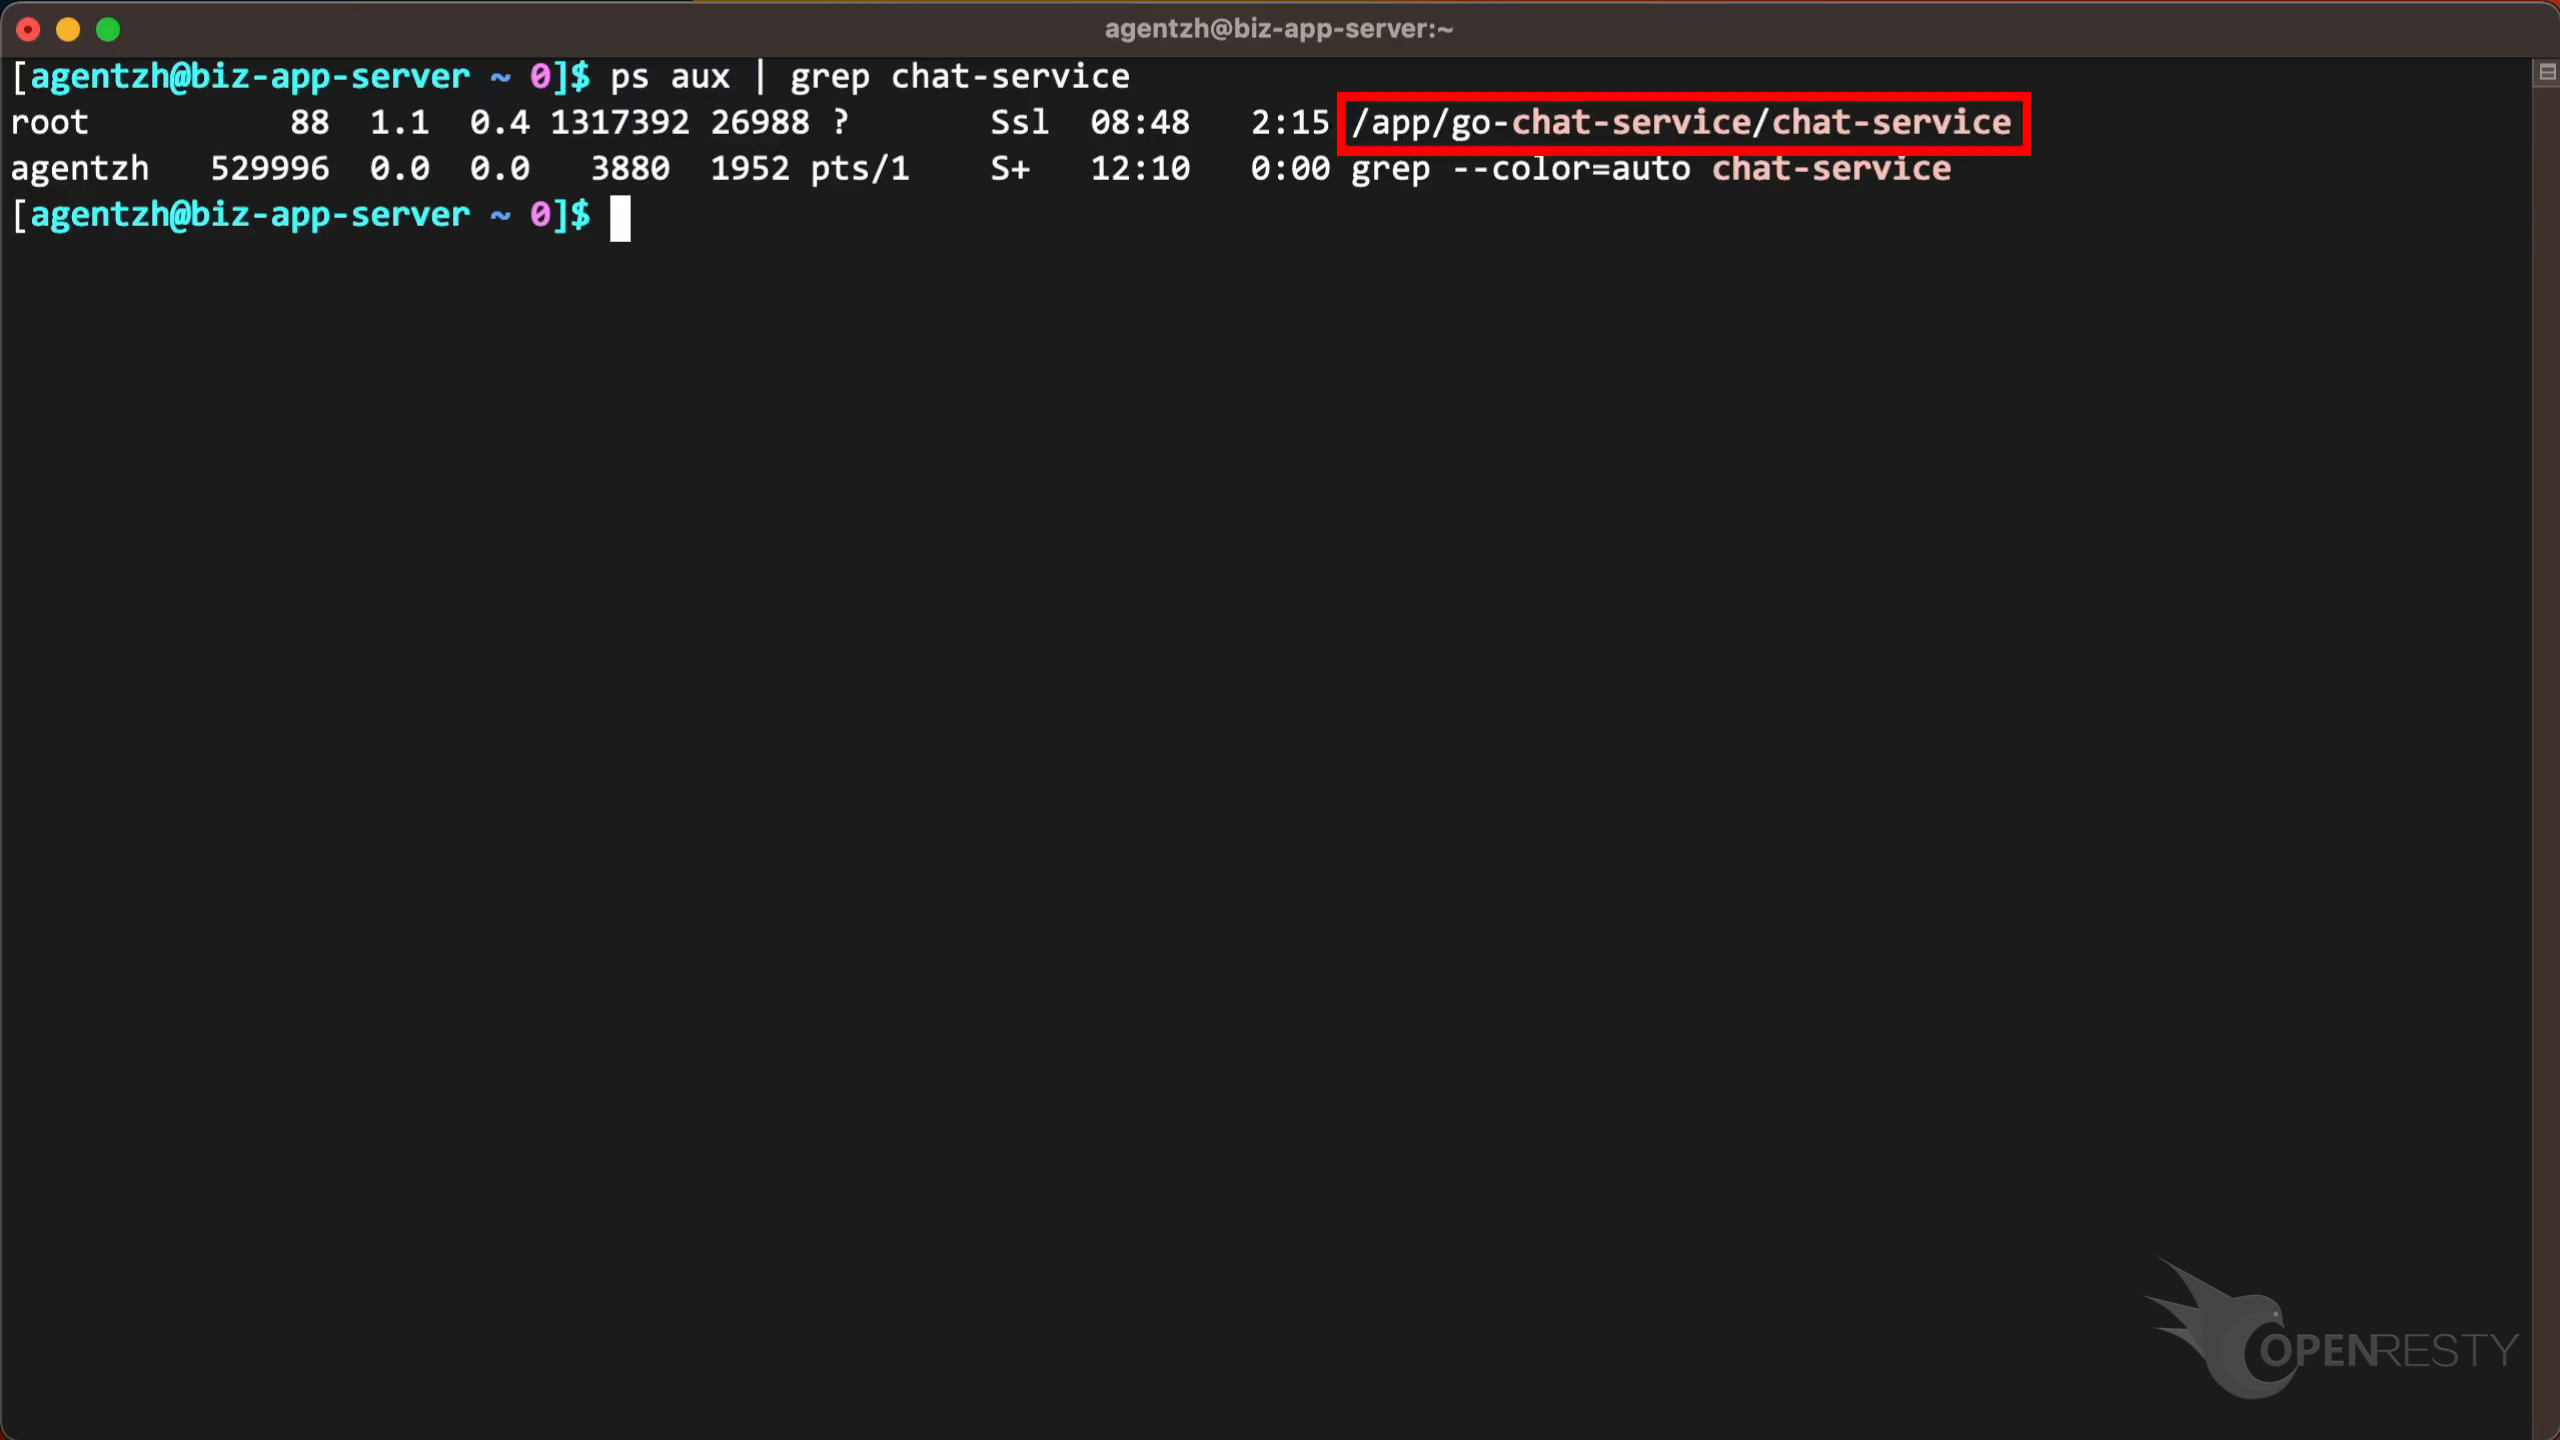
We see the full command line here.
Use the guided analysis feature of OpenResty XRay to spot the problematic Go code paths
Let’s use OpenResty XRay to check out this application. We can analyze it in real time and figure out what’s going on.
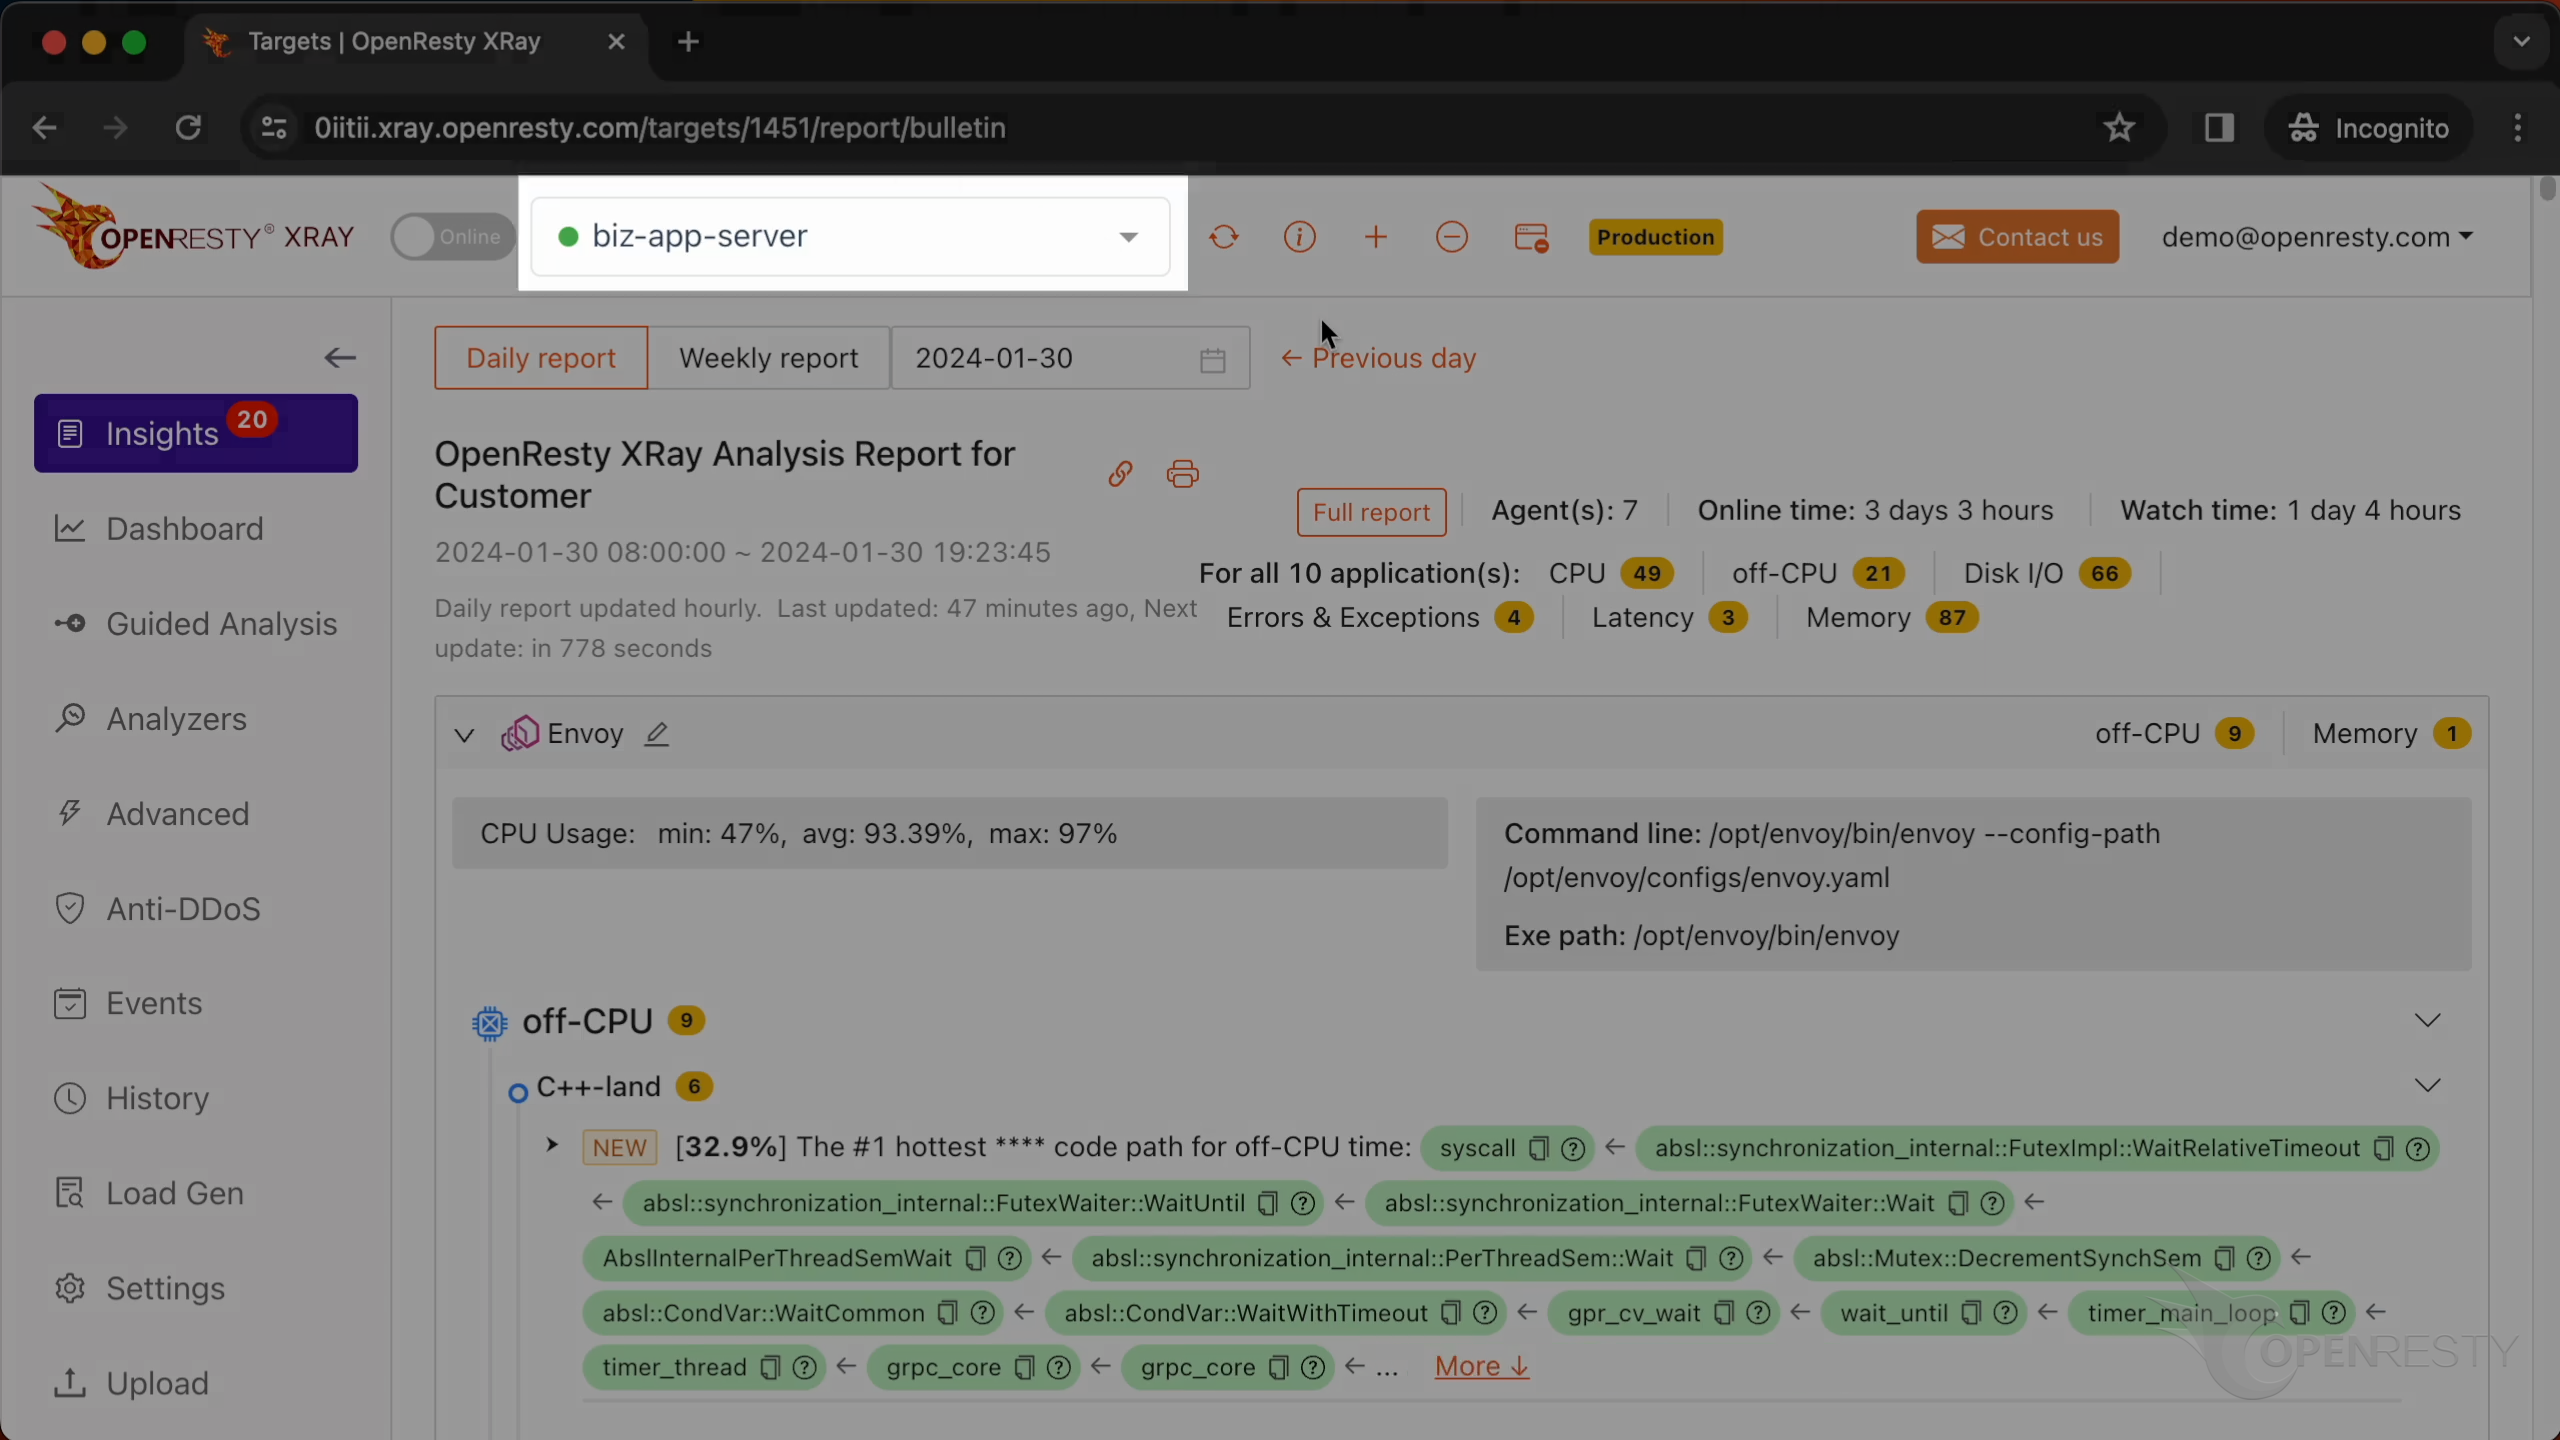
Open the OpenResty XRay Web console in the web browser.
Make sure it is the right machine you are watching.
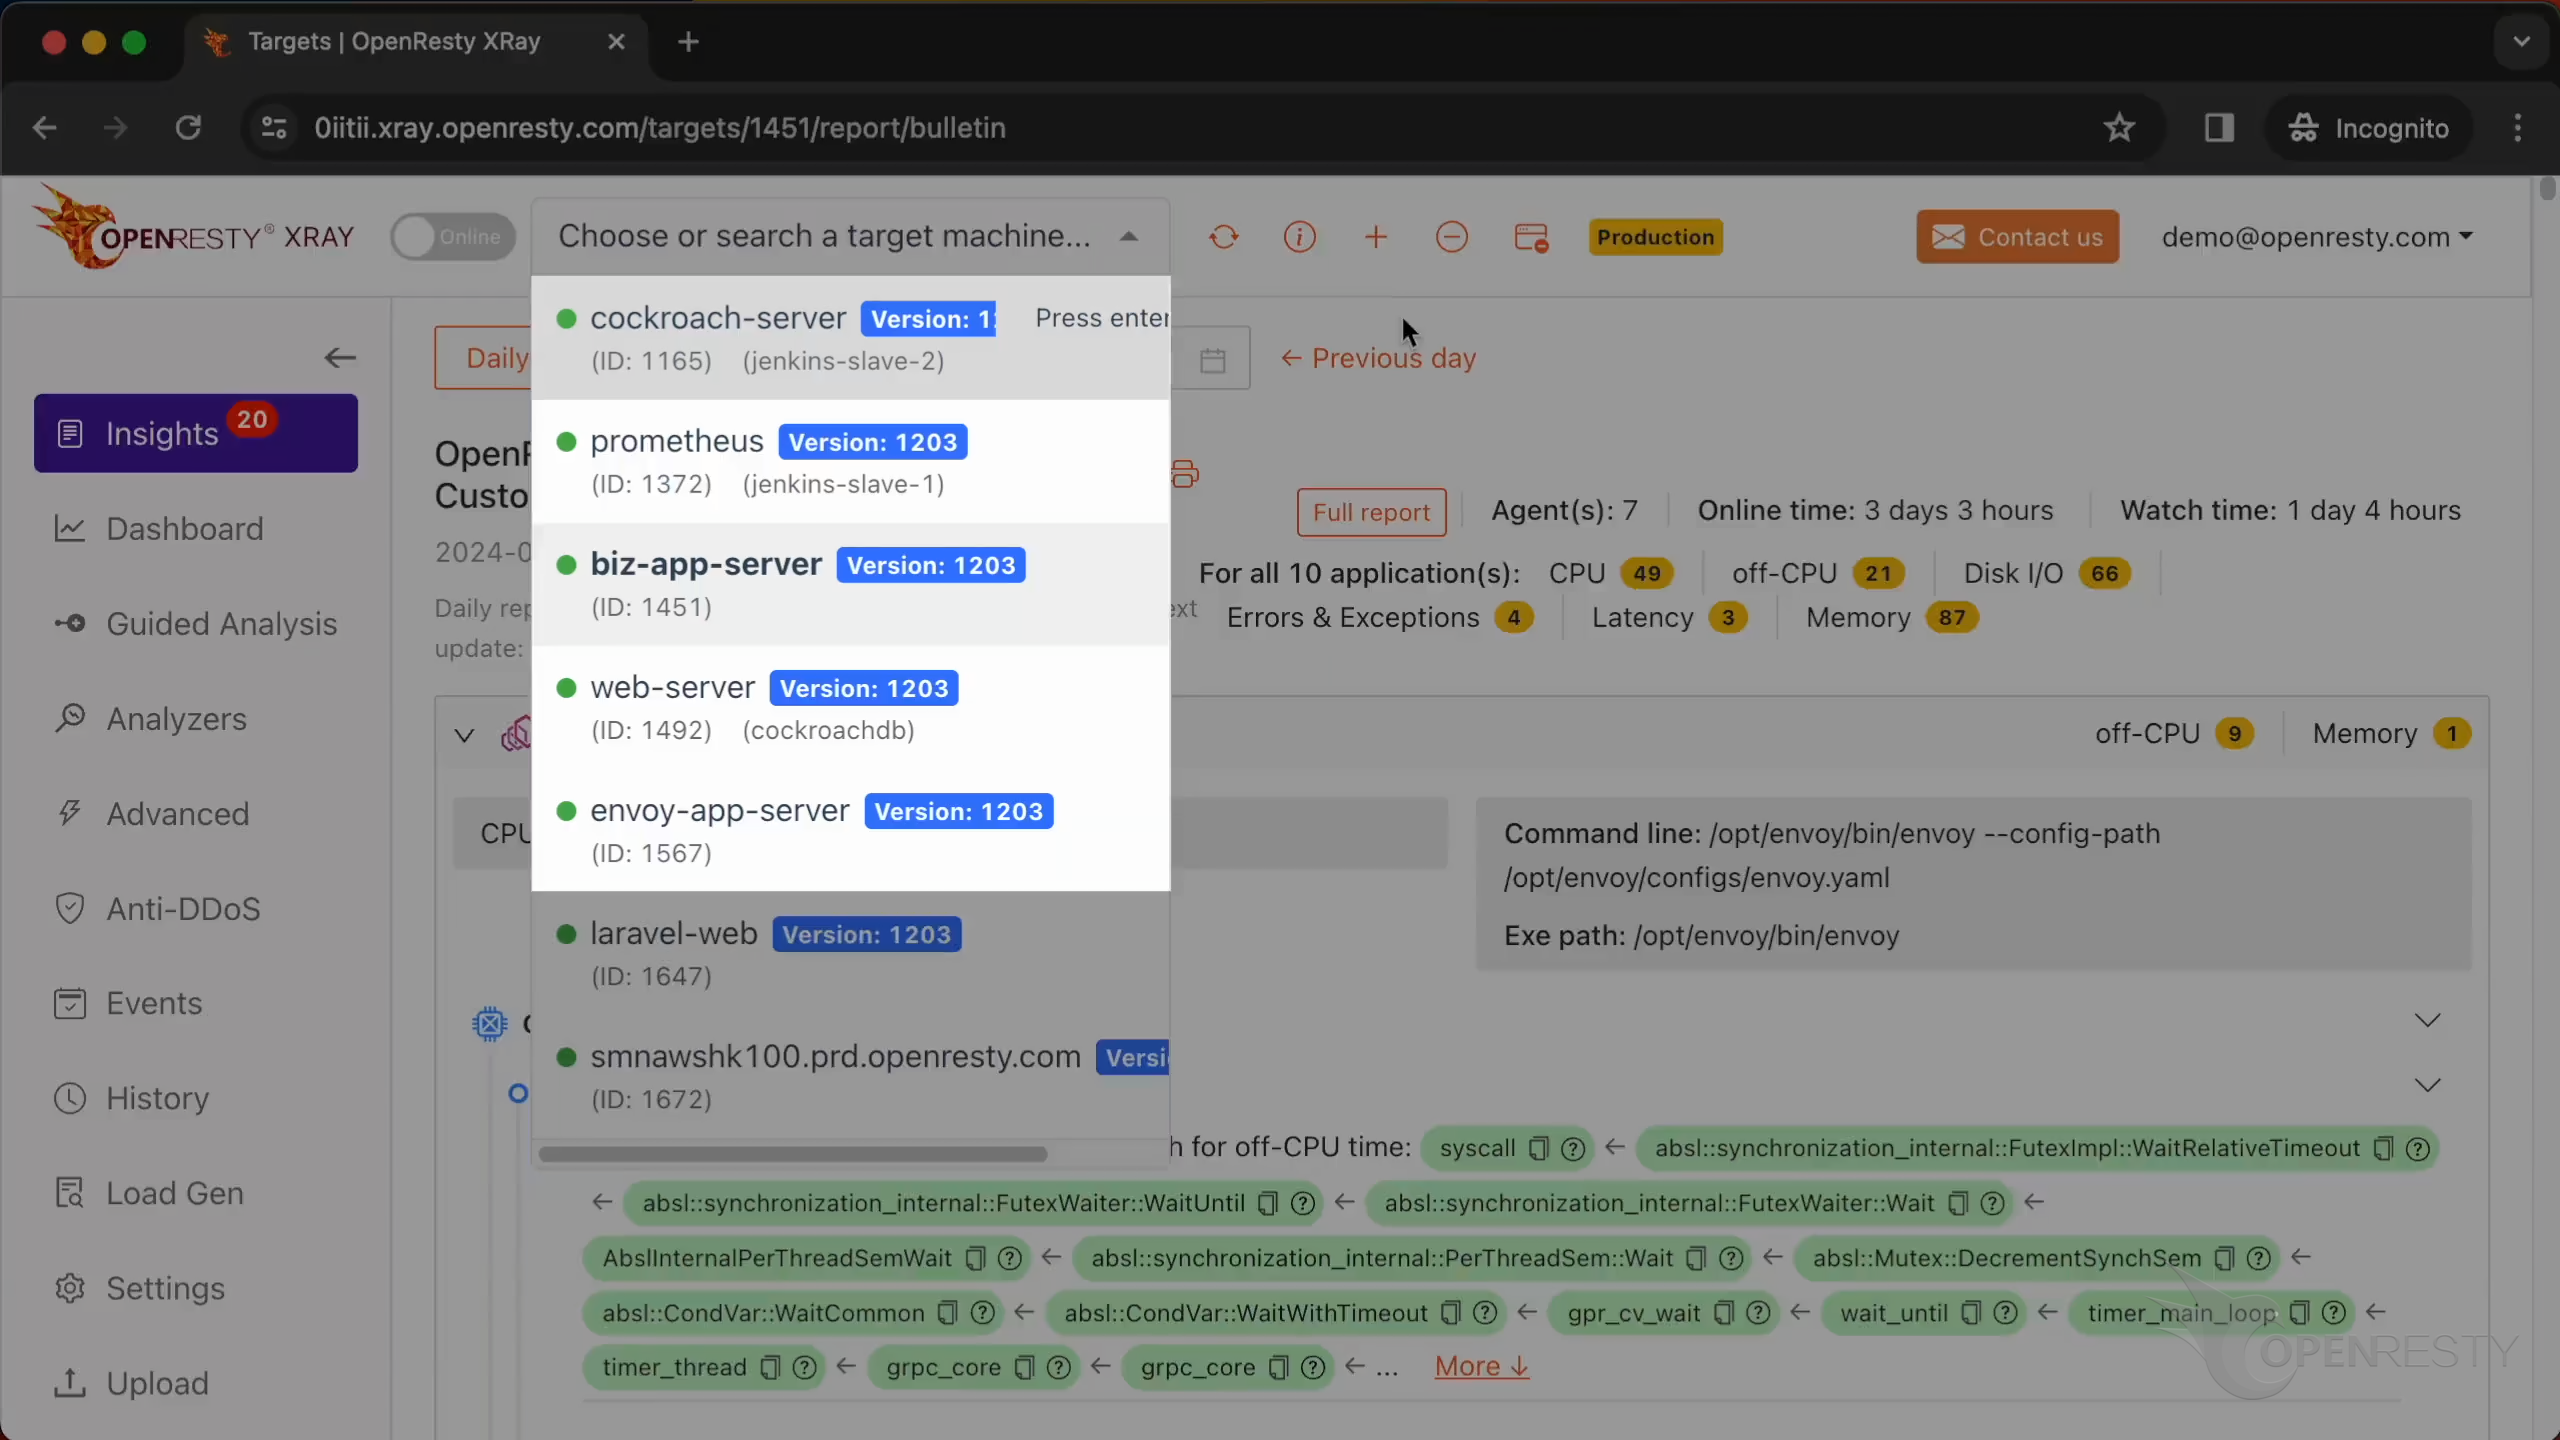
You can choose the right machine from the list below if the current one is not correct.
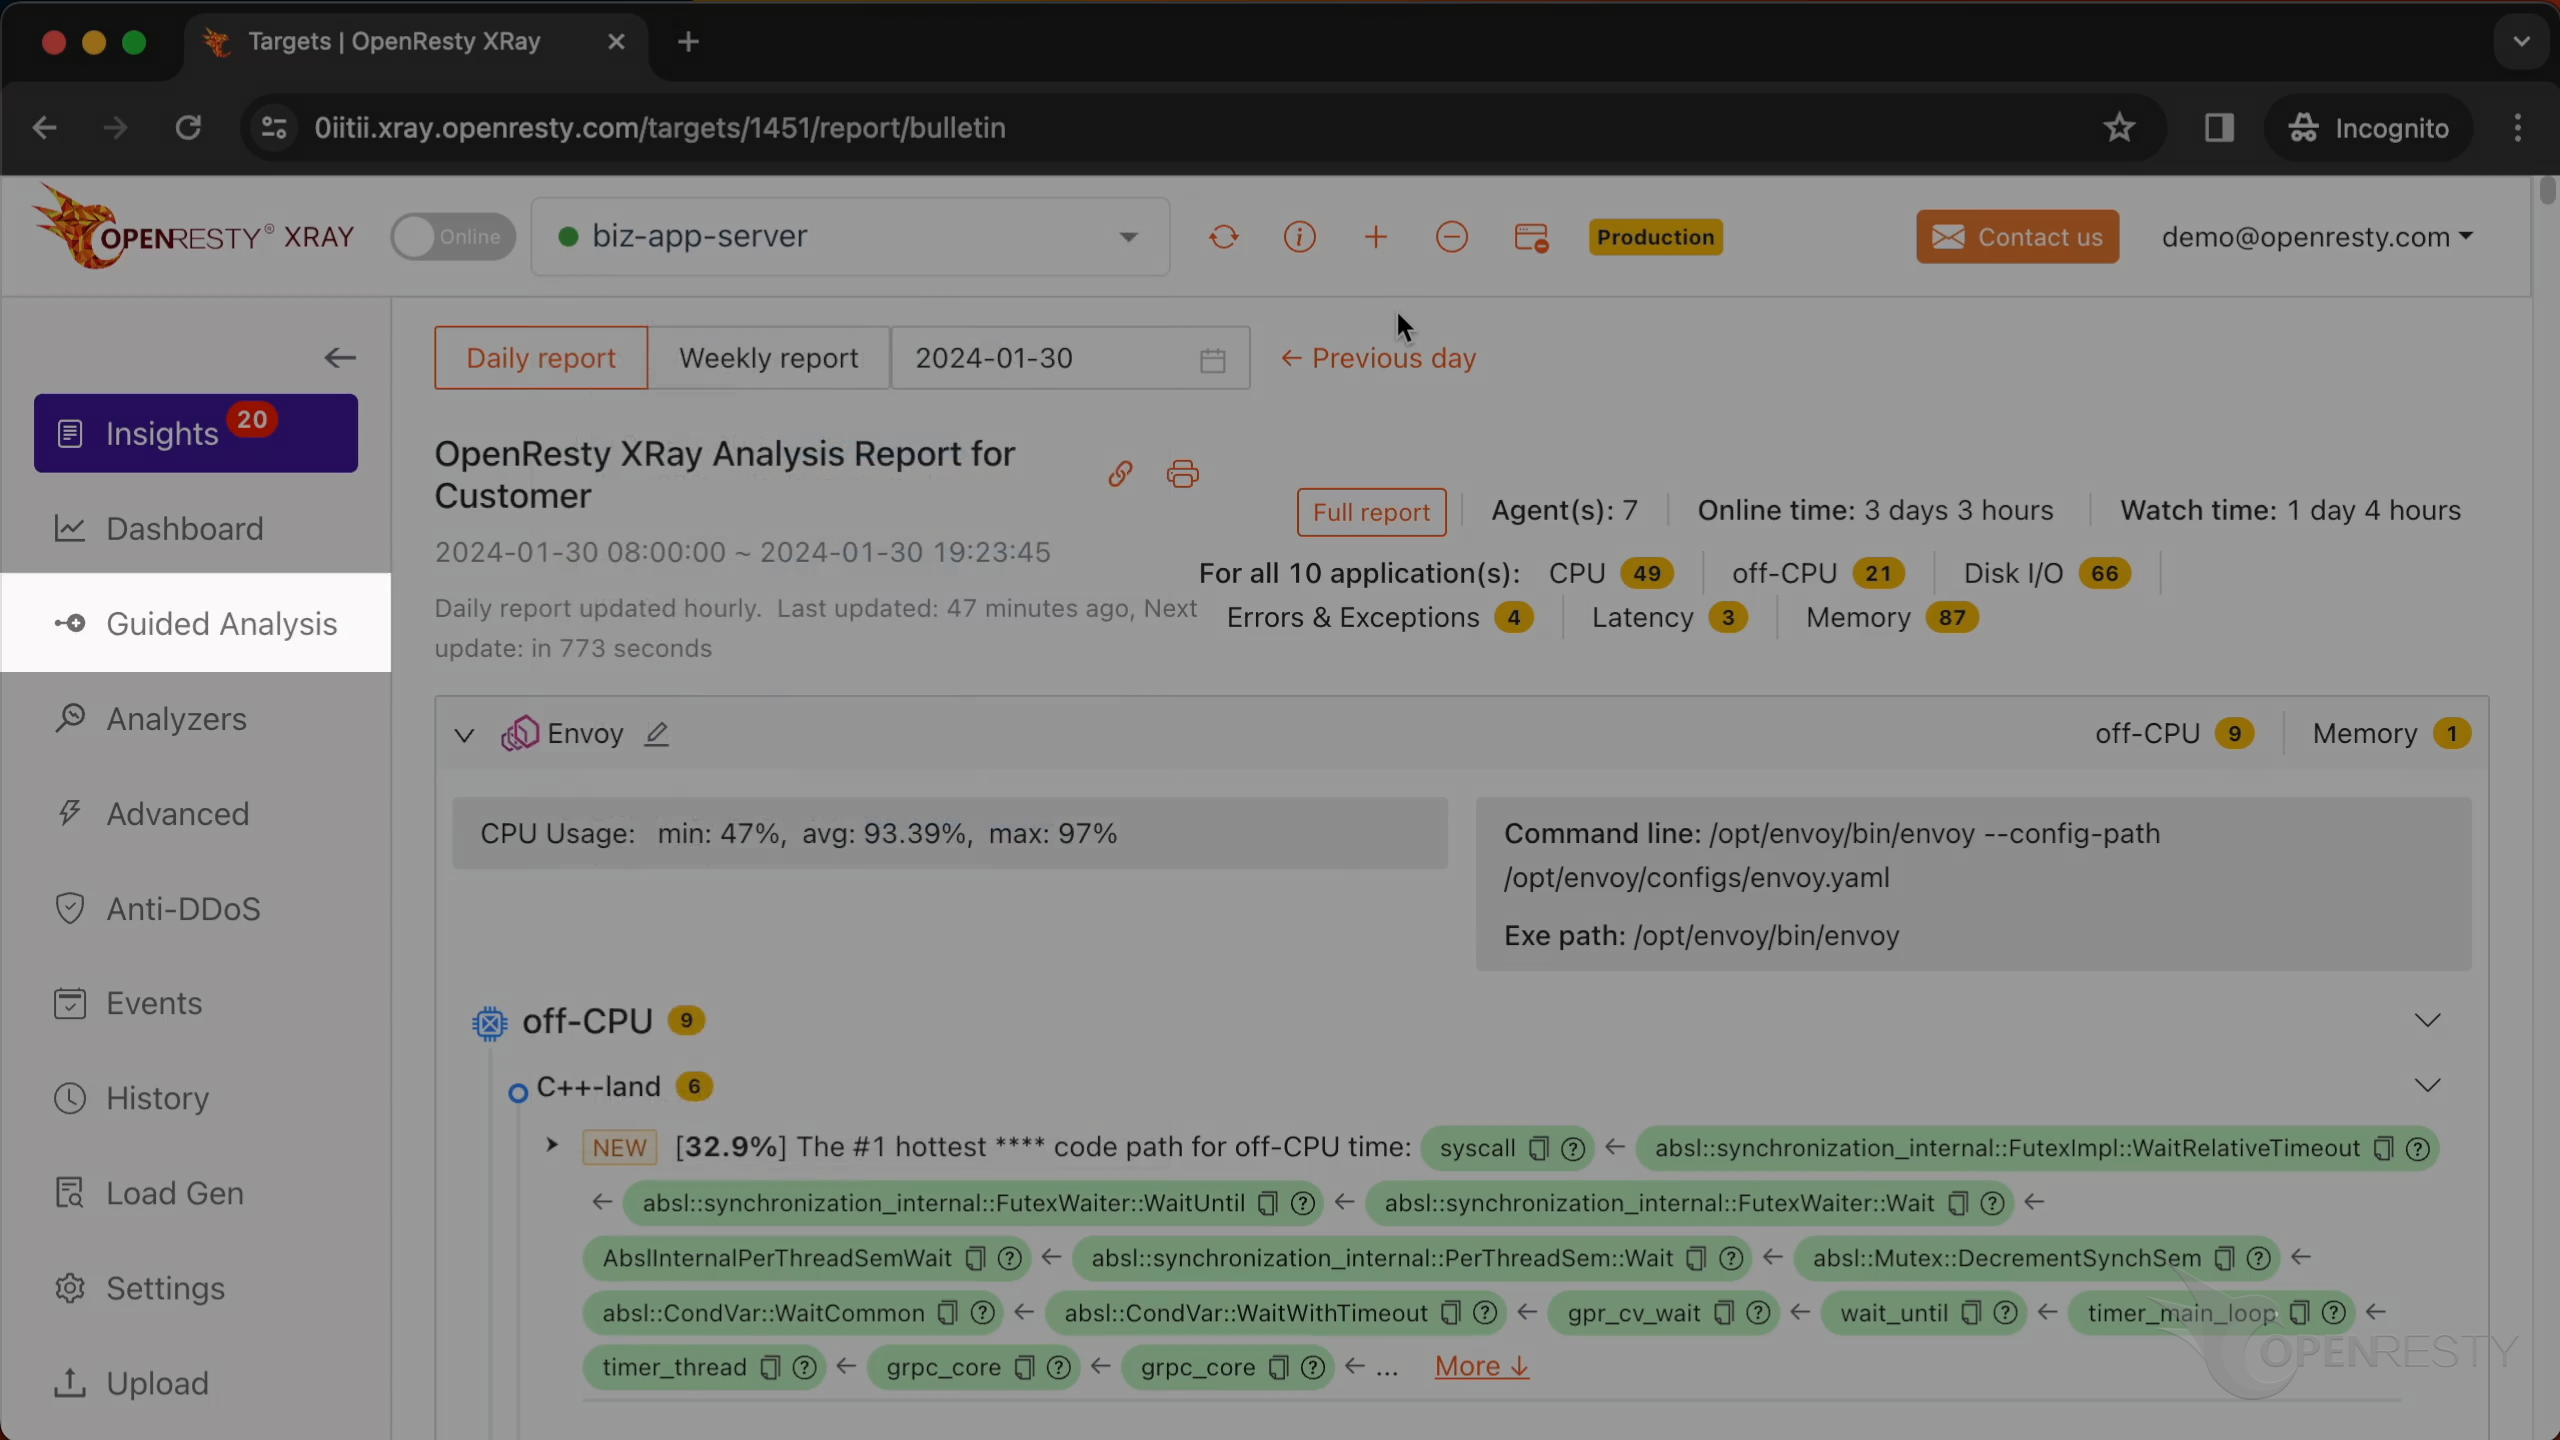
Go to the “Guided Analysis” page.
Here you can see different types of problems that you can diagnose.
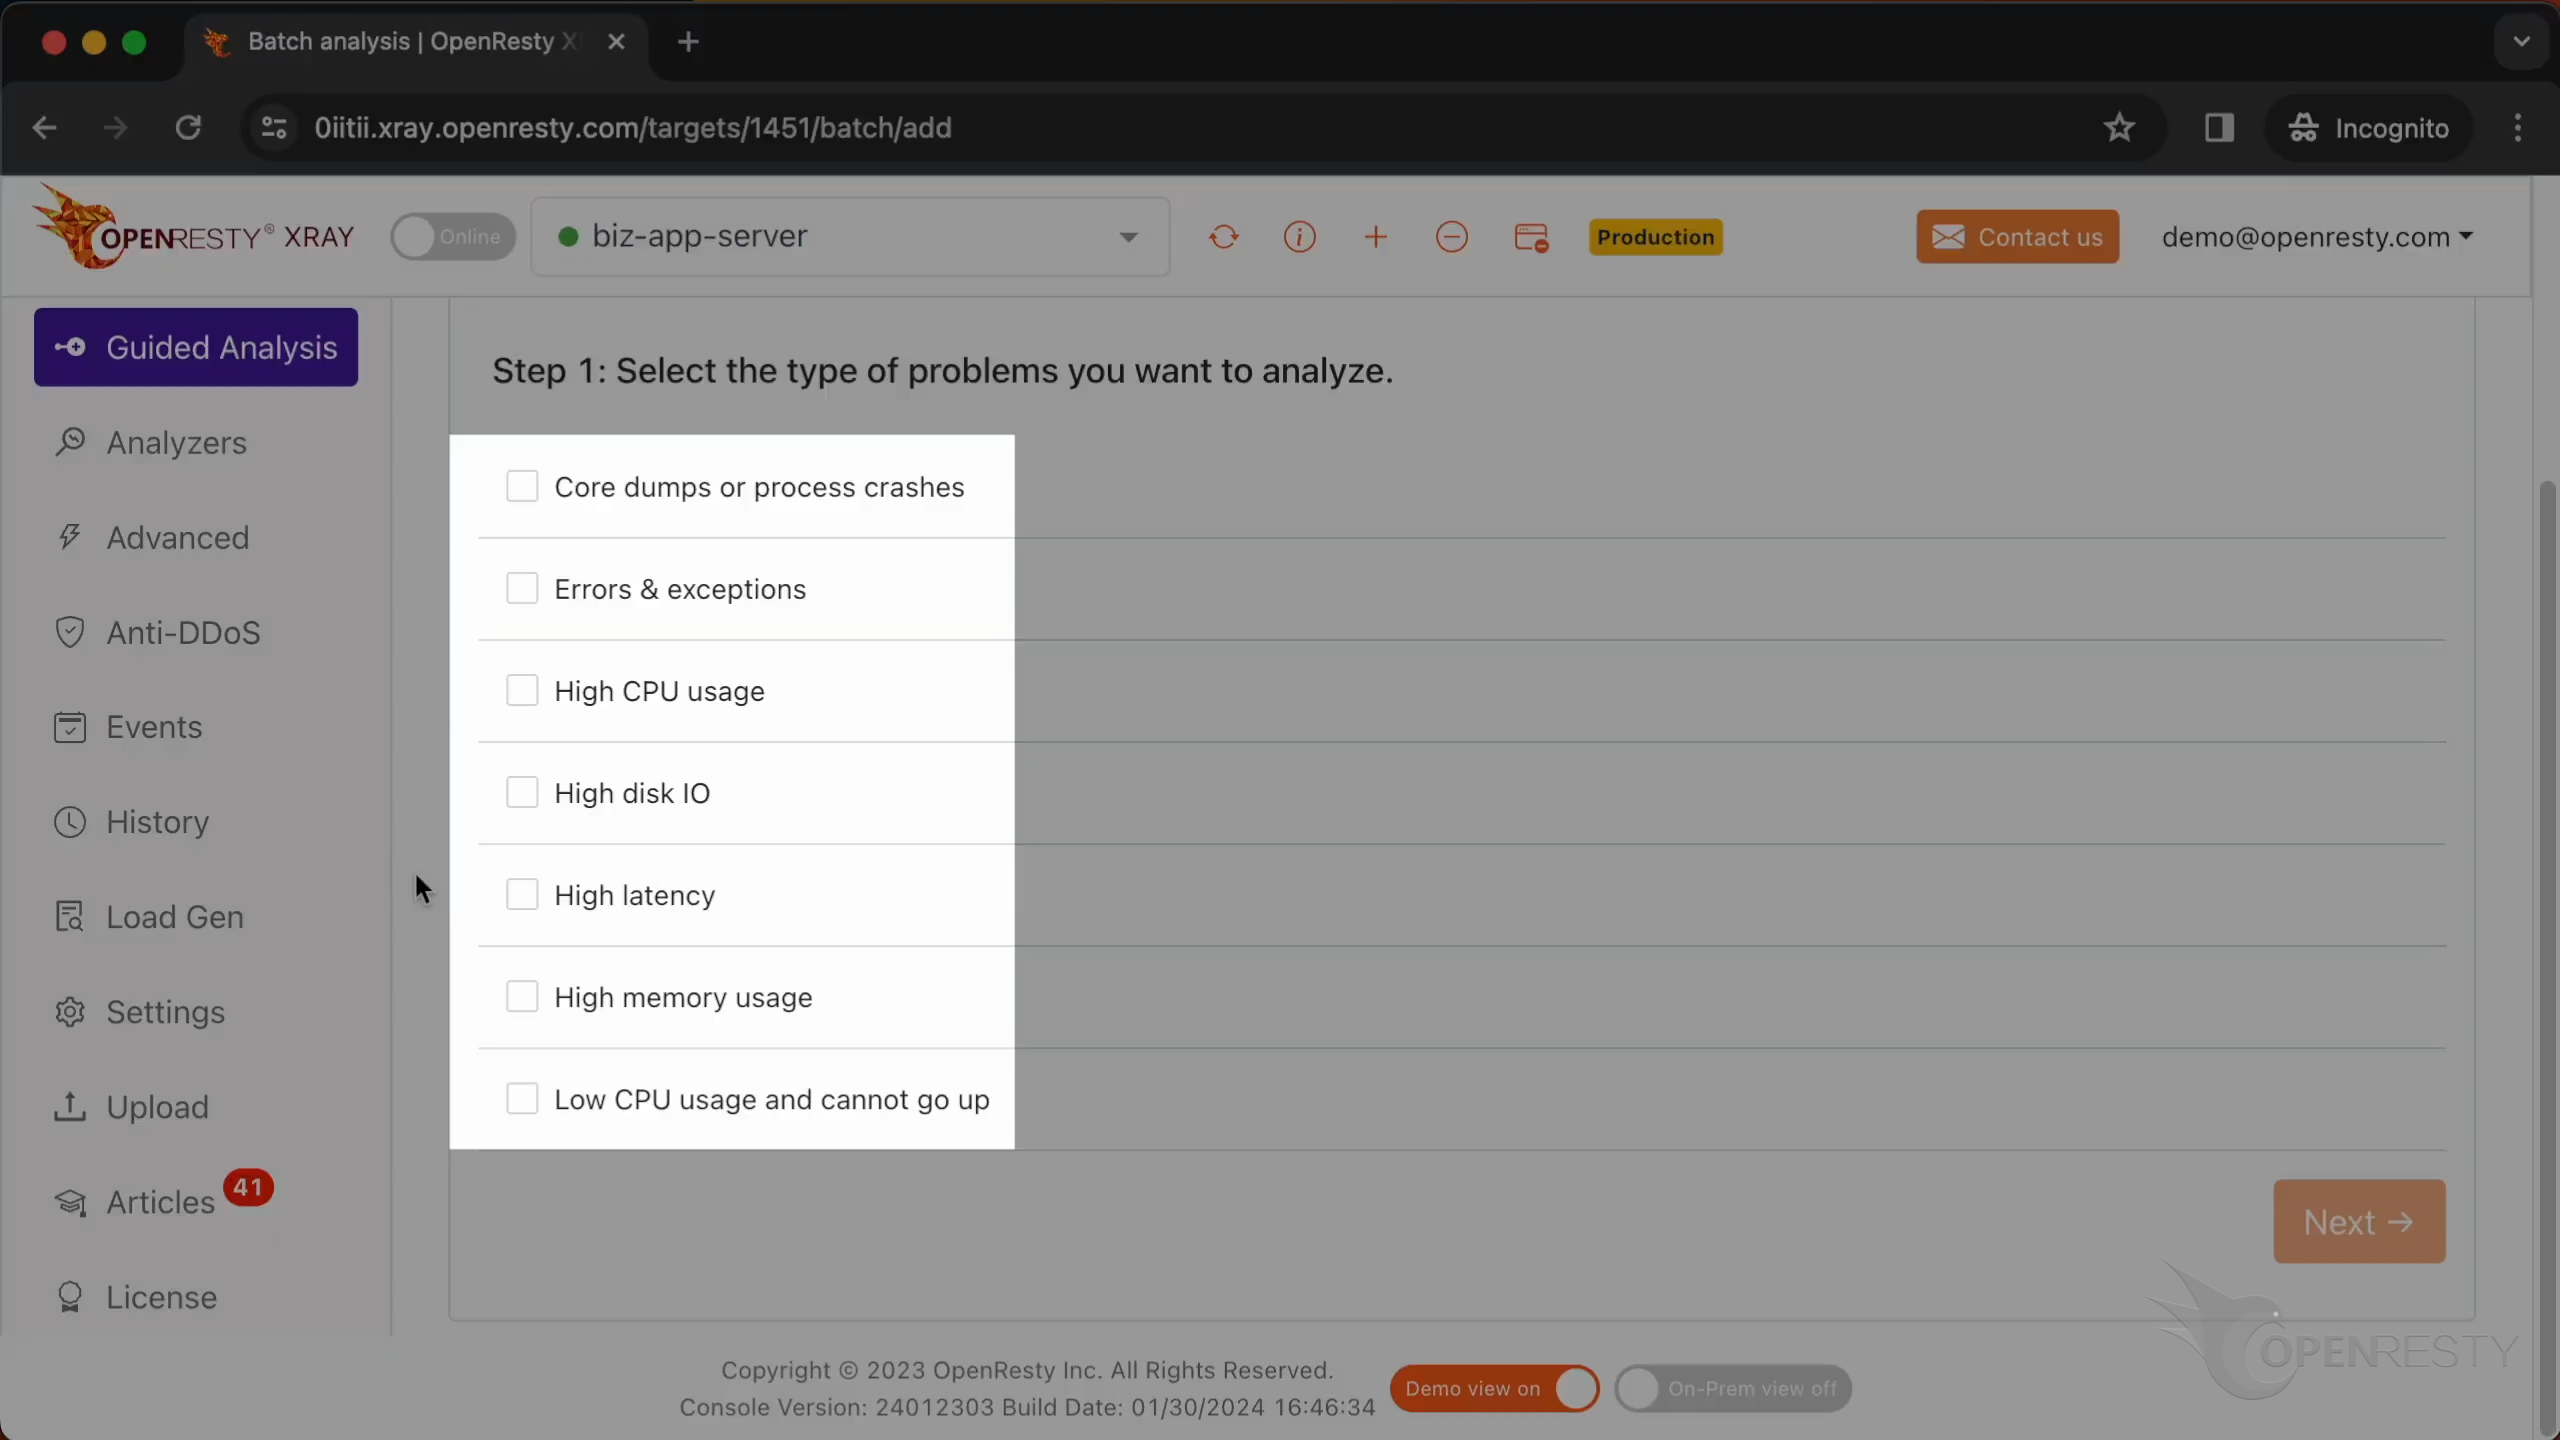
Let’s select “High disk IO”.
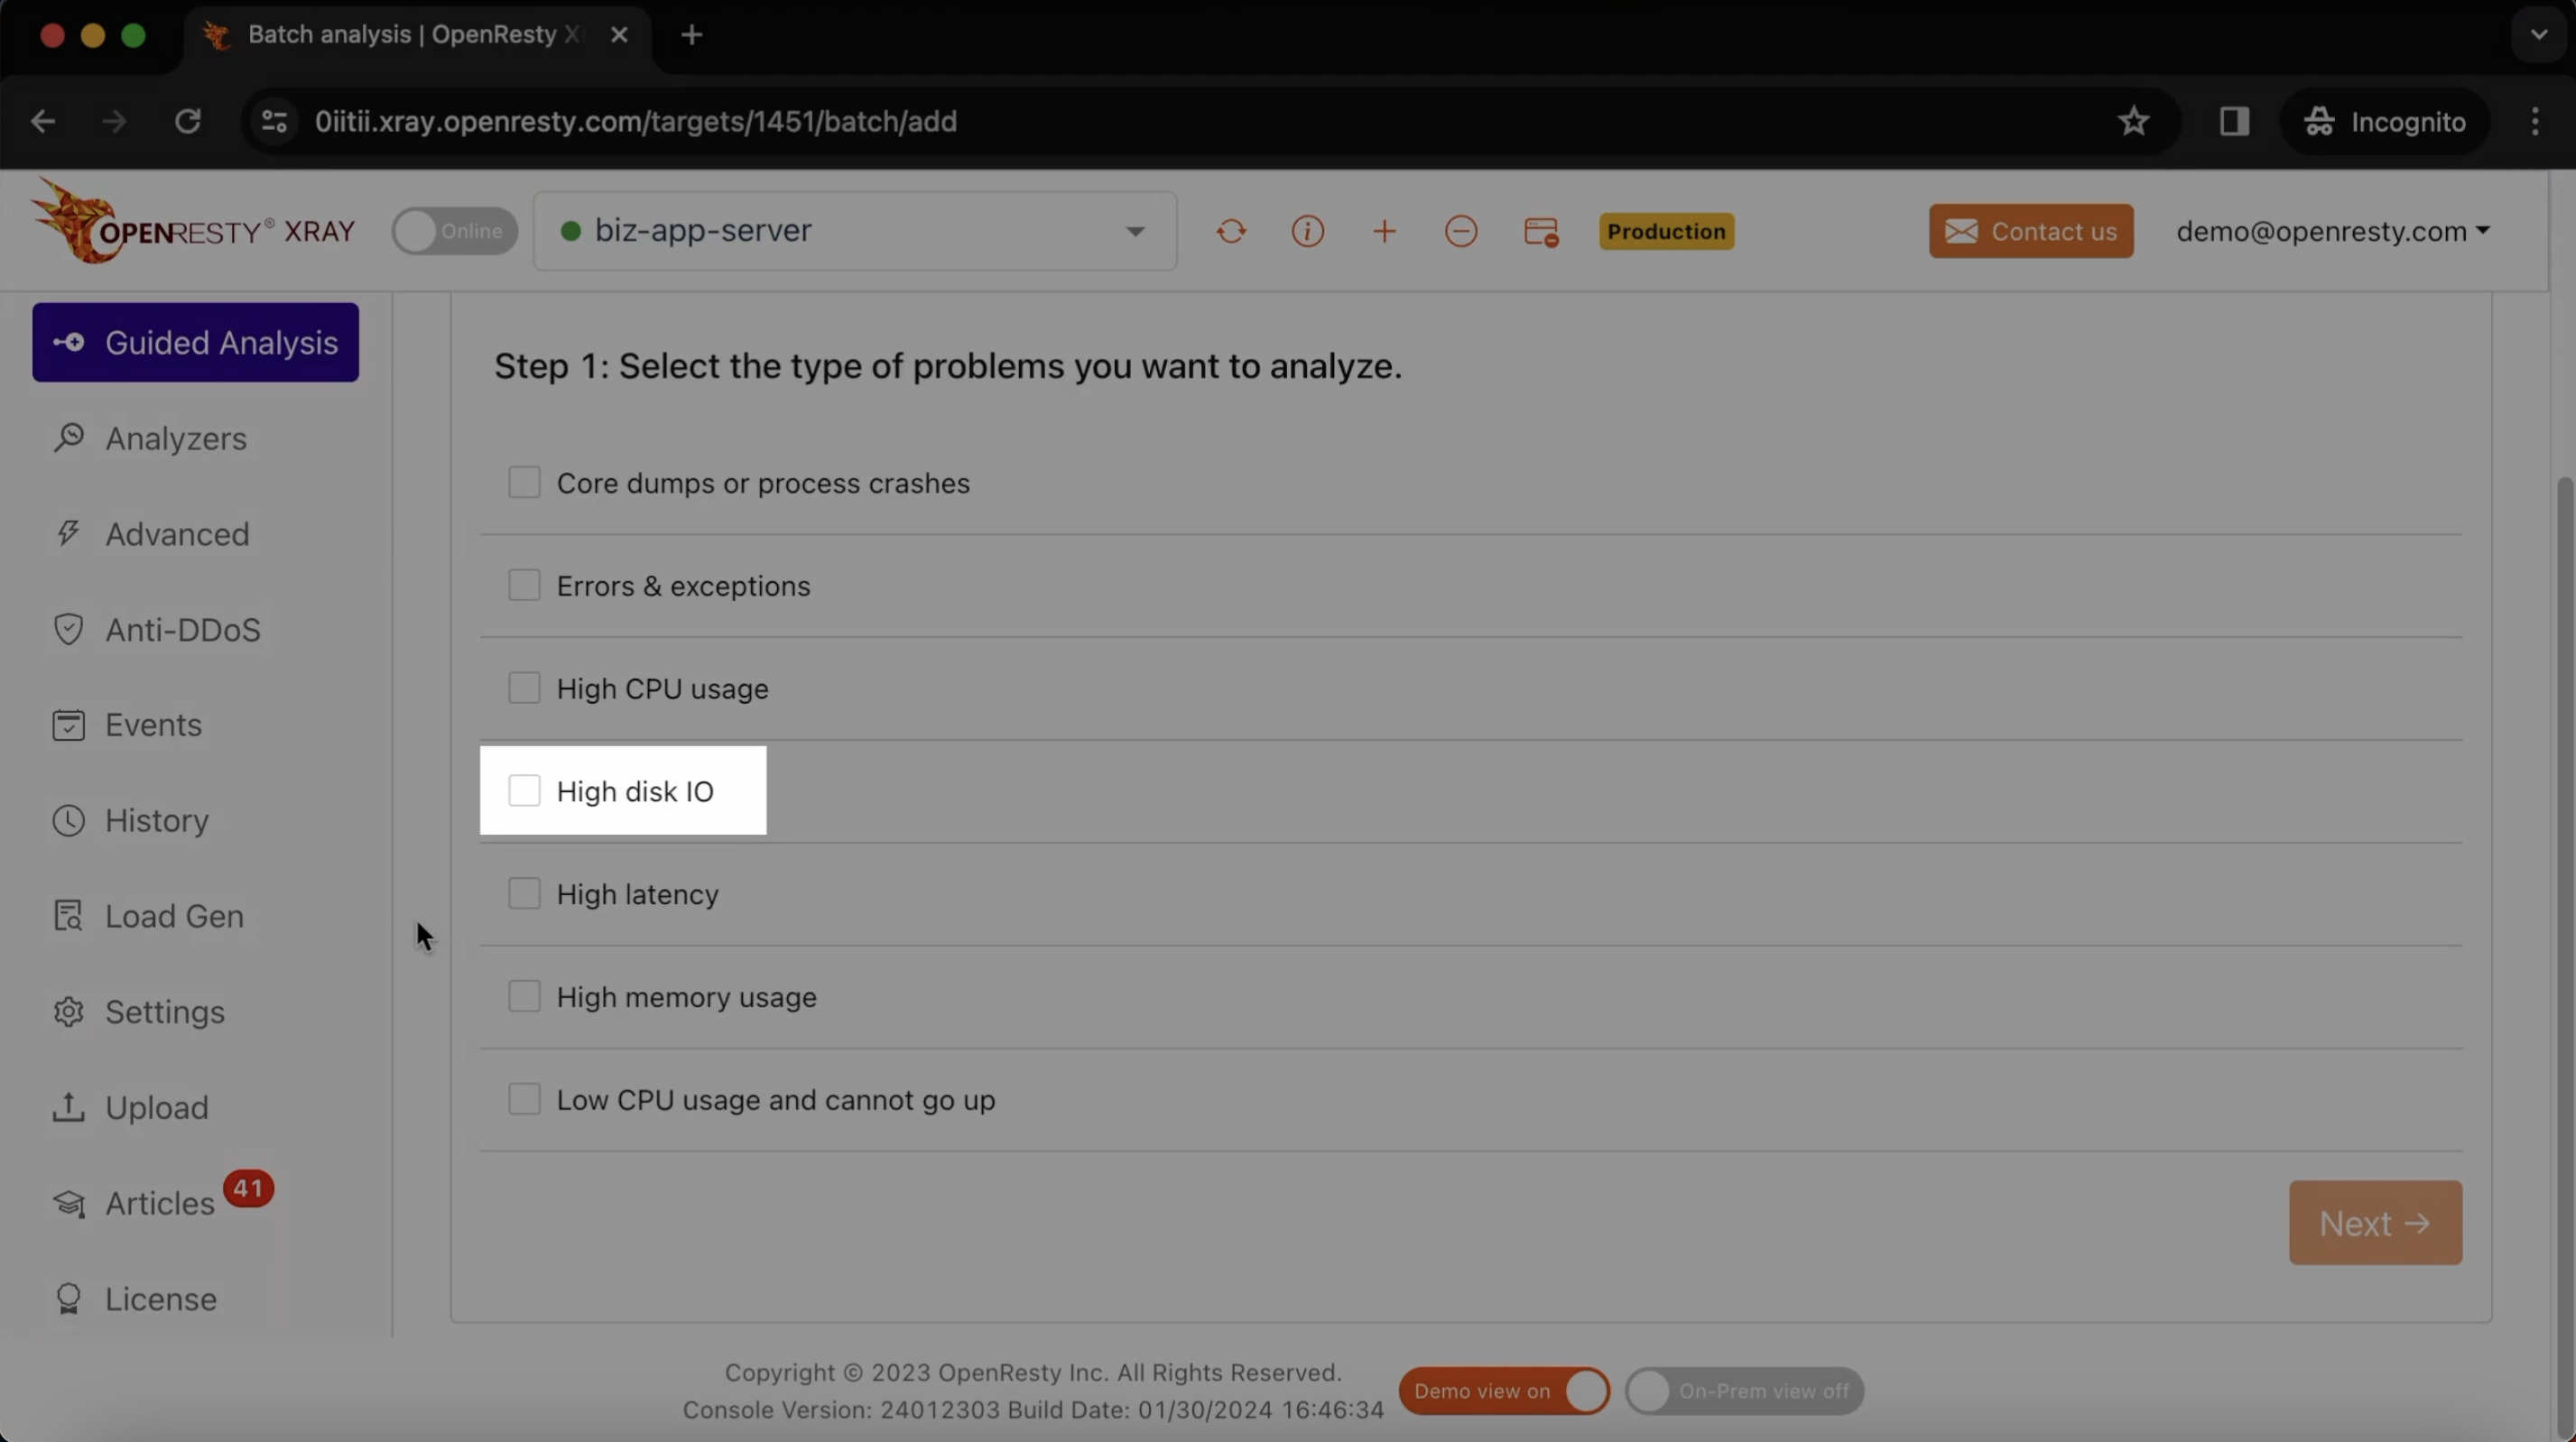
Click on “Next”.

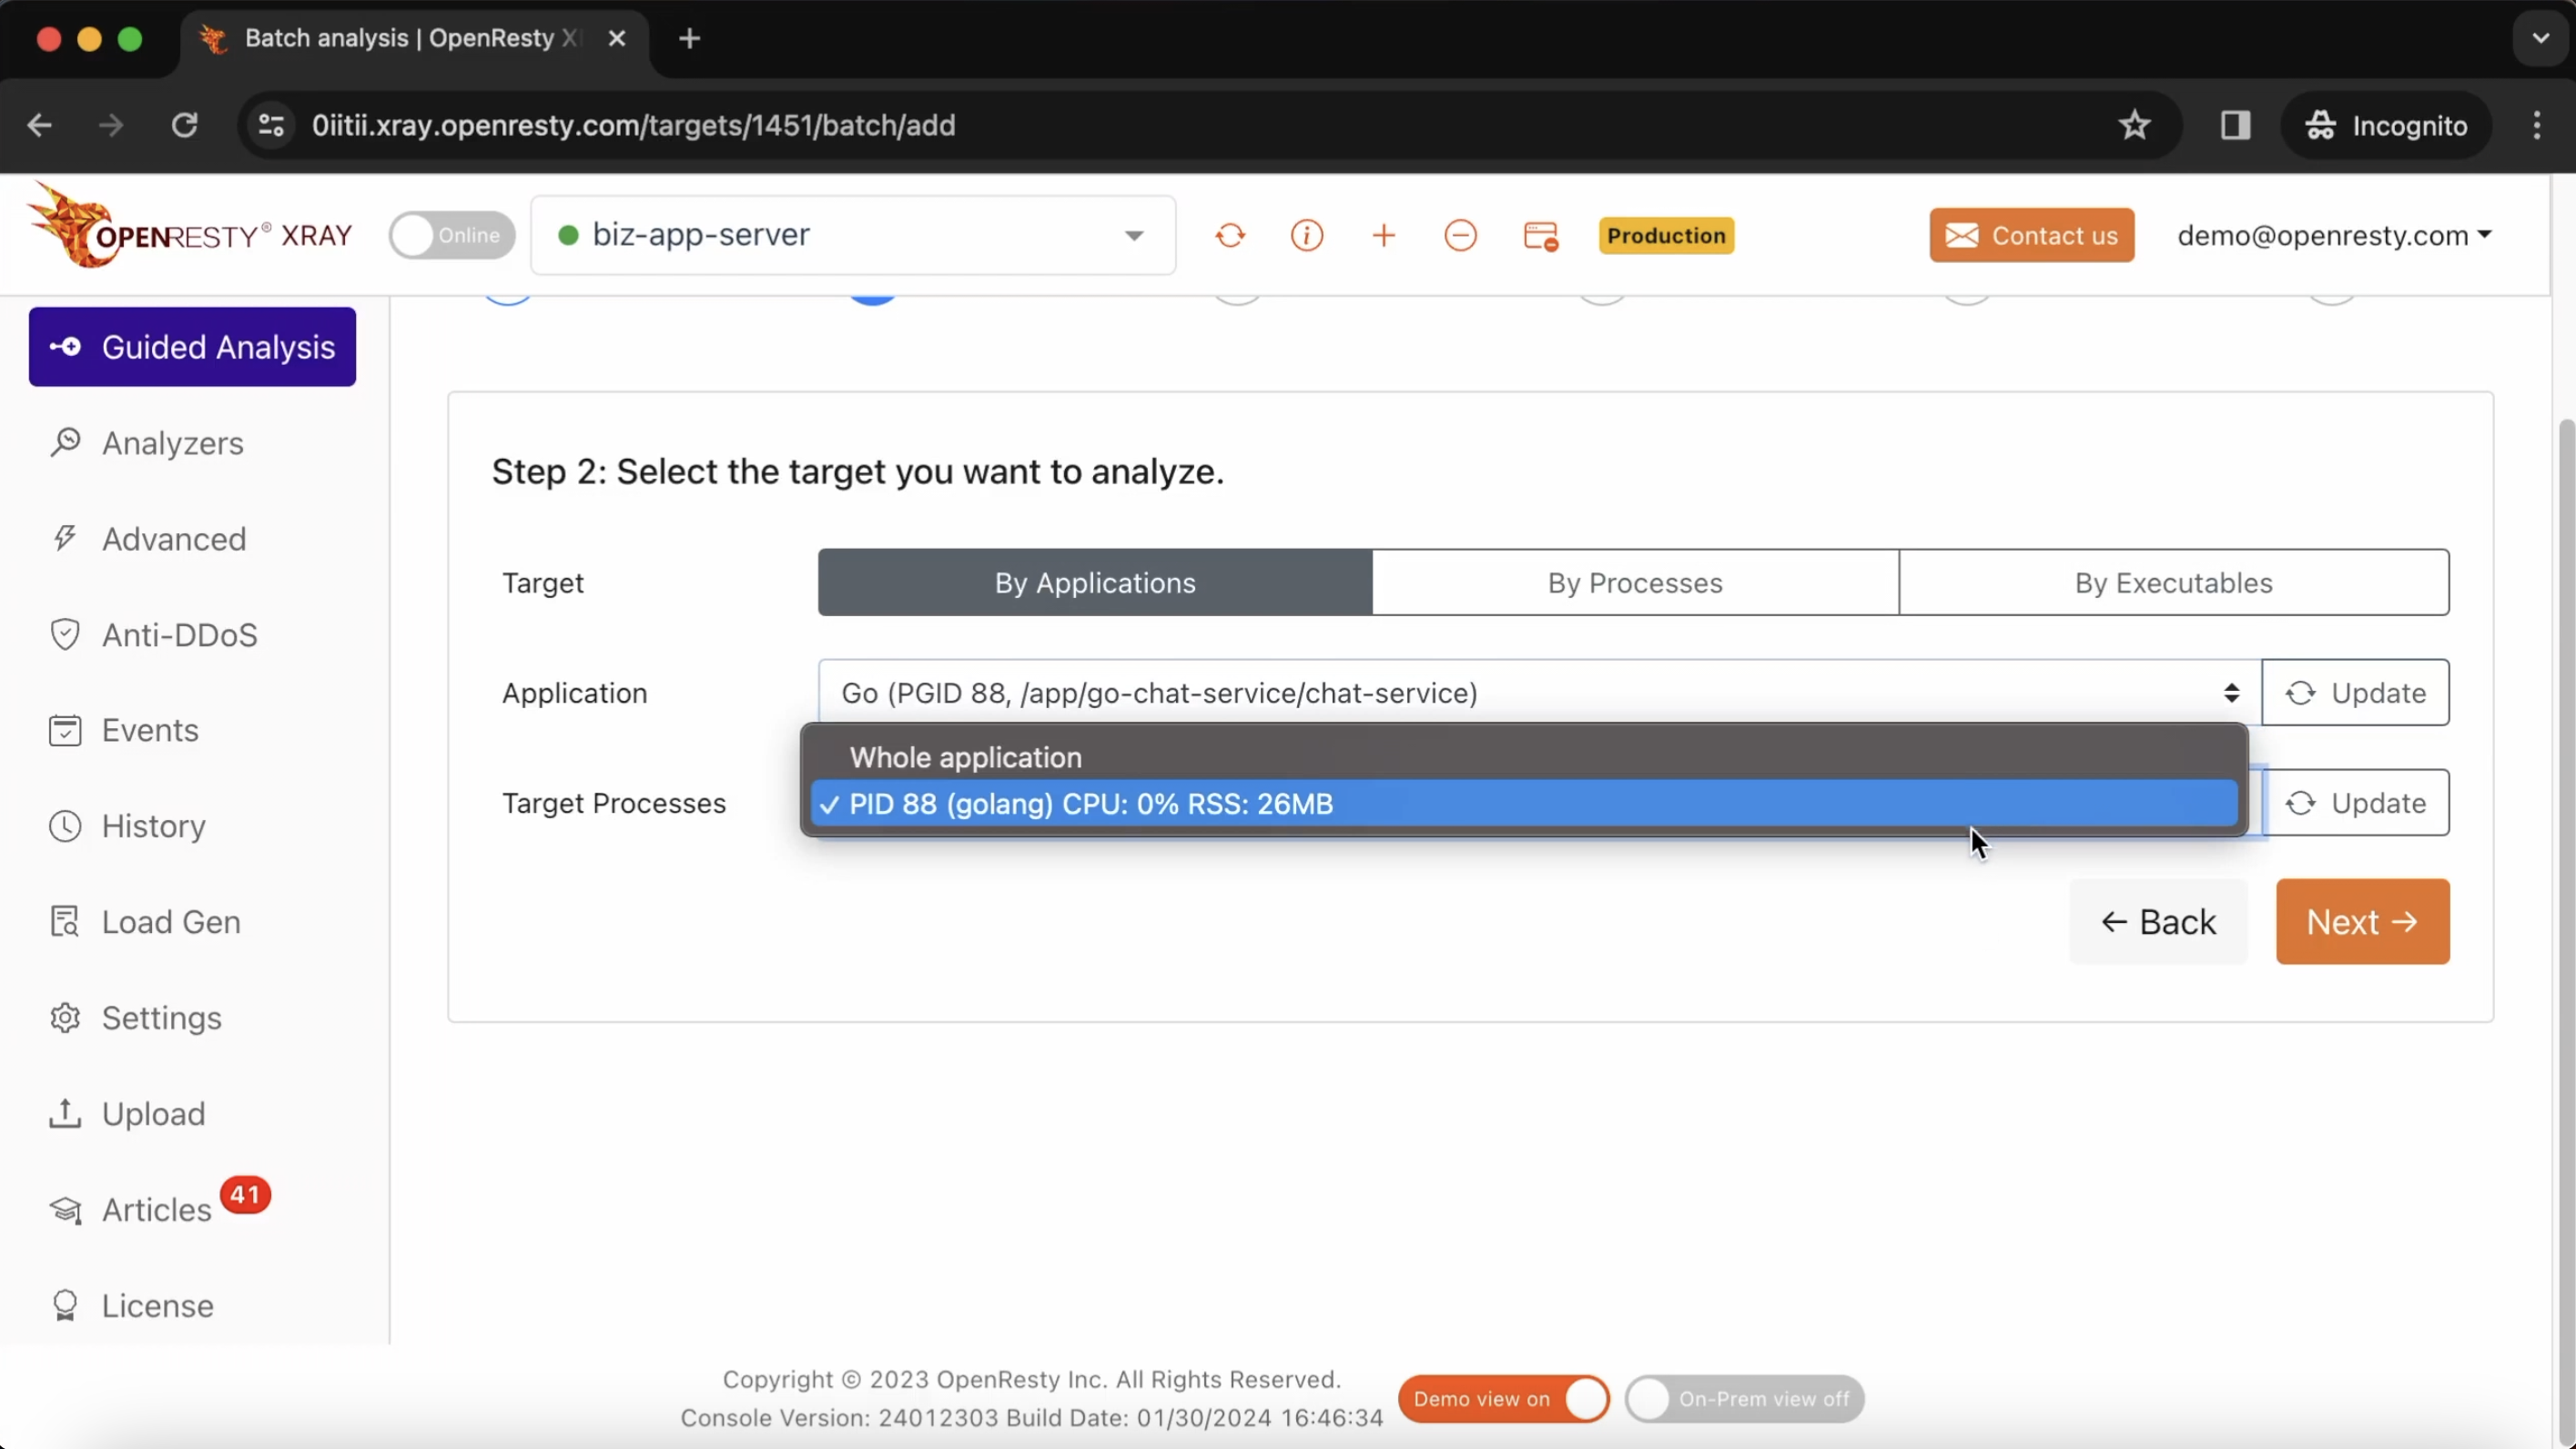
Select the Go application named ‘chat-service’.
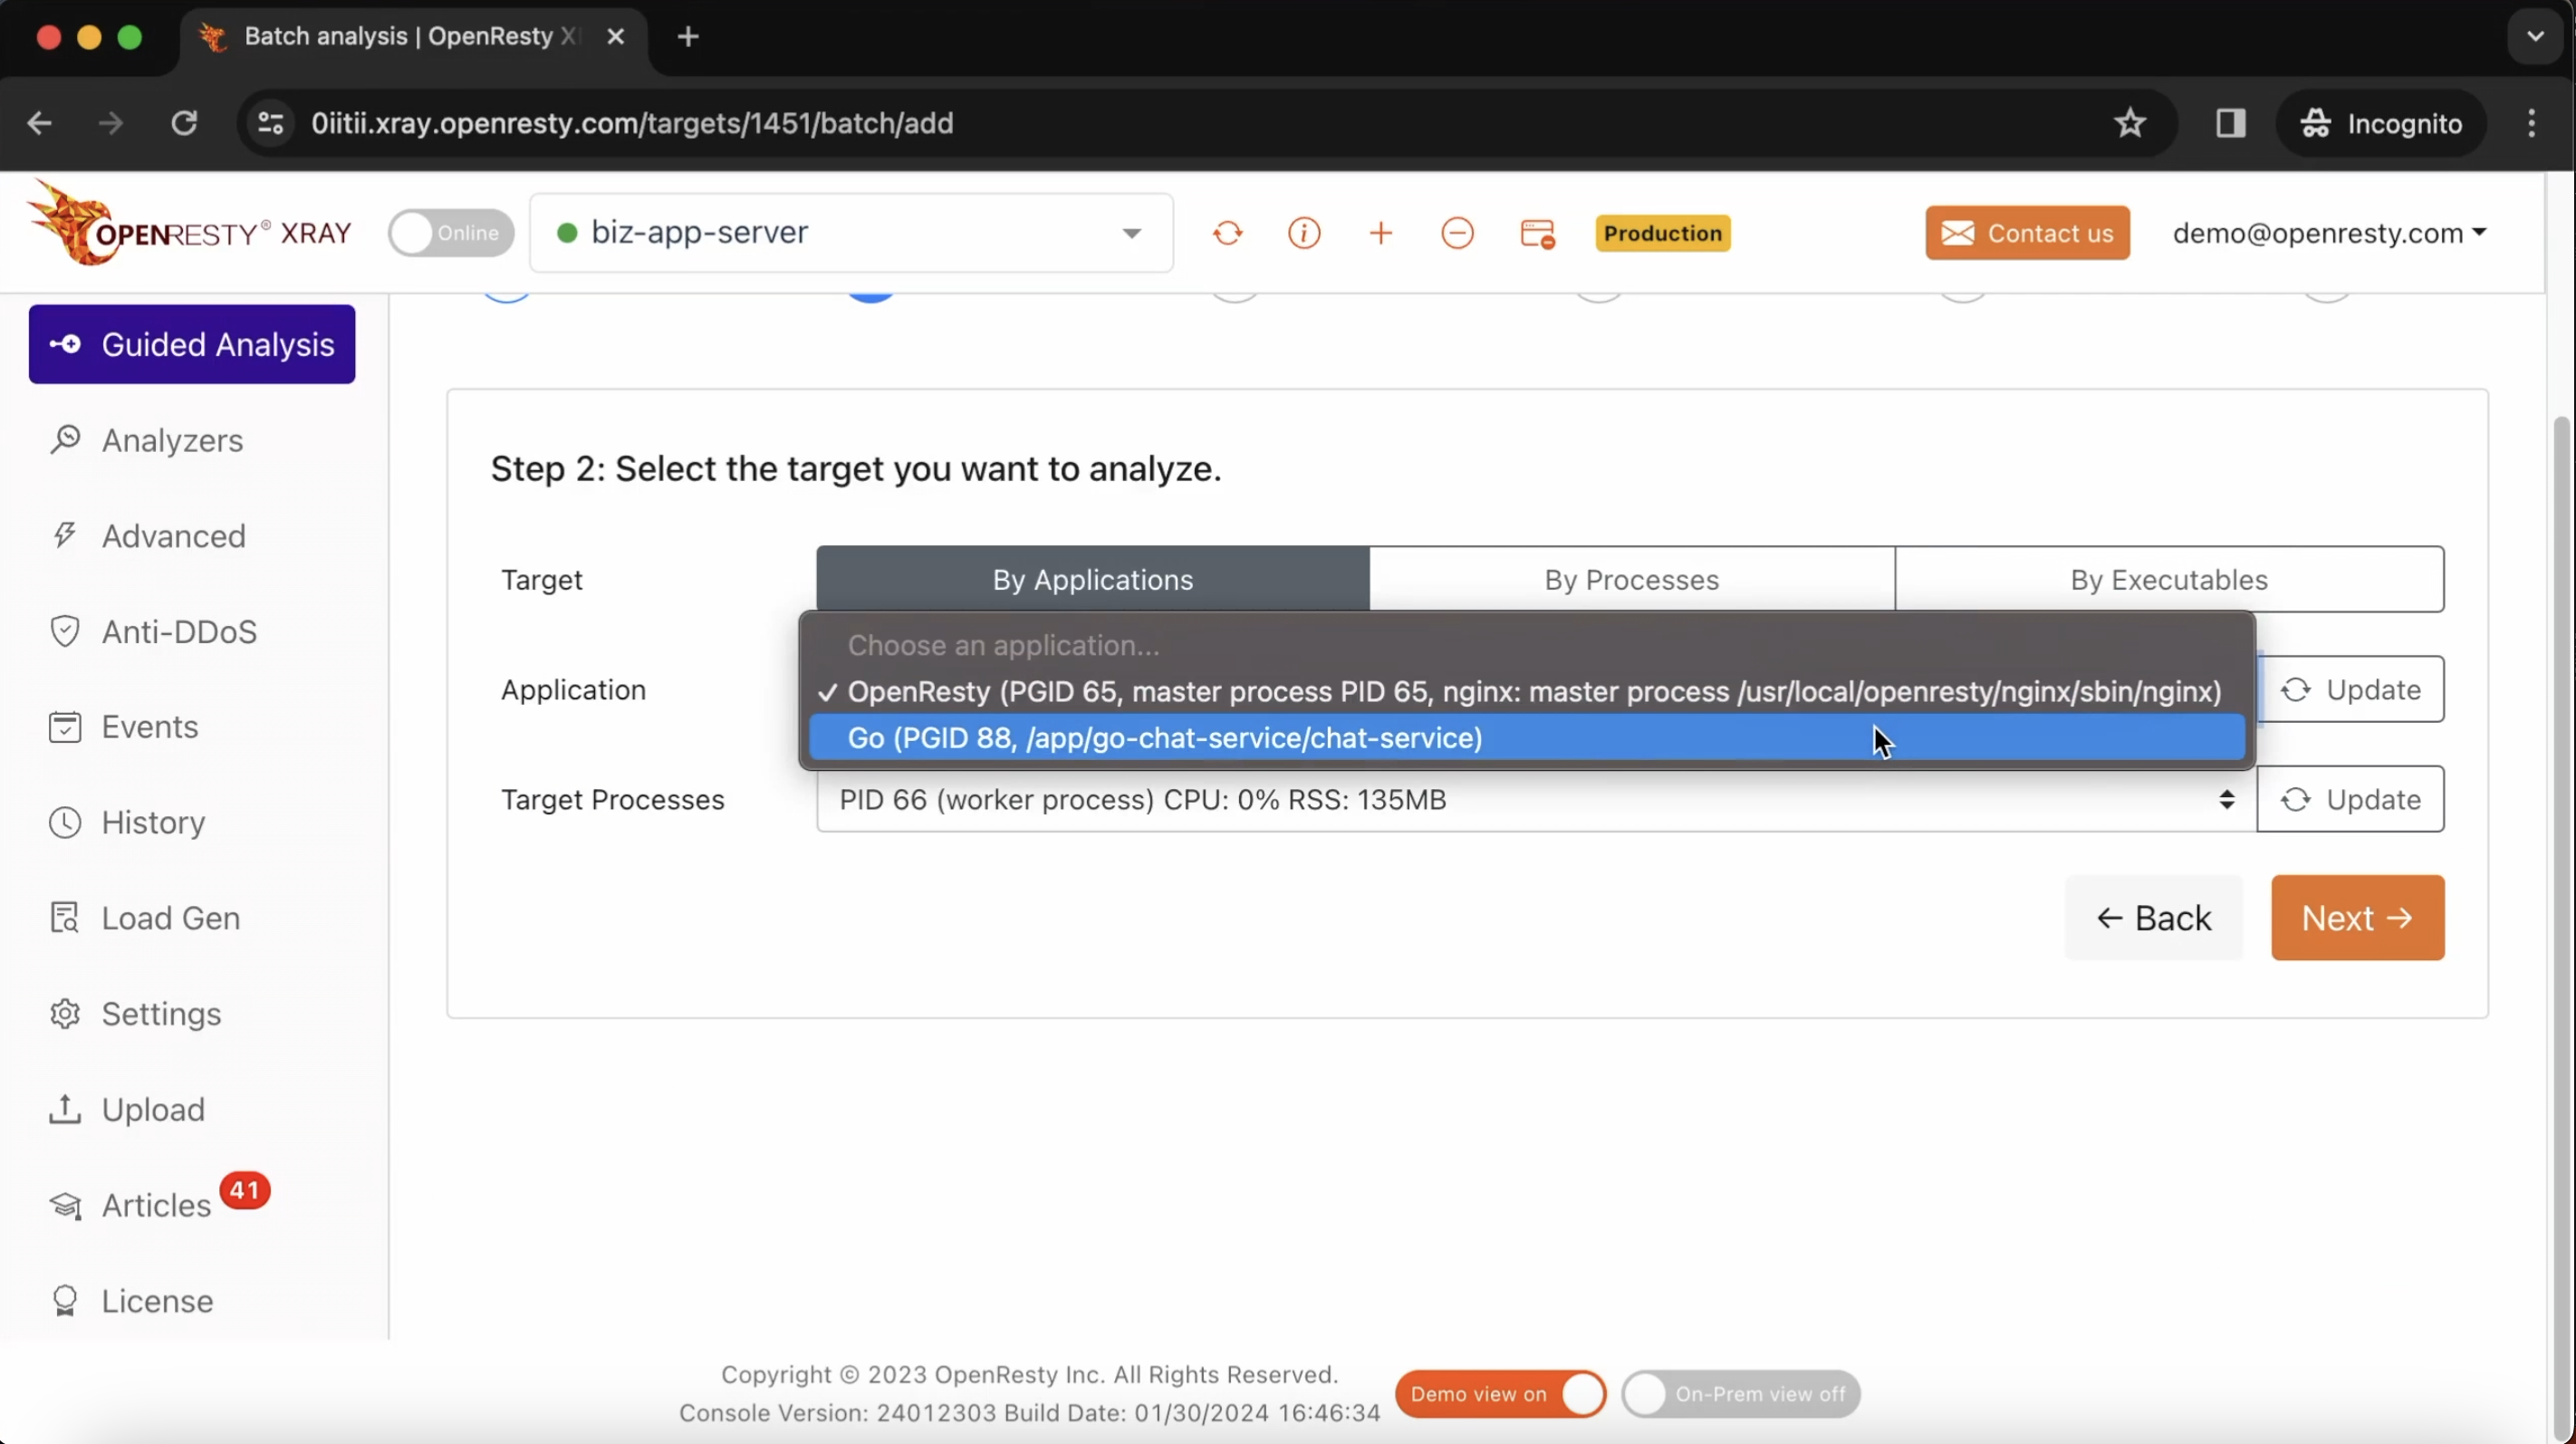
Select the process that we saw previously in ps.
Make sure that the application type is right. Usually the default should be correct.
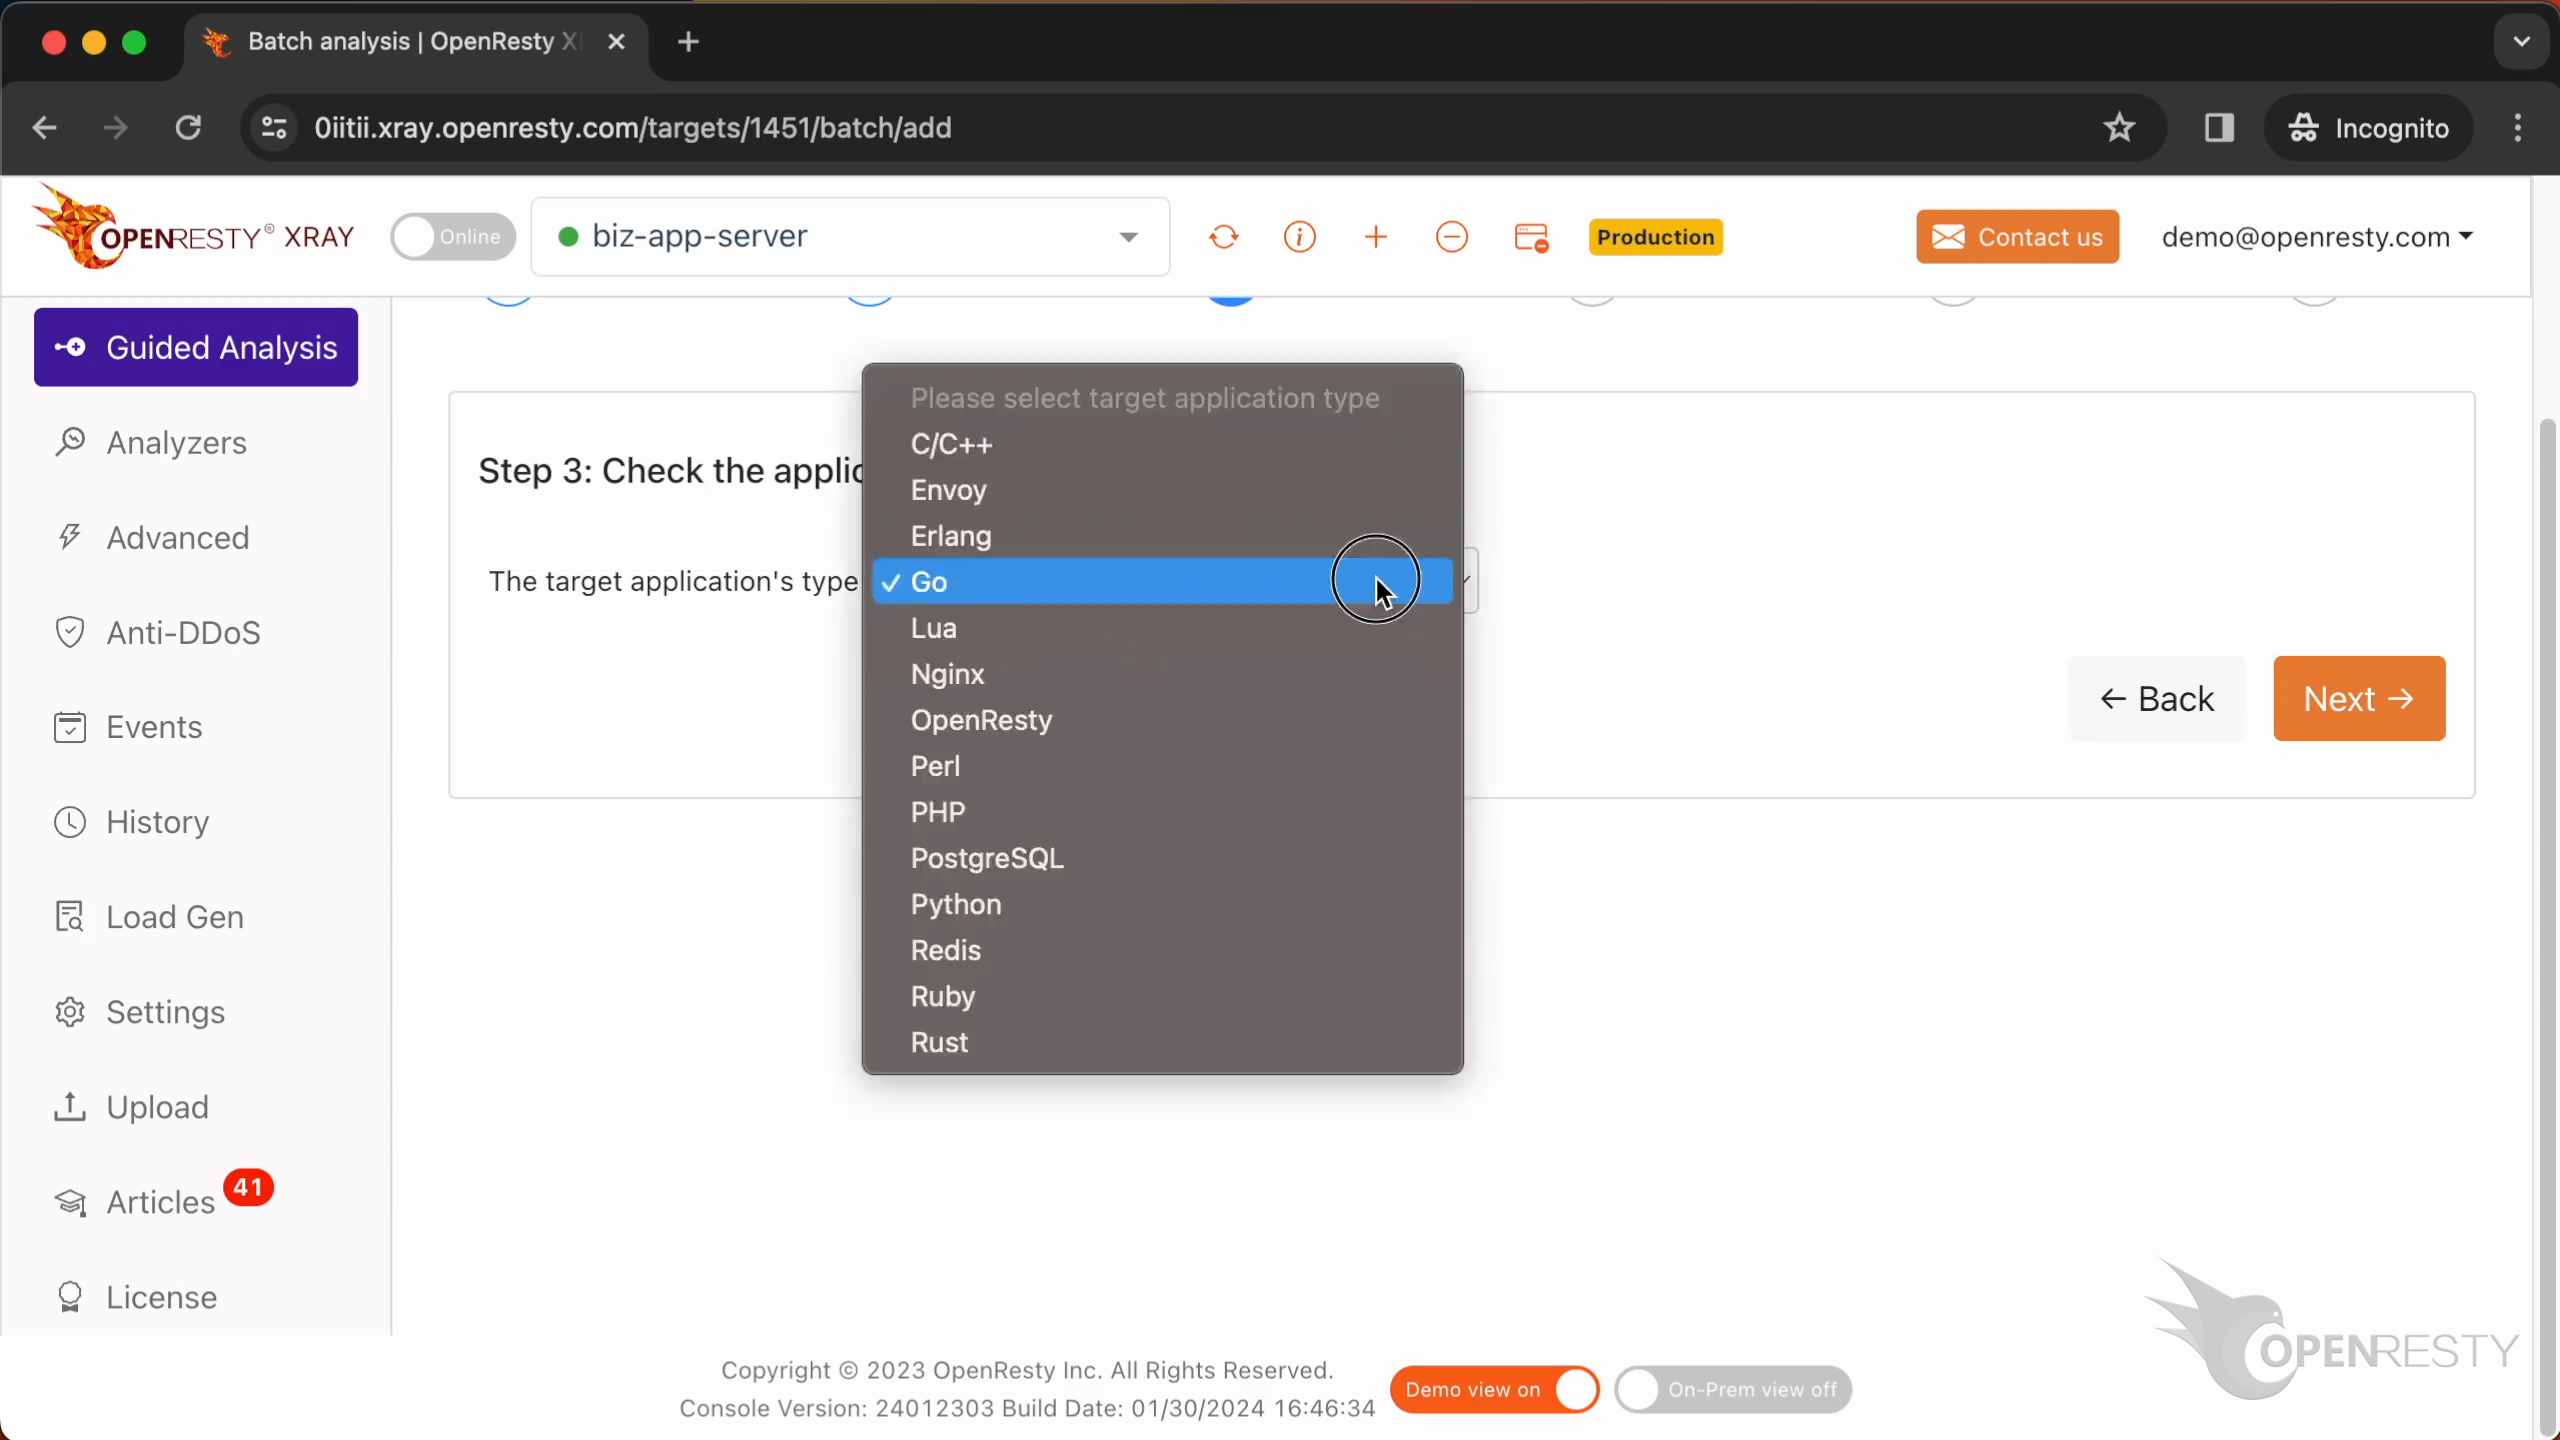
The language level is just “Go”.
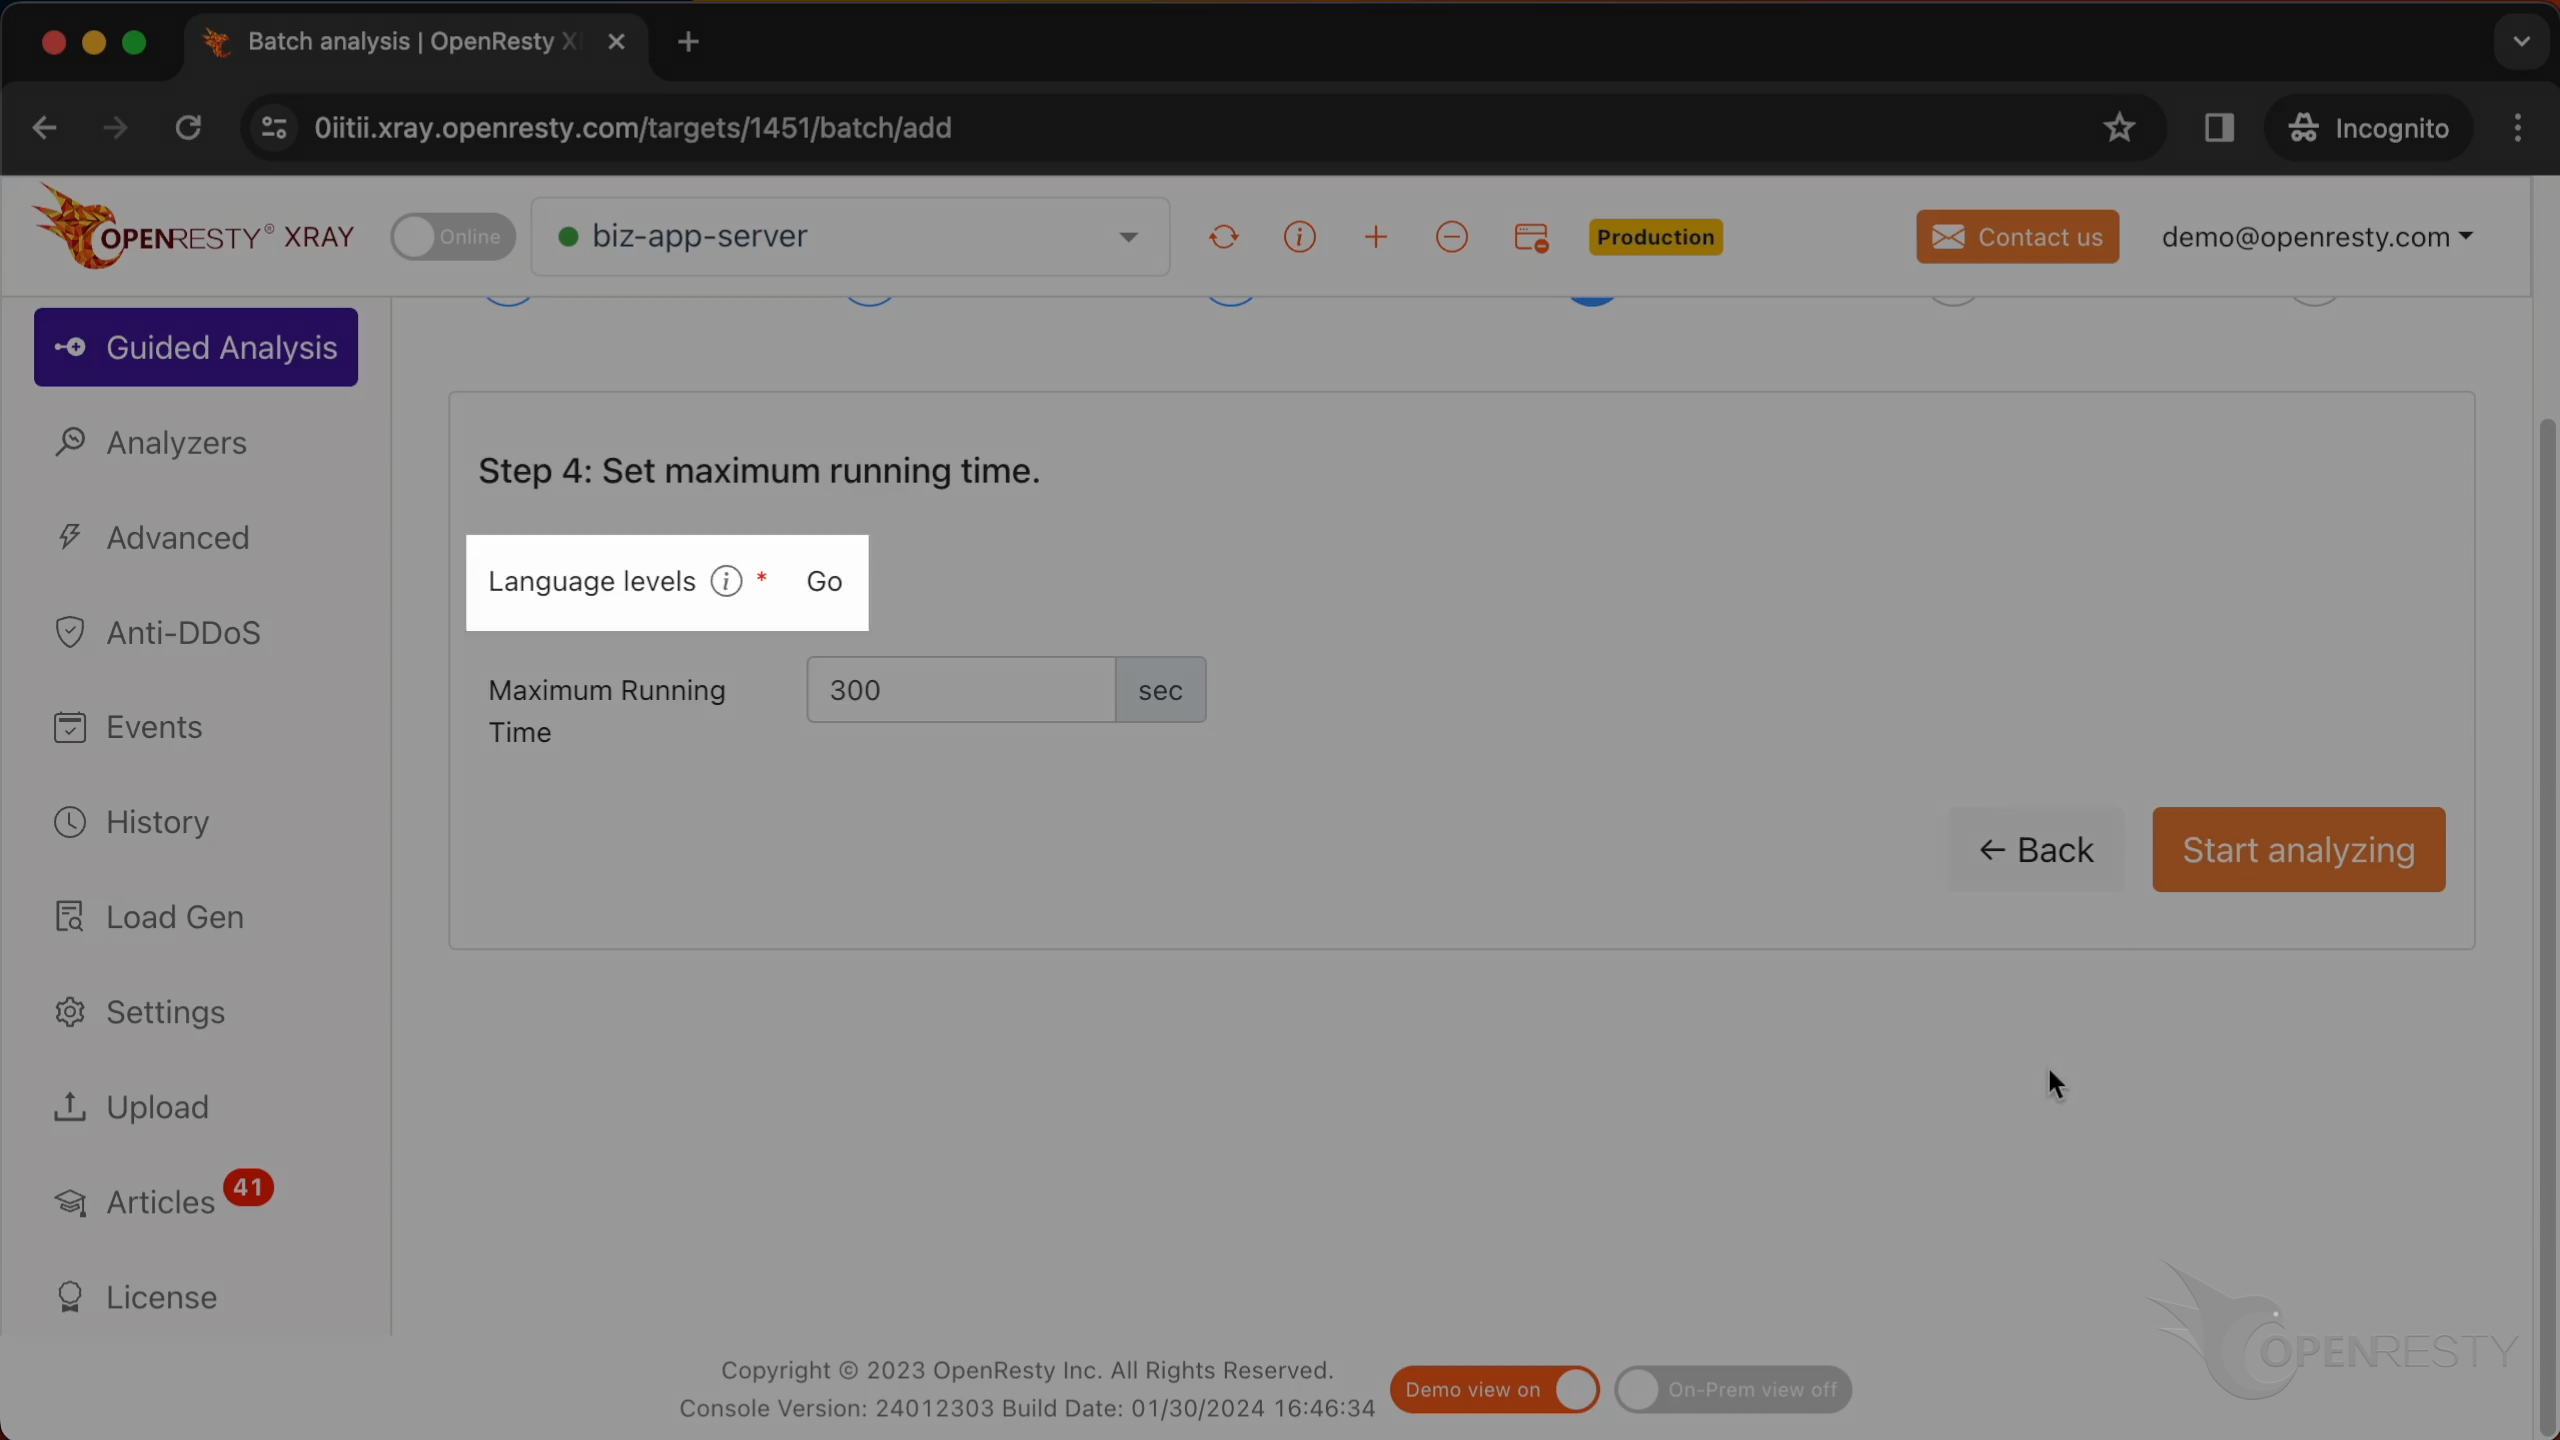
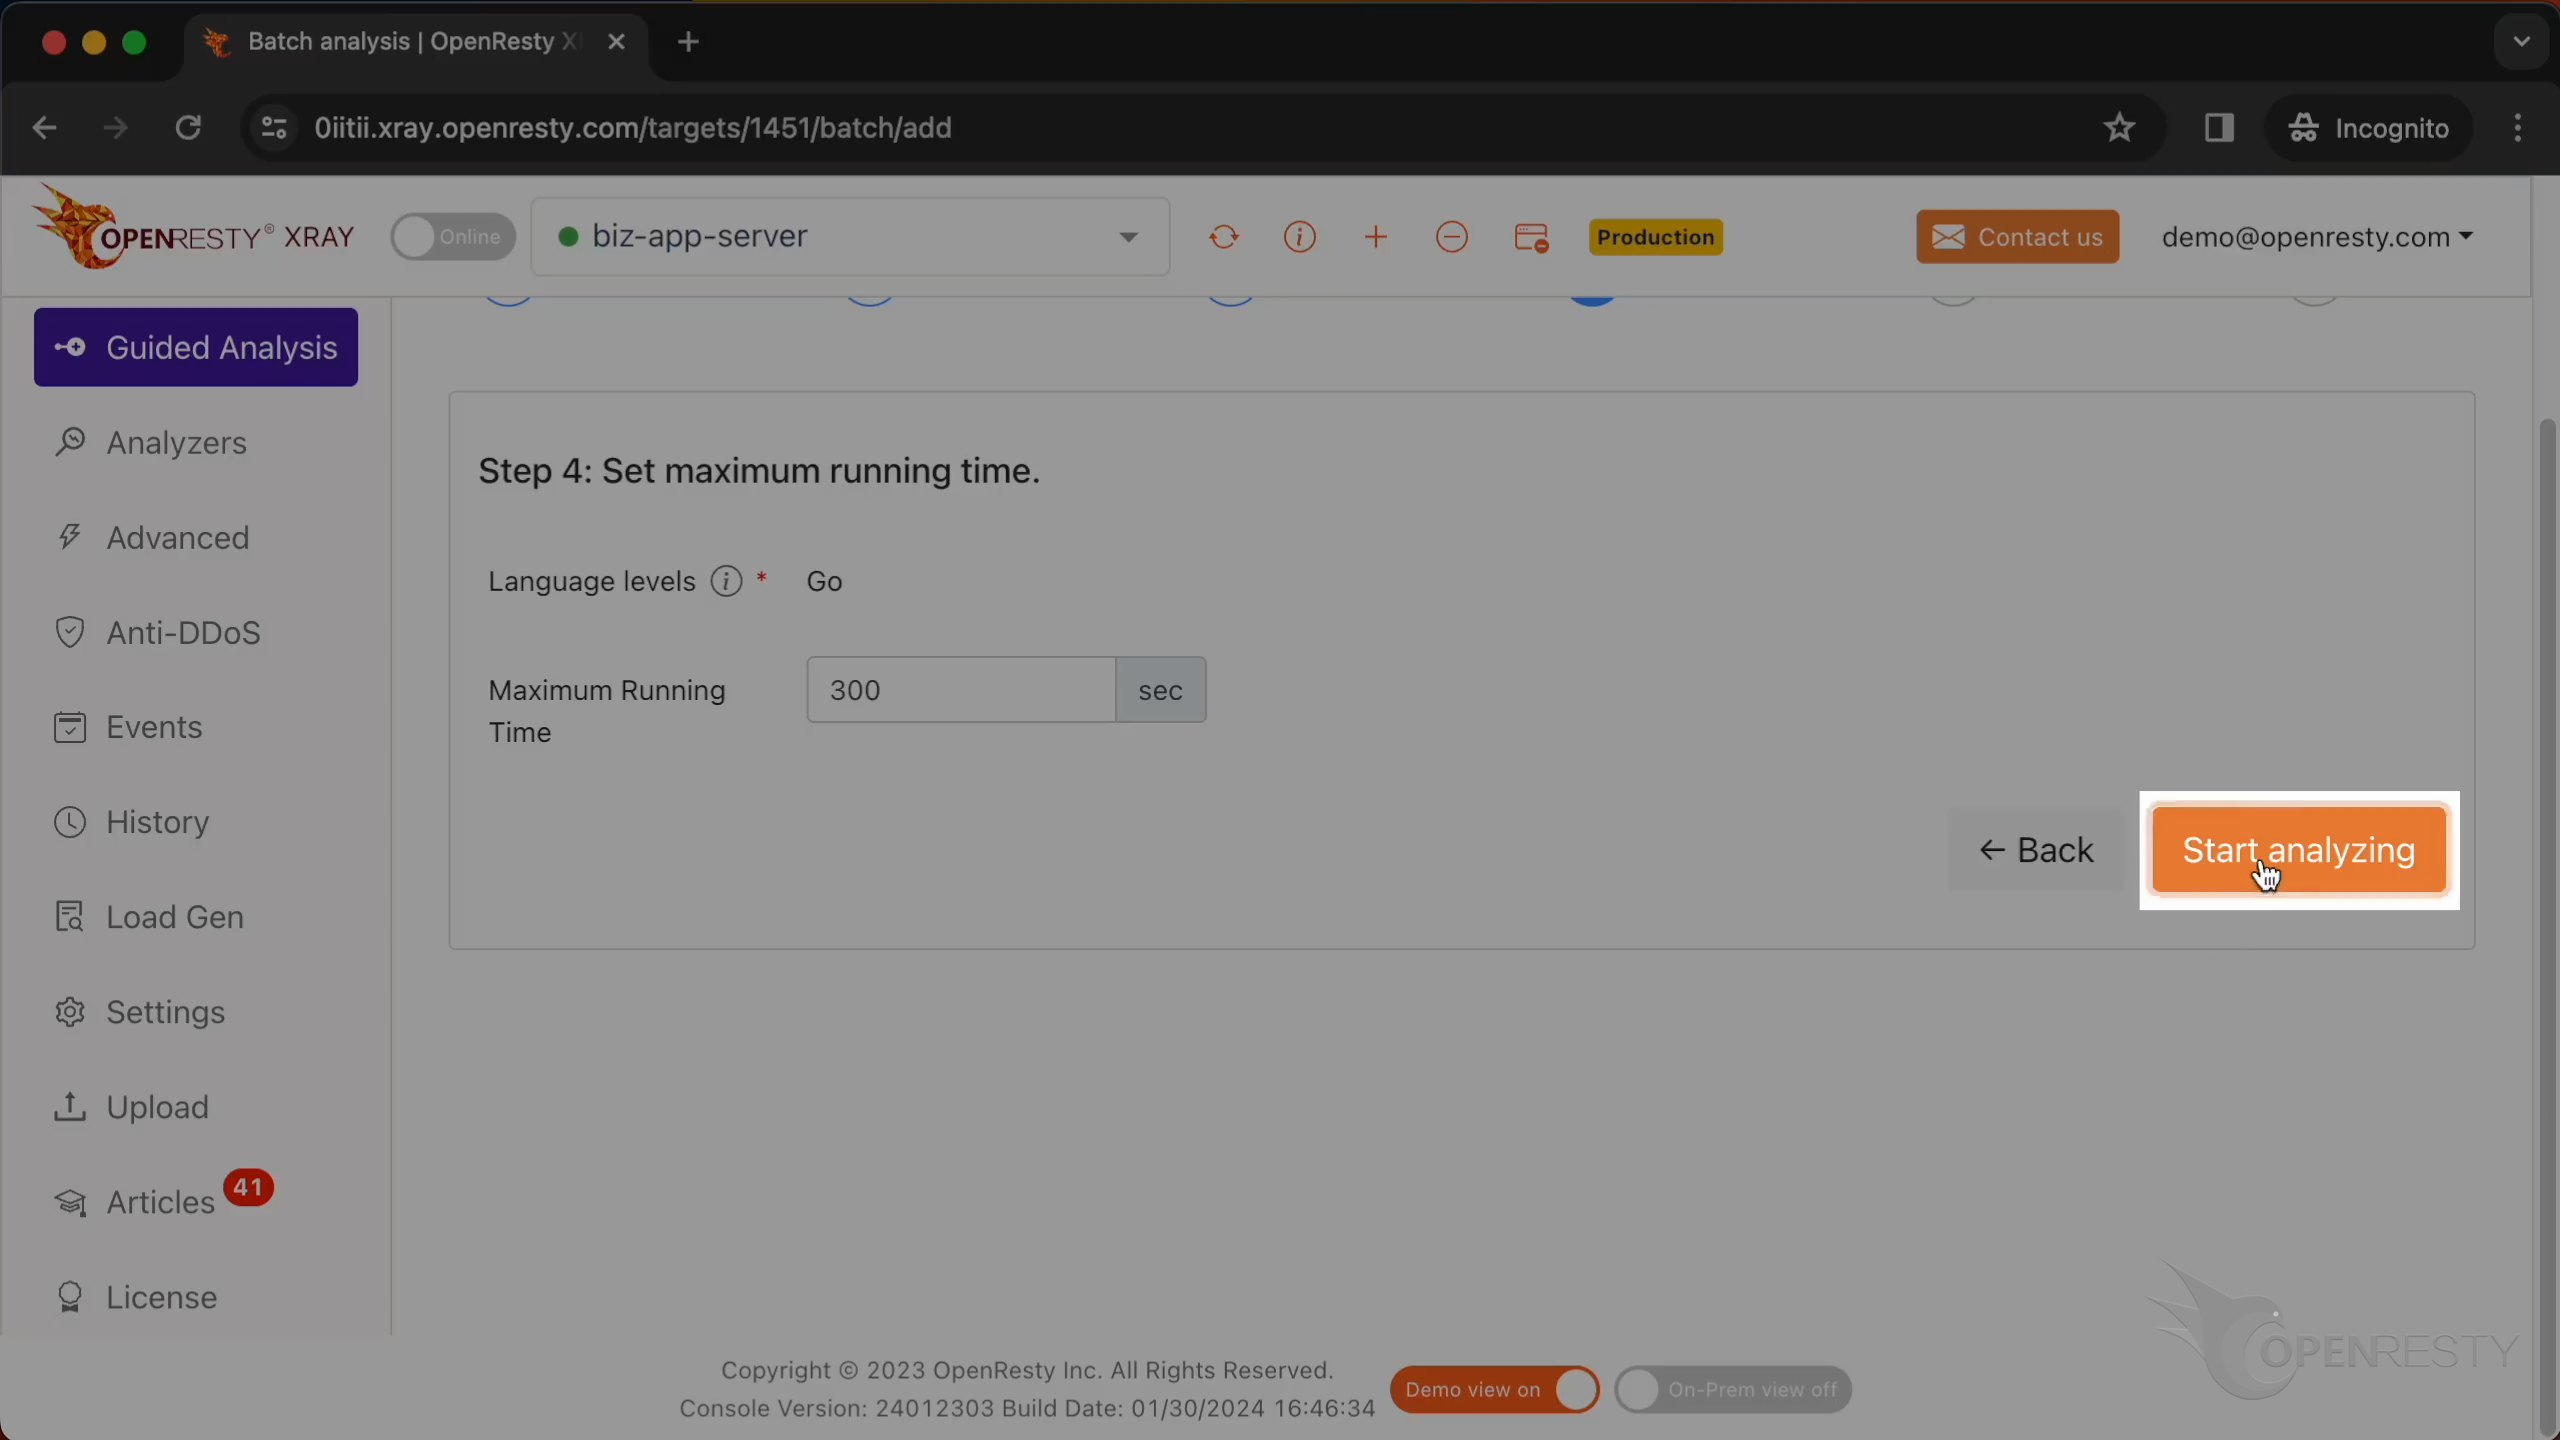
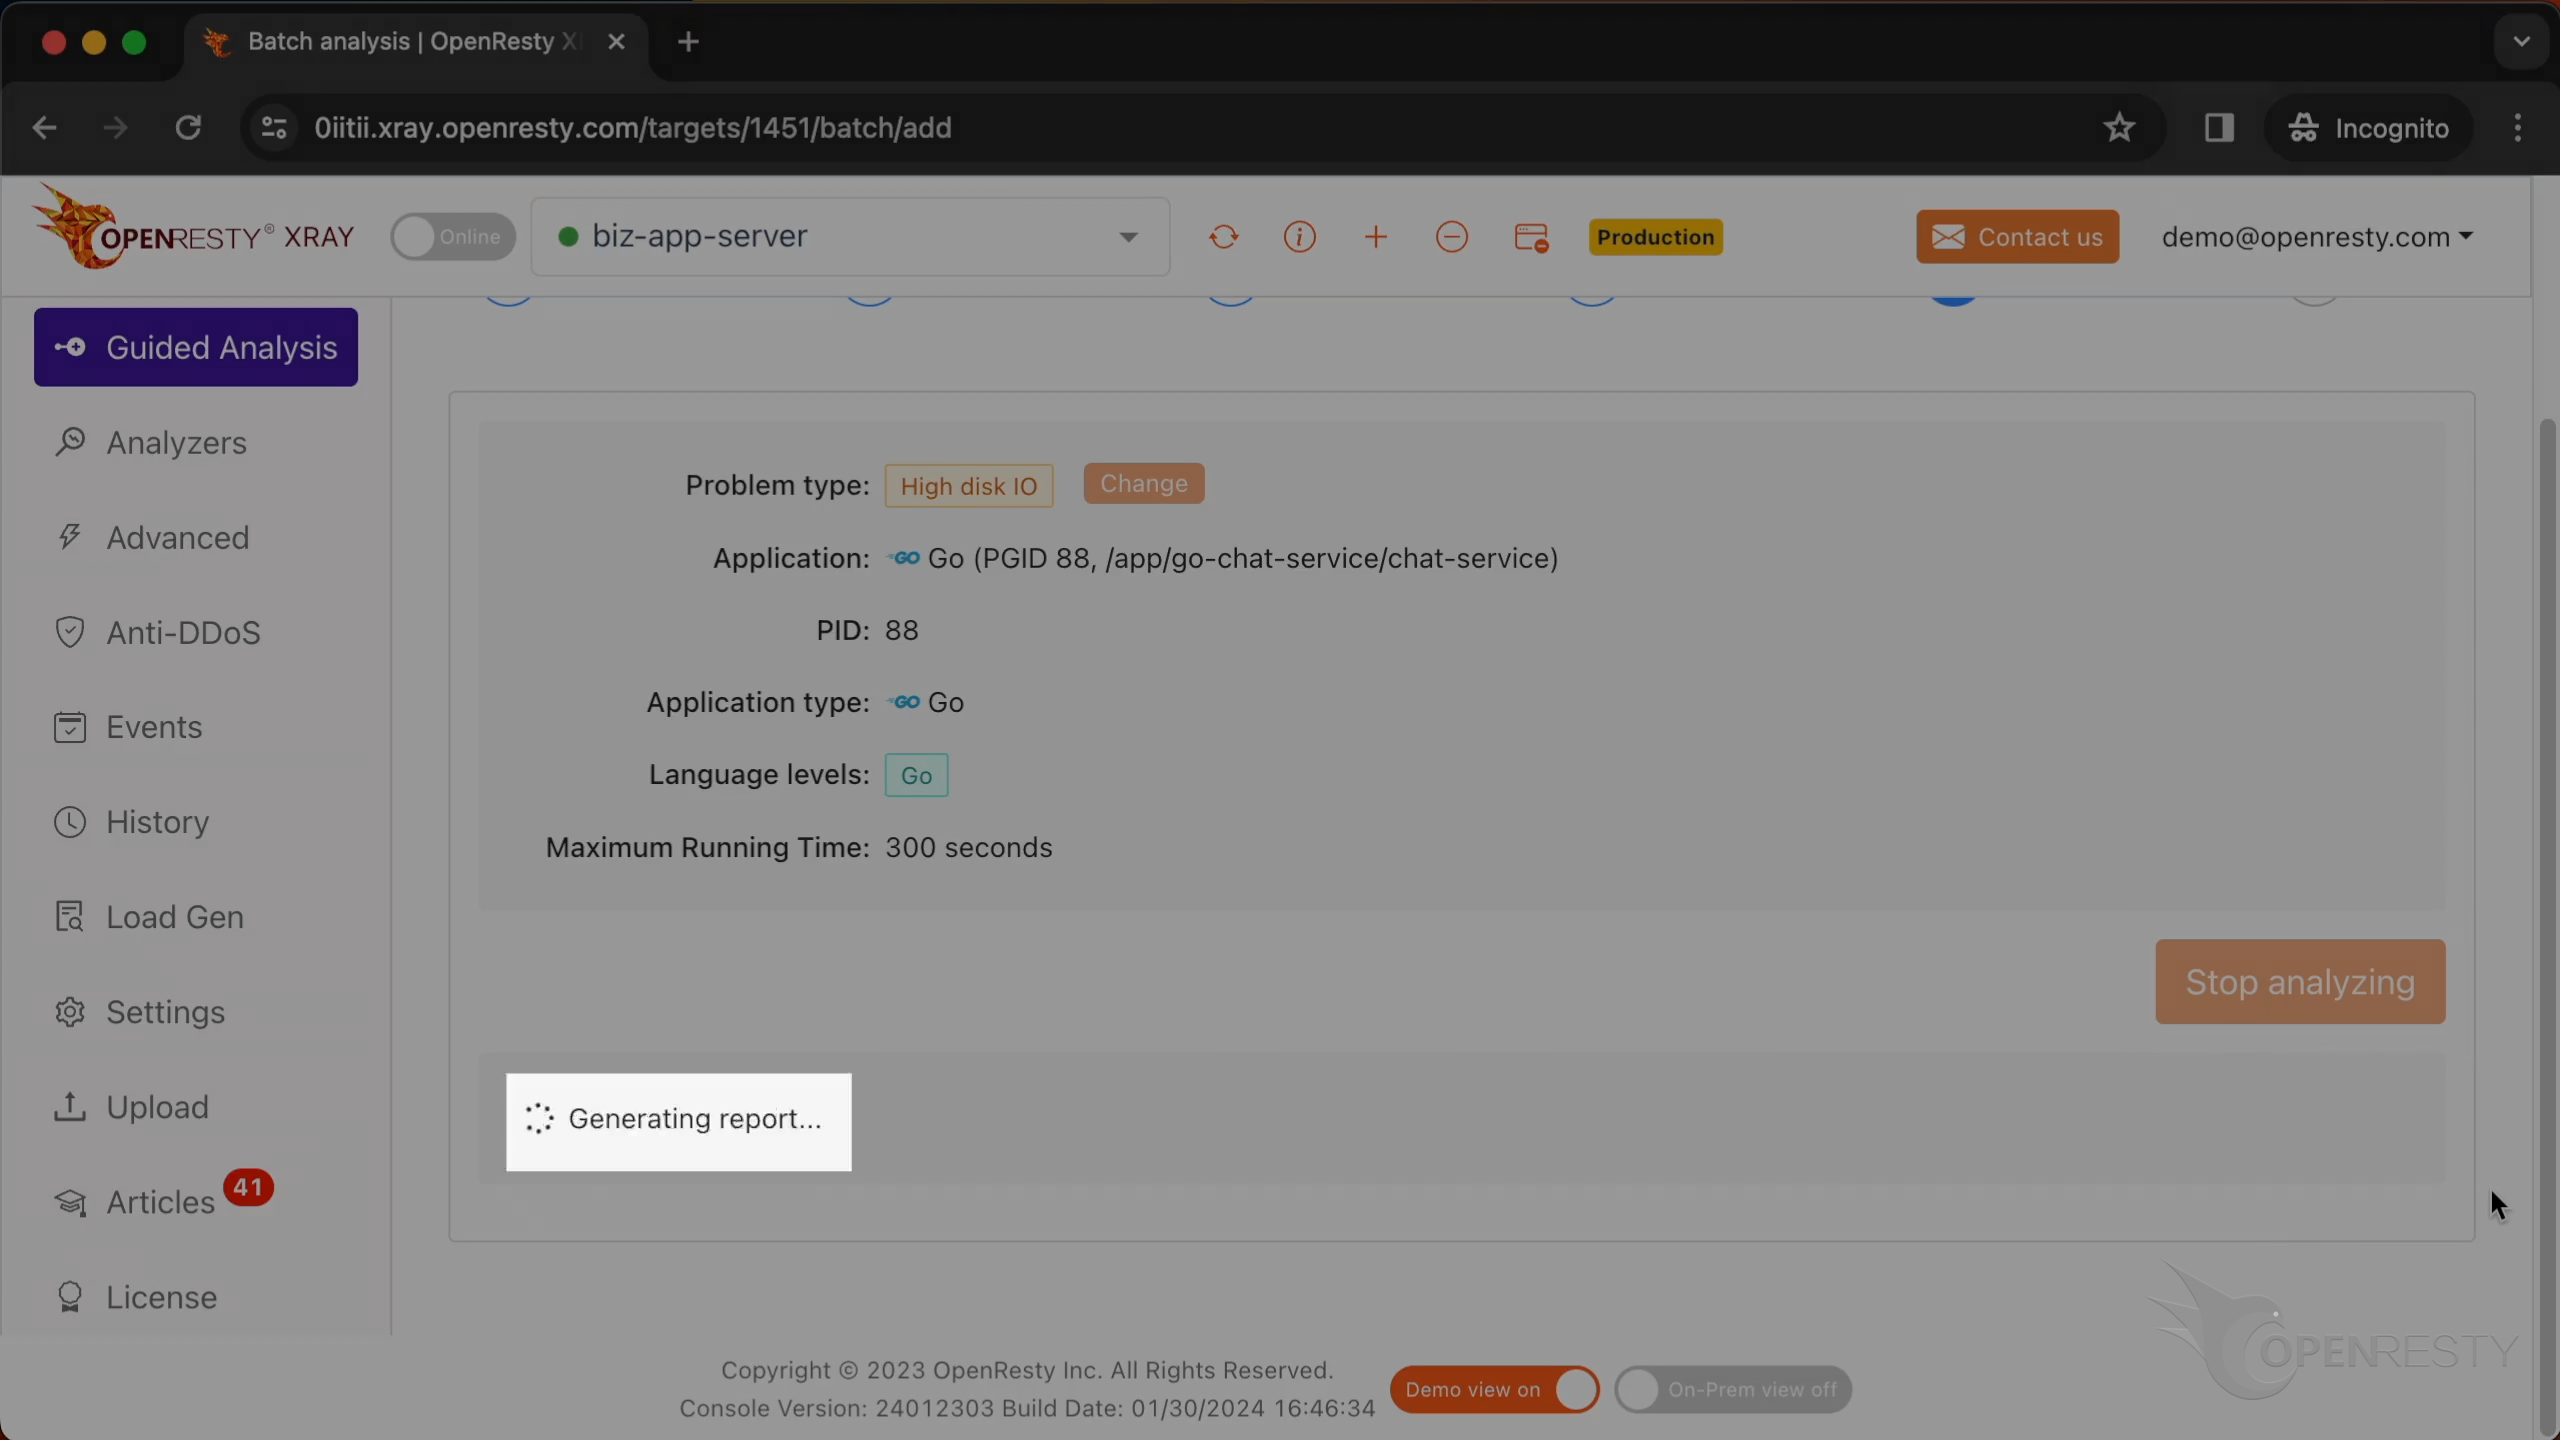
We can also set the maximum analyzing time. We’ll leave it as 300 seconds, which is the default value.

Let’s start analyzing.
The system will keep performing different rounds of analysis. Now it’s executing the first round.

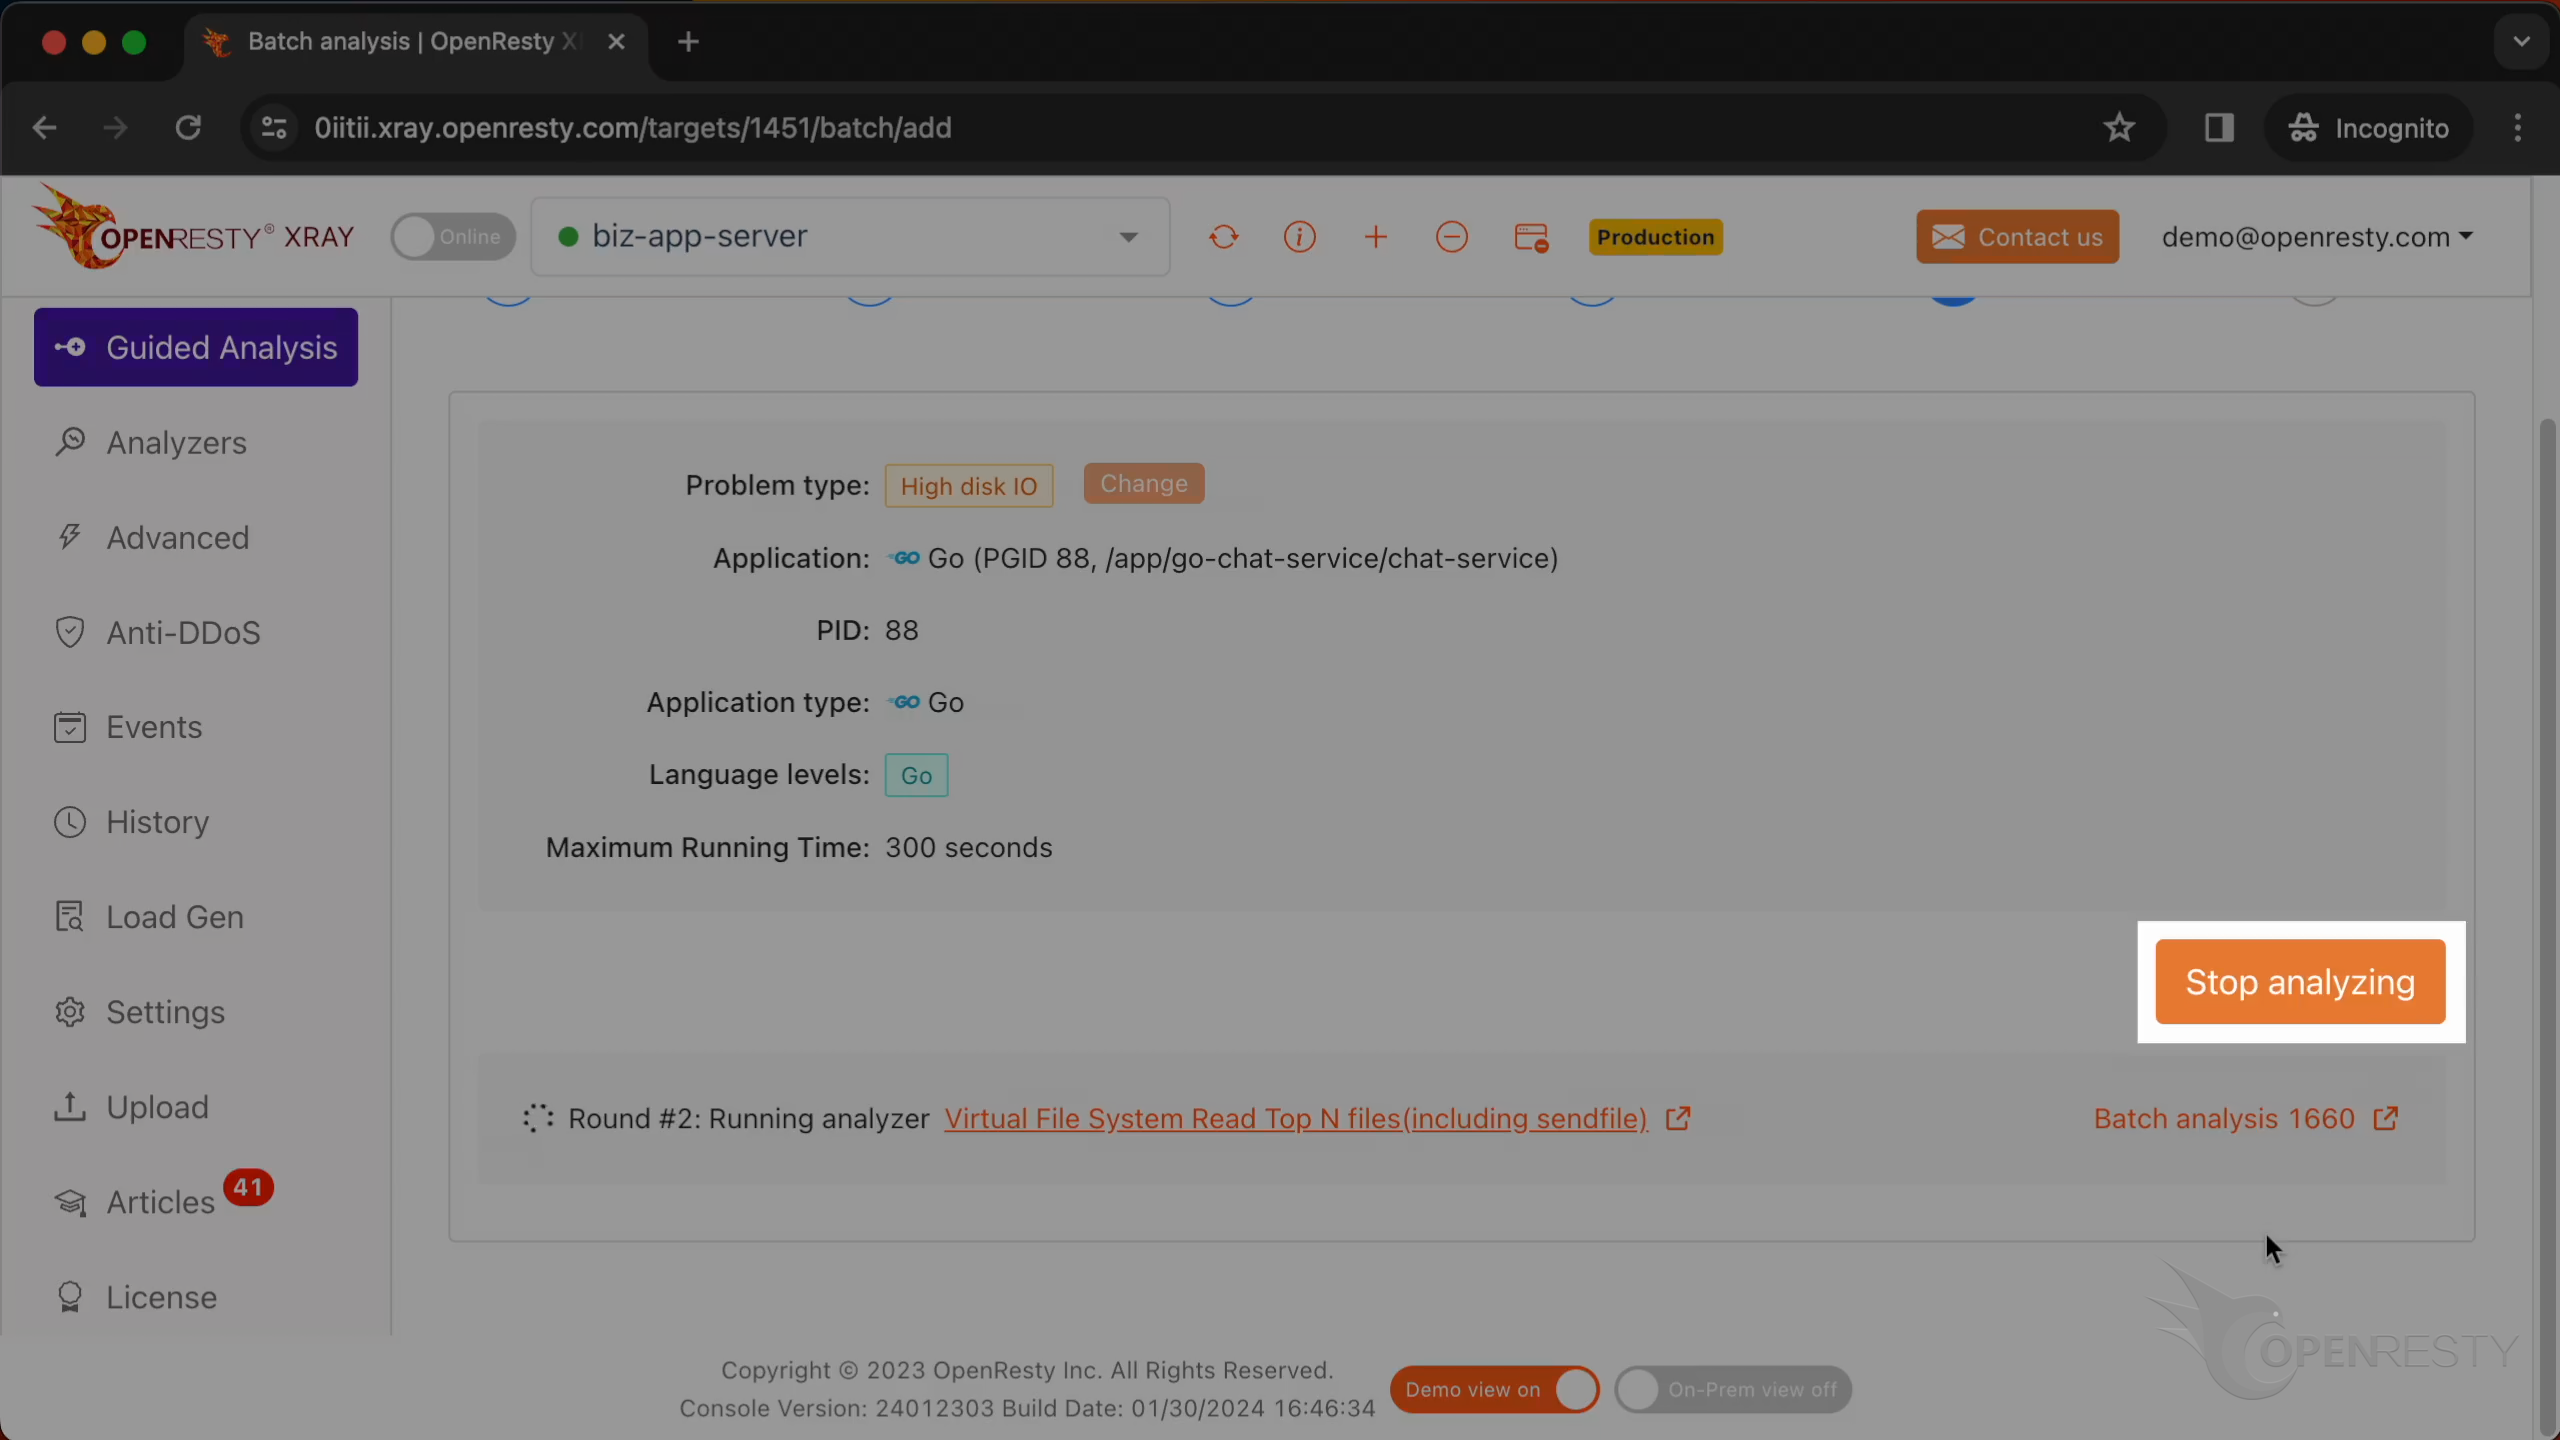
The first round is done and it’s on to the second one already. That’s enough for this case.
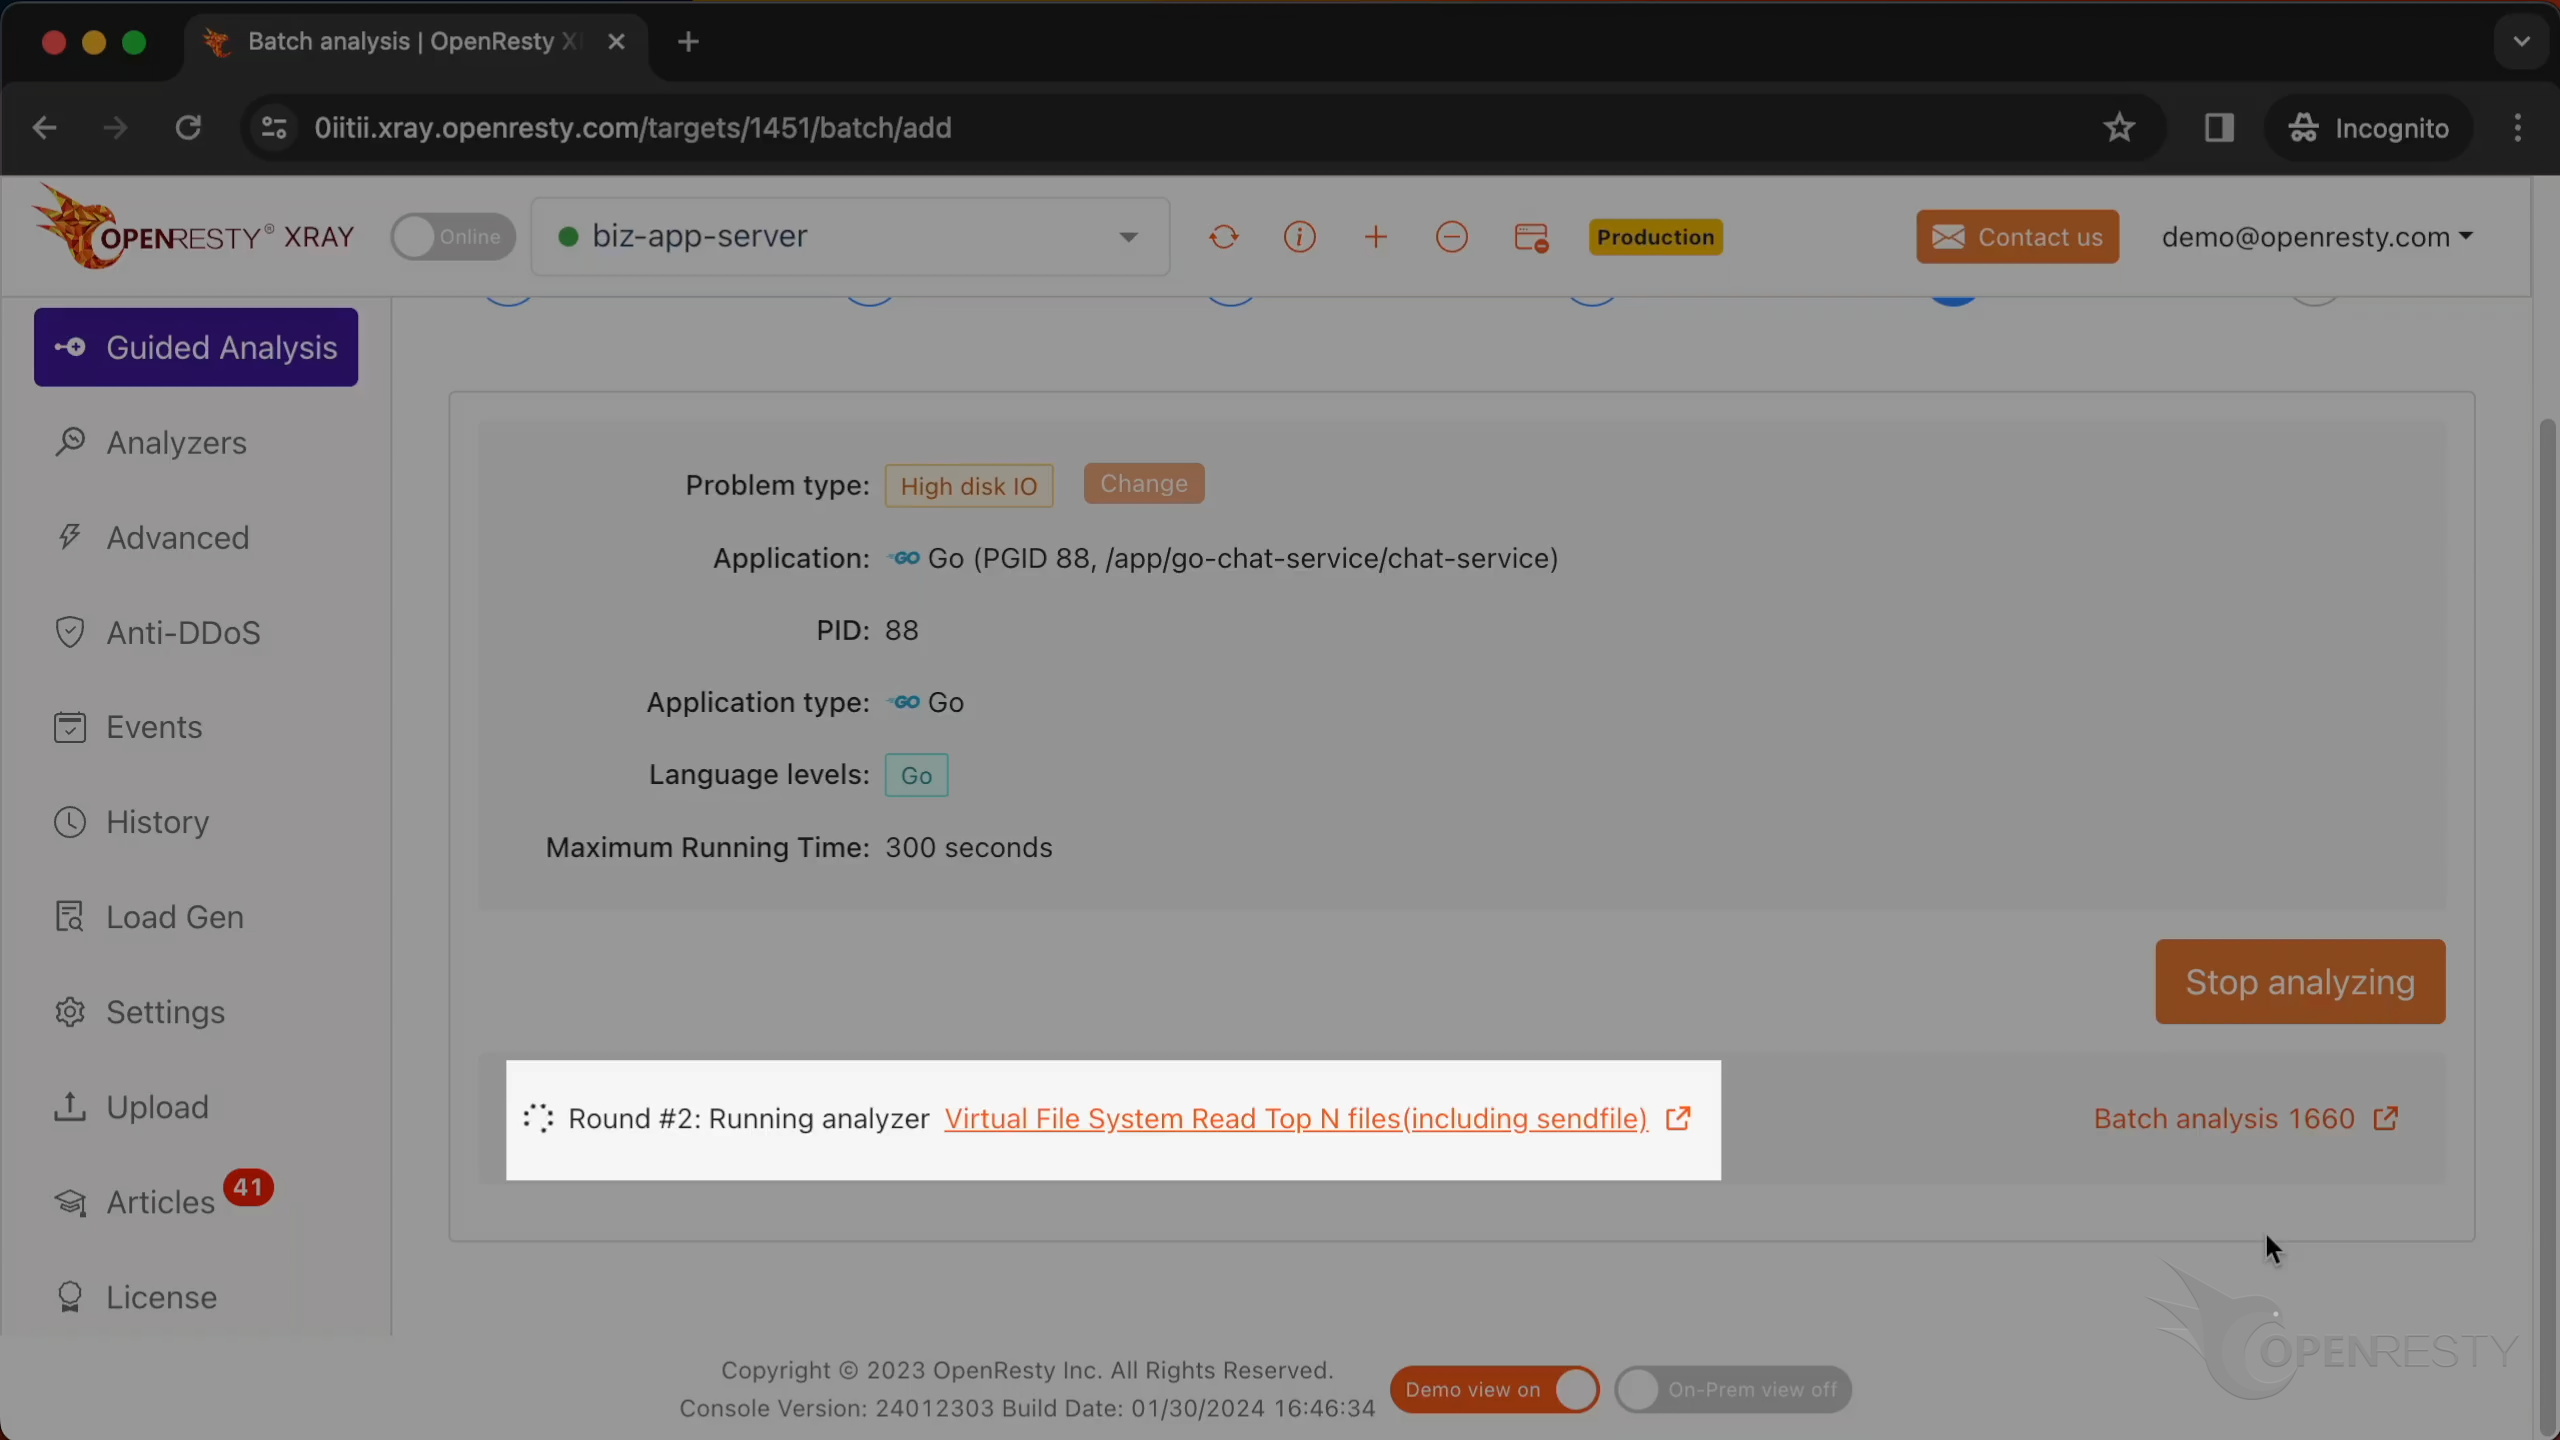
Let’s stop analyzing.
It shows that the system is generating a report.
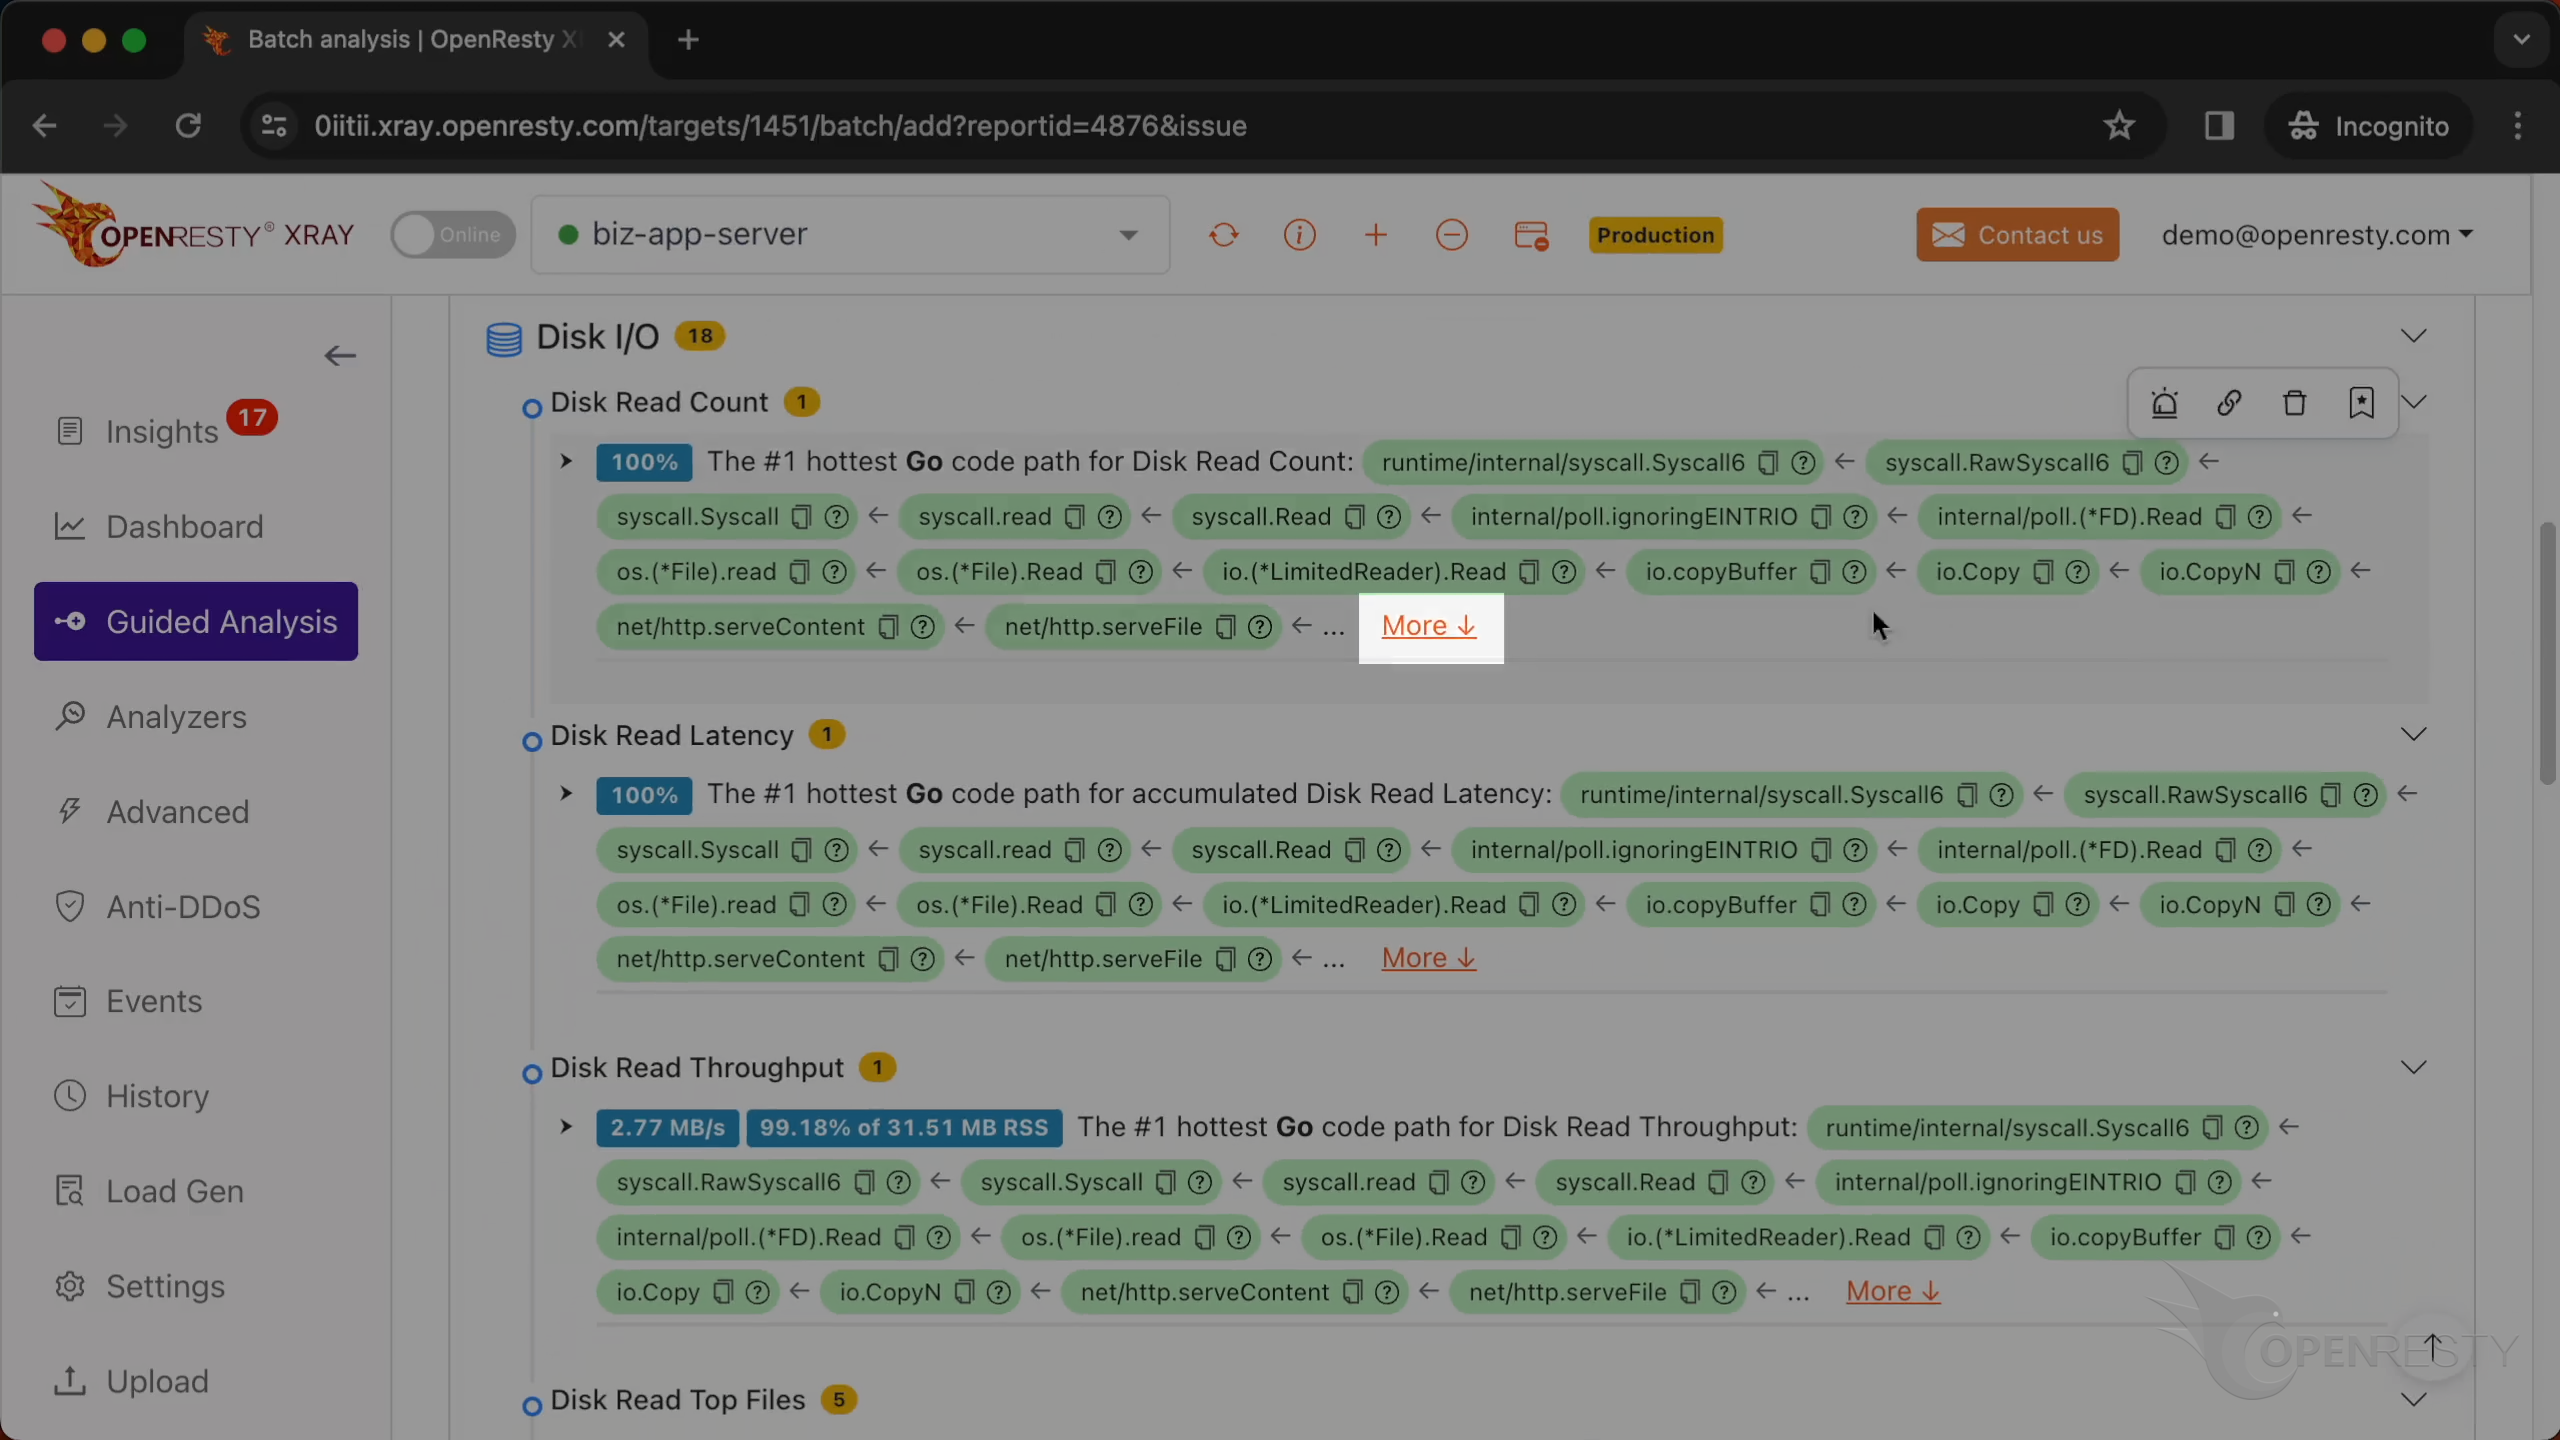
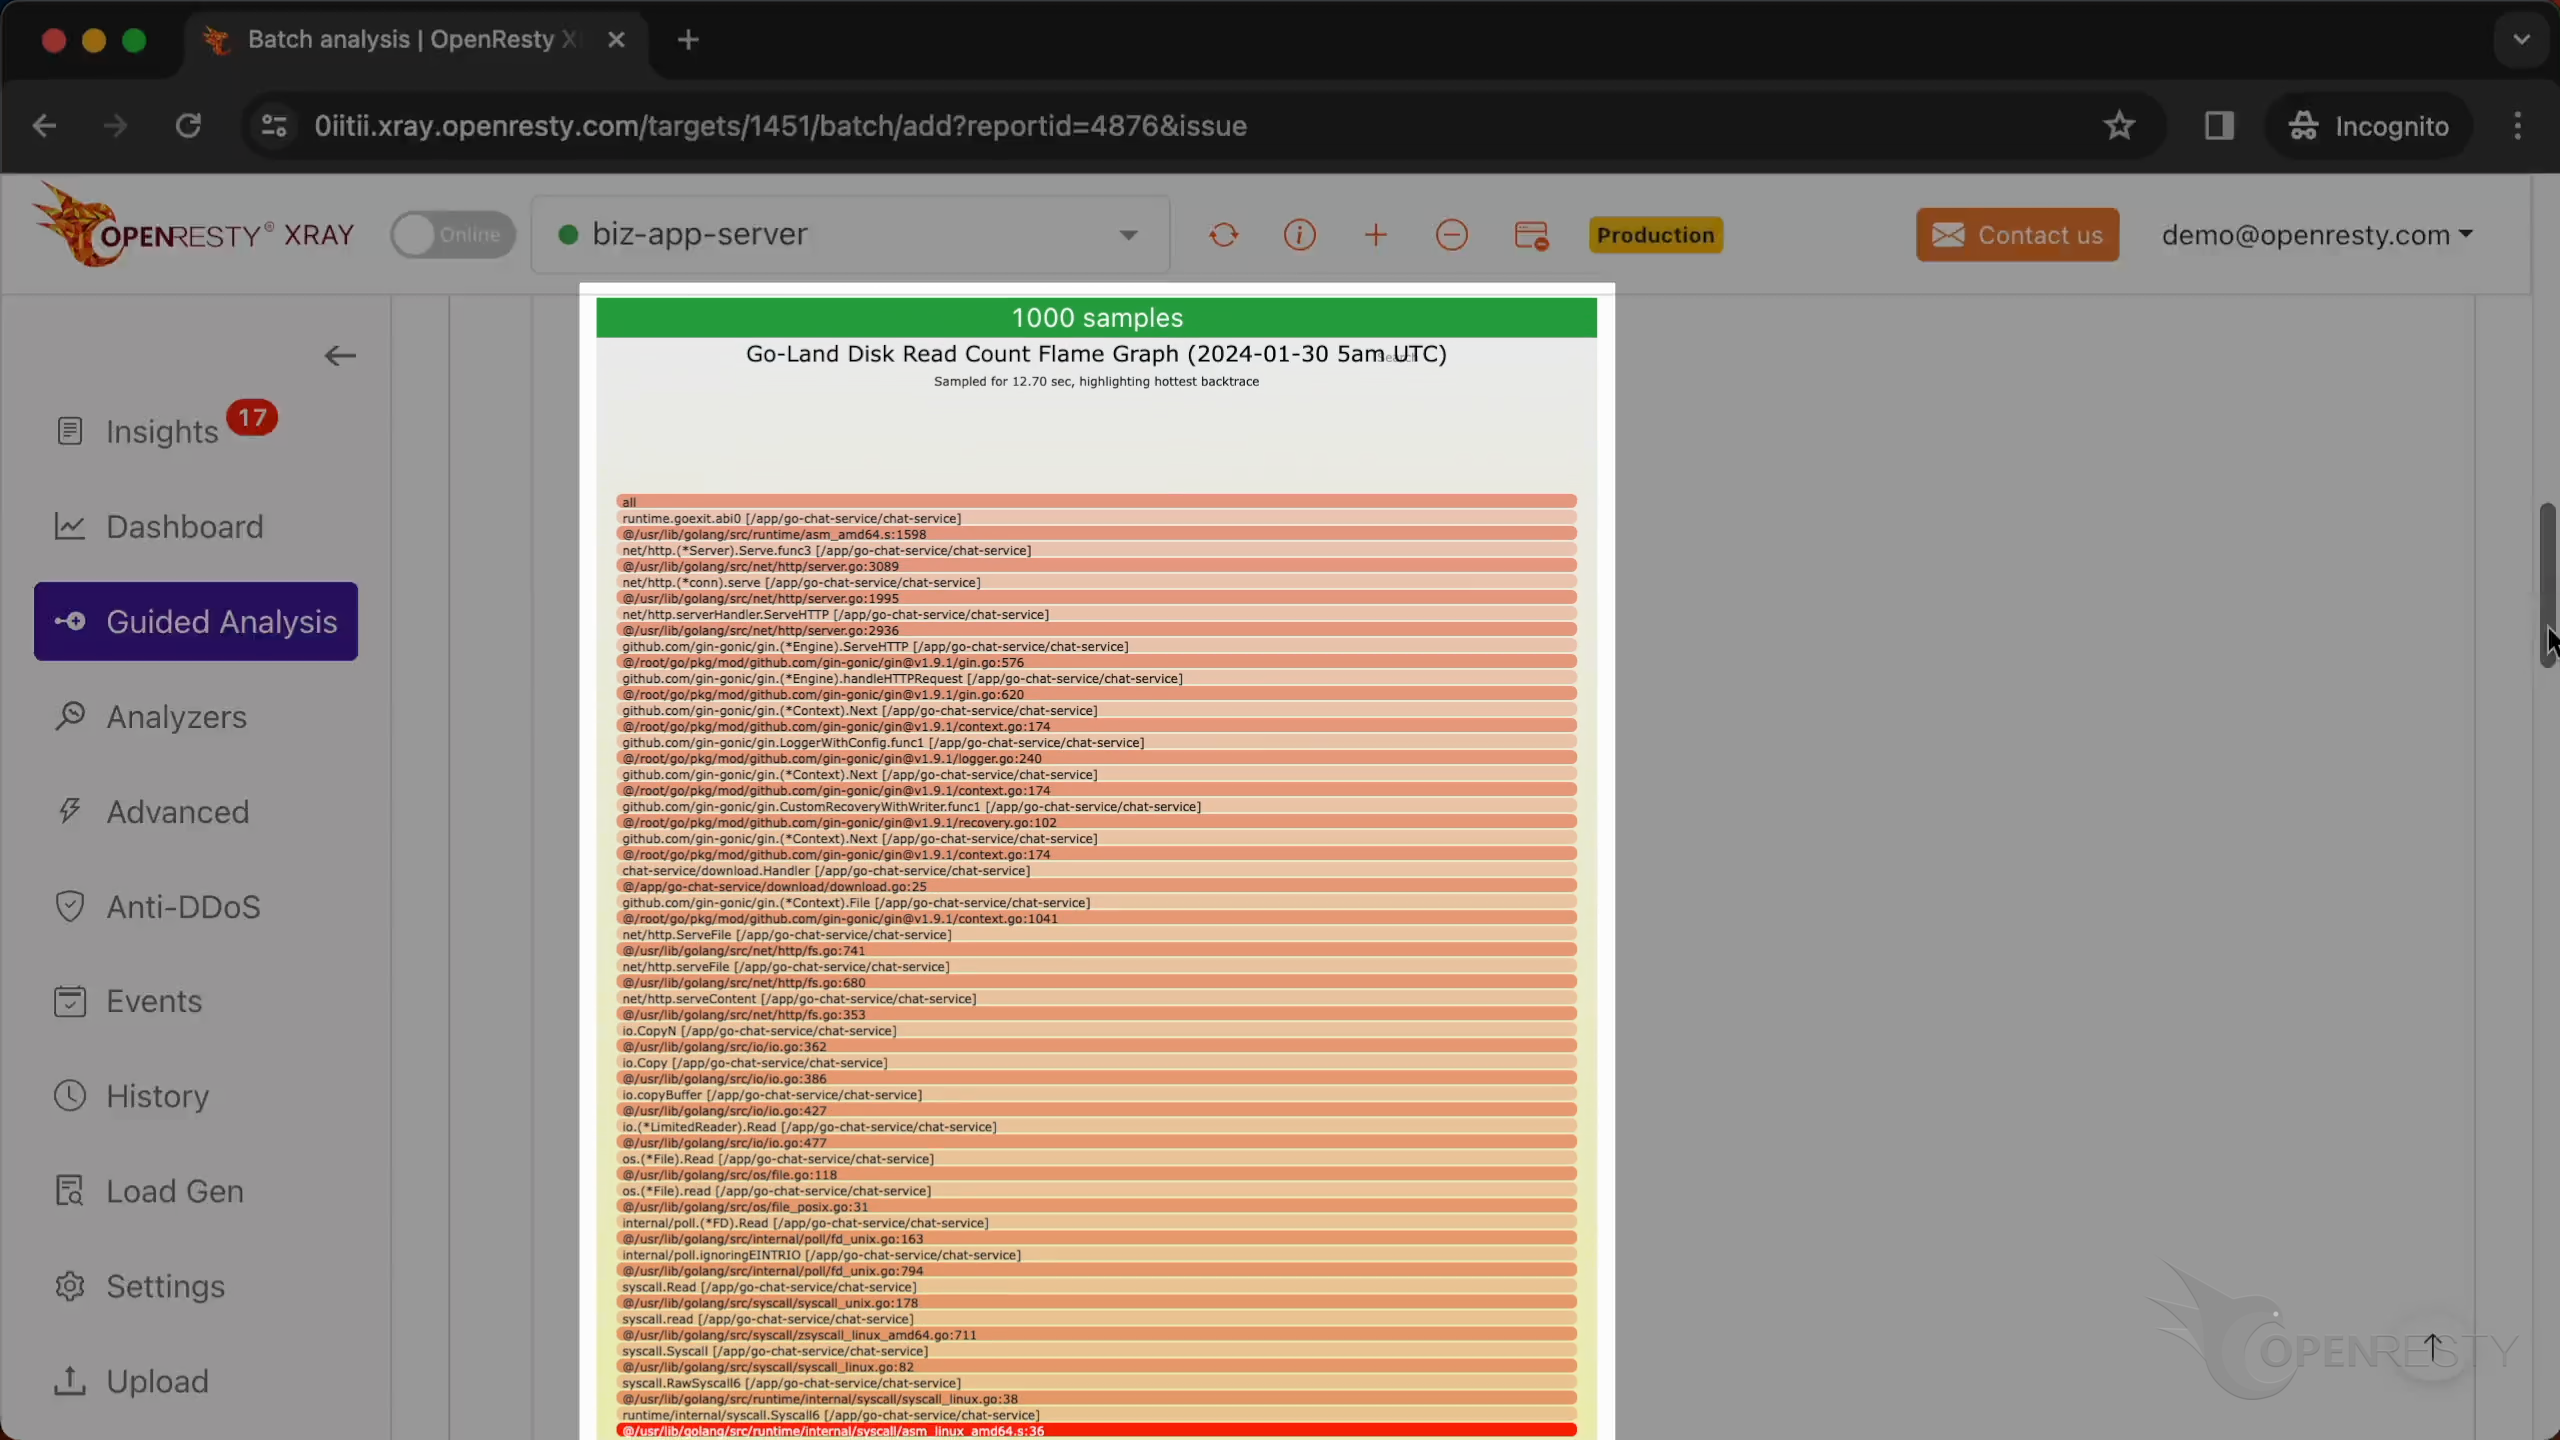
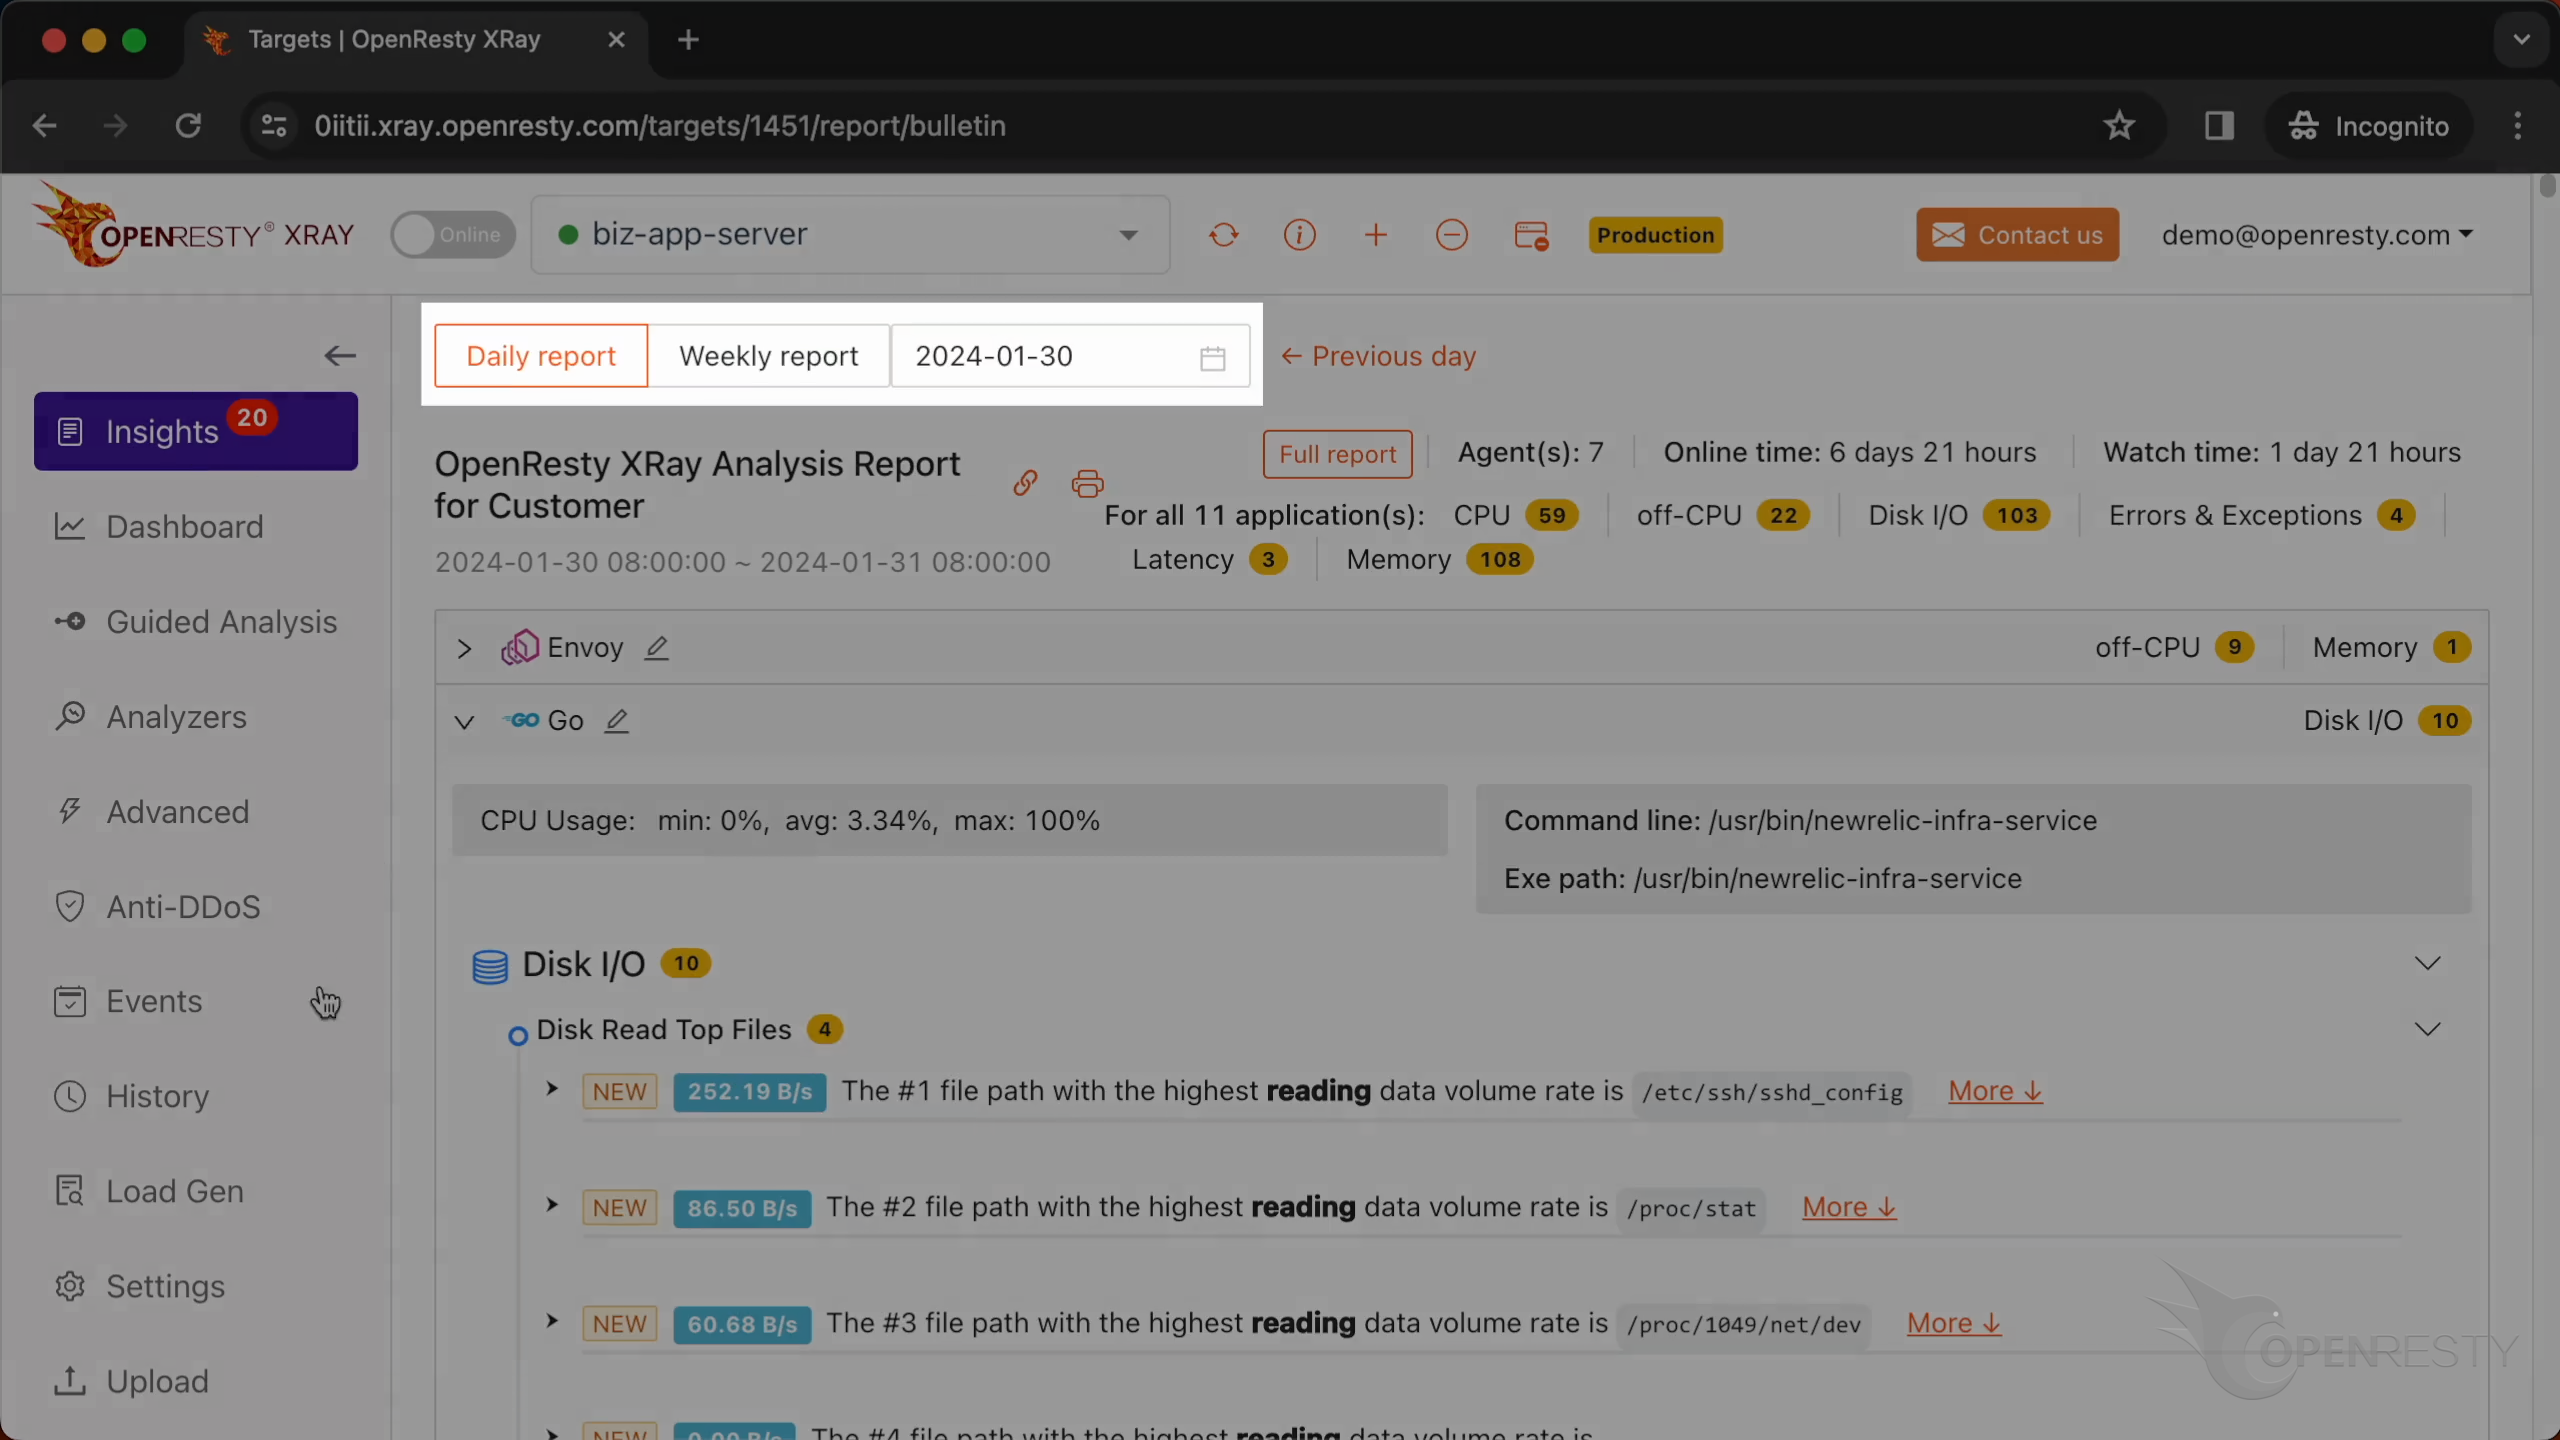
We can see it automatically creates an analysis report.
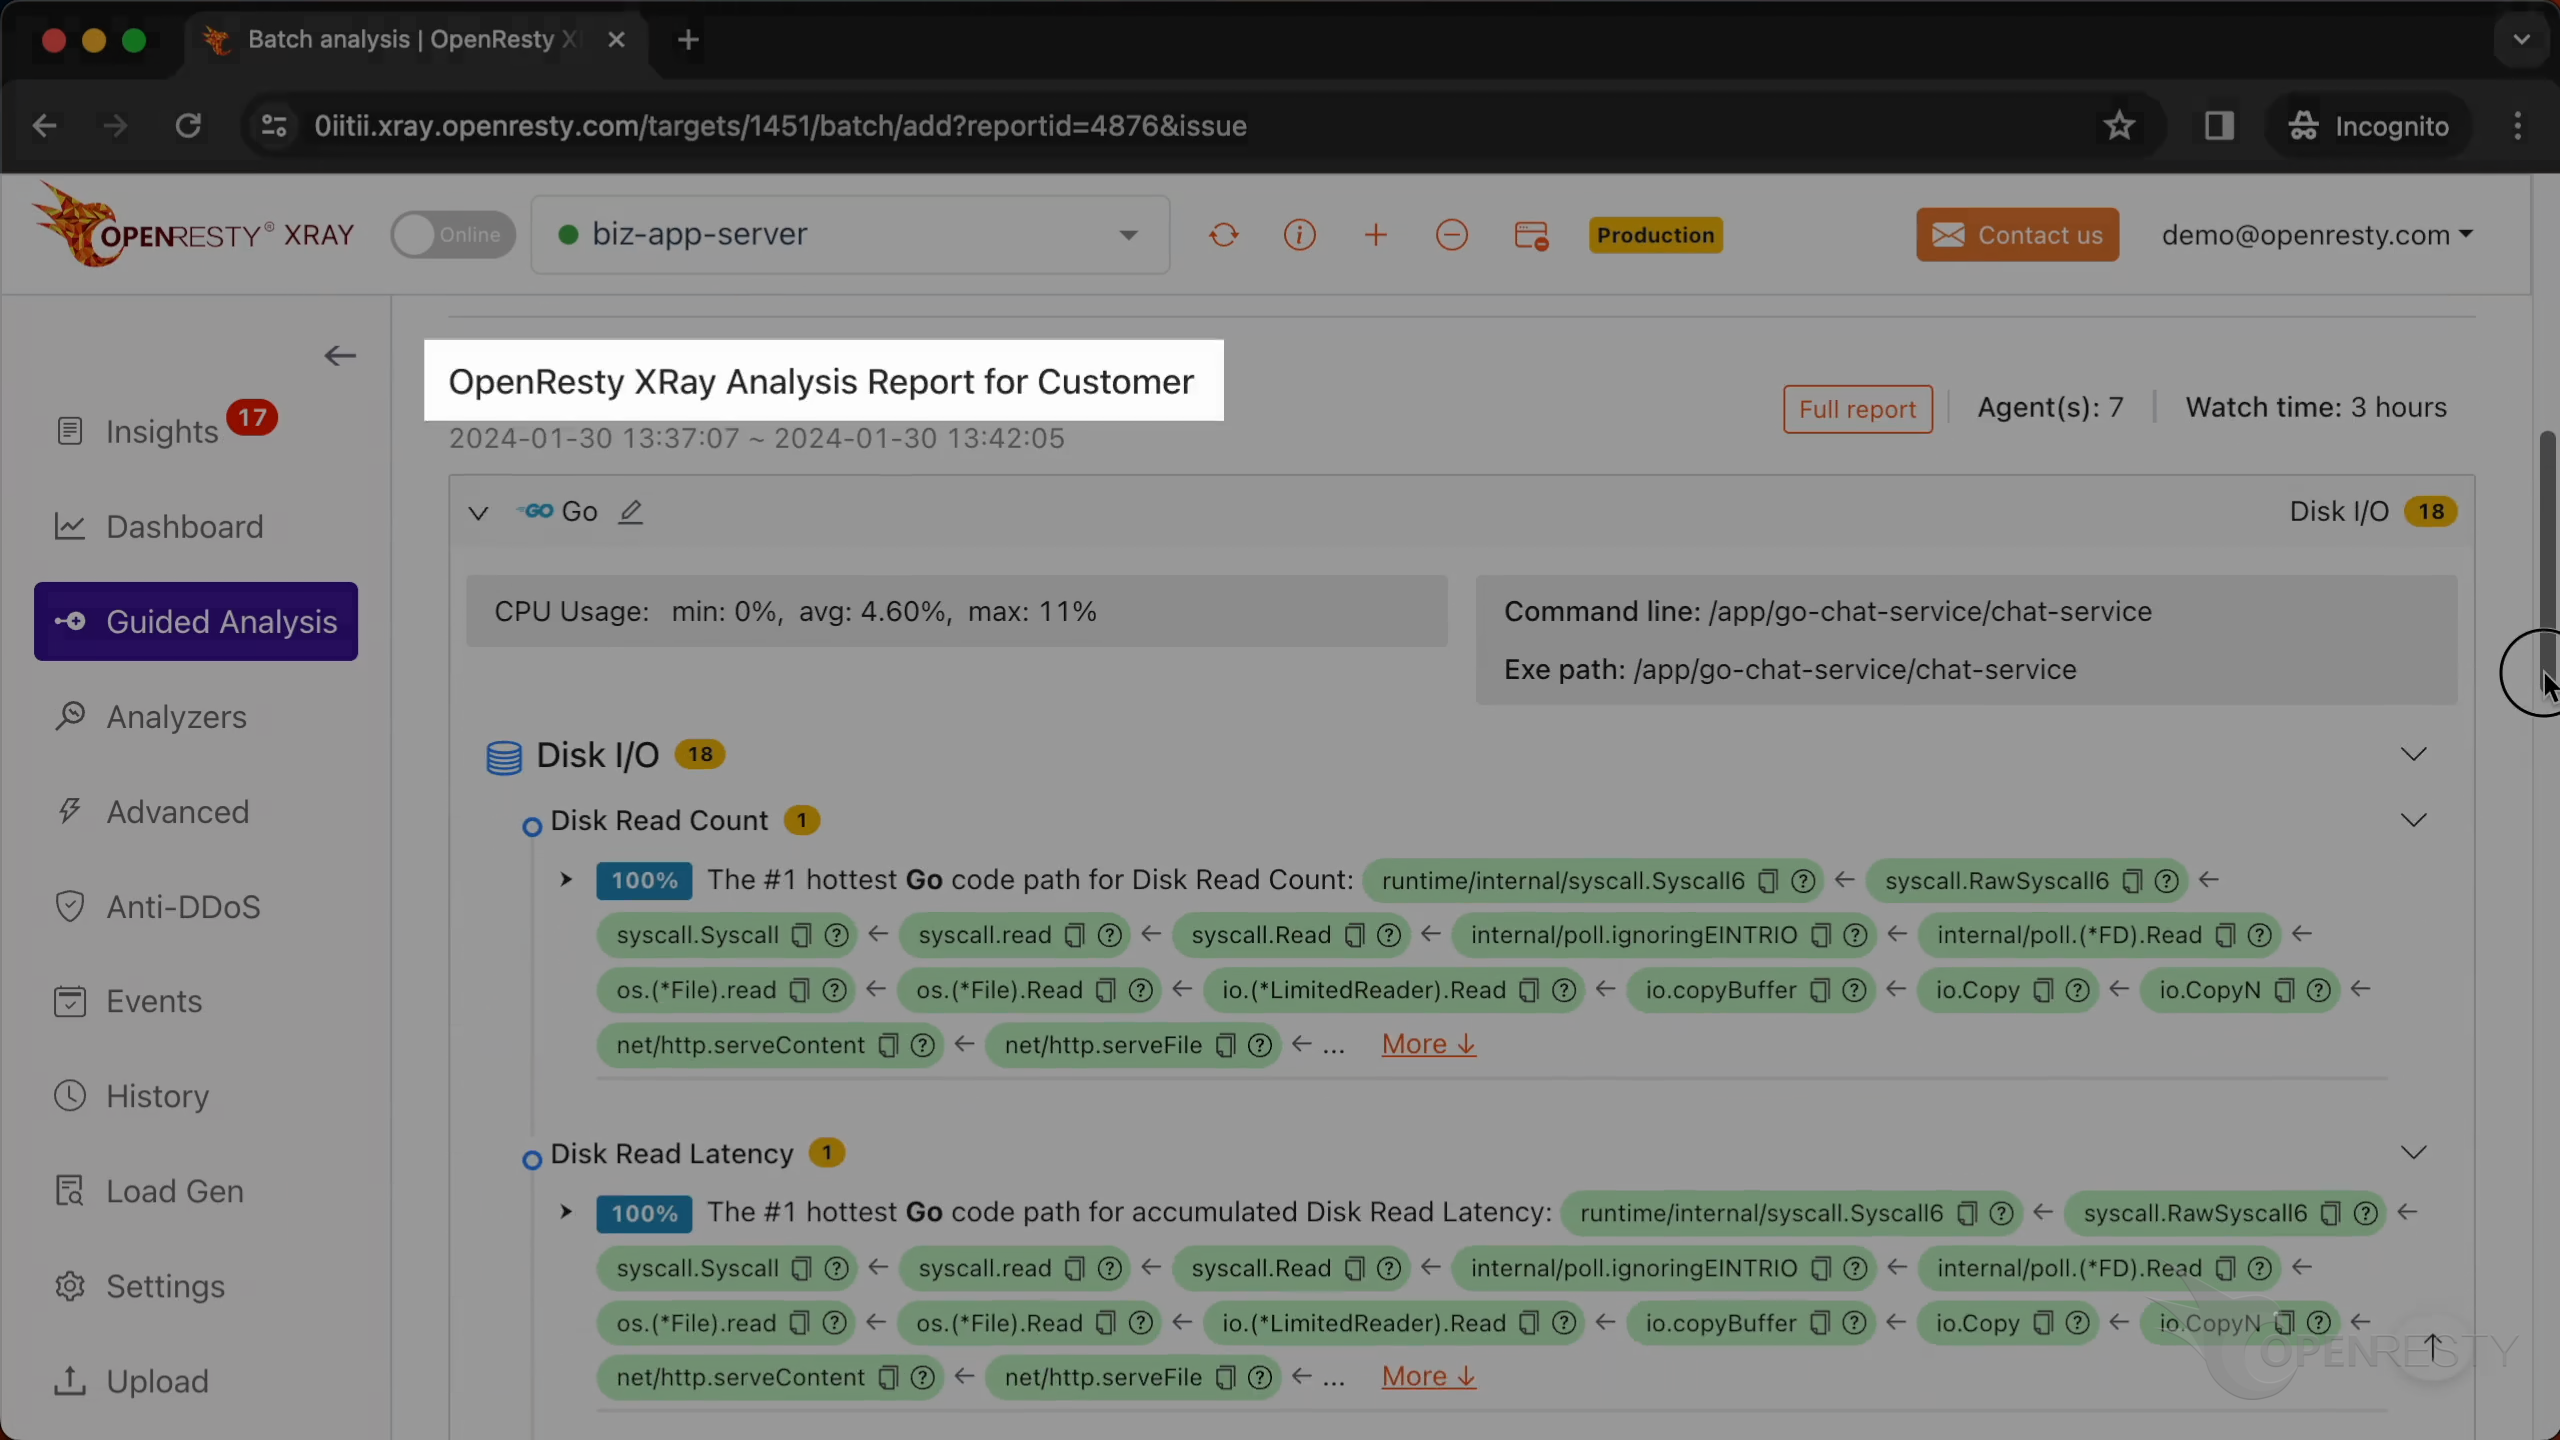
This is the type of problem we diagnose. It’s “Disk I/O”.
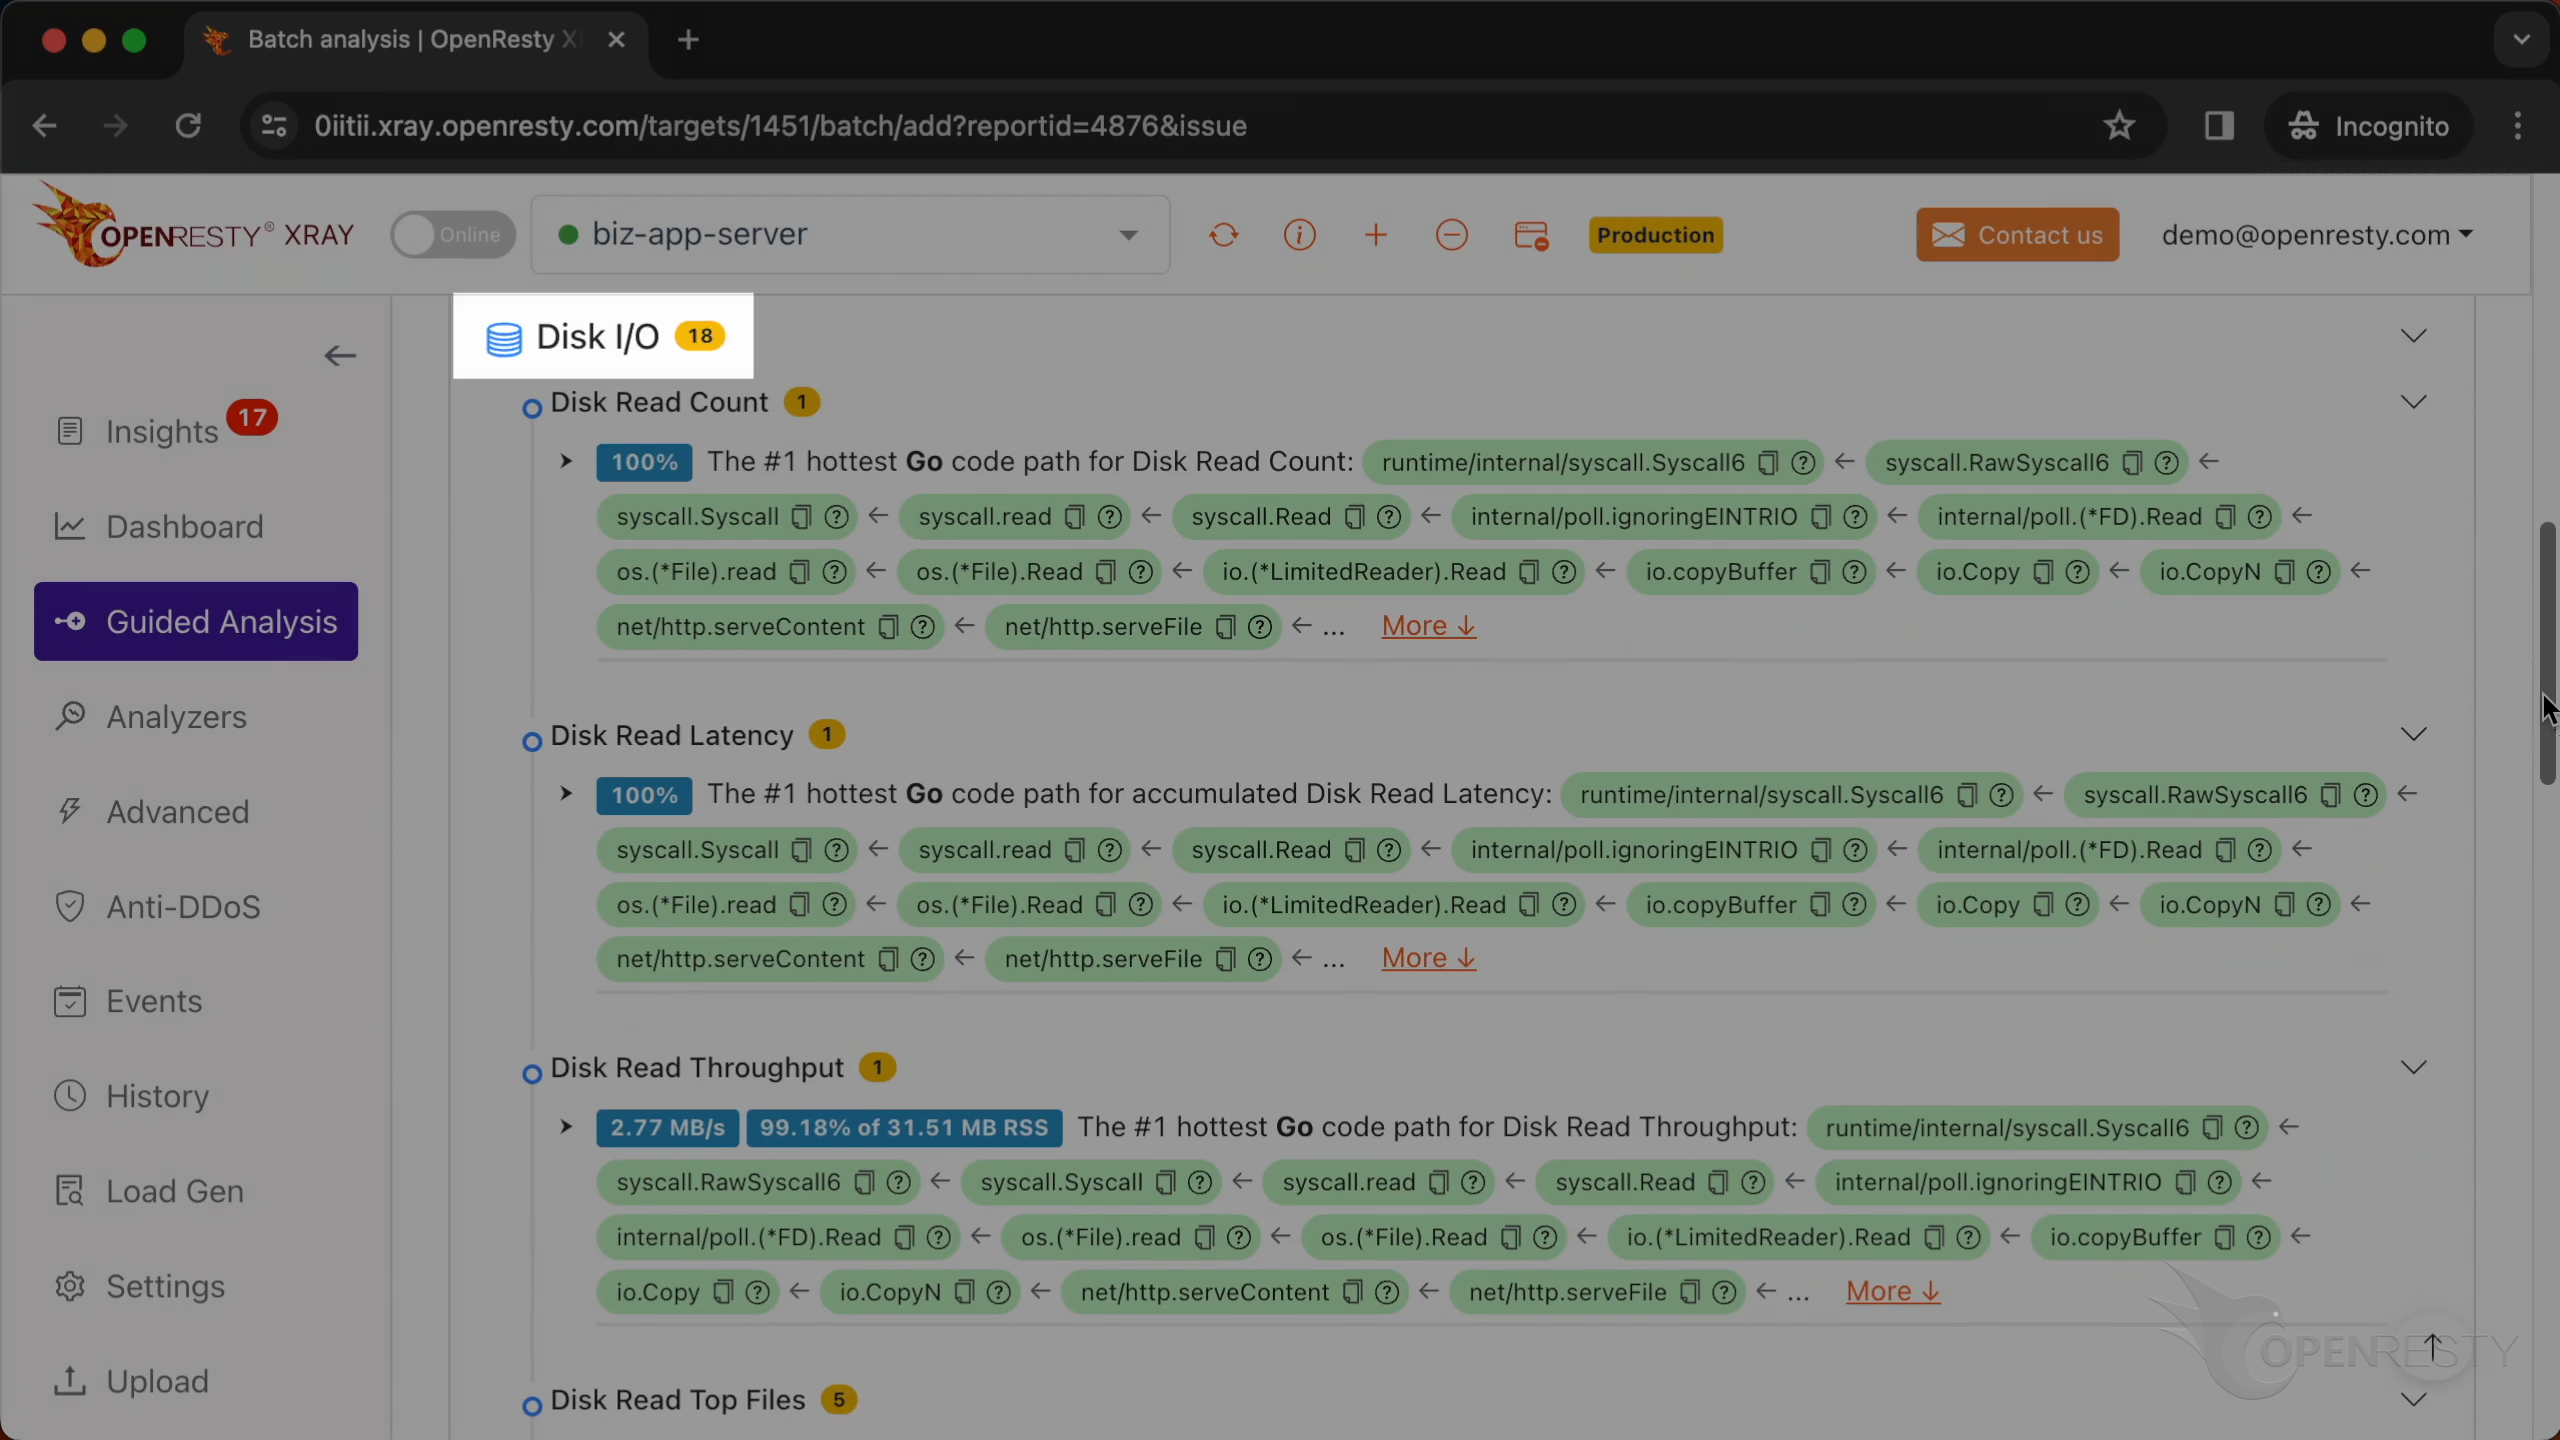
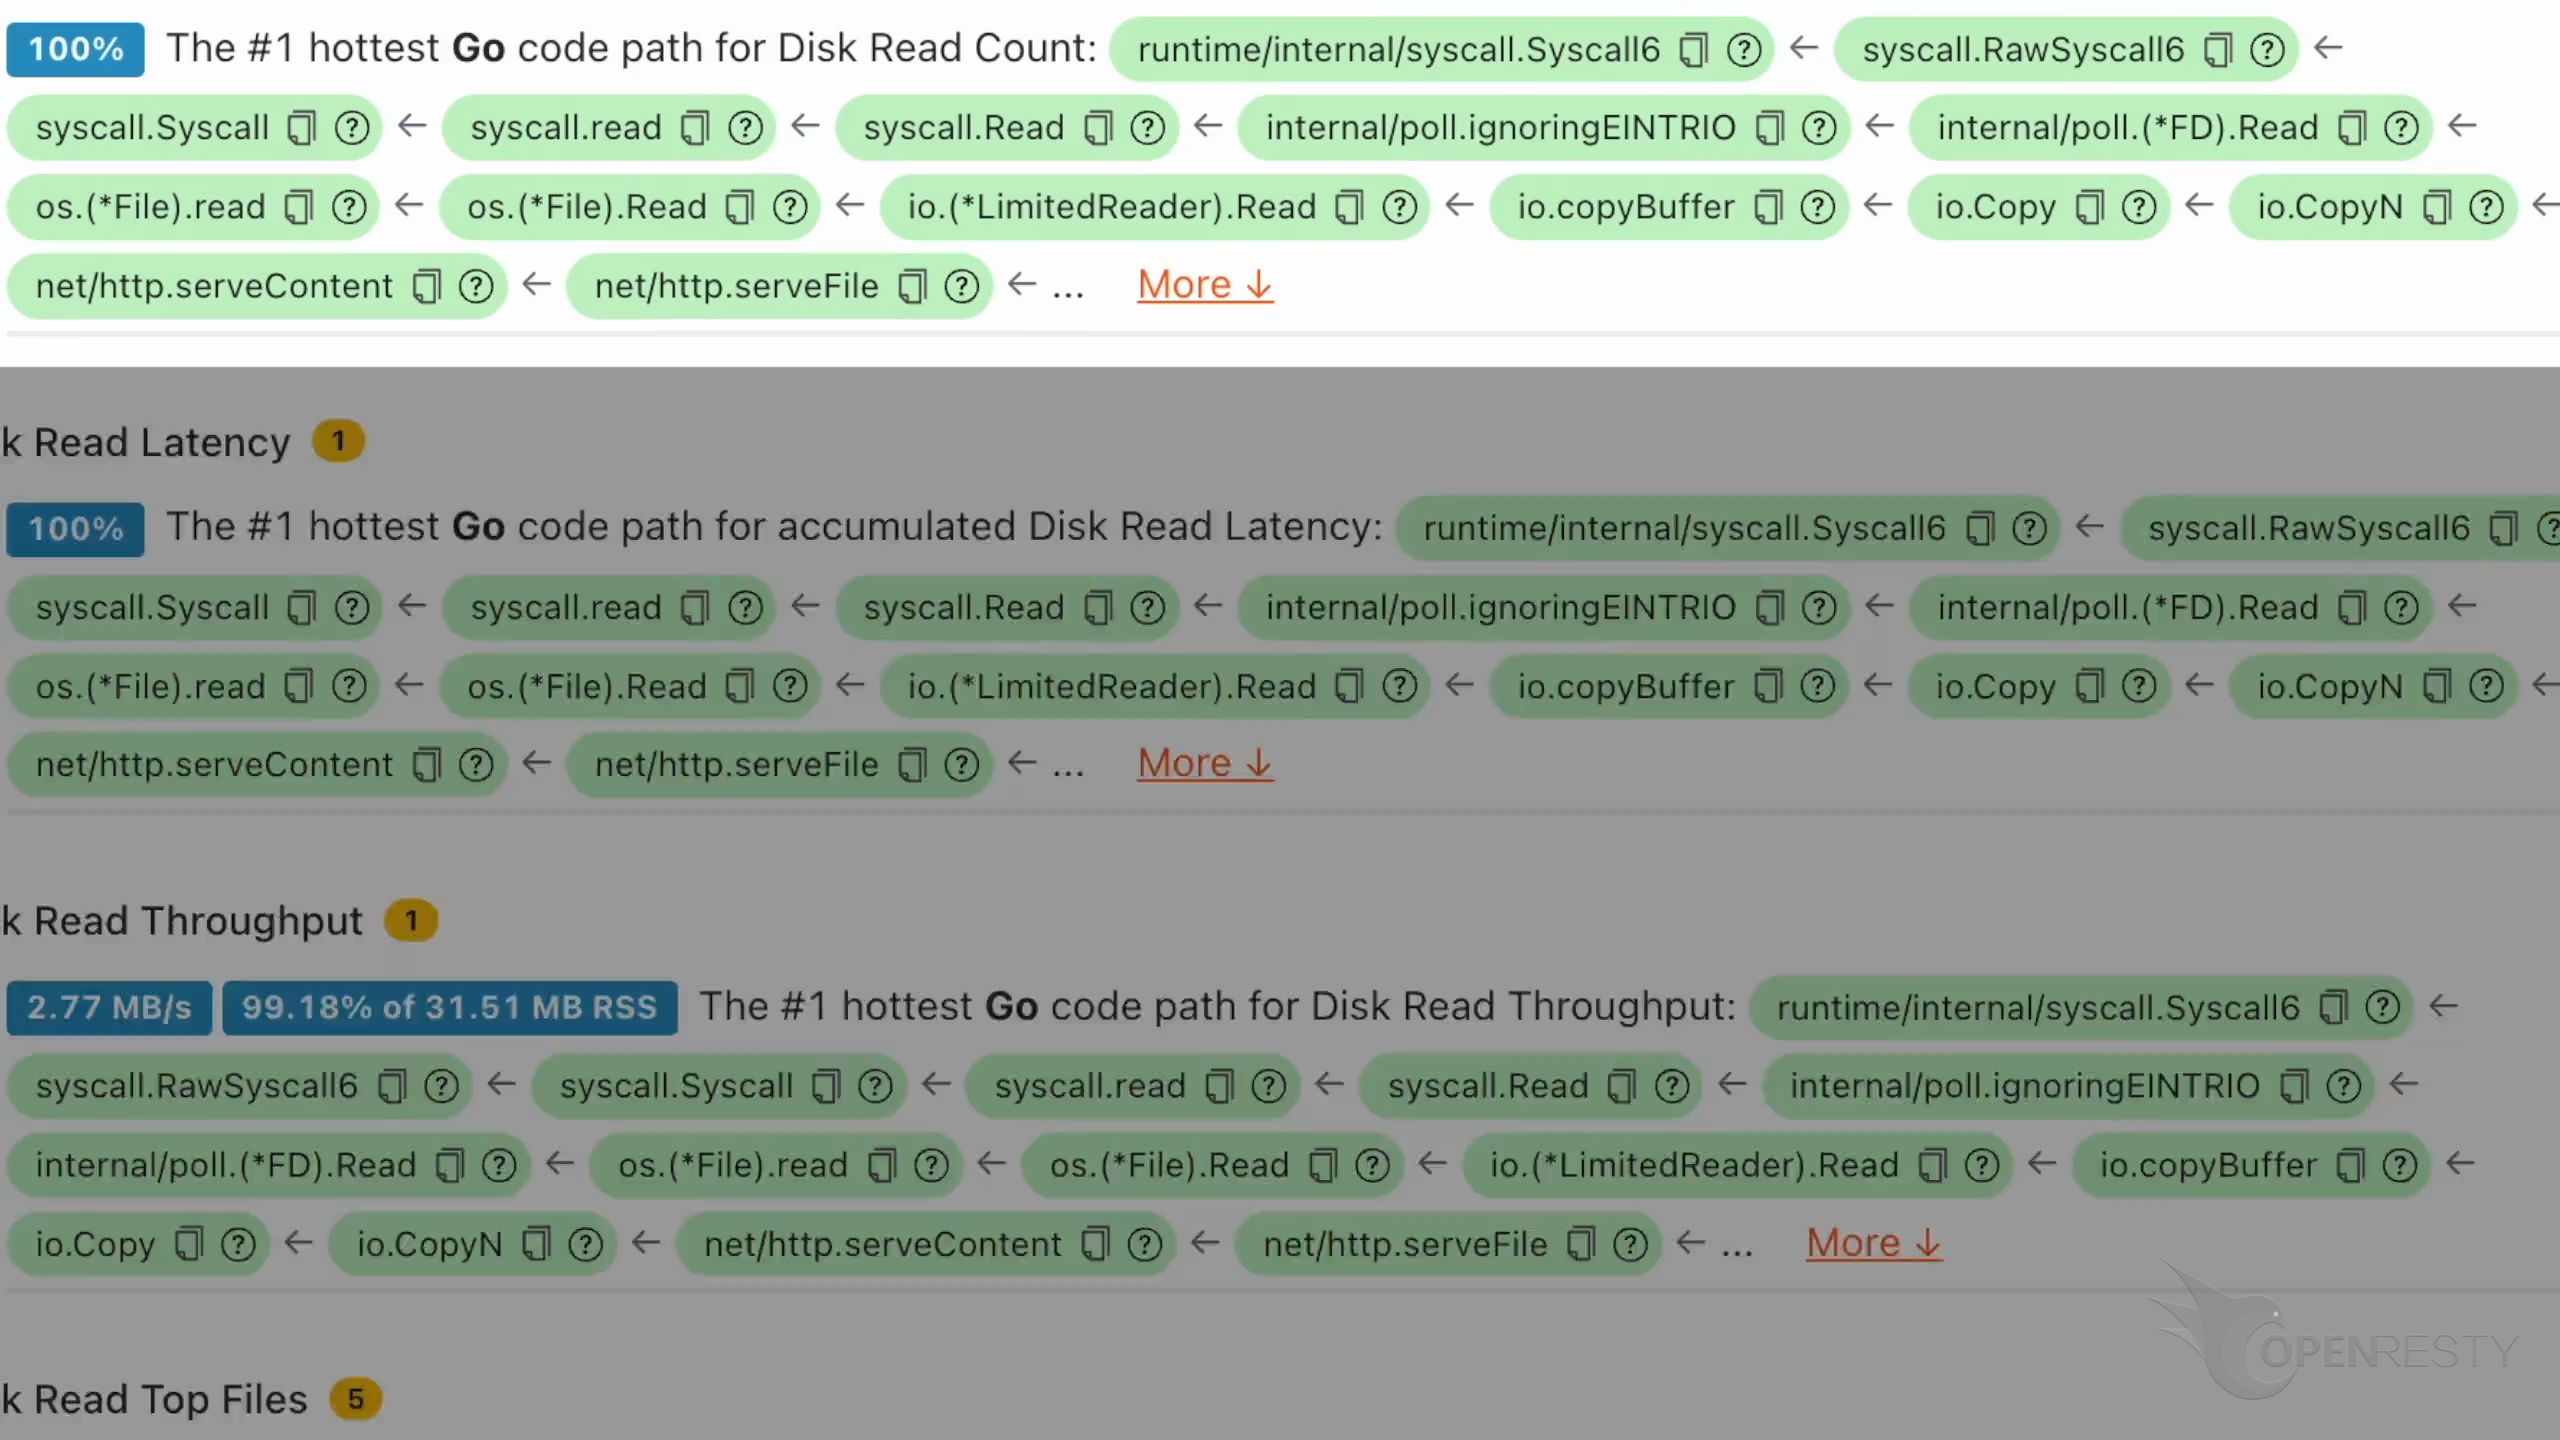
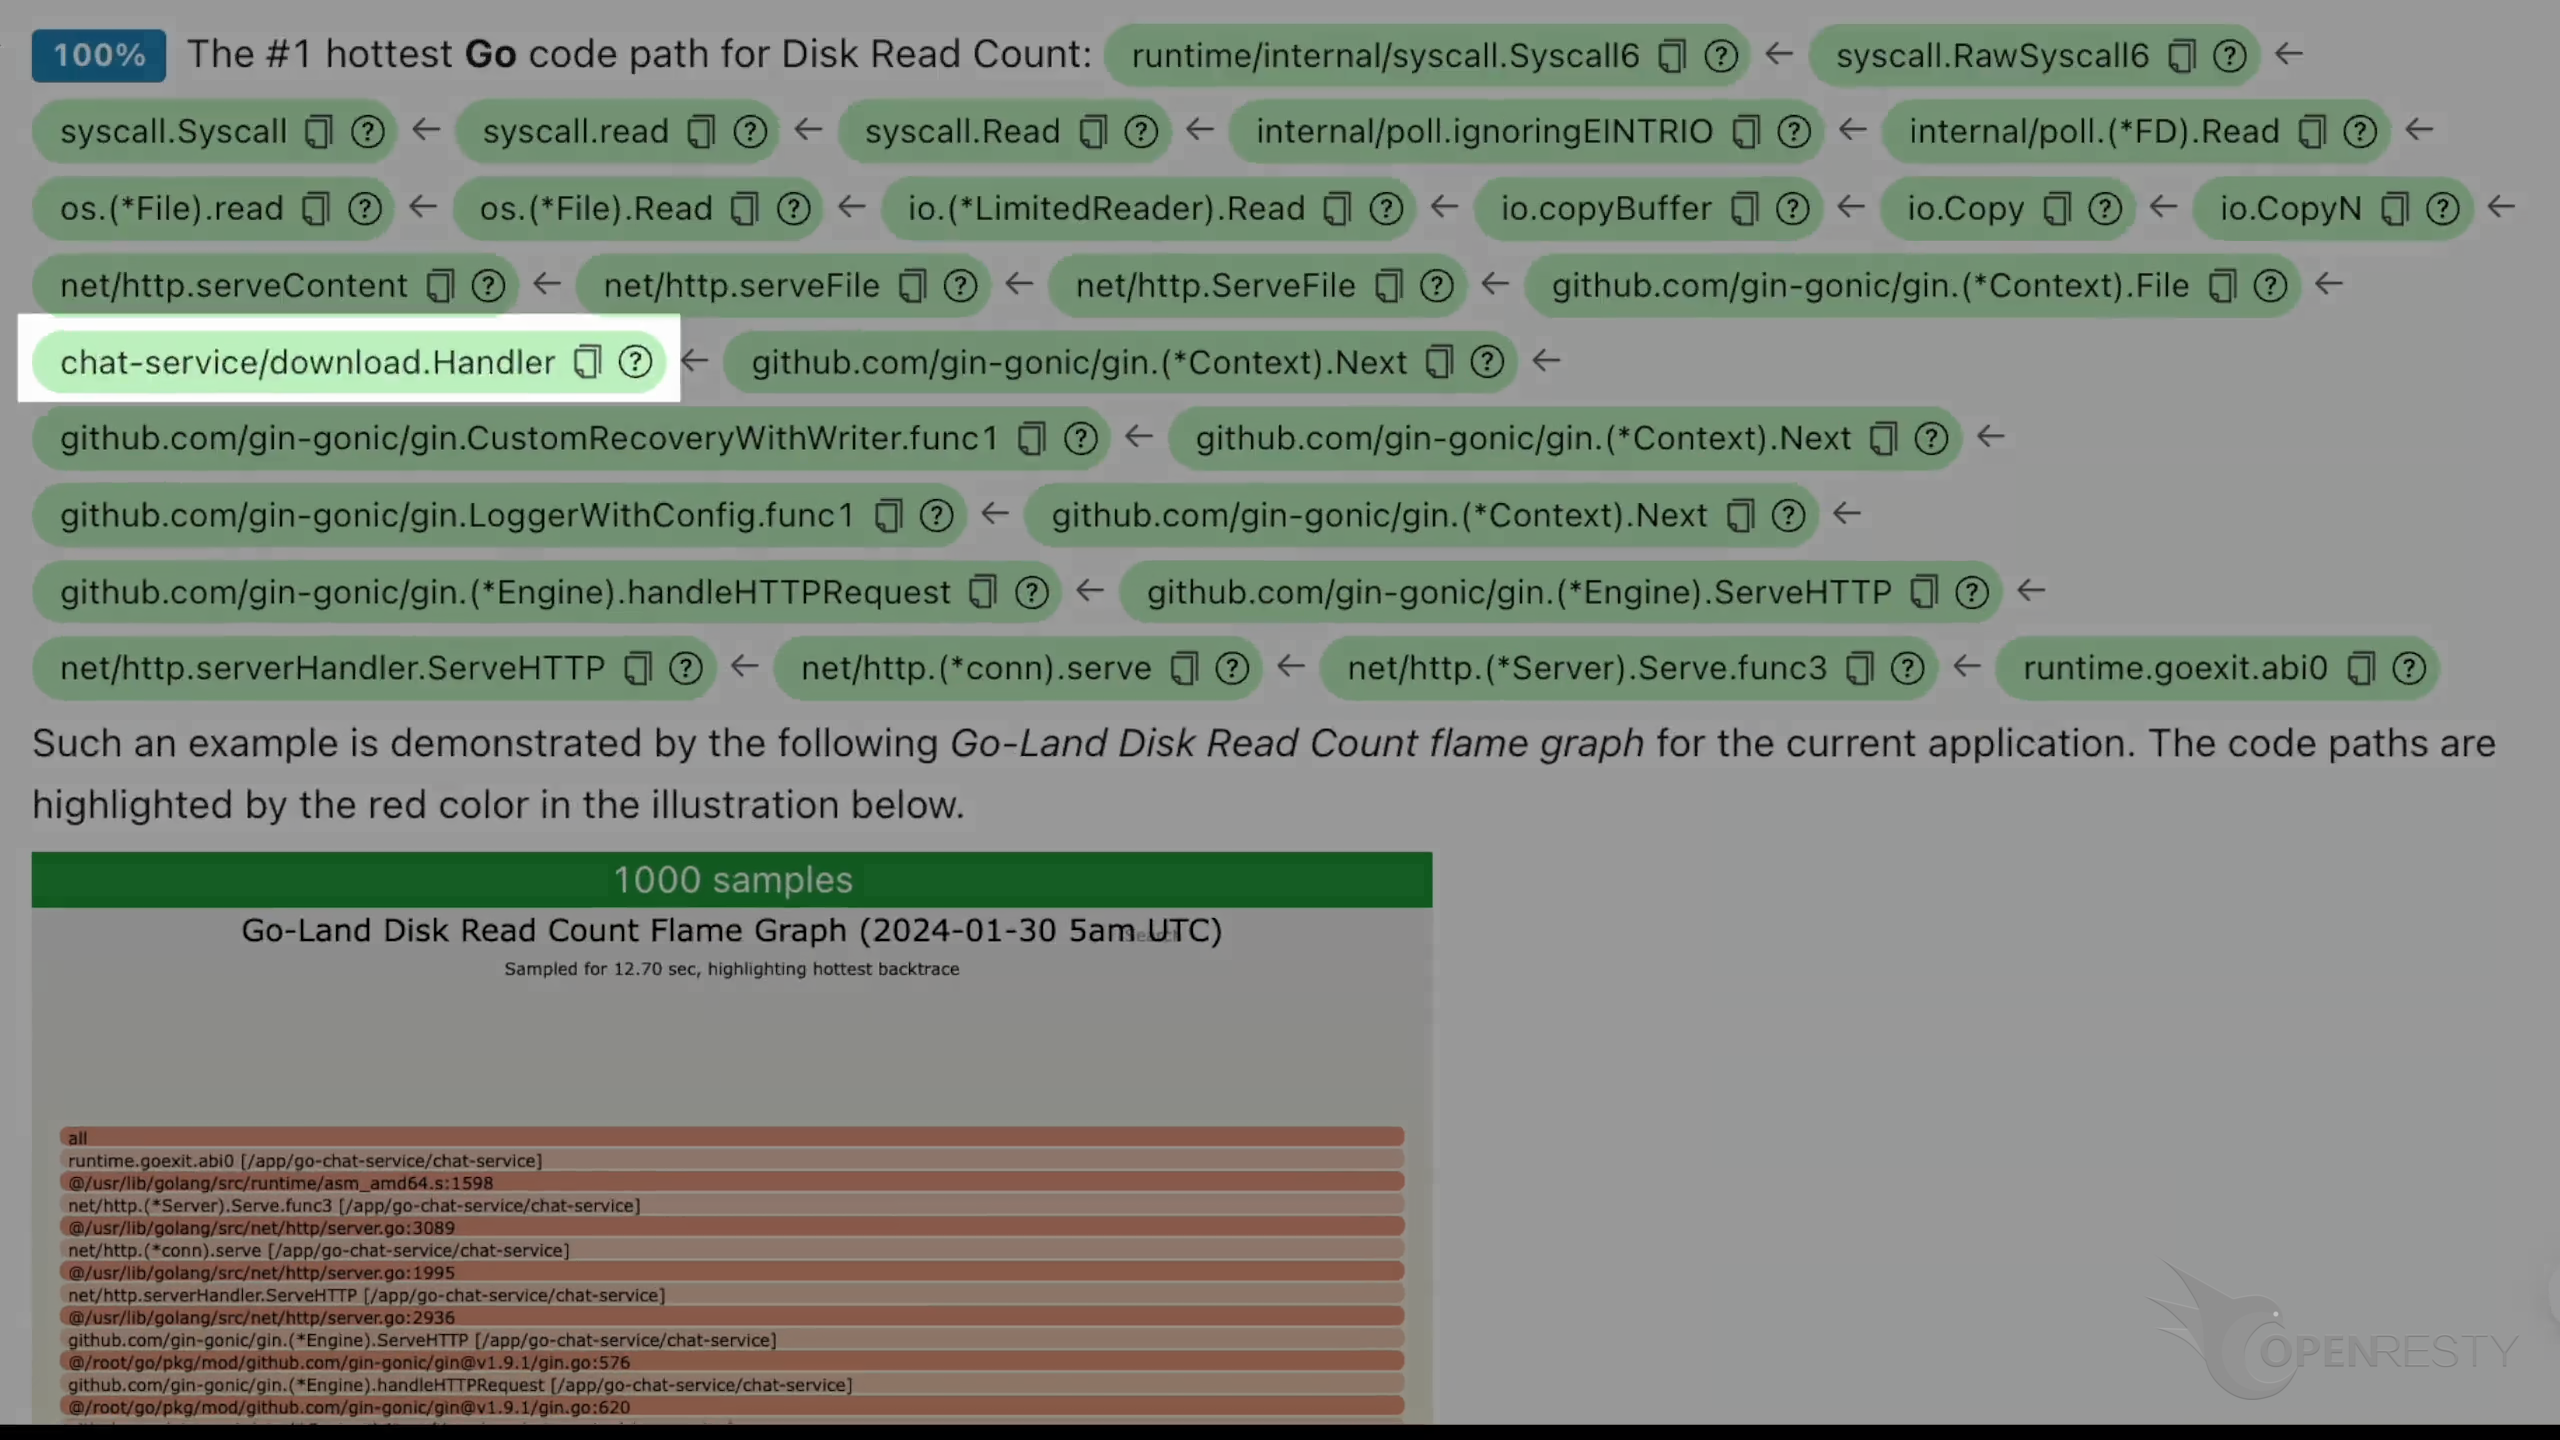
This is the analysis of hard disk read count.
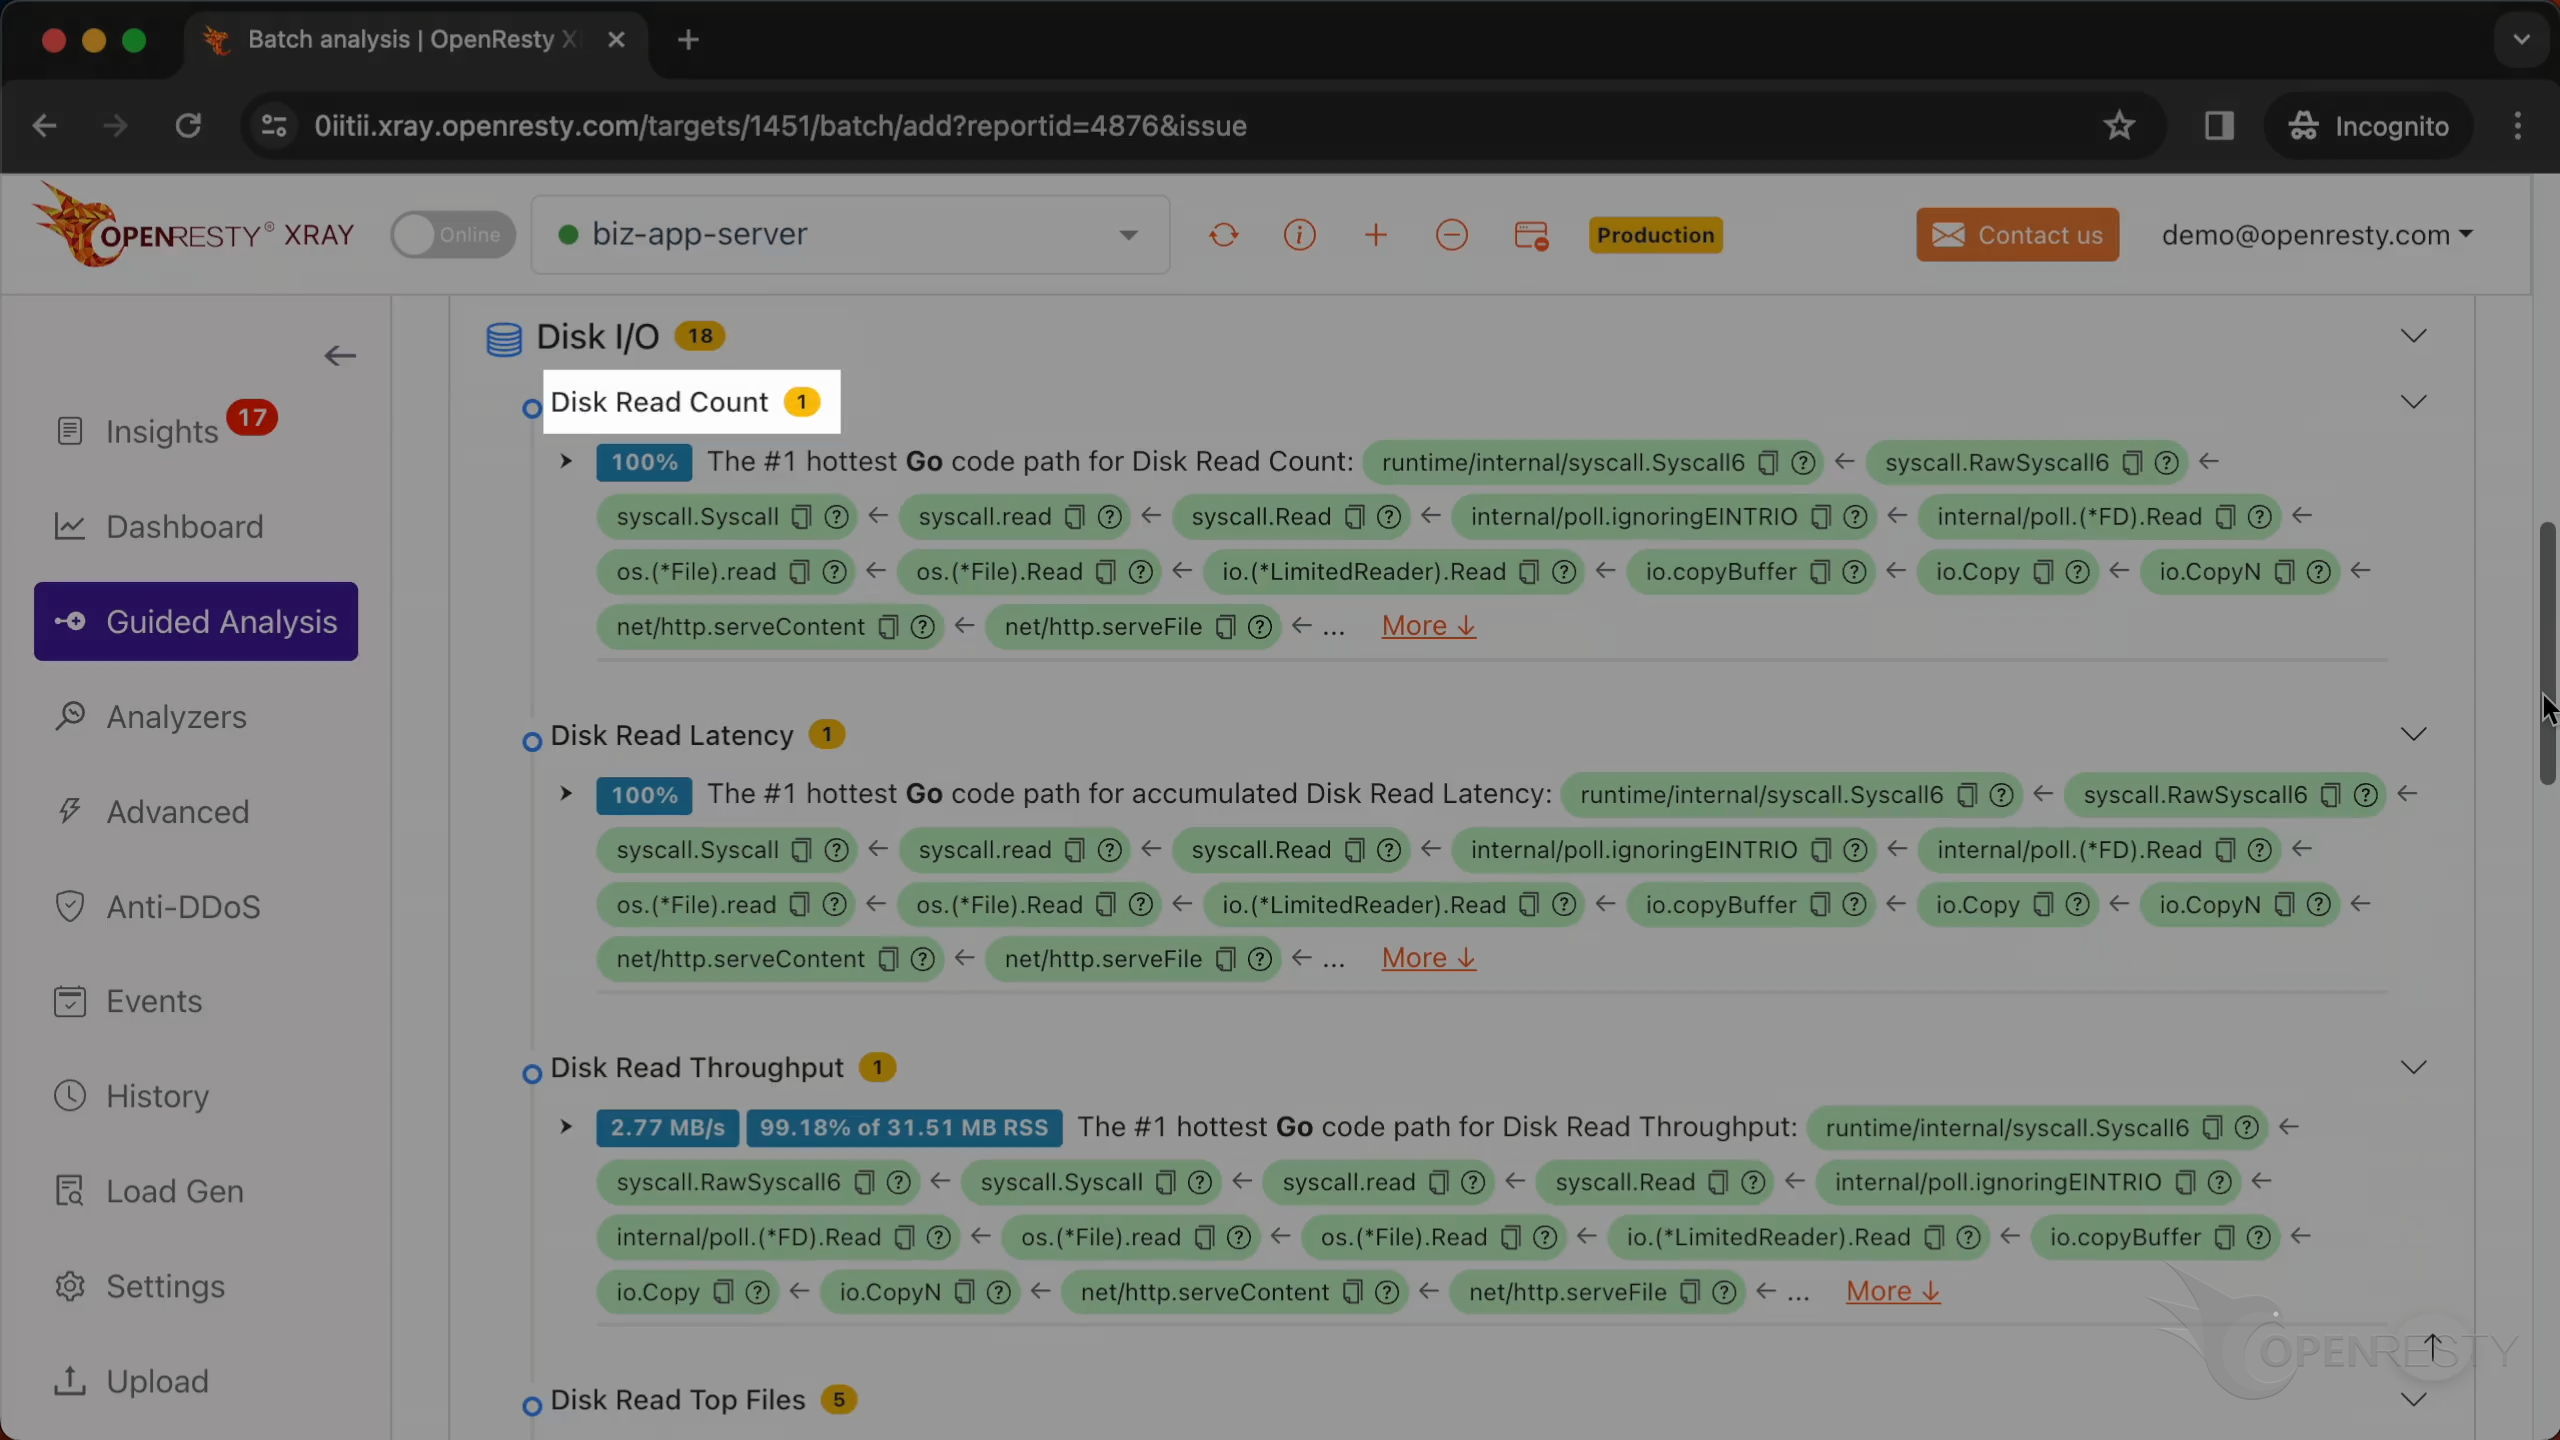
This code path has the maximum disk read operations.
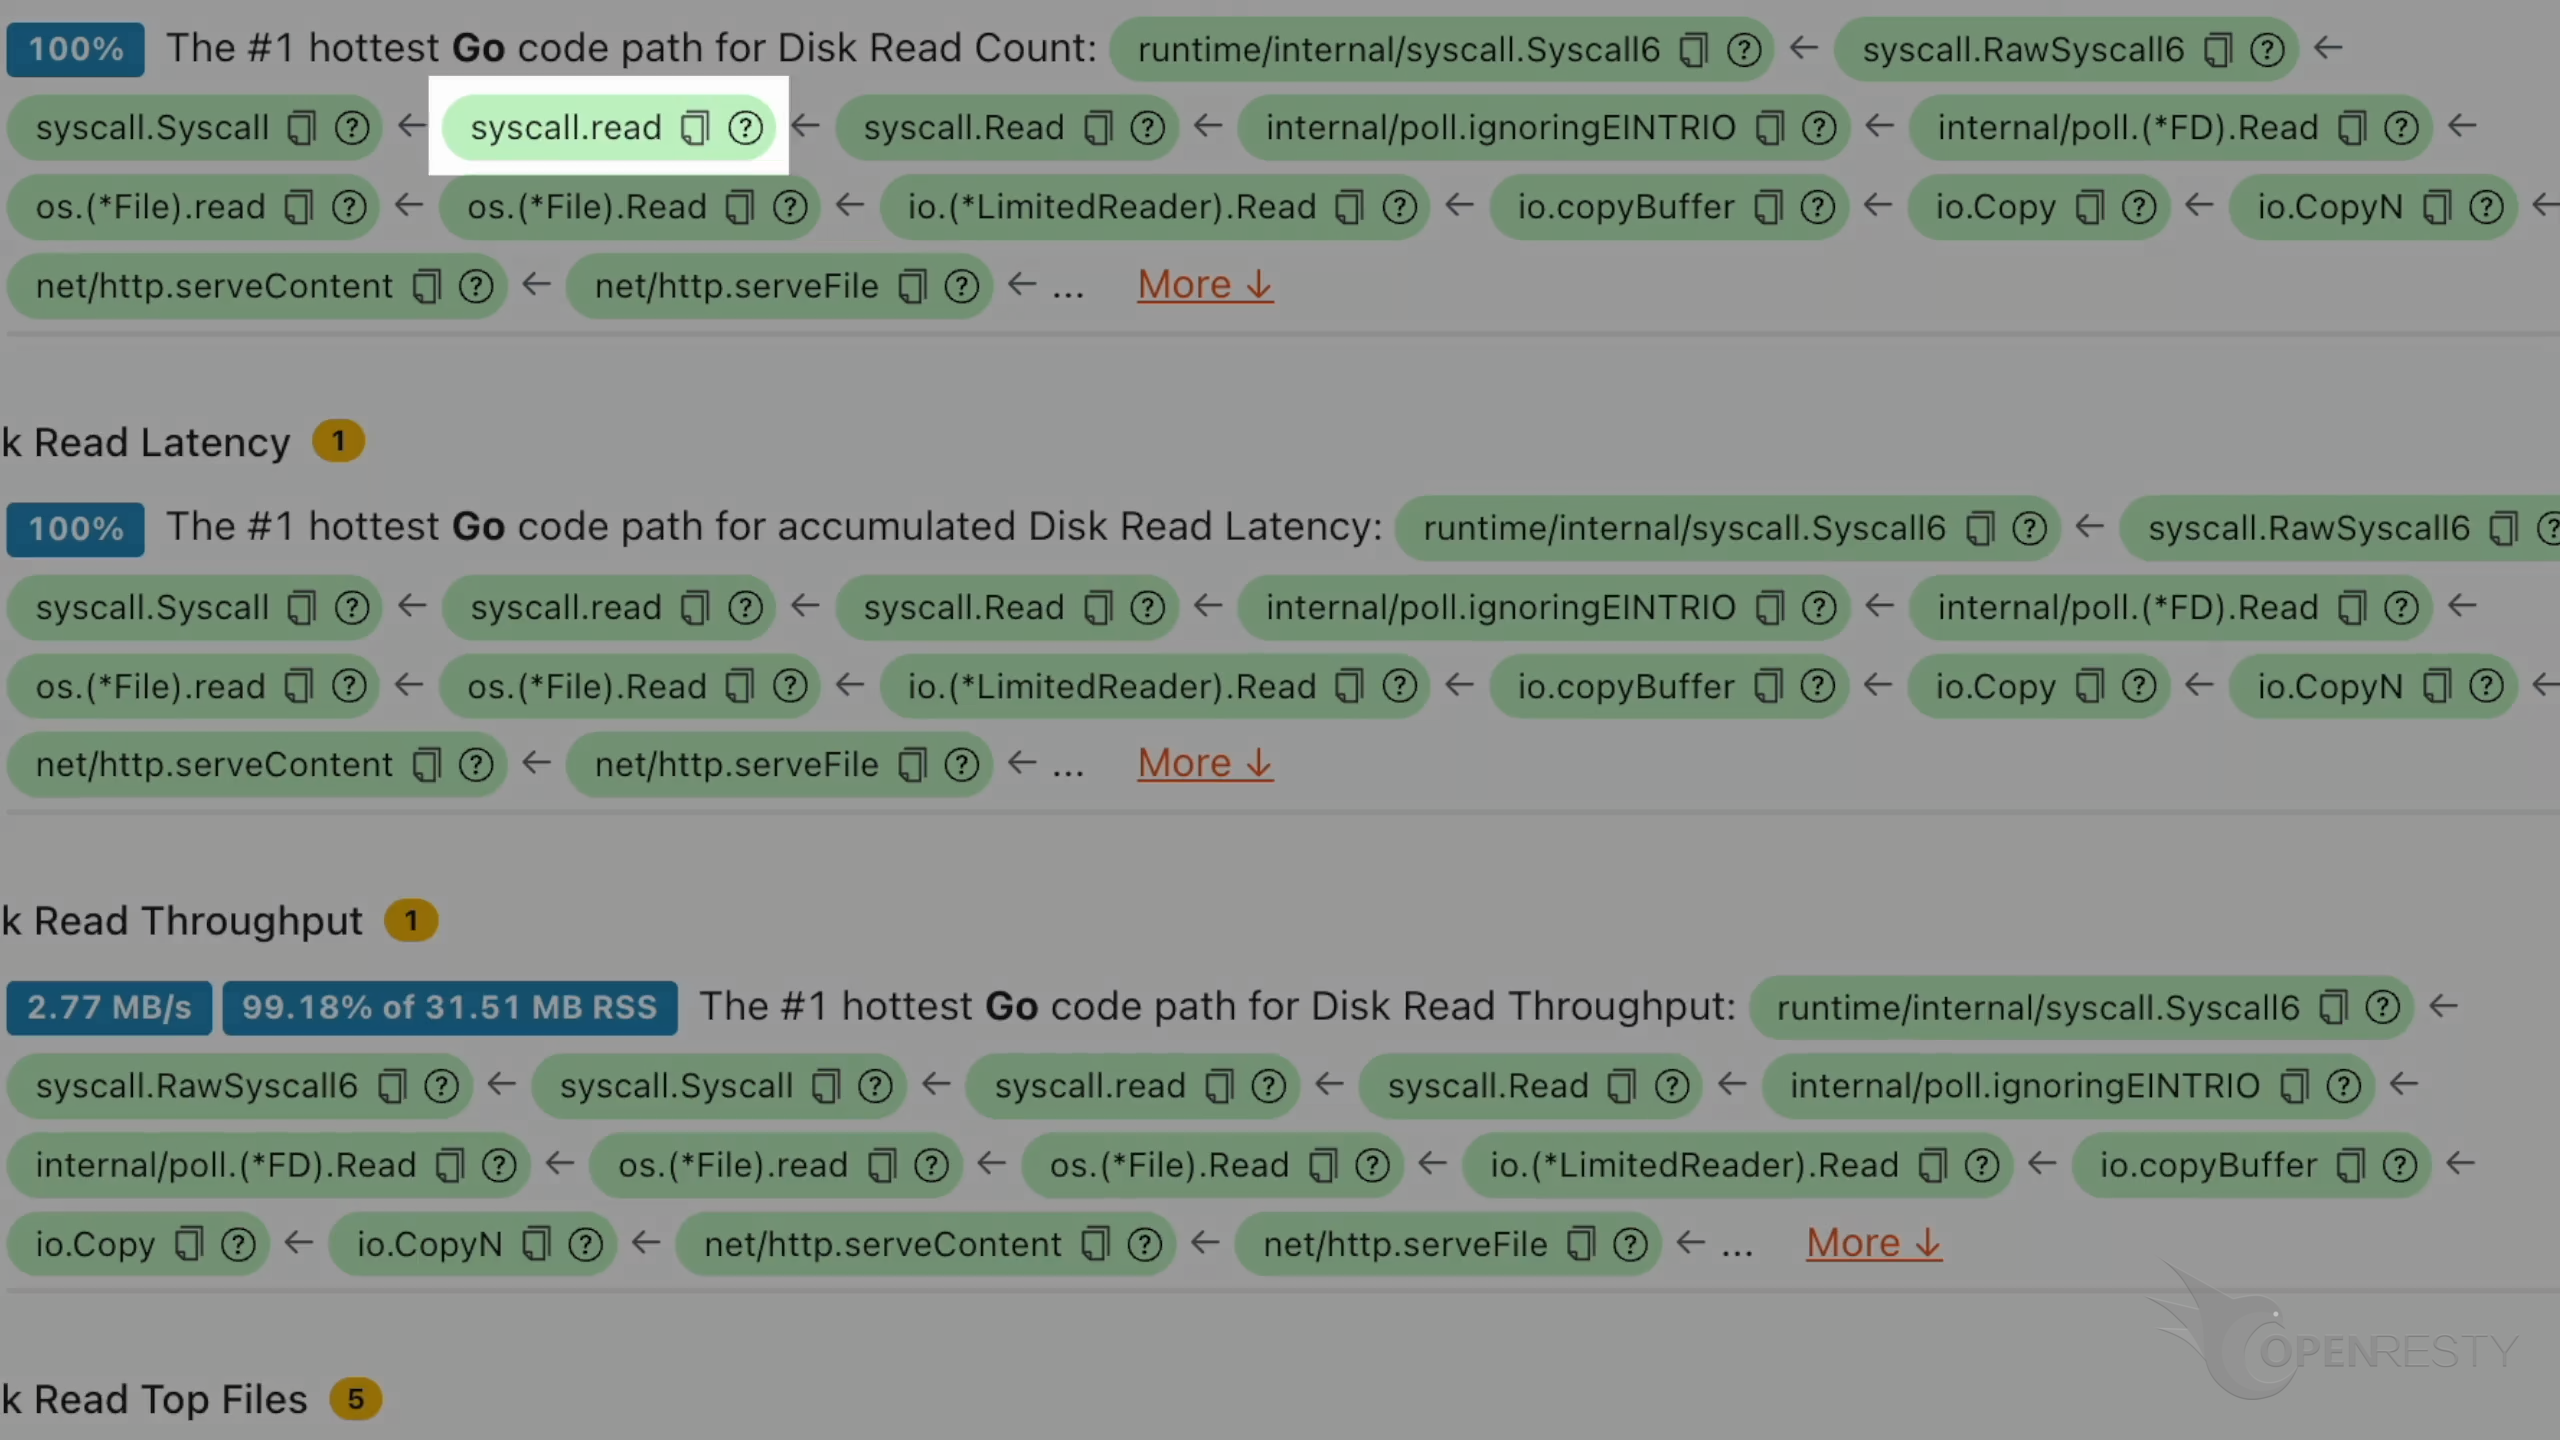
The function syscall.read reads data from a file descriptor.
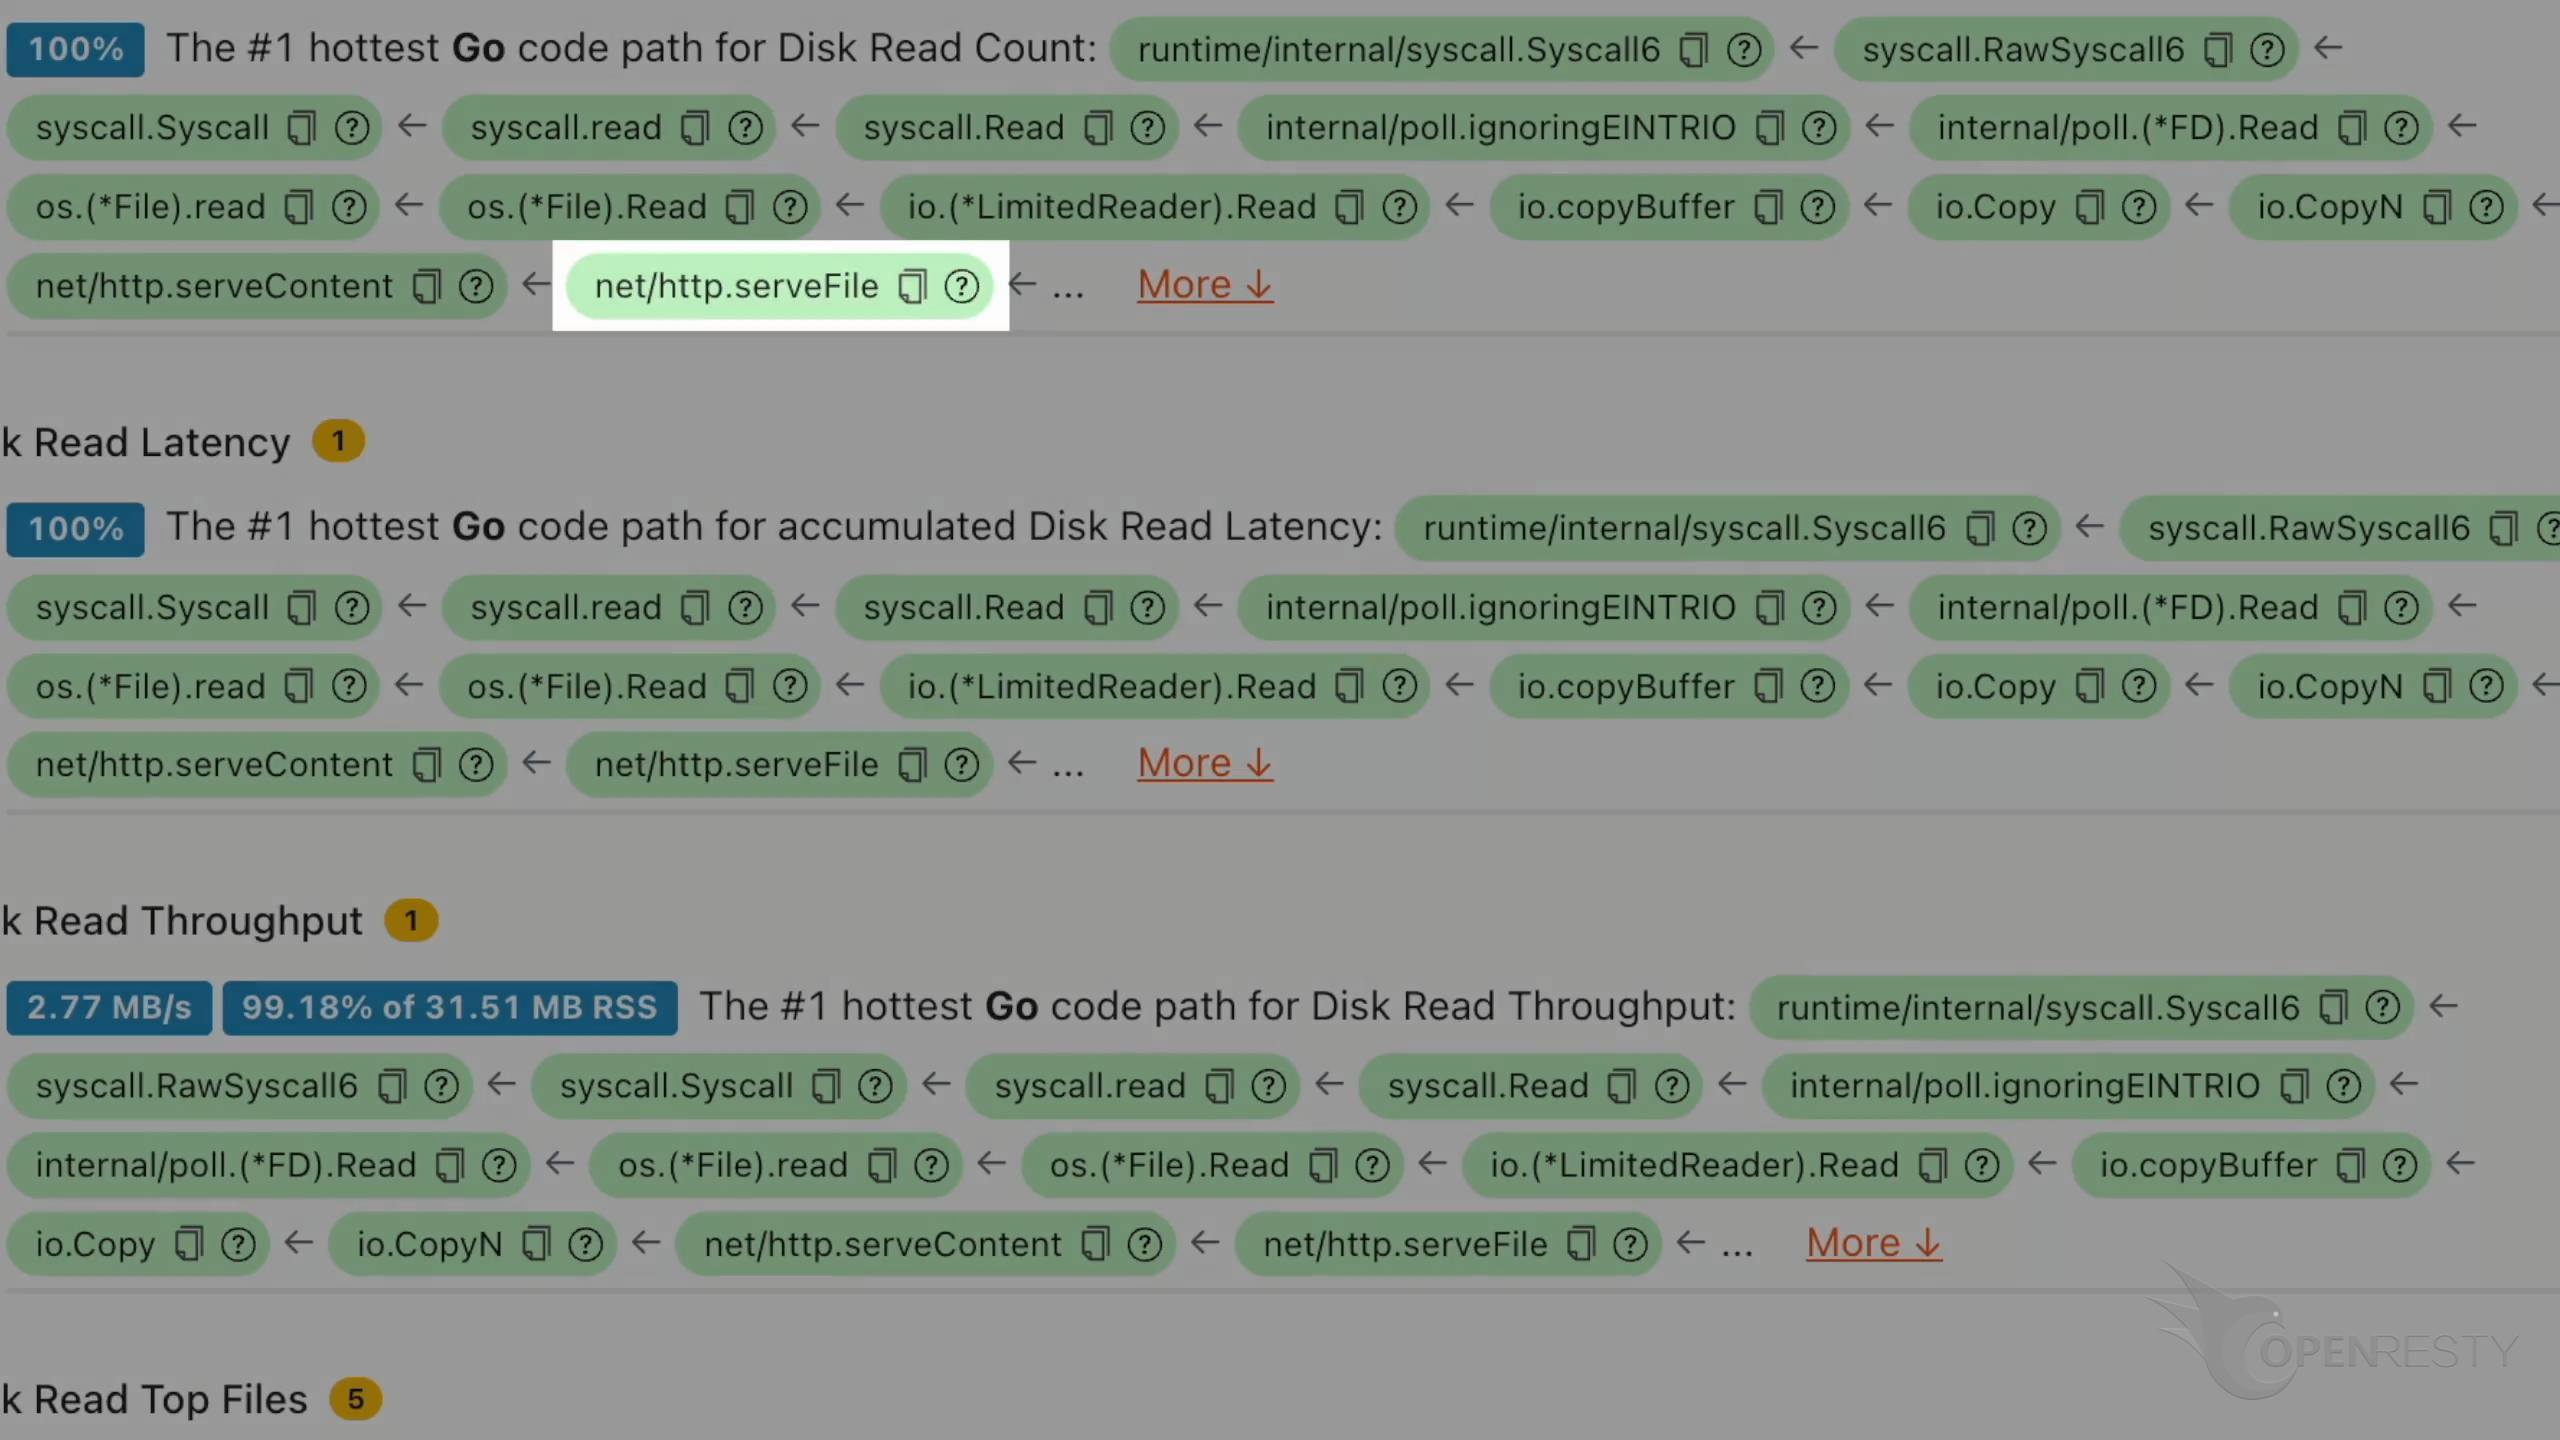
The function http.serveFile serves the file as an HTTP response.
Click to see more details.
The business function download.Handler is responsible for file downloads.
handleHTTPRequest is a core function in the gin framework. It mainly handles HTTP requests. gin is a high-performance HTTP web framework written in Go.
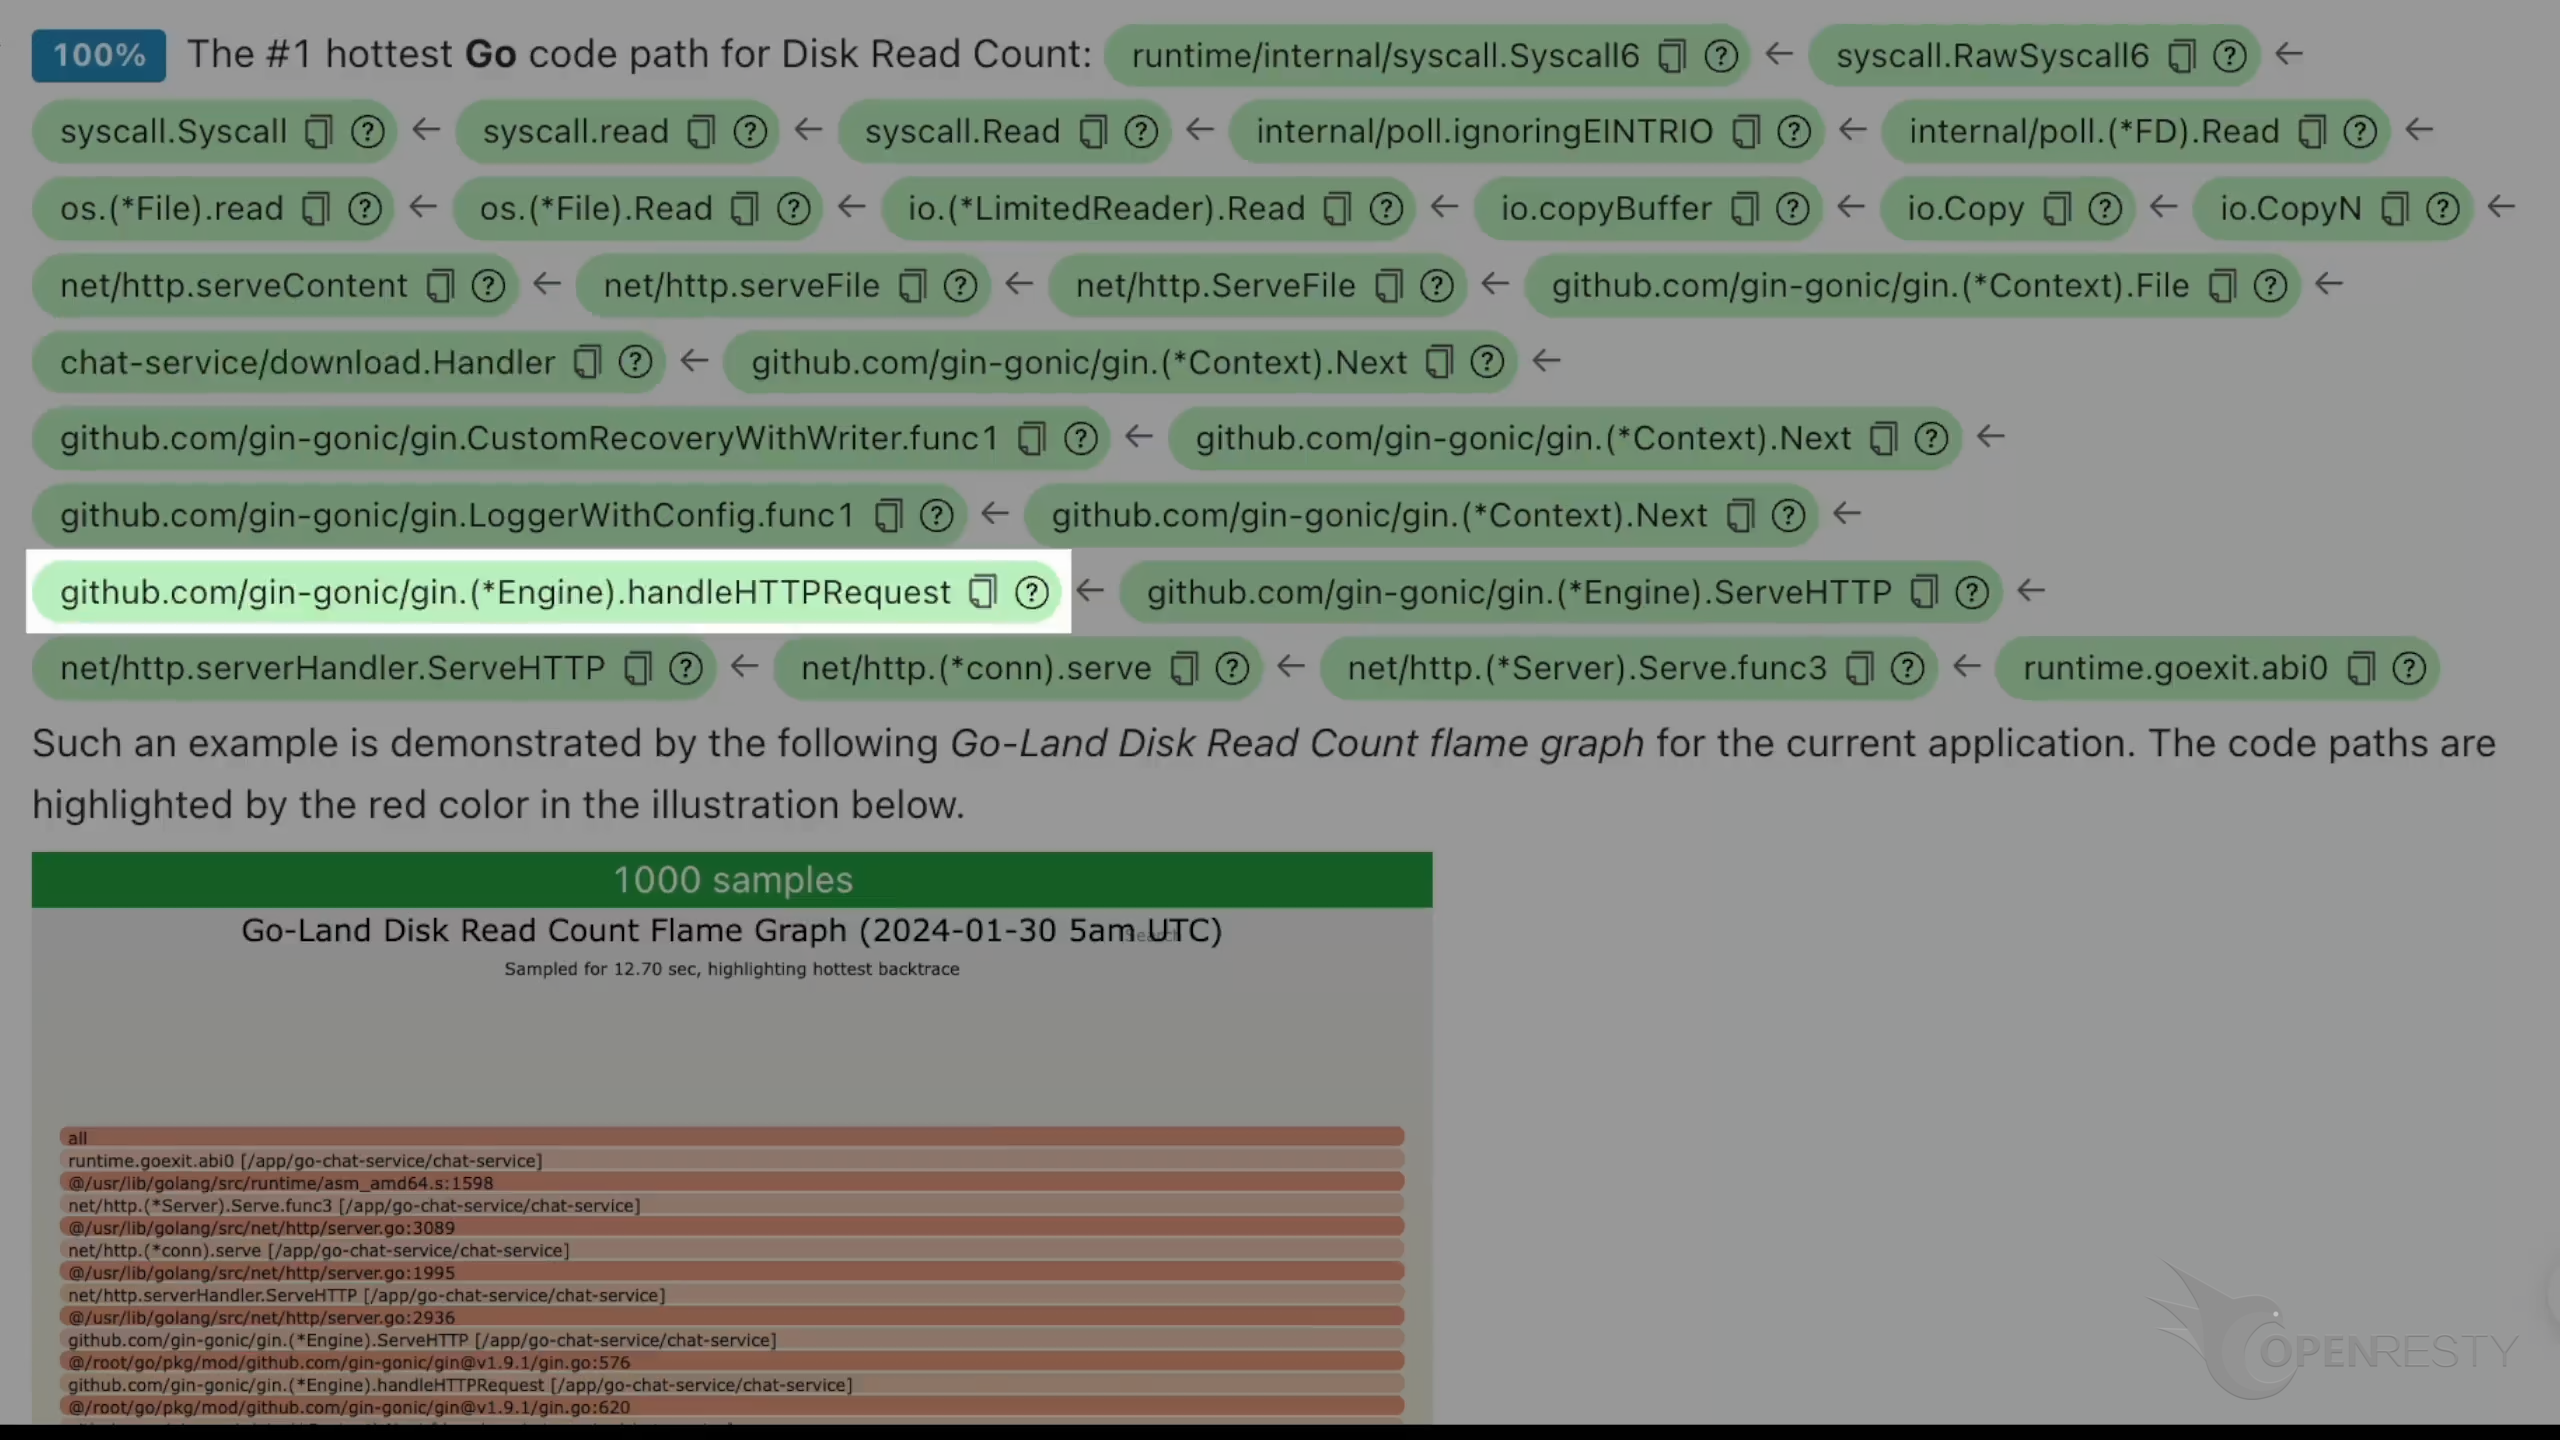
This code path was automatically derived from this Go-land disk read count flame graph.
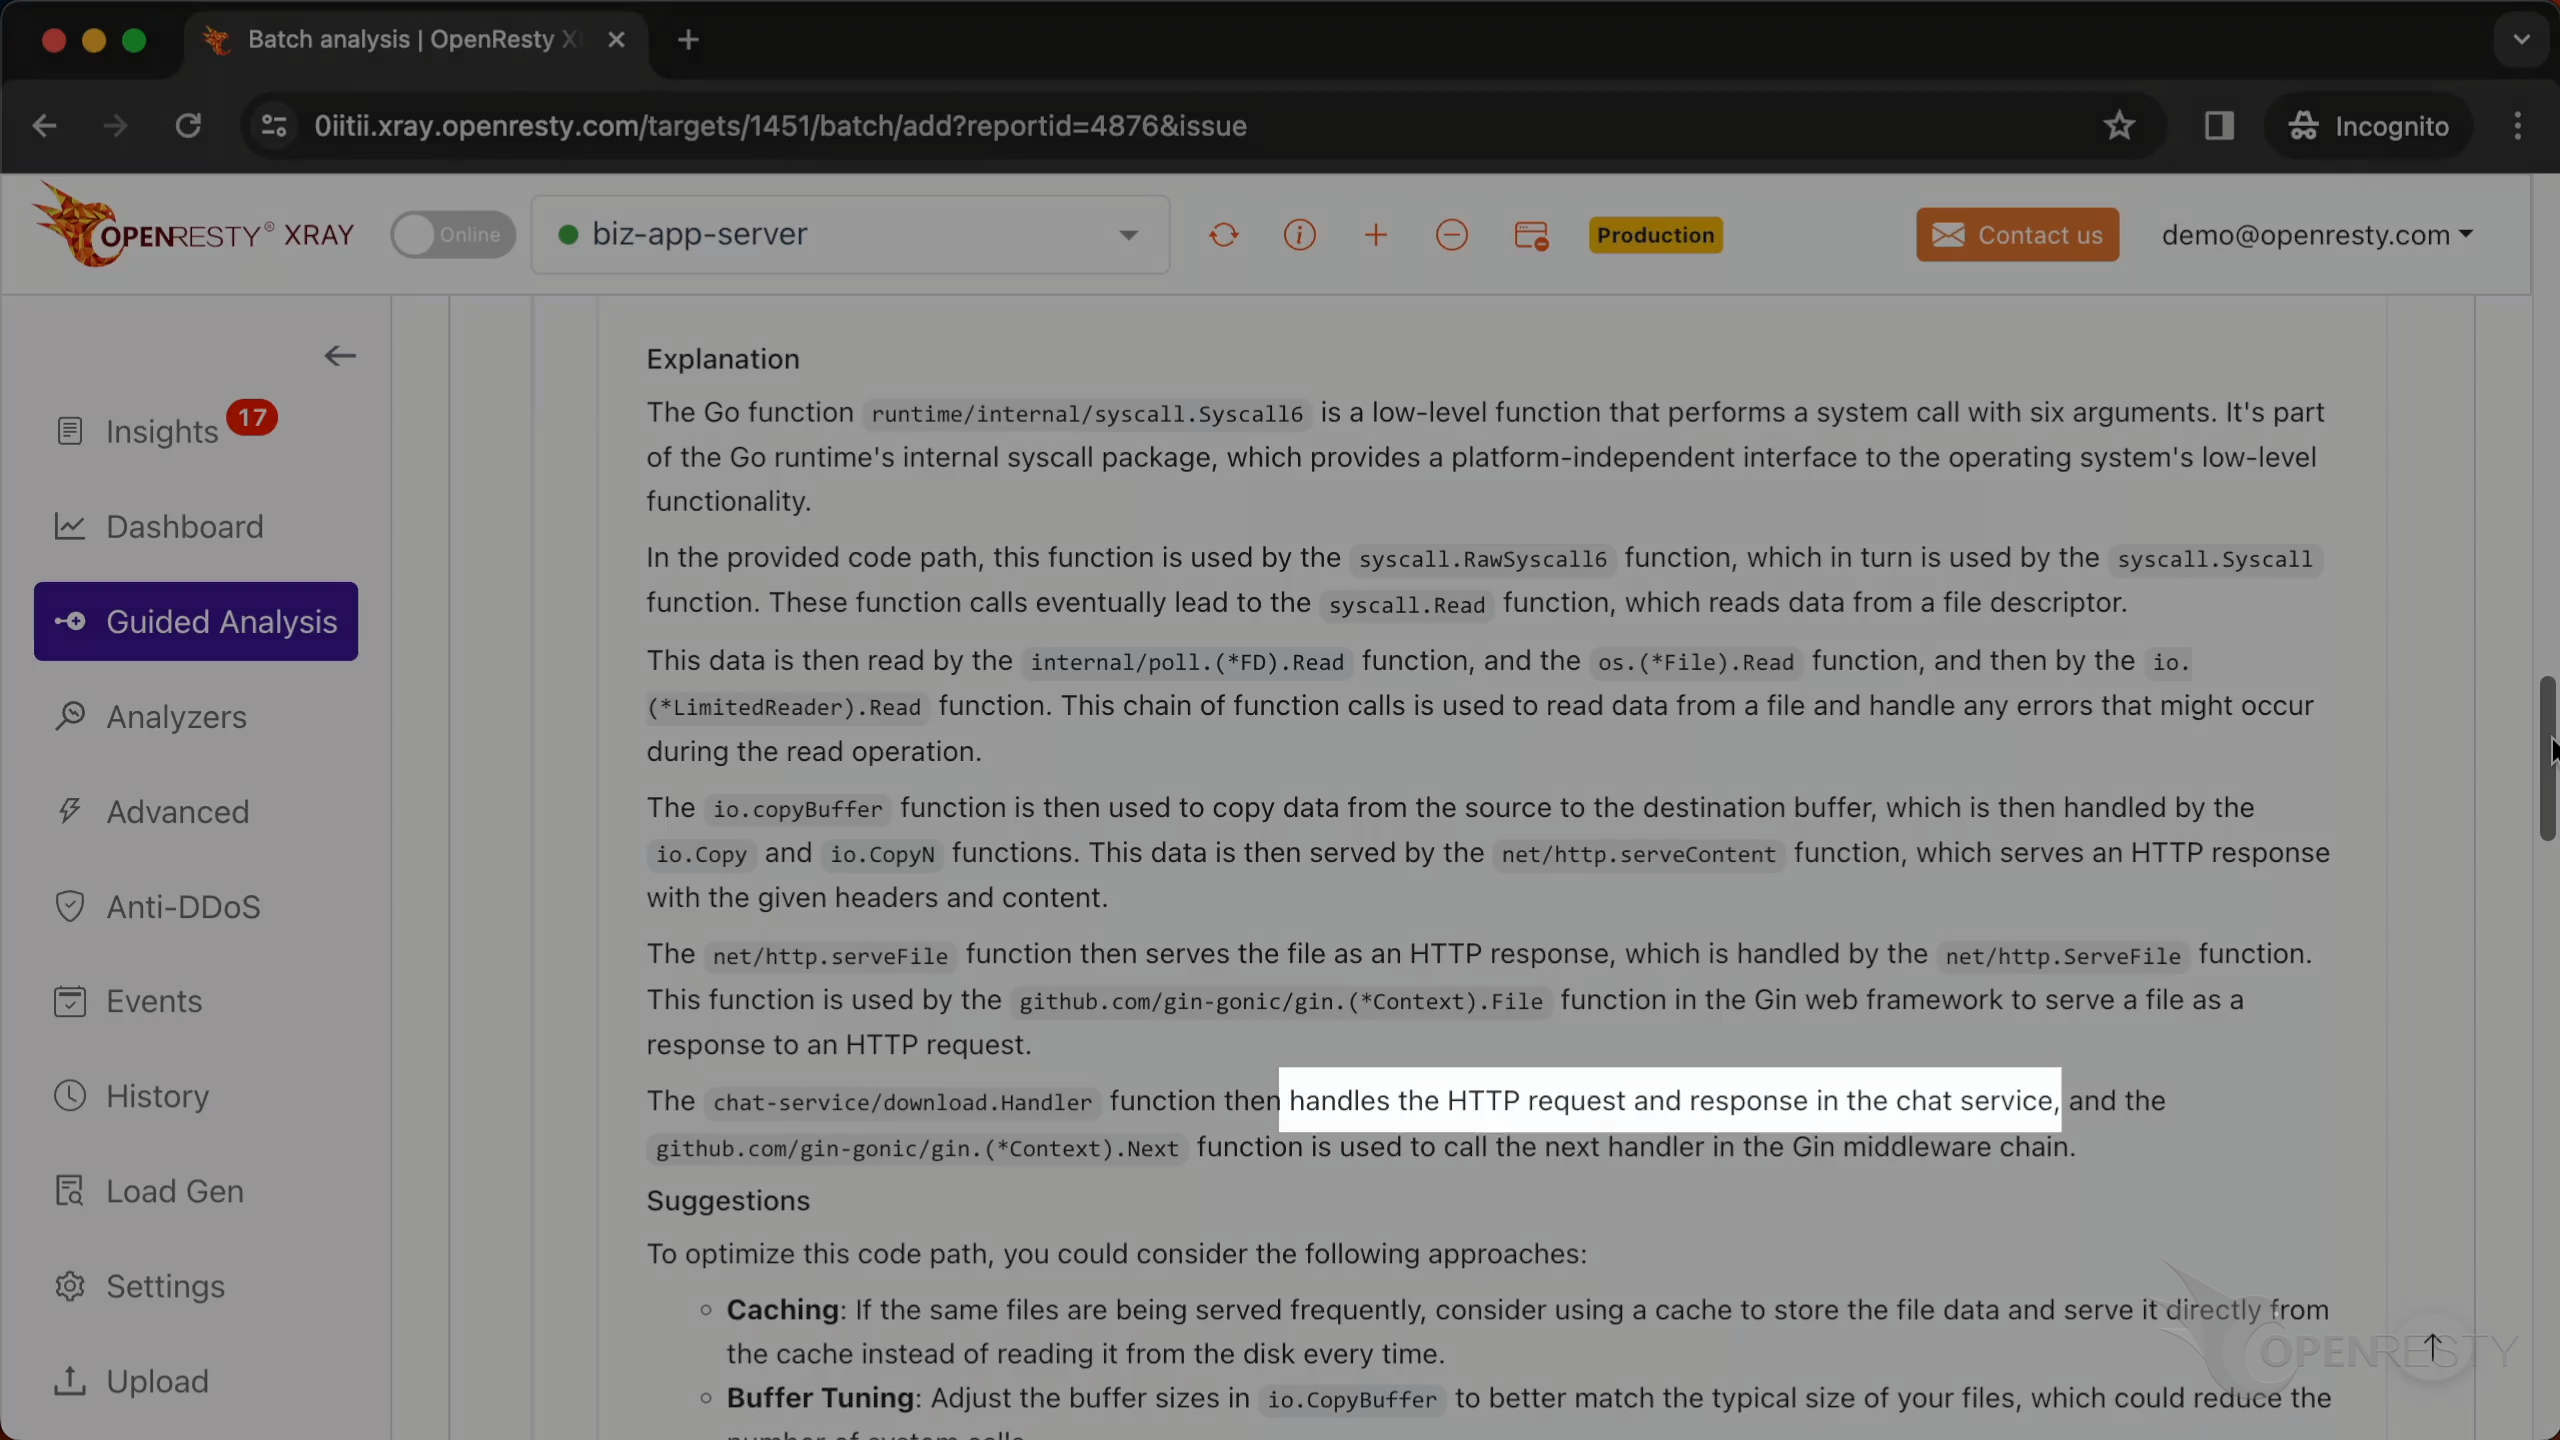
Below are more detailed explanations and suggestions regarding the current issue.
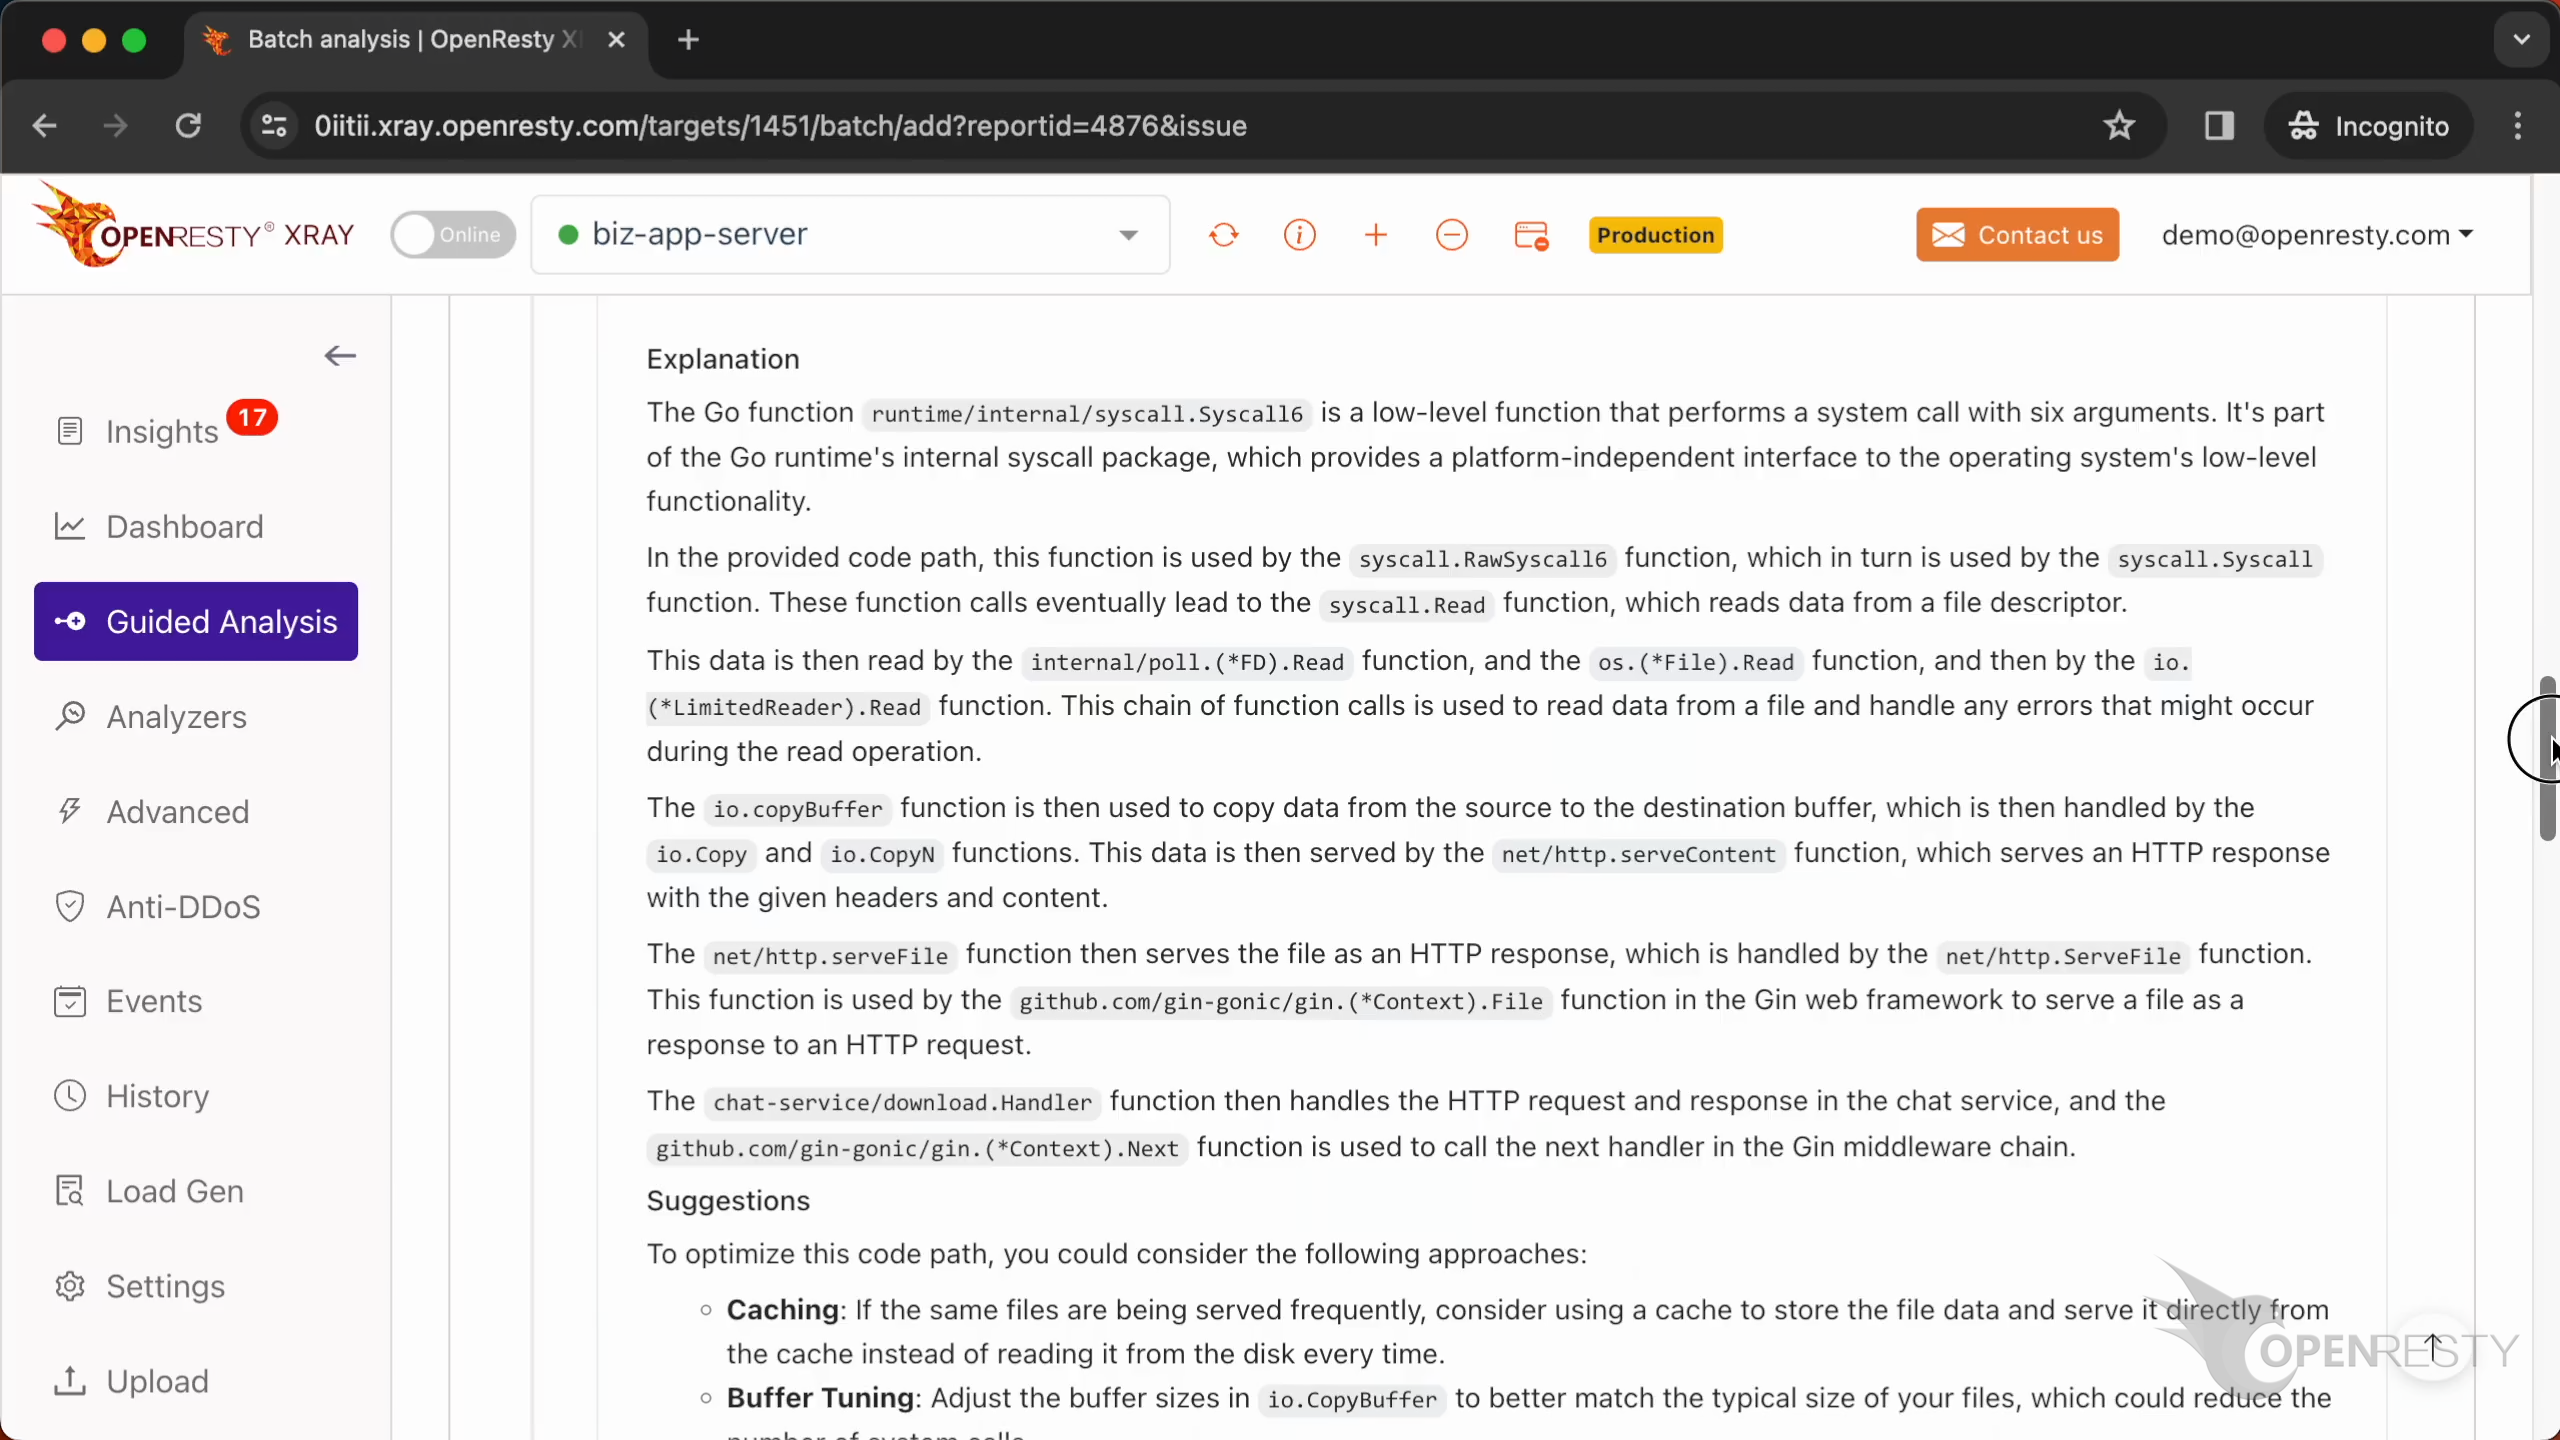
It mentions the function download.Handler.
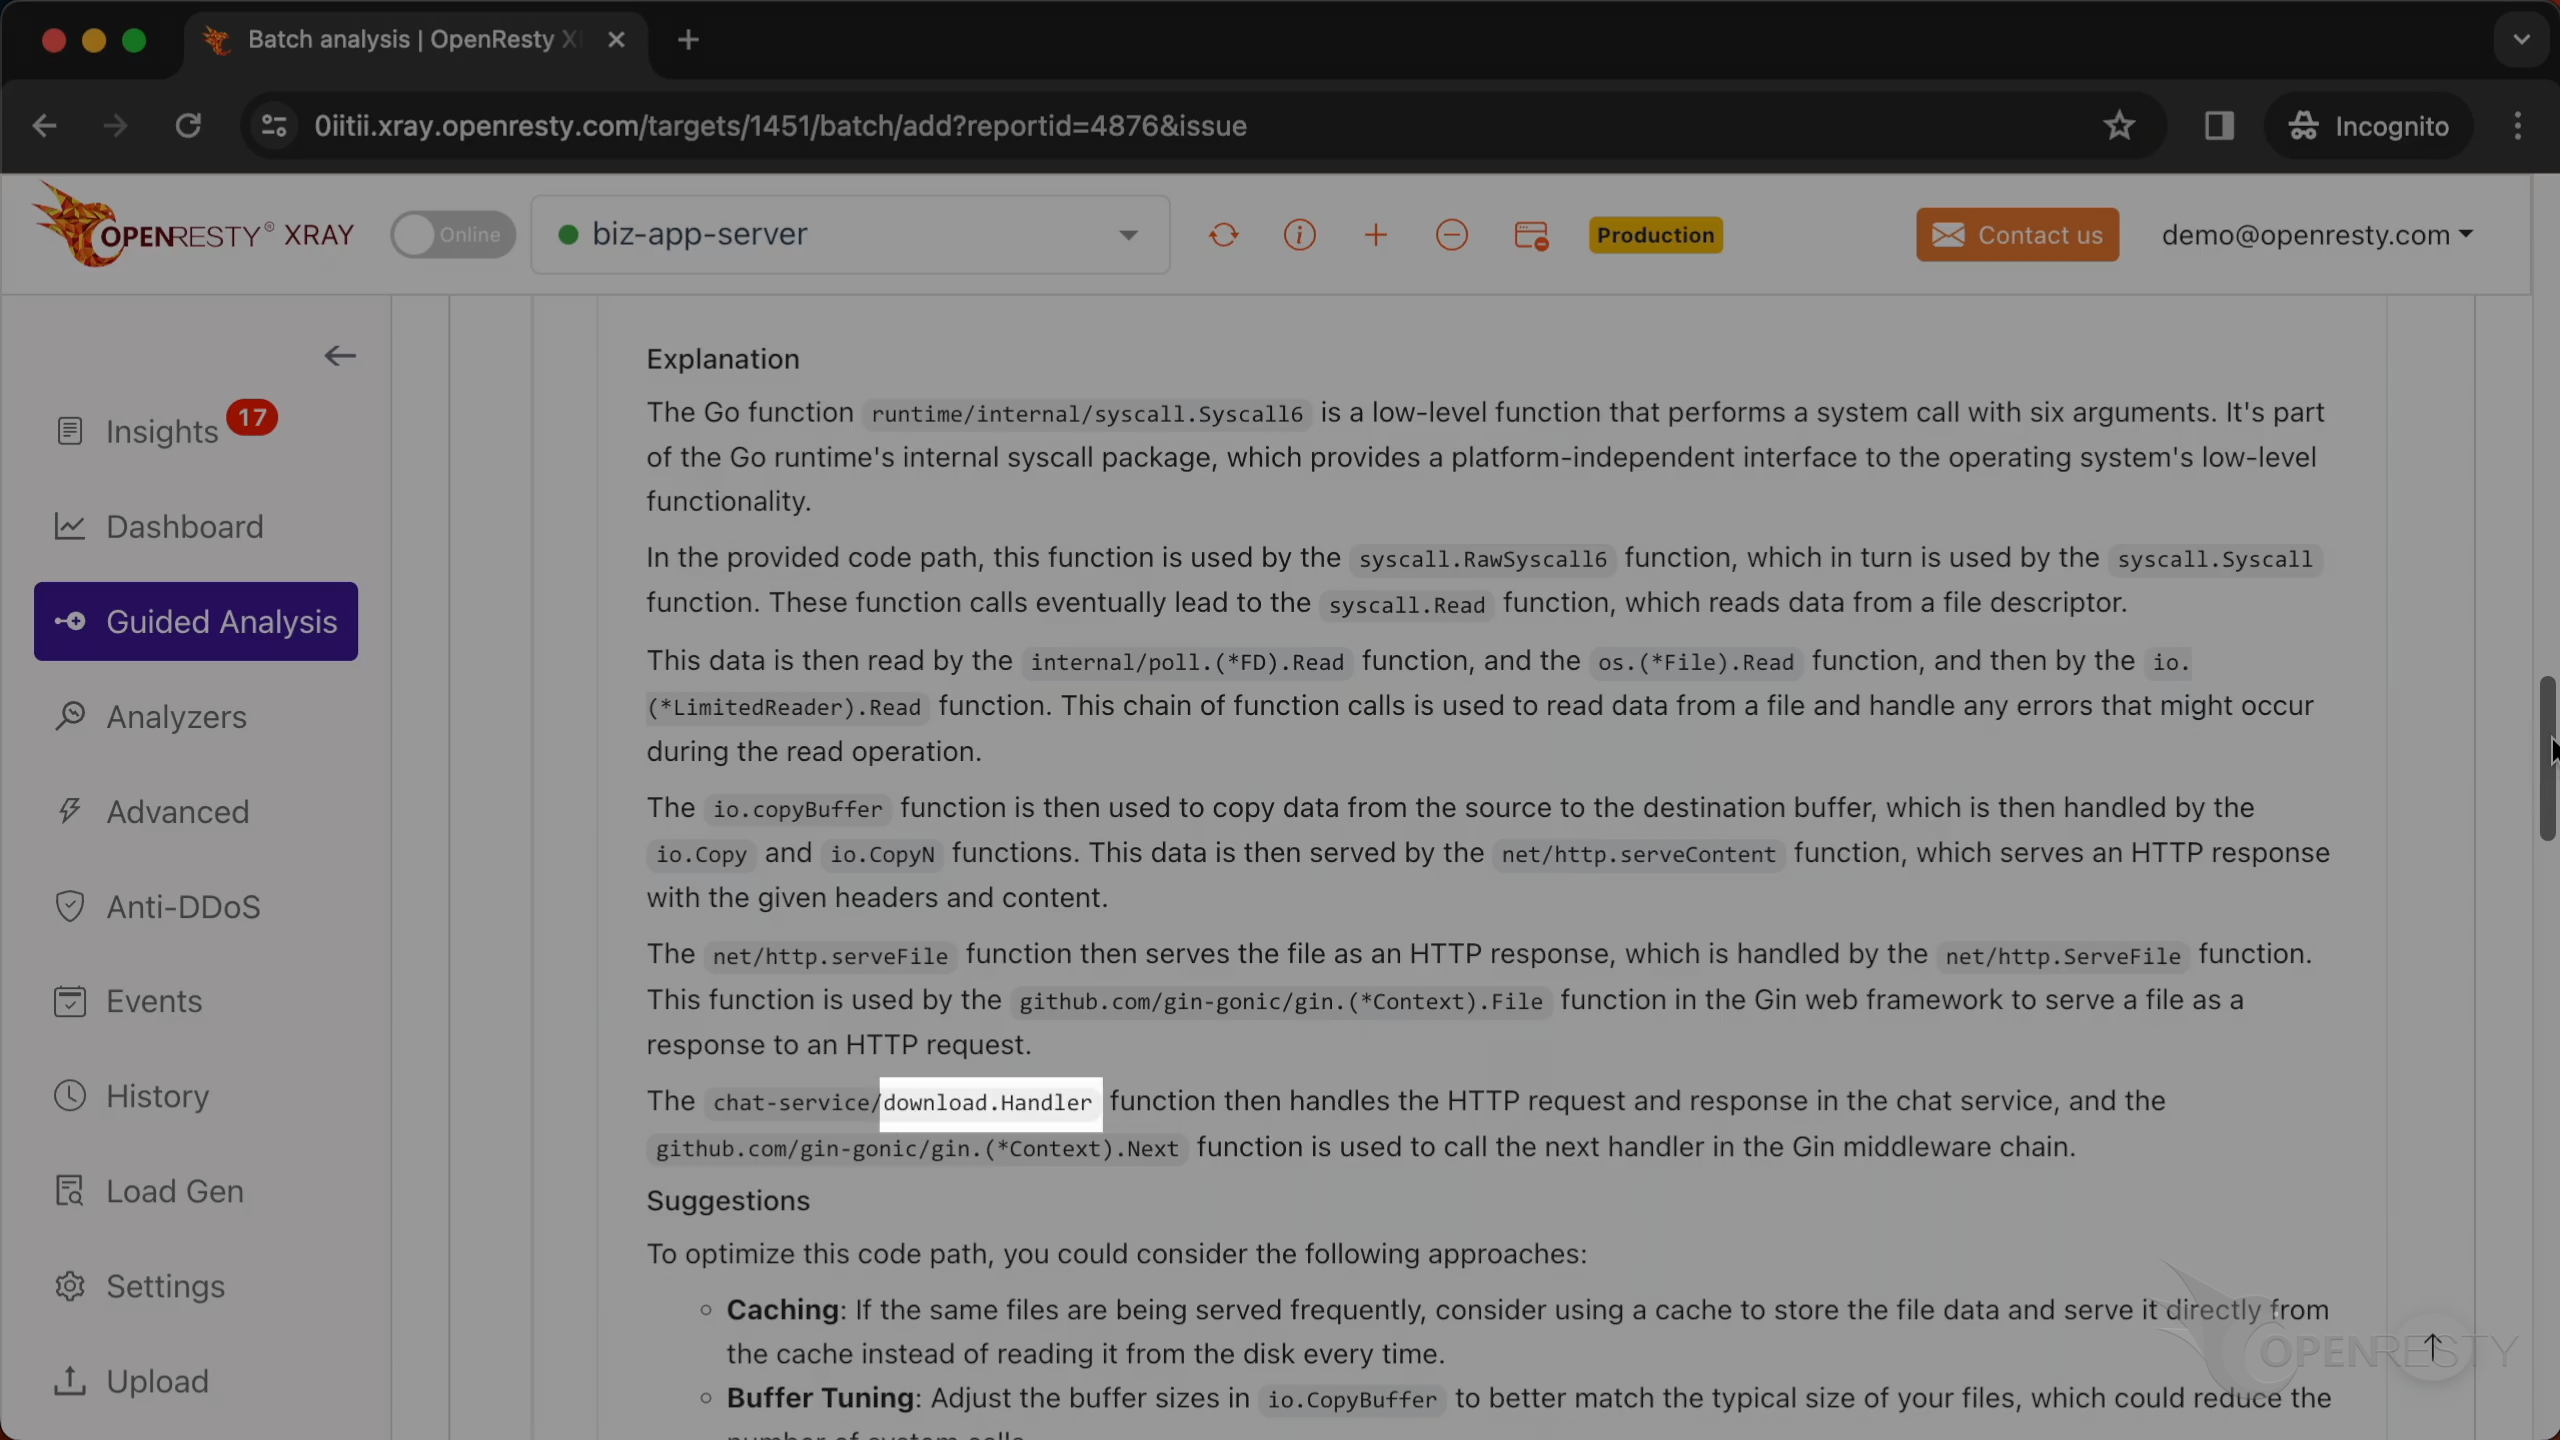
It is responsible for handling HTTP requests and responses.
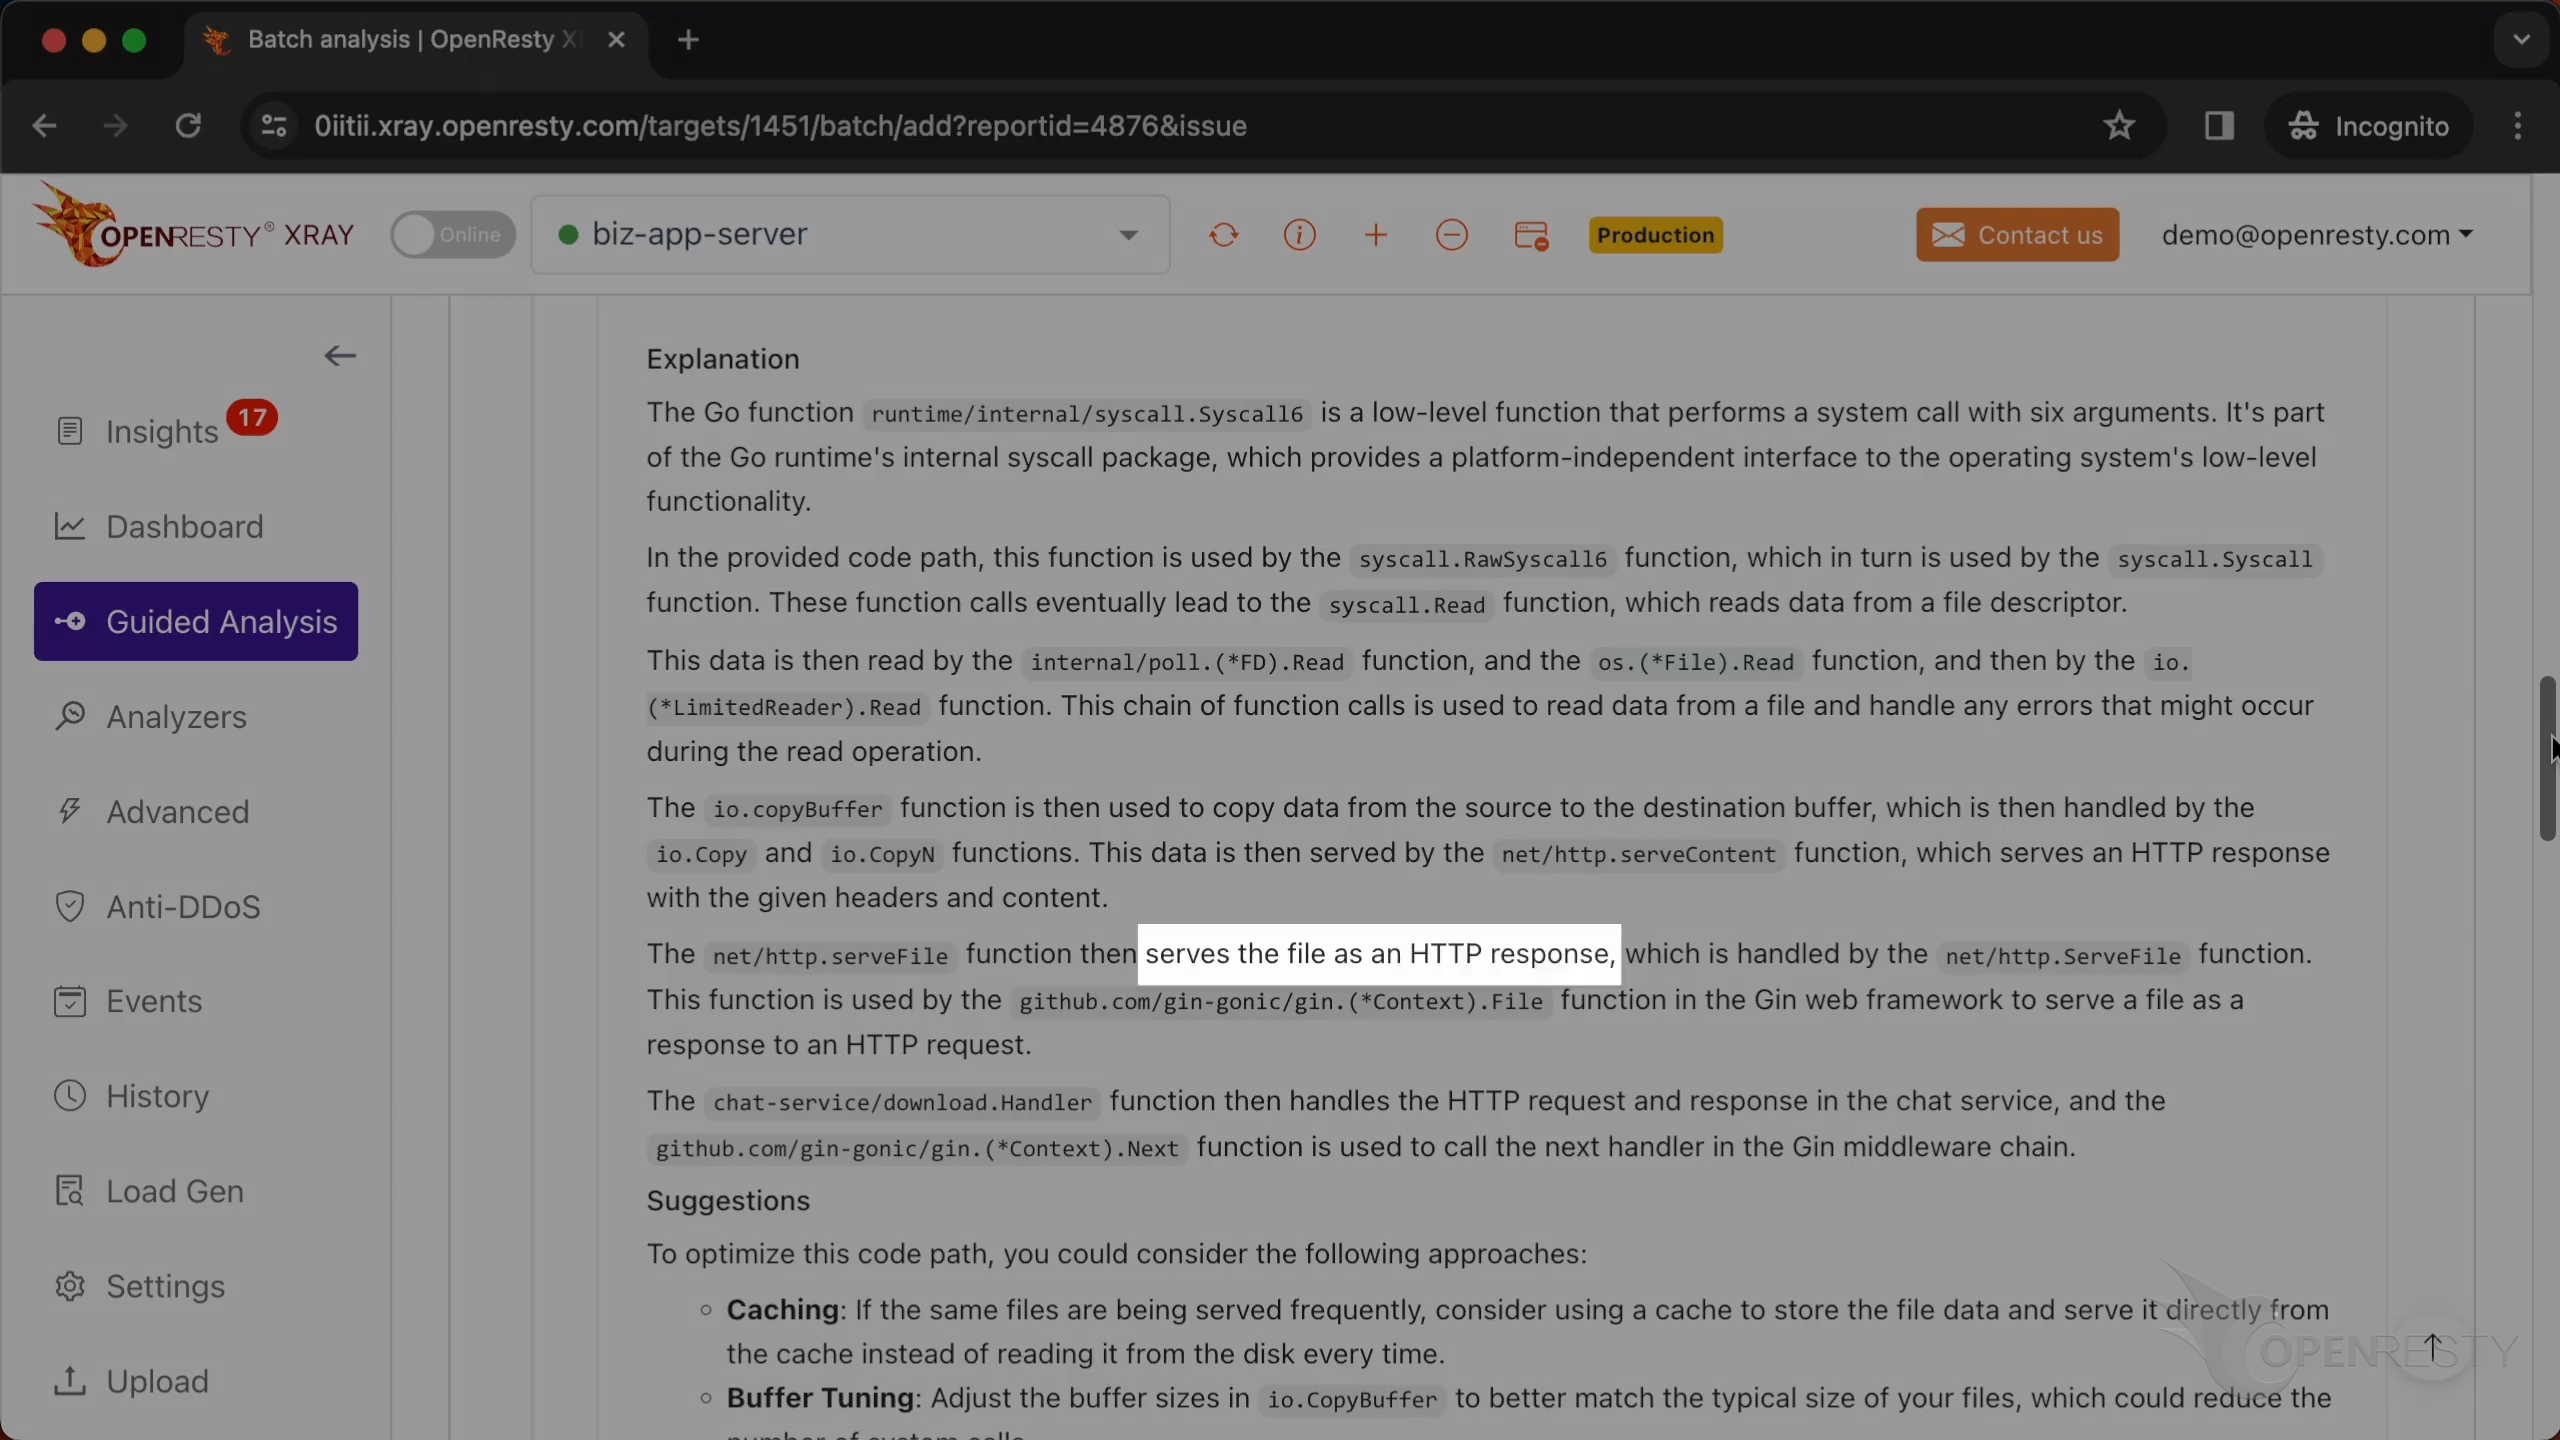
It also mentions the function http.serveFile.
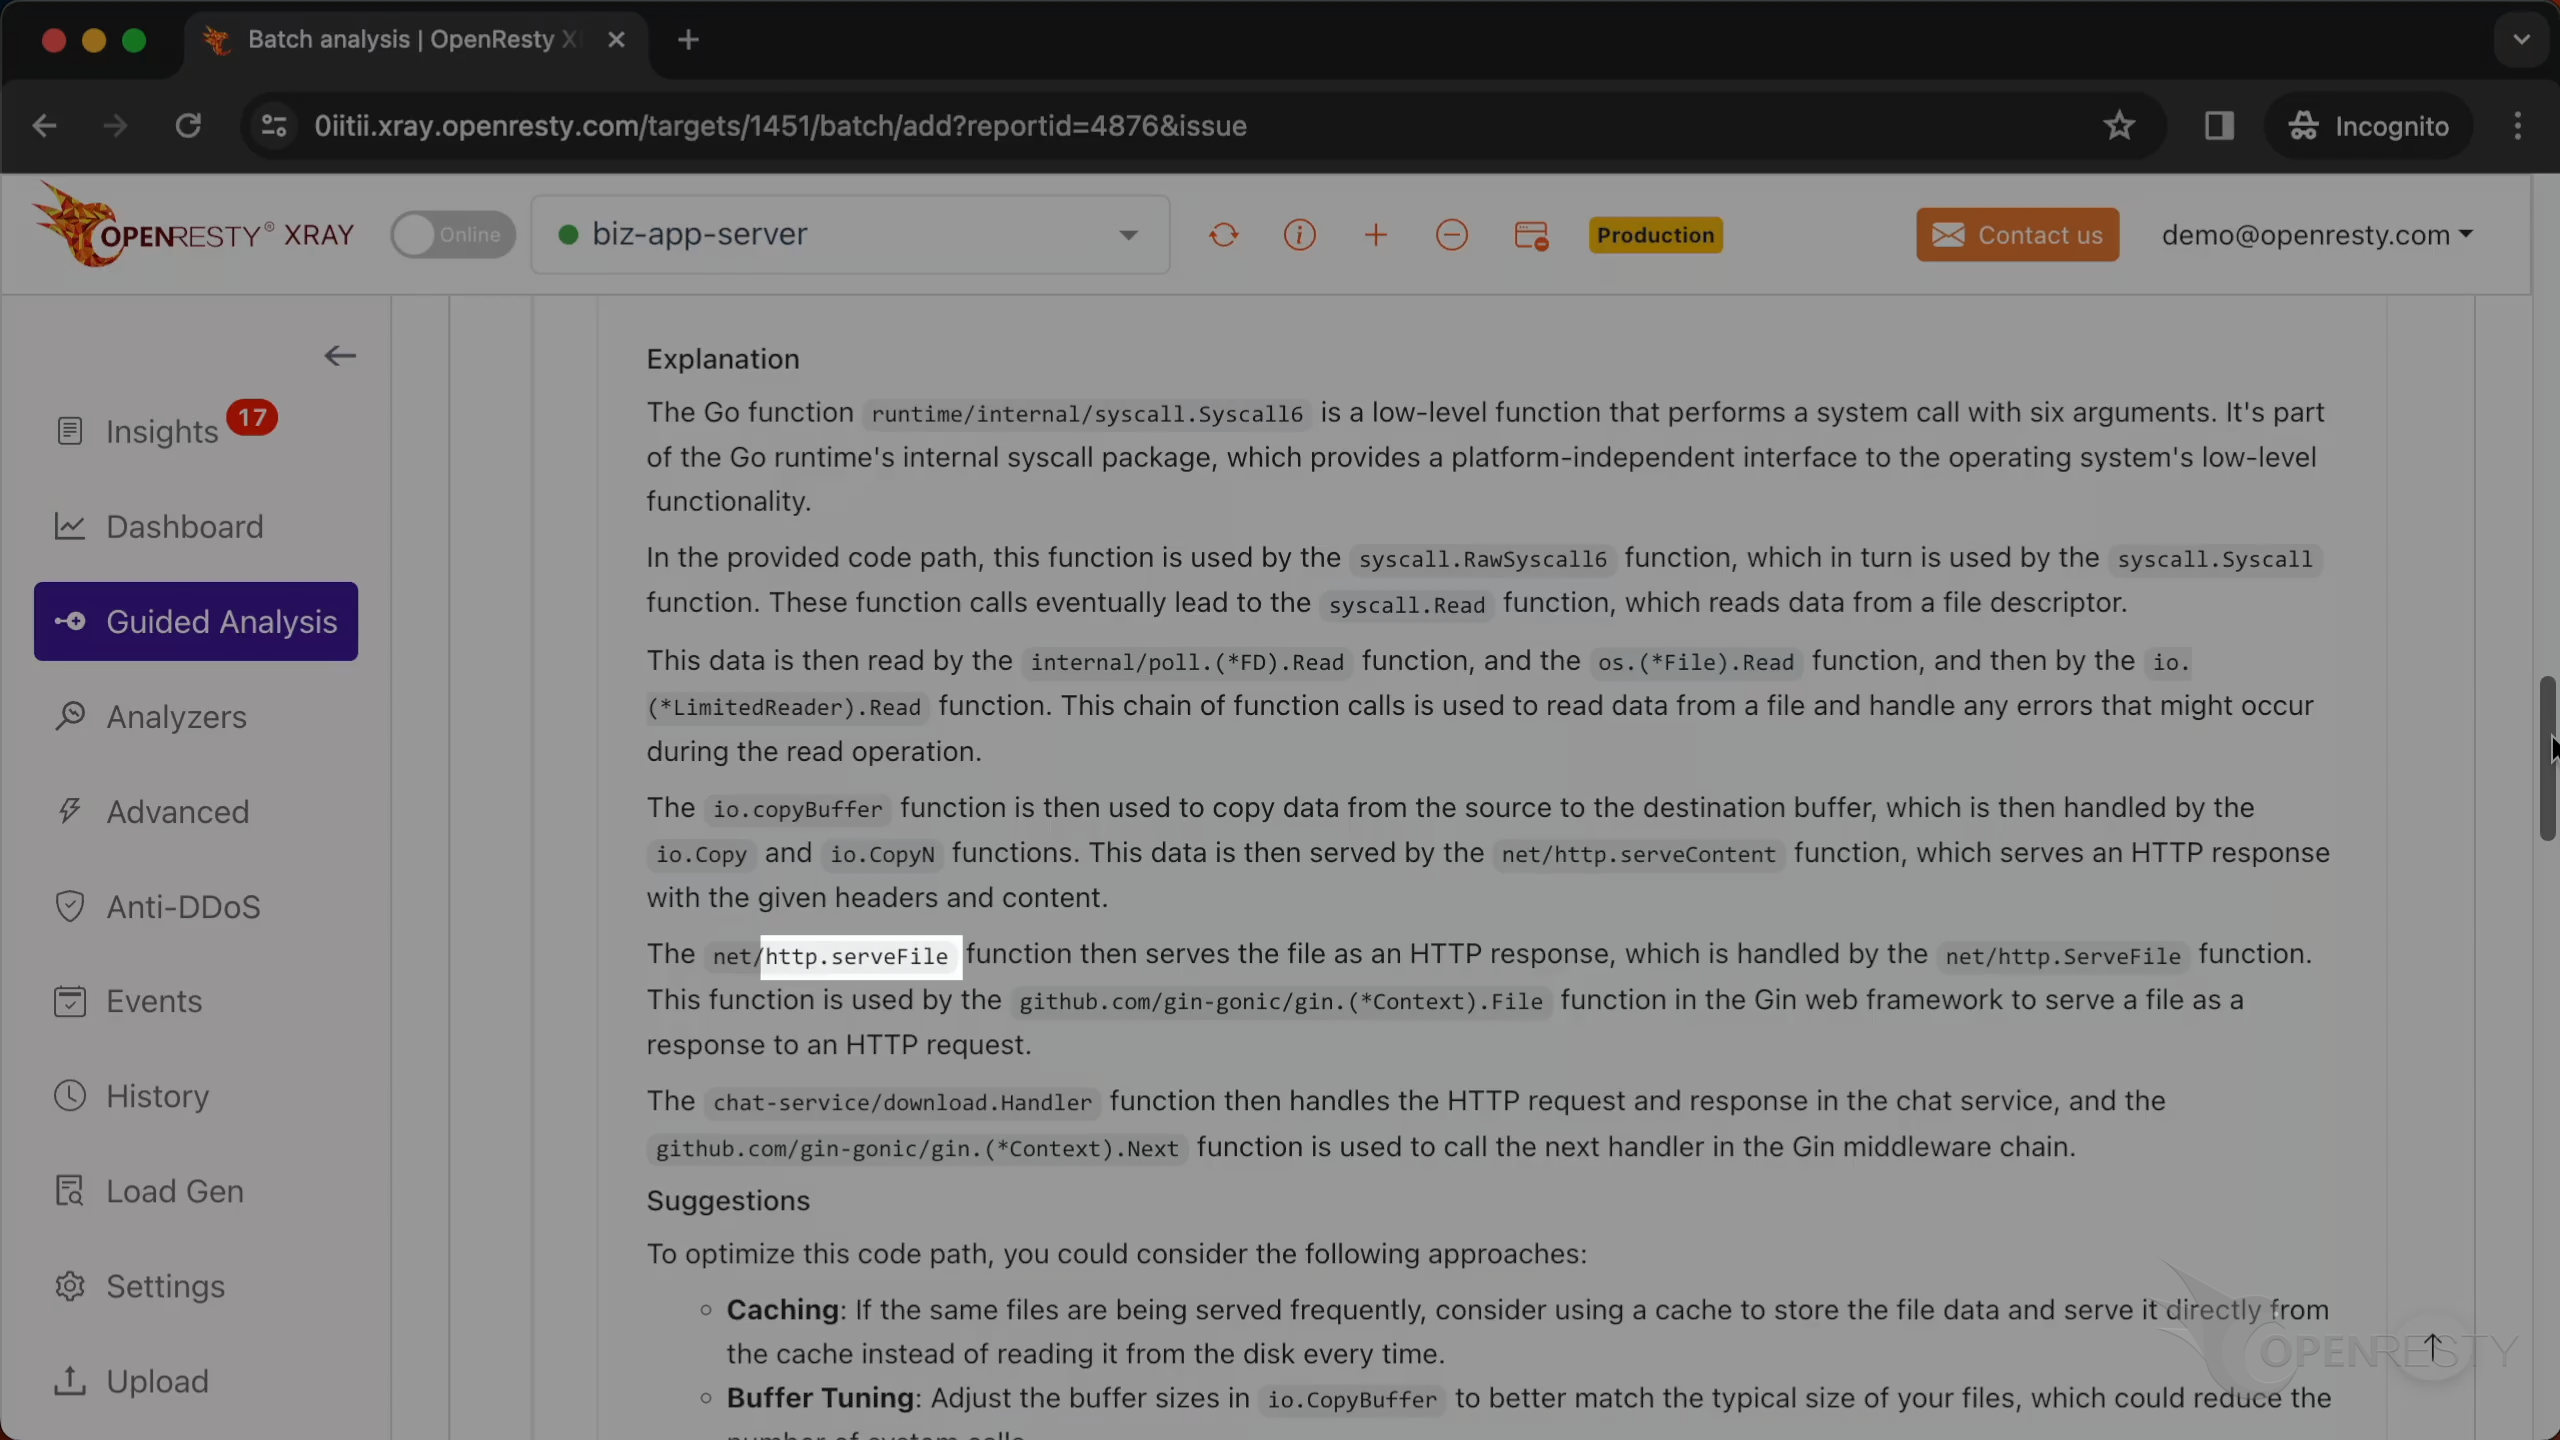
It sends files as HTTP responses.
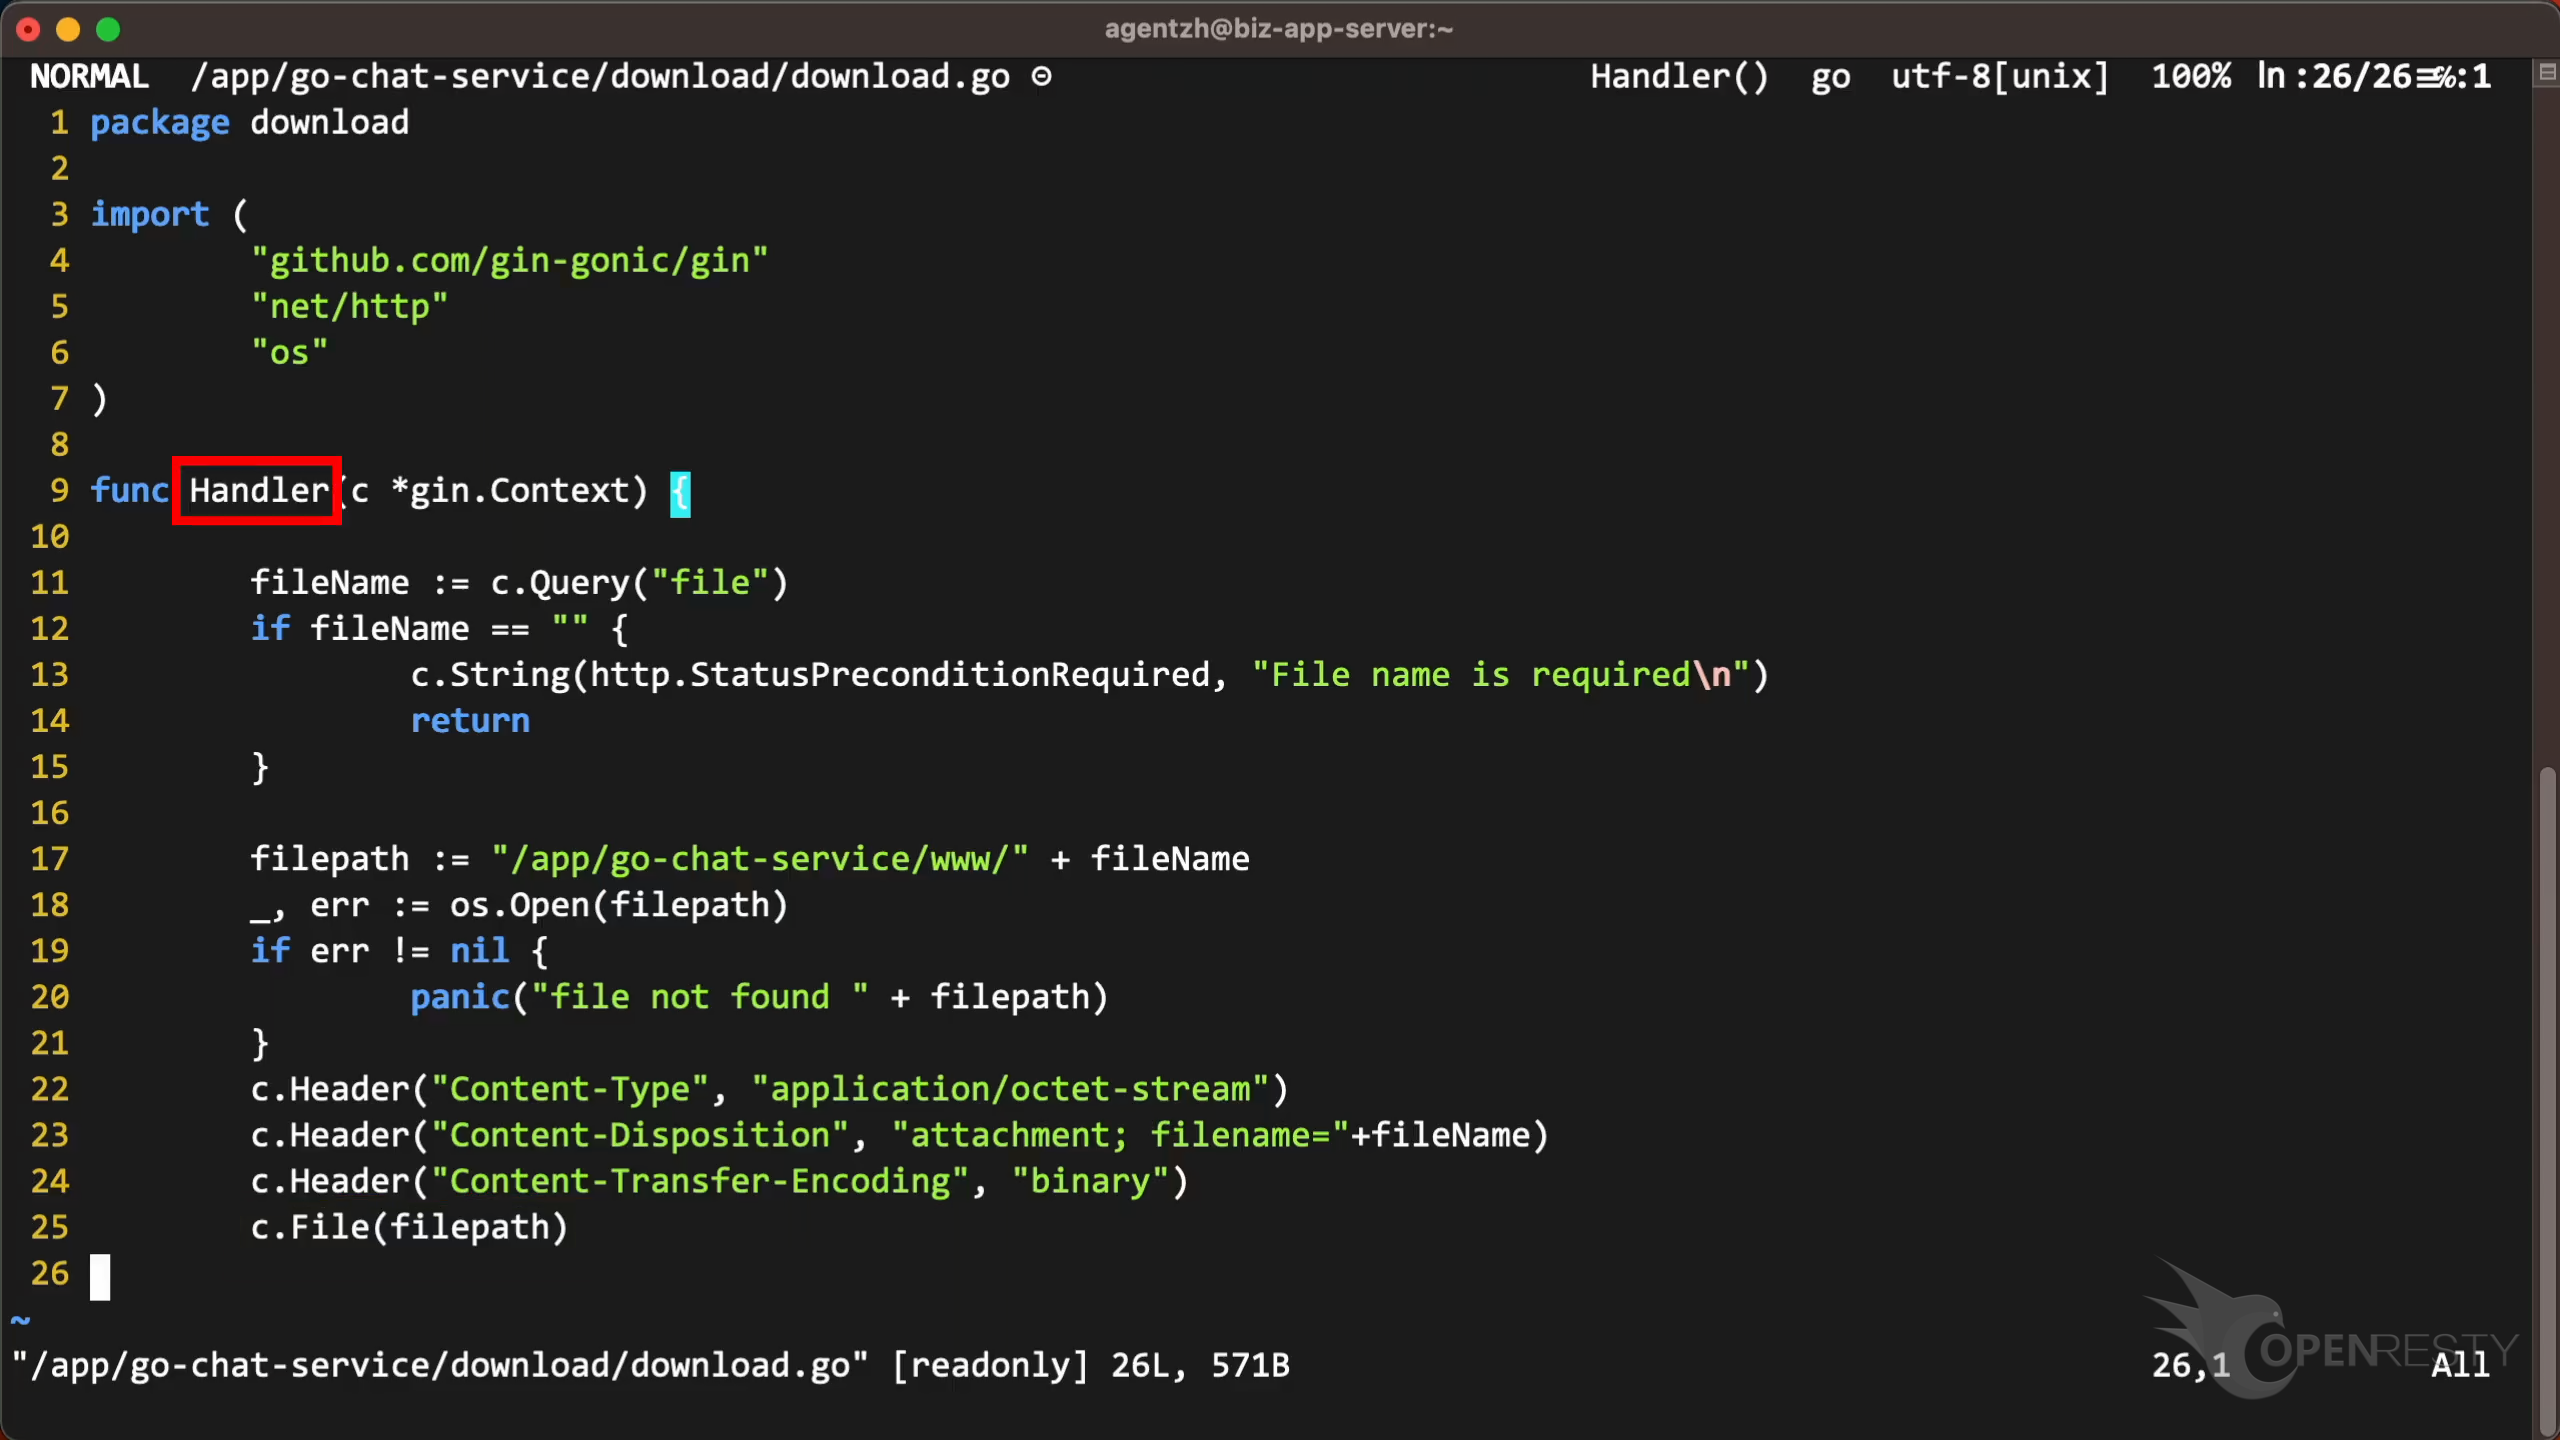
Let’s go back to the code path. Hover the mouse over the green box for this function.
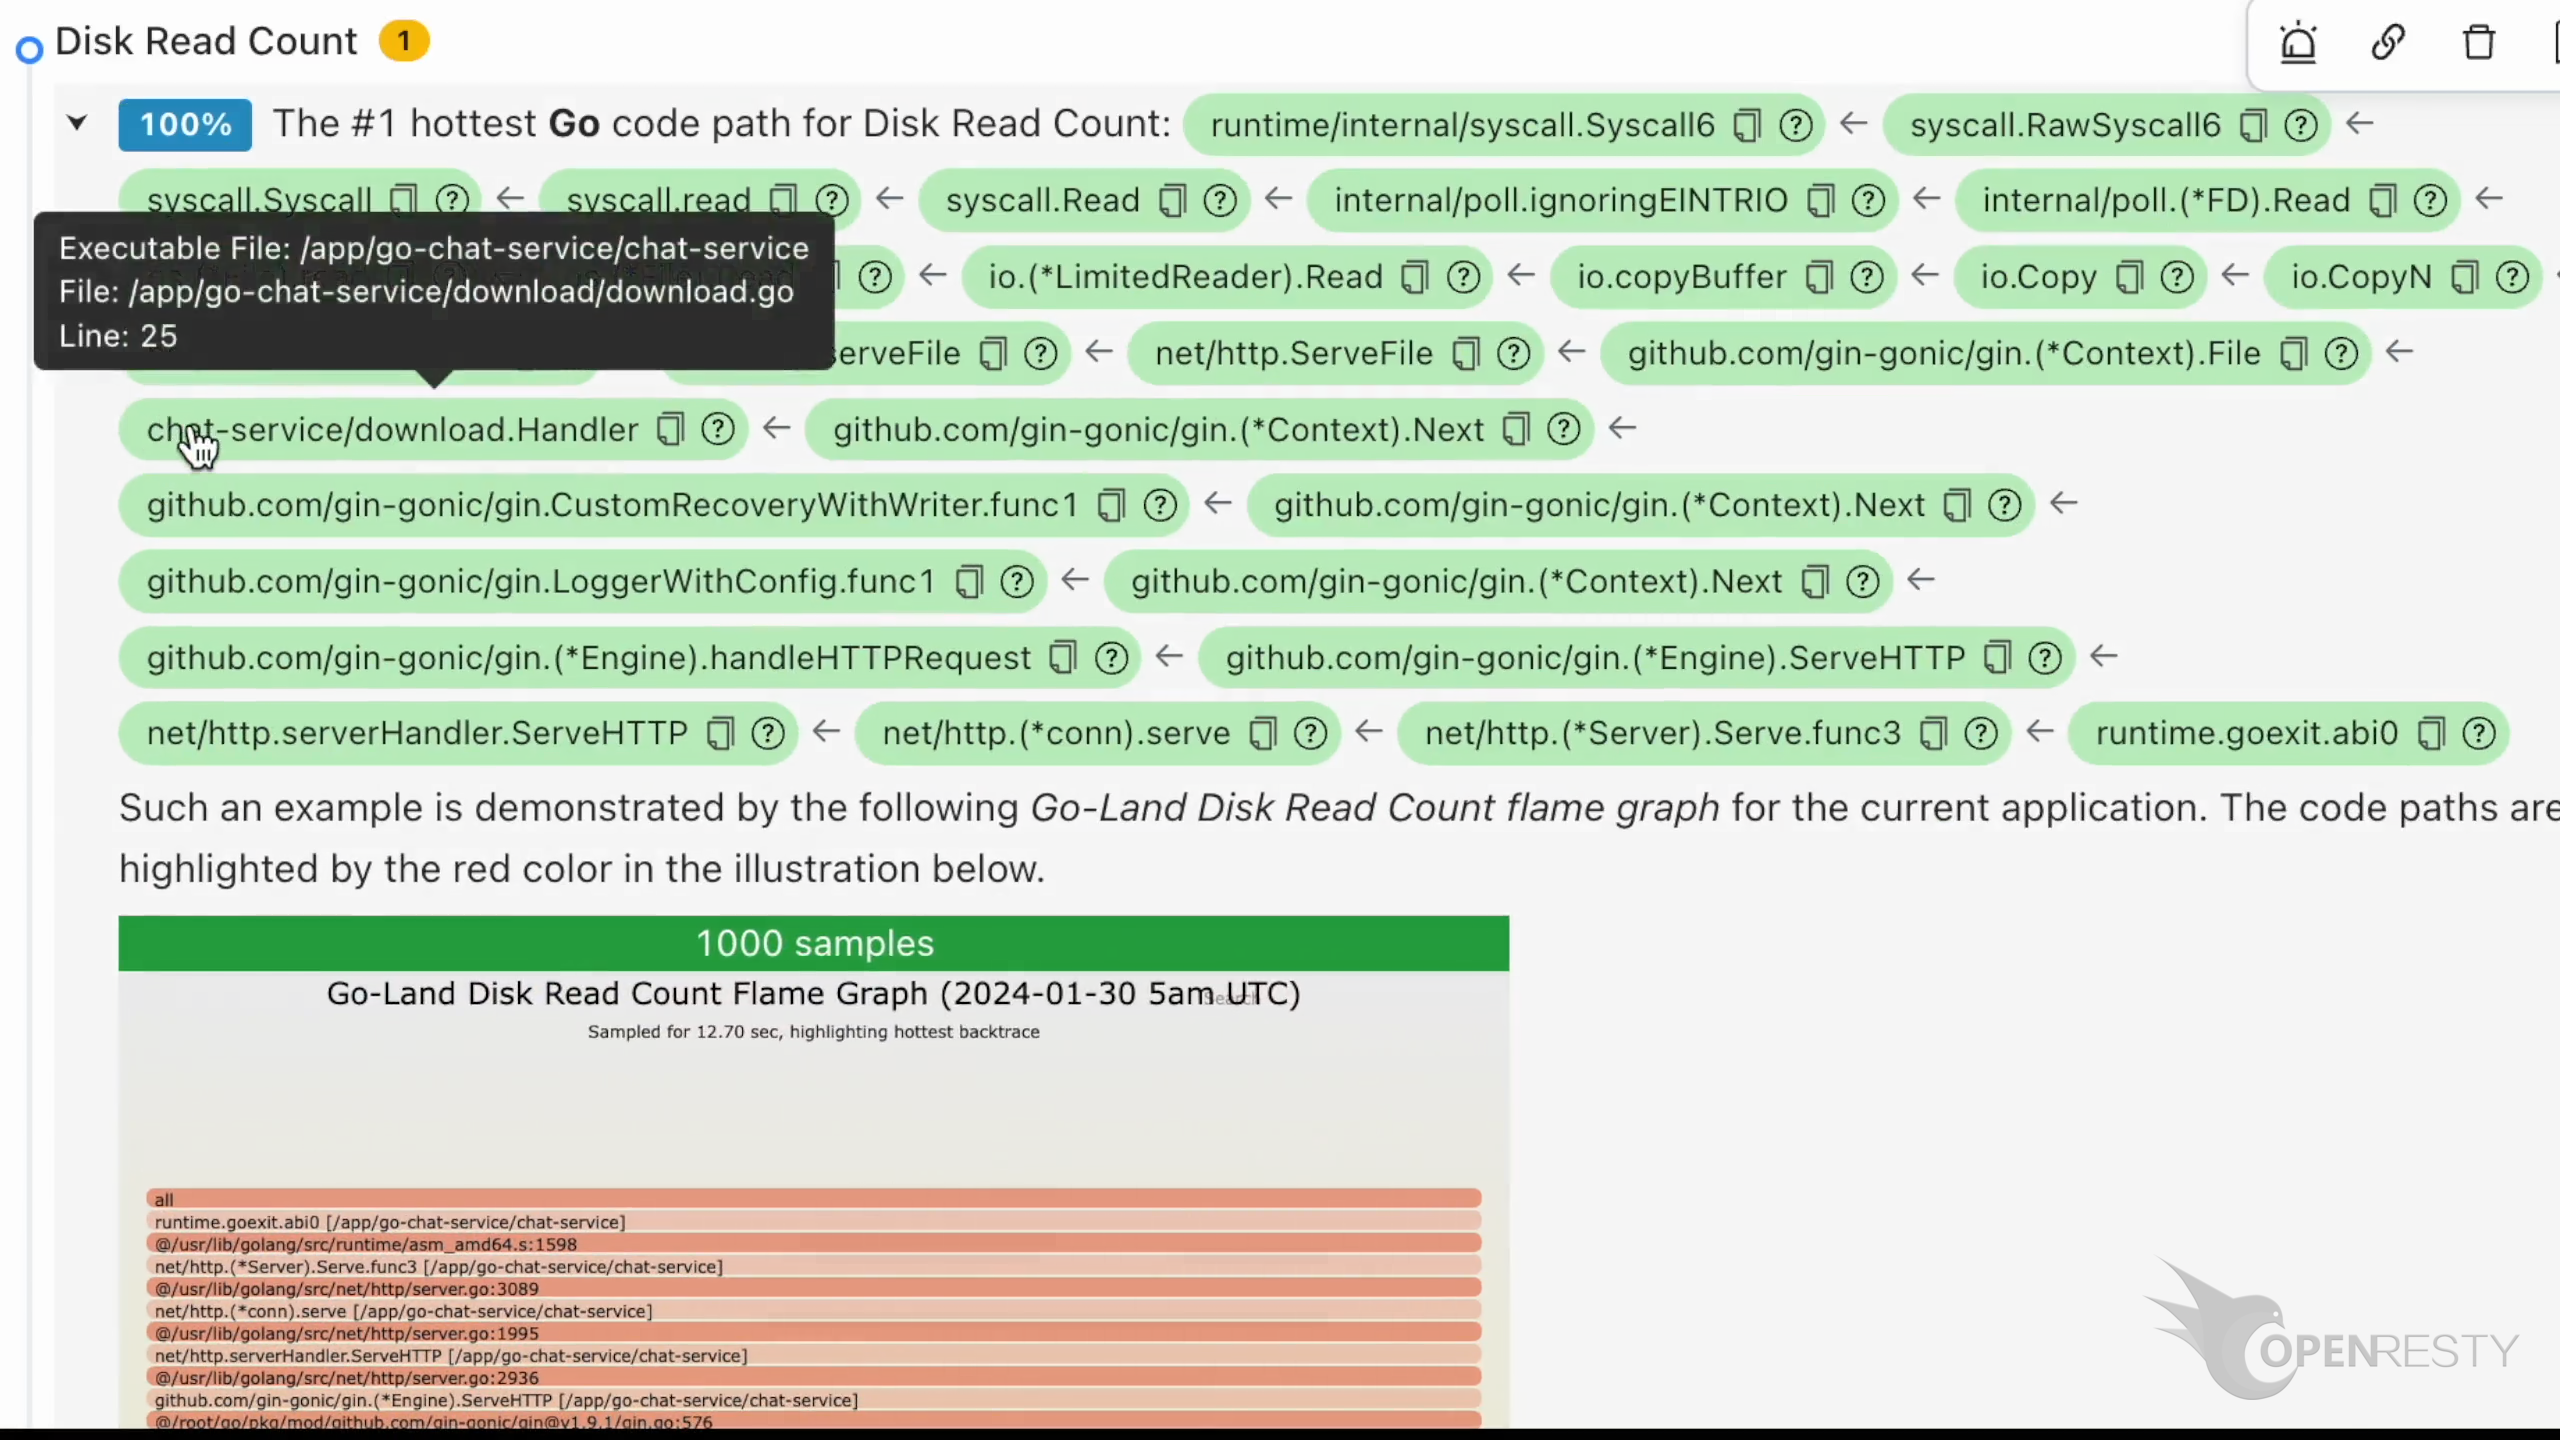
We can see its source file and the full path for this file in the tooltip.

The source line number is 25.

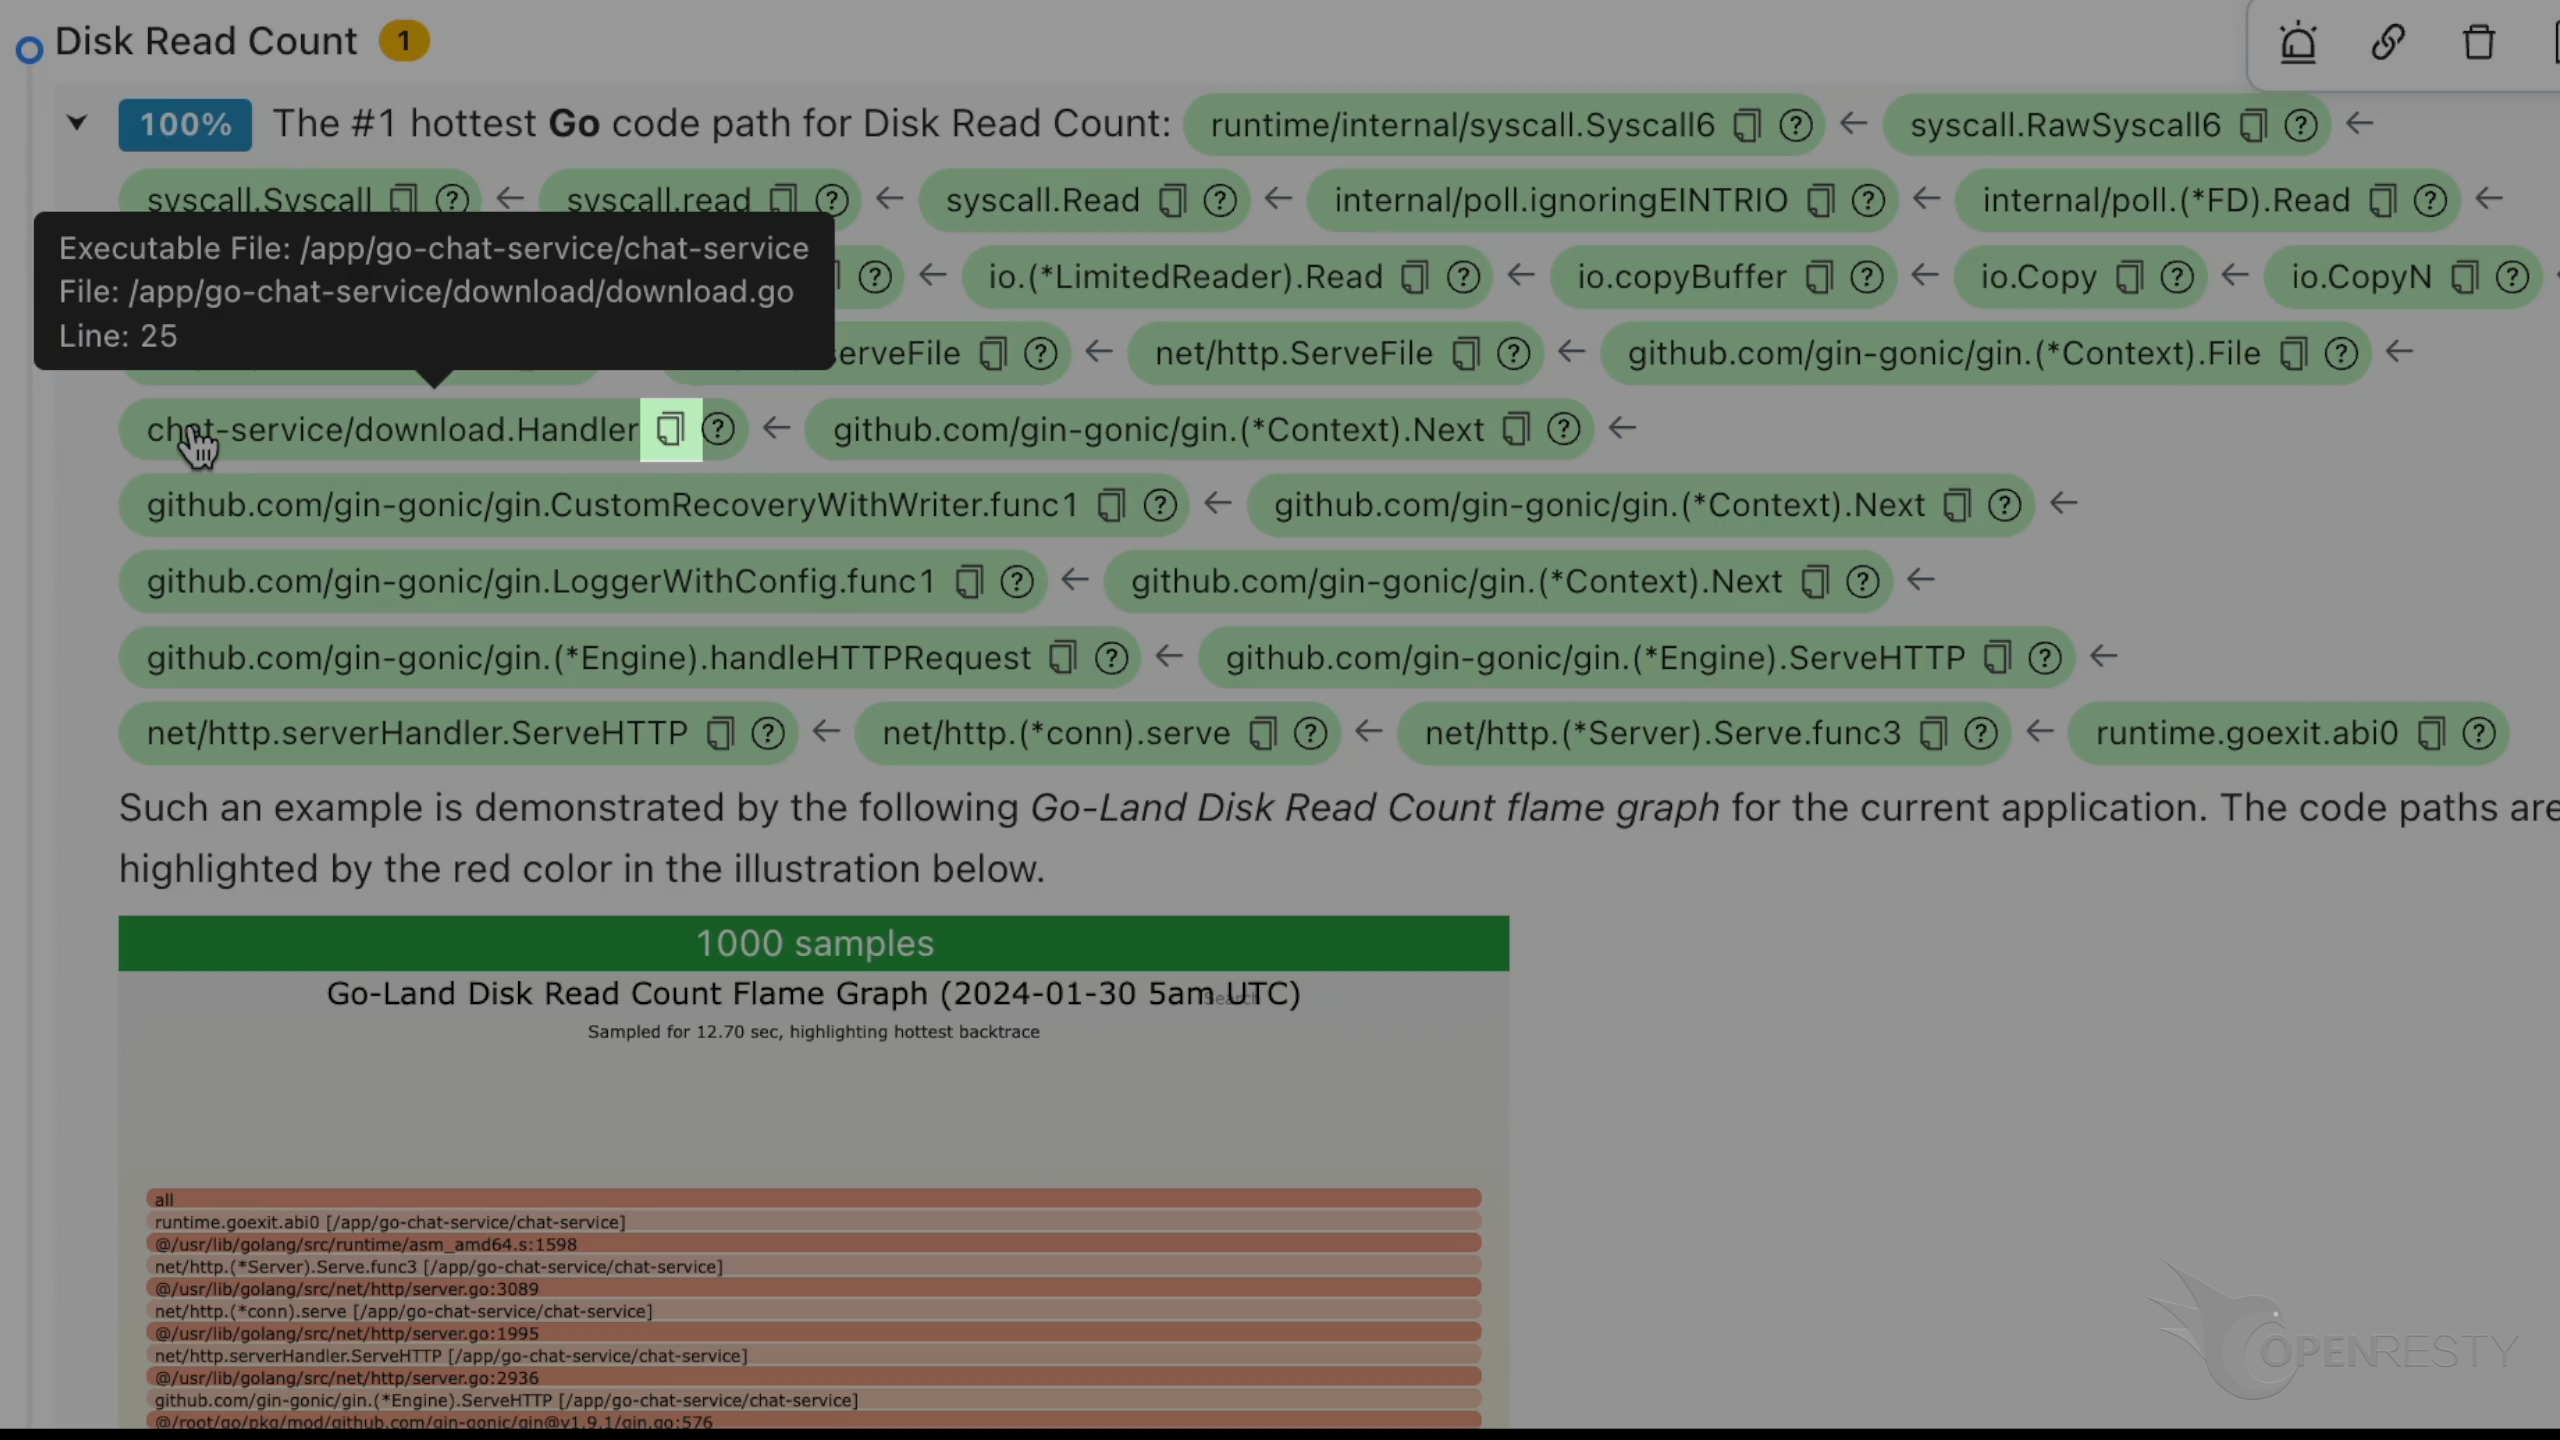
Click the icon to copy the full Go source file path for this function.
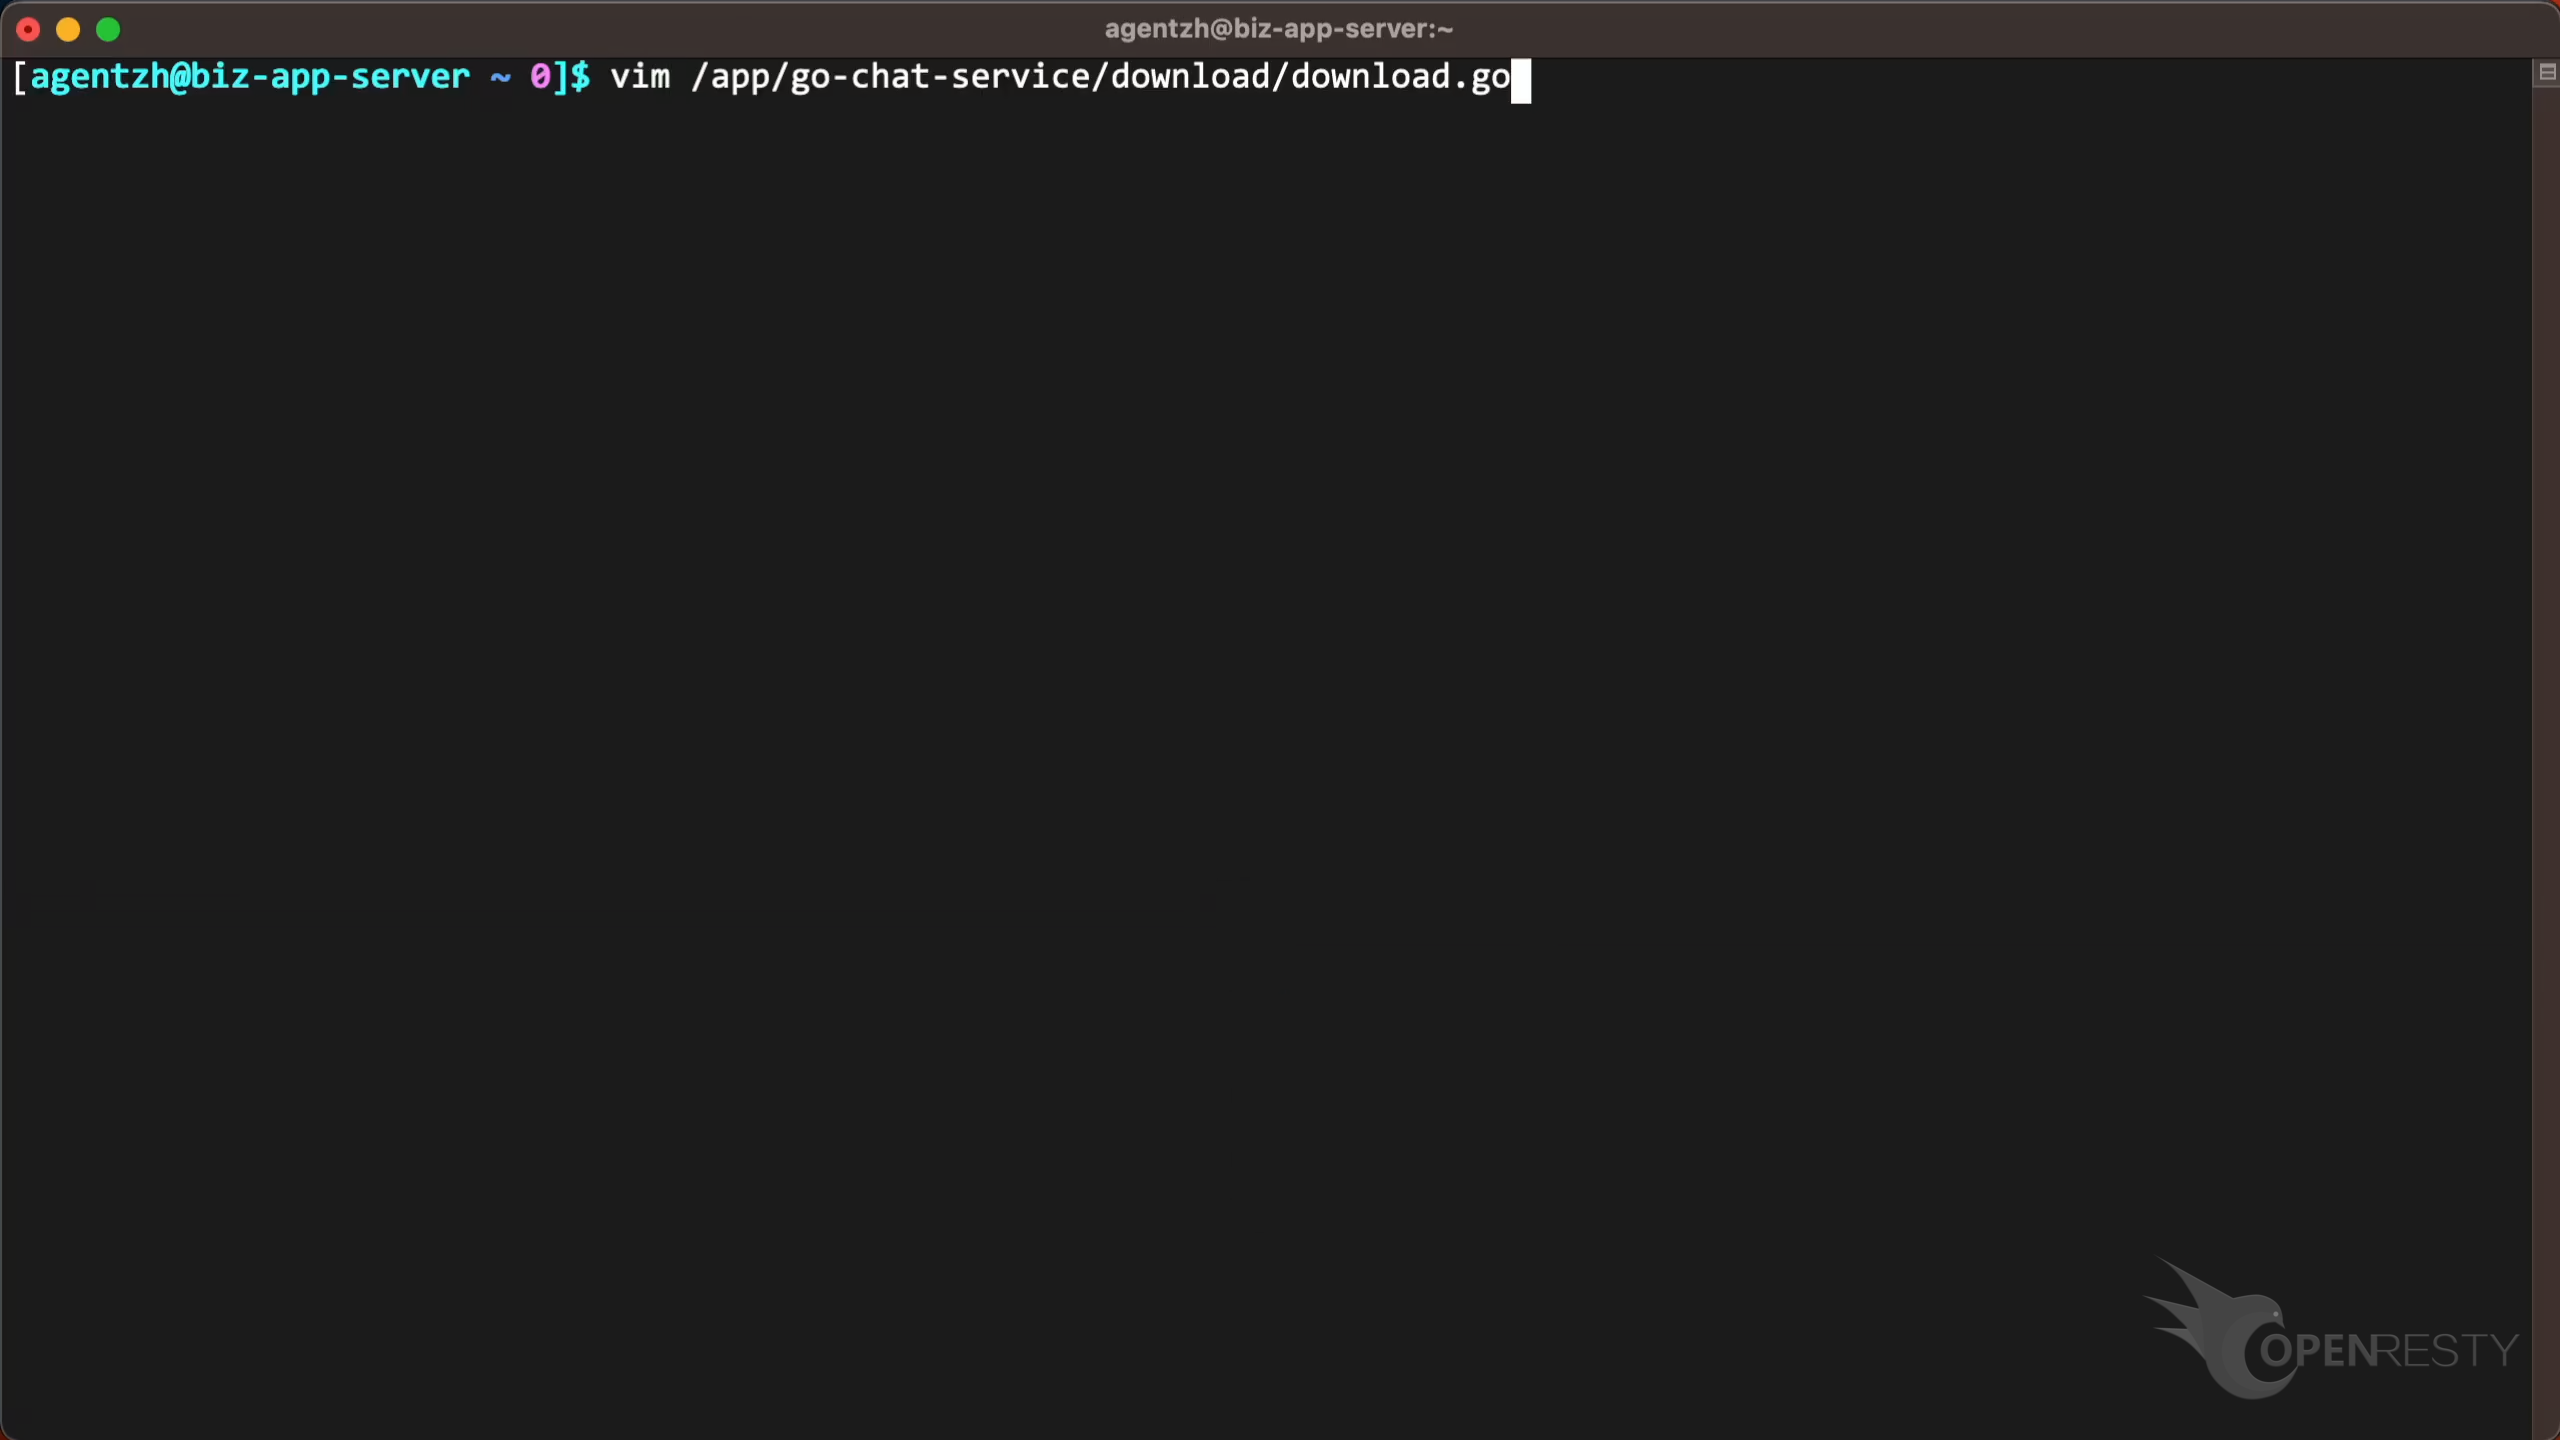
Use the vim editor to open the source file. And look at the Golang code in this file. You can use any editors you like.
Check line 25, as OpenResty XRay suggested.
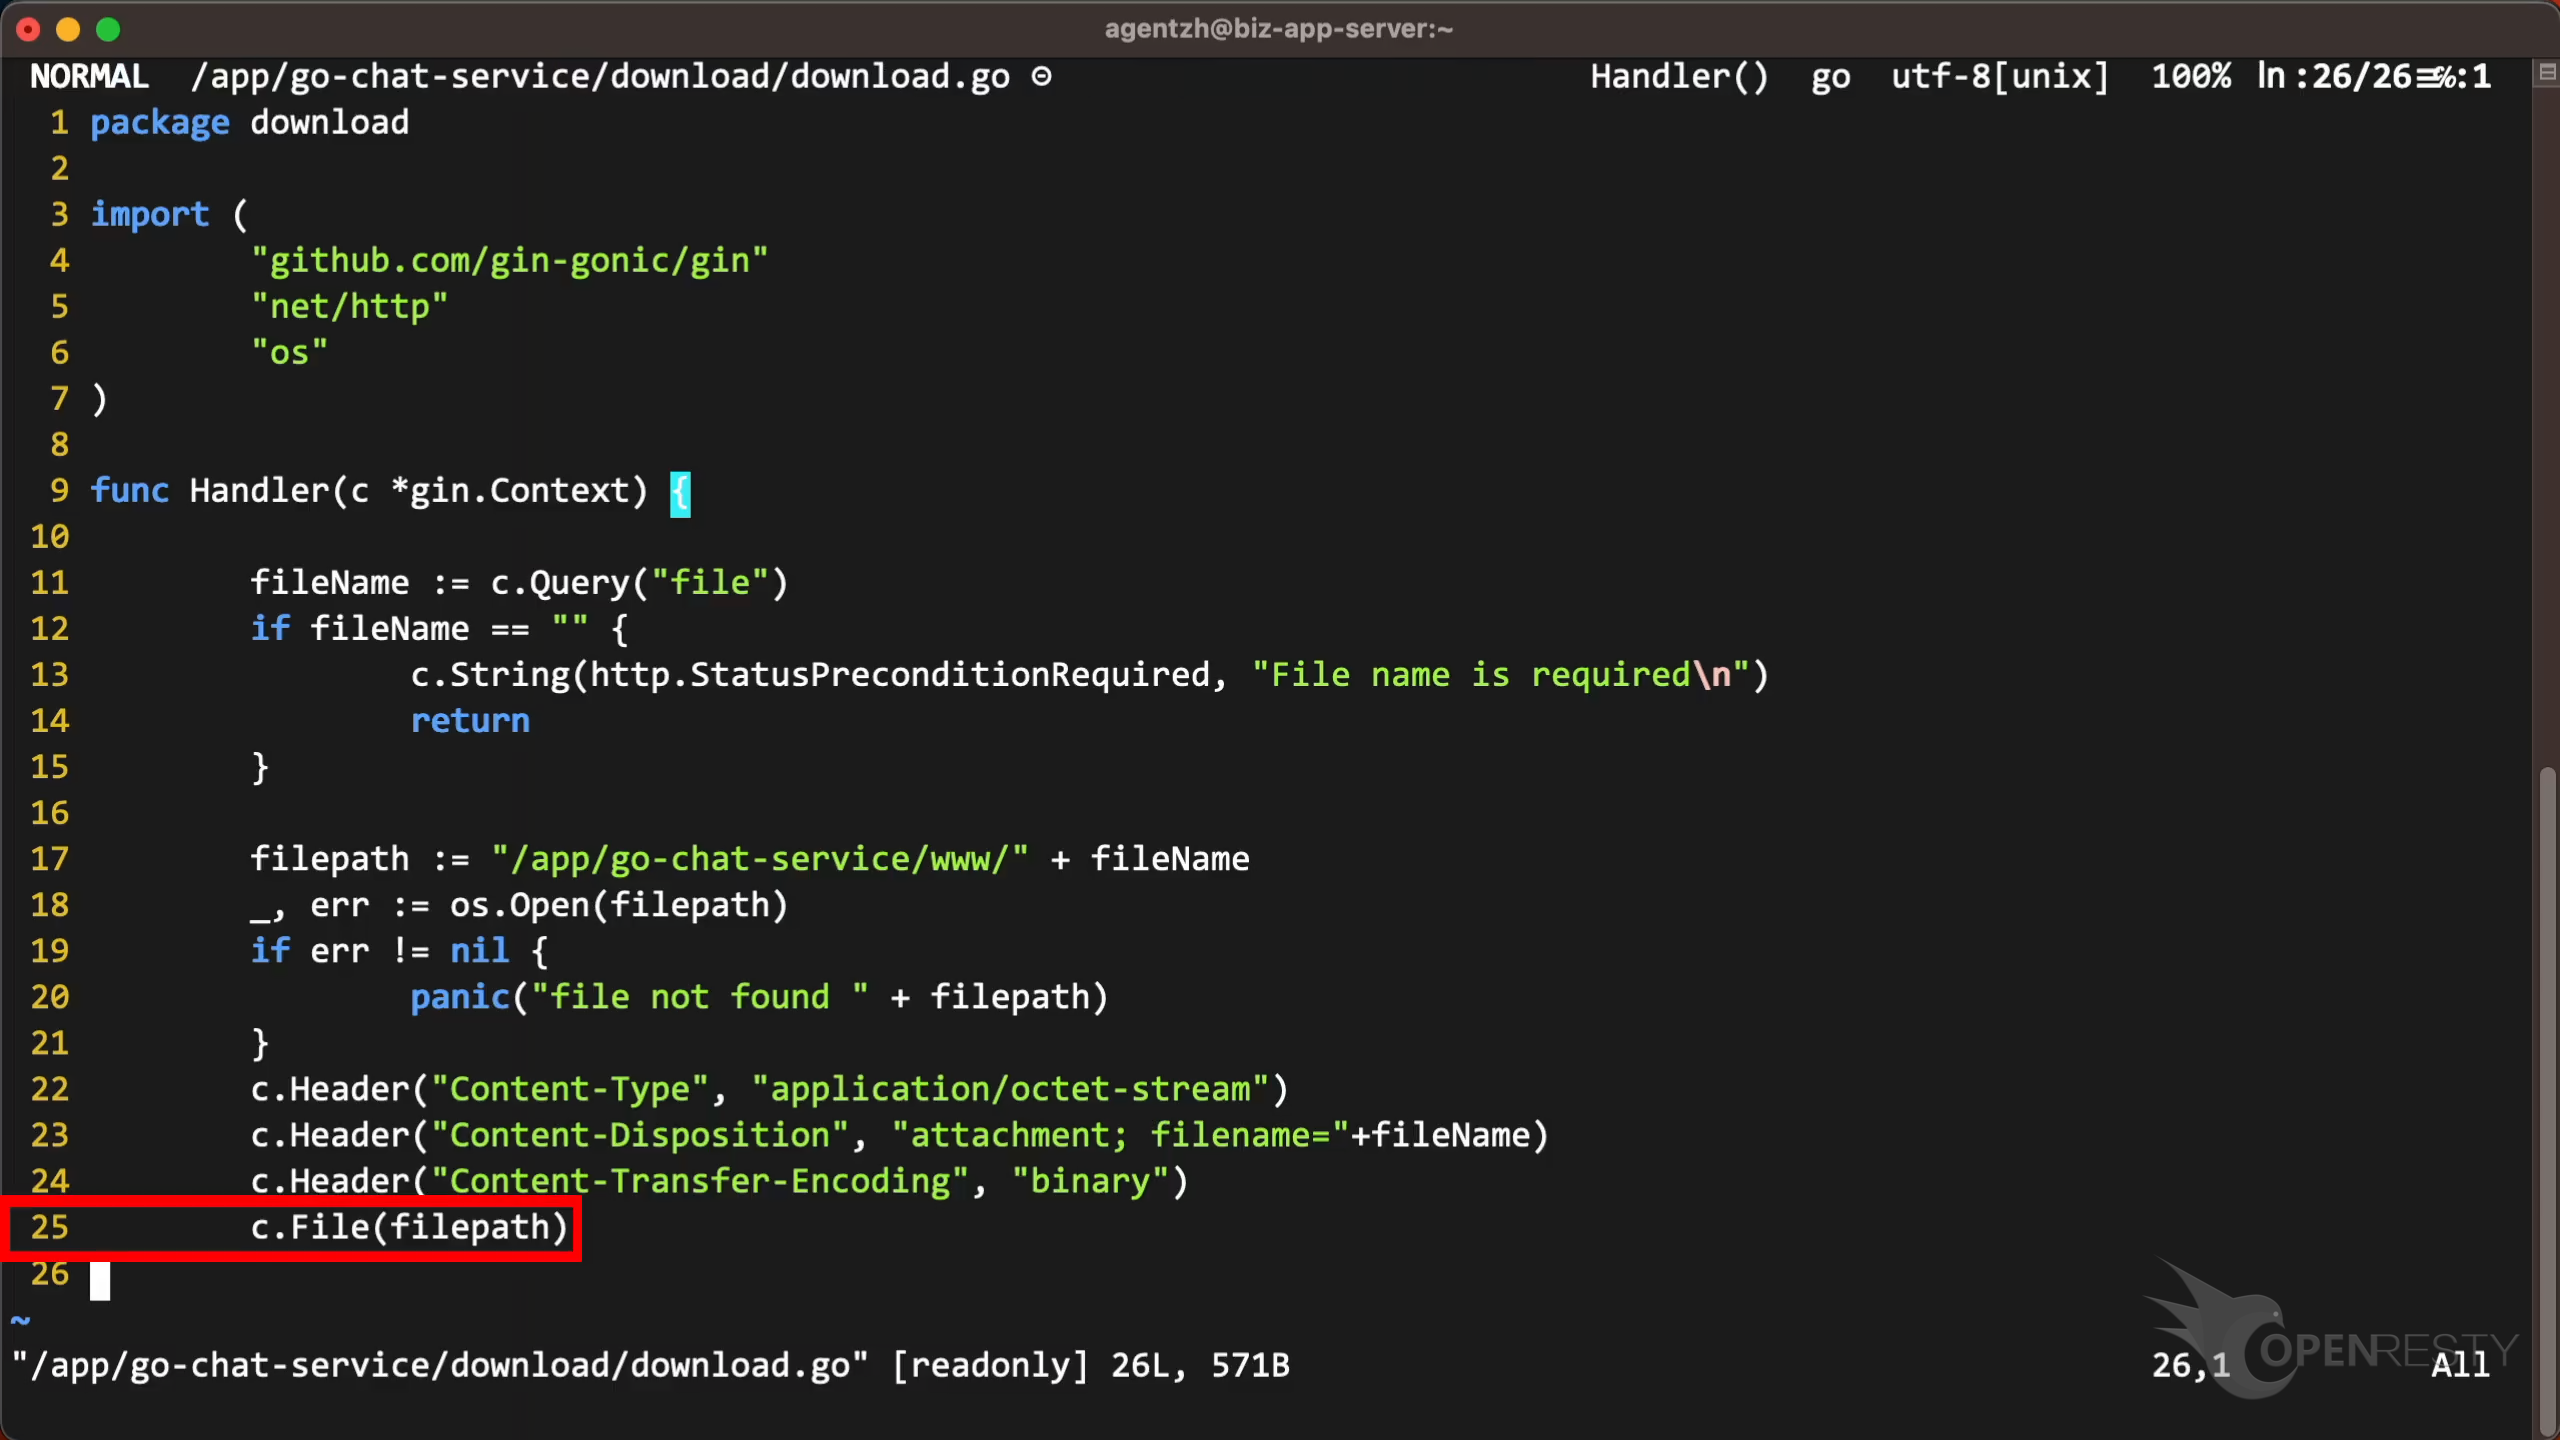
This function sends the file content to the client as an HTTP response. We suggest using a web server such as Nginx to serve these static files instead of a Go application for better performance and security.
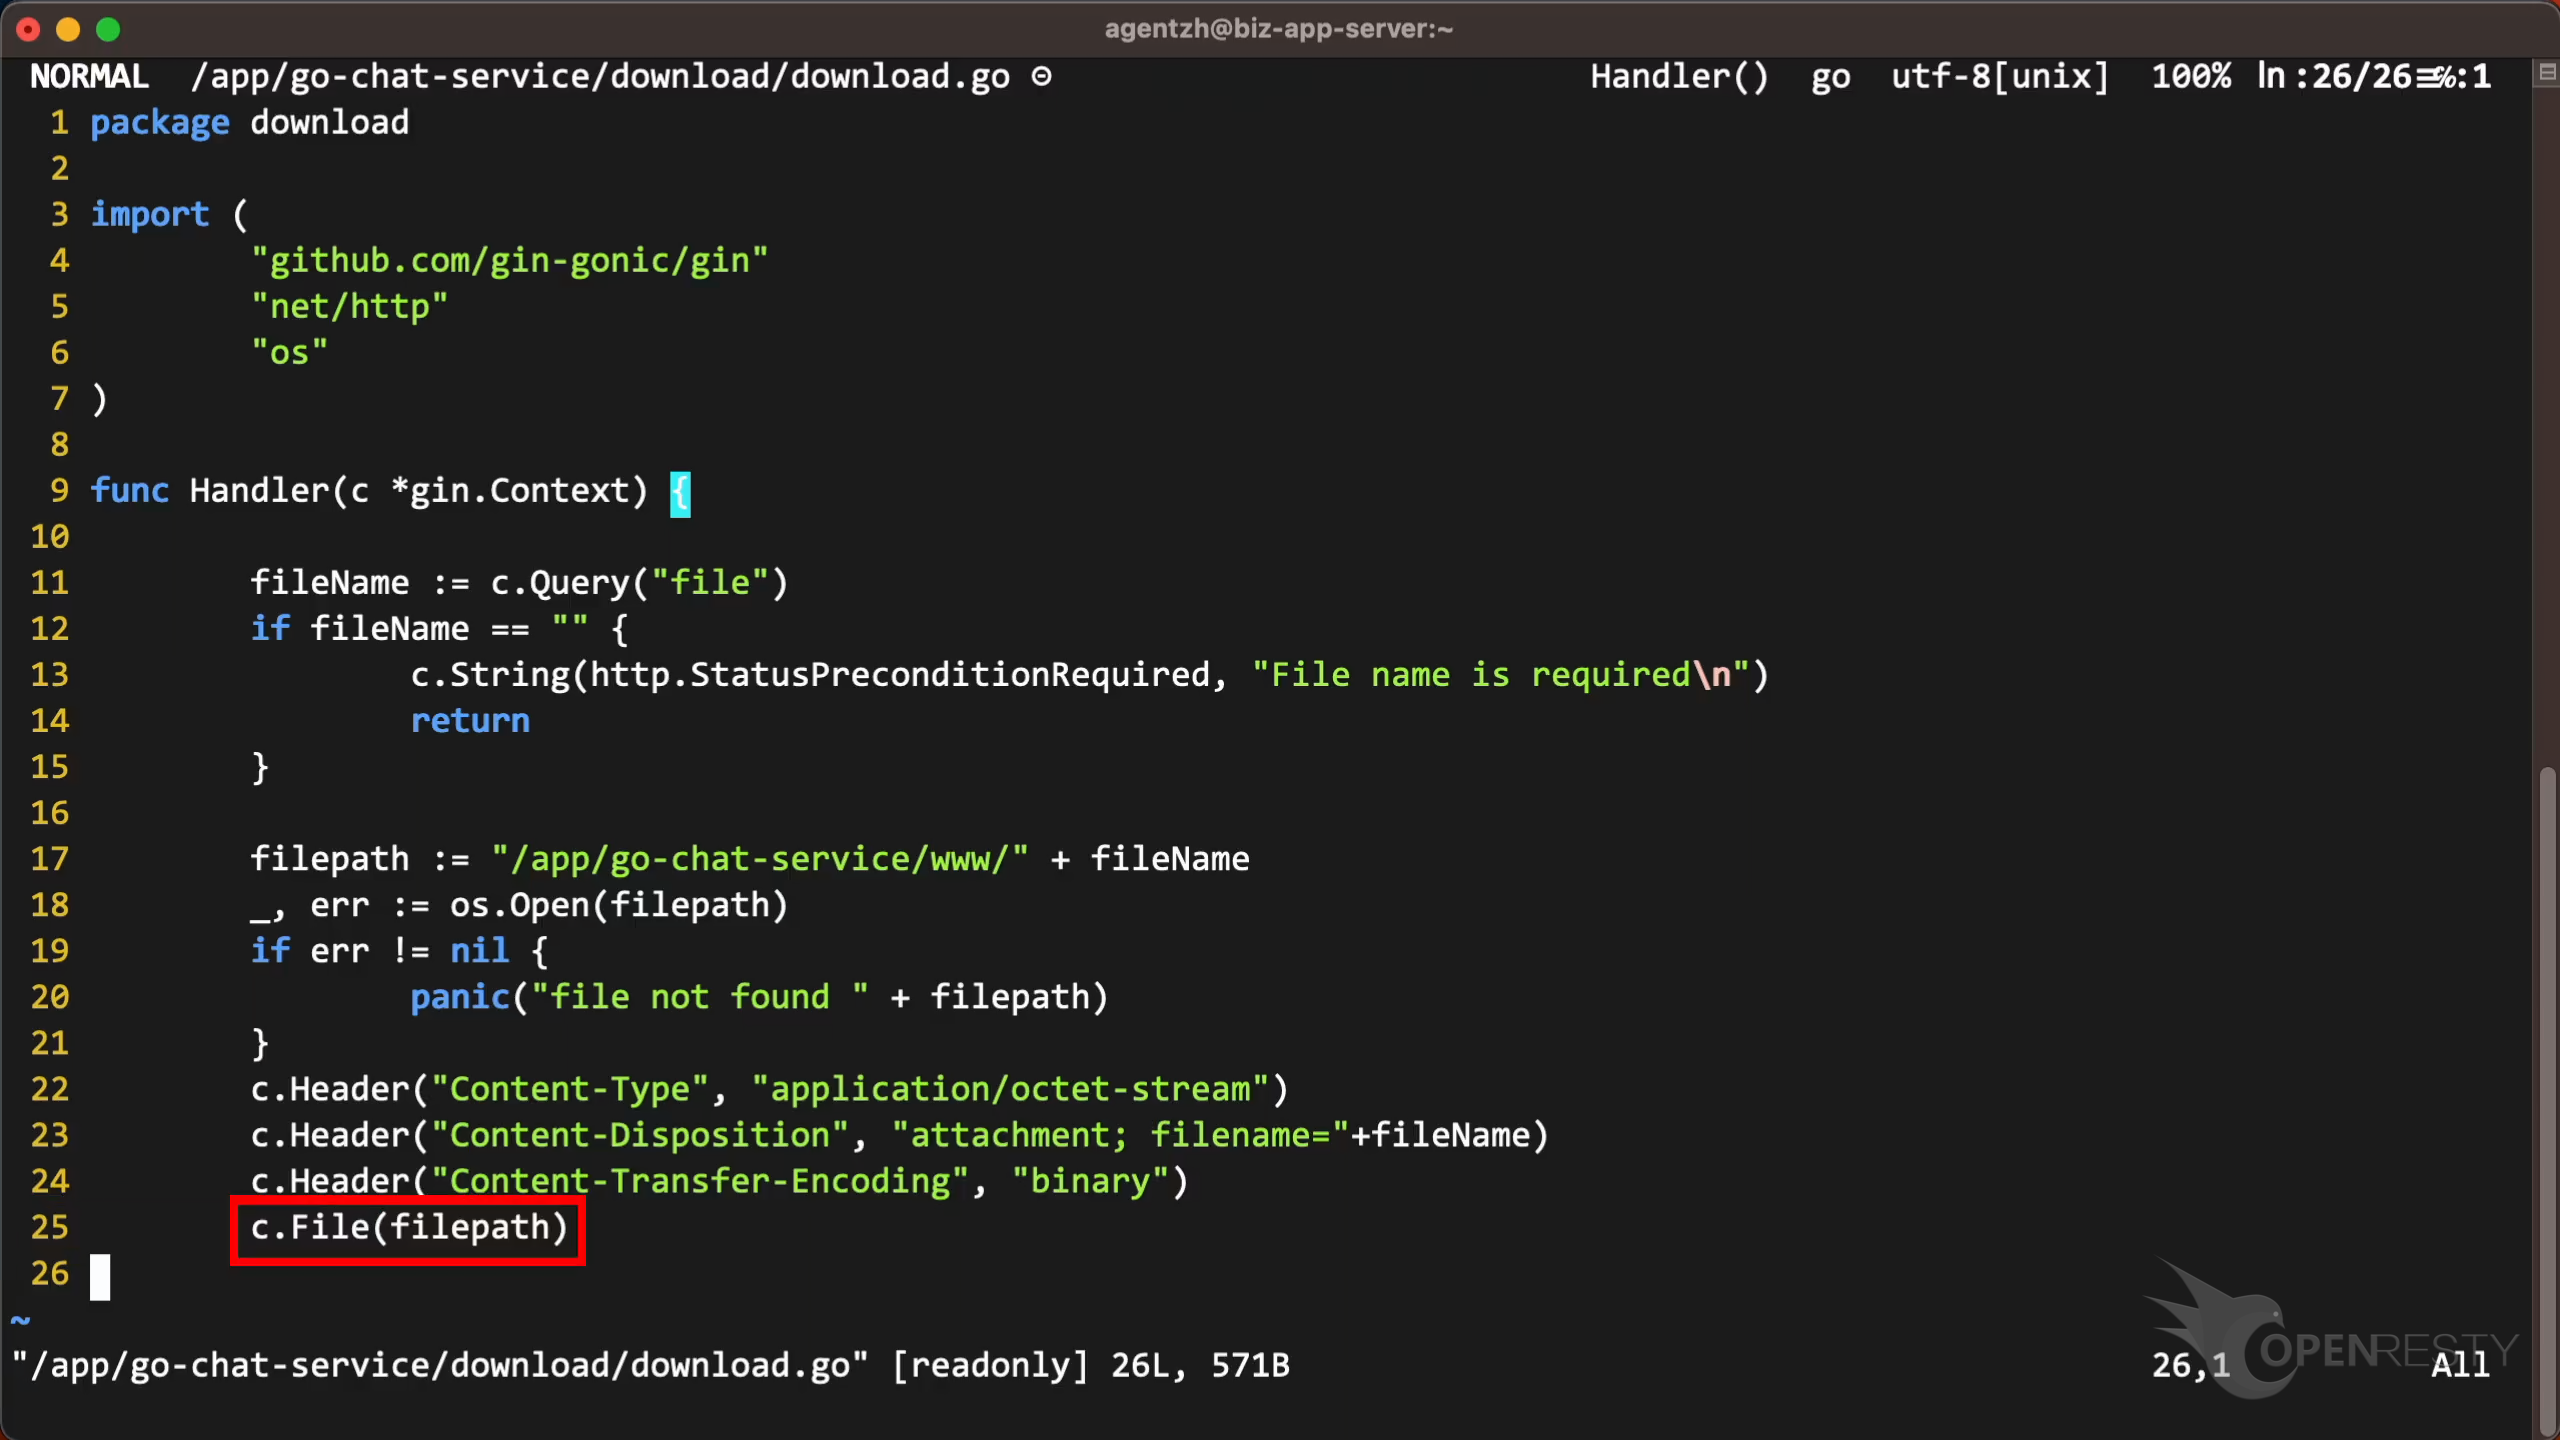
You can see that this source line is inside the Handler function, as shown in the report.
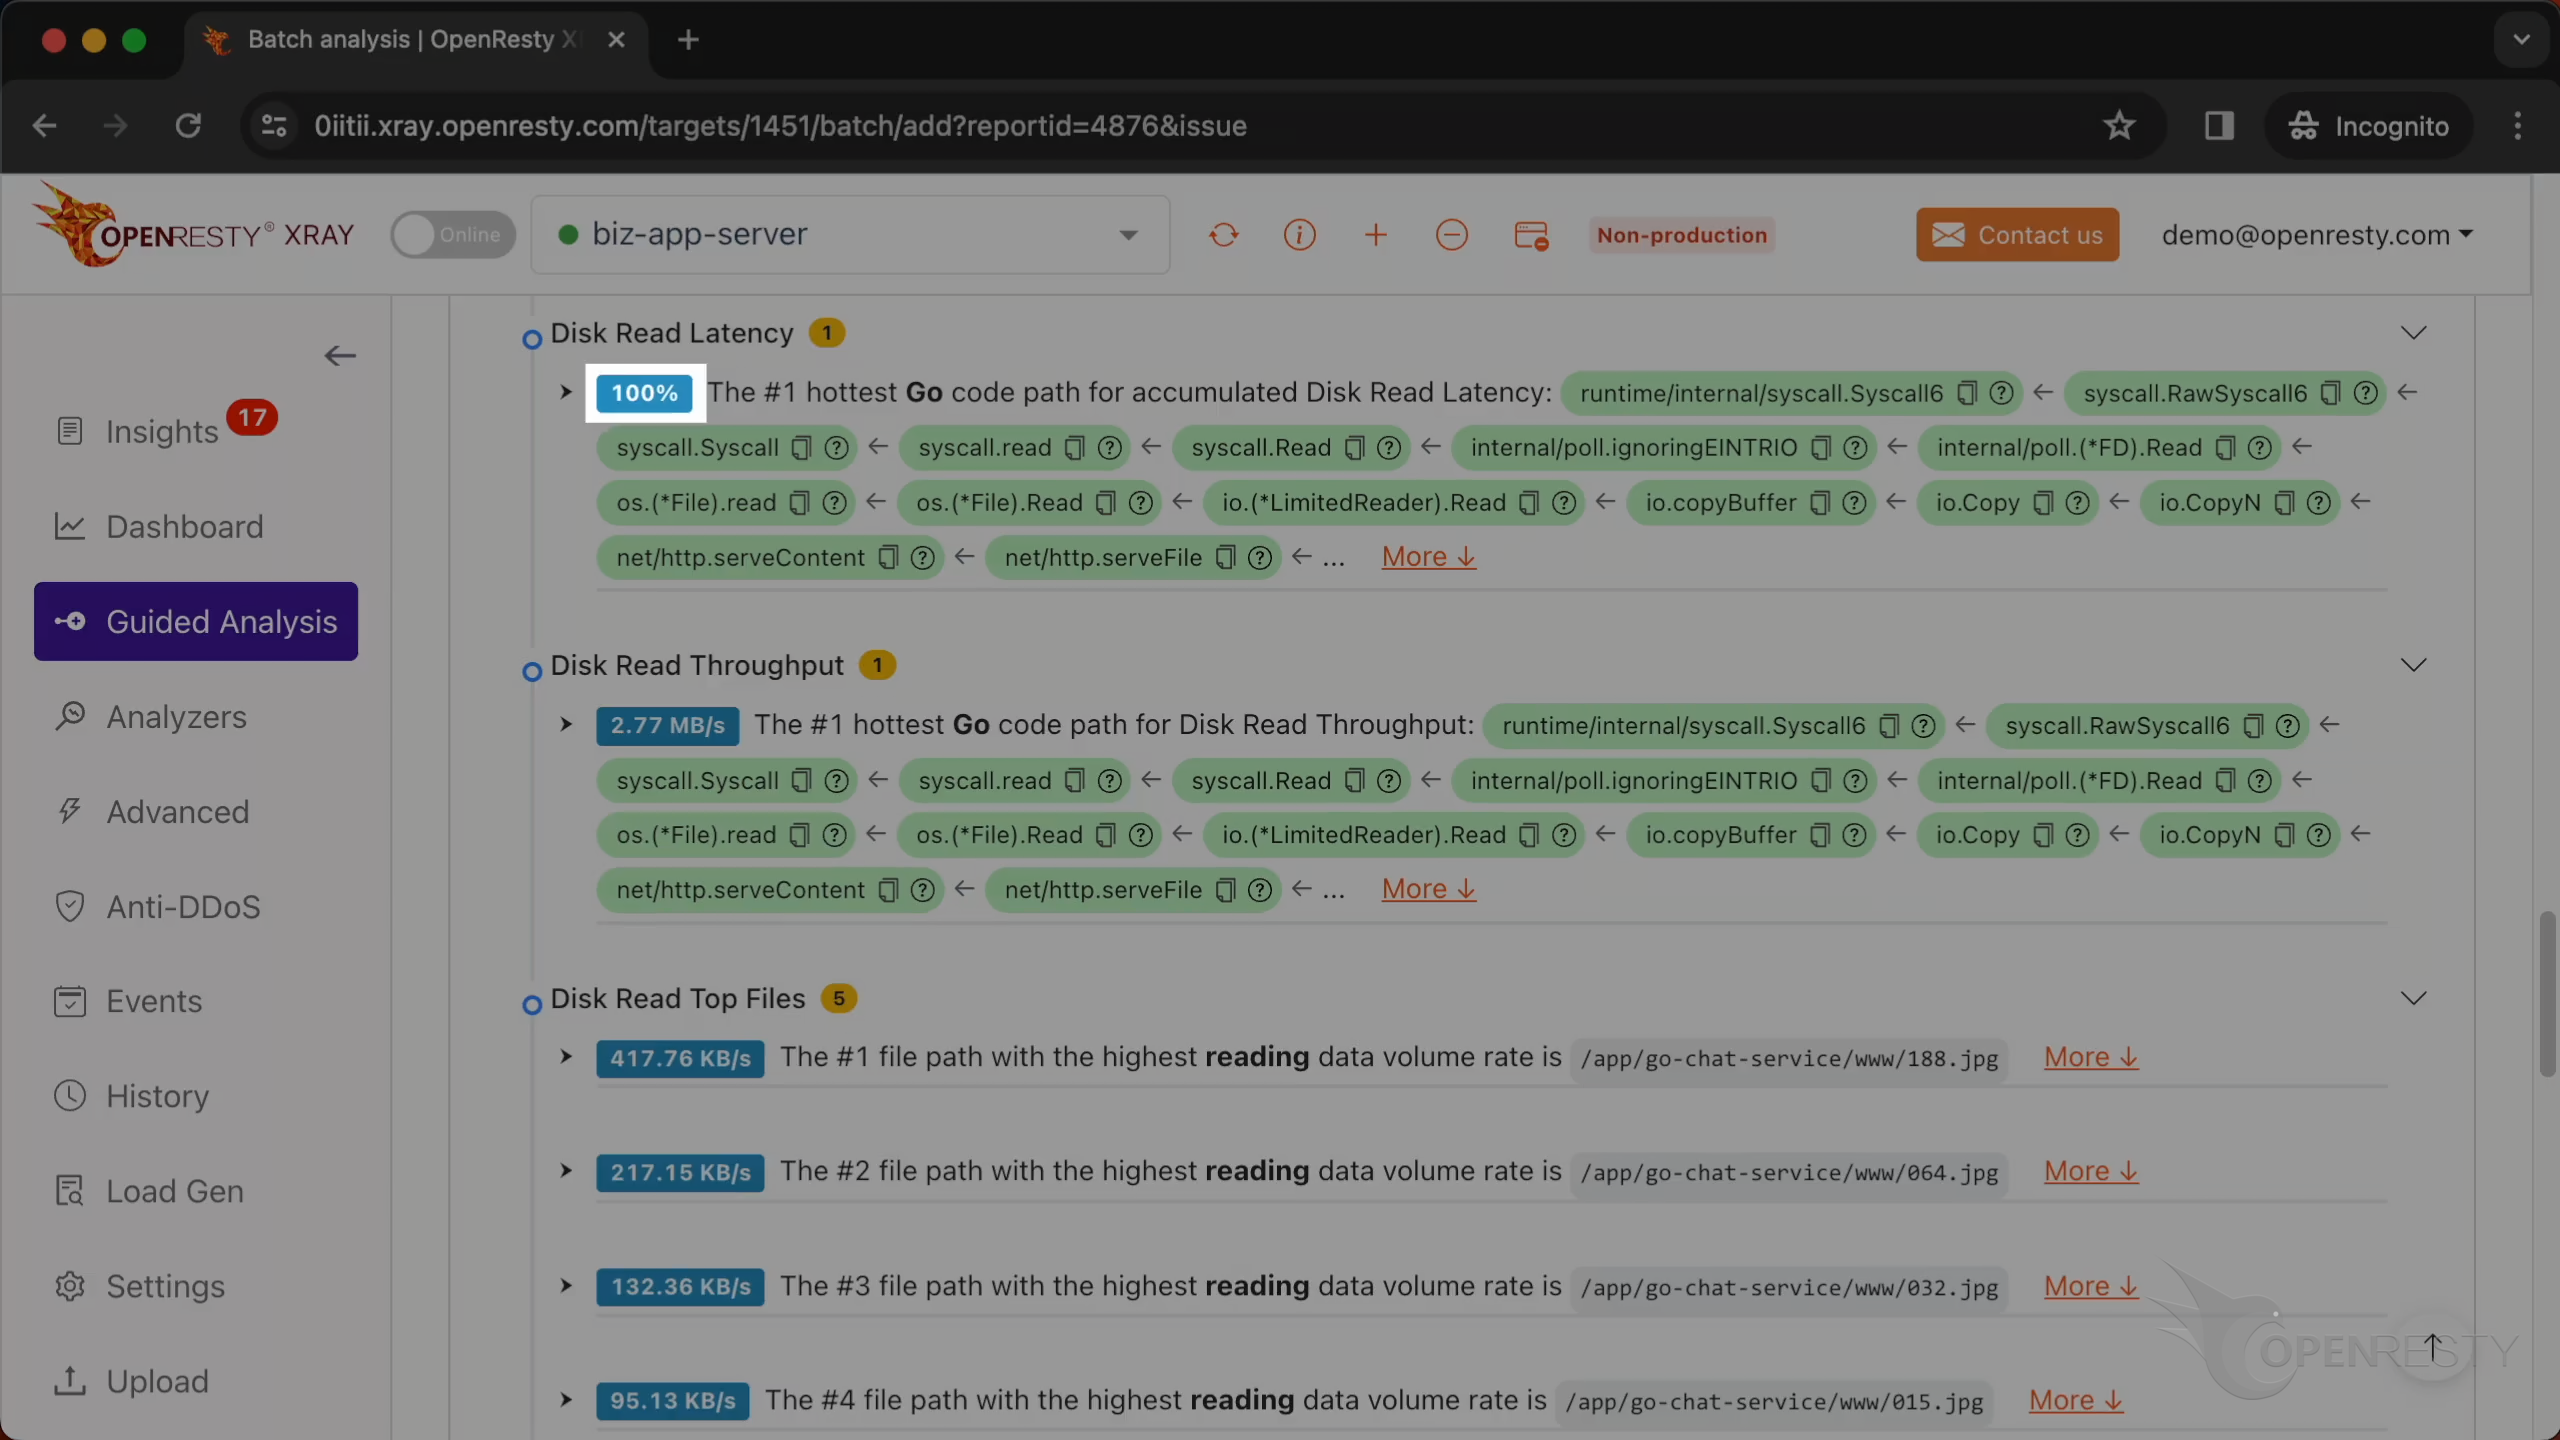
This is the analysis of disk read latency.
This code path is identical to the one we previously examined. It handles file downloads.
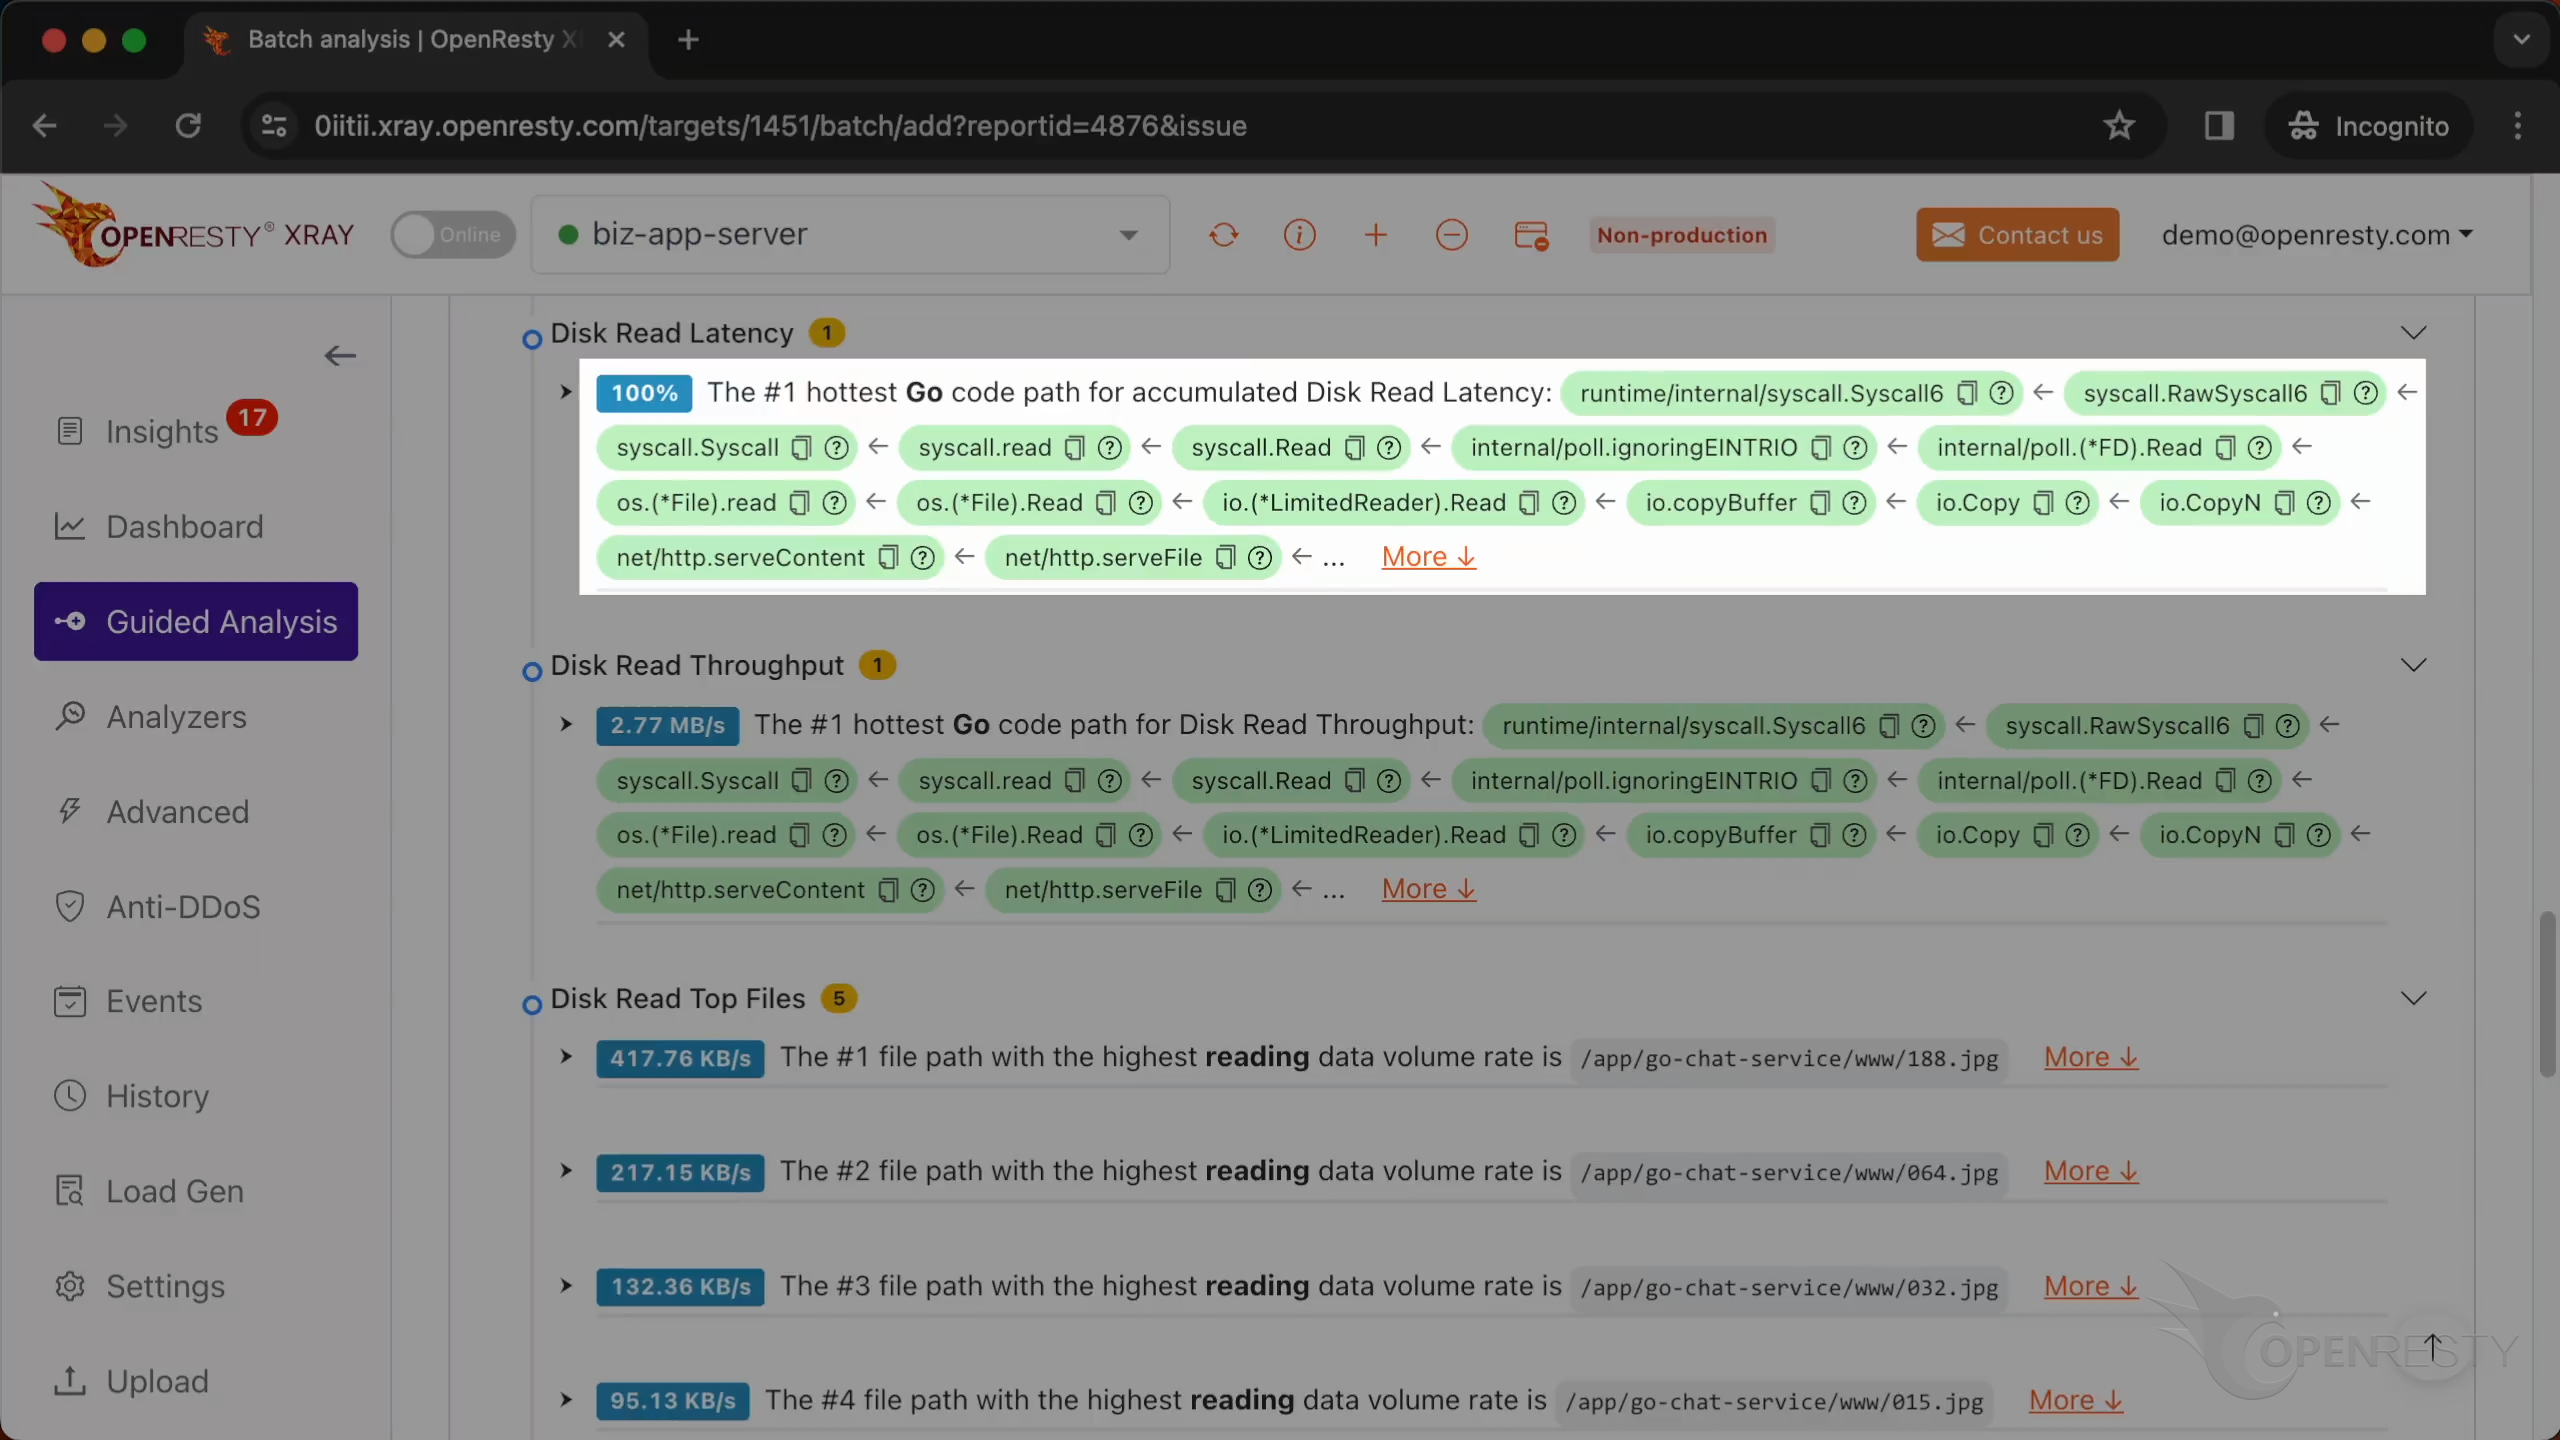
It is the sole source of hard disk read latency.
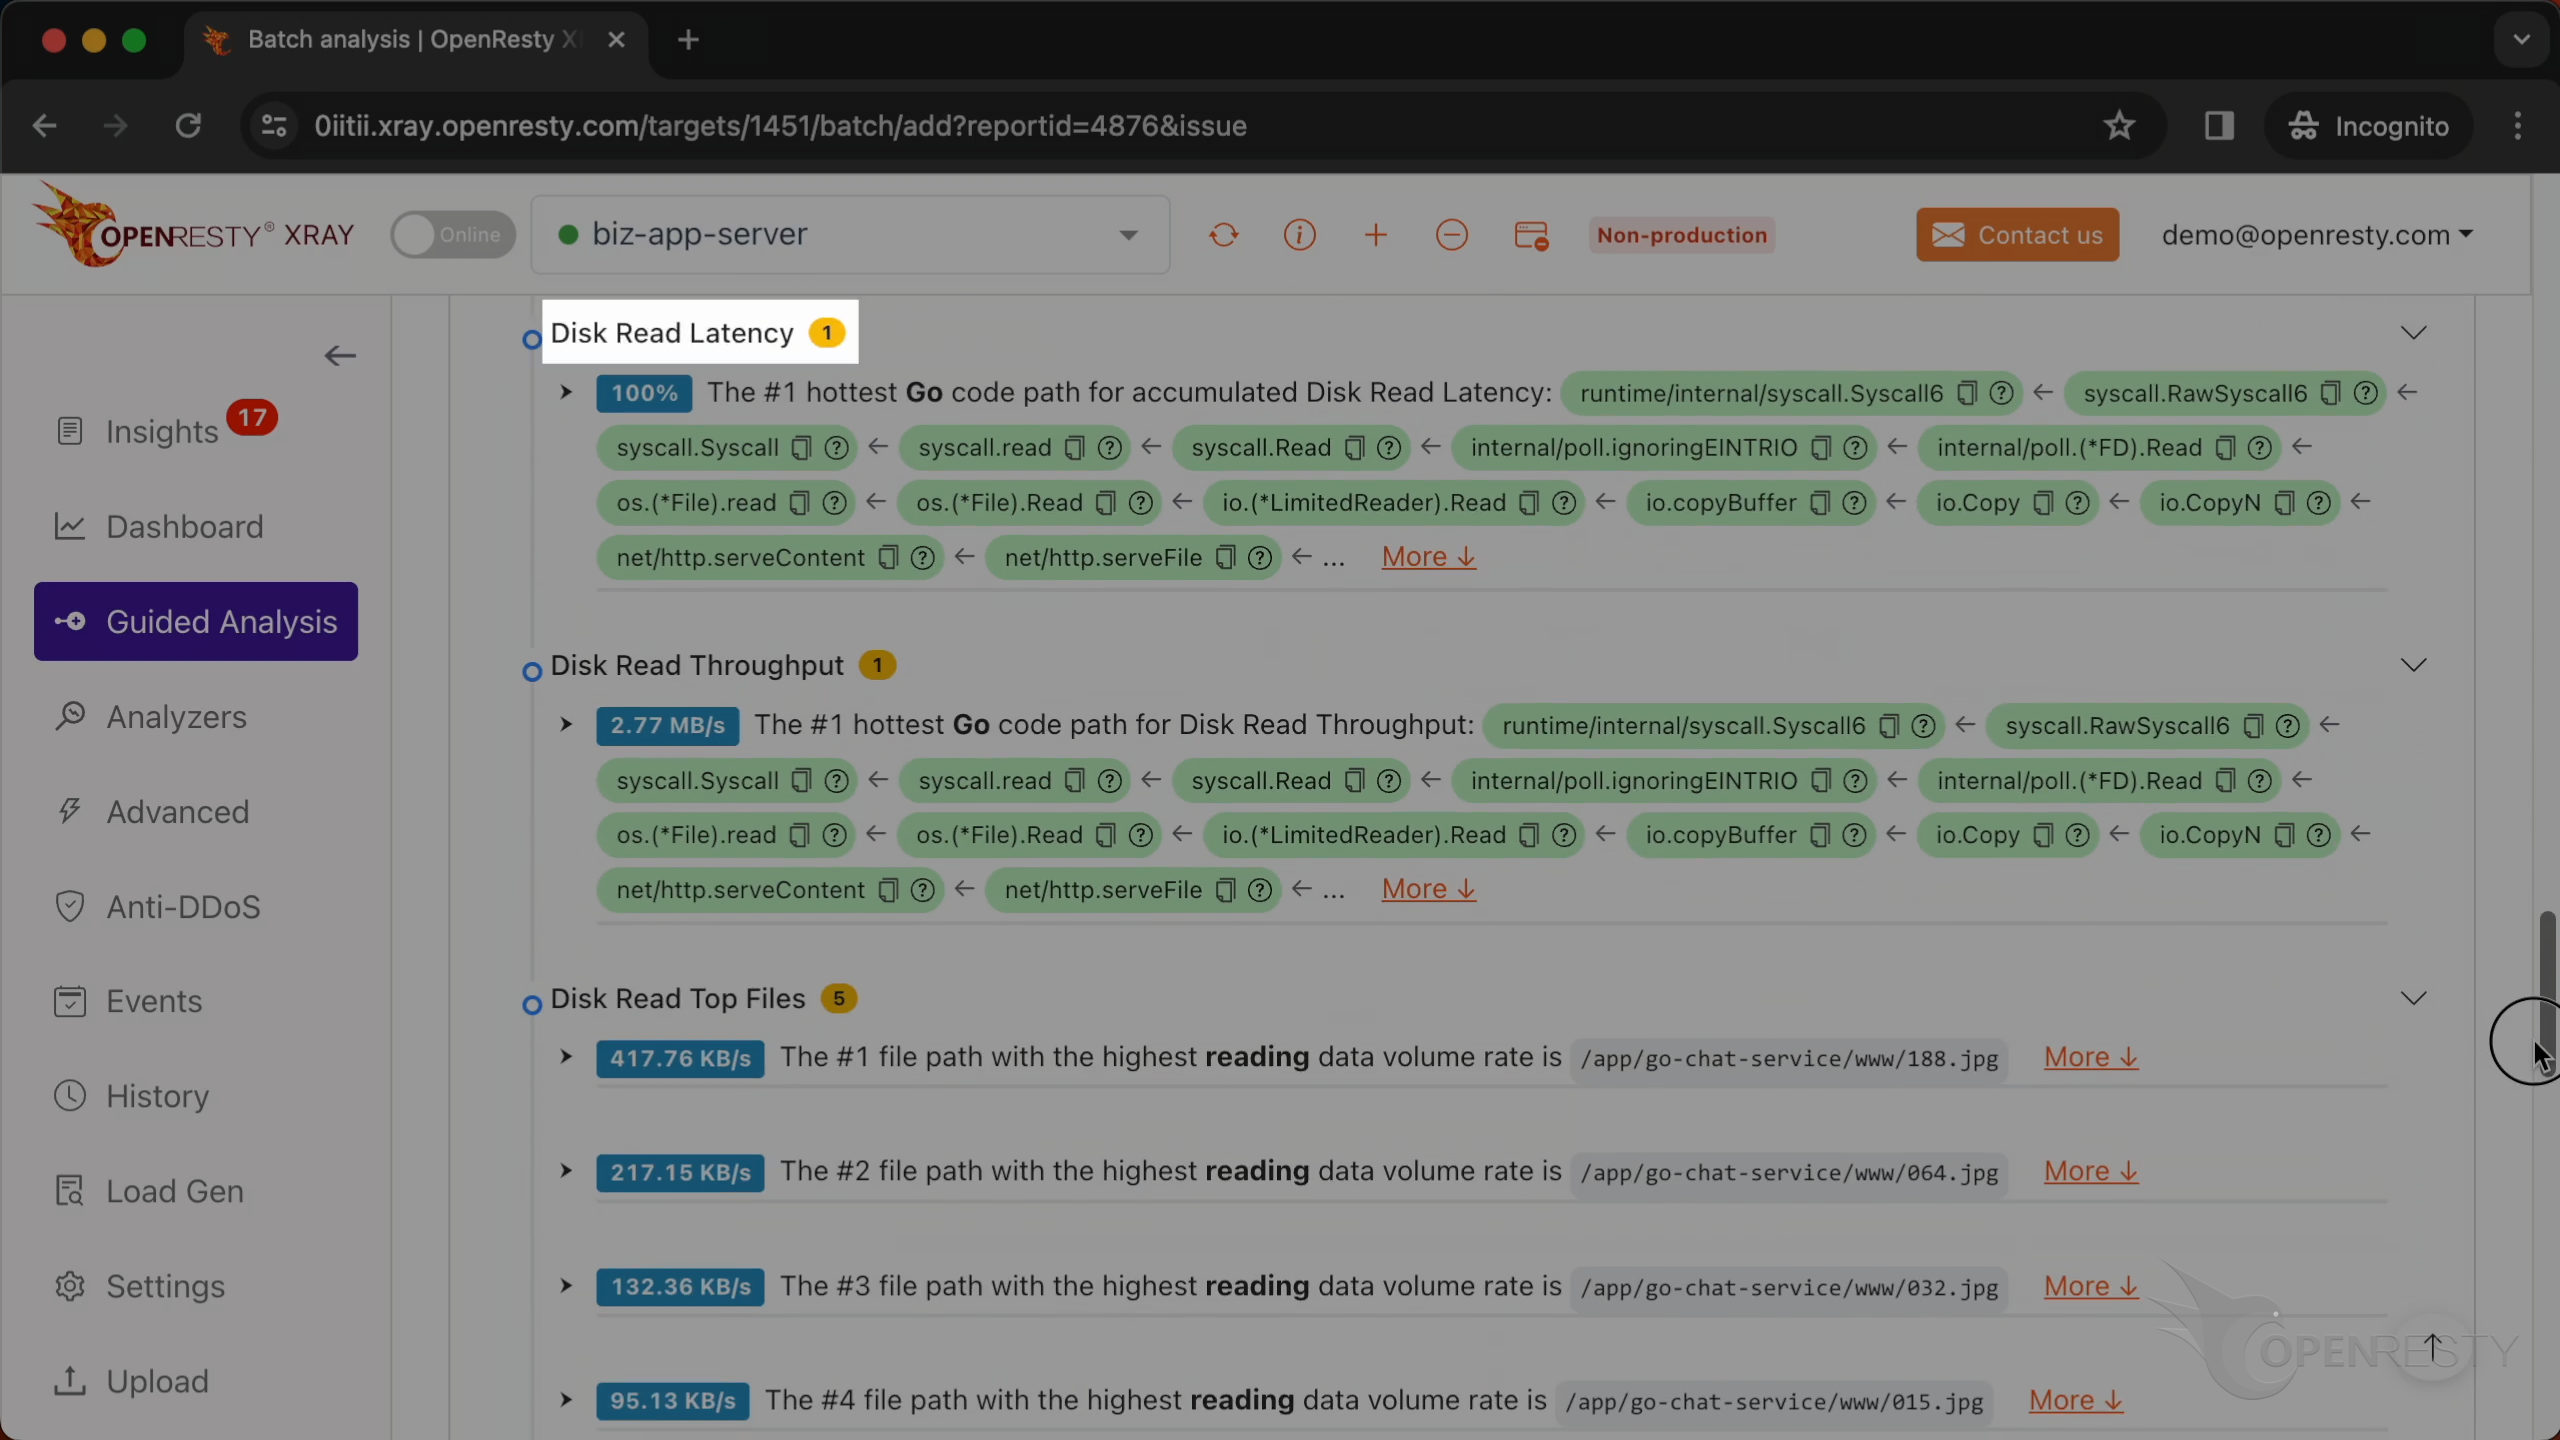
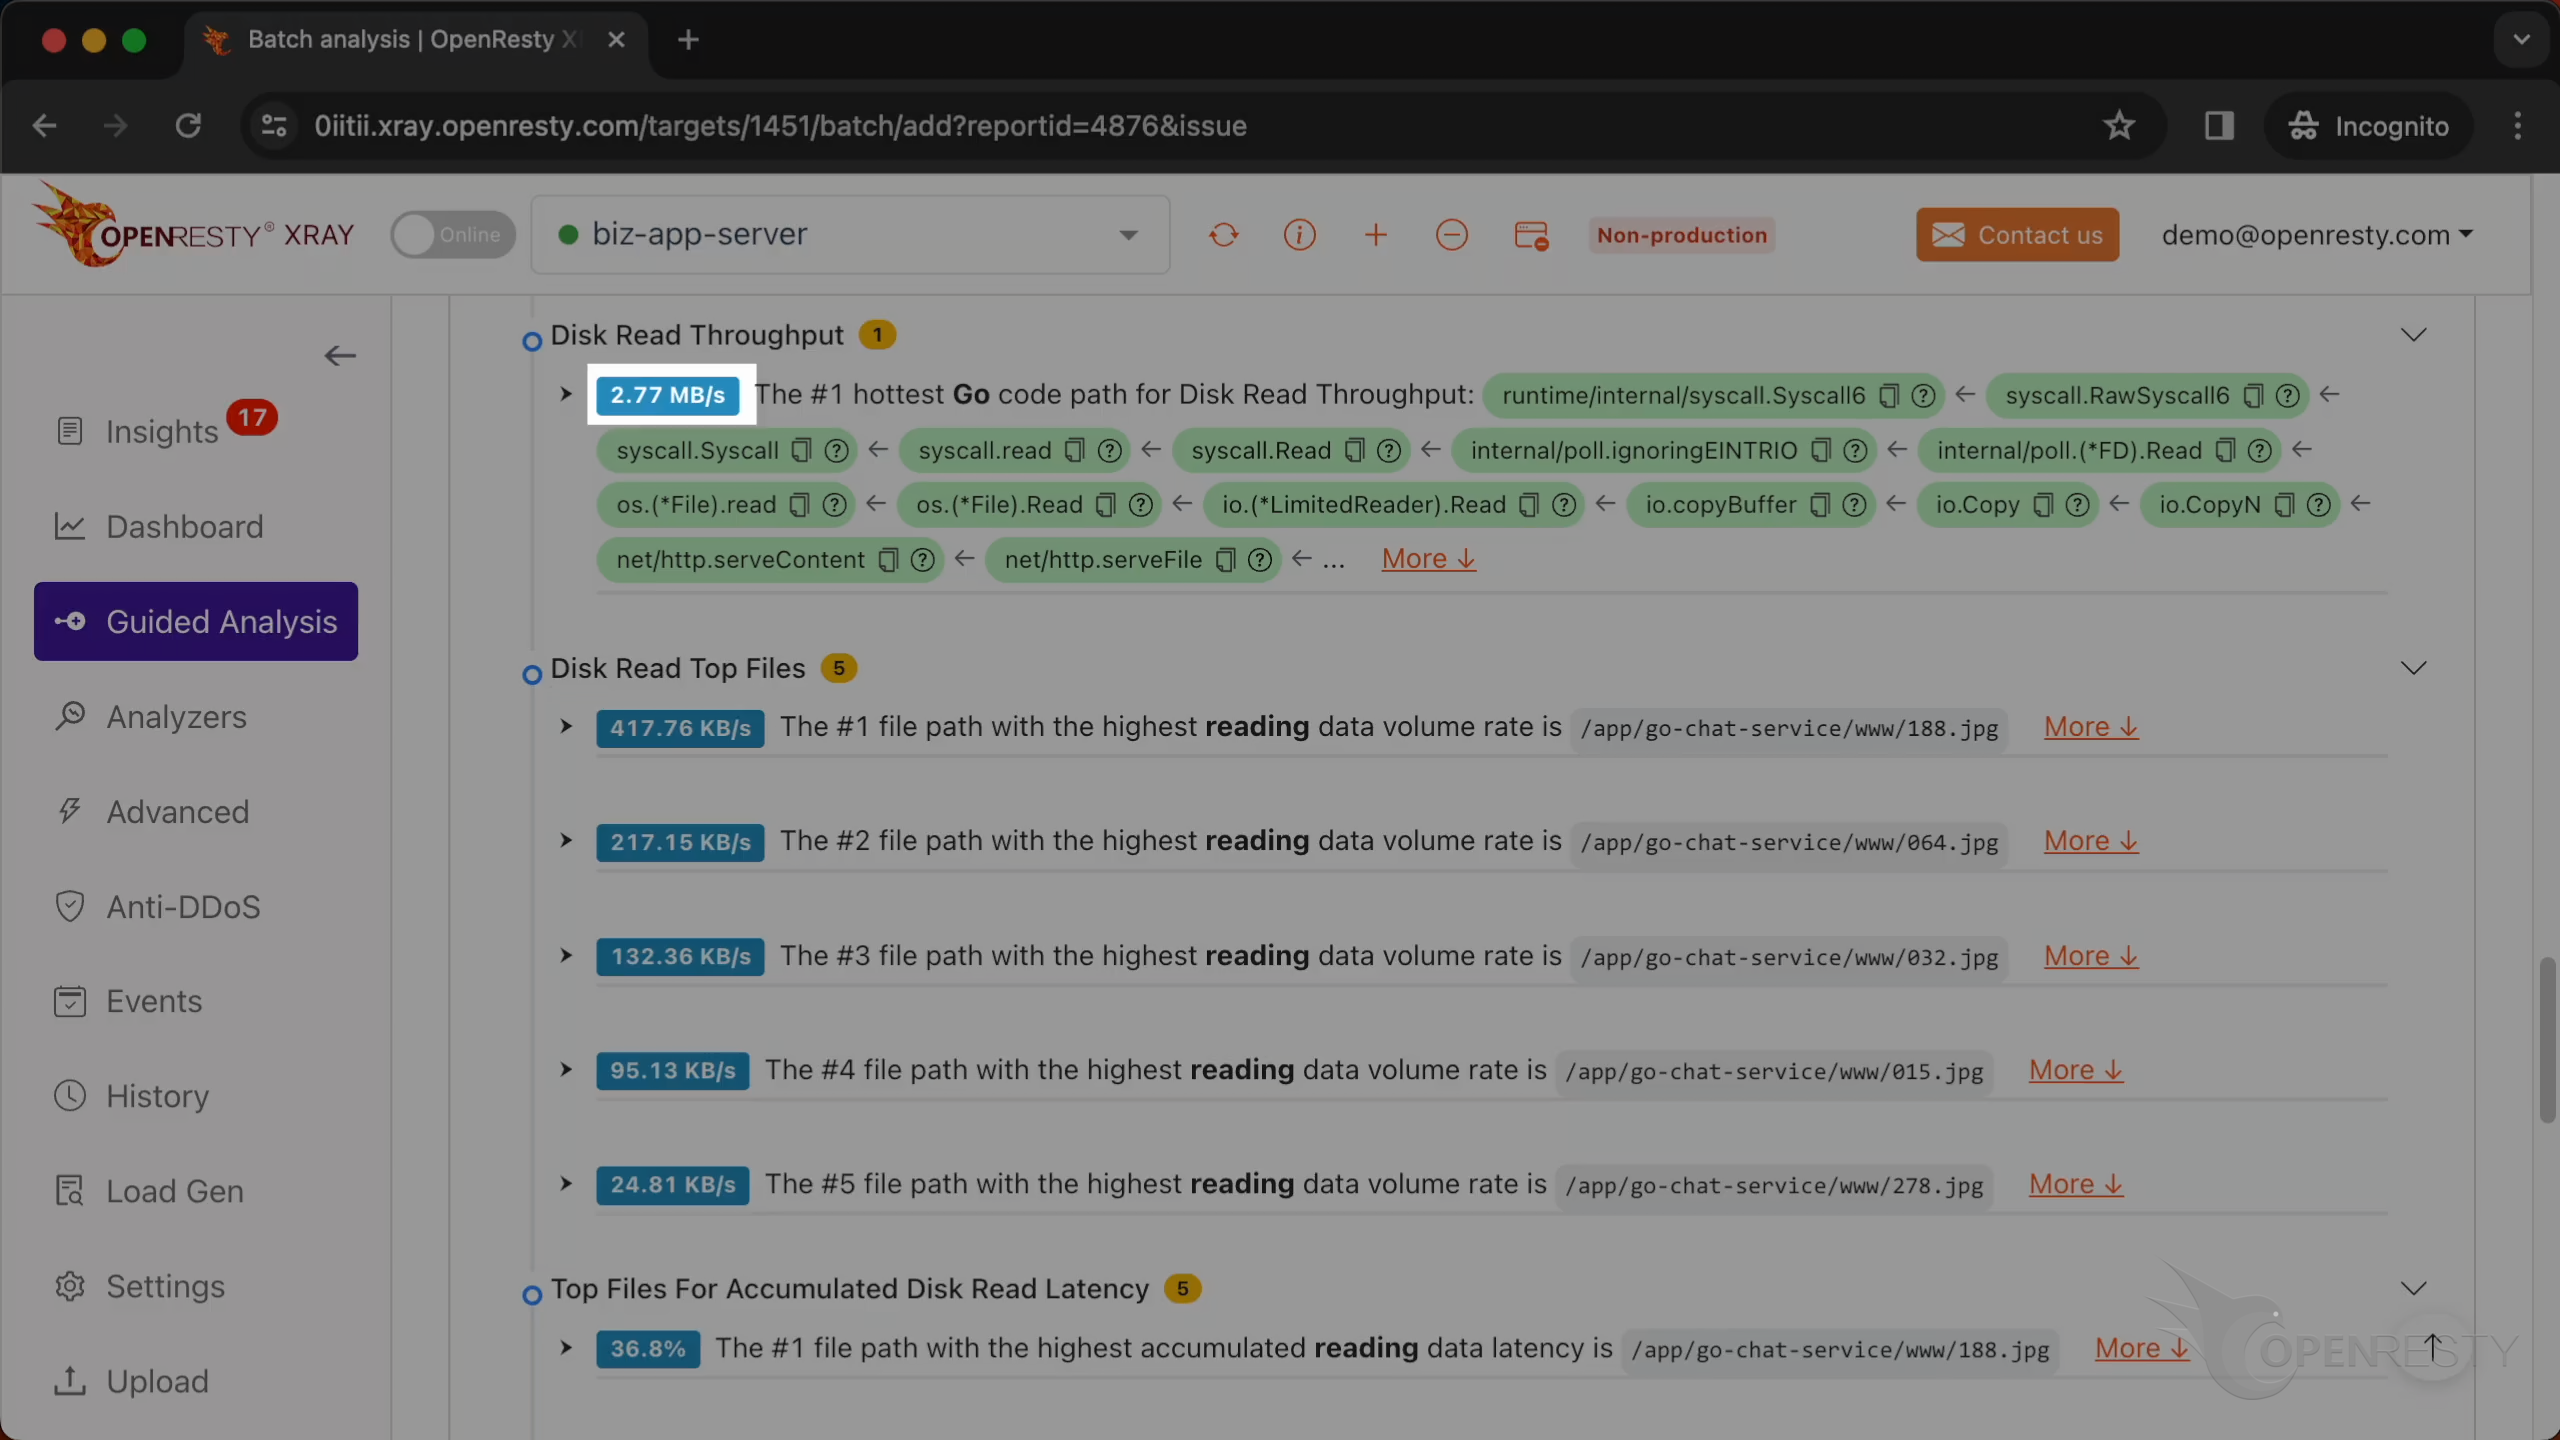
This is the analysis of the disk read throughput.
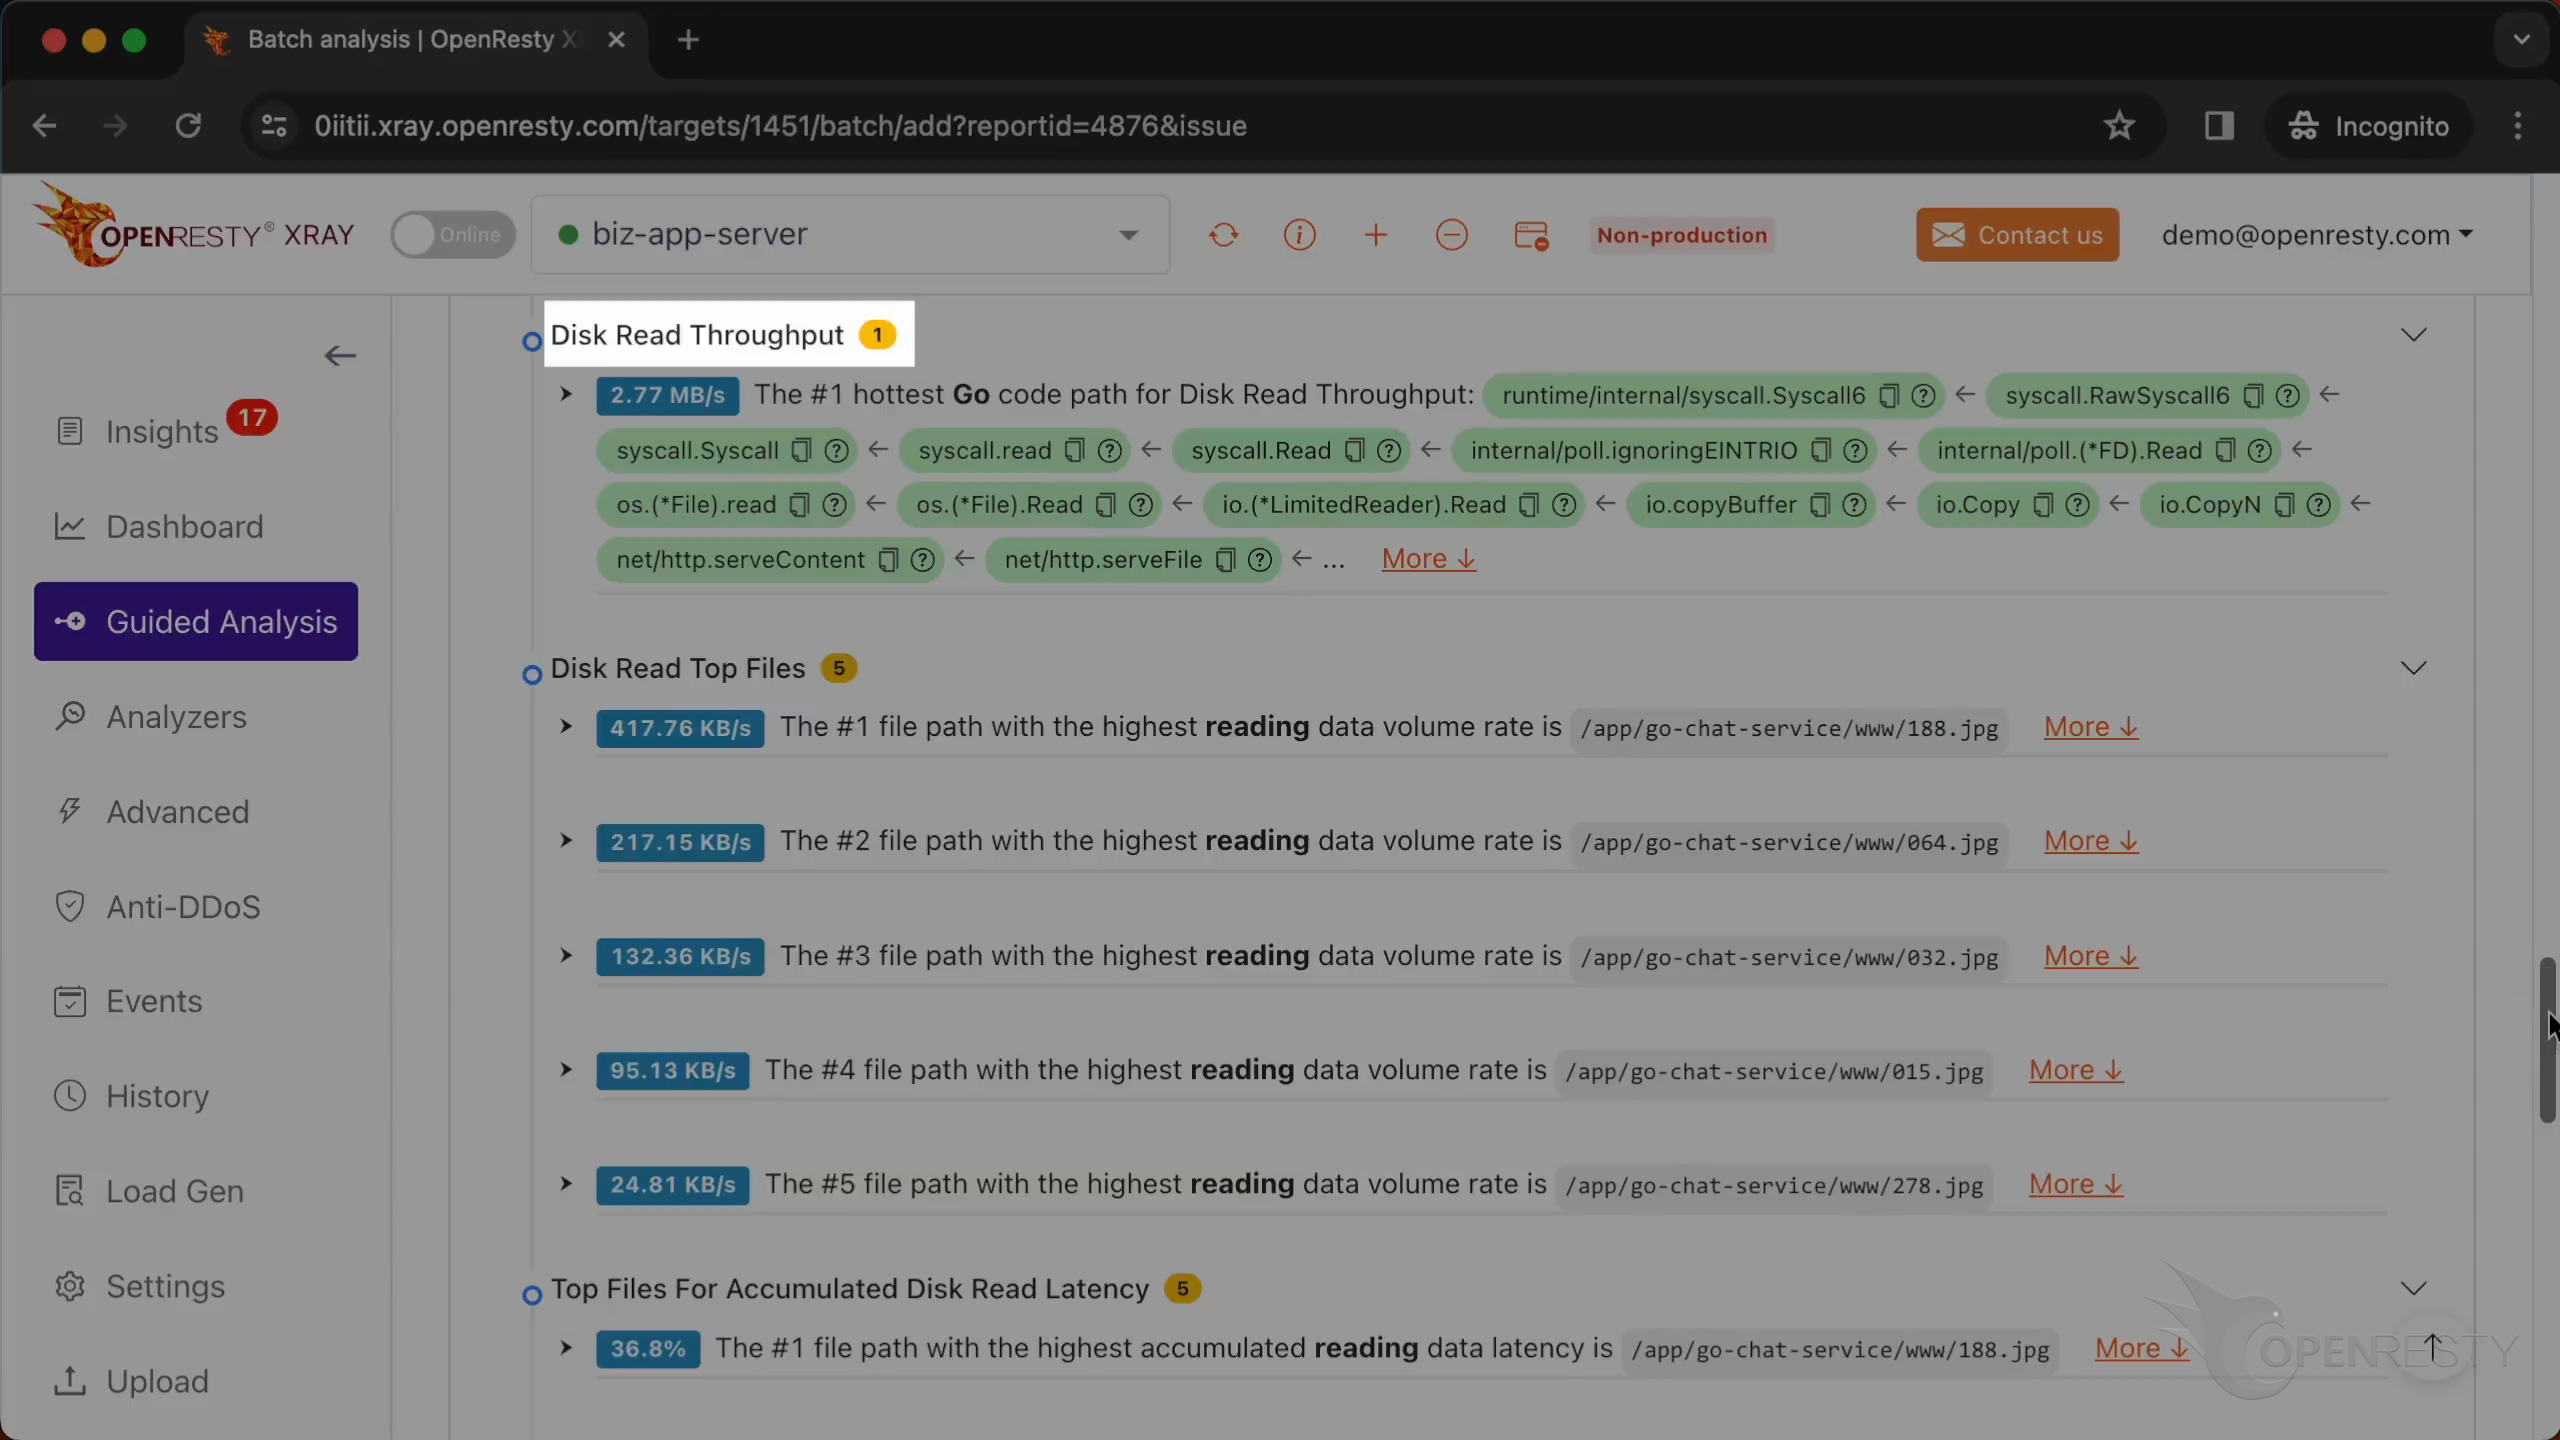
It is the same code path that handles file downloads.
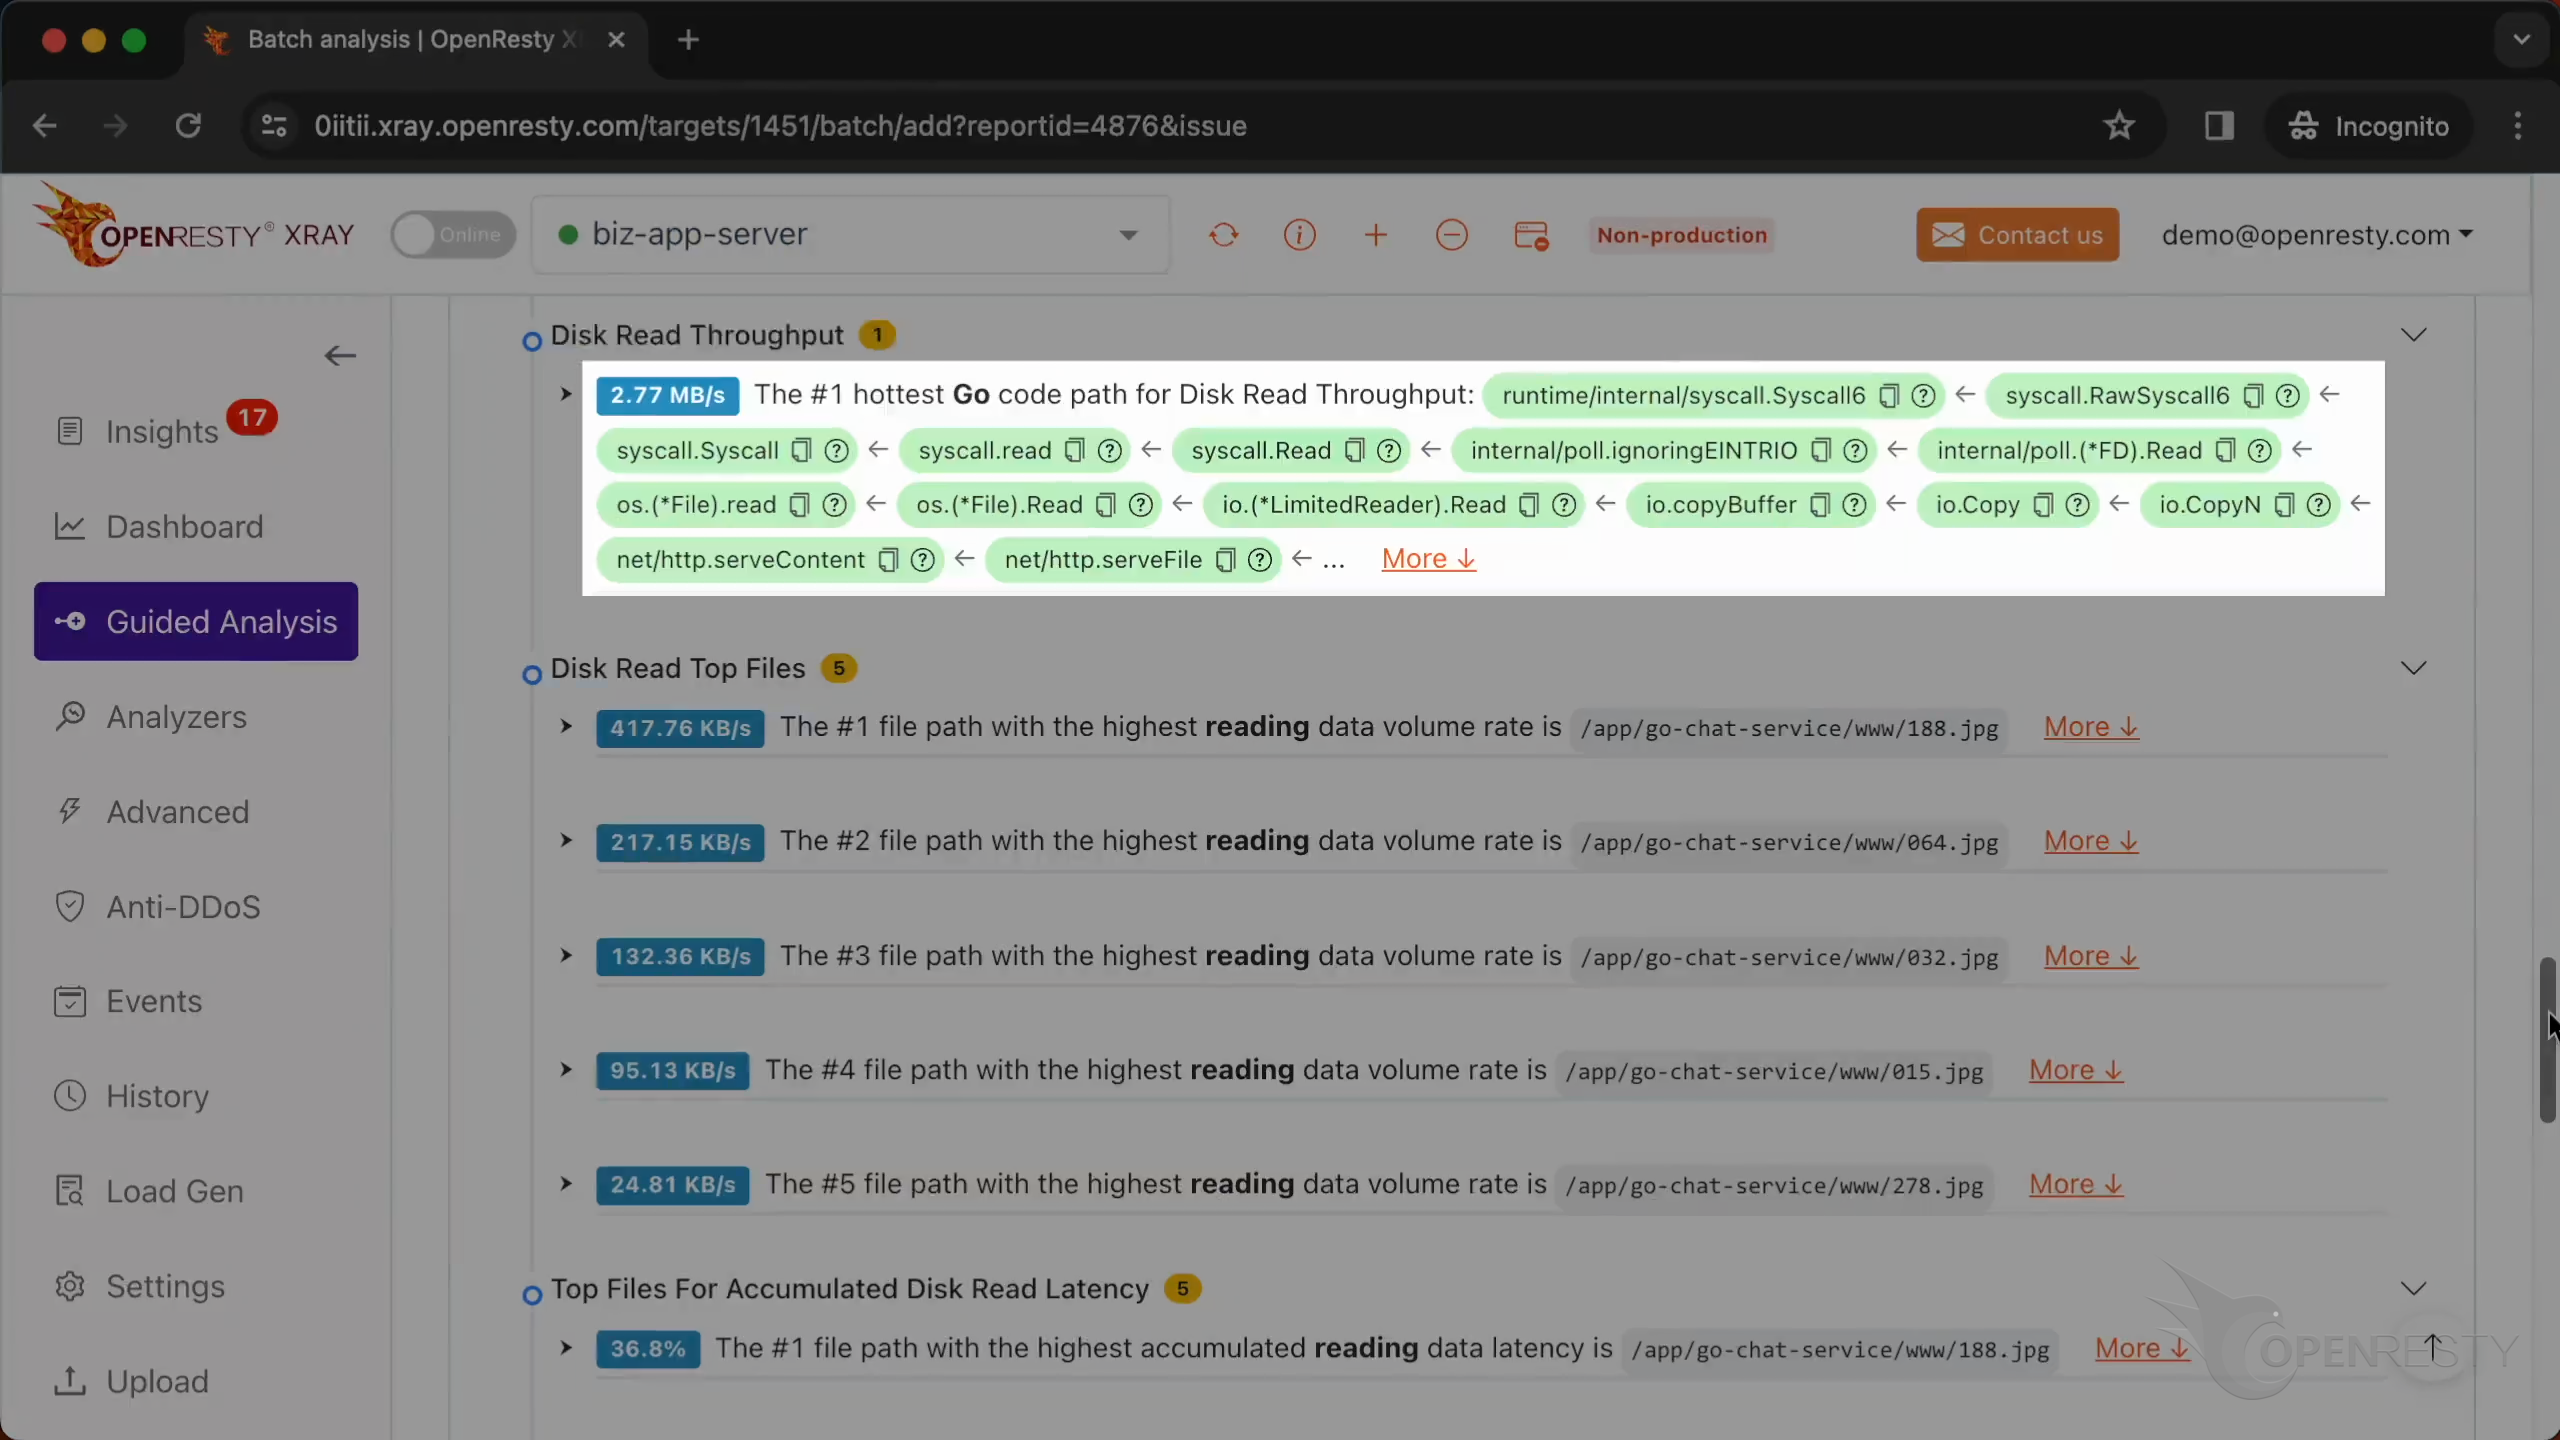
The read rate is close to 3 MB/s.
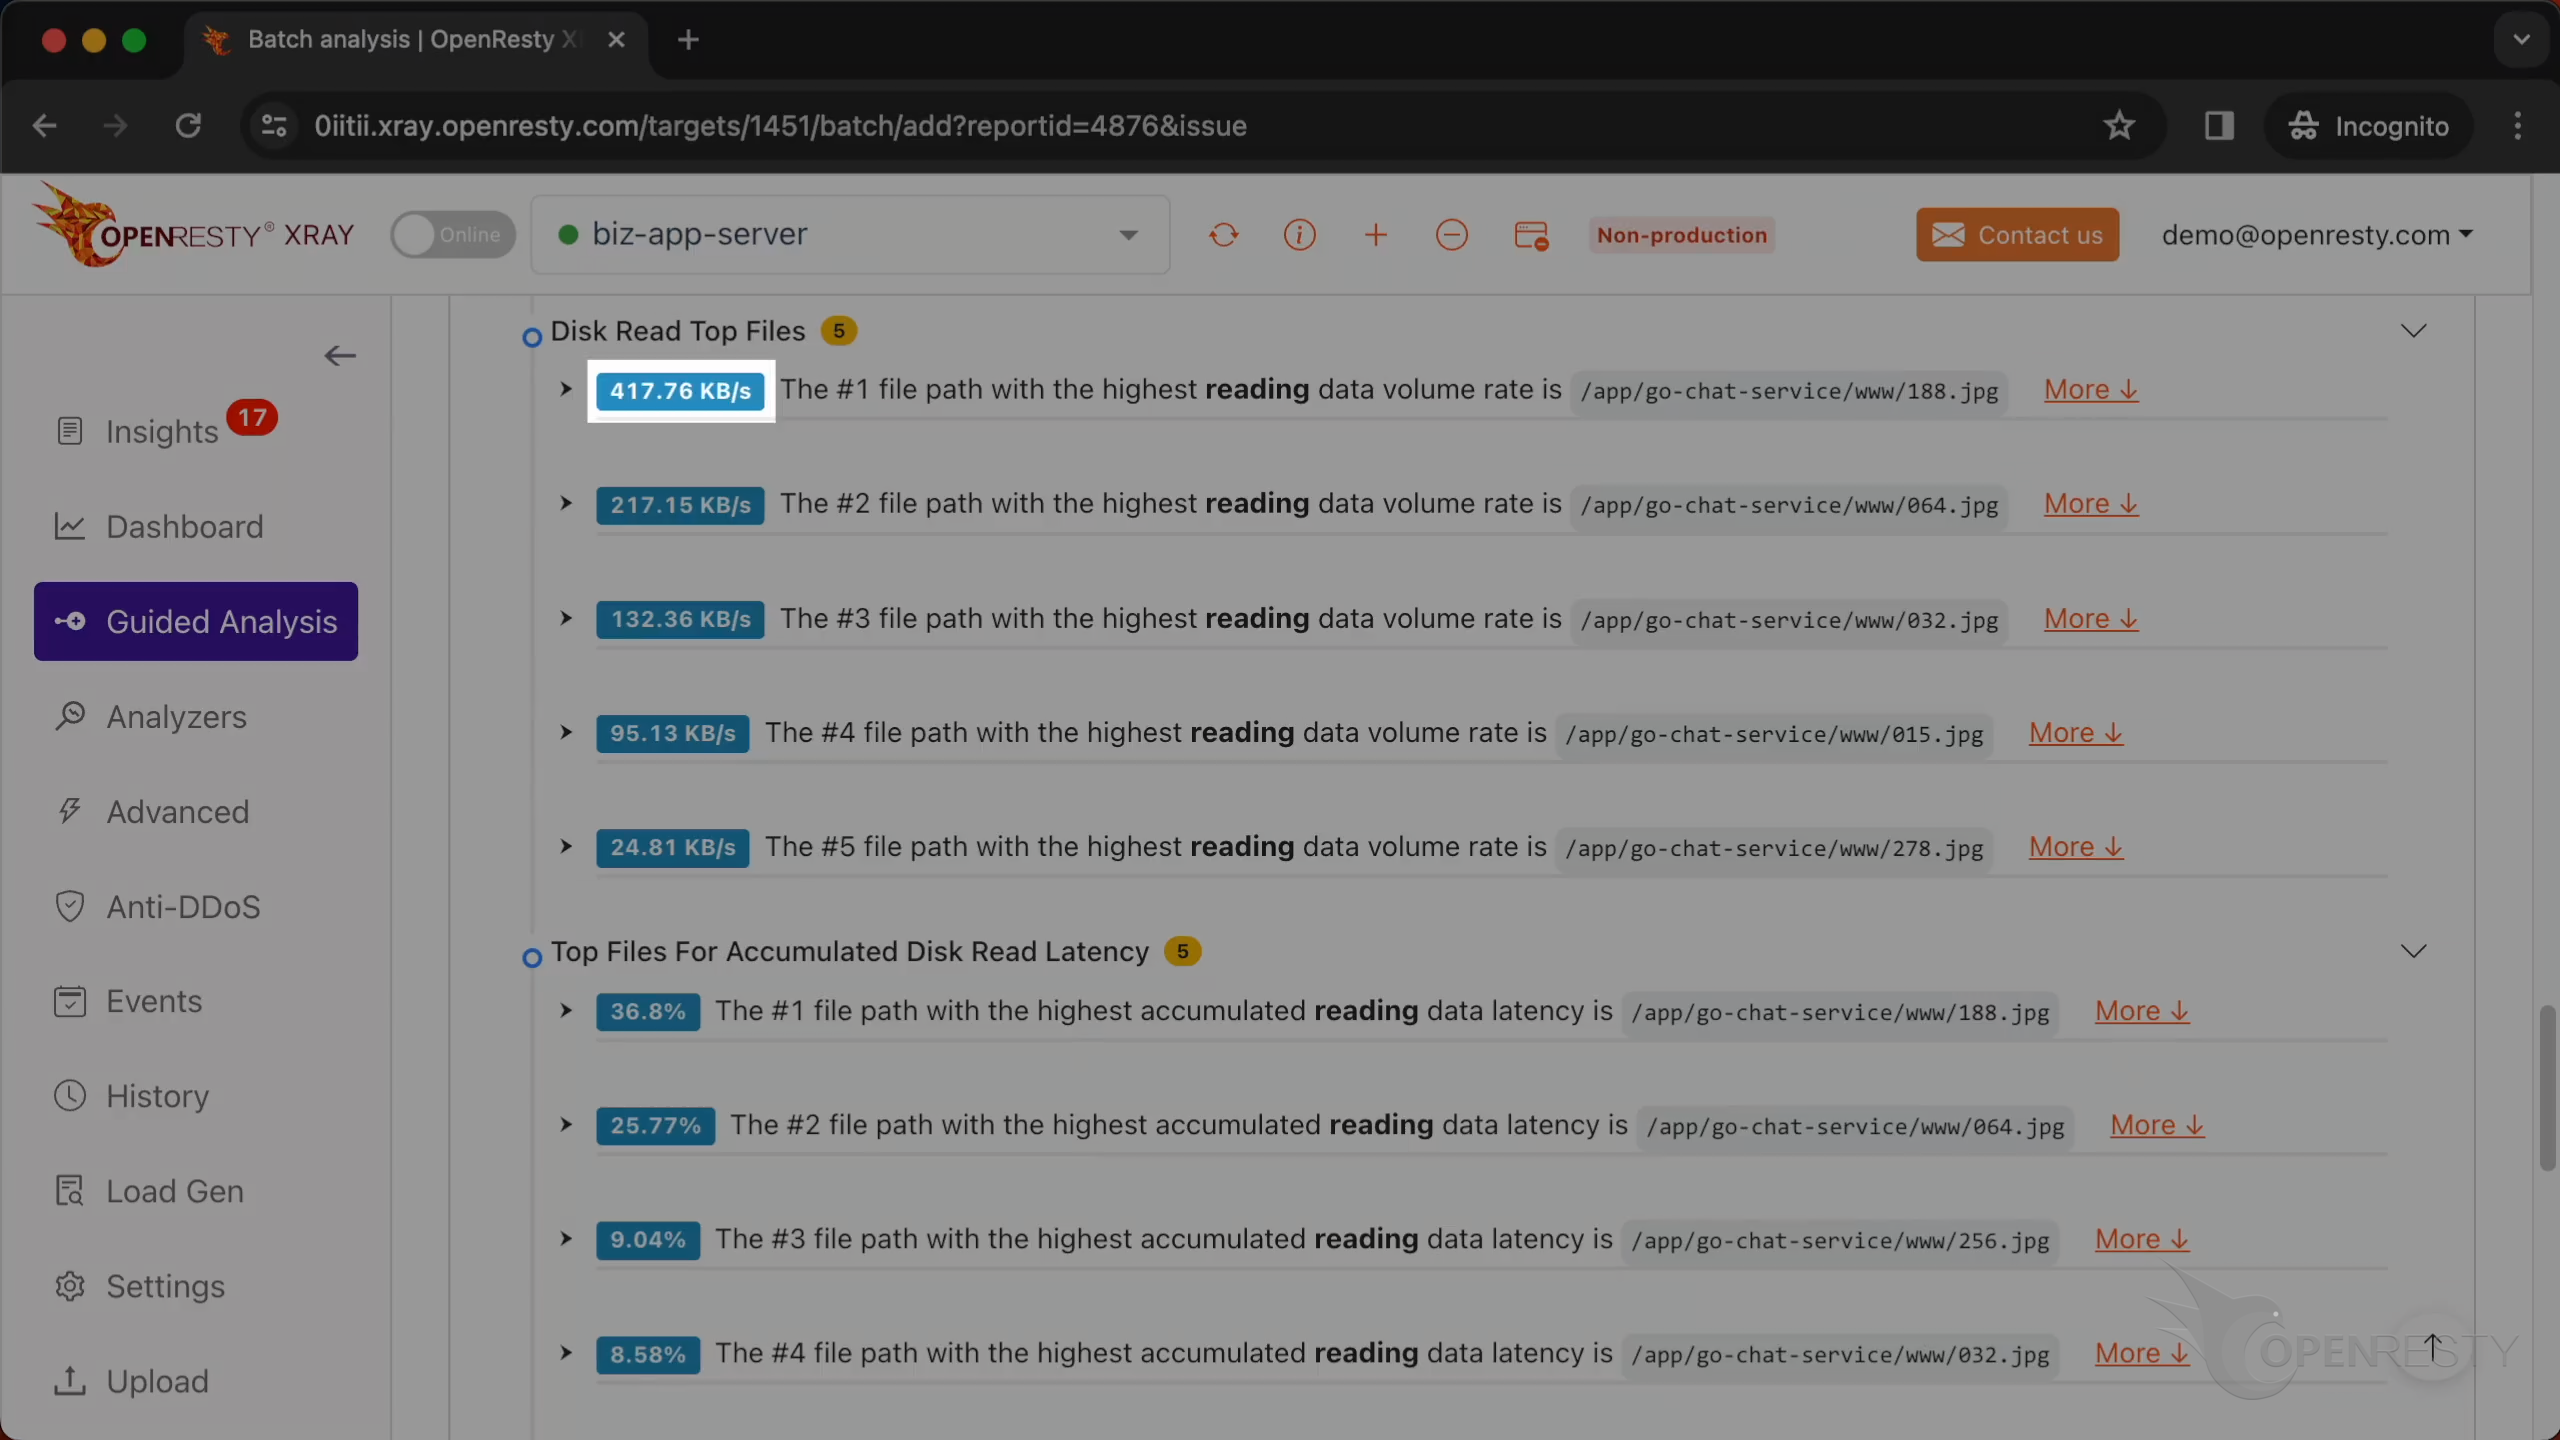
These are files with the most number of disk reads.
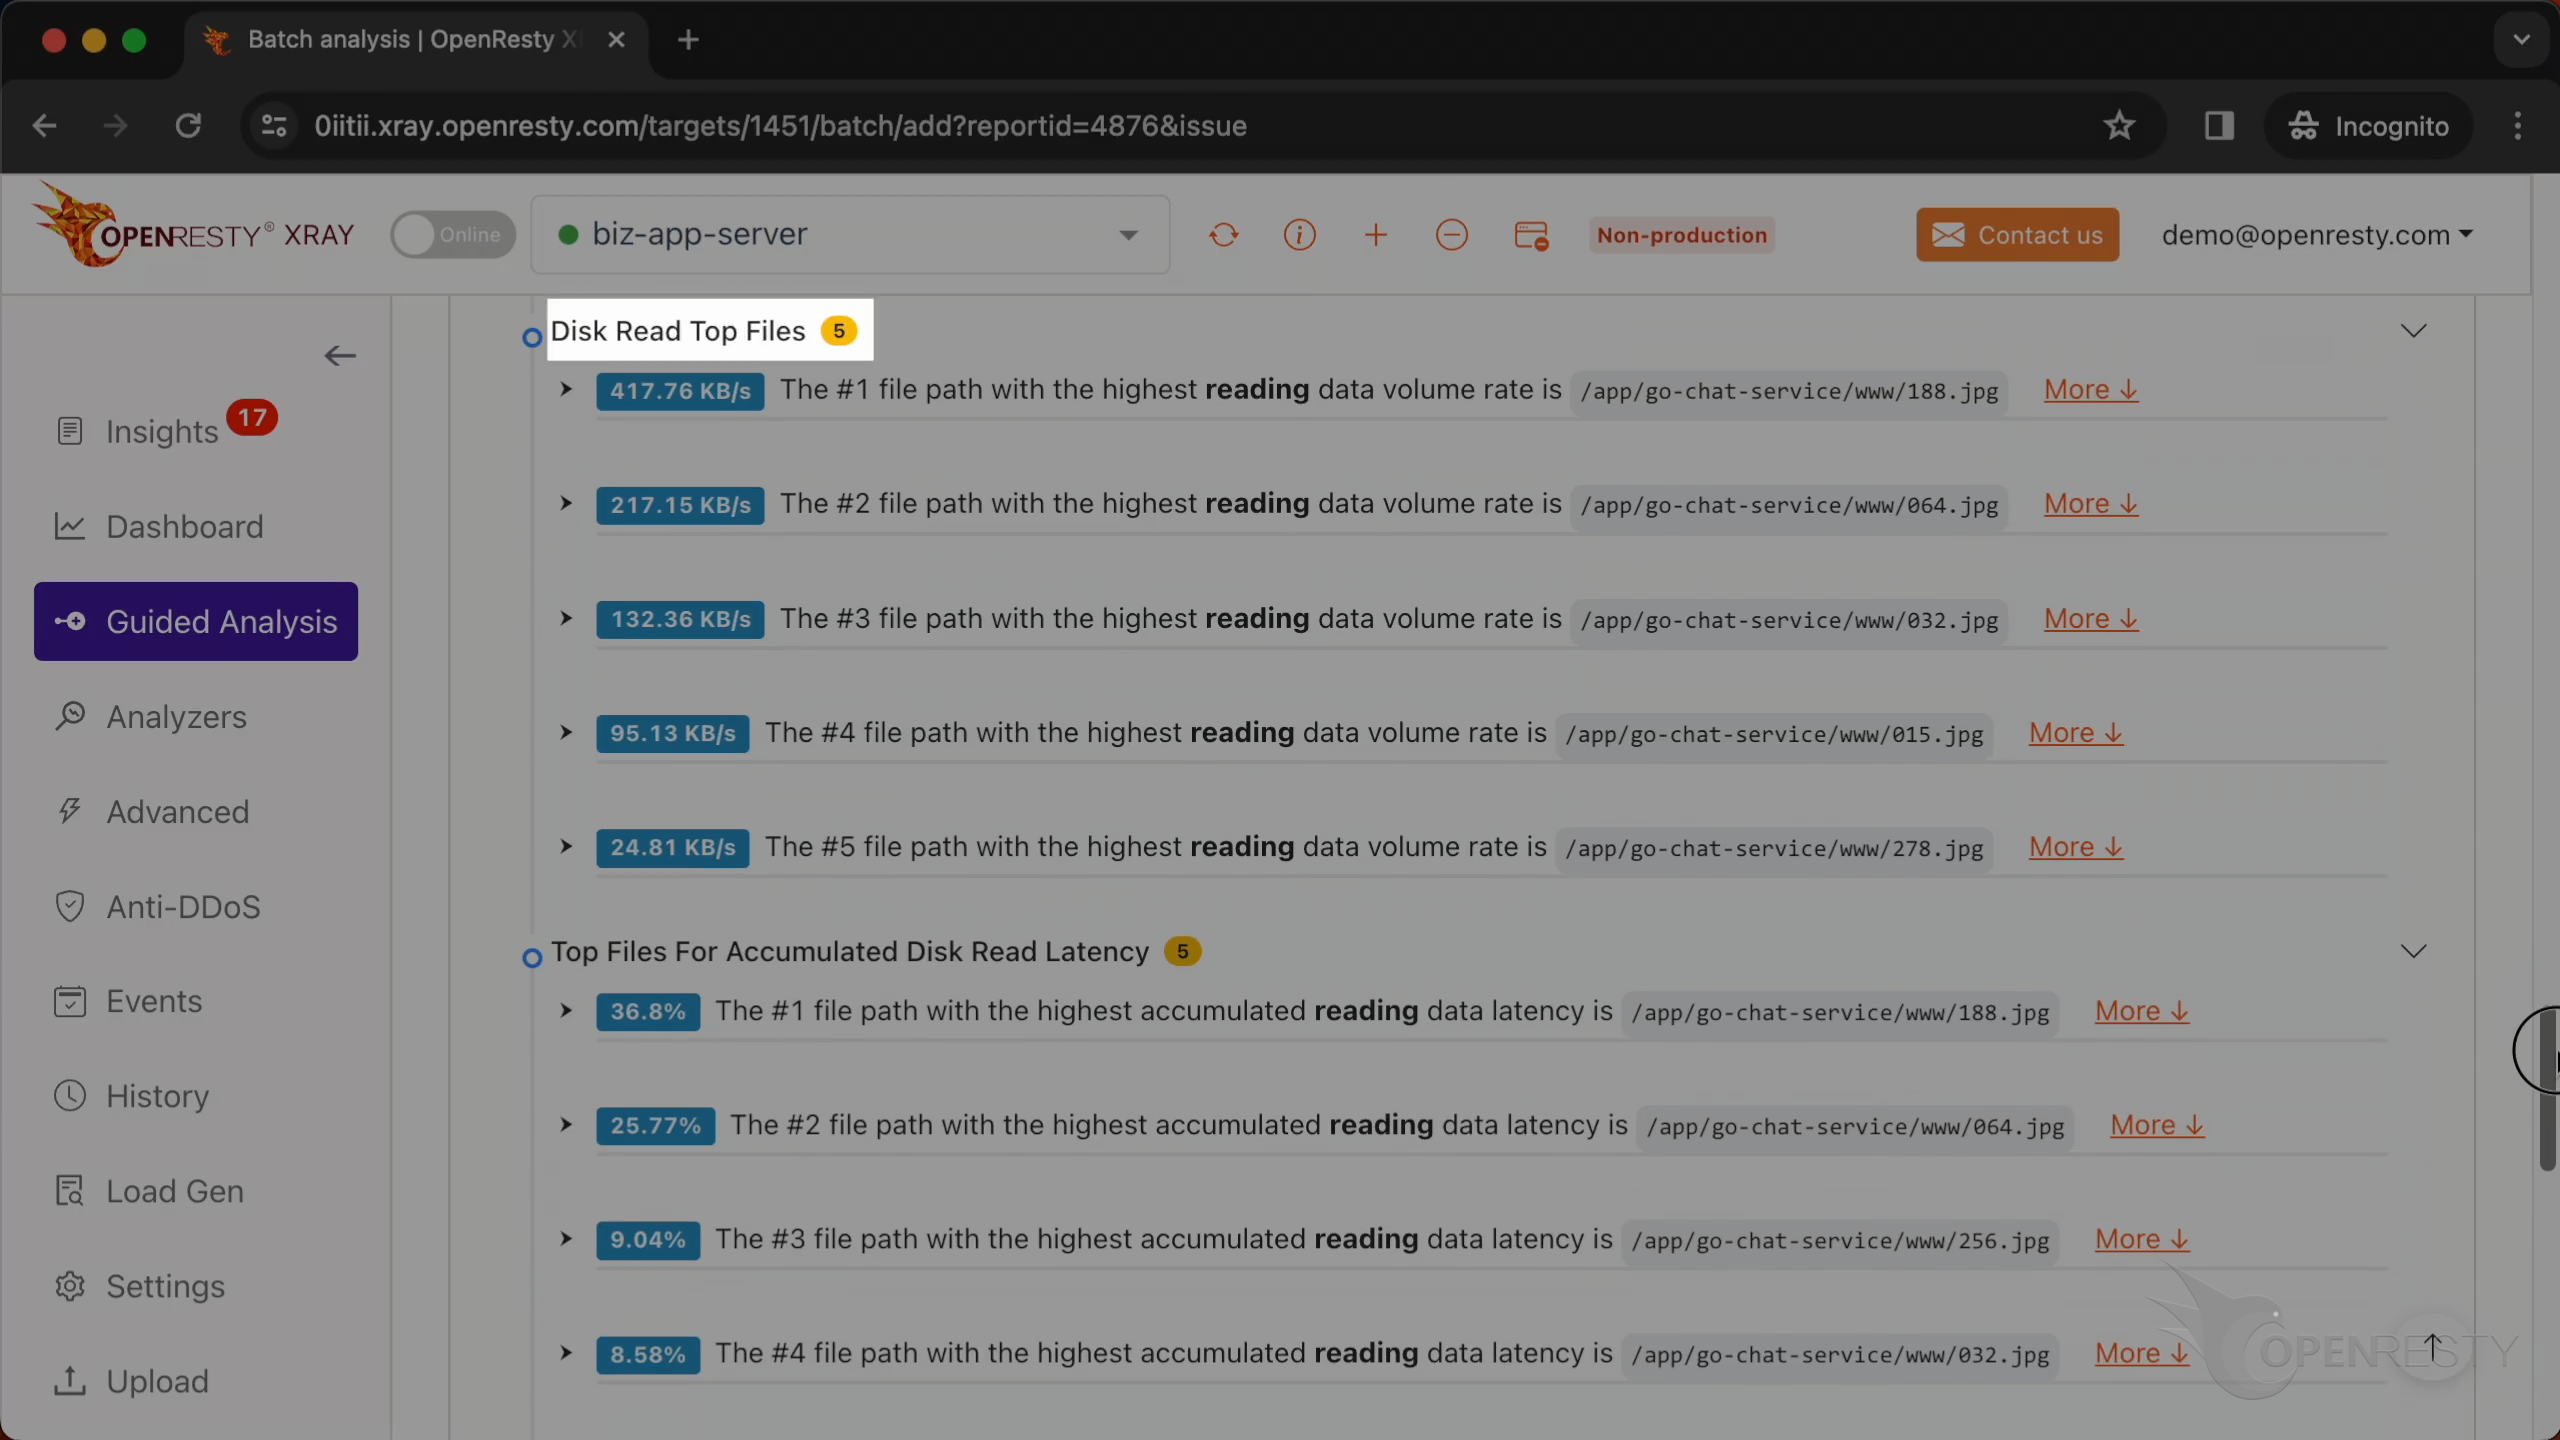
The file with the highest reading data volume rate is 188.jpg.
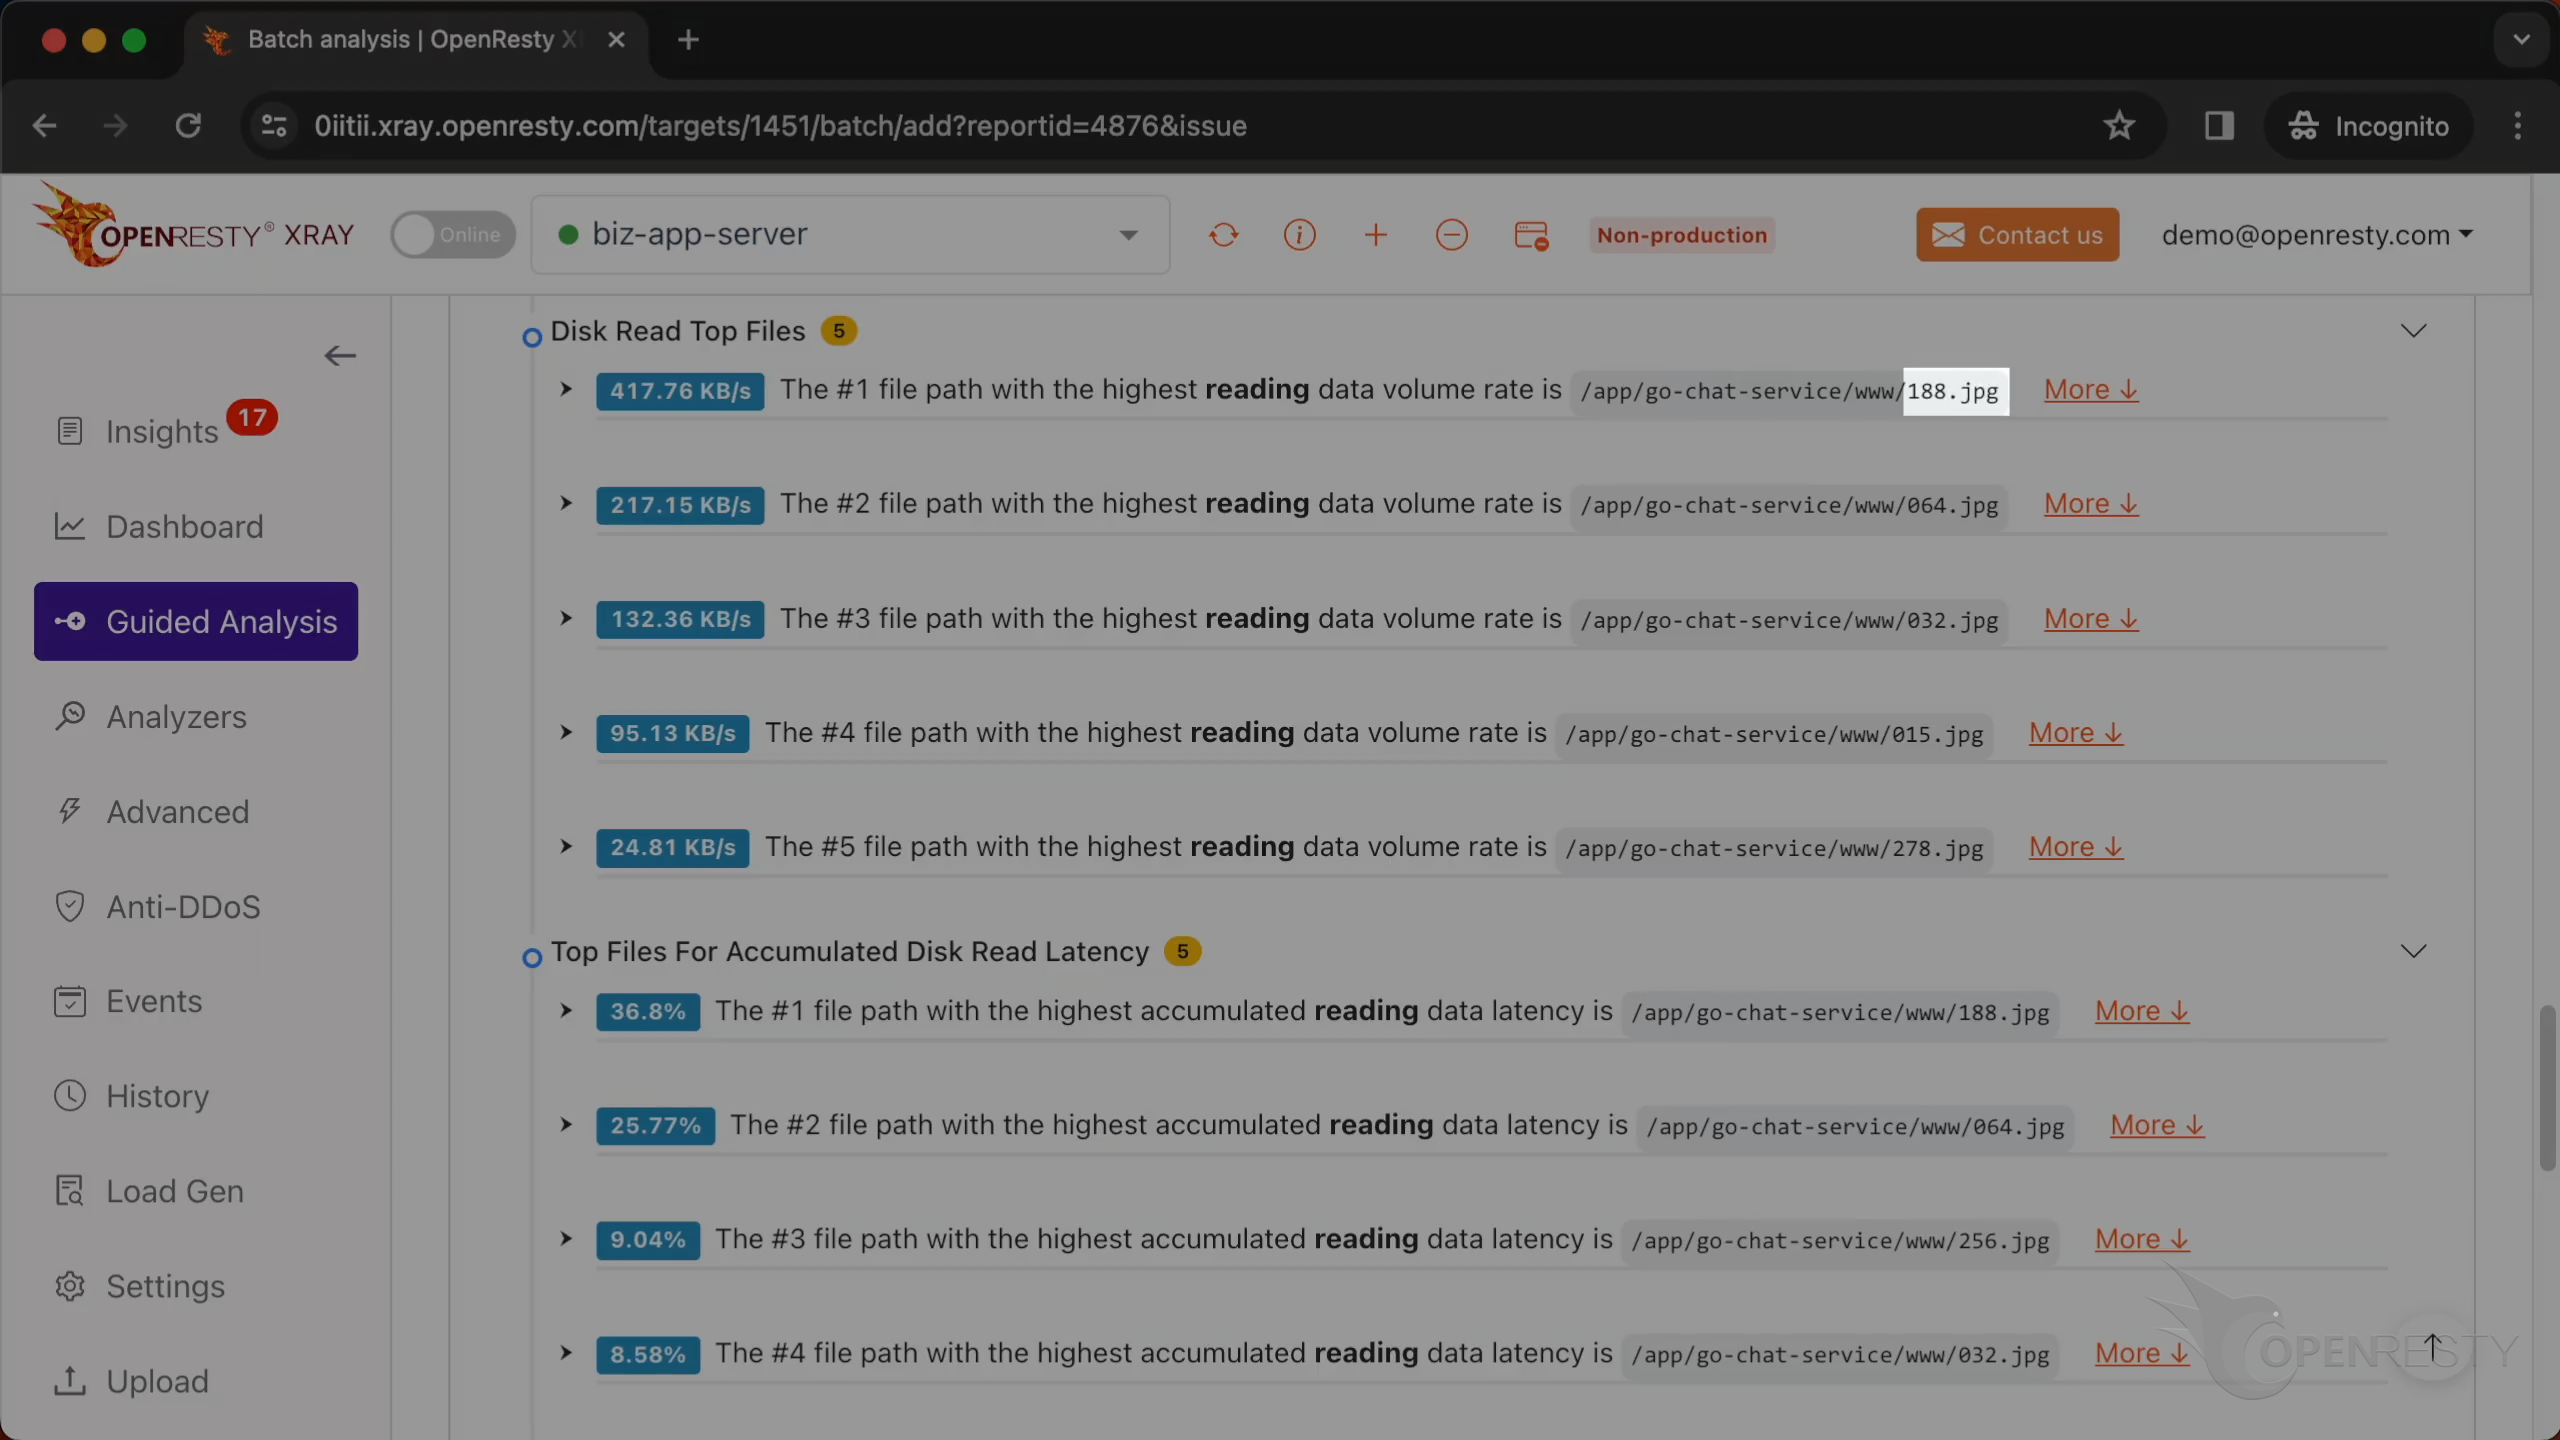
The reading rate is 417 KB/s。
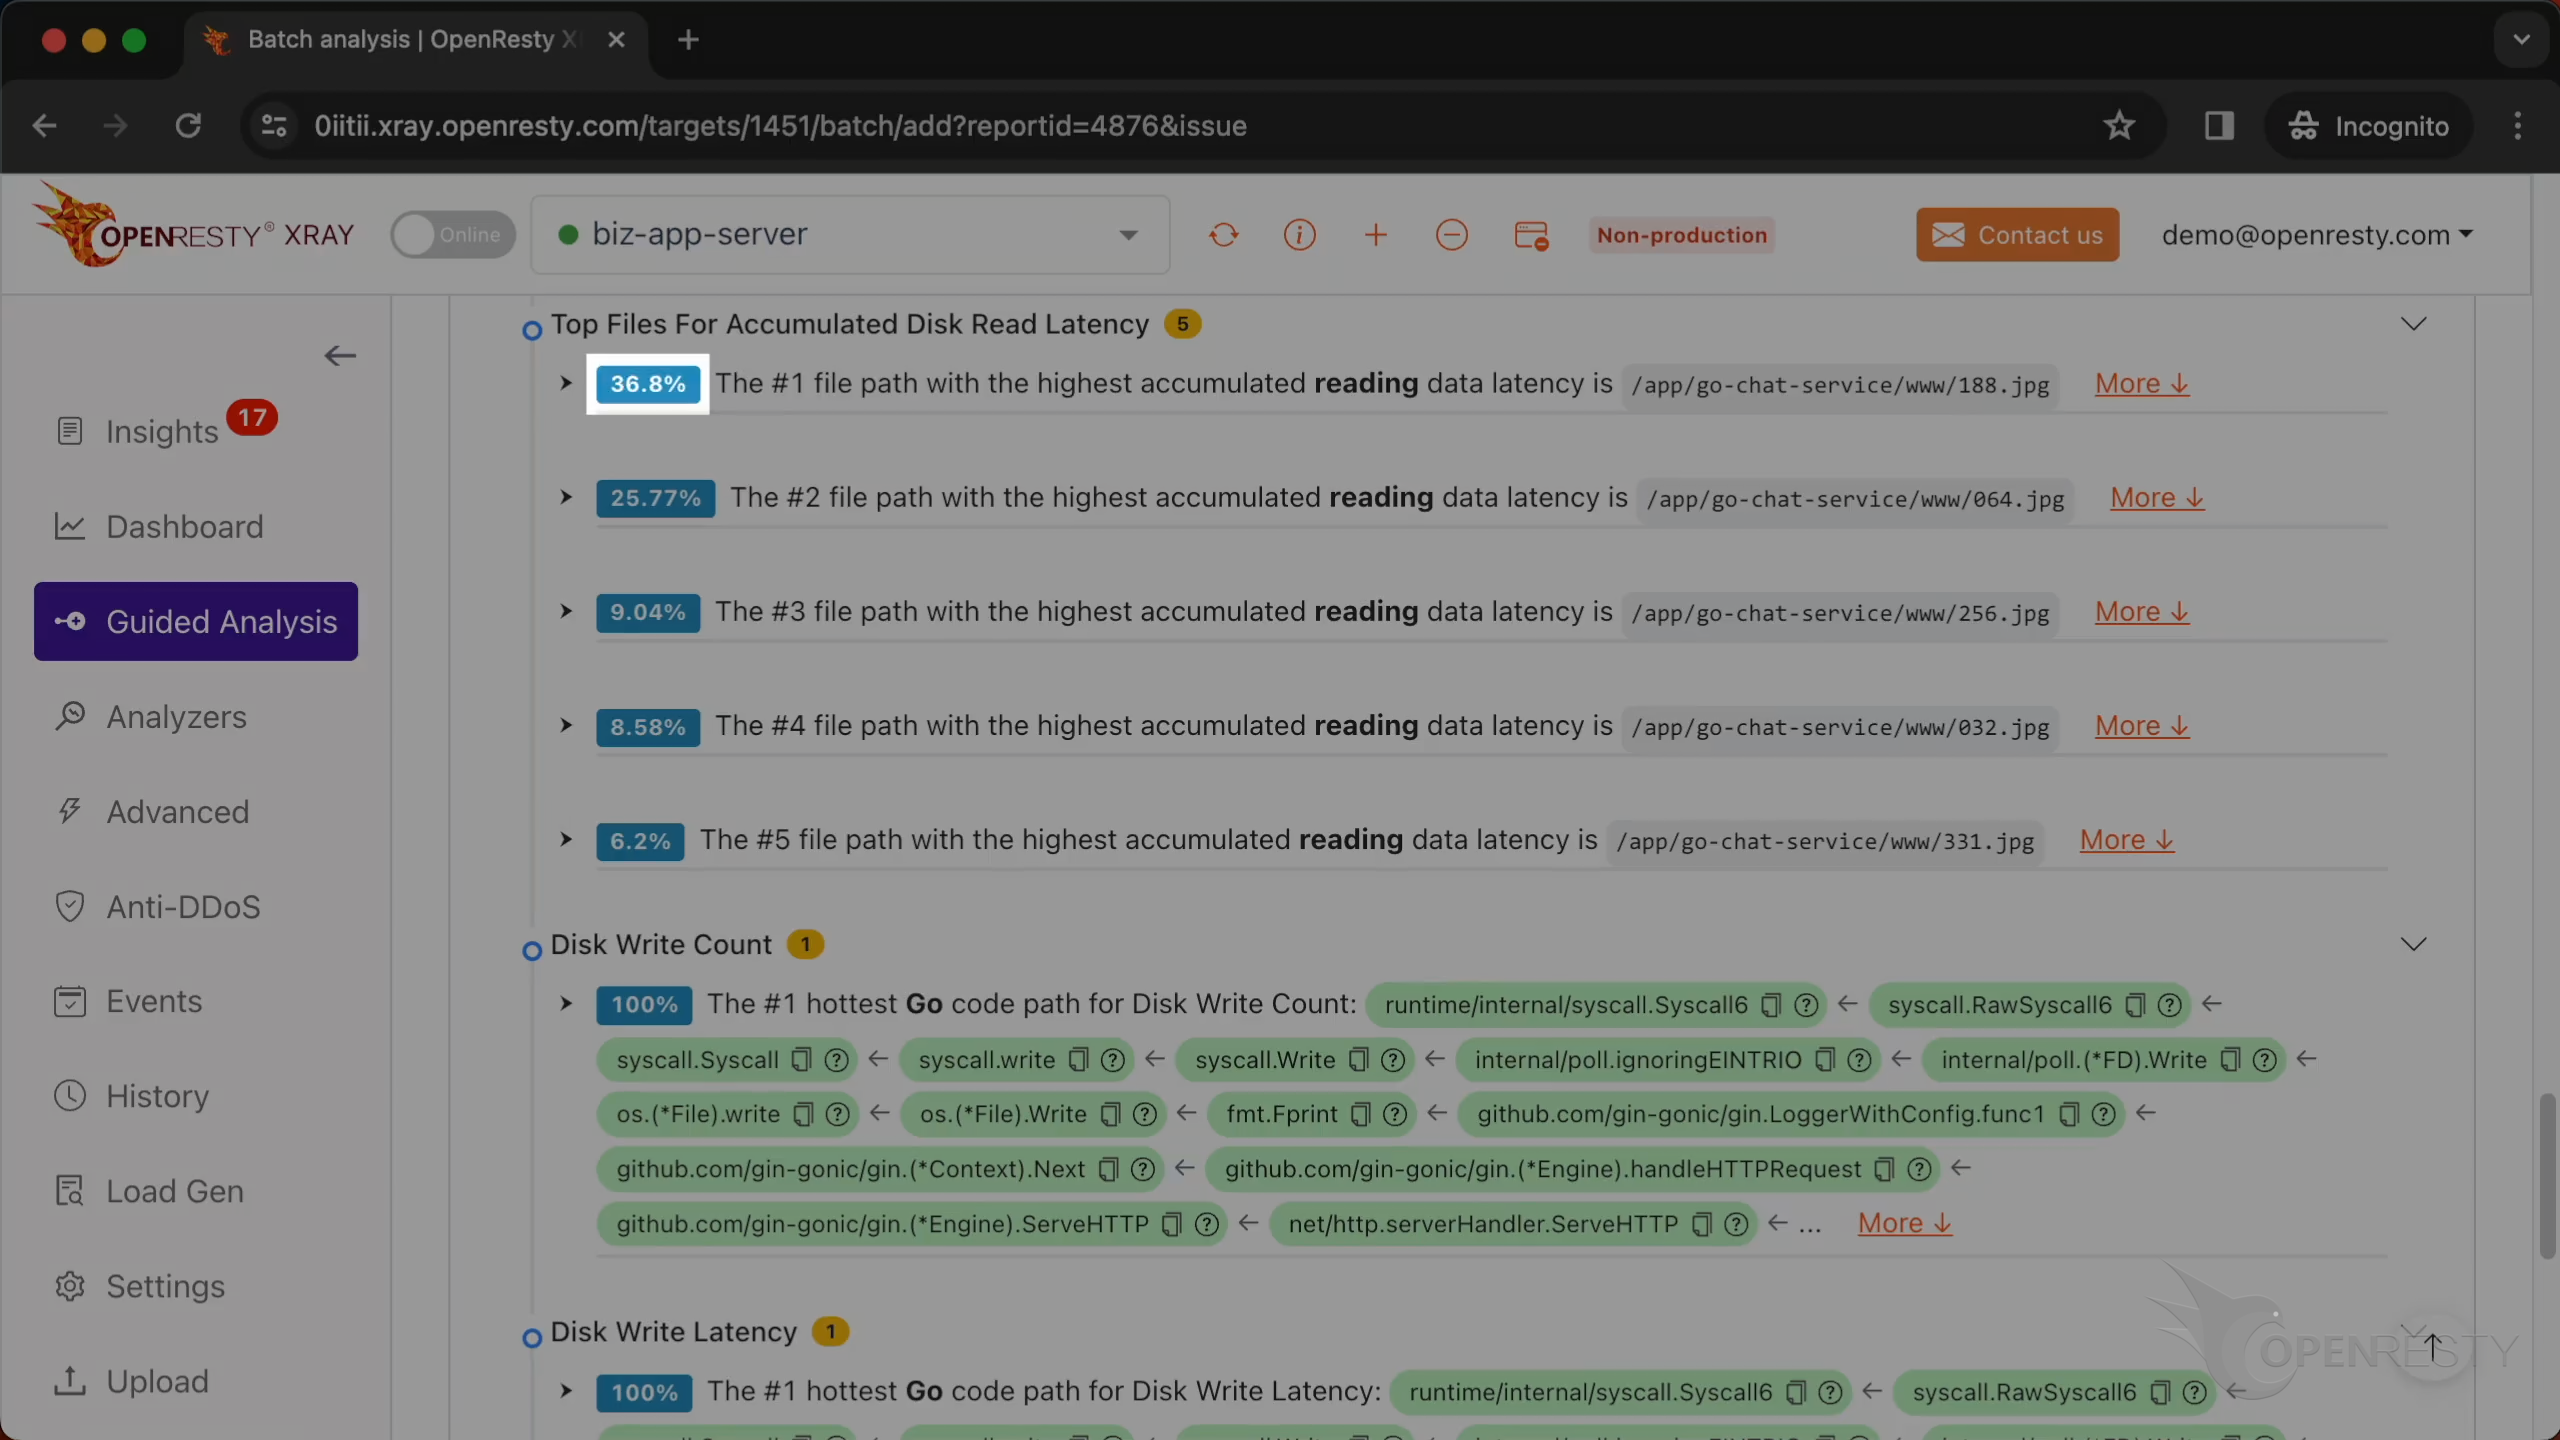
These are files with the most accumulated read latency.
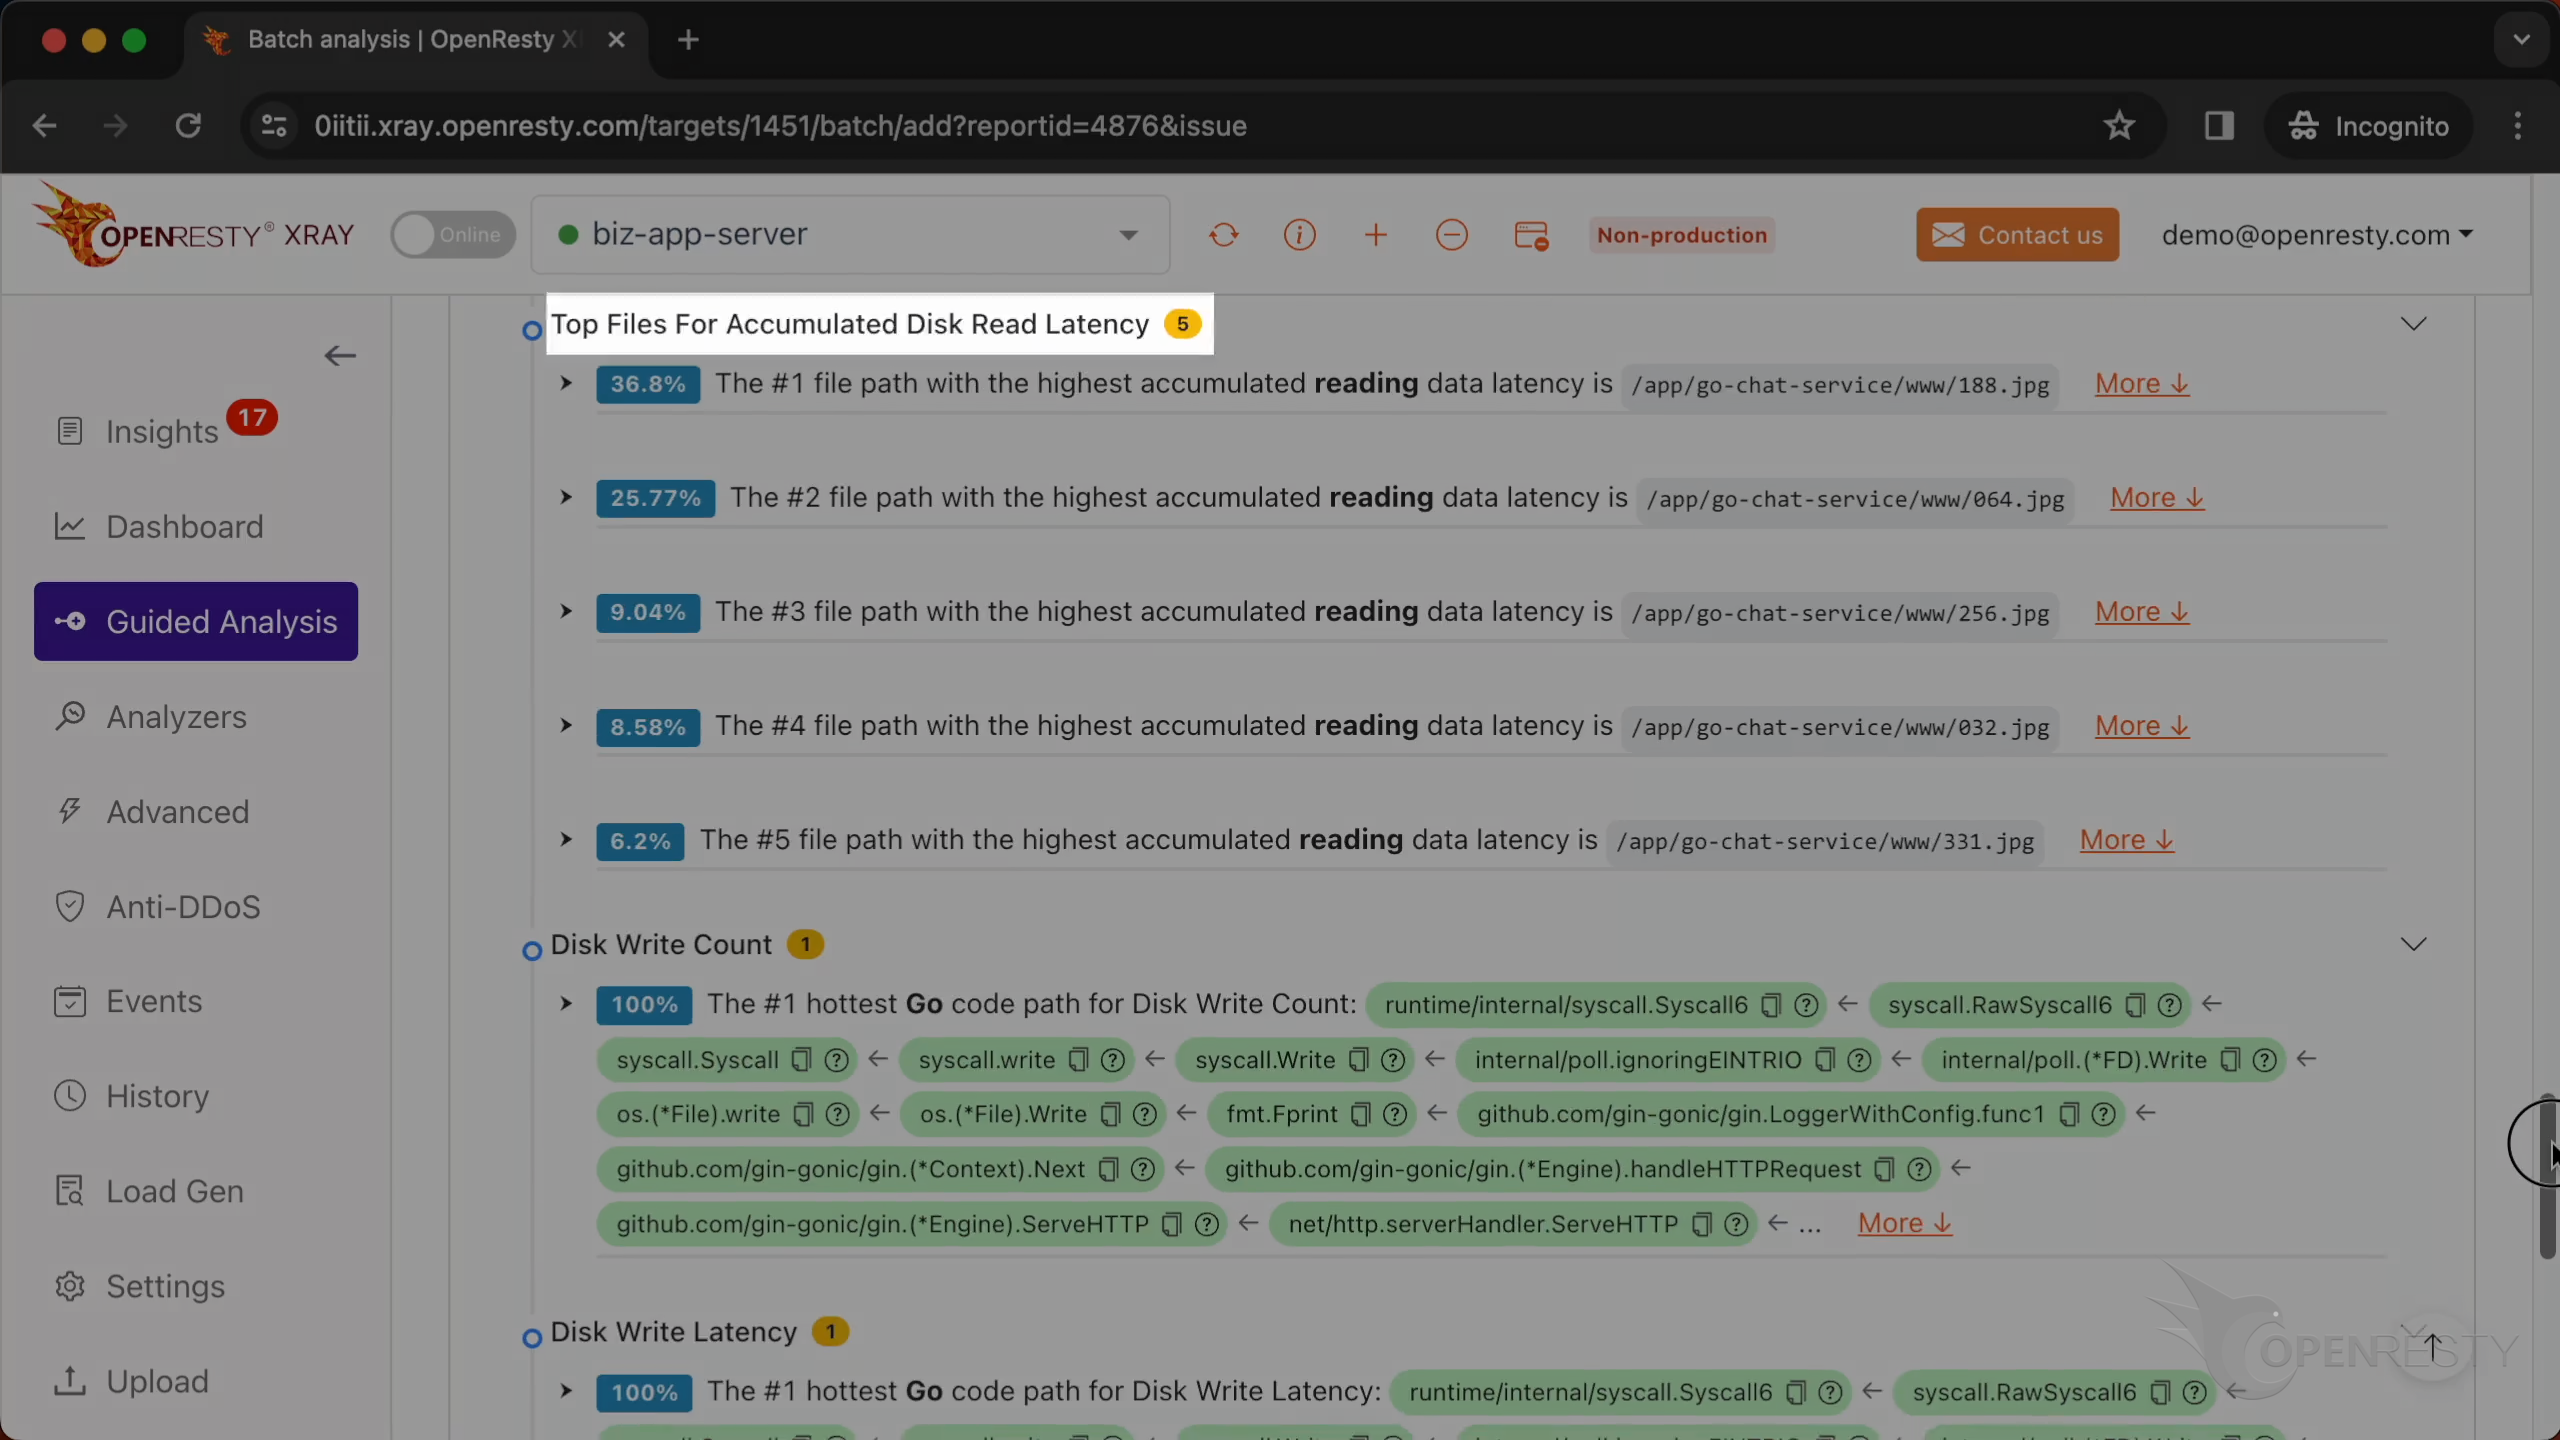
The file with the highest reading data latency is 188.jpg.
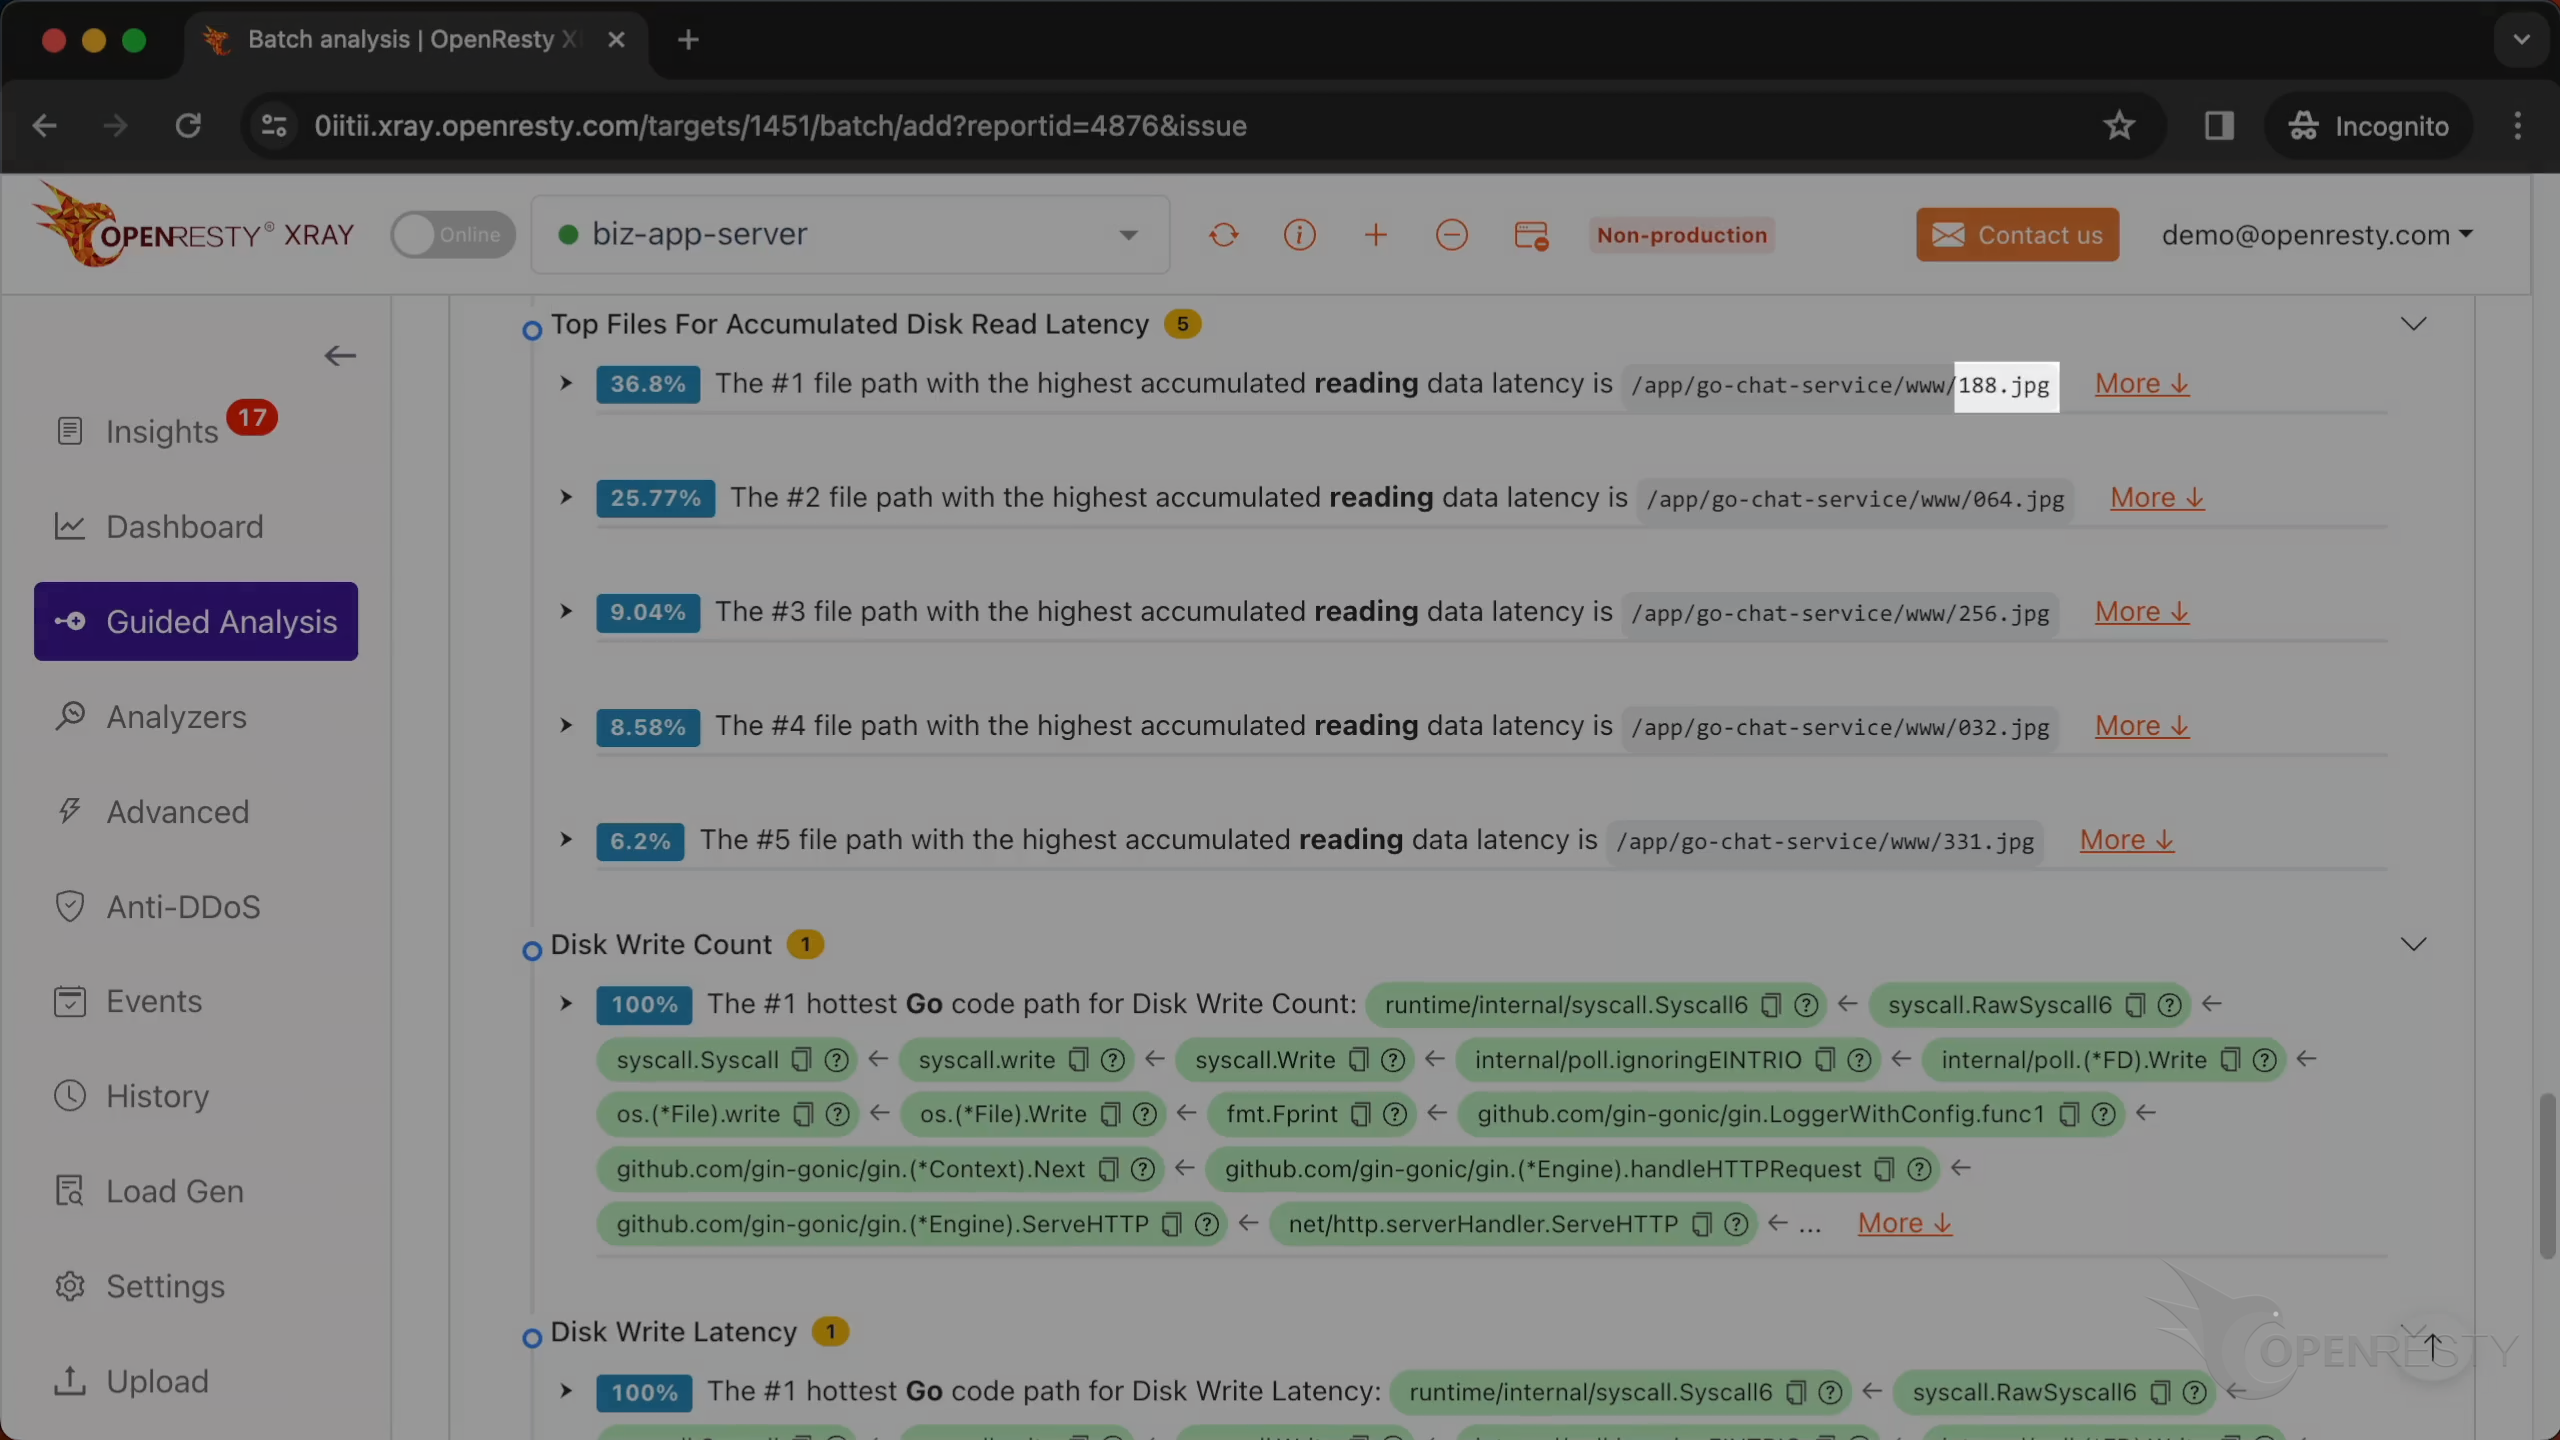
The proportion is 36%.
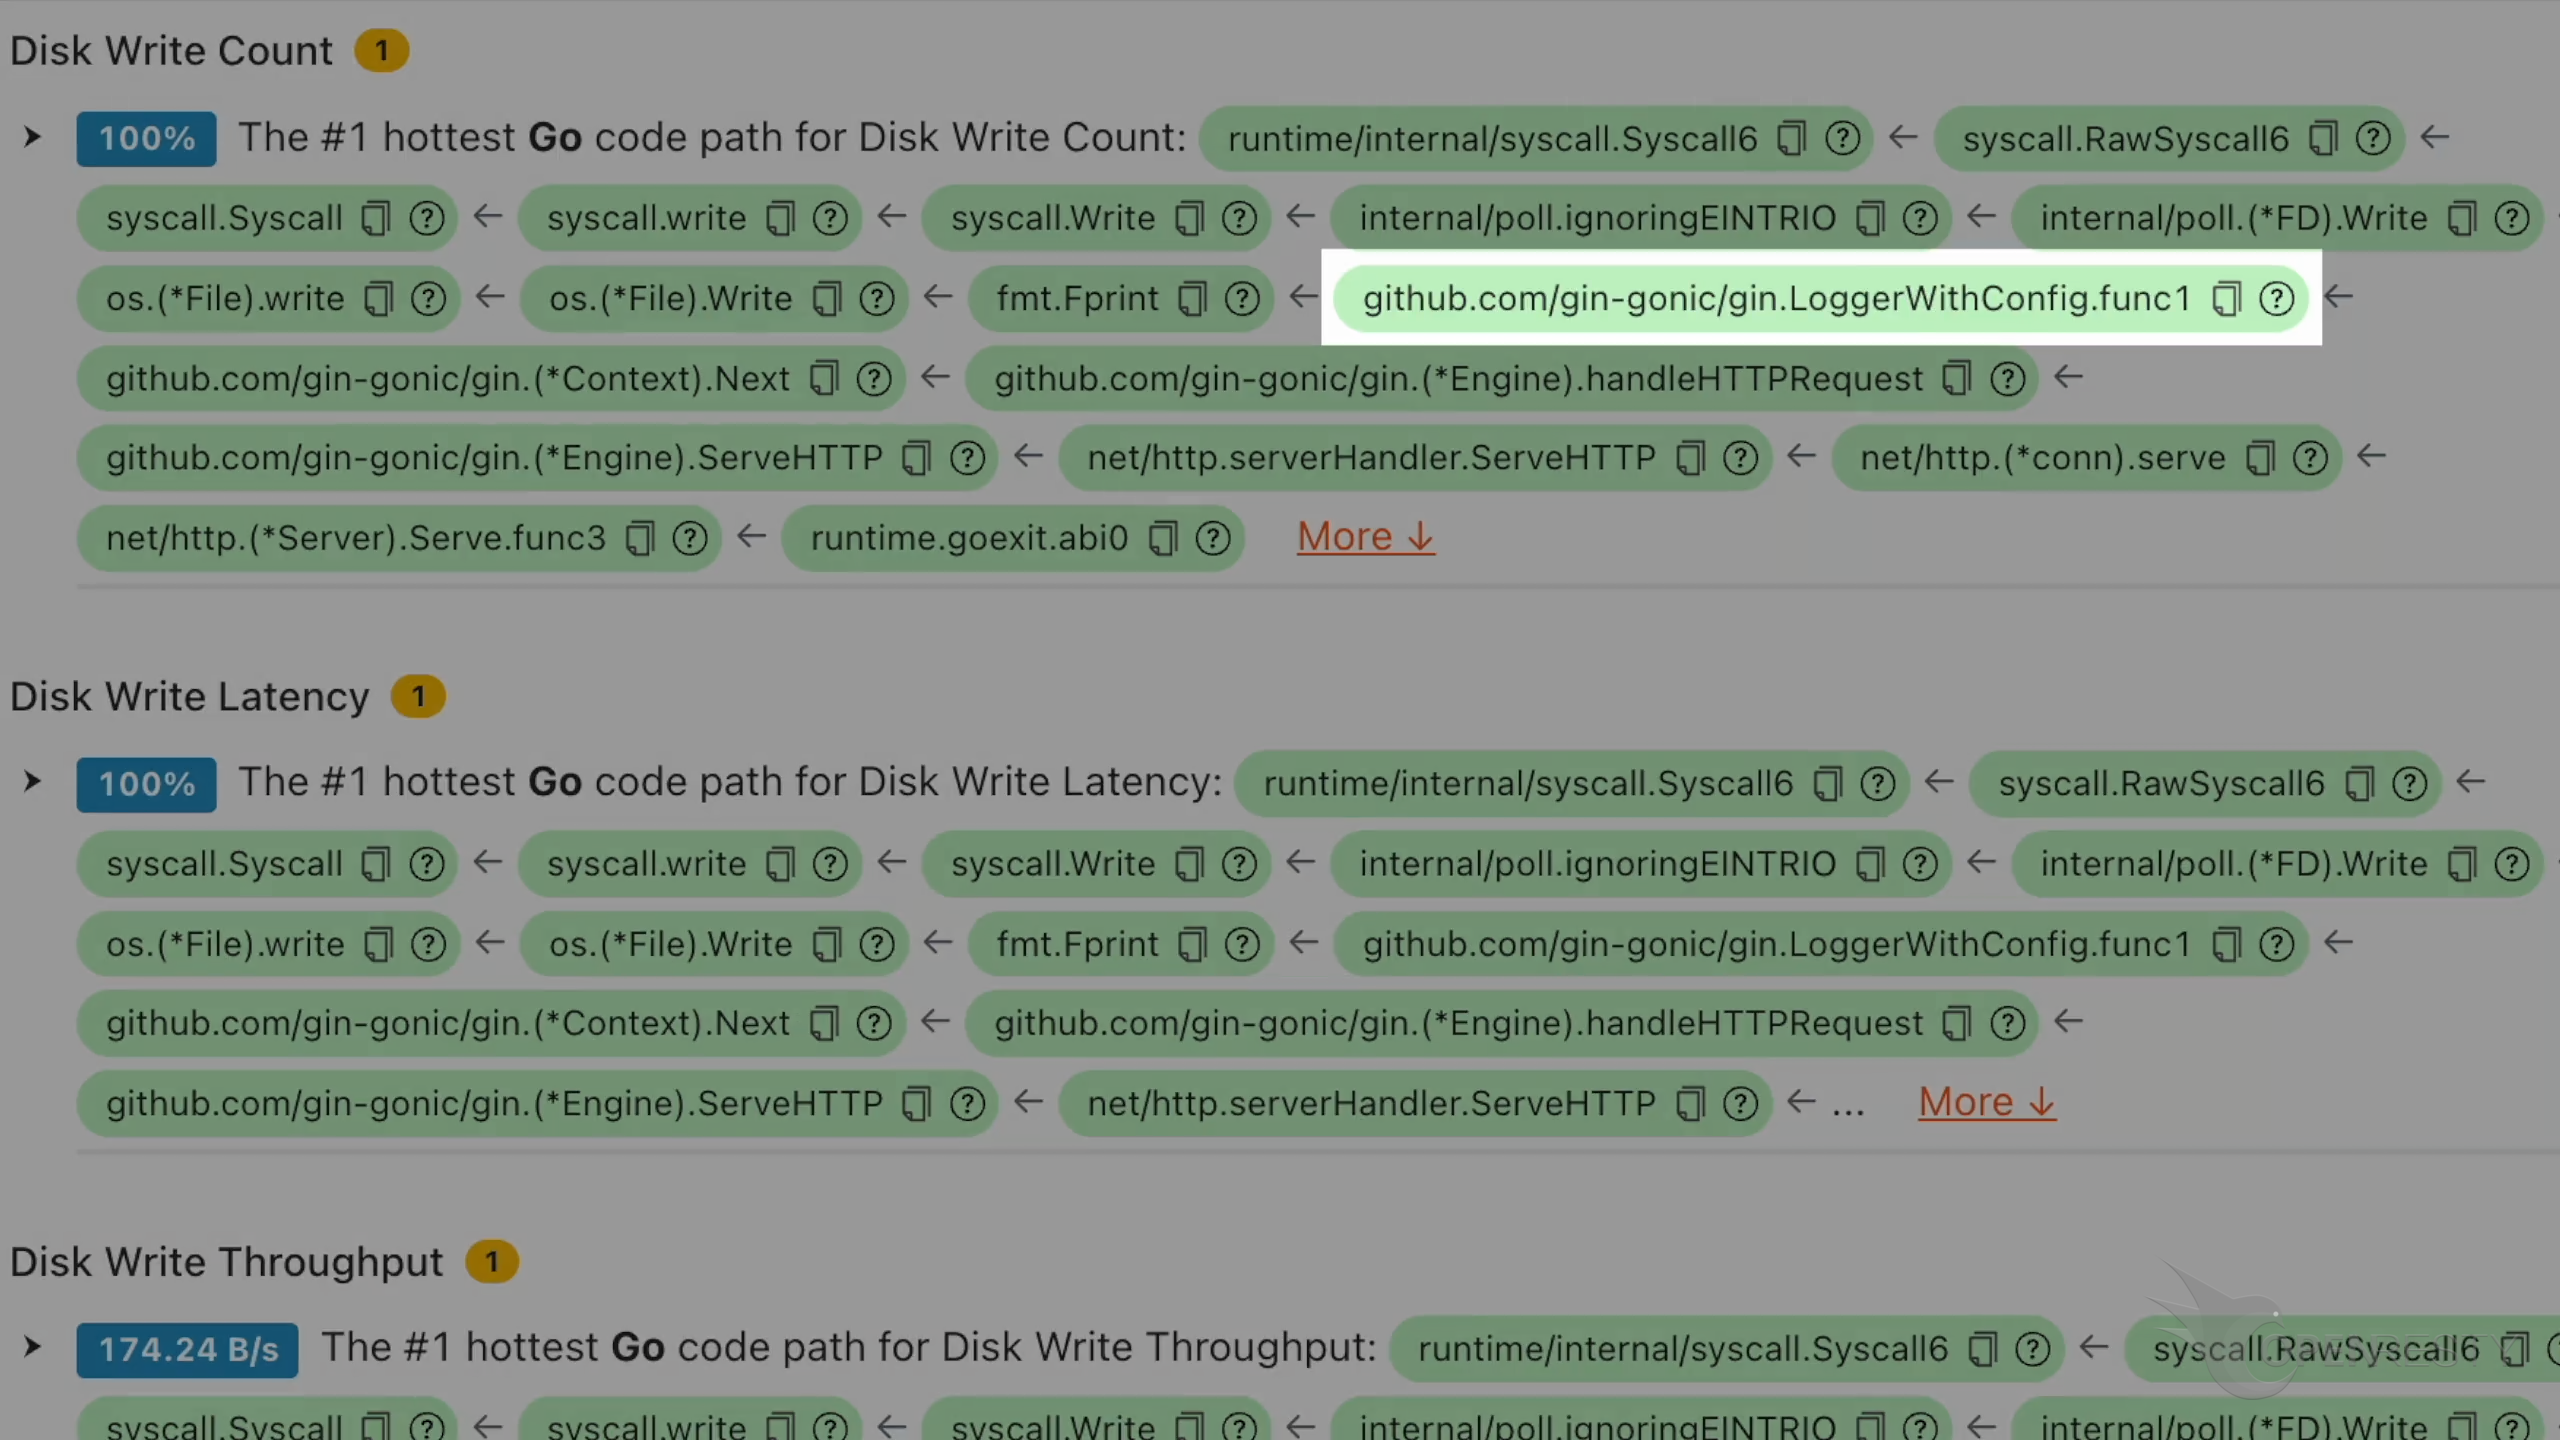
This is the analysis of the disk write count.
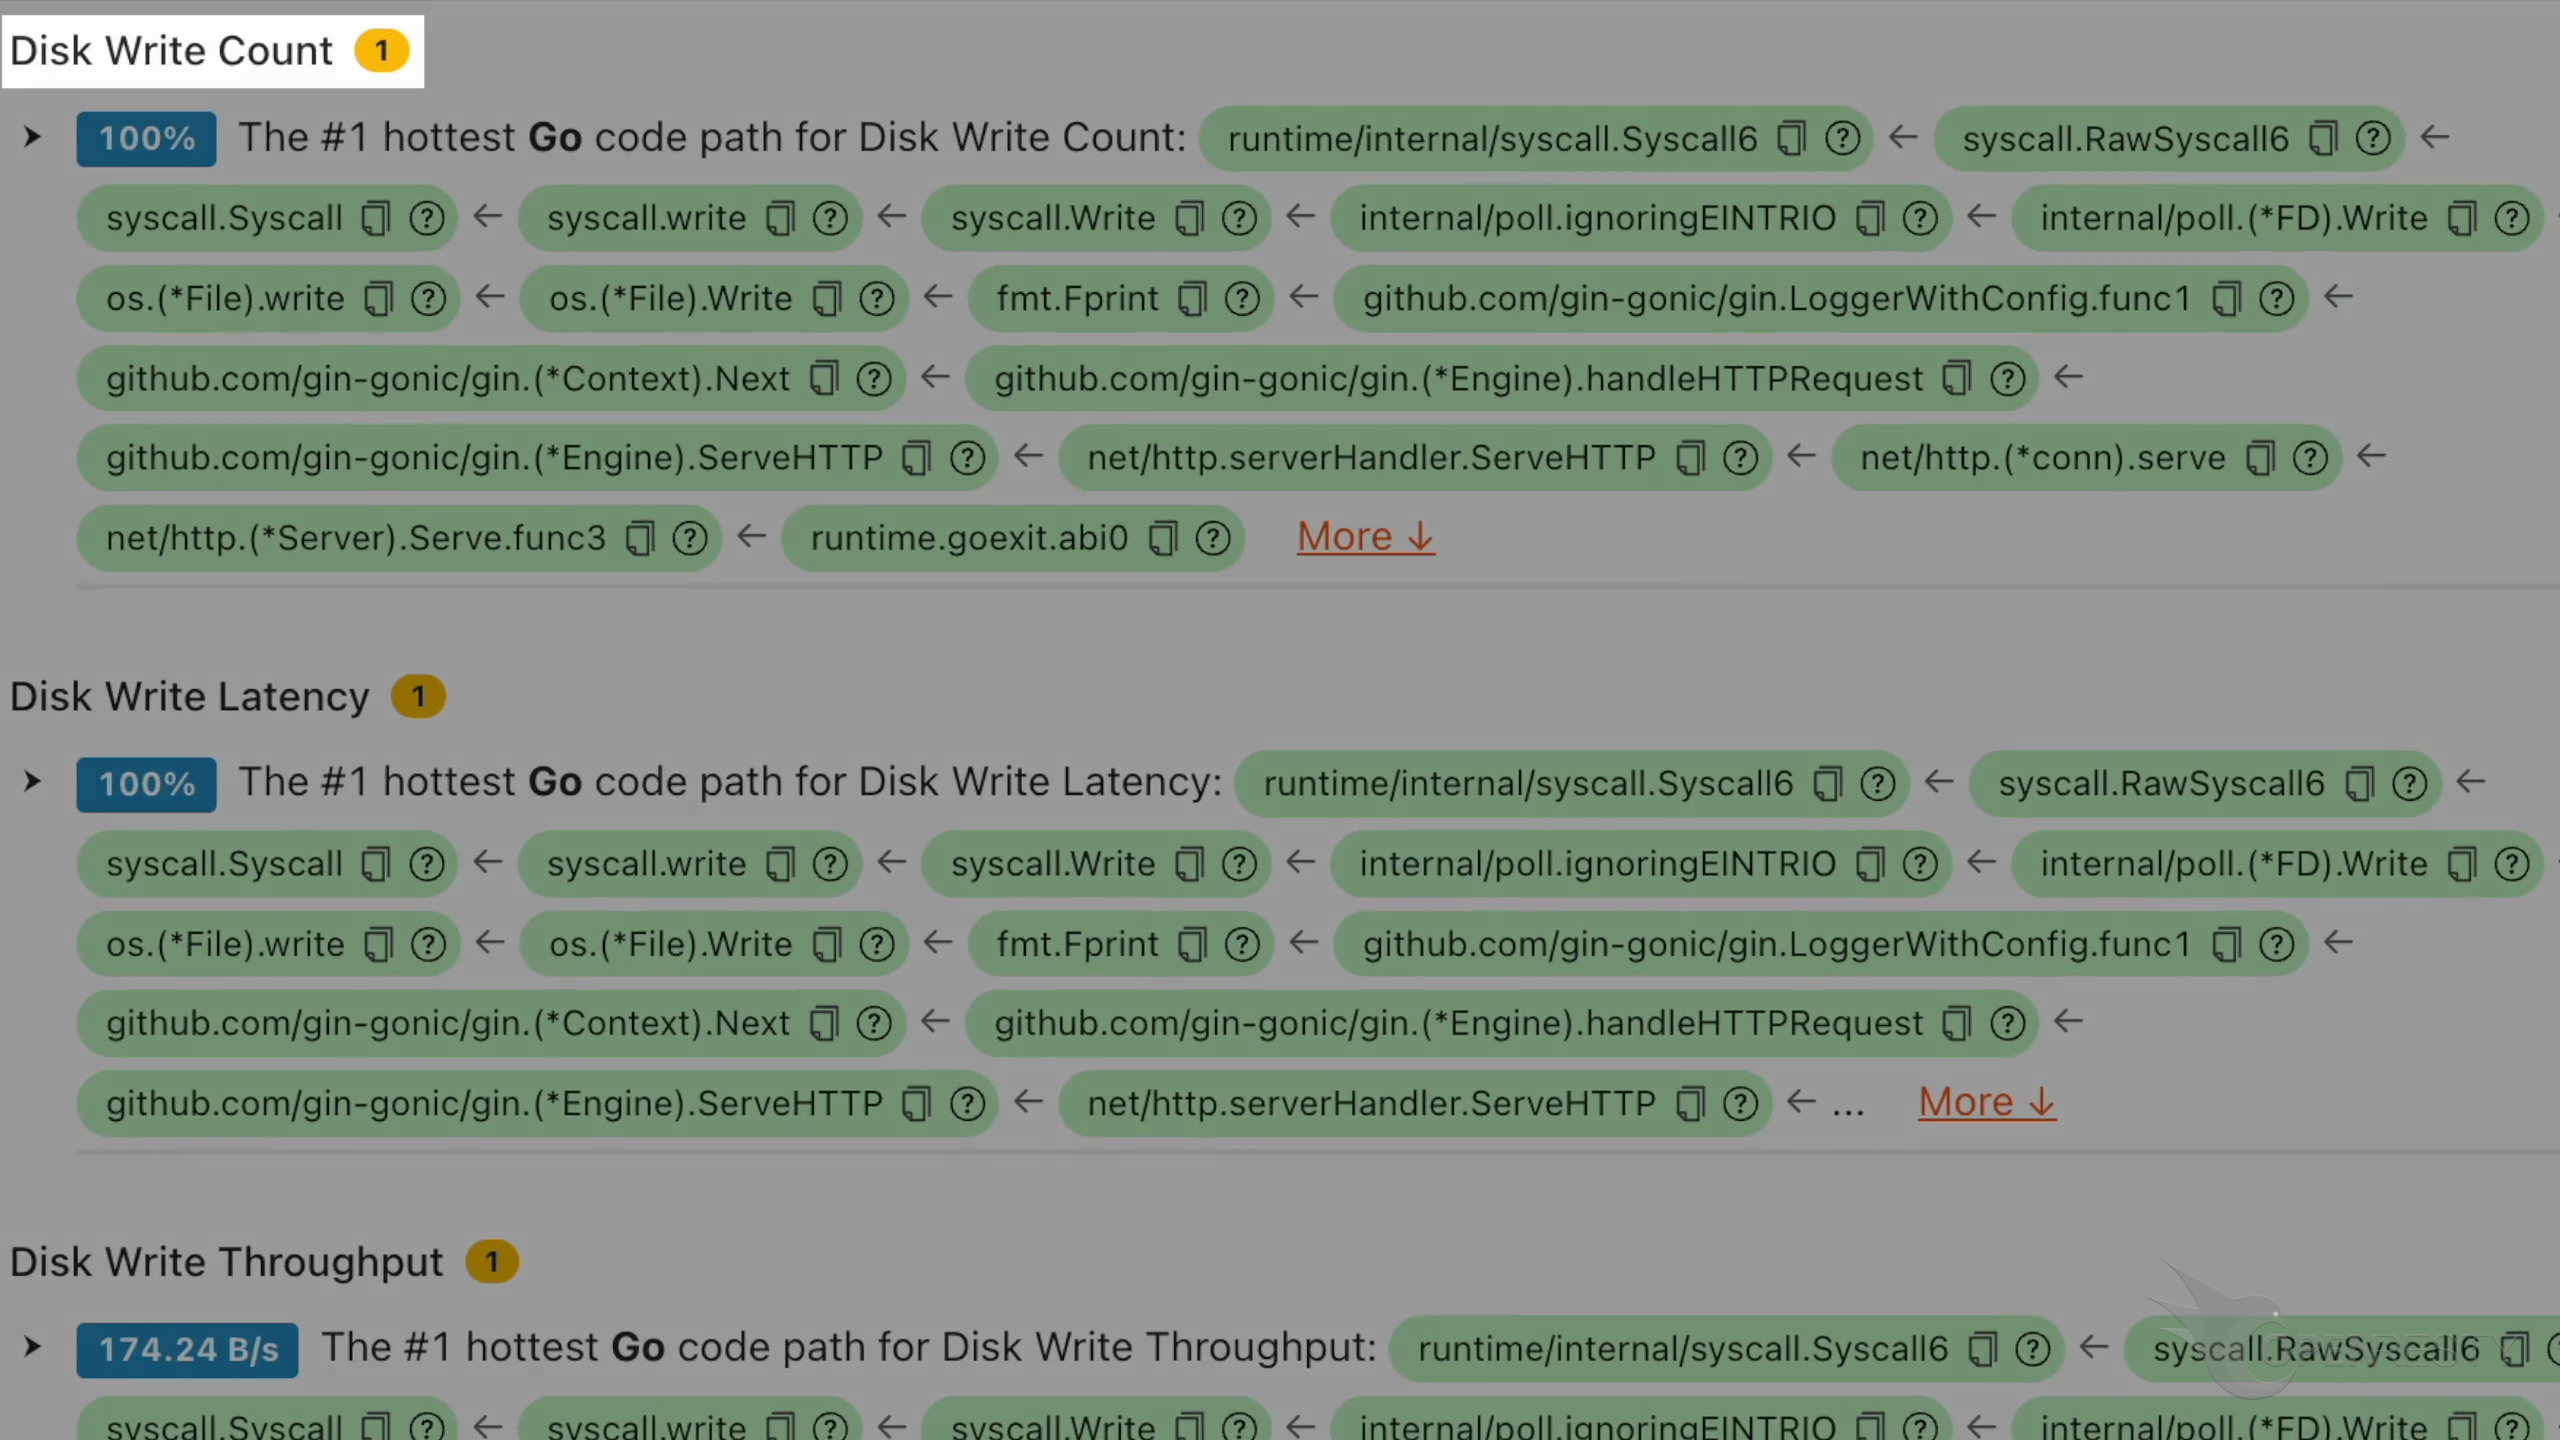
This code path is the sole source of disk write operations.
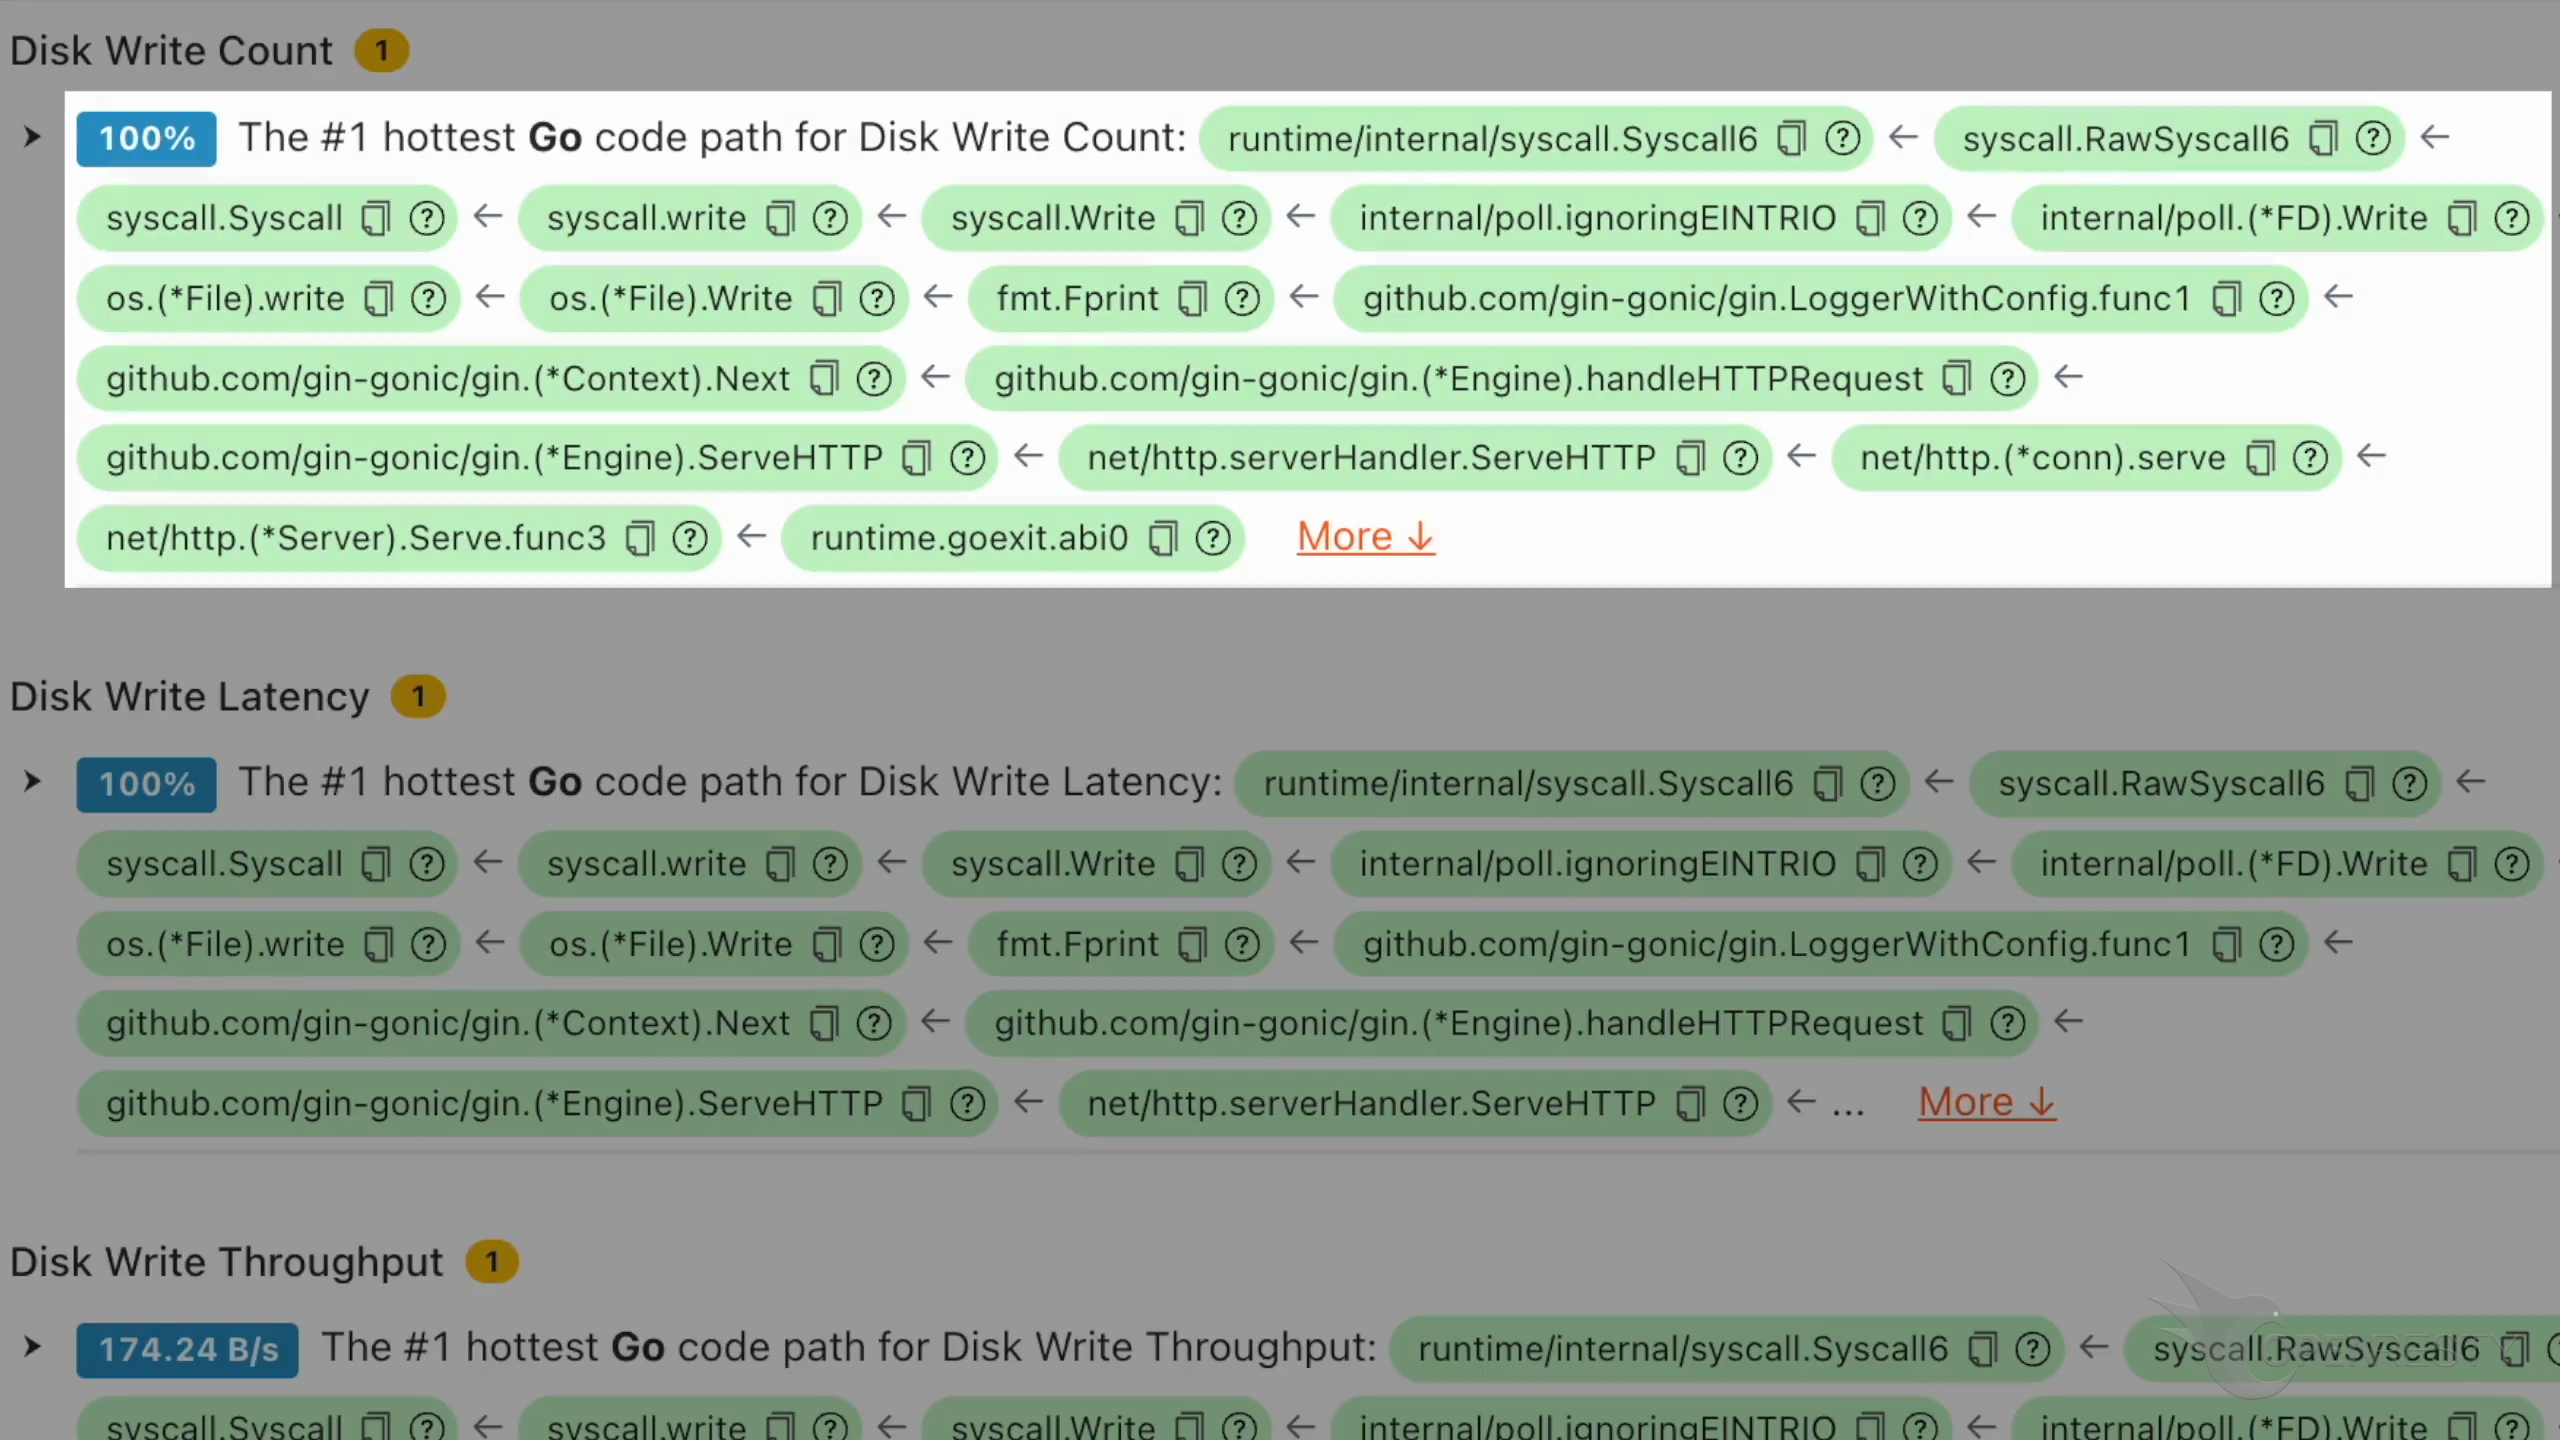
This is a function in the gin framework that logs requests.
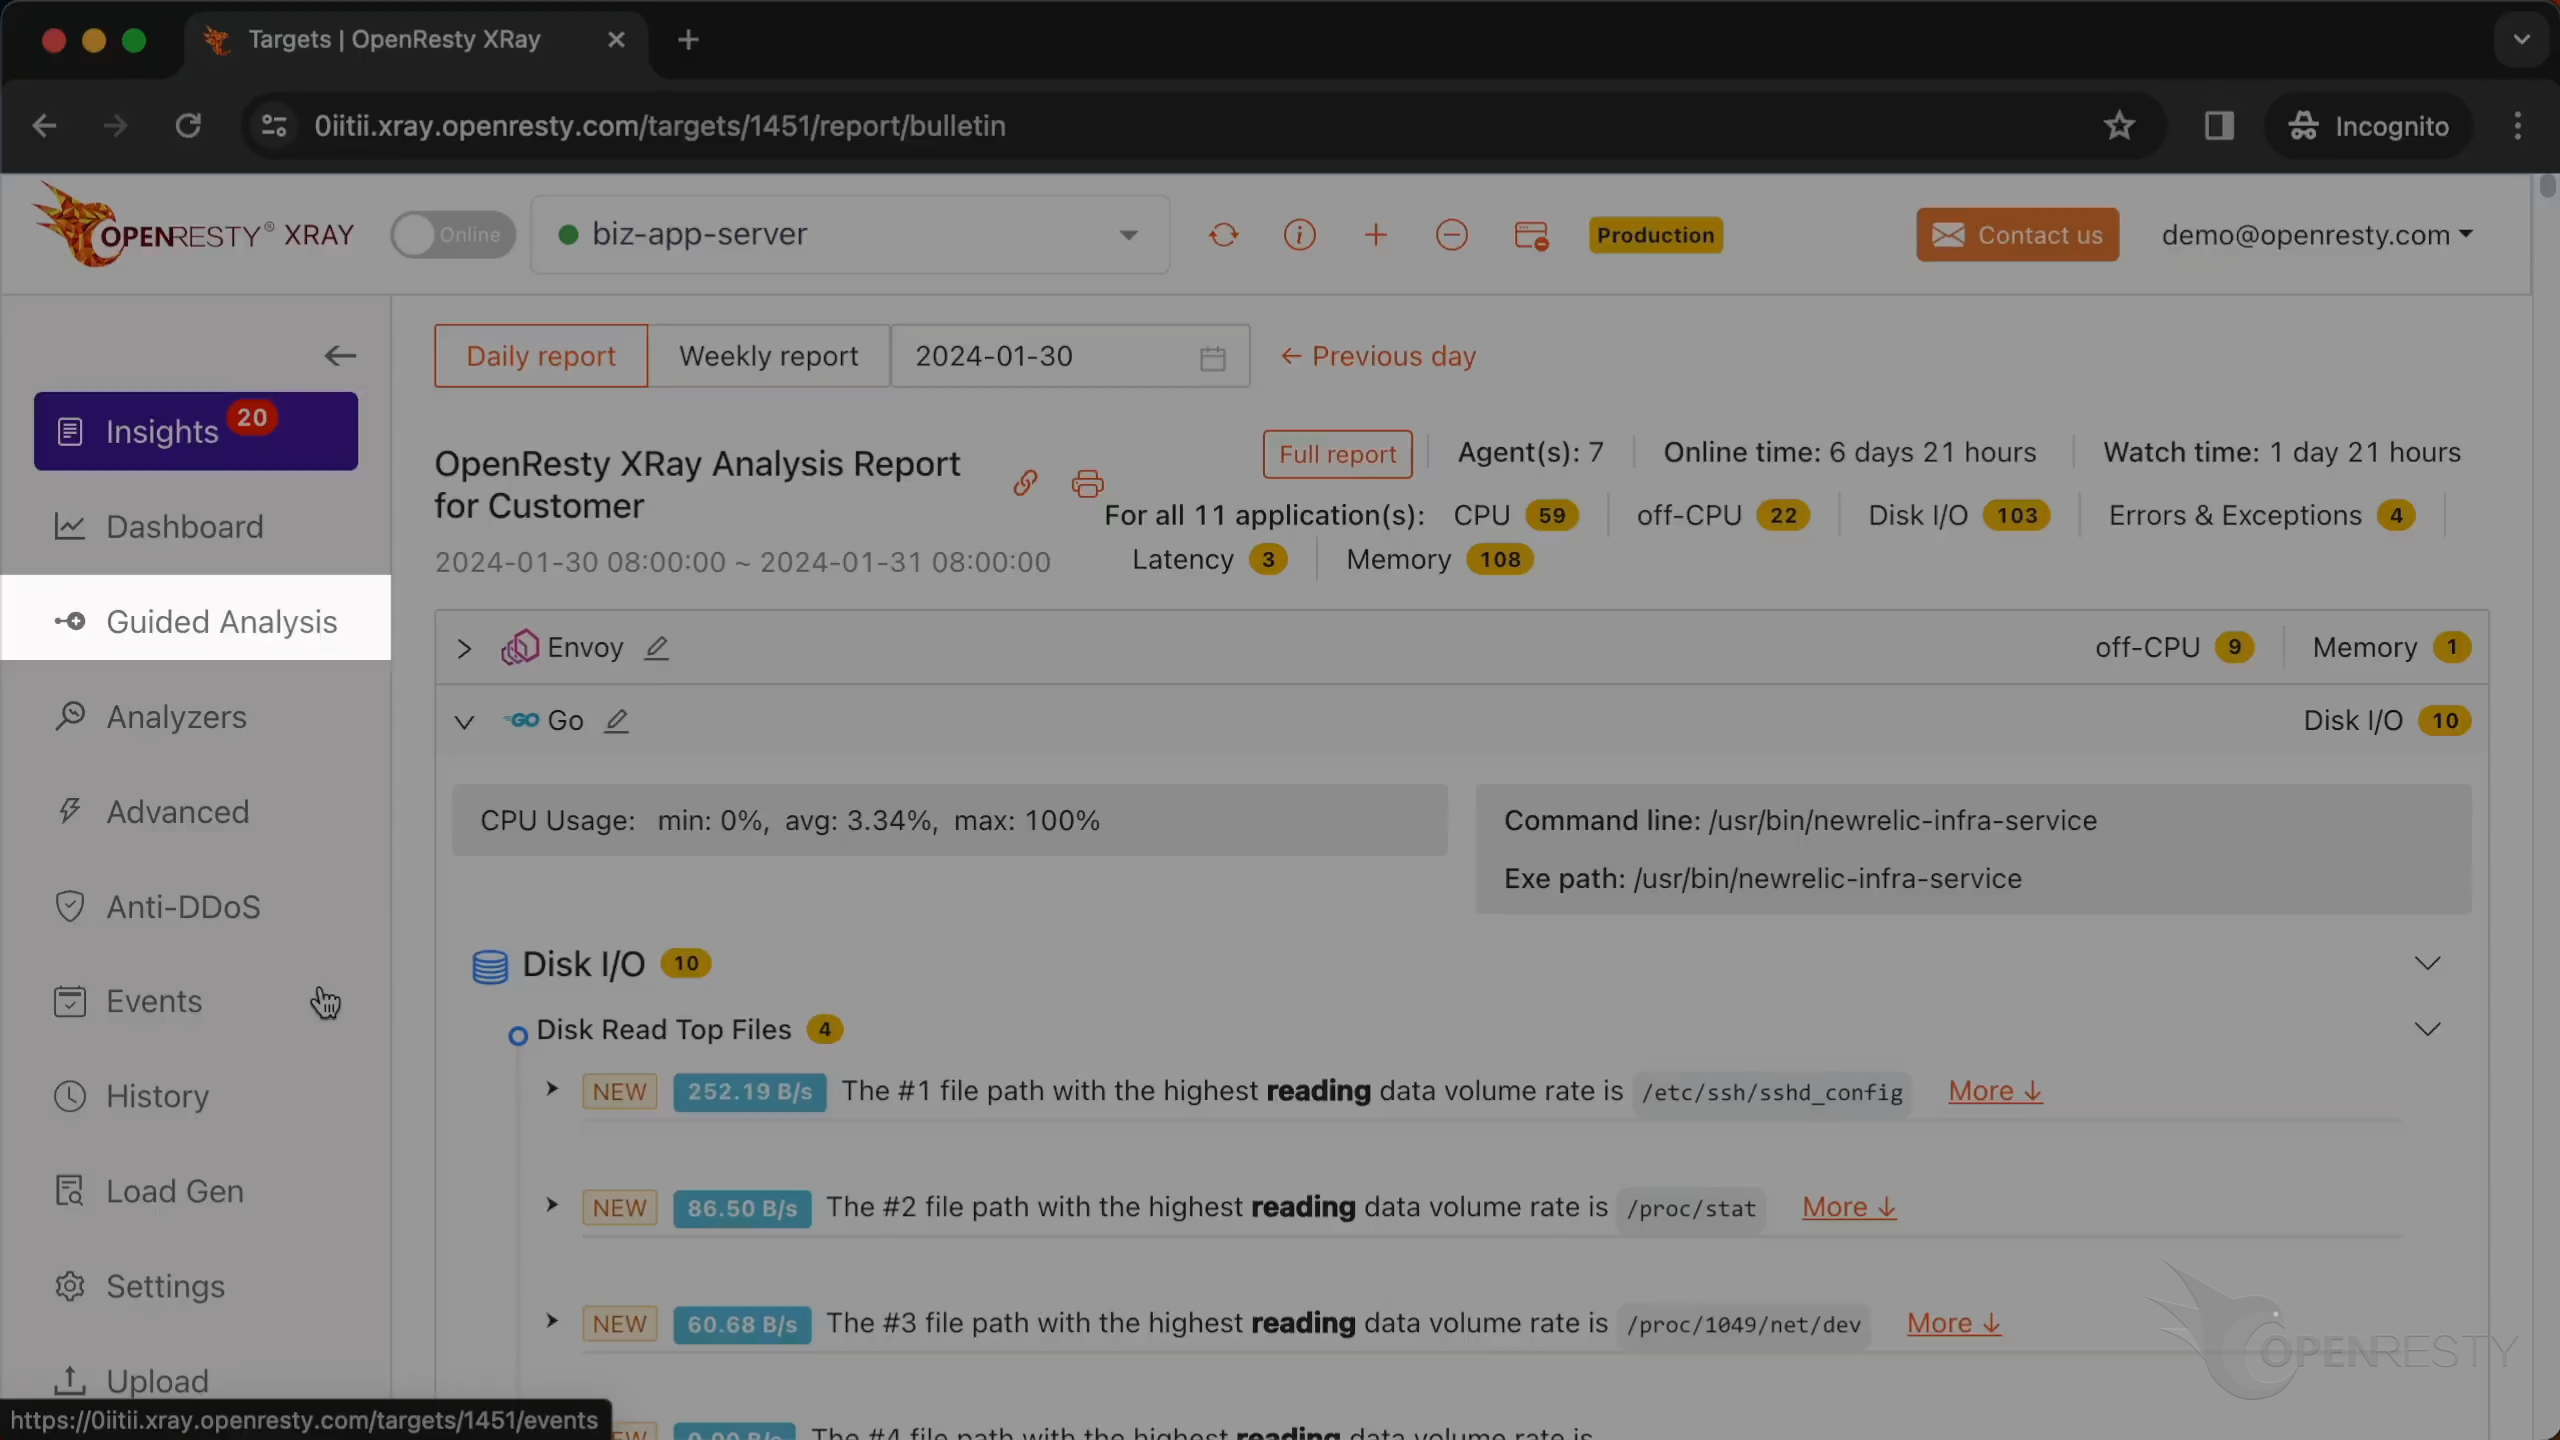
Automatic analysis and reports
OpenResty XRay can also monitor online processes automatically and generate analysis reports.
Go to the “Insights” page.
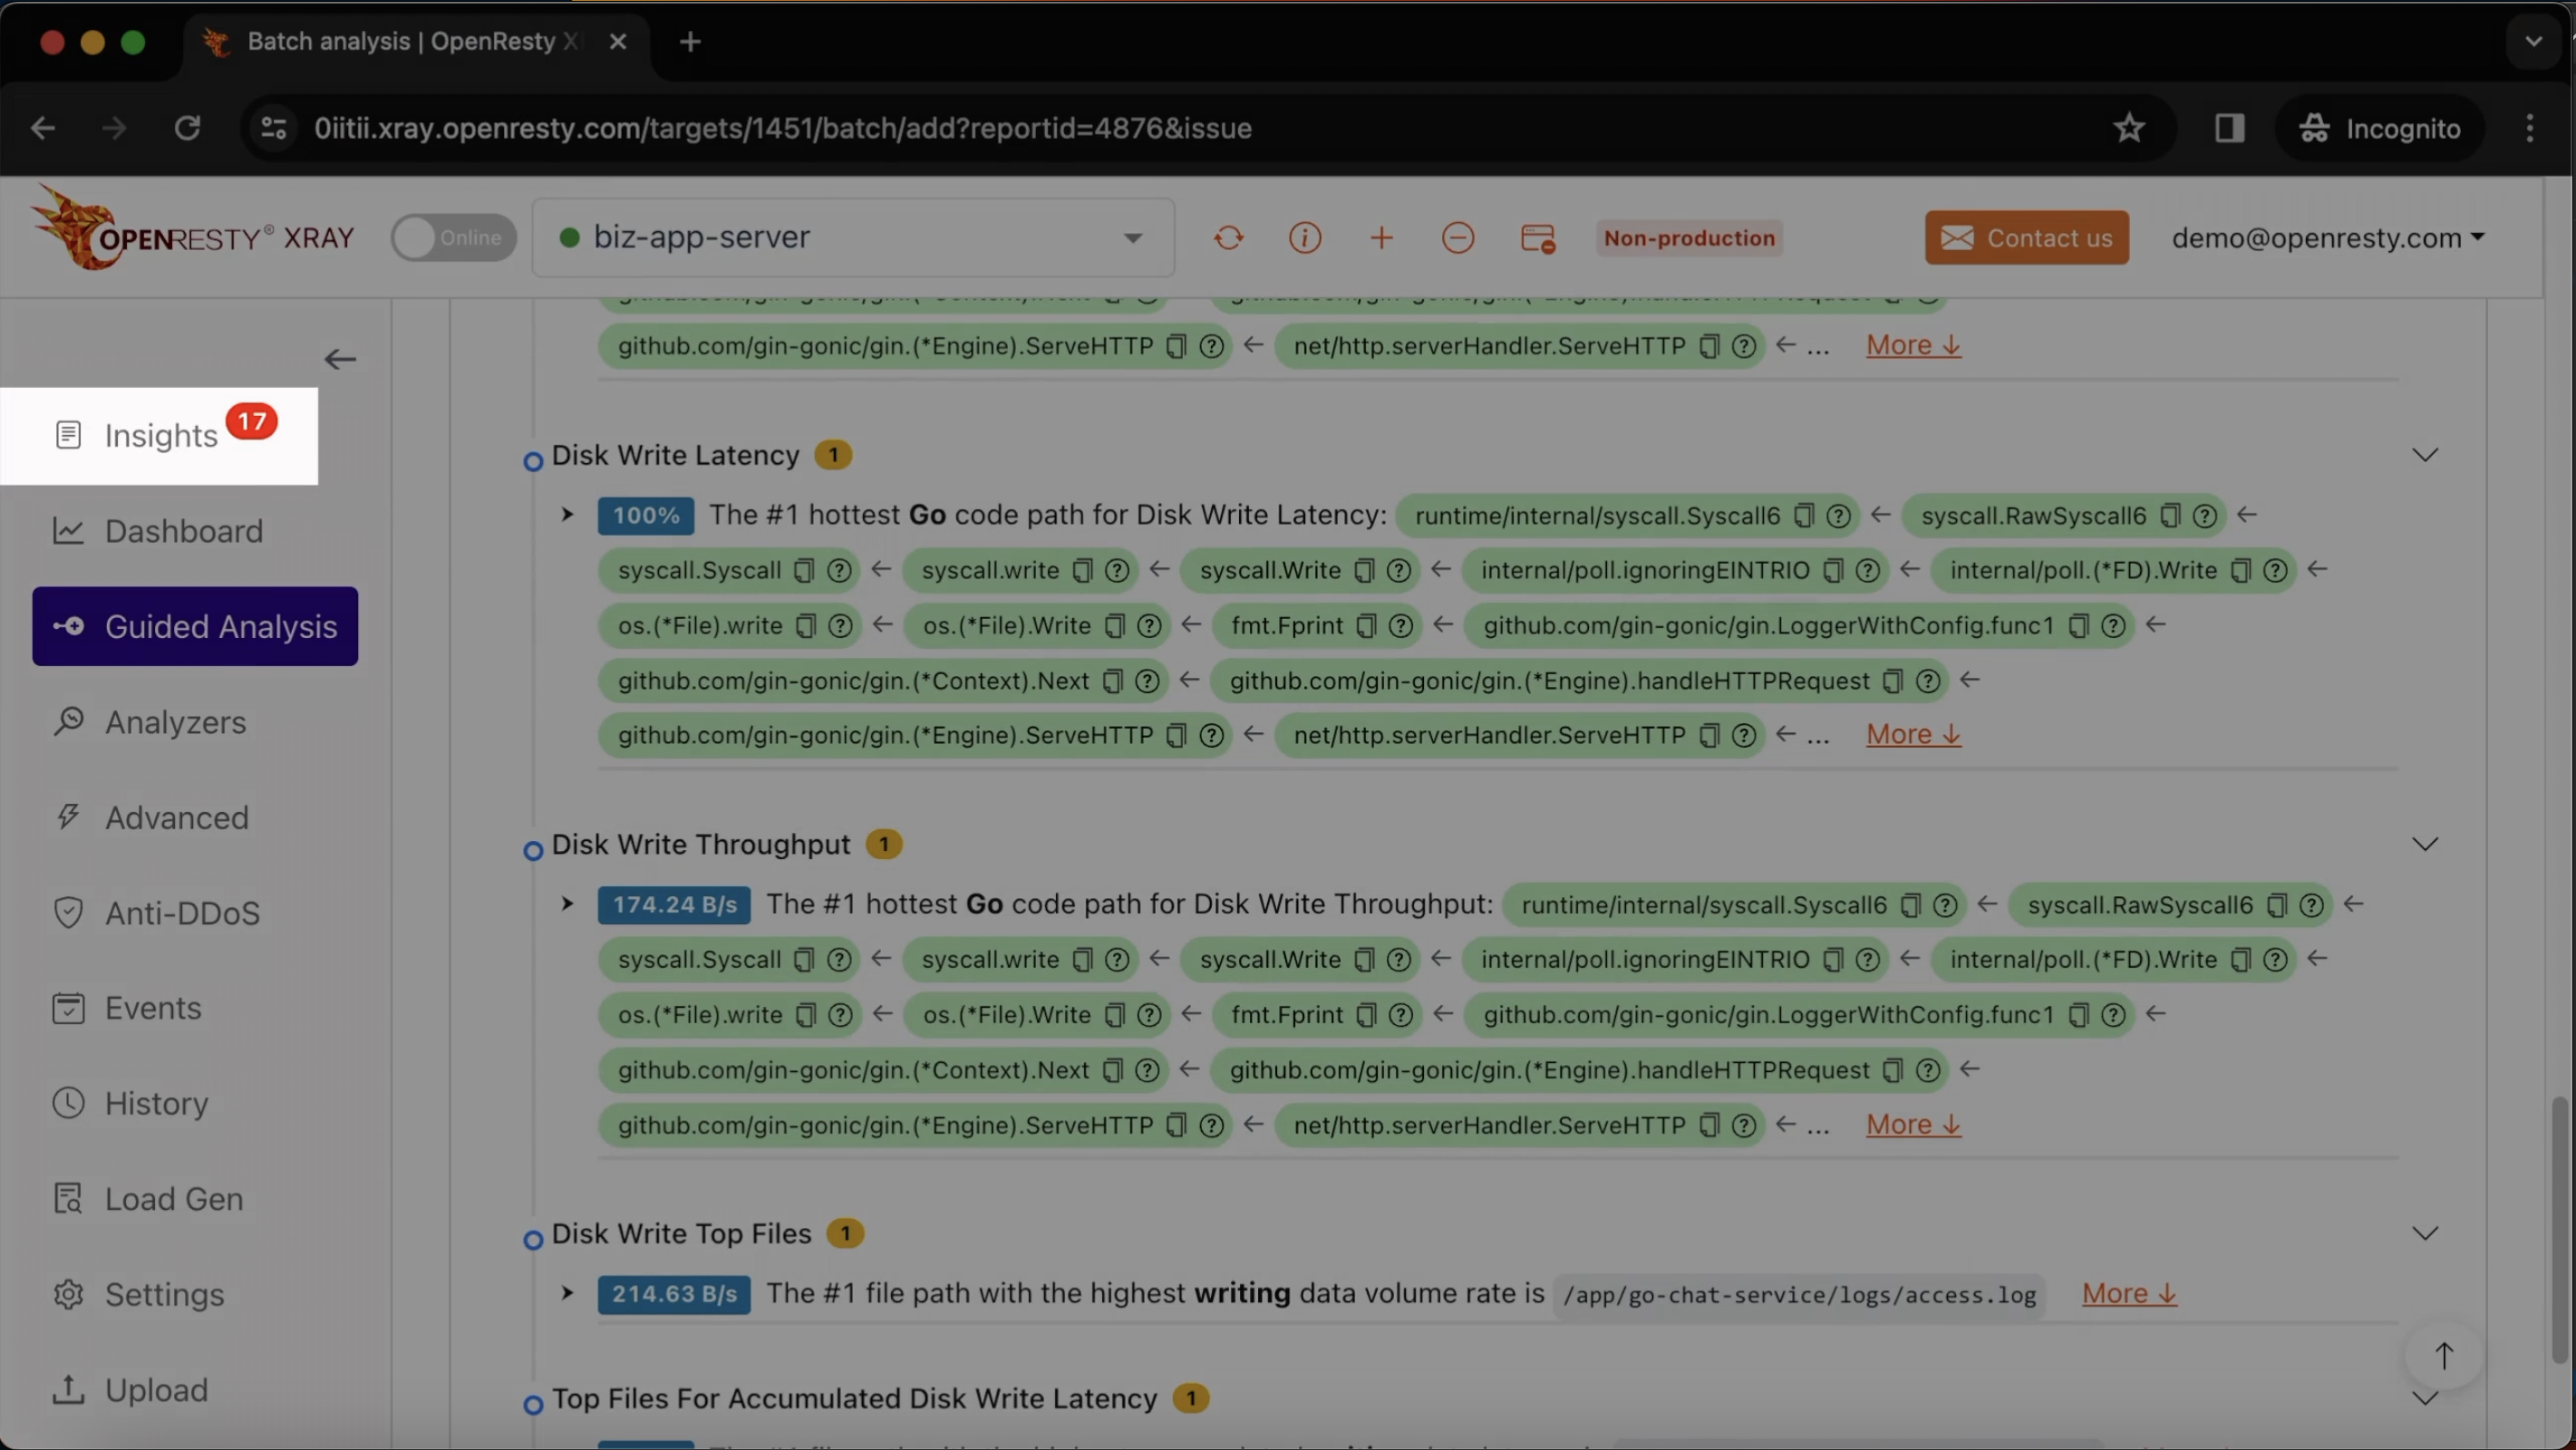
You can find the automatic reports on the “Insights” page for daily and weekly periods.
For this reason, you don’t have to use the Guided Analysis feature.
Guided analysis is useful for application development and demonstration purposes.
What is OpenResty XRay
OpenResty XRay is a dynamic-tracing product that automatically analyzes your running applications to troubleshoot performance problems, behavioral issues, and security vulnerabilities with actionable suggestions. Under the hood, OpenResty XRay is powered by our Y language targeting various runtimes like Stap+, eBPF+, GDB, and ODB, depending on the contexts.
If you like this tutorial, please subscribe to this blog site and/or our YouTube channel. Thank you!
About The Author
Yichun Zhang (Github handle: agentzh), is the original creator of the OpenResty® open-source project and the CEO of OpenResty Inc..
Yichun is one of the earliest advocates and leaders of “open-source technology”. He worked at many internationally renowned tech companies, such as Cloudflare, Yahoo!. He is a pioneer of “edge computing”, “dynamic tracing” and “machine coding”, with over 22 years of programming and 16 years of open source experience. Yichun is well-known in the open-source space as the project leader of OpenResty®, adopted by more than 40 million global website domains.
OpenResty Inc., the enterprise software start-up founded by Yichun in 2017, has customers from some of the biggest companies in the world. Its flagship product, OpenResty XRay, is a non-invasive profiling and troubleshooting tool that significantly enhances and utilizes dynamic tracing technology. And its OpenResty Edge product is a powerful distributed traffic management and private CDN software product.
As an avid open-source contributor, Yichun has contributed more than a million lines of code to numerous open-source projects, including Linux kernel, Nginx, LuaJIT, GDB, SystemTap, LLVM, Perl, etc. He has also authored more than 60 open-source software libraries.
Related Articles
OpenResty XRay Jan 16, 2024
")
OpenResty XRay Aug 12, 2024
")
OpenResty XRay May 24, 2024
")
OpenResty XRay Dec 7, 2023

OpenResty XRay Sep 27, 2023
")


")
")
")

")