Flame Graphs: How to Read a CPU Flame Graph and Find the Code Burning Your CPU
A flame graph is a visualization of stack-trace samples that shows where a program spends CPU time. Invented by Brendan Gregg in 2011, it stacks sampled function calls bottom-to-top so you can read a program’s hottest code paths in seconds. Every flame graph follows four rules: width is a function’s share of samples, not duration; the y-axis is stack depth; the top edge is where the CPU is actually on-CPU (the opposite—the bottom edge—for root-at-top renderings); and the x-axis is alphabetical, not time. If you remember nothing else, remember those four.
The moment you need this graph usually looks like this: an alert fires, top shows some process pinned at 100% CPU, and then… nothing. top can tell you which process is burning CPU, but not the thing you actually need—which function, which file, which line. That is the step a flame graph fills in: it takes troubleshooting from the process level down to the line level. This article gives you the four reading rules and the common shapes first, then walks you through three real production cases (PHP, Go, Erlang), from a real flame graph all the way to the culprit line.
How to Read a Flame Graph
Most guides tell you a flame graph “shows CPU usage.” That is true and useless. Here is what you actually need to read one.
The Four Rules
1. Width = share of samples, not duration. A box spanning 40% of the graph means that function appeared in 40% of stack-trace samples. It does not mean the function ran for 40% of clock time. In practice the distinction rarely matters for CPU profiles, but it matters a lot when someone asks “why is this box wider on Tuesday’s graph?"—the answer is sample count, not wall clock.
2. The y-axis is stack depth. Bottom is the entry point (main, start_thread, the runtime’s bootstrap). Top is the leaf function where the CPU was actually executing. Every box between is a caller in the chain.
3. The top edge is on-CPU. If you want to know what is burning your CPU, look at the top of the graph. The widest boxes at the top edge are the functions directly executing on the CPU. Everything below them is “how we got here.” Watch the rendering direction: a classic flame graph has the root at the bottom and flames growing up; many modern tools (including OpenResty XRay, used in this article’s cases) render with the root at the top and leaves growing down—and this rule then mirrors to the bottom edge. The data is identical either way; see the variants section later.
4. The x-axis is alphabetical, not time. This is the single most common misreading. A flame graph is not a timeline. The horizontal ordering is alphabetical (or by address) so that identical stack frames merge into one wider box. Two boxes side-by-side do not mean “A happened, then B happened.” For example, decode appearing to the left of encode does not mean decoding ran before encoding—the letter d just sorts before e.
What the Shapes Tell You
Once you internalize the four rules, reading a flame graph becomes shape recognition:
Plateau (a wide, flat top): one function dominates CPU. This is the easiest pattern—look at what the plateau function does, and you have your bottleneck. In the PHP example below,
preg_matchis exactly this kind of bottleneck—the accompanying report shows the path with it as the leaf accounts for 56.2% of CPU.Tower (a tall, narrow spike): a deep call stack that fires rarely. Towers are usually not your problem unless several cluster into a wide base. A single tower in a flame graph full of plateaus is noise.
Hair (many thin spikes along the top edge): short-lived calls that each appear in only a few samples—kernel interrupts, timer ticks, signal handlers. Hair is normal. If hair is wide, you have an interrupt storm, not an application bug.
Flat base, spiky top: your framework or runtime (the base) is healthy; the variance is in application-level code (the spikes above). Start reading from where the base breaks into branches. The PHP example below is exactly this—every framework layer is equally wide, and the hotspot lives in deeper business code.
You do not need to memorize these shapes; you will match all of them against the three cases in the “Three Real Cases” section below: PHP is a deep base, Erlang is a leaf-end branch. Look at real graphs first, and the shapes internalize themselves.
Self vs. Total
Every box in a flame graph has two quantities: total is its full width—it includes all the functions it calls; self is the fraction of samples where that function sits at the top of the stack (i.e., no callee was sampled above it). Profilers also commonly write these as “self time” and “total time,” but in a sampling flame graph that “time” is inaccurate—as with Rule 1, the underlying quantity is a sample count/share, not wall clock. Go’s pprof calls them flat (self) and cum (cumulative, i.e., total), which is more apt: no “time” in the name. (Chrome DevTools does call them “Self Time”/“Total Time,” but that is because it produces a flame chart, where the x-axis really is time—see the variants section later.)
A function with large total but tiny self is a dispatcher: it is not burning CPU itself, it is just routing work to the children below it.
When your profiler lets you sort by self (flat in pprof), do it. The functions with the highest self are the ones the CPU is actually running—these are your optimization targets.
Three Real Cases: From Flame Graph to Culprit Line
The rules and shapes above are the vocabulary; real cases are what teach judgment. The three below come from profiling live, running processes with dynamic tracing—no code changes, no restarts. Two things to state up front: the flame graphs OpenResty XRay renders are root-at-top, leaves-at-bottom (the icicle orientation described later), and they highlight the hottest backtrace in red—so read the graphs below by looking at the bottom and the red path; the percentages in each case come from the code-path report generated by the same analysis run as the flame graph. Each case follows the same three-step read: what you see → how you recognize it → what it means.
Example 1: PHP preg_match — 56.2% CPU on Regex in a Loop
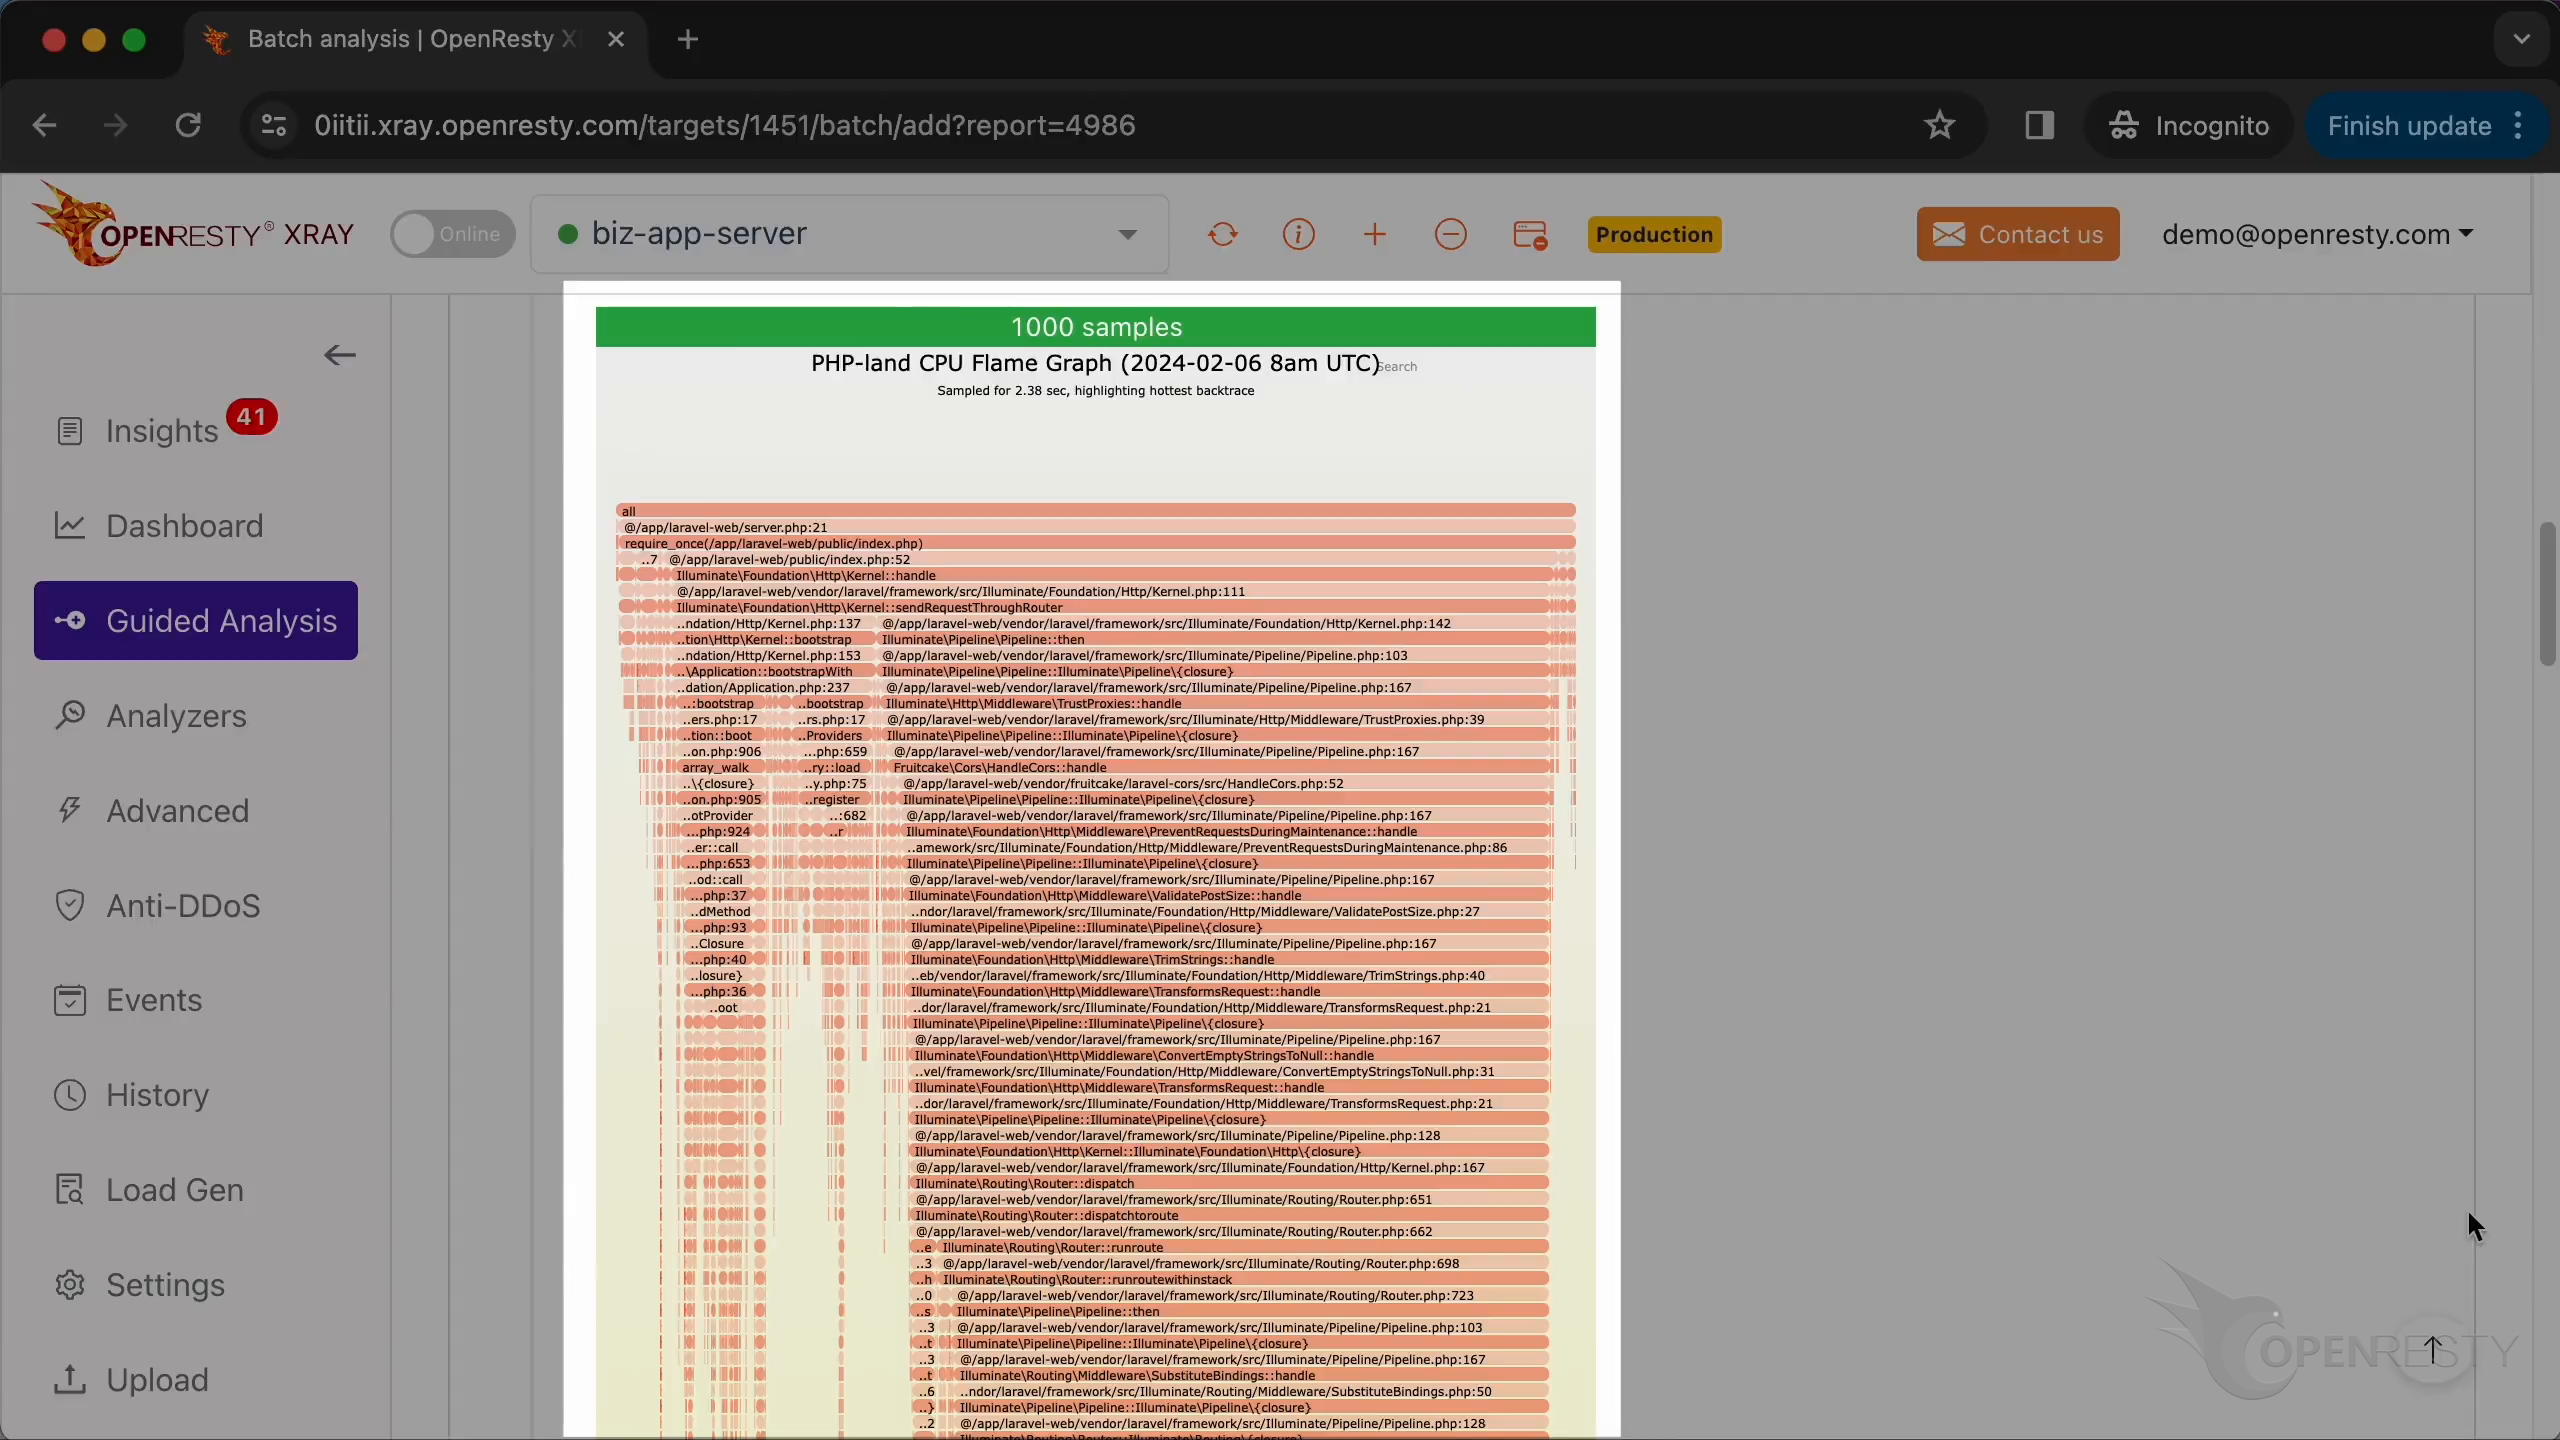
What you see: A root-at-top PHP-level flame graph. The visible part is Laravel’s bootstrap and middleware chain—from server.php through Kernel::handle to the Pipeline middleware, passed down layer by layer, each layer nearly equal in width. This is the “deep base” shape: the framework itself does not burn CPU, it just passes the request along, and the real hotspot is in business code deeper down the call chain.
How you recognize it: Each layer of the base is nearly equal in width, which tells you the CPU is not being split up at the framework level; follow the widest single chain downward and you reach the business function. The accompanying code-path report gives the answer directly: the #1 hottest PHP path has preg_match as its leaf, reached through Laravel’s callAction into processOrders, at 56.2% of CPU time—and the leaf is where the CPU burns.
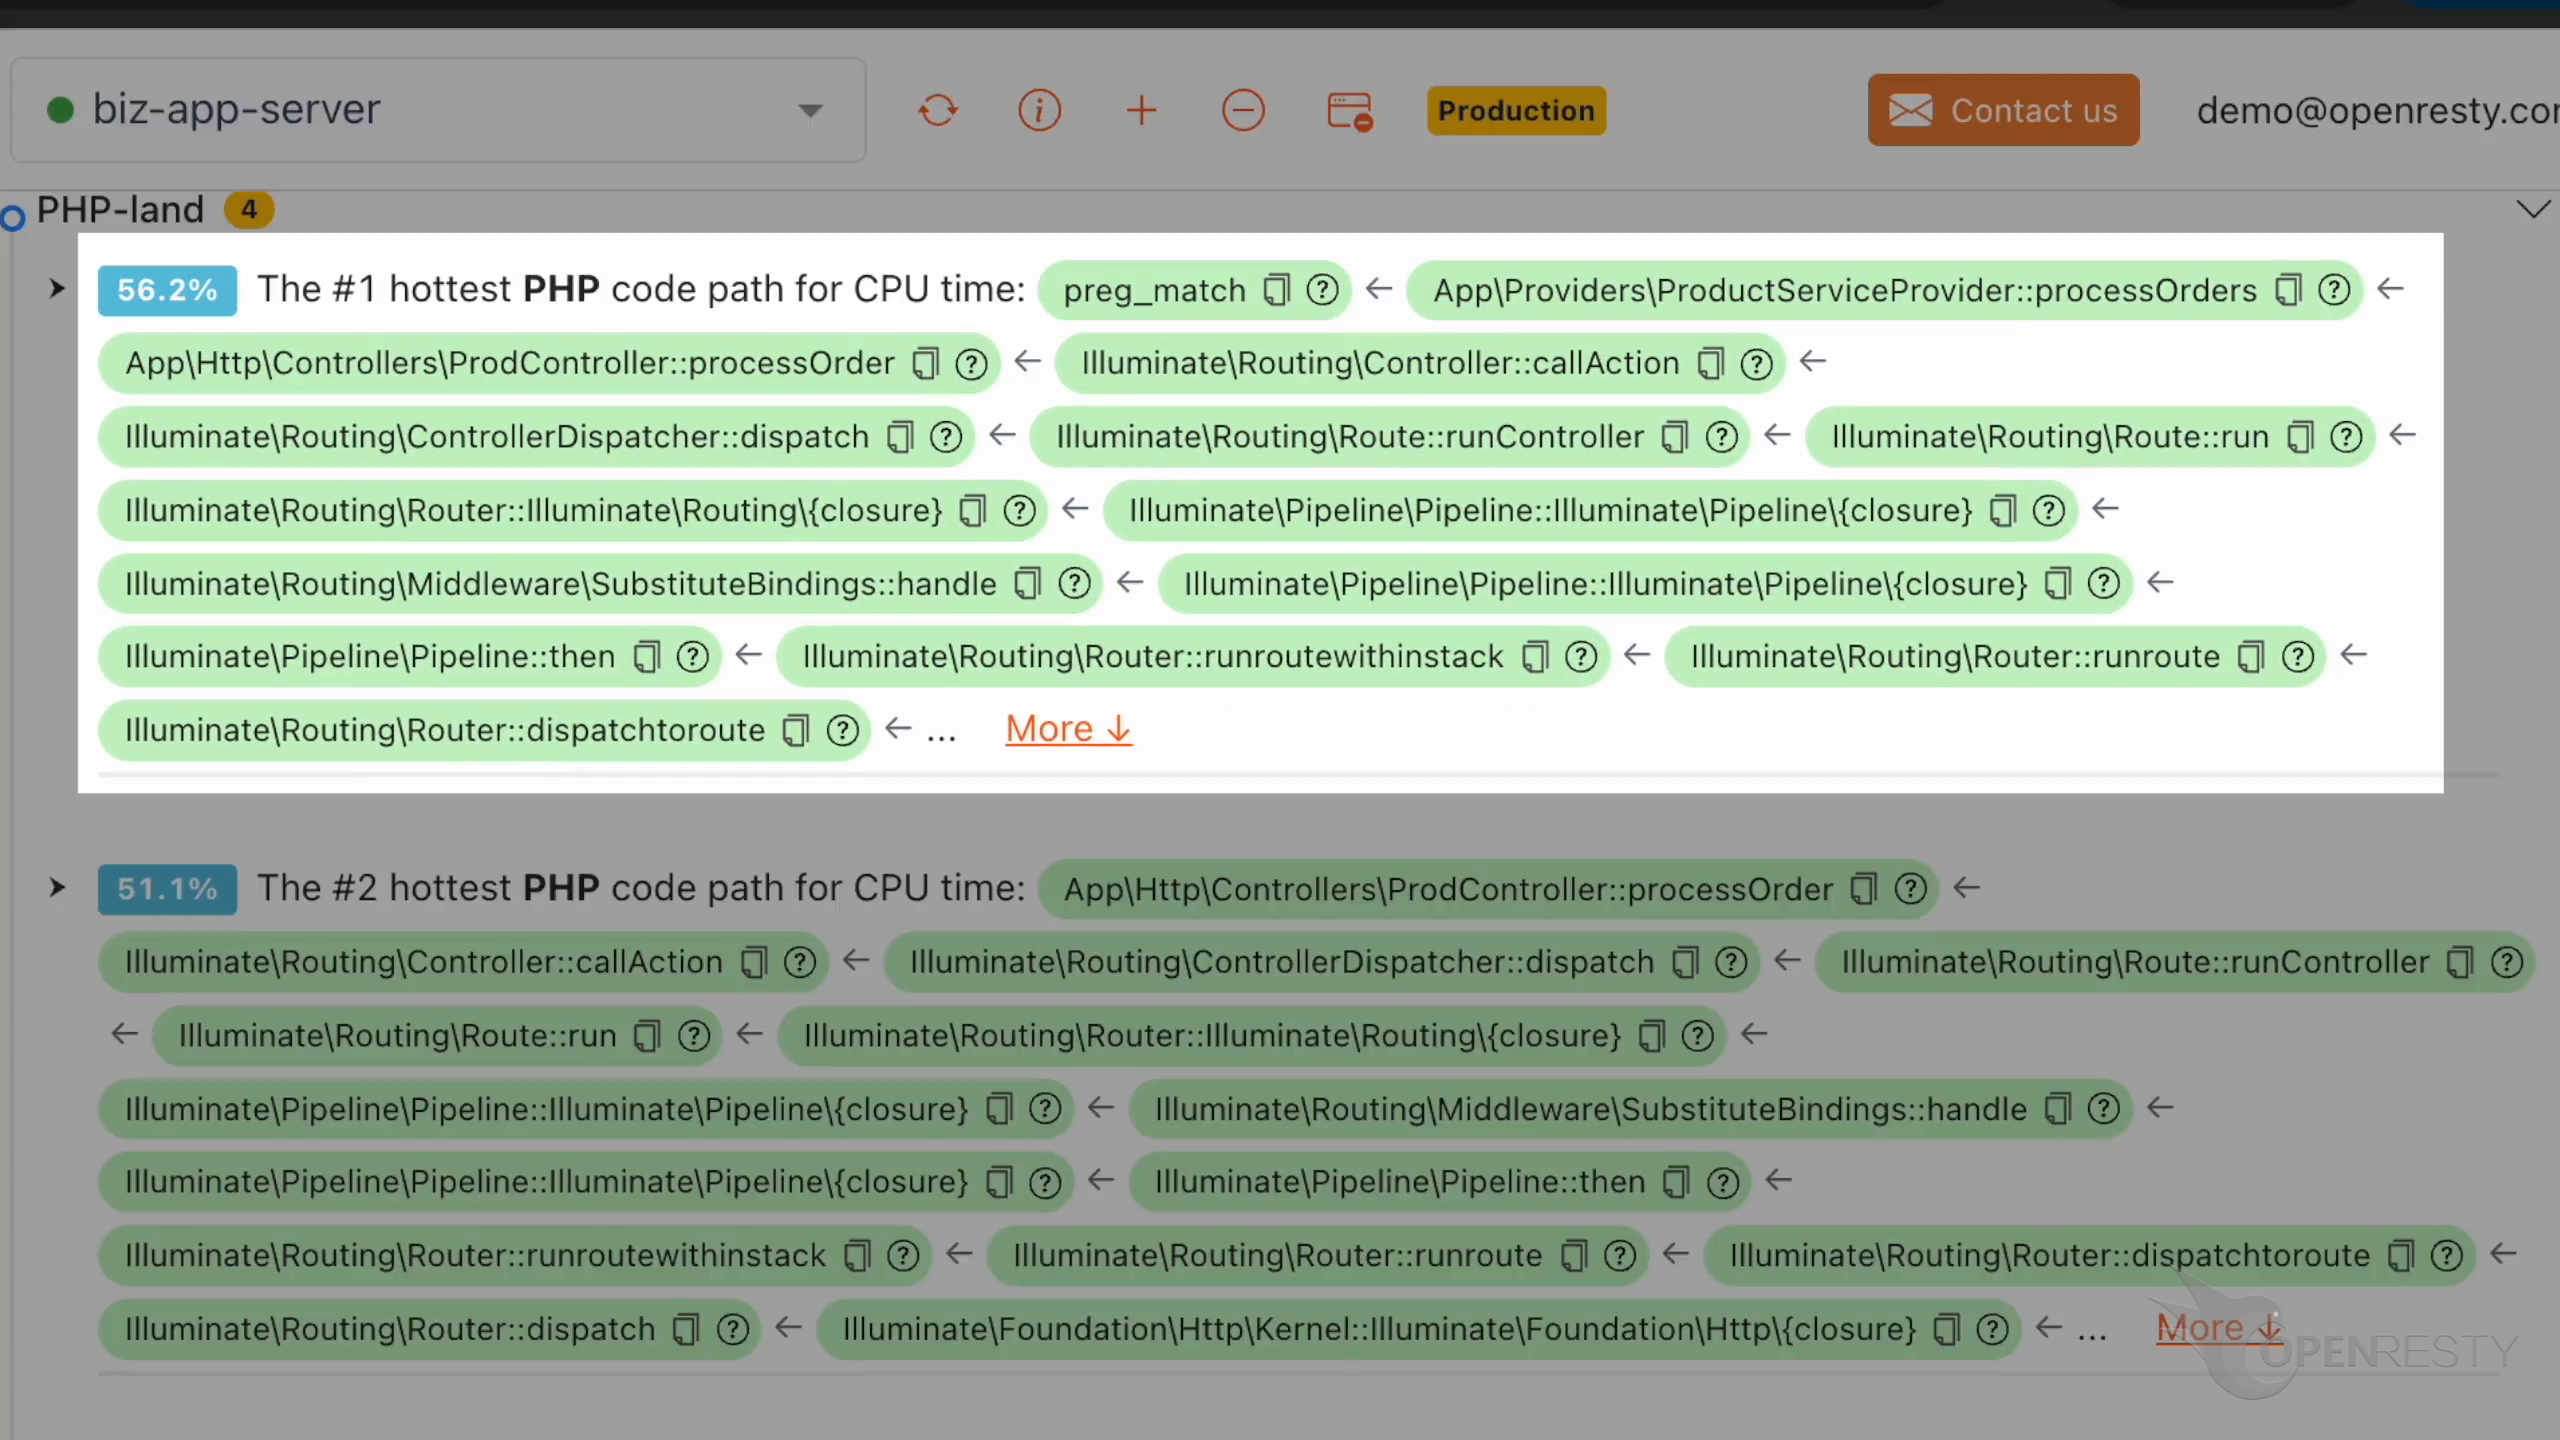
What it means: A loop in processOrders (line 437 of ProductServiceProvider.php) is repeatedly matching the same regular expression, paying the cost of a PCRE match on every iteration. The fix, straight from the source case: precompile the regex and reuse it, so it is not rebuilt on each iteration.
The C-level code-path report for the same process confirms this conclusion:
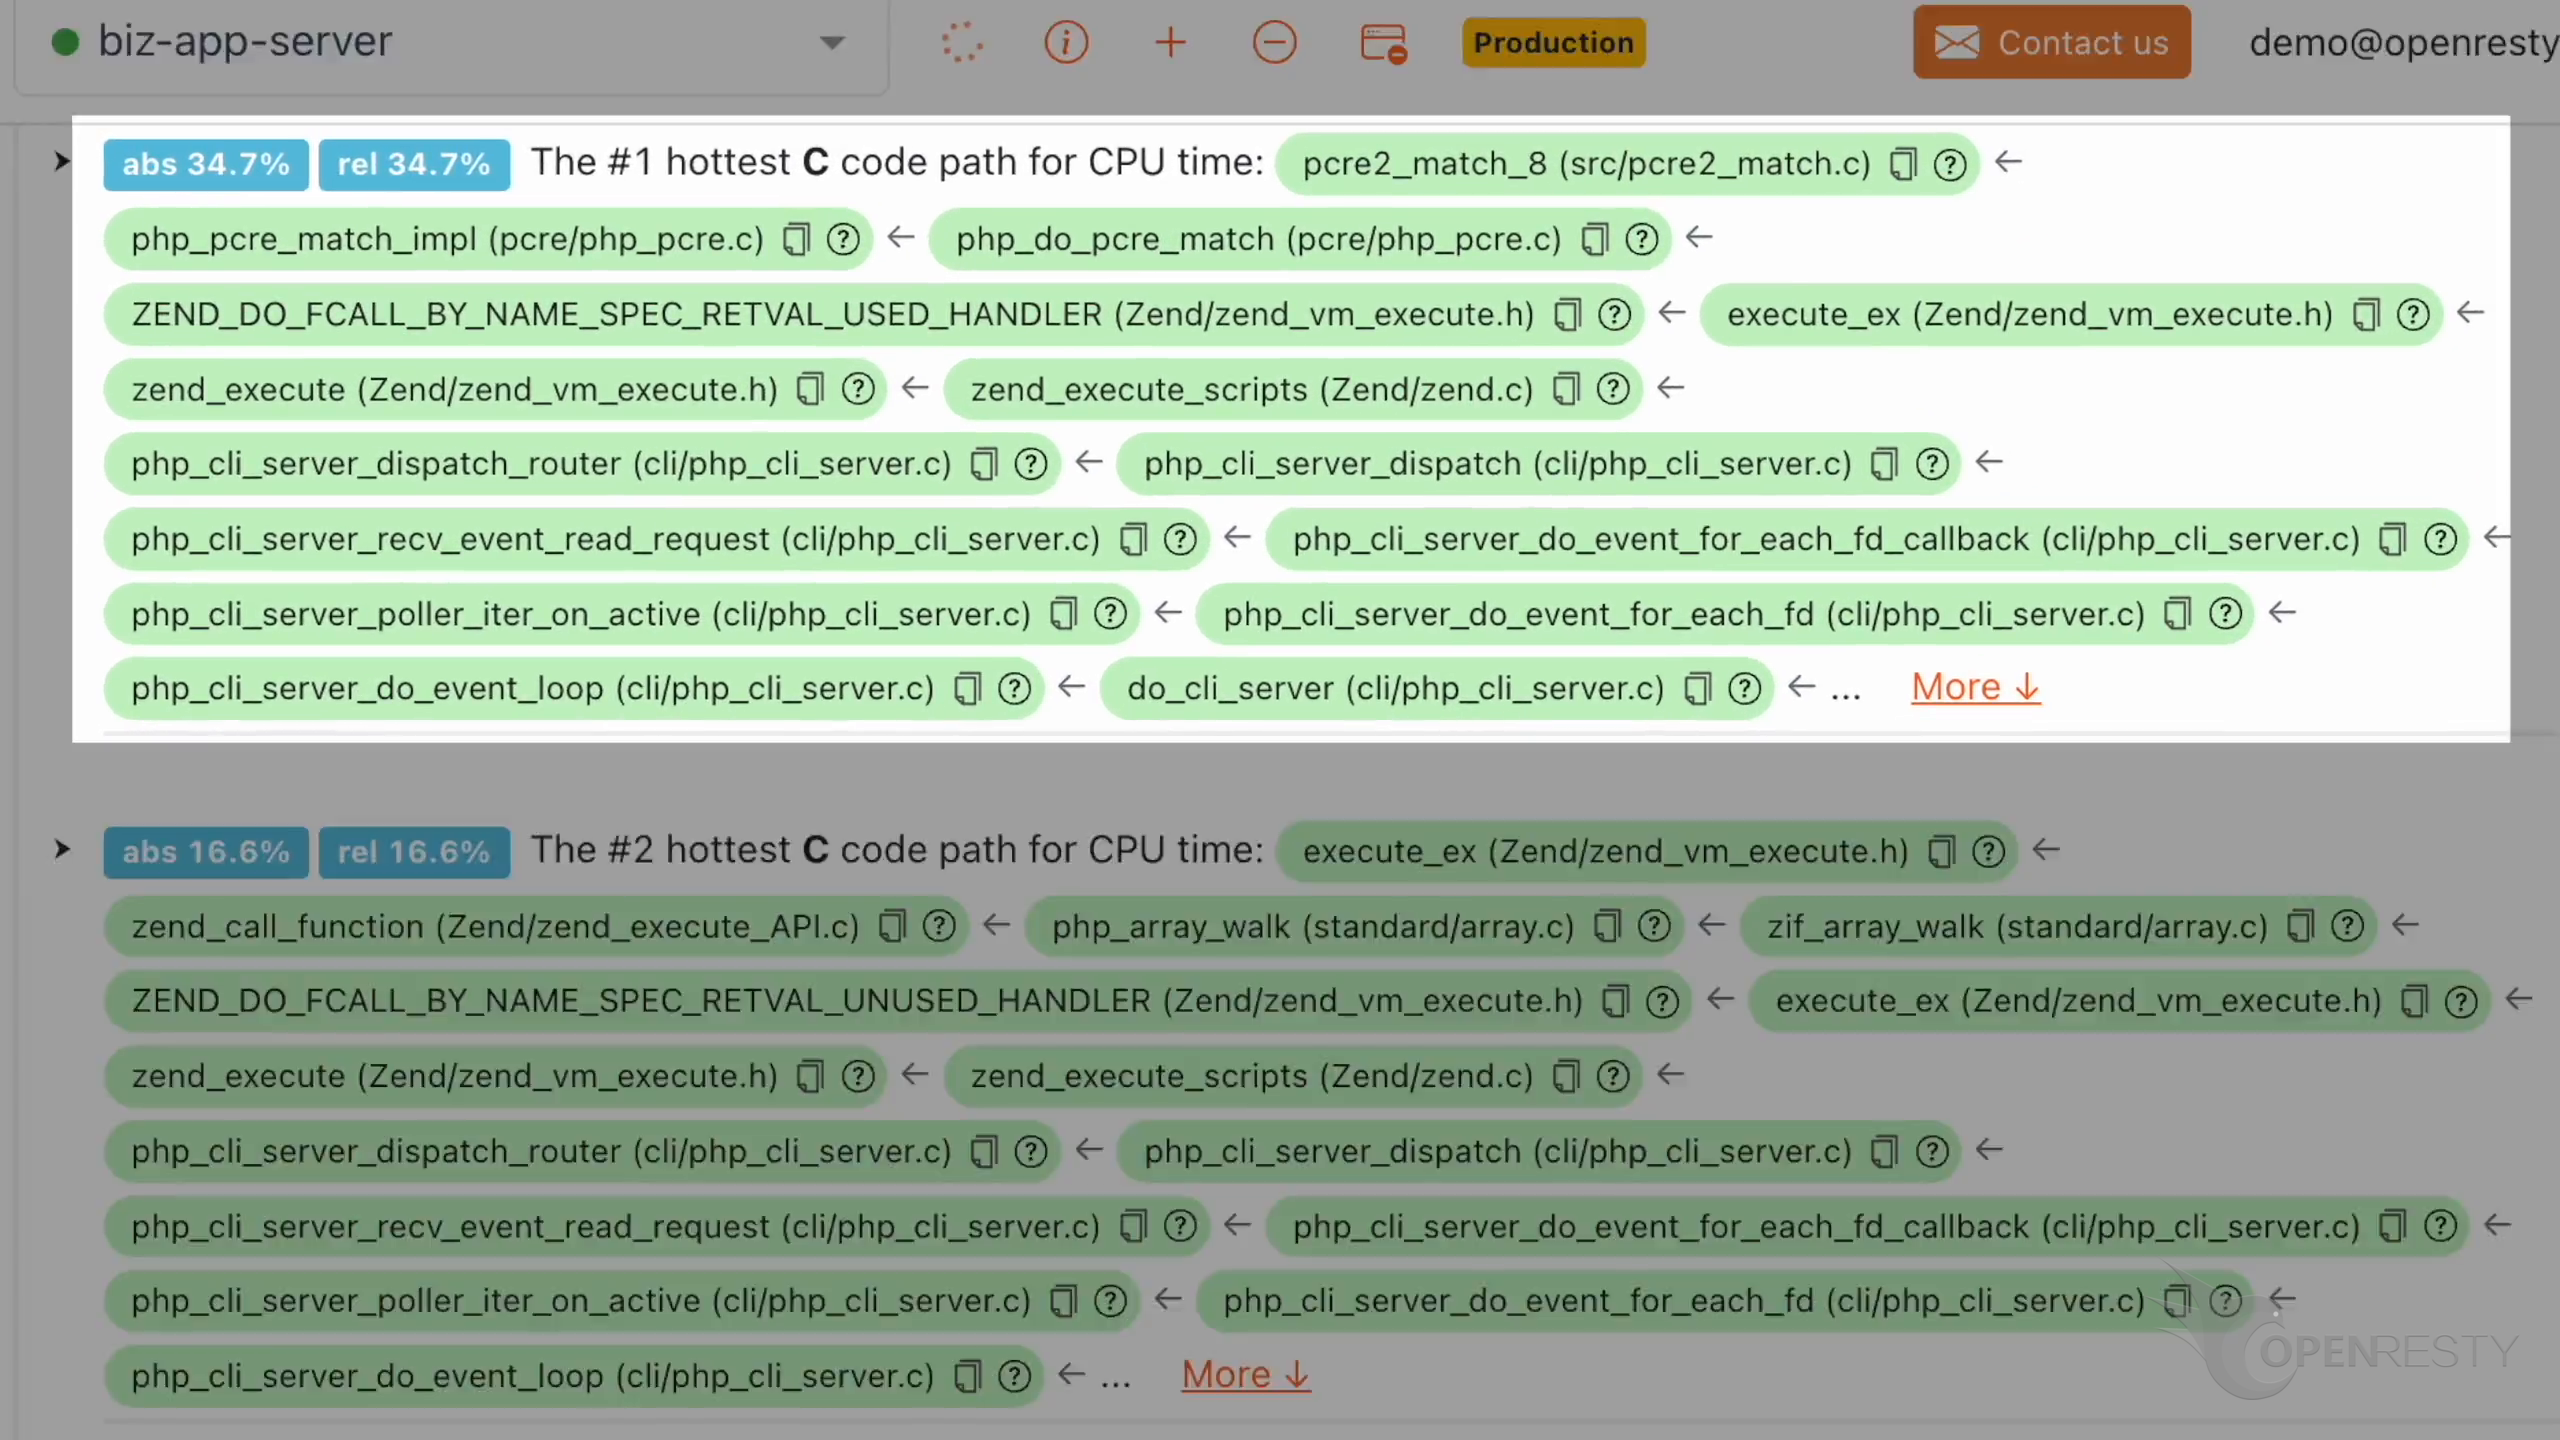
pcre2_match_8 is the hottest C function at 34.7%, called through php_pcre_match_impl. When two language levels point at the same bottleneck, you can be confident the diagnosis is right.
Full walkthrough: PHP High CPU: Find the Hottest Code Path
Example 2: Go regexp.MustCompile — 36.8% CPU on Regex Compilation
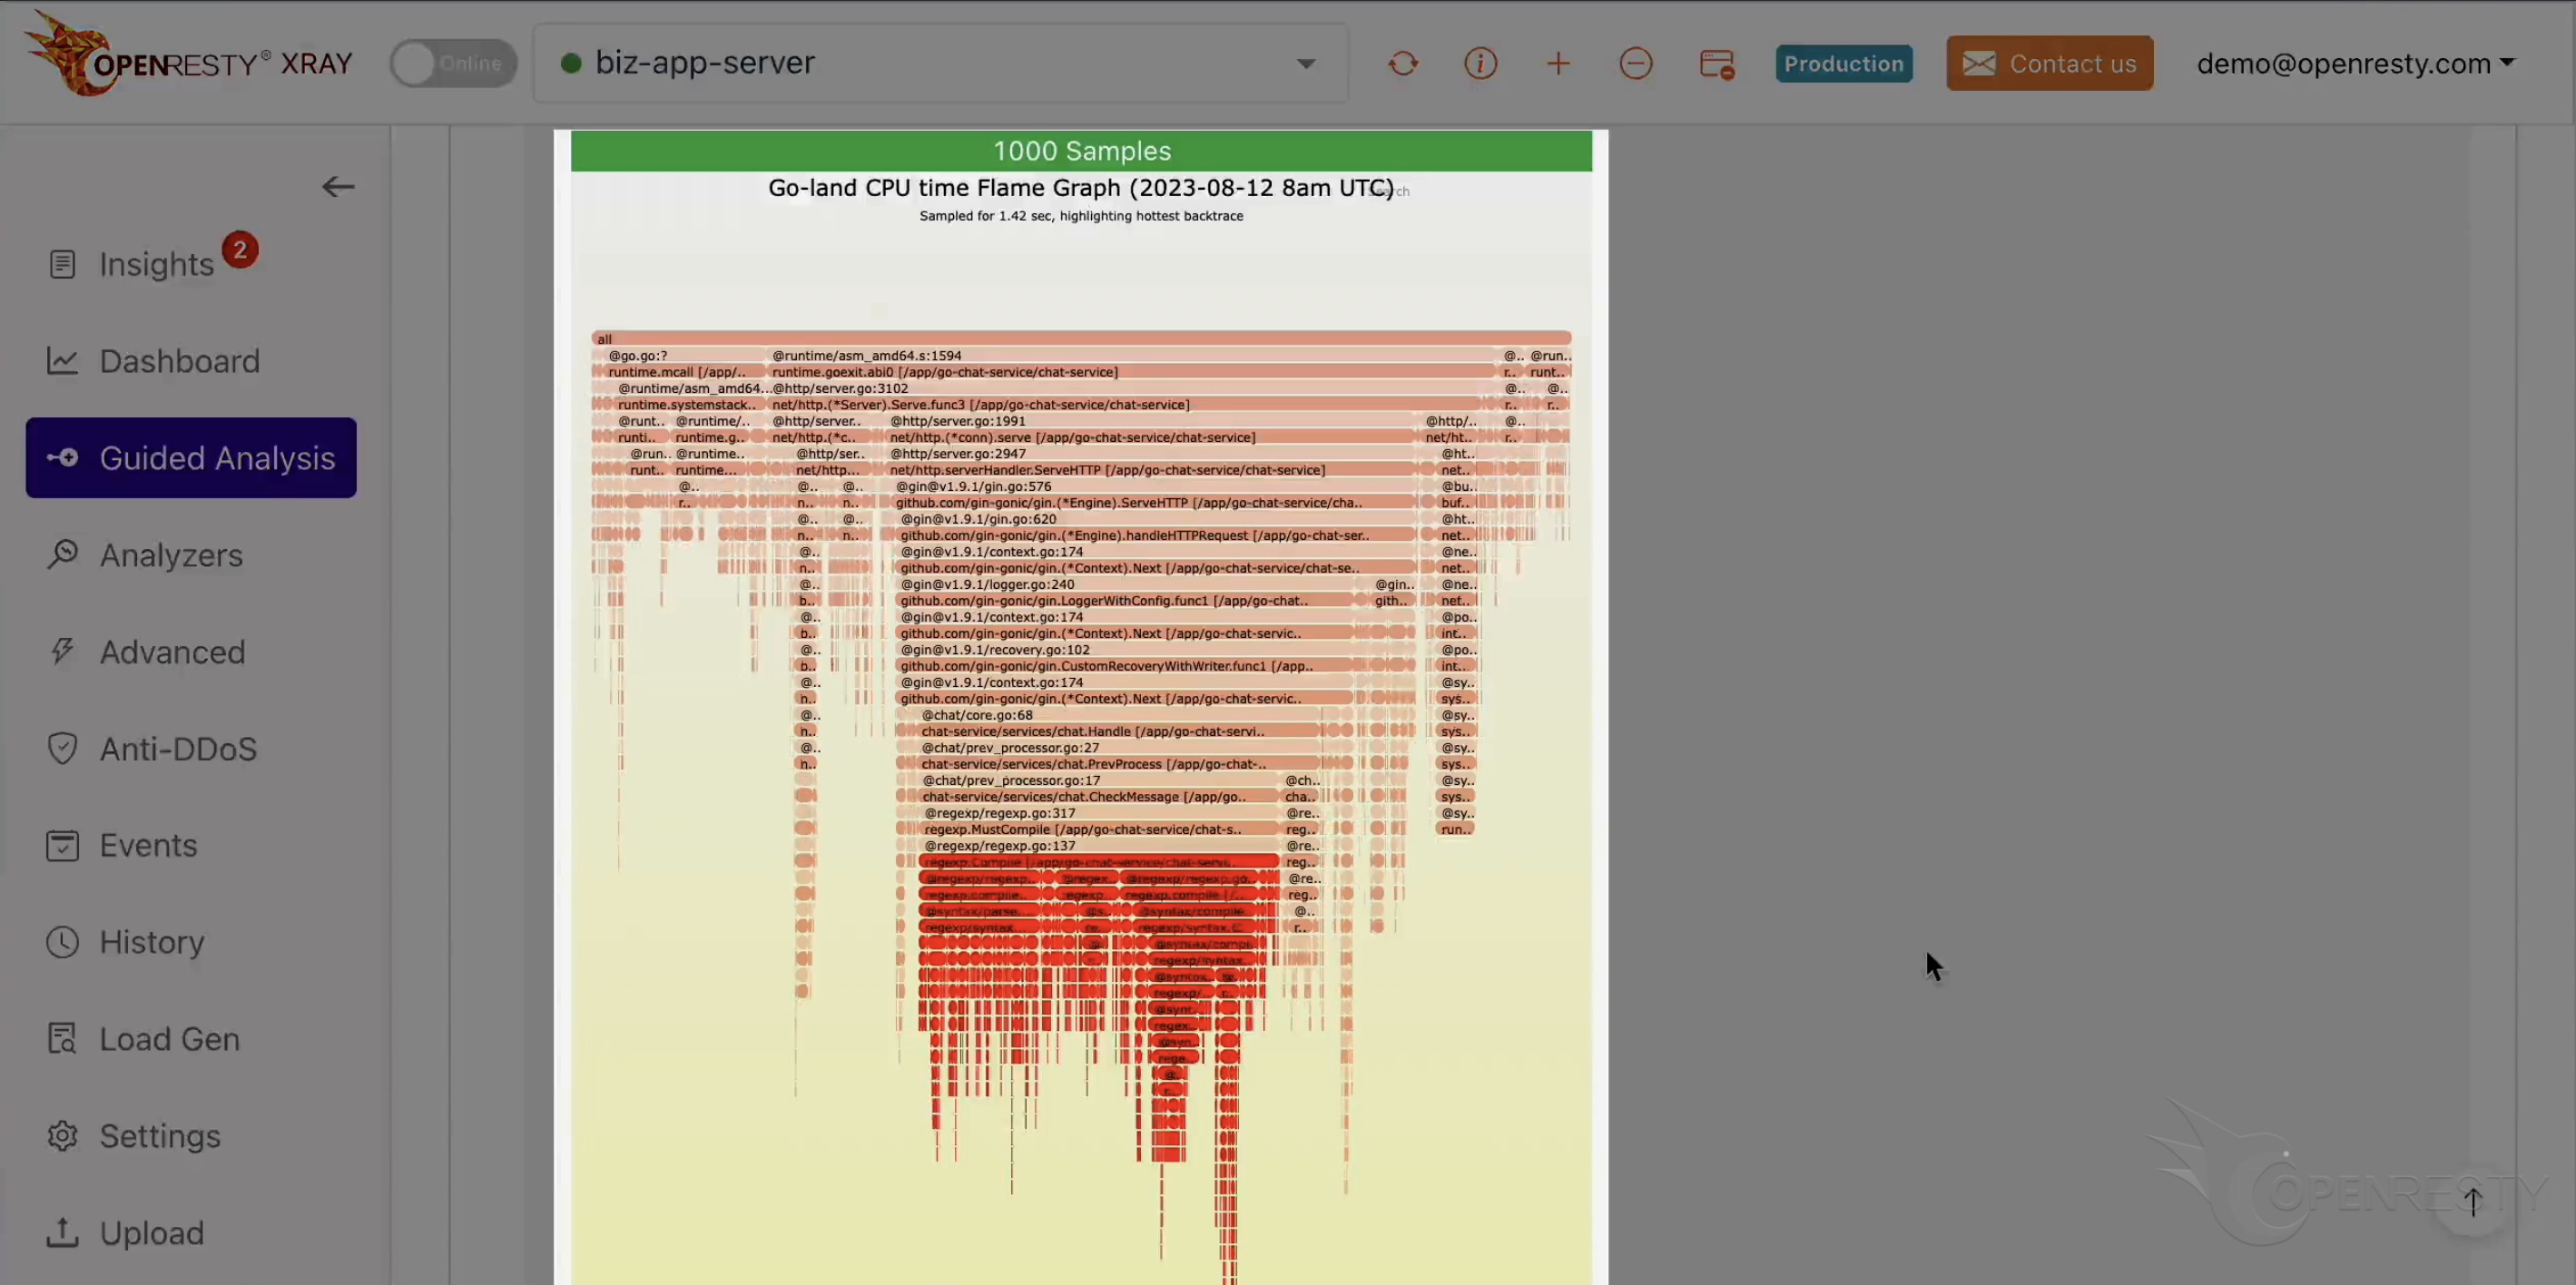
What you see: A root-at-top Go-level flame graph with the hottest backtrace highlighted in red: the HTTP handling chain goes through chat.Handle to CheckMessage at prev_processor.go line 17, then into regexp.MustCompile, below which a whole swath of red regexp/syntax compilation calls fans out. The accompanying report shows this regex-compilation path at 36.8% of CPU time.
How you recognize it: Follow the red highlight to the leaf end, and the function names tell a different story: this is not regex matching (execution)—it is regex compilation (building the automaton). Compilation is far more expensive than matching, and doing it in a hot path is a classic Go mistake.
What it means: CheckMessage at prev_processor.go line 17 runs regexp.MustCompile on every call. The standard practice is to compile each regex once and reuse the result—for example, initialized in a package-level variable. Move the compilation out of the hot path and this 36.8%-of-CPU compilation chain disappears.
Full walkthrough: Go High CPU: Regex Compilation Consuming 36.8% of CPU
Example 3: Erlang erts_pcre_exec — PCRE Backtracking in a lists:filter Loop
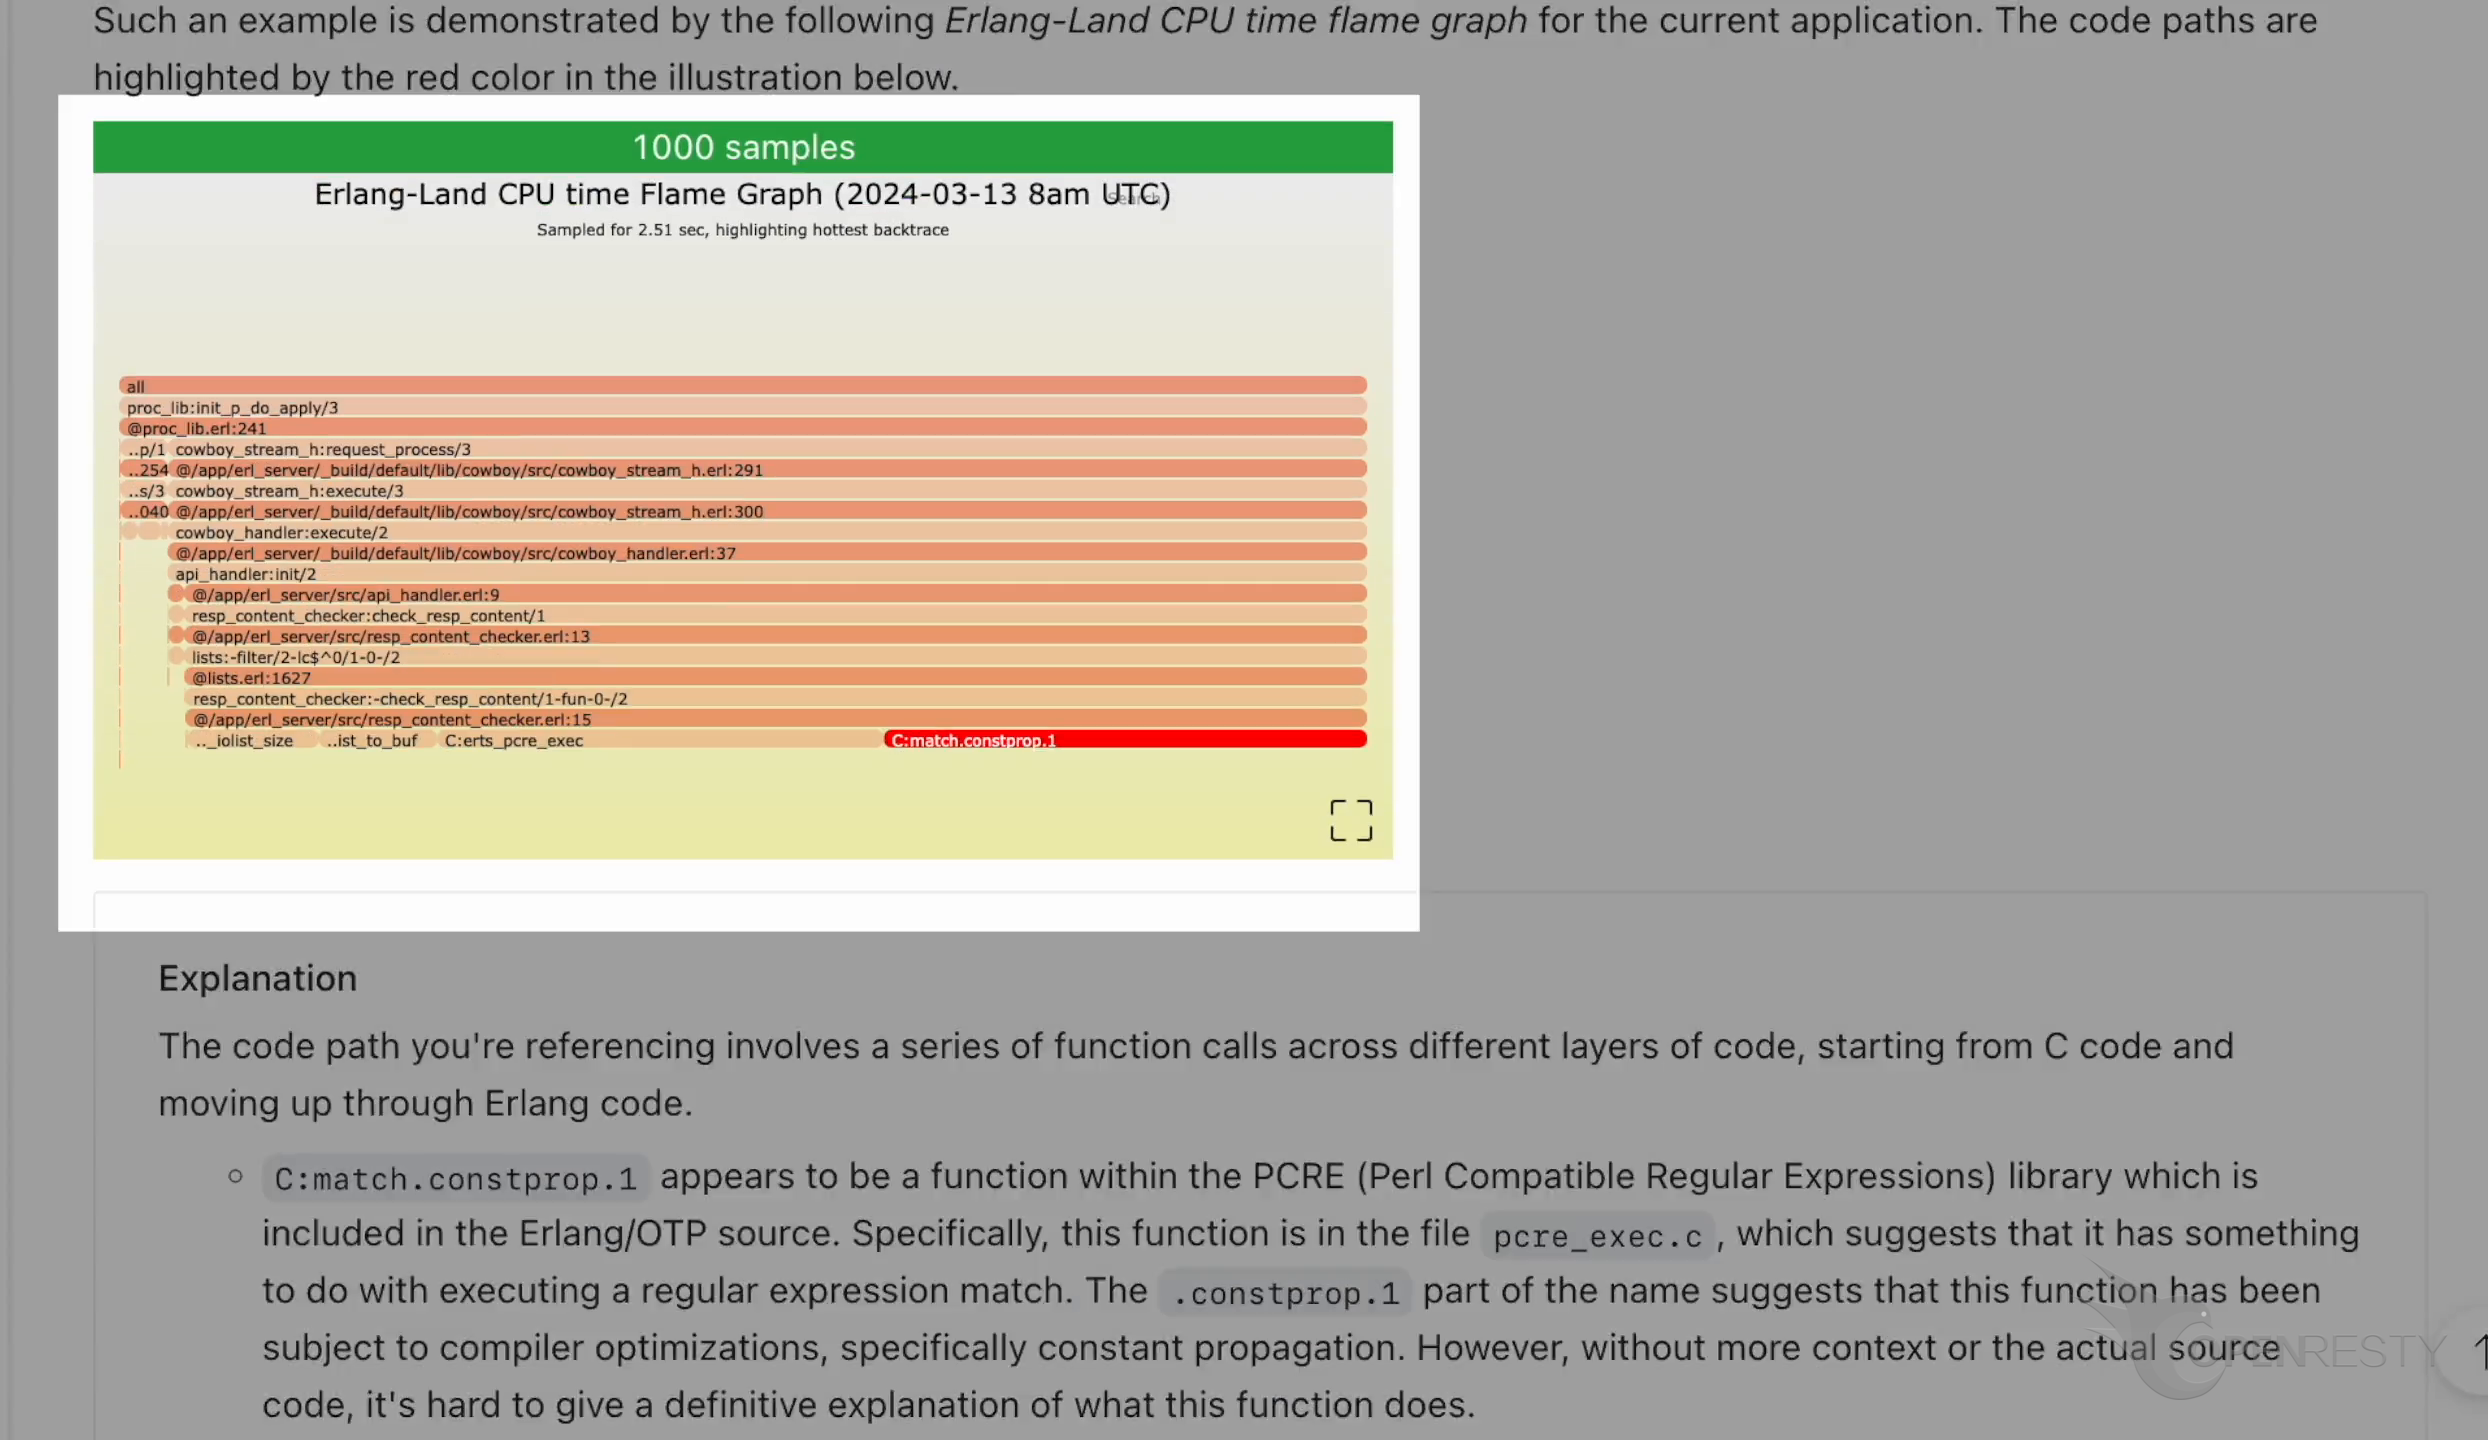
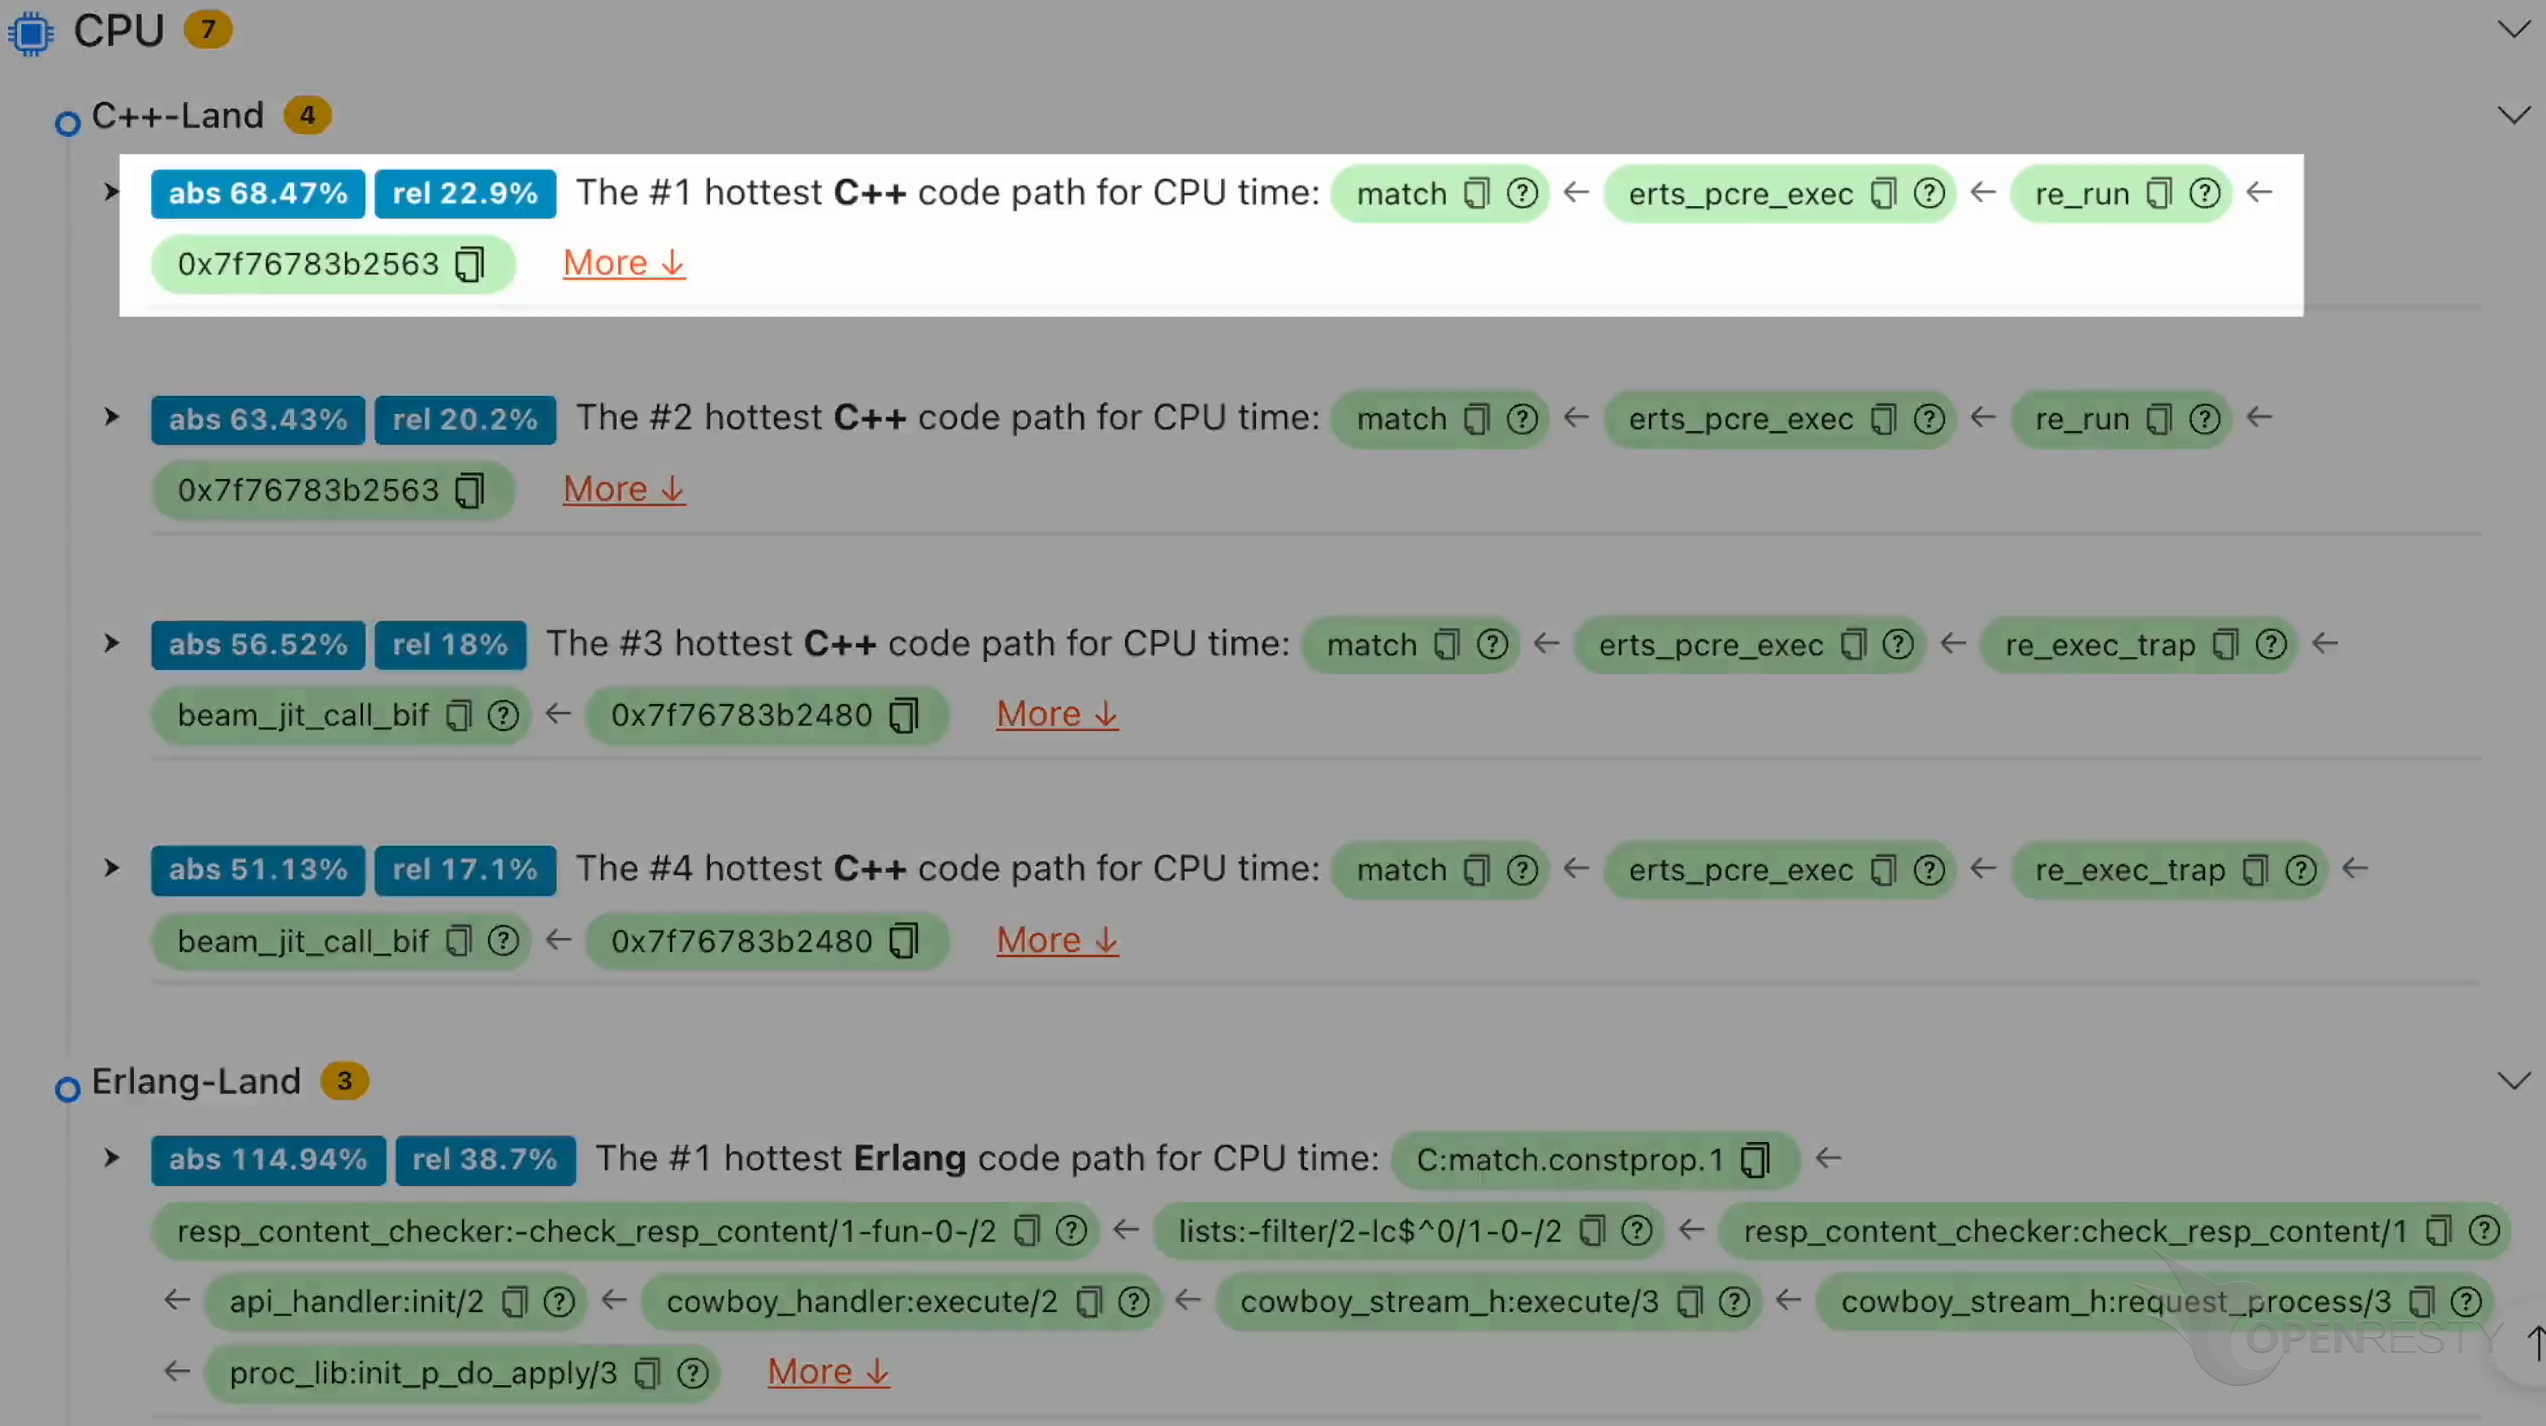
What you see: A root-at-top Erlang-level flame graph: from cowboy’s request-handling chain to the business function check_resp_content, then through the lists:filter anonymous function down to erts_pcre_exec at the bottom, with the red-highlighted C:match.constprop.1 as the end of the hottest backtrace. The C-level code-path report confirms the same chain—the hottest C path is match ← erts_pcre_exec ← re:run:
How you recognize it: The leaf-end branching shape. Unlike the Go case’s single red trunk, this graph splits at the very bottom into several parallel leaf paths (erts_iolist_size, erts_iolist_to_buf, erts_pcre_exec—the first two appear as truncated labels in the graph). The rule is unchanged: follow the widest, red-highlighted one—it leads to erts_pcre_exec, the regex call.
What it means: Every element in the list is being matched against a PCRE regex. PCRE uses a backtracking NFA engine, so patterns with .*, .+, or nested alternations can cause exponential-time matching—a failure mode known as catastrophic backtracking. The fix is either optimizing the pattern to avoid backtracking, or switching to a non-backtracking regex engine.
Full walkthrough: Erlang High CPU: Tracing PCRE Regex Bottlenecks via Flame Graphs
The Pattern Across All Three
All three bottlenecks are regex-related, but the lessons are general:
- Read the leaf end first (the bottom edge for our three cases). When there is a red highlight, just follow it. The widest leaf box is your starting point.
- Read downward for context. The boxes below tell you why that function is hot—who calls it, from where, in what loop.
- Cross-validate across language levels. When the application-level flame graph (PHP/Go/Erlang) and the C-level flame graph point at the same bottleneck, you have a confirmed diagnosis, not a hypothesis.
All three cases happen to be regex bottlenecks; to see real graphs of other shapes—lock waits, memory allocation, and so on—start from the per-stack case articles in the last column of the routing table below, and the off-CPU and memory flame-graph variants later in this article.
From 100% CPU to the Culprit Line
Back to the scene from the opening: top stopped at the process level. Chain together the reading methods above, and four steps take you all the way from 100% CPU to a specific line of code:
Step 1: Find the process. top or htop shows you which process is burning CPU. Note the PID.
Step 2: Get a flame graph. Use a profiler to collect stack-trace samples from that PID. The next section covers which tool to use for each stack.
Step 3: Read the leaf end. Find the widest box at the leaf end of the flame graph—that is the function directly burning CPU. Hover or click to see its source file and line number. Note: you want the widest box at the leaf end (highest self), not the widest overall—the full-width boxes at the base are usually frameworks or dispatchers, with large total but no self burn of their own (see the “Self vs. Total” section above).
Step 4: Read the code. Open the file, jump to the line. Now you know what is burning CPU and why it is being called, because the flame graph gave you the full call stack.
This workflow is the same regardless of language or runtime. What changes is the tool you use in Step 2.
Per-Stack Routing Table
| Stack | Profiling Tool | One-Line Command / Entry Point | Flame Graph Article |
|---|---|---|---|
| Linux (any native binary) | perf | perf record -g -p PID; perf script | stackcollapse-perf.pl | flamegraph.pl | — |
| Go | pprof | go tool pprof -http=:8080 http://host:port/debug/pprof/profile | Go high CPU |
| Java | async-profiler | asprof -d 30 -f out.html PID | Java CPU analysis |
| Node.js | 0x / --prof | 0x app.js | Node.js CPU analysis |
| PHP | Excimer (sampling) | — | PHP high CPU |
| Perl | Devel::NYTProf | perl -d:NYTProf script.pl | Perl high CPU |
| Erlang/BEAM | eflame | — | Erlang high CPU |
| Rust | cargo-flamegraph | cargo flamegraph --pid PID | Rust/Sled high CPU |
| Nginx/OpenResty | — | — | Nginx CPU hottest requests, Lua CPU flame graph |
| C/C++ (Envoy, llama.cpp, …) | perf | same as Linux row | Envoy CPU, llama.cpp CPU |
Every tool in this table requires some form of instrumentation, recompilation, or restart—the next section details this cost, and how to get around it.
How to Get a Flame Graph for Your Stack
If you have never generated a flame graph before, the per-stack routing table above gives an entry point for each major runtime. The general recipe is:
- Collect stack-trace samples from the target process (the tool varies by stack).
- Collapse the samples into a text format (one line per unique stack, with a count).
- Render the collapsed stacks into an SVG or interactive HTML.
Brendan Gregg’s FlameGraph repo provides stackcollapse-*.pl and flamegraph.pl for steps 2 and 3. Most modern tools (pprof, async-profiler, cargo-flamegraph) do all three steps in one command.
The common cost across all these tools is access: you need to modify the process (add flags, recompile with frame pointers, restart to enable a debug agent) or have root/CAP_SYS_ADMIN to use perf/eBPF. In production, that cost is real—especially during an incident, when the last thing you want to do is restart.
OpenResty XRay removes that cost. It attaches to an already-running process using dynamic tracing—no code changes, no recompilation, no restart—and can produce flame graphs for all the stacks listed in the routing table above. The three flame graphs in this article’s cases were captured exactly that way: from live processes, with zero downtime. (For the runtime cost of that sampling, see our measured profiling overhead in production.) Flame graphs are just one of the analysis types it produces — see the full picture, from CPU, memory, and I/O analysis to fully automated reports.
Icicle Graphs, Flame Charts, and Other Variants
Icicle Graphs
An icicle graph (also called an inverted flame graph) flips the stack: the root is at the top, and leaf functions grow downward. The data is identical—same samples, same widths—only the orientation changes.
Most modern profiling tools (Grafana Pyroscope, Polar Signals, Datadog’s continuous profiler) default to the icicle orientation. If the tool you are using shows the root at the top, you are looking at an icicle graph—the OpenResty XRay flame graphs in this article’s three cases are exactly this orientation. The reading rules are the same: width is sample share, the bottom edge is now where the CPU is on-CPU, and the x-axis is still not time.
Flame Charts vs. Flame Graphs
A flame chart looks like a flame graph, but the x-axis is time. Flame charts are produced by browser DevTools (Chrome’s Performance panel) and some tracing tools. In a flame chart, horizontal position means “this happened before that”—so left-to-right ordering is meaningful.
The quickest way to tell them apart: if identical function names appear in multiple boxes that do not merge, it is a flame chart (time-ordered). If identical names always merge into one wider box, it is a flame graph (alphabetical merge).
Other Variants
Flame graphs are not limited to CPU:
- Off-CPU flame graphs show where a program is waiting—on locks, I/O, sleep calls. See Off-CPU Analysis.
- Memory flame graphs show which call paths are allocating memory. See Django Memory Distribution.
- Differential flame graphs compare two profiles and show what changed—useful for before/after comparisons of a deploy.
Each variant changes what the width represents (wait time, bytes allocated, sample delta) but keeps the same stacking structure.
Can AI Read Flame Graphs for You?
It can speed you up, but it does not replace the fundamentals. AI is genuinely fast at recognizing common patterns (regex in a loop, lock contention, framework overhead), and it is a useful starting point for engineers reading a flame graph for the first time. But the four rules in this article are simple enough that you do not need AI for the basics. Where AI adds real value is in connecting a flame graph to your specific codebase and runtime—and that requires more than an SVG image.
OpenResty XRay’s AI Assistant does exactly that: instead of analyzing a static image, it works directly on the dynamic-tracing data that produced the flame graph—the raw stack samples, the process metadata, the runtime context. This means it can correlate across language levels (PHP + C, Go + runtime), identify patterns specific to your framework, and produce recommendations that reference your source files and line numbers.
FAQ
What does the width of a box mean in a flame graph?
Width represents the fraction of stack-trace samples that include that function. A box spanning 30% of the graph means that function appeared in 30% of all samples collected during the profiling period. It is a proxy for CPU time share, not a measurement of wall-clock duration.
Do the colors in a flame graph mean anything?
In Brendan Gregg’s original flame graphs, colors are random warm hues—they carry no semantic meaning. Some tools assign colors by module, language level, or package (e.g., red for kernel, green for application code). Check your specific tool’s legend. If there is no legend, the colors are decorative. OpenResty XRay’s flame graphs use two colors: orange for CPU flame graphs and blue for off-CPU flame graphs.
How do I find the bottleneck in a flame graph?
Look at the top edge of the graph (the bottom edge if it is an icicle graph). The box with the highest self at that edge is your function—the one directly executing, not just dispatching work. That is your bottleneck. Read downward to see the call chain that leads to it.
I see 100% CPU in top but I can’t tell which code is responsible. How do I find out?
top tells you which process is burning CPU, but not which function or line. You need a flame graph. Attach a profiler to that process’s PID (see the per-stack routing table above), collect stack-trace samples for 10–30 seconds, and render the flame graph. The widest plateau at the leaf end (the top edge in the classic orientation, the bottom edge in a root-at-top rendering) is the responsible function. Hover or click on it to see the source file and line number. If you’re chasing high P99 latency with high CPU usage, the flame graph is exactly this step — for the full diagnostic path and root-cause spectrum, see P99 latency explained.
About OpenResty XRay
OpenResty XRay is a dynamic-tracing product that automatically analyzes running applications to resolve performance issues, behavioral issues, and security vulnerabilities, and provides actionable suggestions. Under the hood, OpenResty XRay is powered by our Y language and supports various different runtimes in different environments, such as Stap+, eBPF+, GDB, and ODB.
About the Author
Yichun Zhang is the founder of the open-source OpenResty® project and the CEO and founder of OpenResty Inc.
Yichun Zhang (GitHub ID: agentzh), born in Jiangsu, China, now lives in the San Francisco Bay Area. He is a pioneer of “edge computing”, “dynamic tracing”, and “machine programming”, with over 22 years of programming experience and 16 years of open-source experience. As the leader of an open-source project with more than 40 million global domain-name users, he built the high-tech enterprise OpenResty Inc. in the heart of Silicon Valley. The company’s two flagship products, OpenResty XRay (a non-intrusive profiling and troubleshooting tool leveraging dynamic tracing technology) and OpenResty Edge (a versatile gateway software best suited for microservices and distributed traffic), are widely trusted by many publicly listed and large enterprises globally. Beyond OpenResty, Yichun Zhang has contributed over a million lines of code to various open-source projects, including the Linux kernel, Nginx, LuaJIT, GDB, SystemTap, LLVM, Perl, and others, and has authored more than 60 open-source software libraries.
Follow Us
If you liked this article, please follow OpenResty Inc. on our blog site. Also welcome to scan the QR code to follow our WeChat public account:

Translation
We provide the original English version (this article) and its Chinese translation. We welcome translations in other languages, as long as they are complete and unabridged, and we will consider publishing them. Thank you very much!
Related Articles
OpenResty XRay Apr 1, 2024

OpenResty XRay Feb 27, 2024

OpenResty XRay Feb 27, 2024

OpenResty XRay Dec 25, 2023

OpenResty XRay Sep 28, 2023