How CPU time is spent inside Go's etcd server (using OpenResty XRay)
In this tutorial, I will demonstrate how the CPU time is spent qualitatively inside Go’s etcd server with OpenResty XRay. I will show the most CPU-intensive Go code paths in it. OpenResty XRay will automatically analyze the Go (golang) language level CPU flame graph.
Problem: high CPU usage
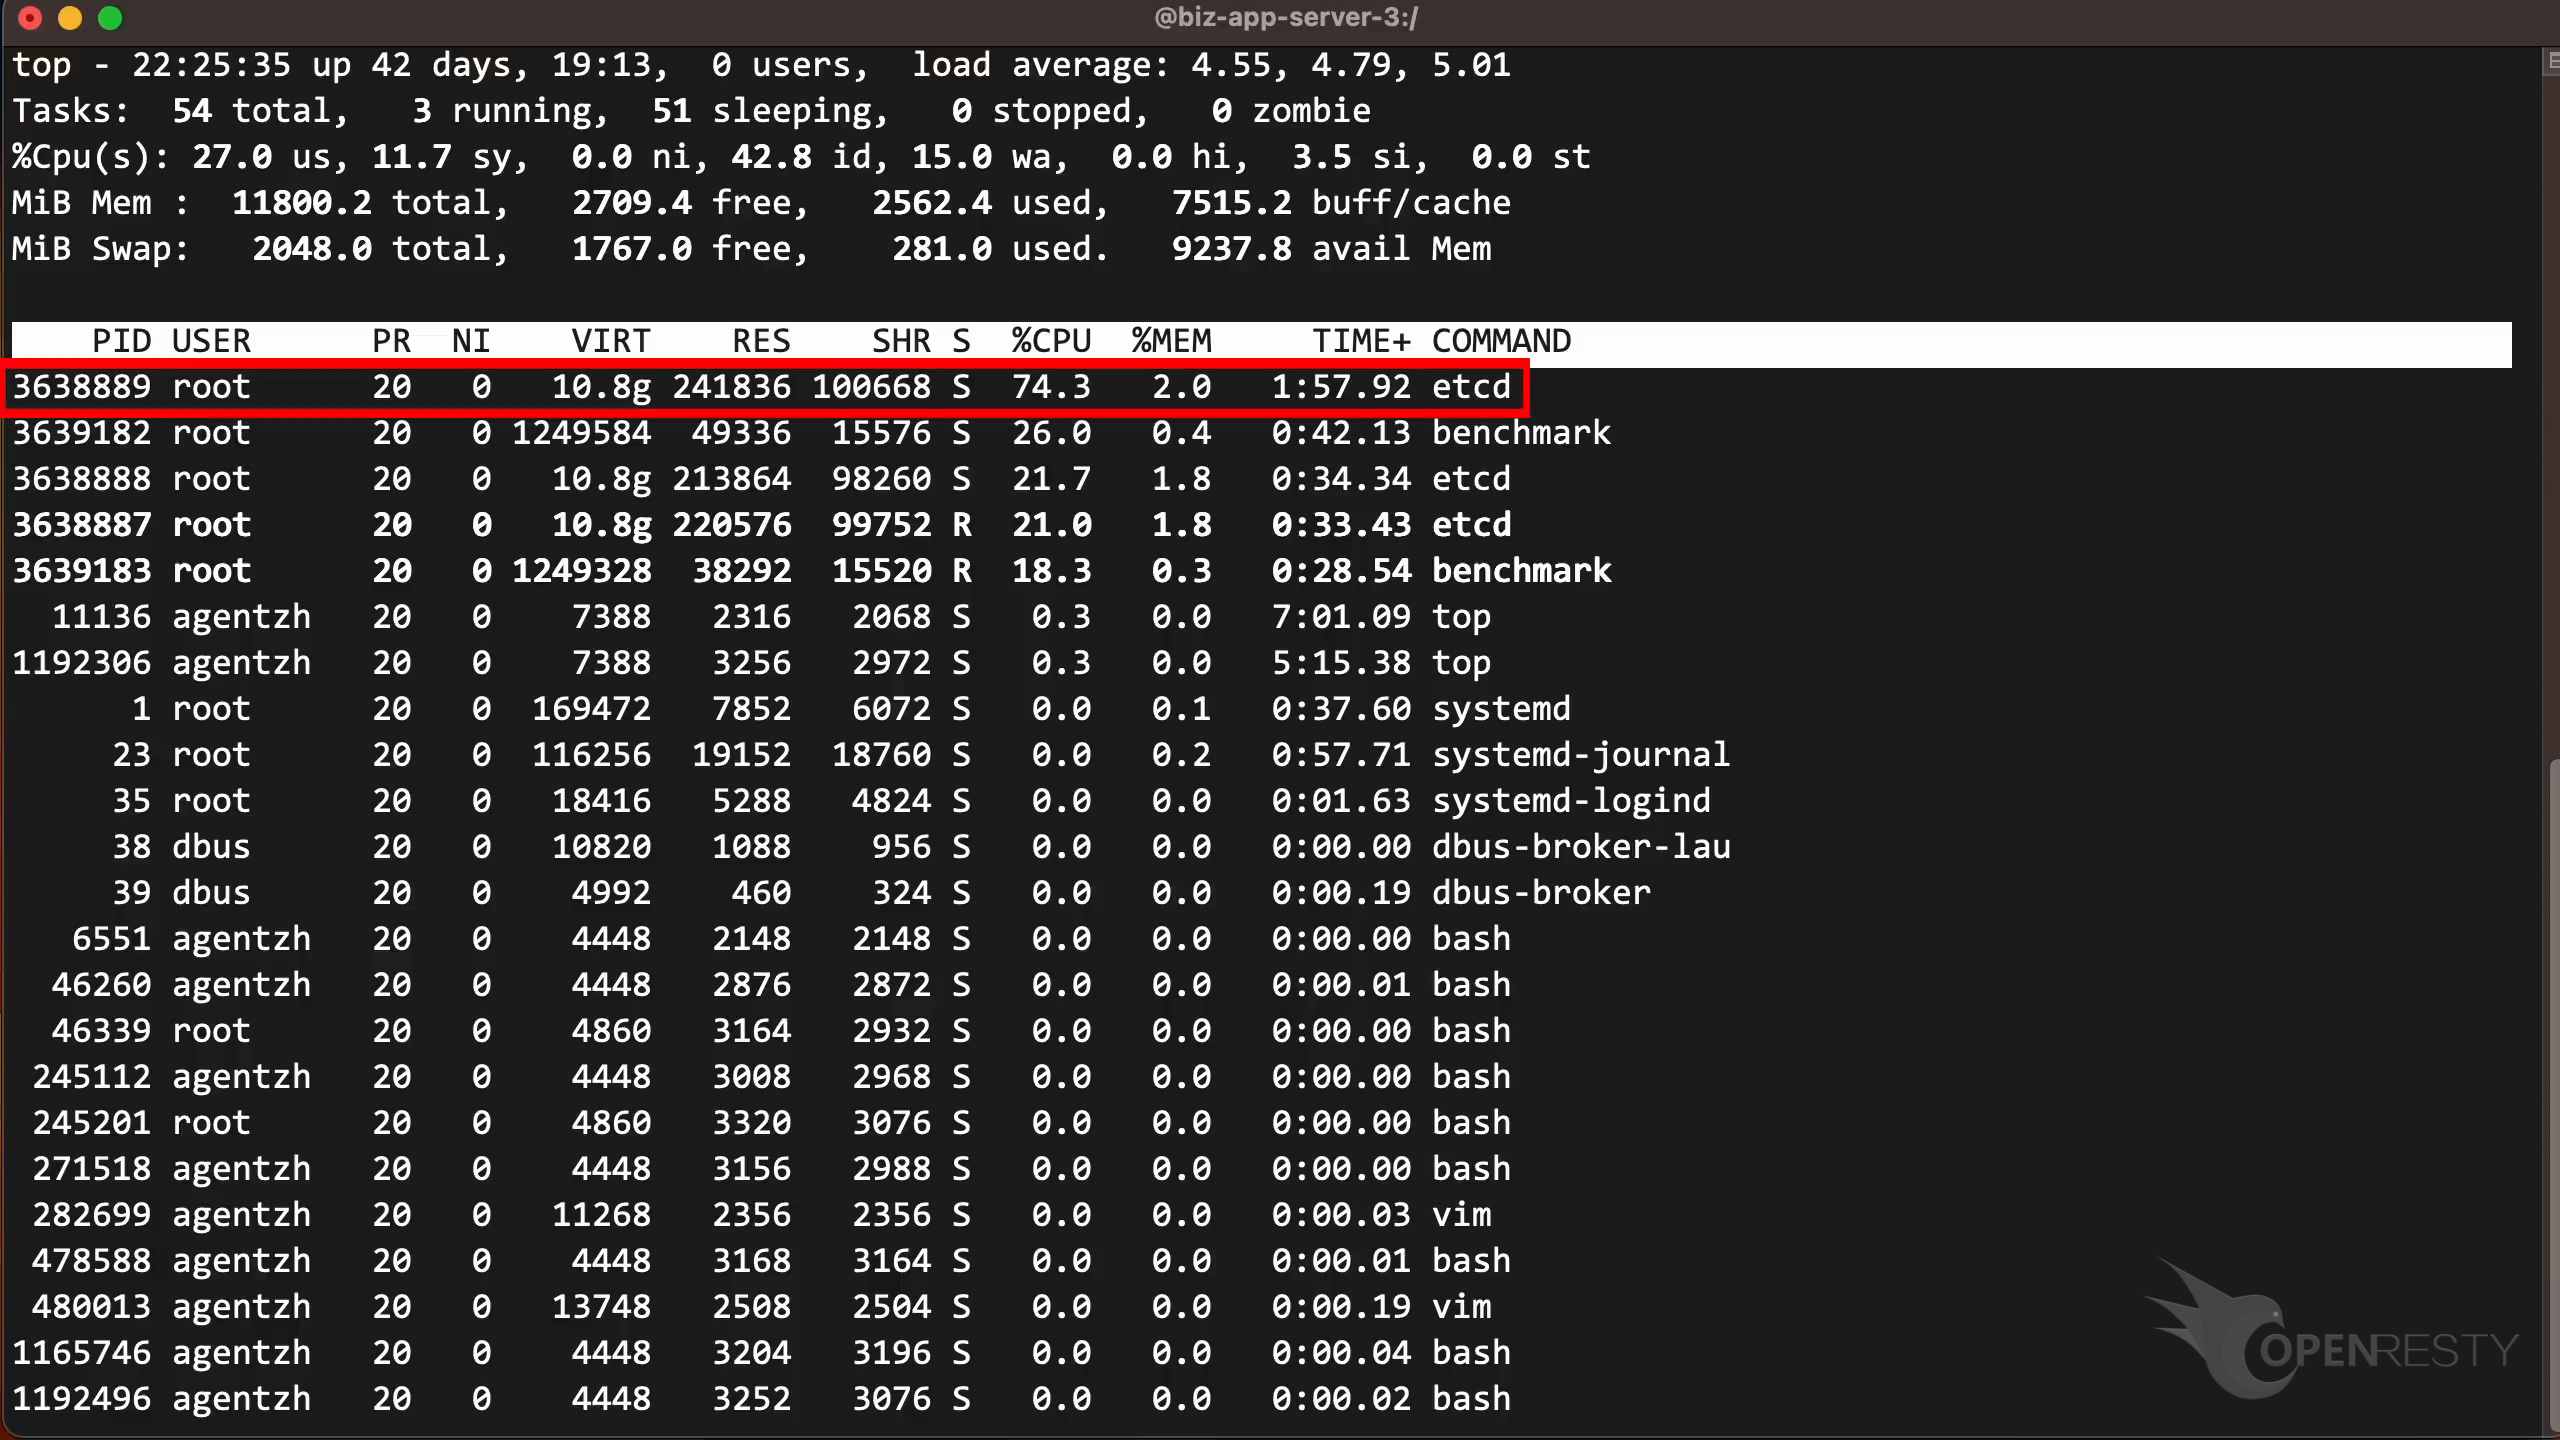
Let’s start by running the top command to check the CPU usage.
As shown, the etcd process consumes more than 70% of a CPU core.
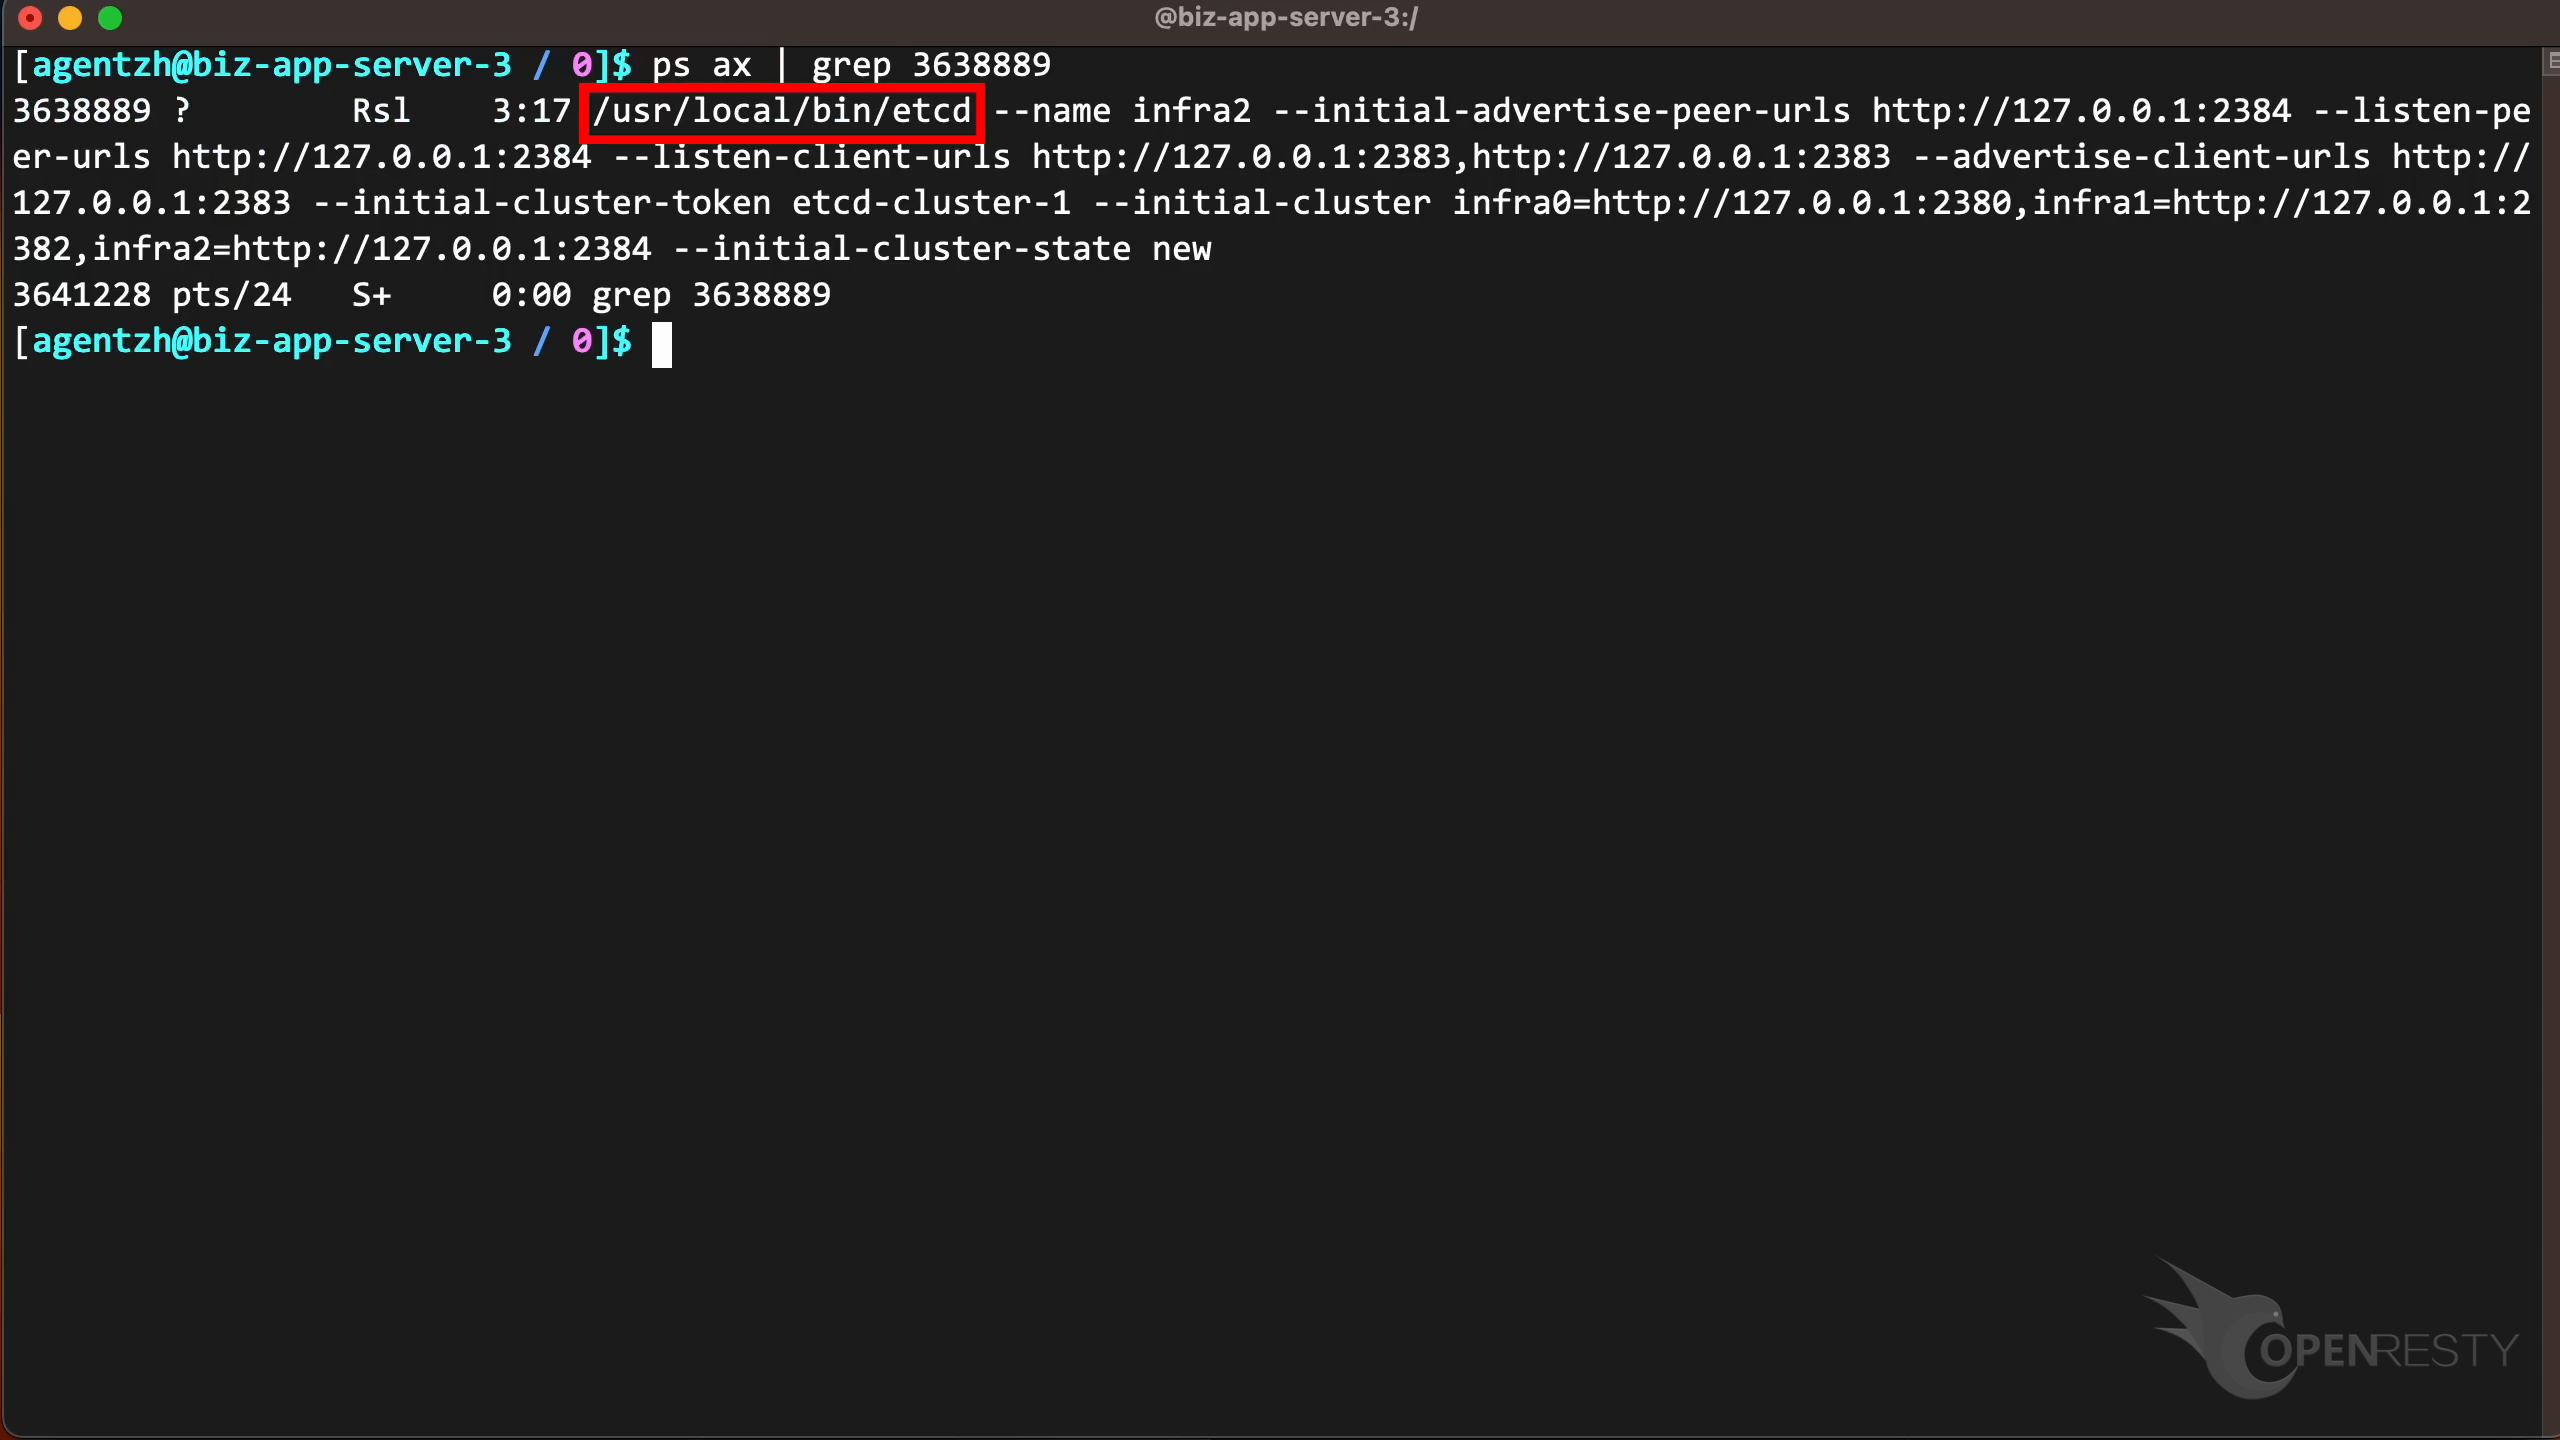
Run the ps command to see the full command line for this process. We can see it is a standard etcd binary executable without any changes.
Use the guidede analysis feature of OpenResty XRay to spot the hottest Go code paths
Let’s use OpenResty XRay to check out this unmodified process. We can analyze it in real time and figure out what’s going on.
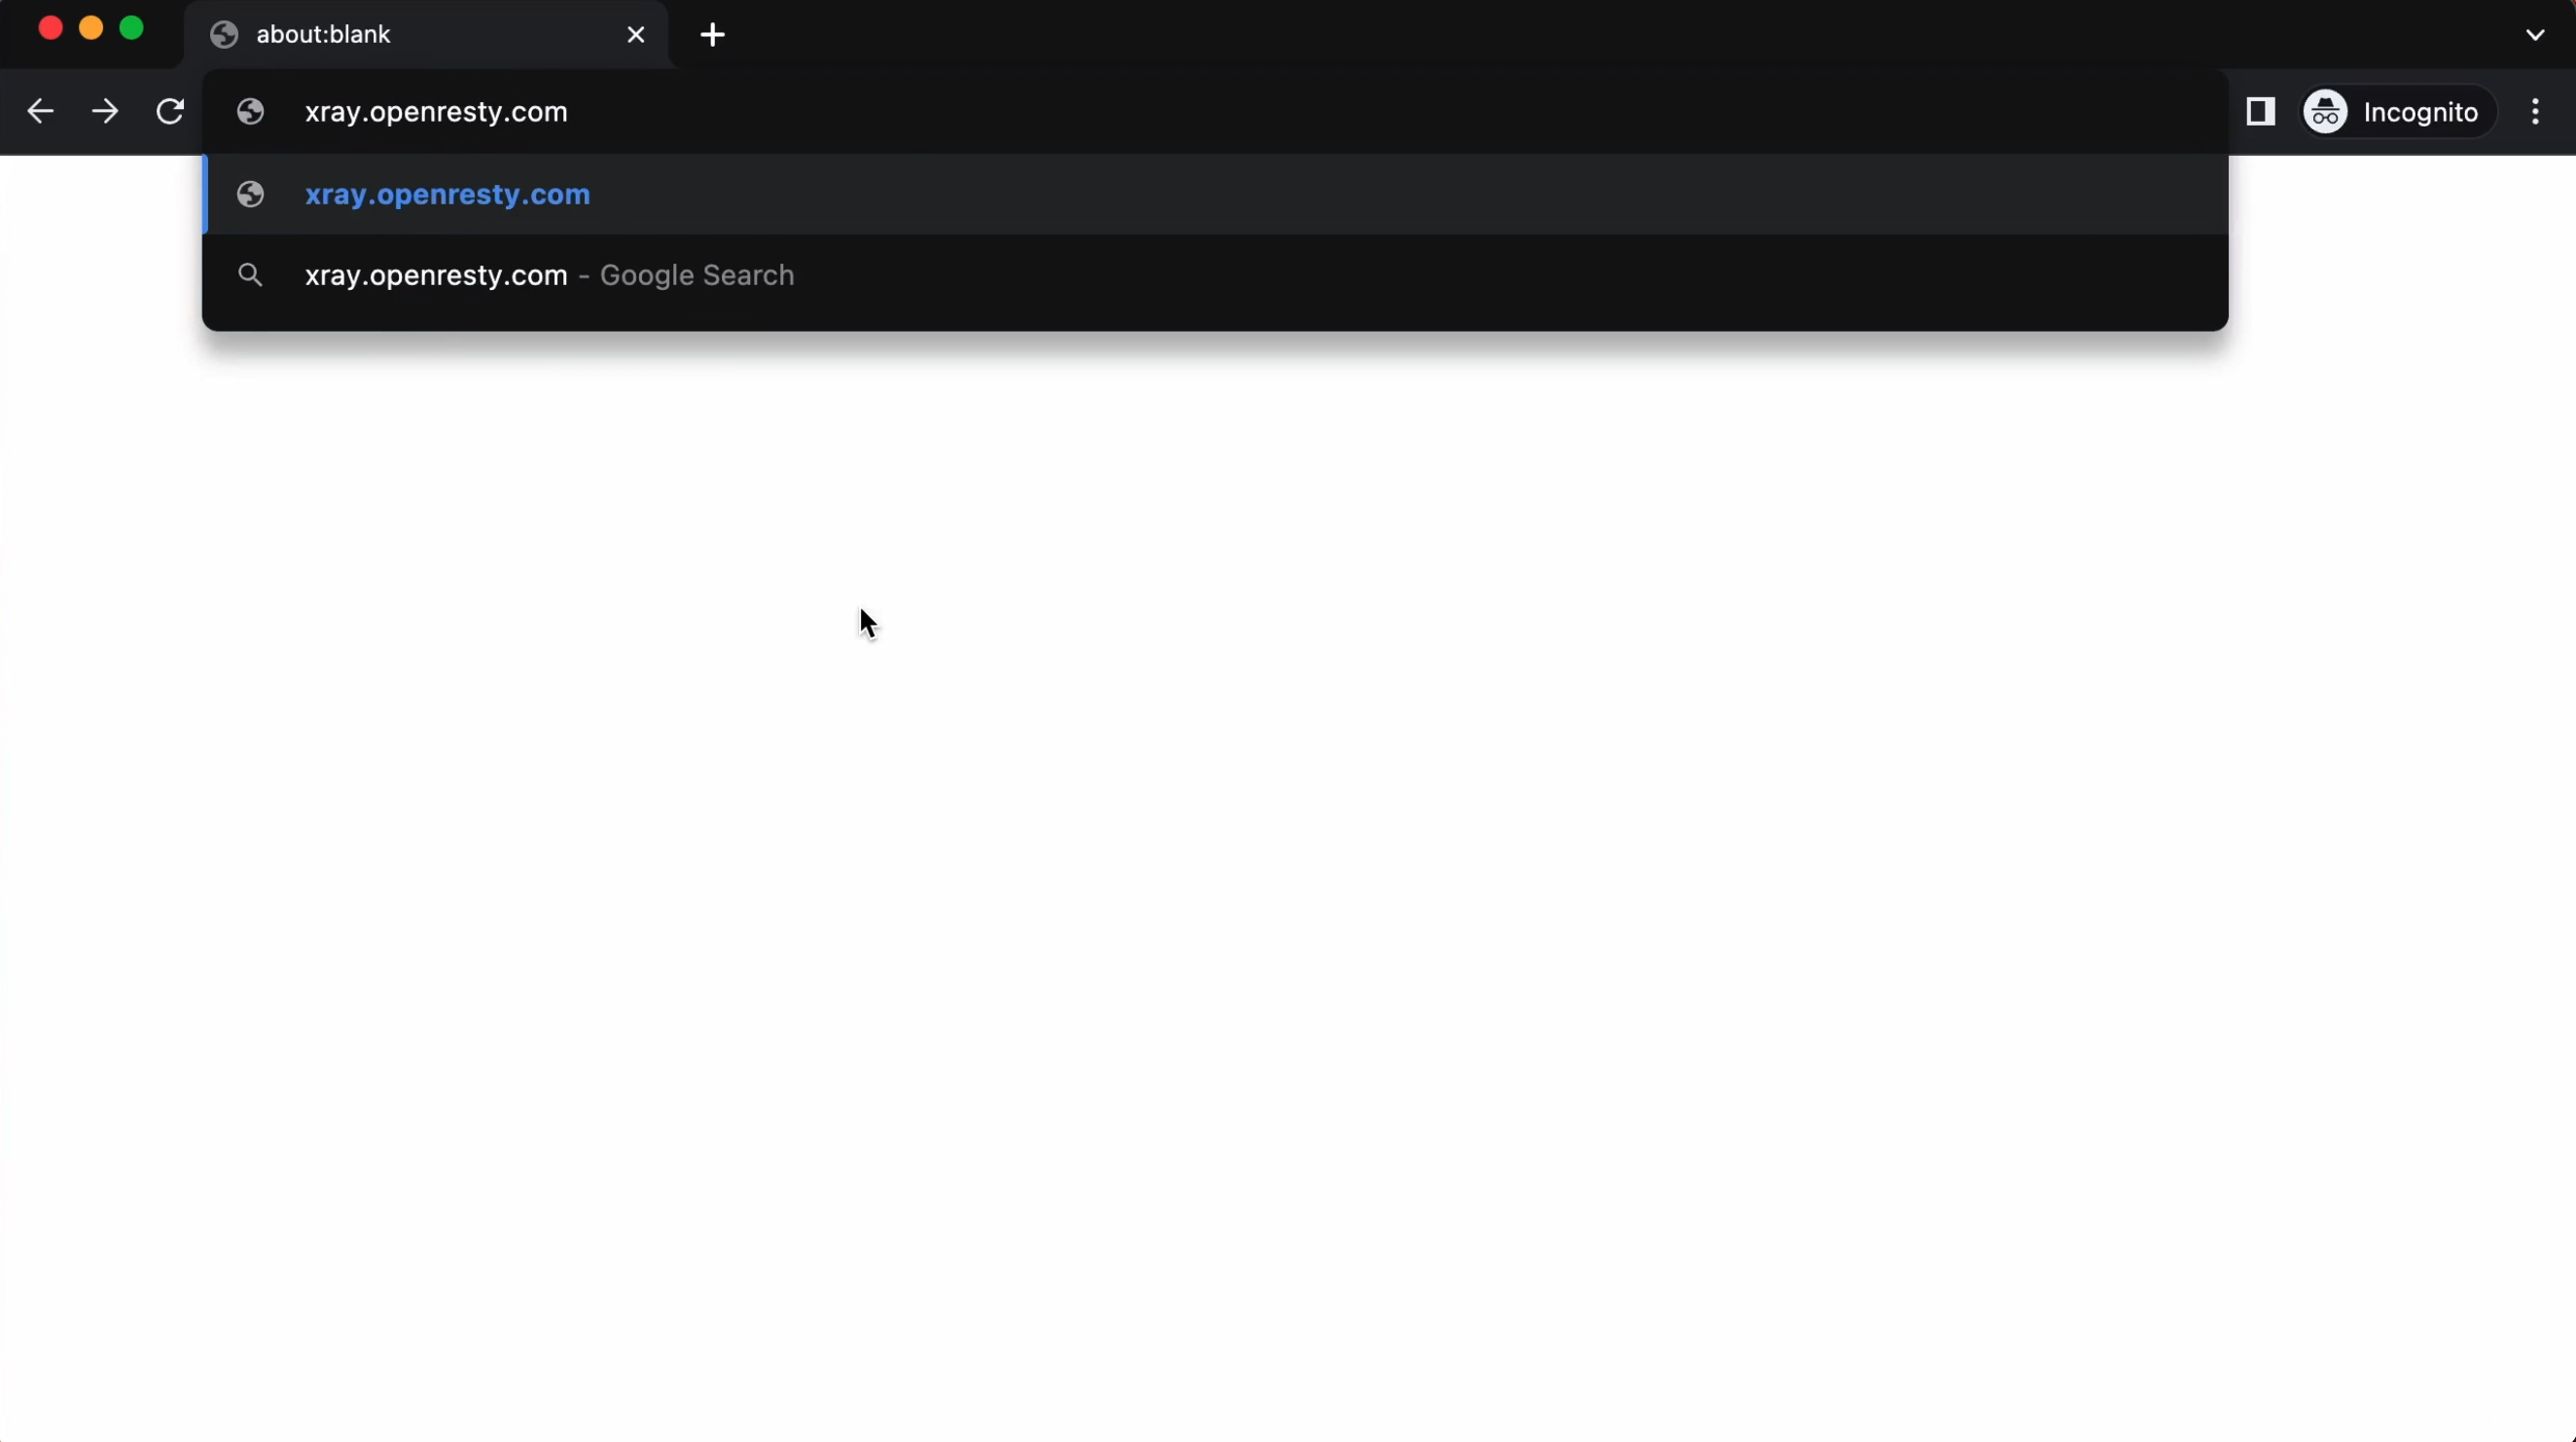
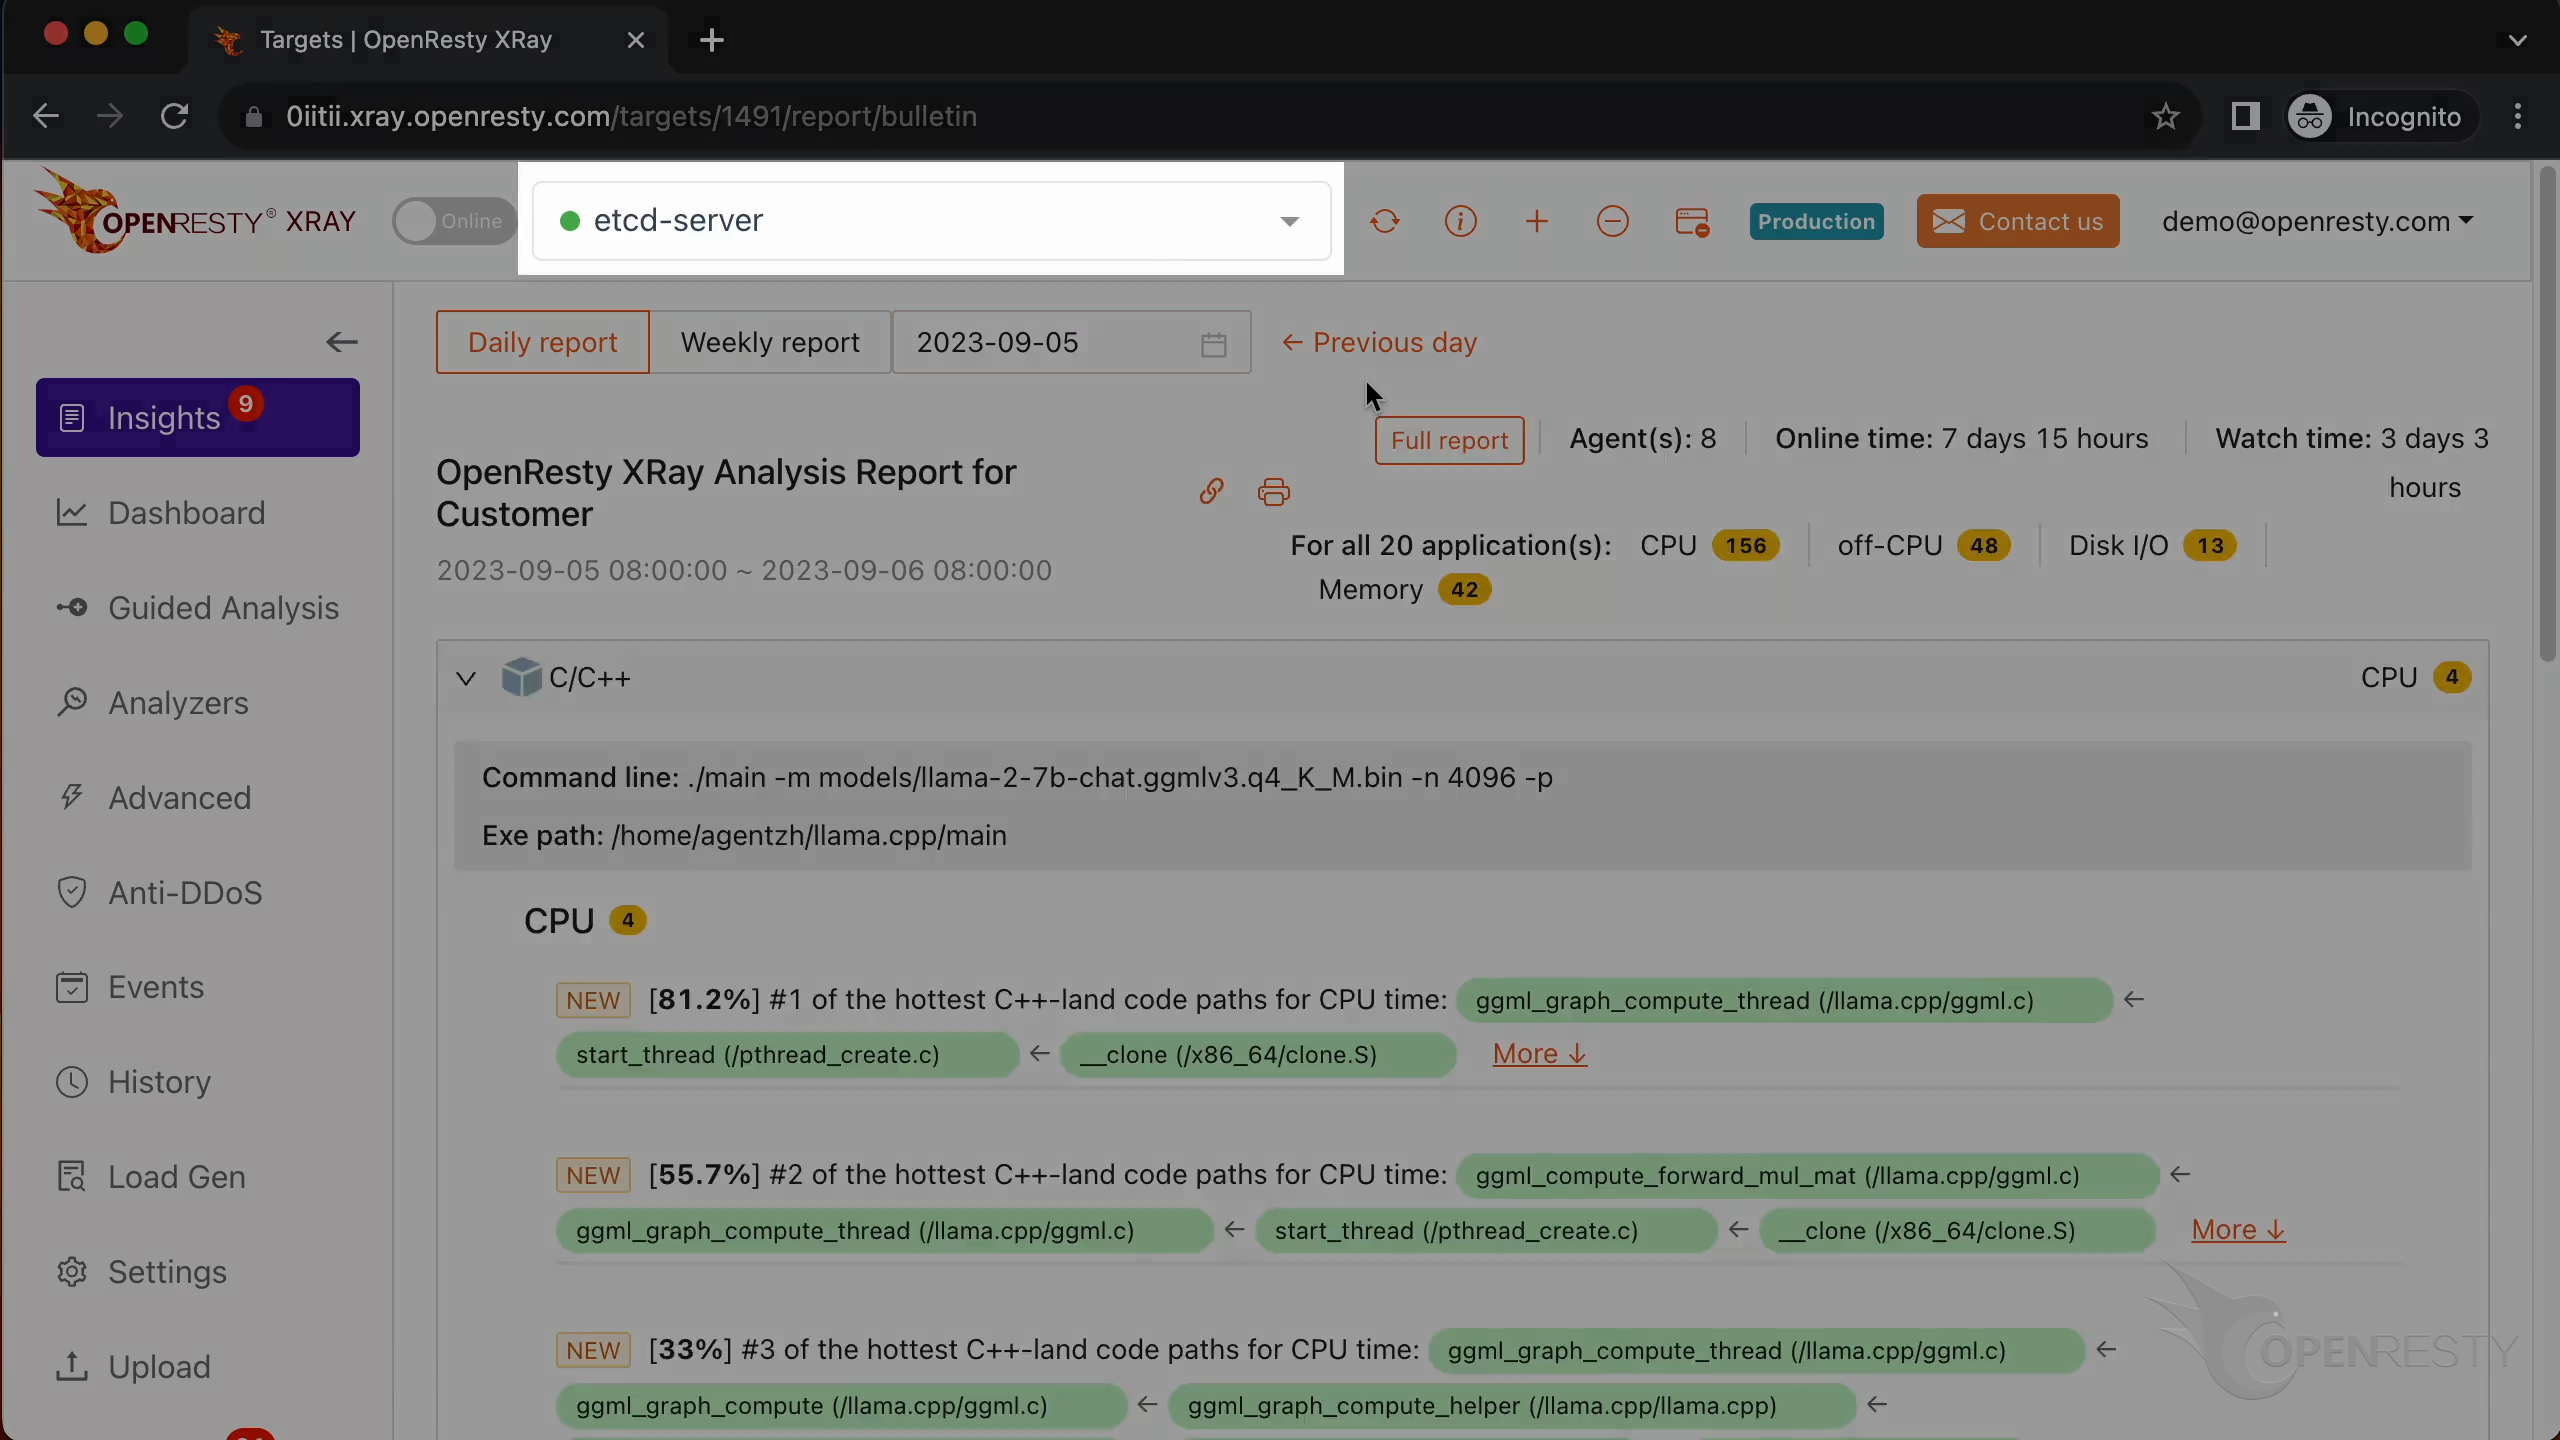
Open the OpenResty XRay web console in the web browser.
Make sure it is the right machine you are watching.
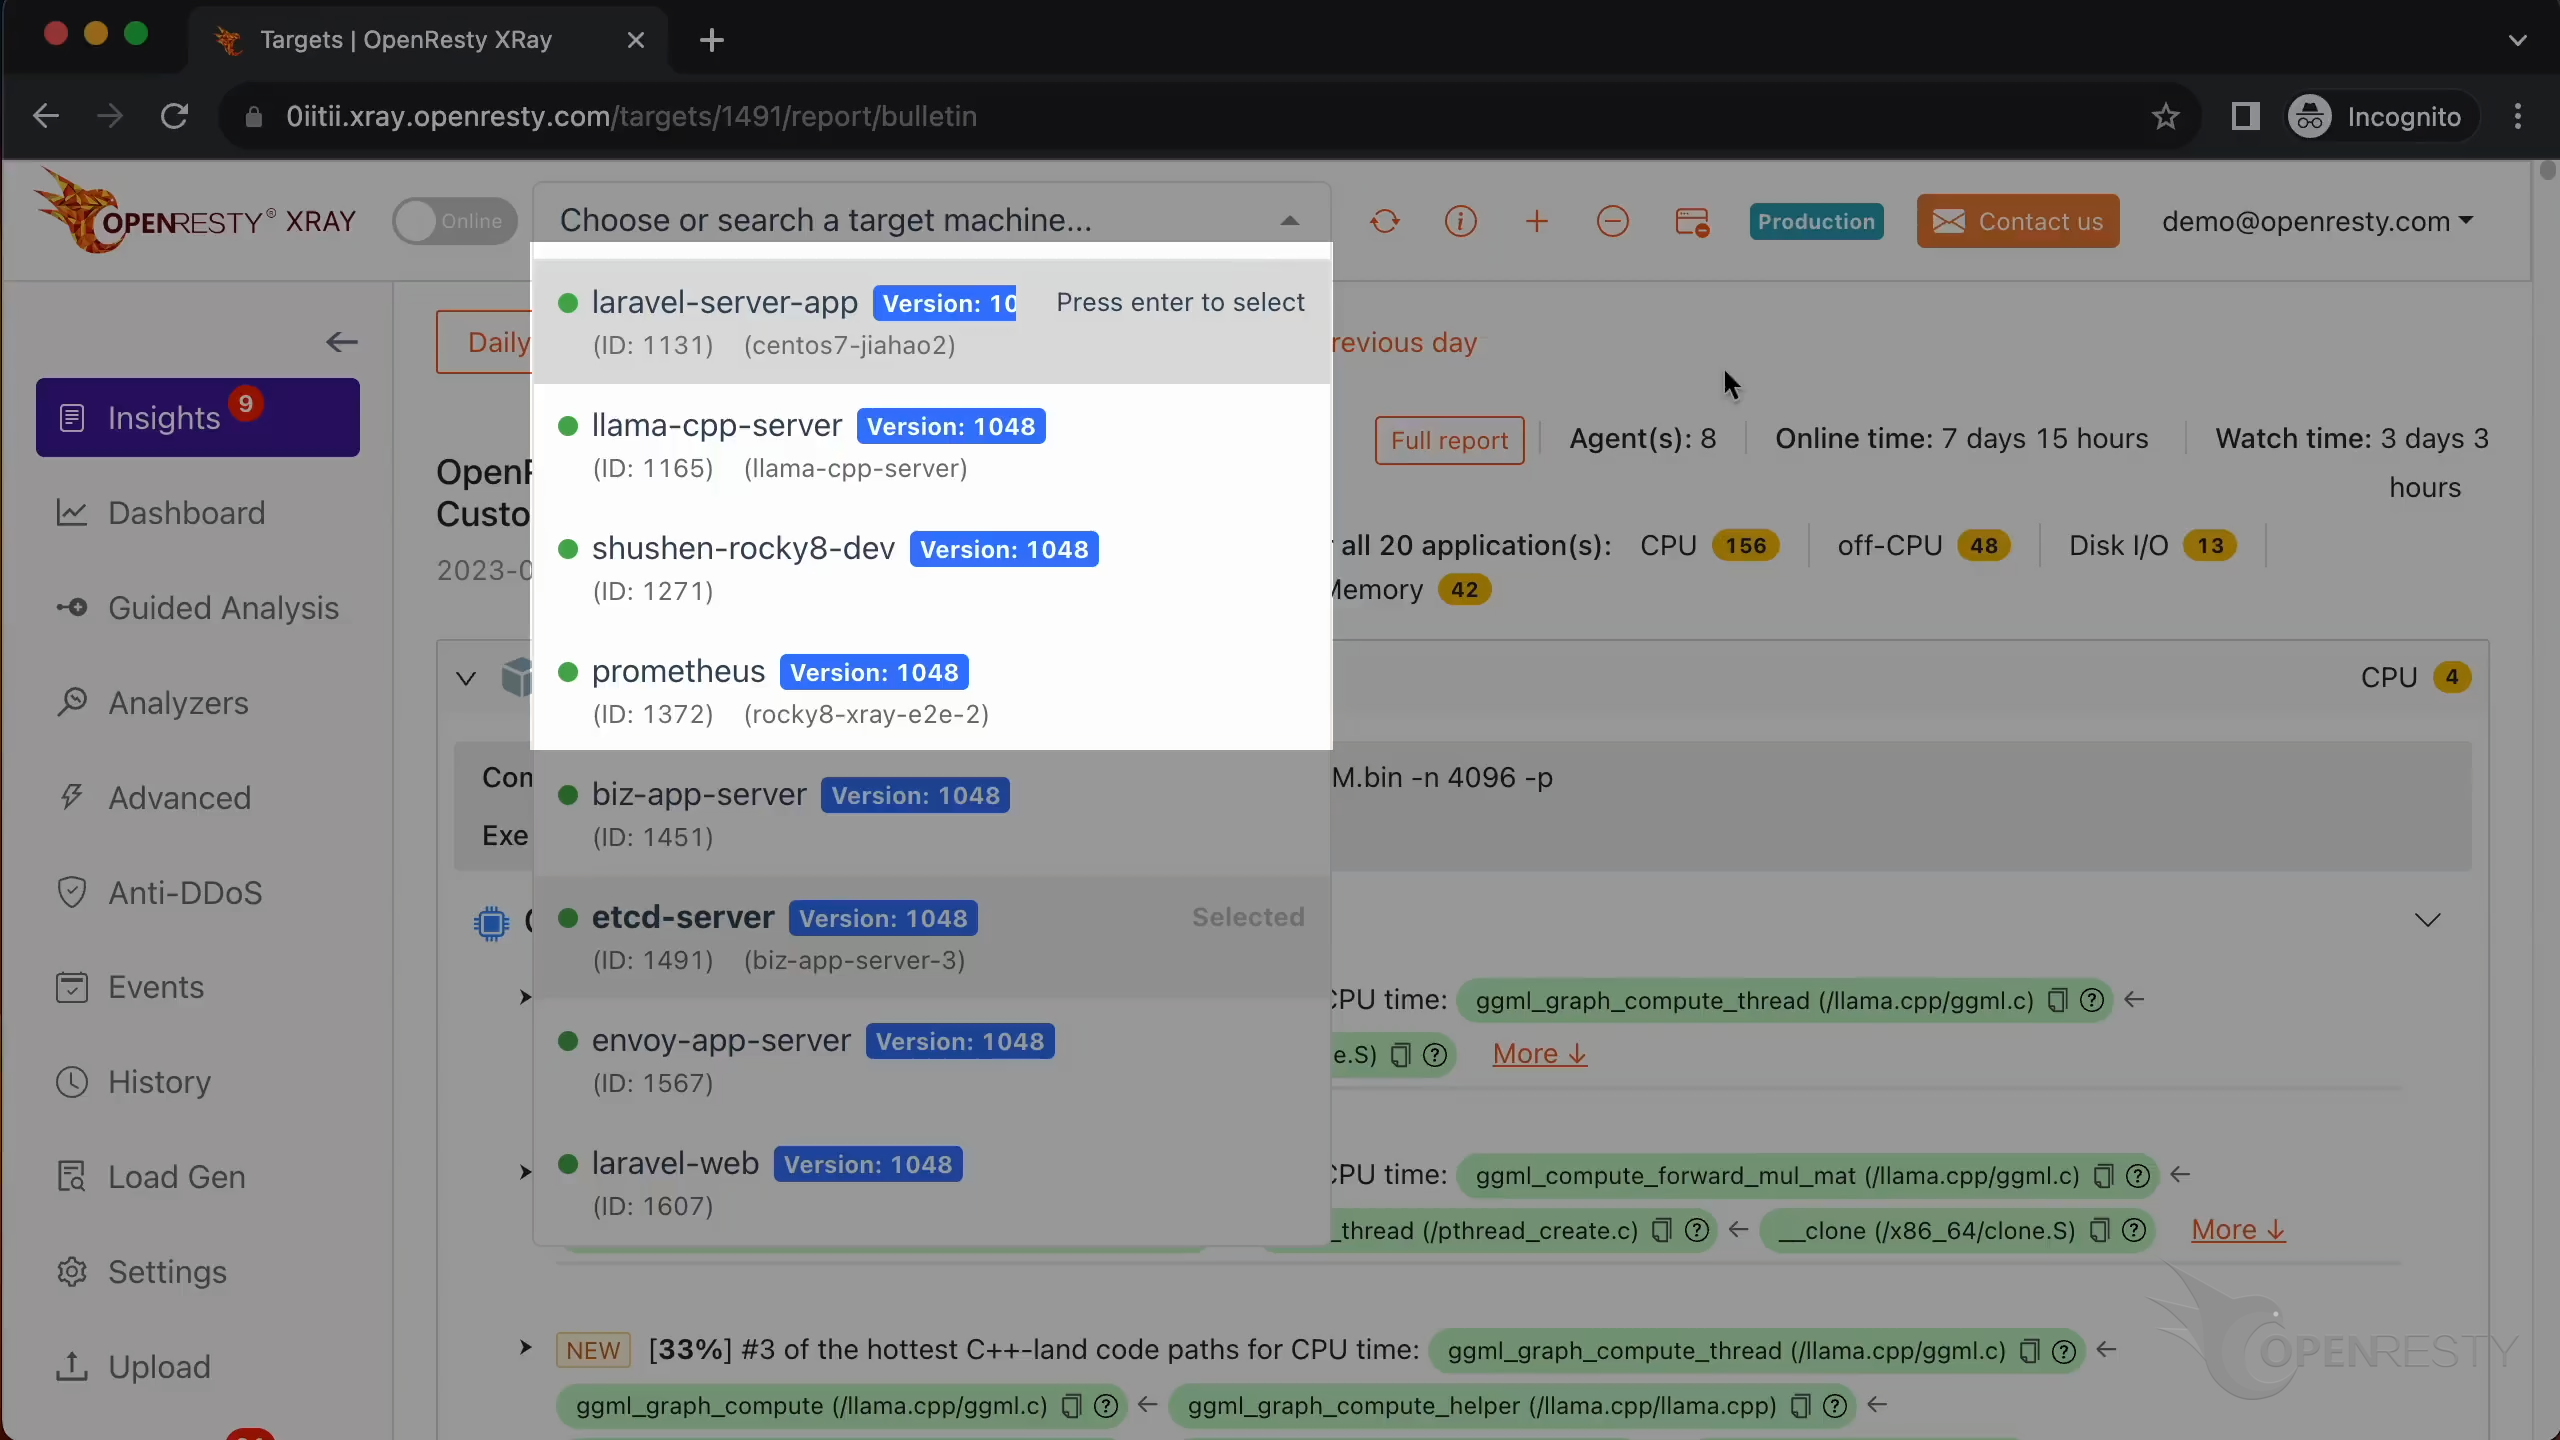
You can choose the right machine from the list below if the current one is not correct.
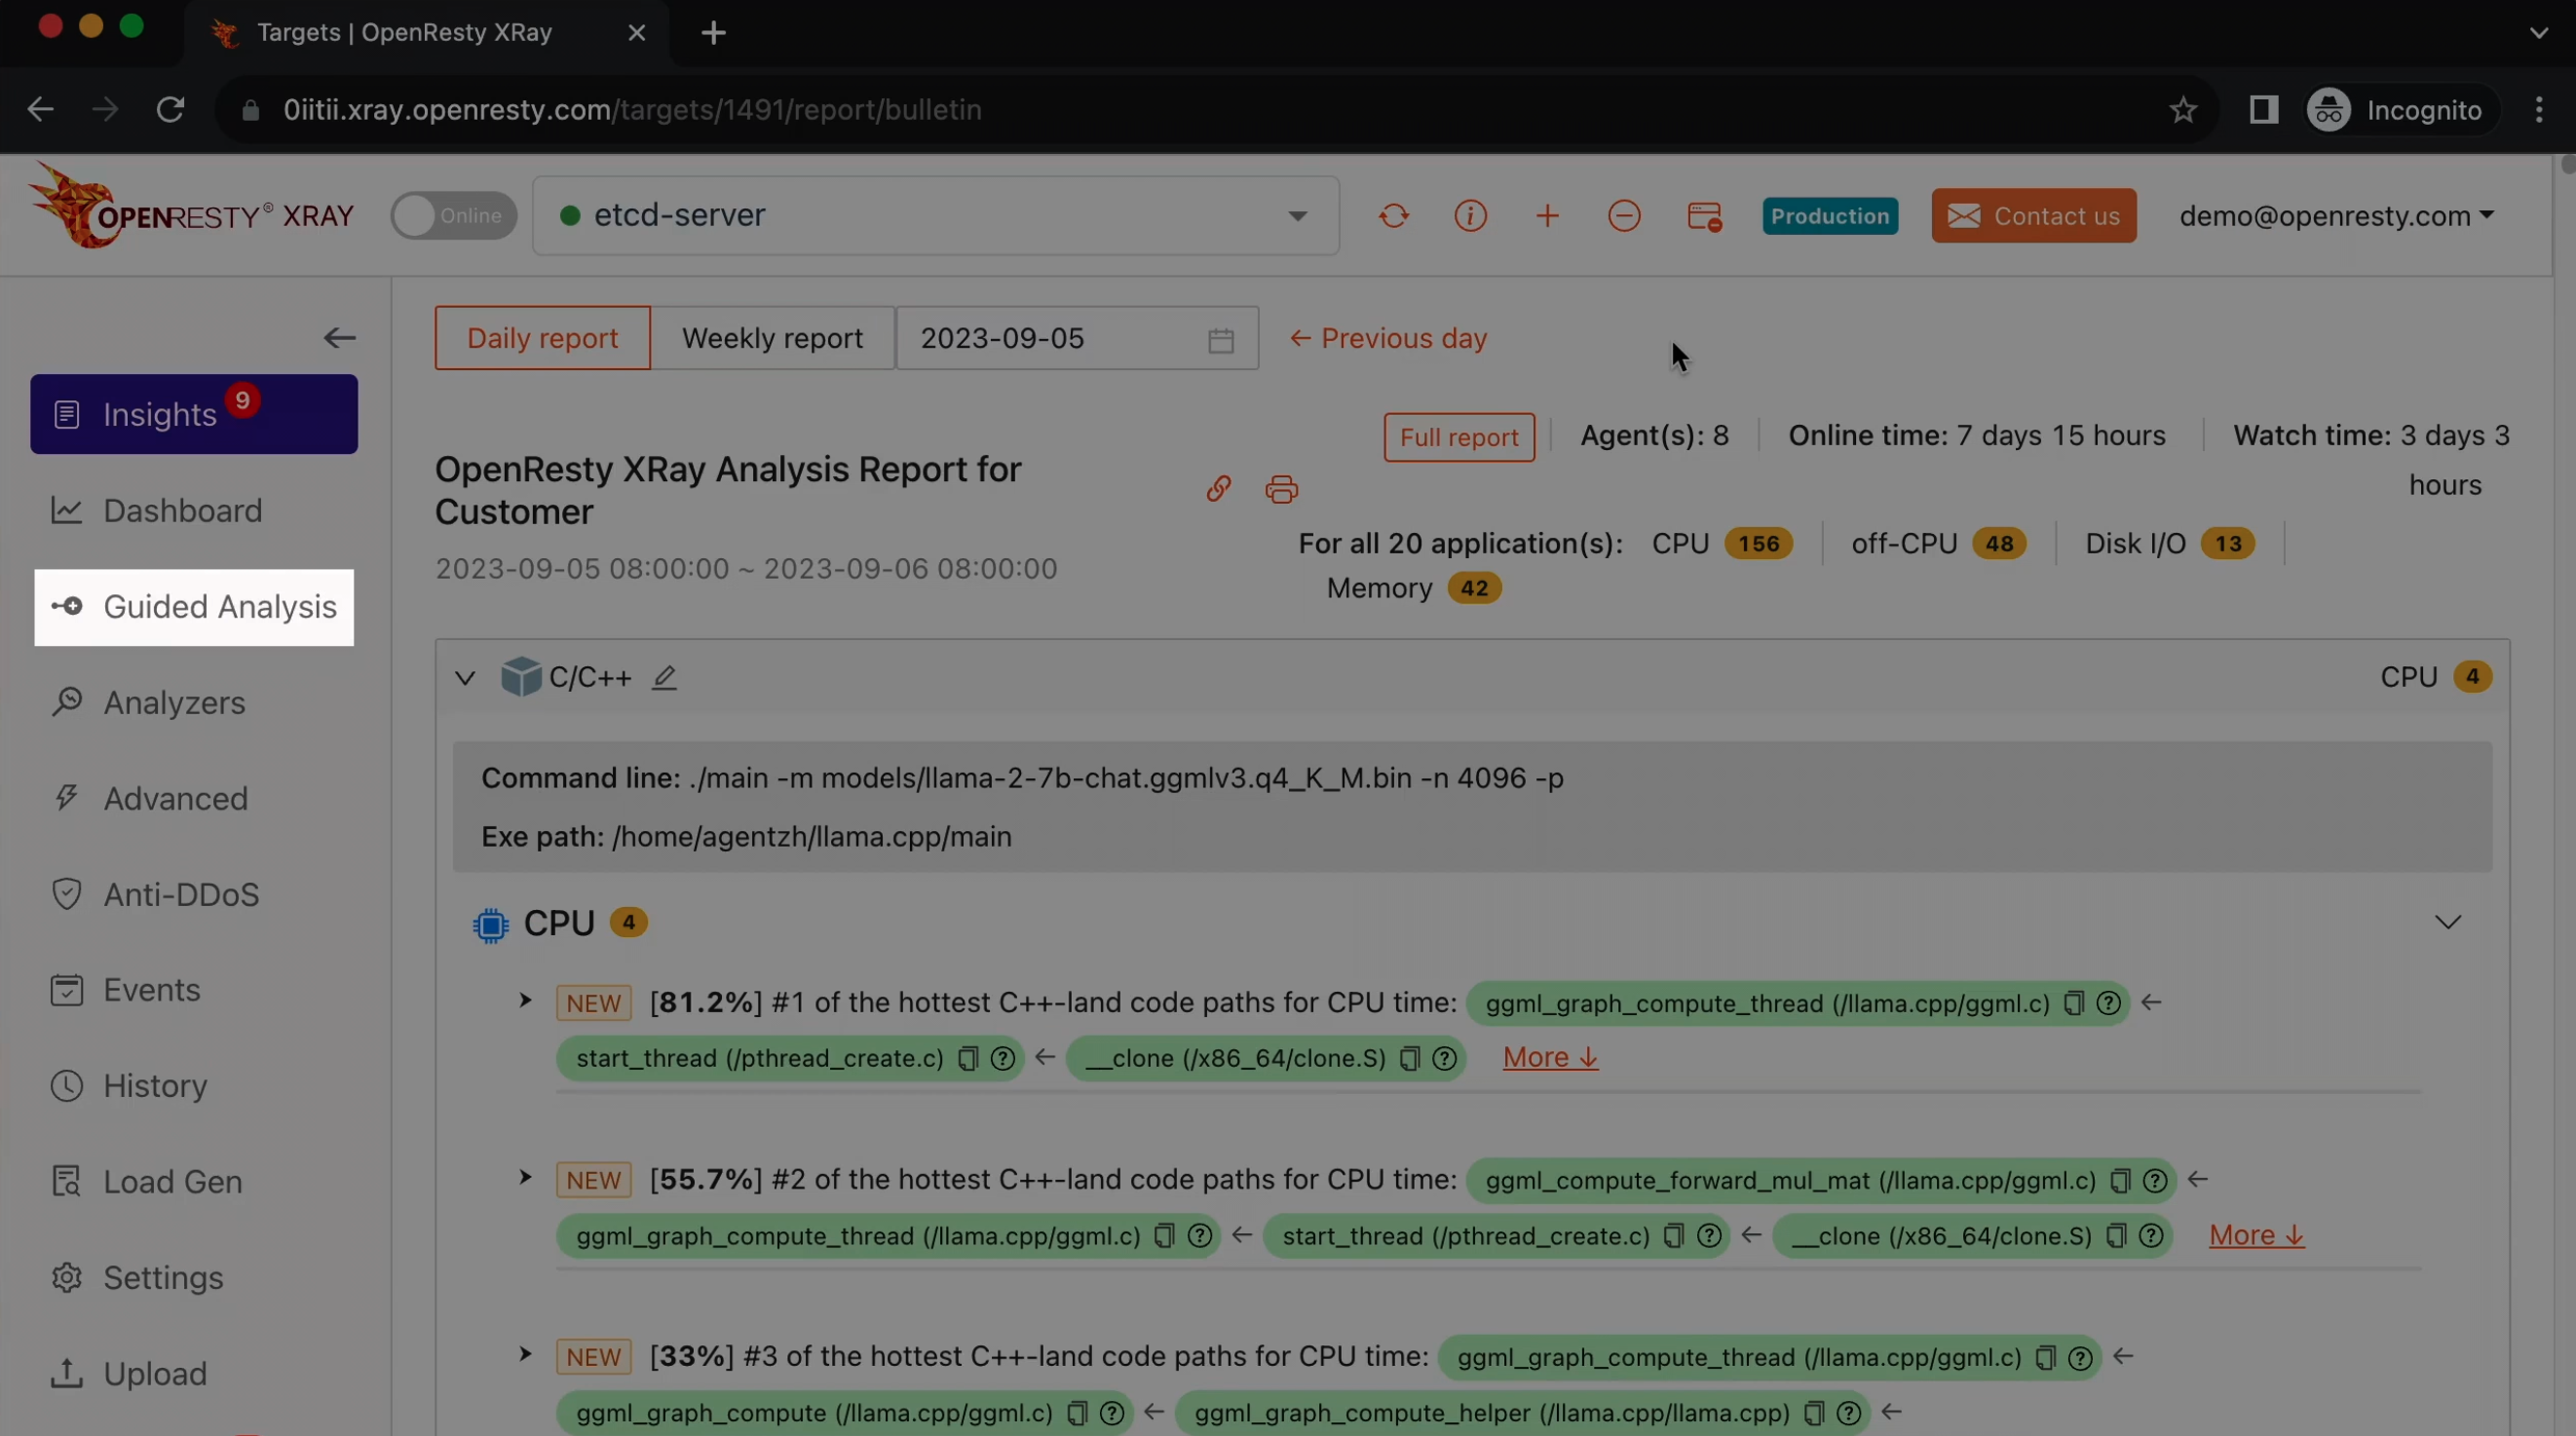
Go to the “Guided Analysis” page.
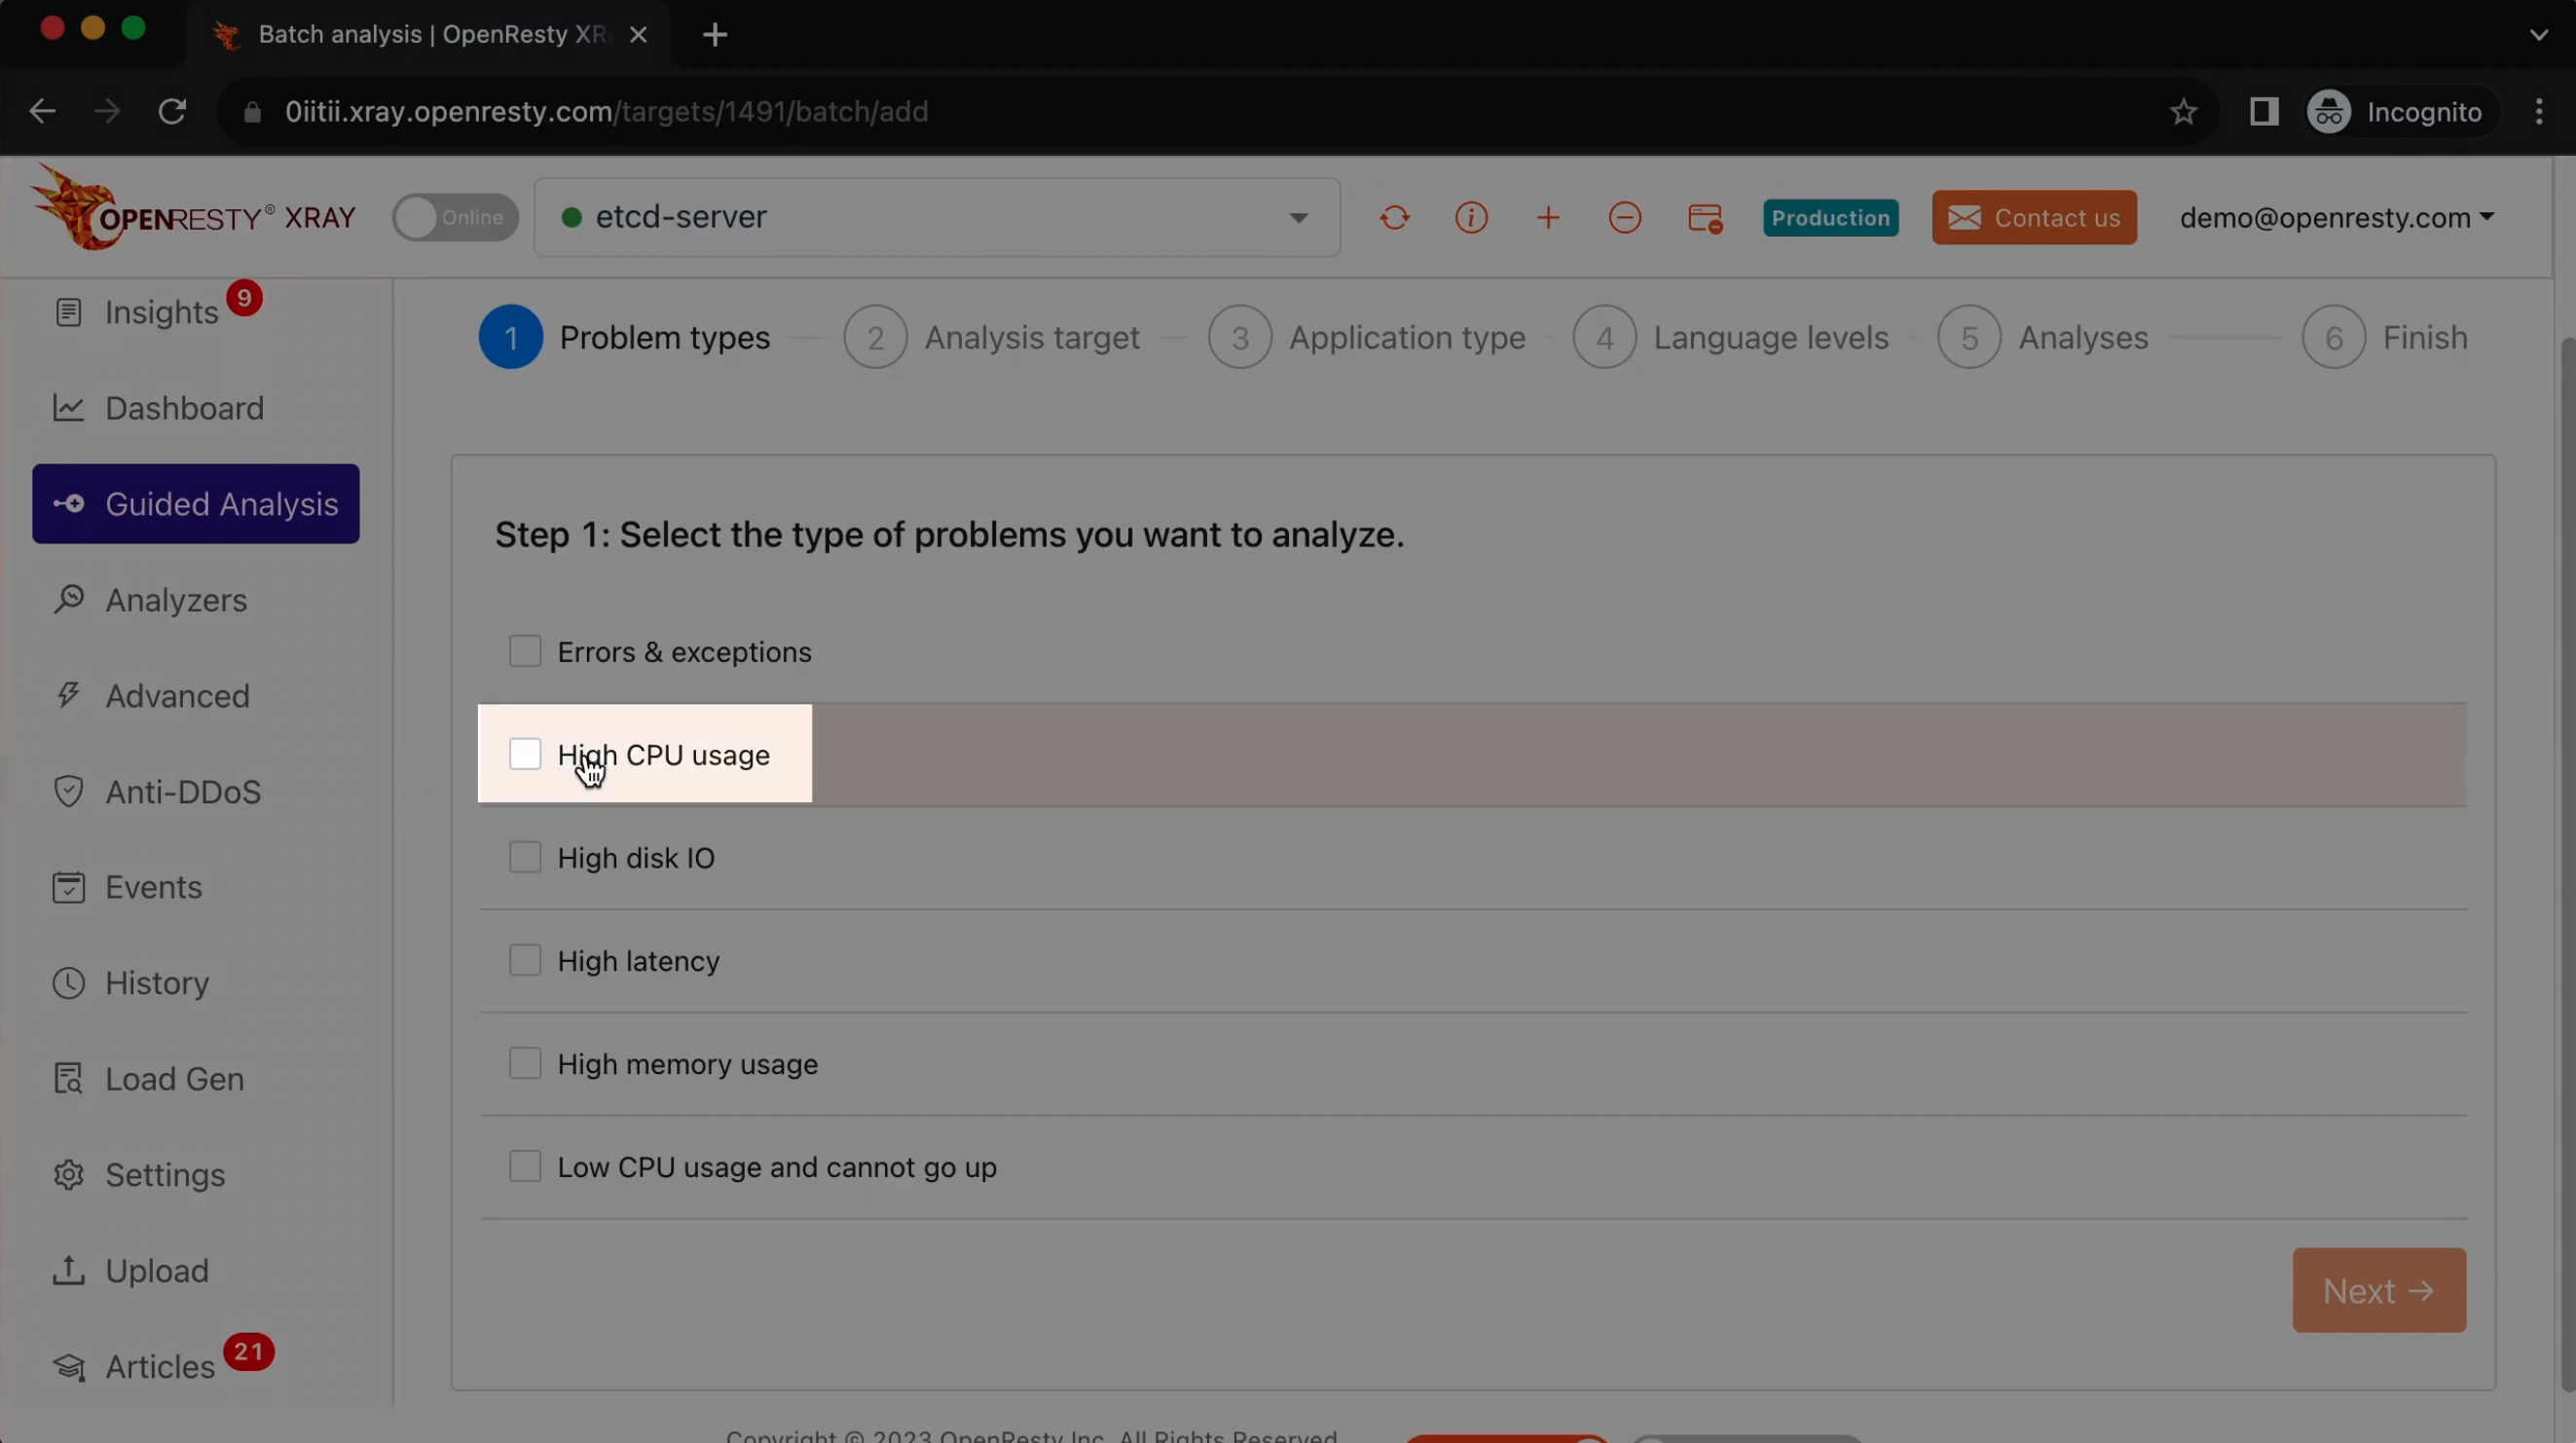
Here you can see different types of problems that you can diagnose.
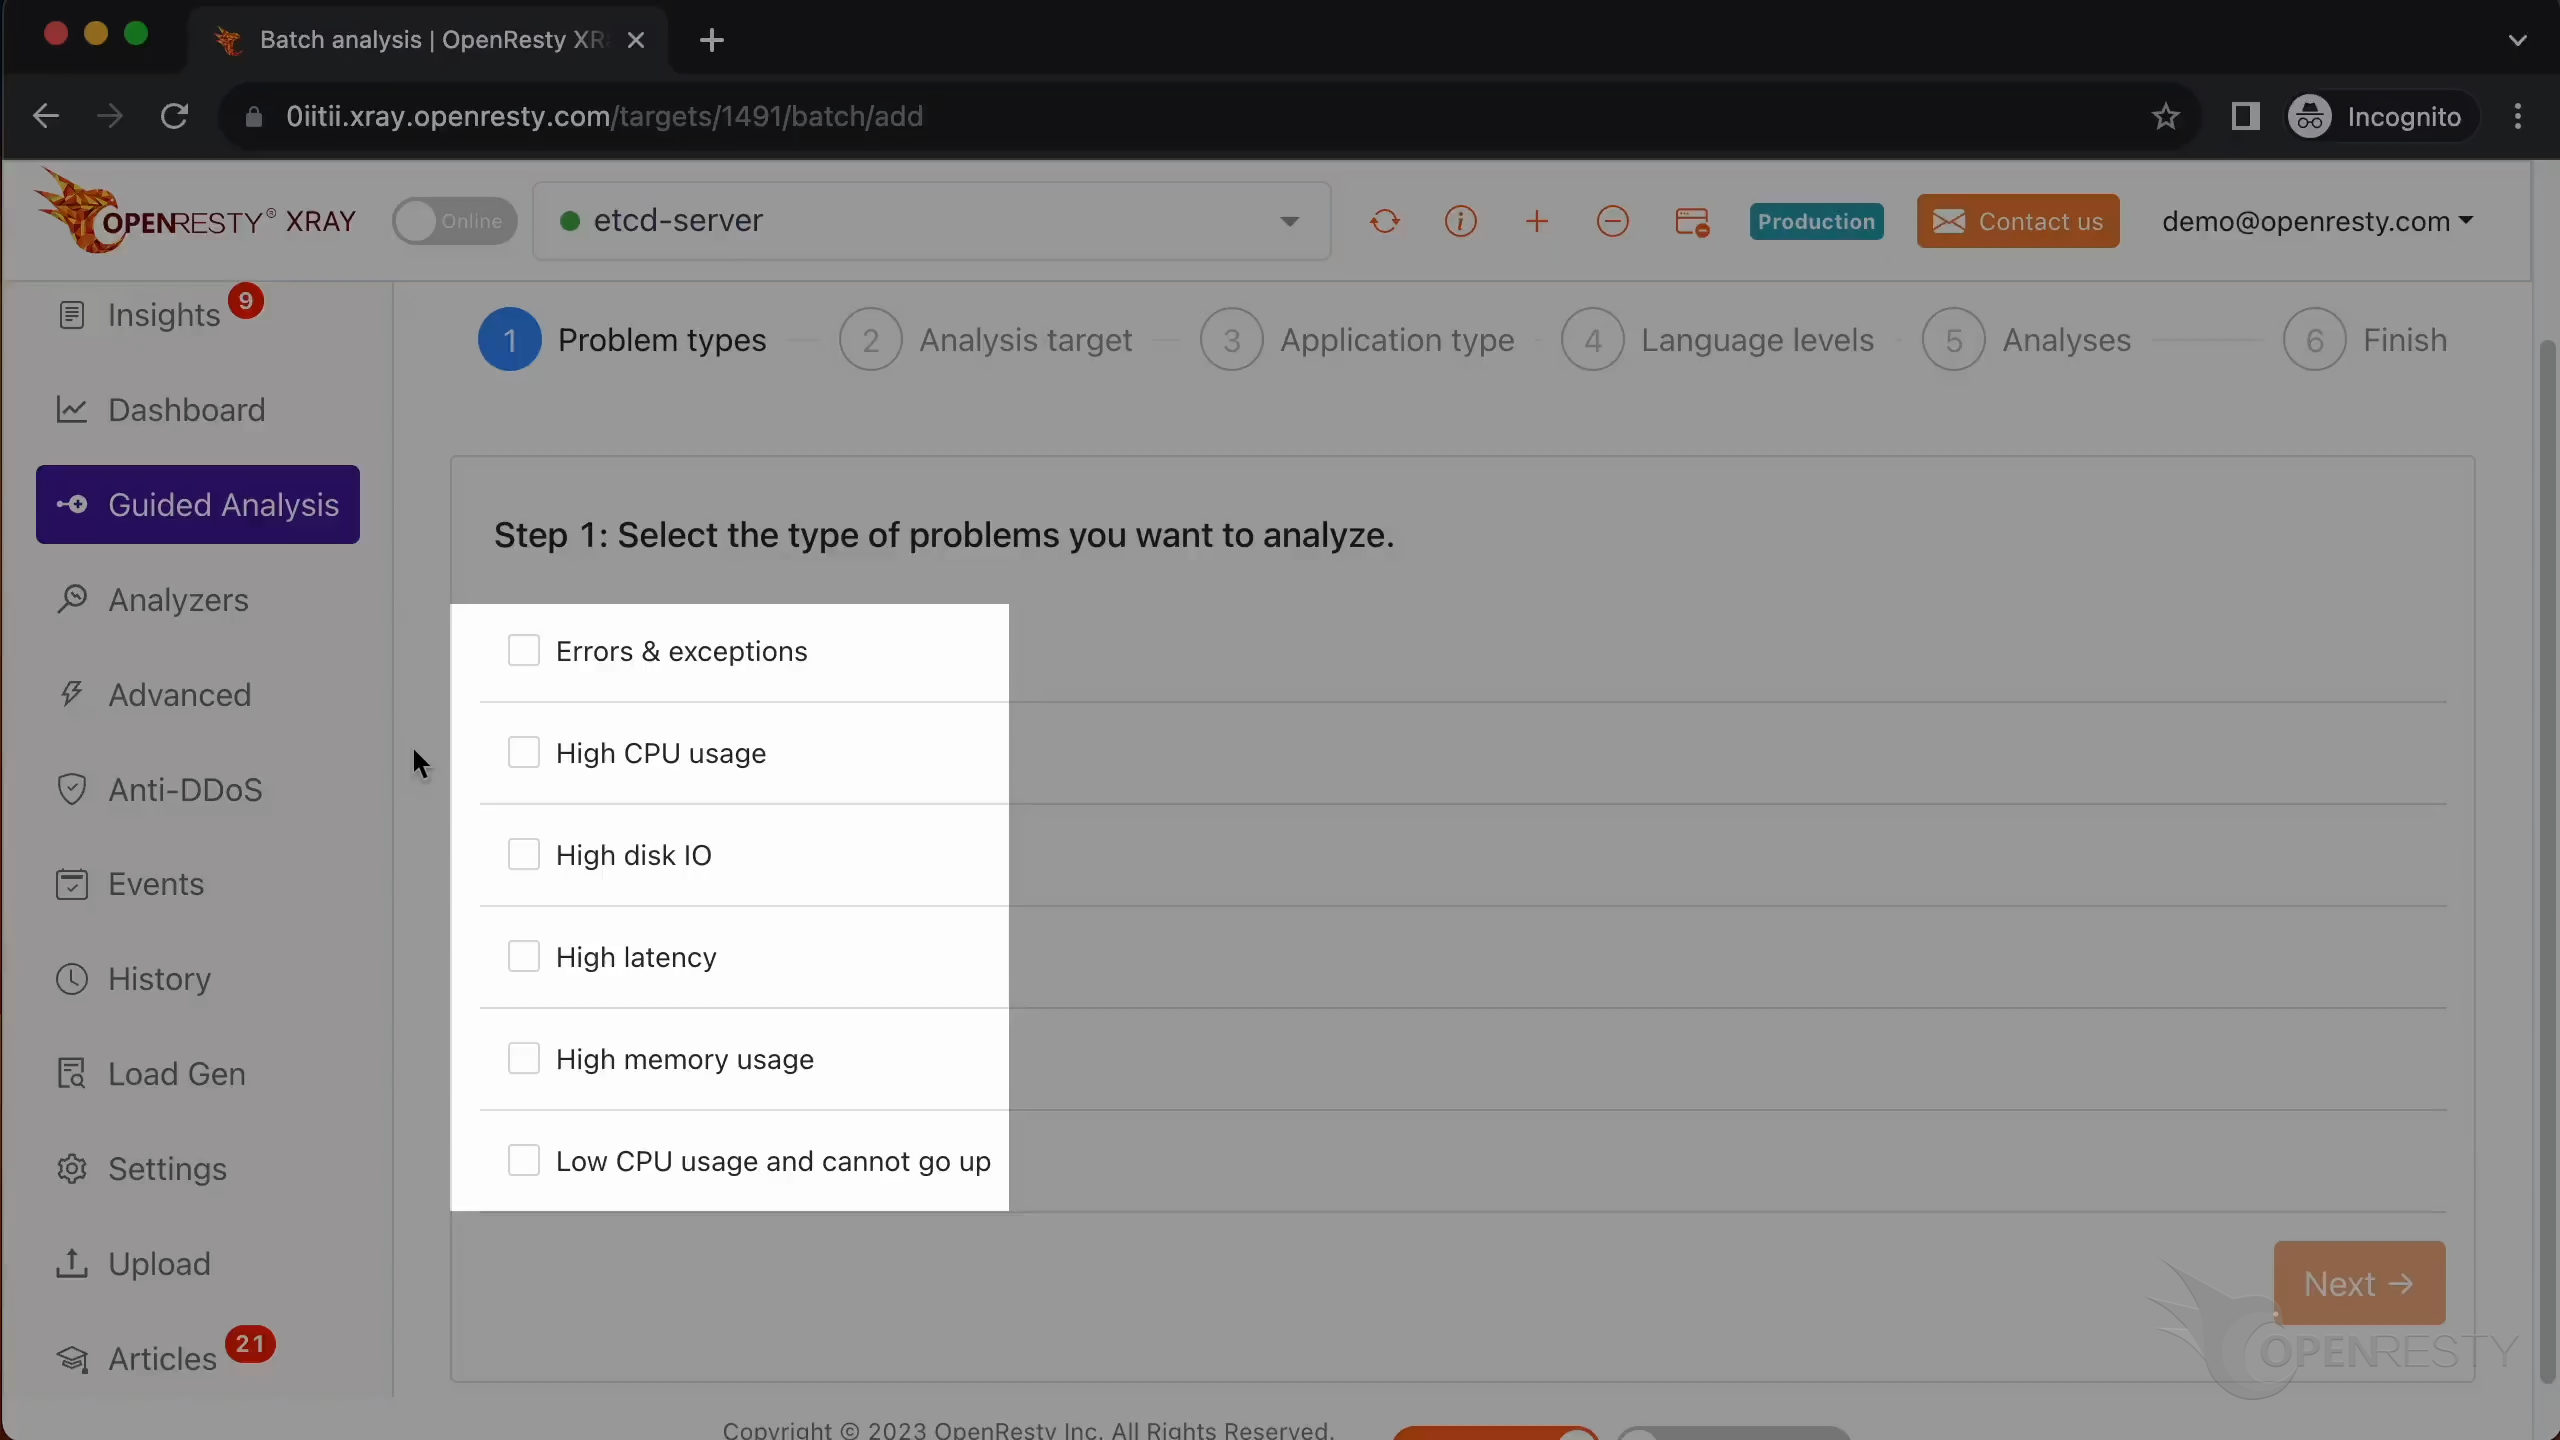
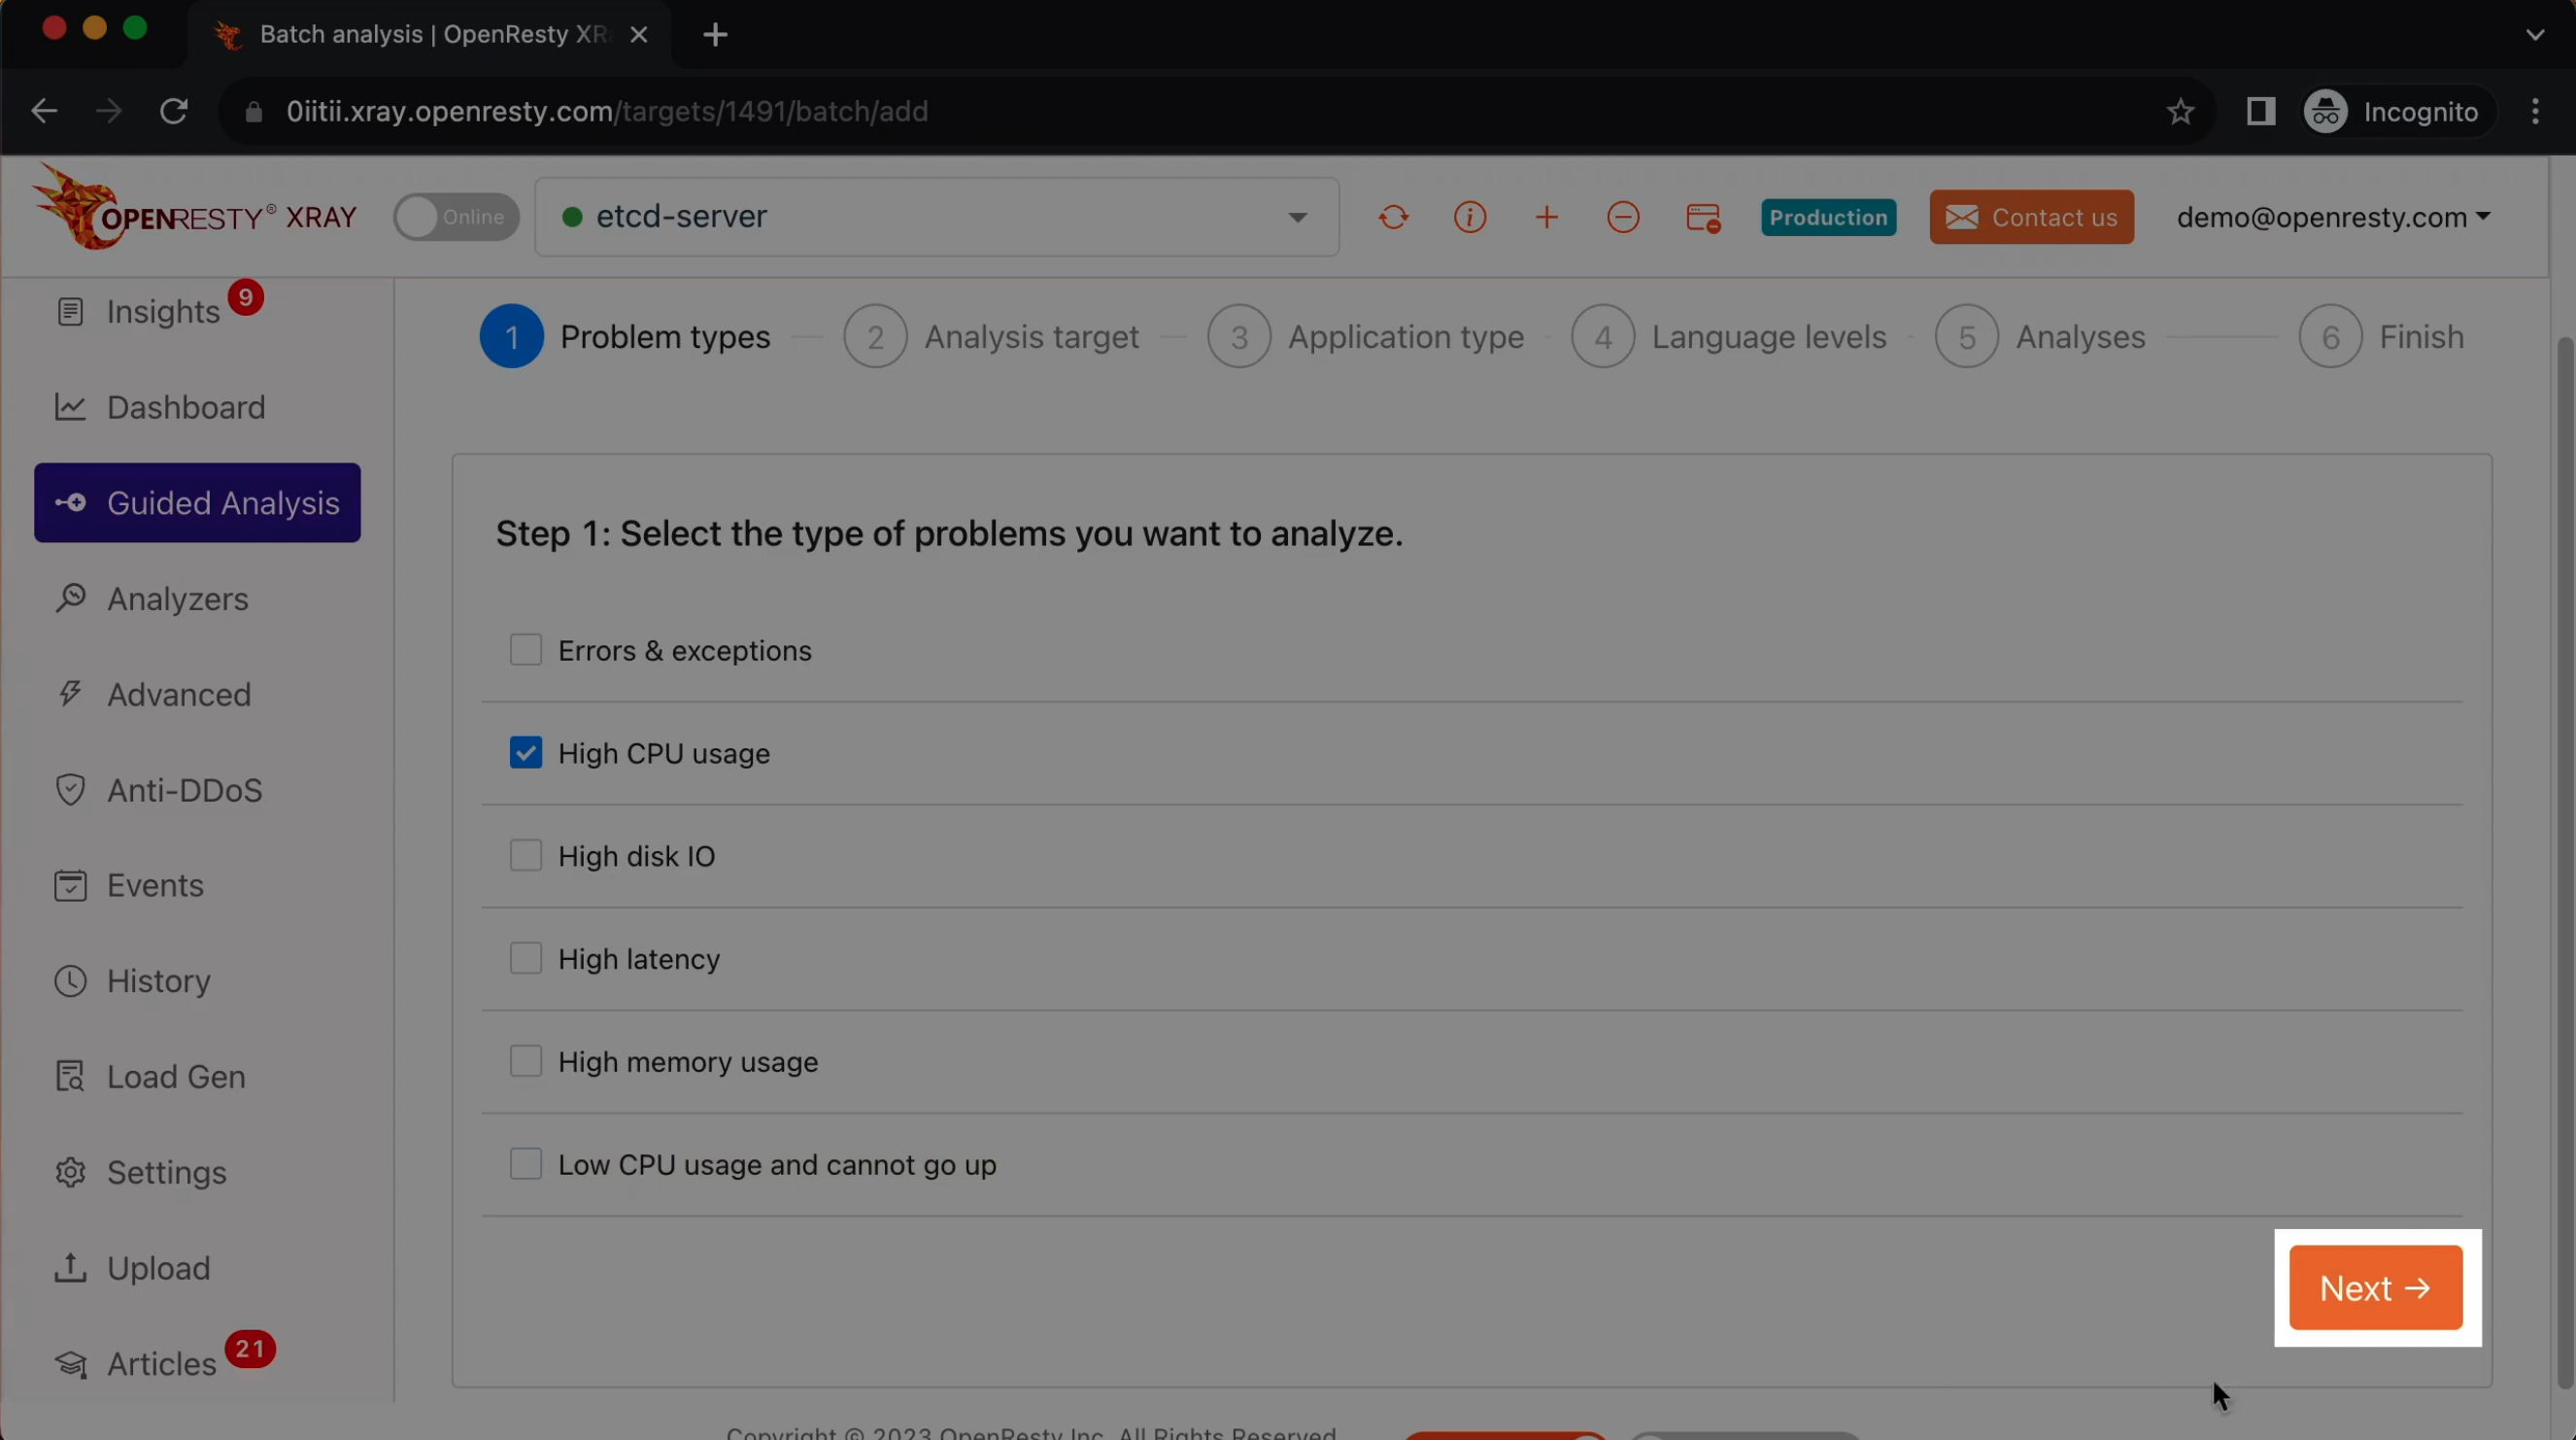
Let’s select “High CPU usage”.
Click on “Next”.
Select the Go application for etcd.
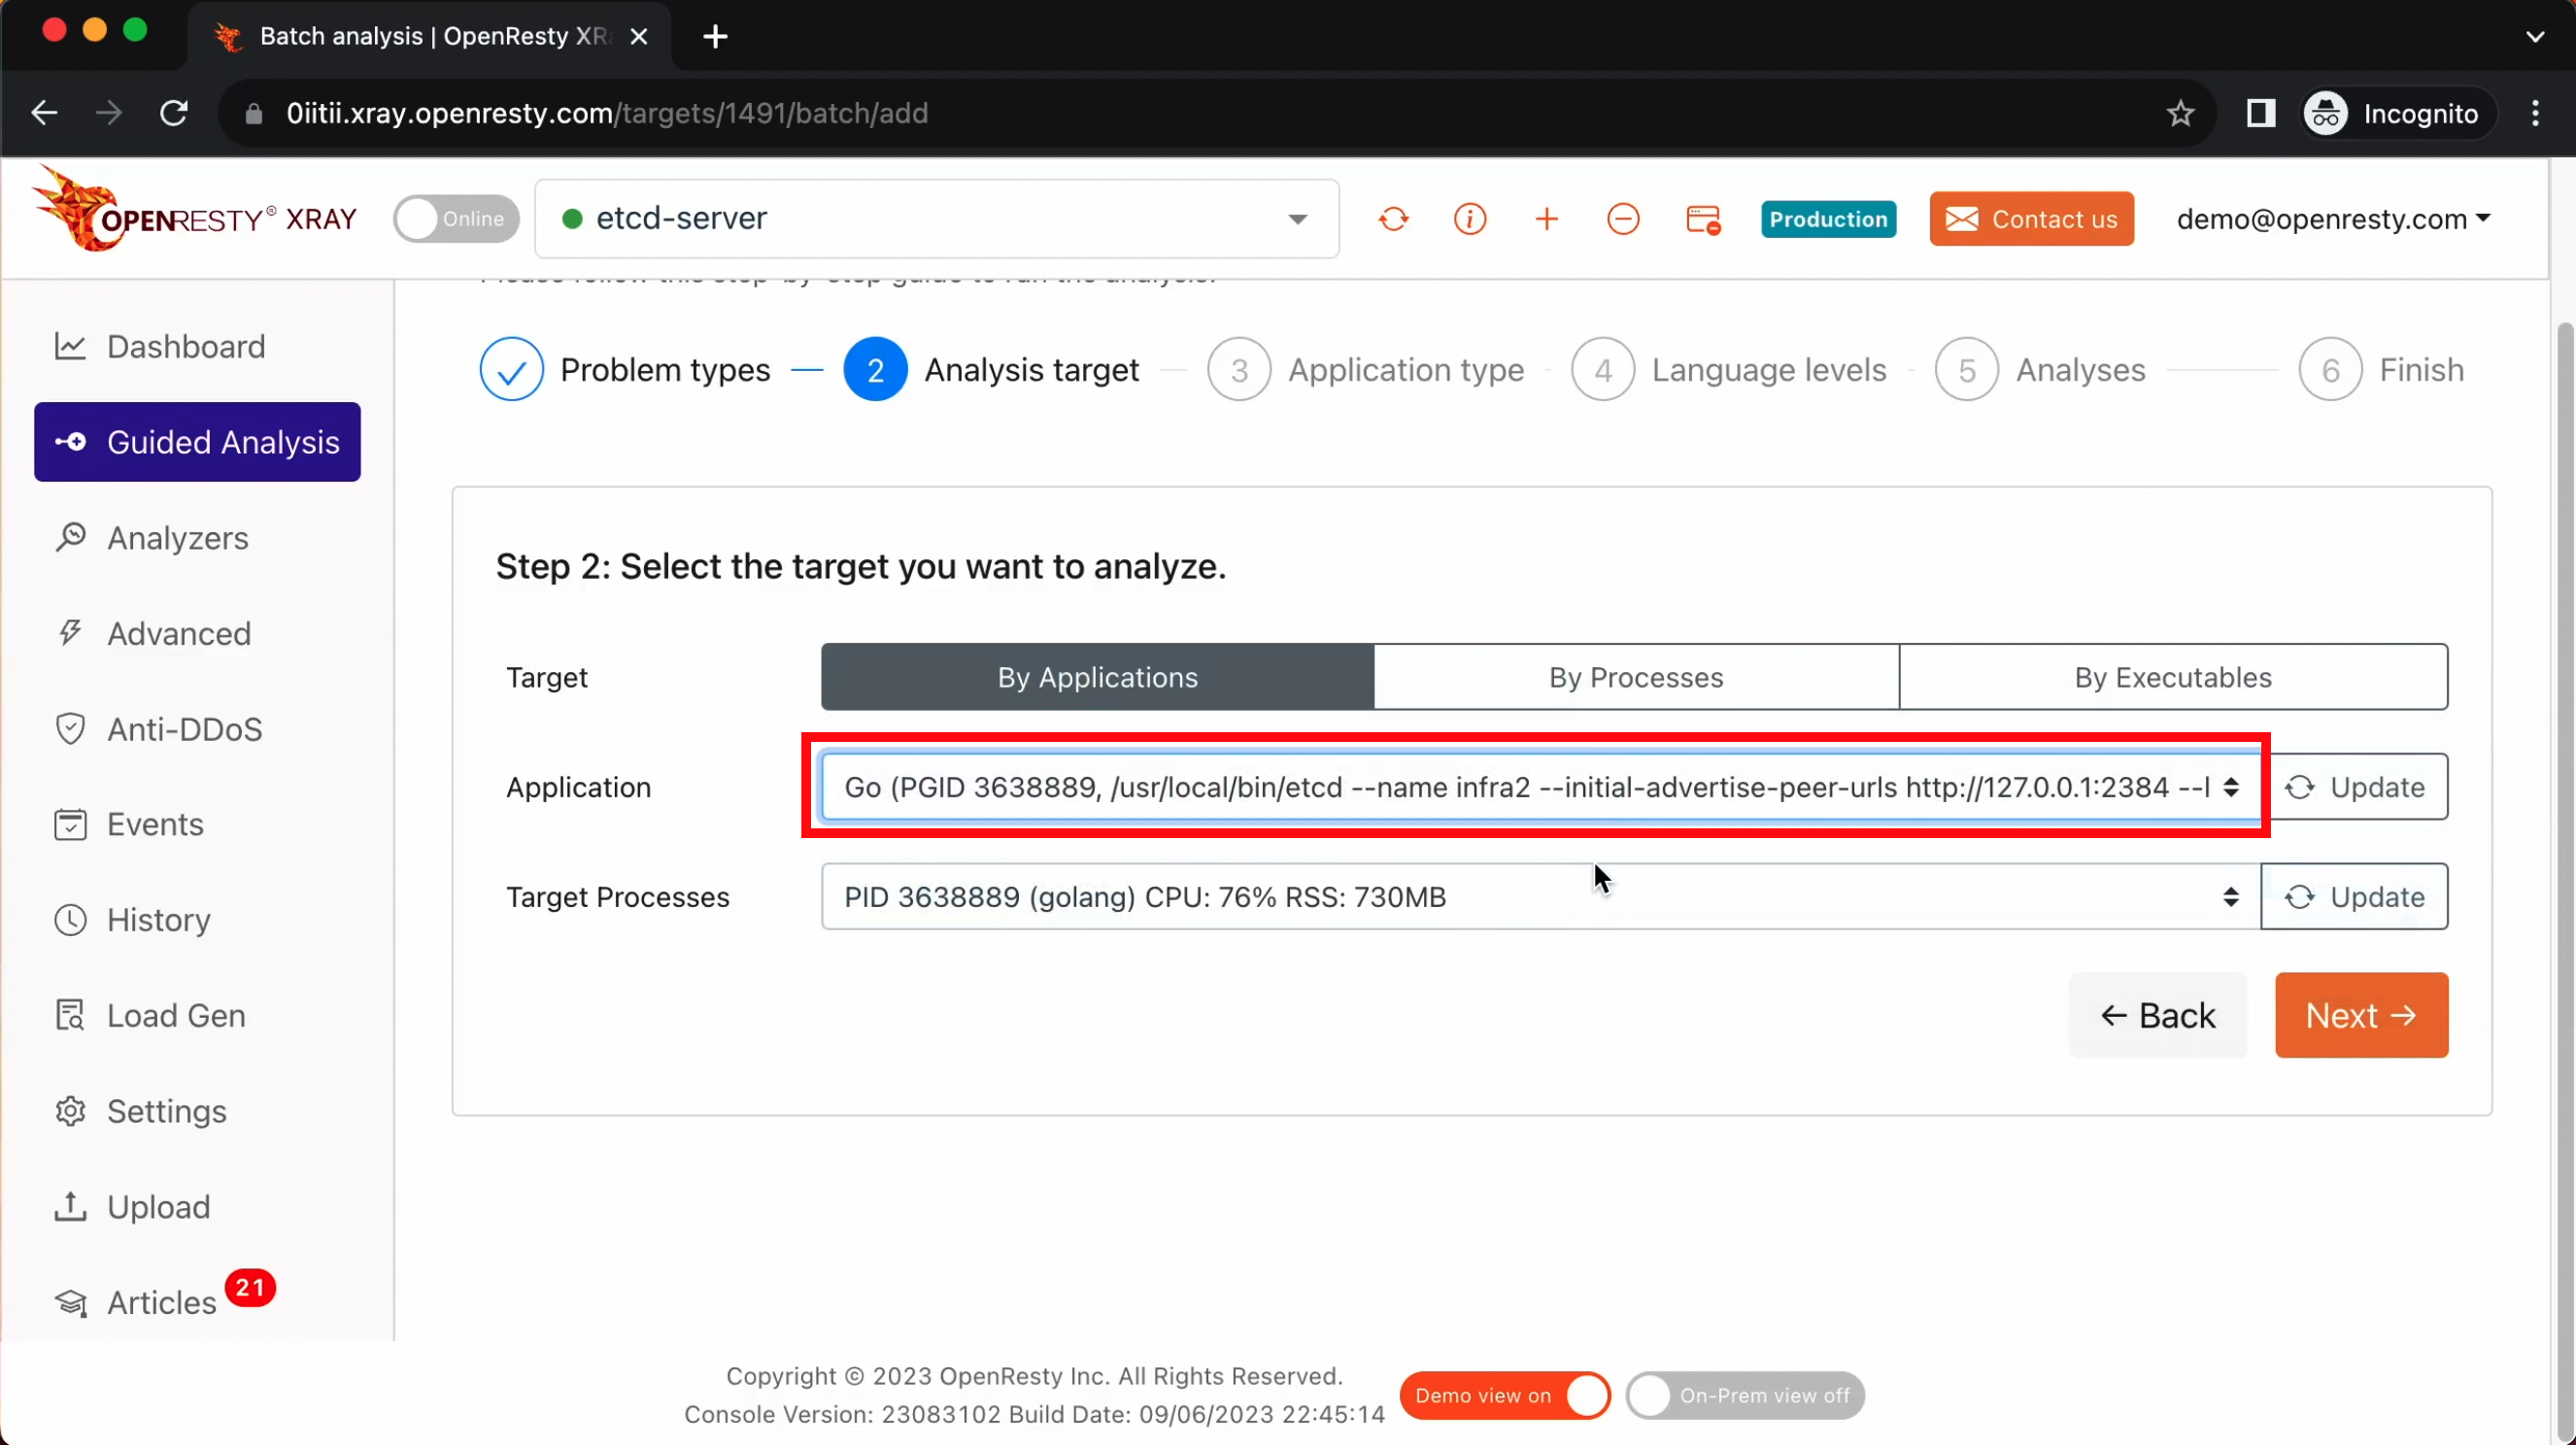
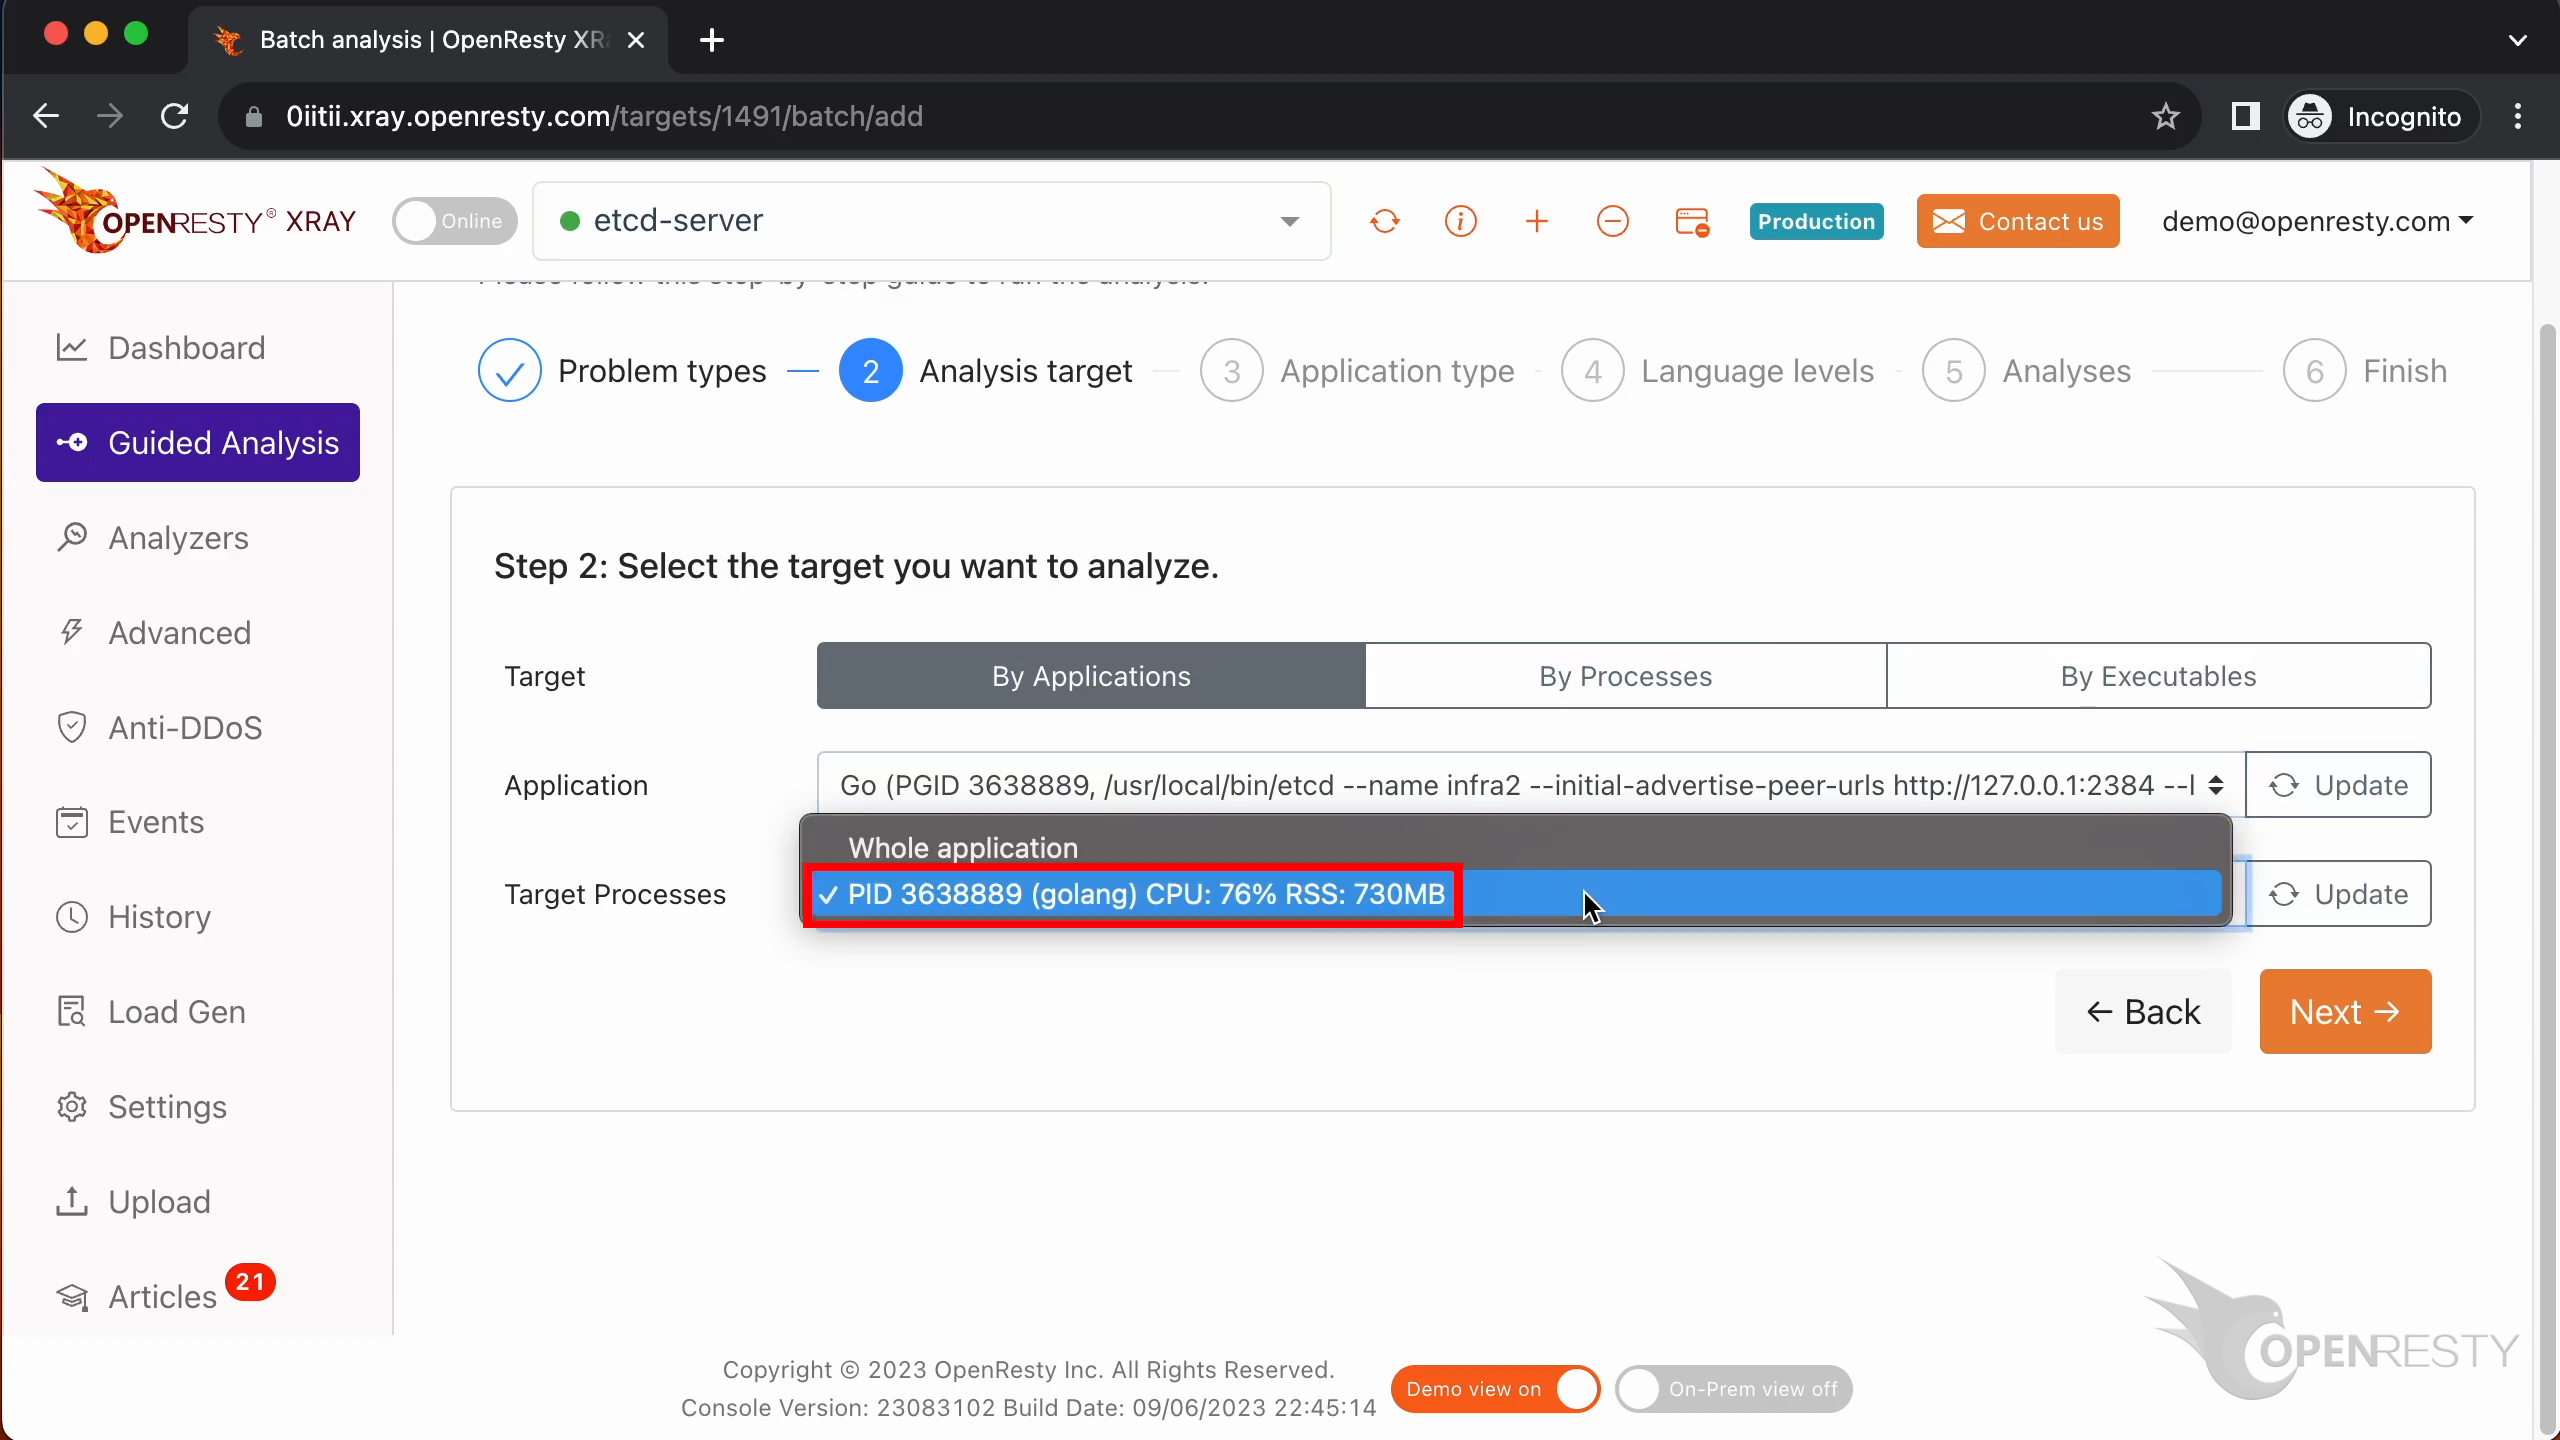
Select the process that consumes more than 70% of the CPU resources. This is what we saw previously in top.
Make sure that the application type is right. Usually the default should be correct.
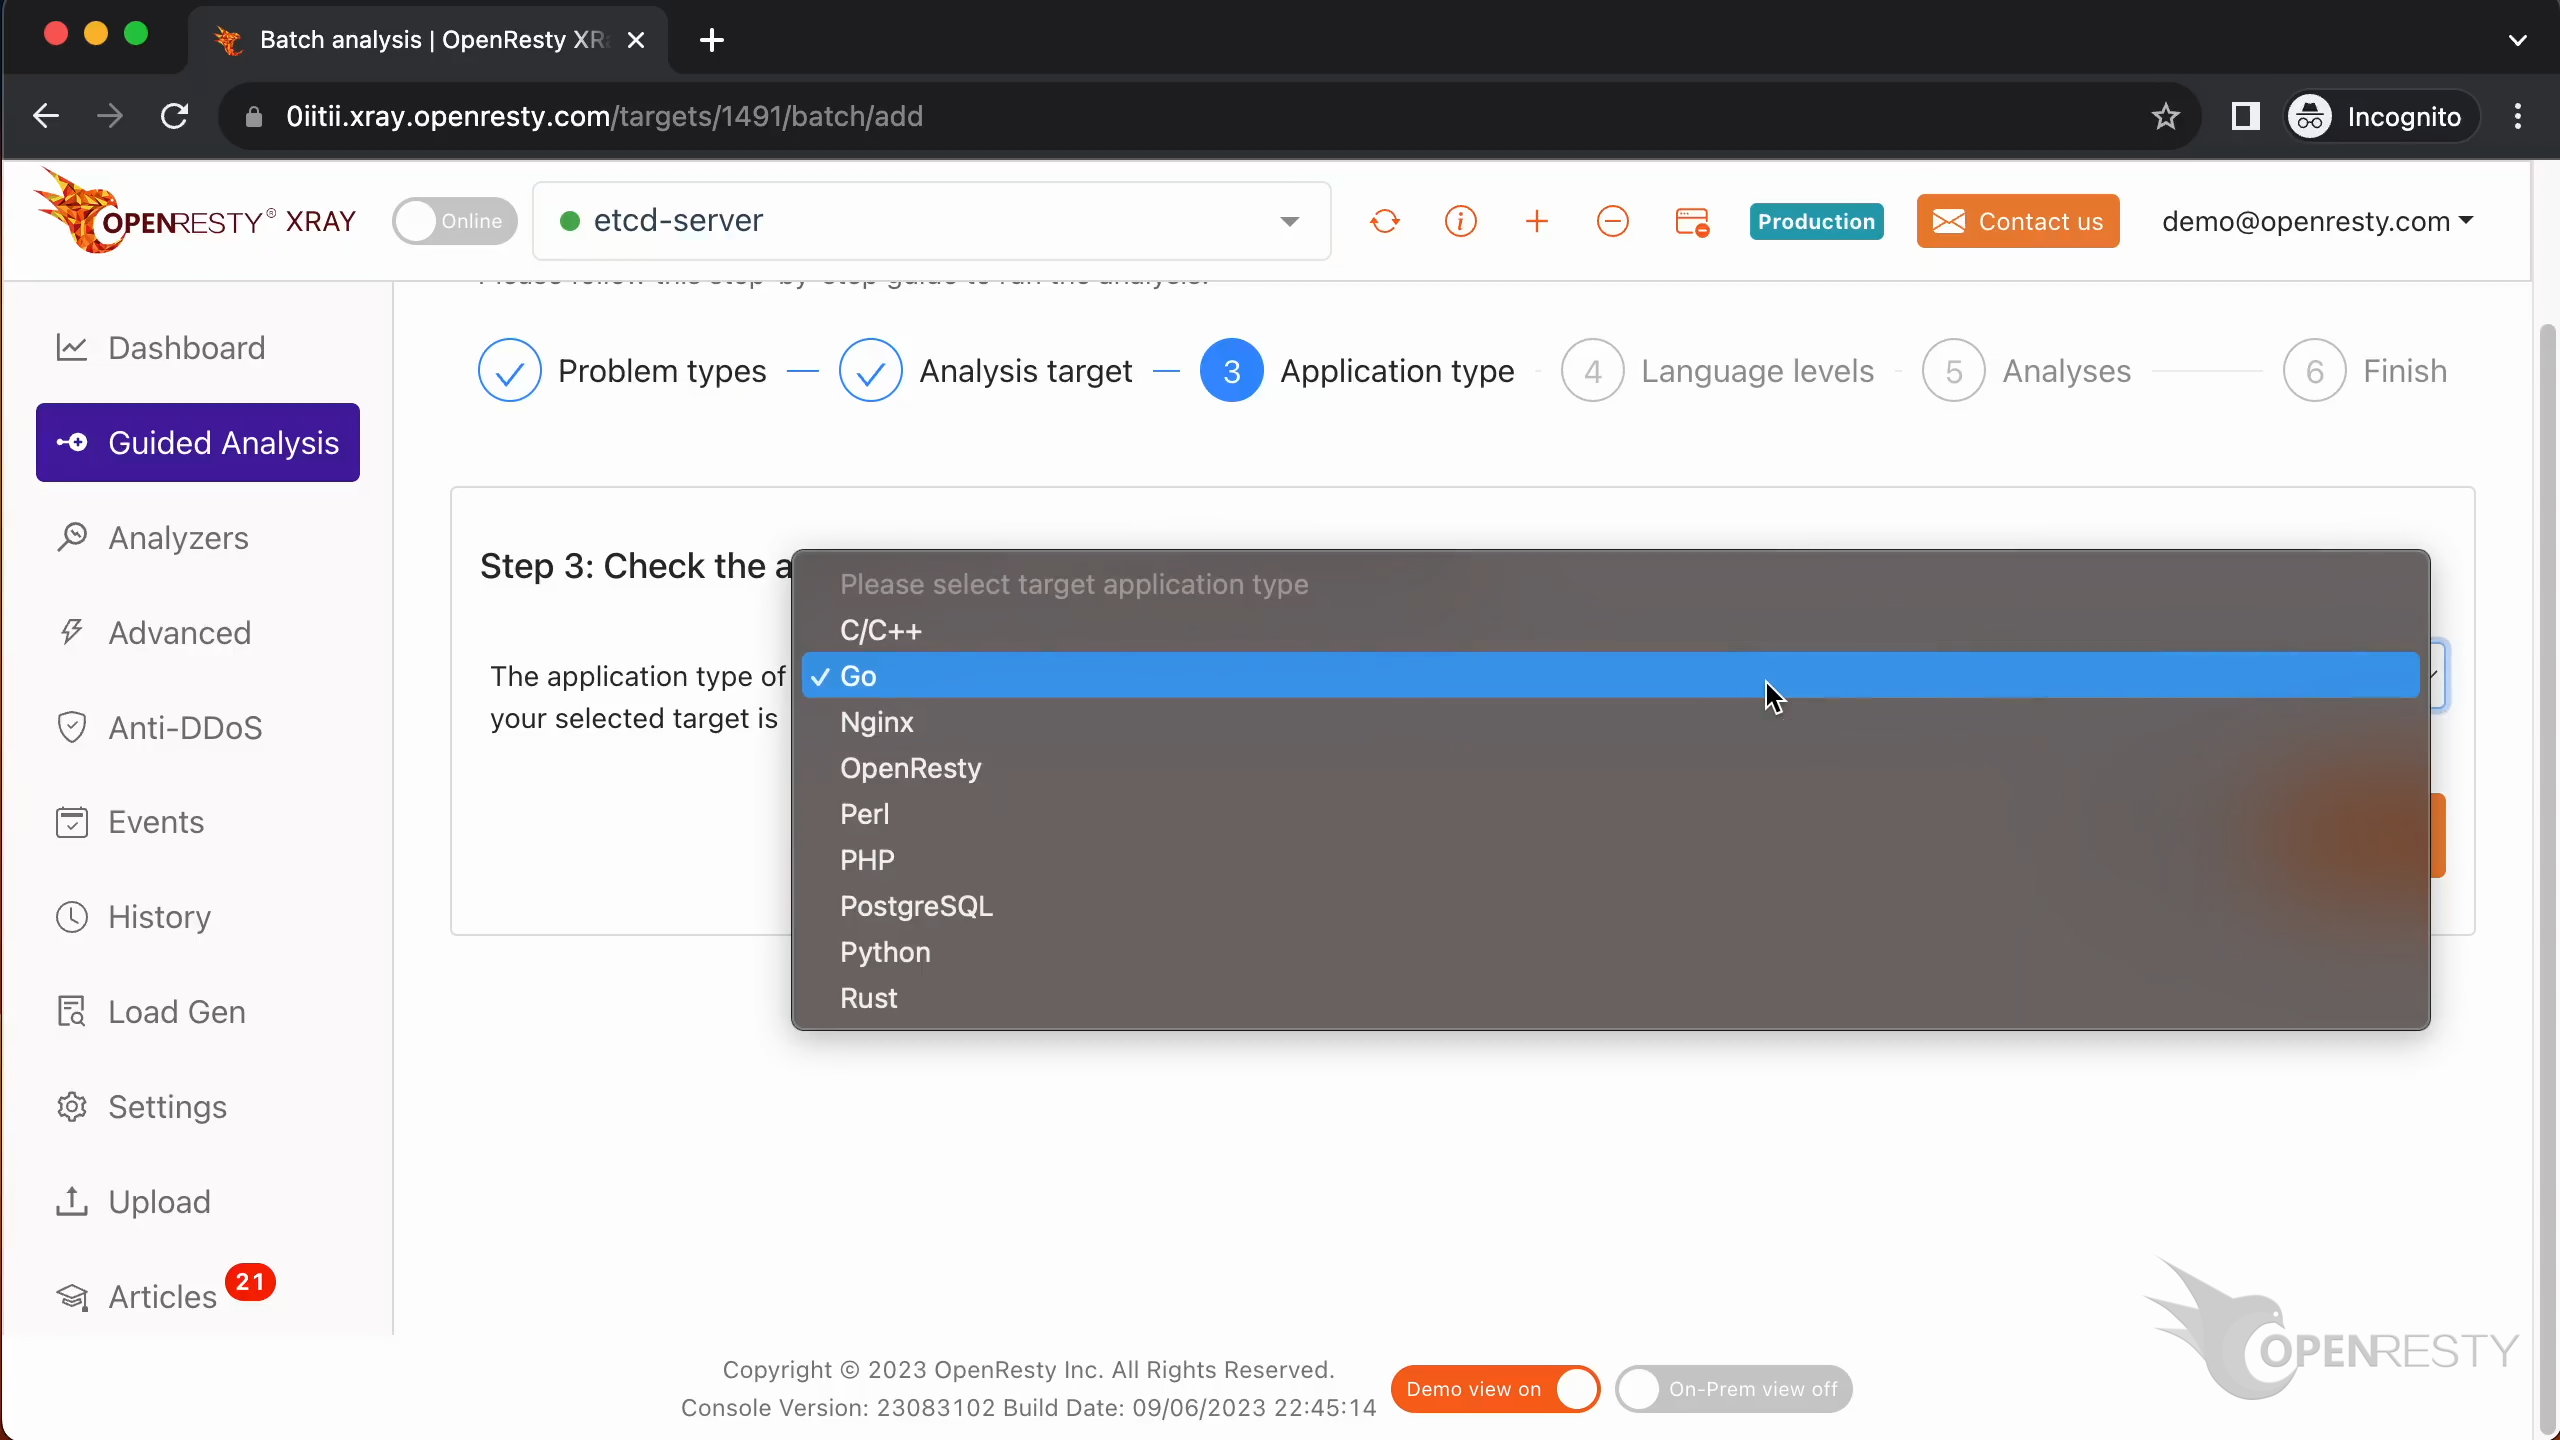
The language level here is just “Go”.
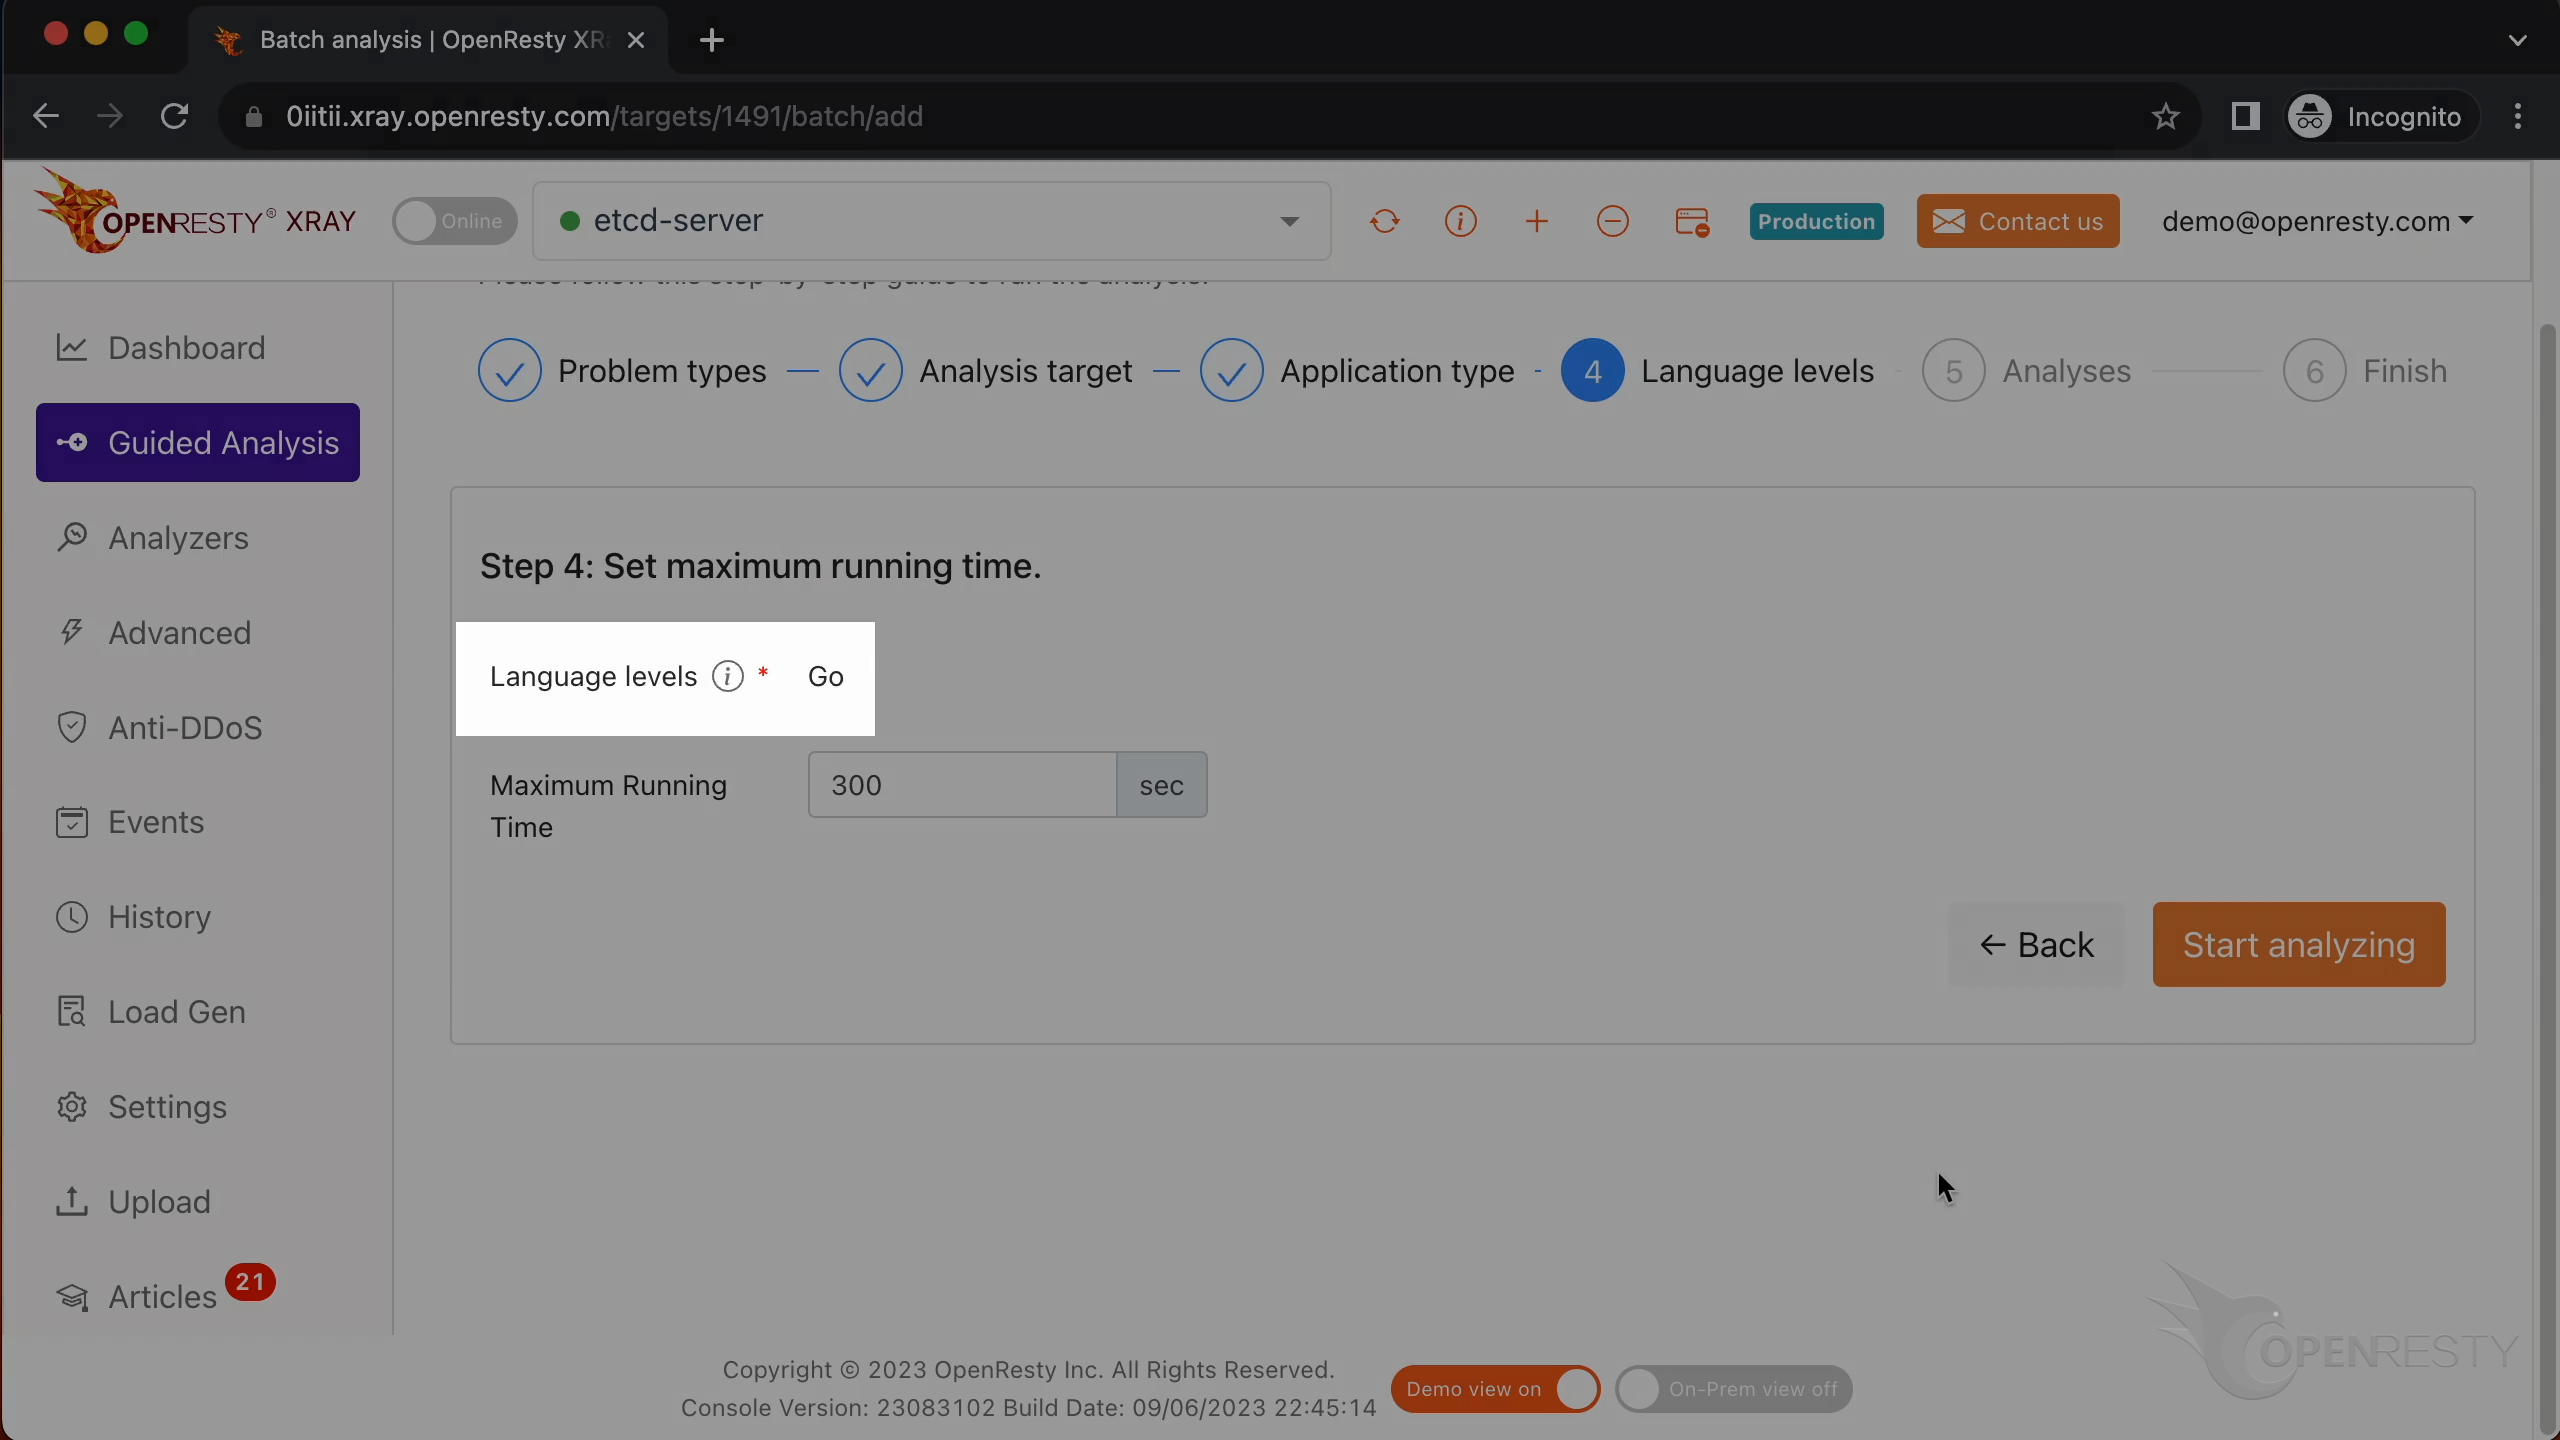
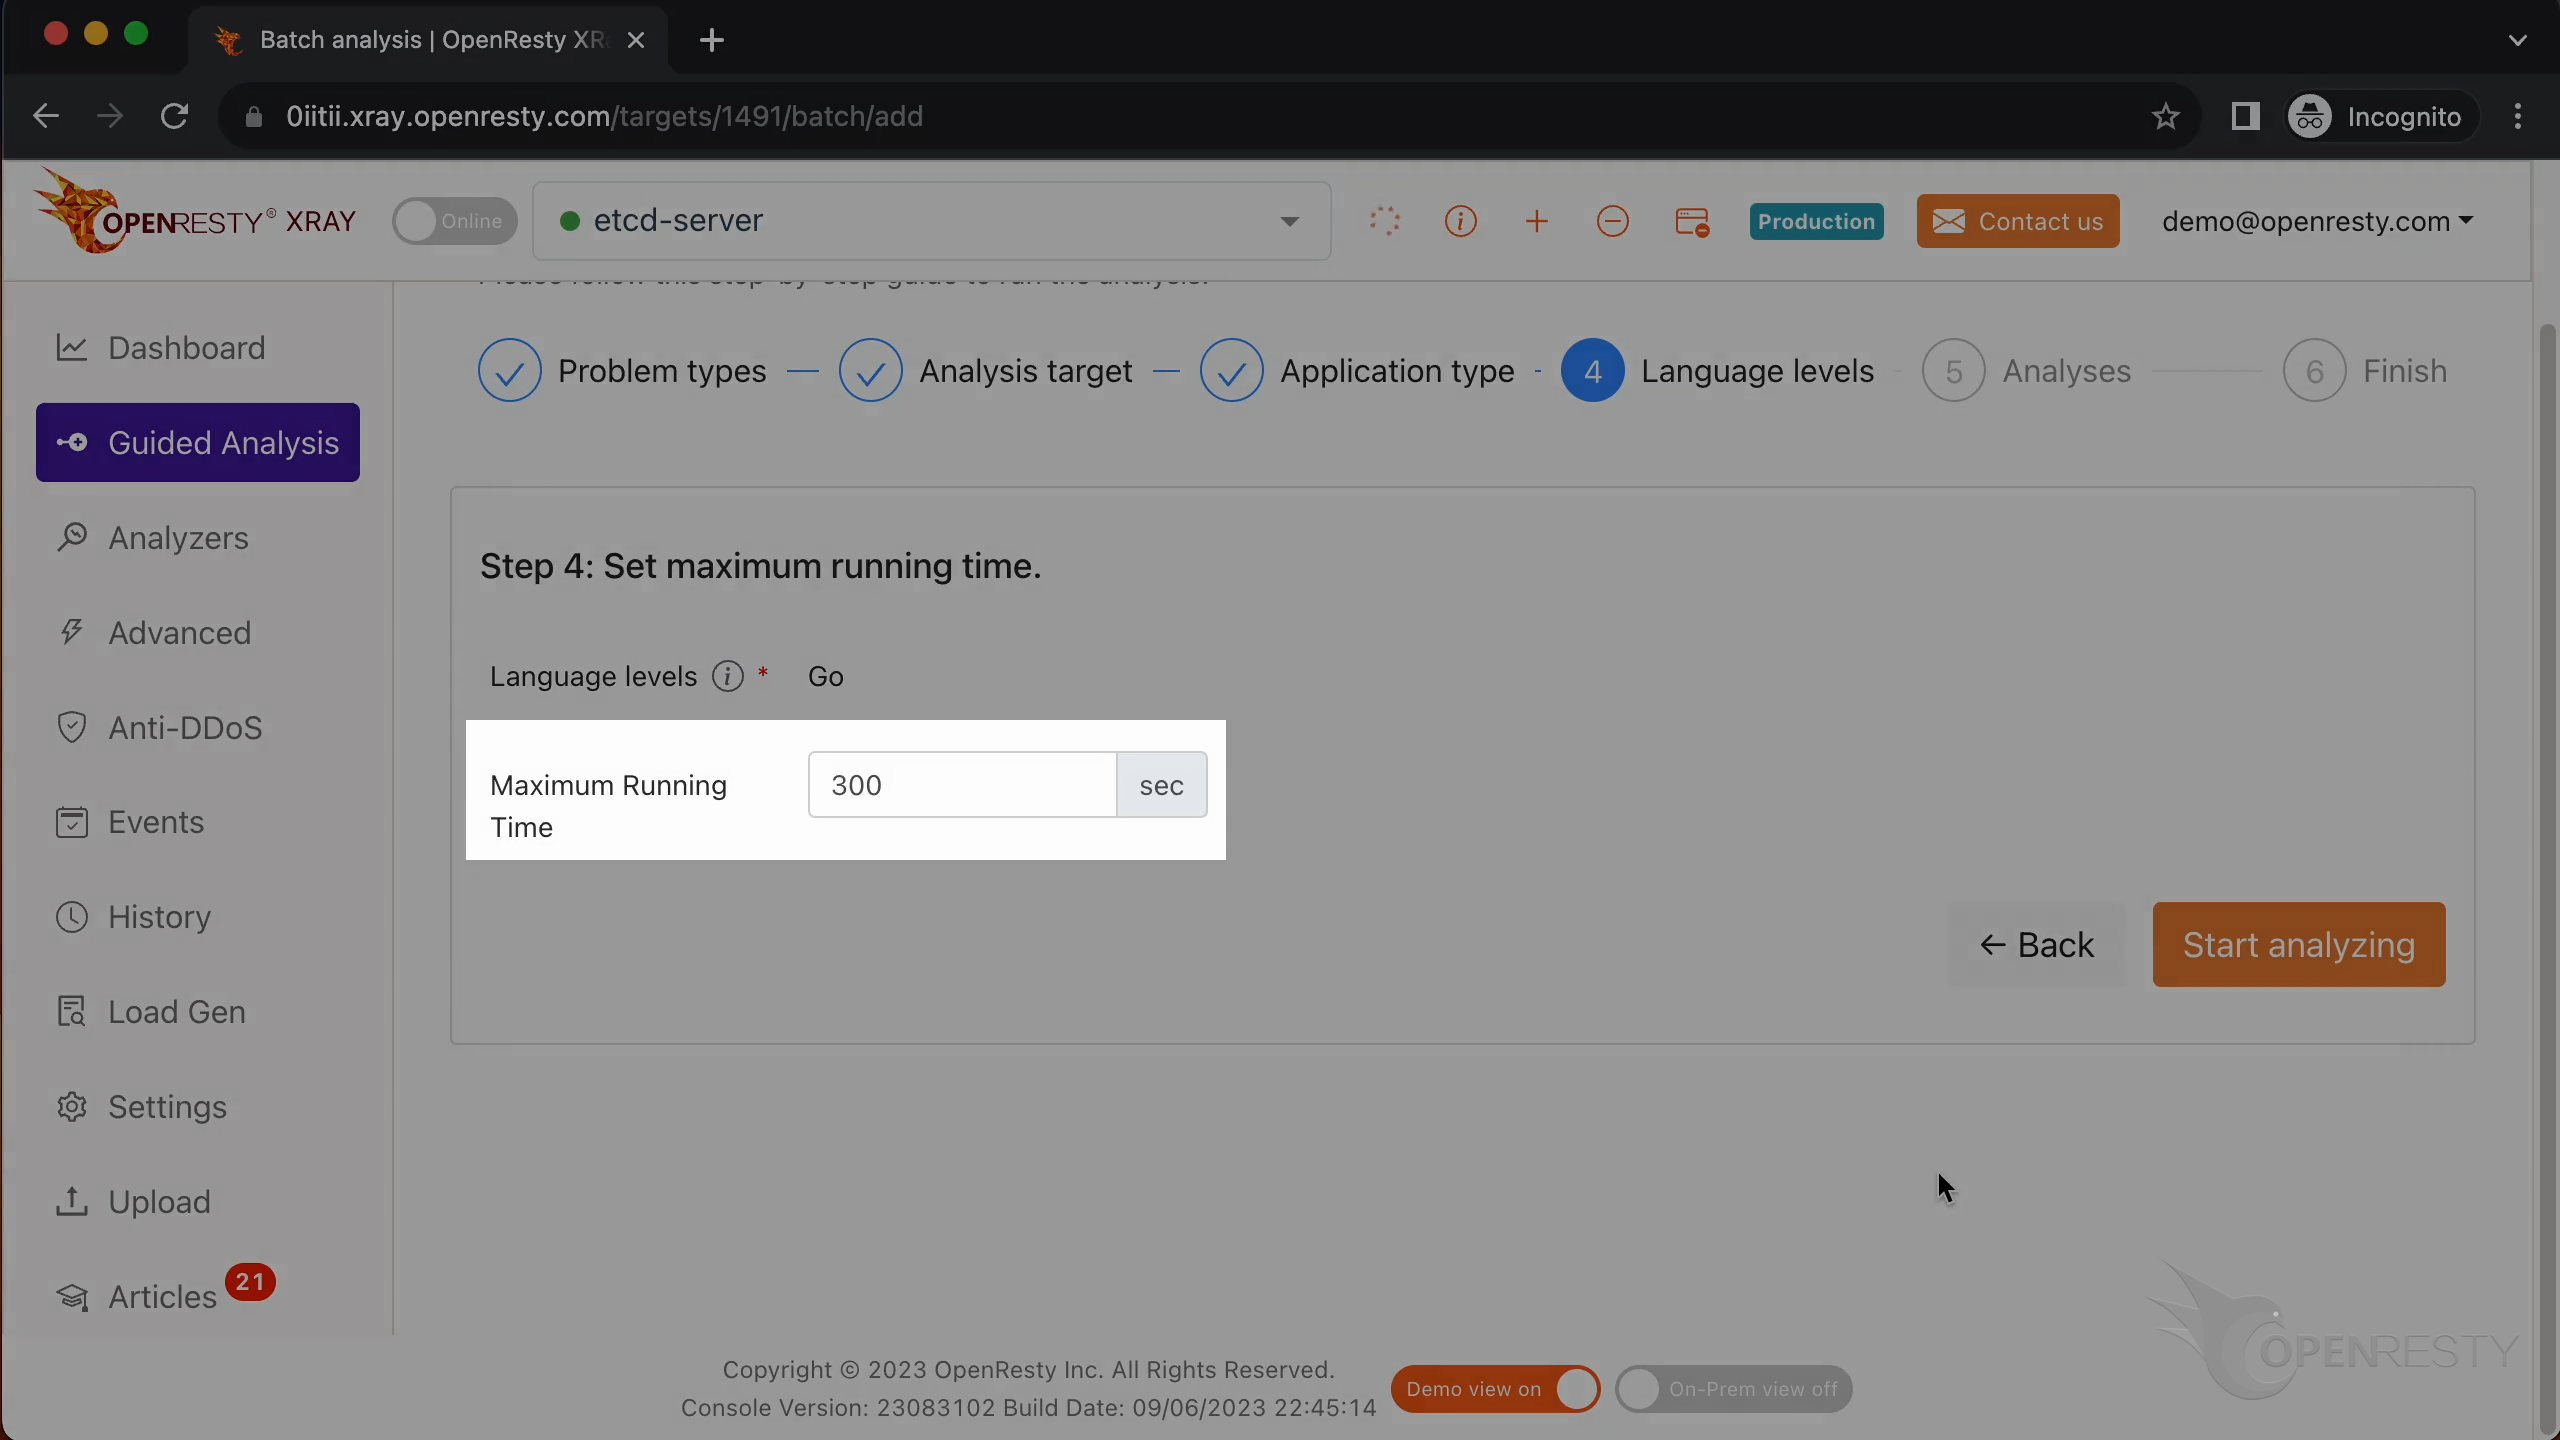
We can set the maximum analyzing time. We’ll leave it as 300 seconds, which is the default value.
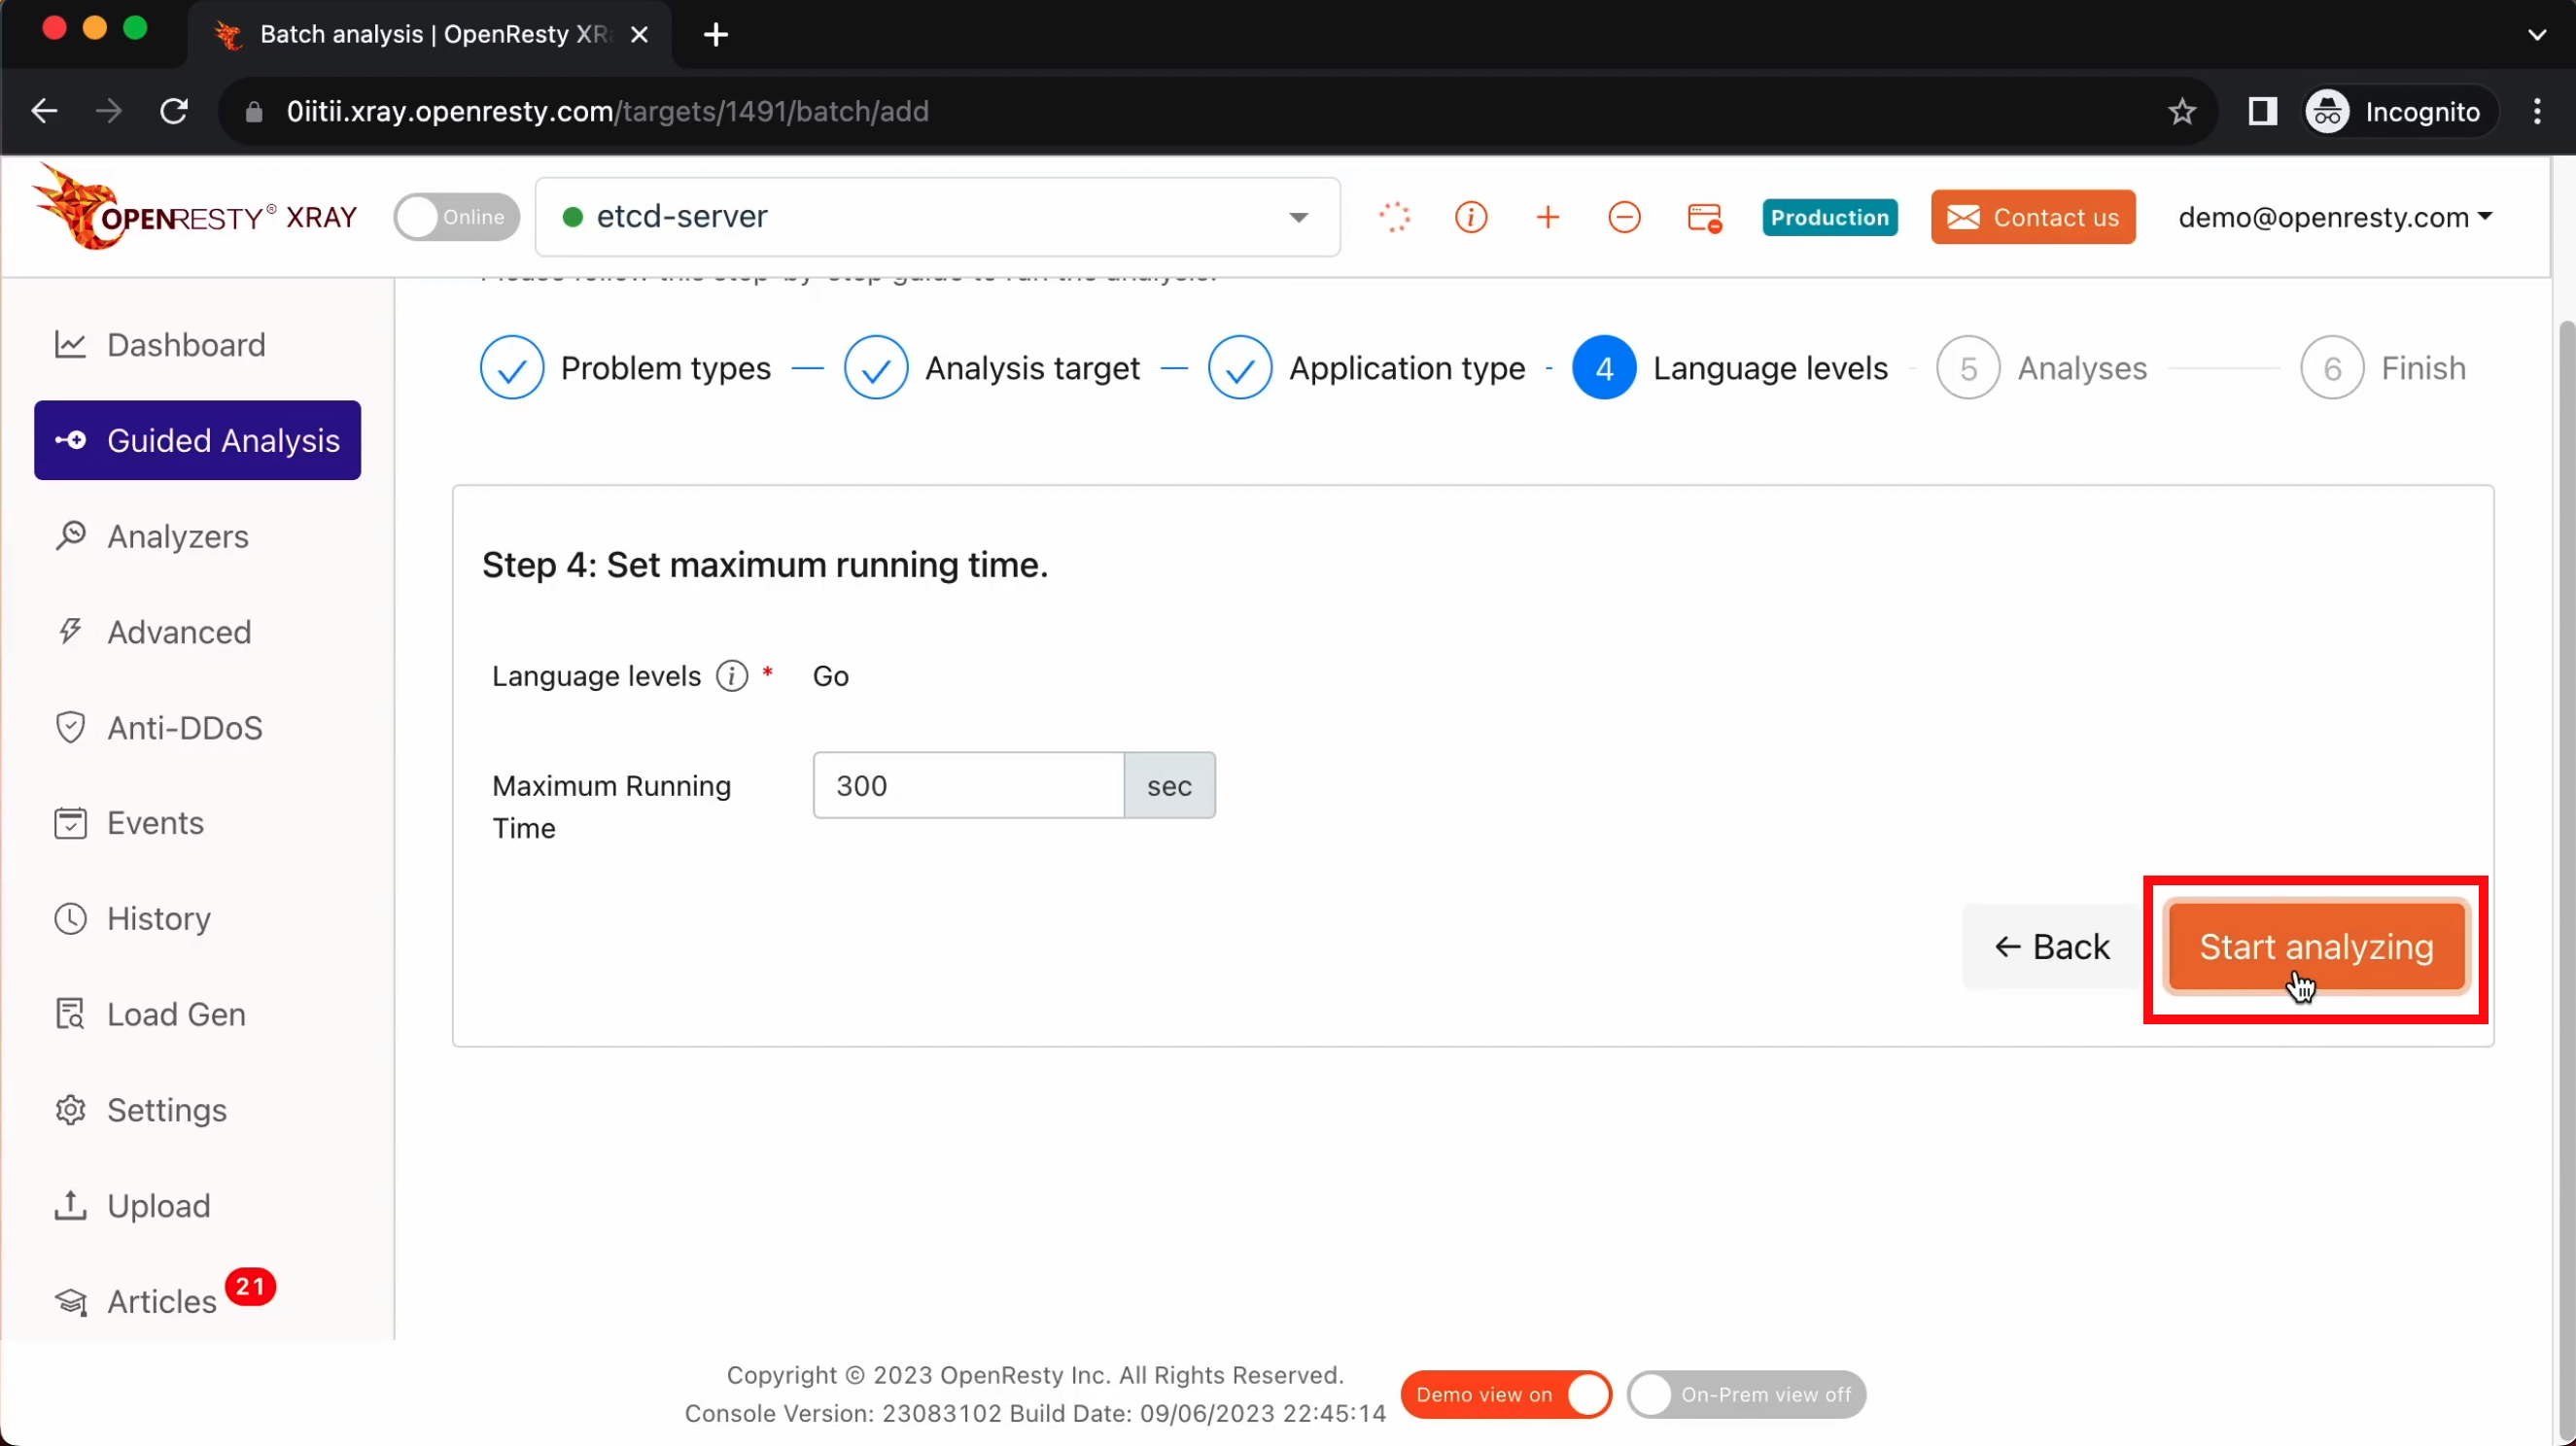
Let’s start analyzing.
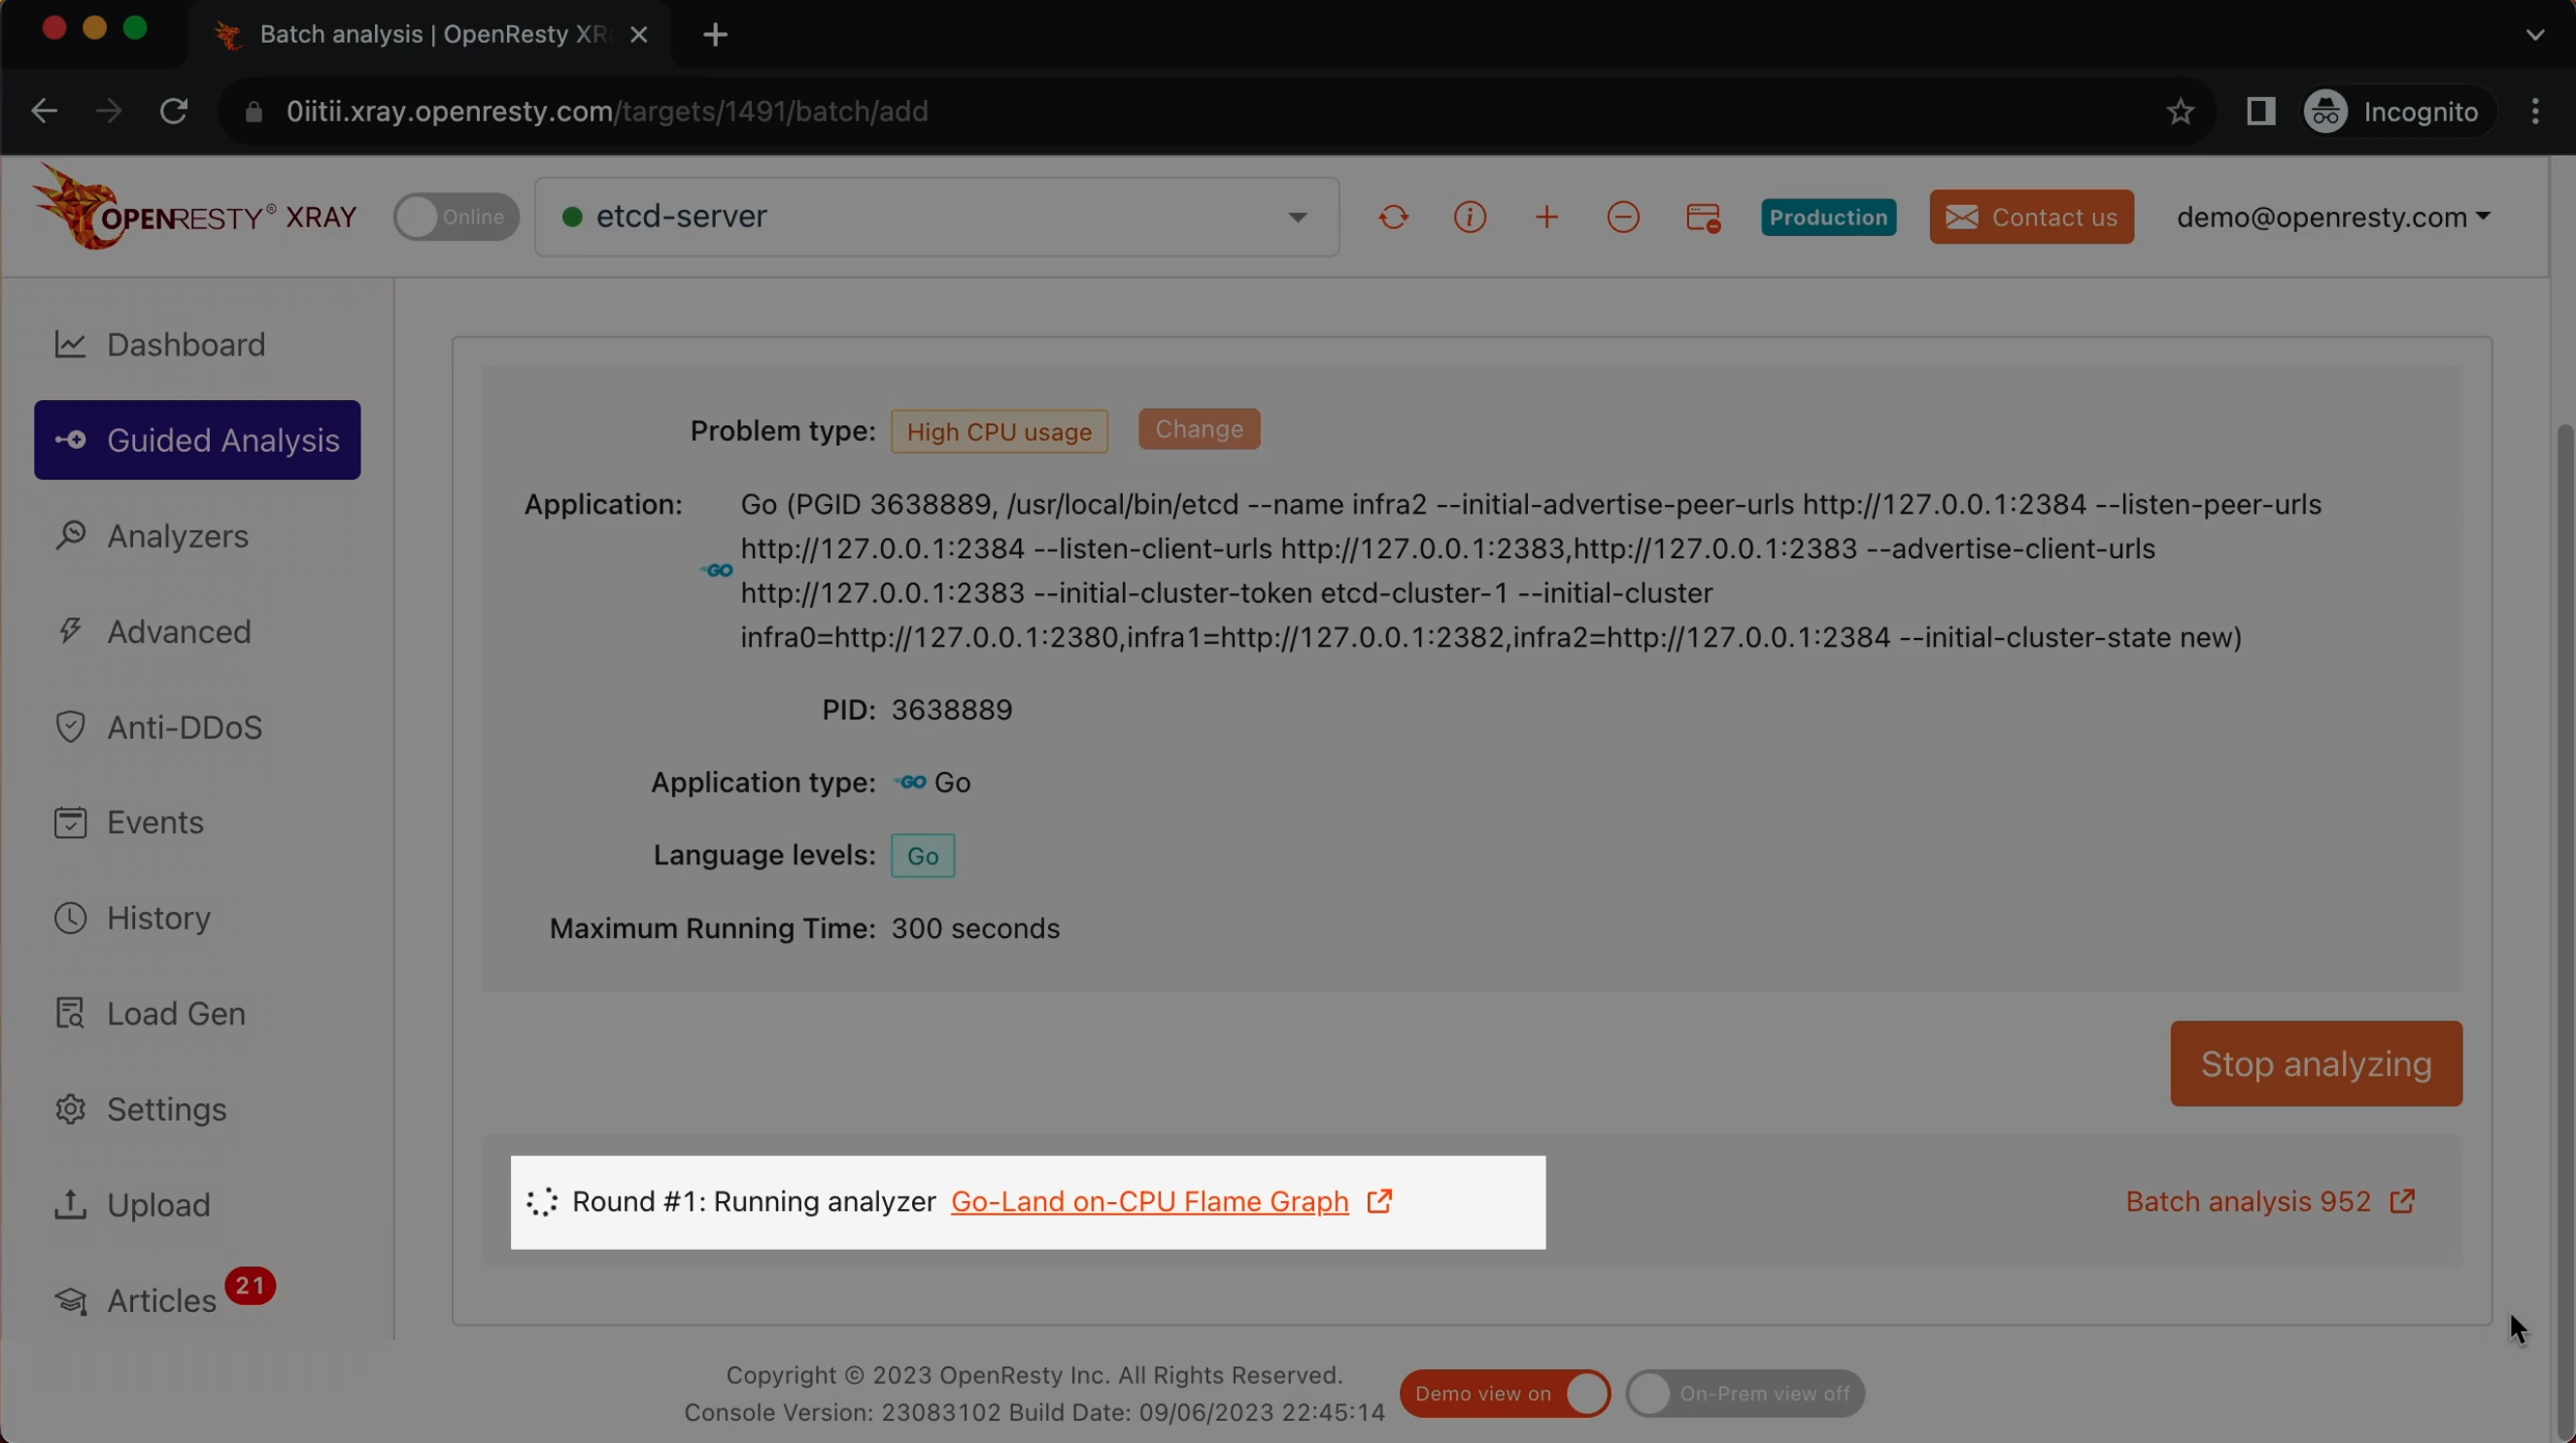
The system will keep performing different rounds of analysis. Now it’s executing the first round.
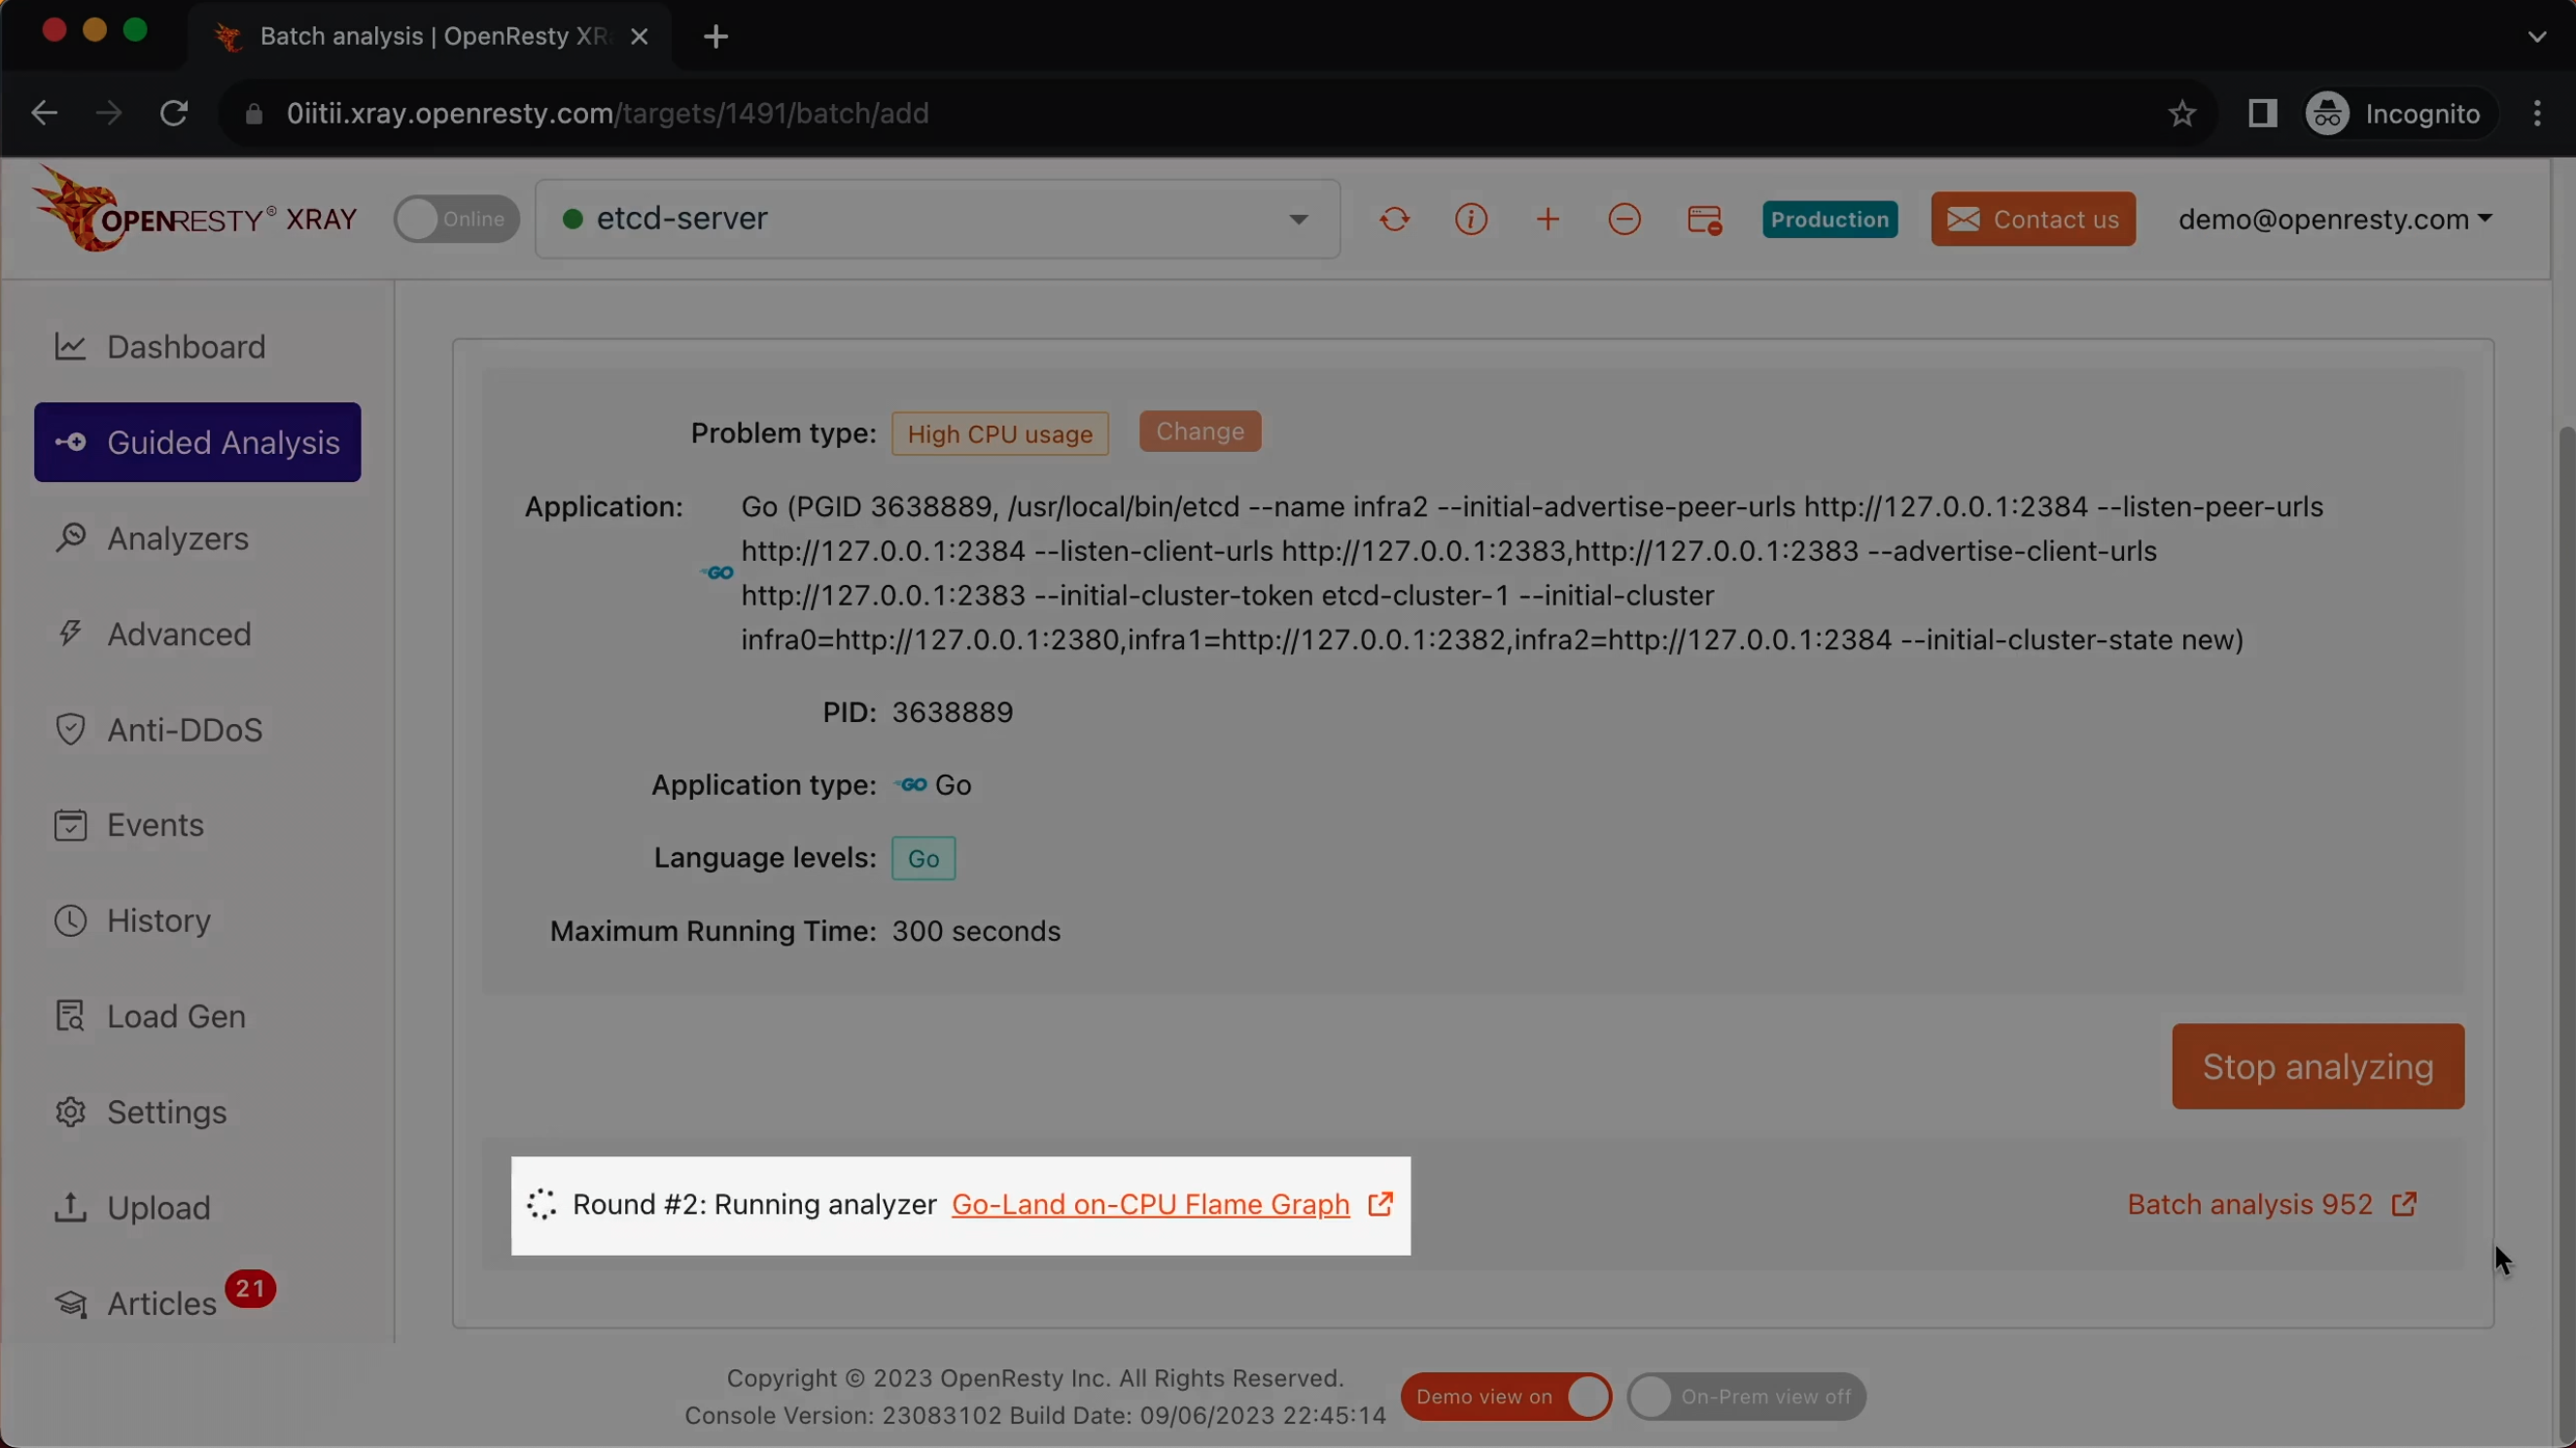
The first round is done and it’s on to the second one already. That’s enough for this case.
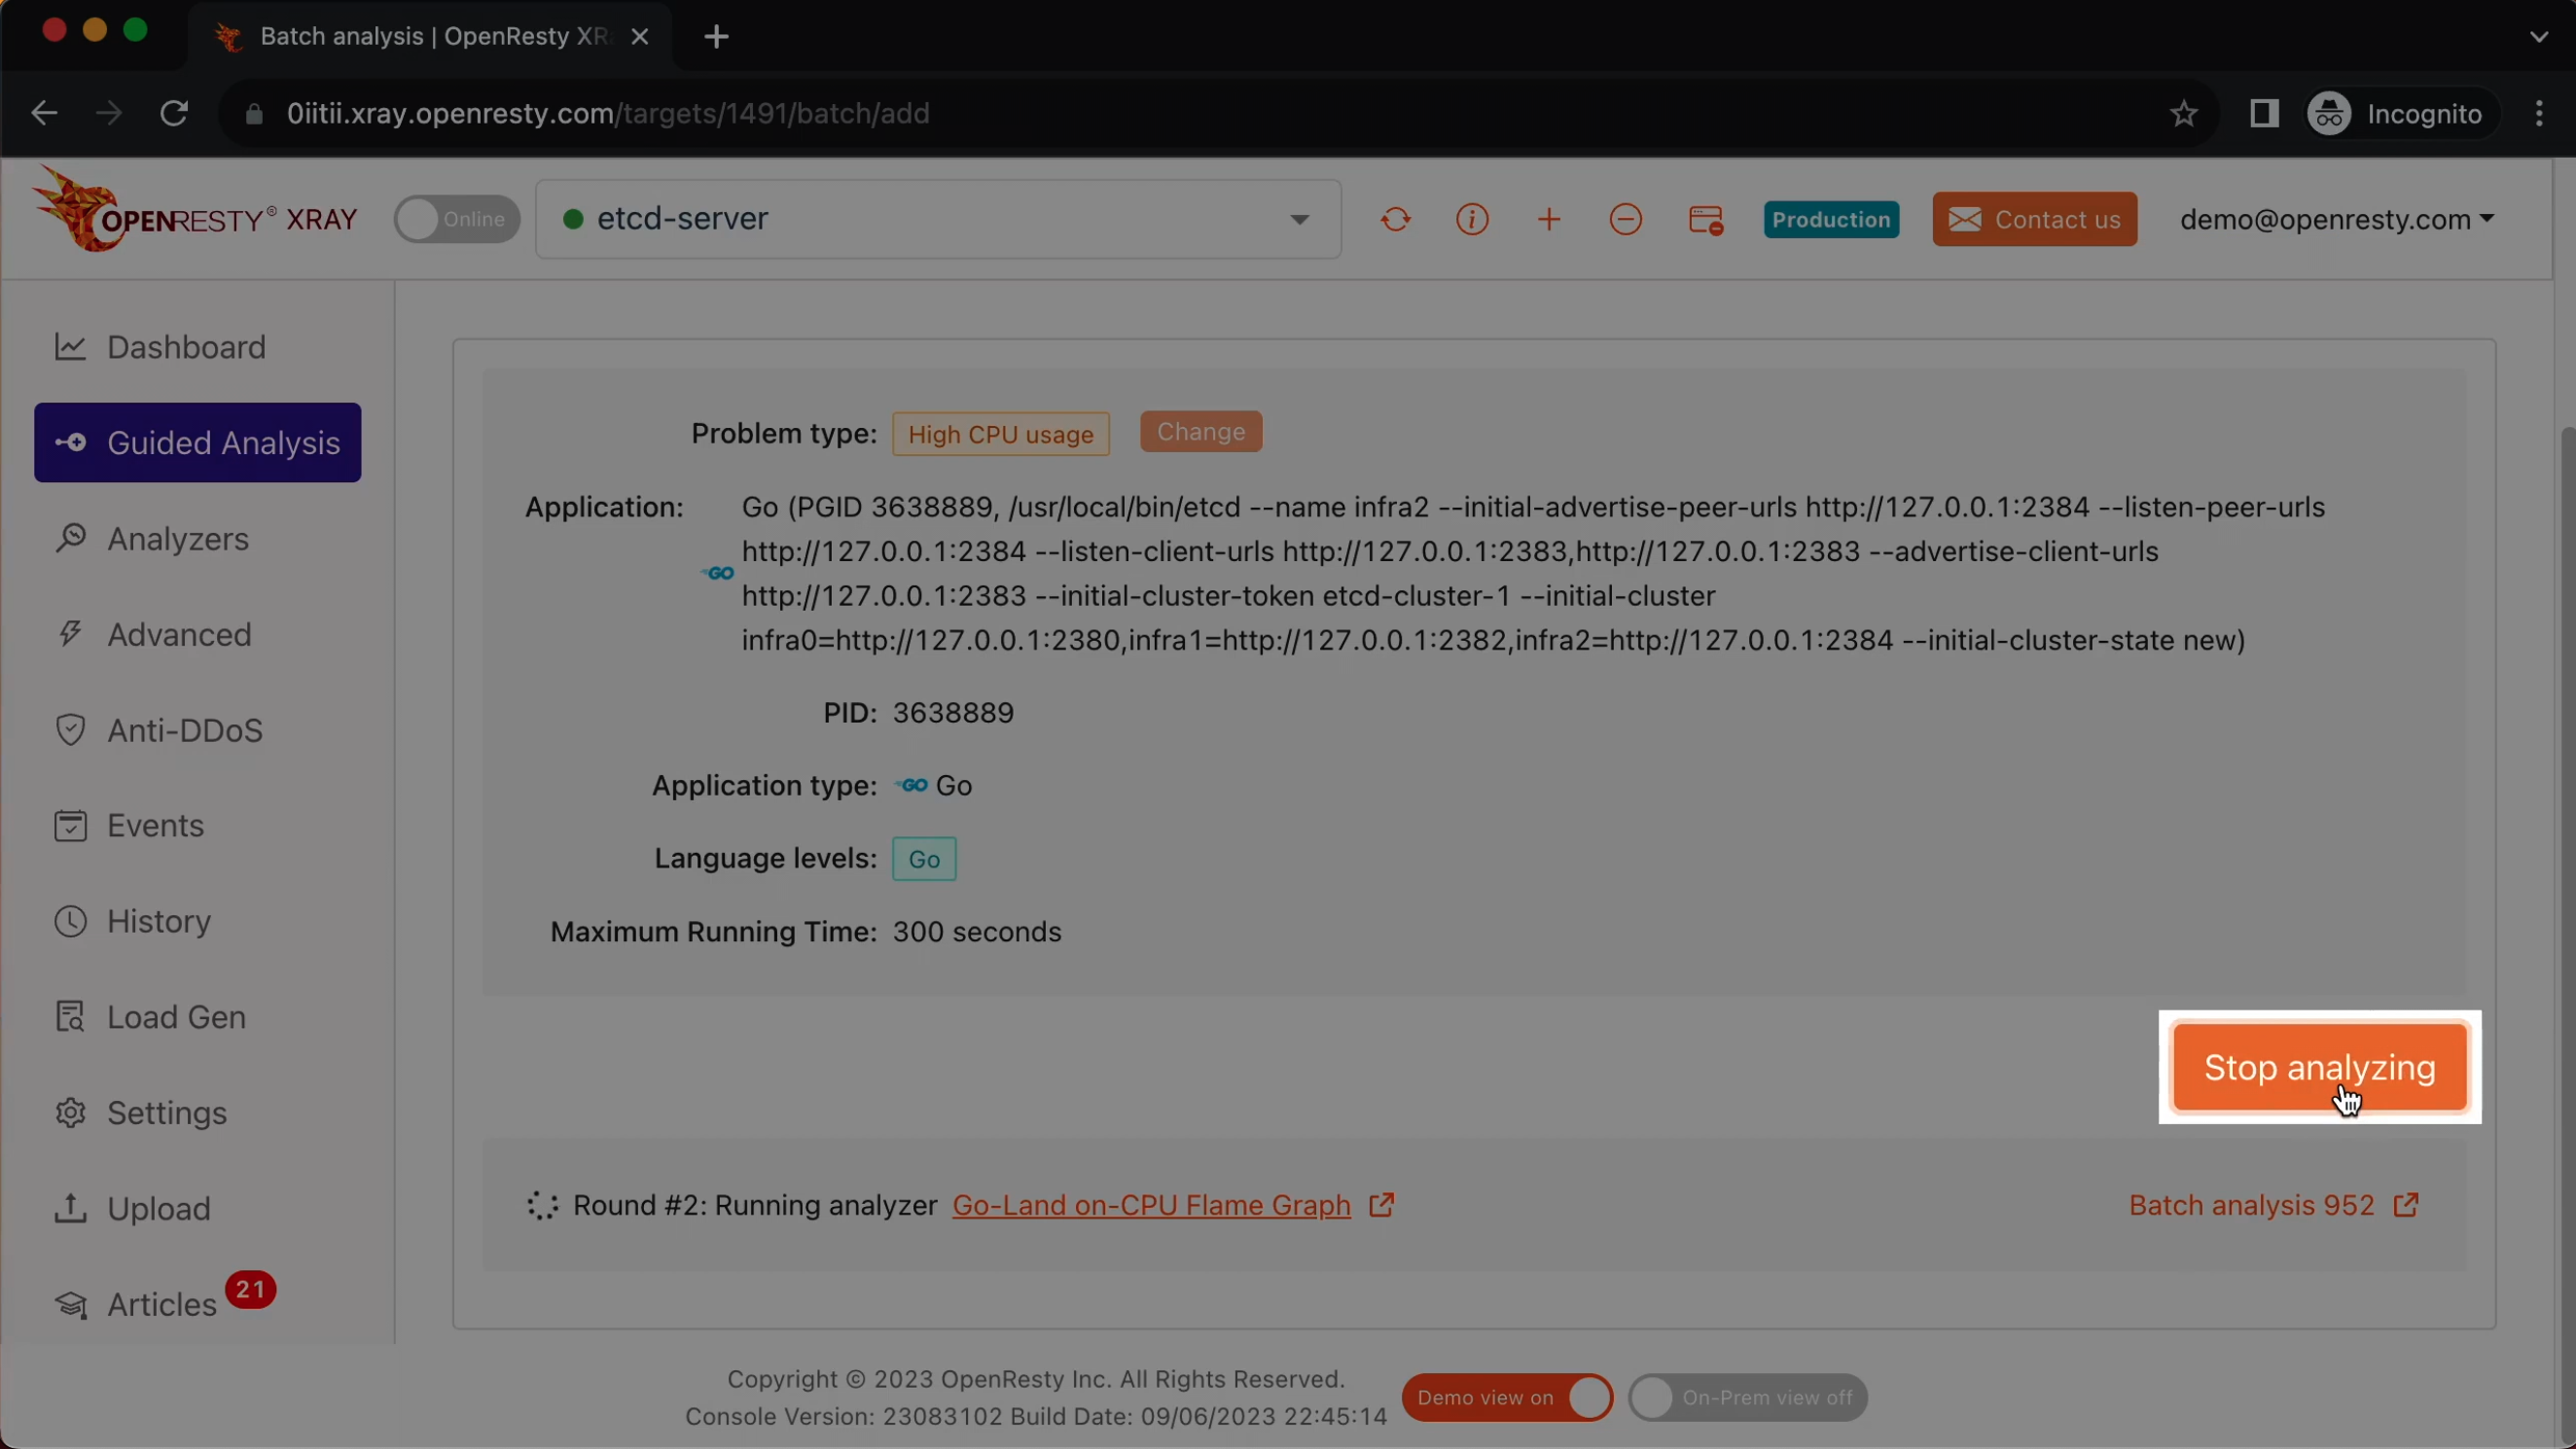
Let’s stop analyzing now.
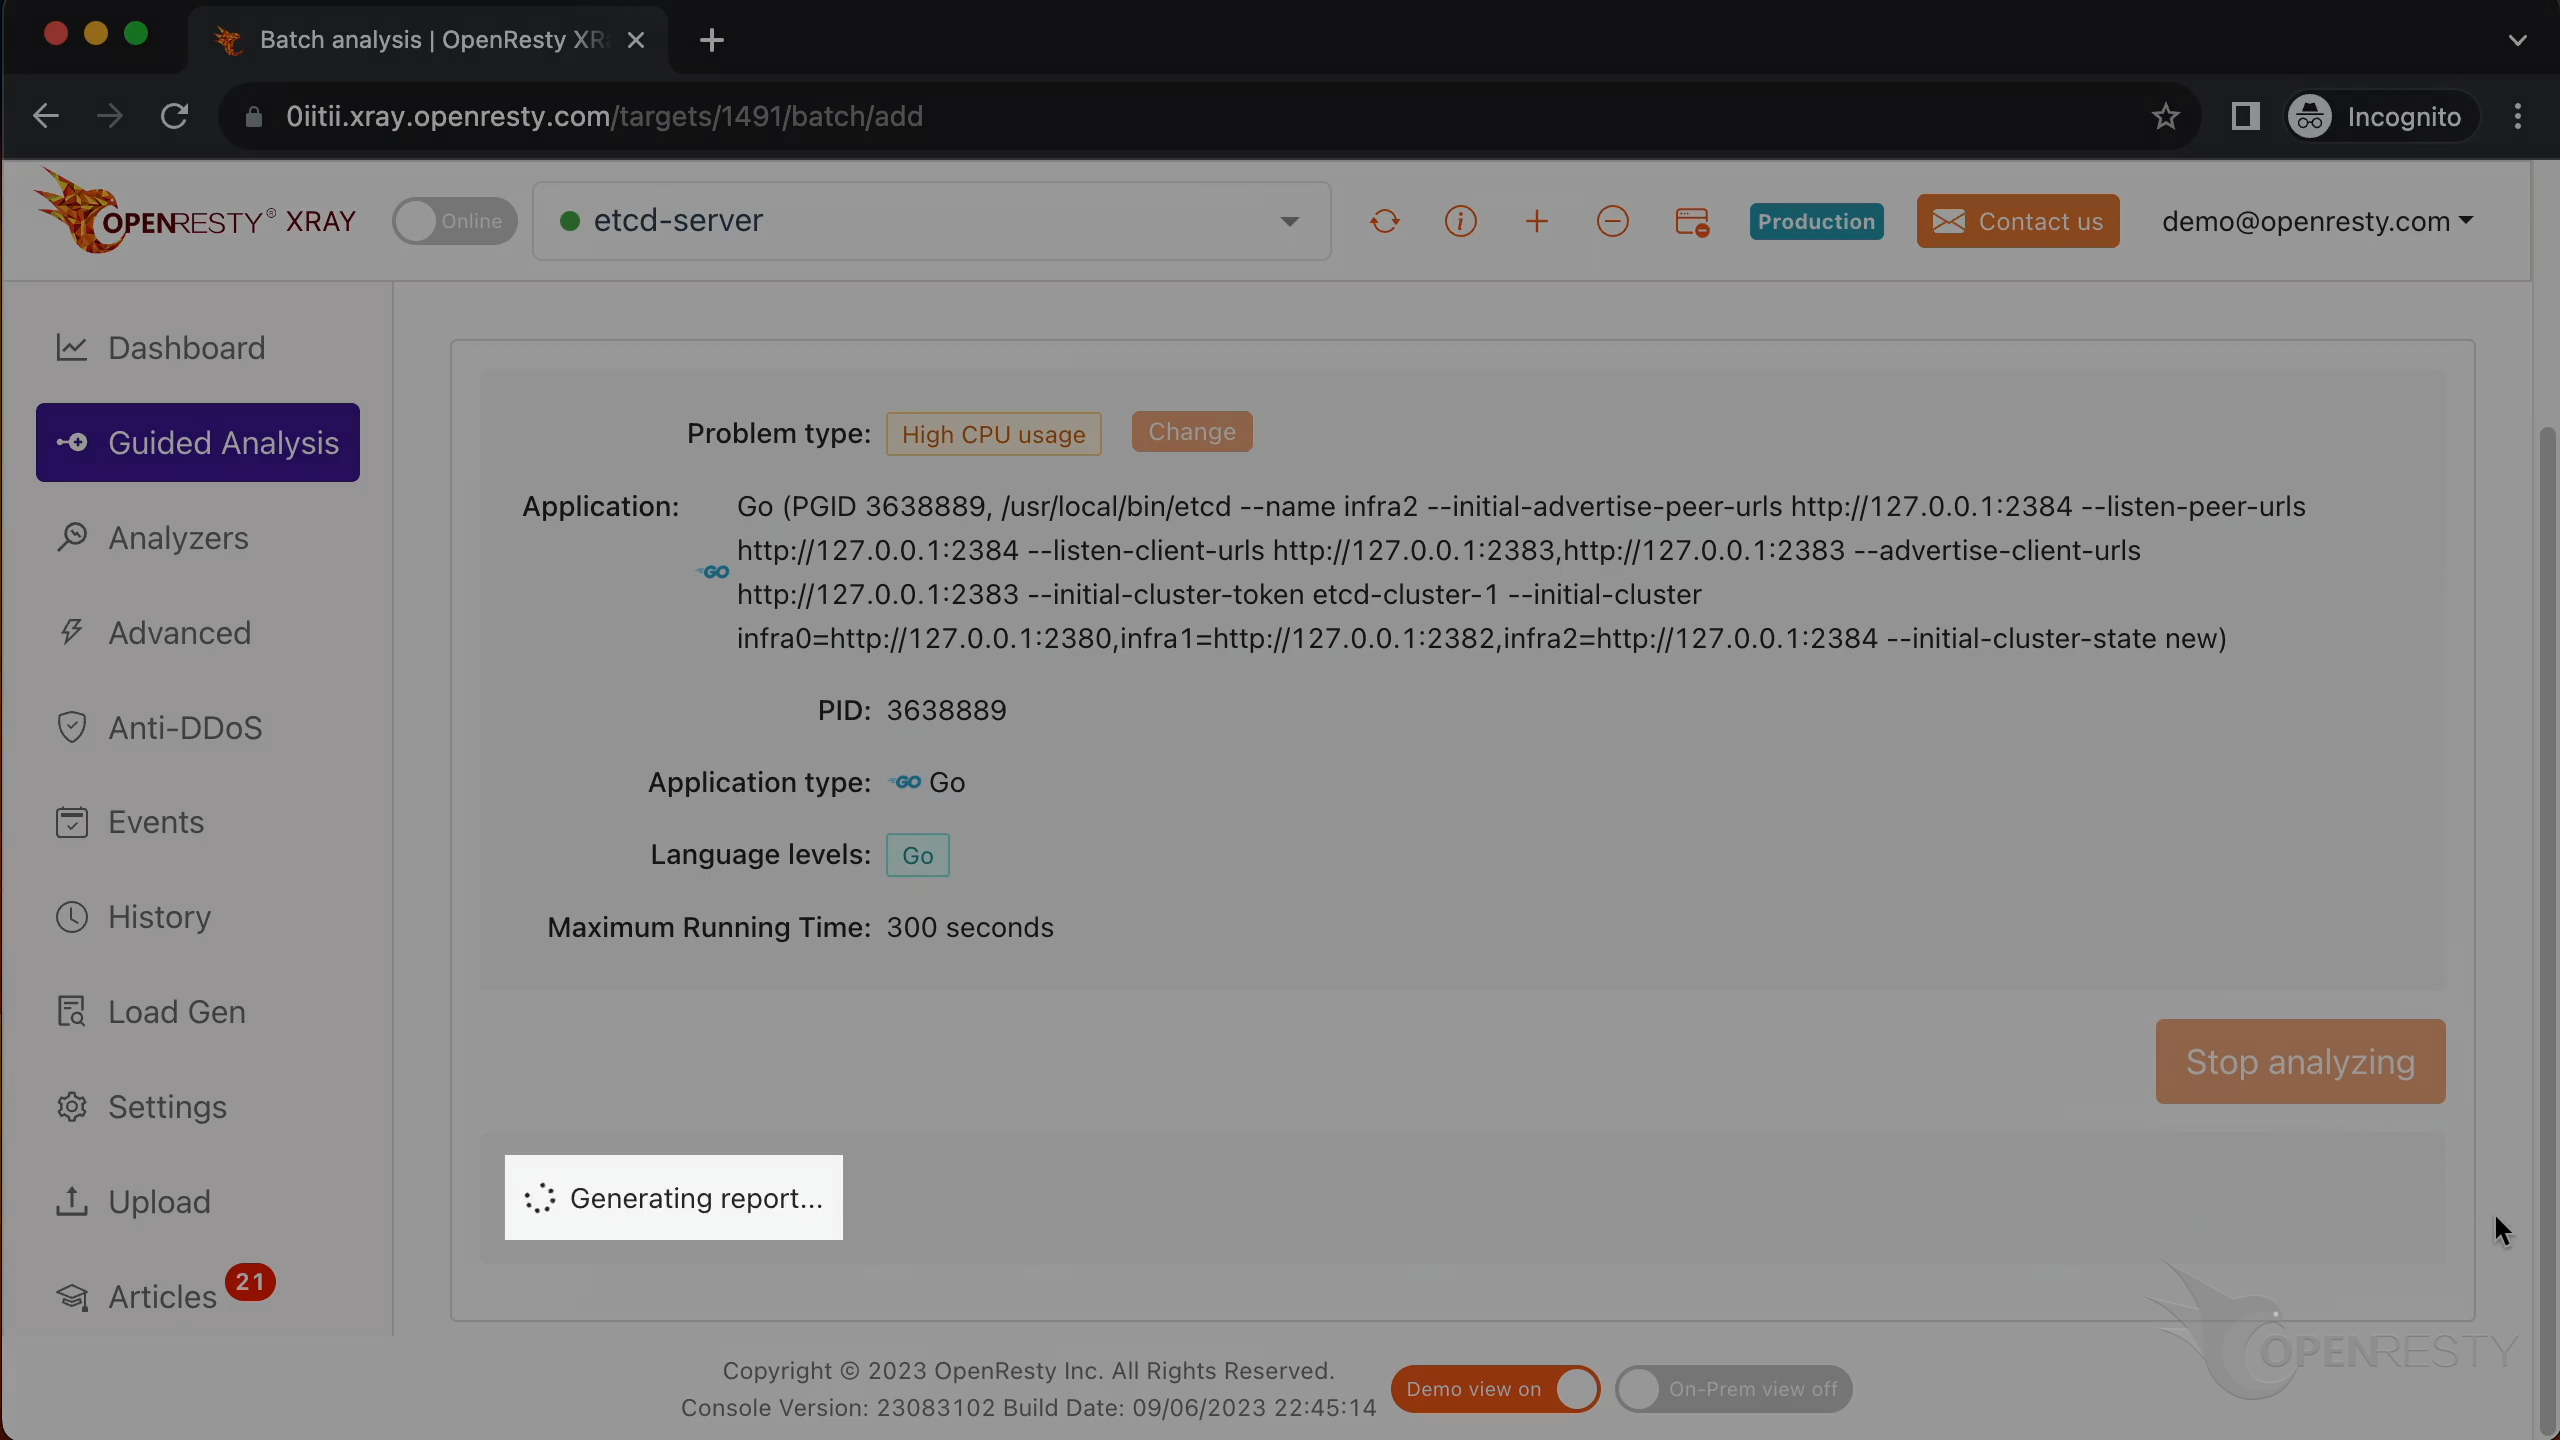
It shows that the system is generating a report for the current analysis.
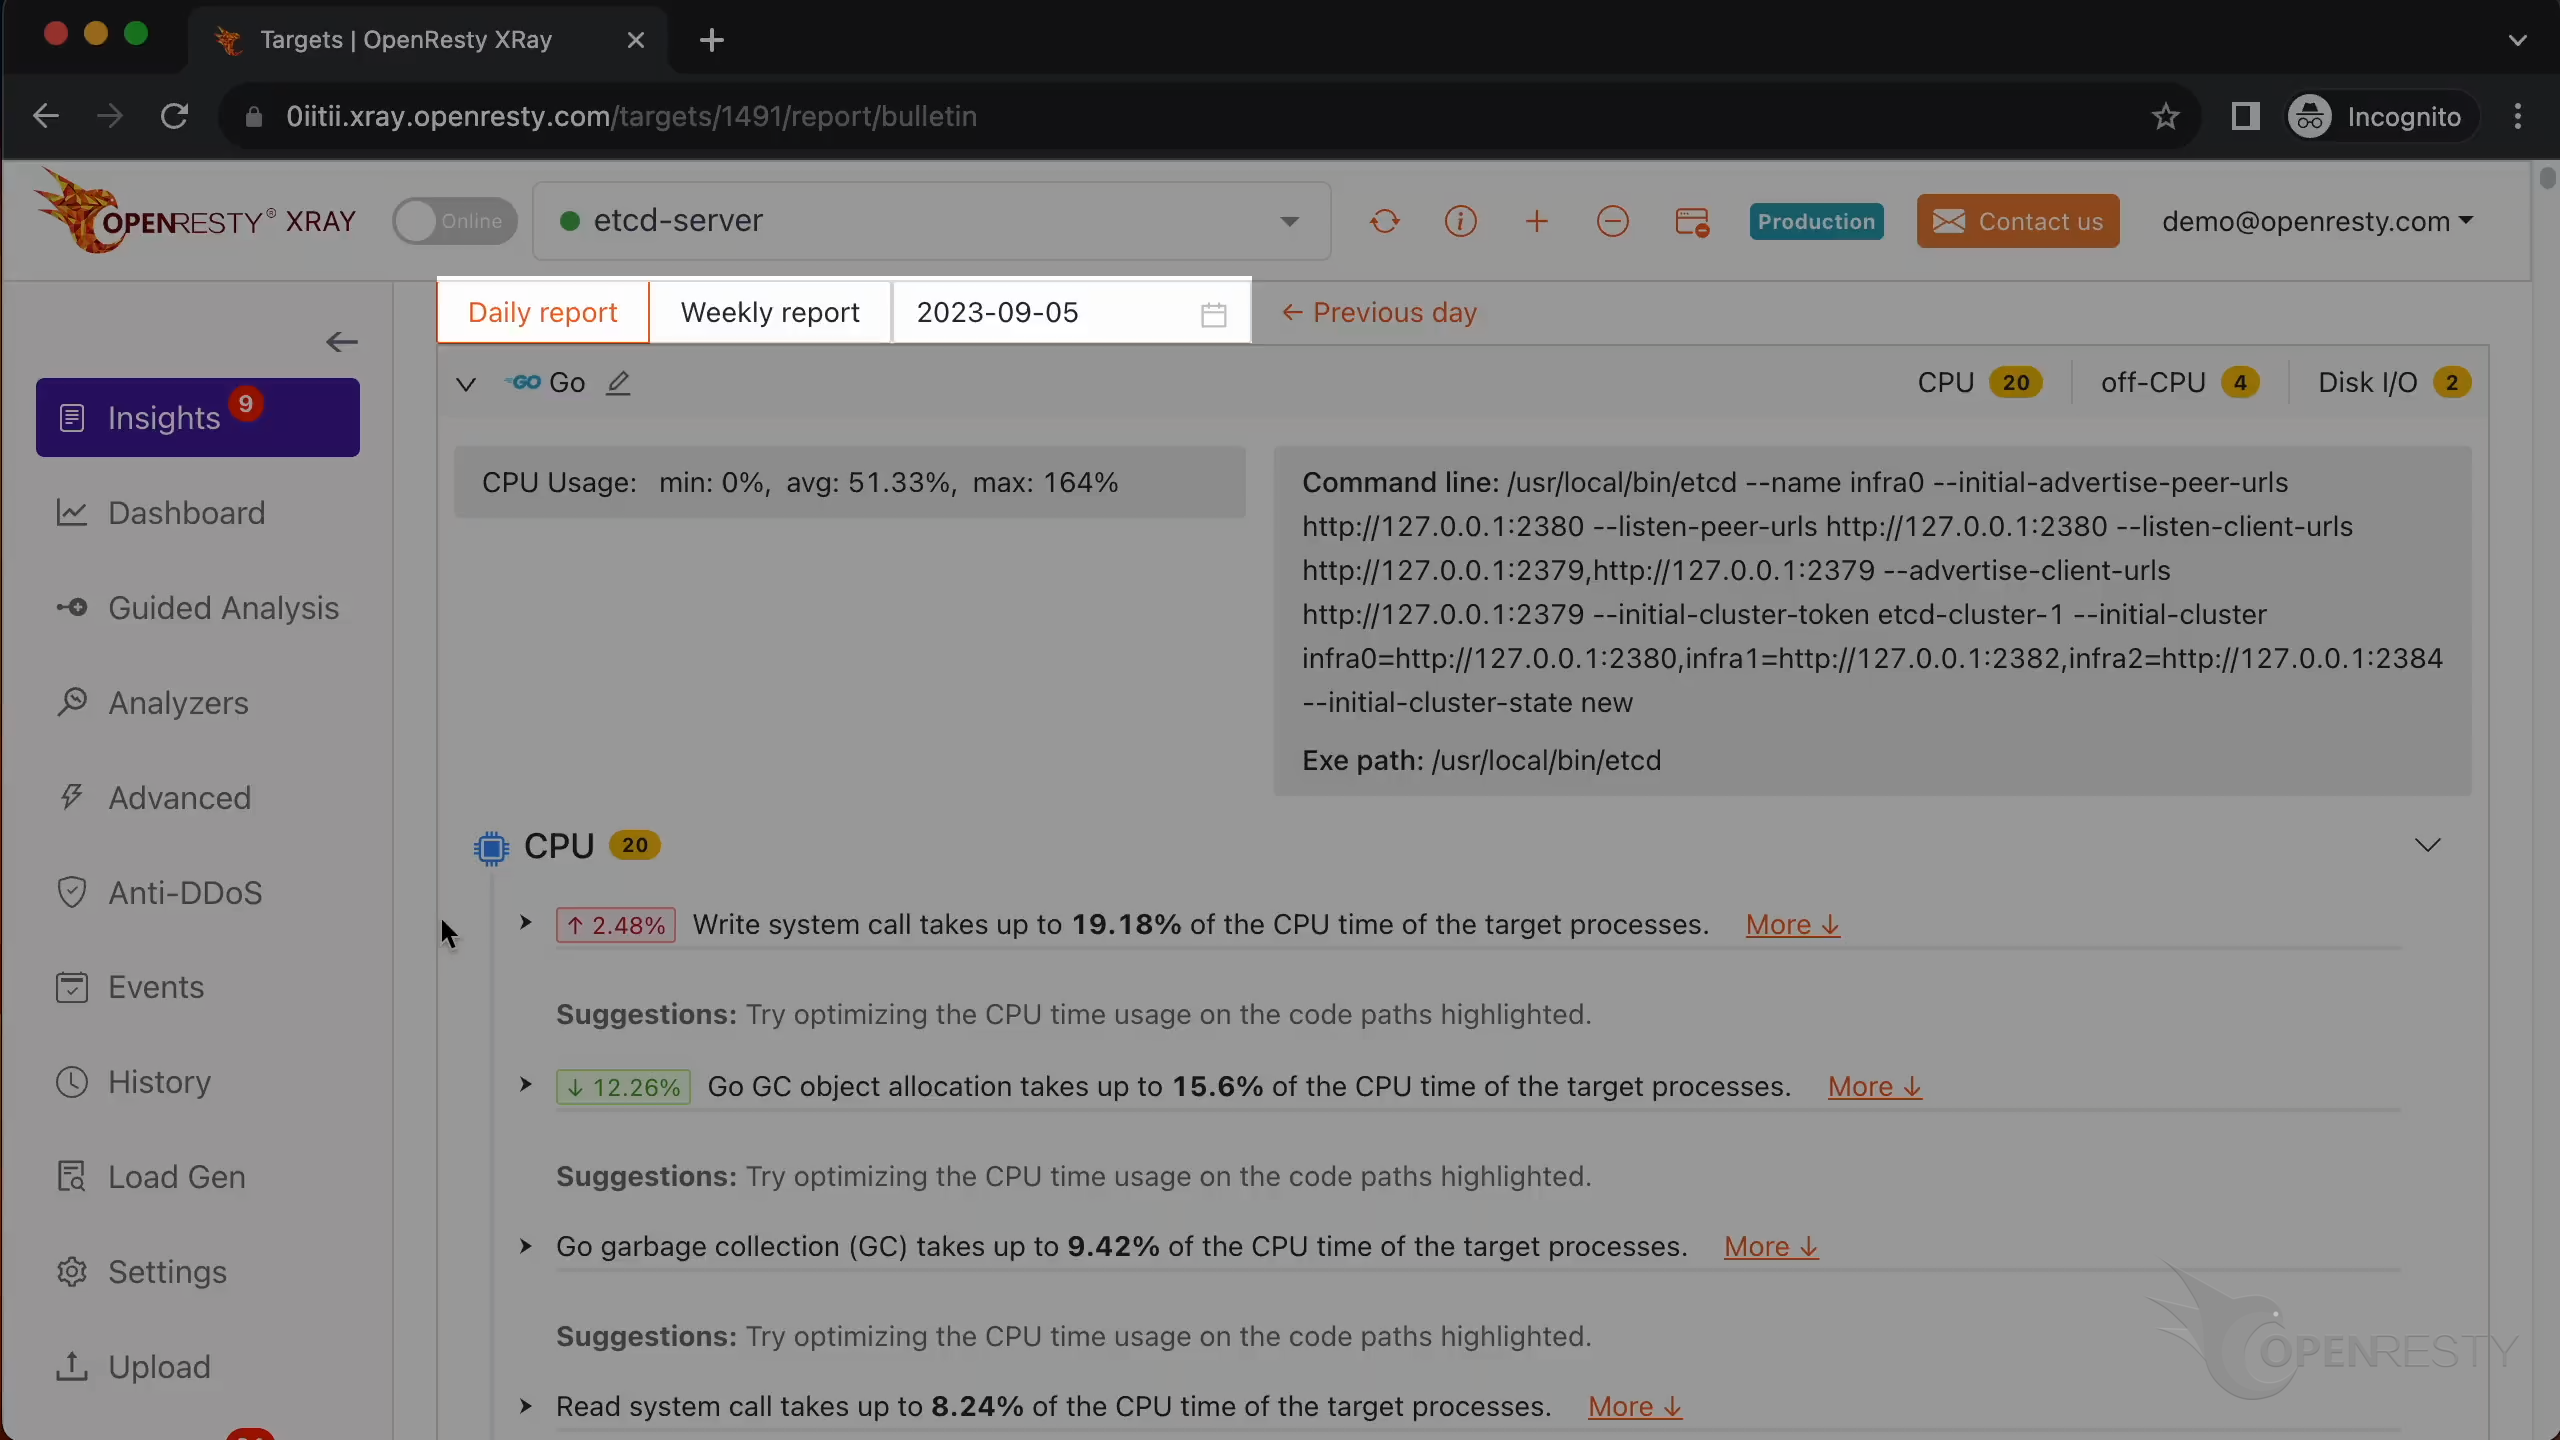
We can see it automatically created a report.
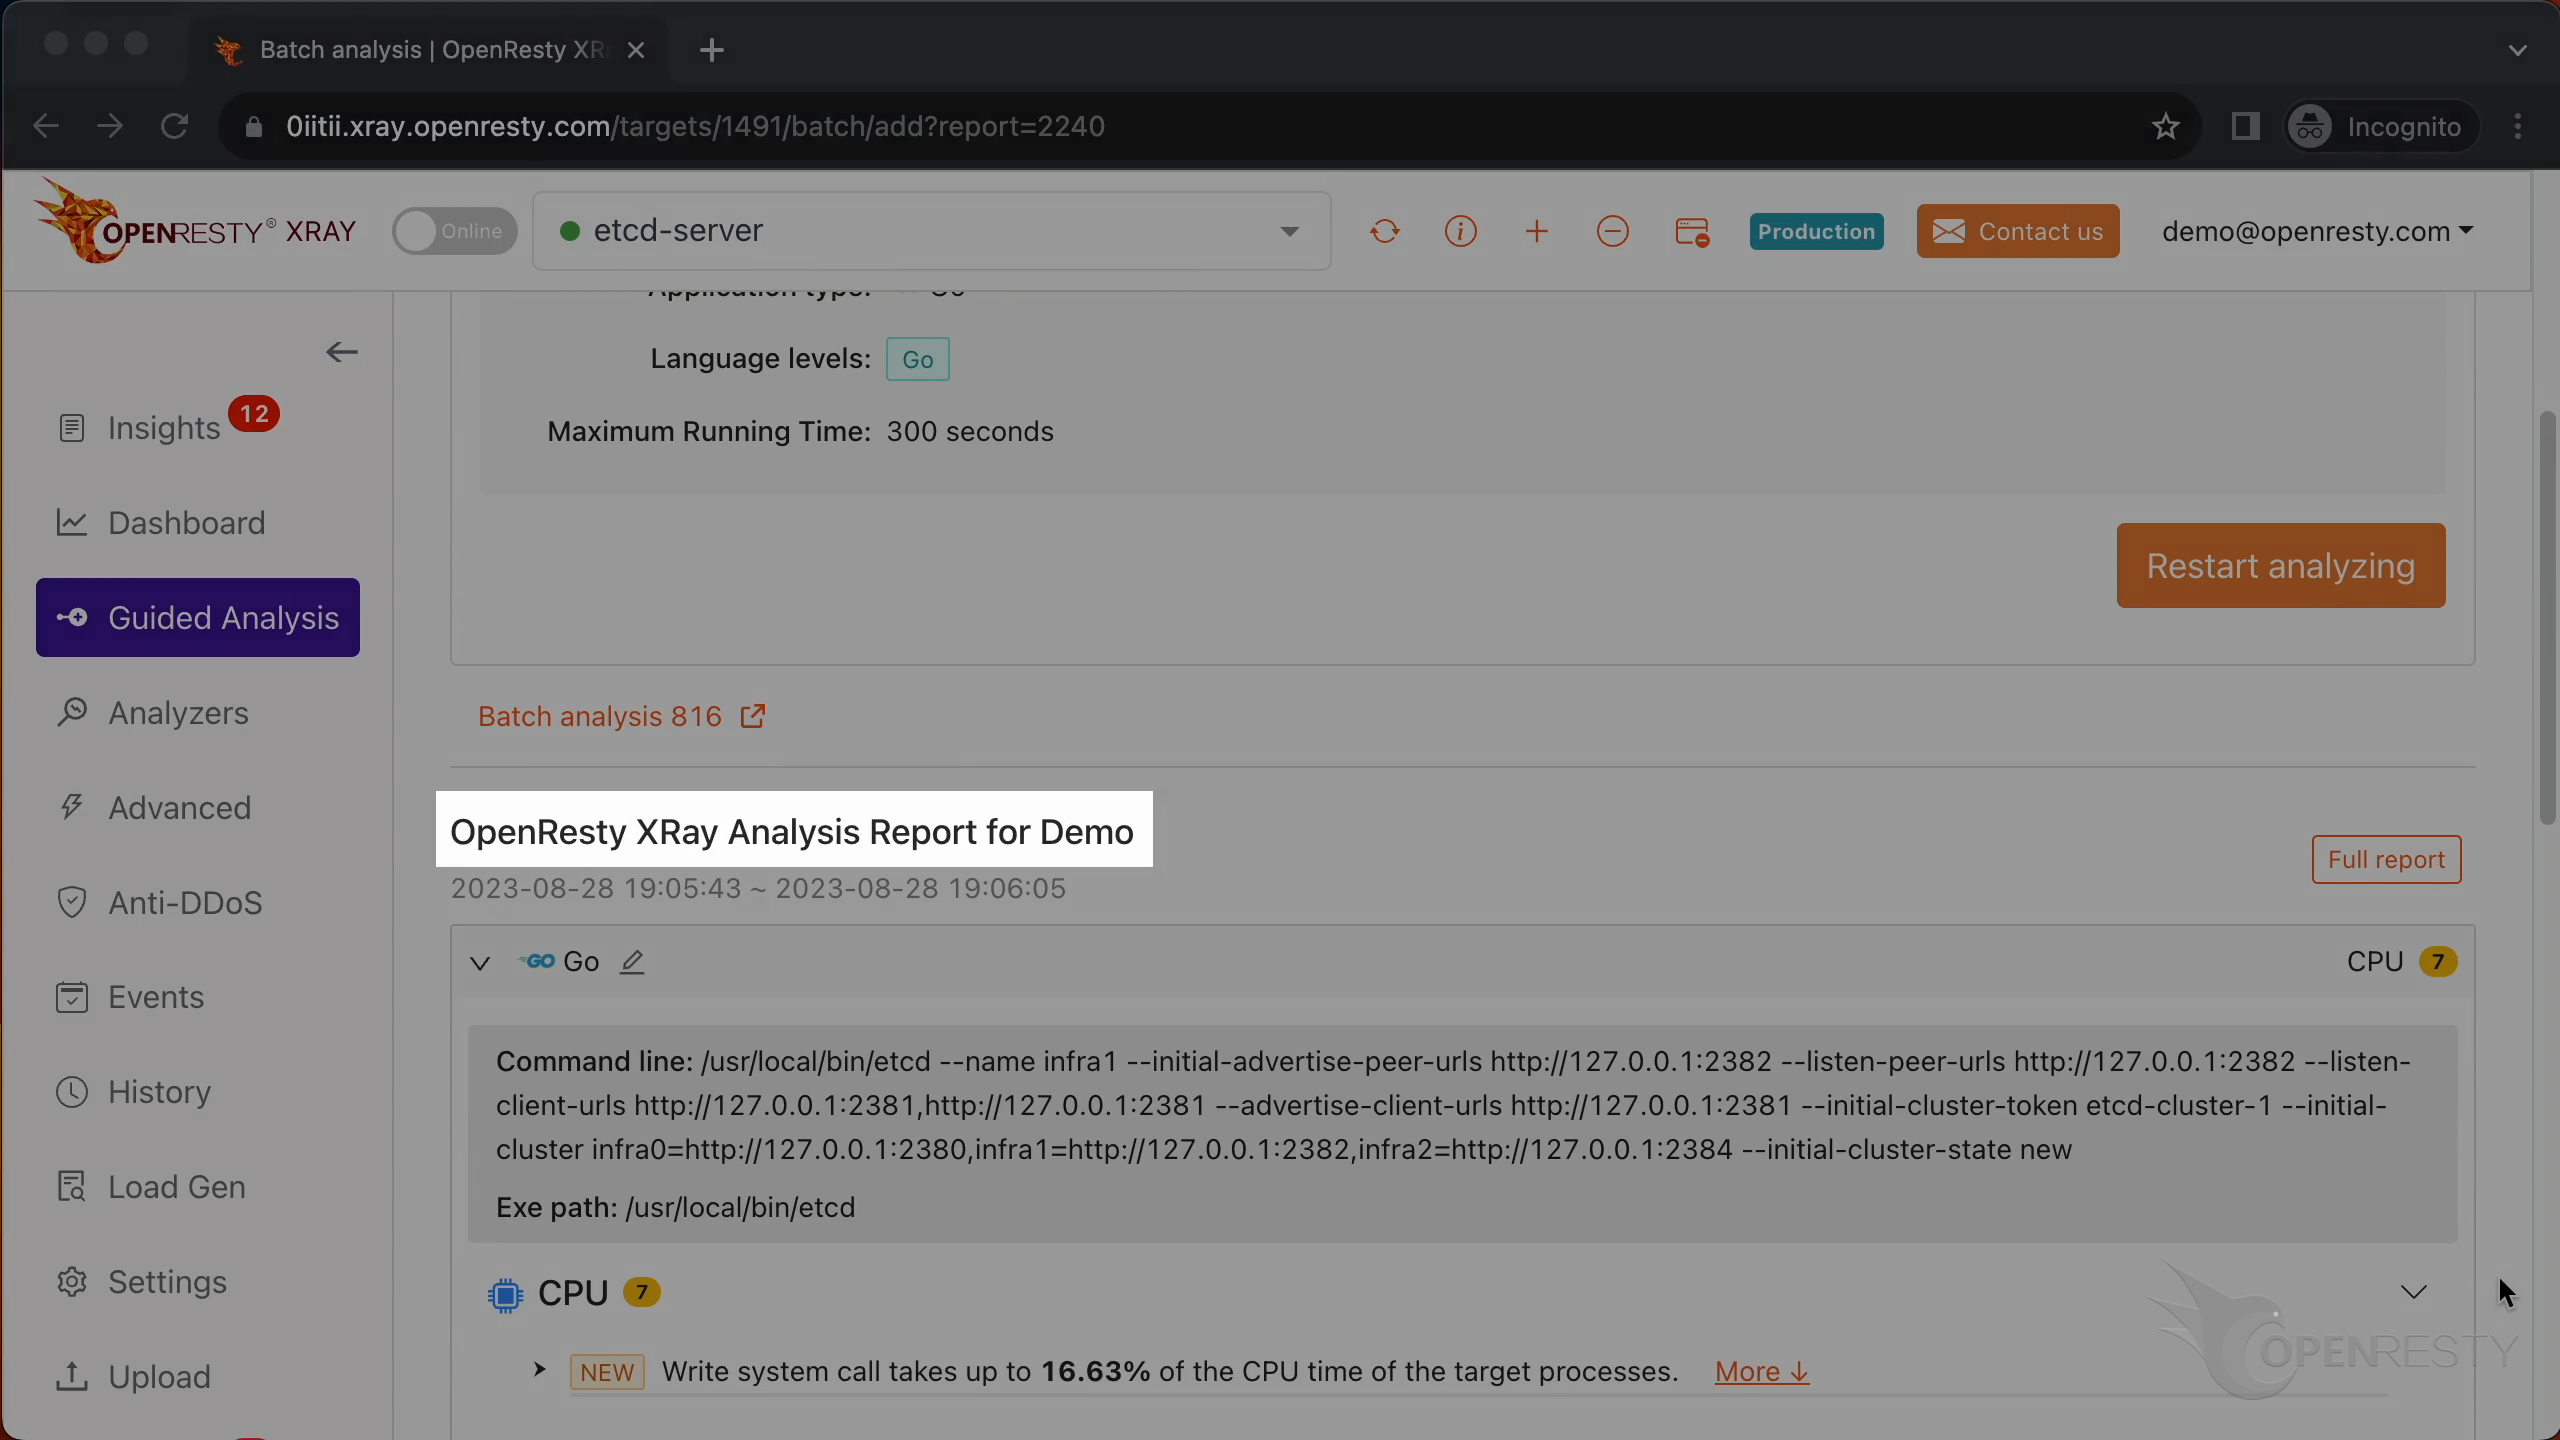
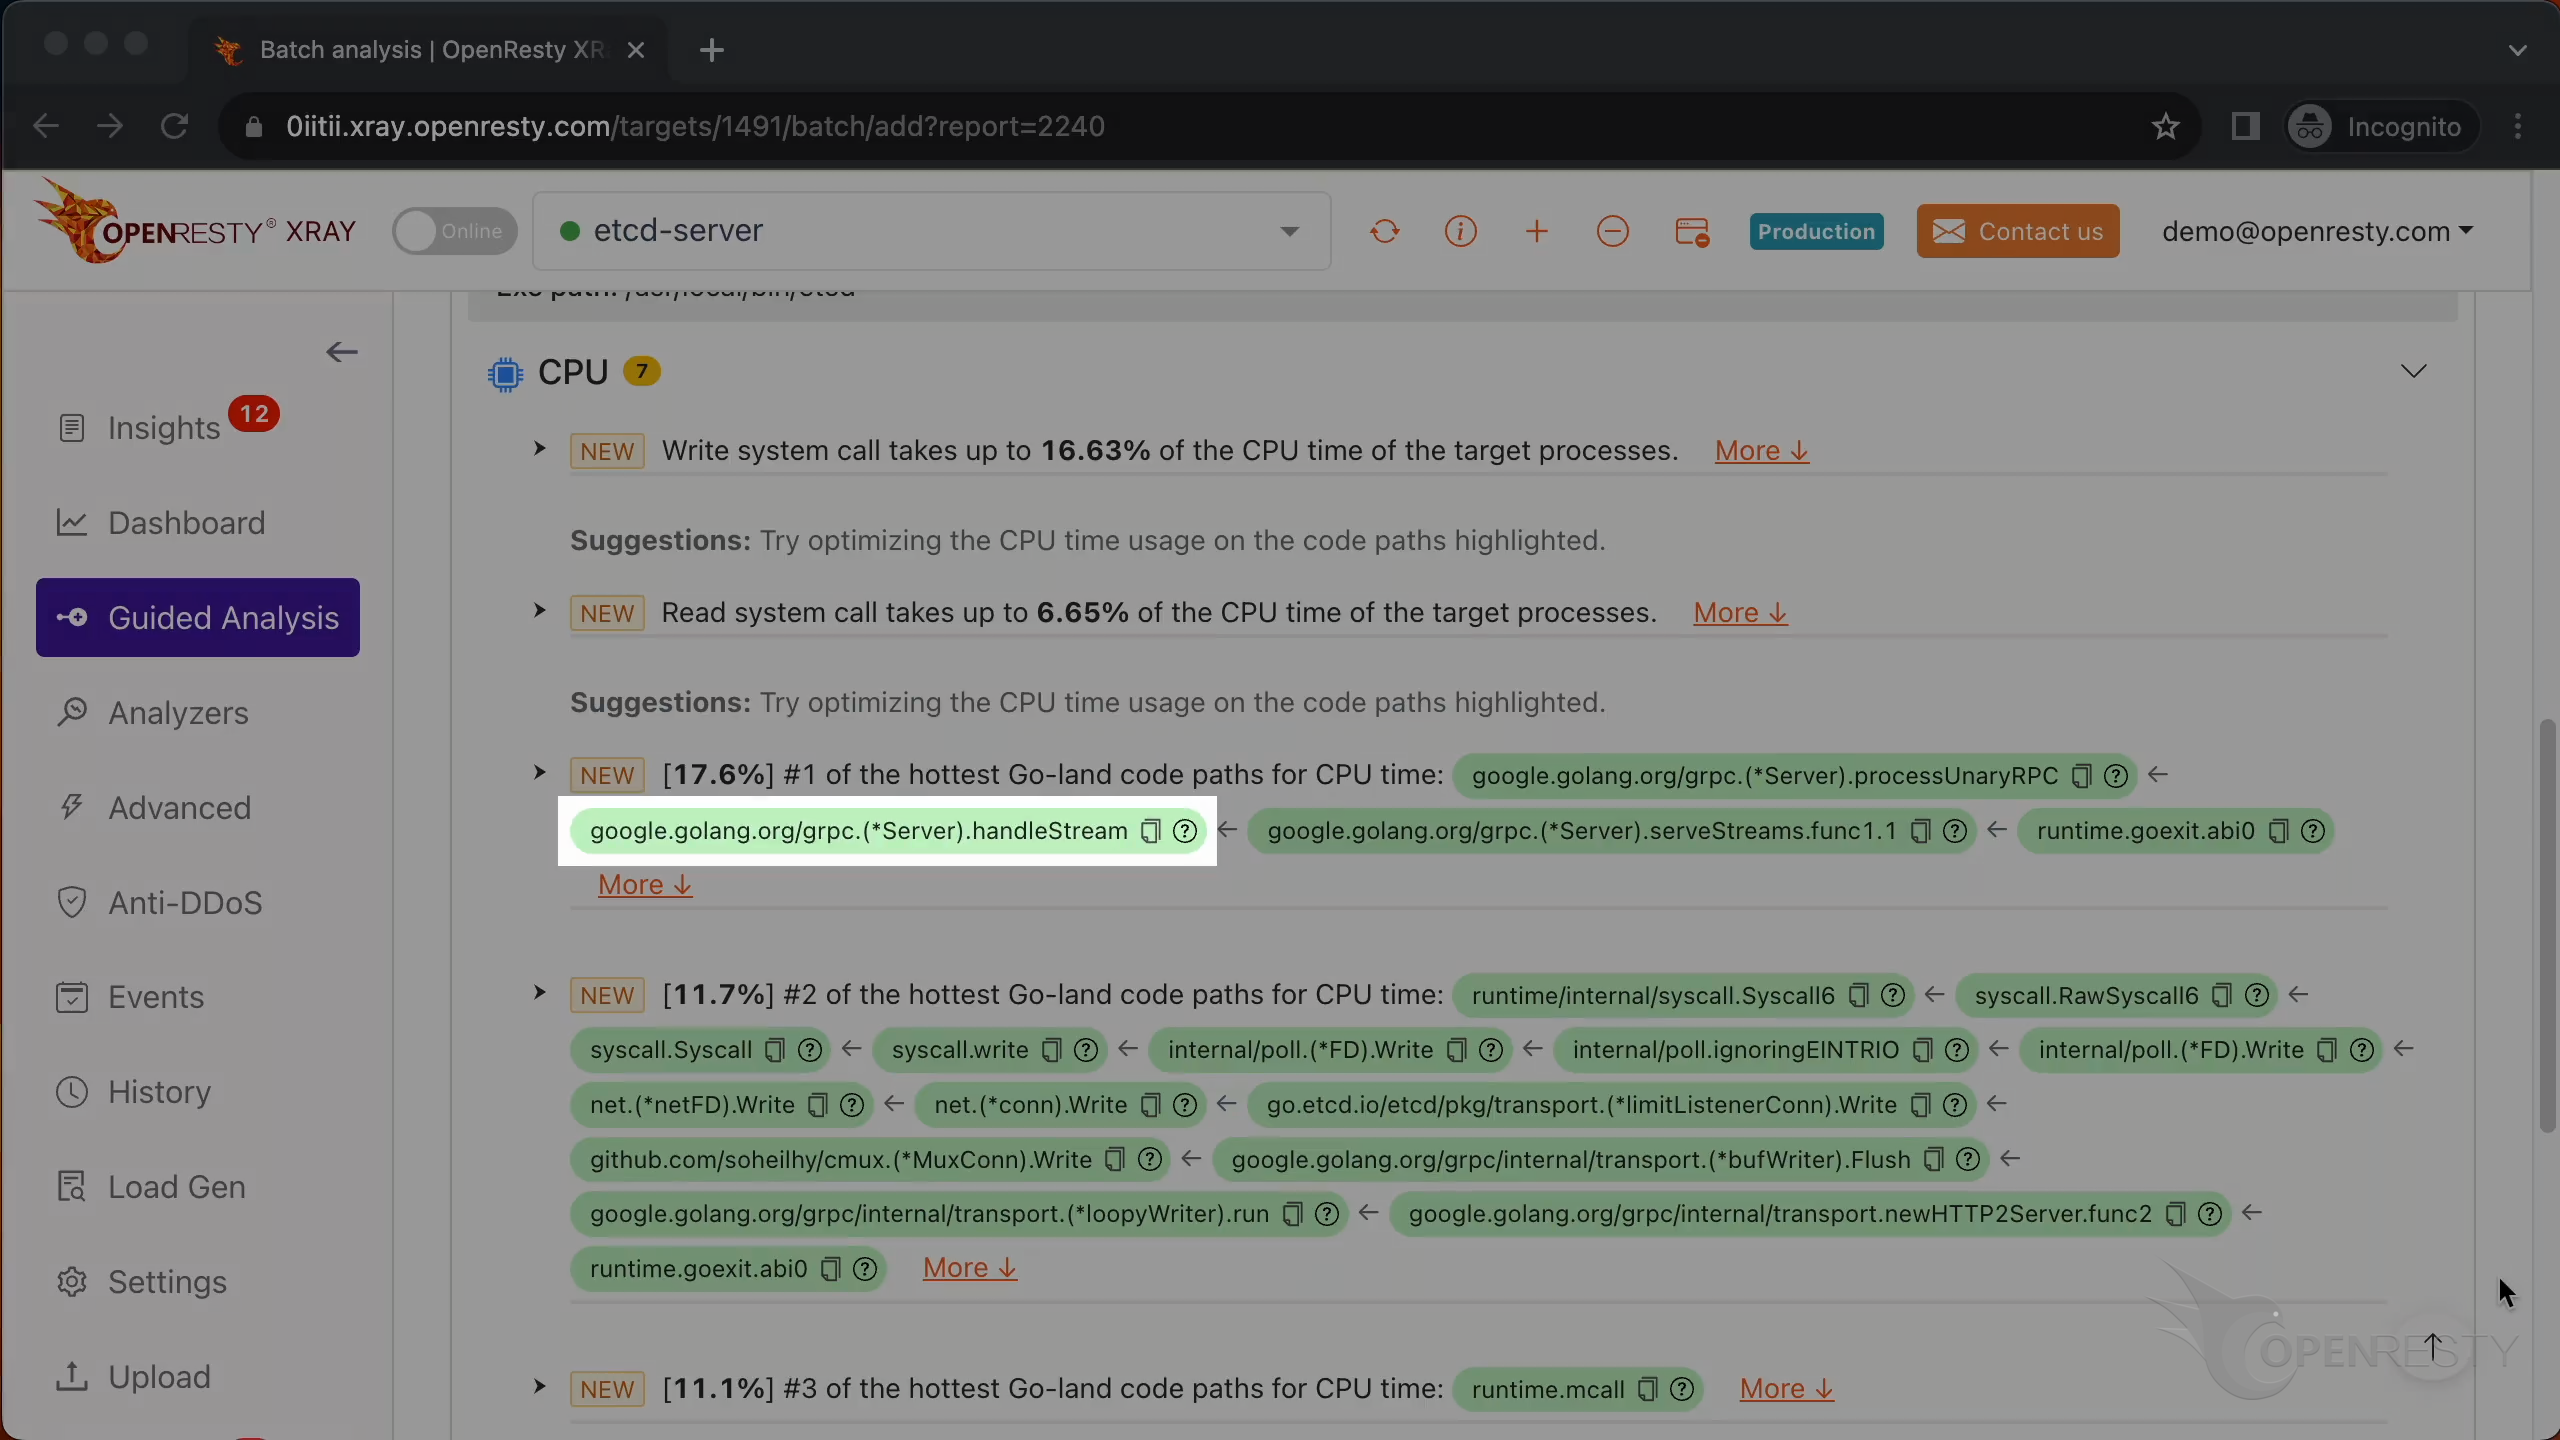
This is the type of problem we are going to diagnose. It’s CPU.
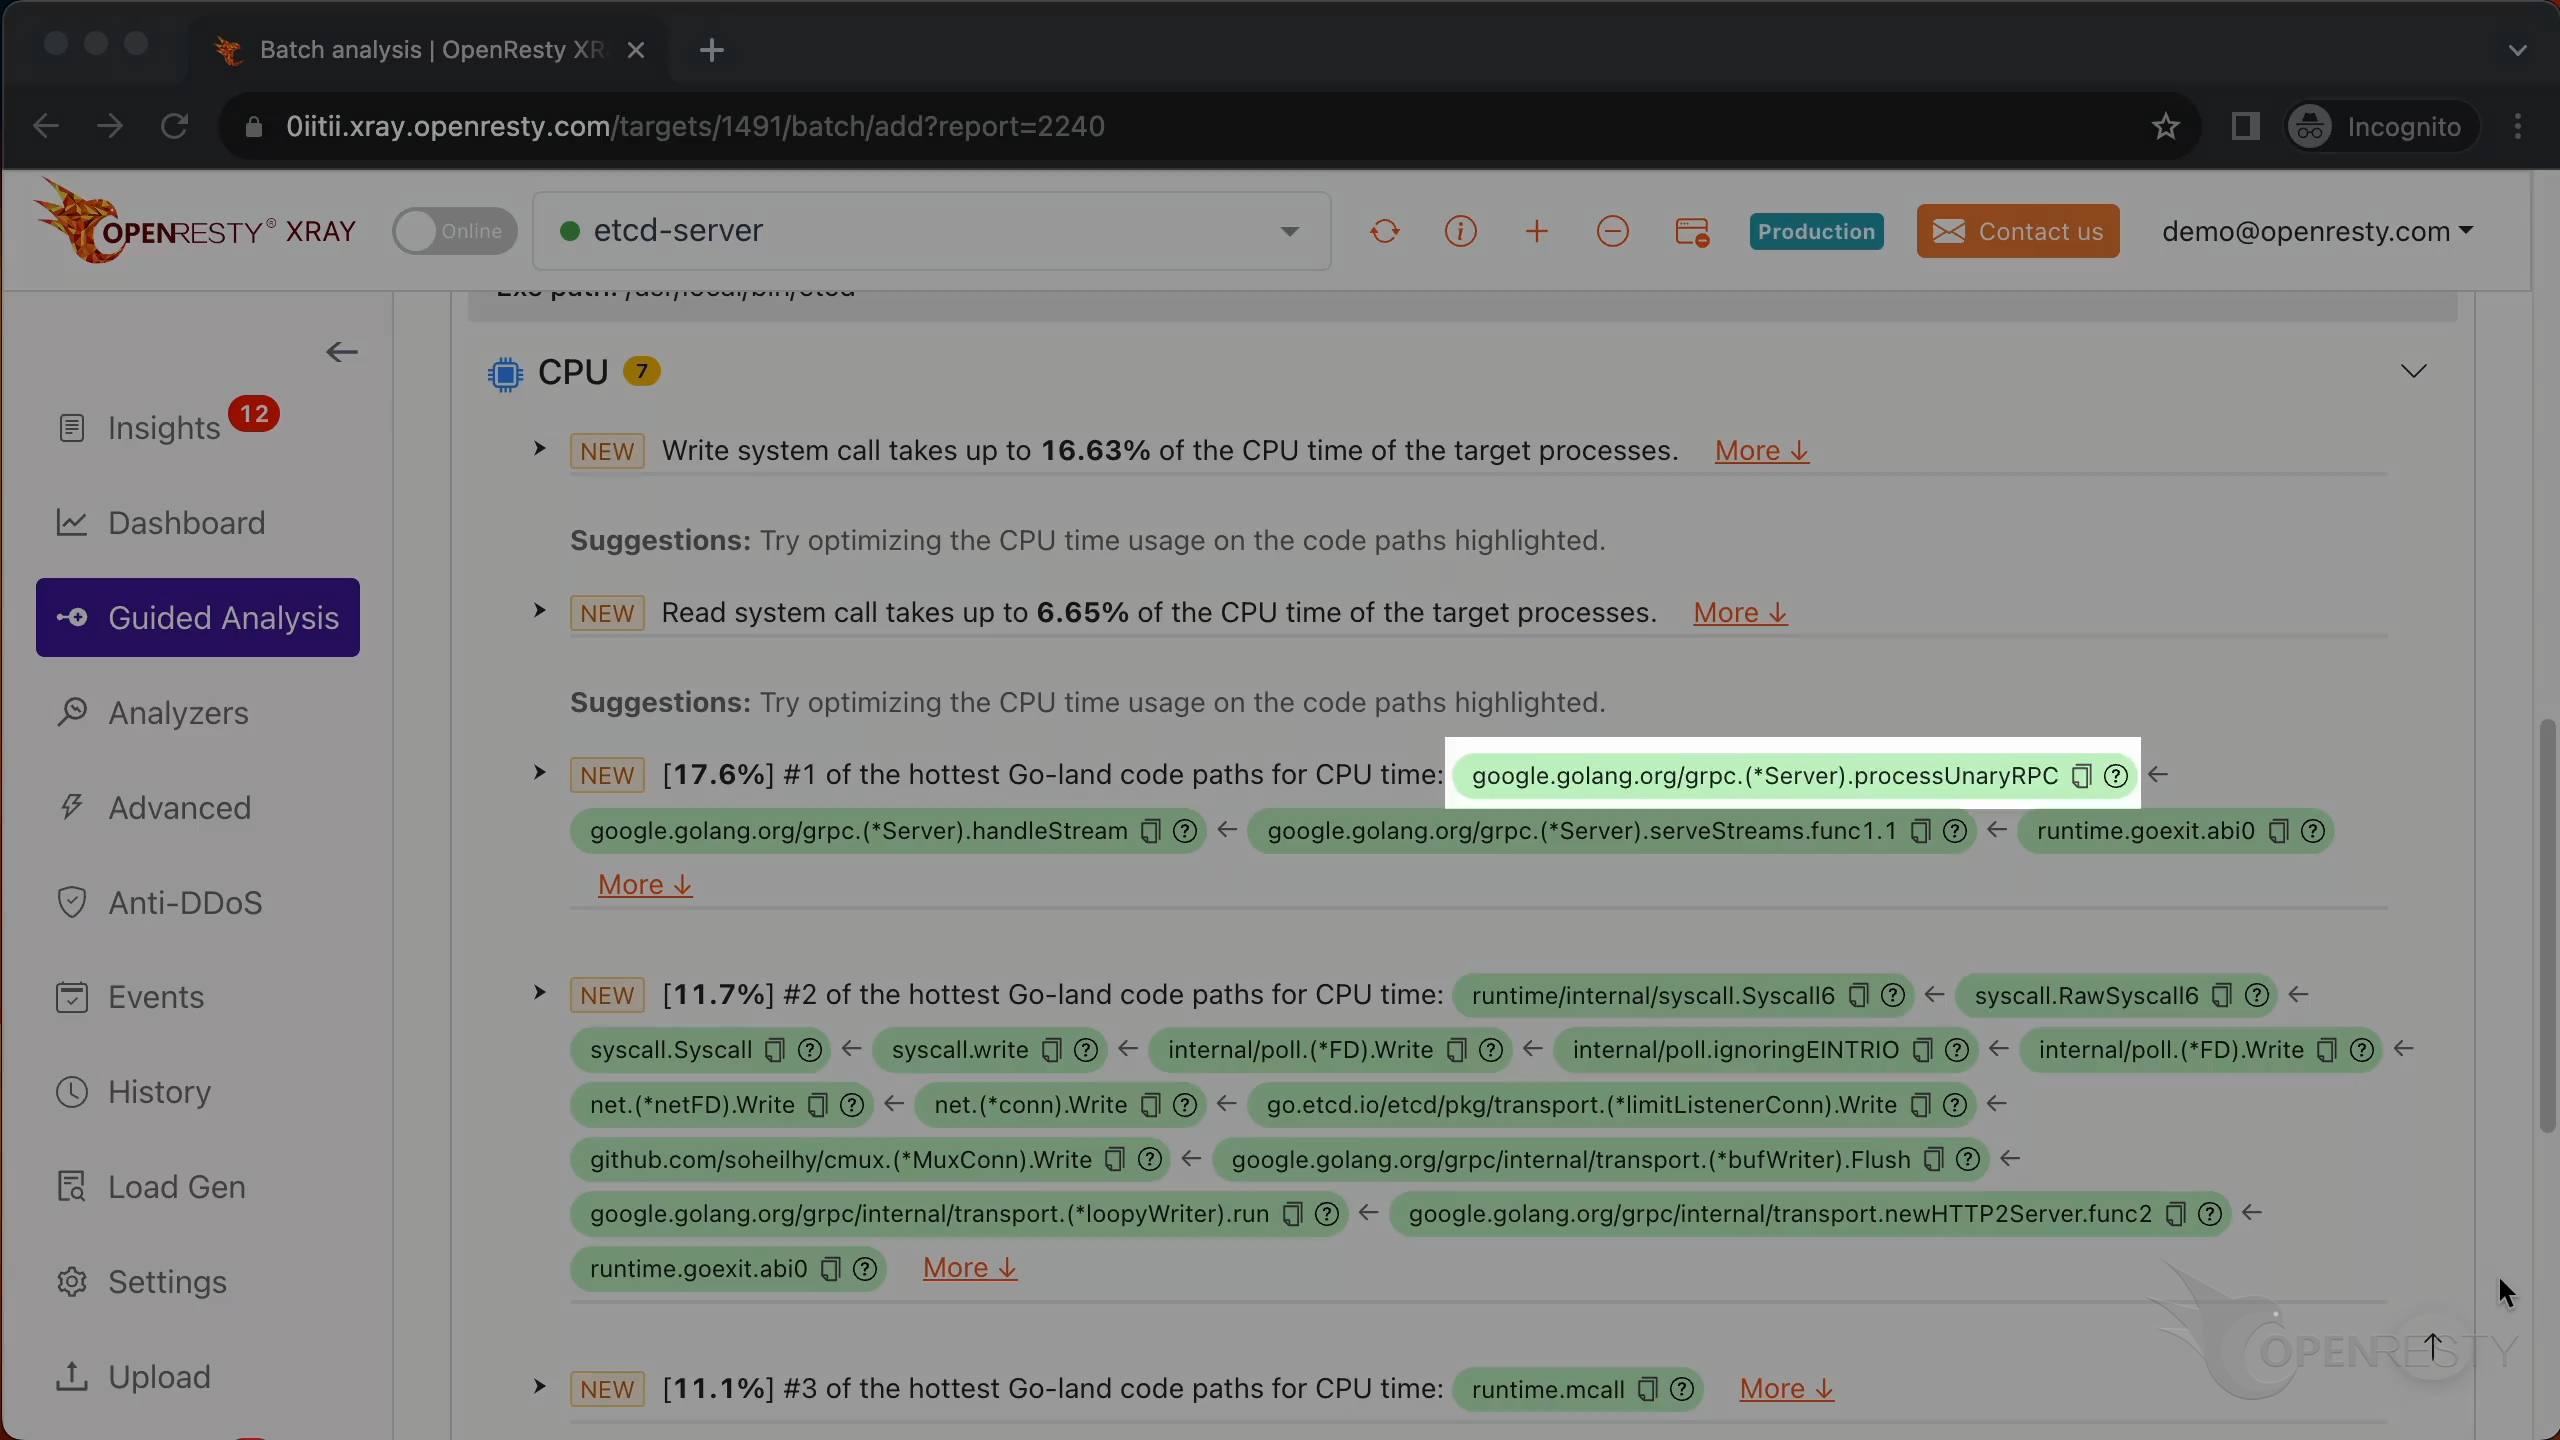
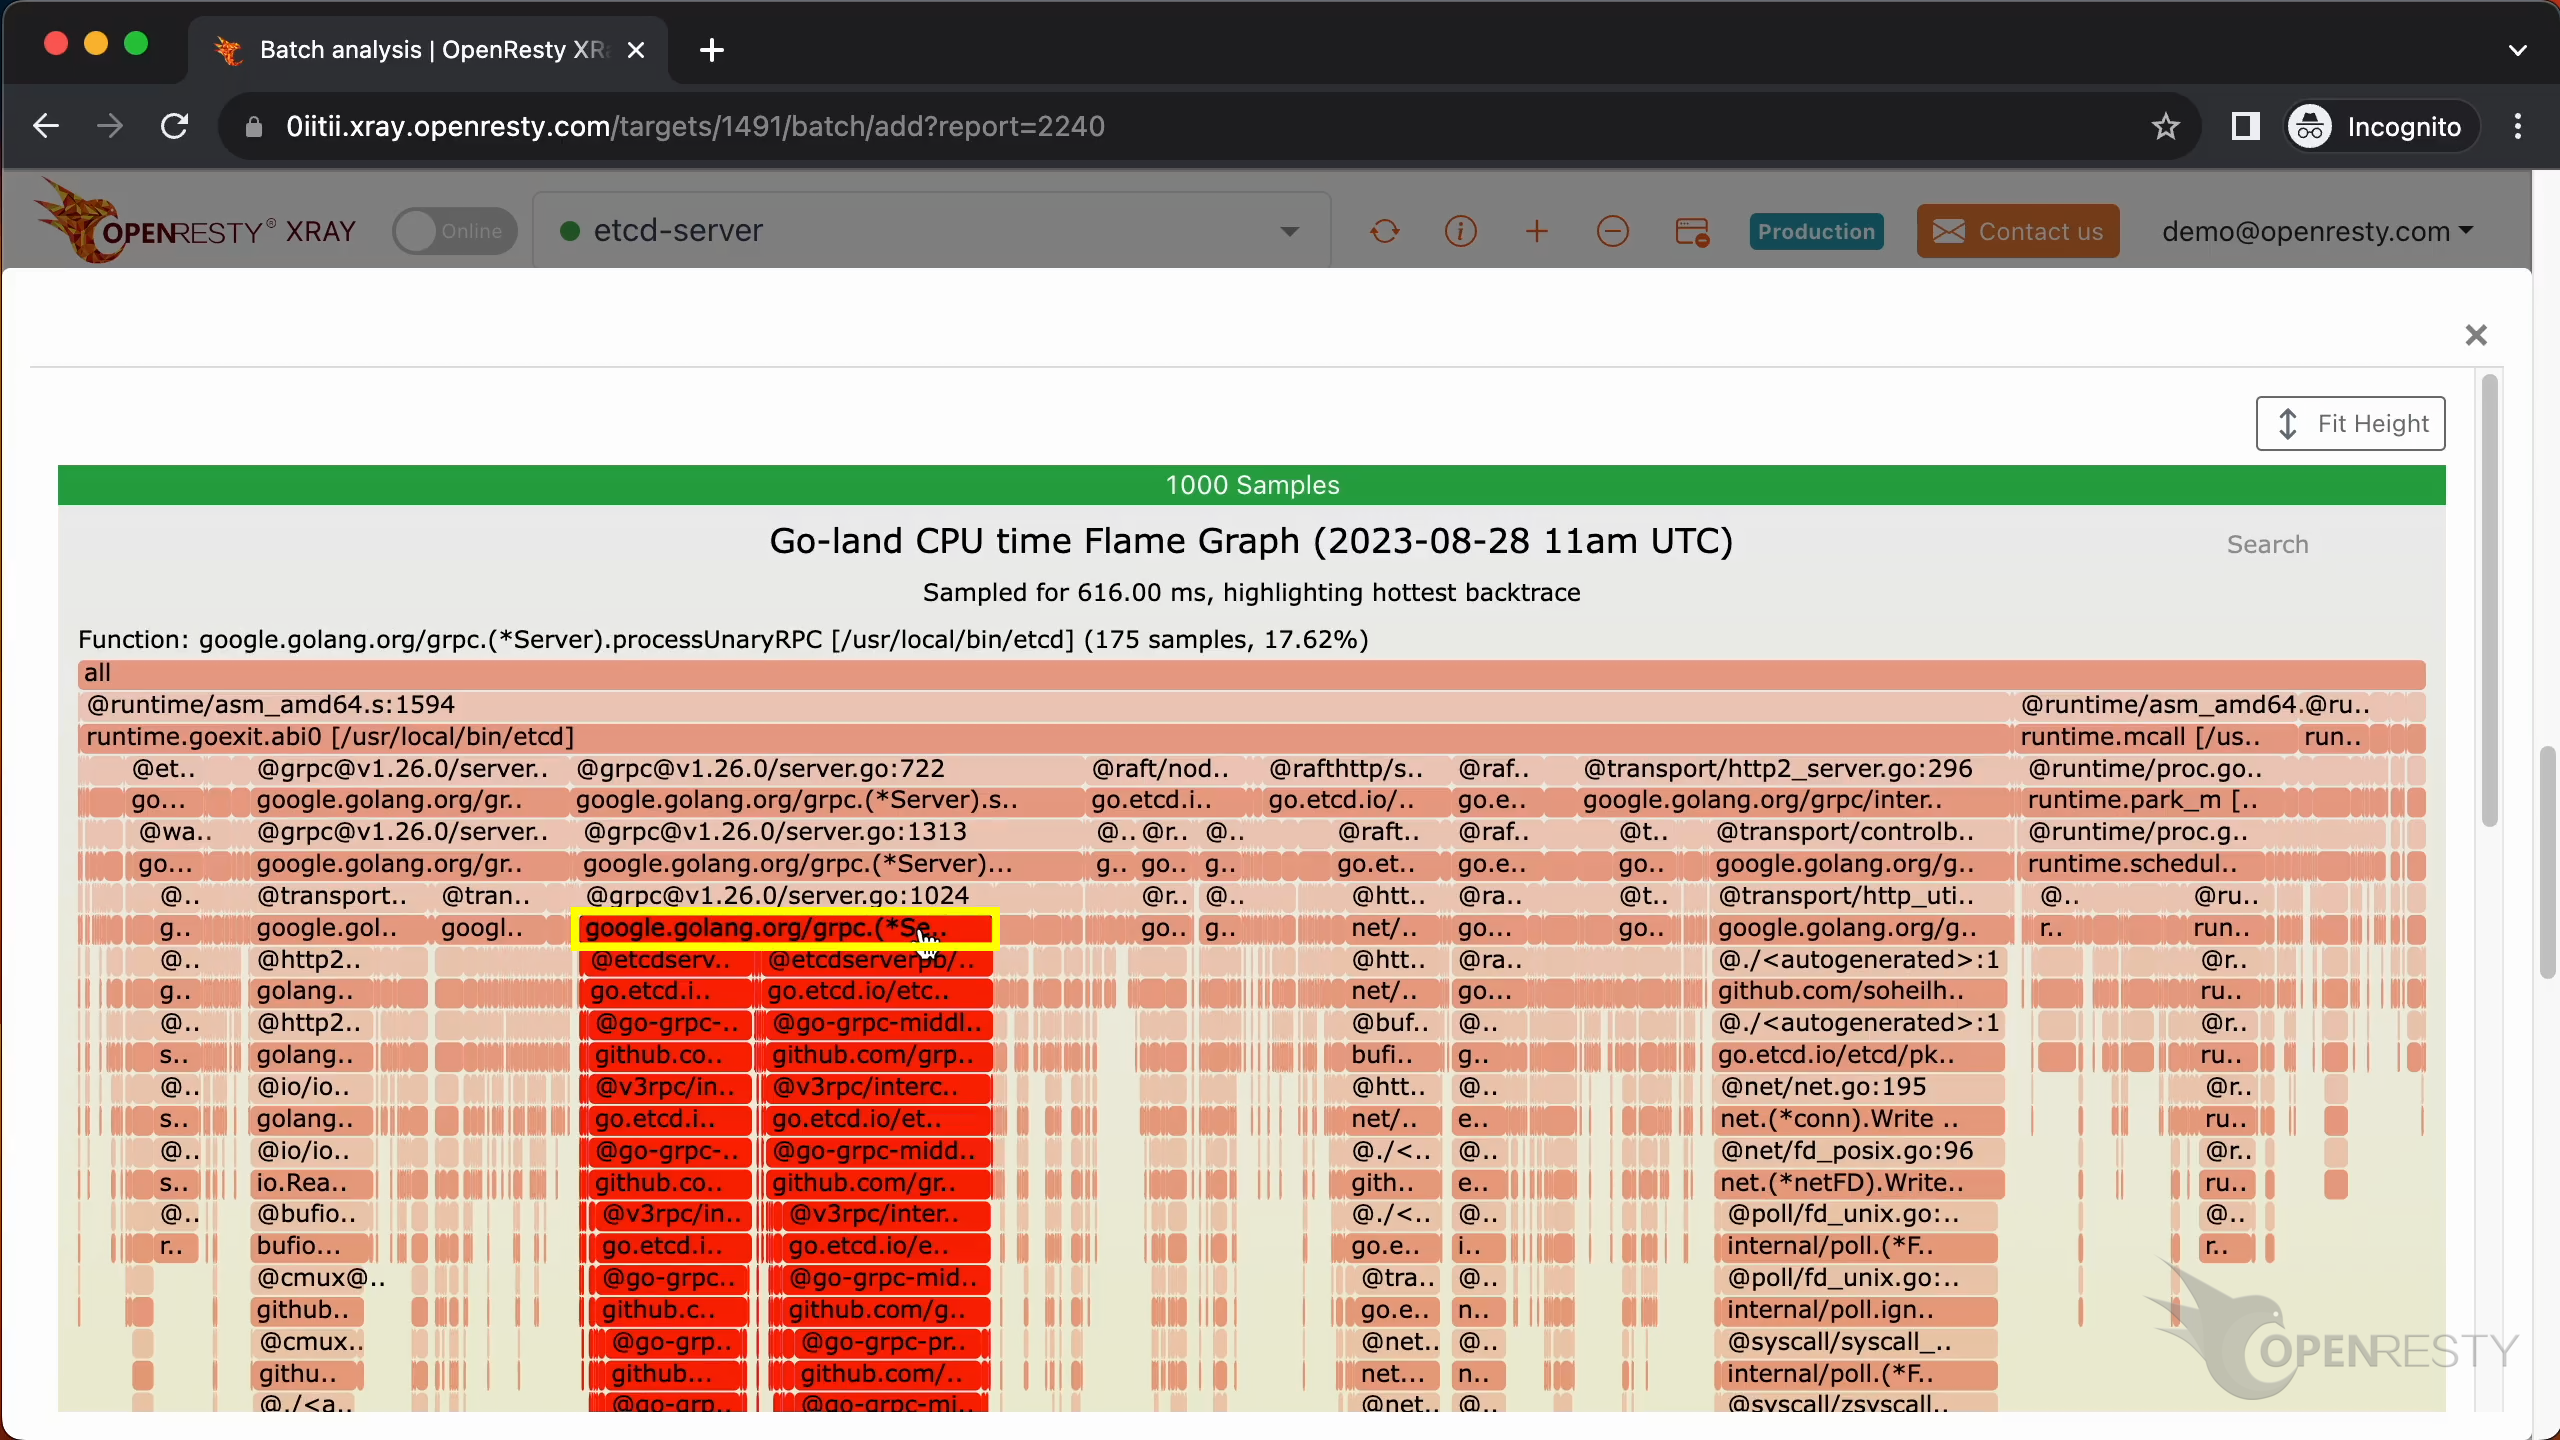
This is the #1 hottest Go-land code path for the CPU time.
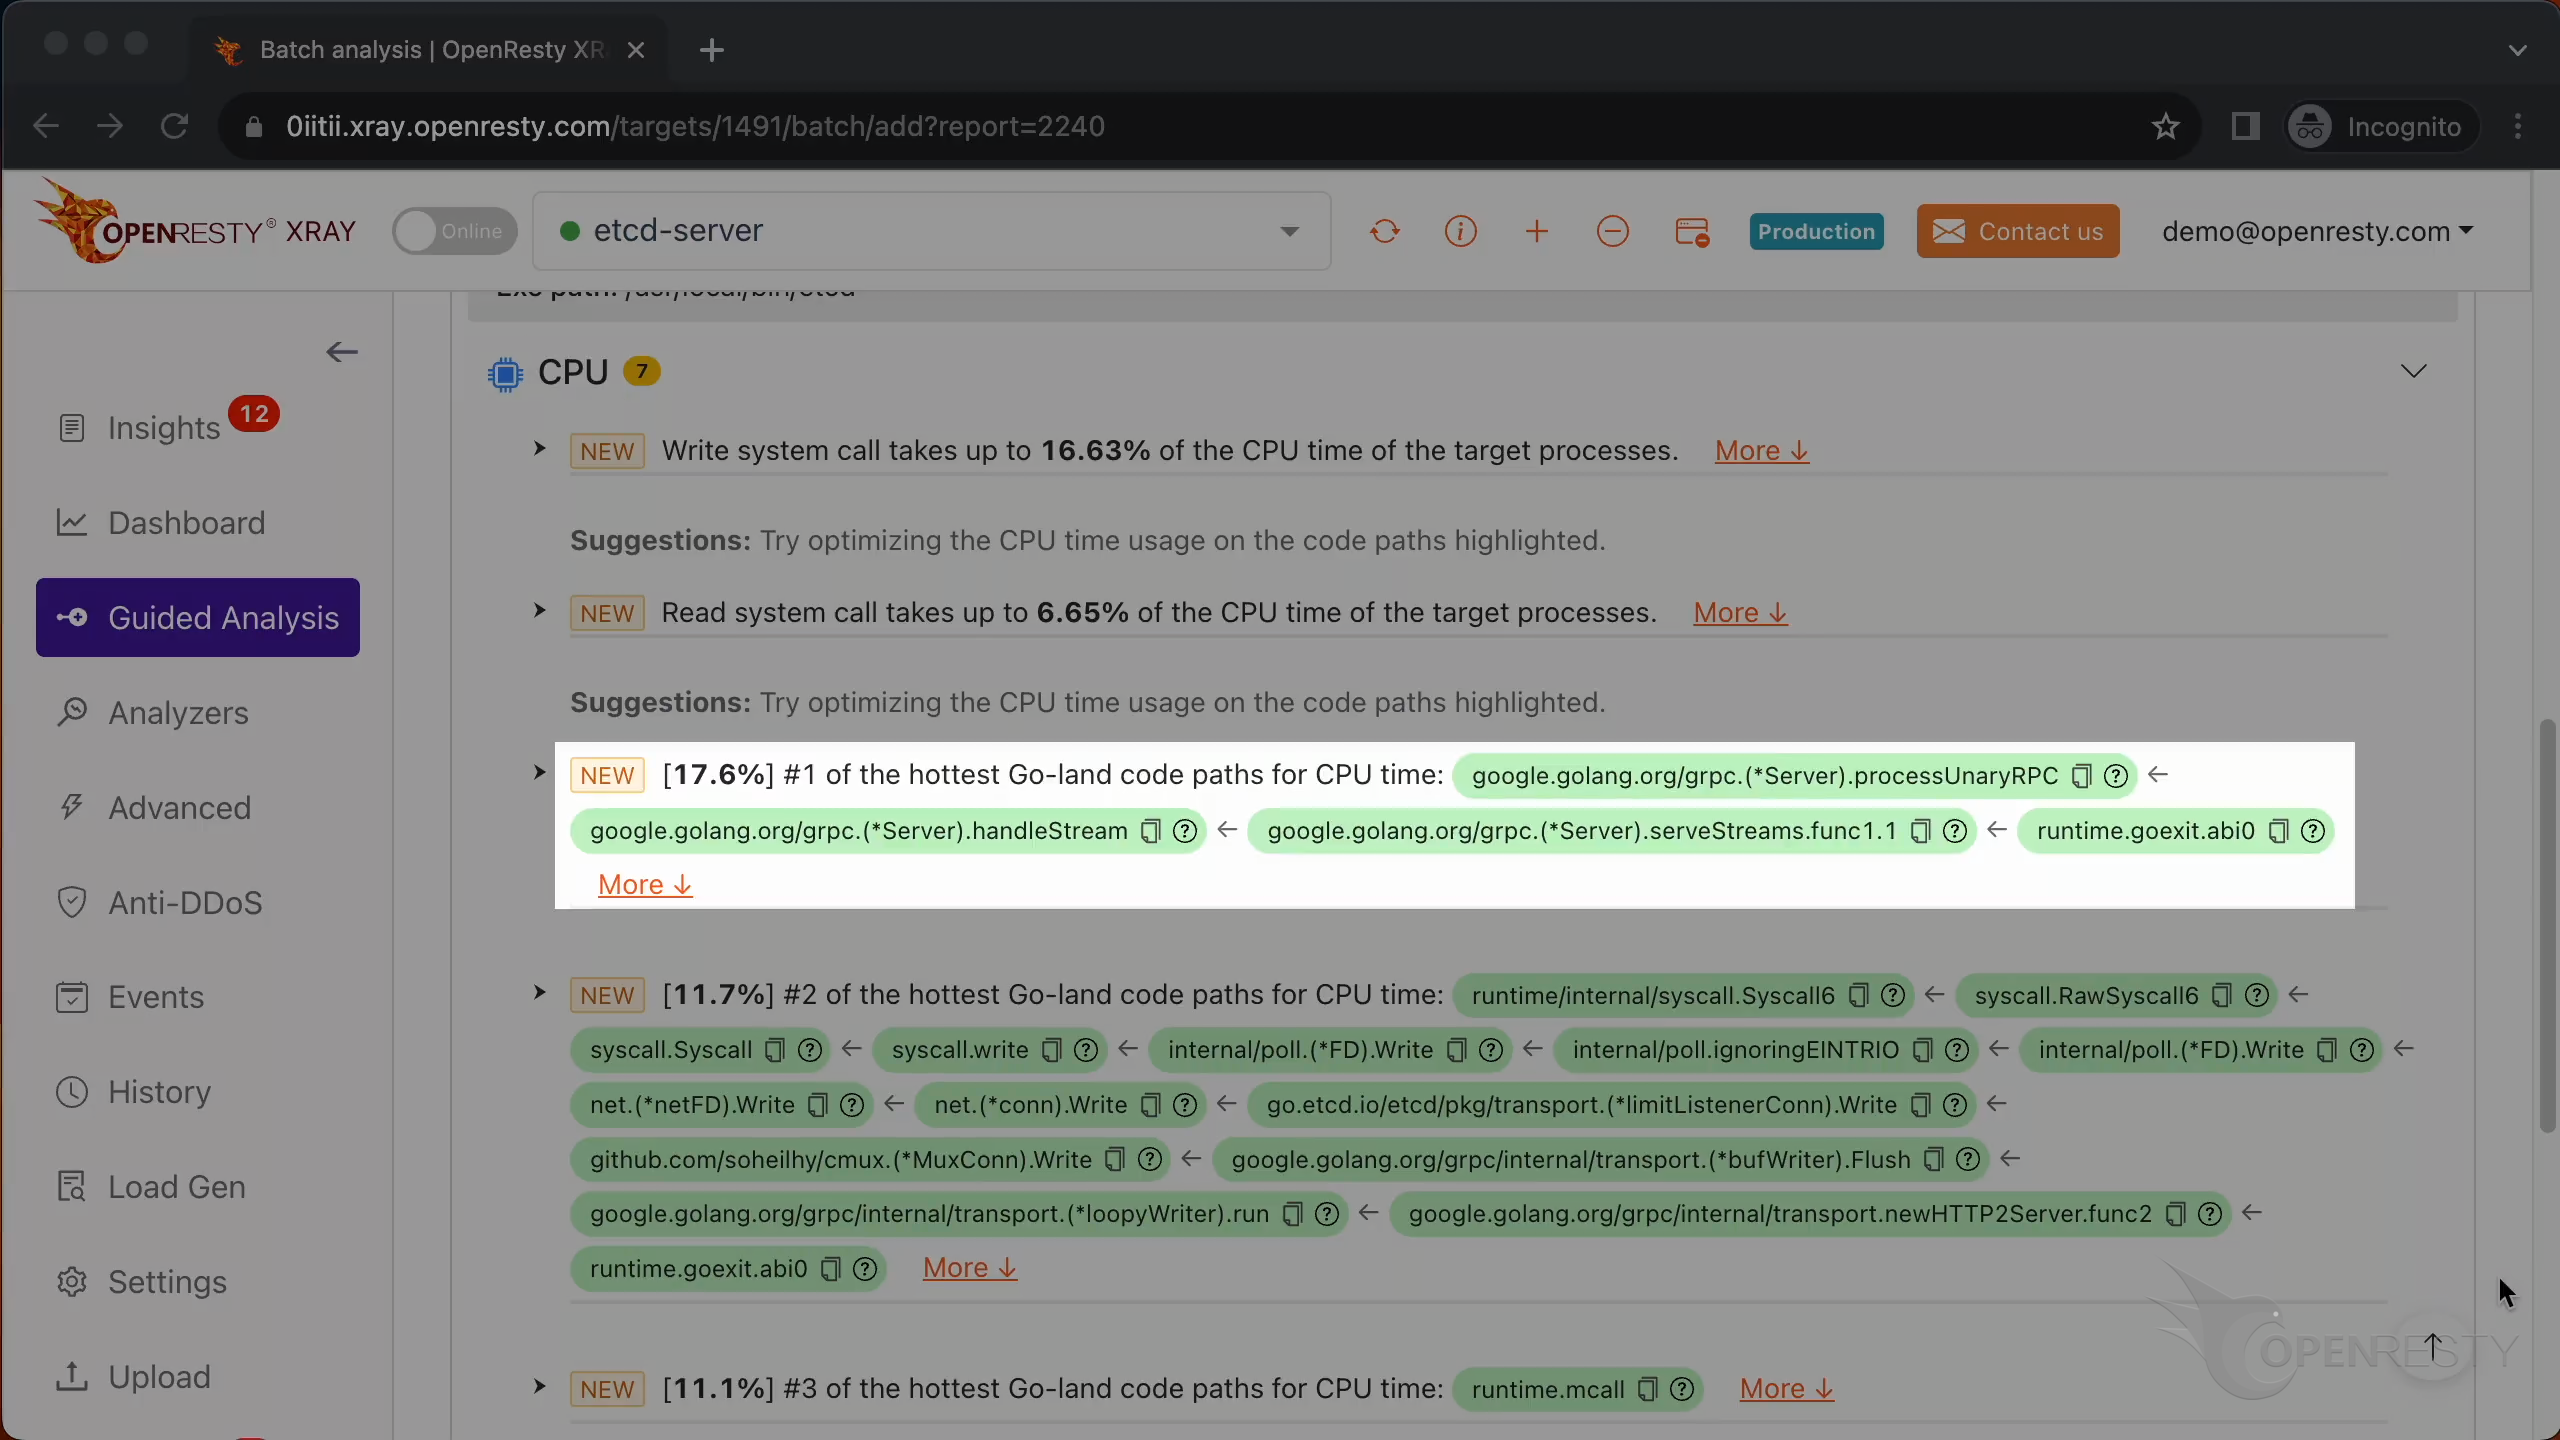
The processUnaryRPC function is in the Go gRPC library. It’s responsible for handling the simplest type of gRPC messages.
This function is called by the handleStream function.
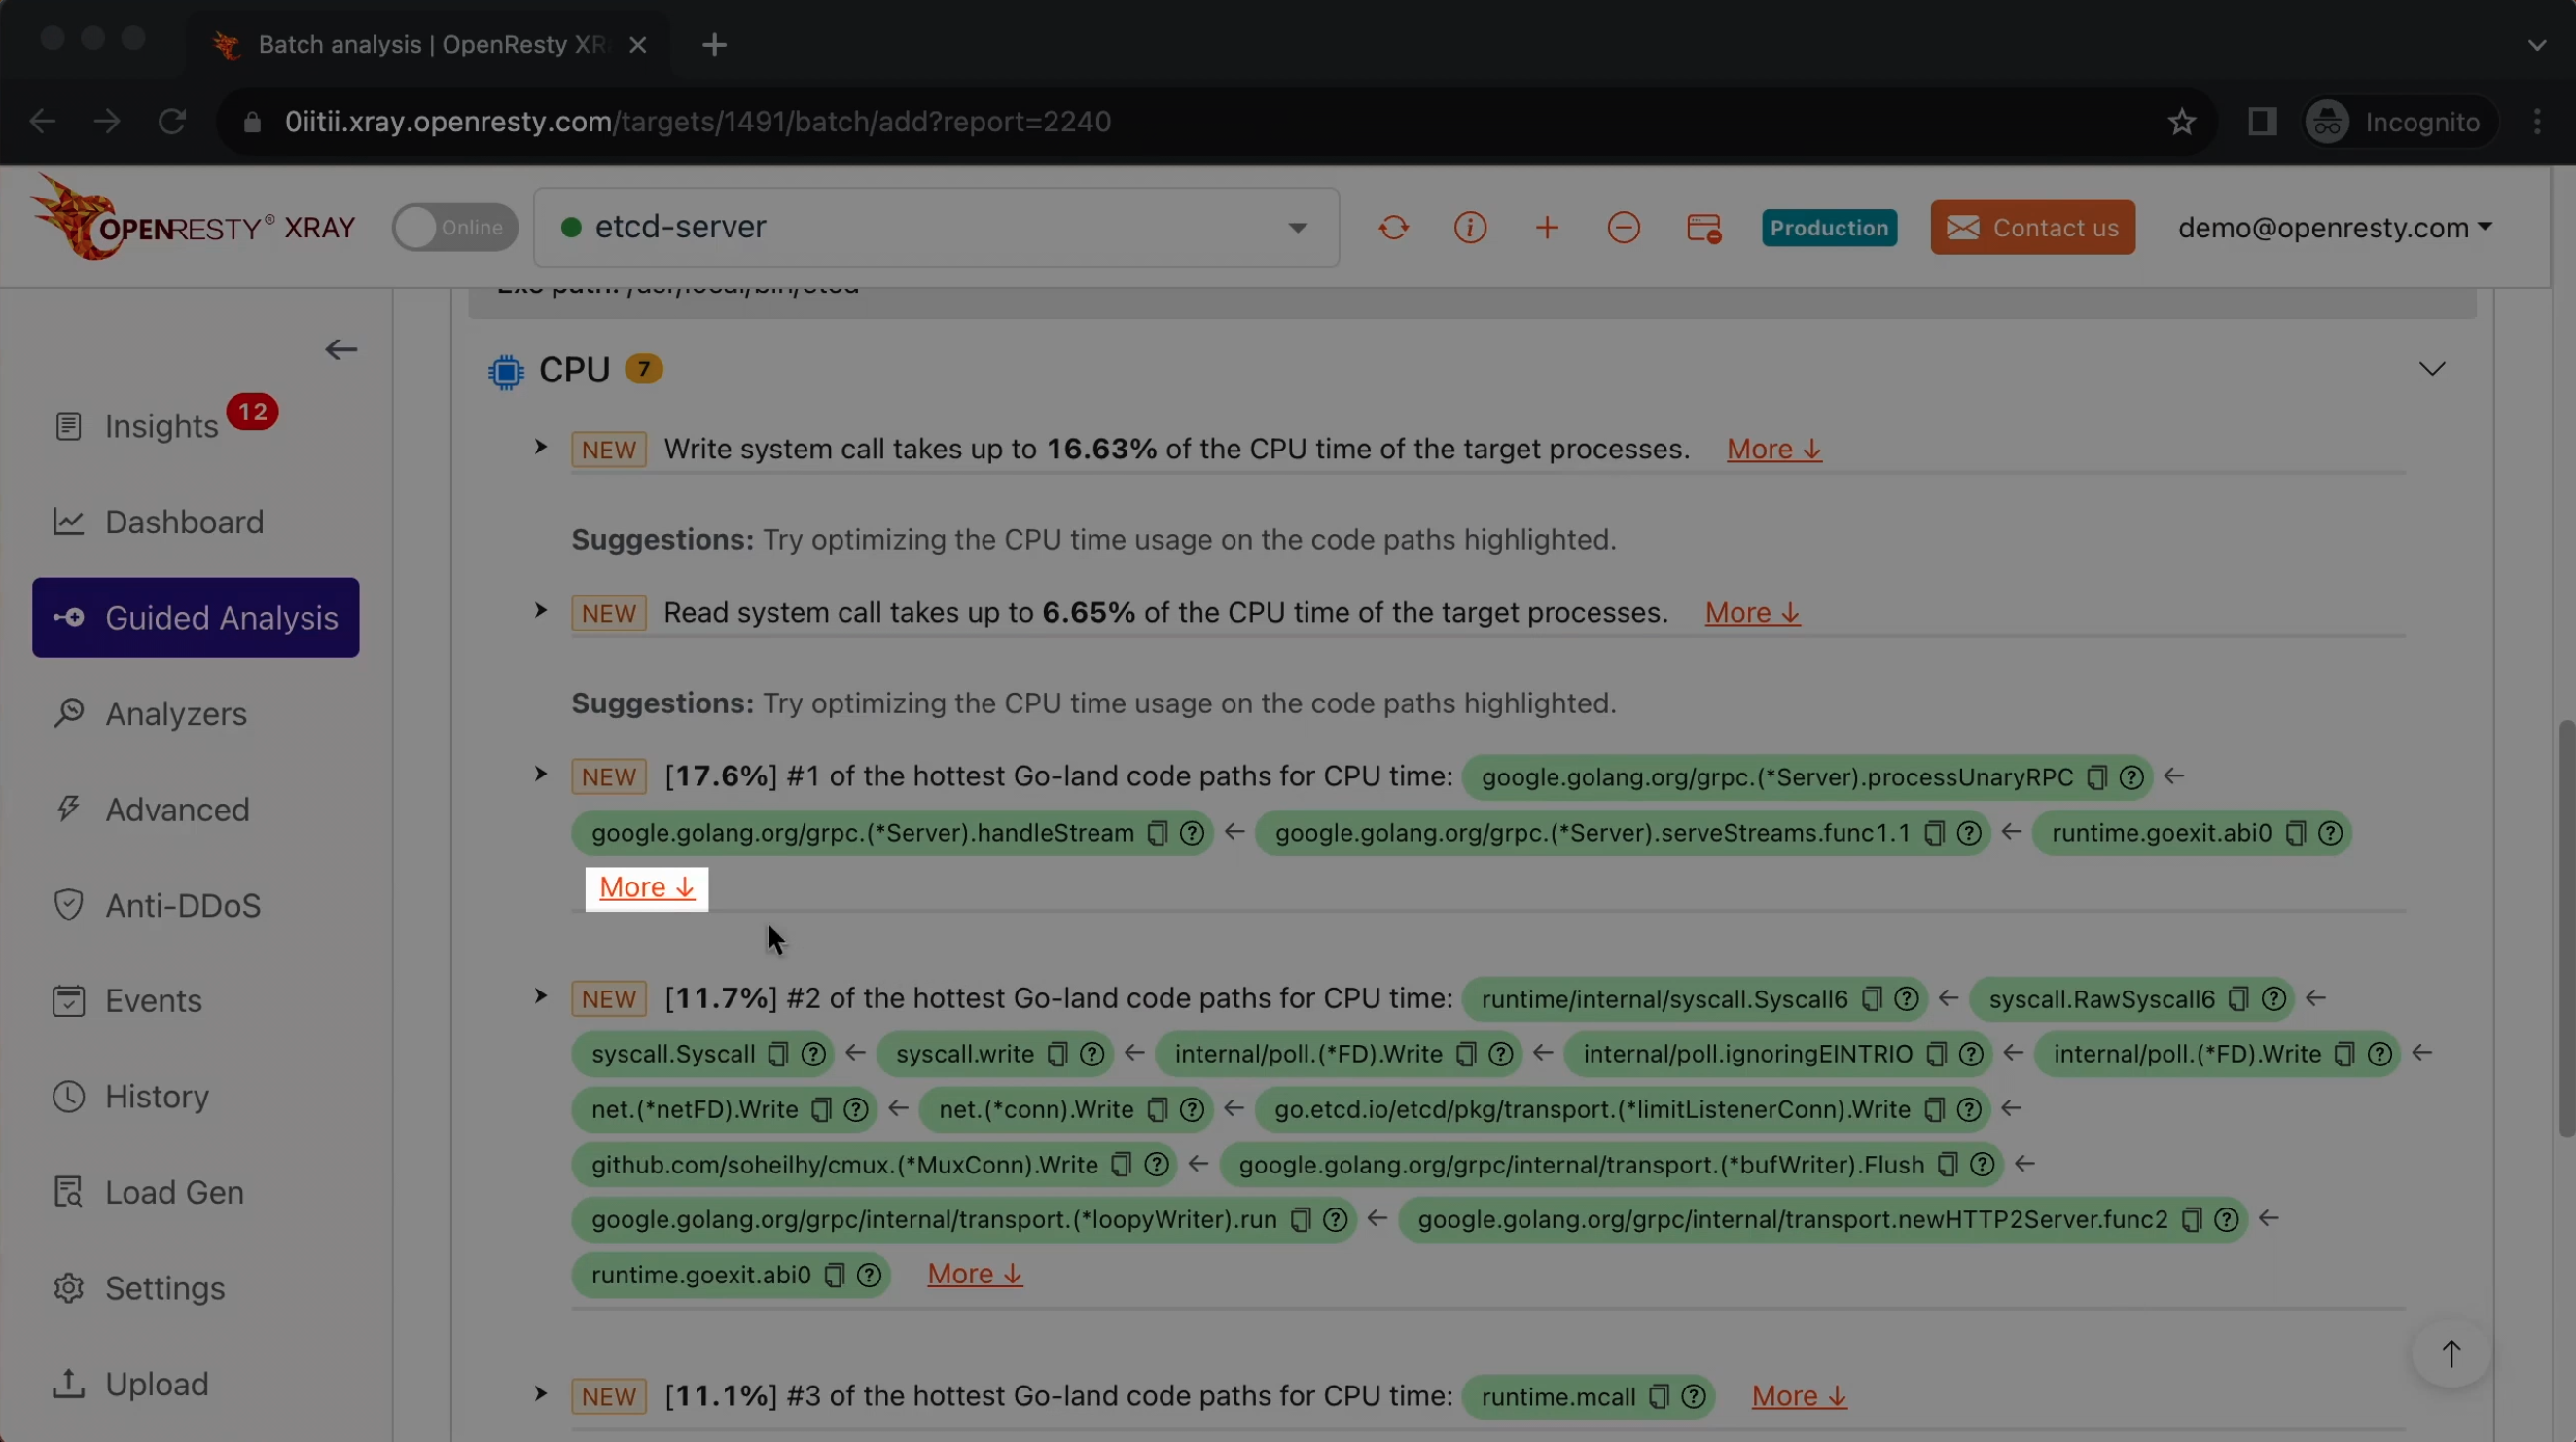
Click “More” to see details about this code path.
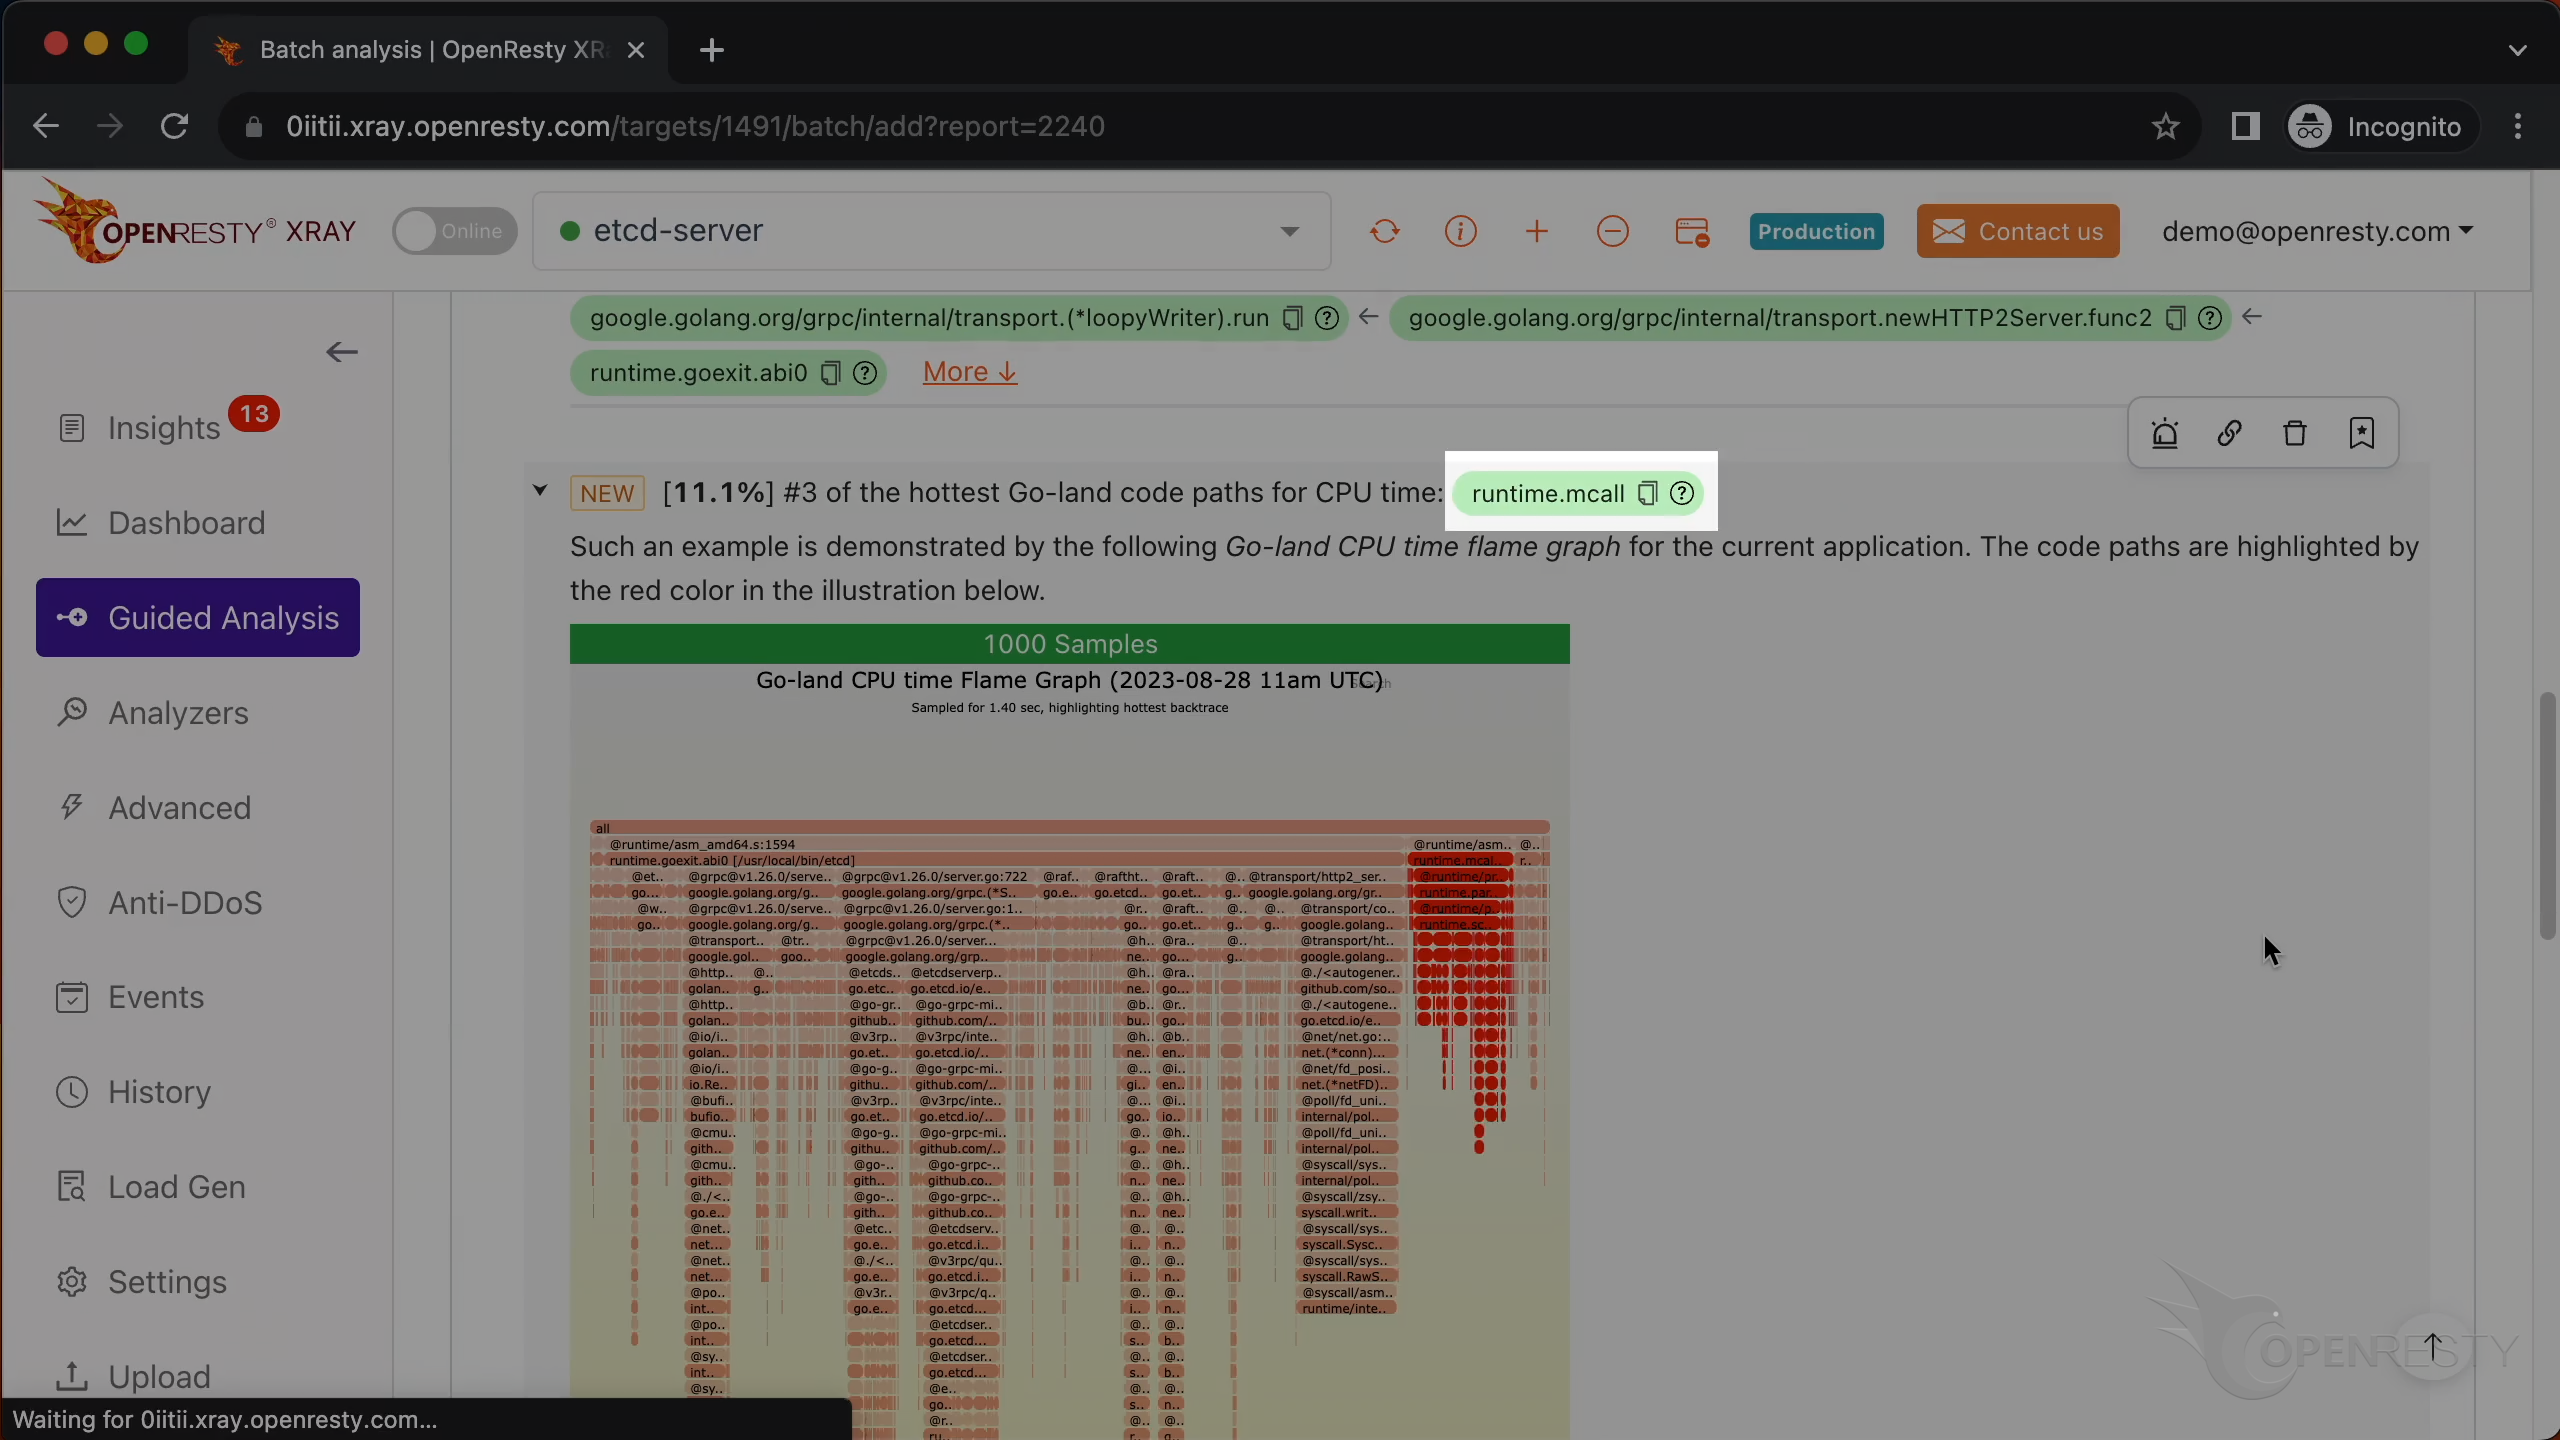
The code path was automatically derived from this Go-land CPU flame graph.
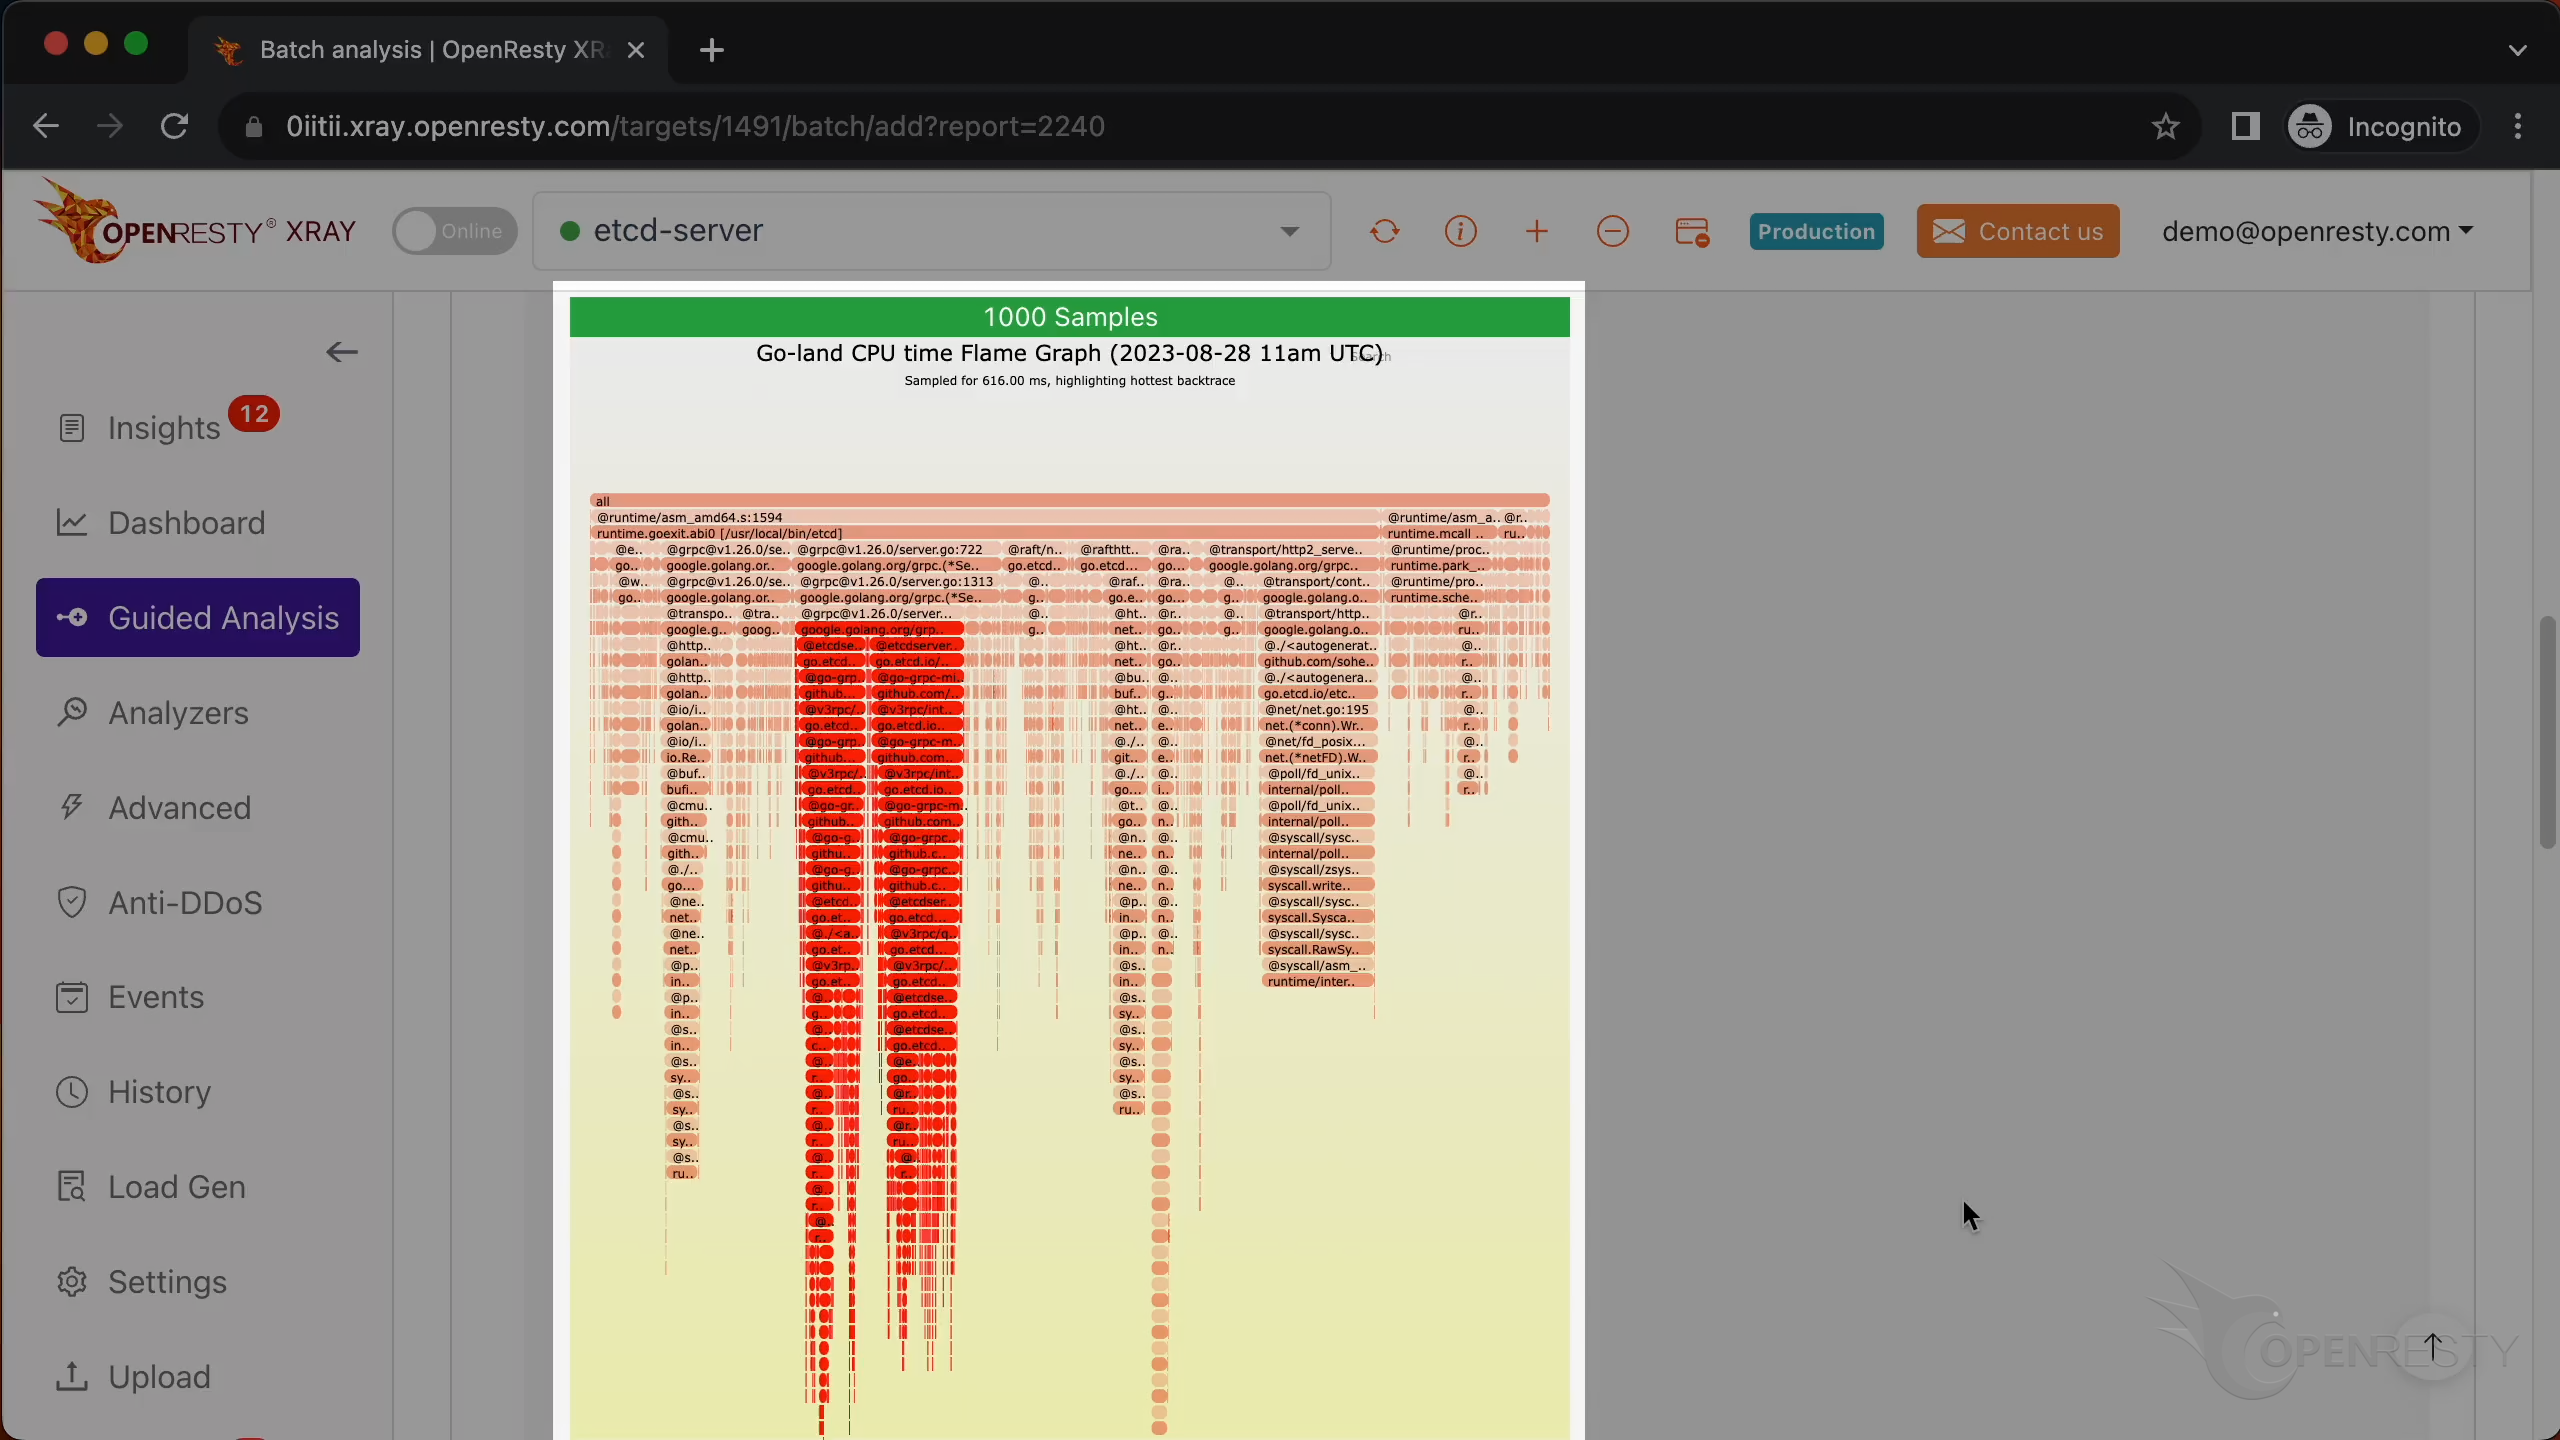
Click the icon to enlarge the flame graph.
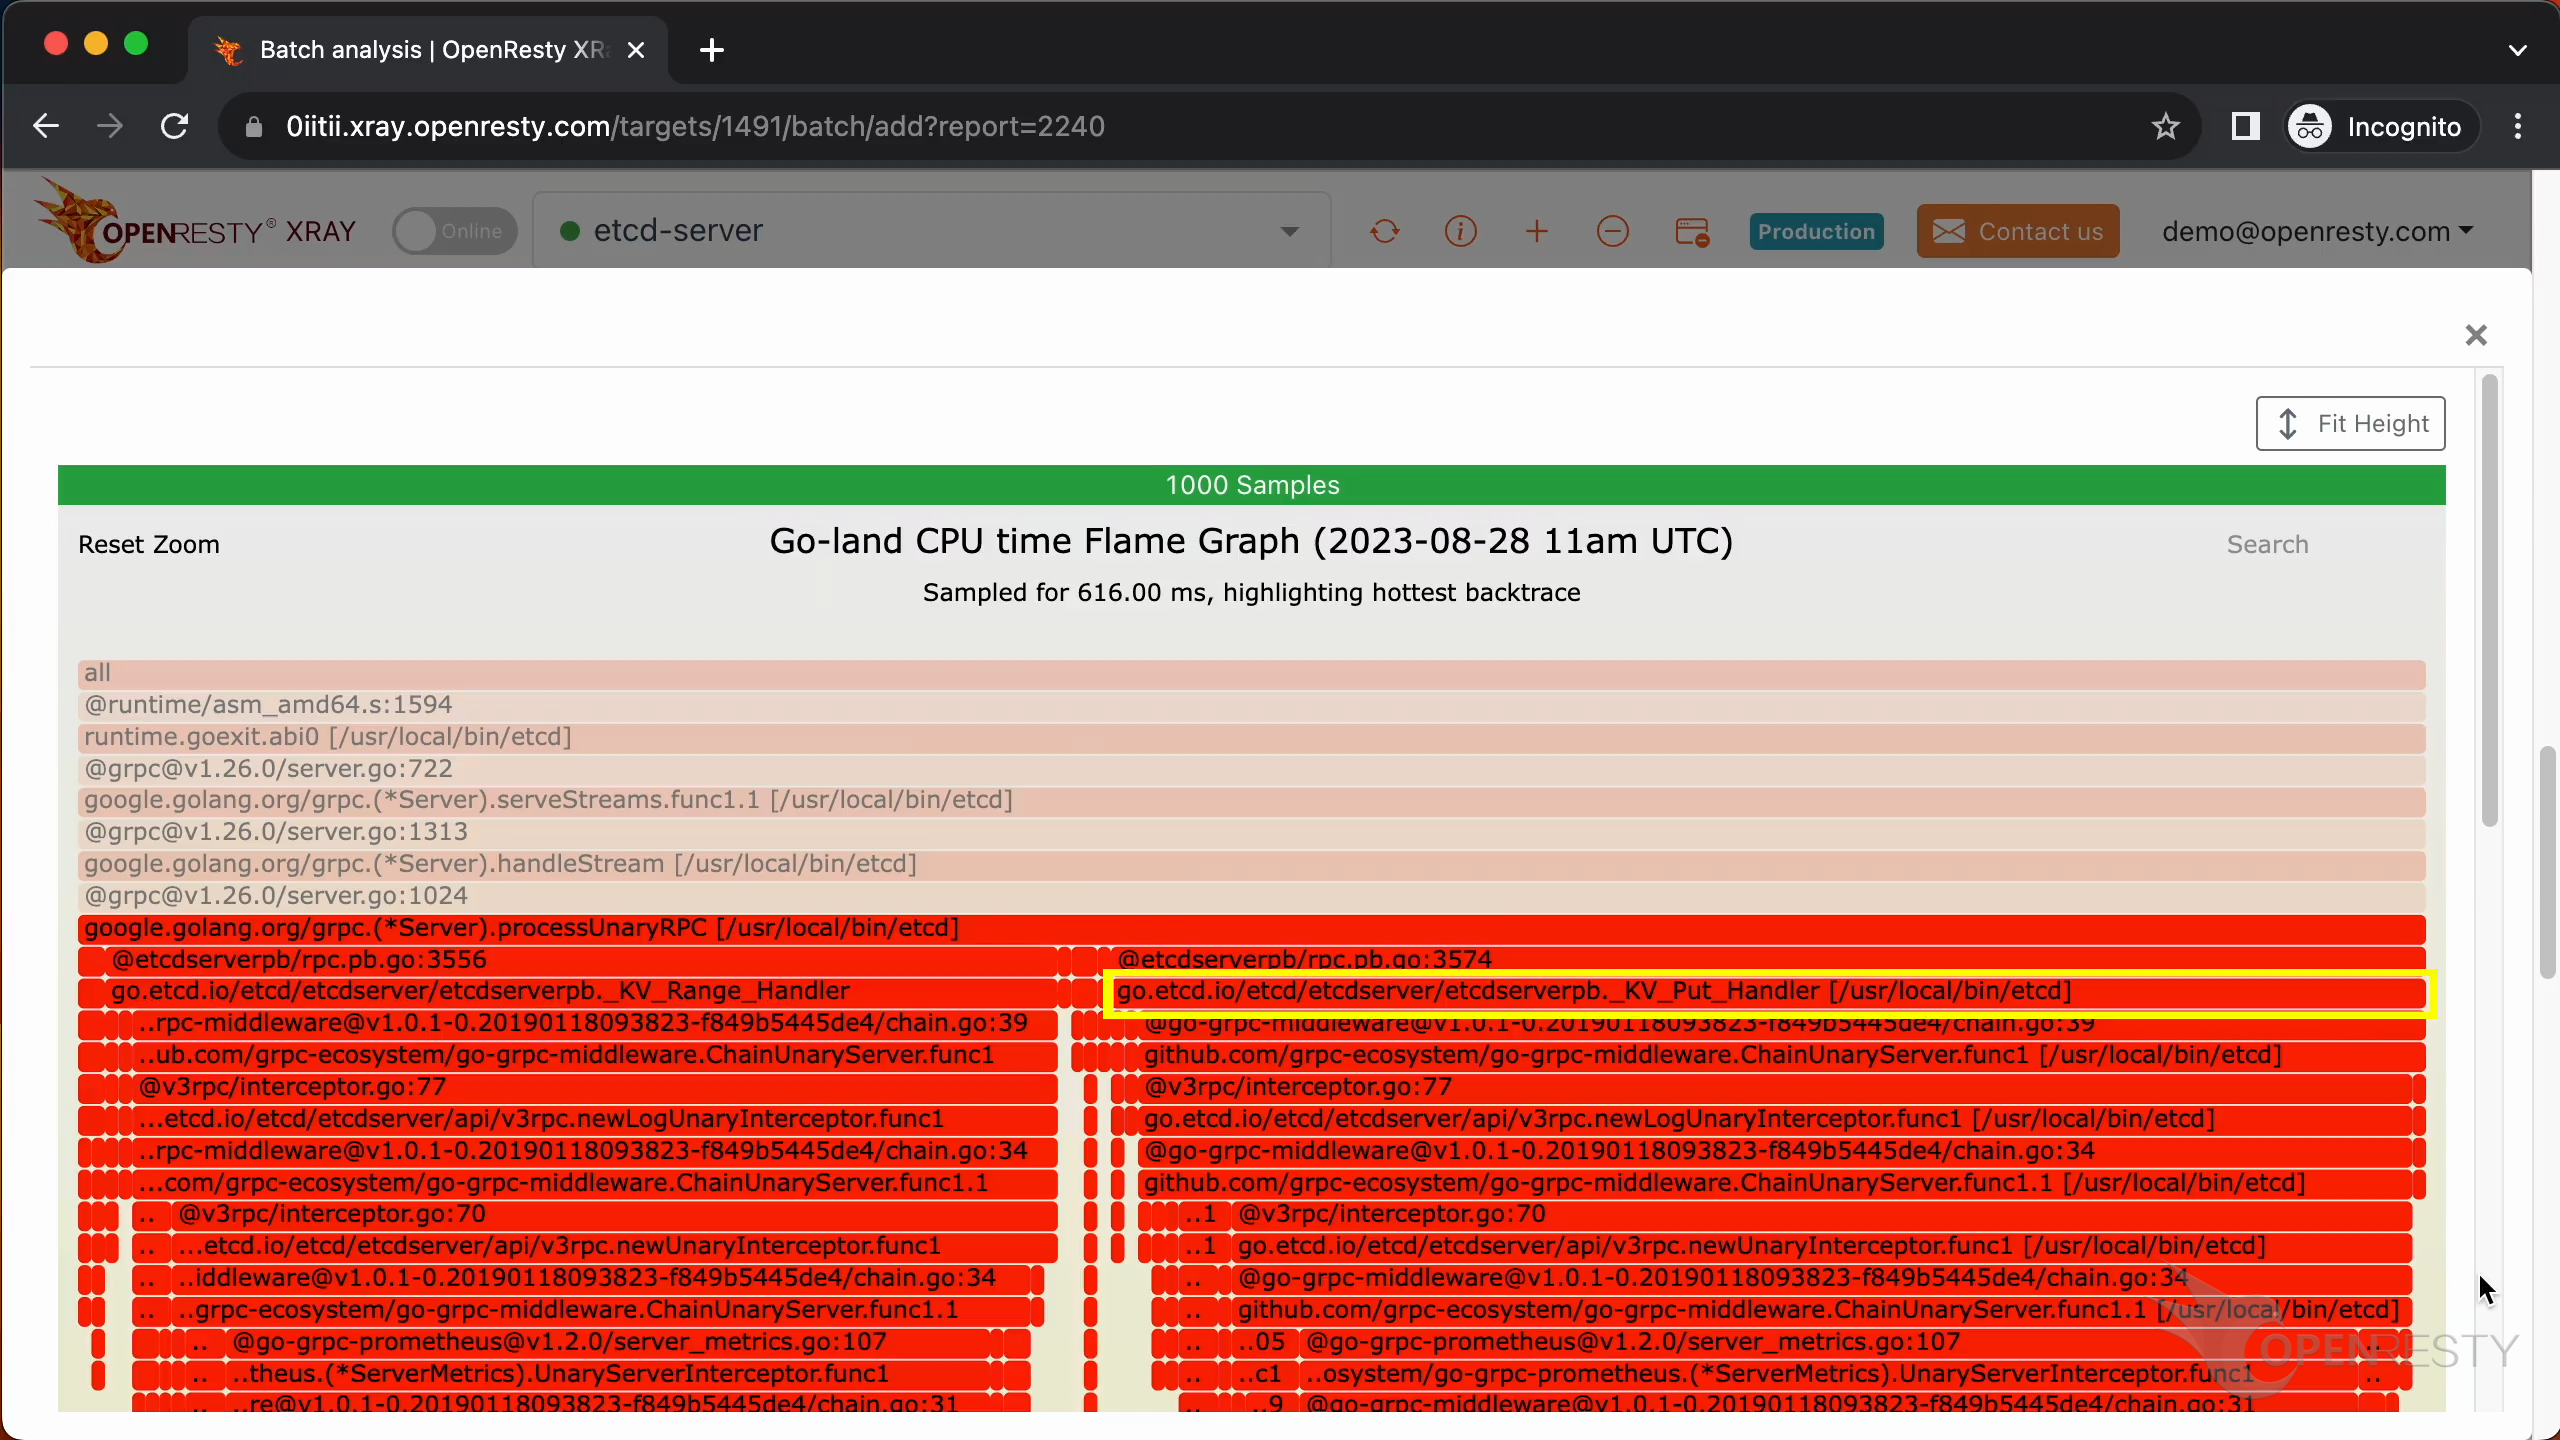
Continue to zoom in.
The function _KV_Range_Handler gets the keys in the range from the key-value store.
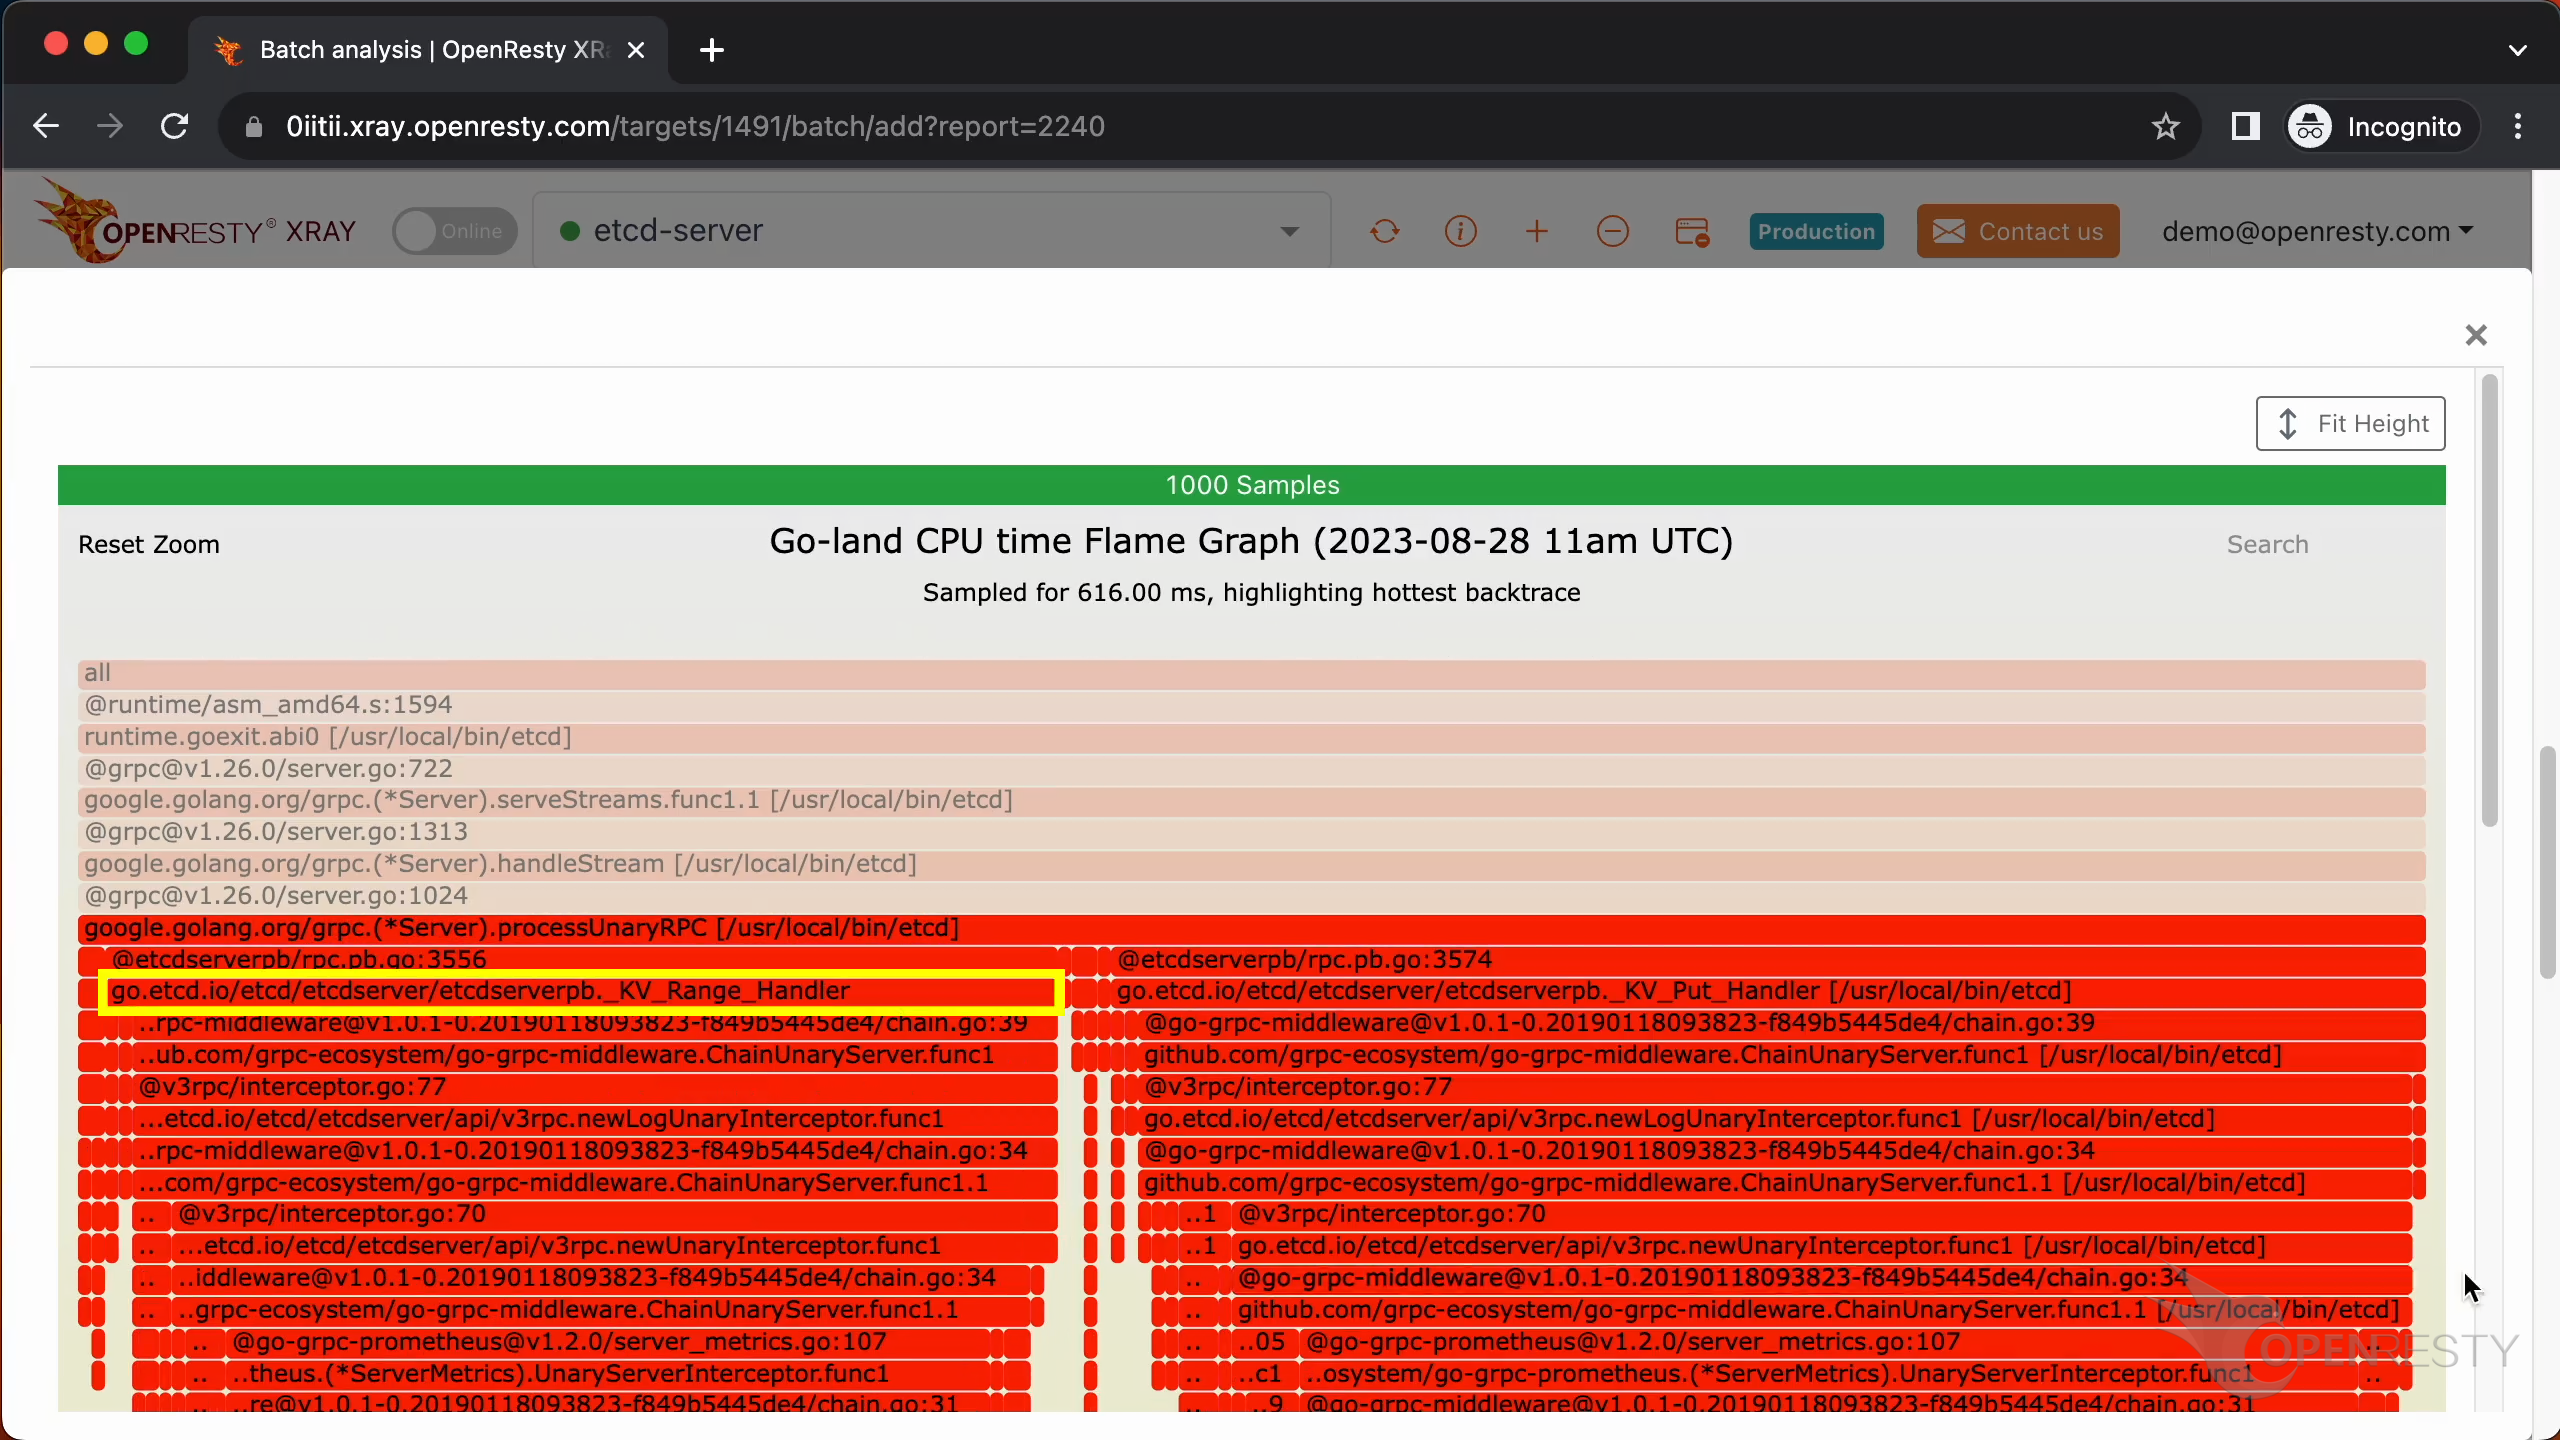
The function _KV_Put_Handler puts the given key into the key-value store.
The Range function is used to query the key-value data stored in etcd by range.
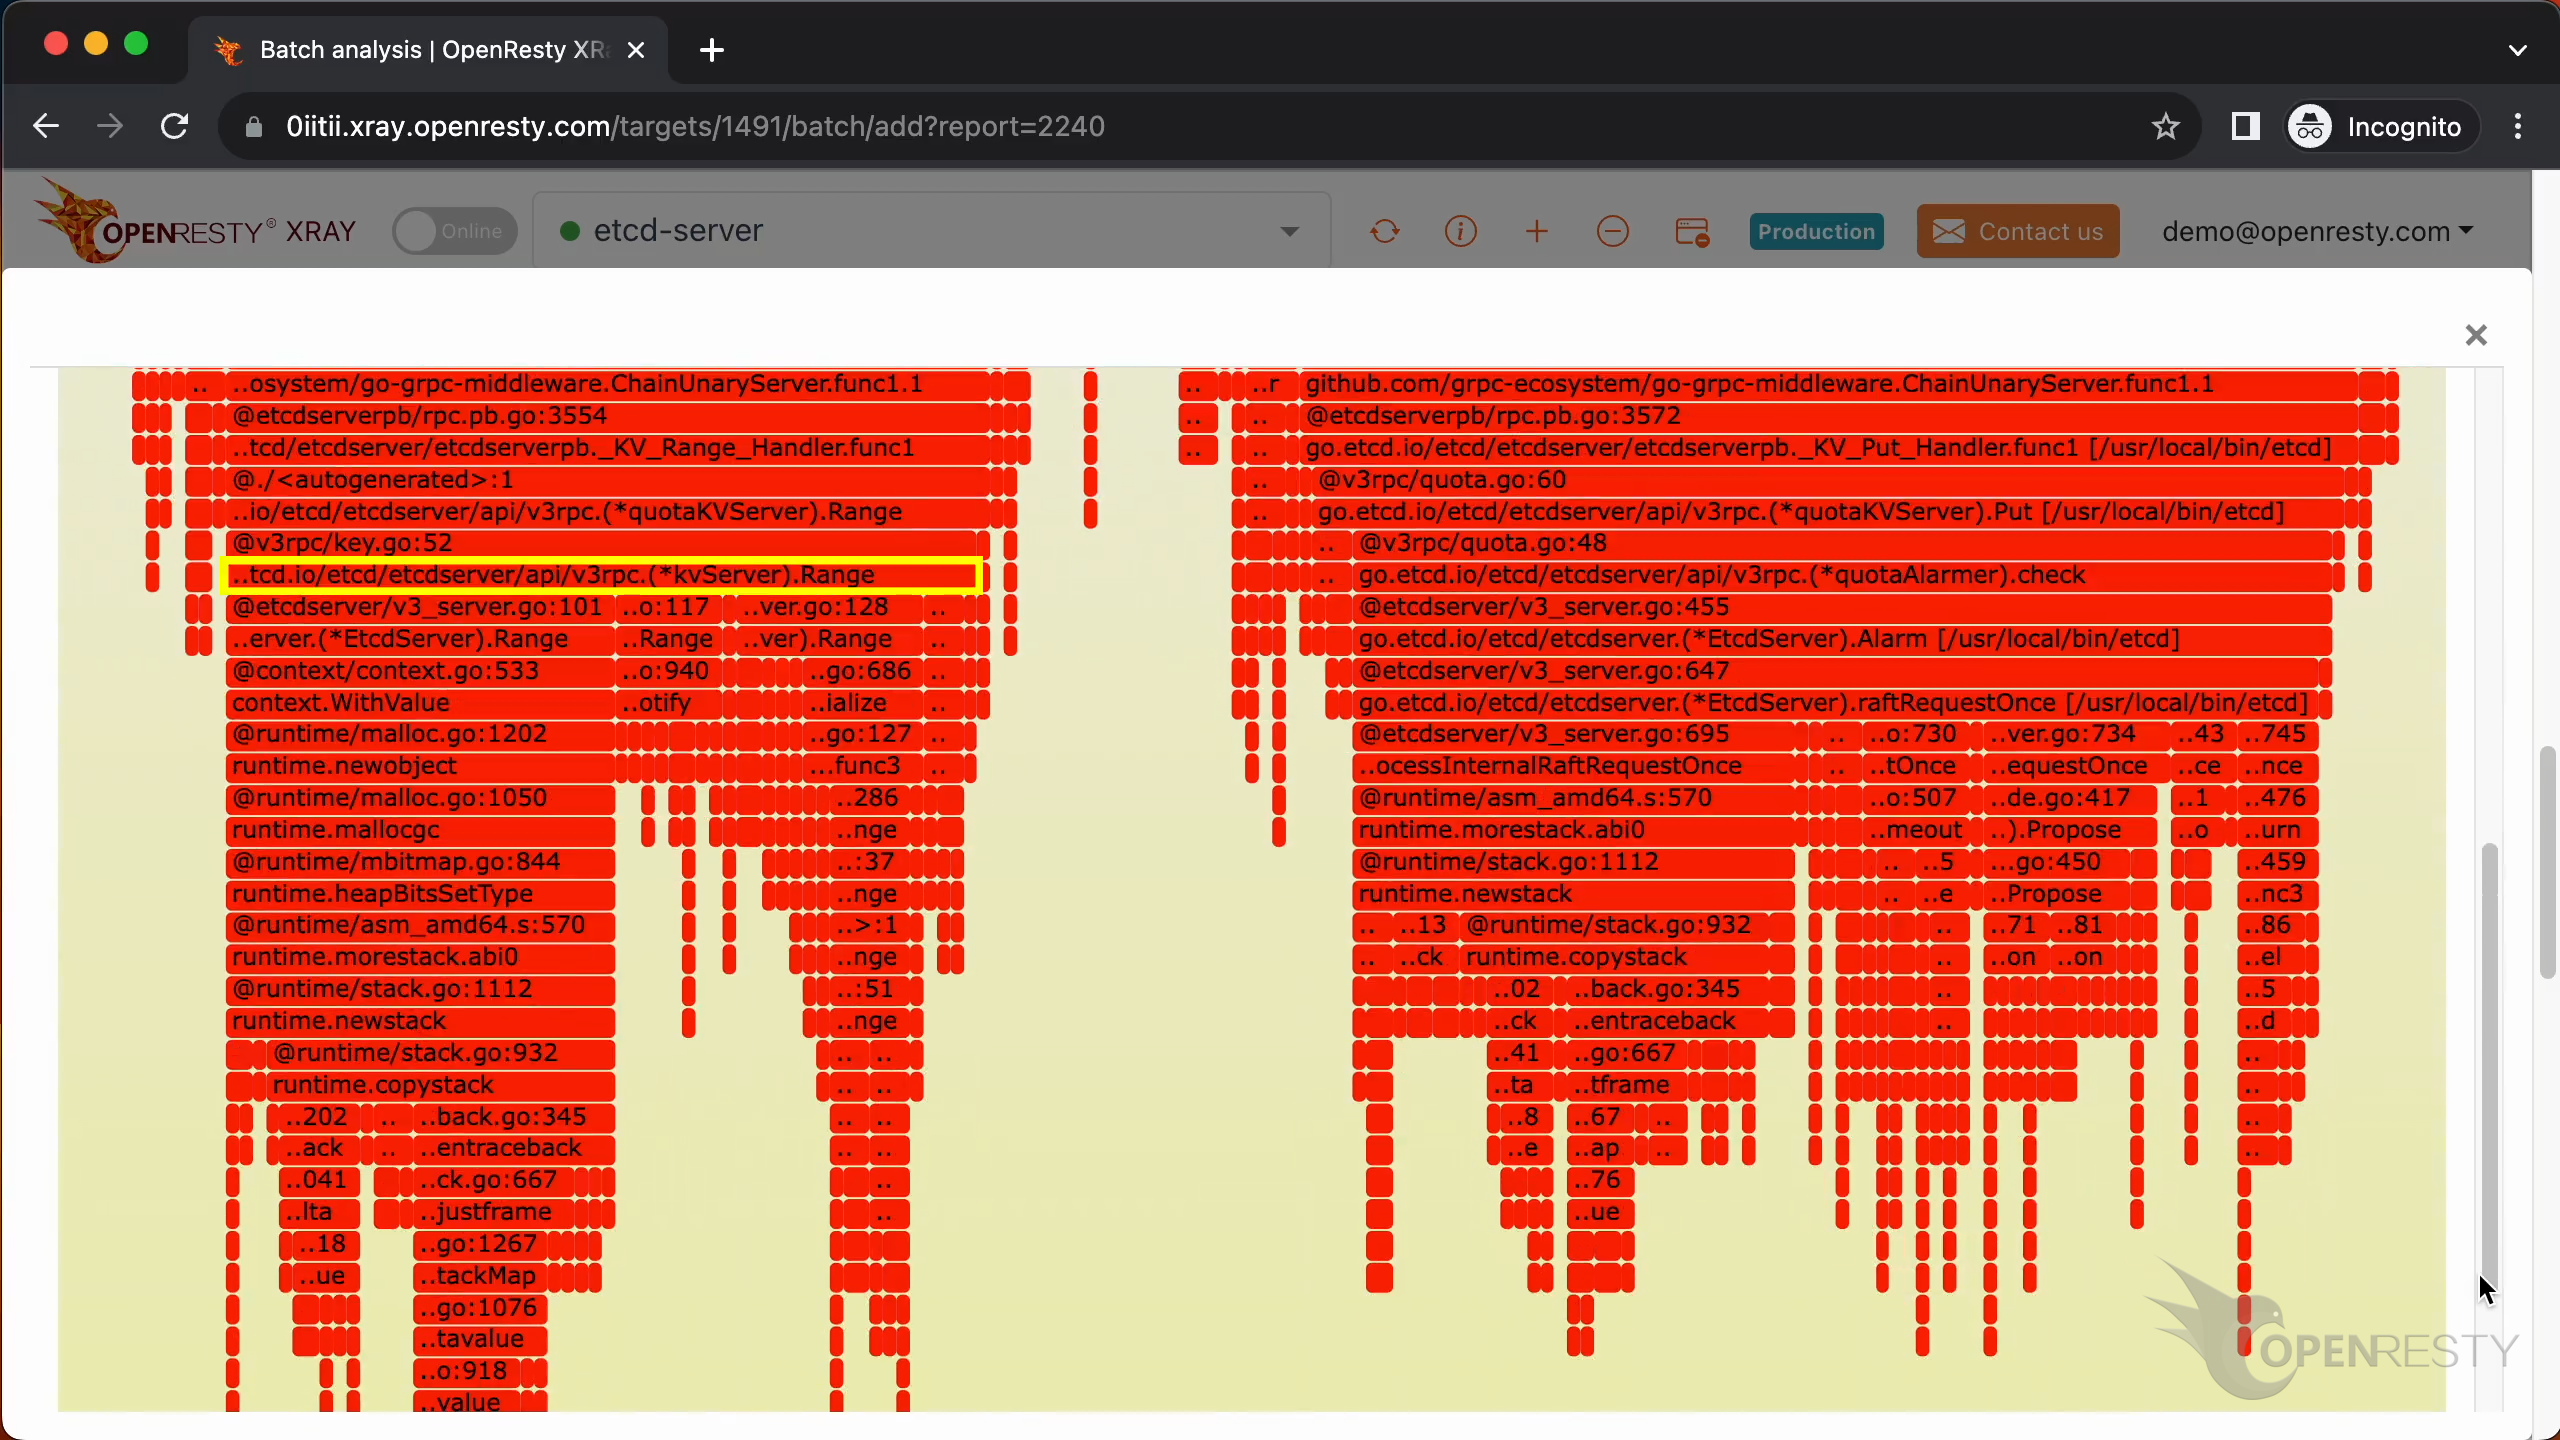
It calls runtime.newobject to create a large number of golang GC objects.
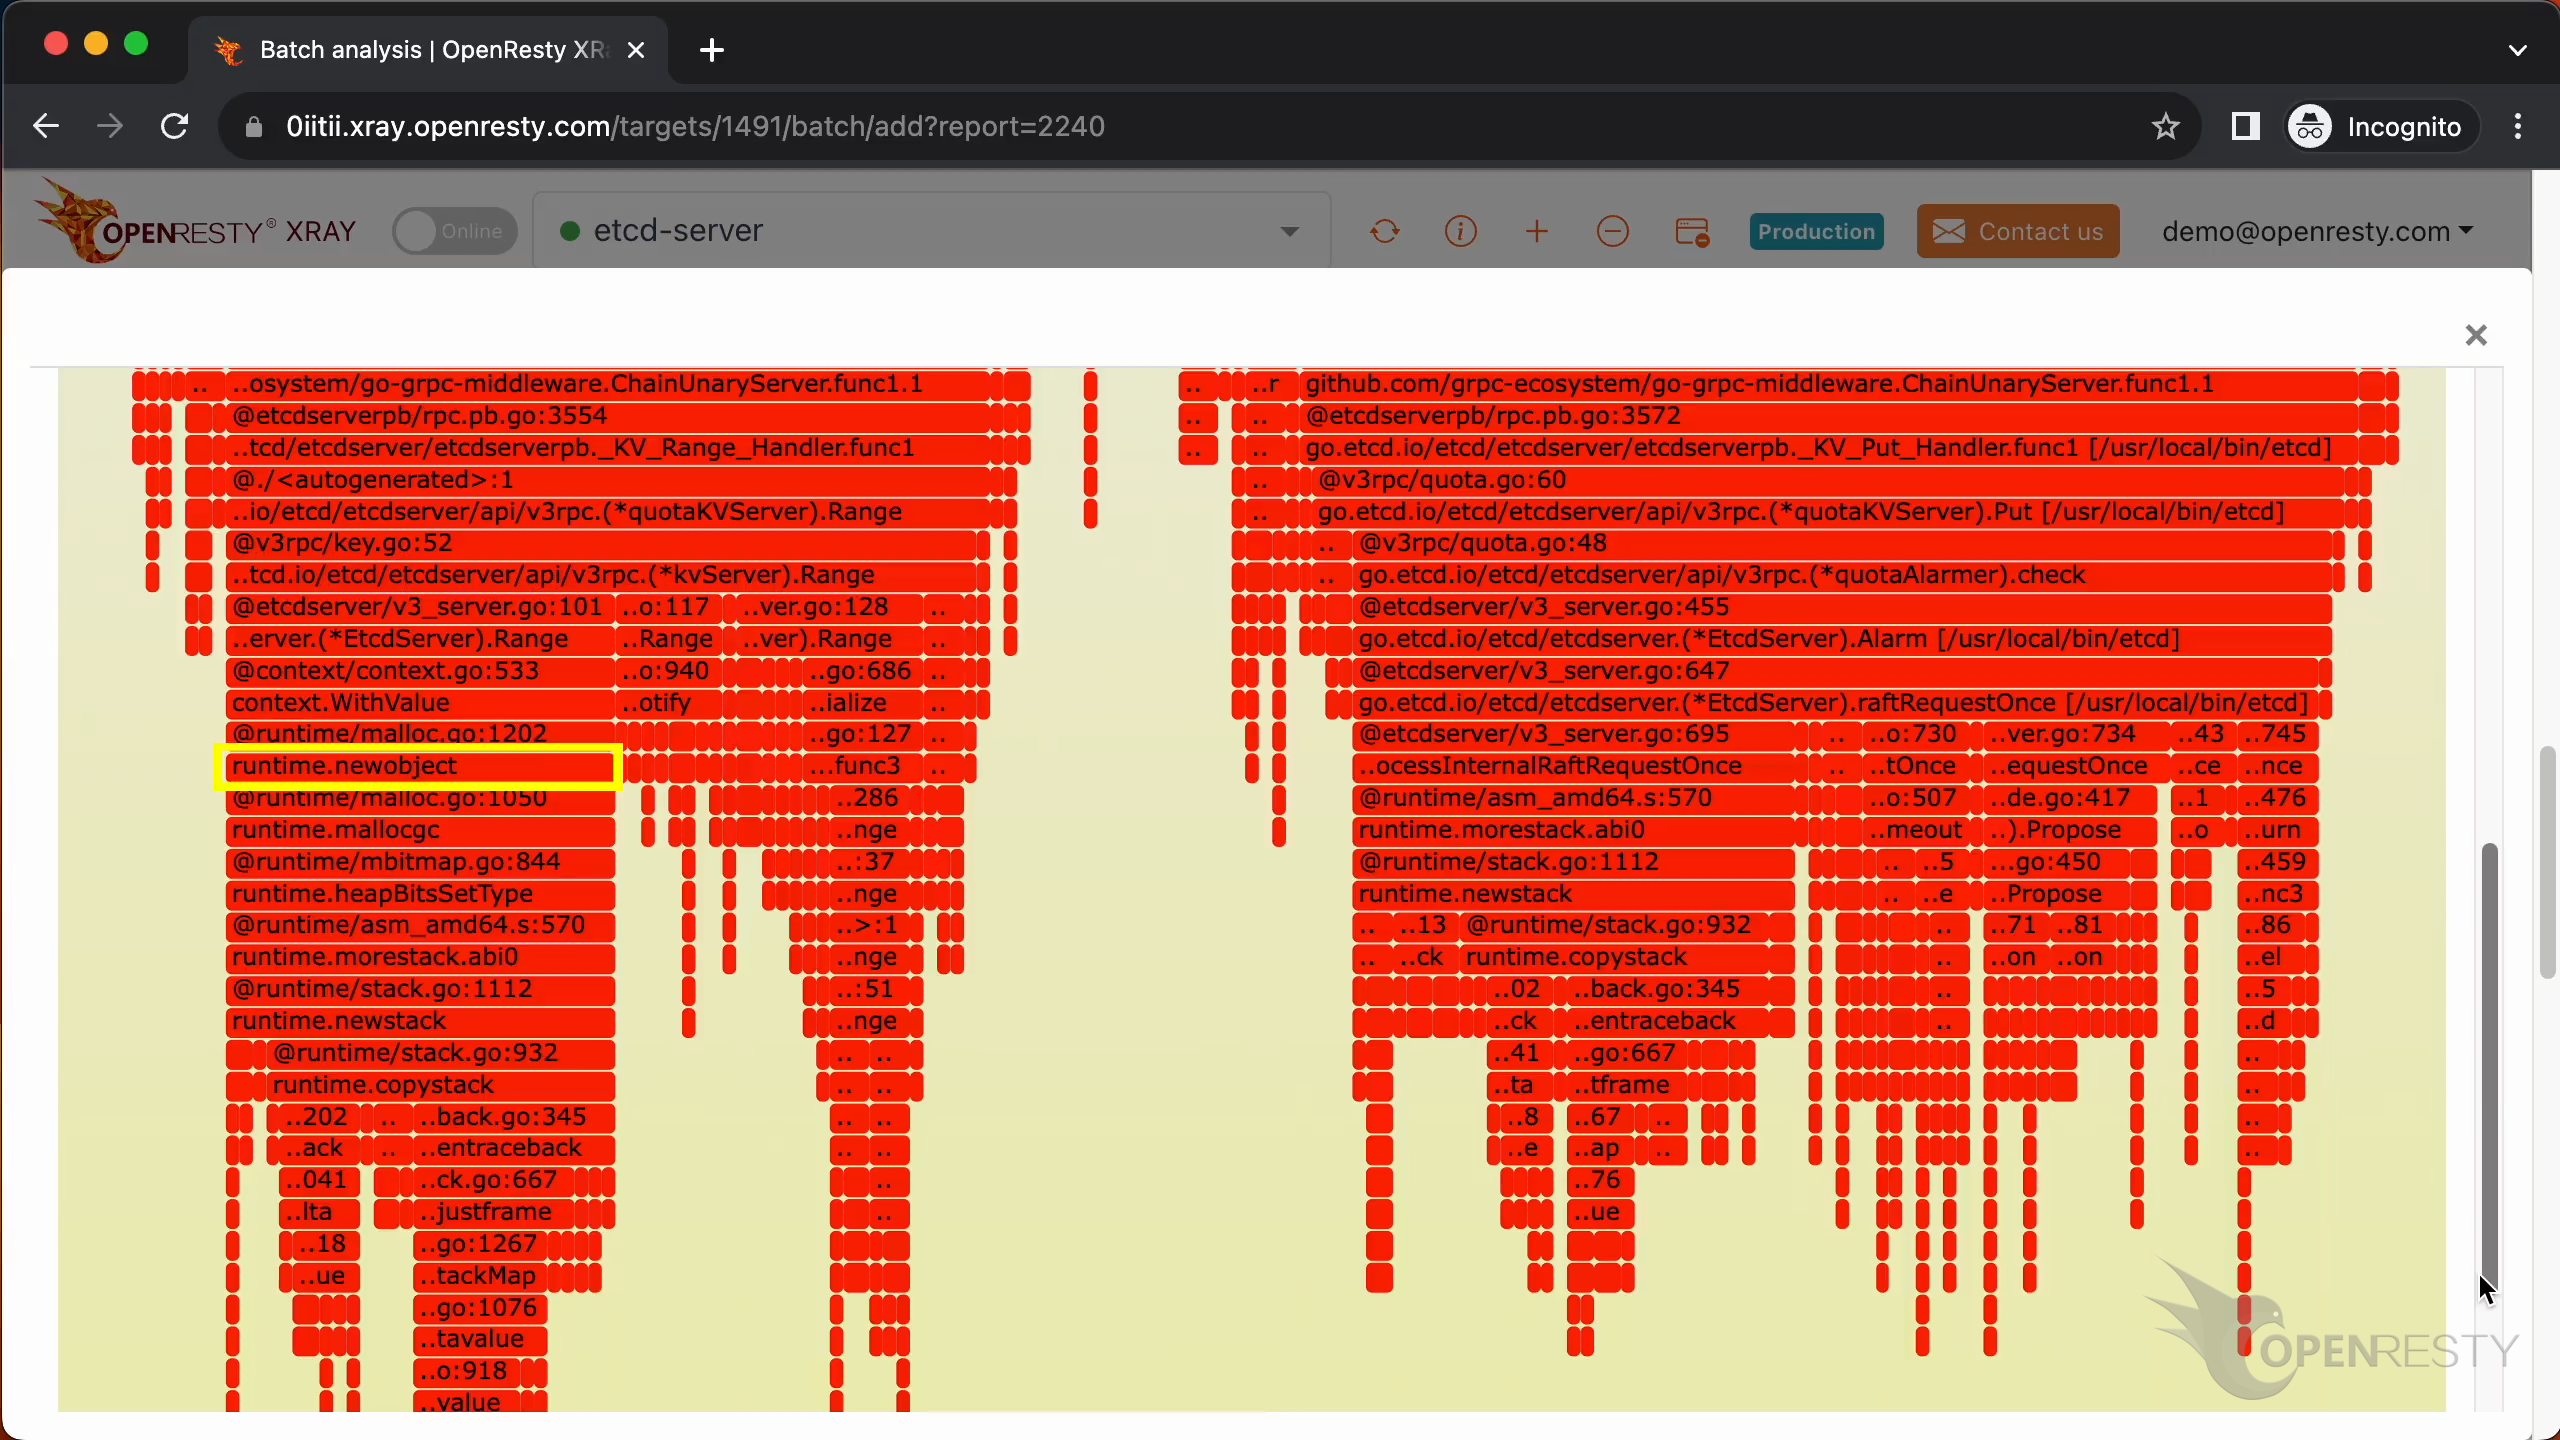
The function runtime.newstack has a high CPU overhead when writing data to etcd. This function is an internal function of the Go language runtime. It is used to create a new stack space for a goroutine.

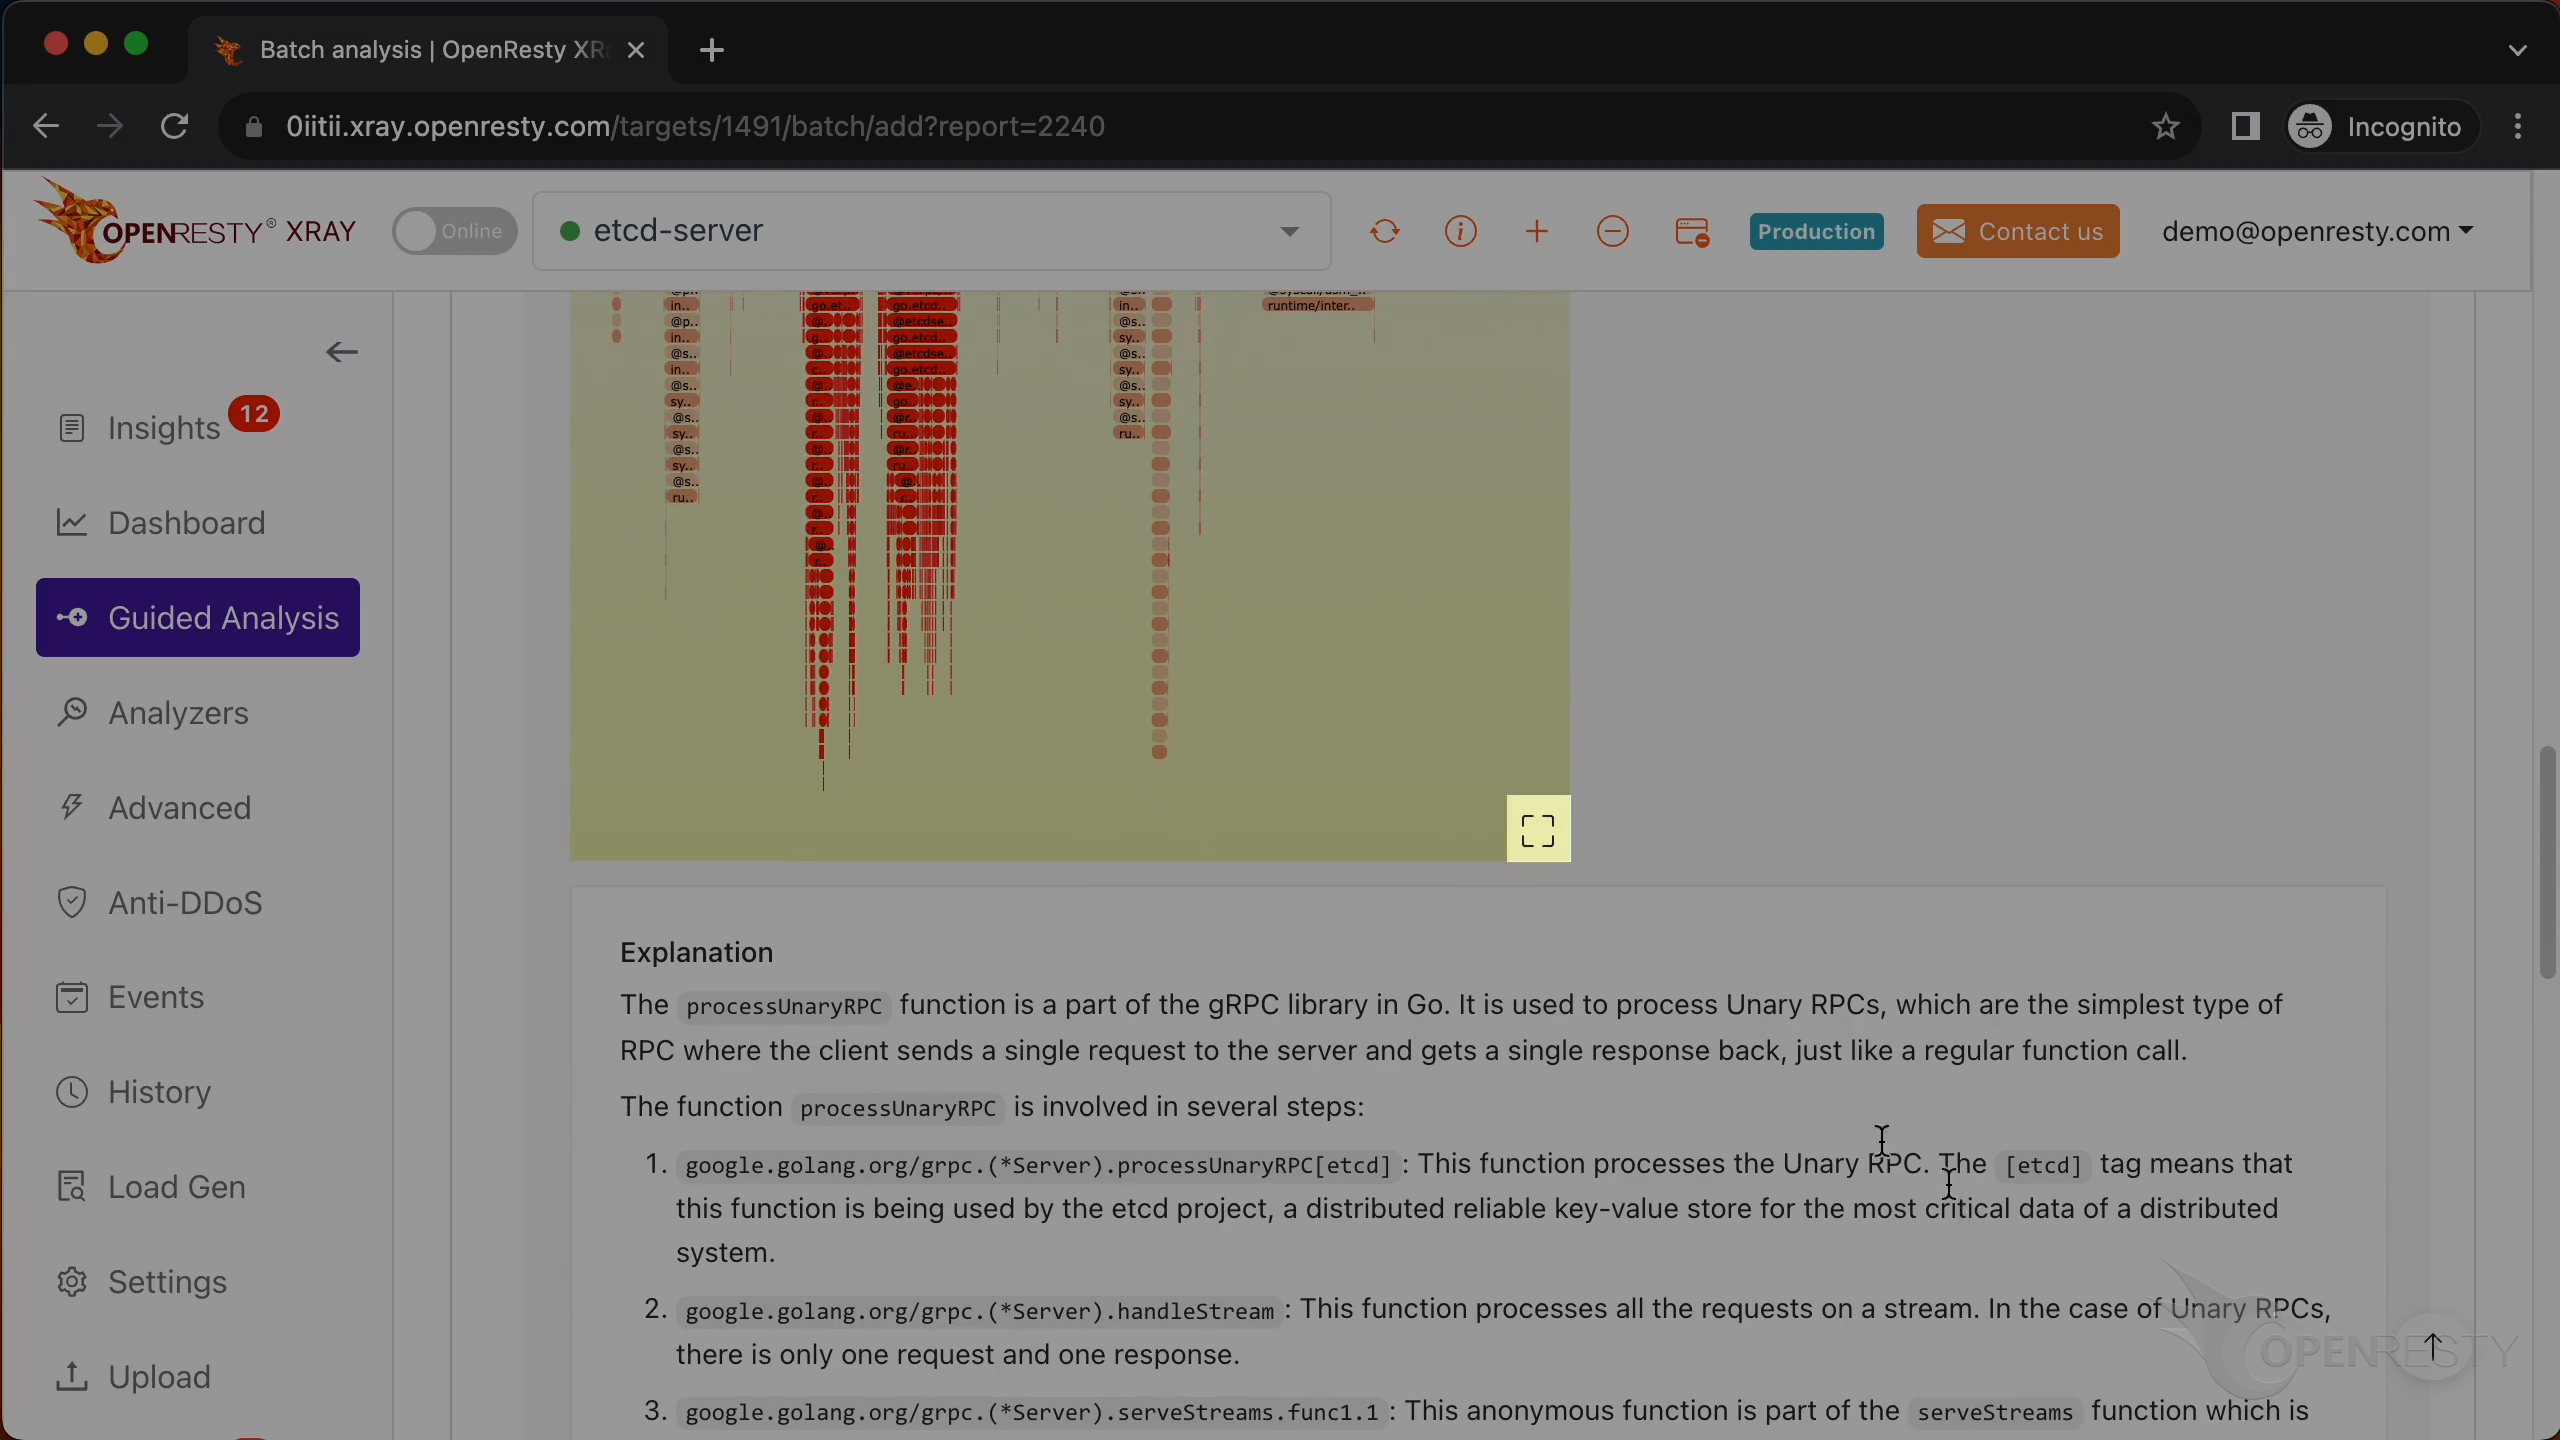
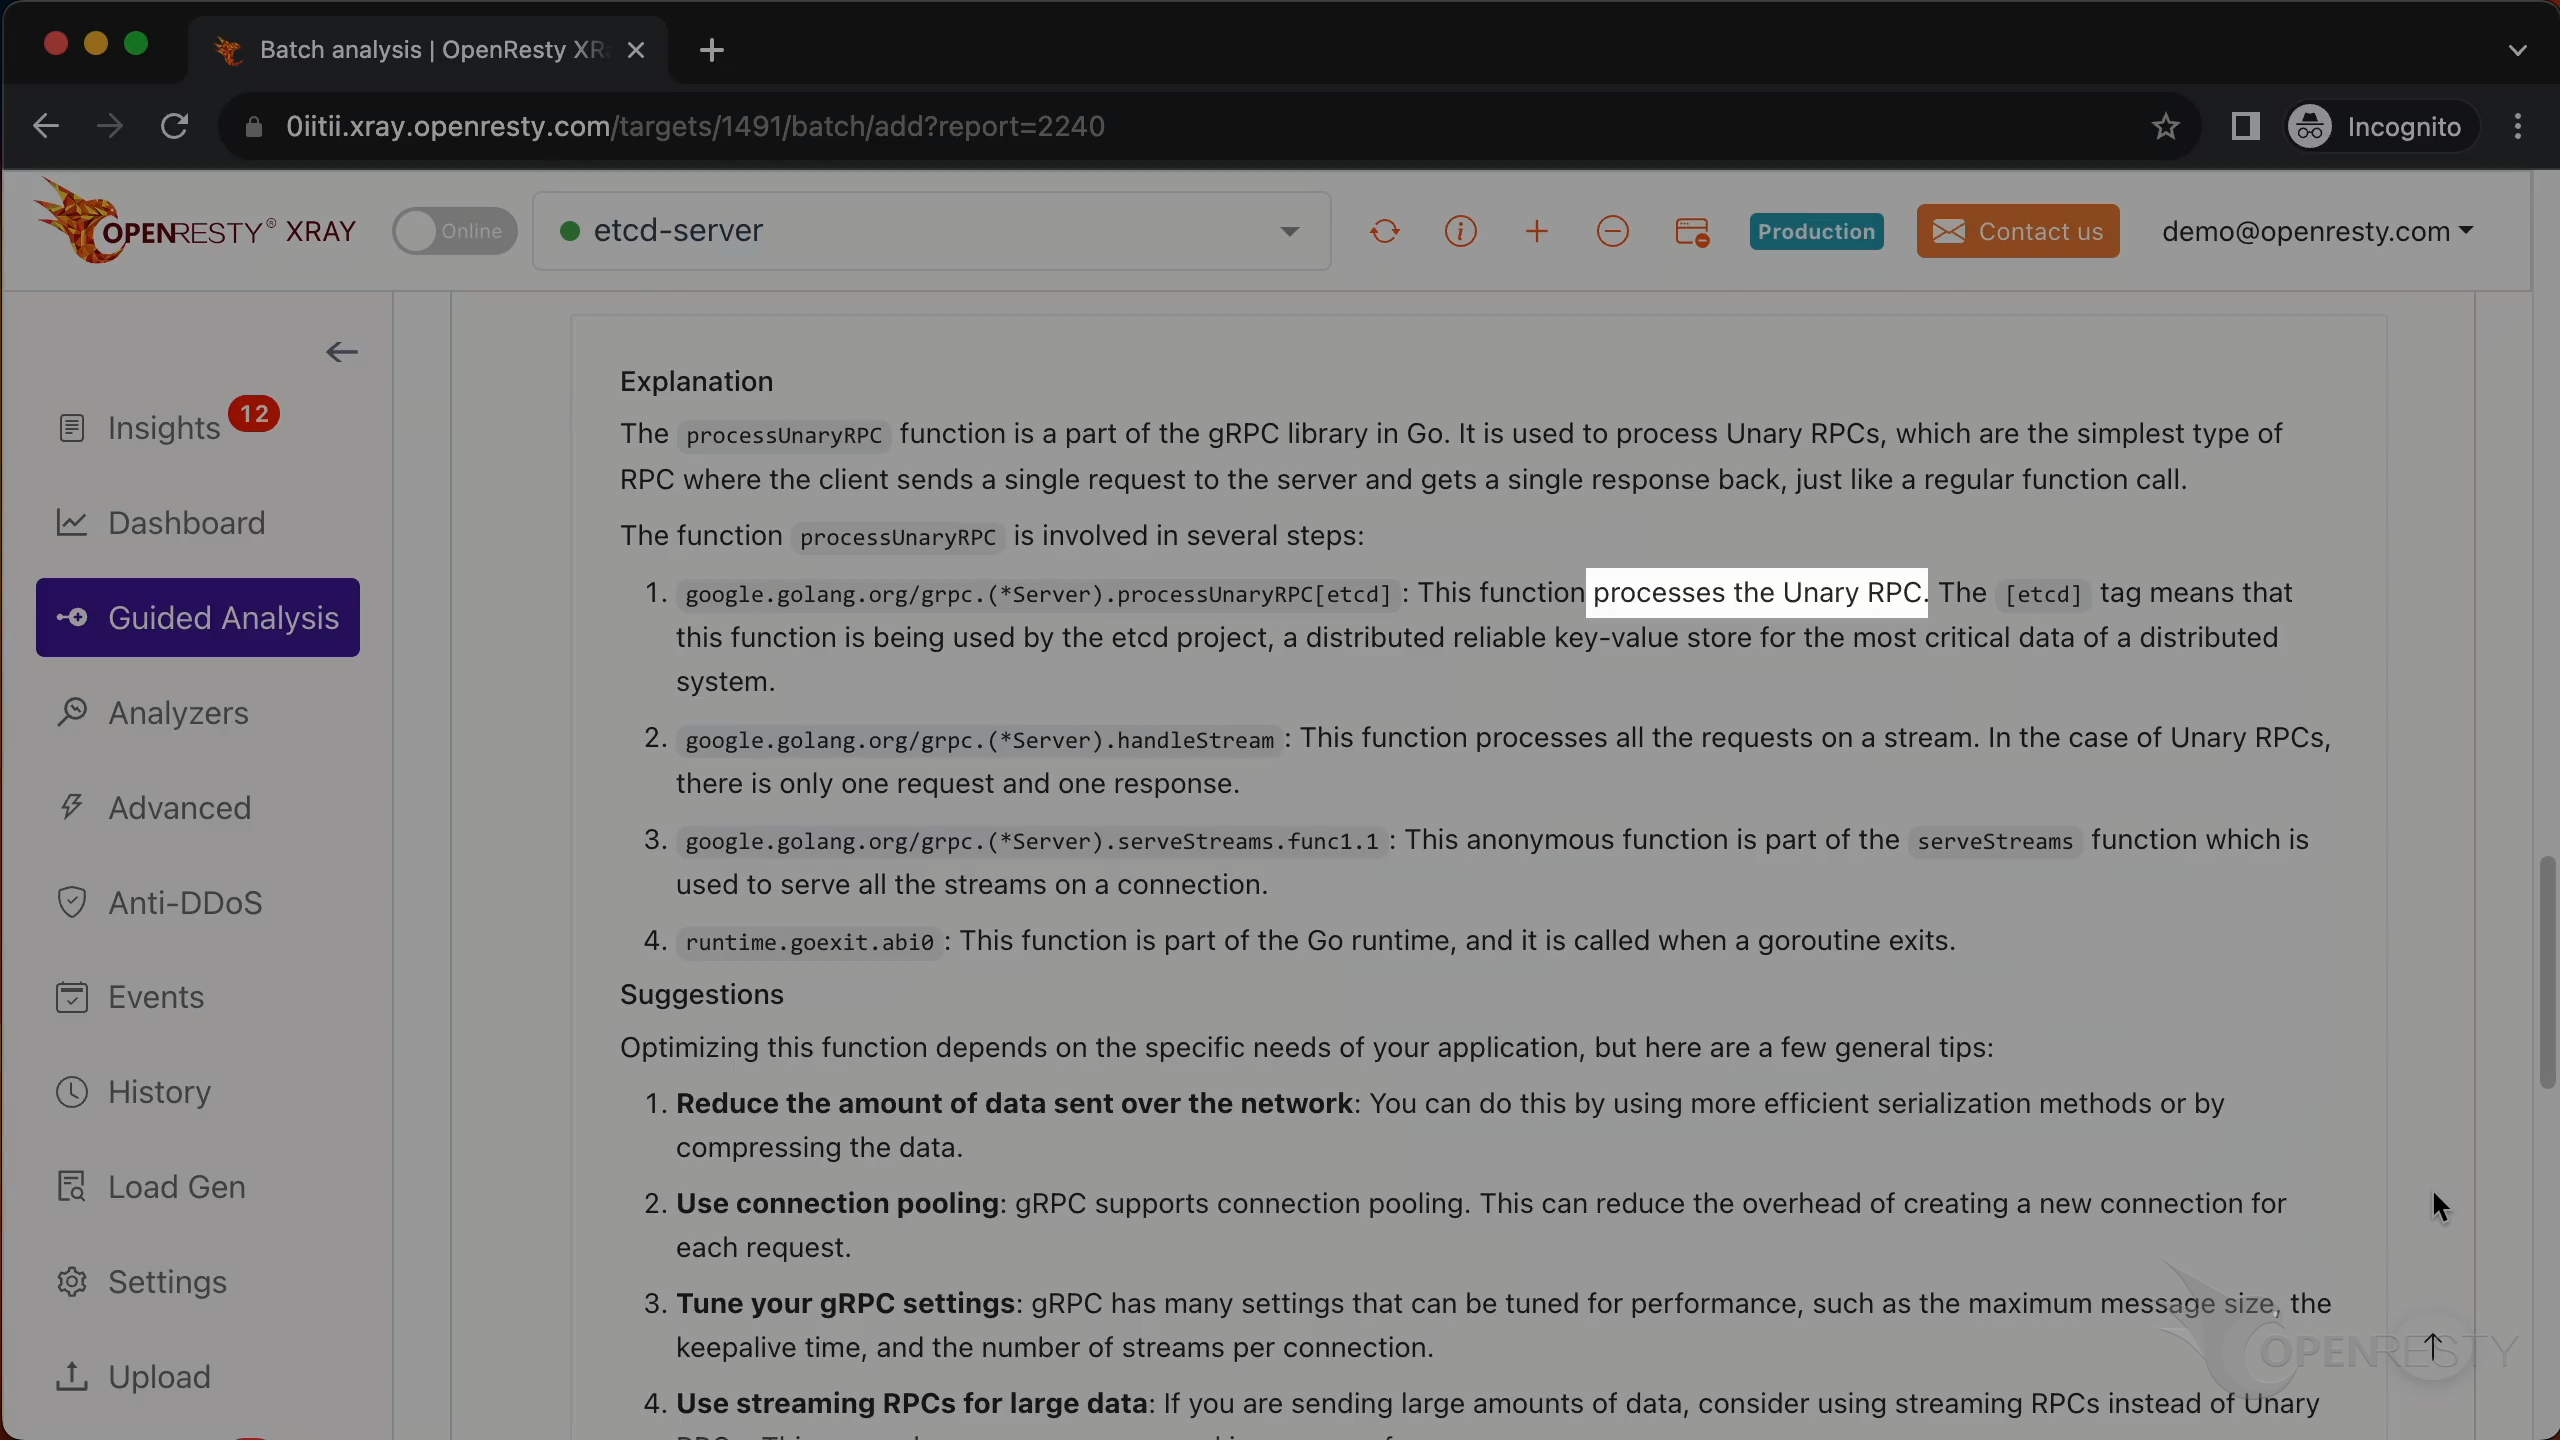
Below are more detailed explanations and suggestions regarding the current issue.
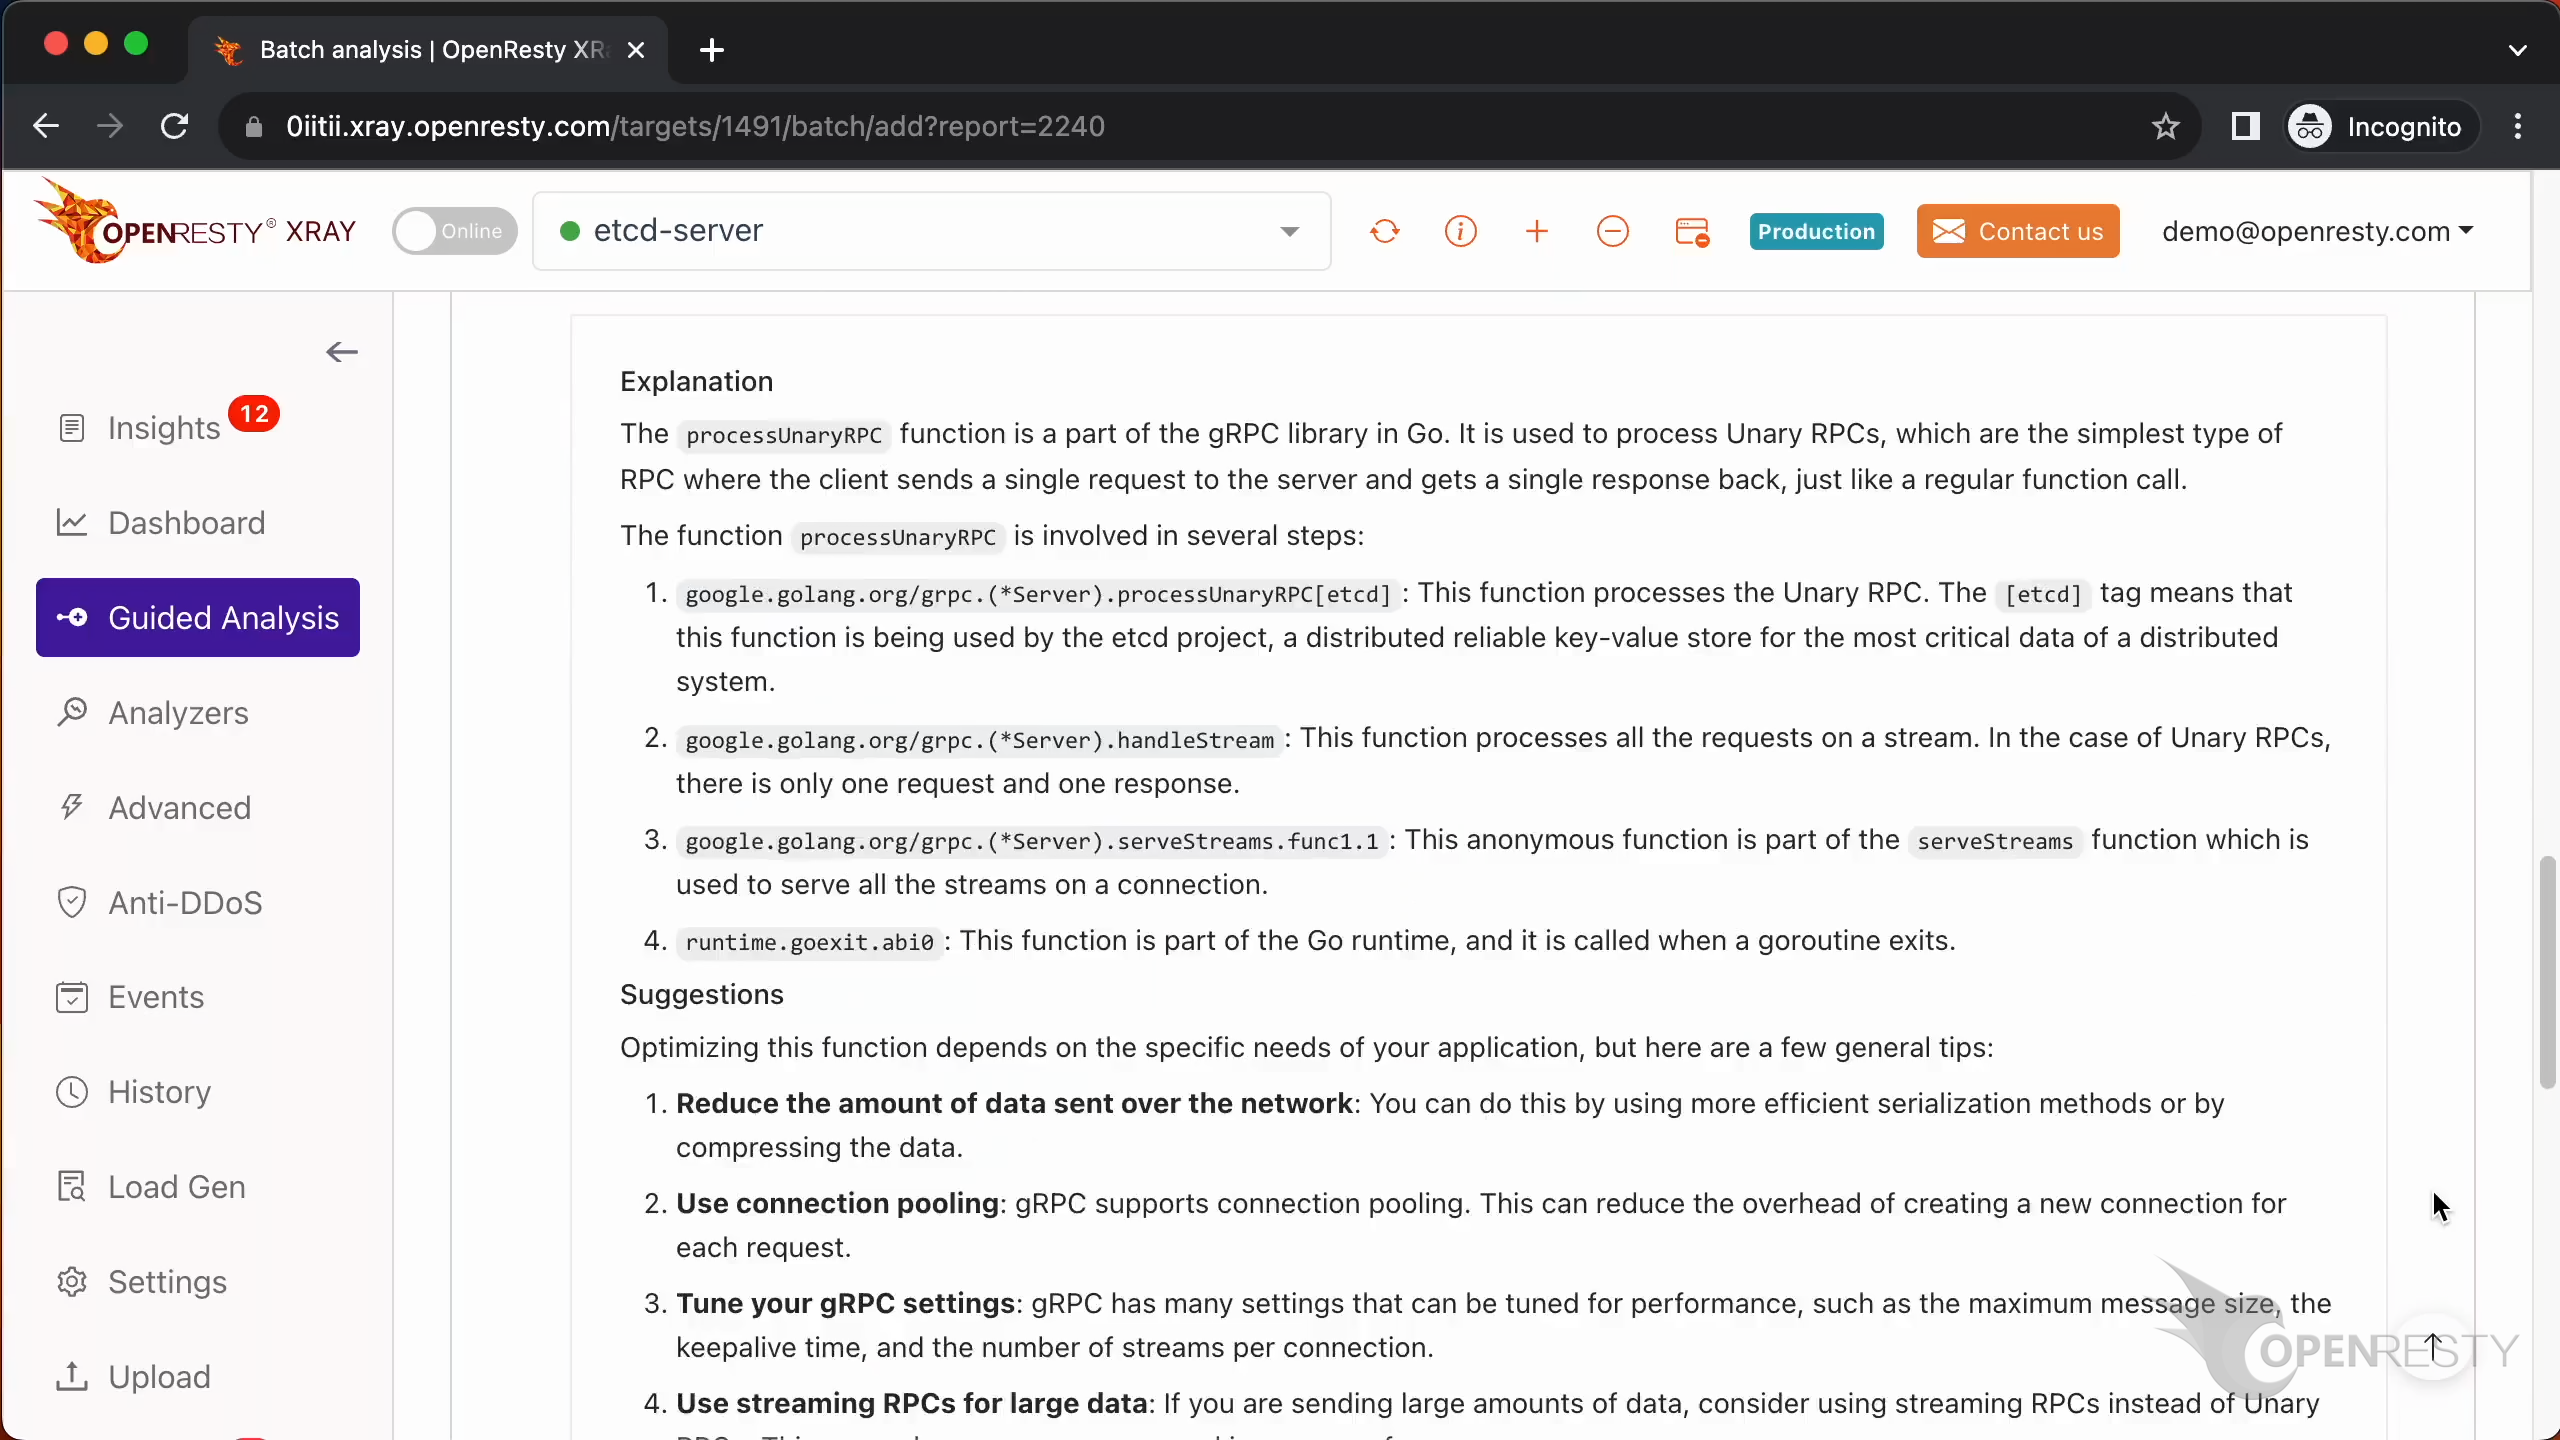
It mentions the function processUnaryRPC.
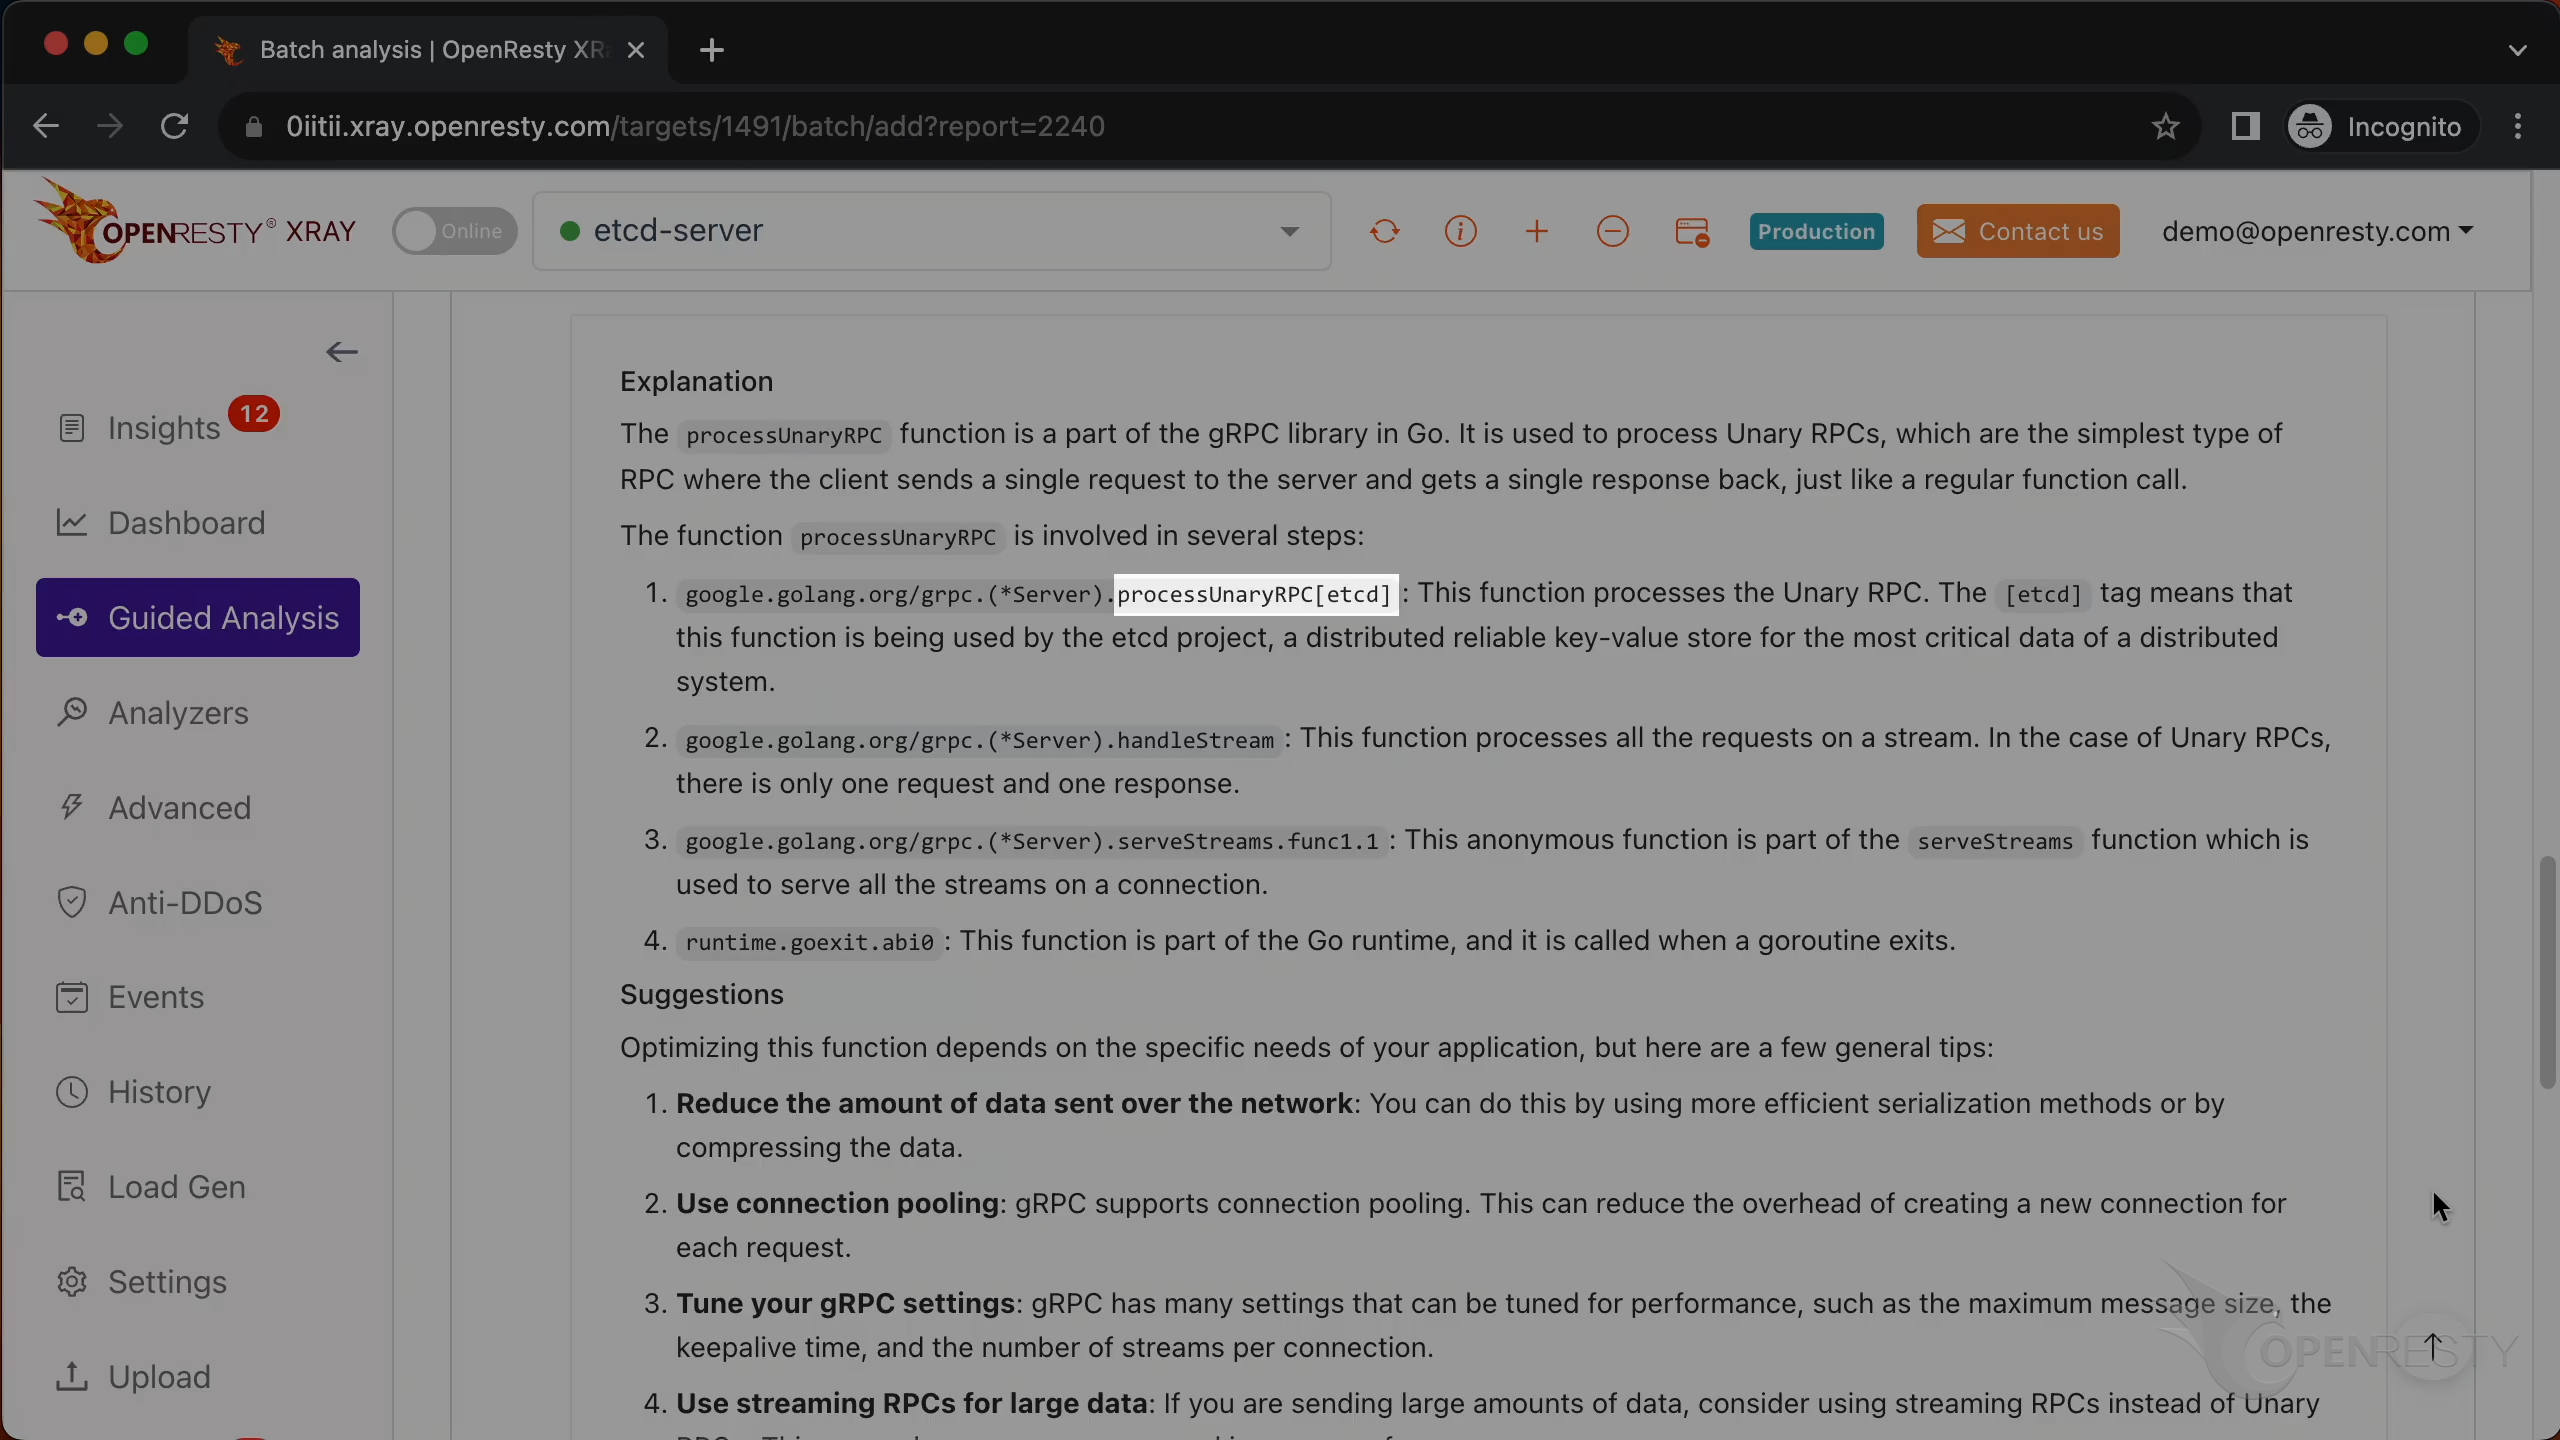
And it processes the Unary RPC.
Let’s go back to the code path. Hover the mouse over the green box for the first function.

We can see the source file of this function. And its full path for the server.go file in the tooltip.
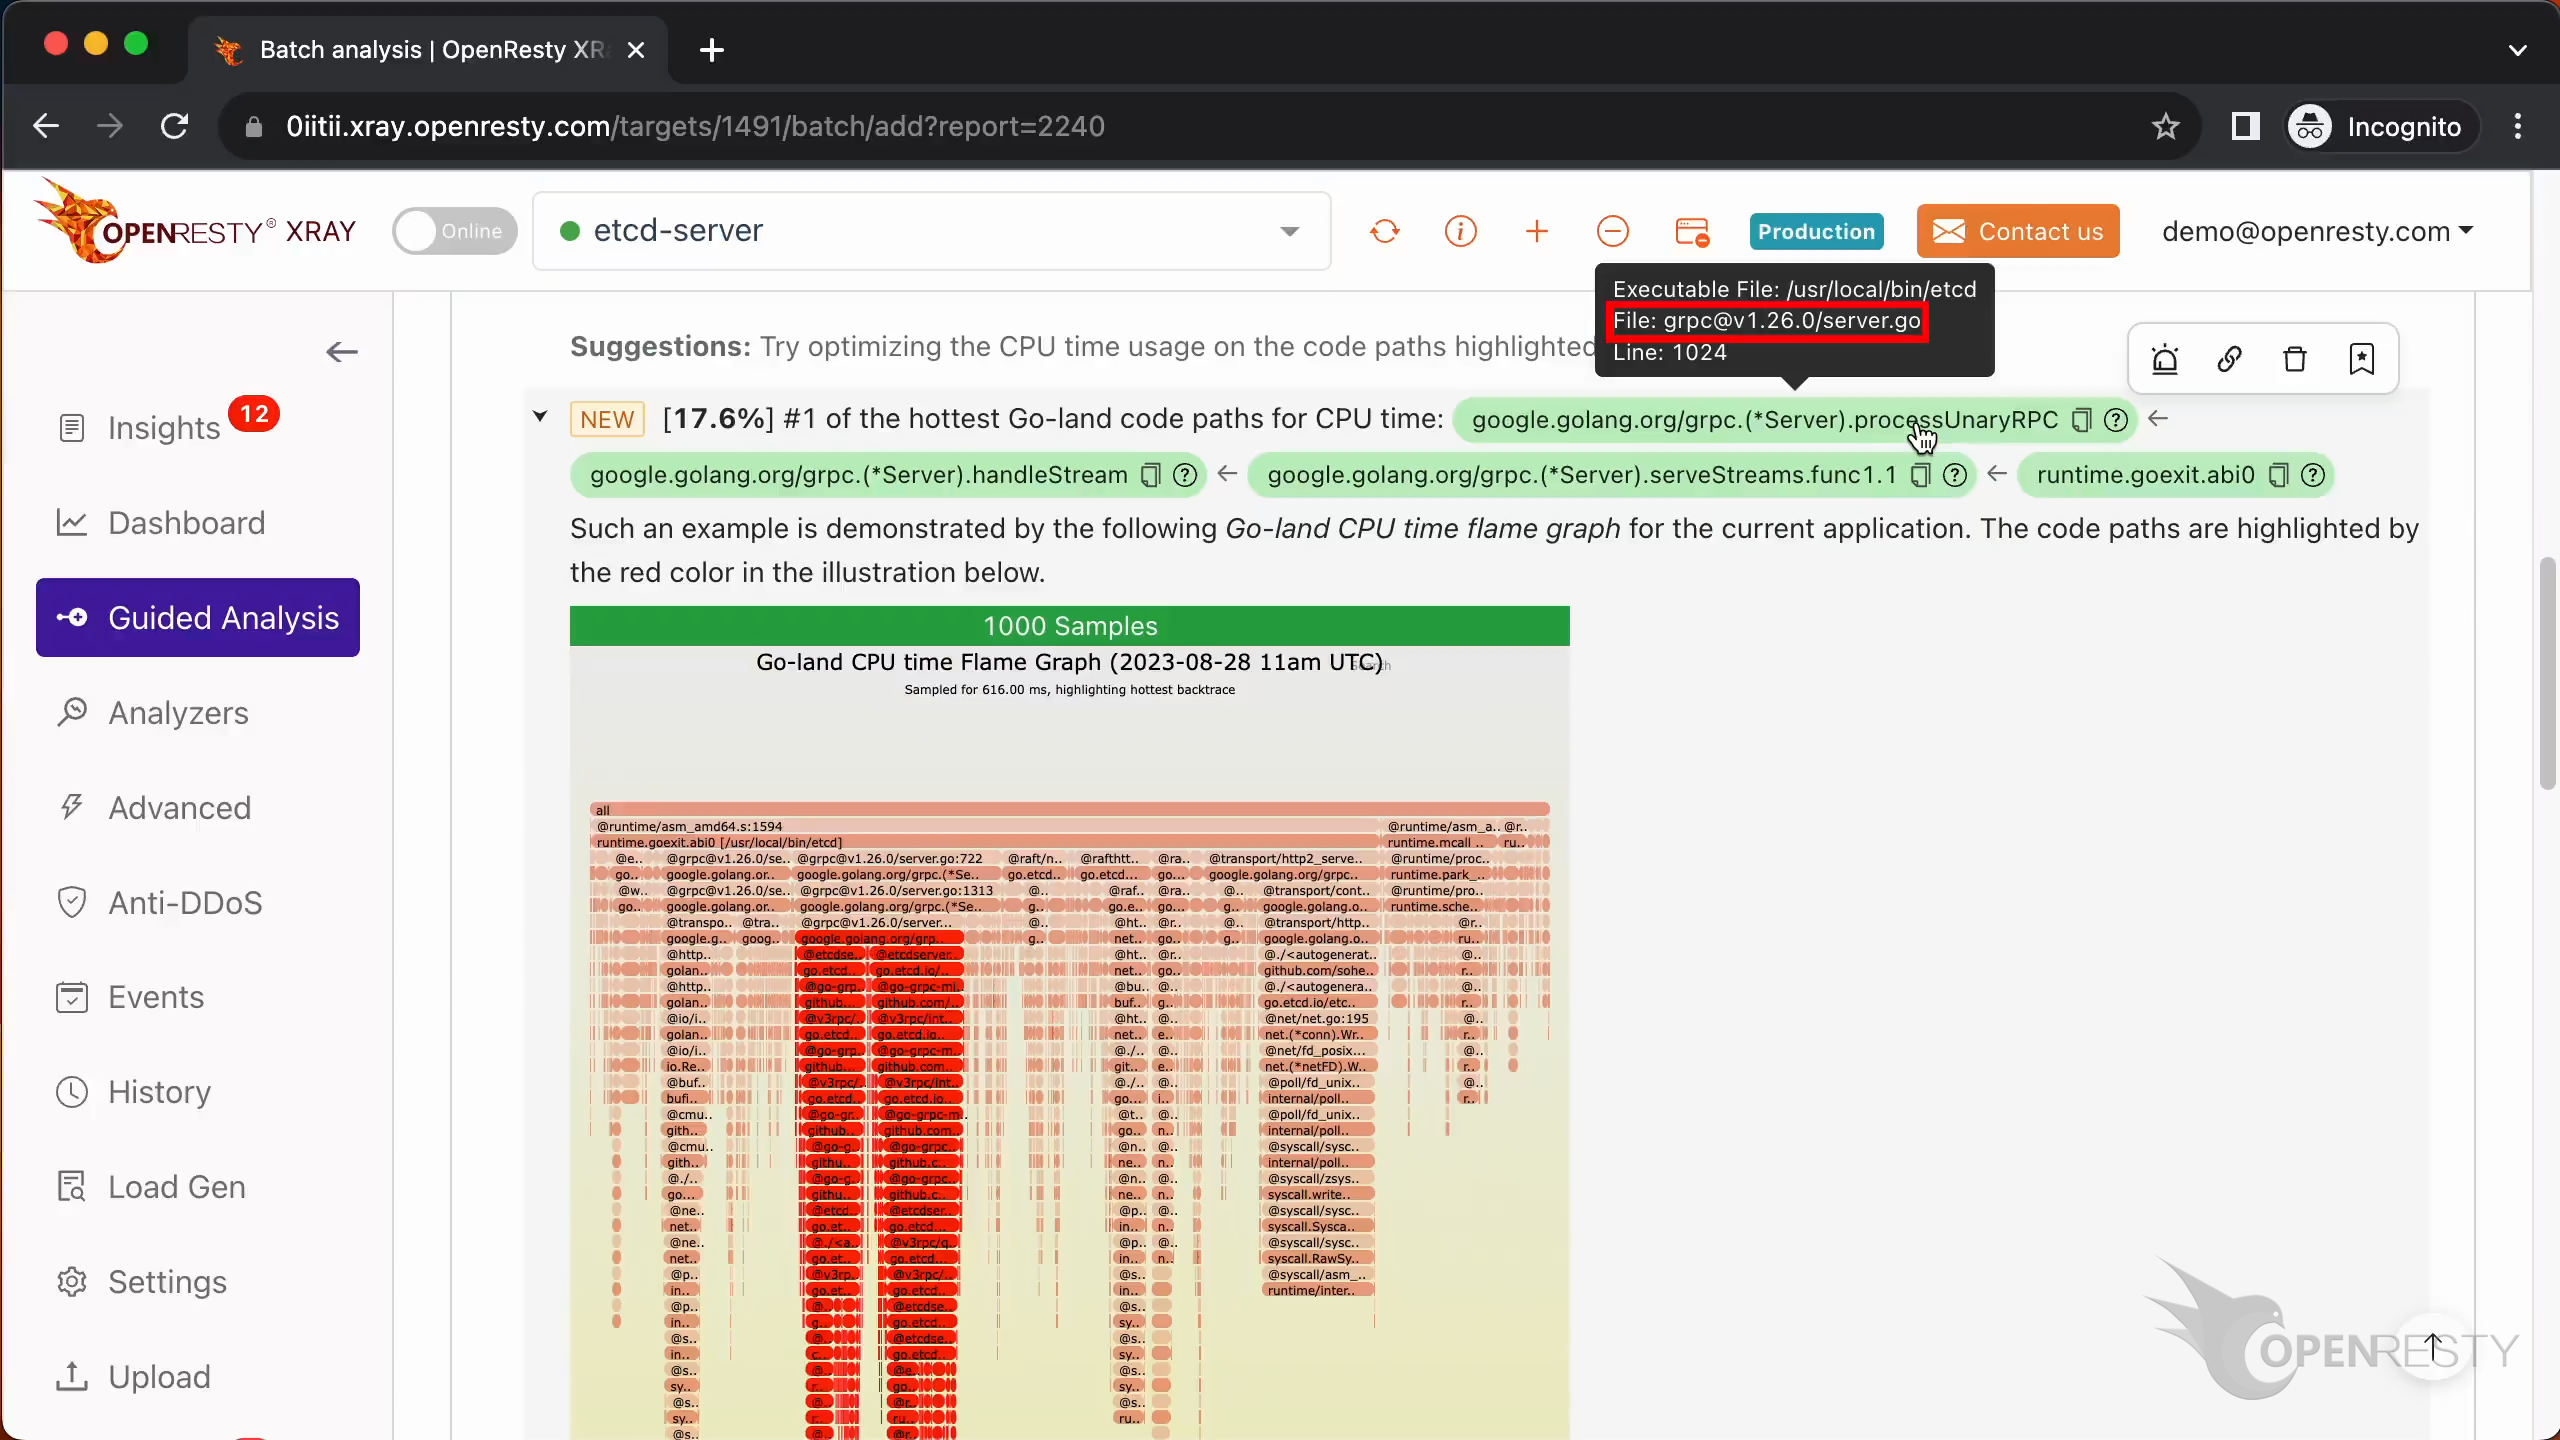
The source line number is 1024.

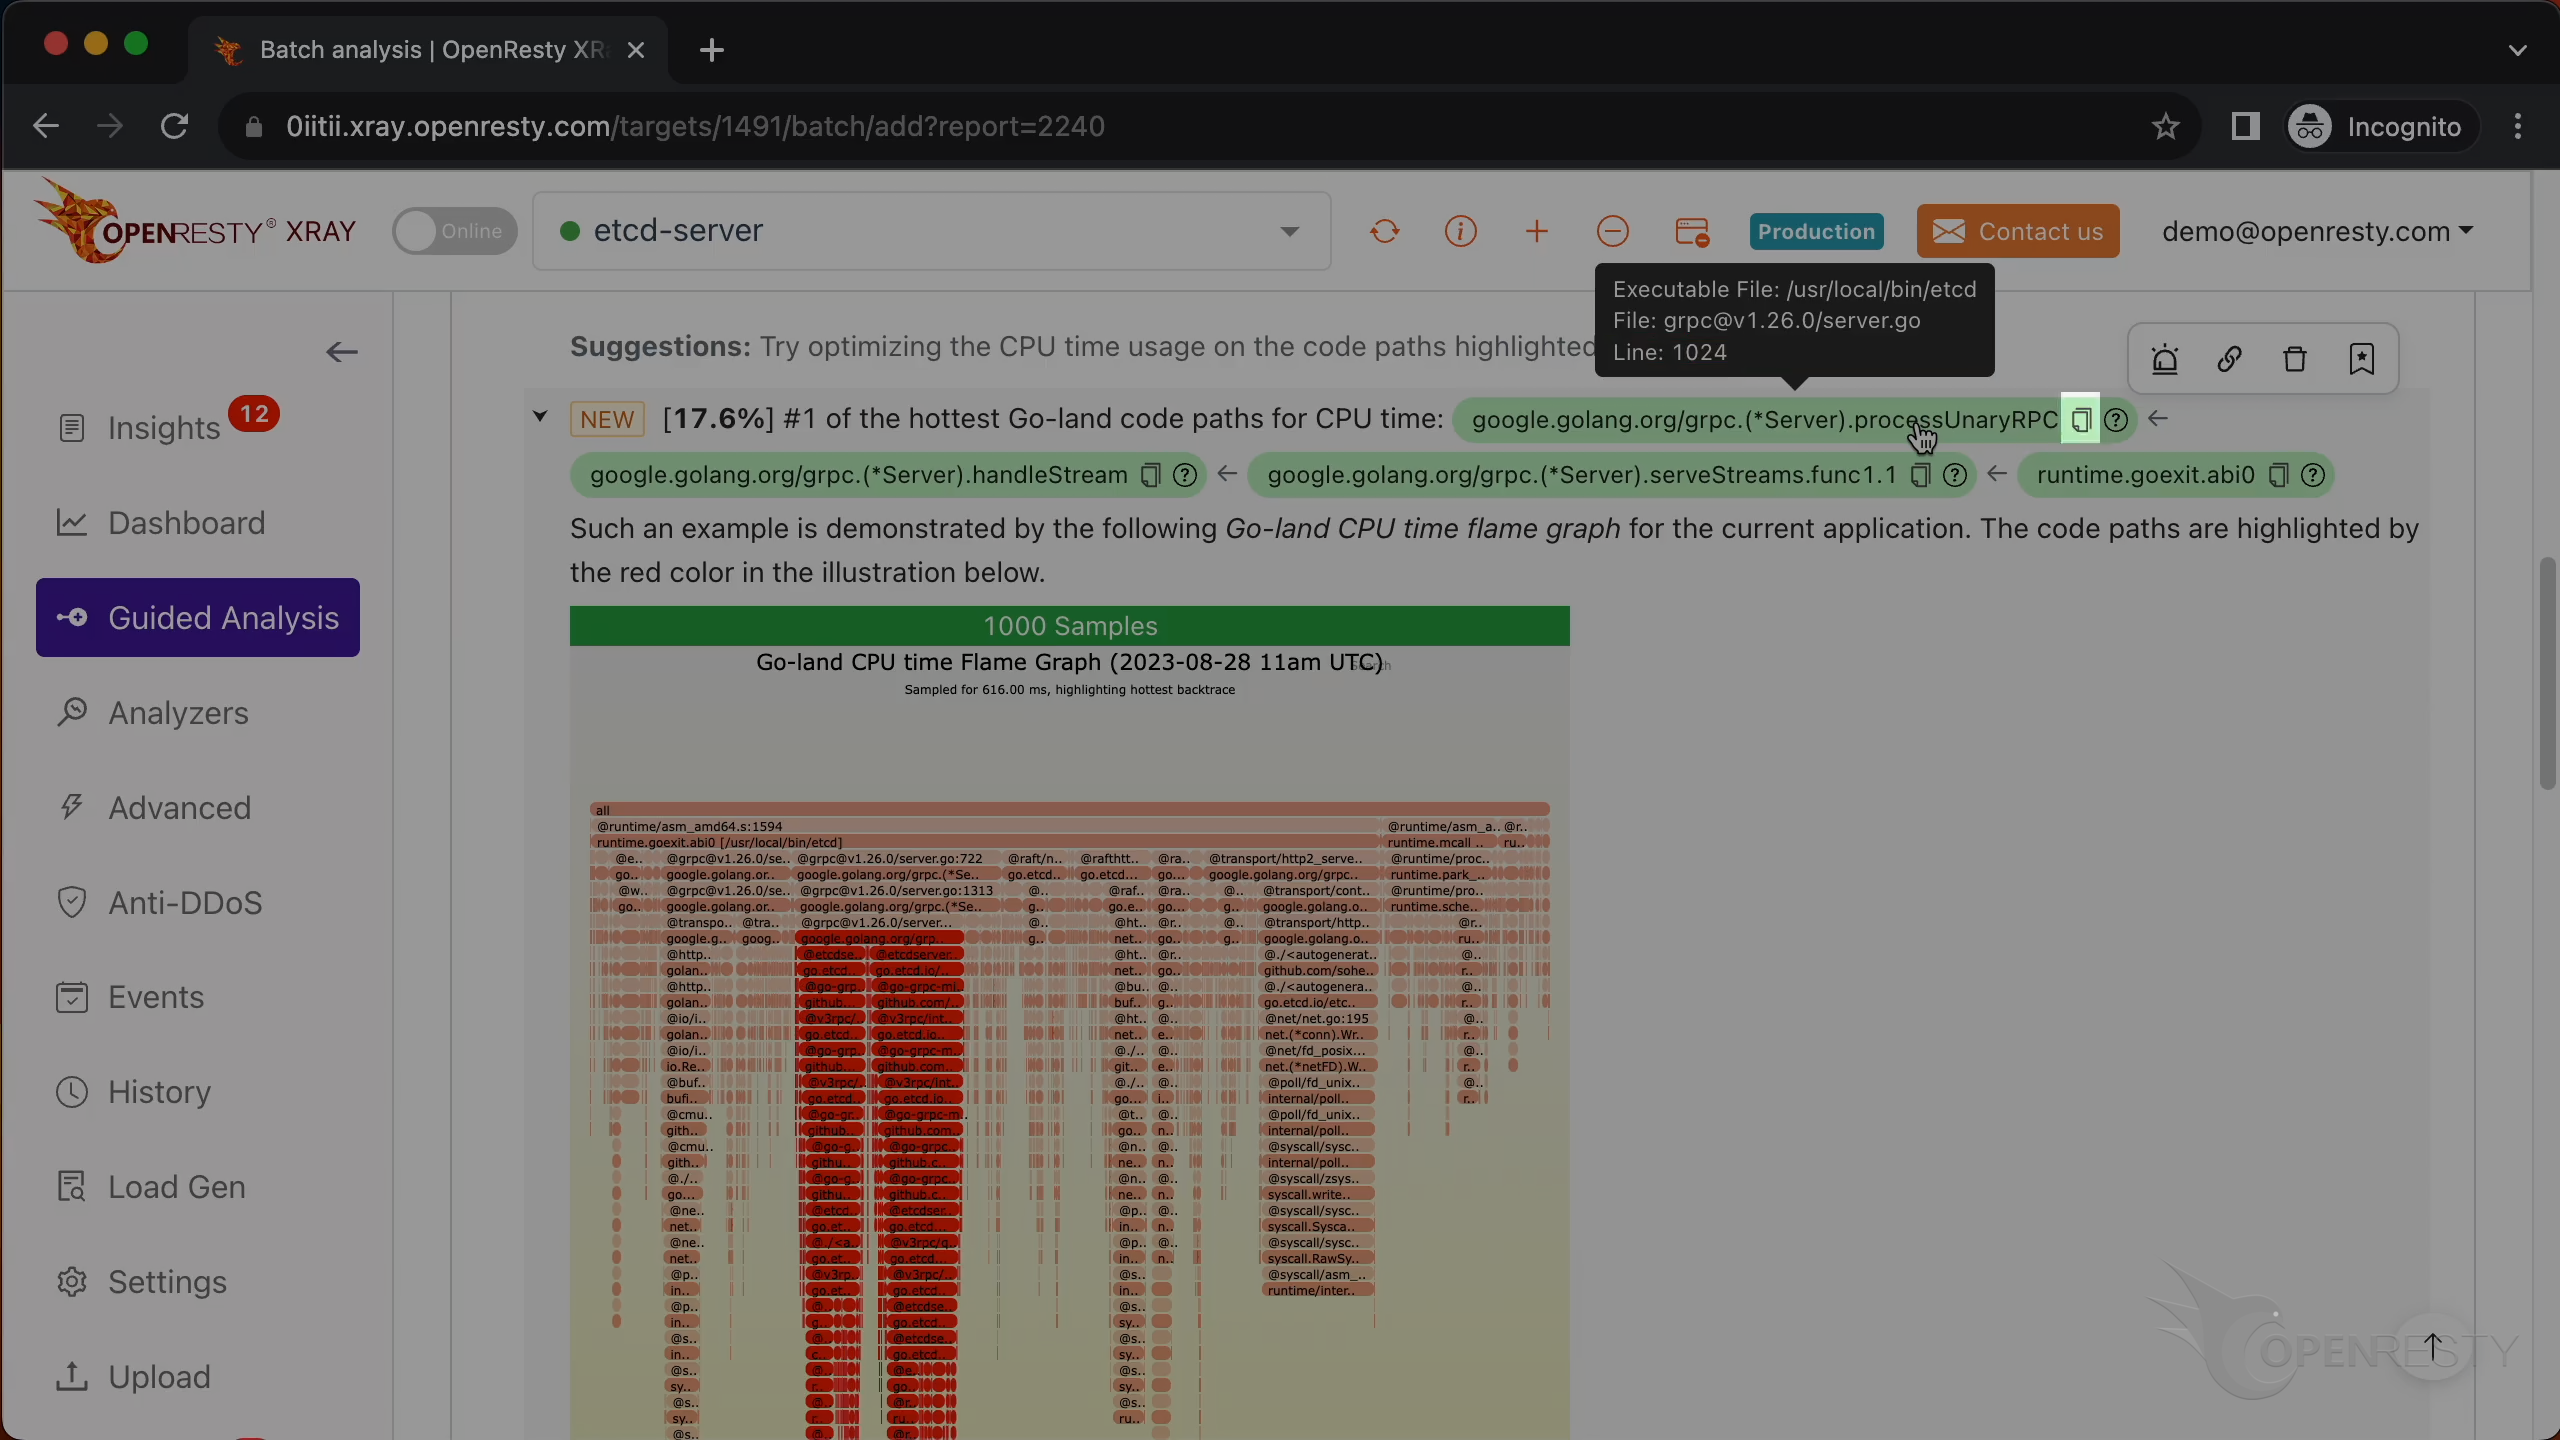
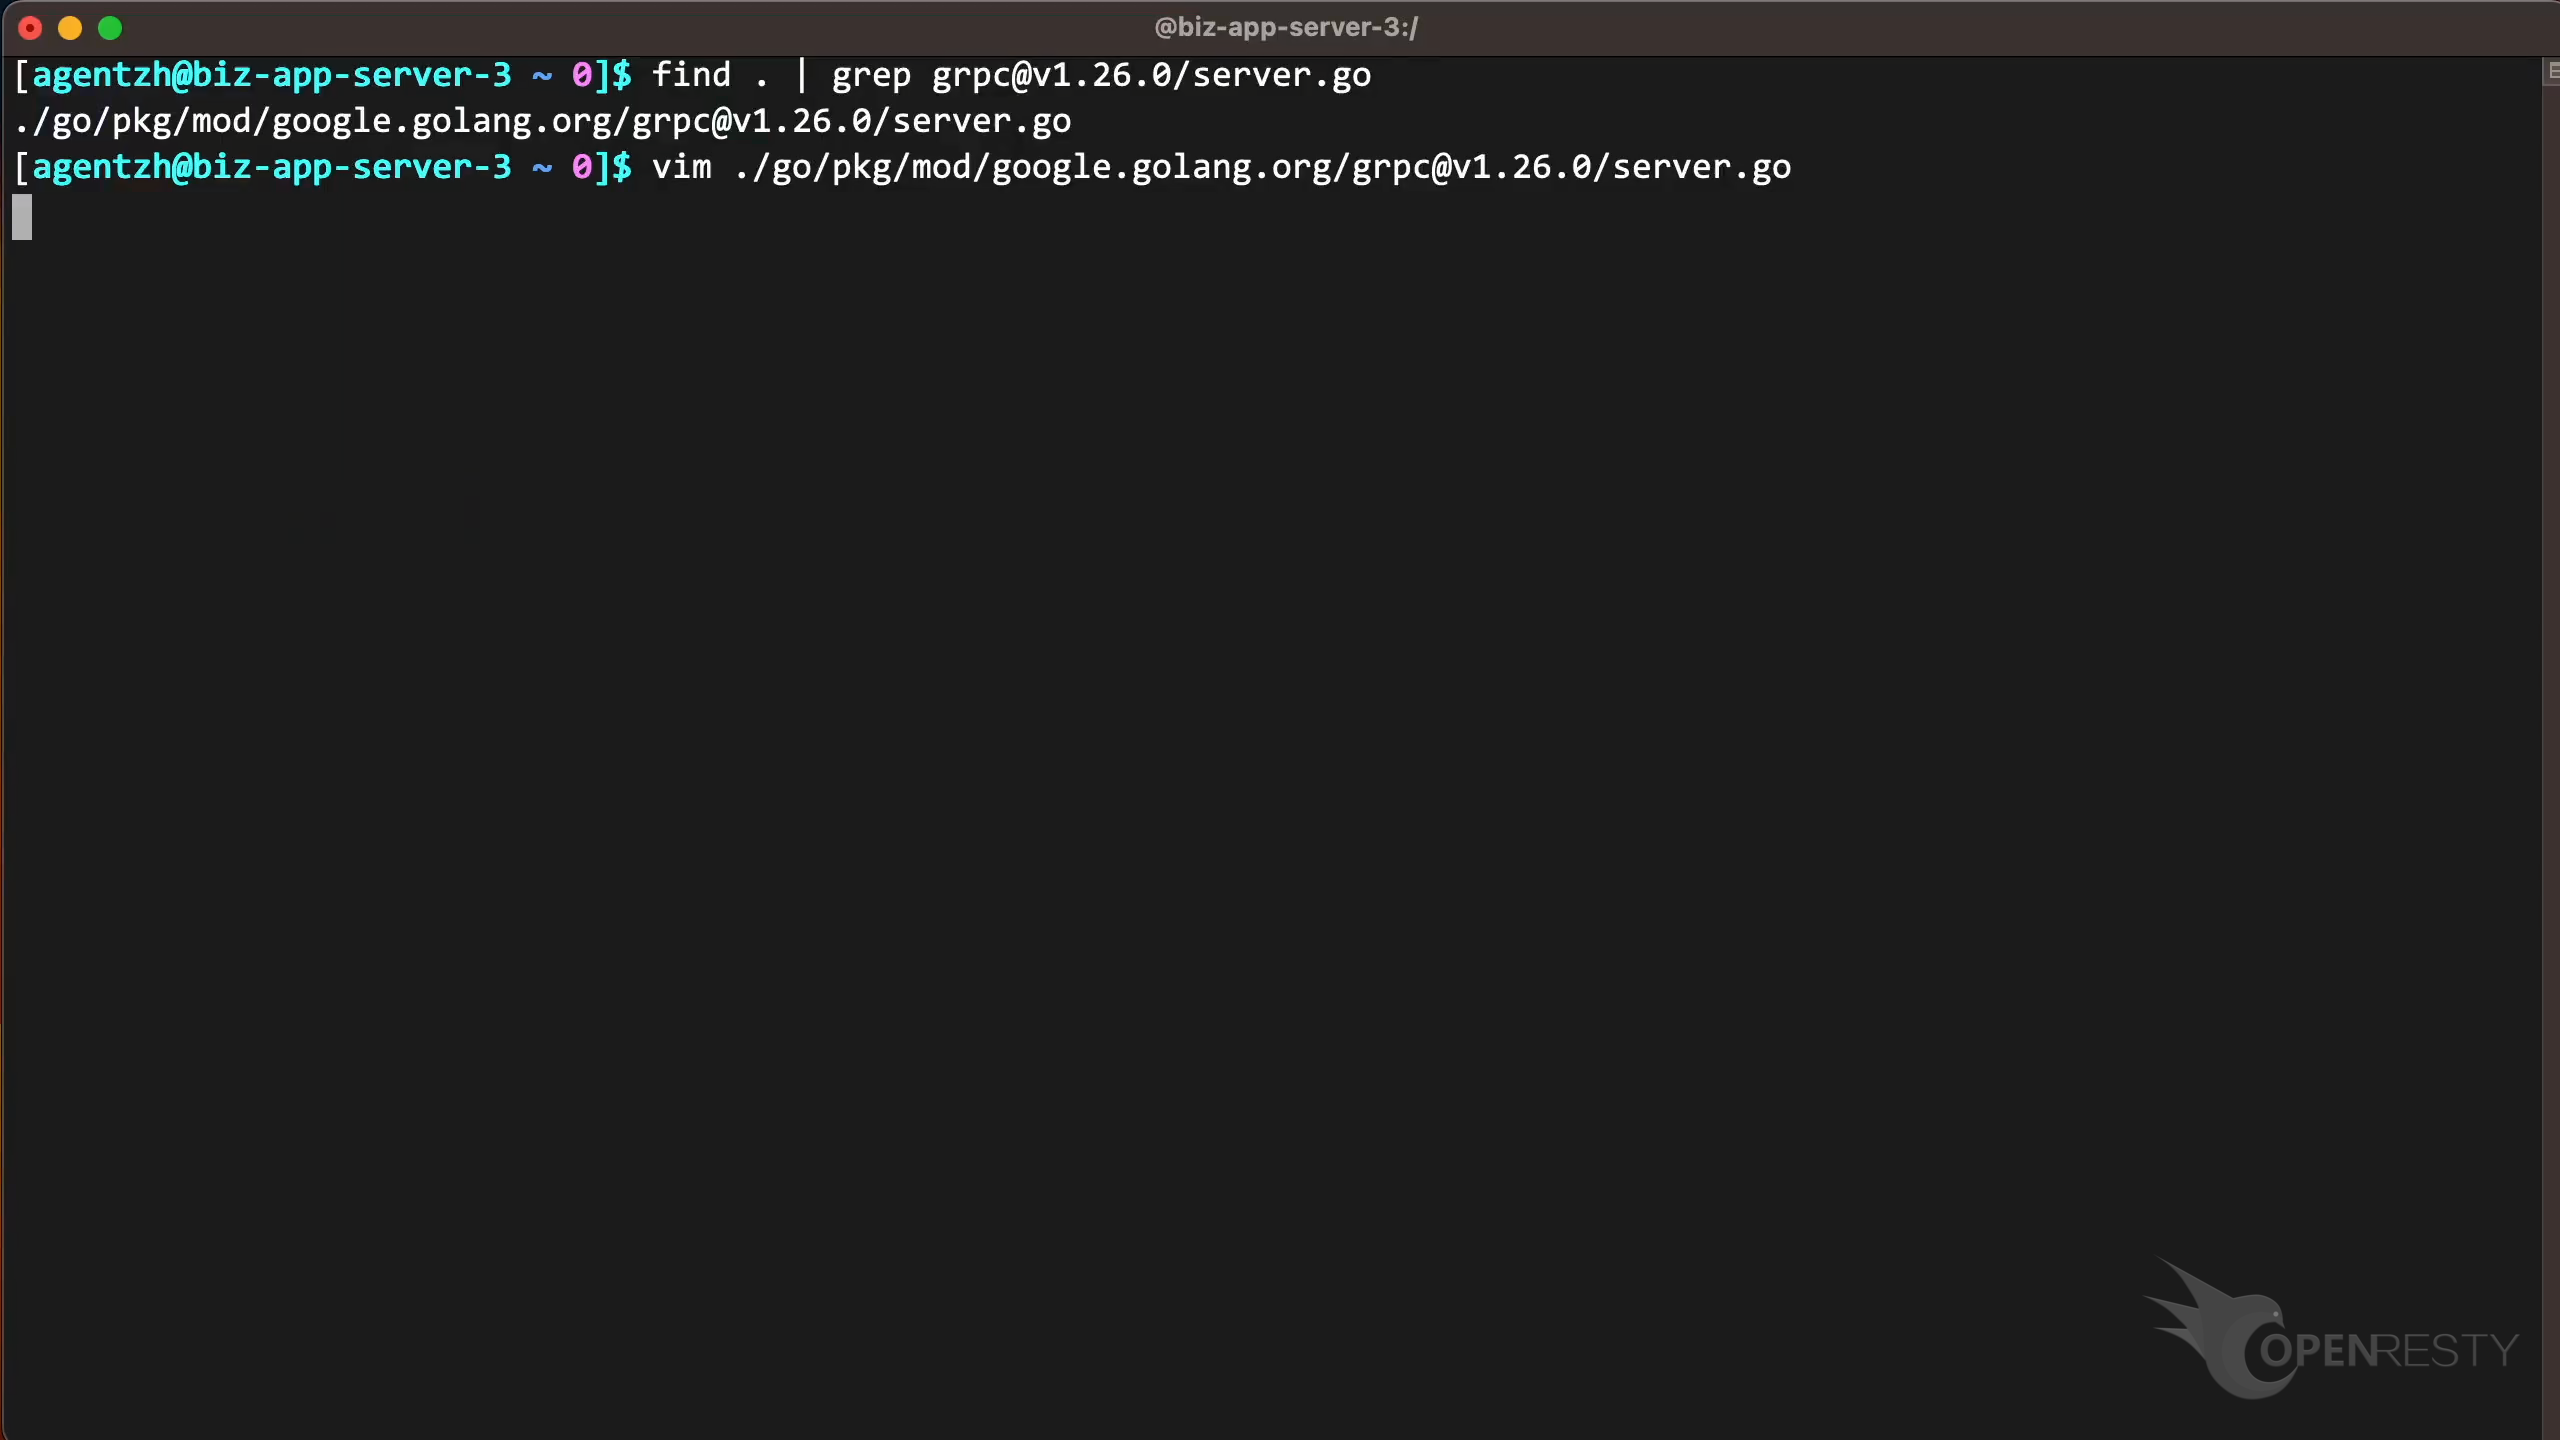
Click the icon to copy the full Go source file path for this function.
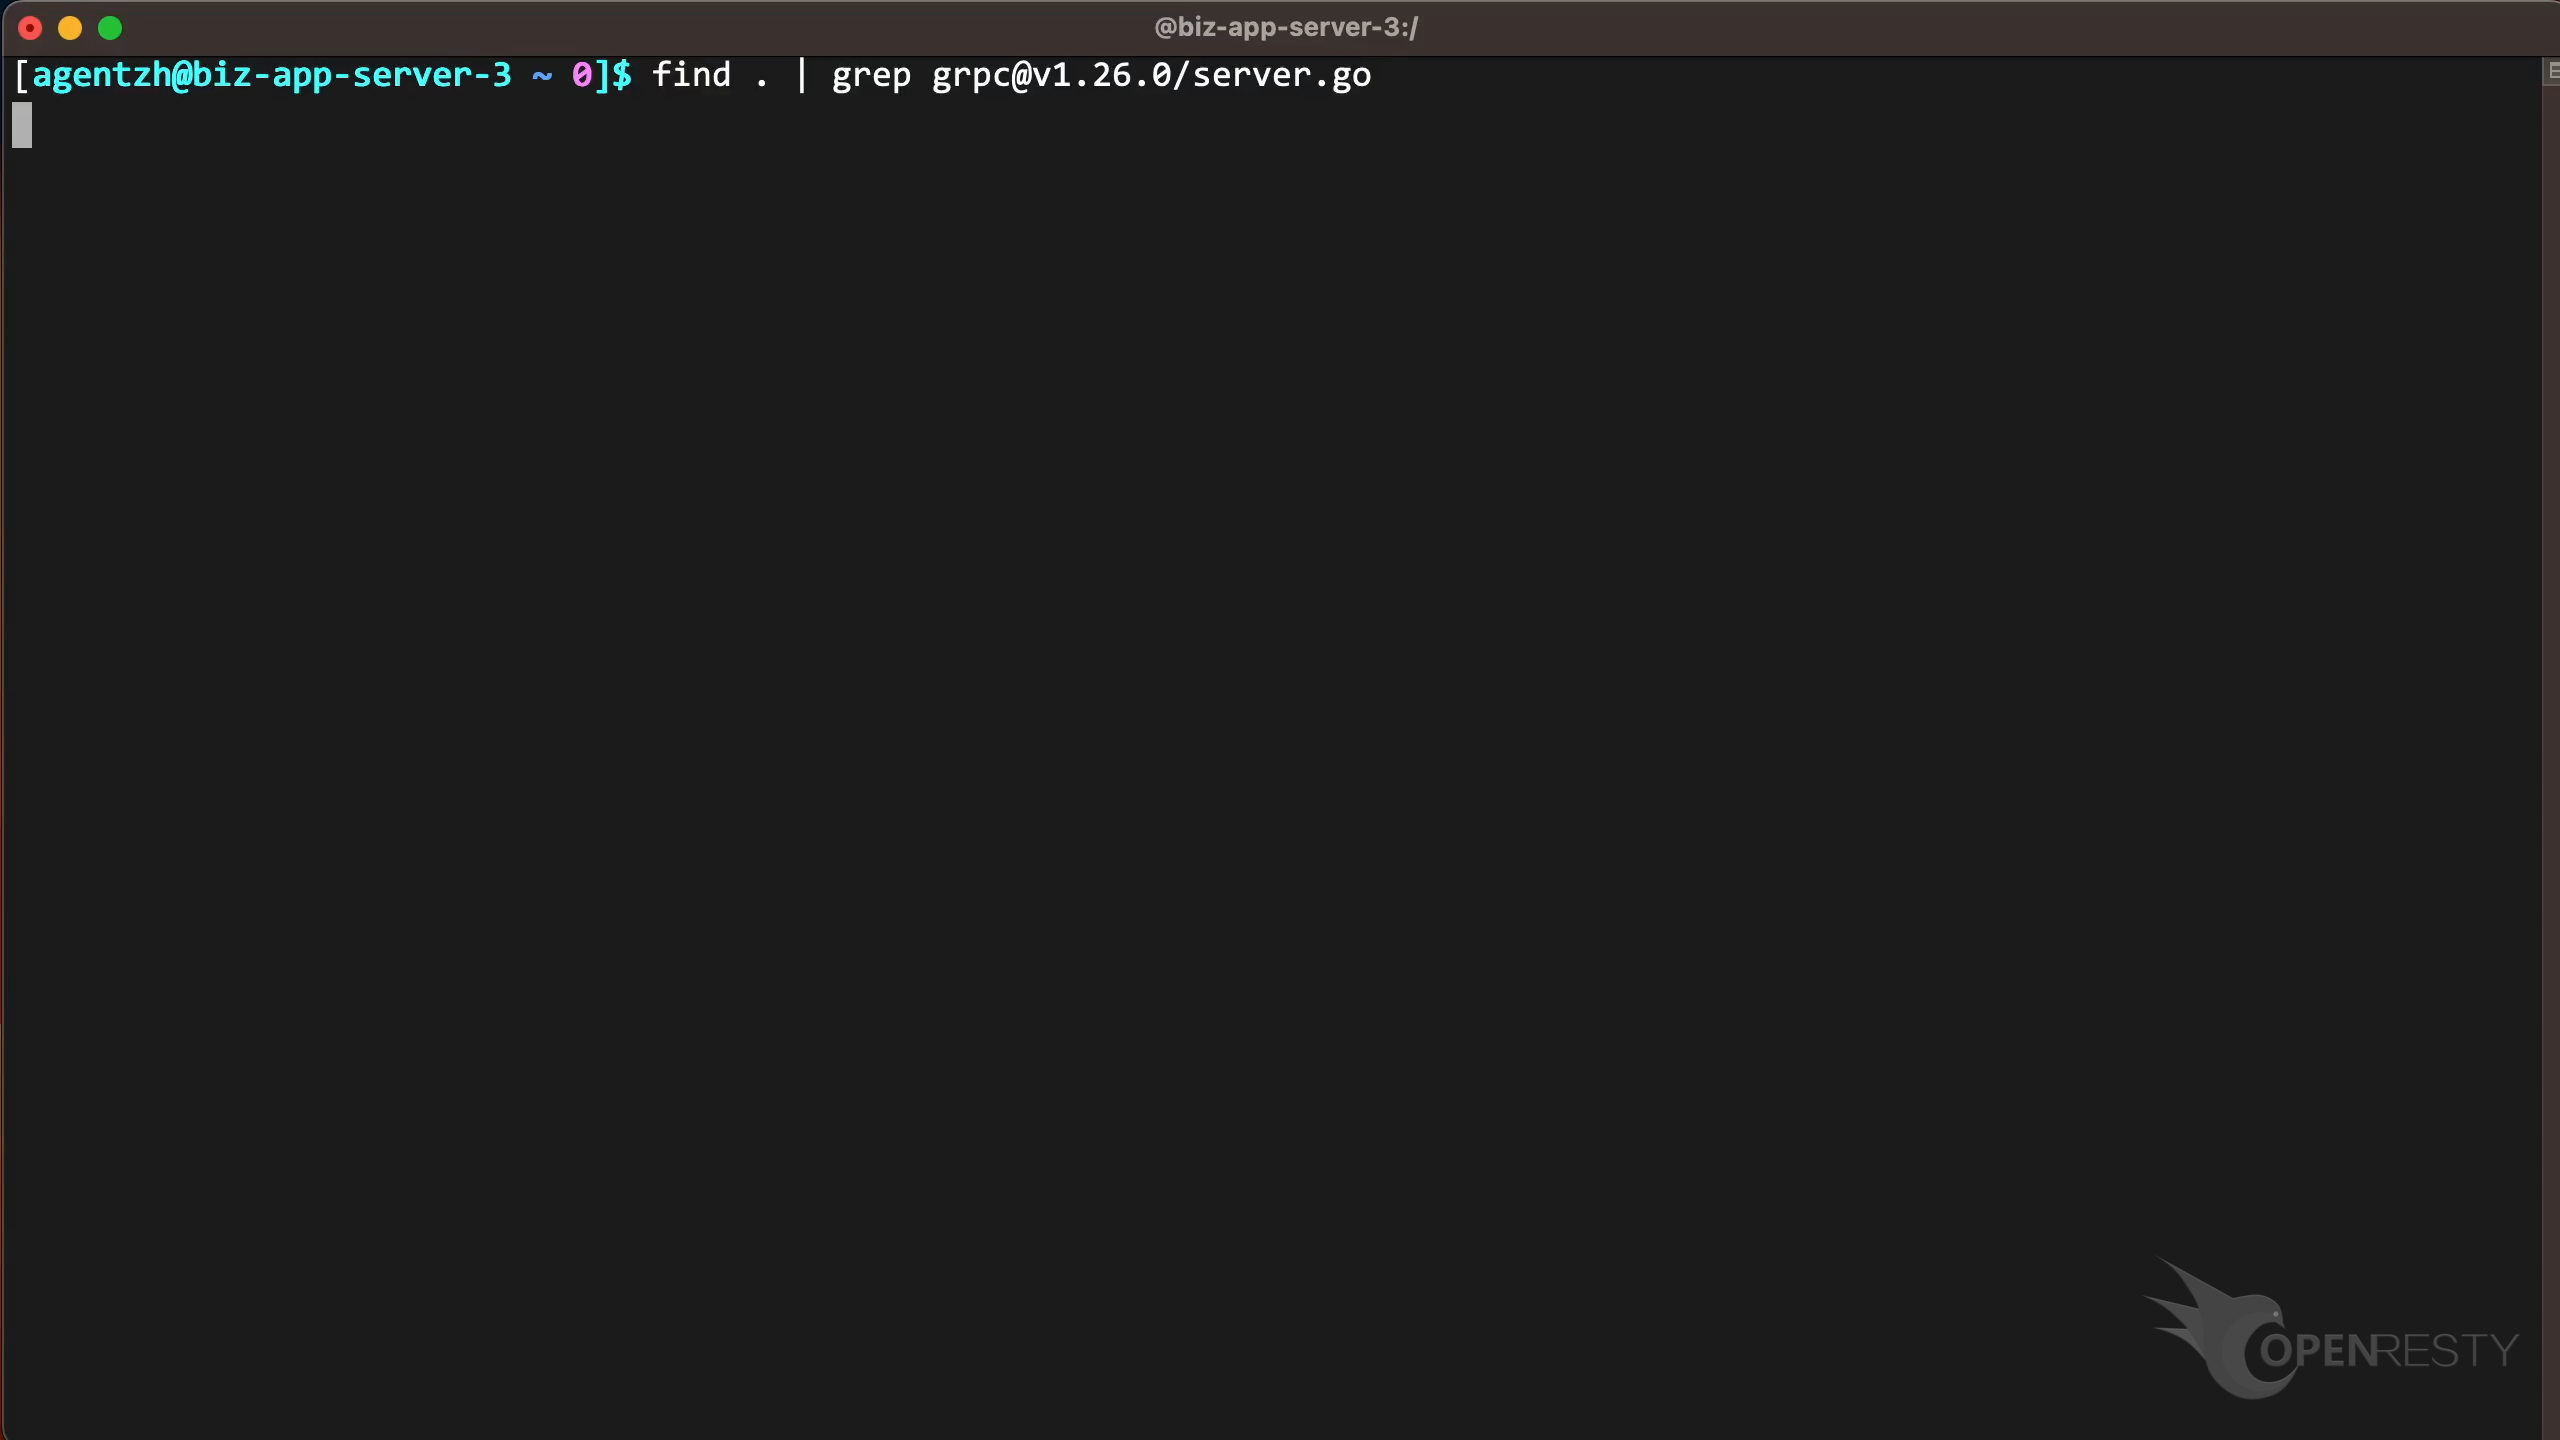
Use the find command to find the source file.
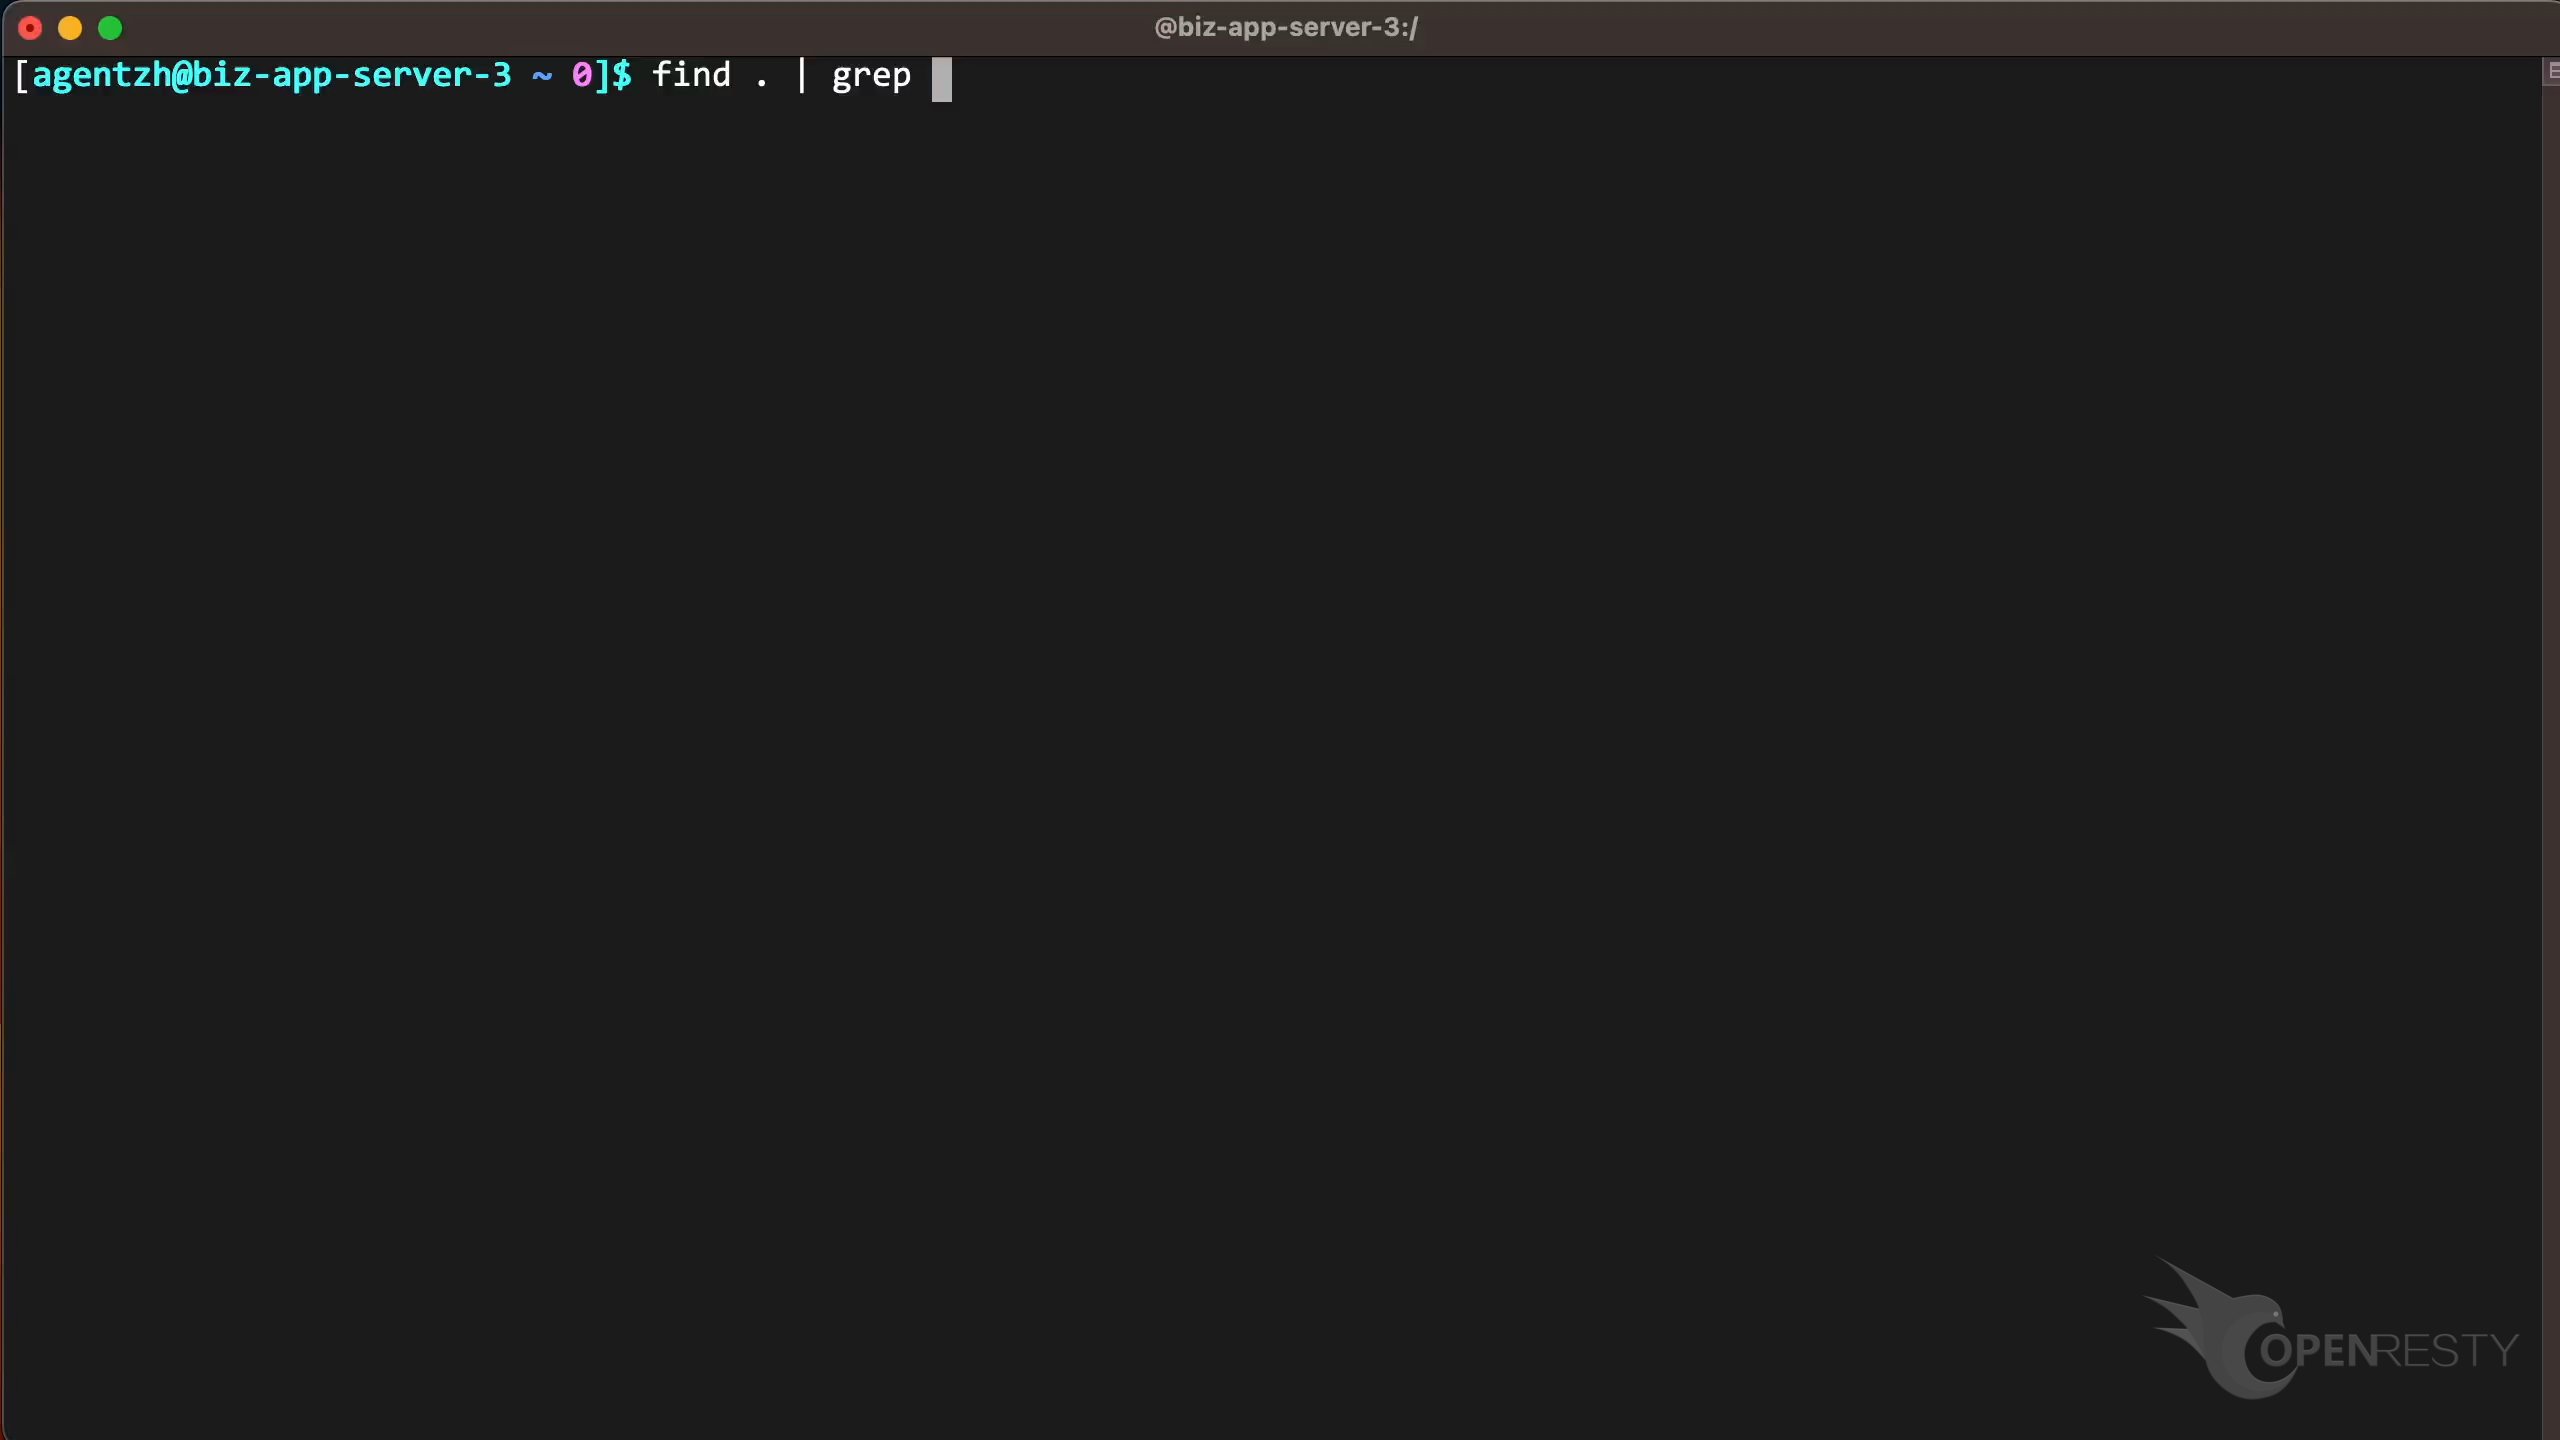
Paste the file path we just copied.
Copy the full file path. Use the vim editor to open the source file. And look at the golang code in this file. You can use any editors you like.
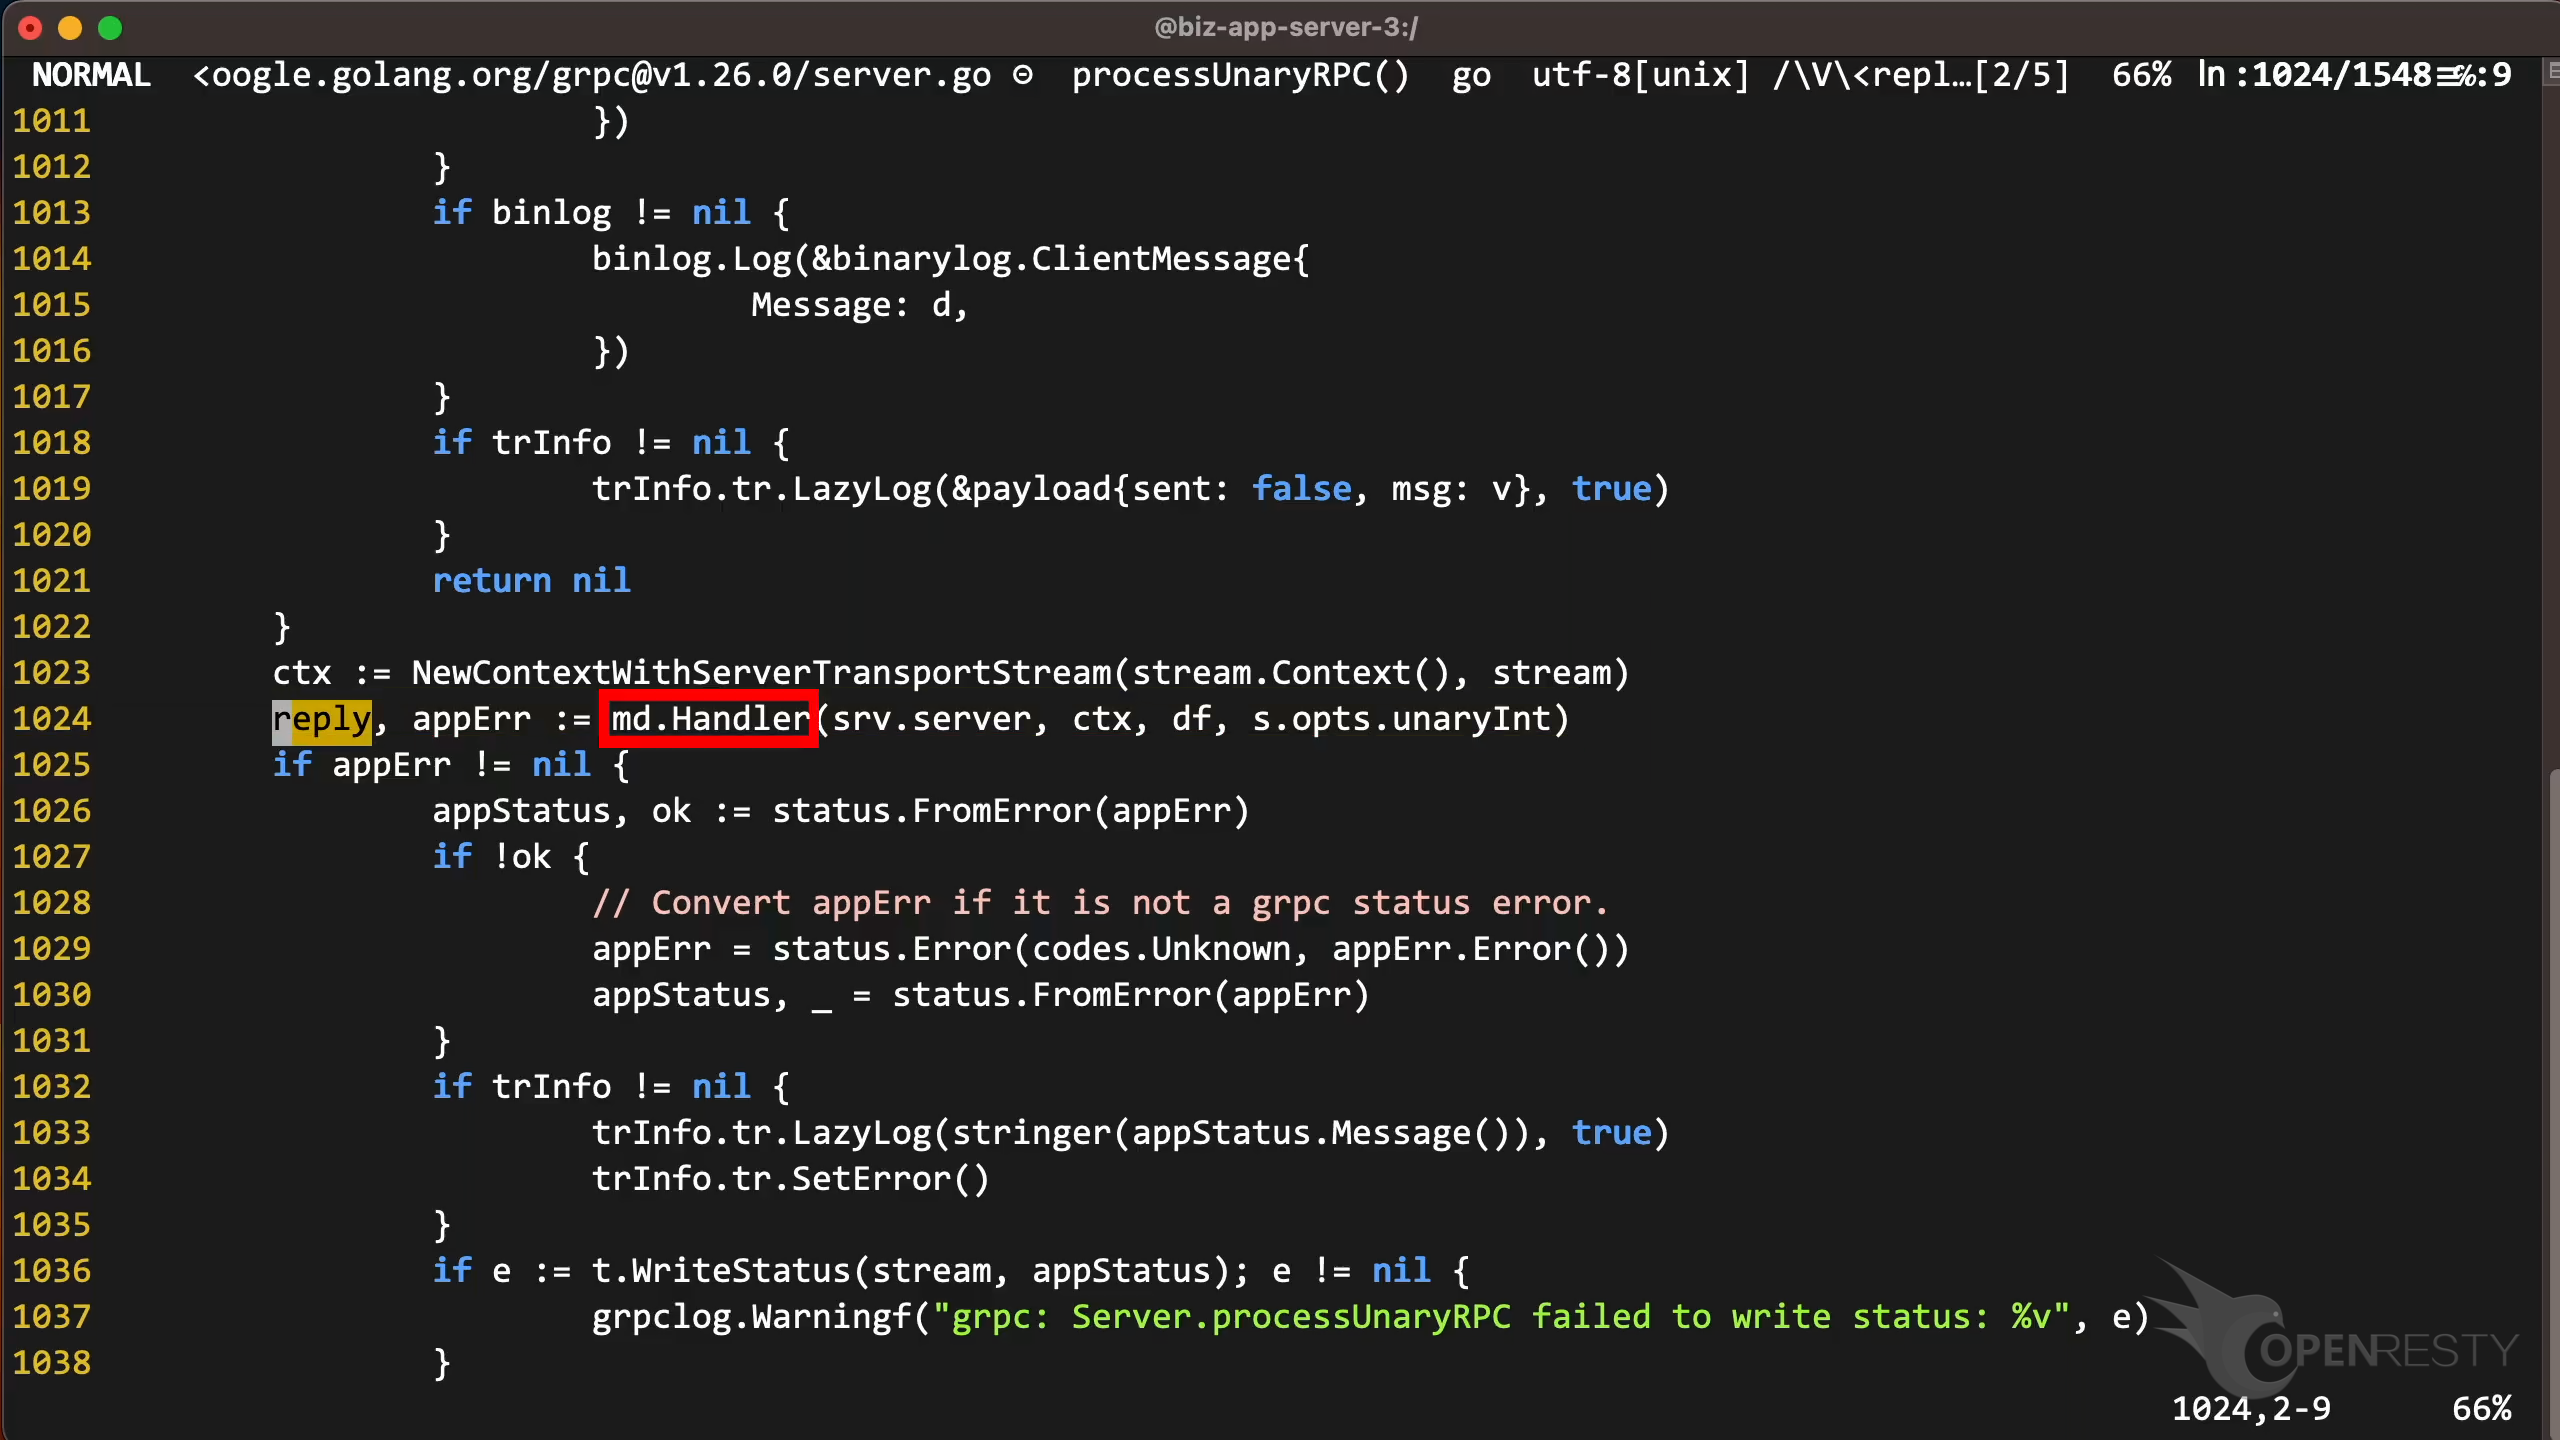
Go to line 1024, as OpenResty XRay suggested.
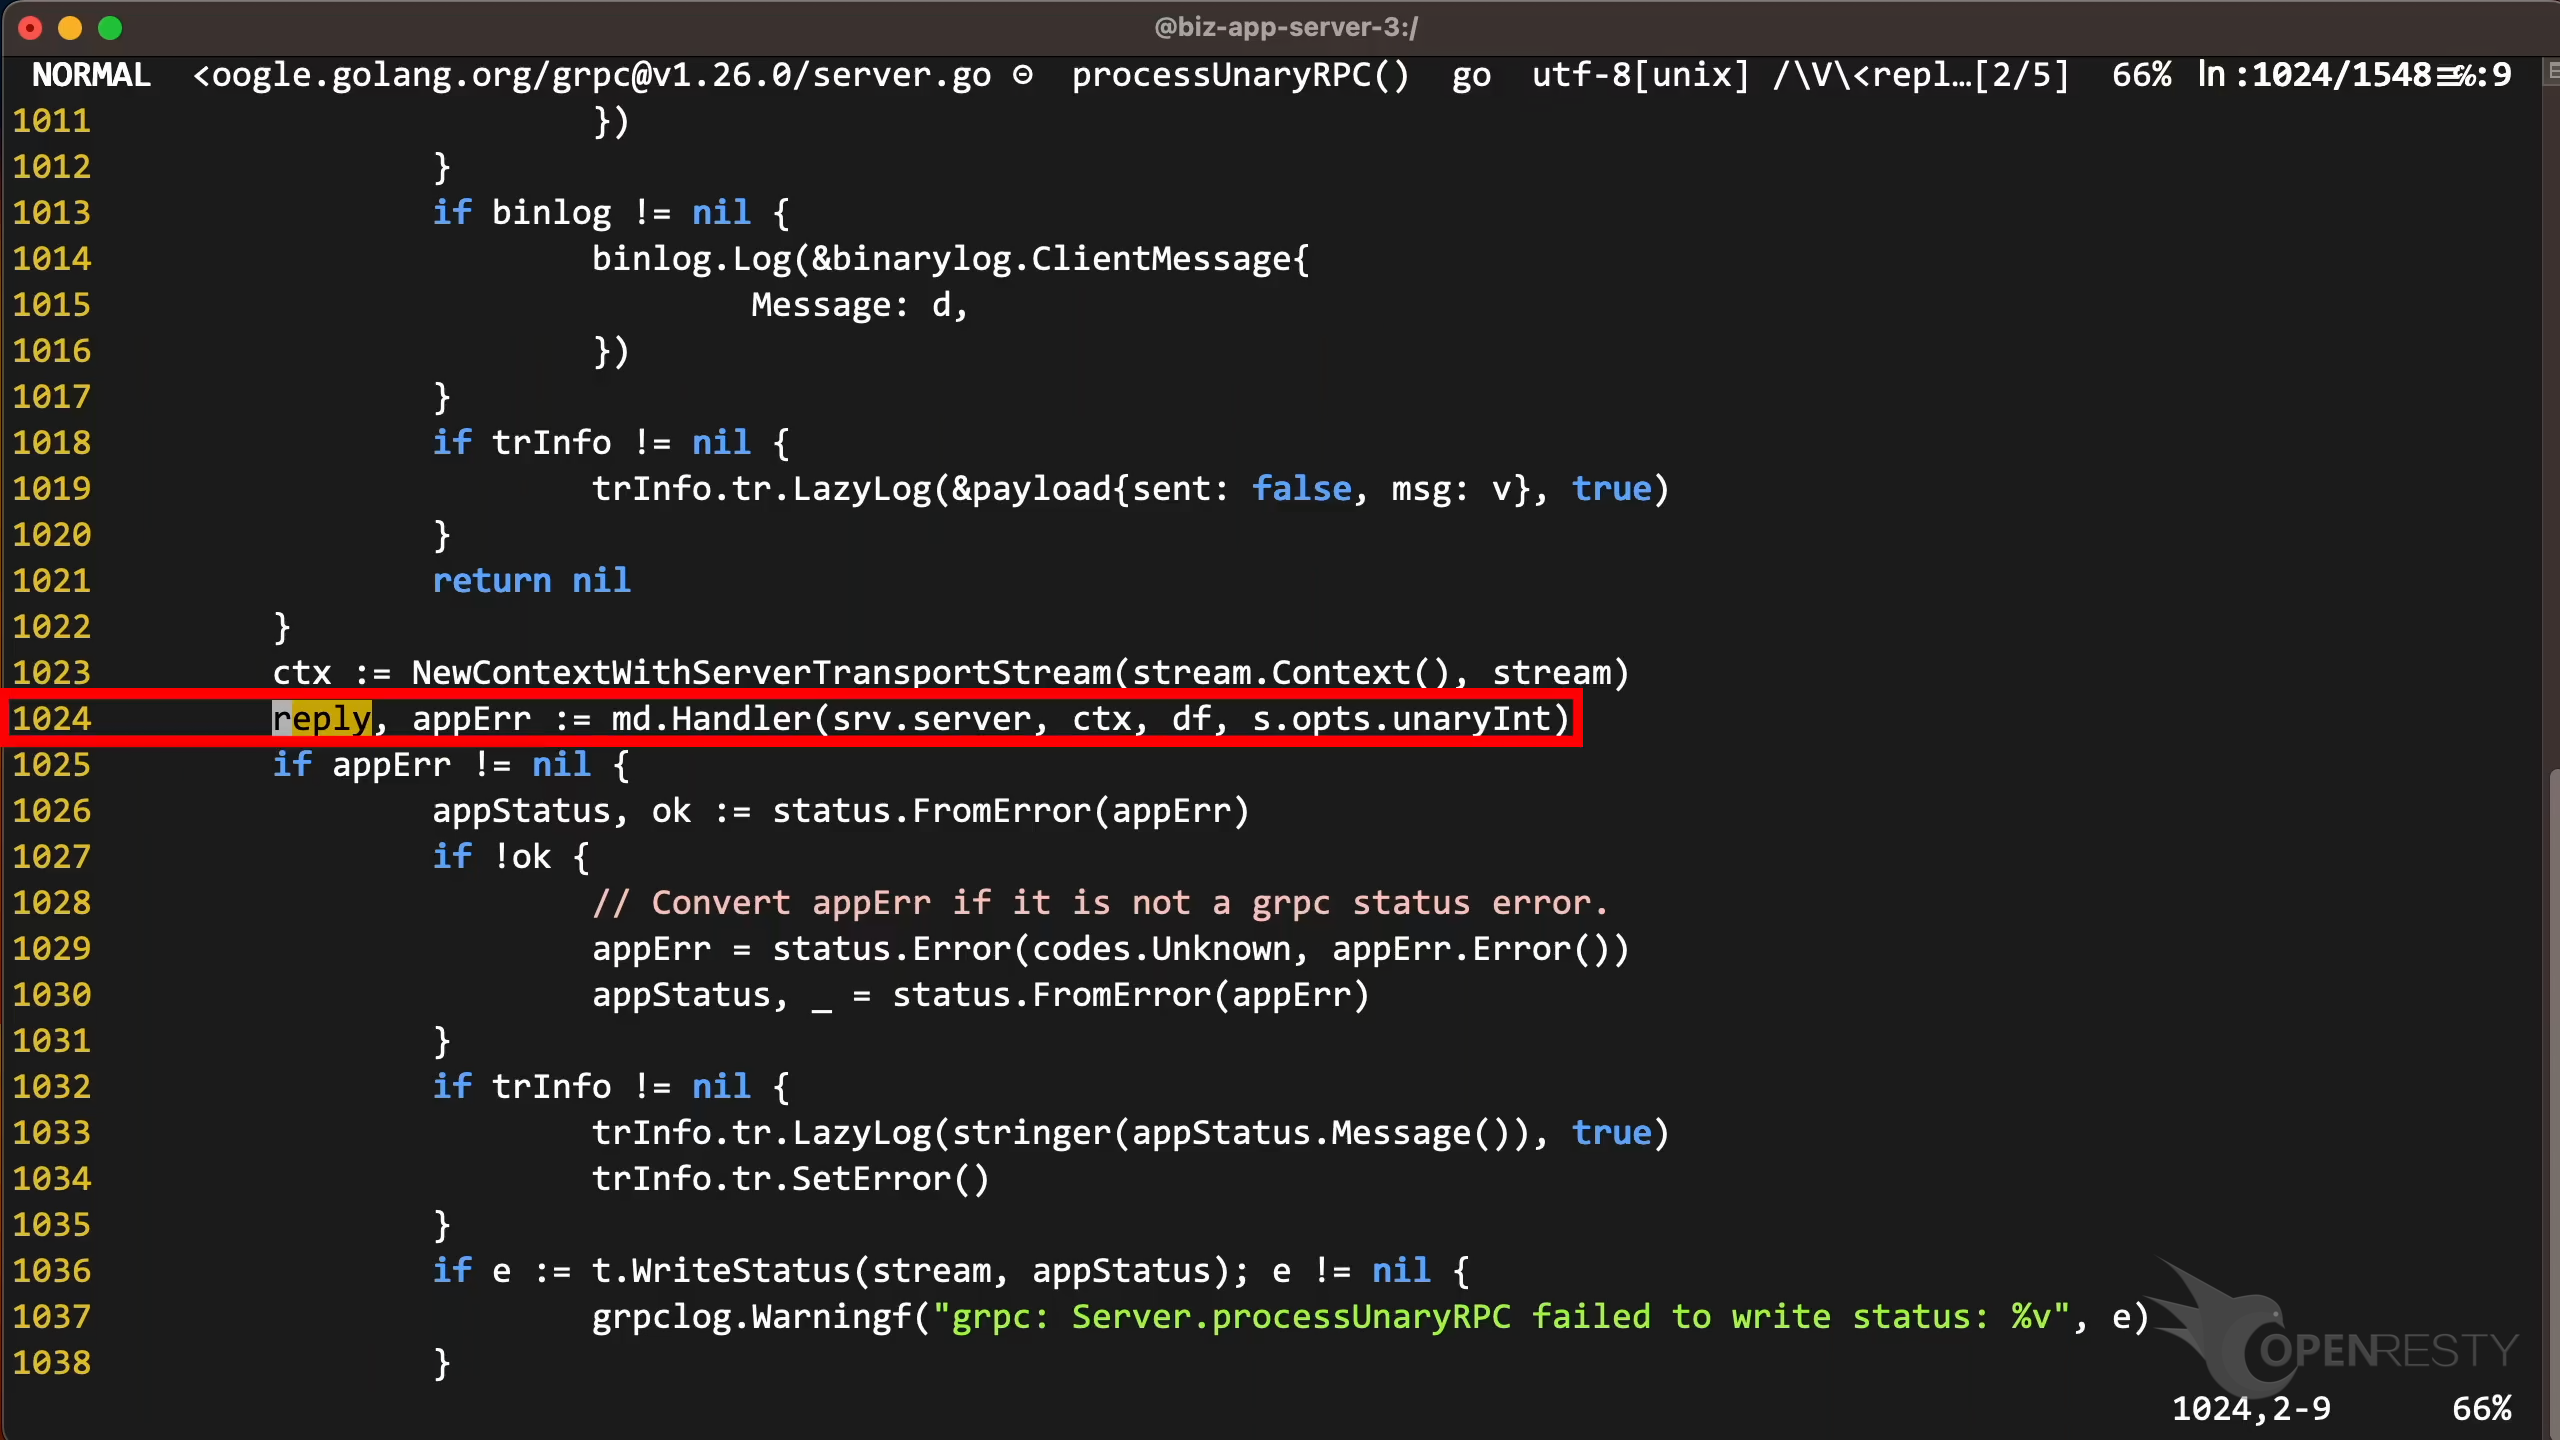
The function md.Handler calls different message handlers depending on the type of gRPC message. The _KV_Range_Handler and _KV_Put_Handler we saw earlier are two examples of such md.Handler callbacks.
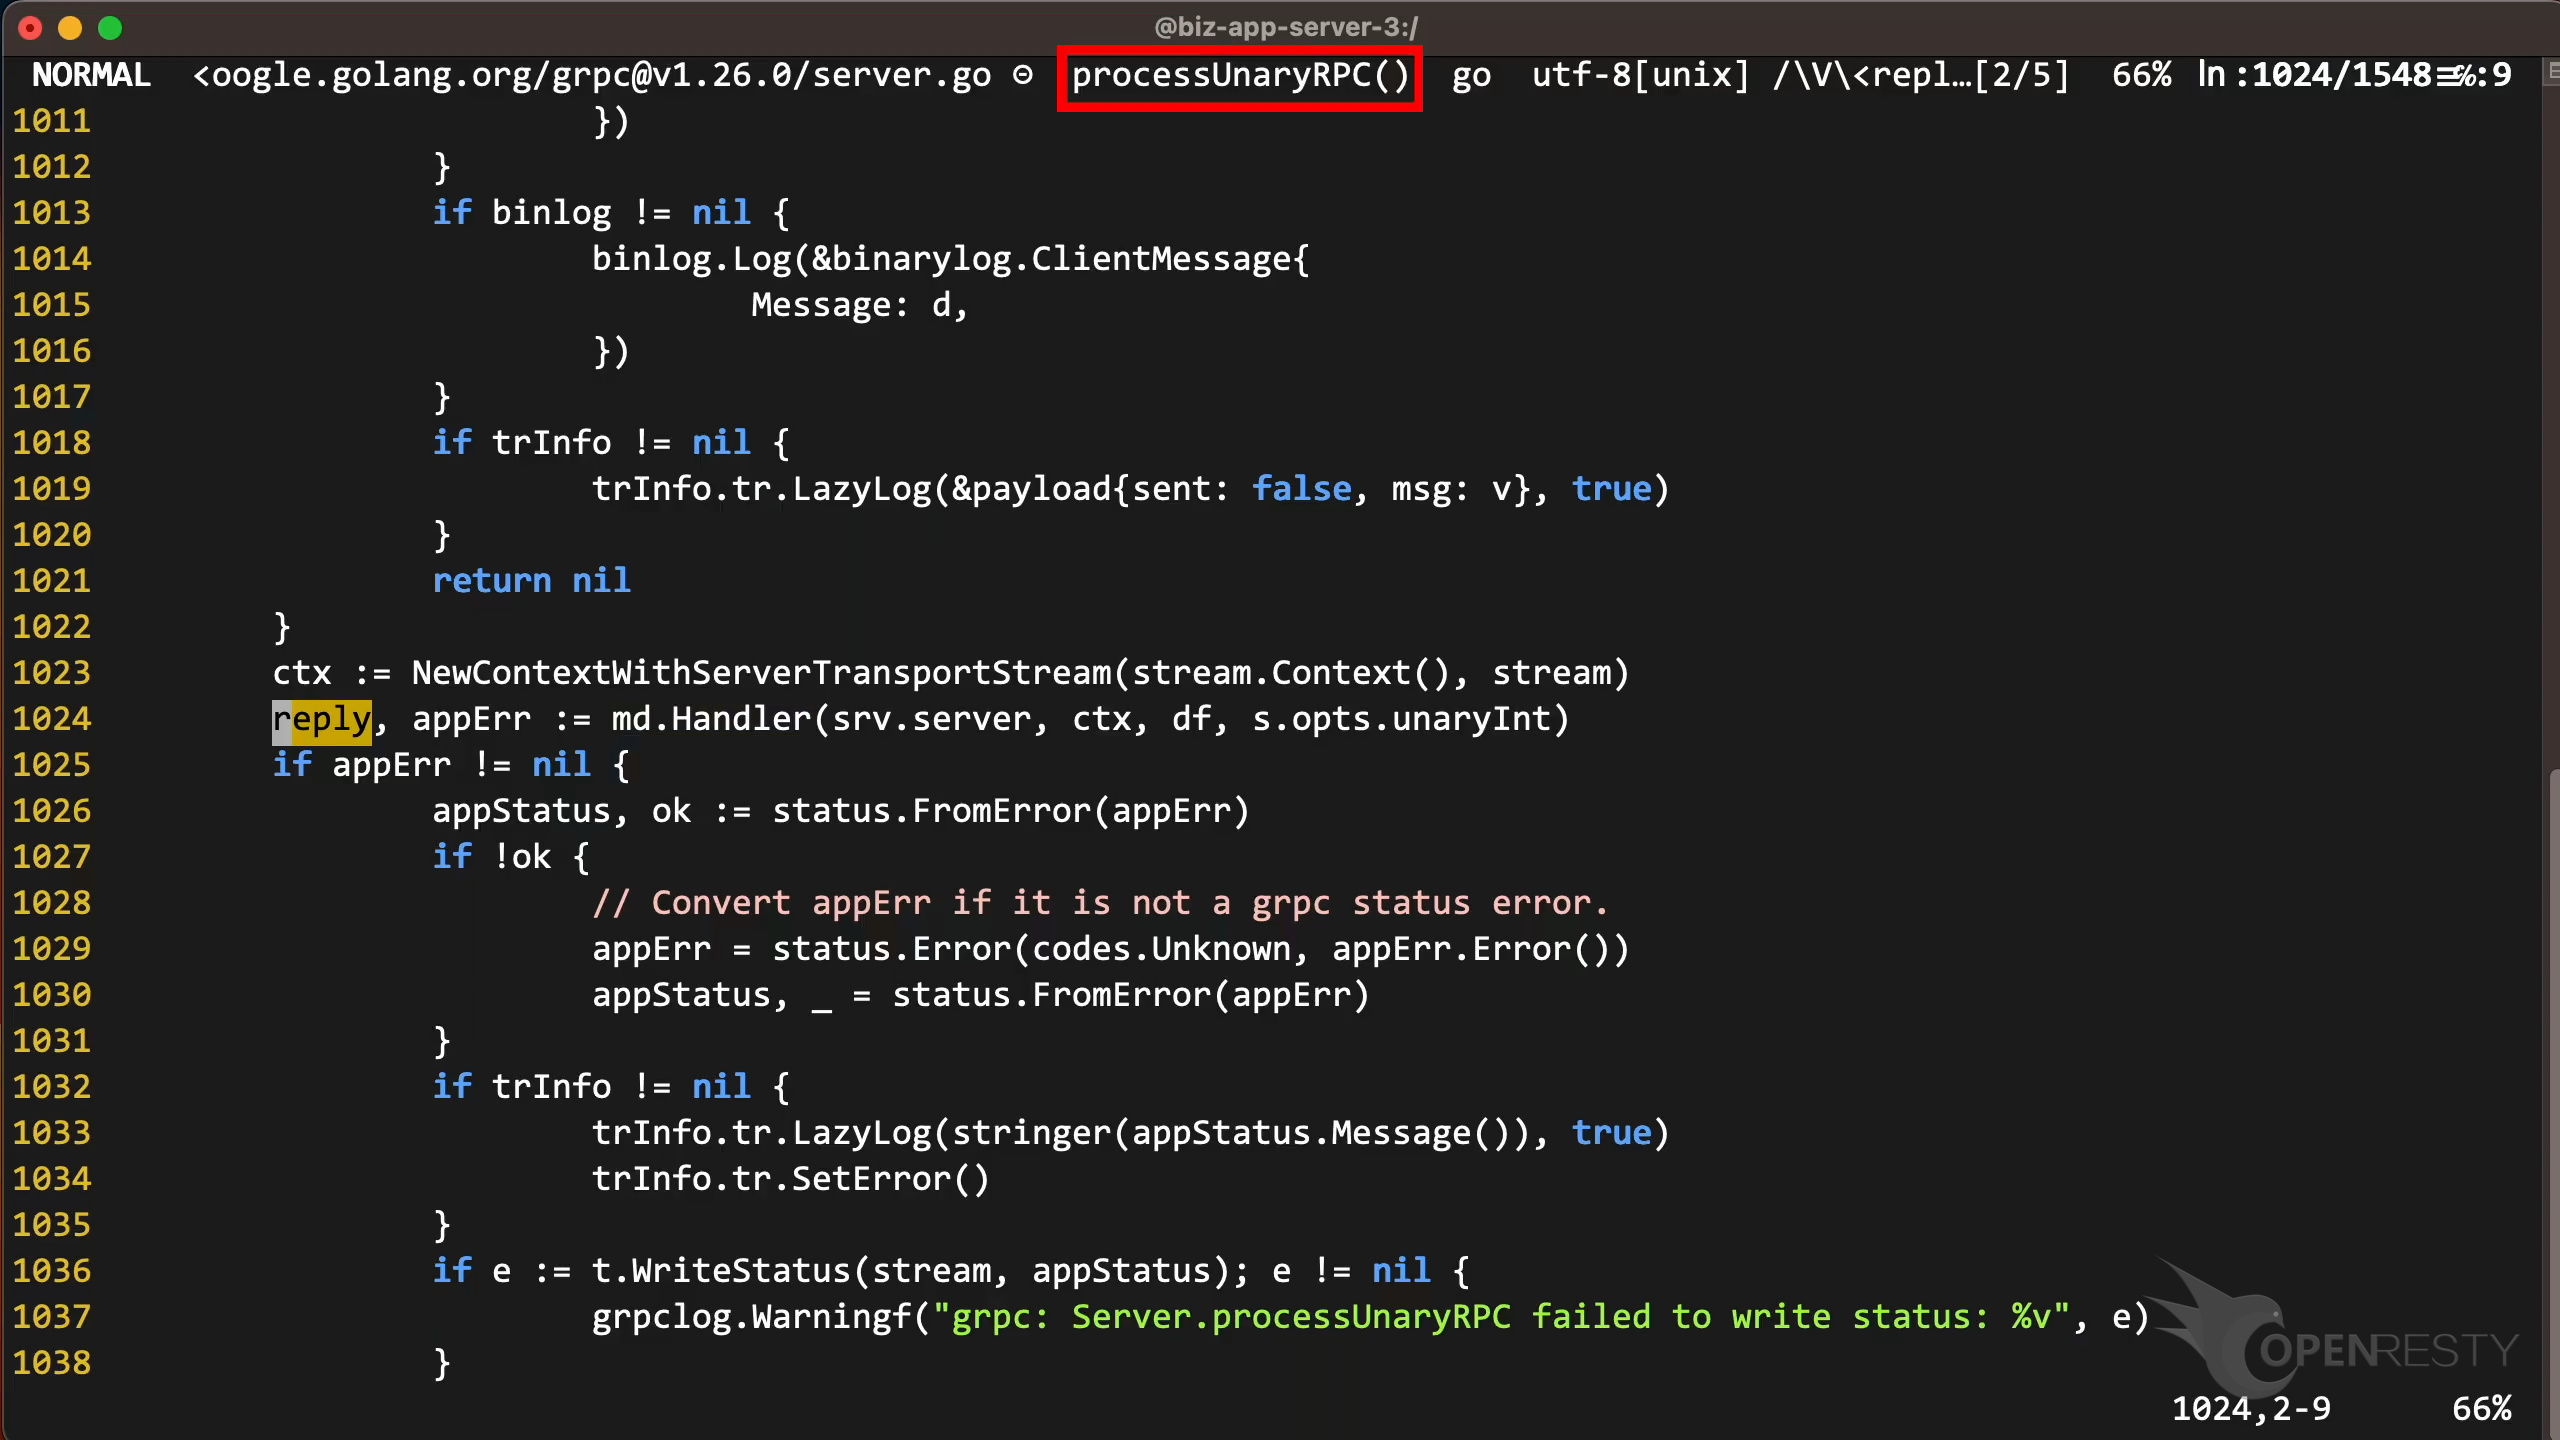
On the status bar you can see that this source line is inside the processUnaryRPC function.
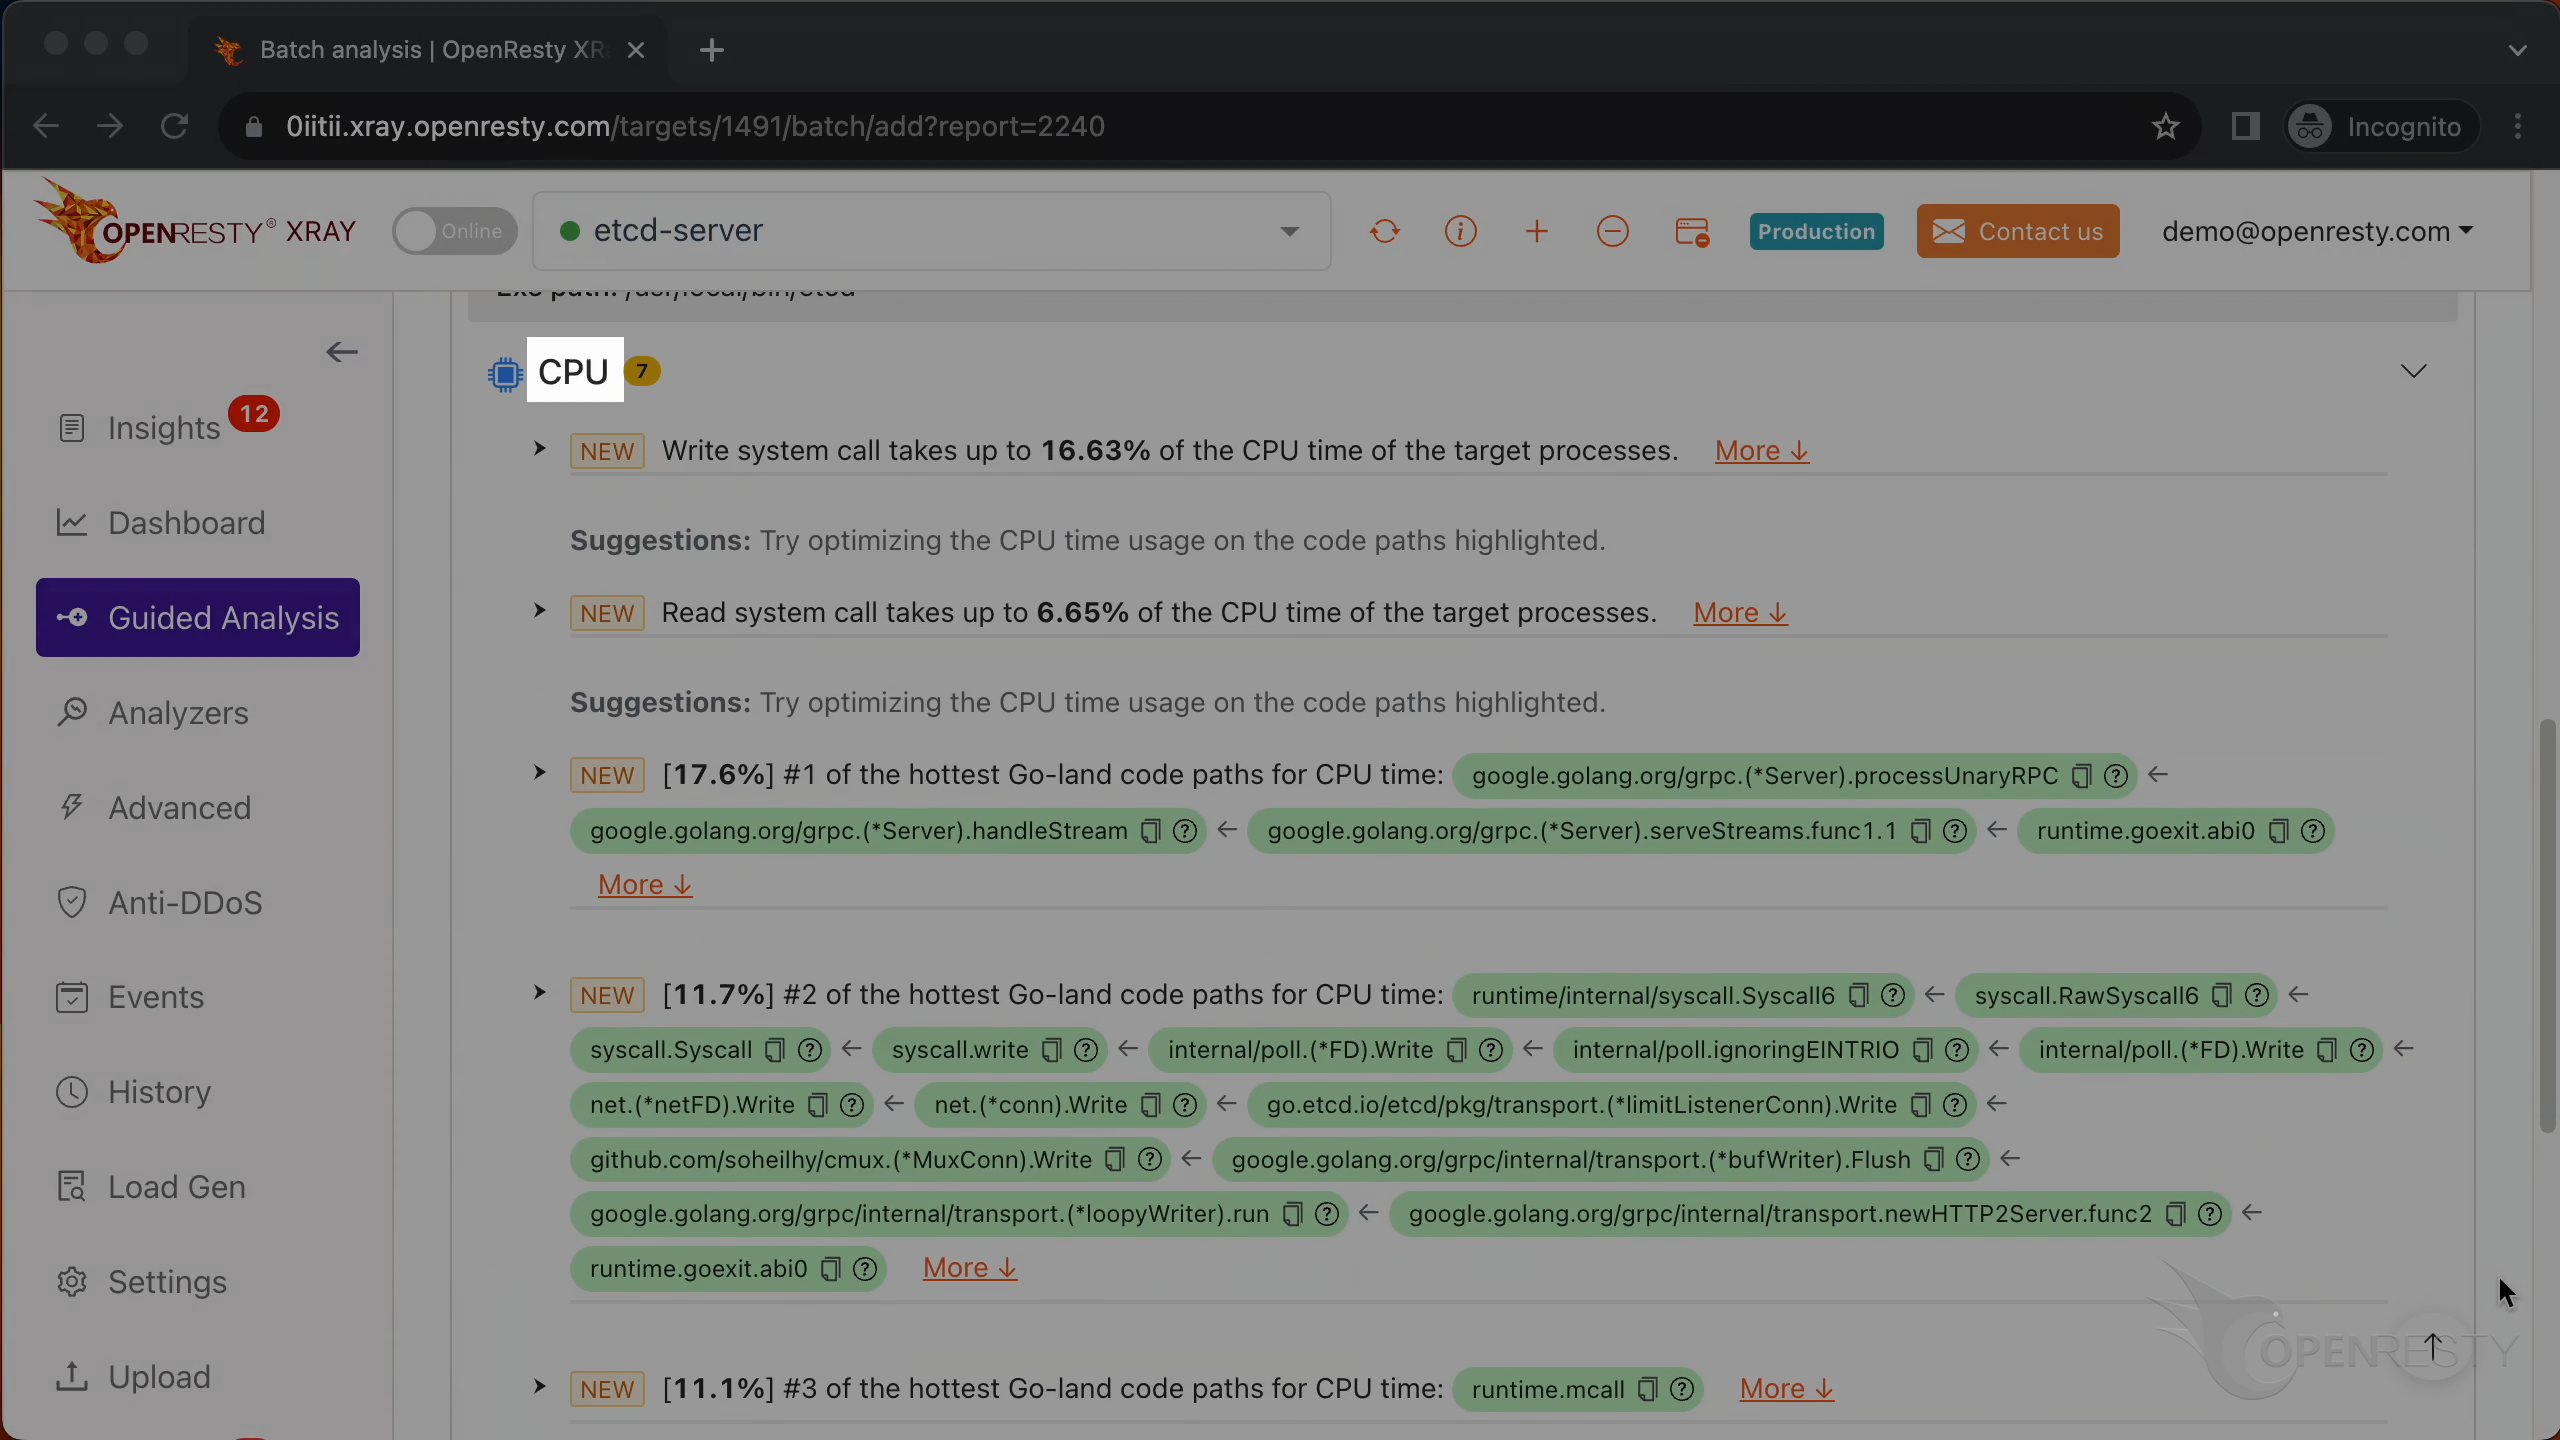
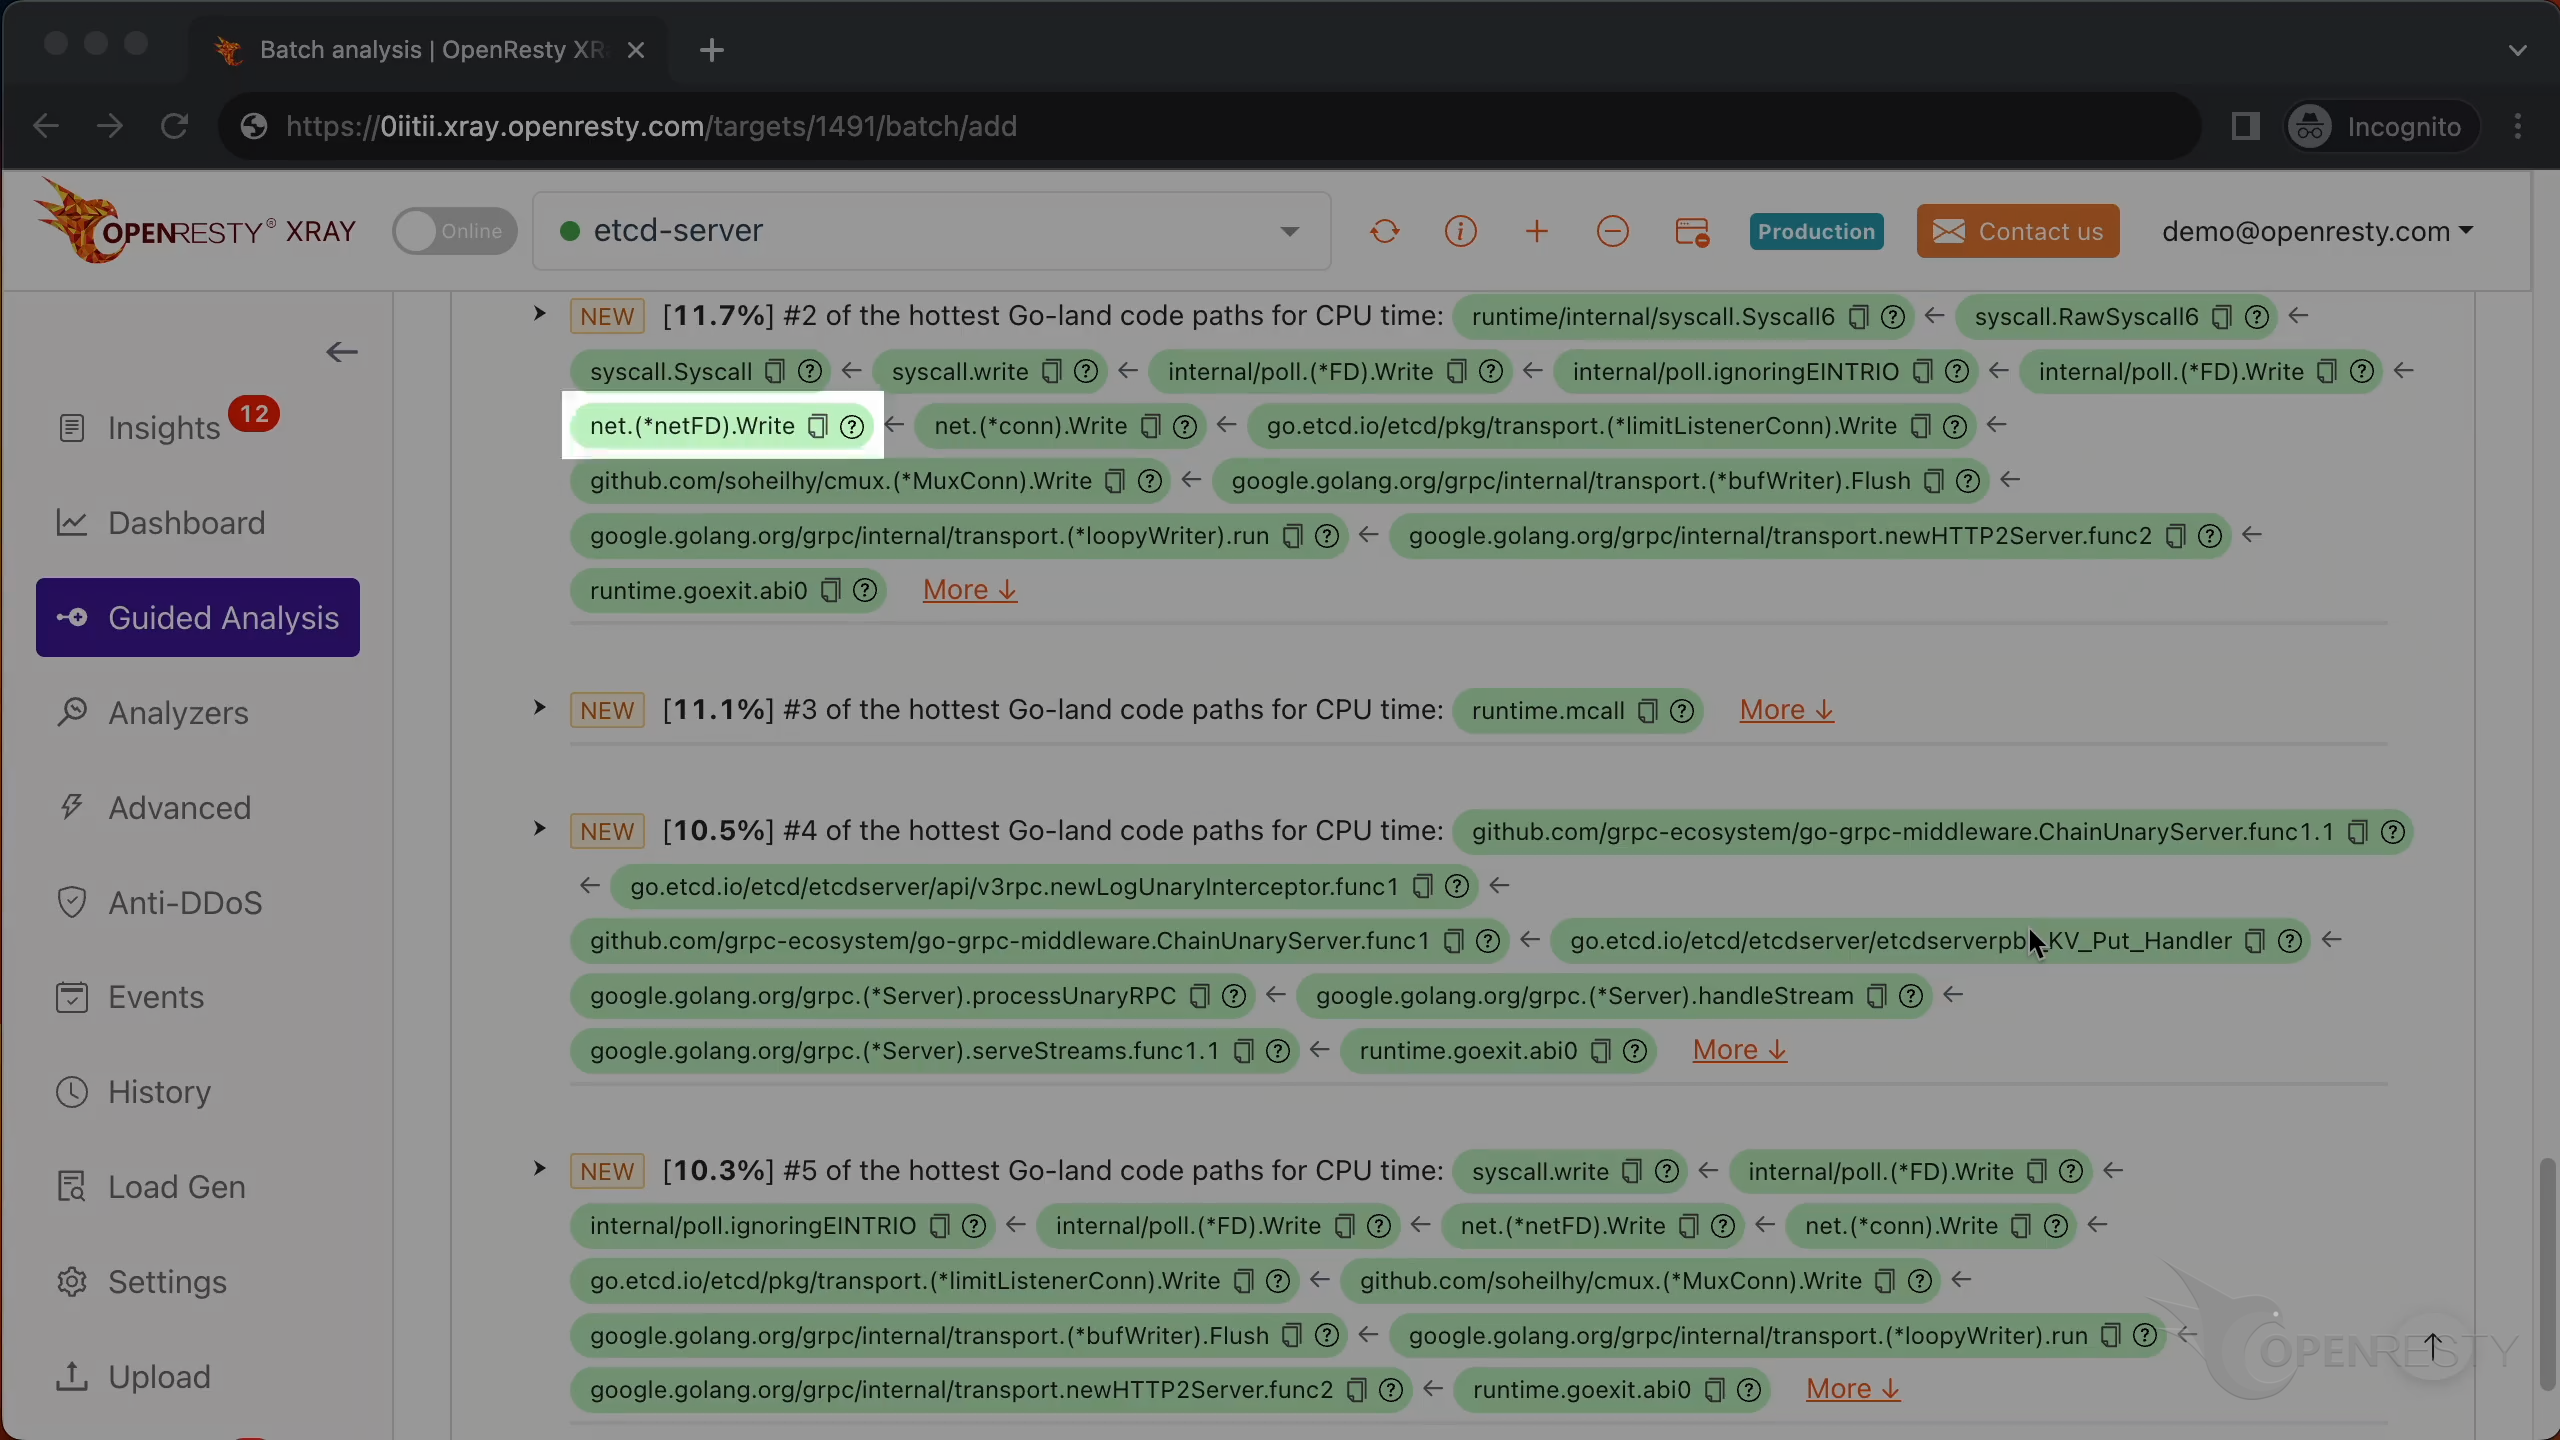
The second hottest code path consumes about 12% of the CPU time.
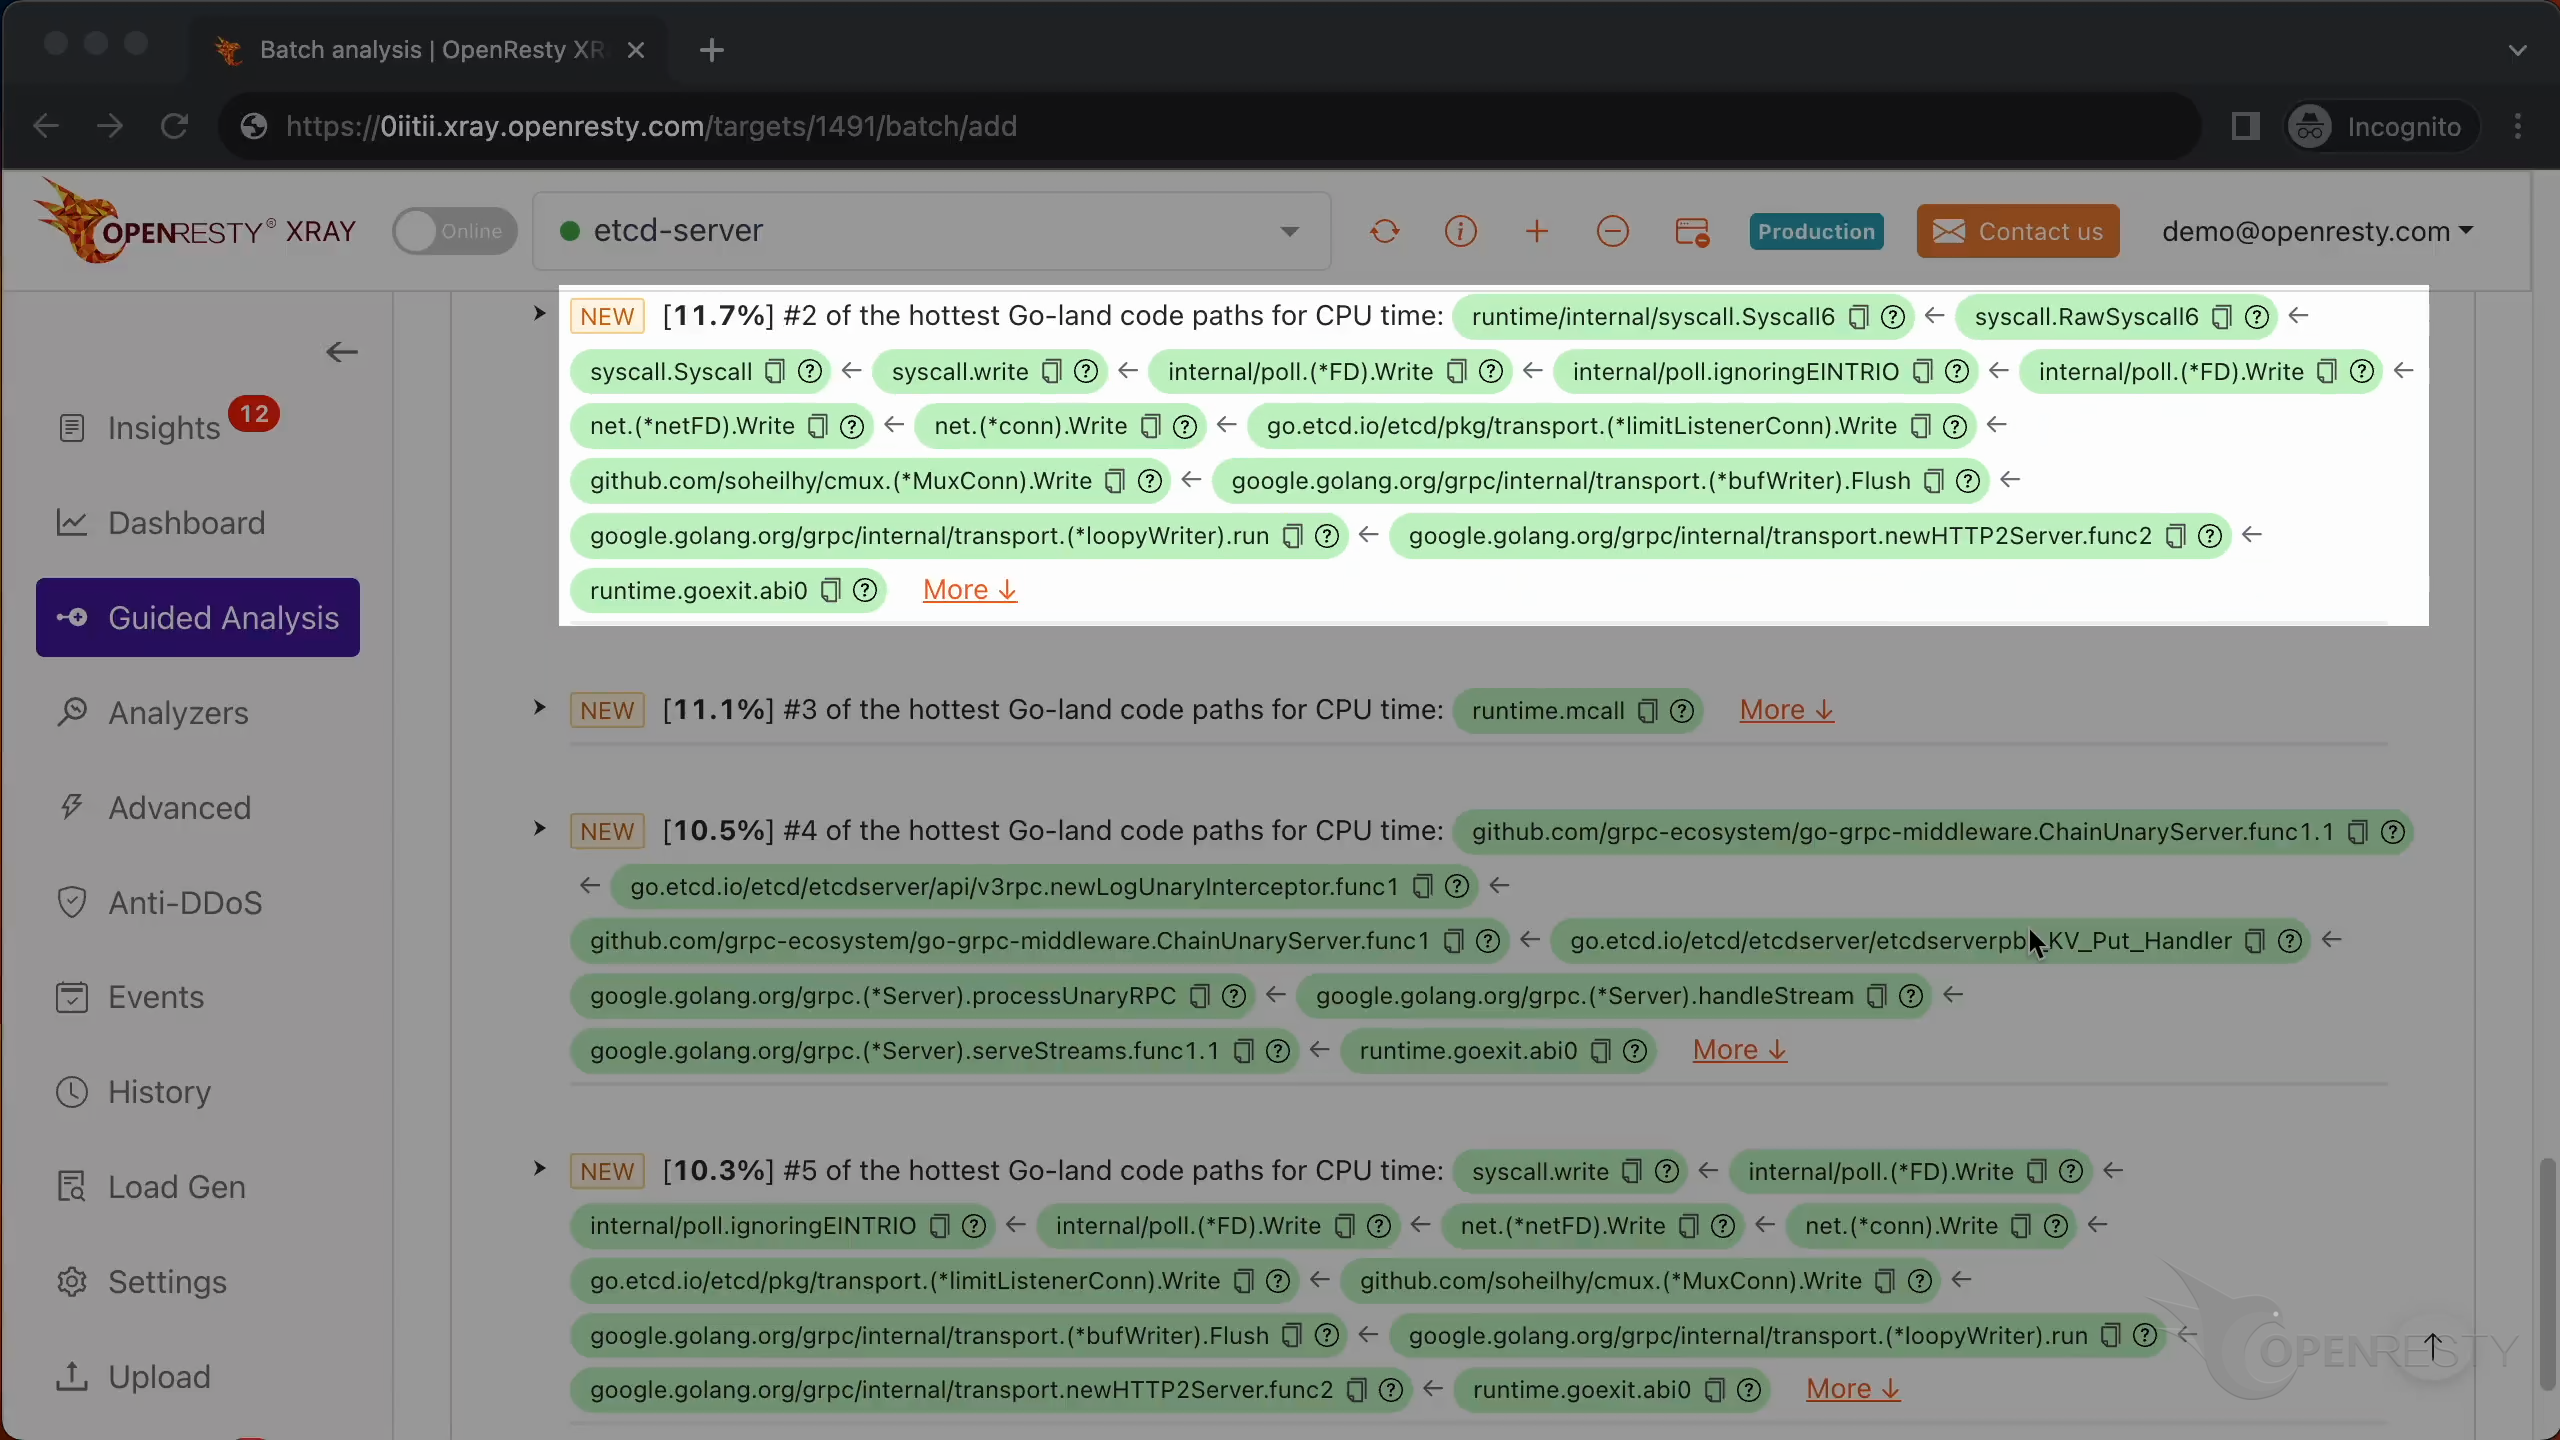
From this function, we know it is writing to a network socket.
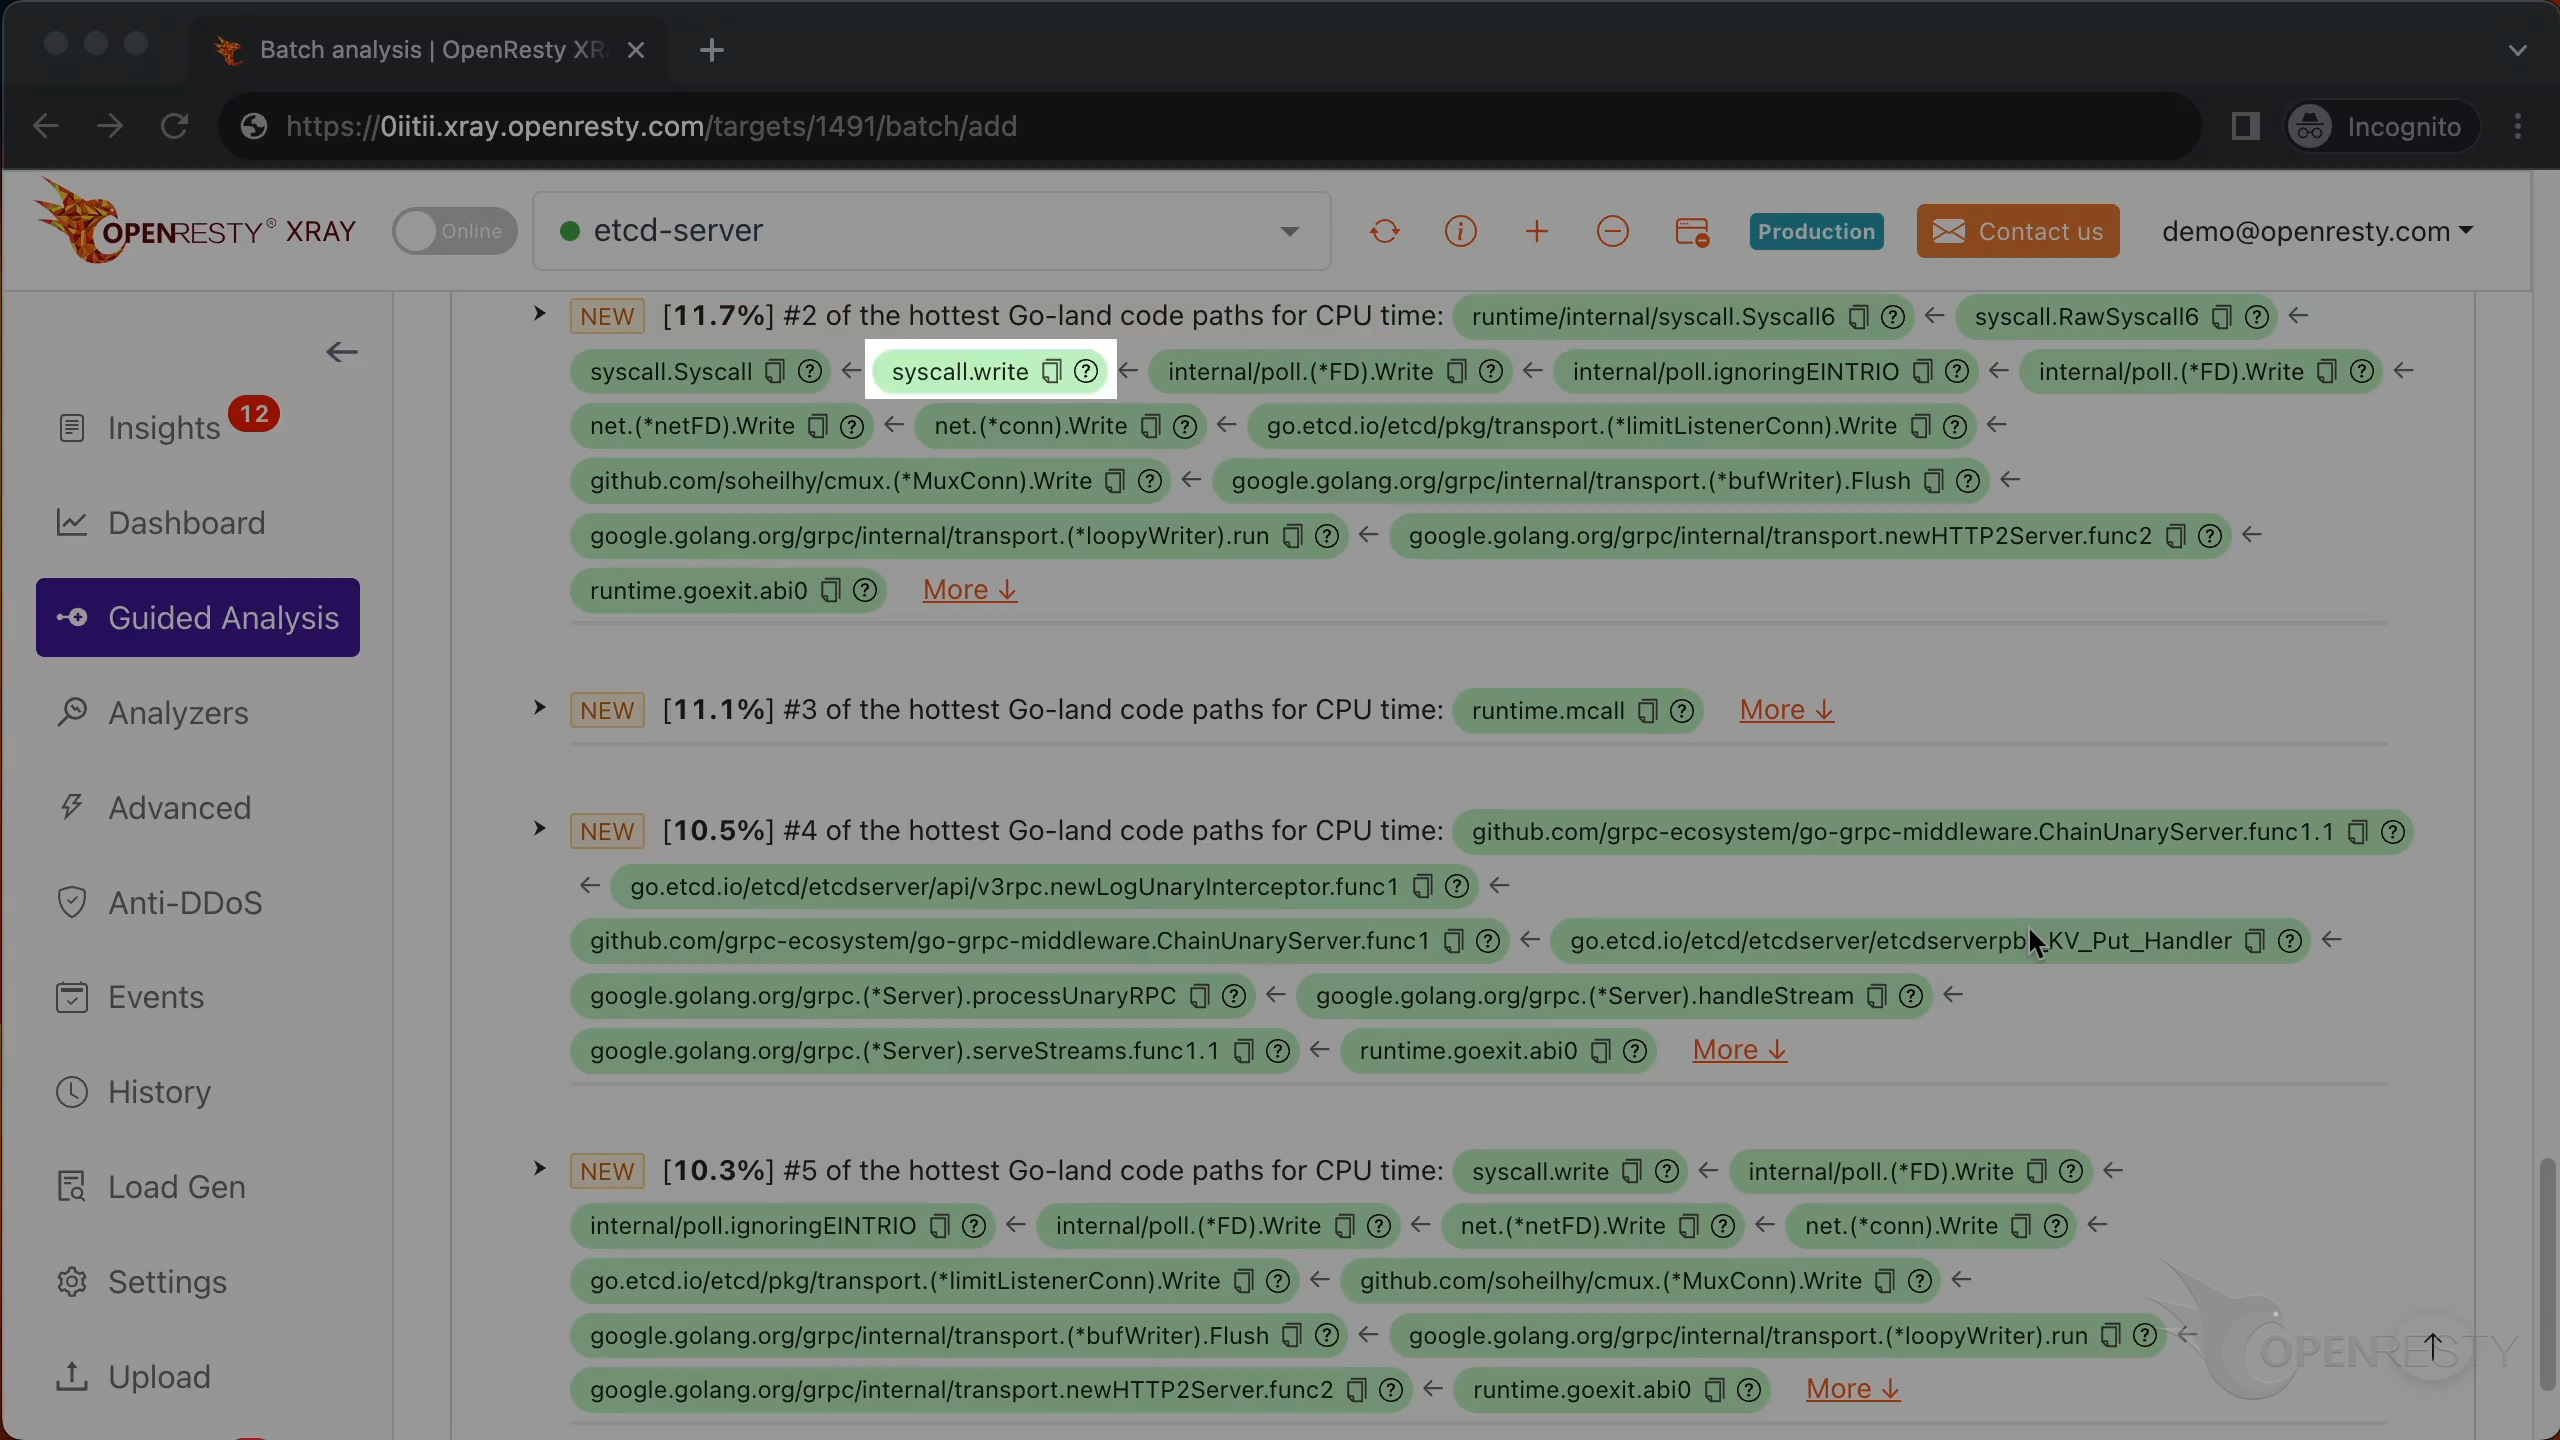
This is invoking the write system call.
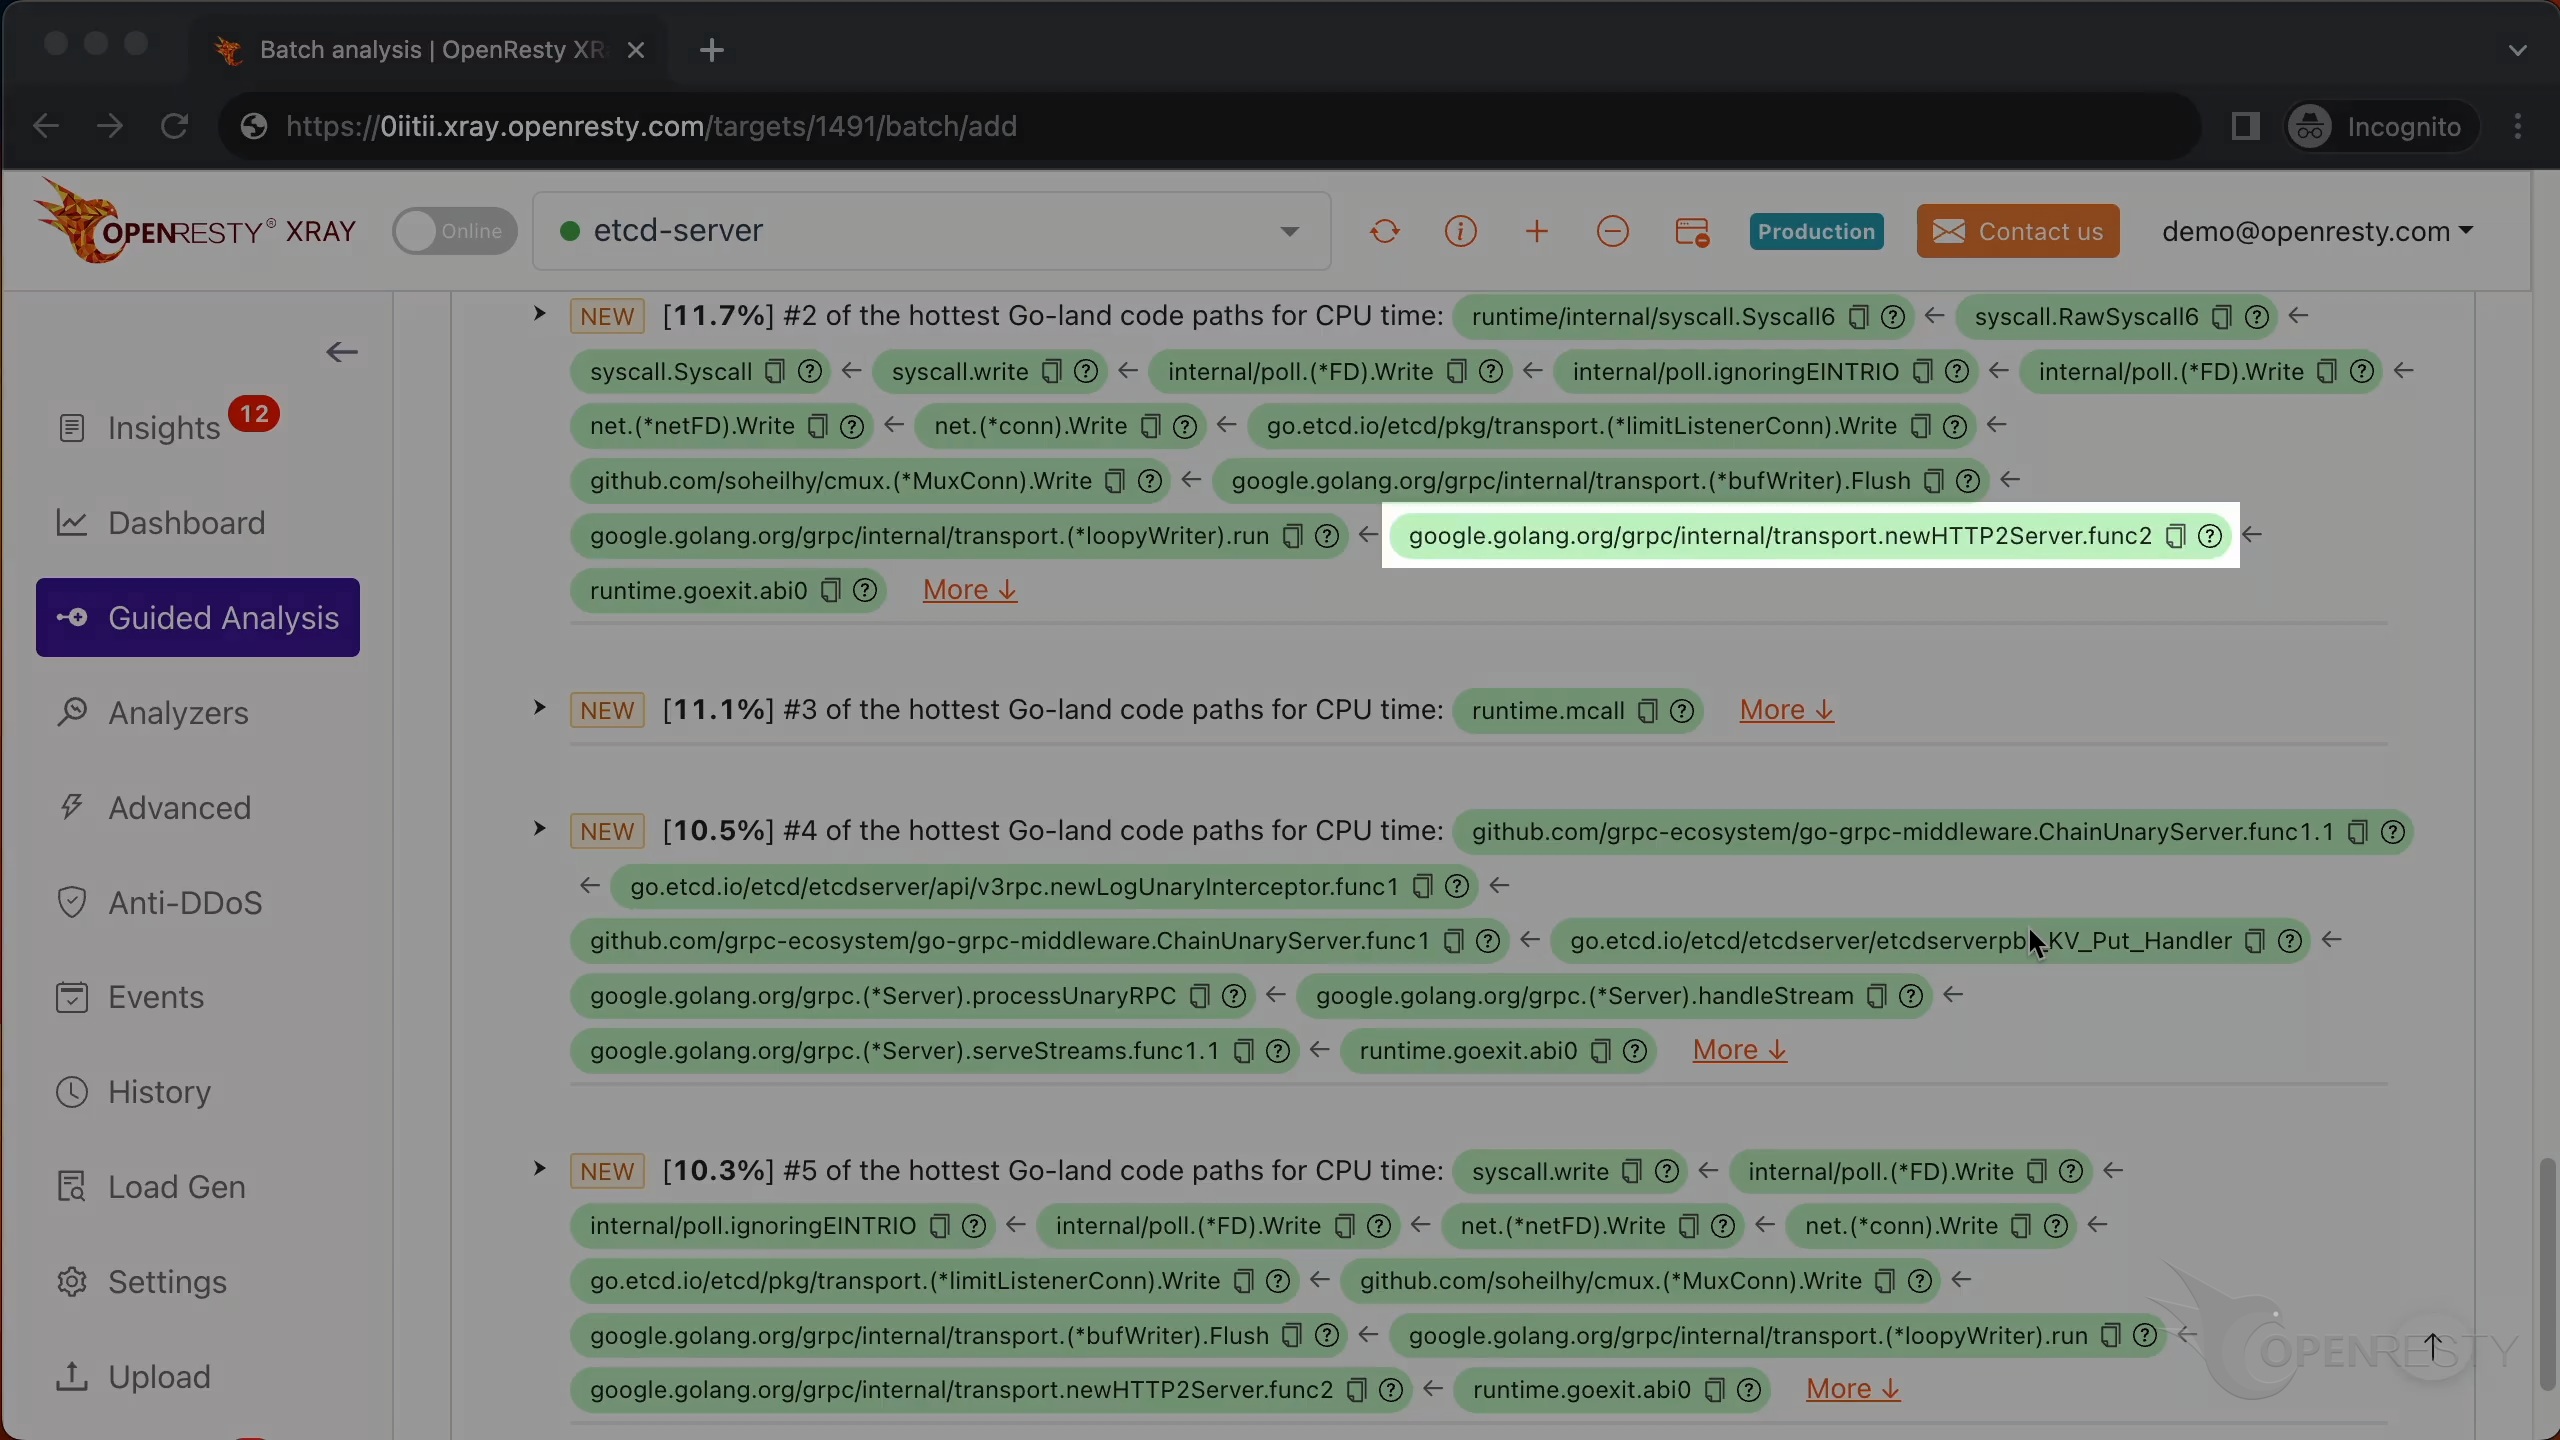
This function sends response data to the network sockets via the HTTP/2 protocol.
The third hottest code path consumes about 11% of the CPU time.
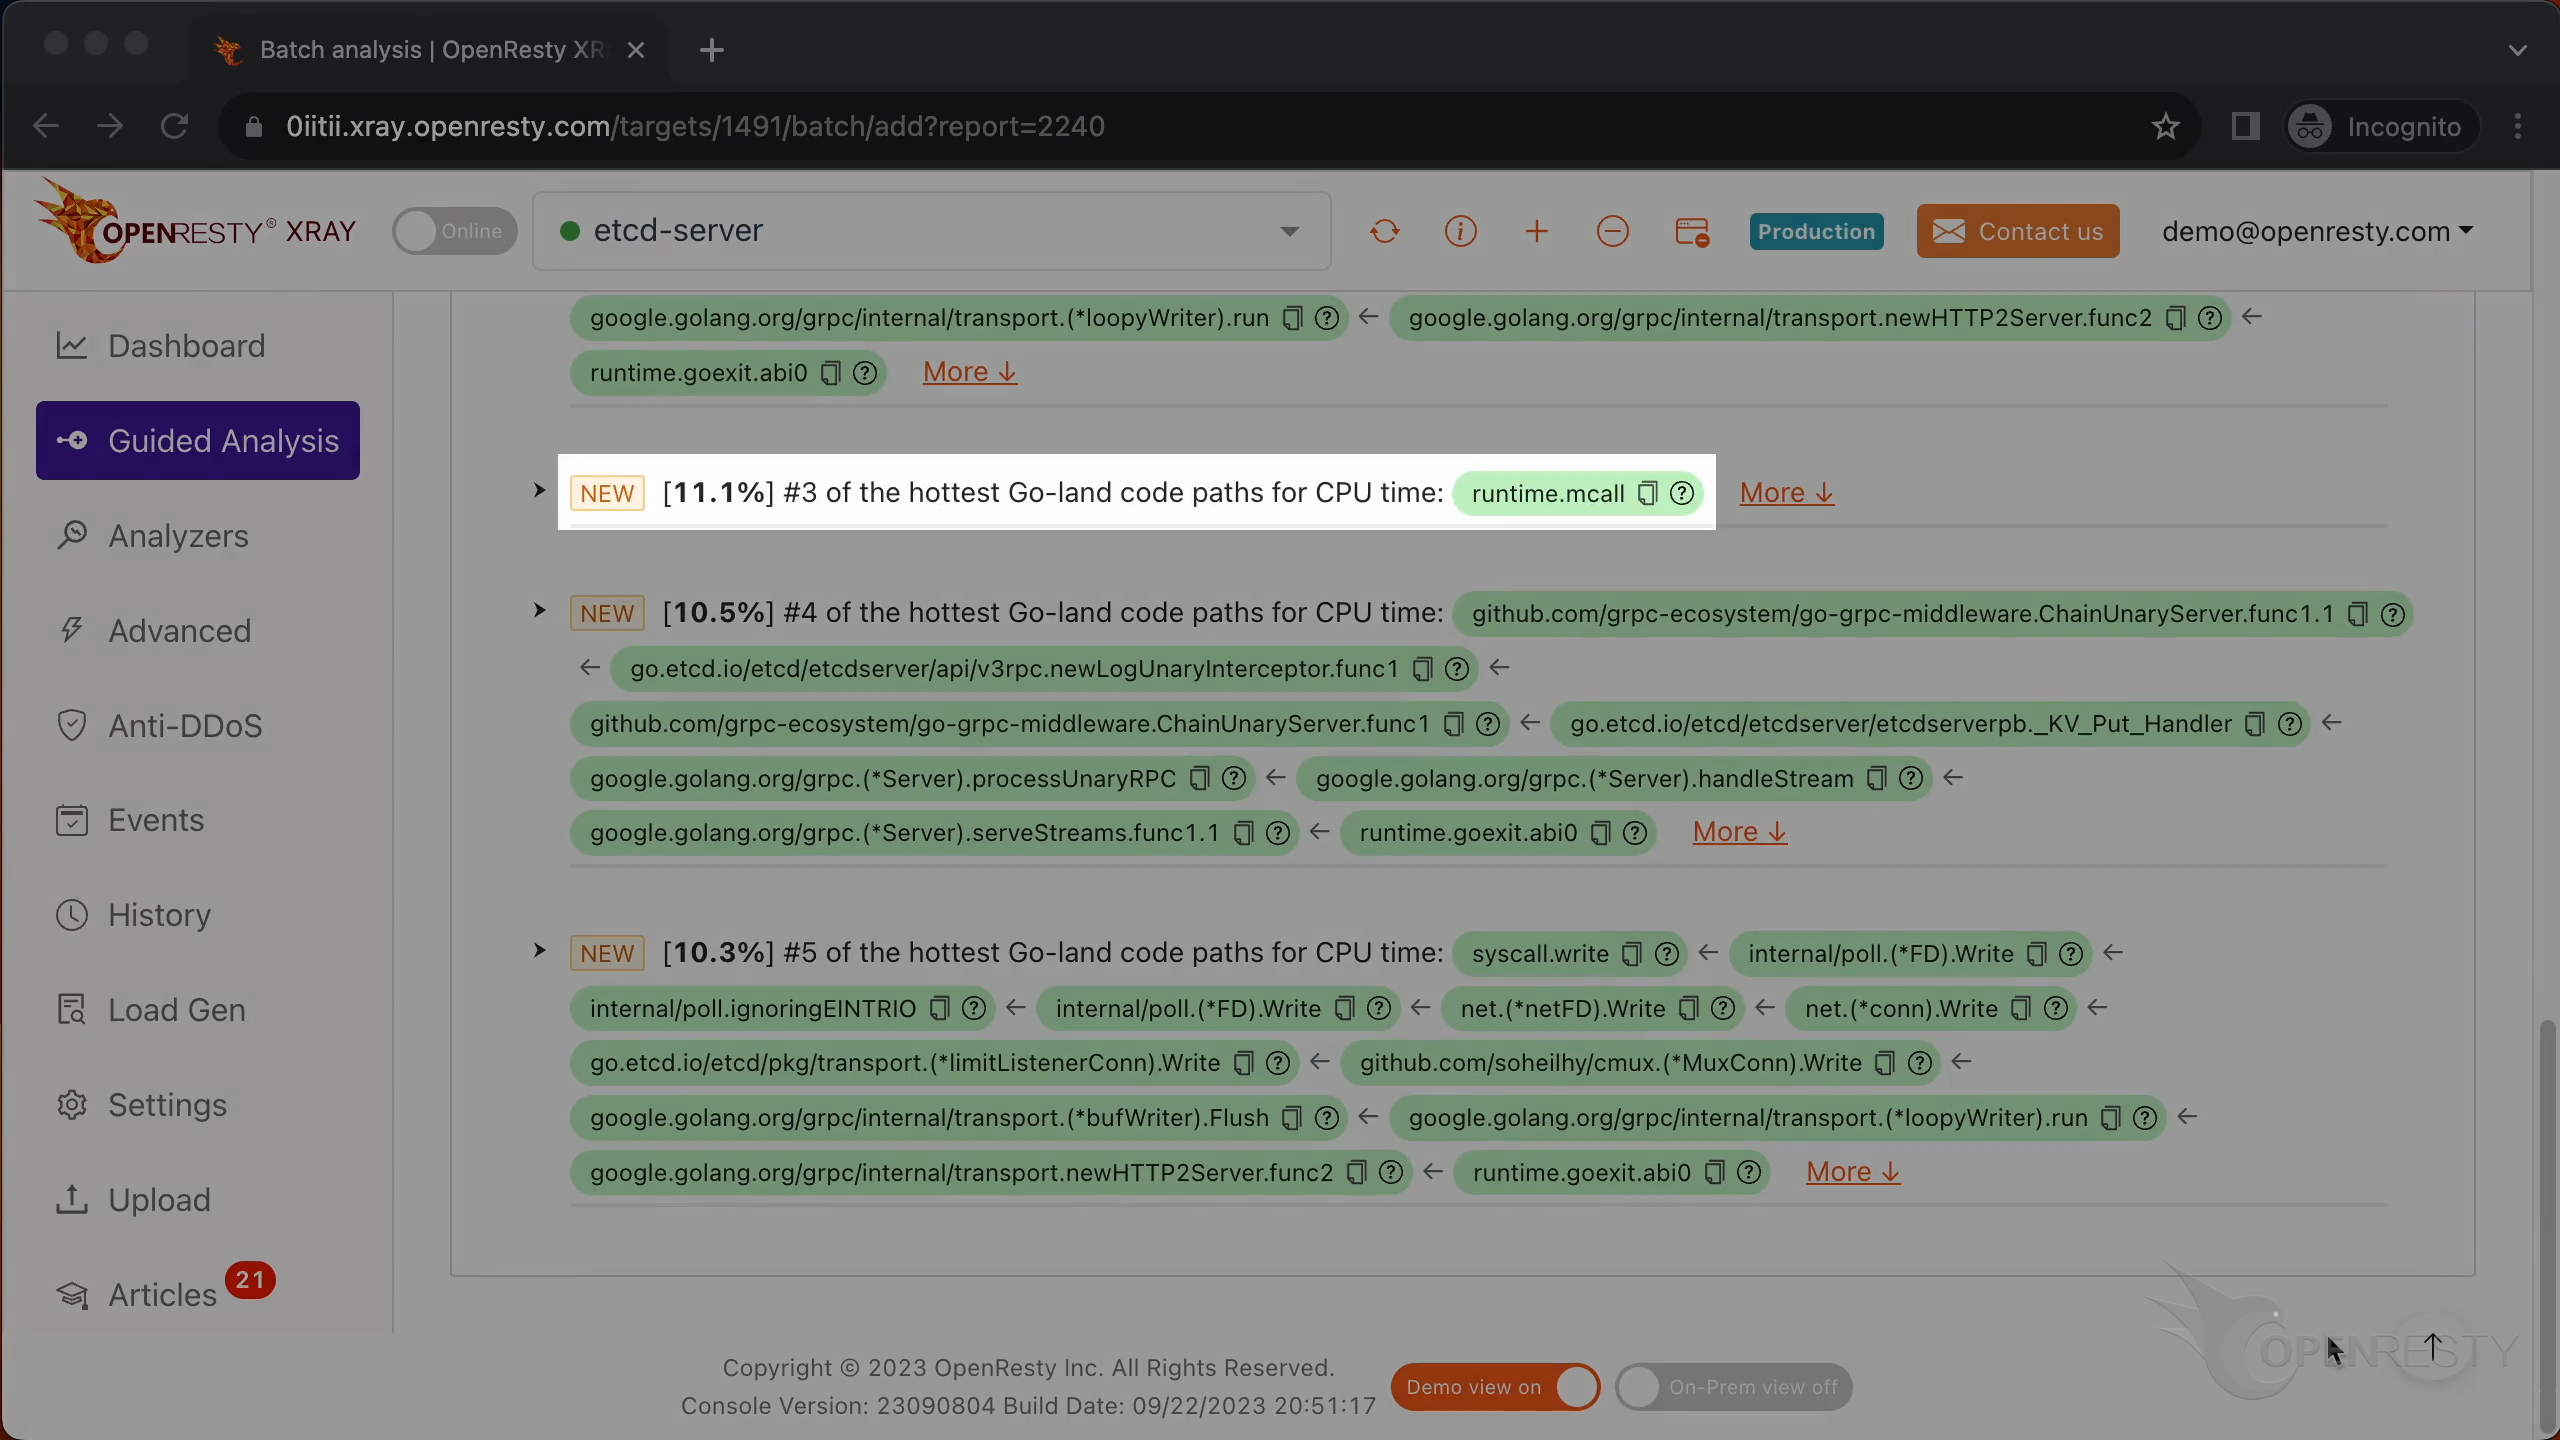
Here, runtime.mcall mainly executes the scheduling of goroutine.
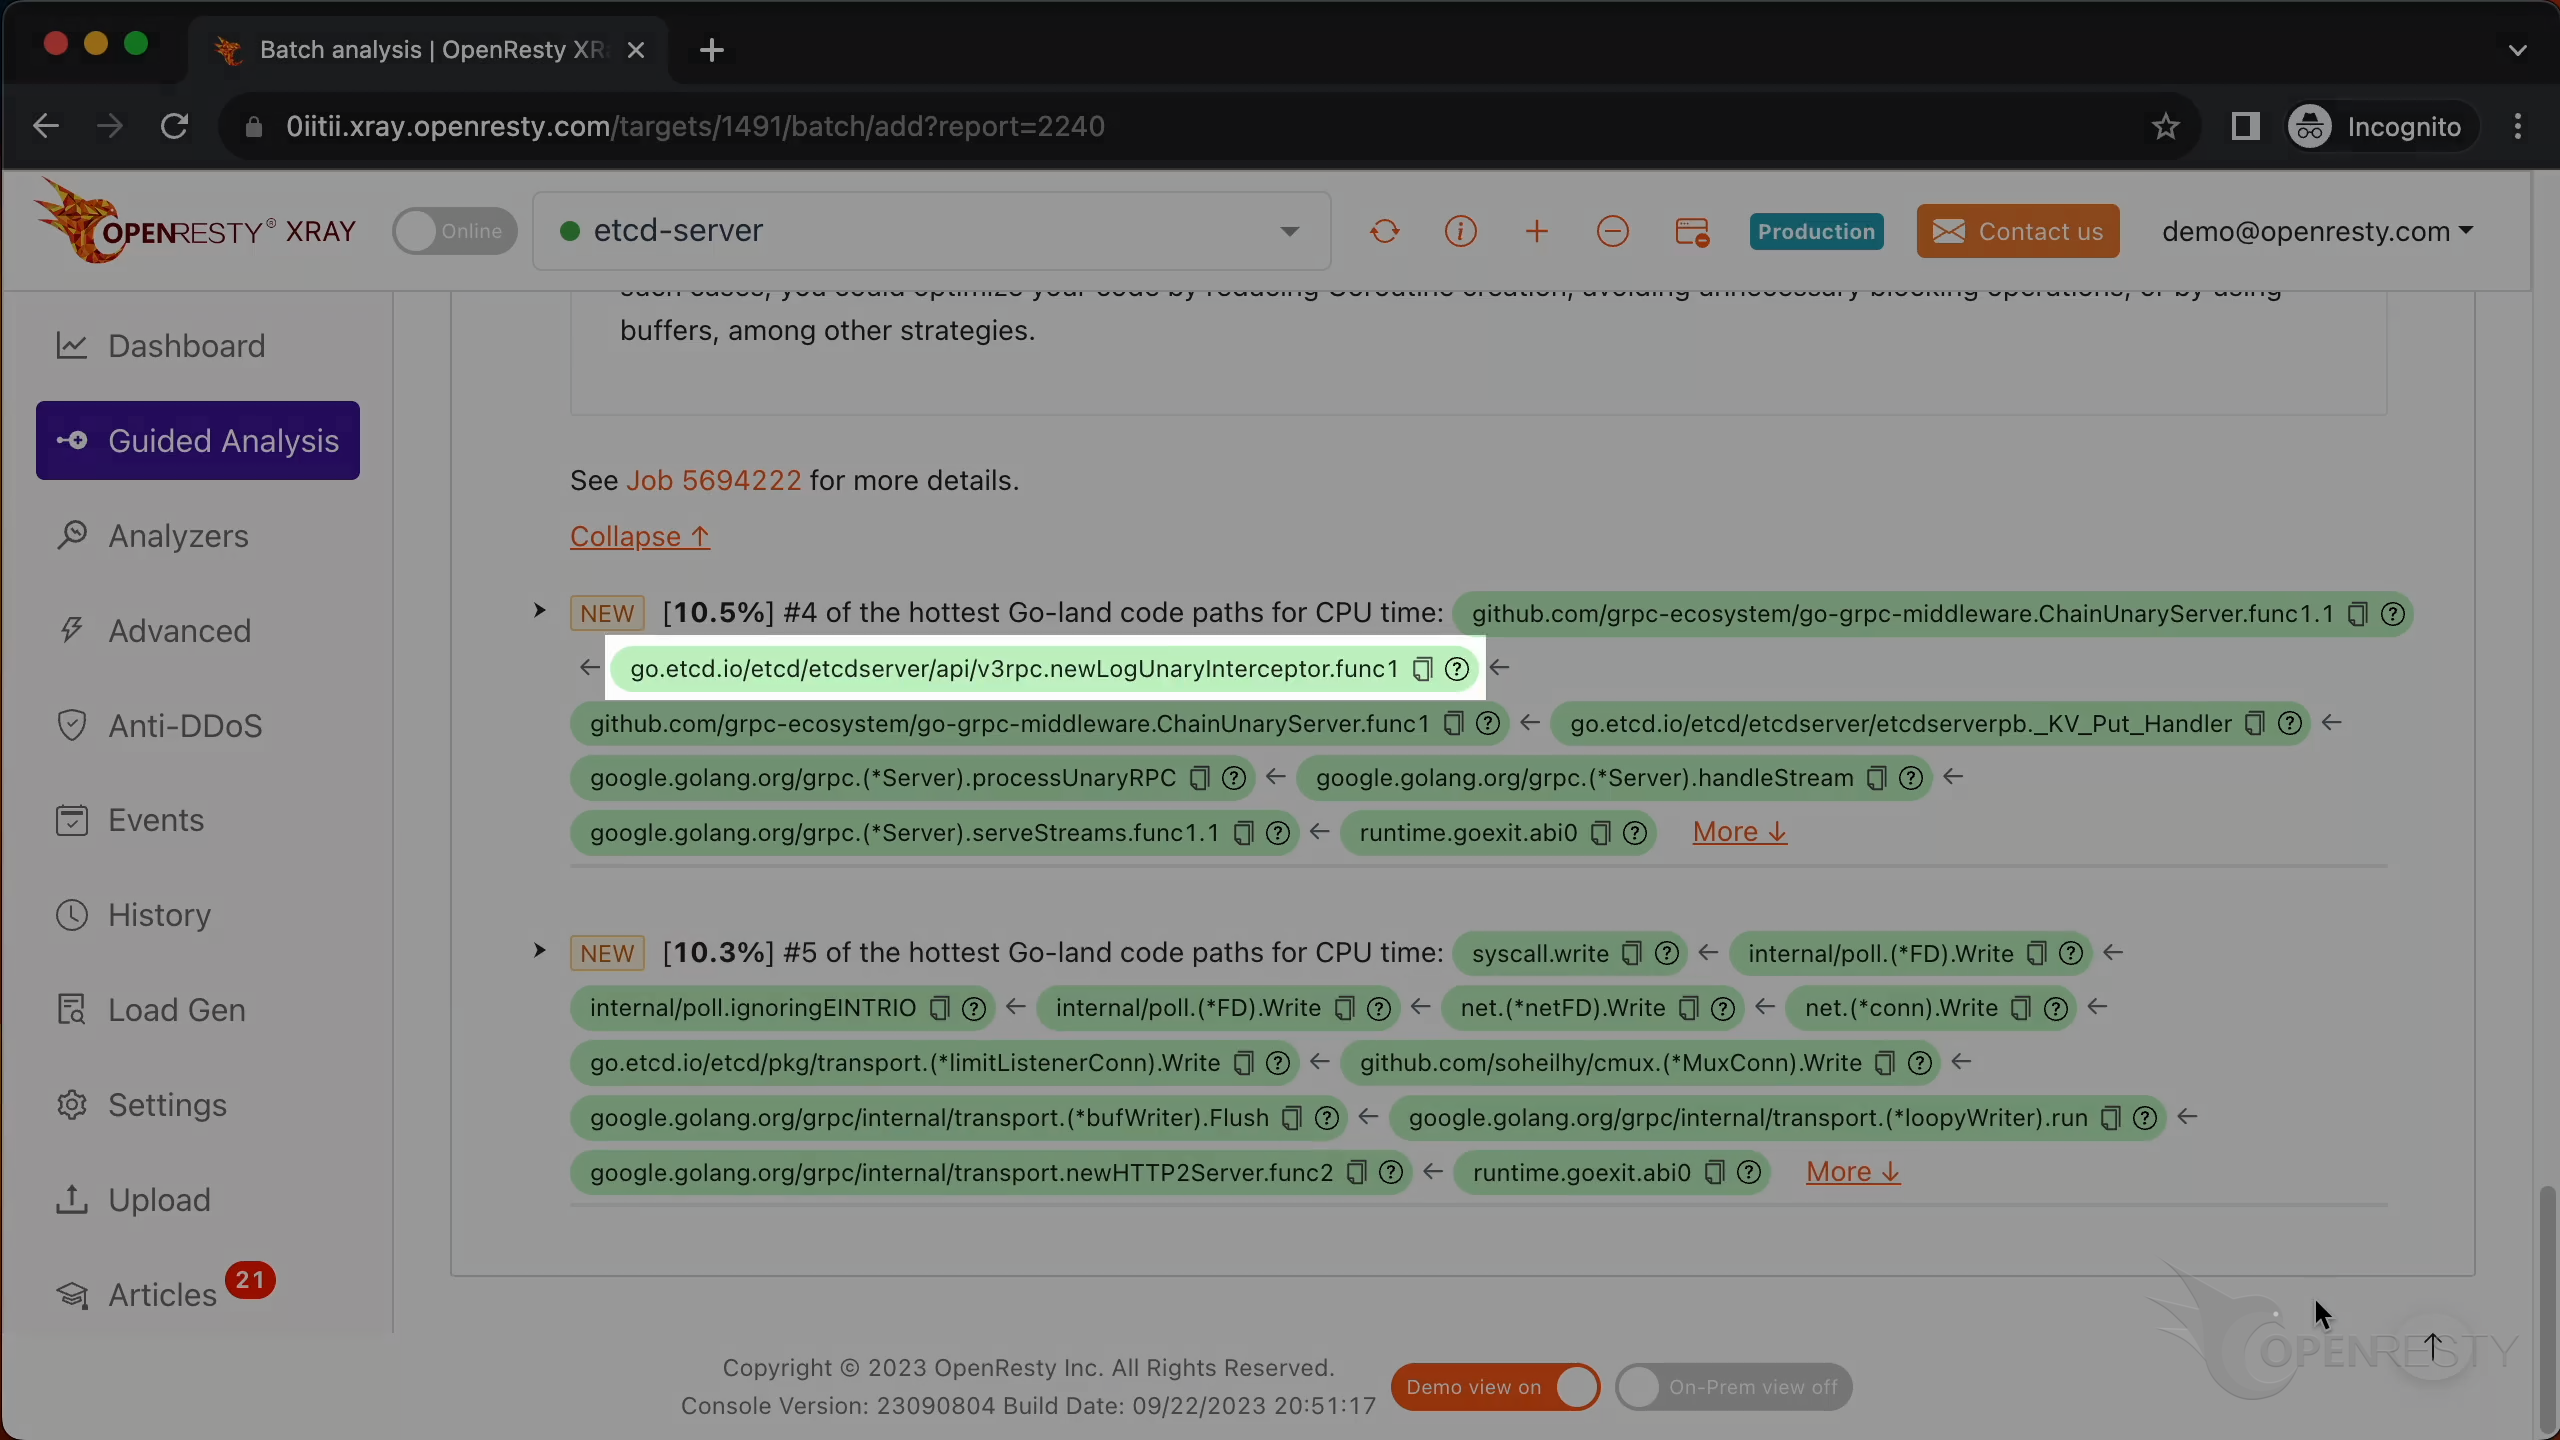
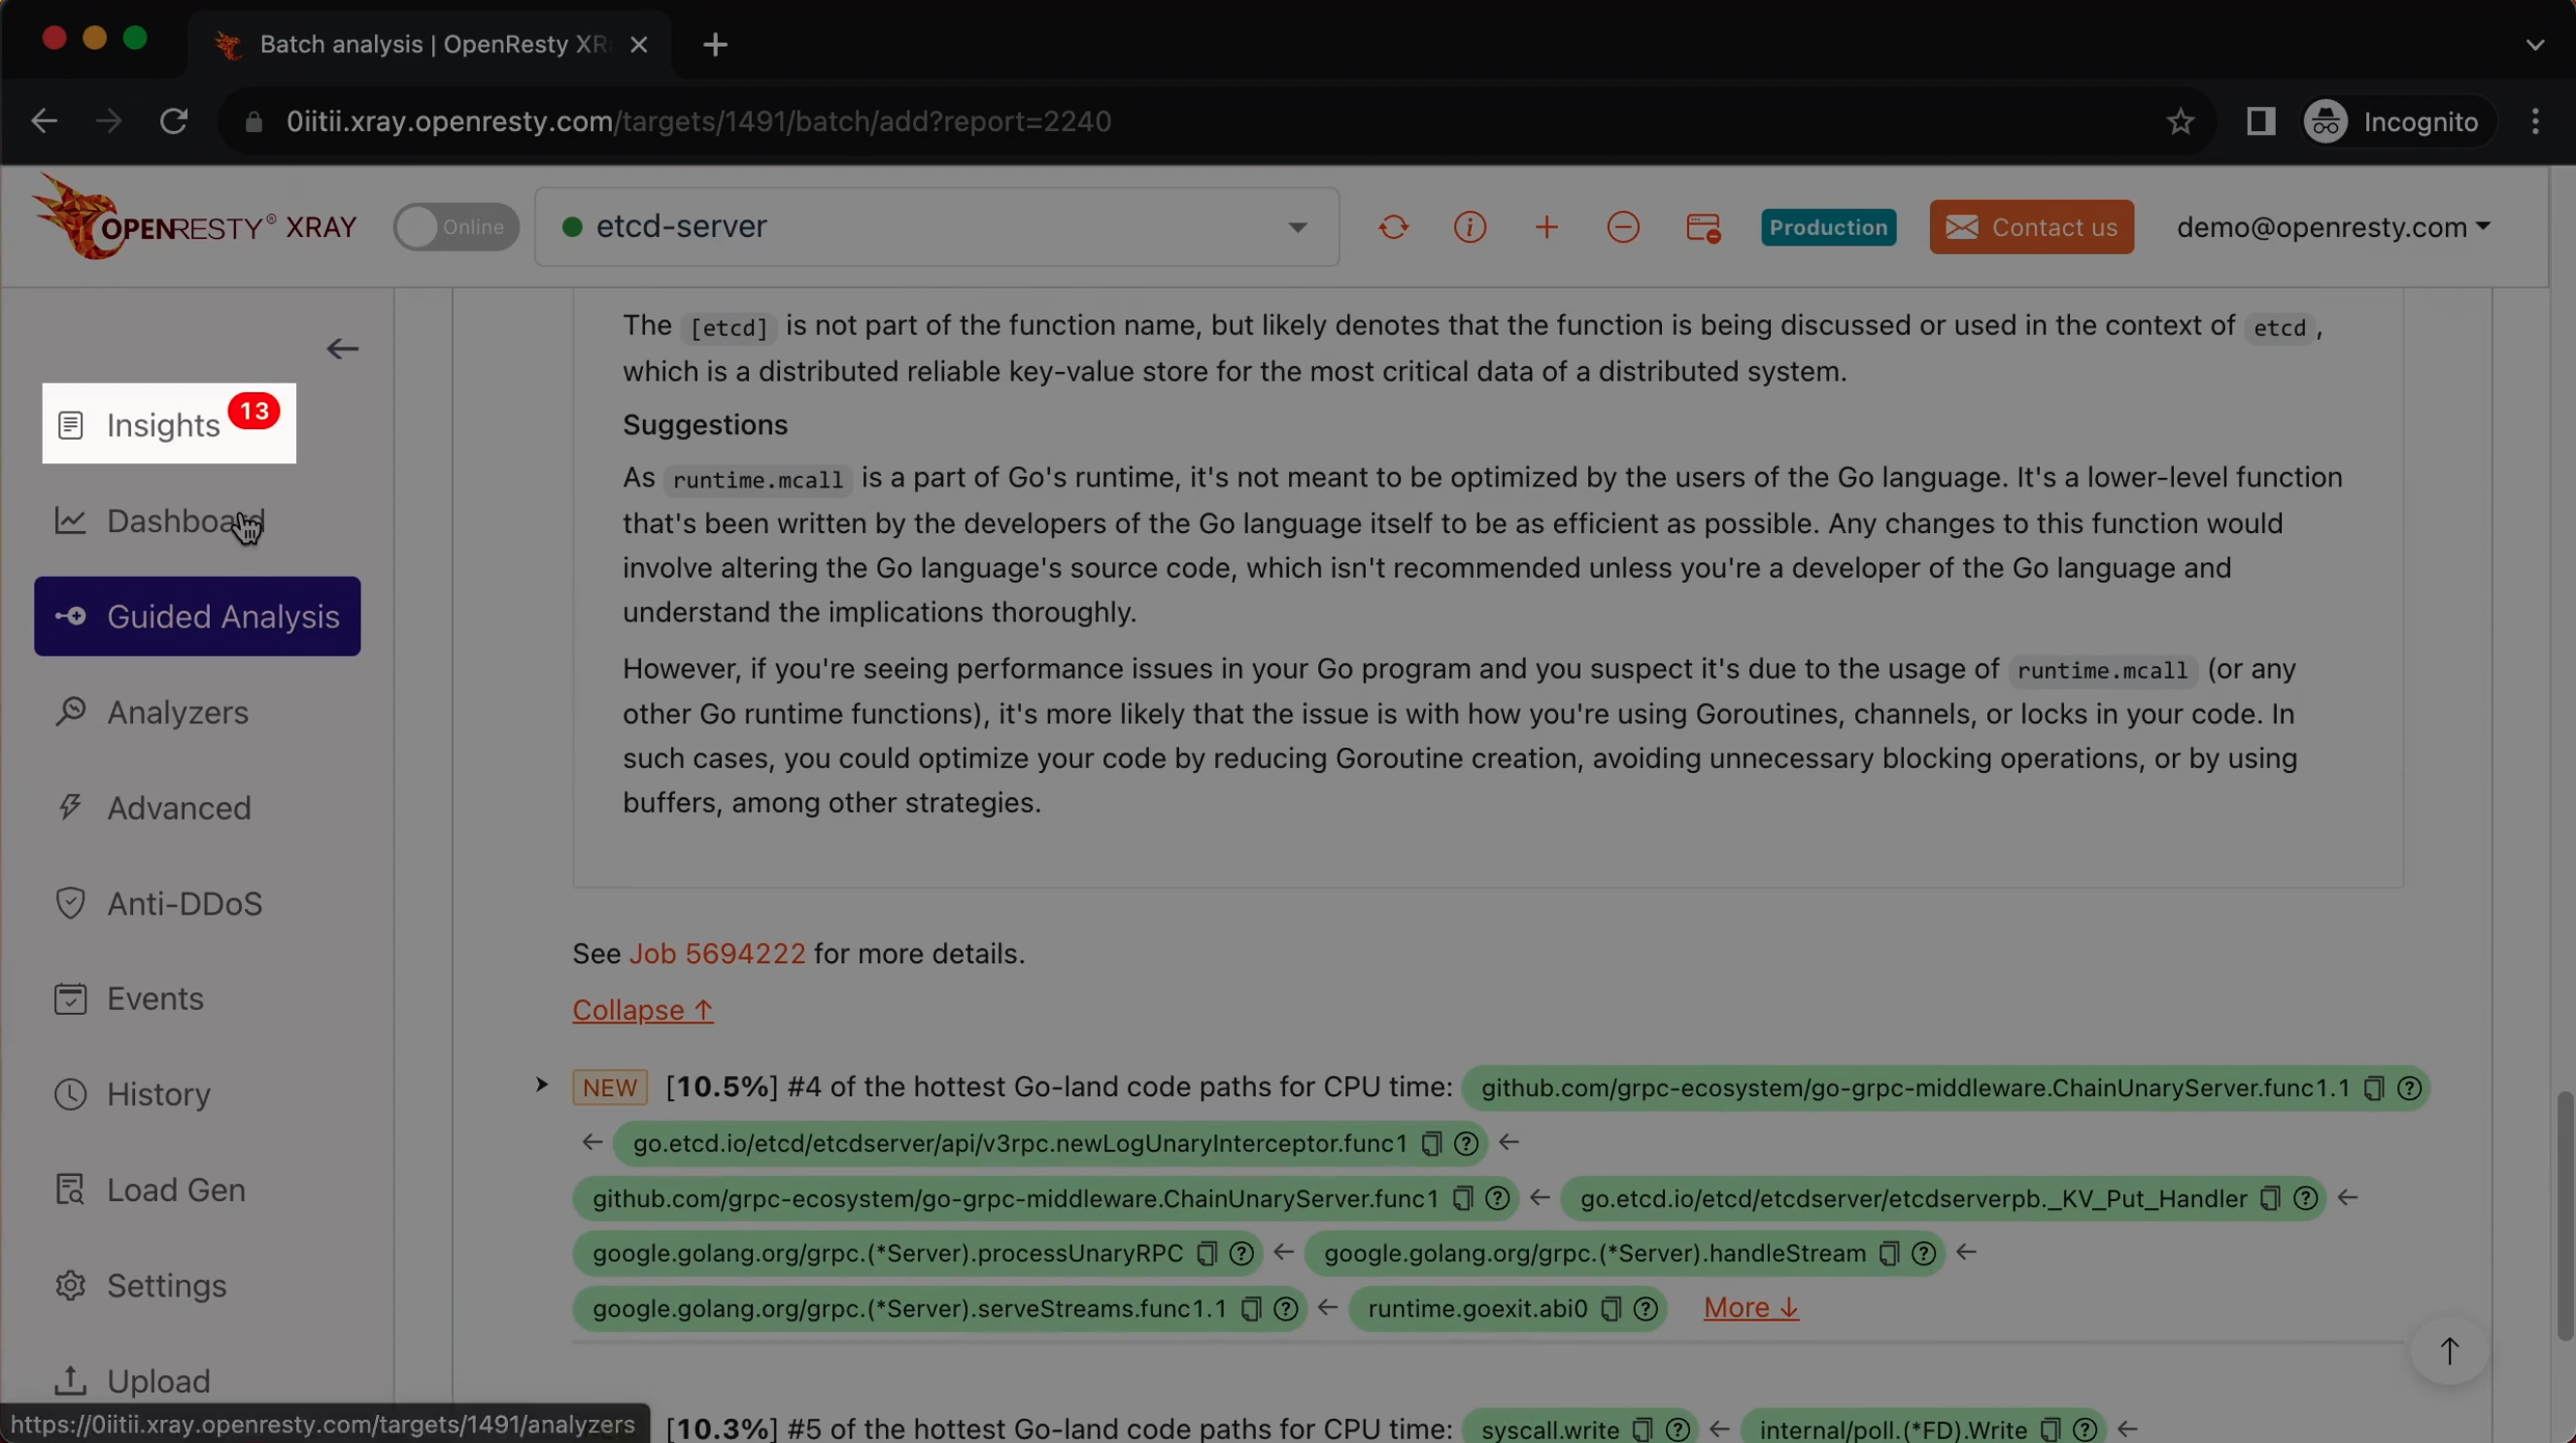
Now we see the fourth hottest Go-code paths.
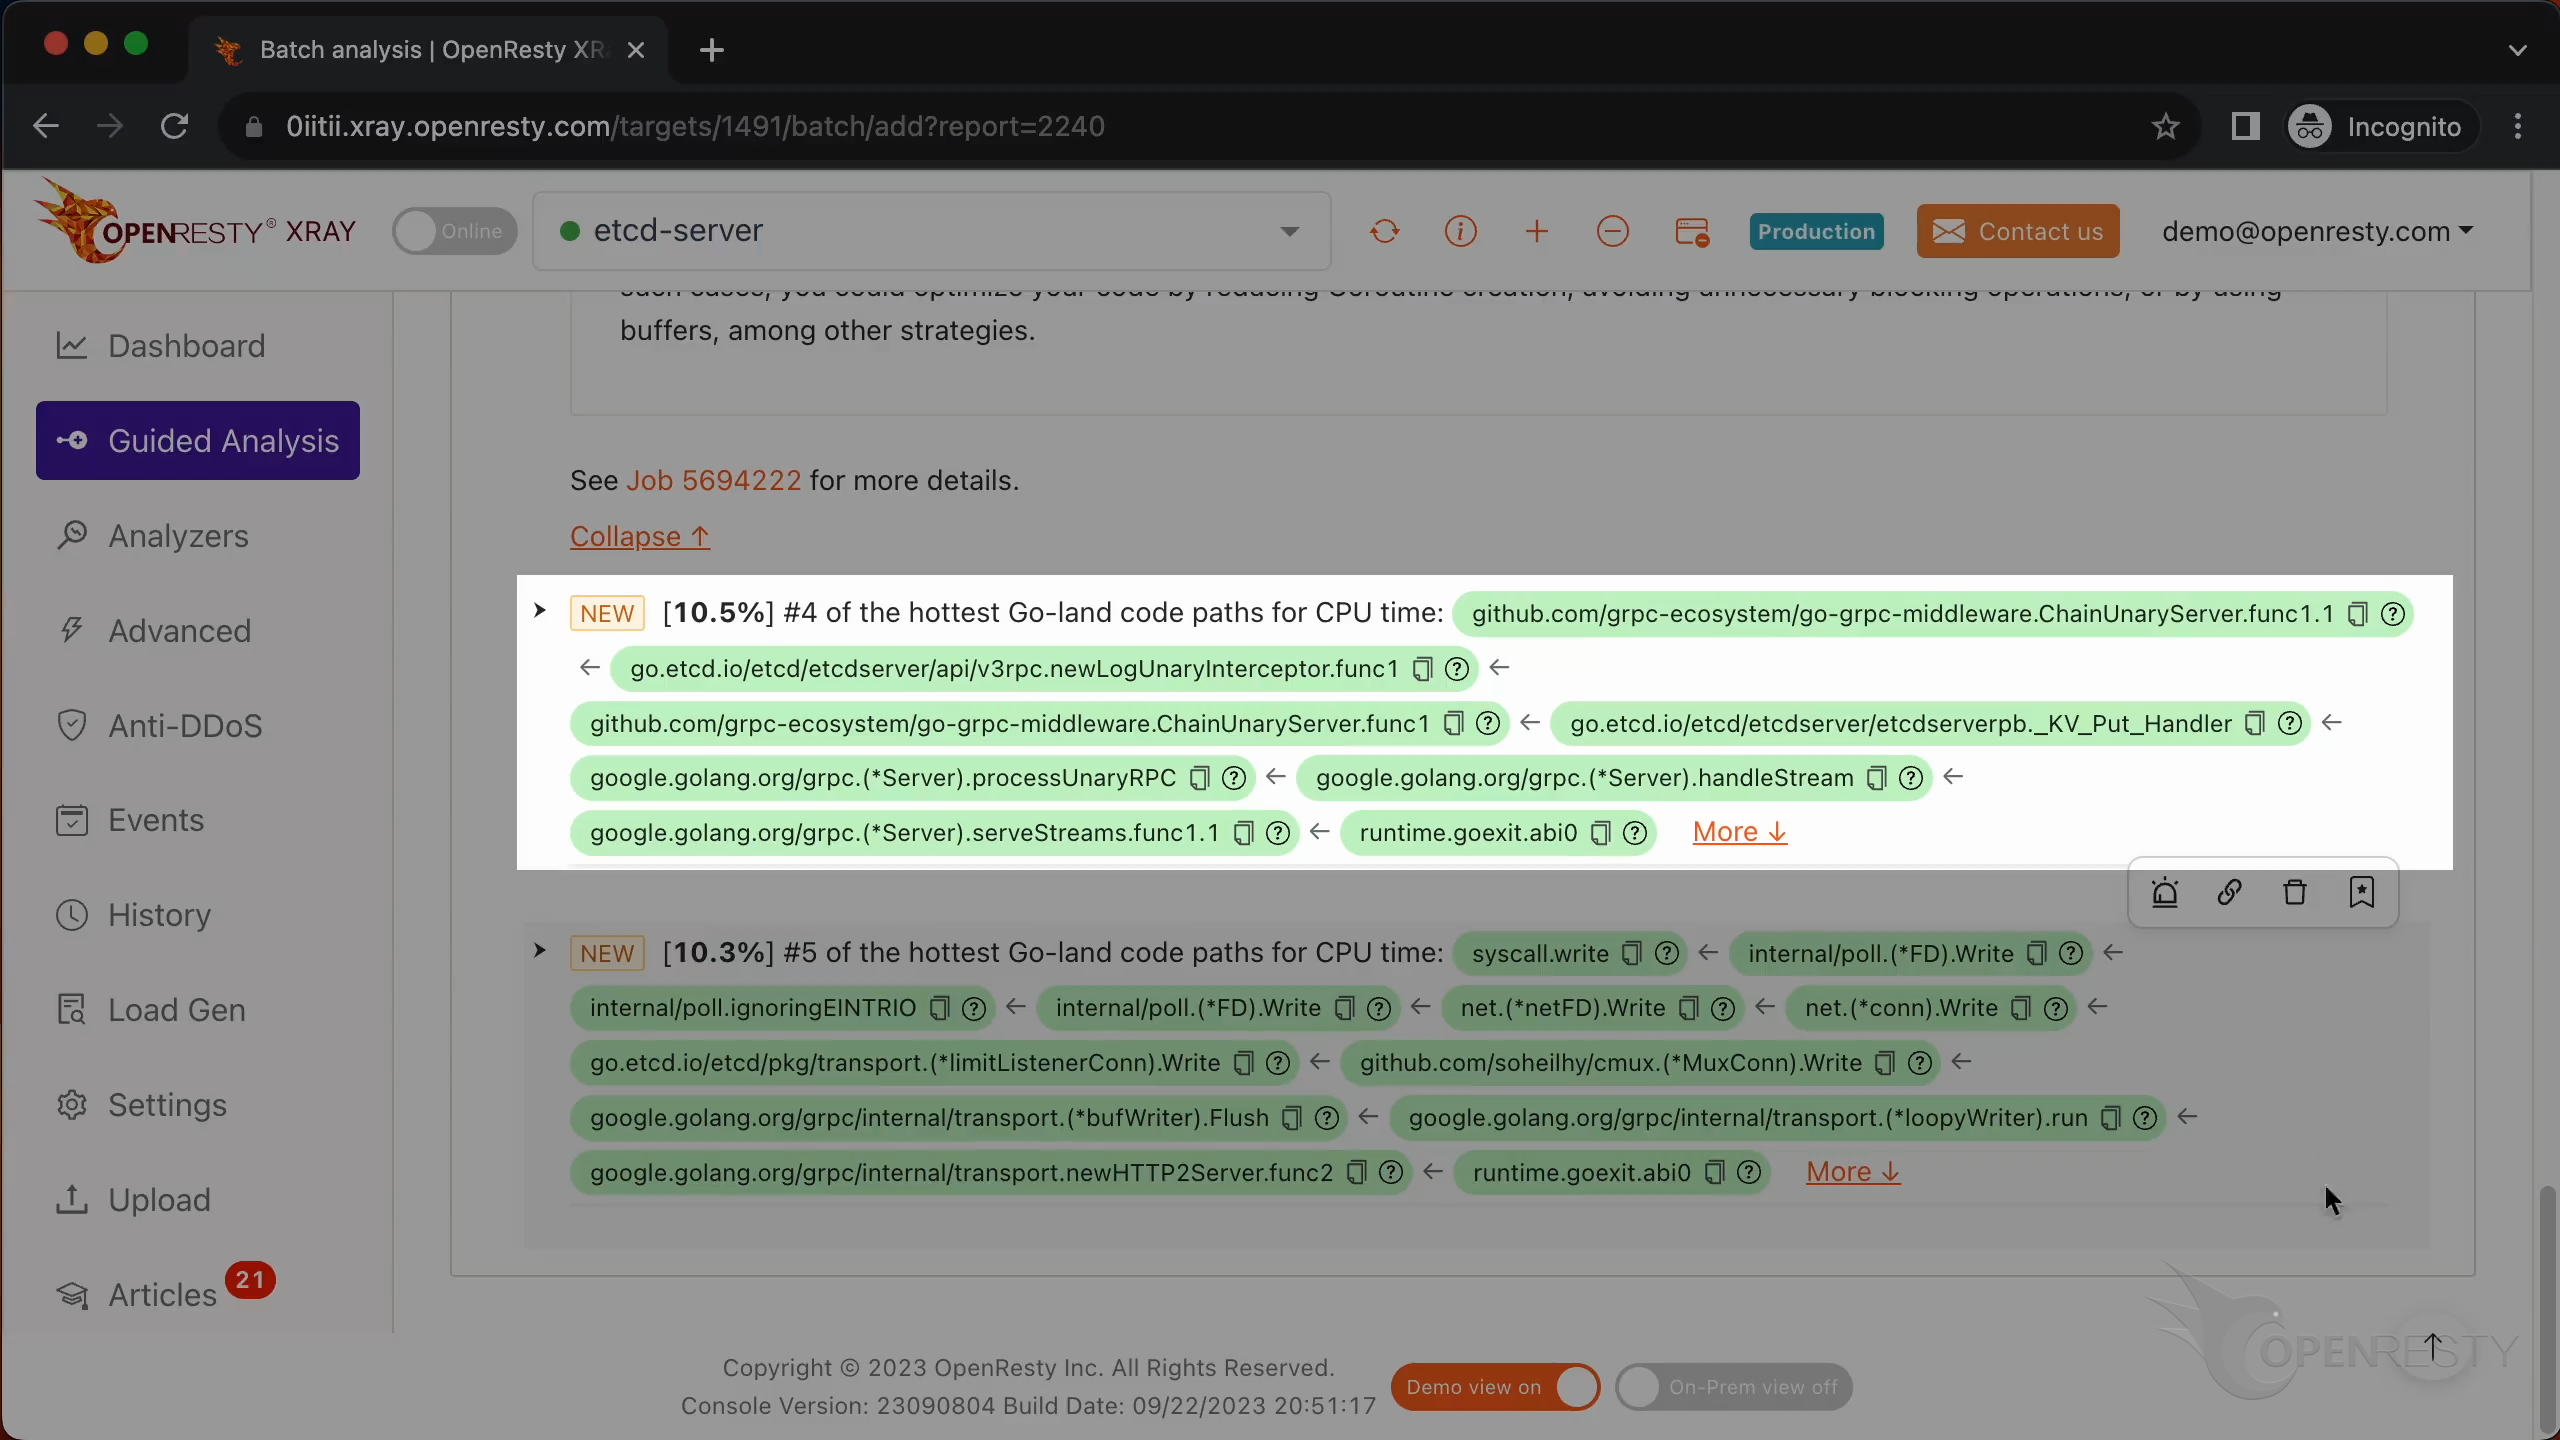
This is for logging every unary gRPC call. And we might want to skip such logging to save CPU time.
Automatic analysis and reports
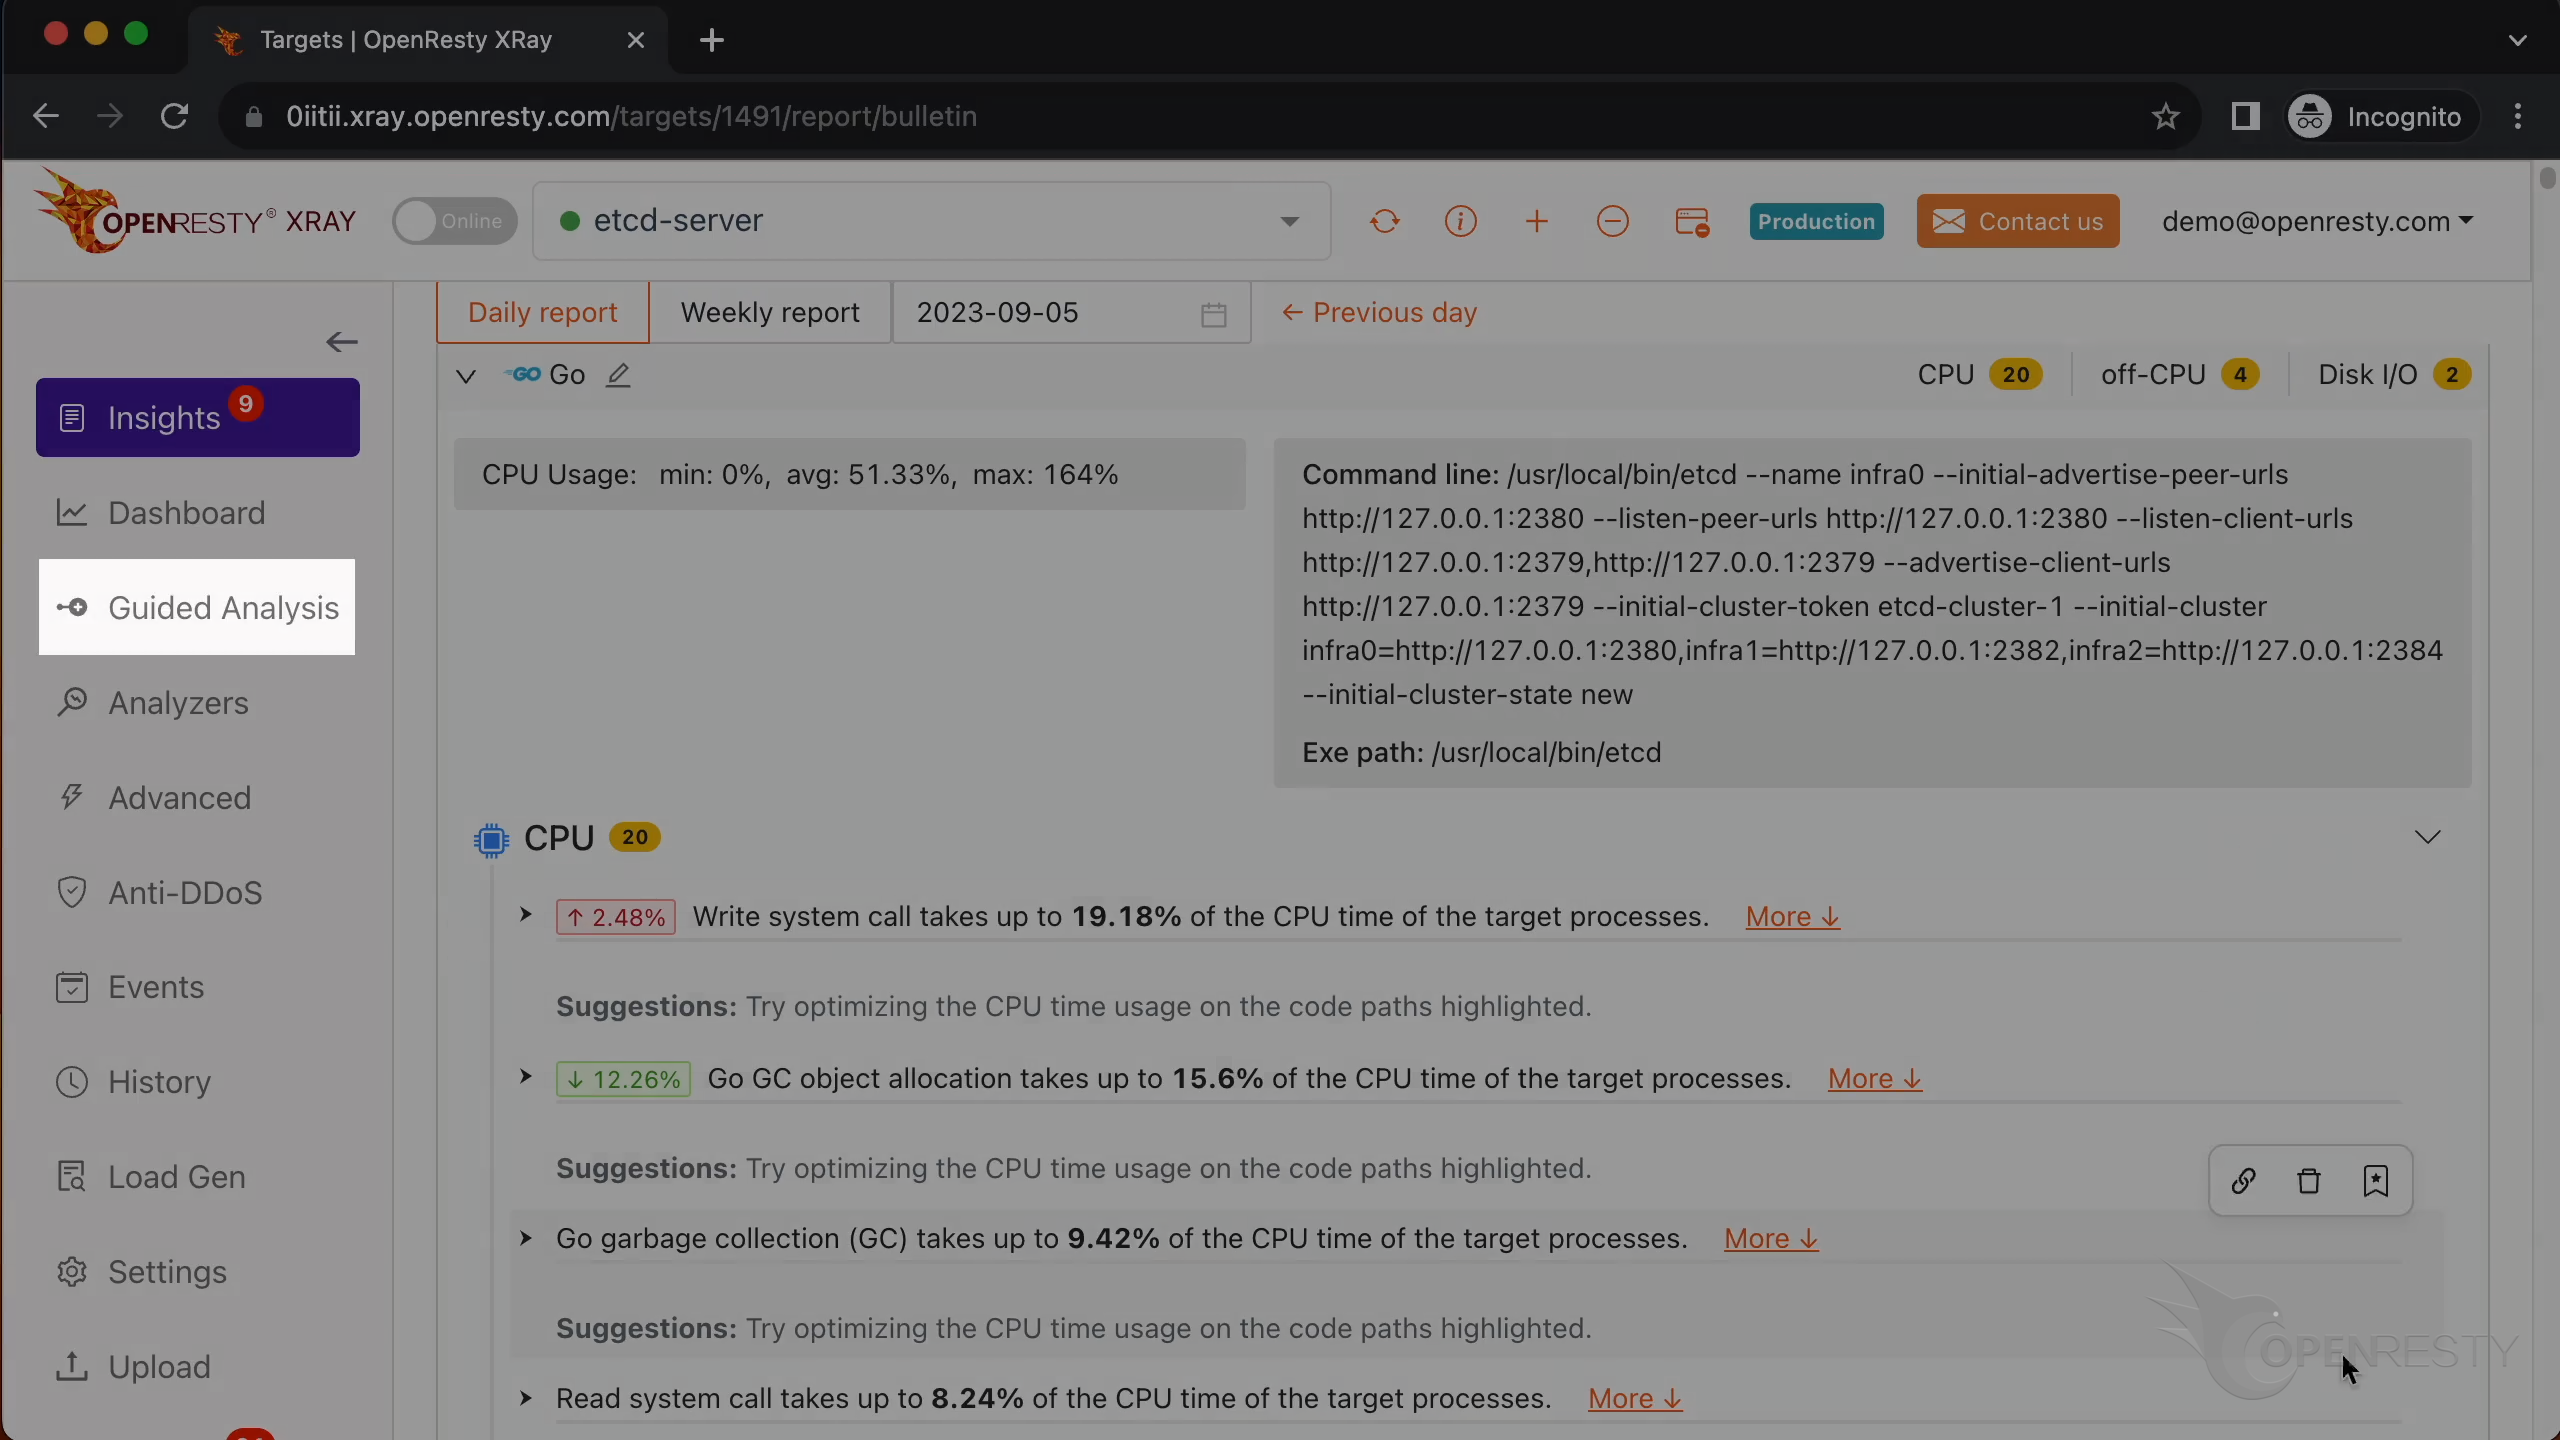
OpenResty XRay can also monitor online processes automatically and show analysis reports. Go to the “Insights” page.
You can find the reports for daily and weekly periods.
So you don’t have to use the “Guided Analysis” feature. Guided analysis is useful for application development and demonstration purposes.
What is OpenResty XRay
OpenResty XRay is a dynamic-tracing product that automatically analyzes your running applications to troubleshoot performance problems, behavioral issues, and security vulnerabilities with actionable suggestions. Under the hood, OpenResty XRay is powered by our Y language targeting various runtimes like Stap+, eBPF+, GDB, and ODB, depending on the contexts.
If you like this tutorial, please subscribe to this blog site and/or our YouTube channel. Thank you!
About The Author
Yichun Zhang (Github handle: agentzh), is the original creator of the OpenResty® open-source project and the CEO of OpenResty Inc..
Yichun is one of the earliest advocates and leaders of “open-source technology”. He worked at many internationally renowned tech companies, such as Cloudflare, Yahoo!. He is a pioneer of “edge computing”, “dynamic tracing” and “machine coding”, with over 22 years of programming and 16 years of open source experience. Yichun is well-known in the open-source space as the project leader of OpenResty®, adopted by more than 40 million global website domains.
OpenResty Inc., the enterprise software start-up founded by Yichun in 2017, has customers from some of the biggest companies in the world. Its flagship product, OpenResty XRay, is a non-invasive profiling and troubleshooting tool that significantly enhances and utilizes dynamic tracing technology. And its OpenResty Edge product is a powerful distributed traffic management and private CDN software product.
As an avid open-source contributor, Yichun has contributed more than a million lines of code to numerous open-source projects, including Linux kernel, Nginx, LuaJIT, GDB, SystemTap, LLVM, Perl, etc. He has also authored more than 60 open-source software libraries.
Related Articles
OpenResty XRay Sep 1, 2023
")
OpenResty XRay Aug 23, 2023
")
OpenResty XRay Dec 25, 2023
")
OpenResty XRay Dec 7, 2023

OpenResty XRay Sep 28, 2023
")


")
")
")

")