Erlang High CPU Usage: PCRE Regex Bottleneck Traced with Flame Graphs
When an Erlang application drives CPU usage past 200%, the bottleneck is often hidden deep in the BEAM VM runtime. We profiled a live Erlang process with OpenResty XRay and traced the Erlang high CPU usage to PCRE regex backtracking inside check_resp_content — specifically the erts_pcre_exec C function that wraps the PCRE library in Erlang’s runtime. No code changes, no recompilation, and no restarts were required.
This walkthrough shows the complete profiling process — from observing an Erlang process consuming 200%+ CPU in top, through Erlang-level and C-level flame graph analysis, to pinpointing the exact source file and line number responsible.
Observing 200%+ CPU in an Erlang Process
Erlang high CPU usage typically surfaces in top or htop output as a busy BEAM VM process — often named beam.smp, or, as in this case, showing the name of the escript that launched it. Either way, the real question is which Erlang code path is responsible.
Run the top command to check the CPU usage.
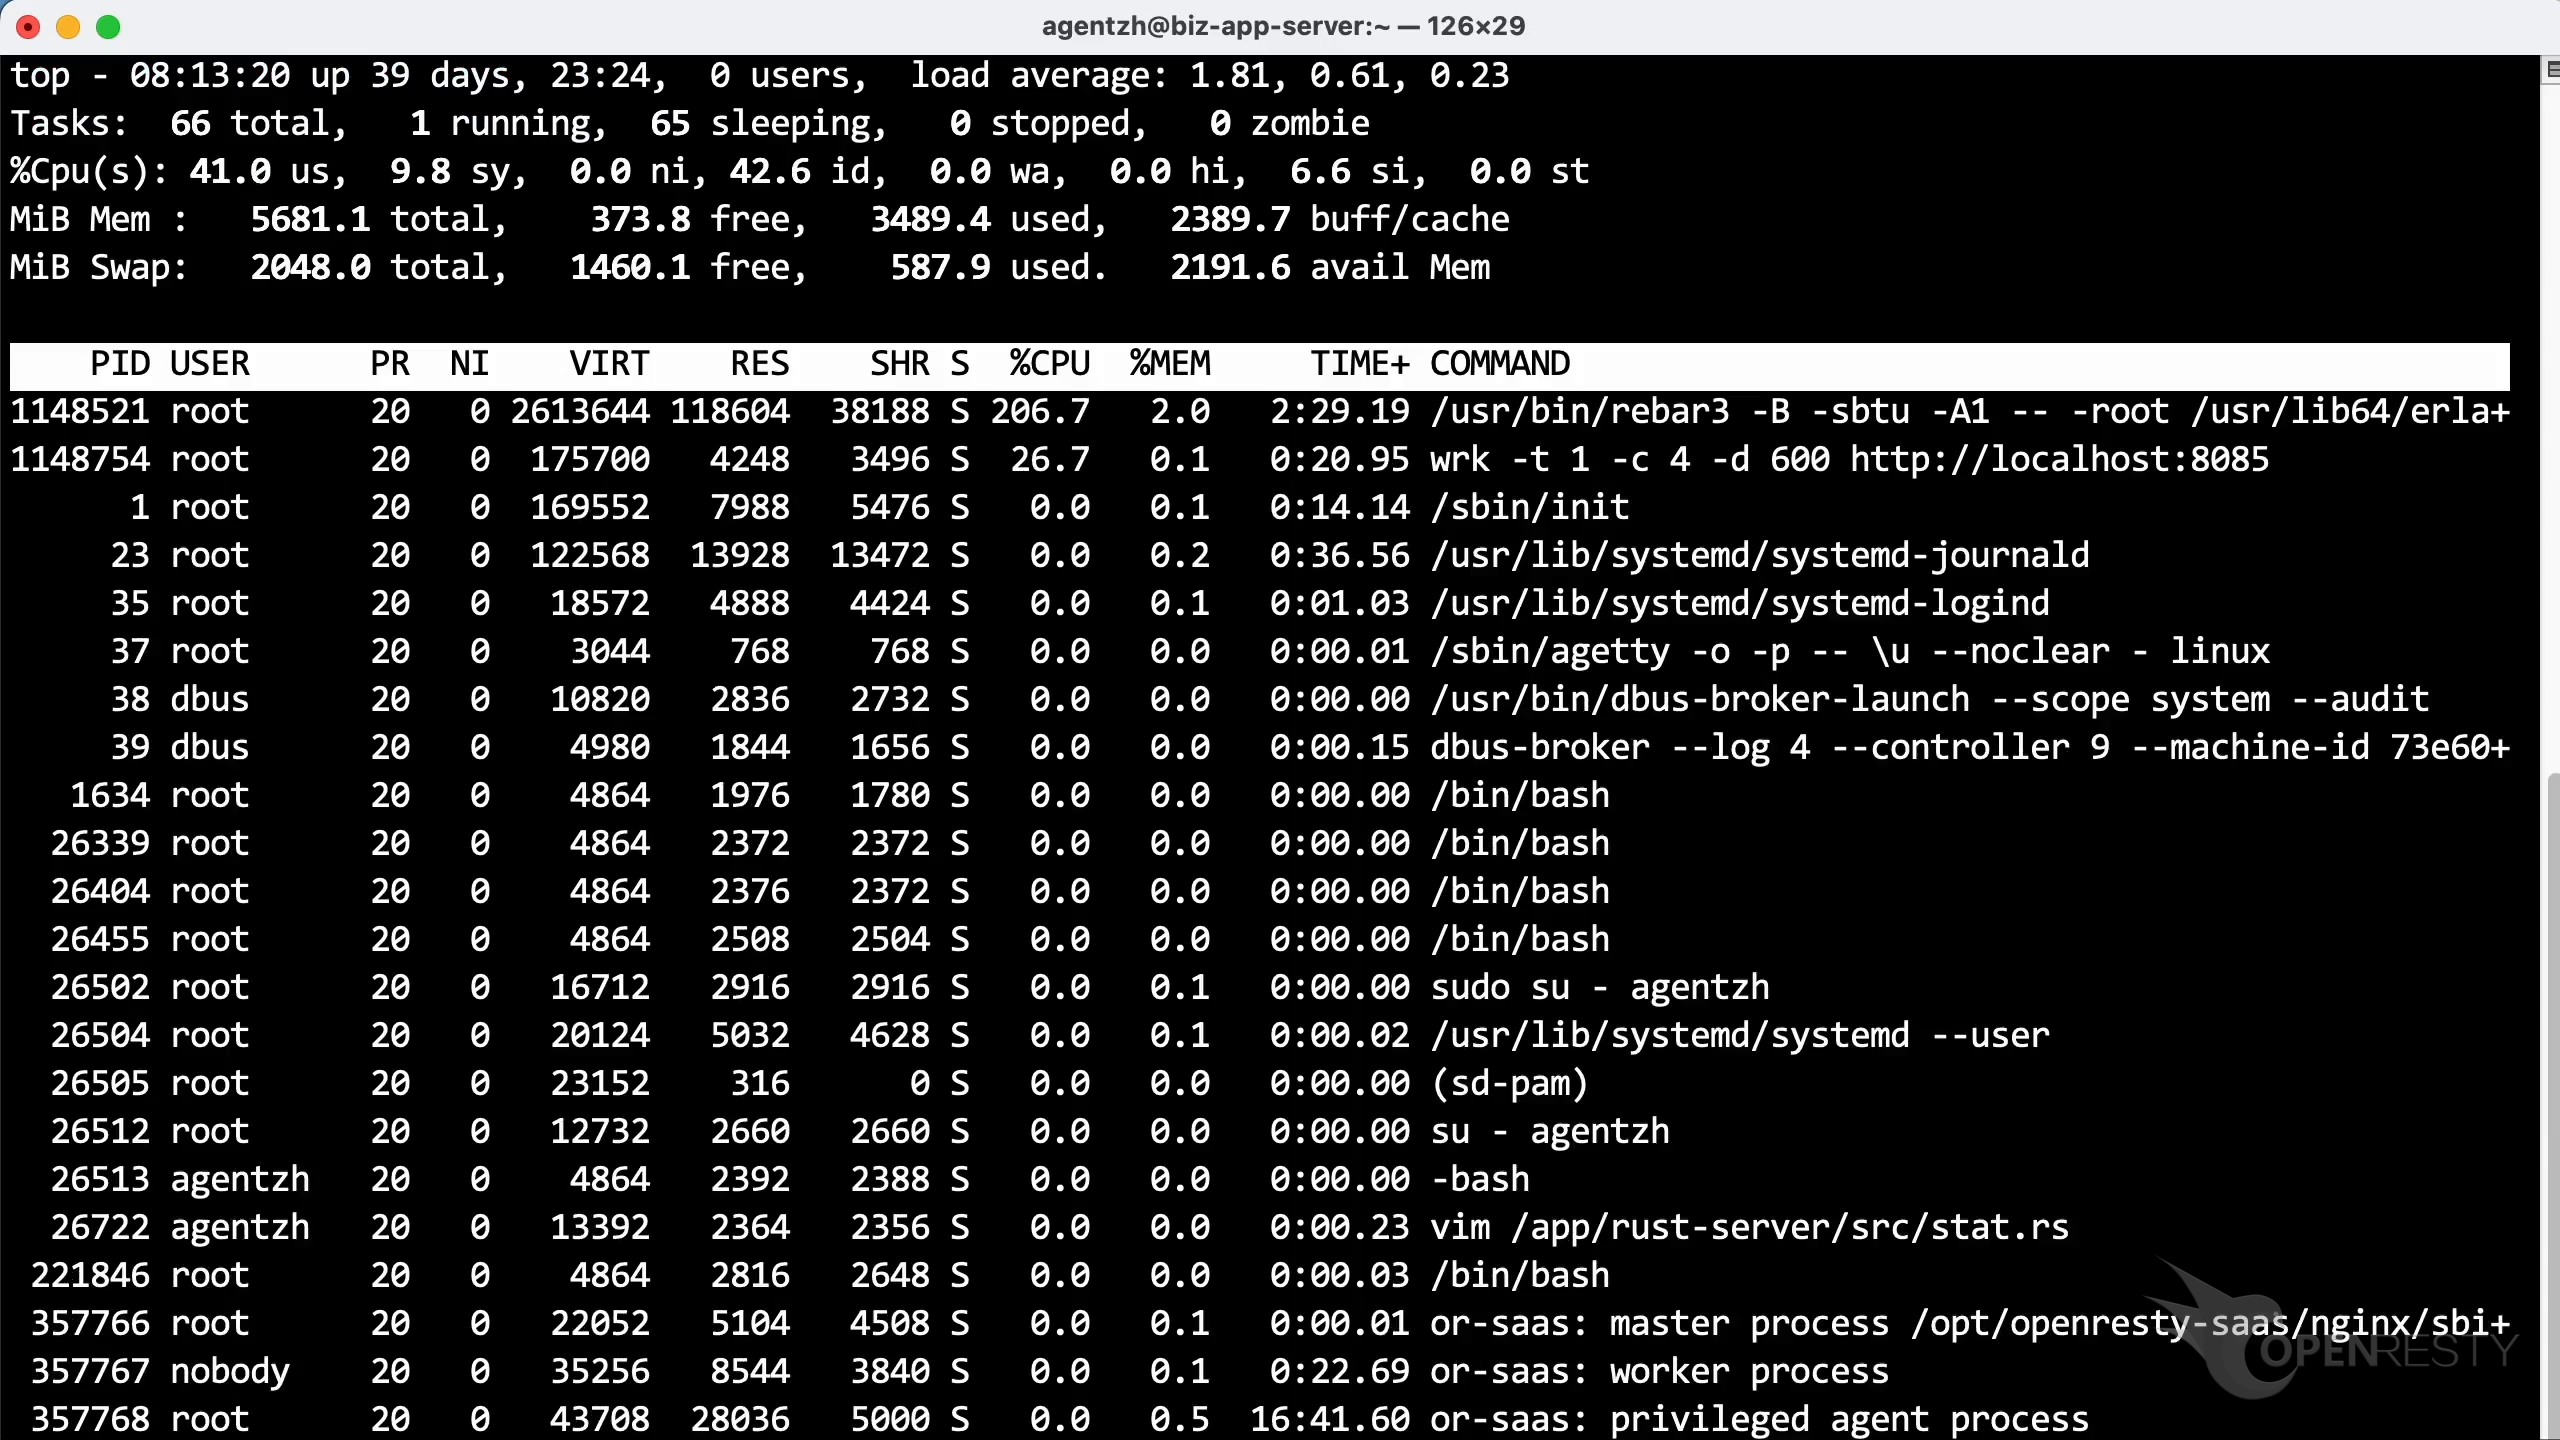
As shown, this process consumes more than 200% of CPU cores.
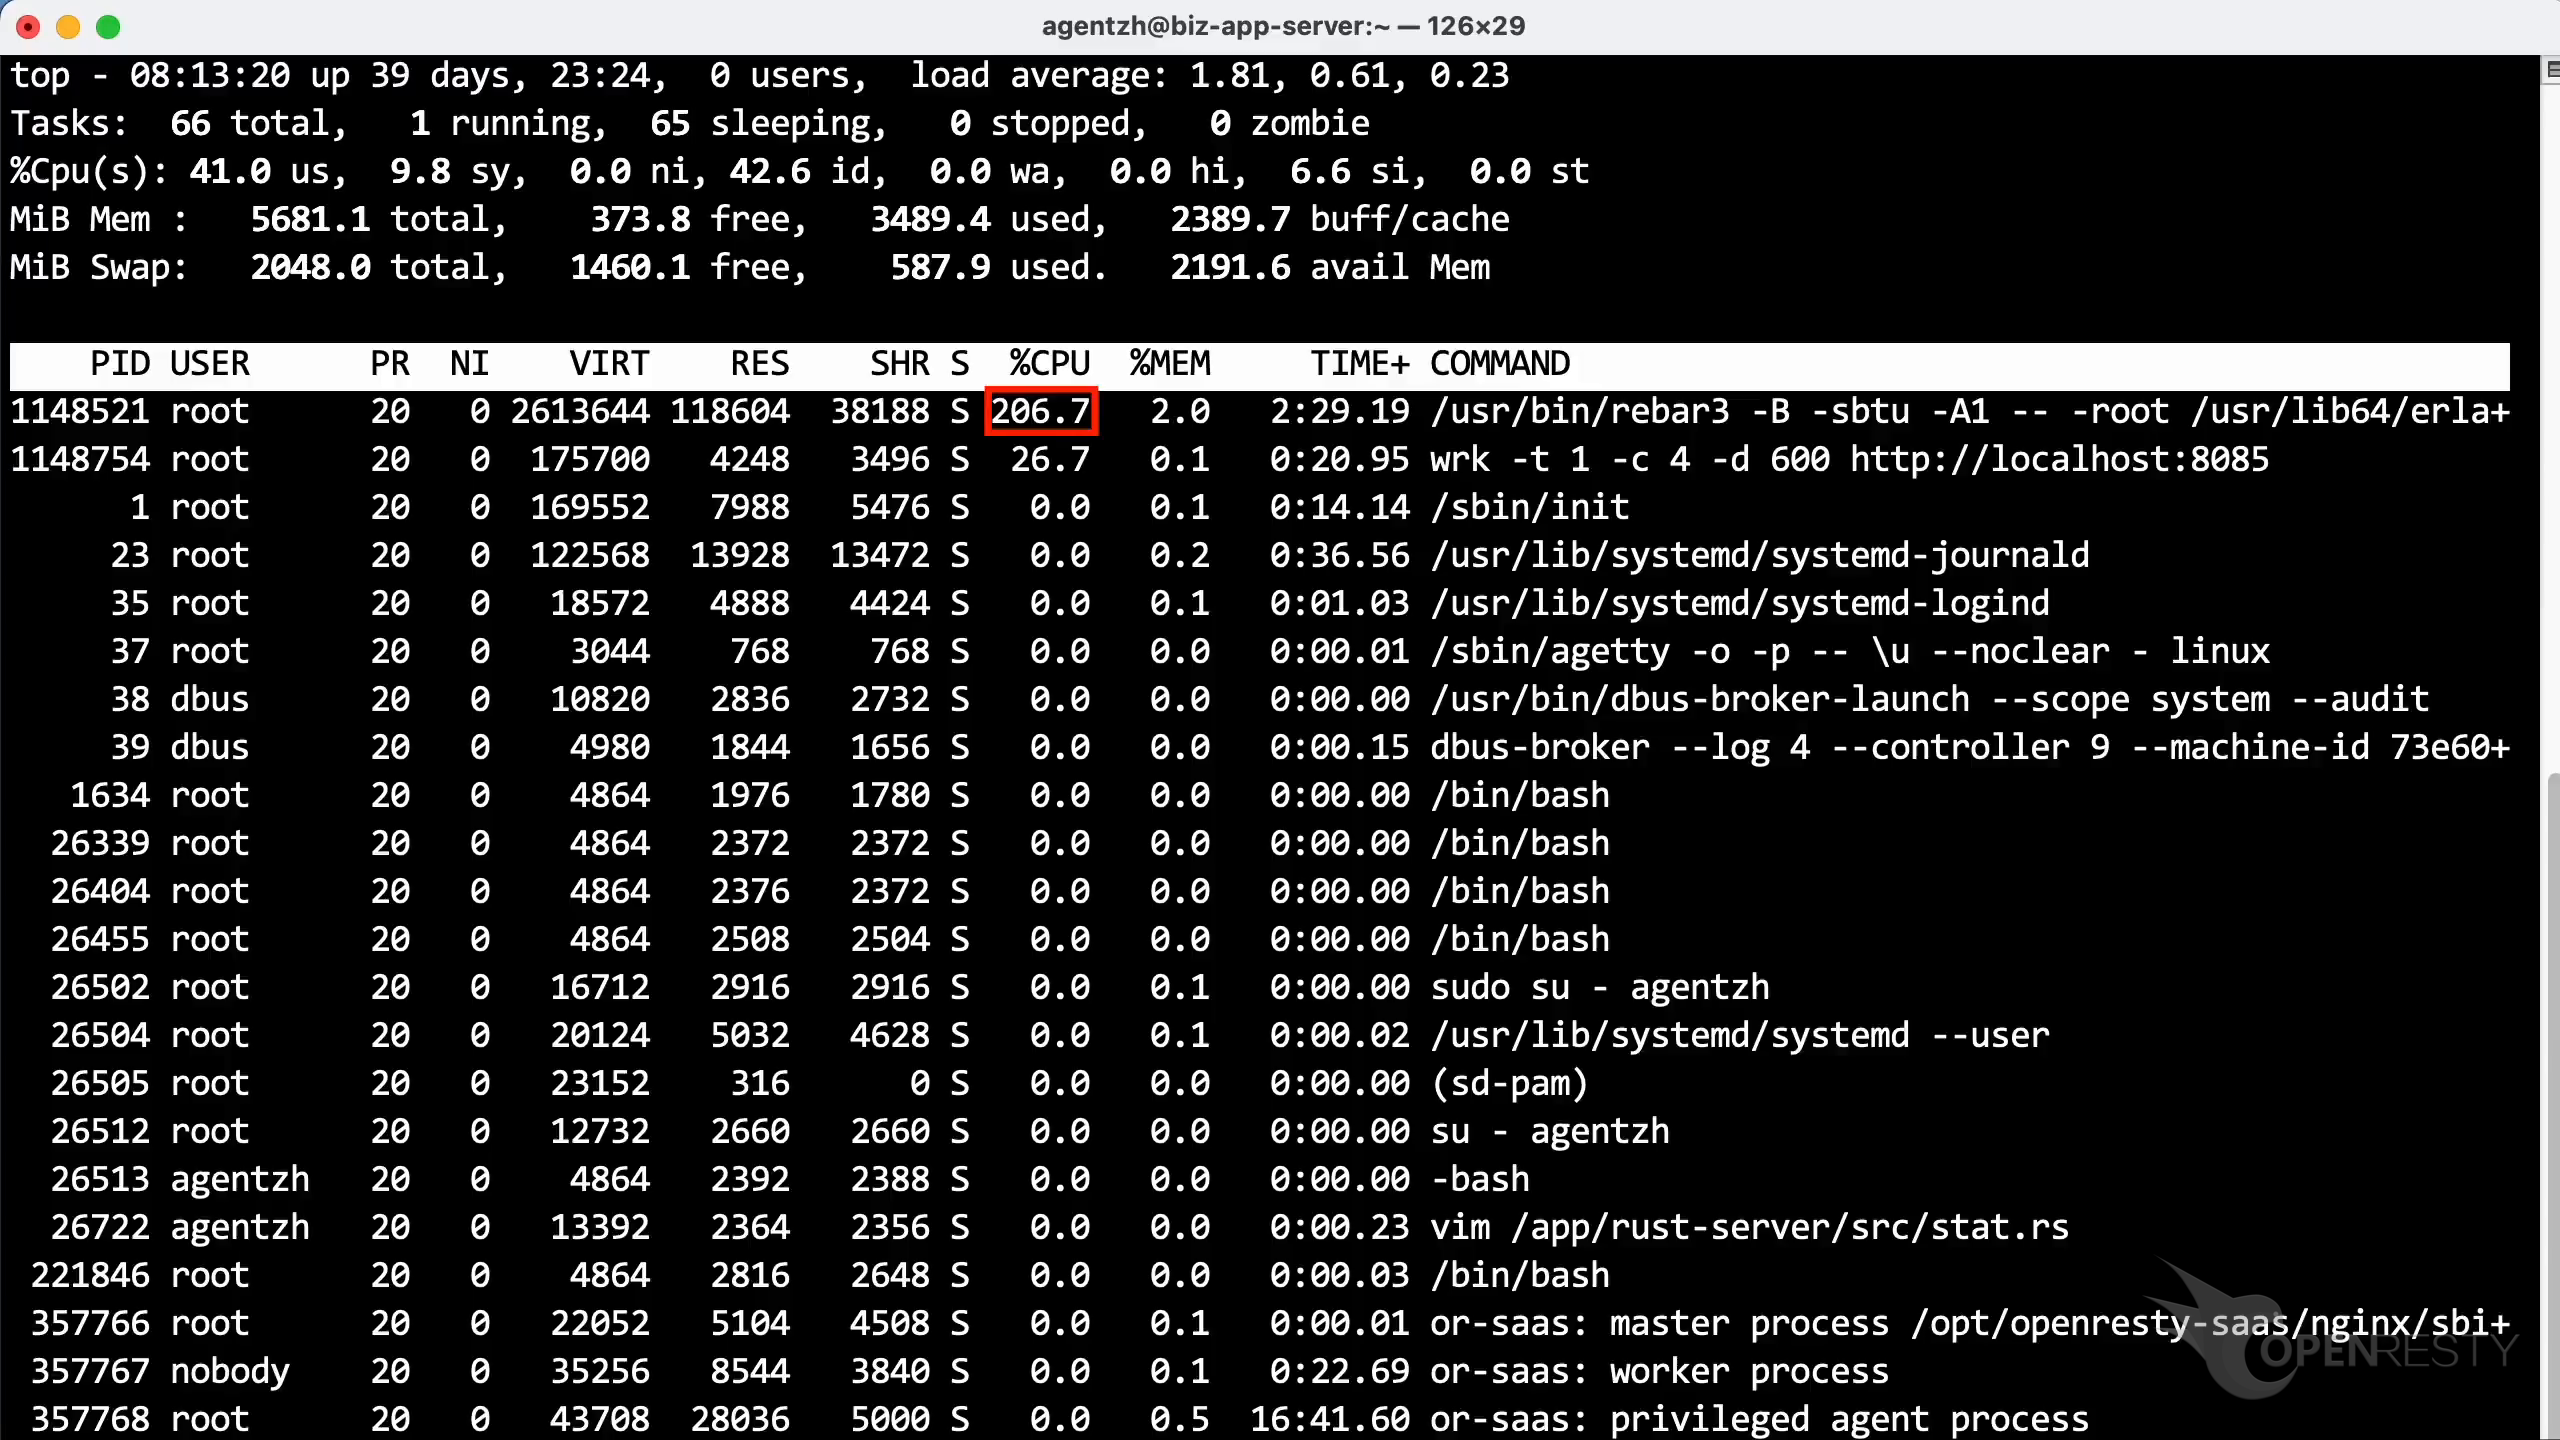
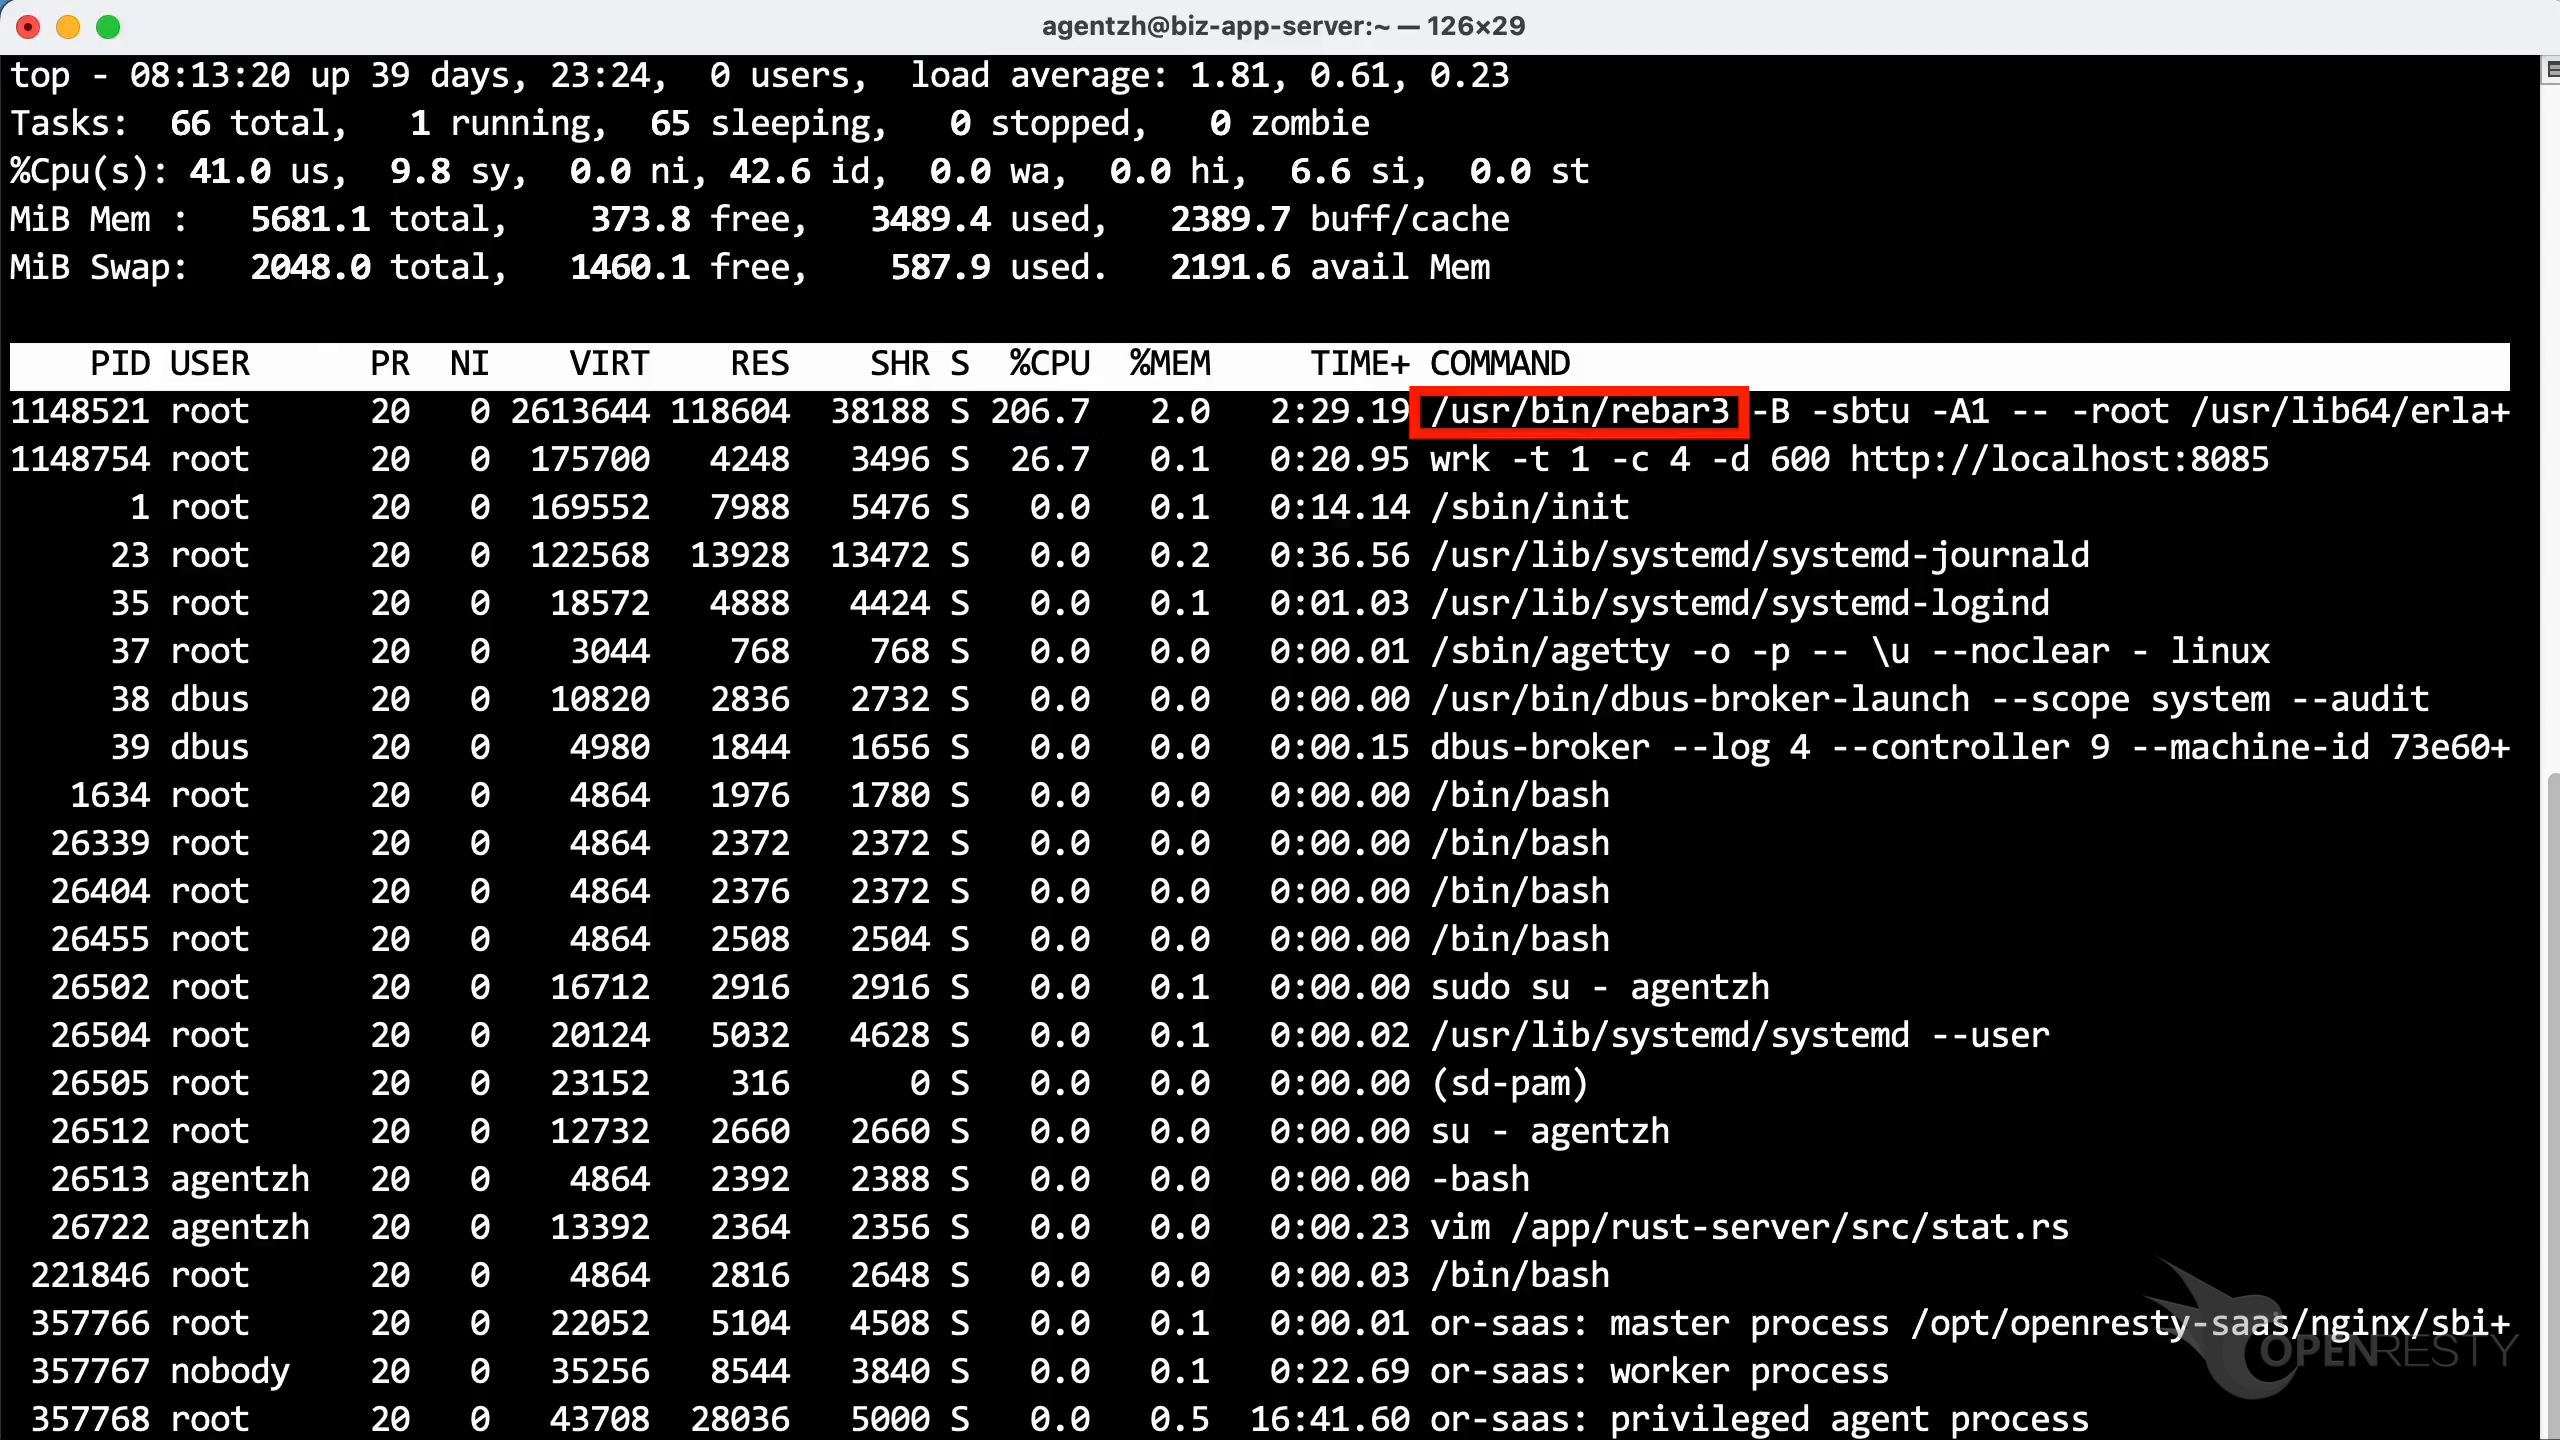
It is called rebar3. rebar3 is a tool for managing and building Erlang projects. Here, we use it to start the project.
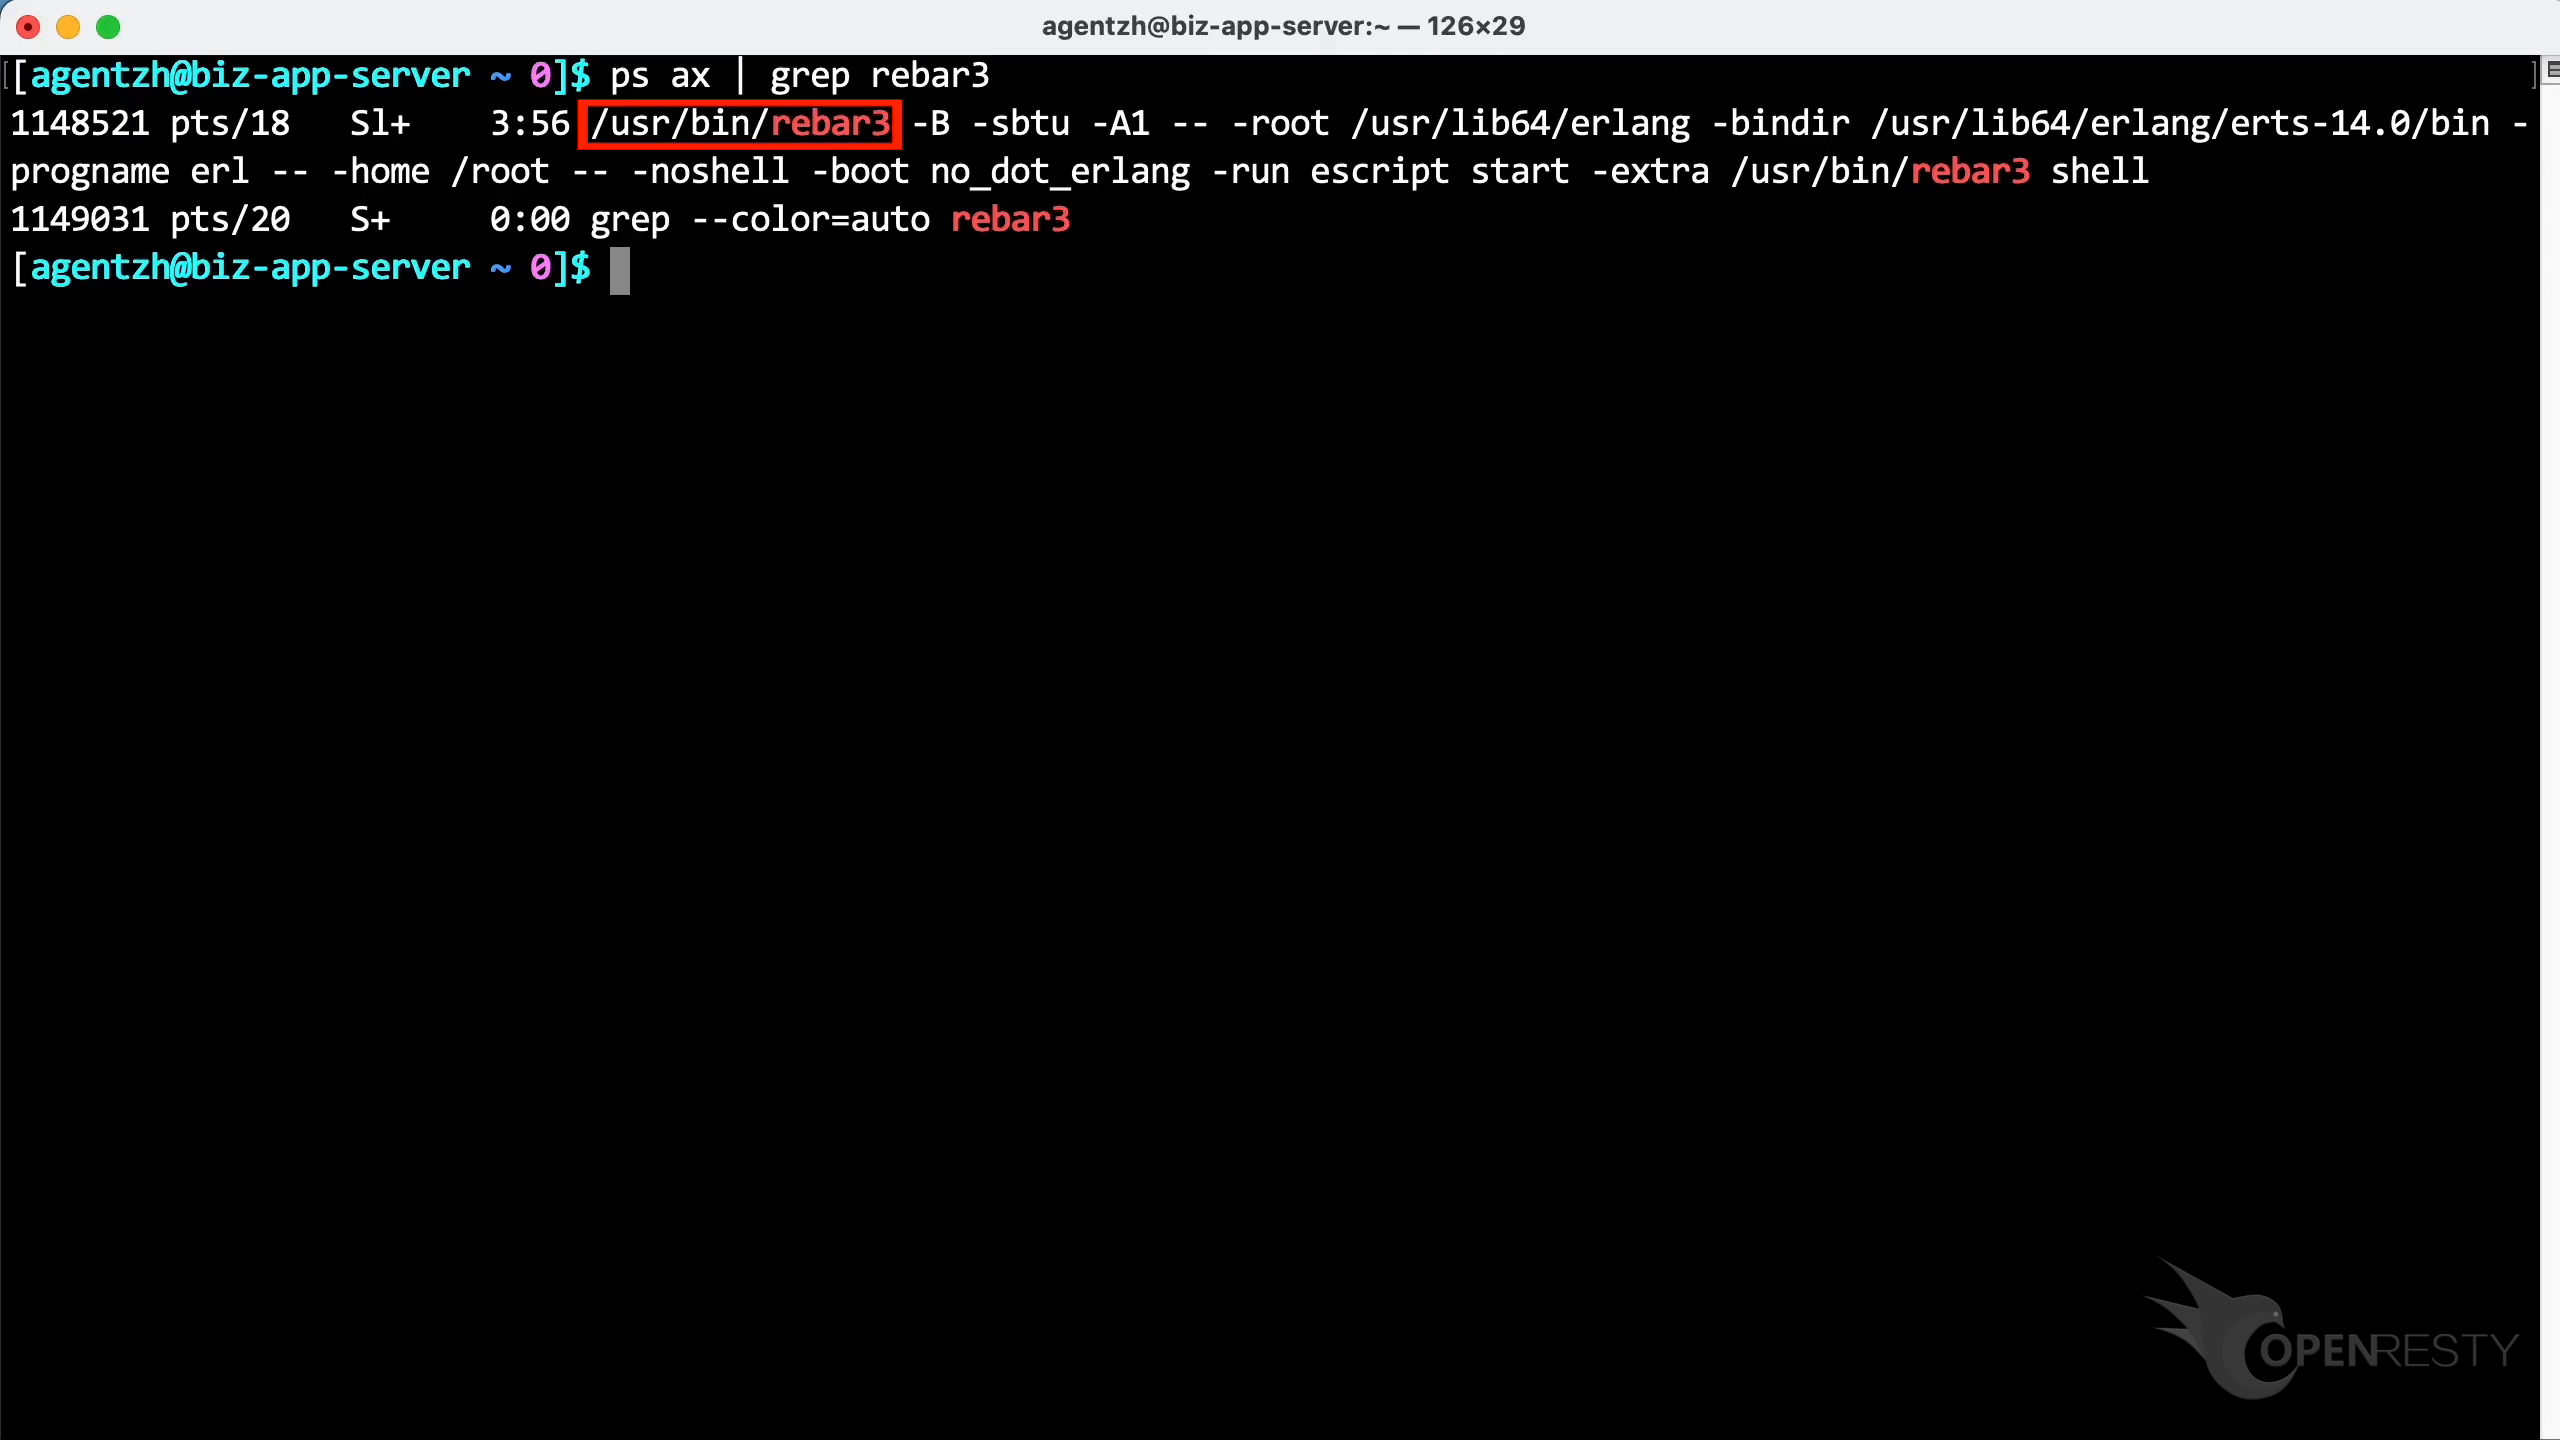
The ps command reveals more details about this process.
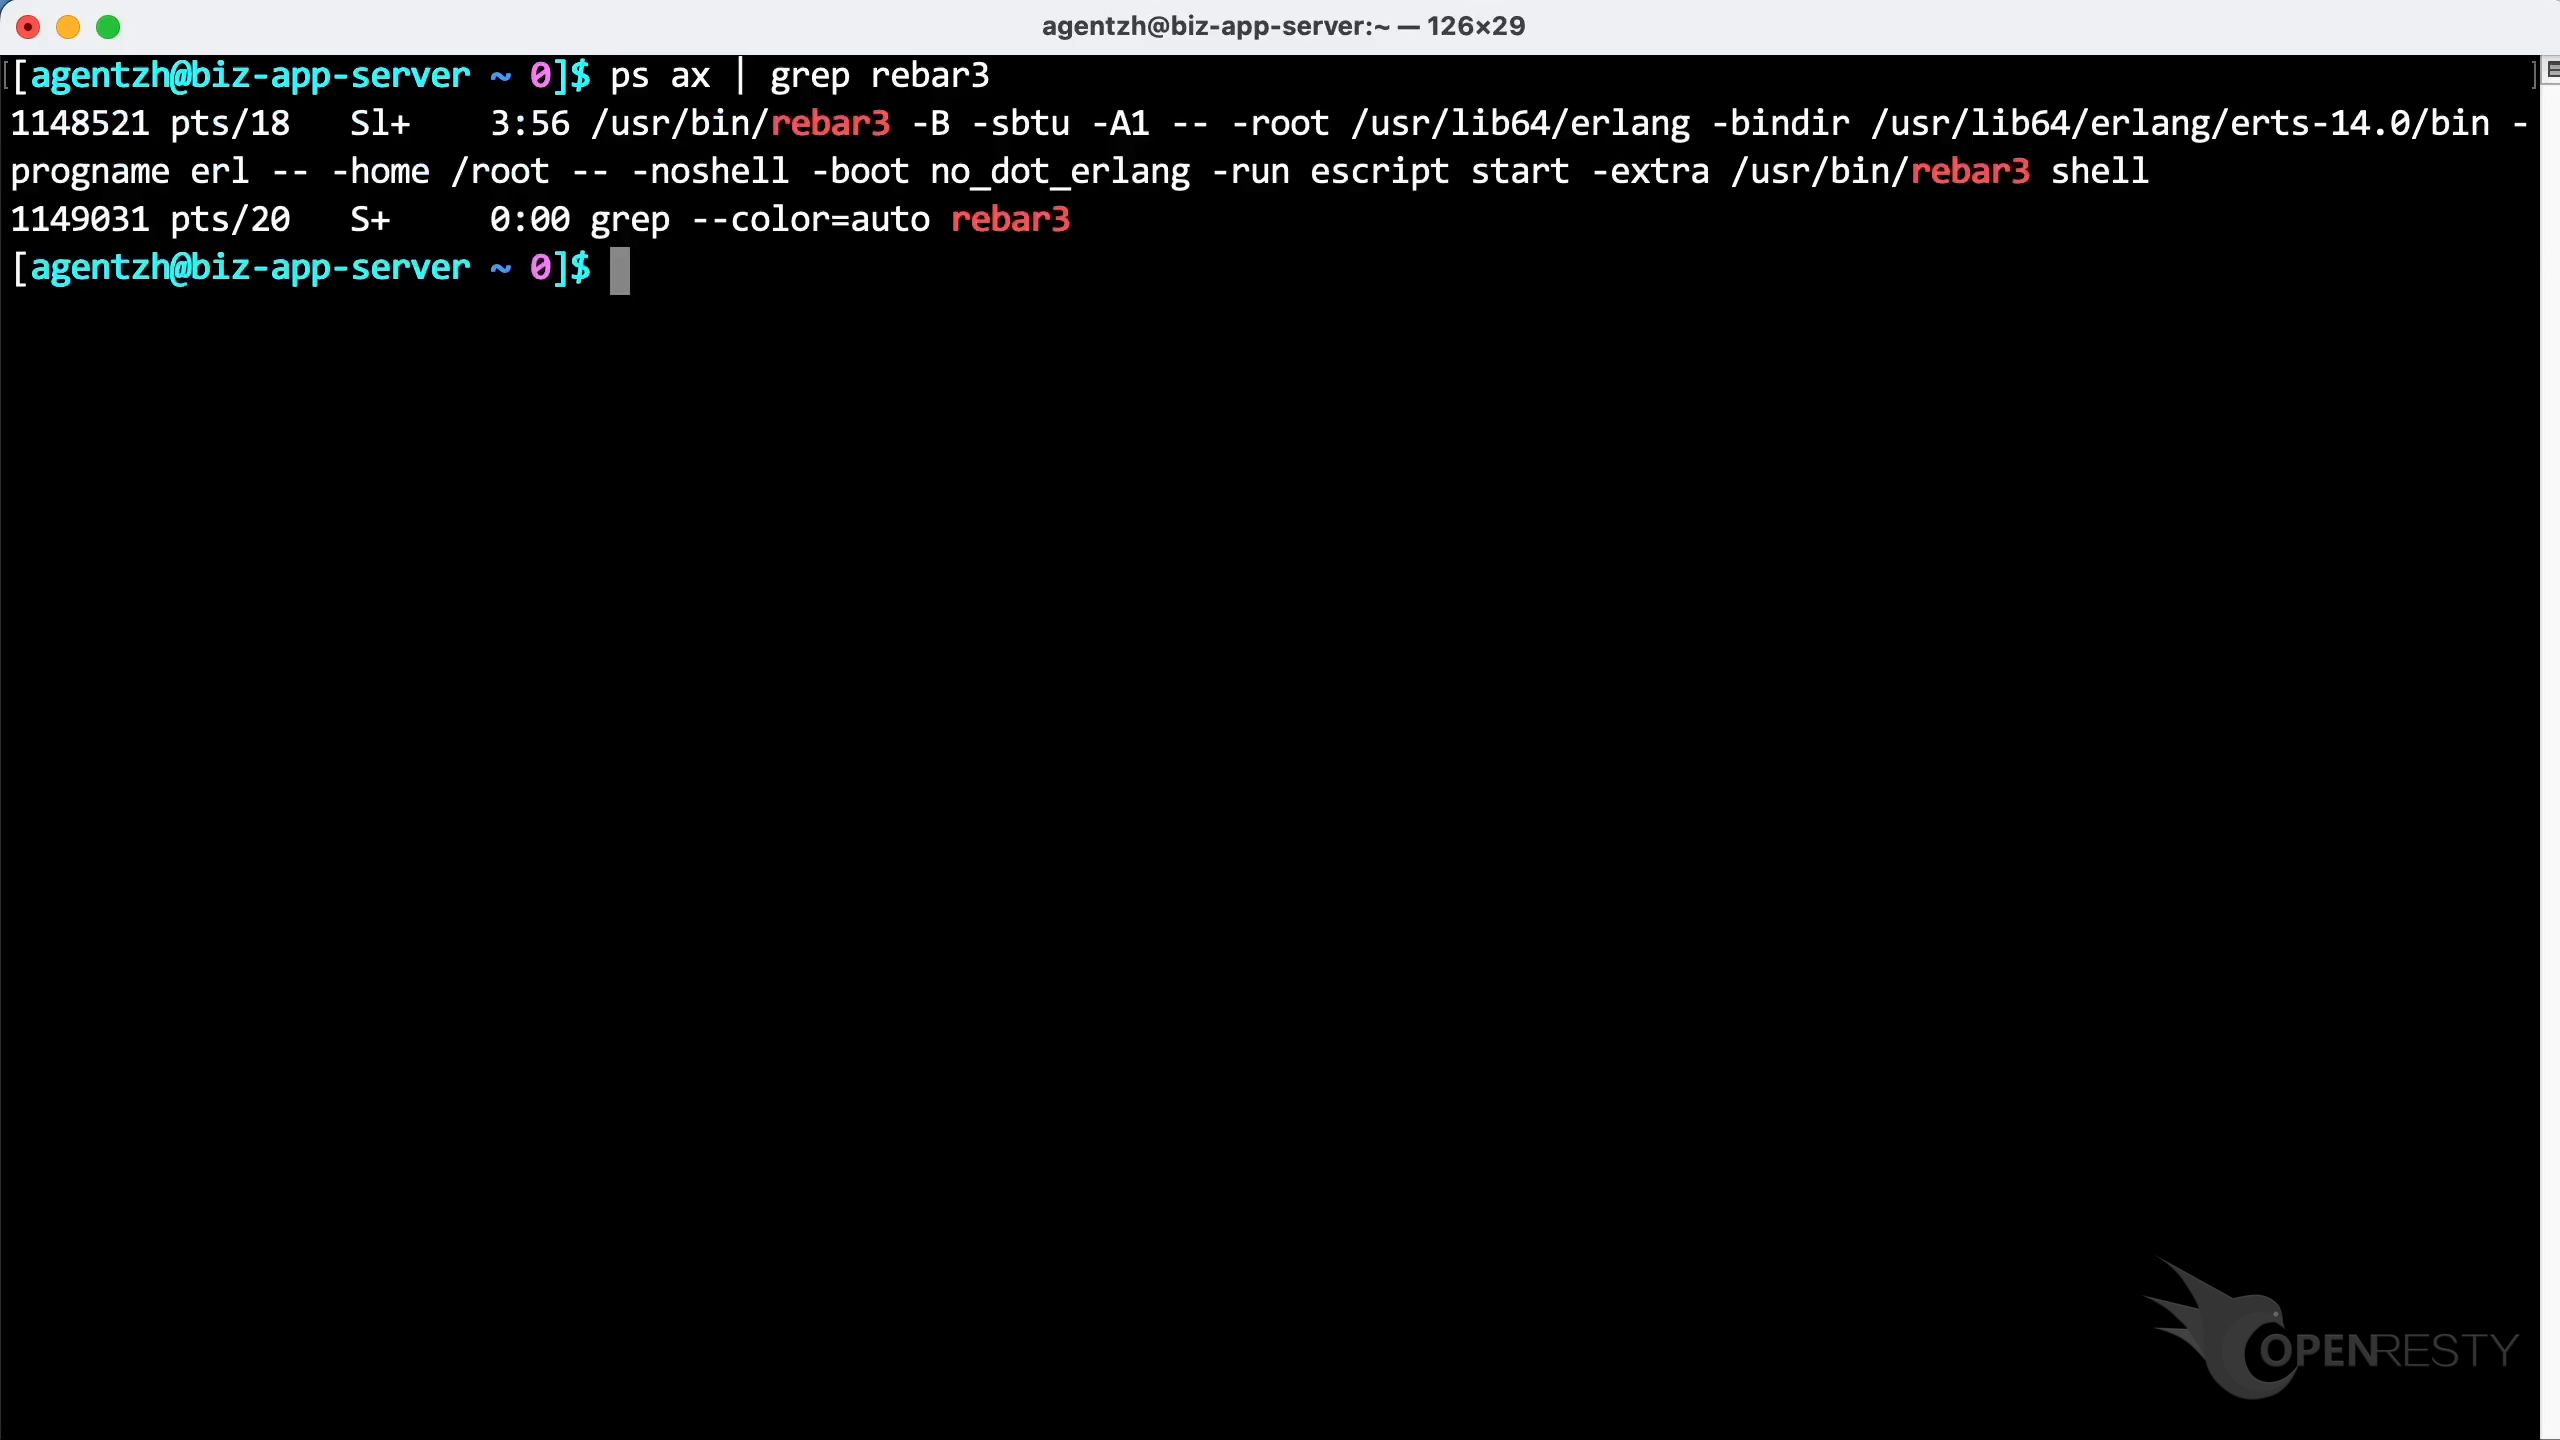
We can see it is the standard rebar3 binary executable shipped with the Linux distribution. Naturally, this program is also compiled using the Erlang, which comes with the standard distribution.
Profiling Erlang CPU Usage with OpenResty XRay
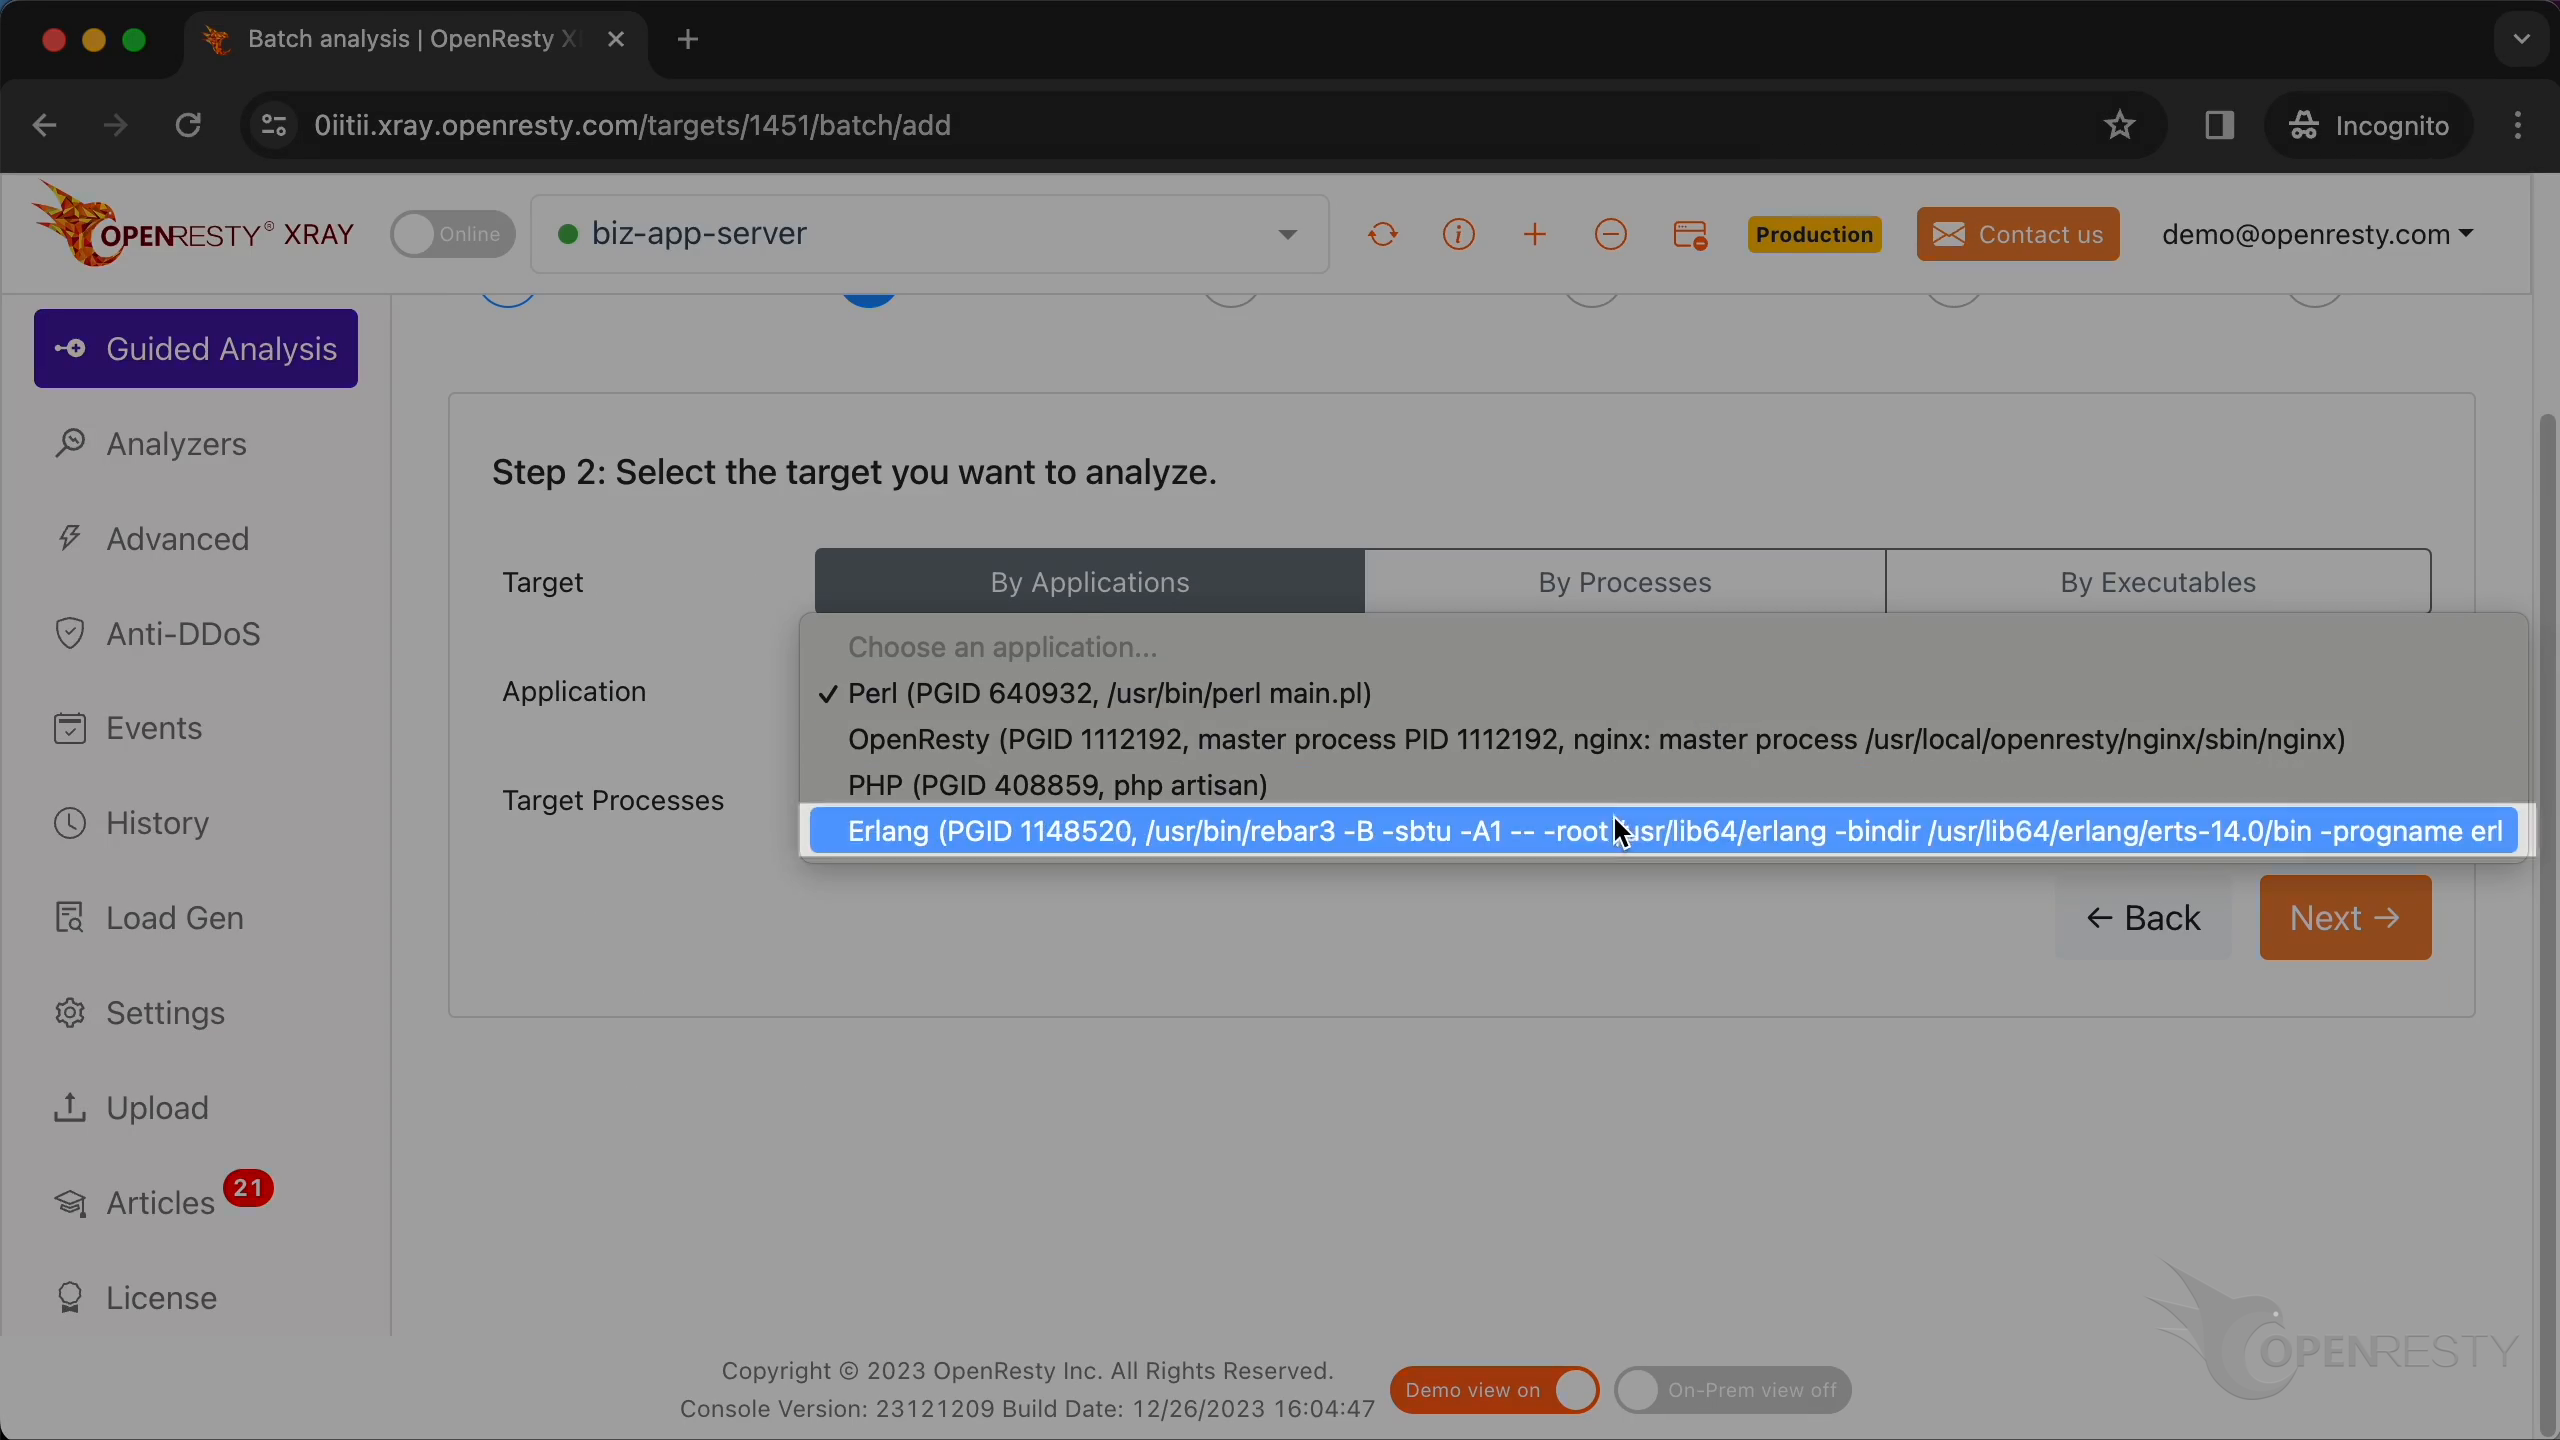
OpenResty XRay can analyze this unmodified Erlang process in real time — at both the Erlang language level and the underlying C level of the BEAM VM — without installing any modules or plugins in the target application. In the web console, navigate to Guided Analysis and select High CPU Usage as the problem type. Then select the Erlang application on the target machine.
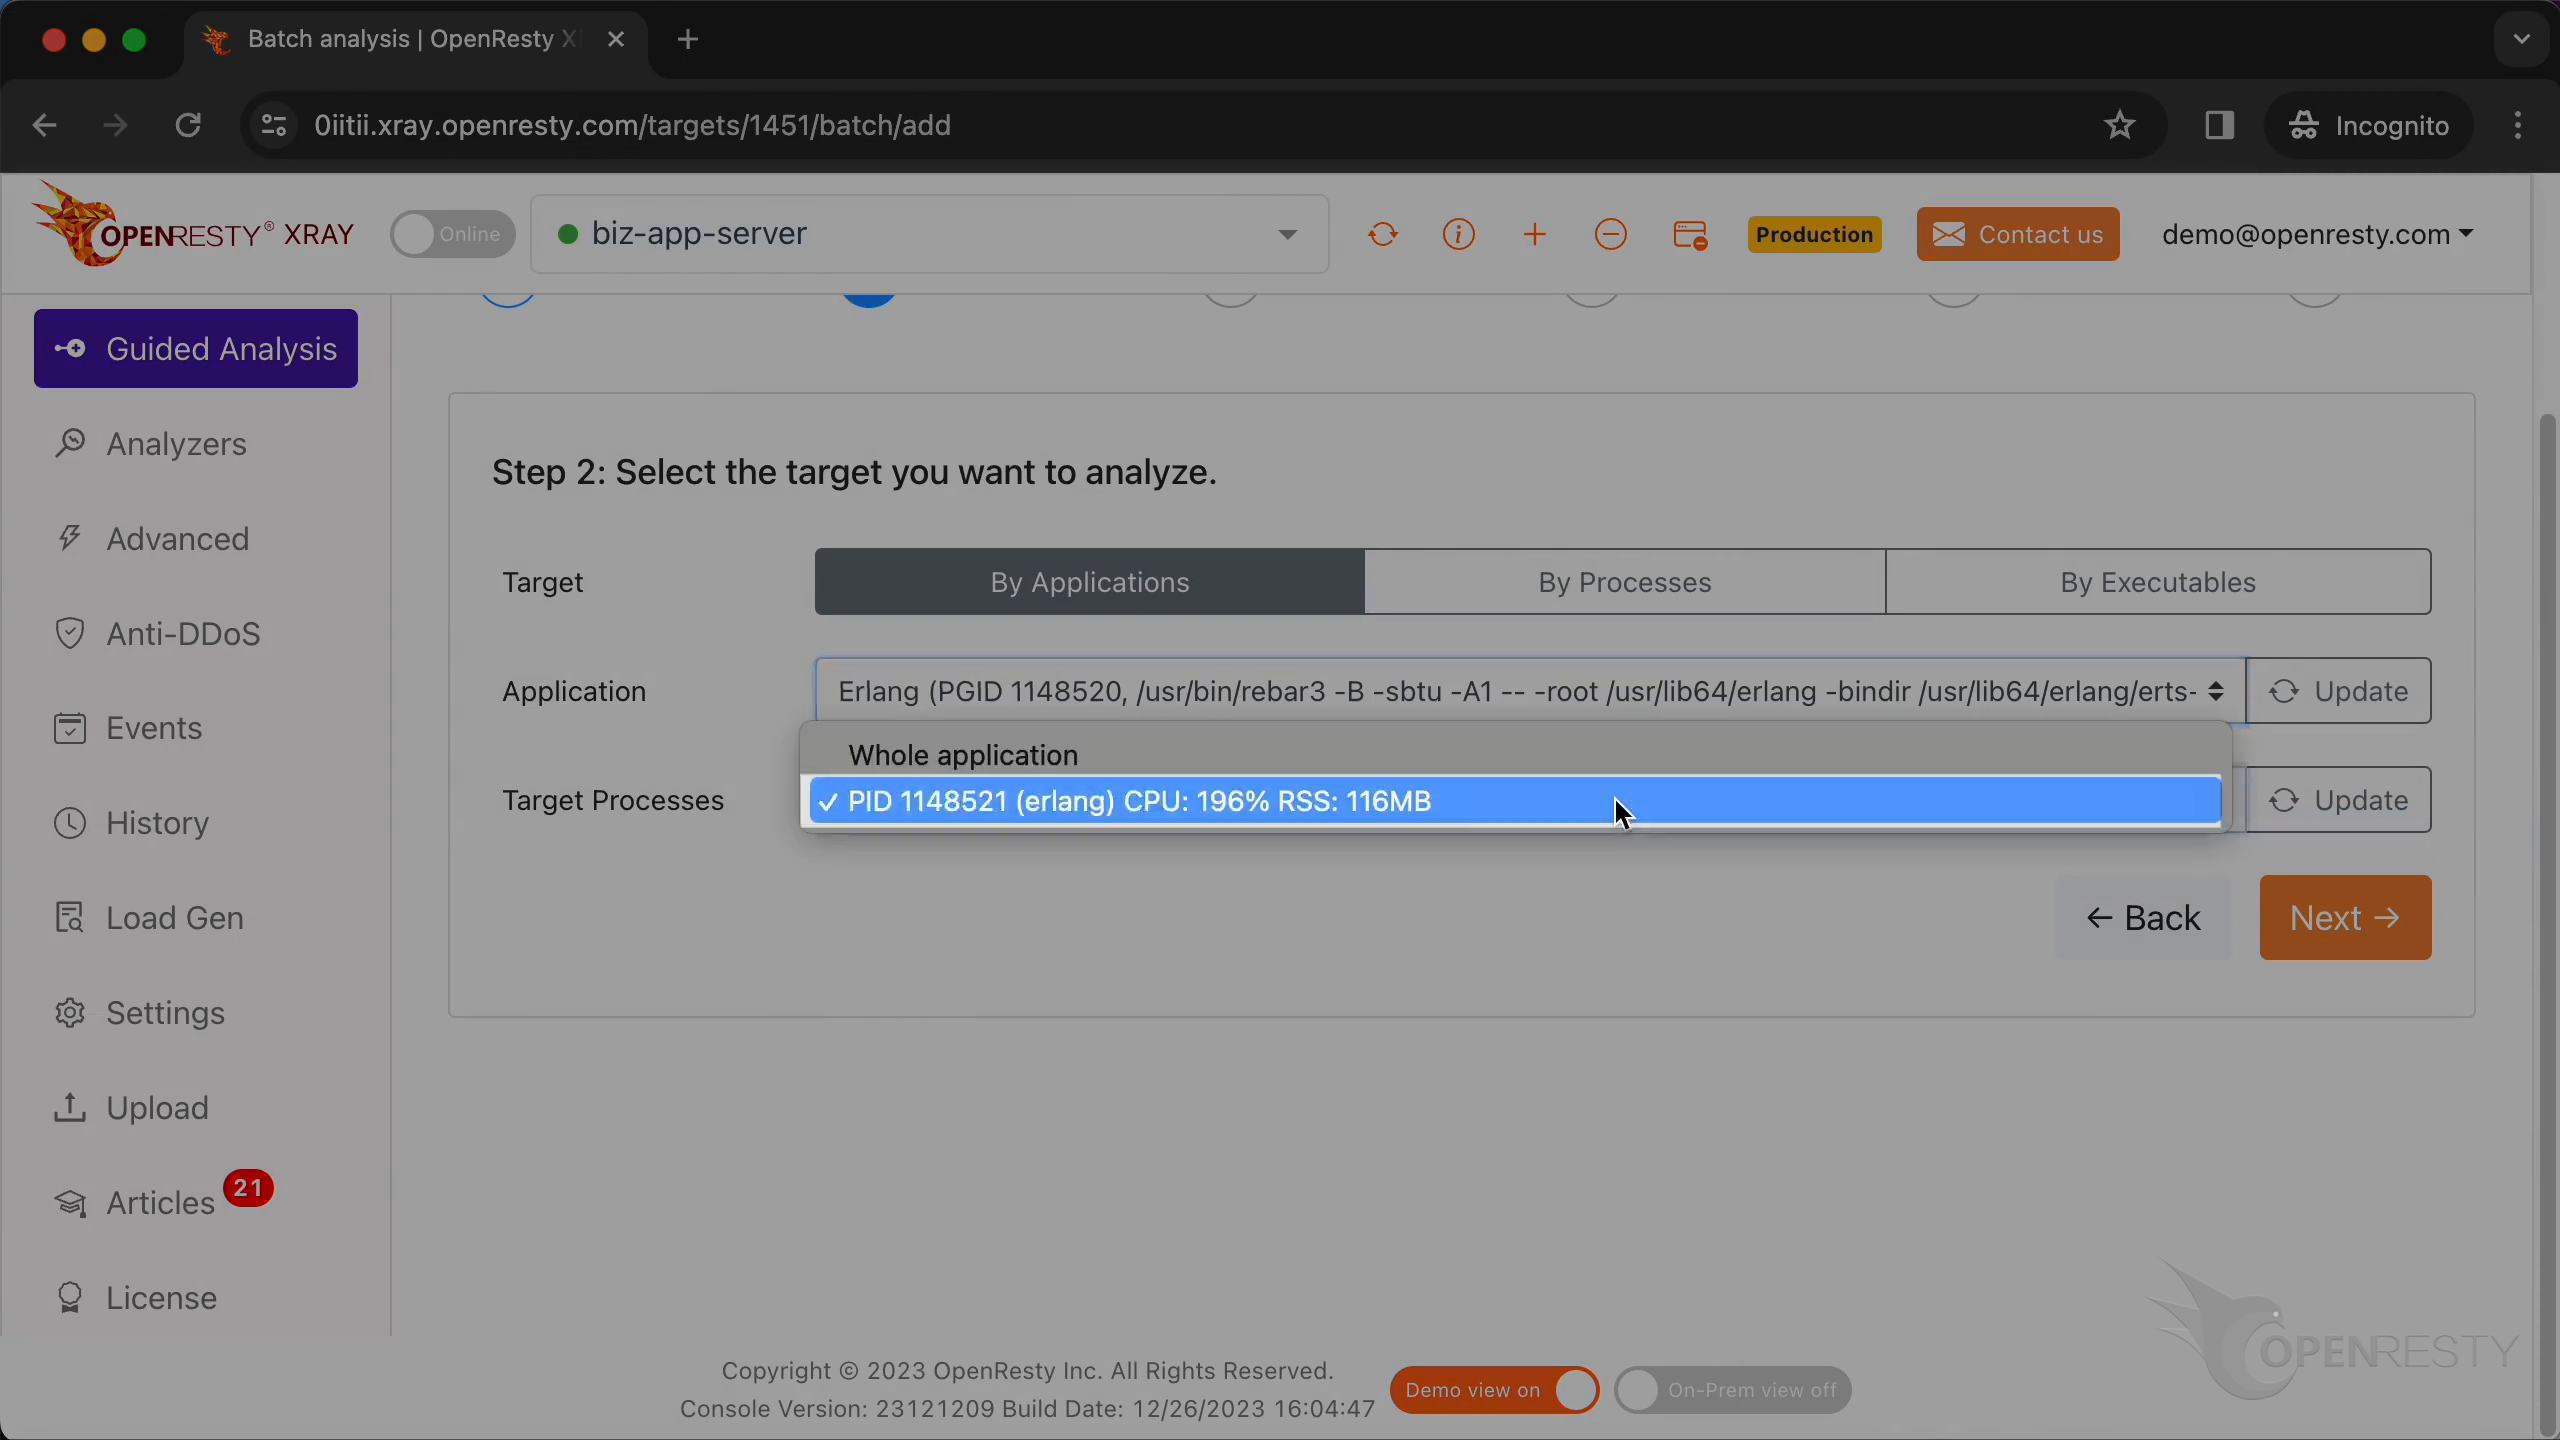
Select the process that consumes almost 200% of CPU cores — the same one we observed in top.
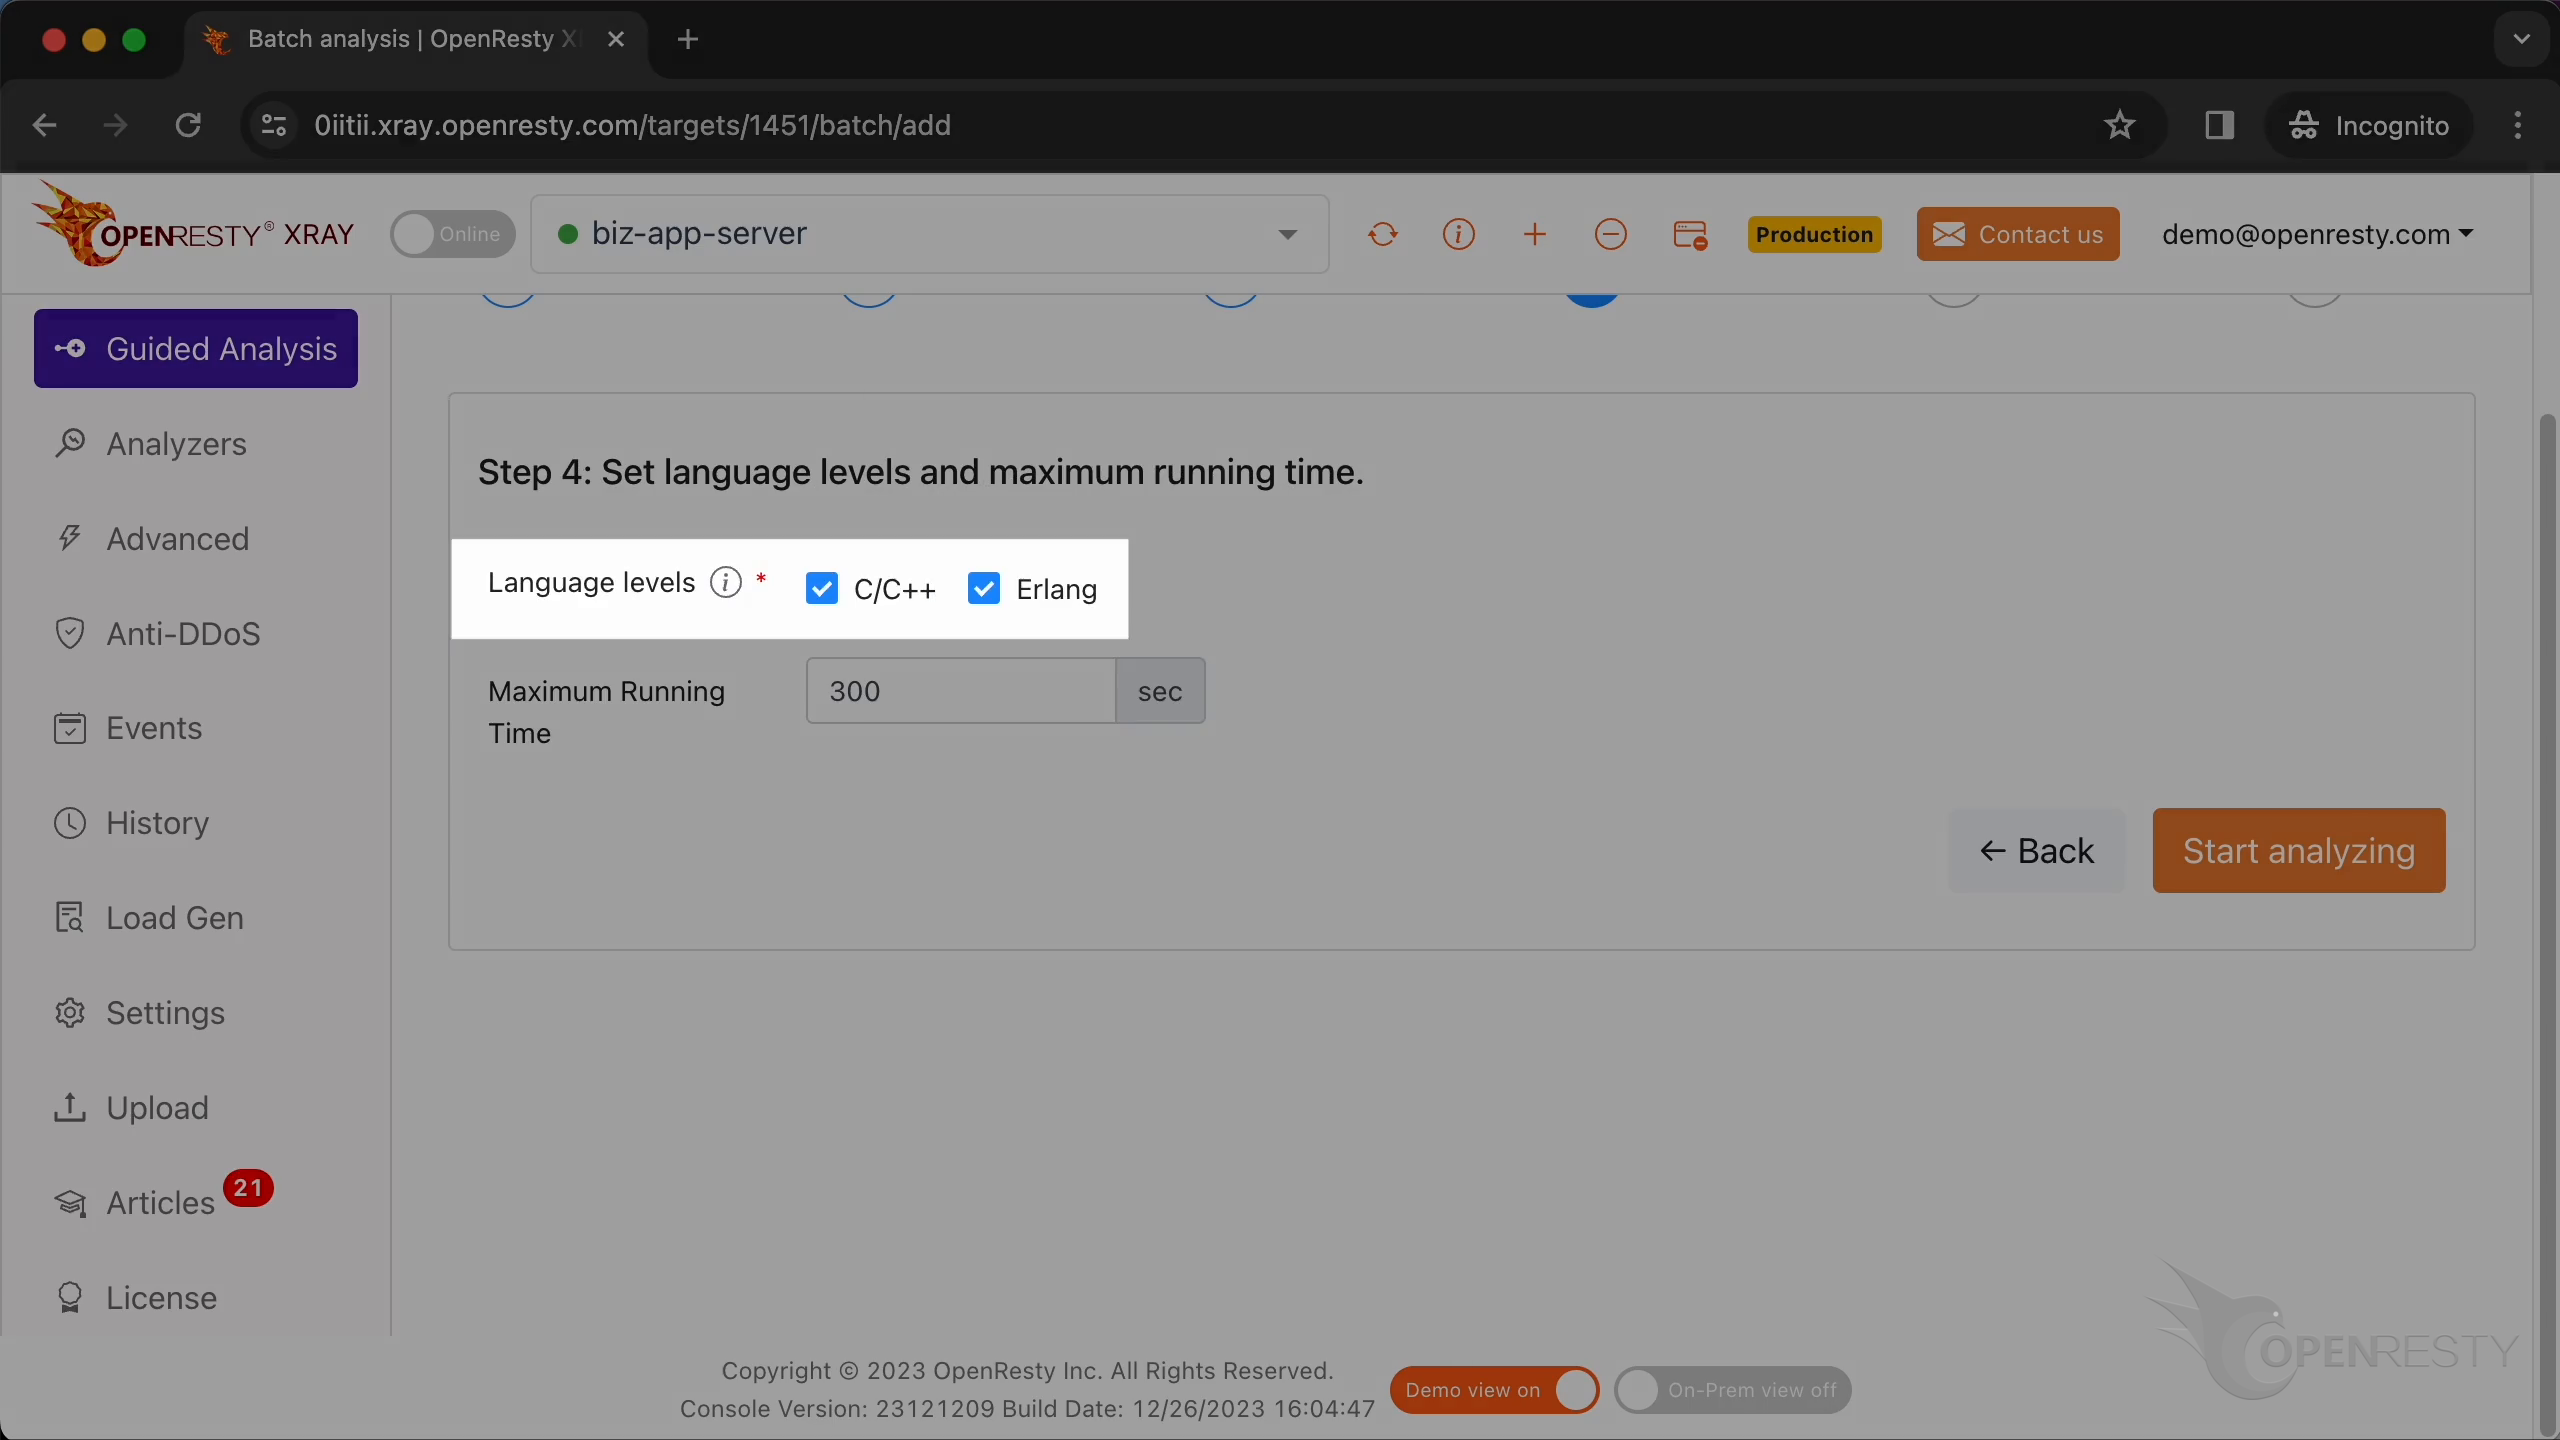
OpenResty XRay can analyze multiple language levels at the same time. We keep both Erlang and C/C++ selected to see hotspots at both the Erlang code level and the BEAM VM internals, and leave the maximum analyzing time at its default of 300 seconds.
After starting the analysis, the system keeps performing different rounds of analysis. Two rounds are enough for this case.
It automatically generated an analysis report.
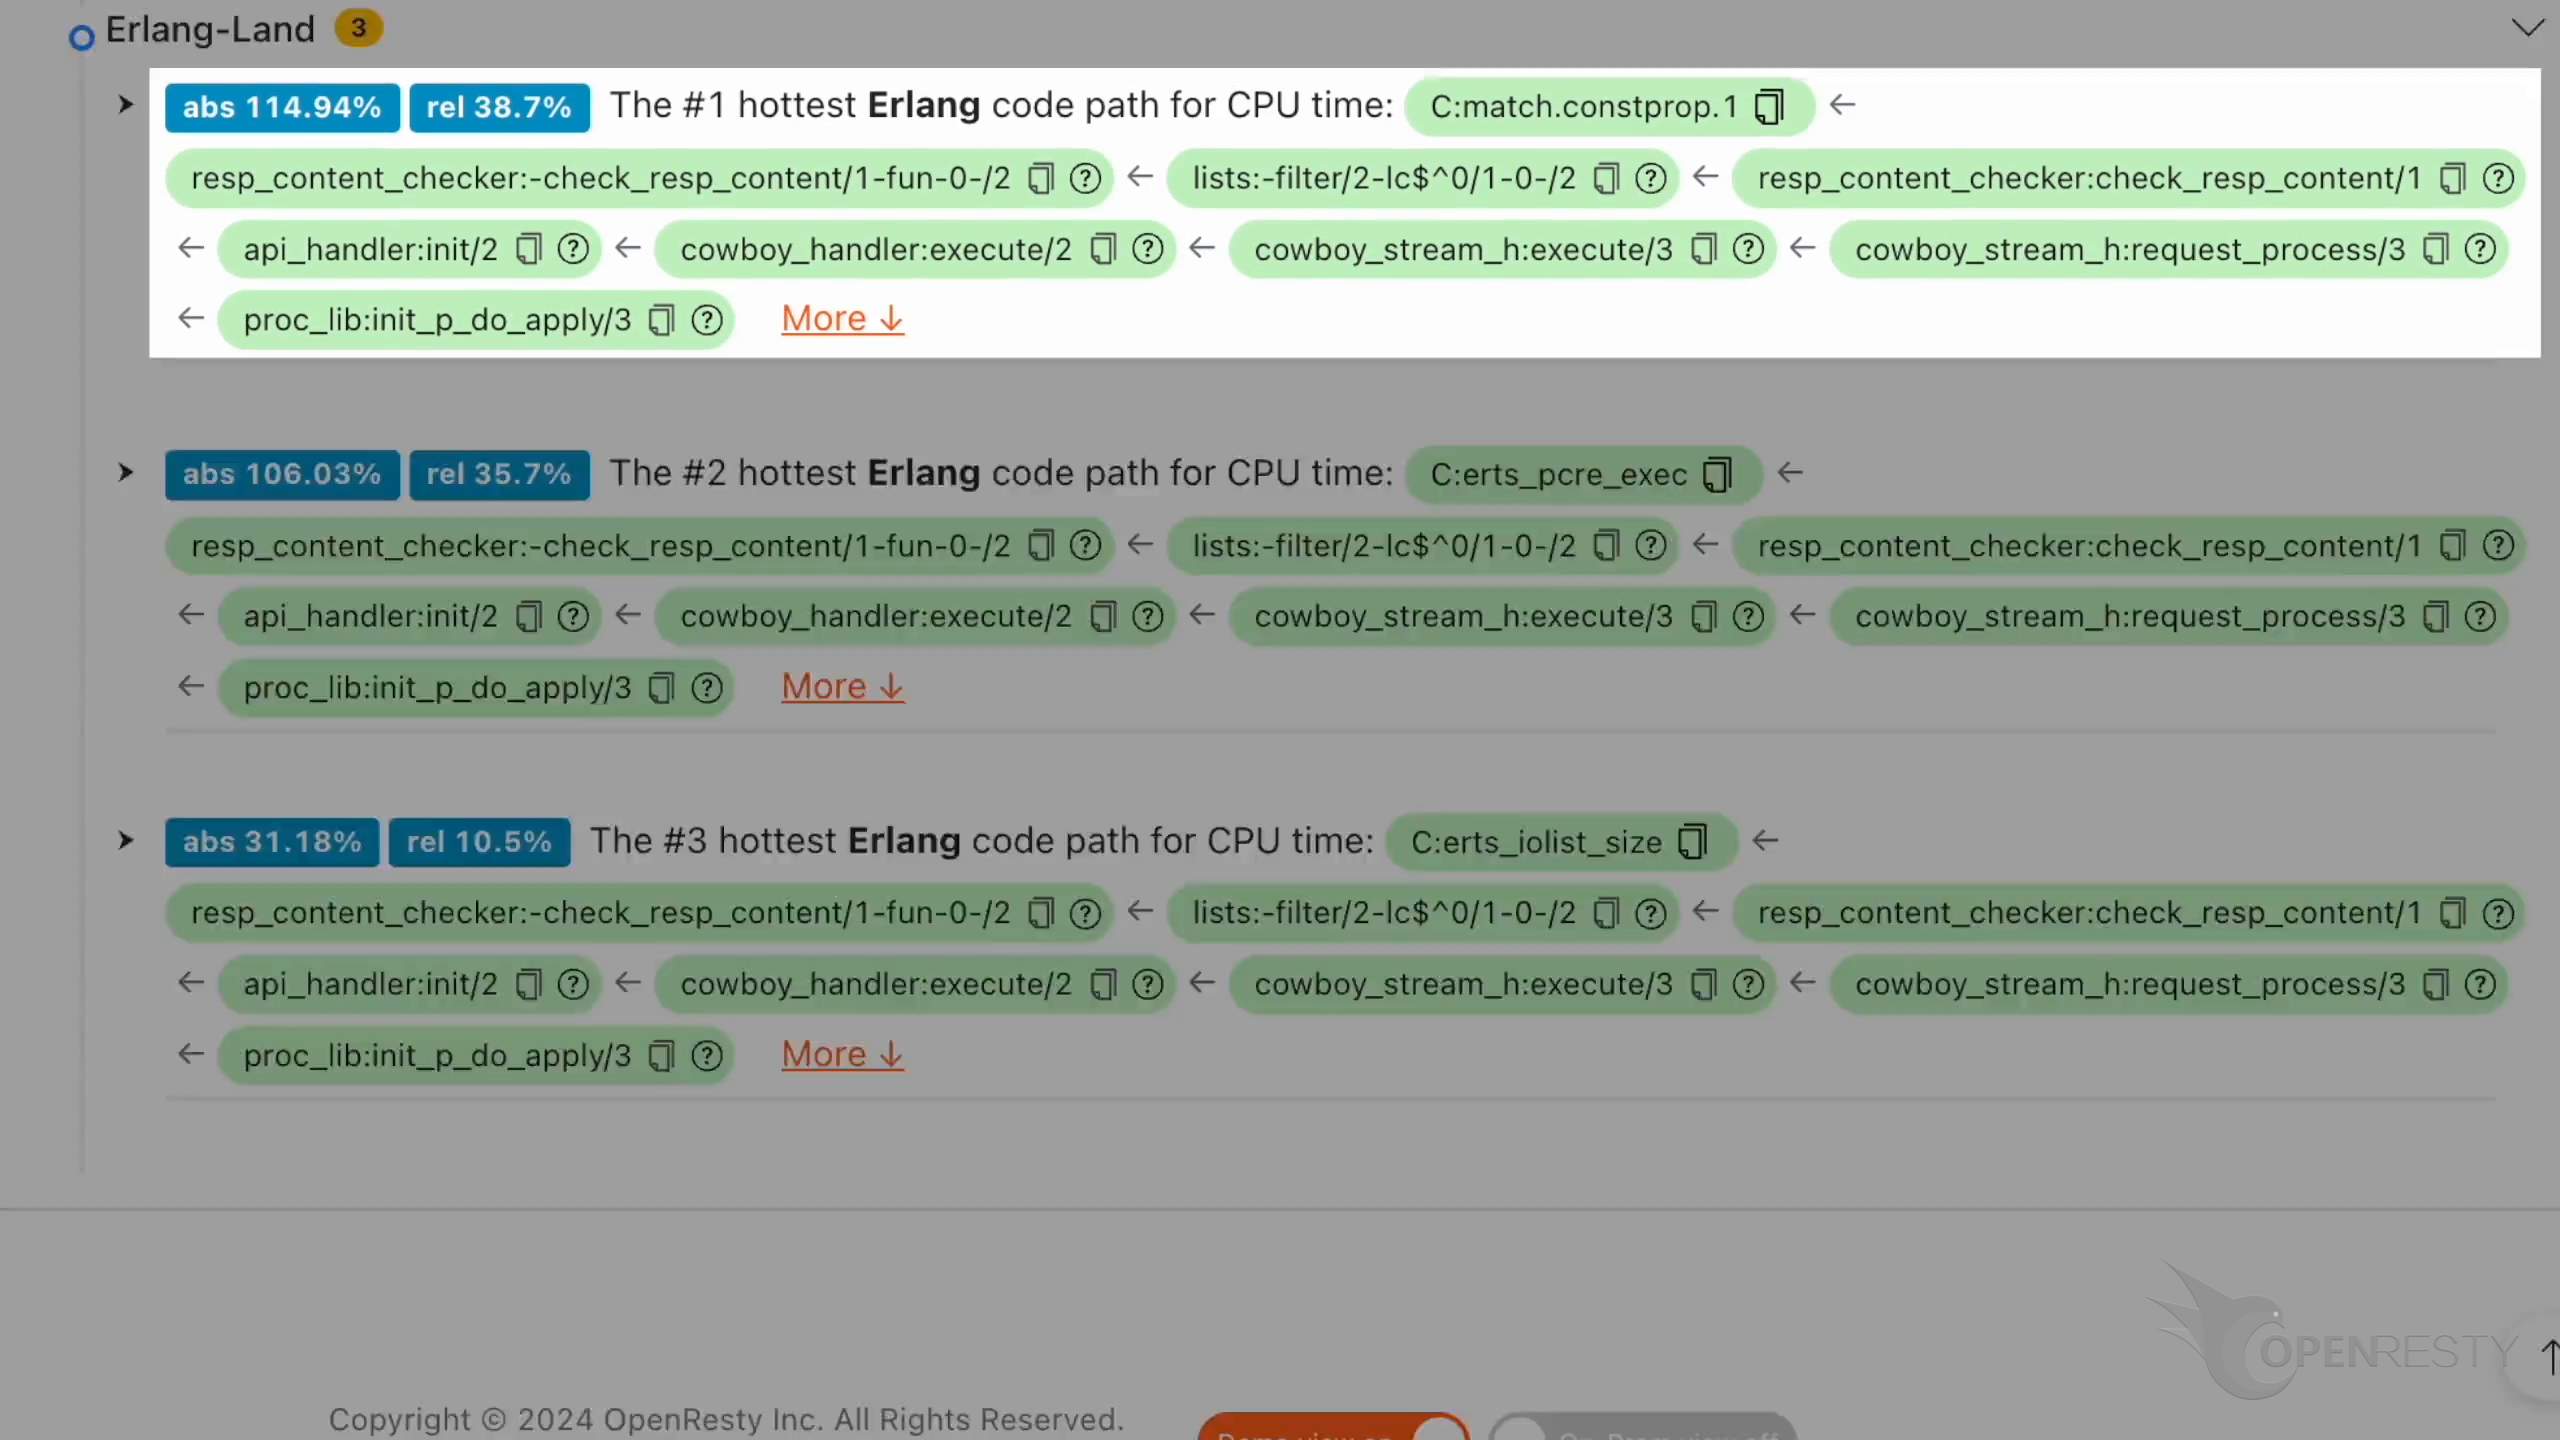
Erlang-Level CPU Flame Graph: Regex in check_resp_content
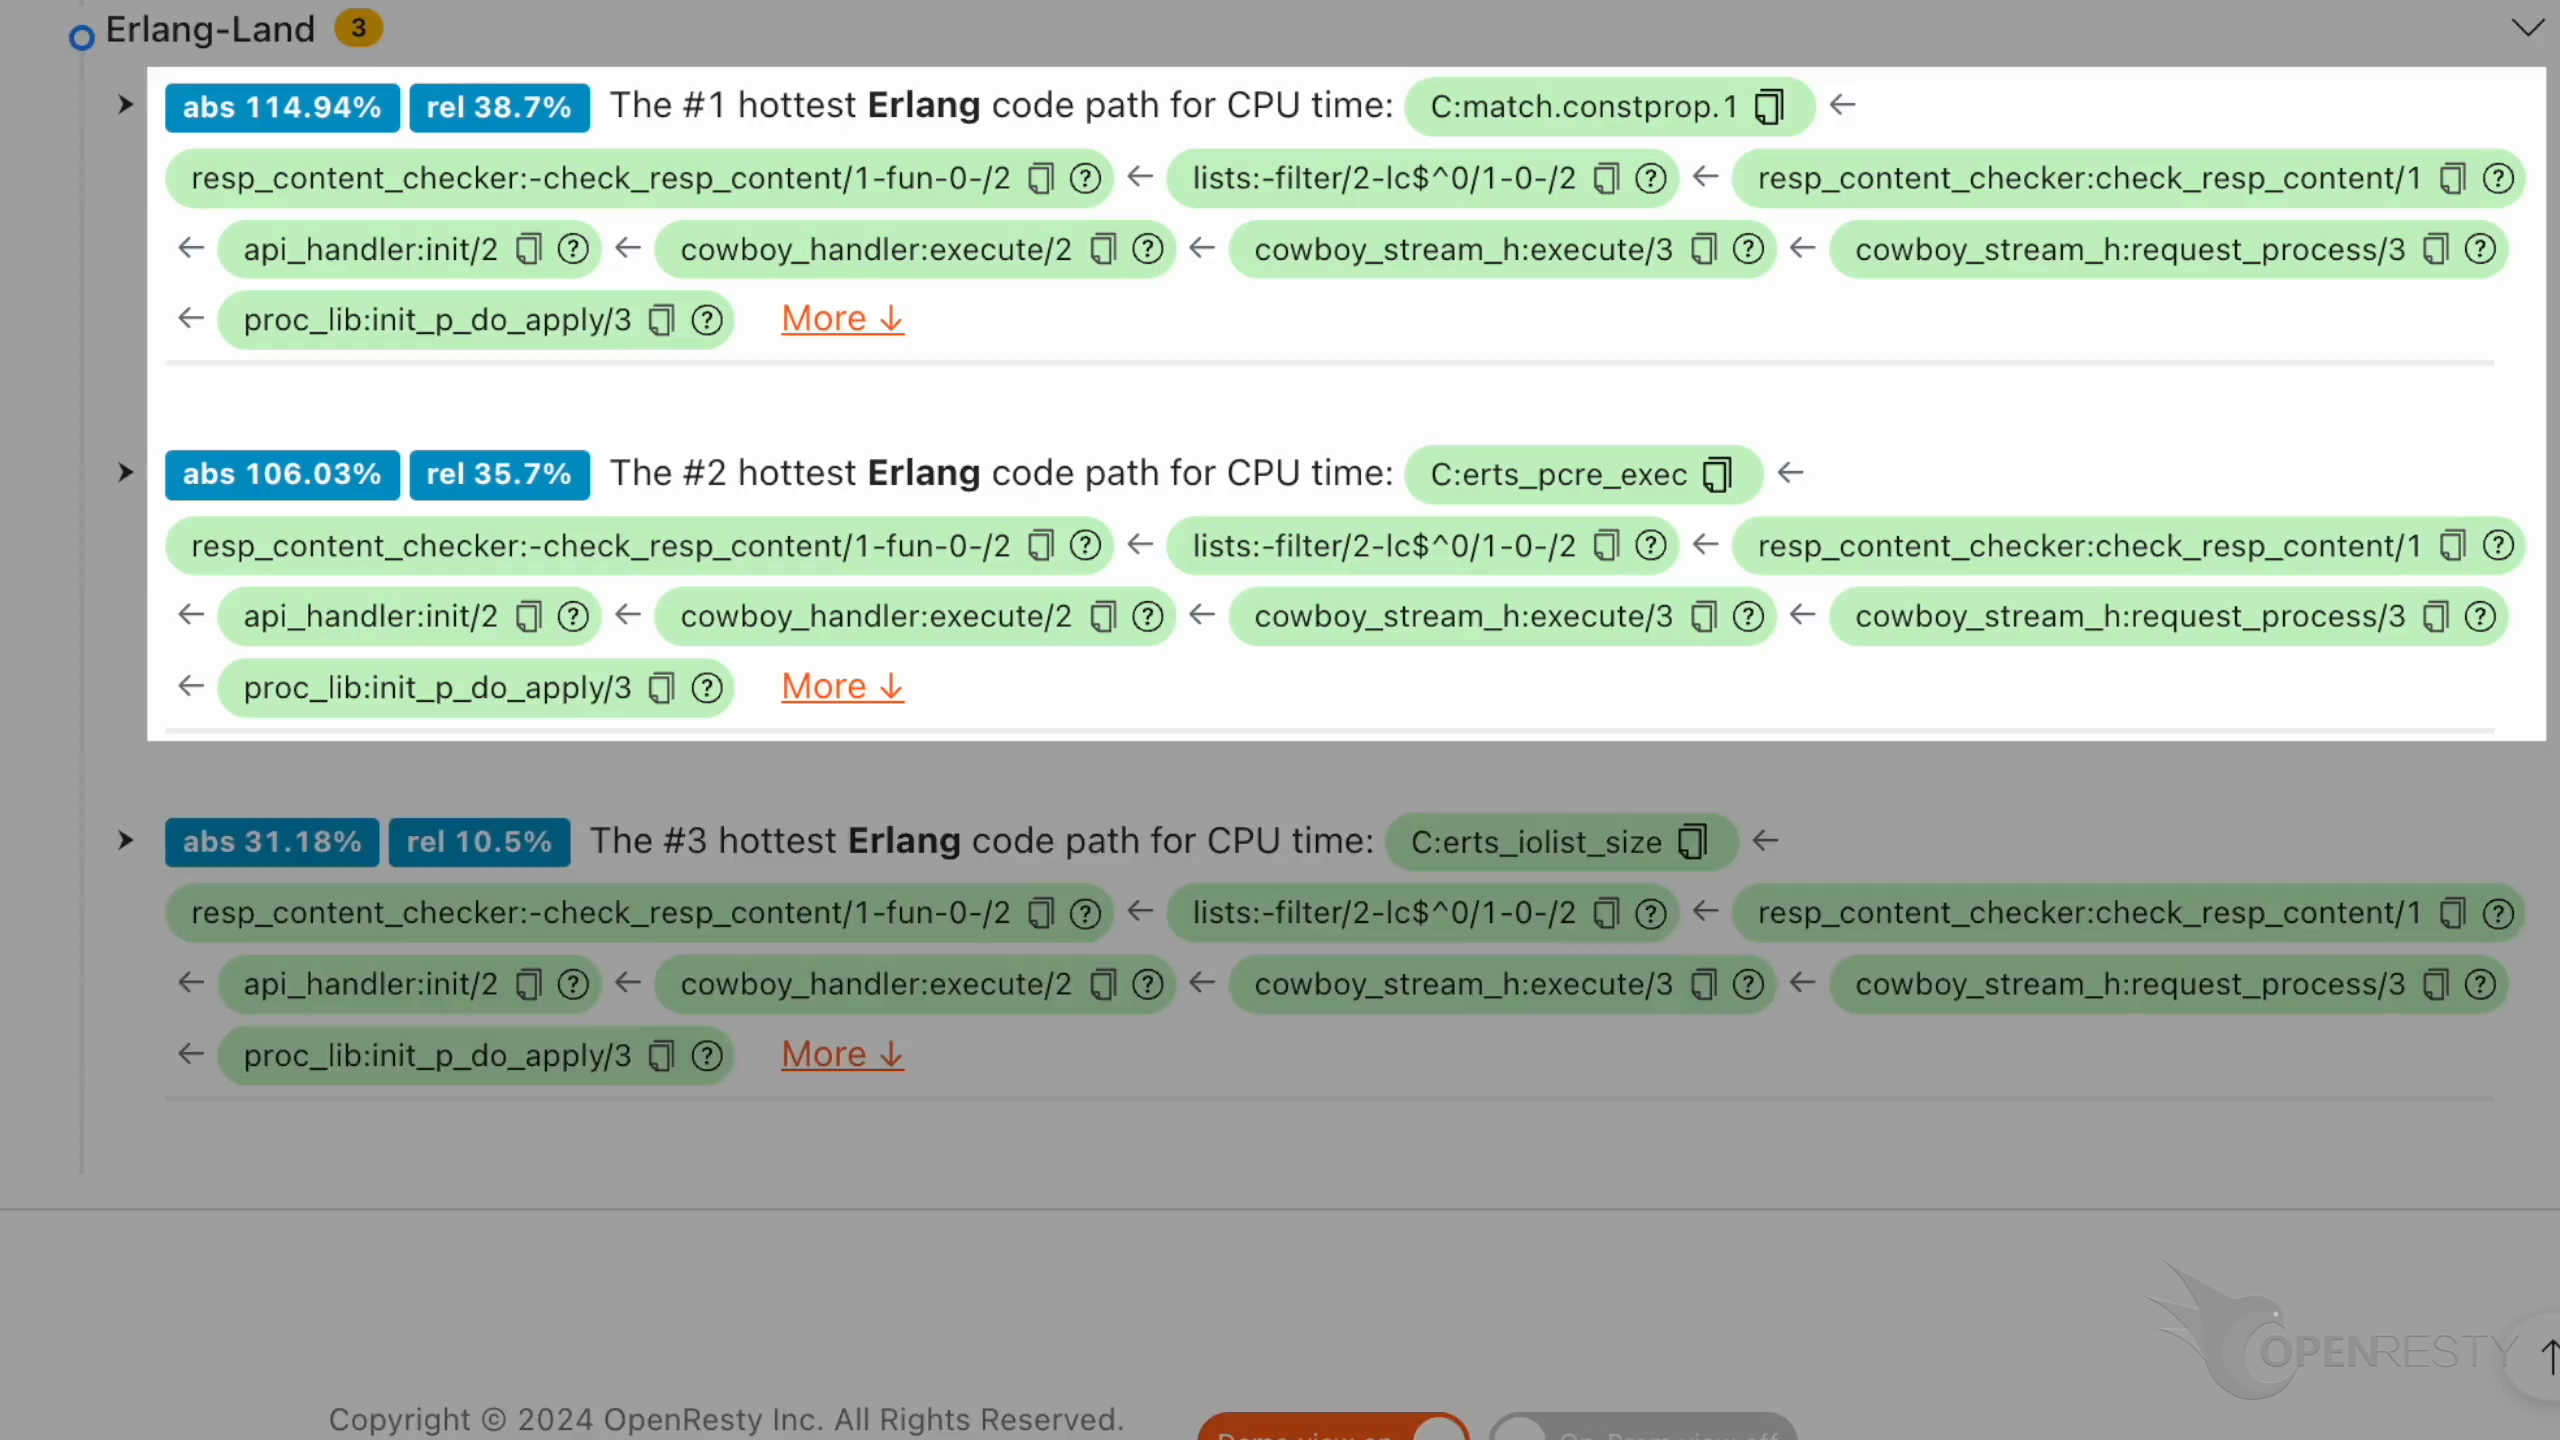
Look at the #1 hottest Erlang code path.
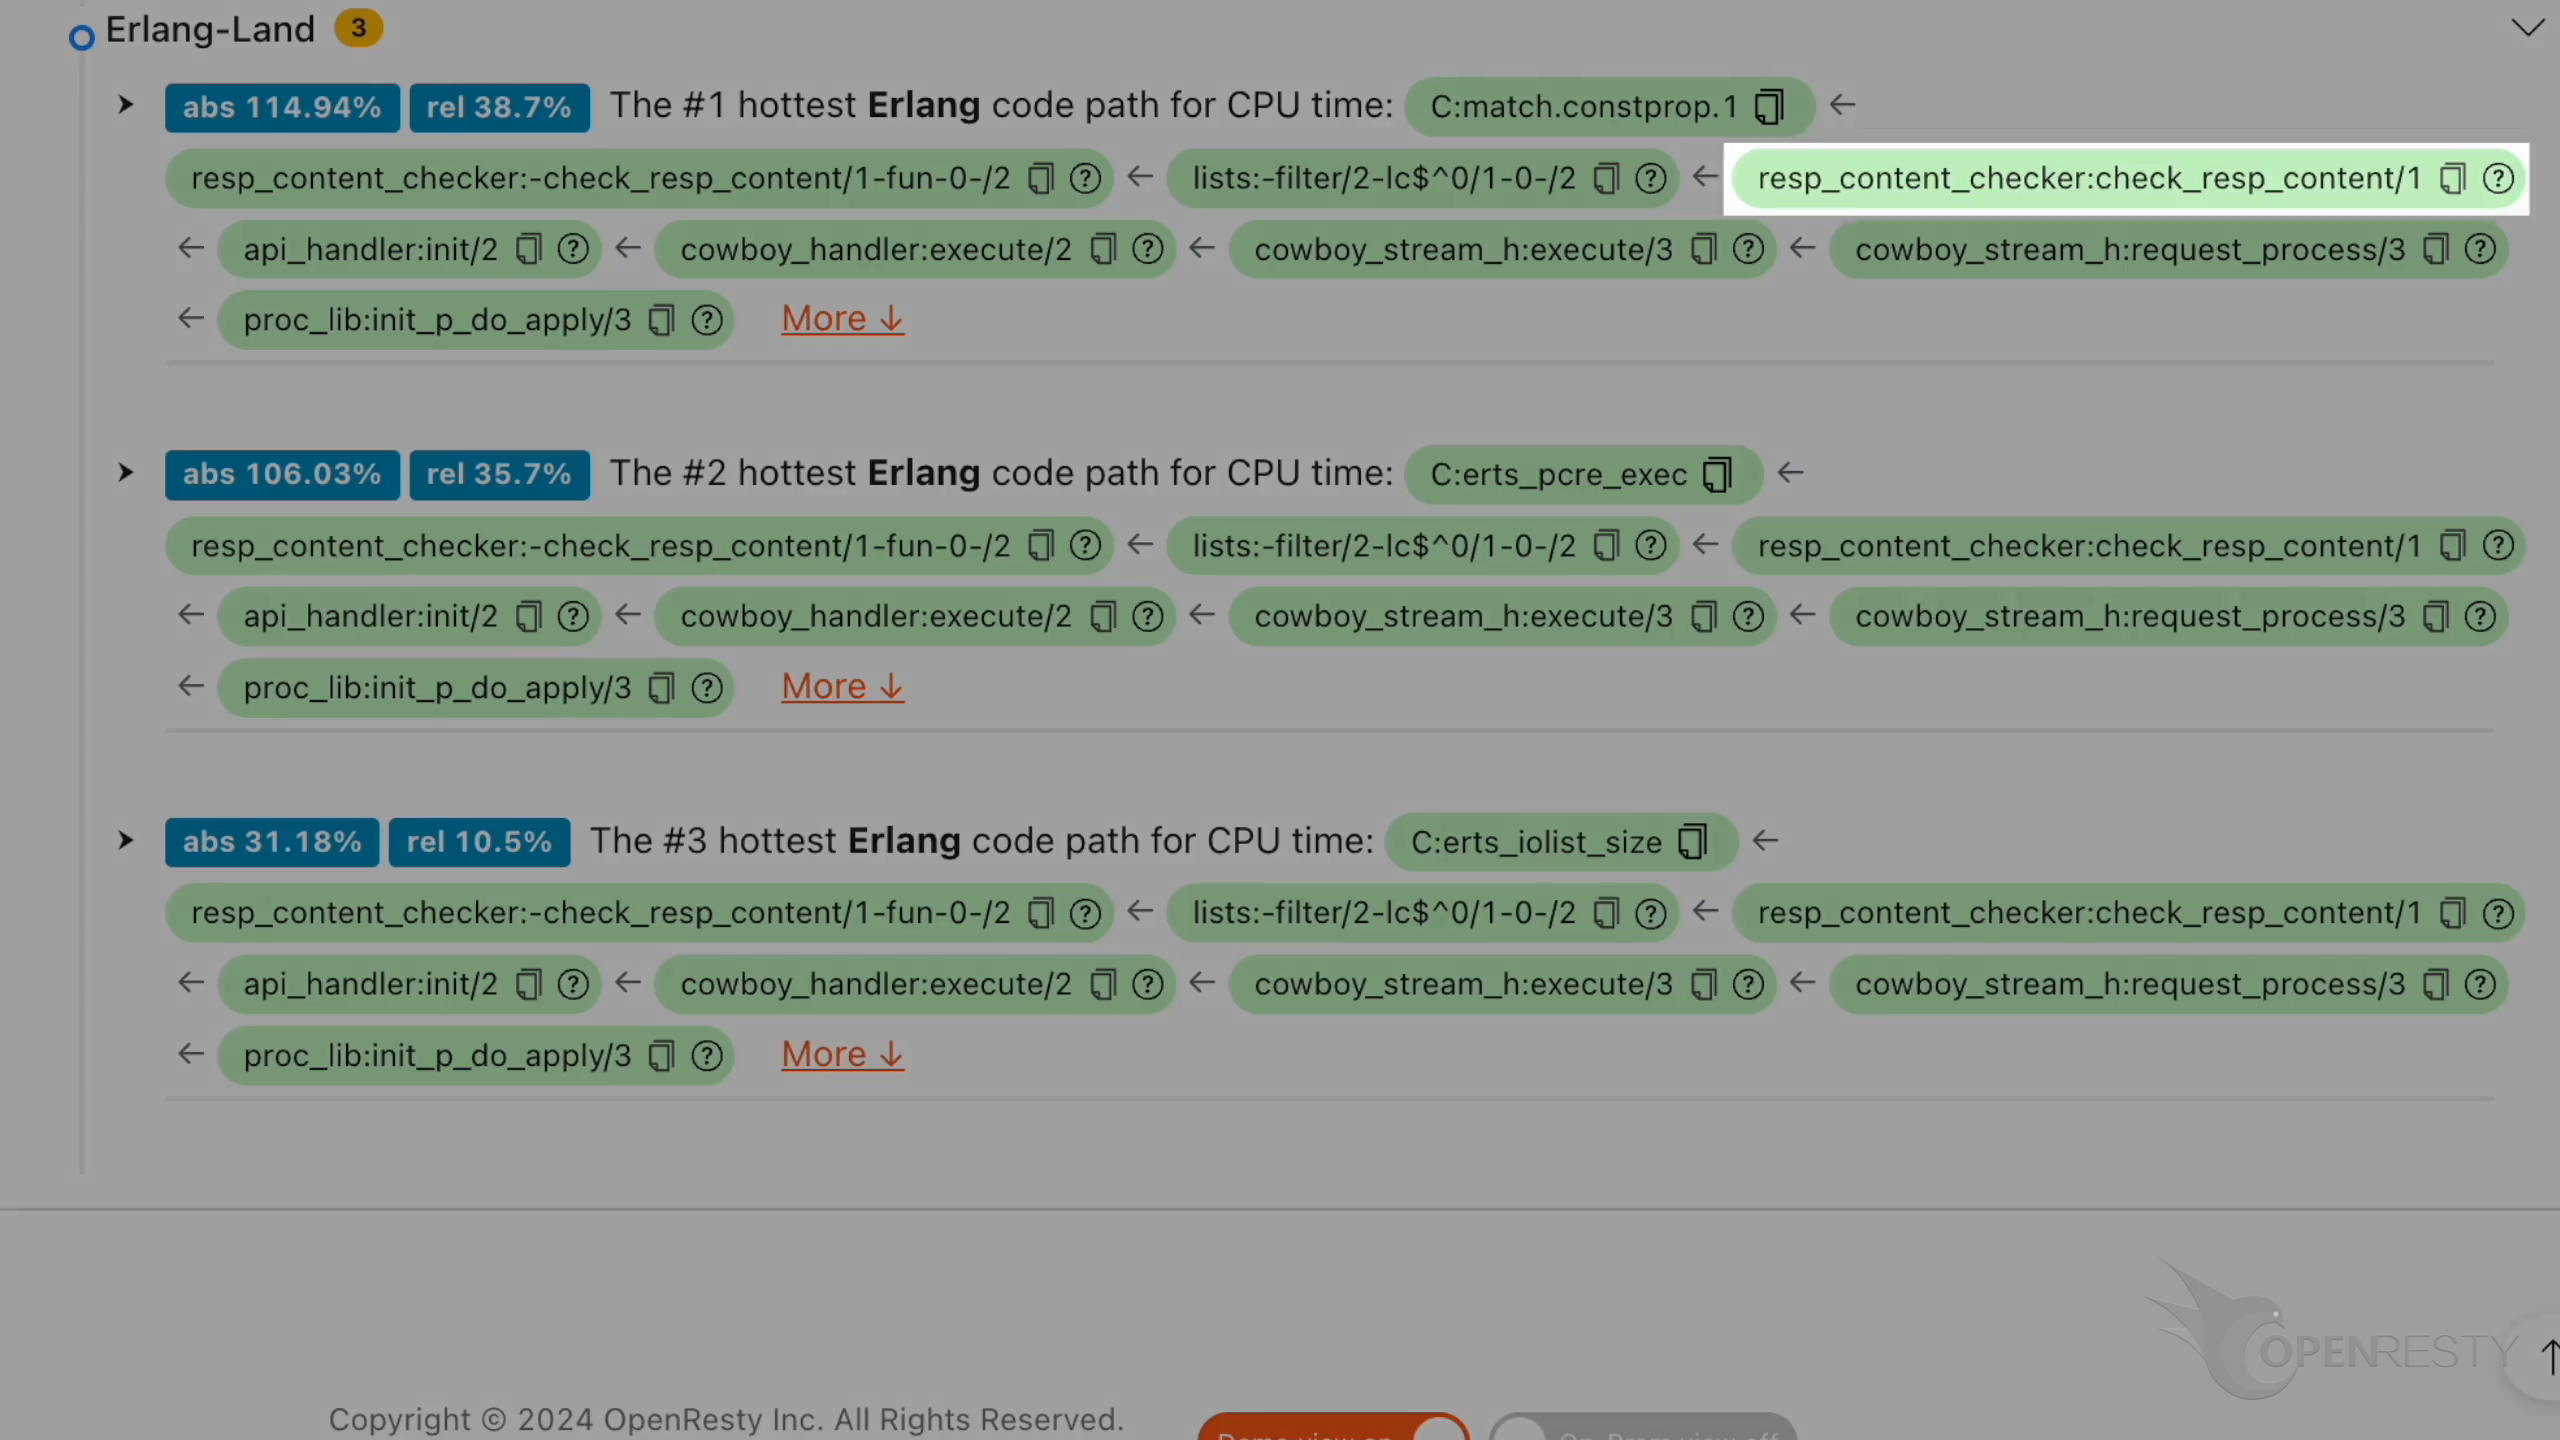
The check_resp_content function is a business function used to check the content of the response.
It calls the filter function of the lists module to filter a list.
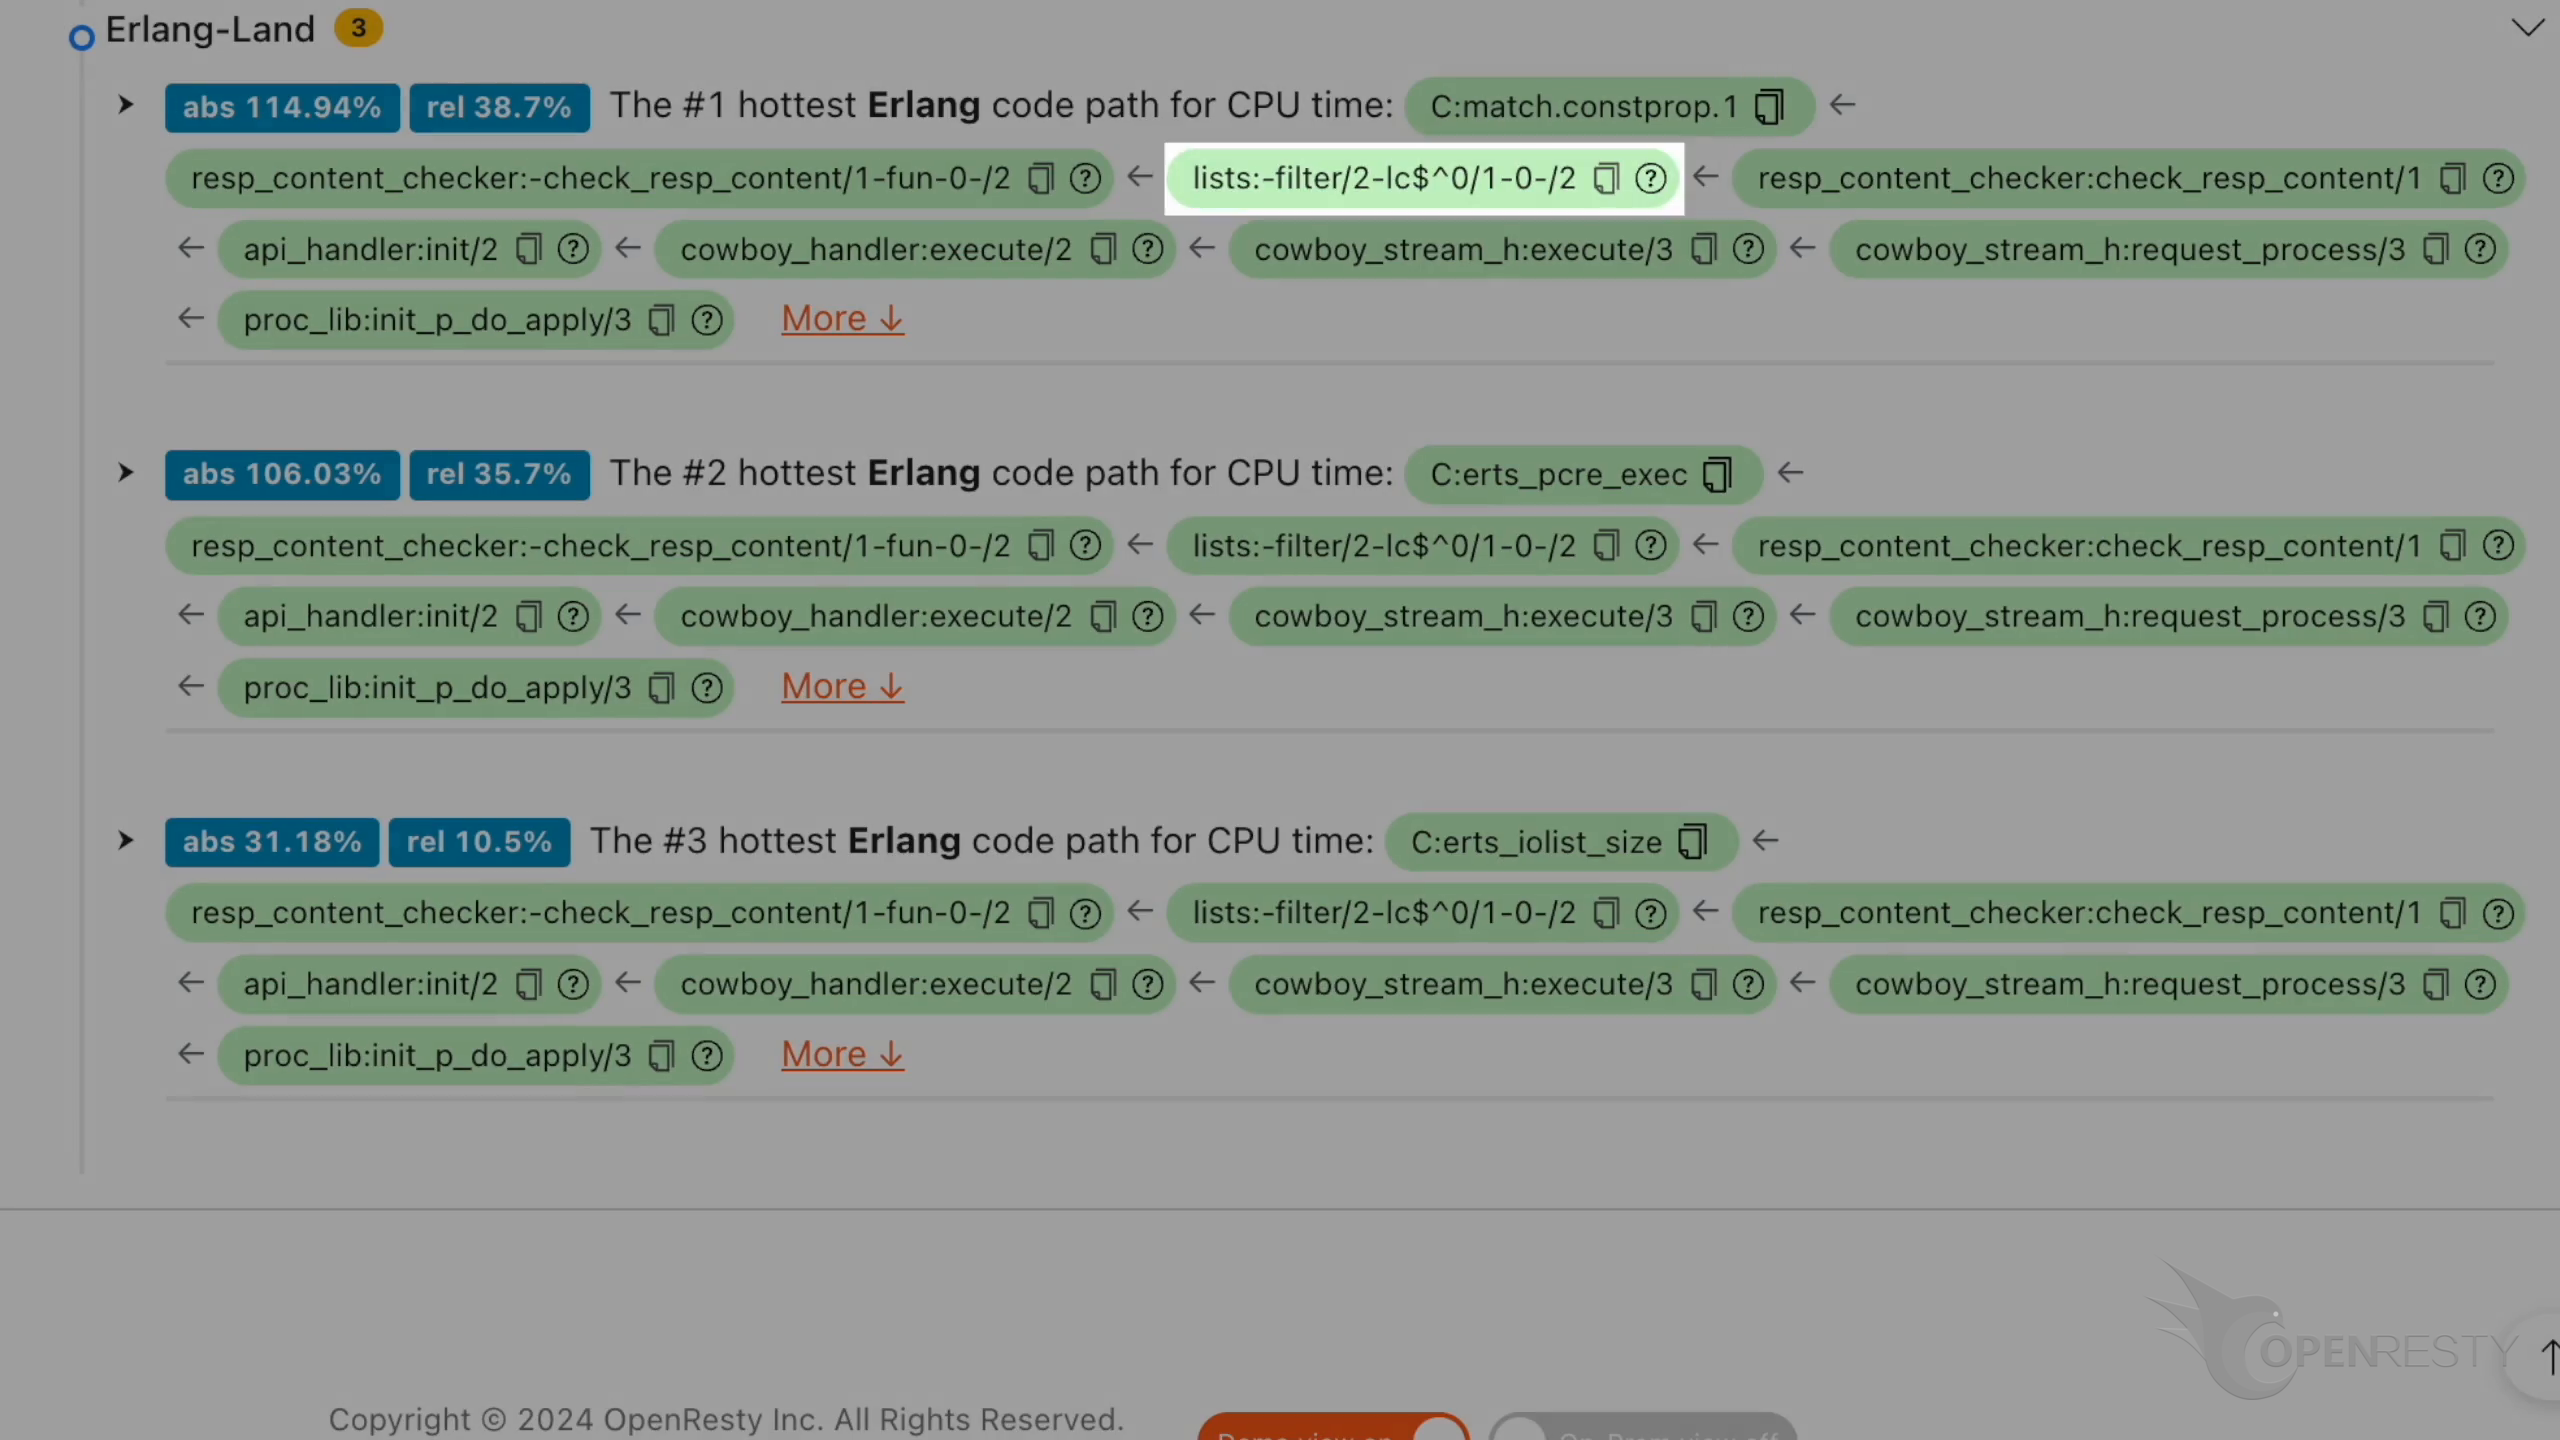
The filter condition is an anonymous function that uses regular expression matching within itself. These calls all occur within the check_resp_content function.
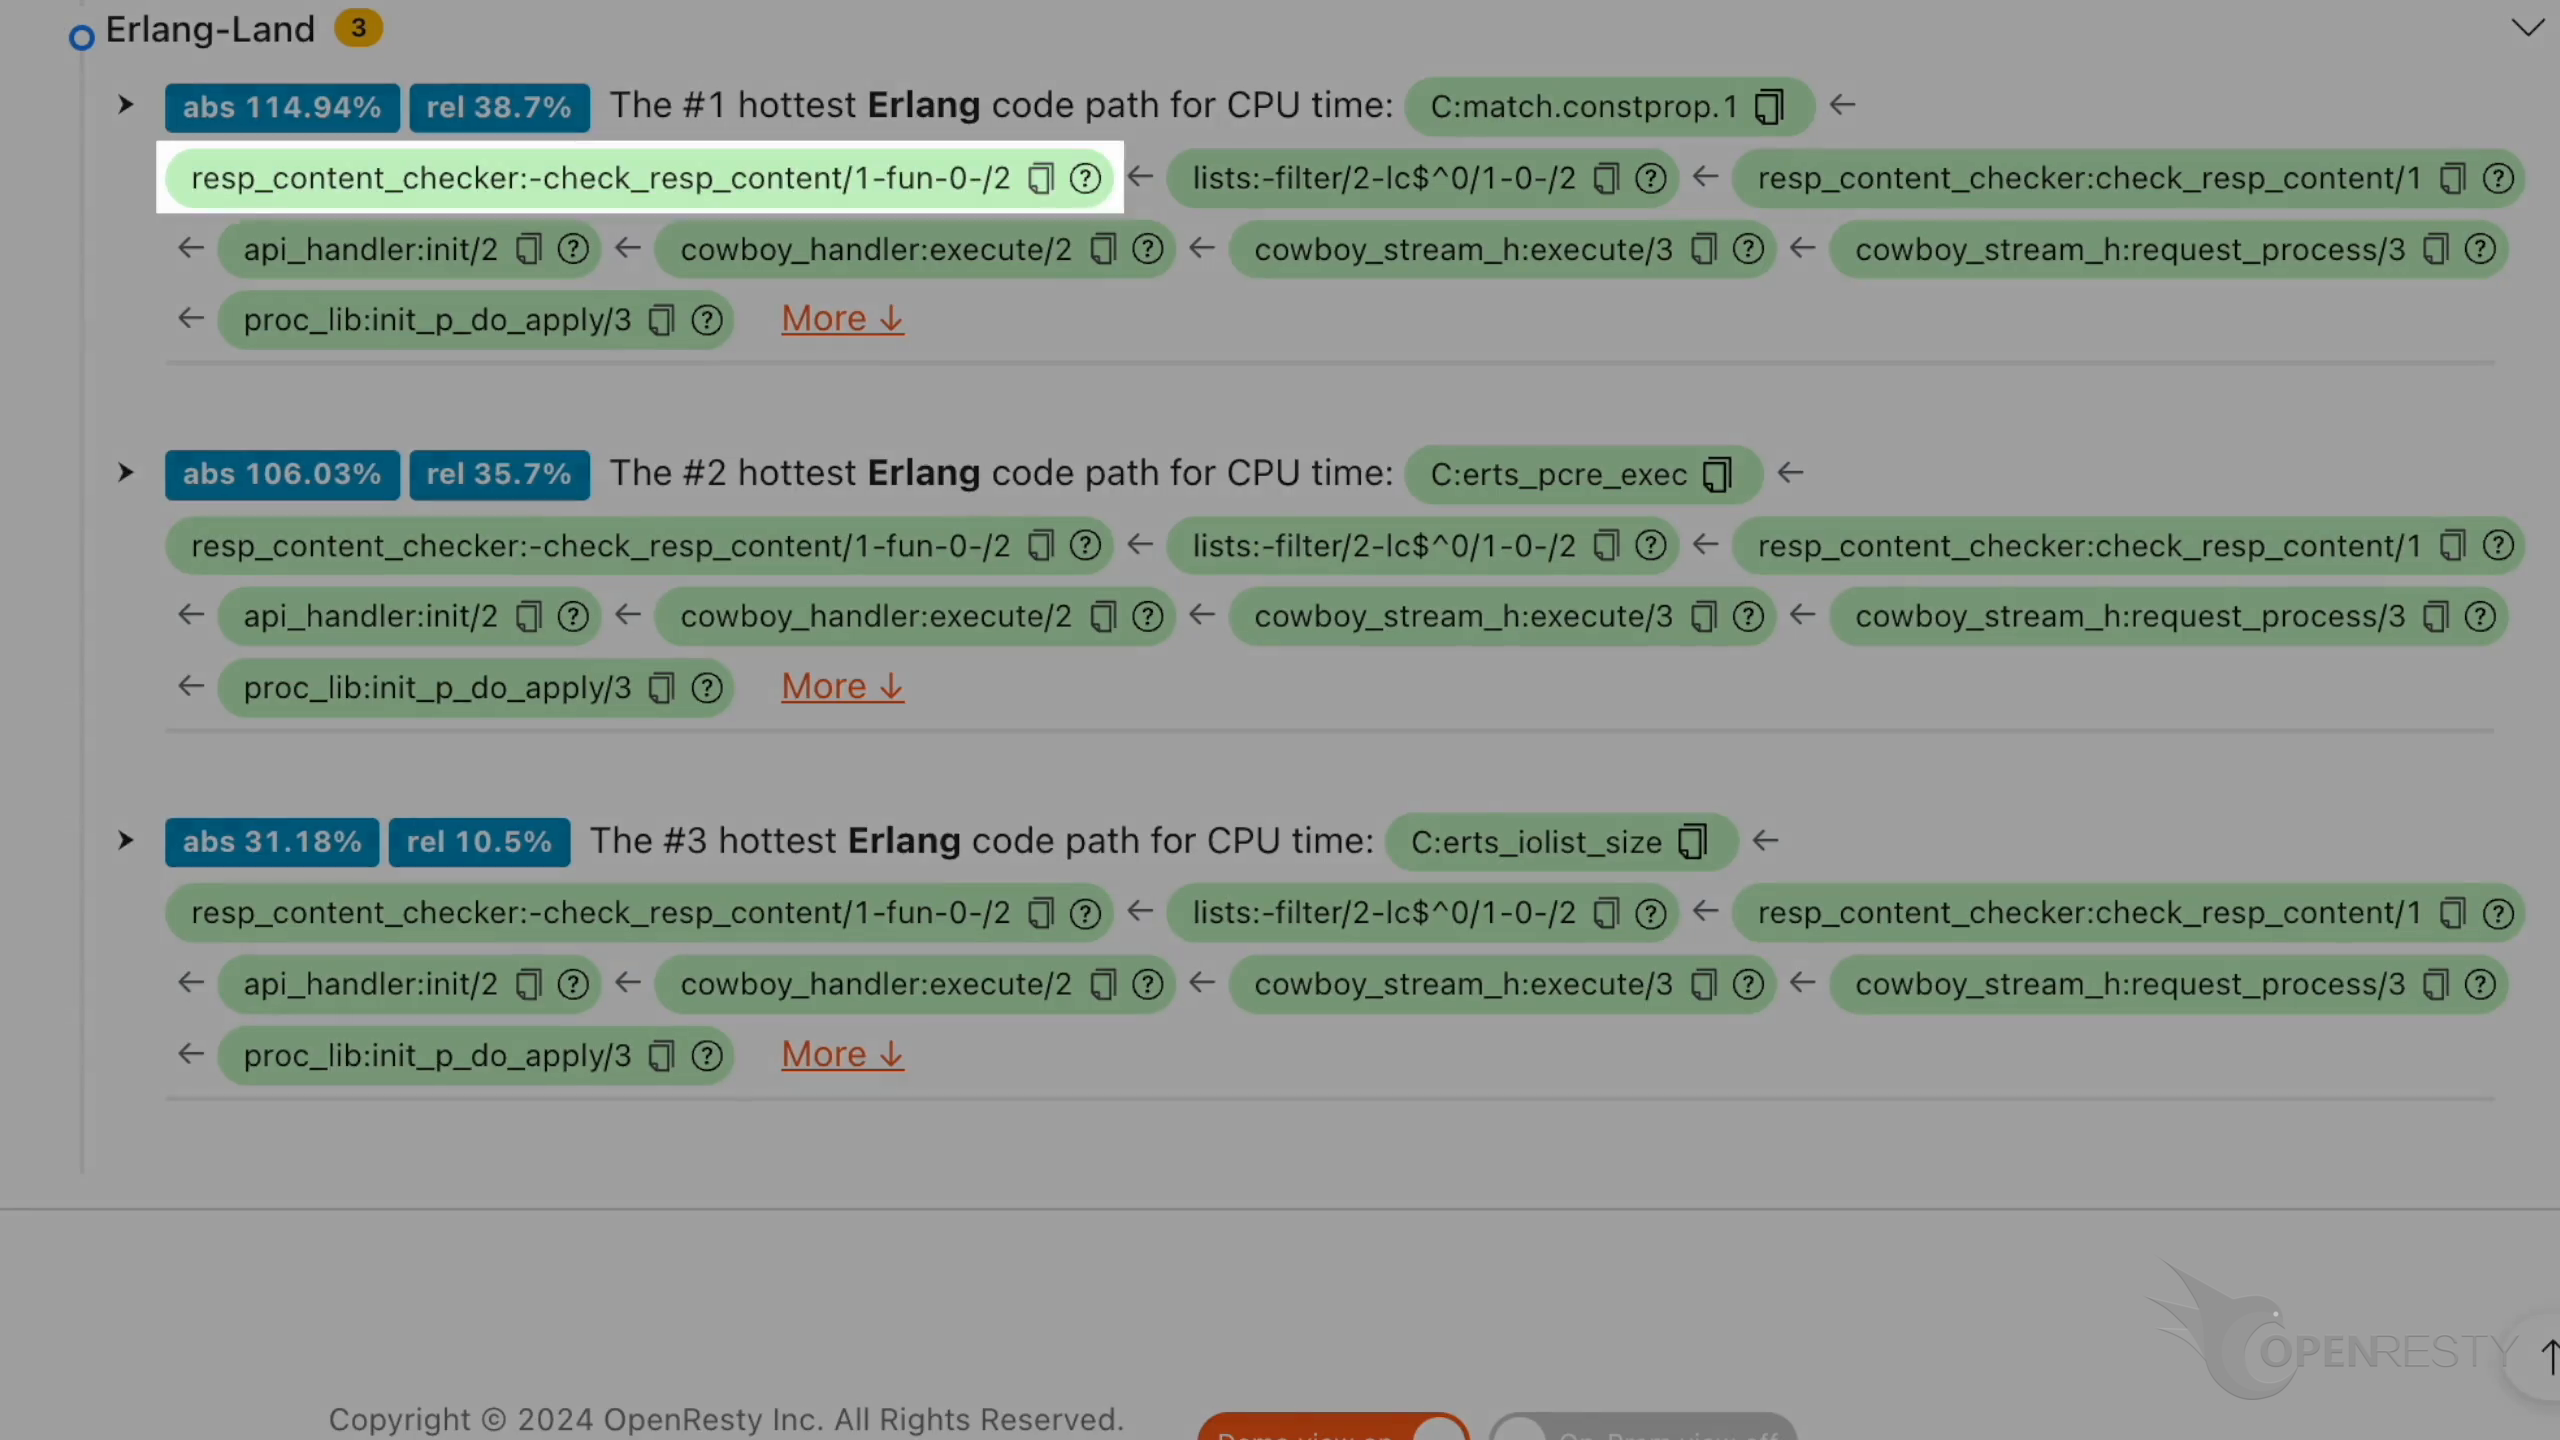
Click “More” to see details about this hottest code path.
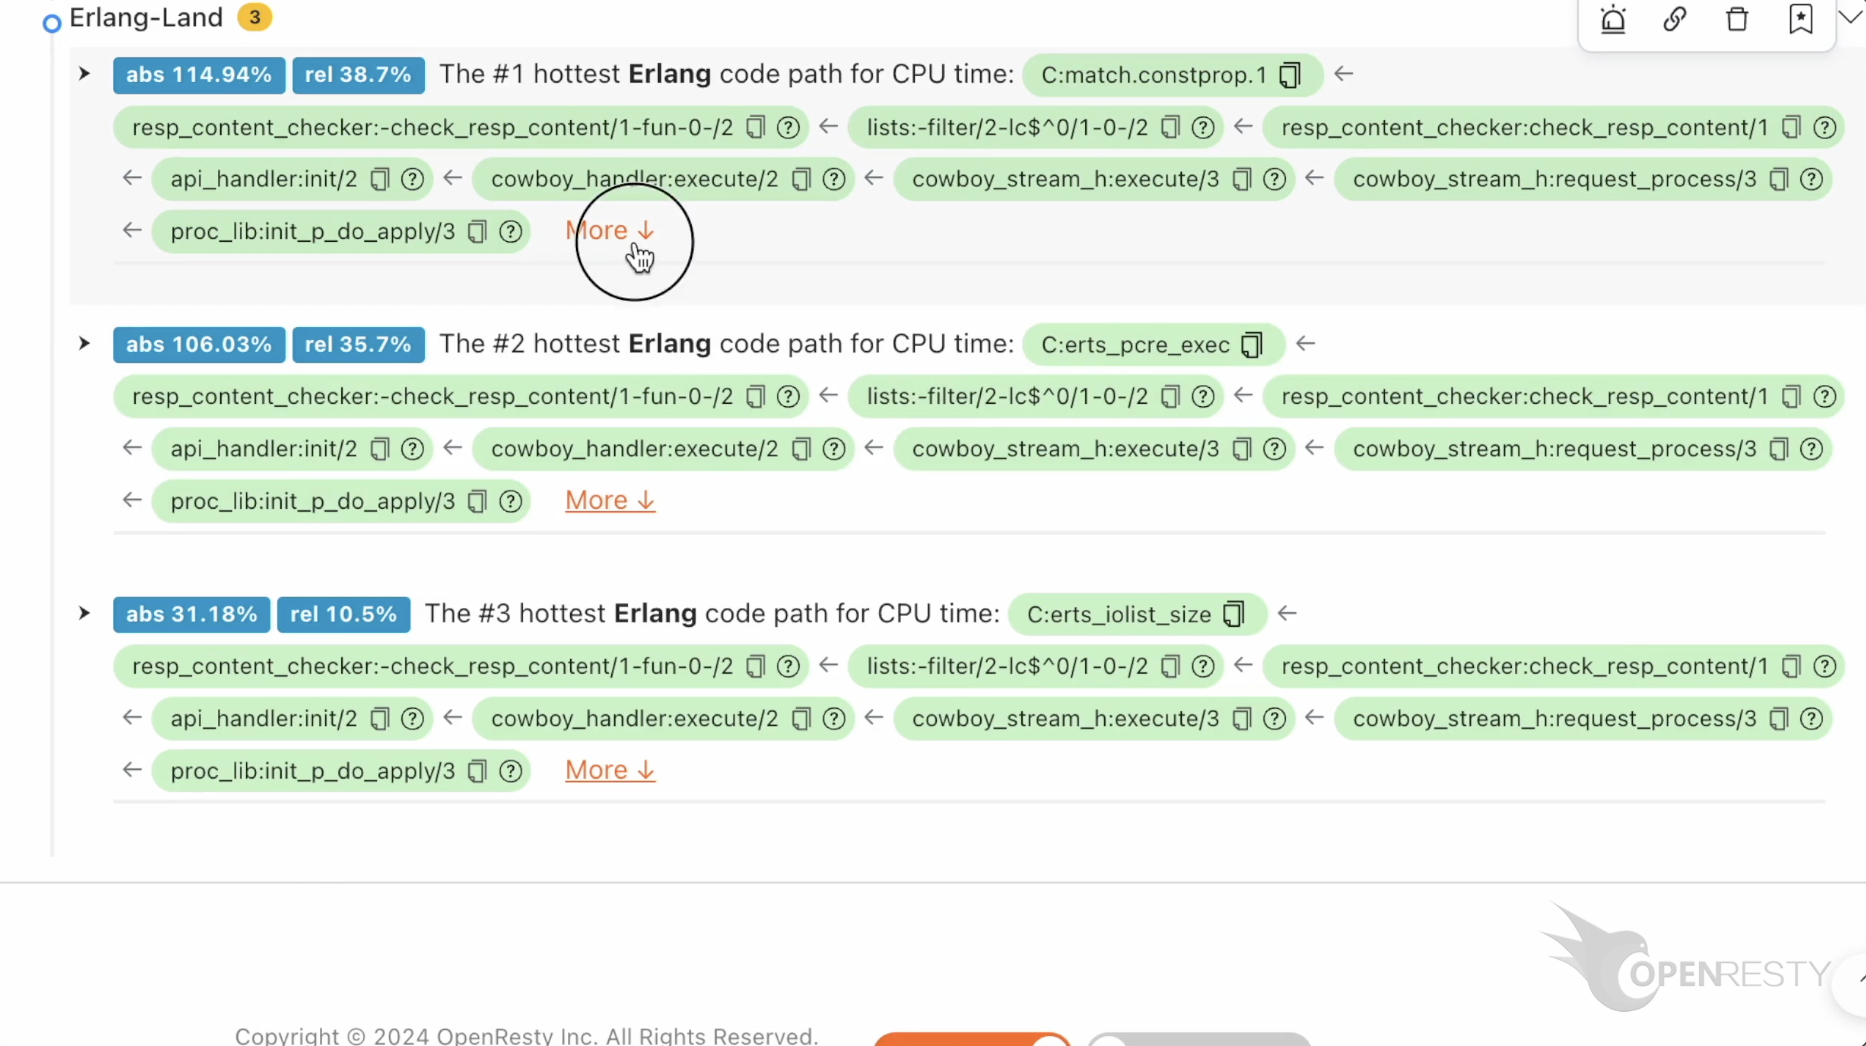
This code path is automatically inferred from this Erlang-level CPU flame graph.
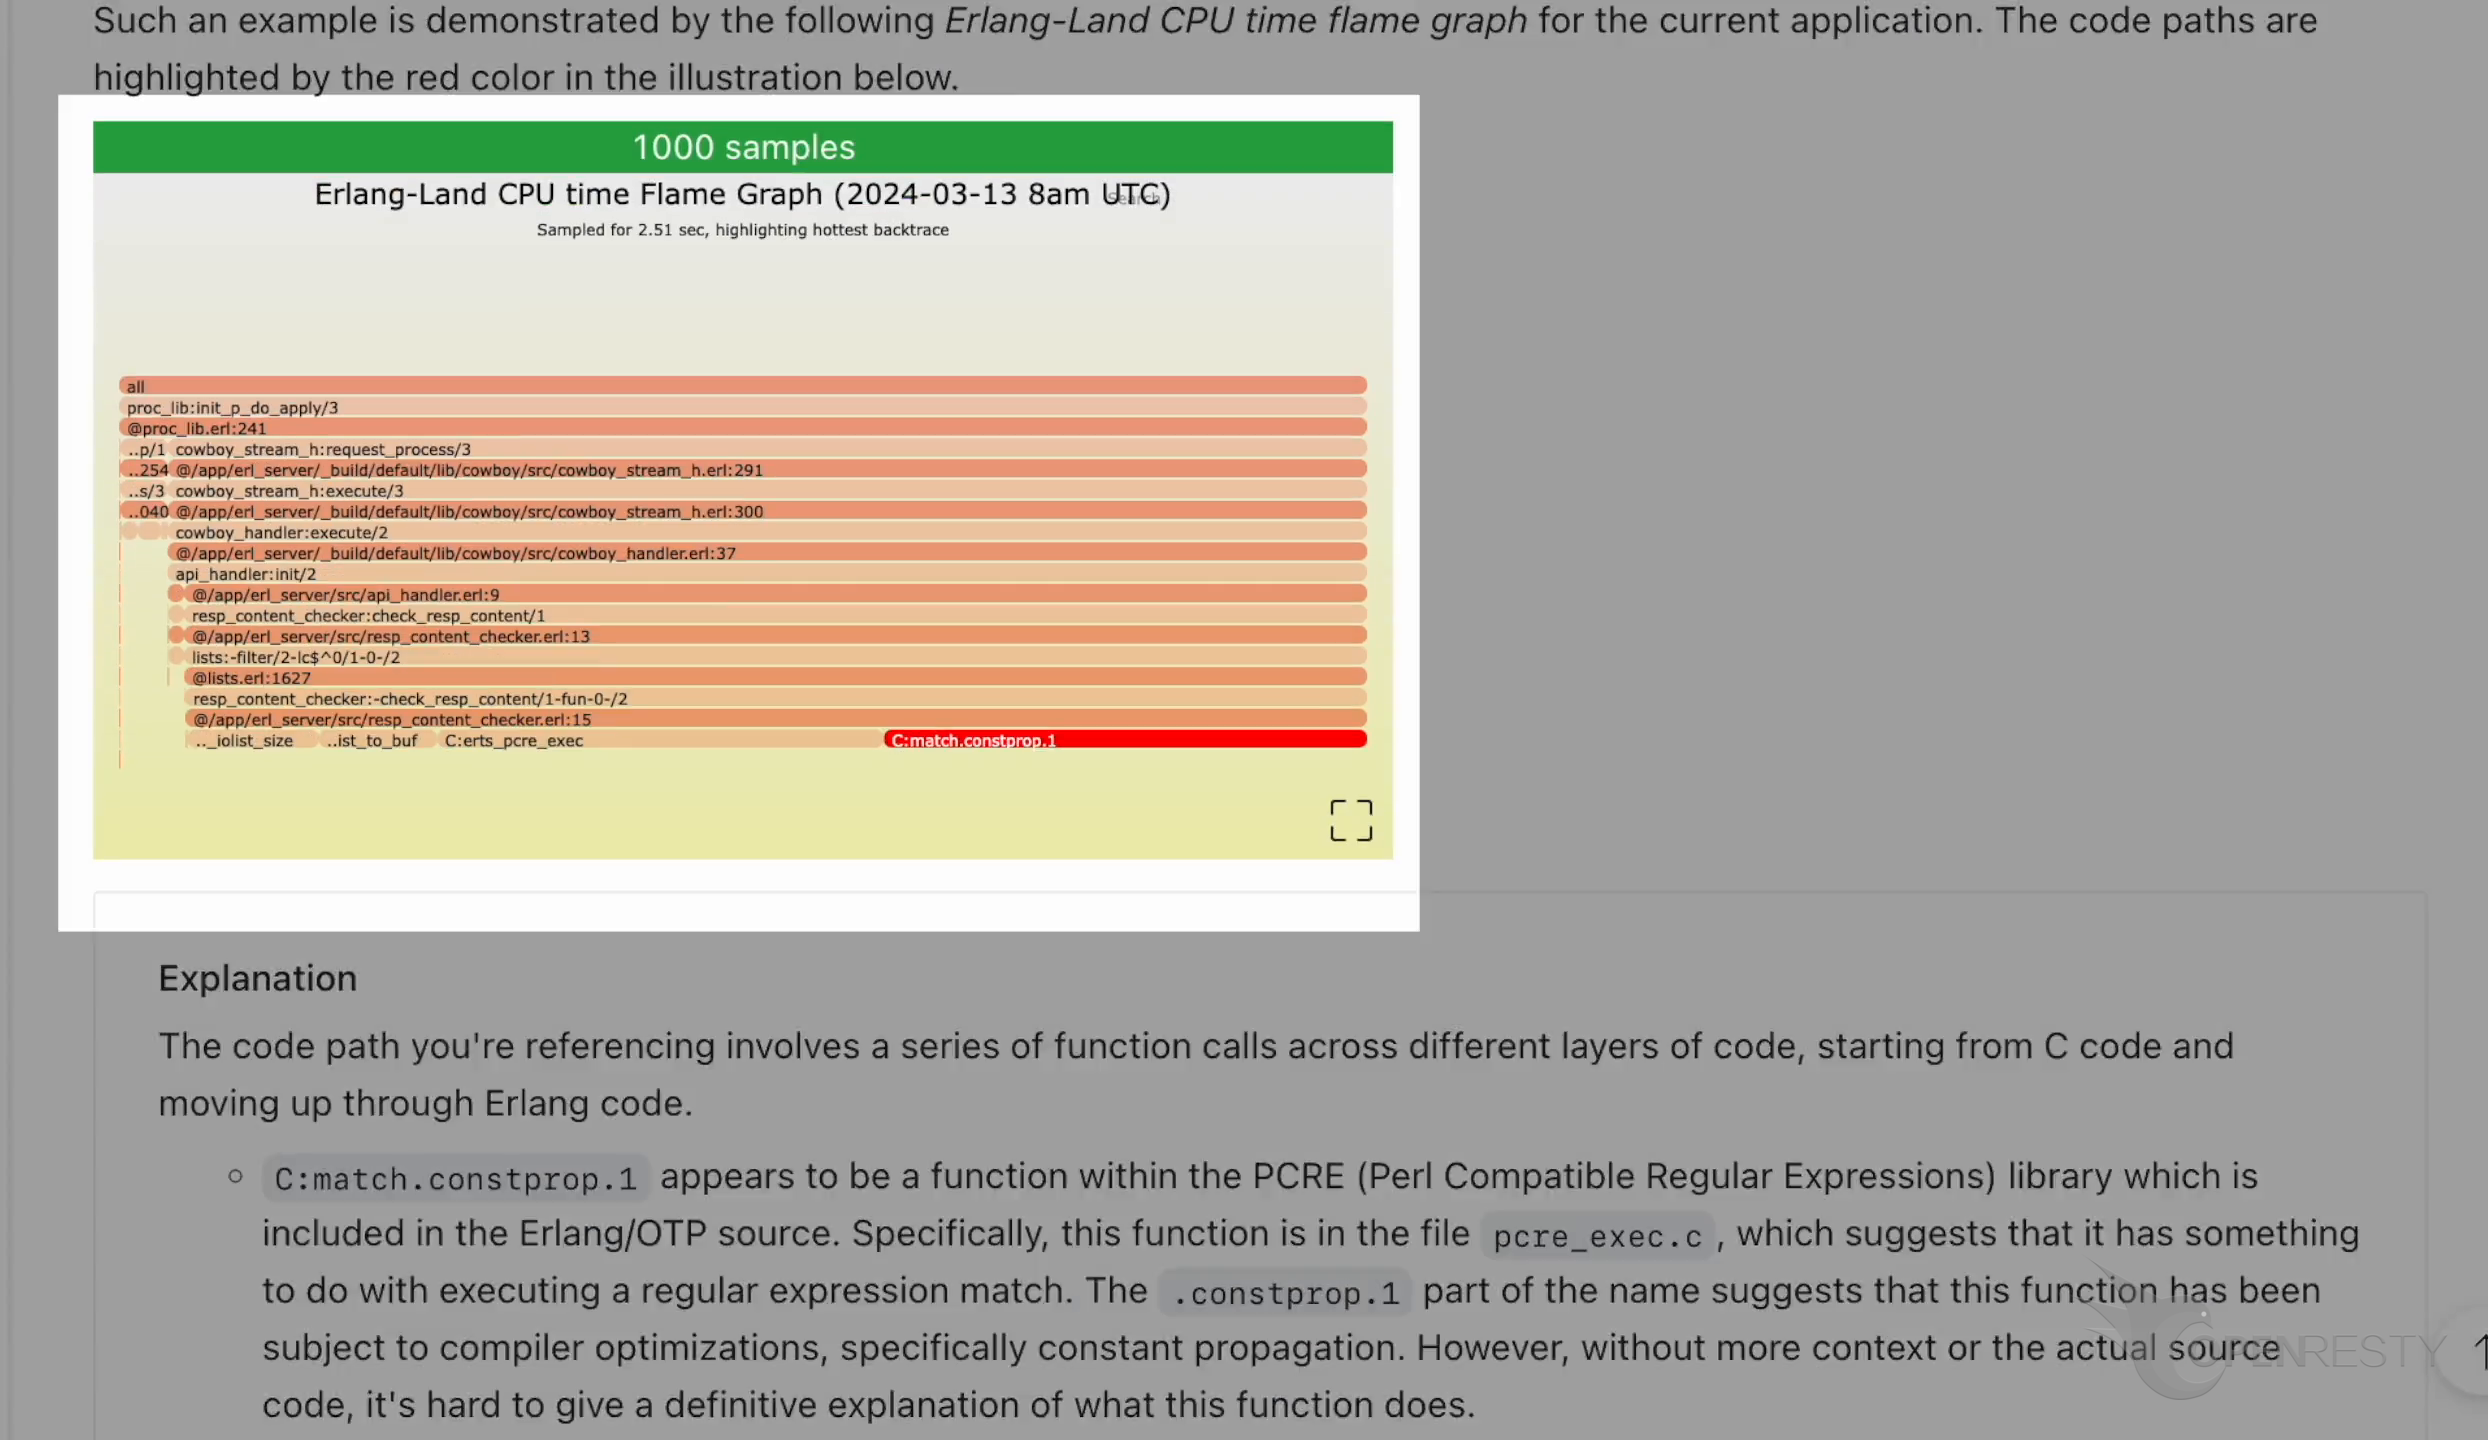
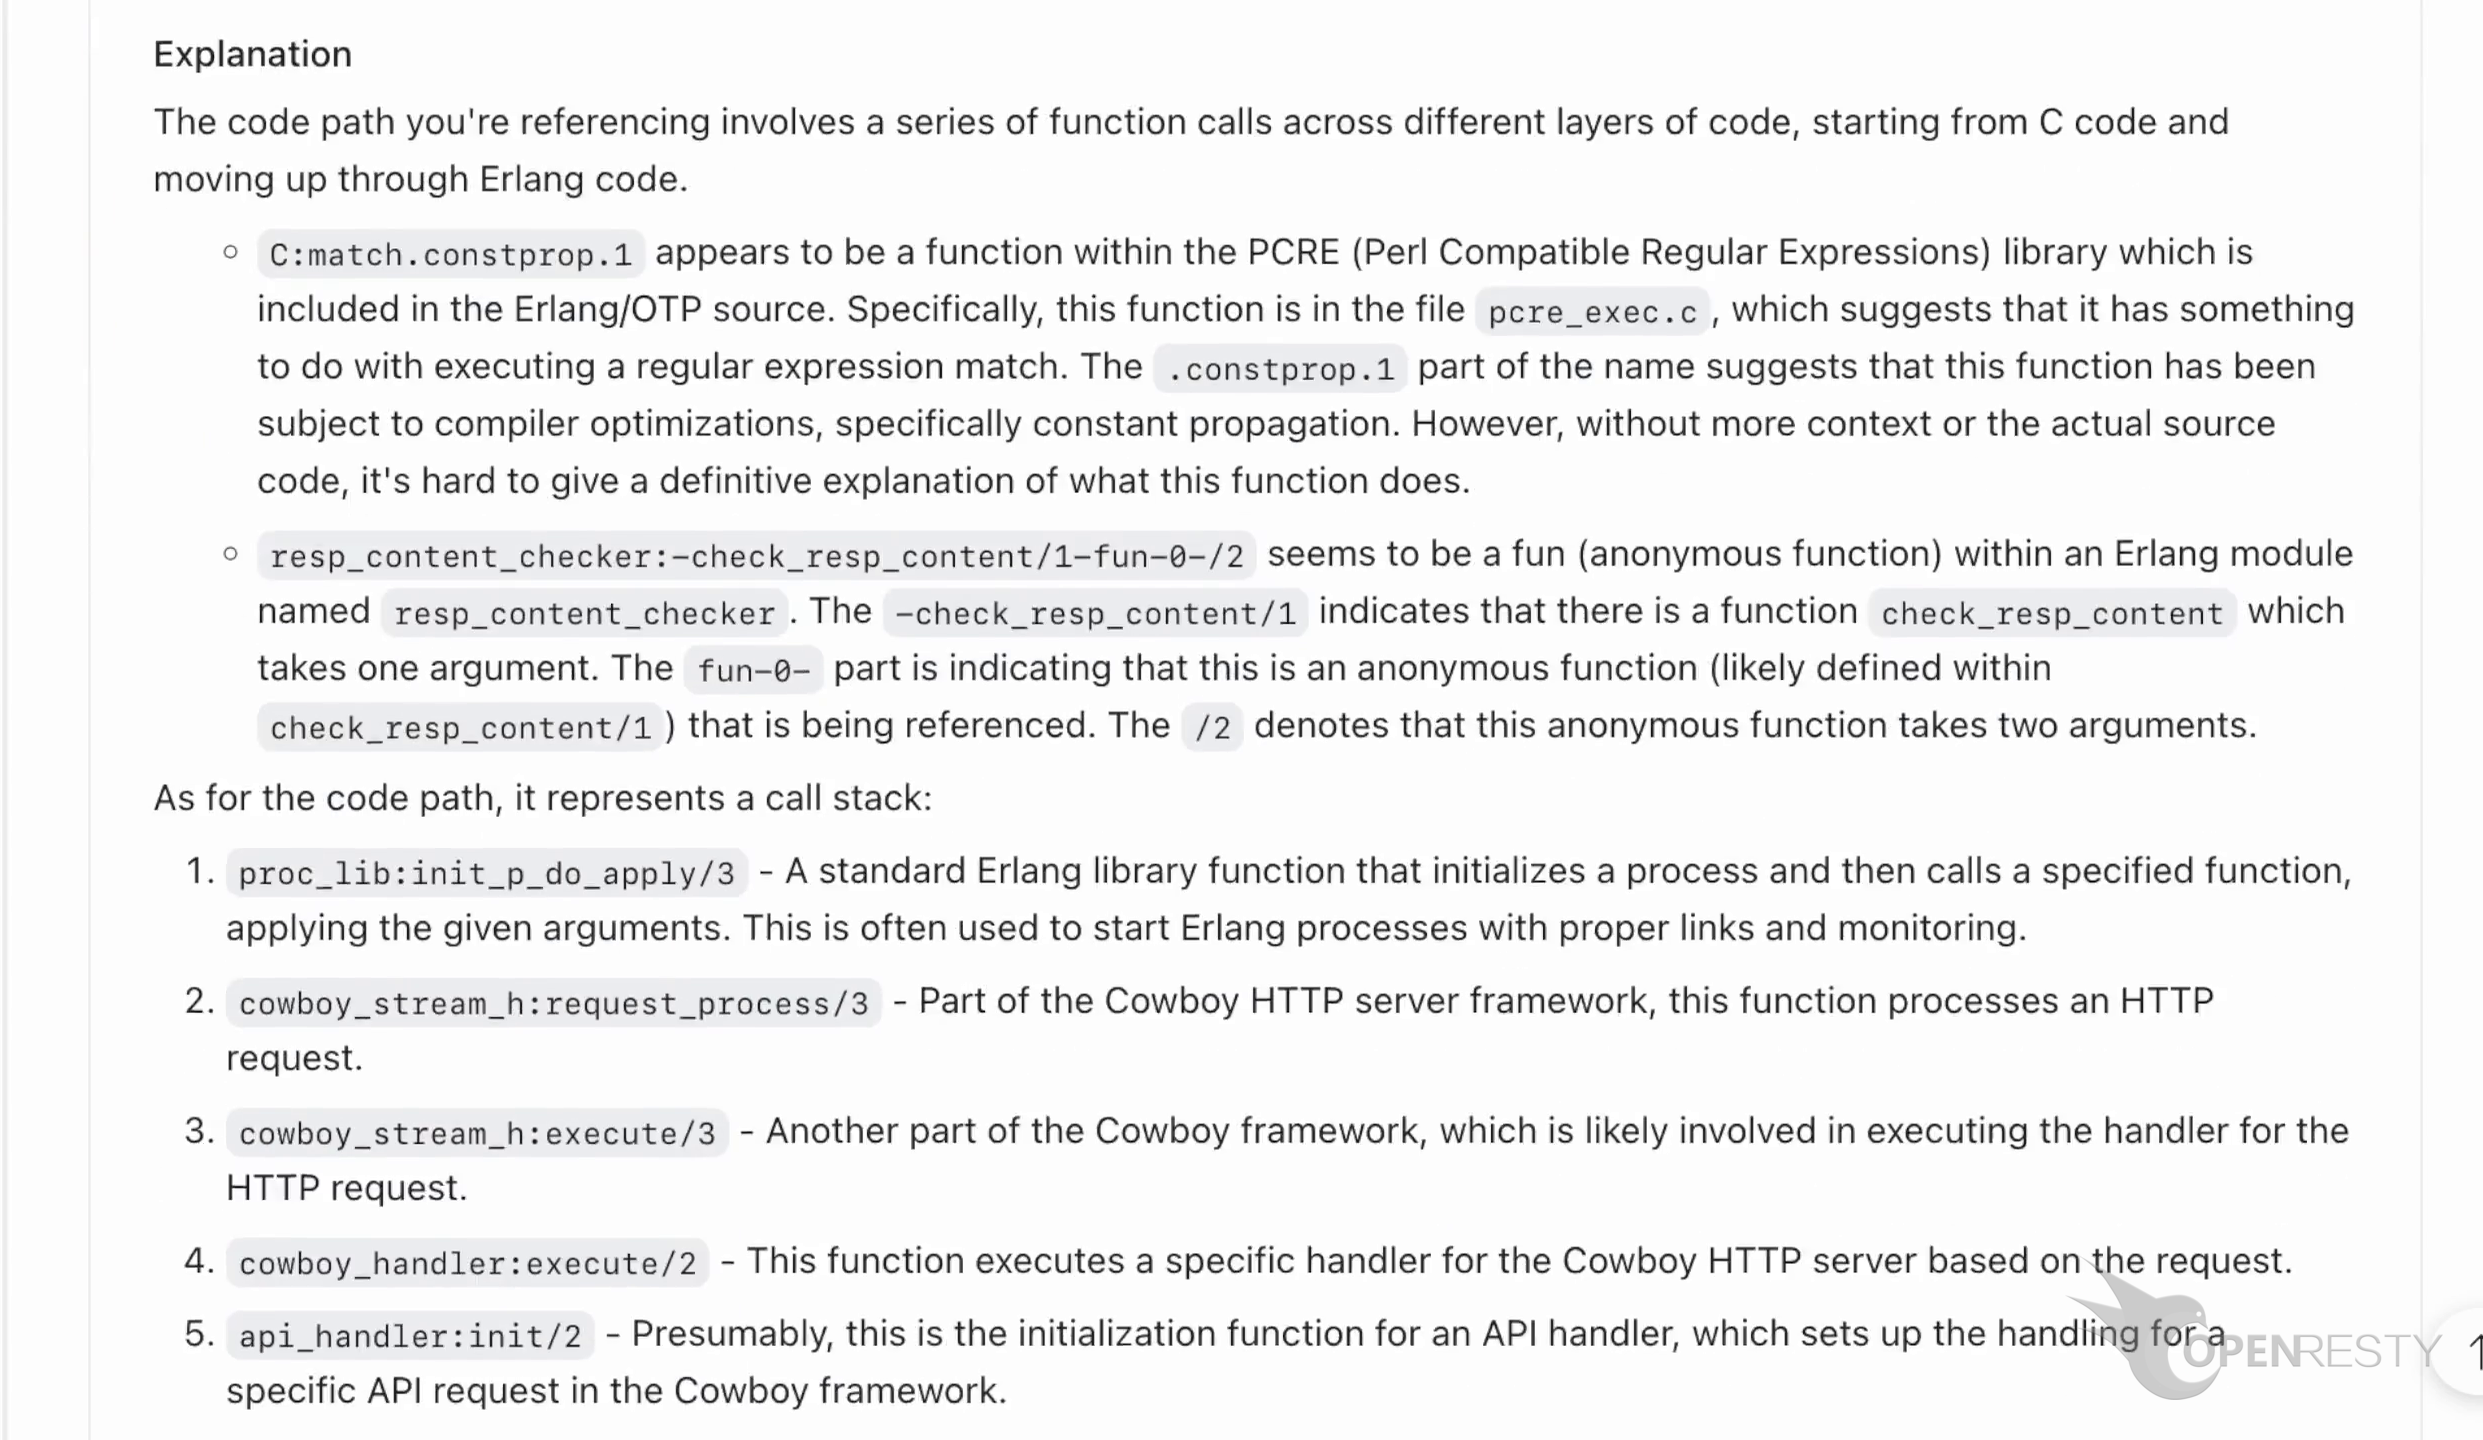
Here are more detailed explanations of the earlier code path.
Go back to the previous hot code path. Hover the mouse over the green box for the first function. You can see the source file of this function in the tooltip.
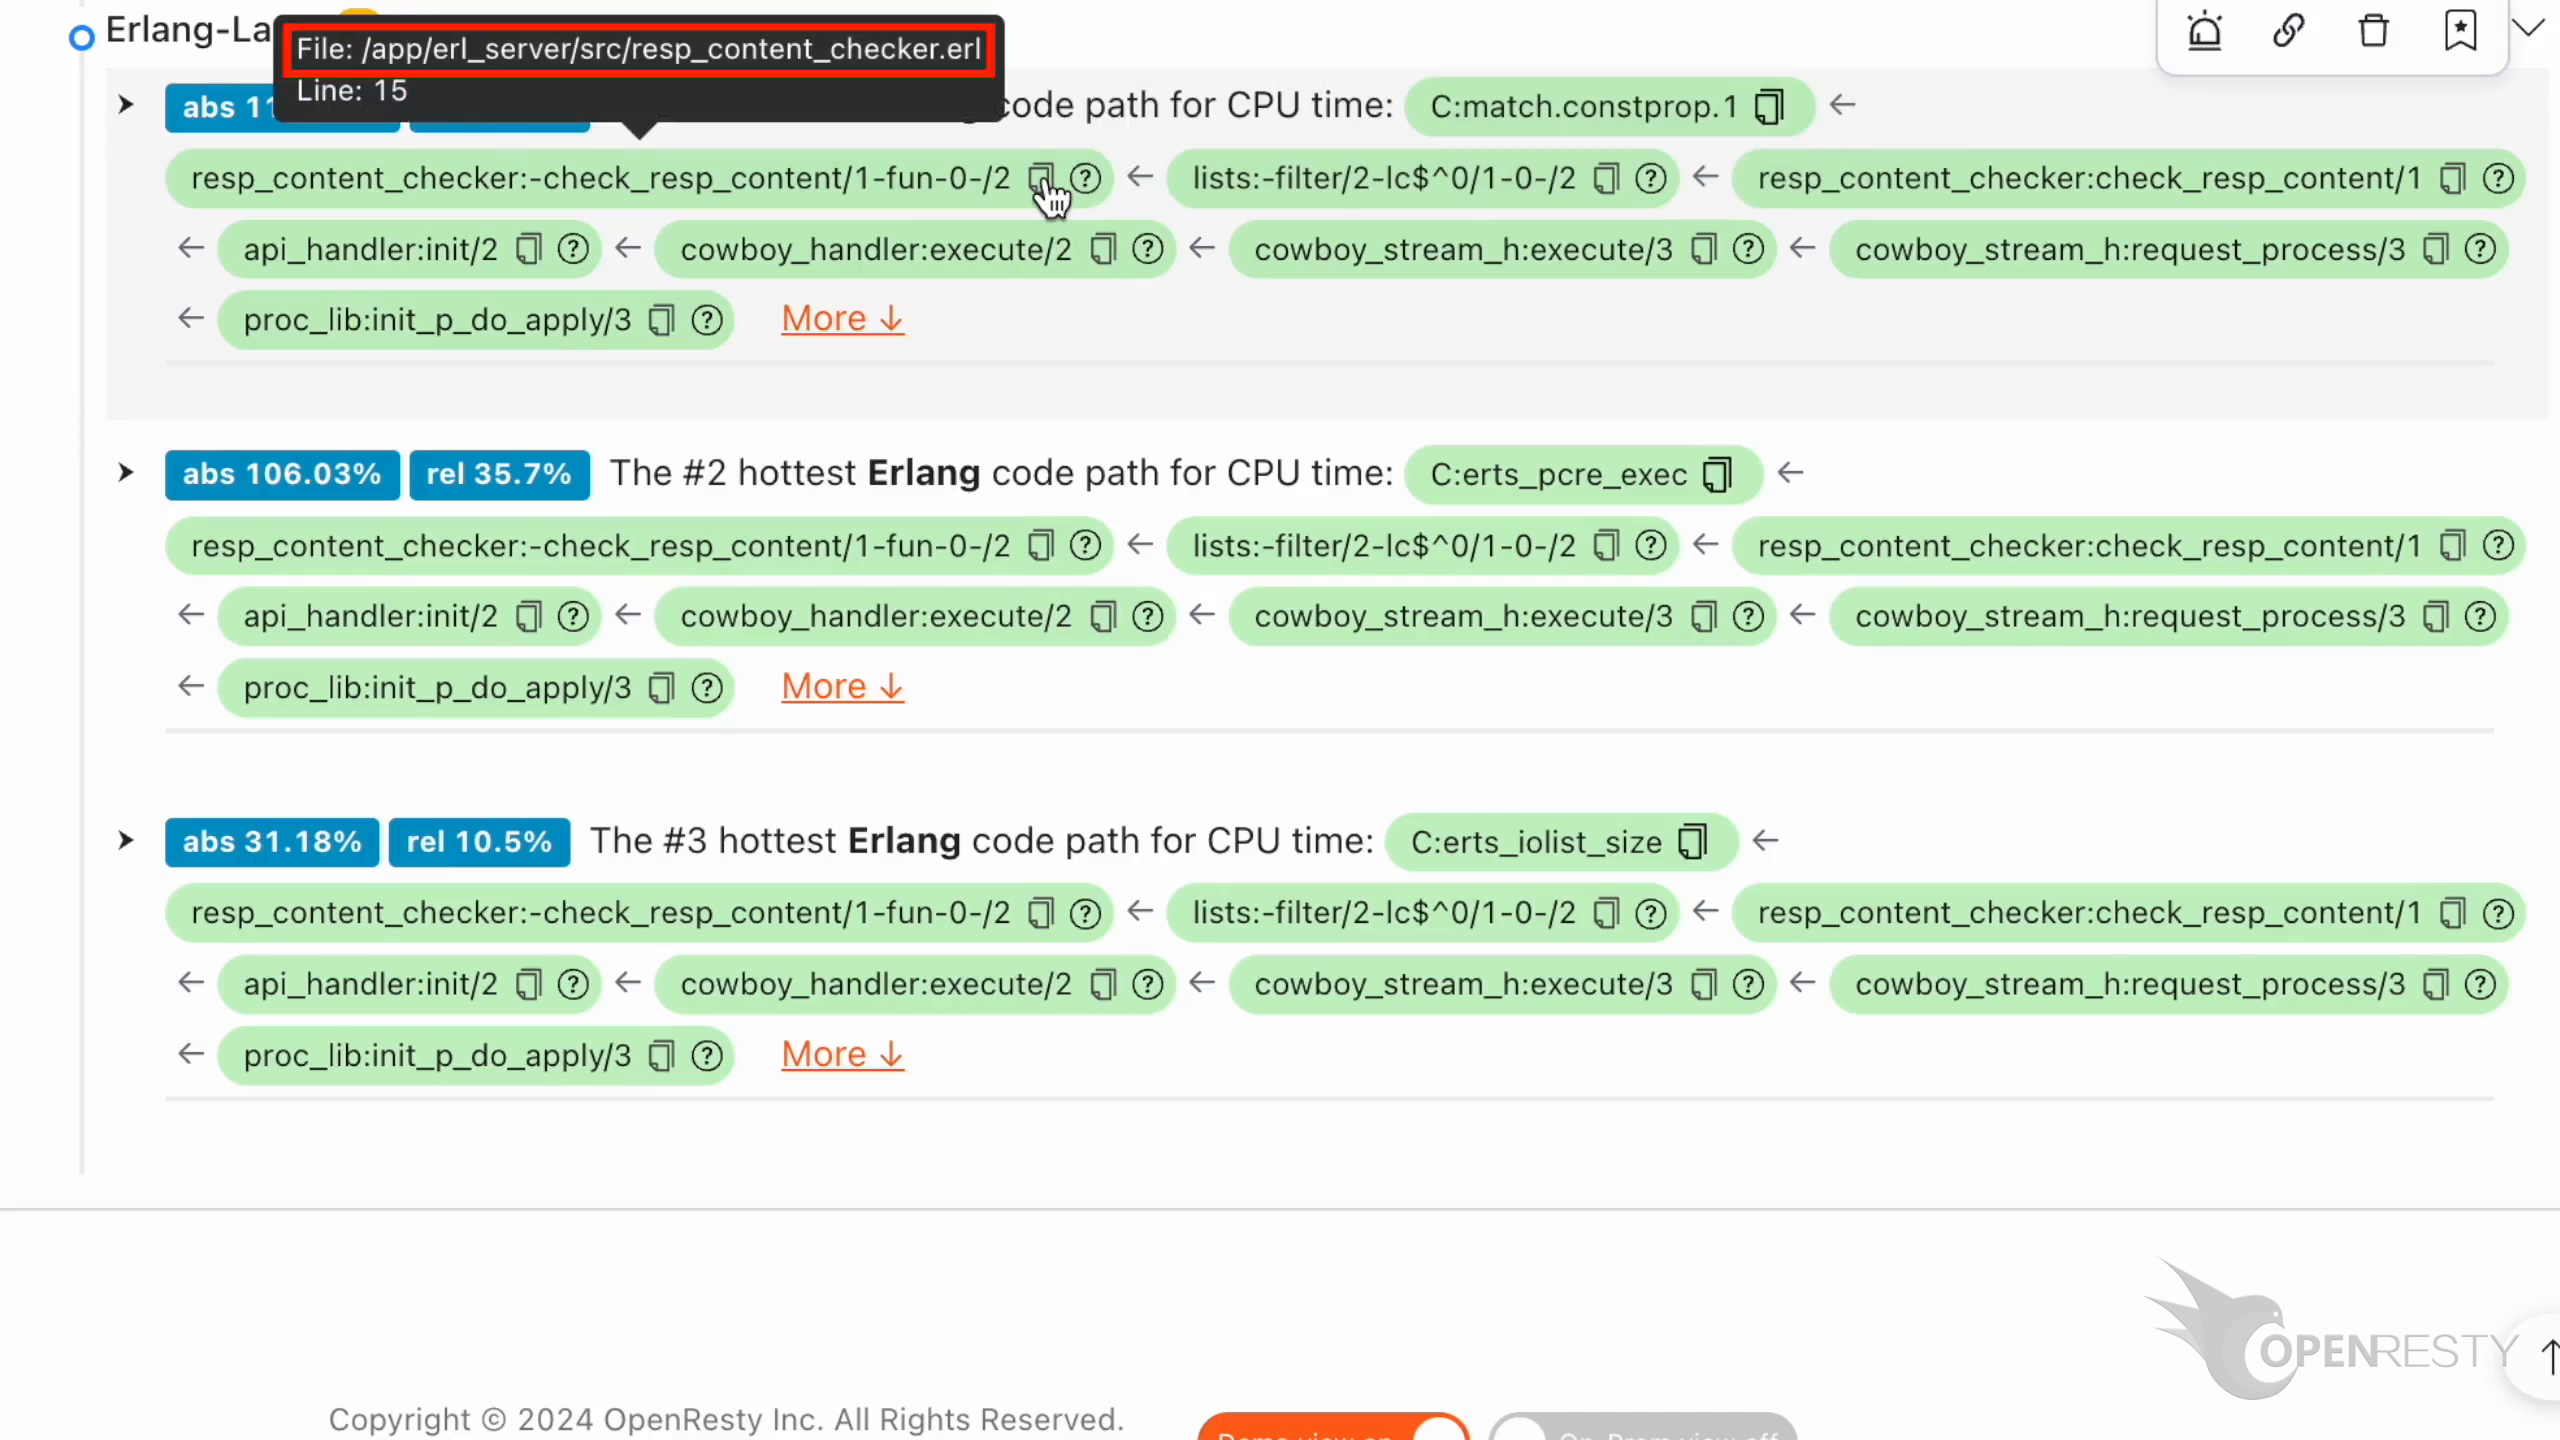
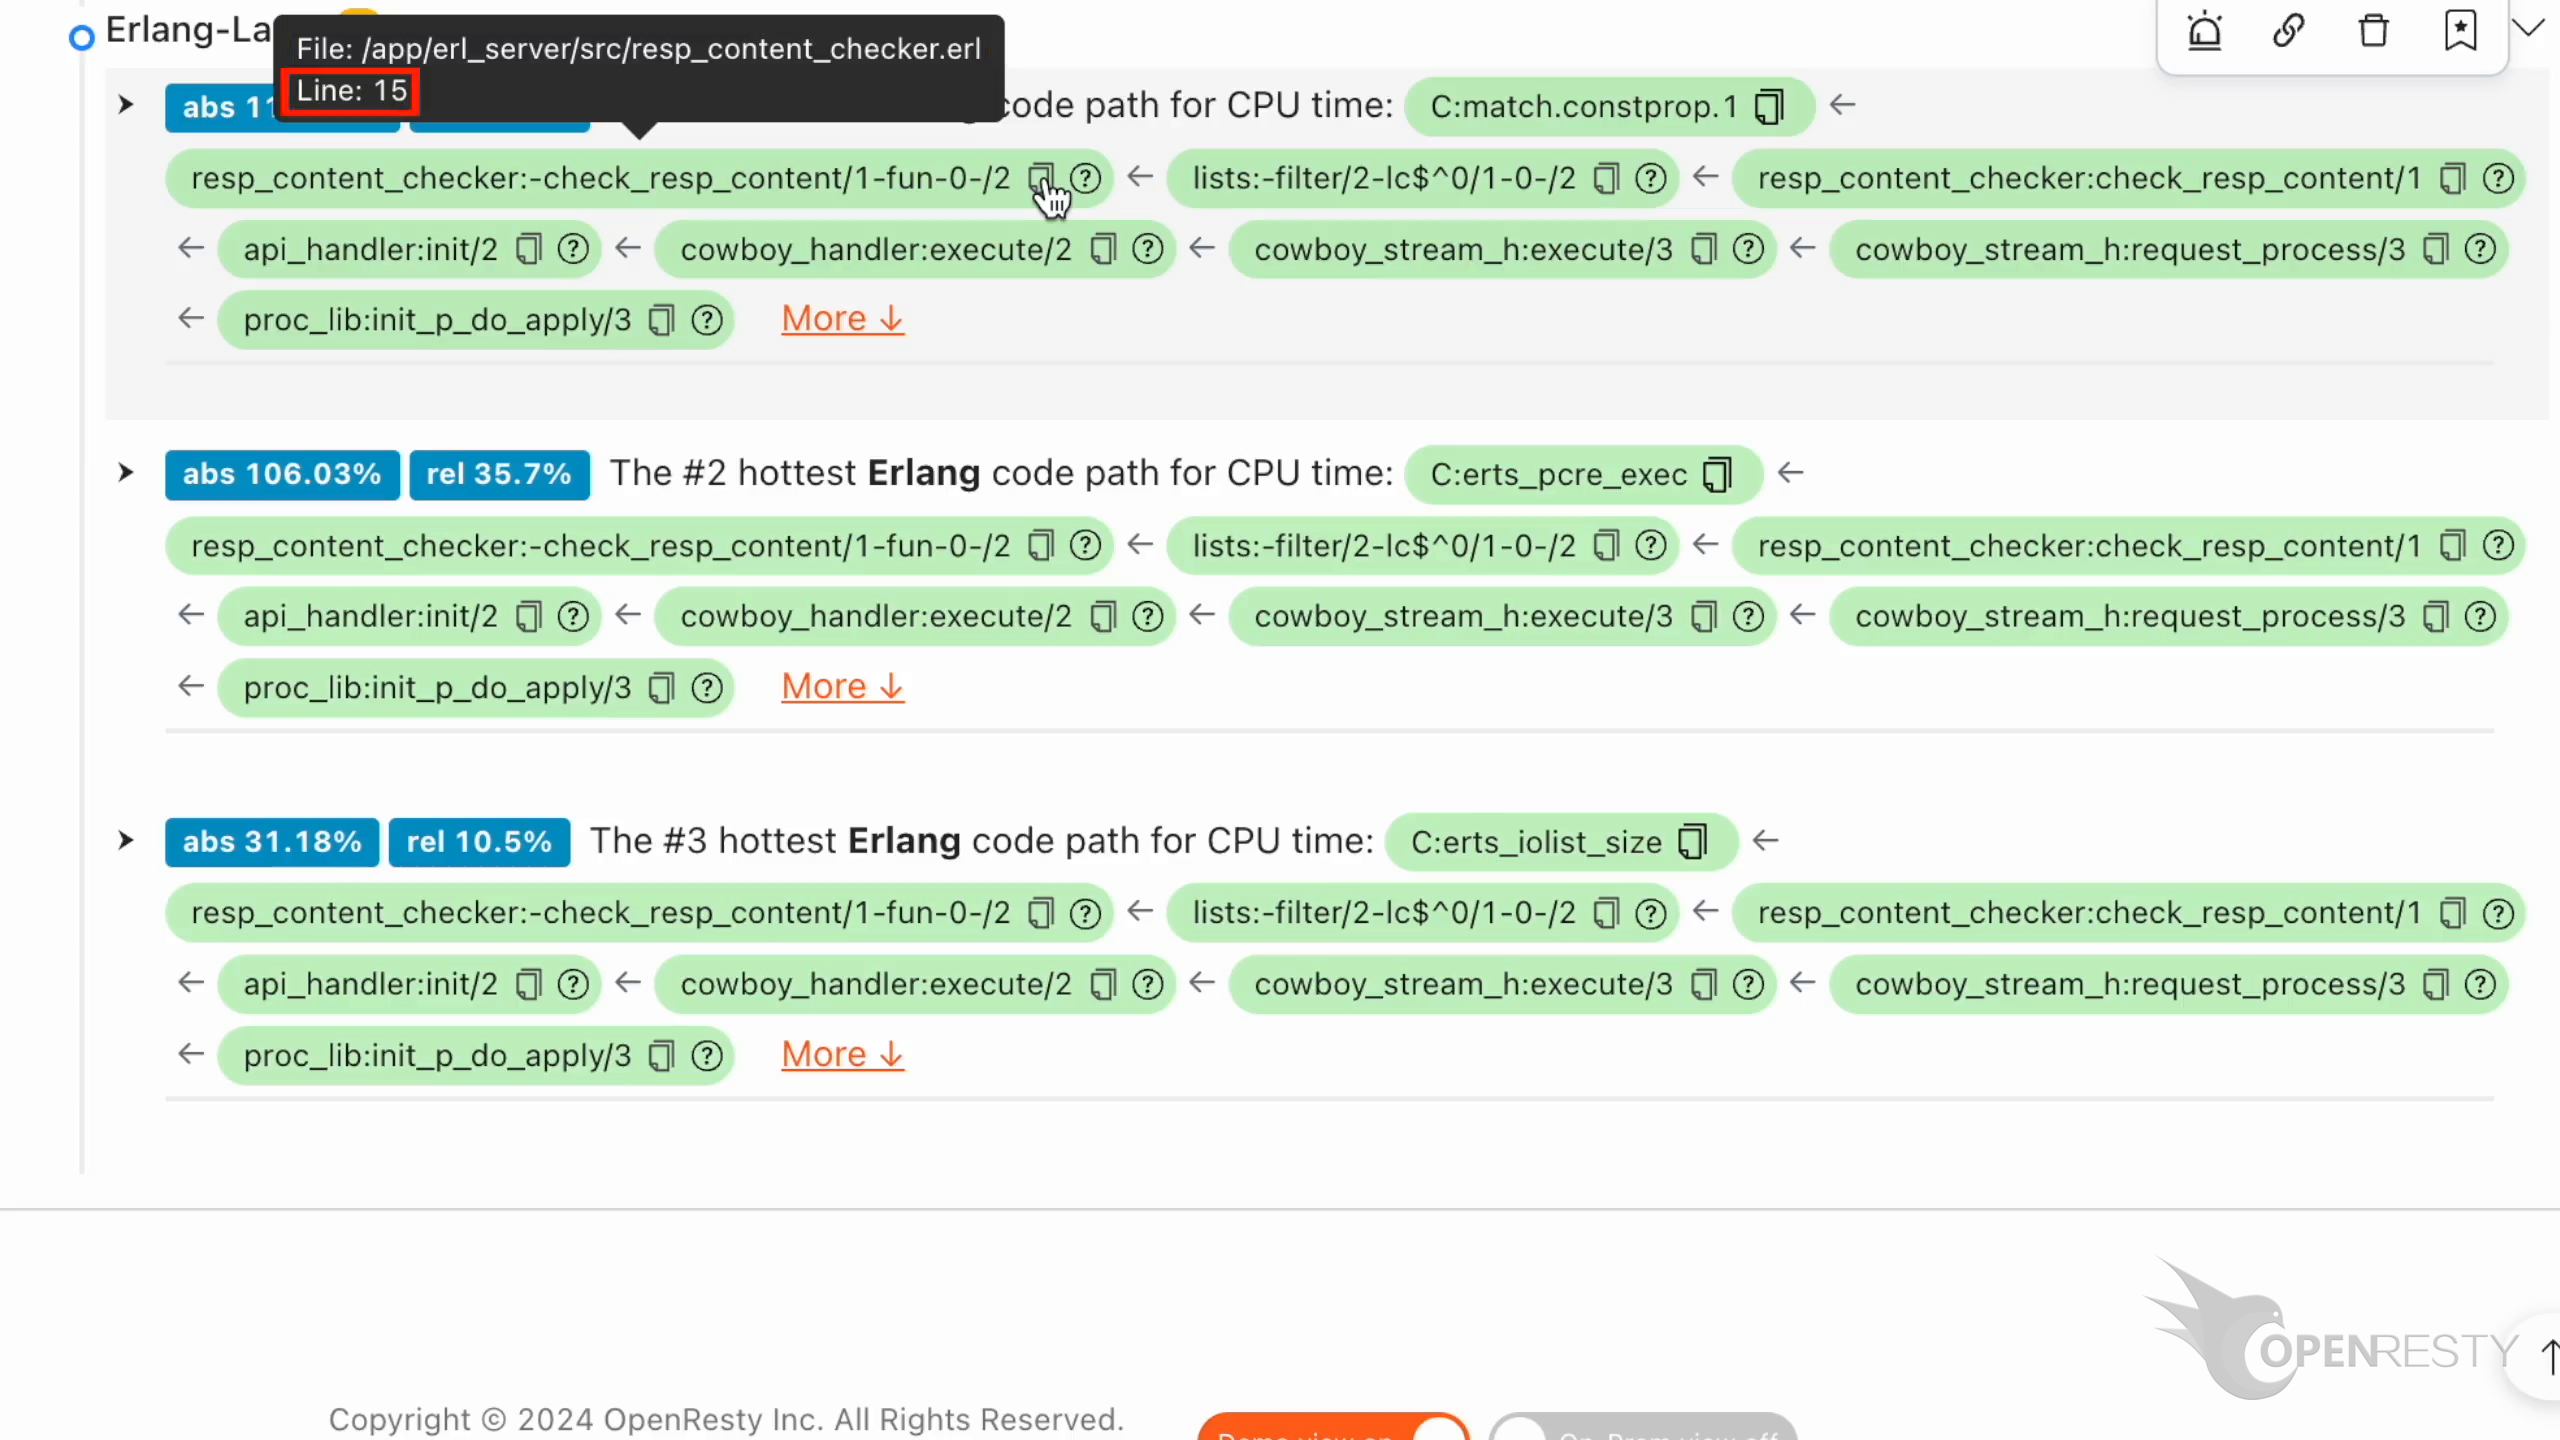
The Erlang source line number is 15.
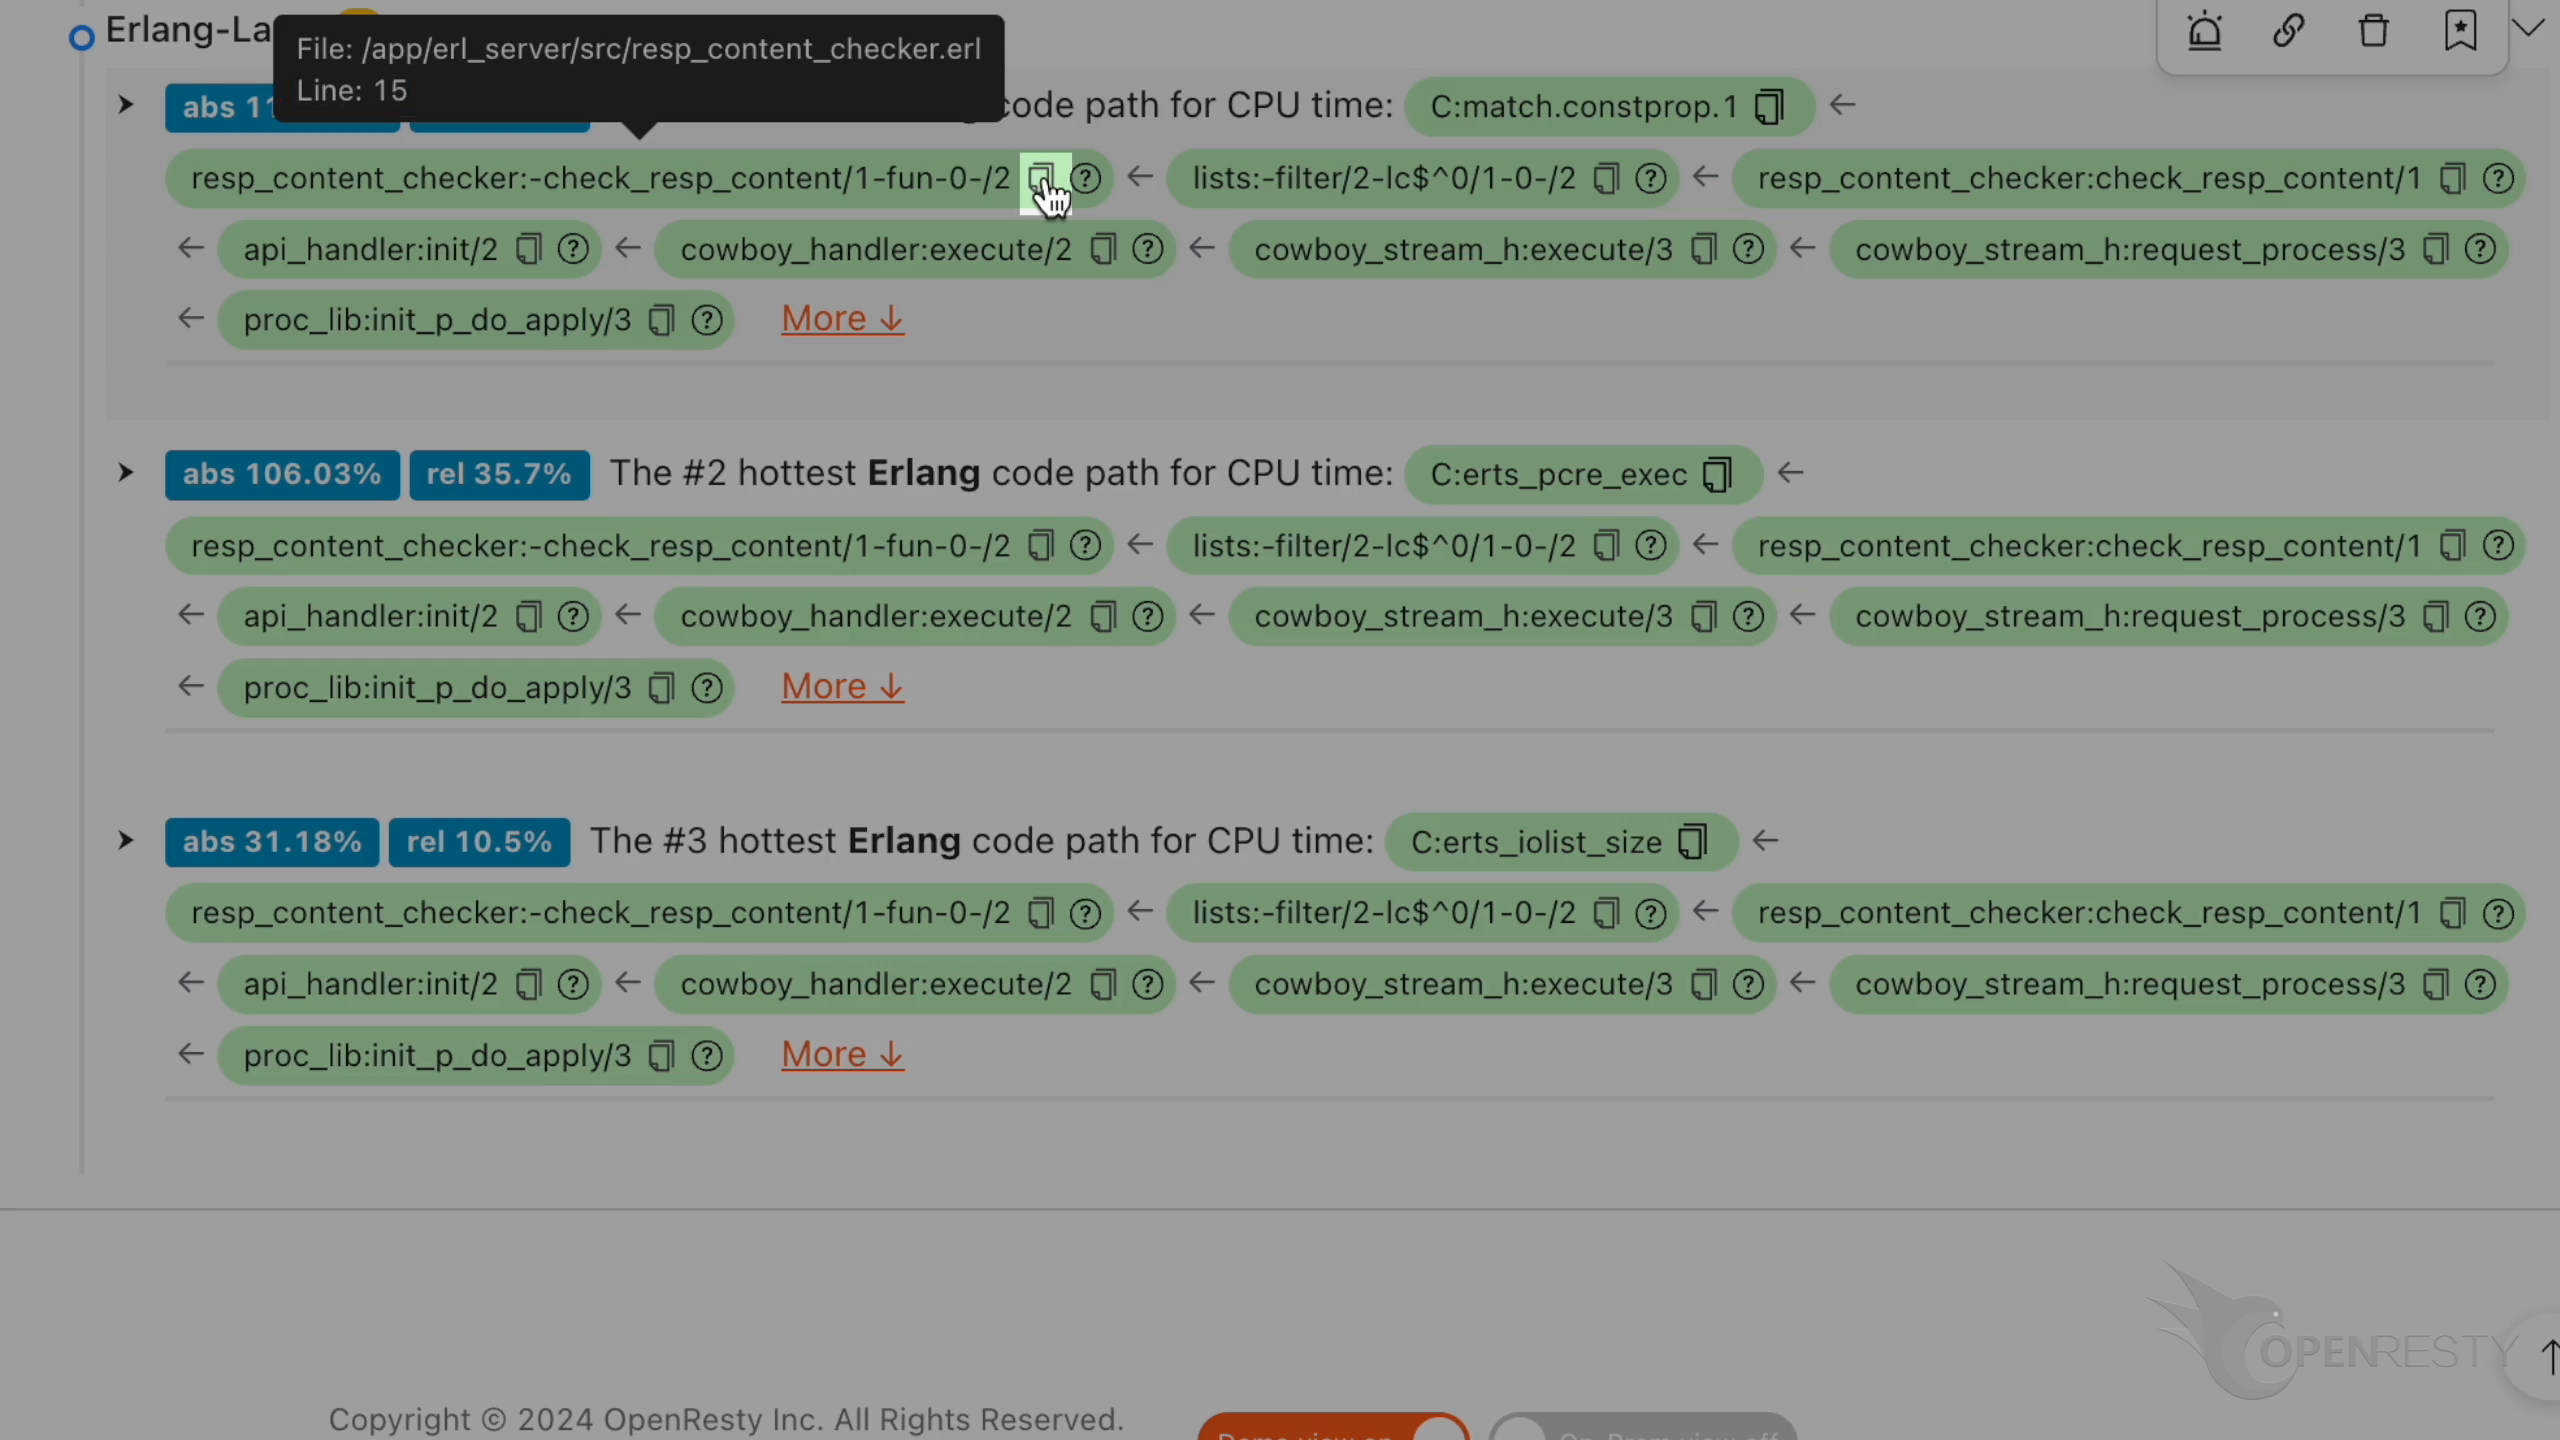
Click the icon to copy the source file path.
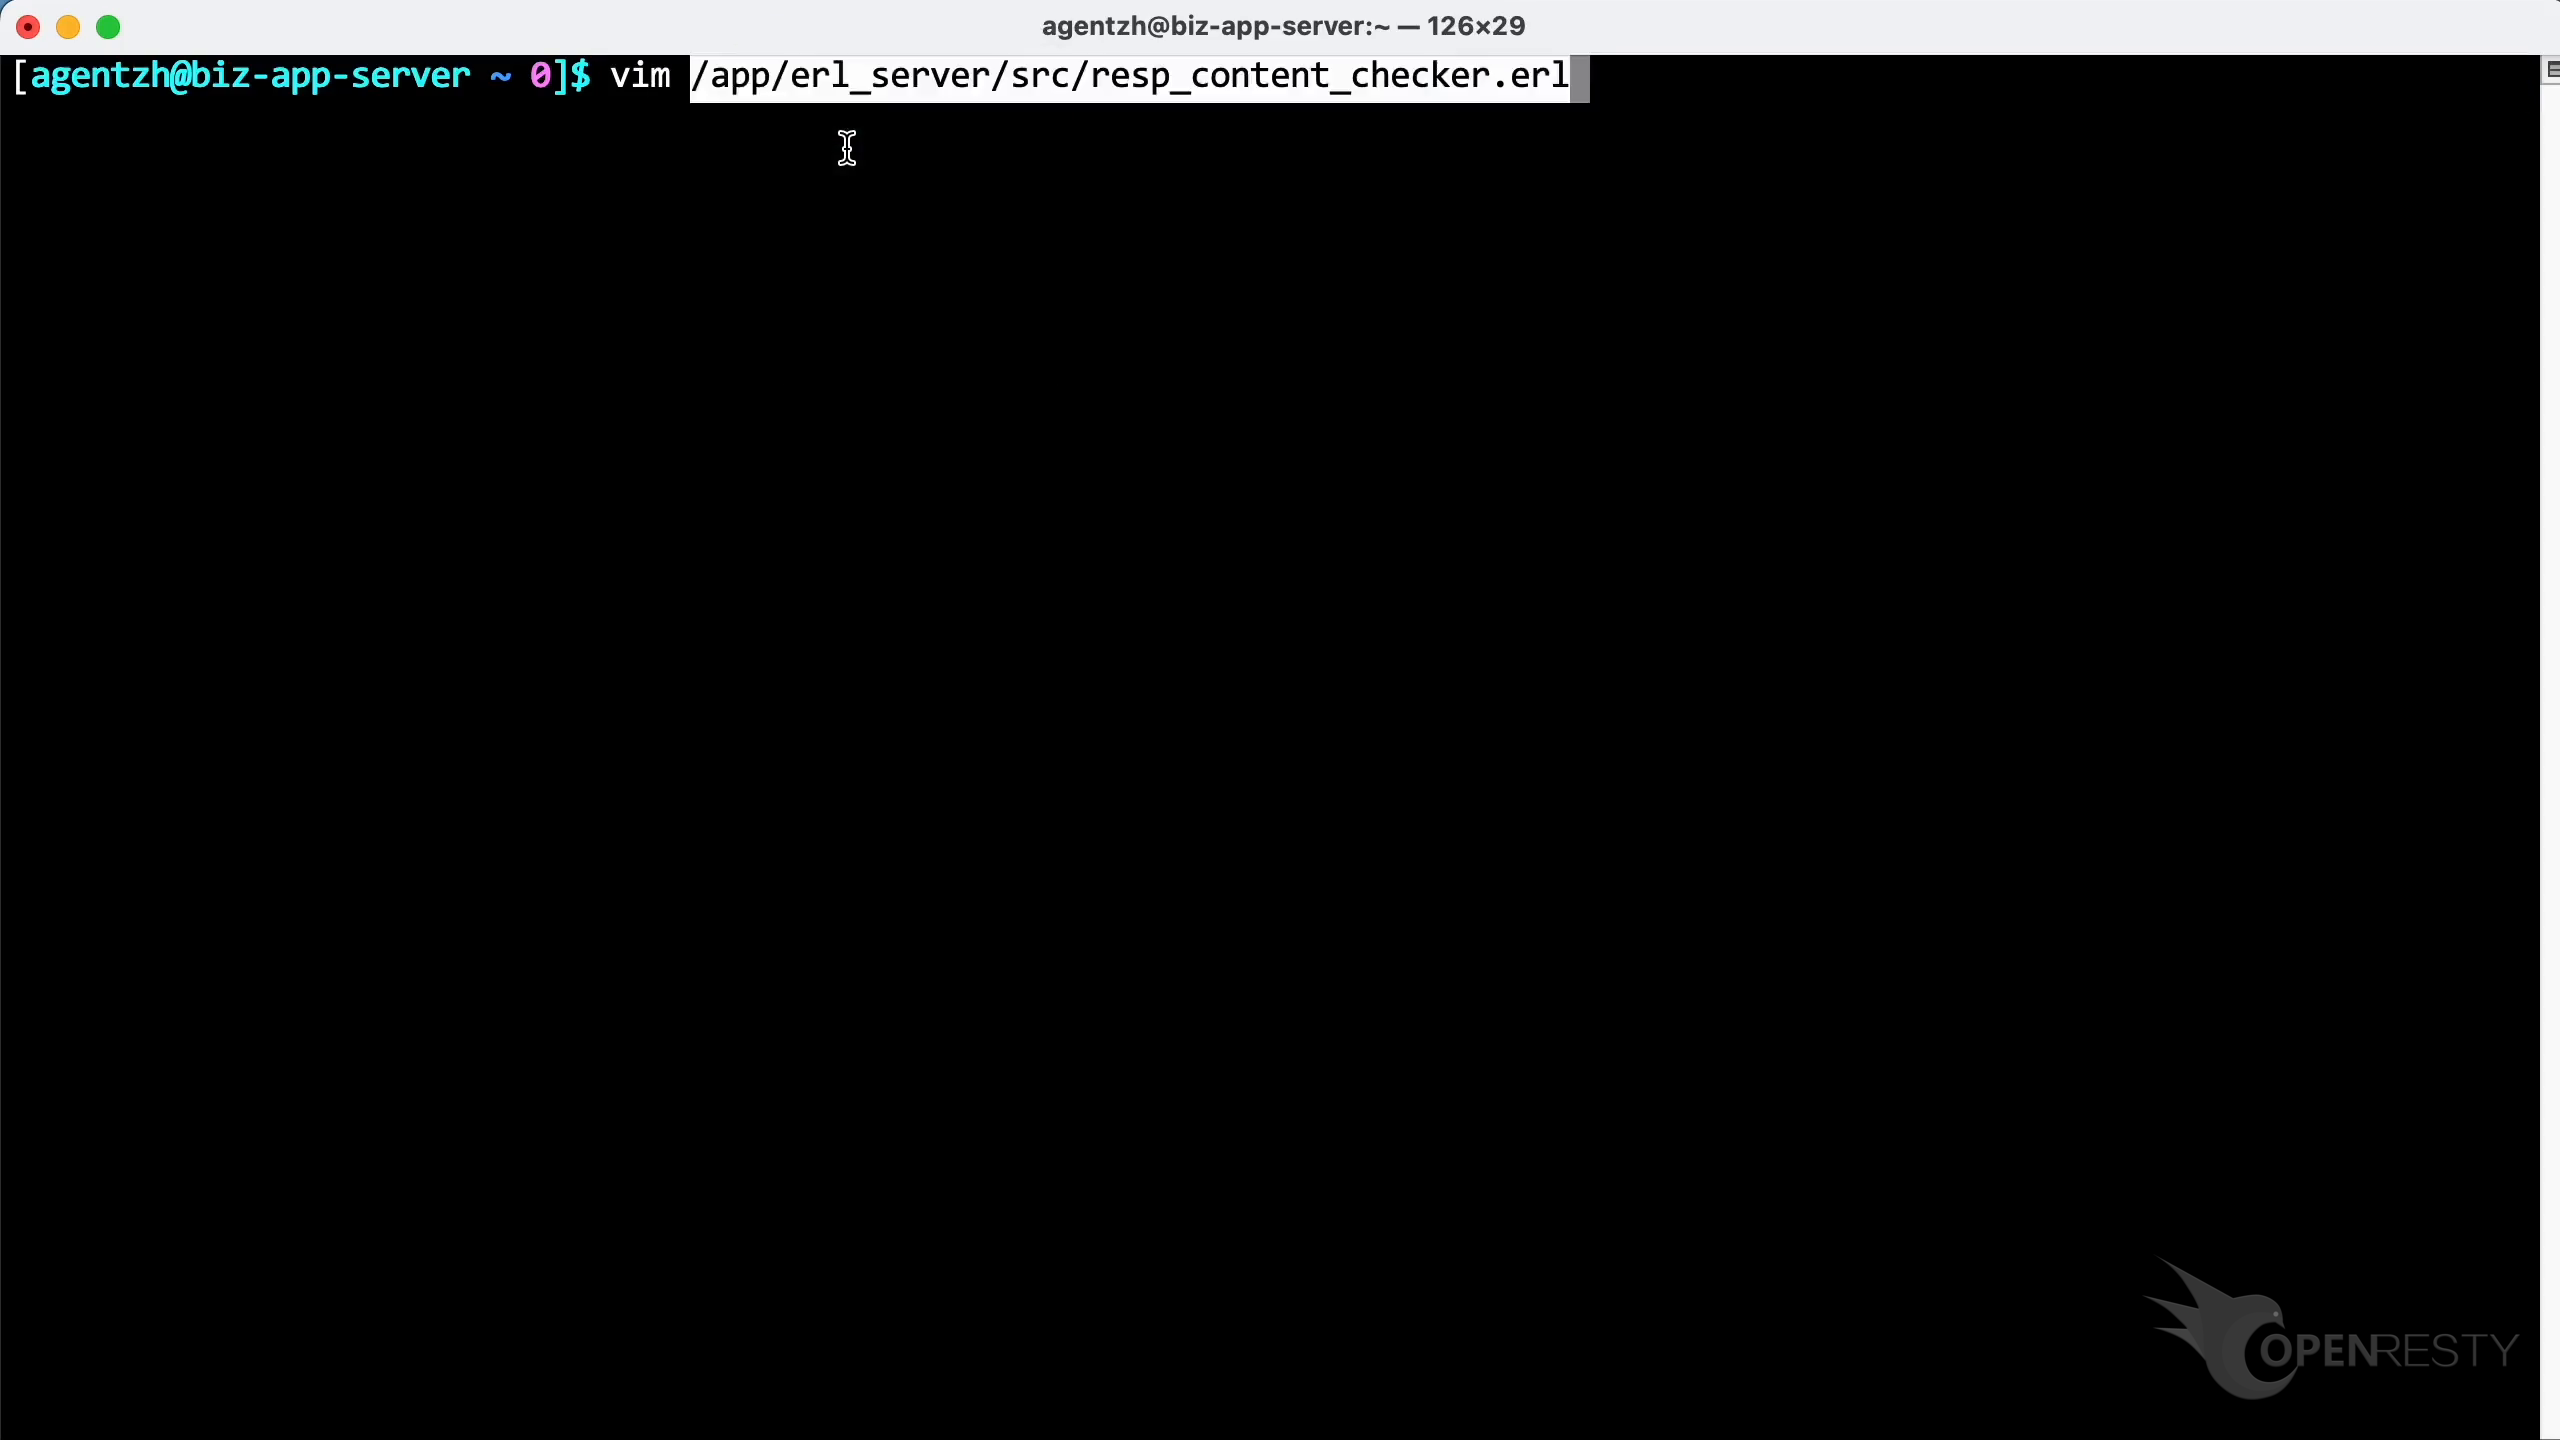
Use the vim editor to open this Erlang source file. You can use any editors you like.
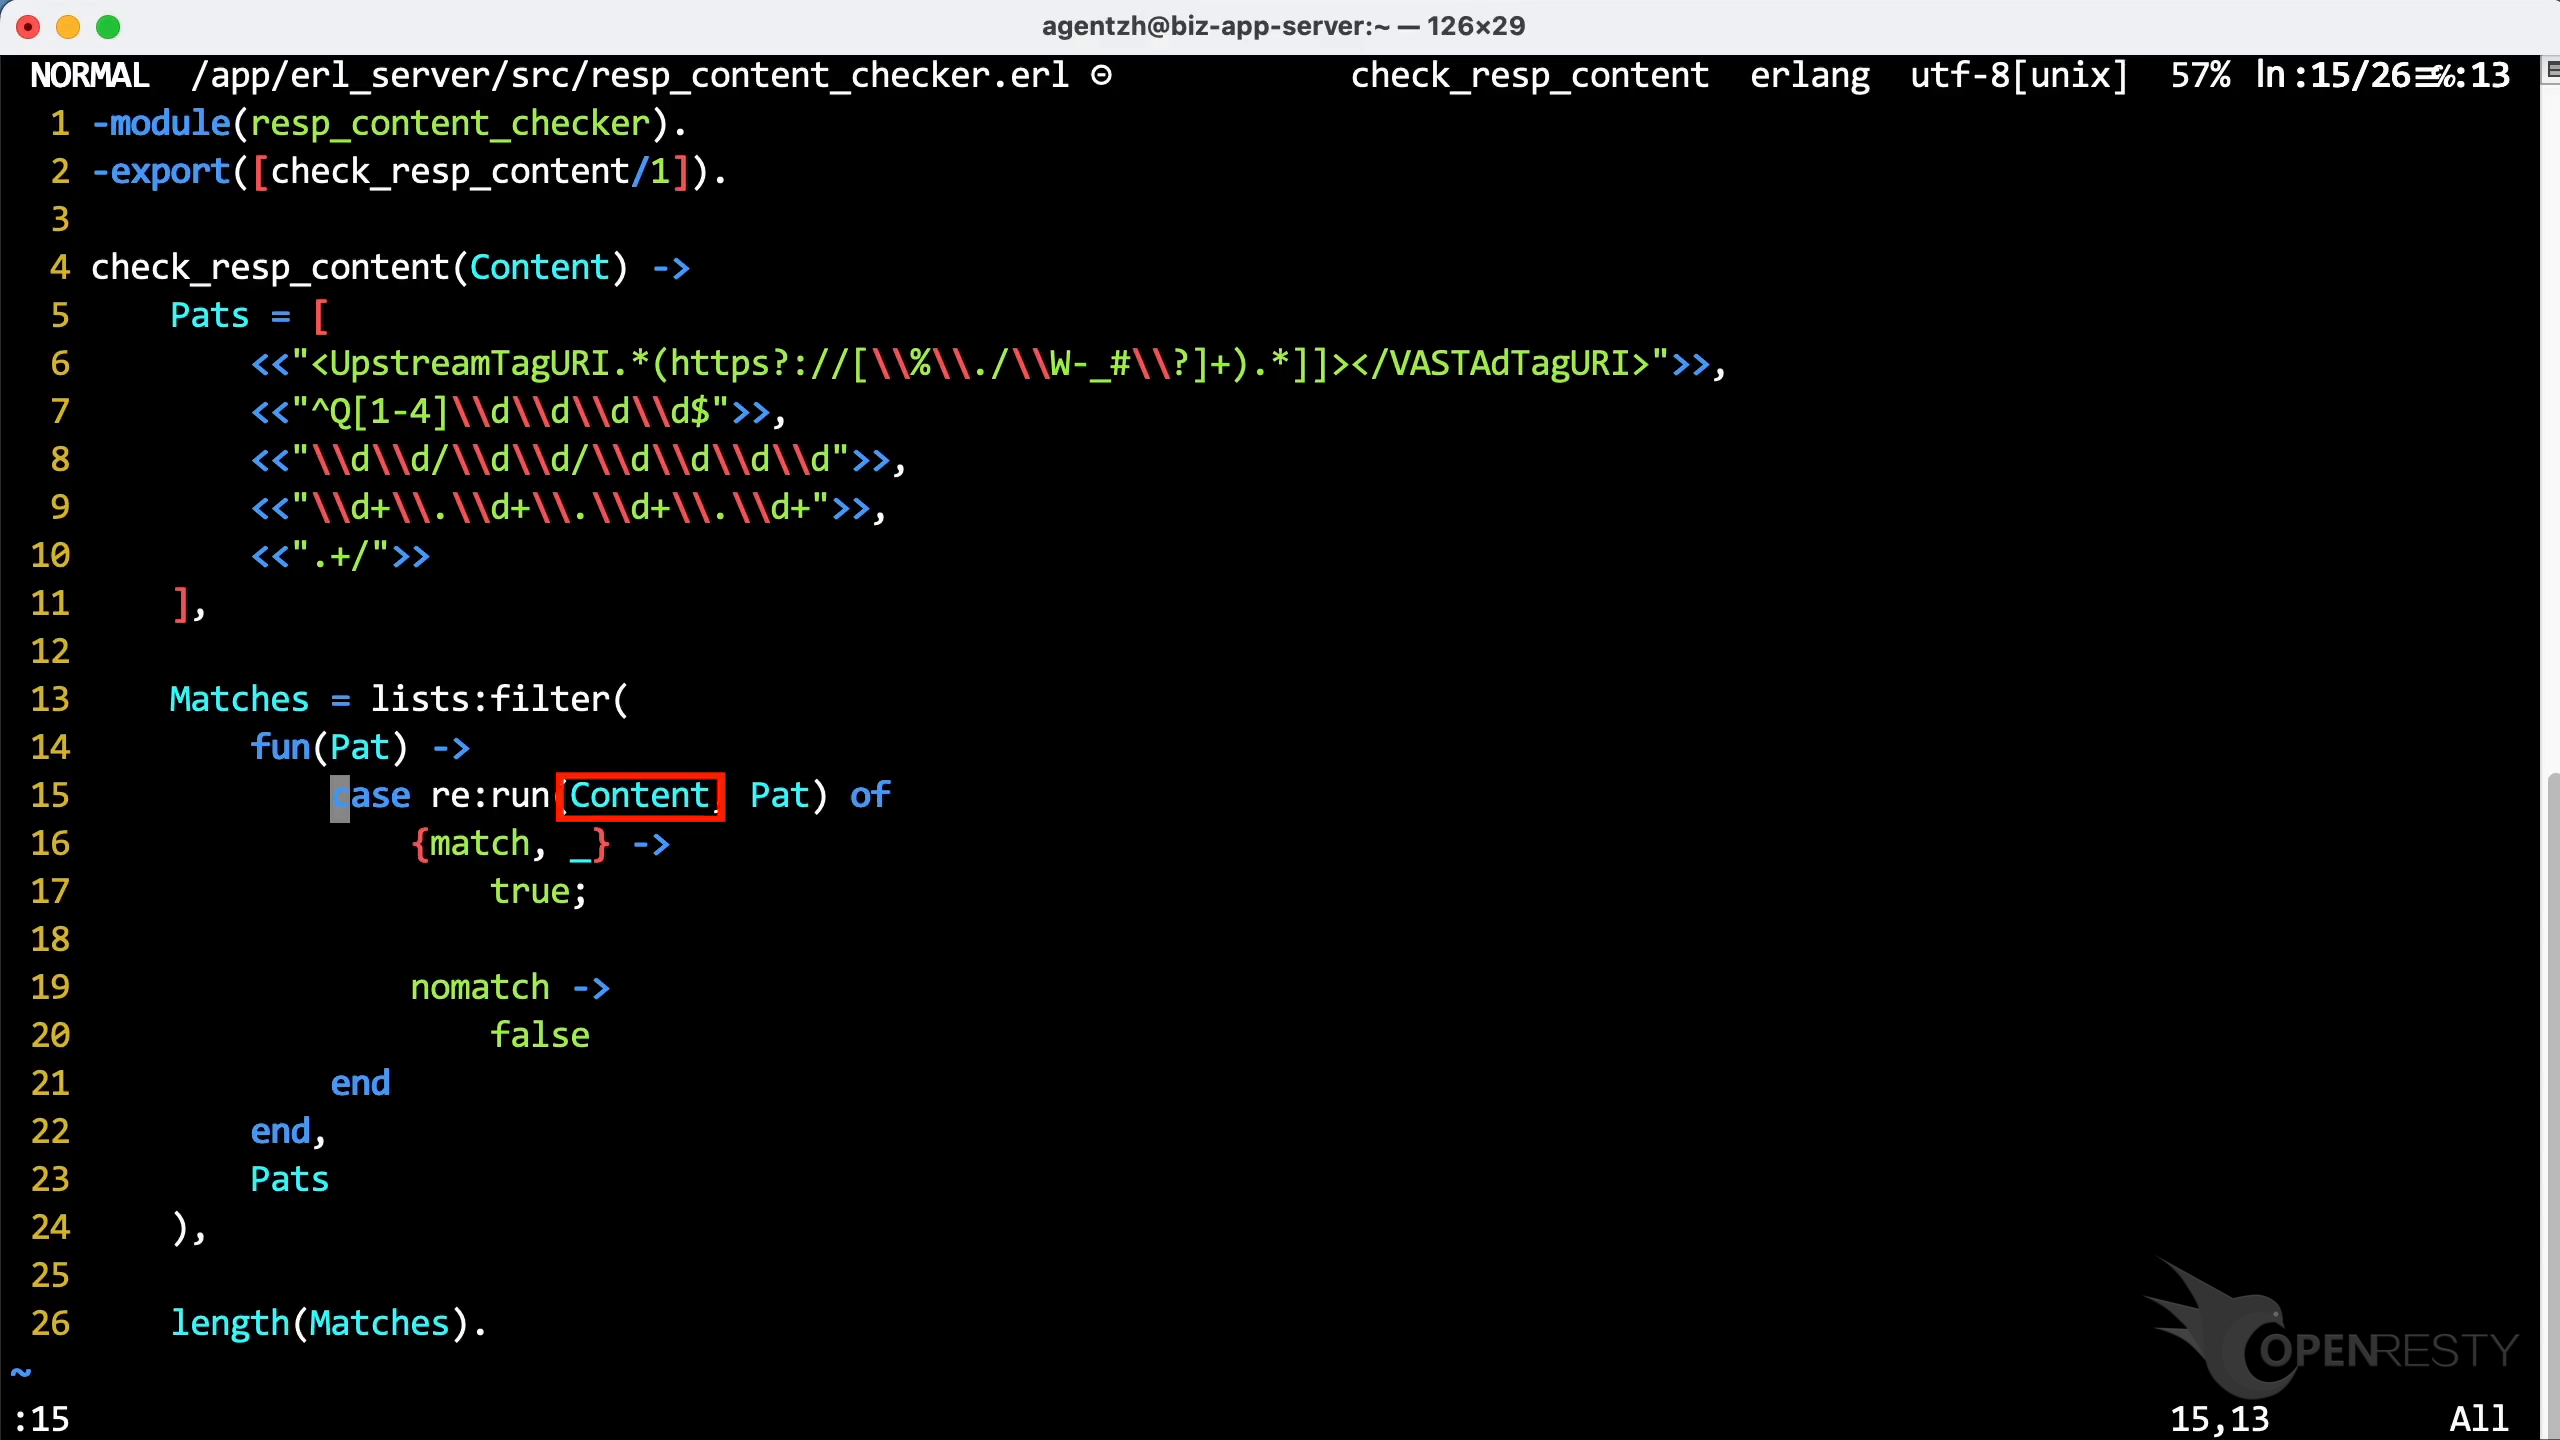
Go to line 15, as OpenResty XRay suggested.
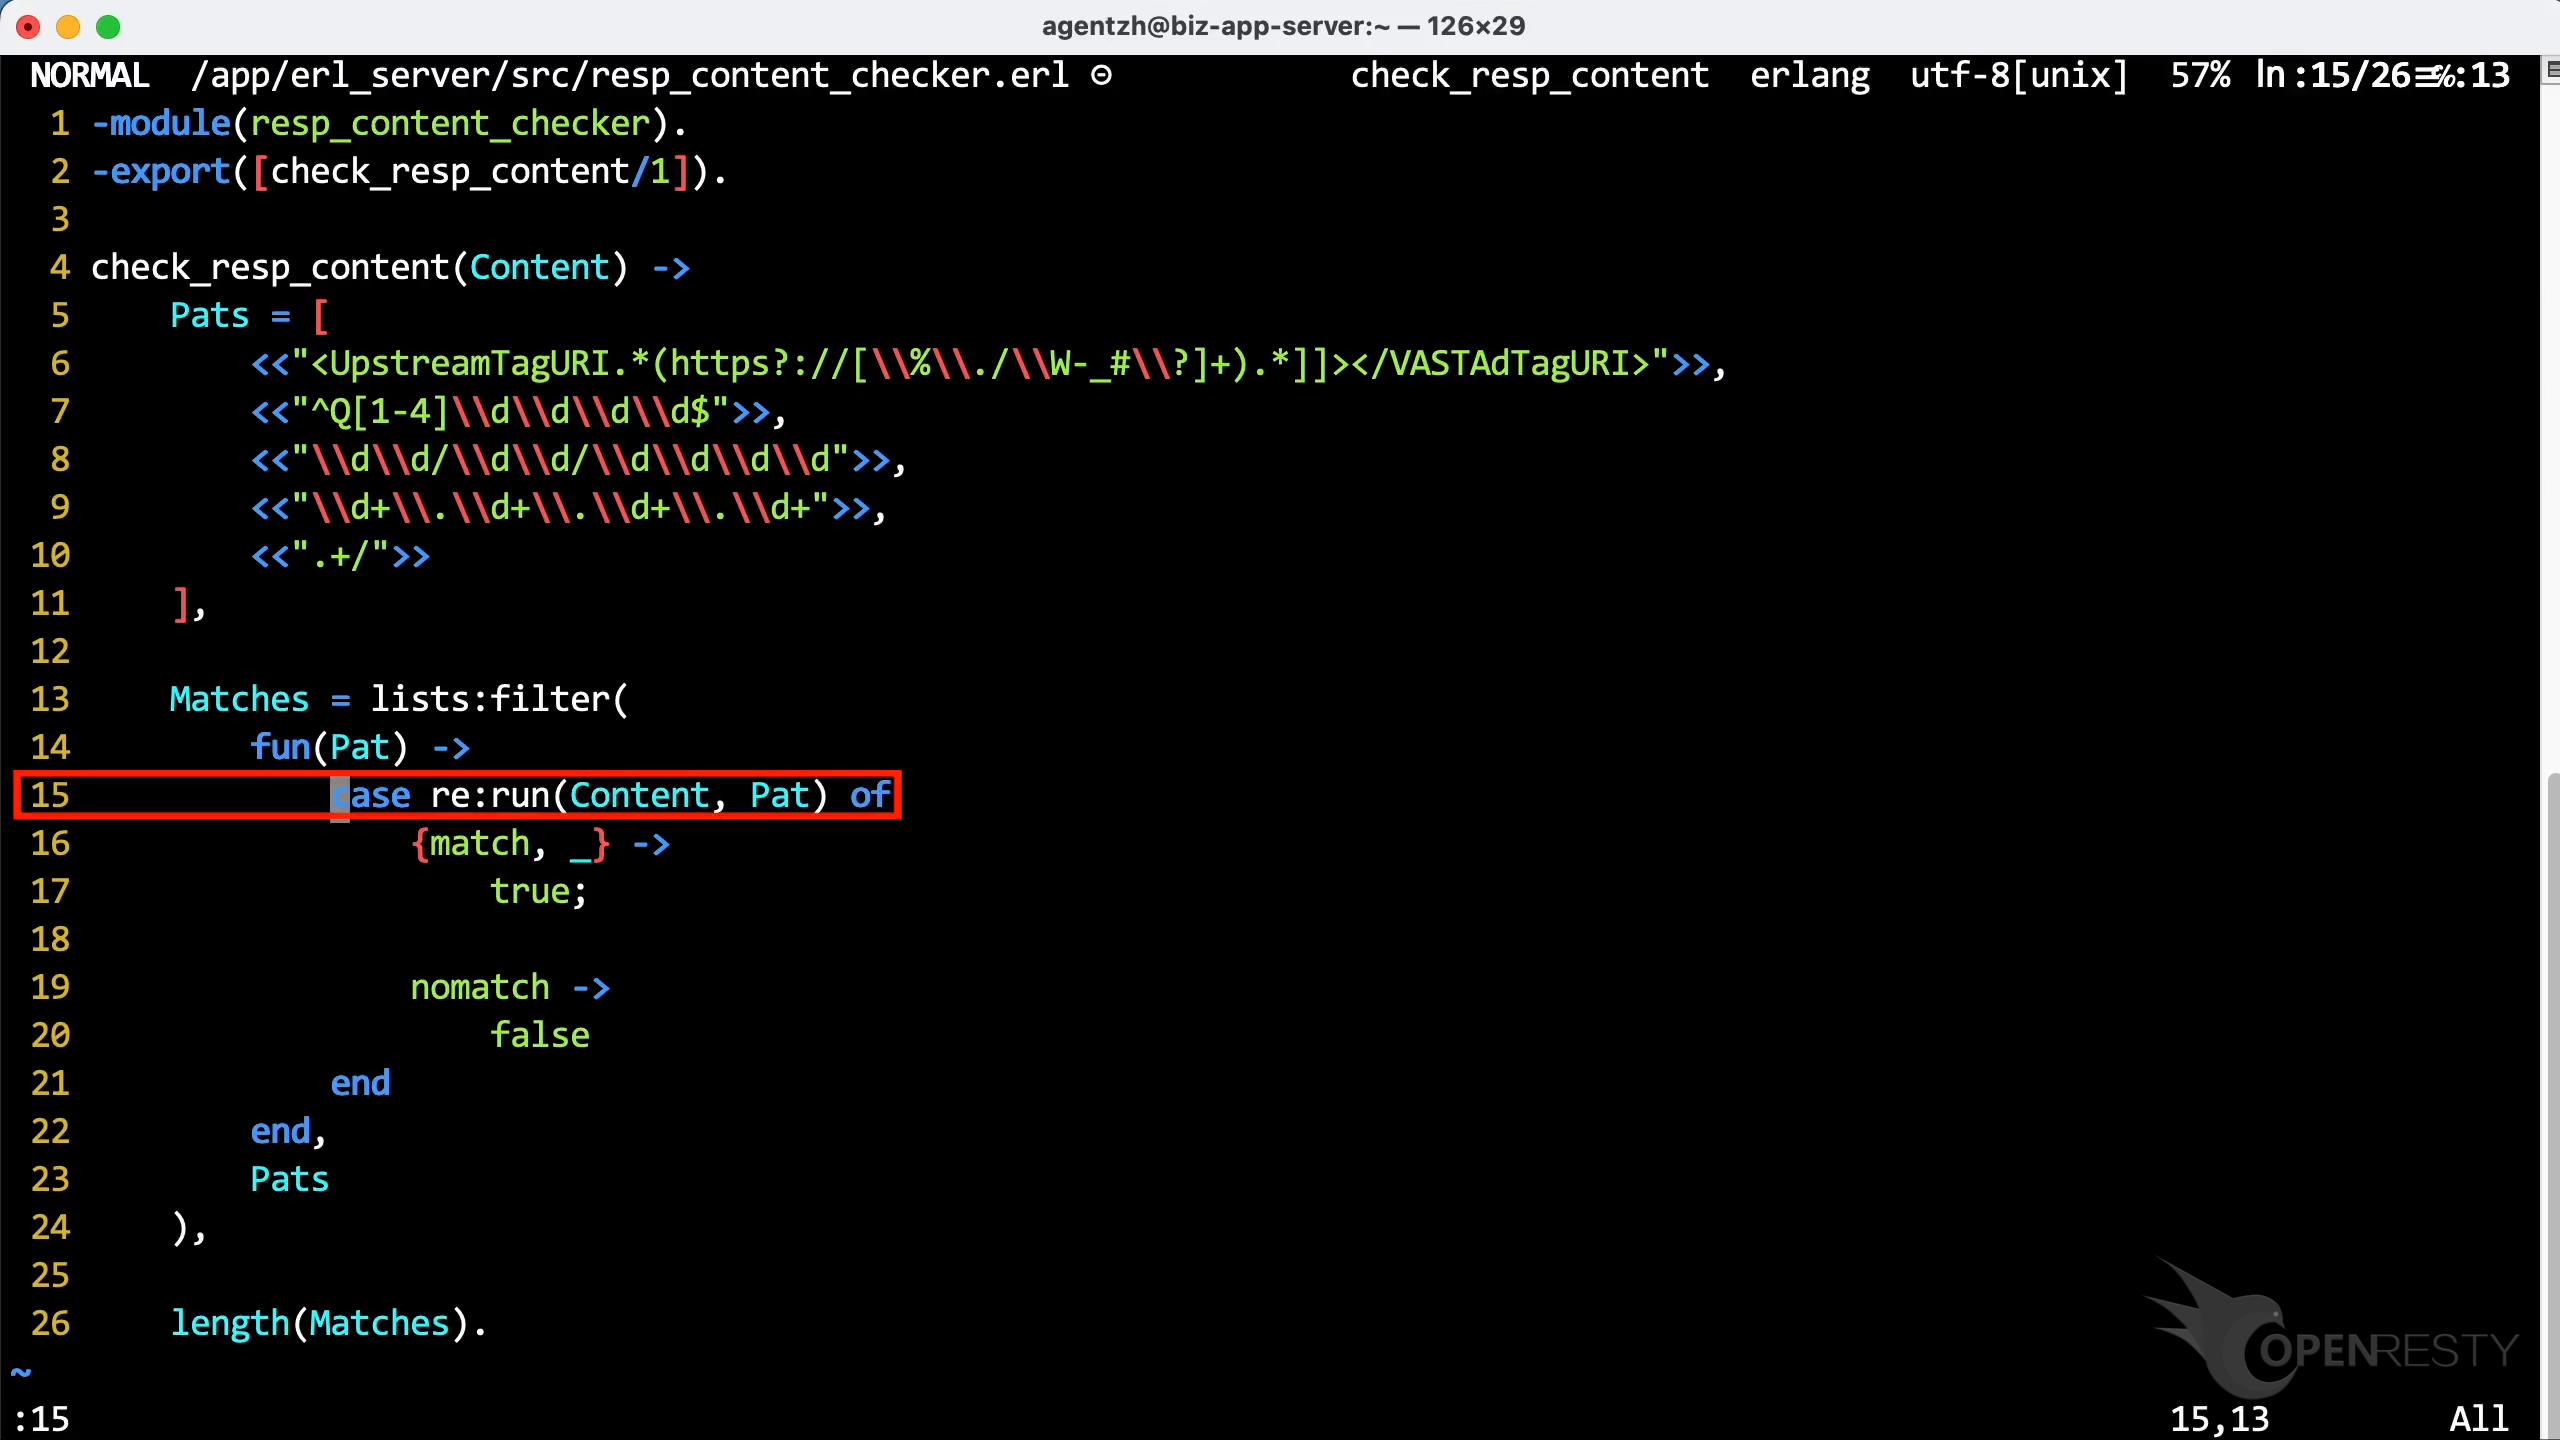
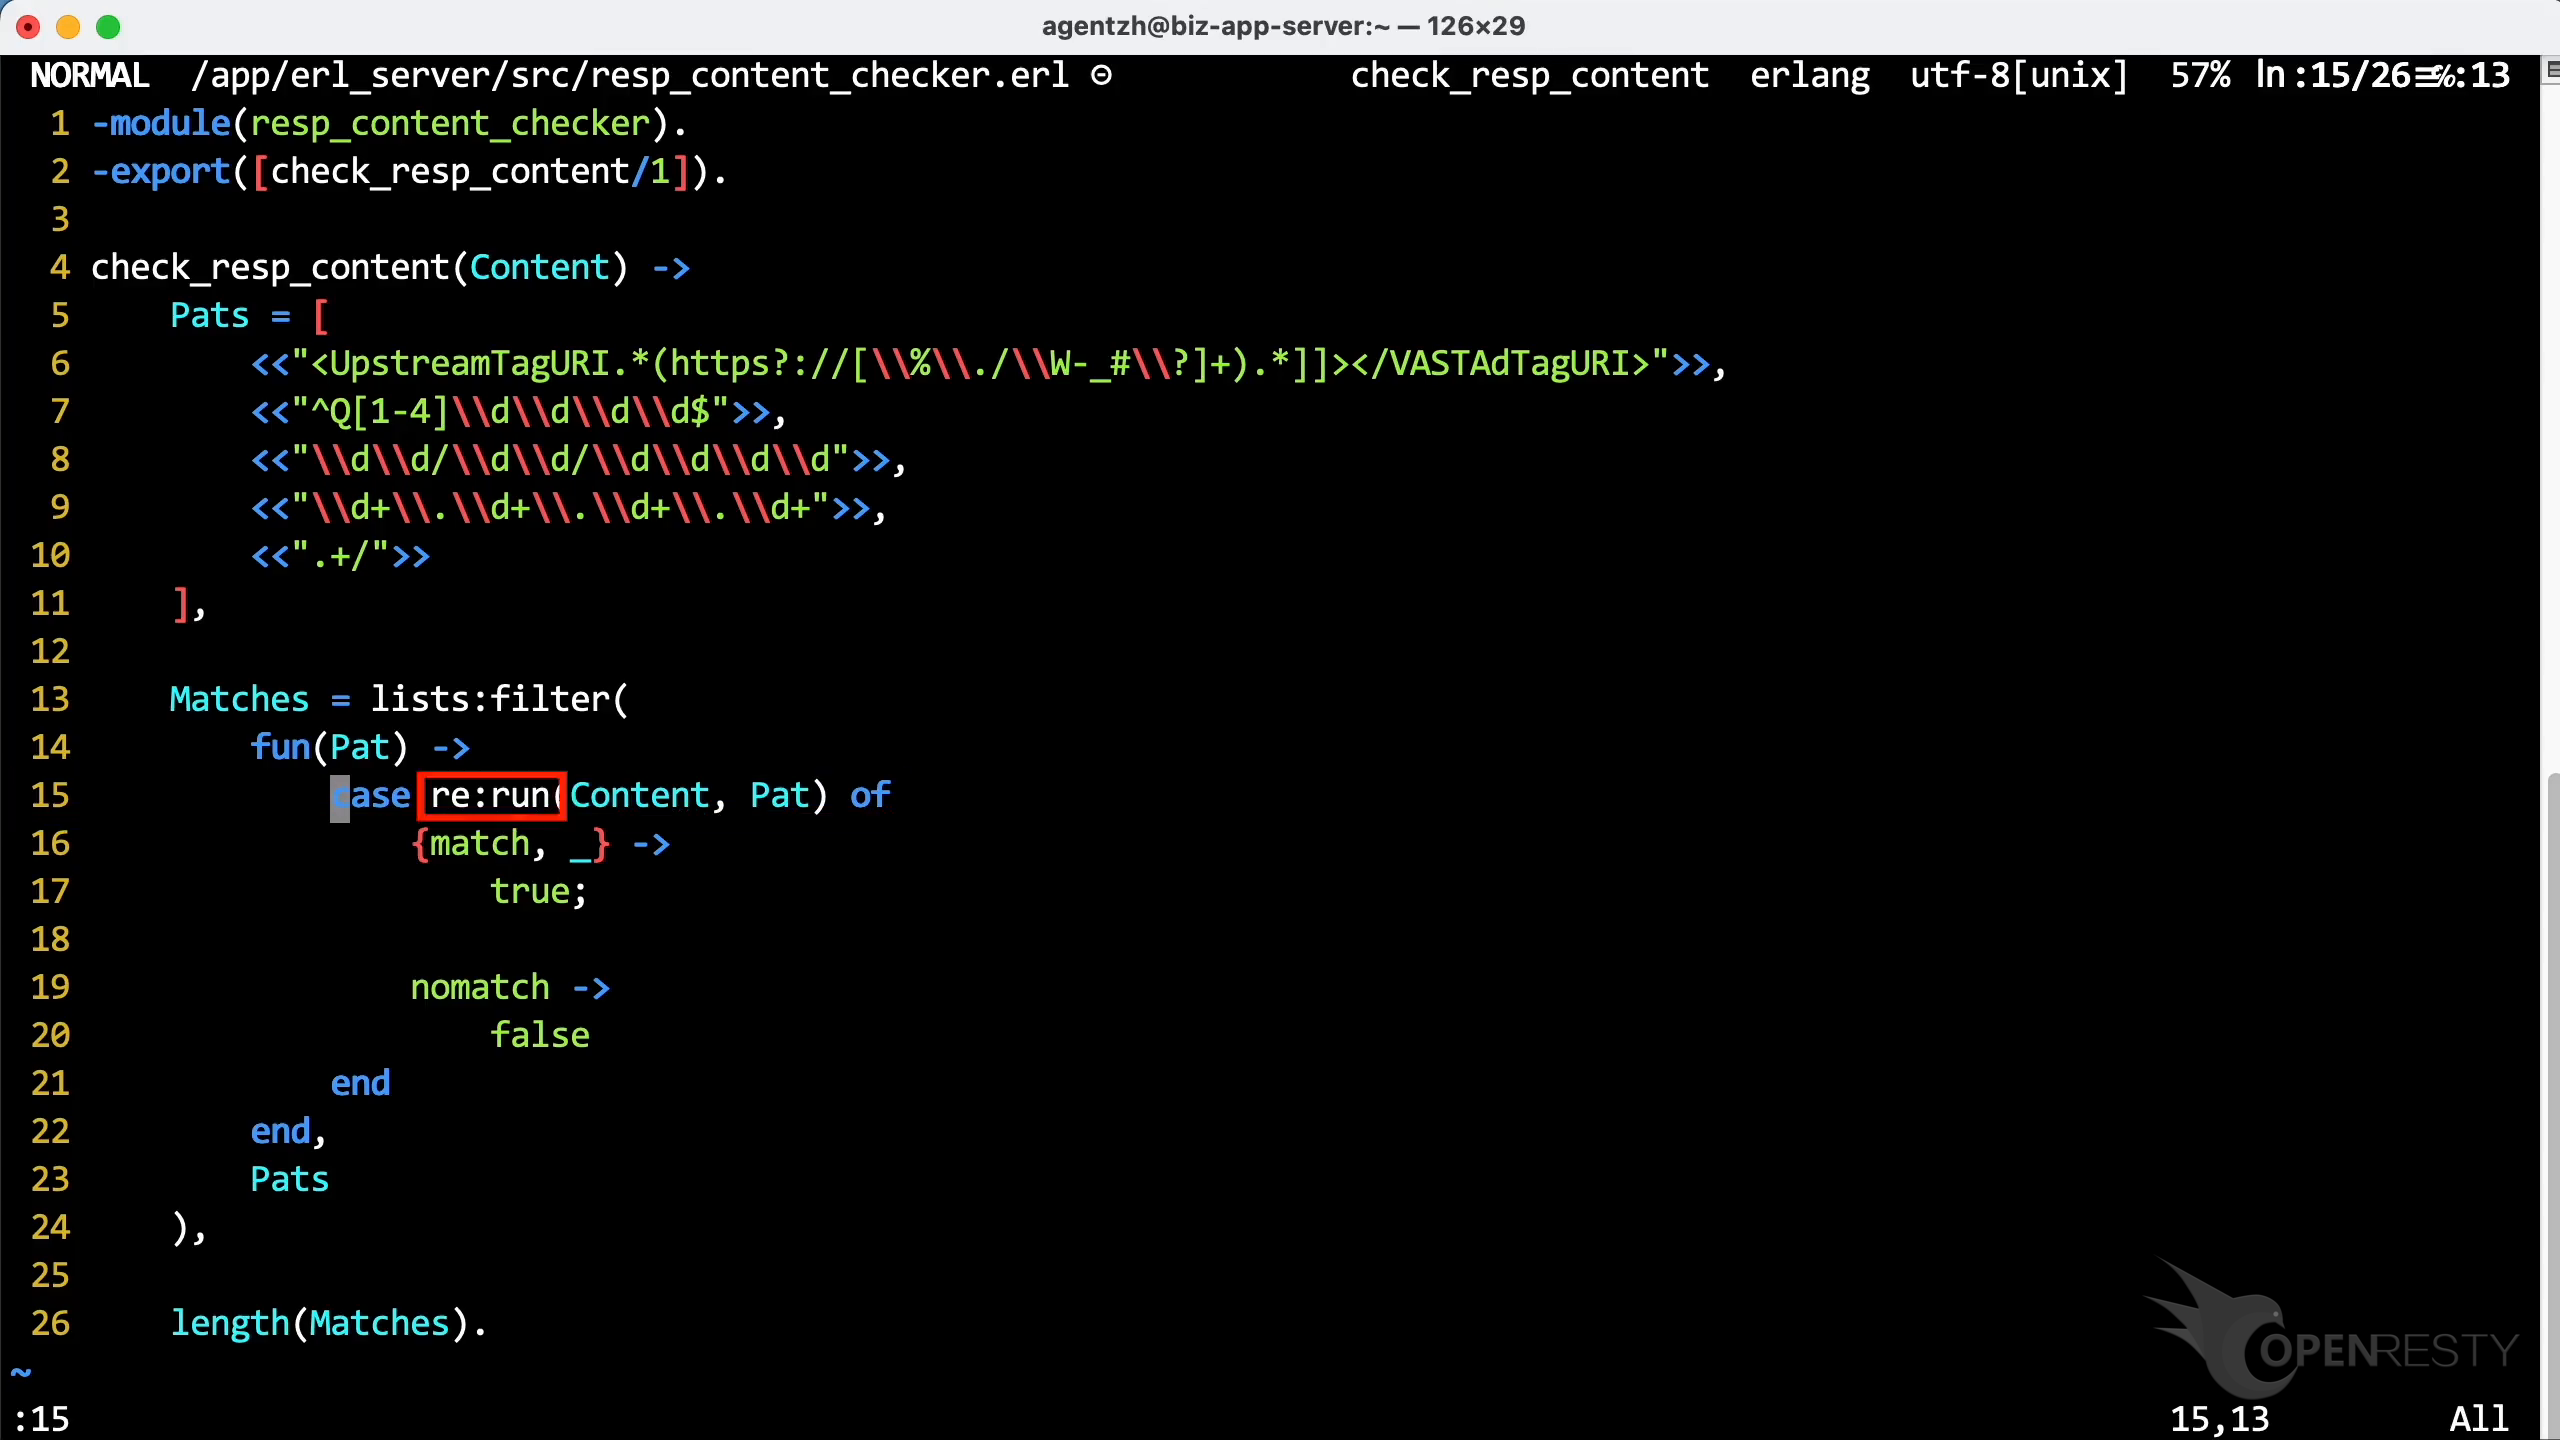
This is the run function of the re module — the standard Erlang interface to the PCRE regex engine.
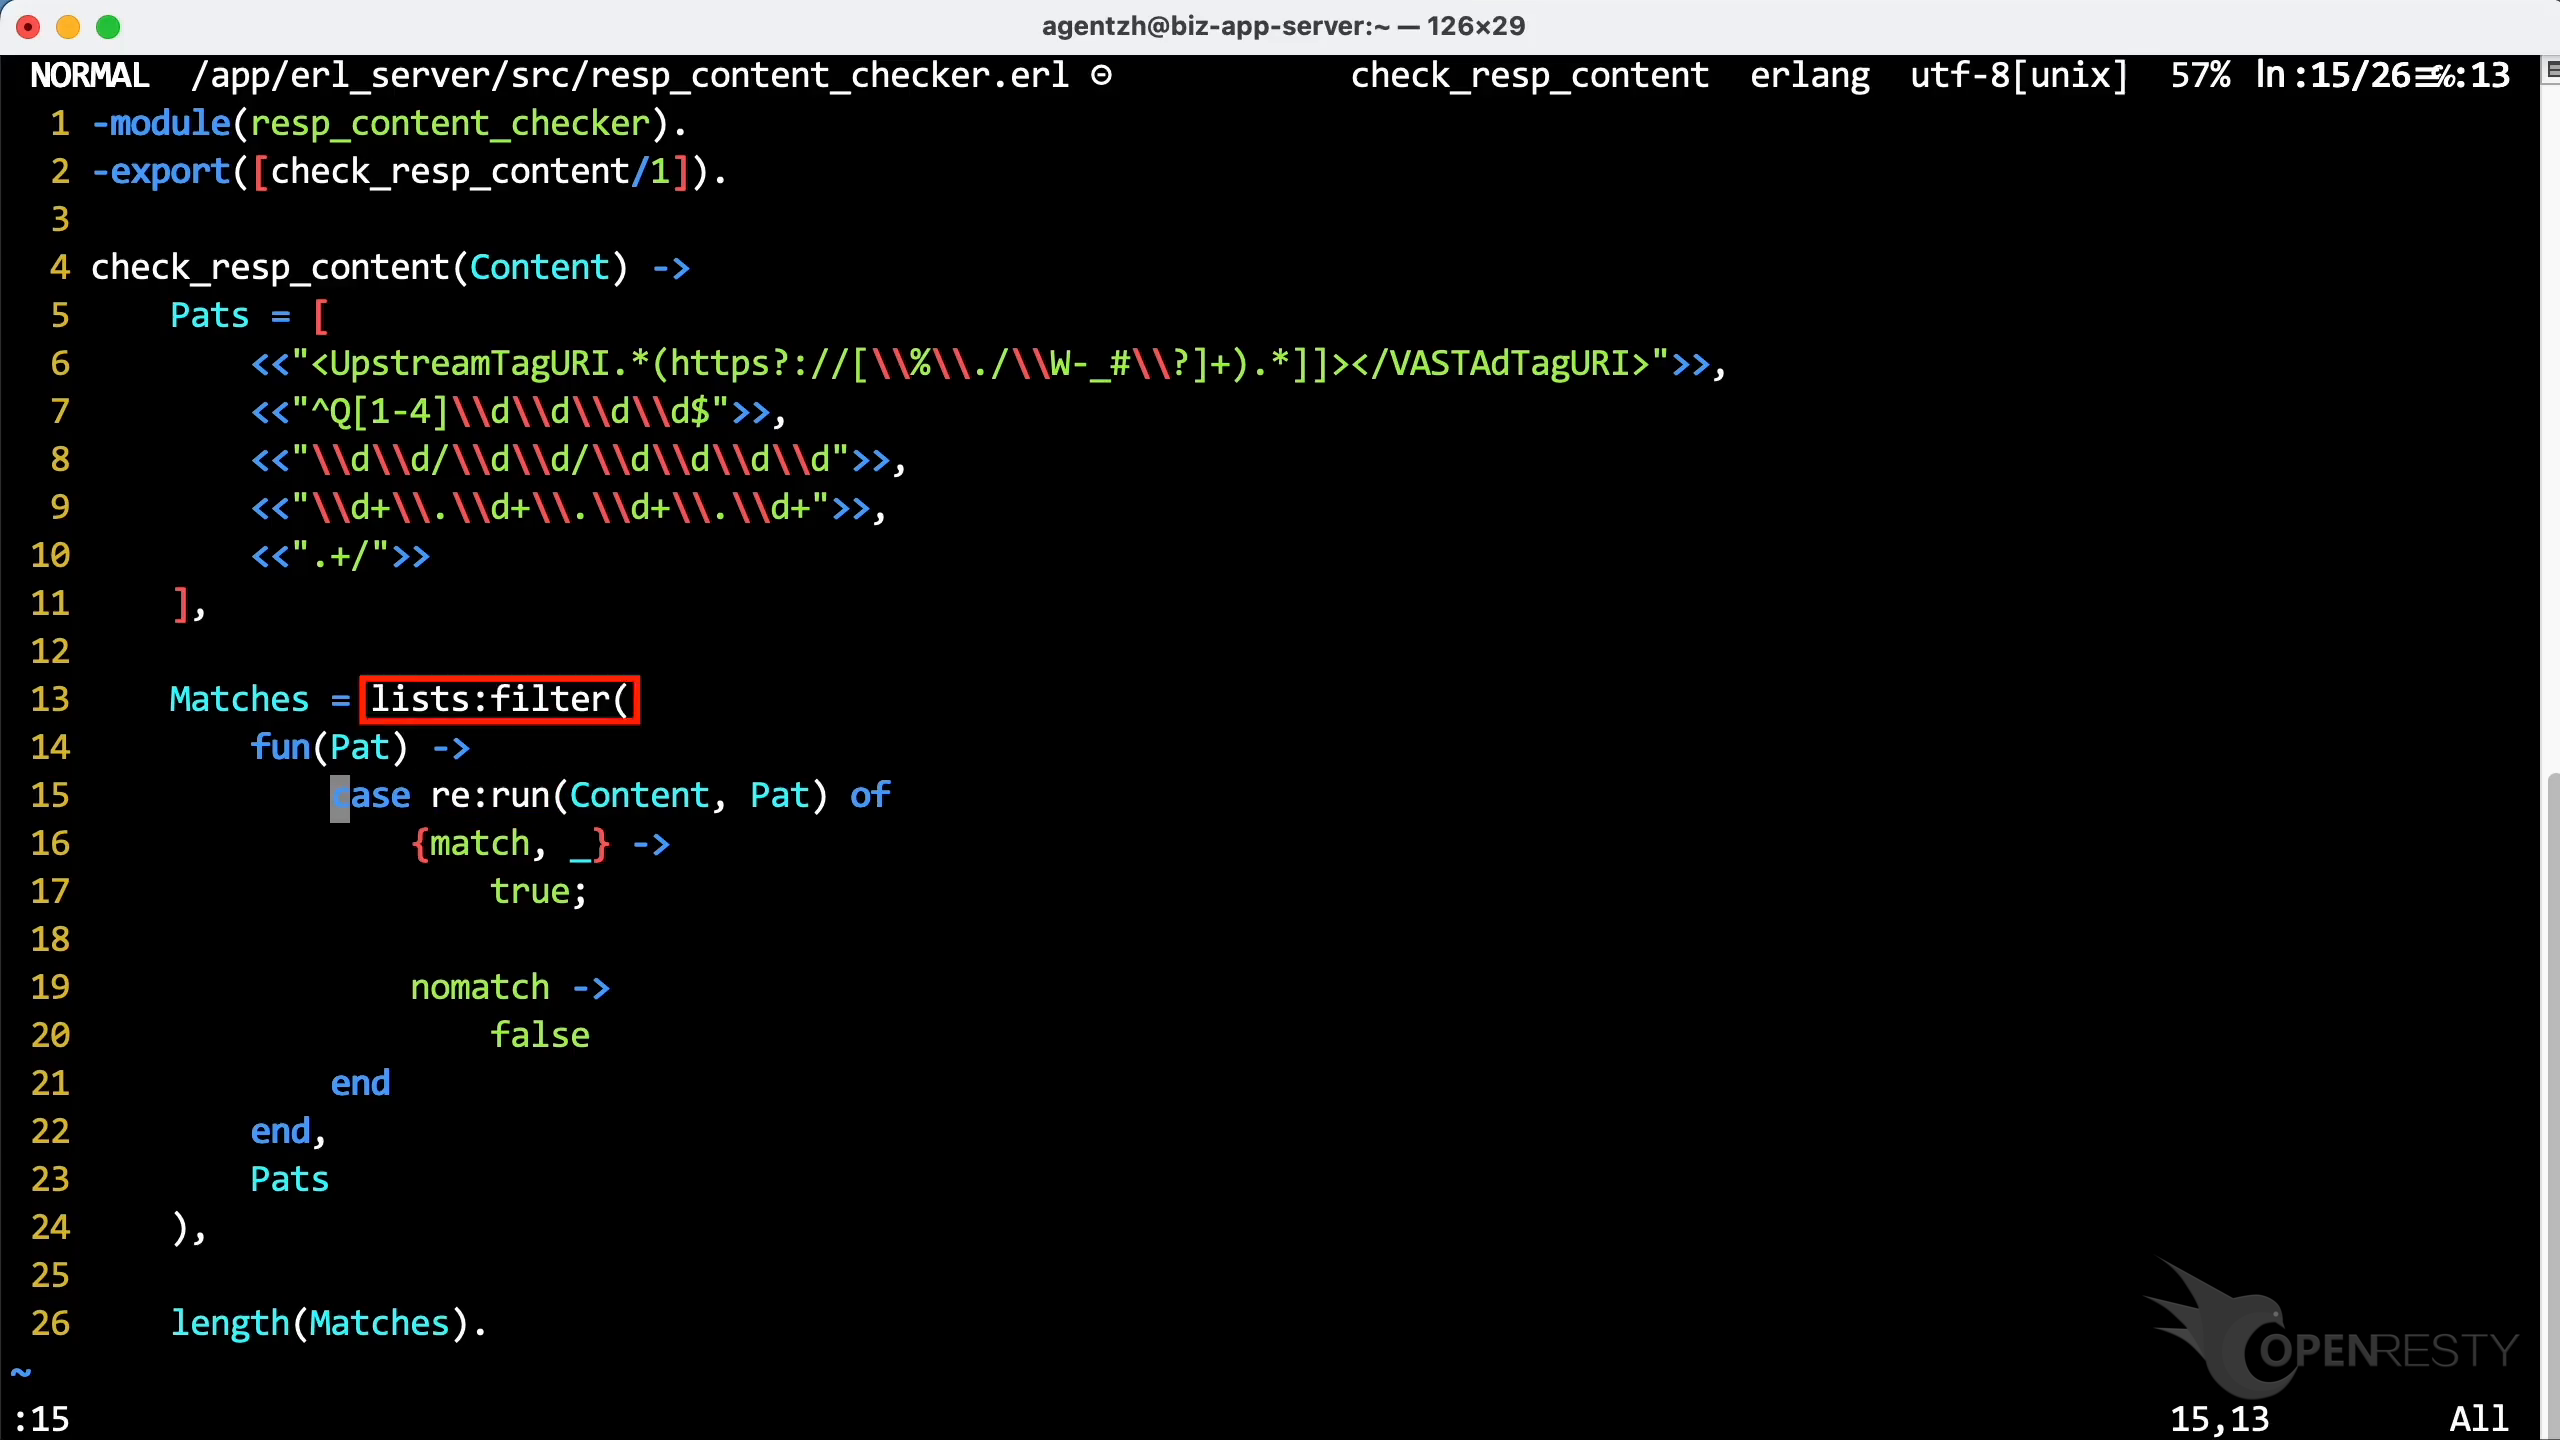
This is the lists:filter function call we saw earlier in the report.
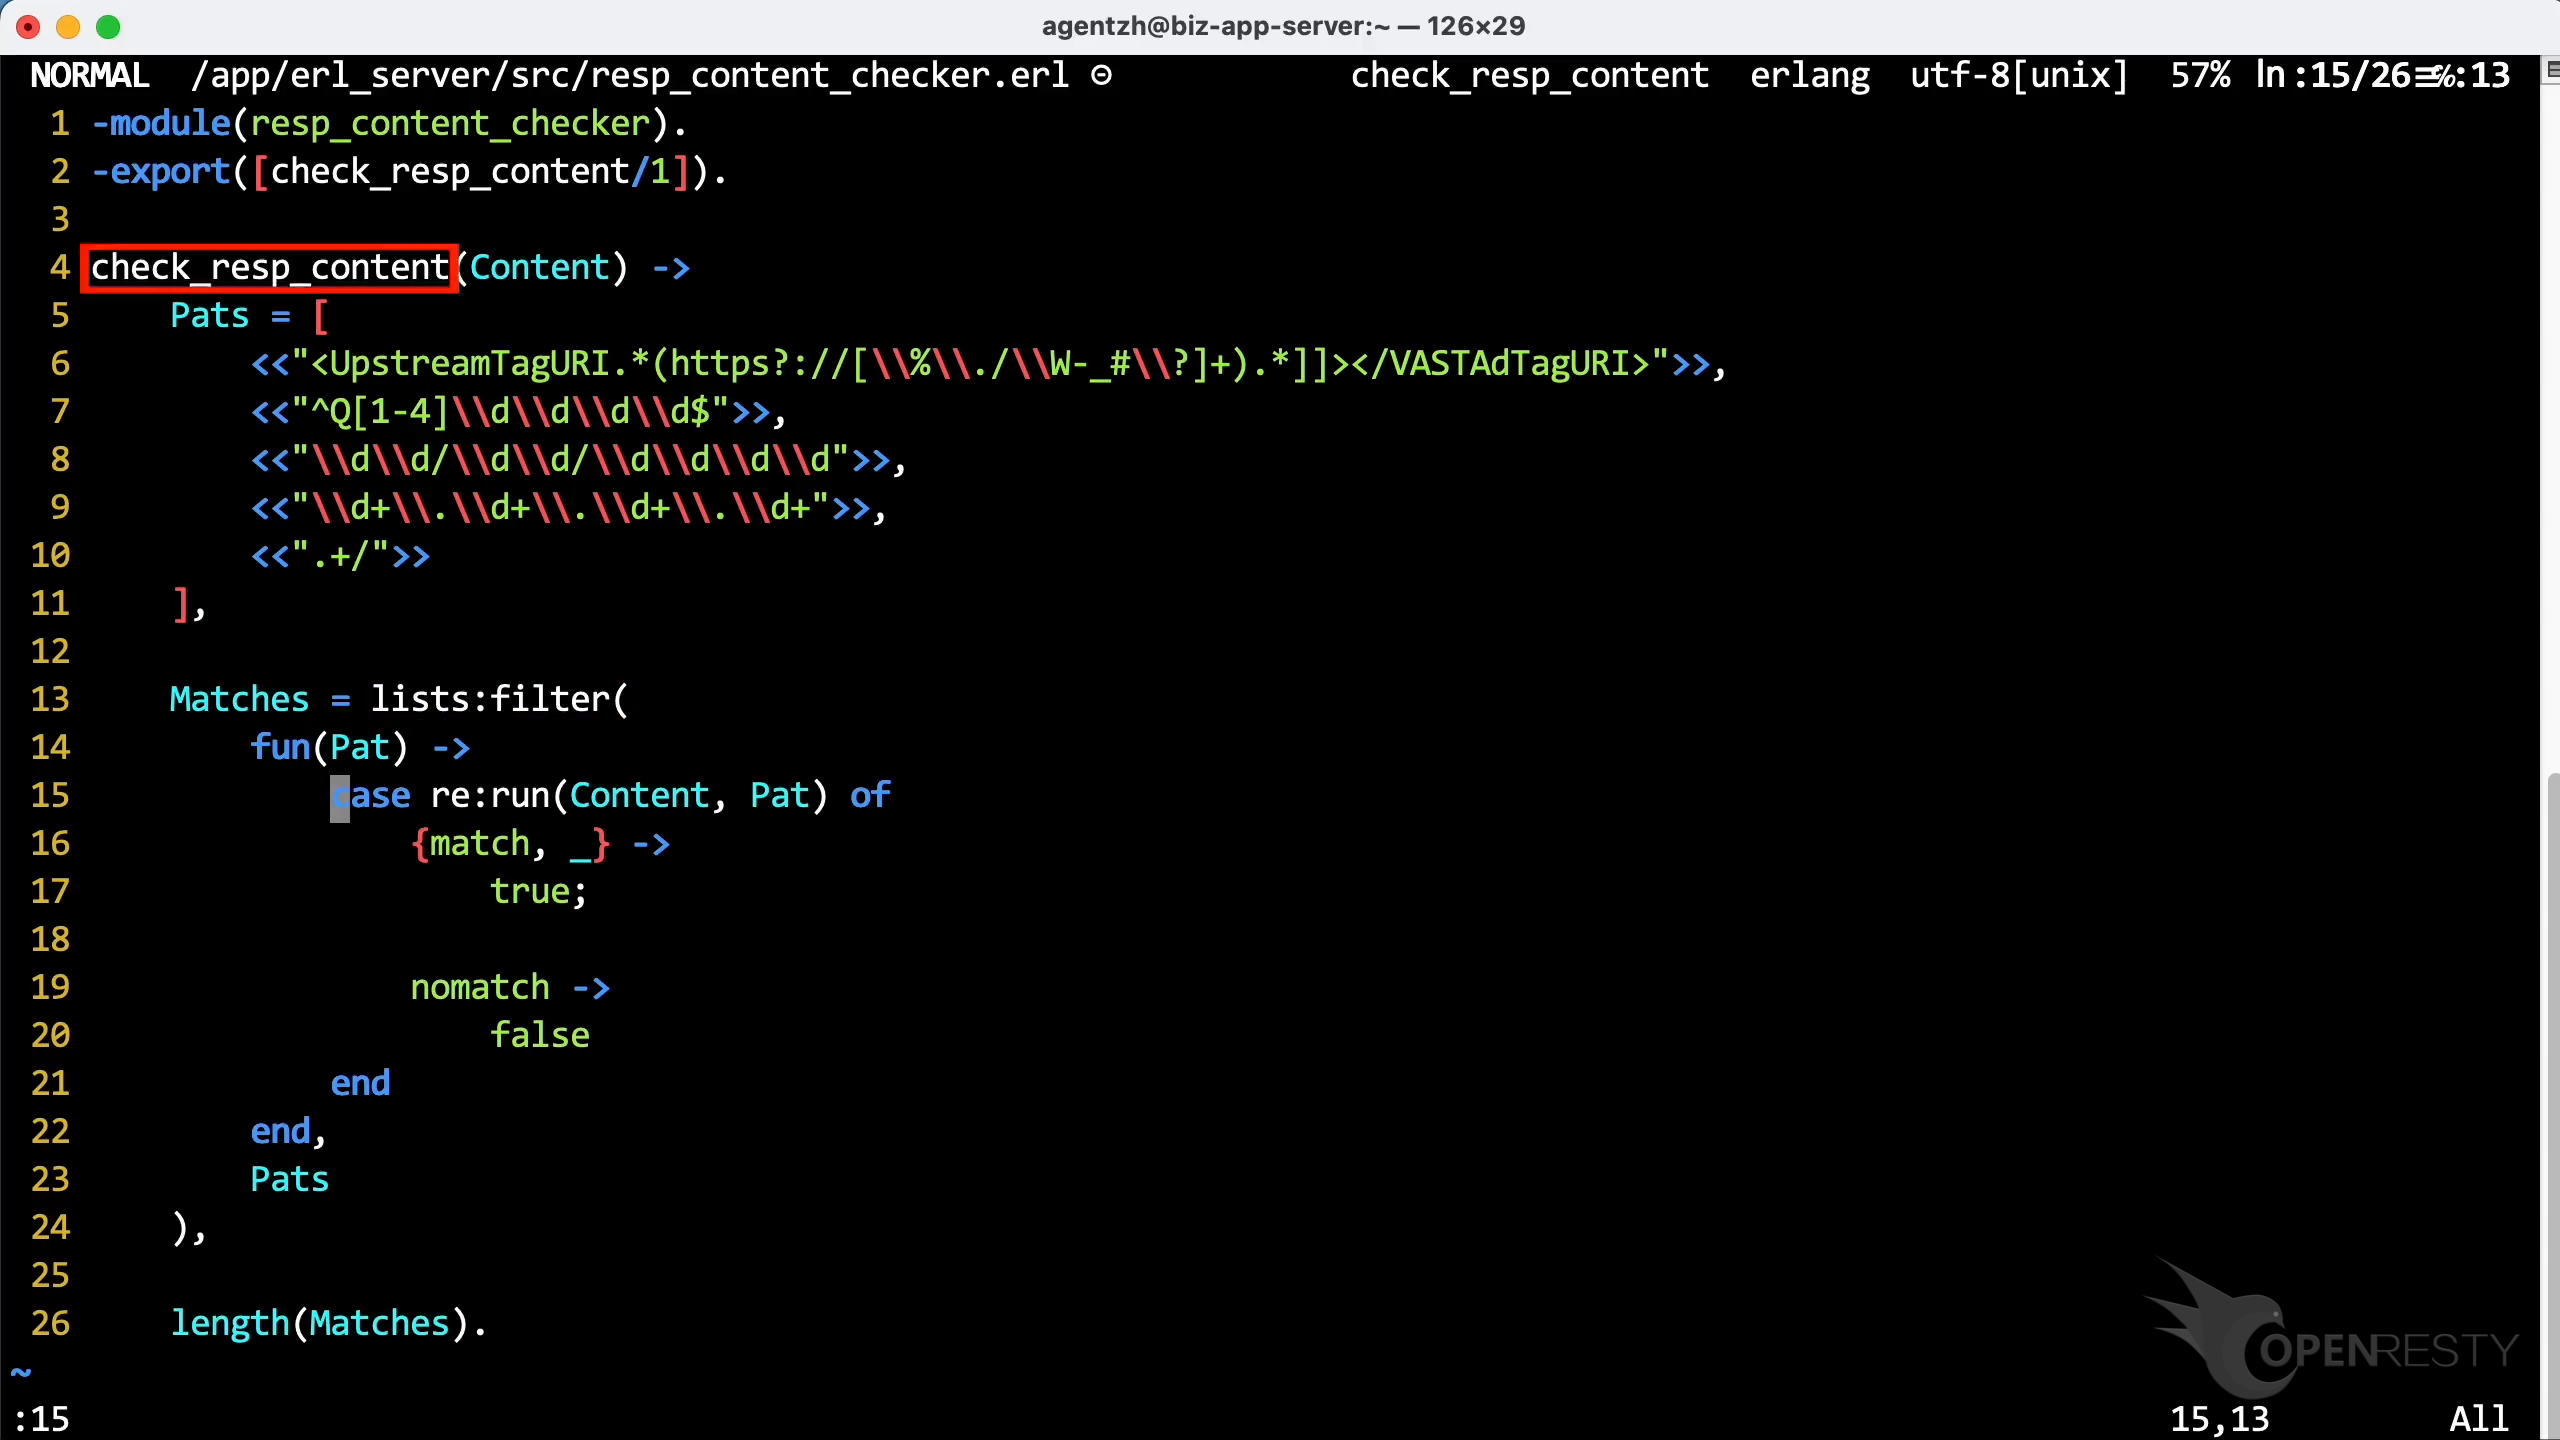
This code path is indeed inside the check_resp_content function. The regex can be optimized to avoid costly backtracking operations, or you can consider using a non-backtracking regex engine.
The top two Erlang code paths are similar, and both execute regular expression matches.
The third Erlang code path is calculating the length of the input string prior to matching.
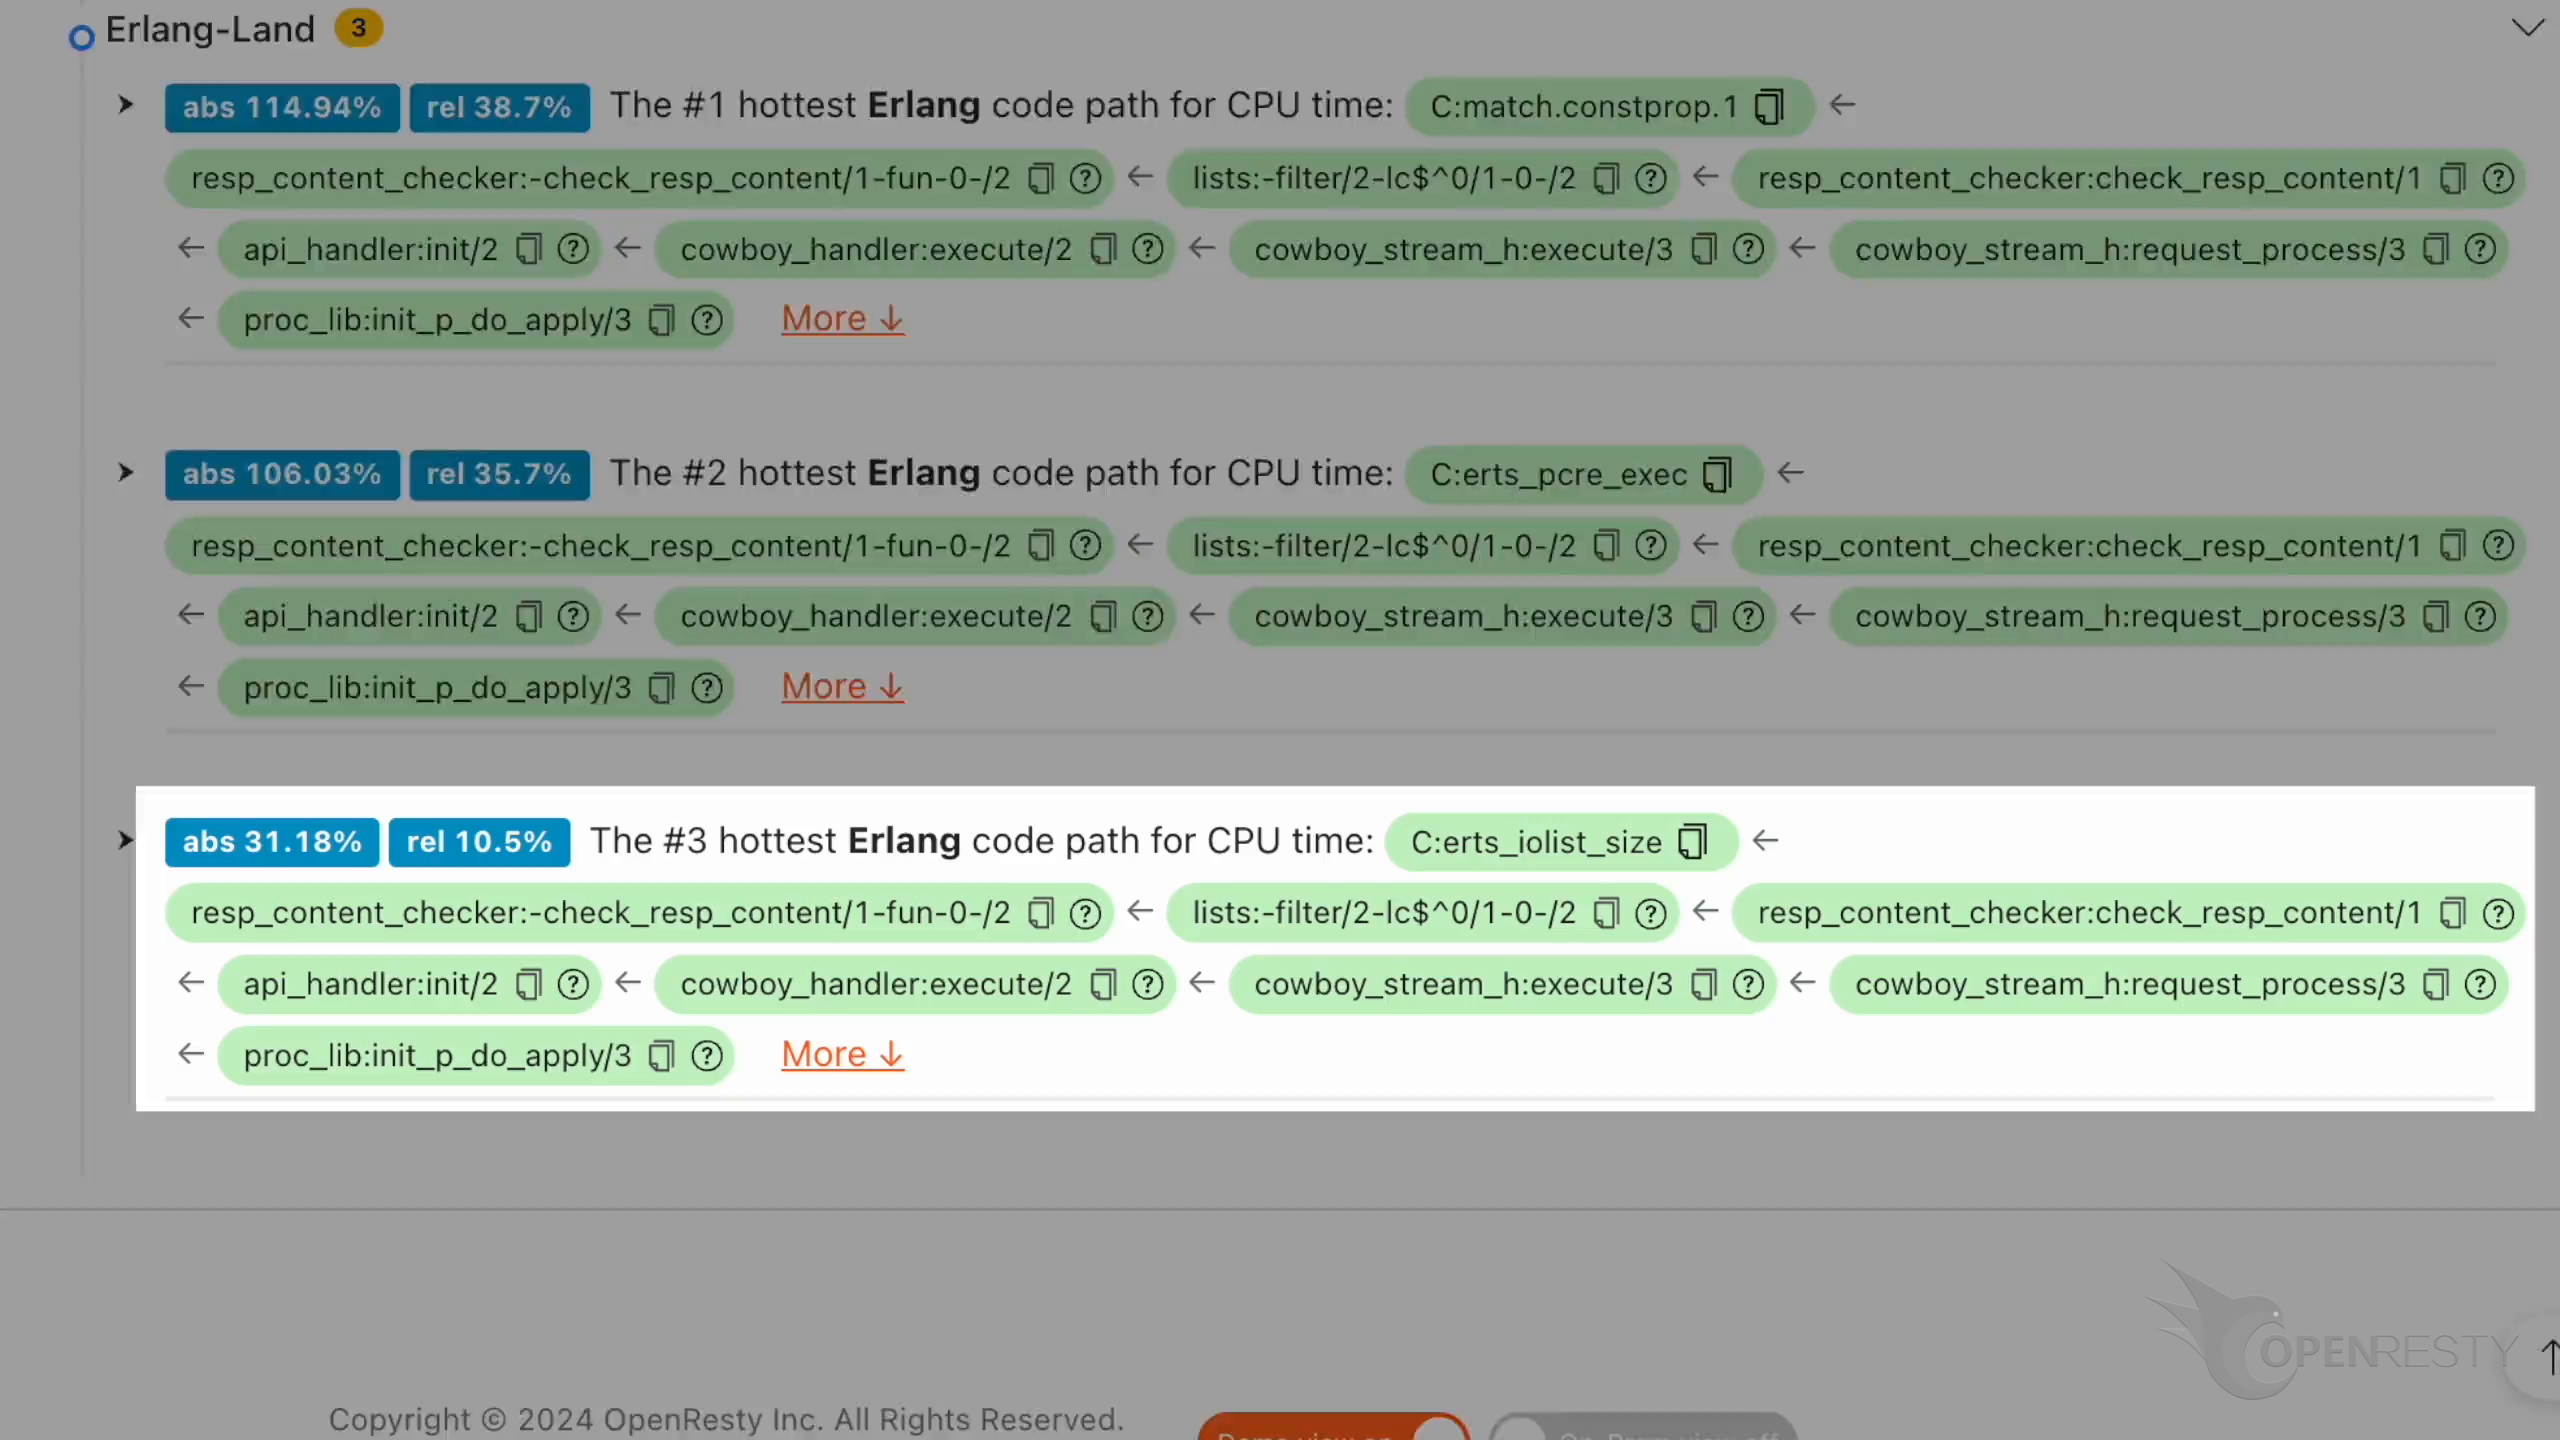
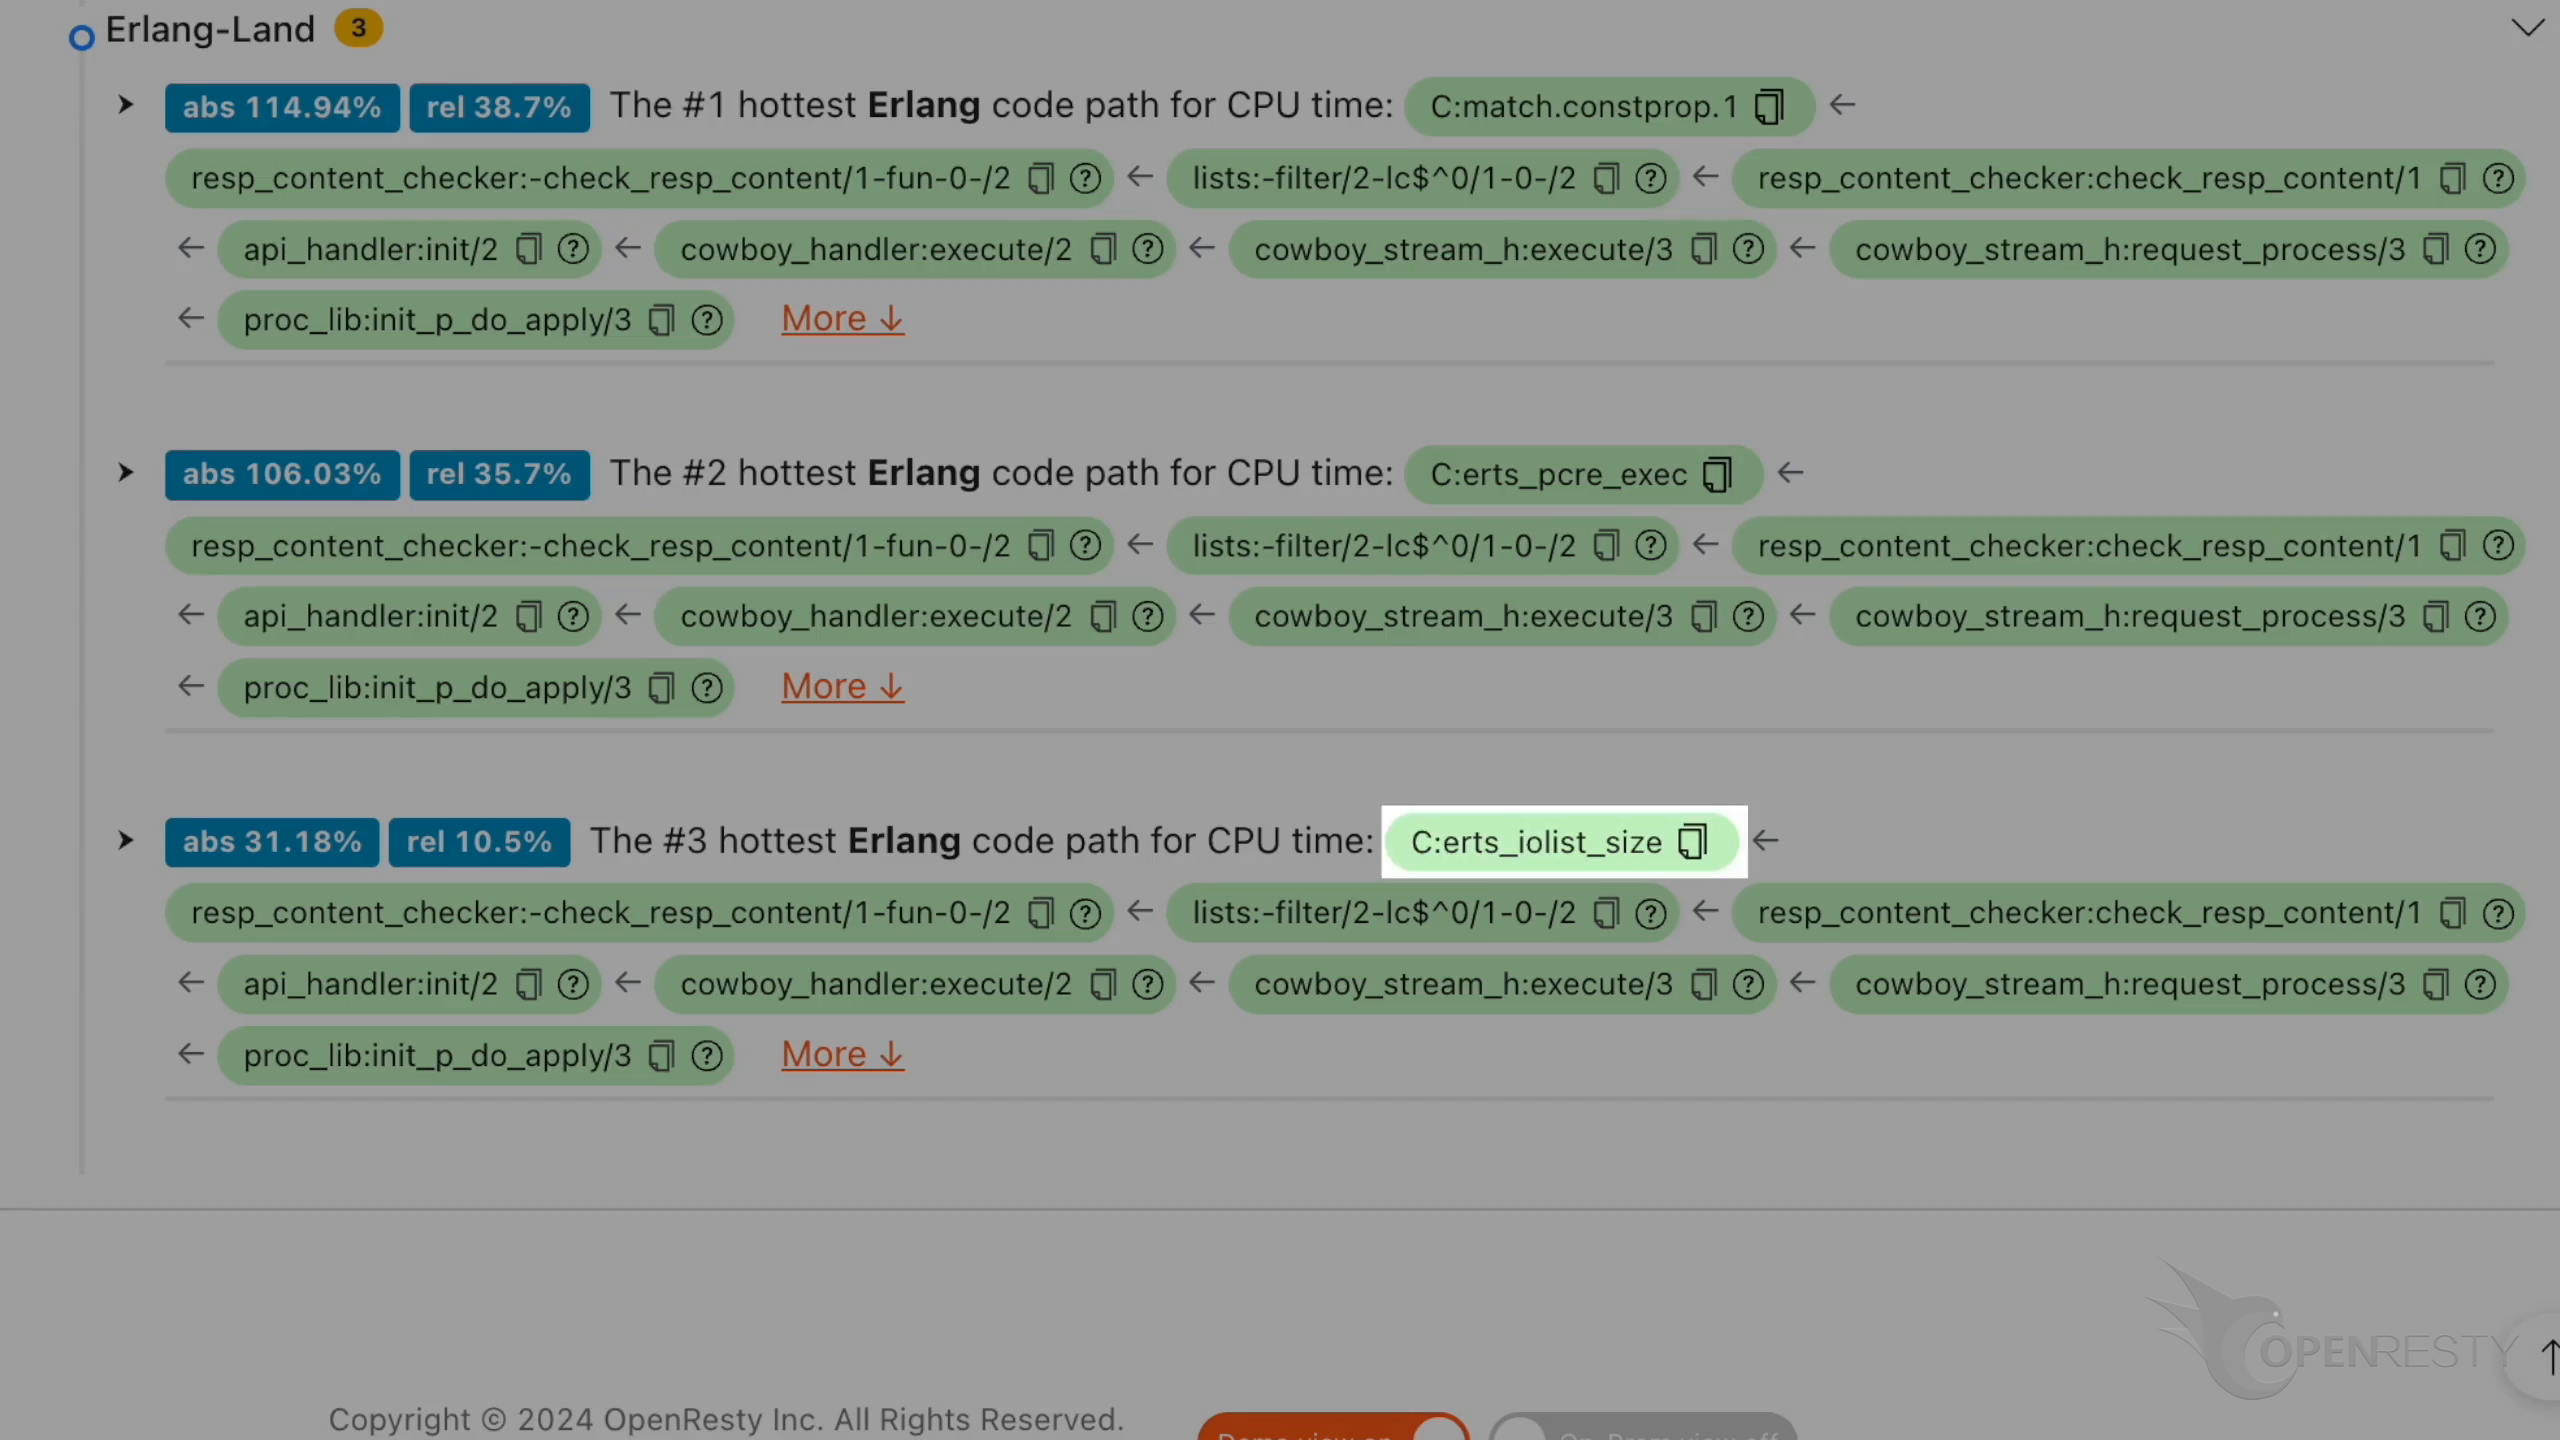
iolist is the input string to be matched, and erts_iolist_size is calculating the length of the string before passing it to the PCRE engine.
The Content variable is the input string to be matched.
C-Level Analysis: erts_pcre_exec and PCRE Backtracking
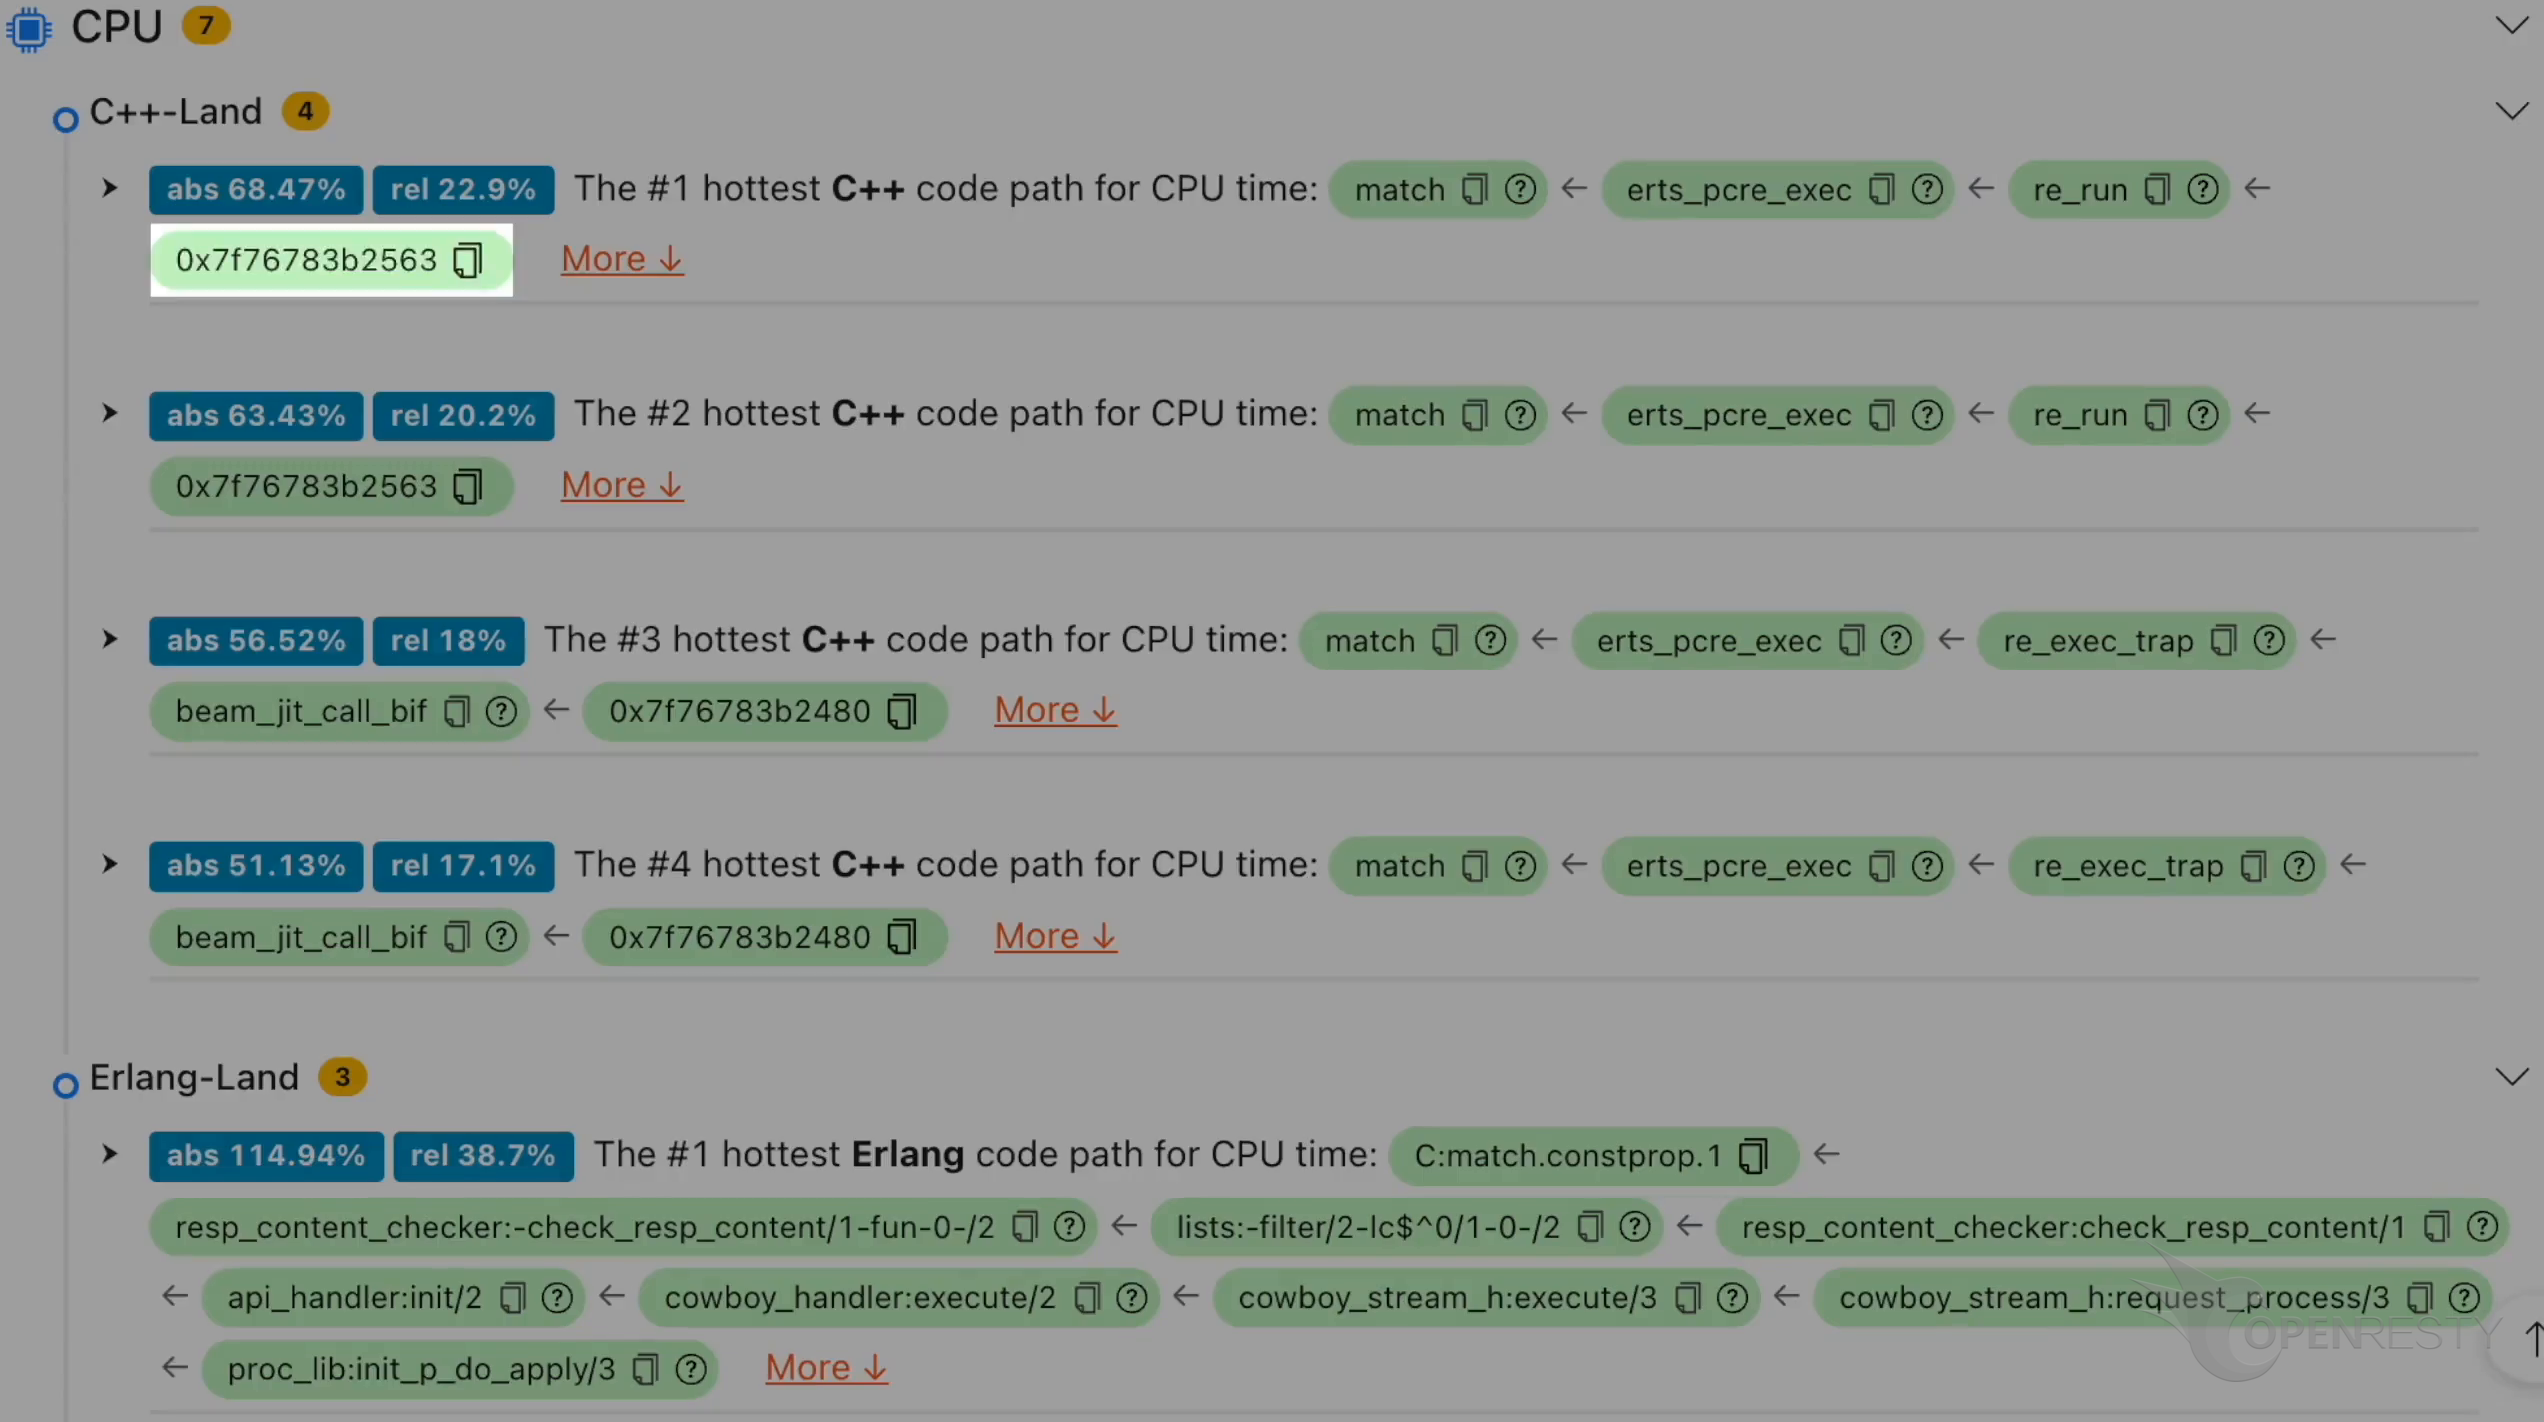
Switch back to the web console. The C-level analysis reveals performance hotspots inside the BEAM VM itself — confirming that the CPU bottleneck reaches all the way down into the PCRE library.
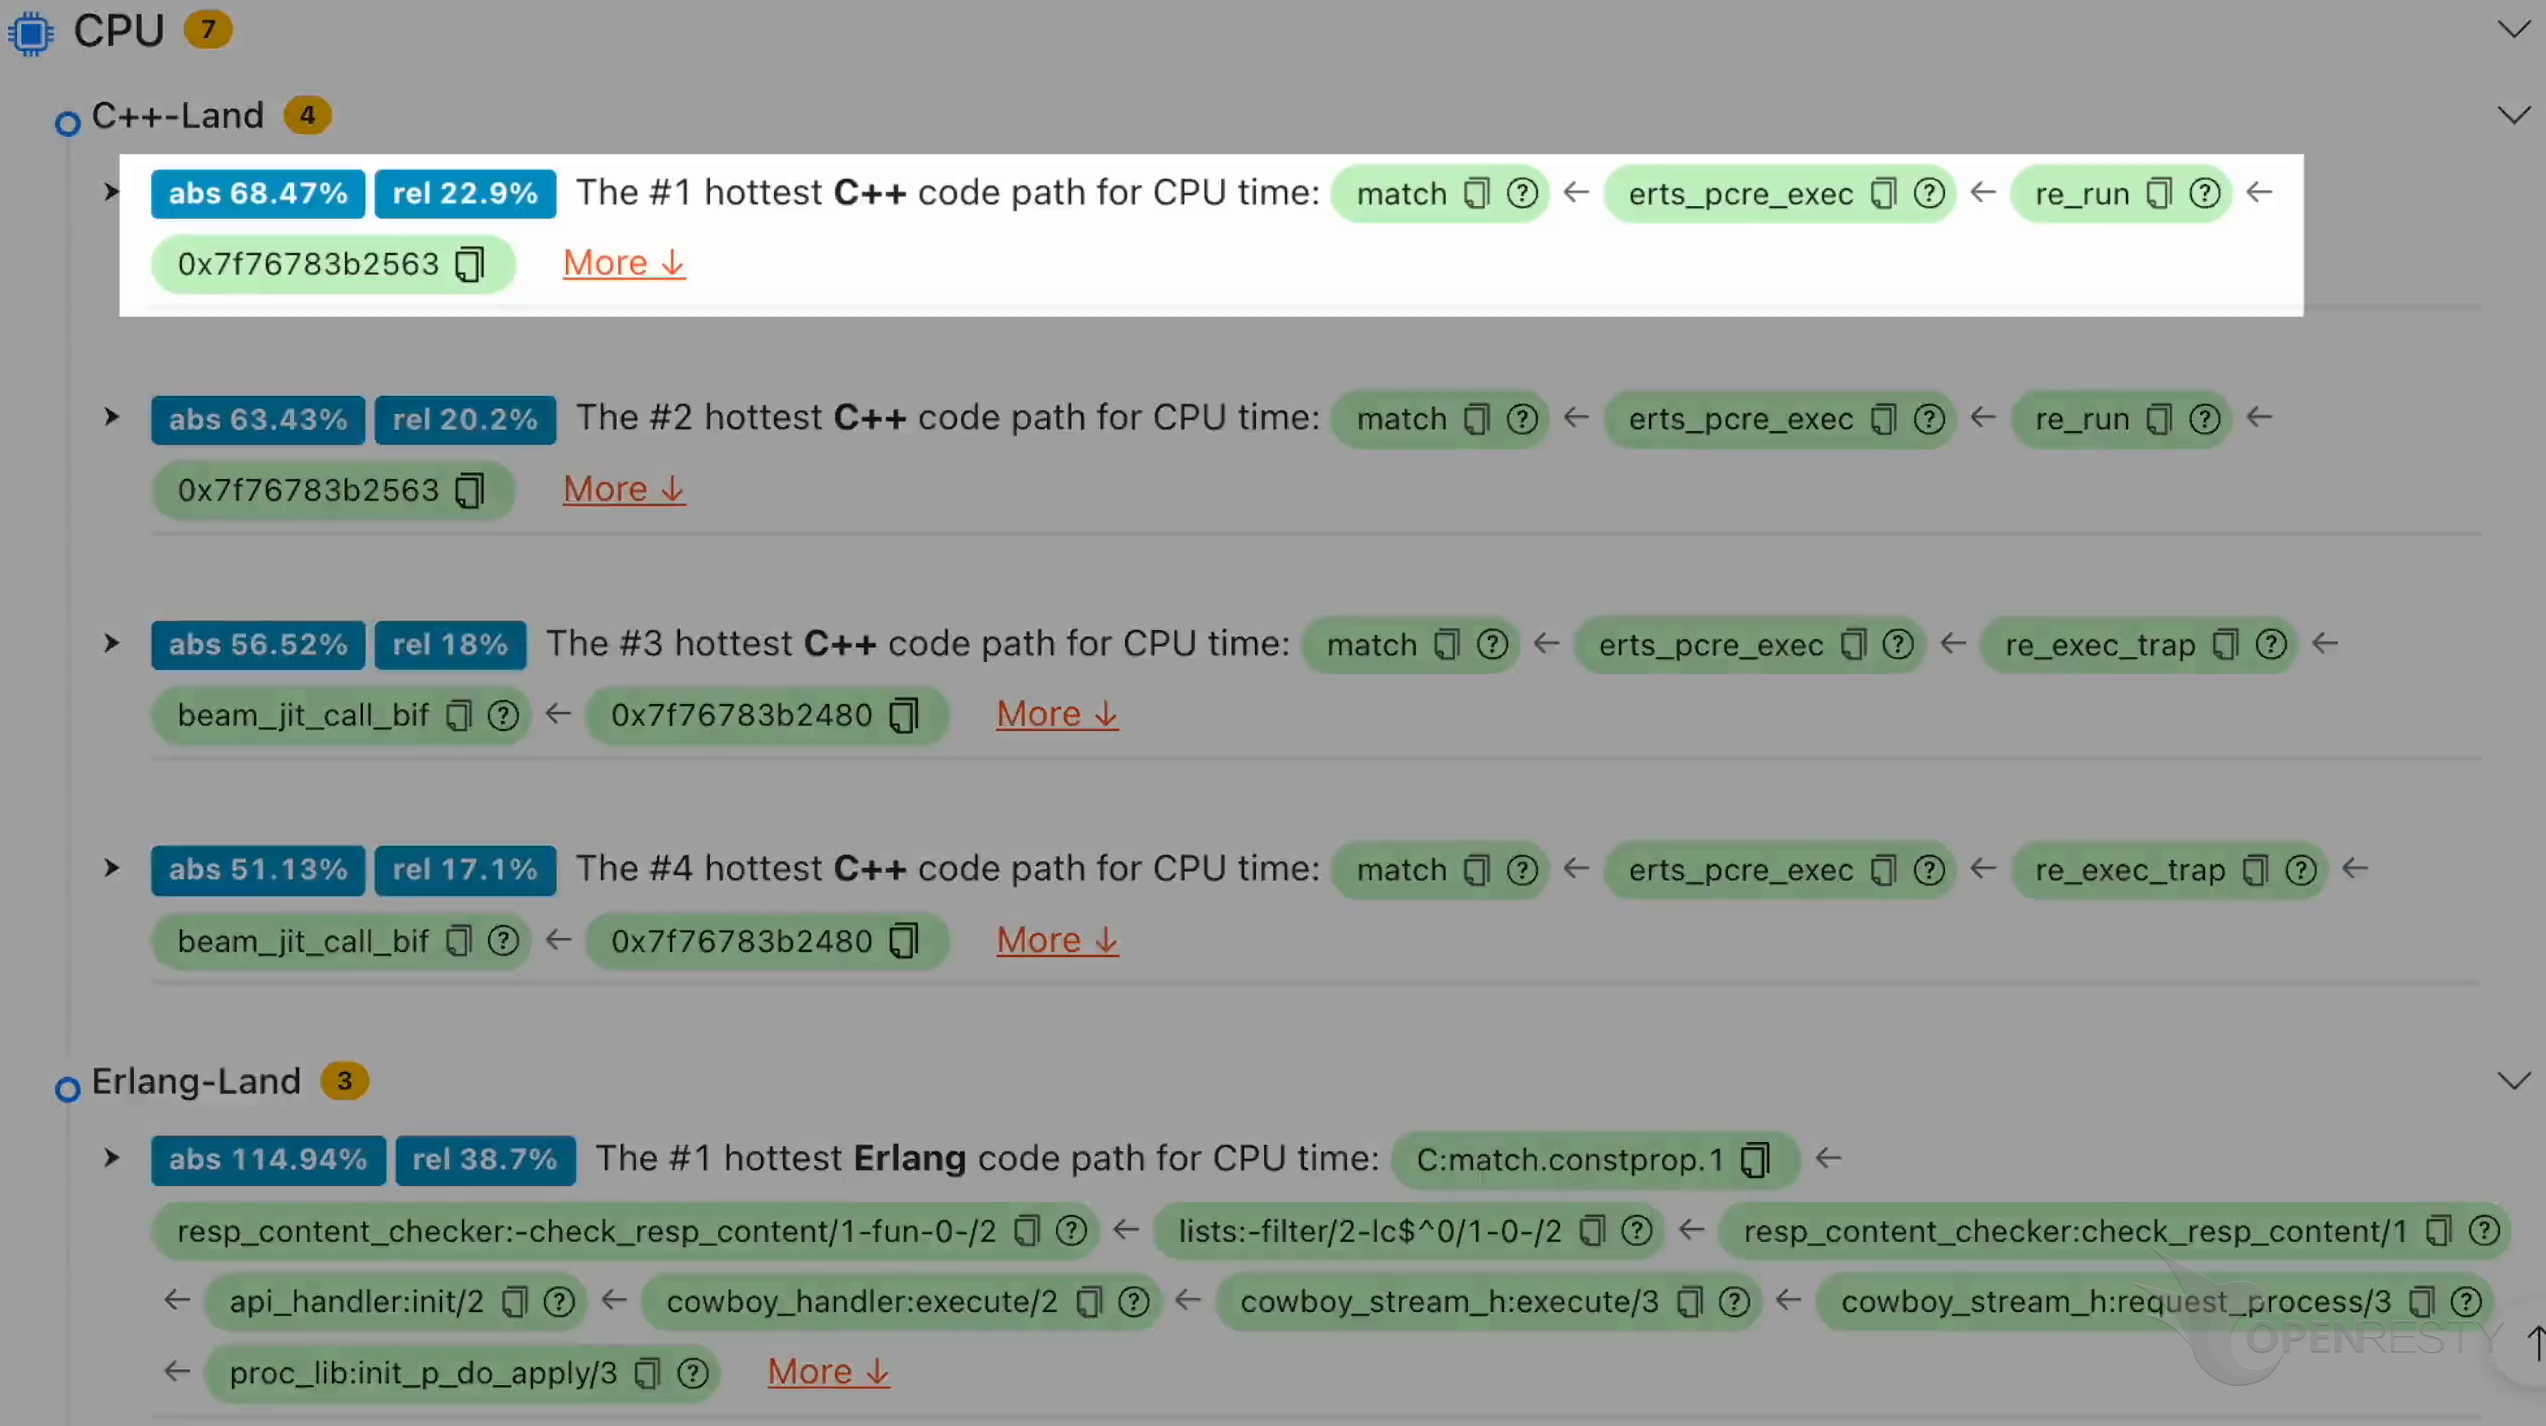
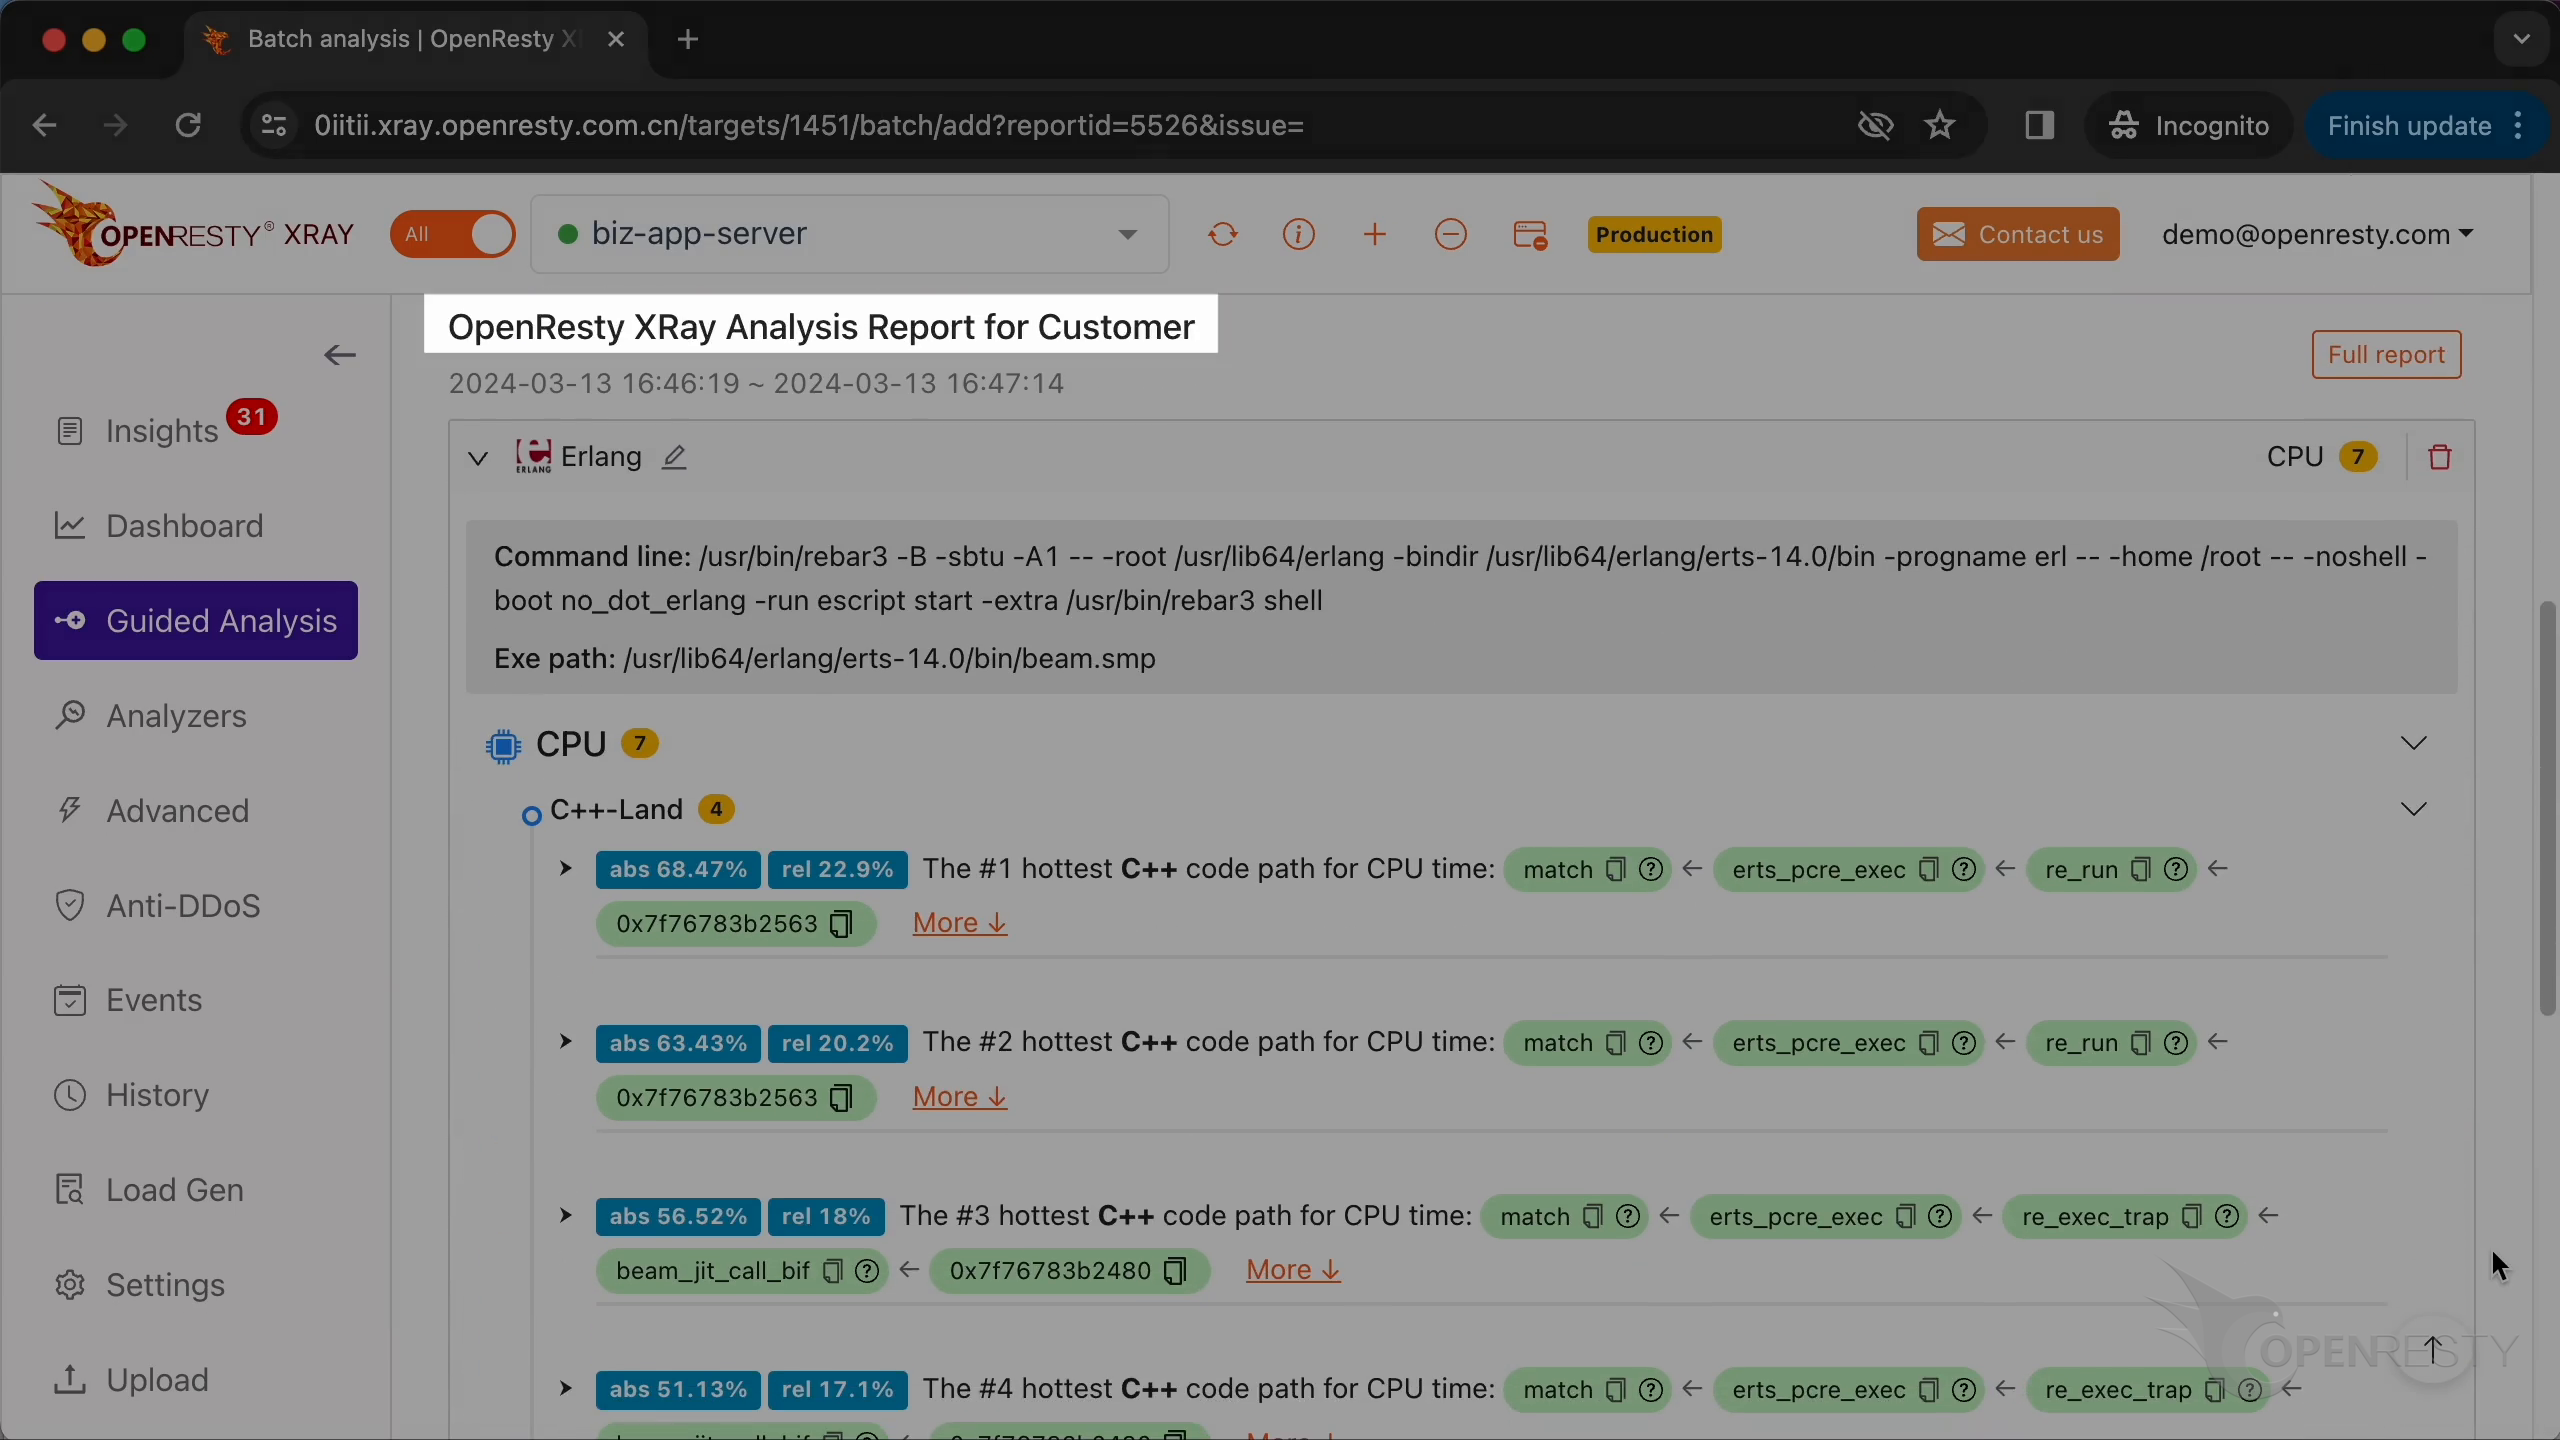
The function match in the PCRE library performs the actual regular expression matching.
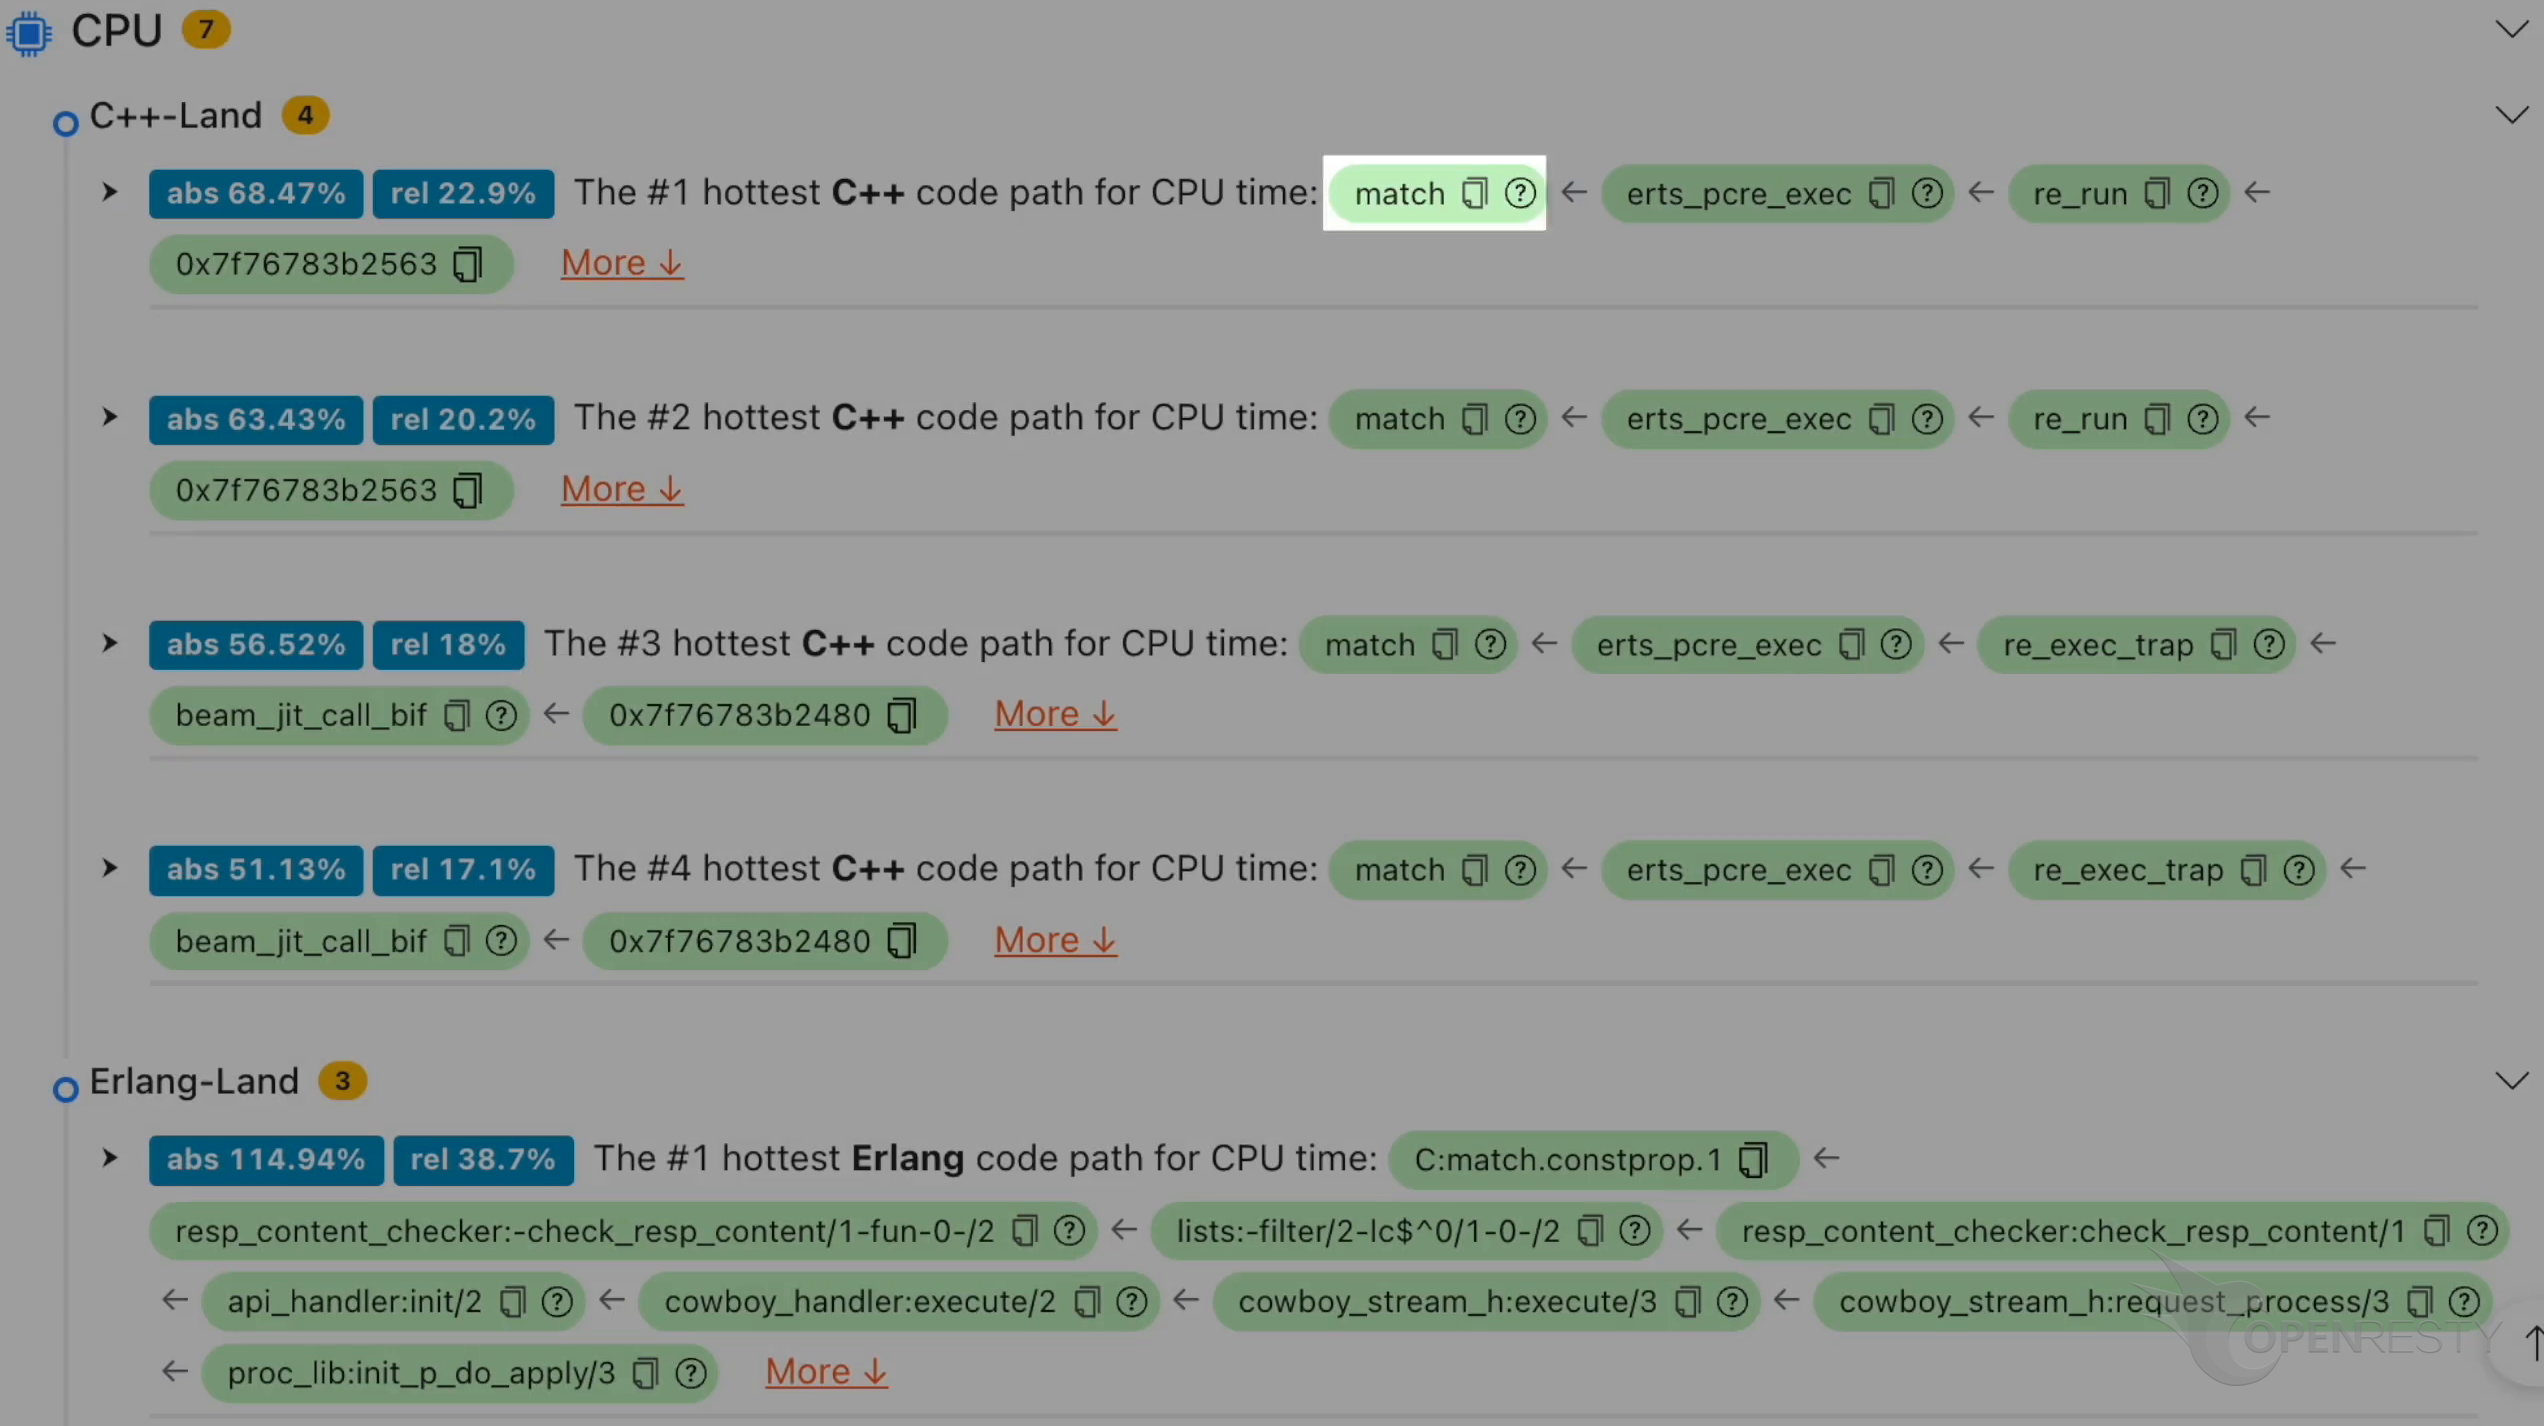
The second function, erts_pcre_exec, is the Erlang runtime’s wrapper for the pcre_exec function in the PCRE library.
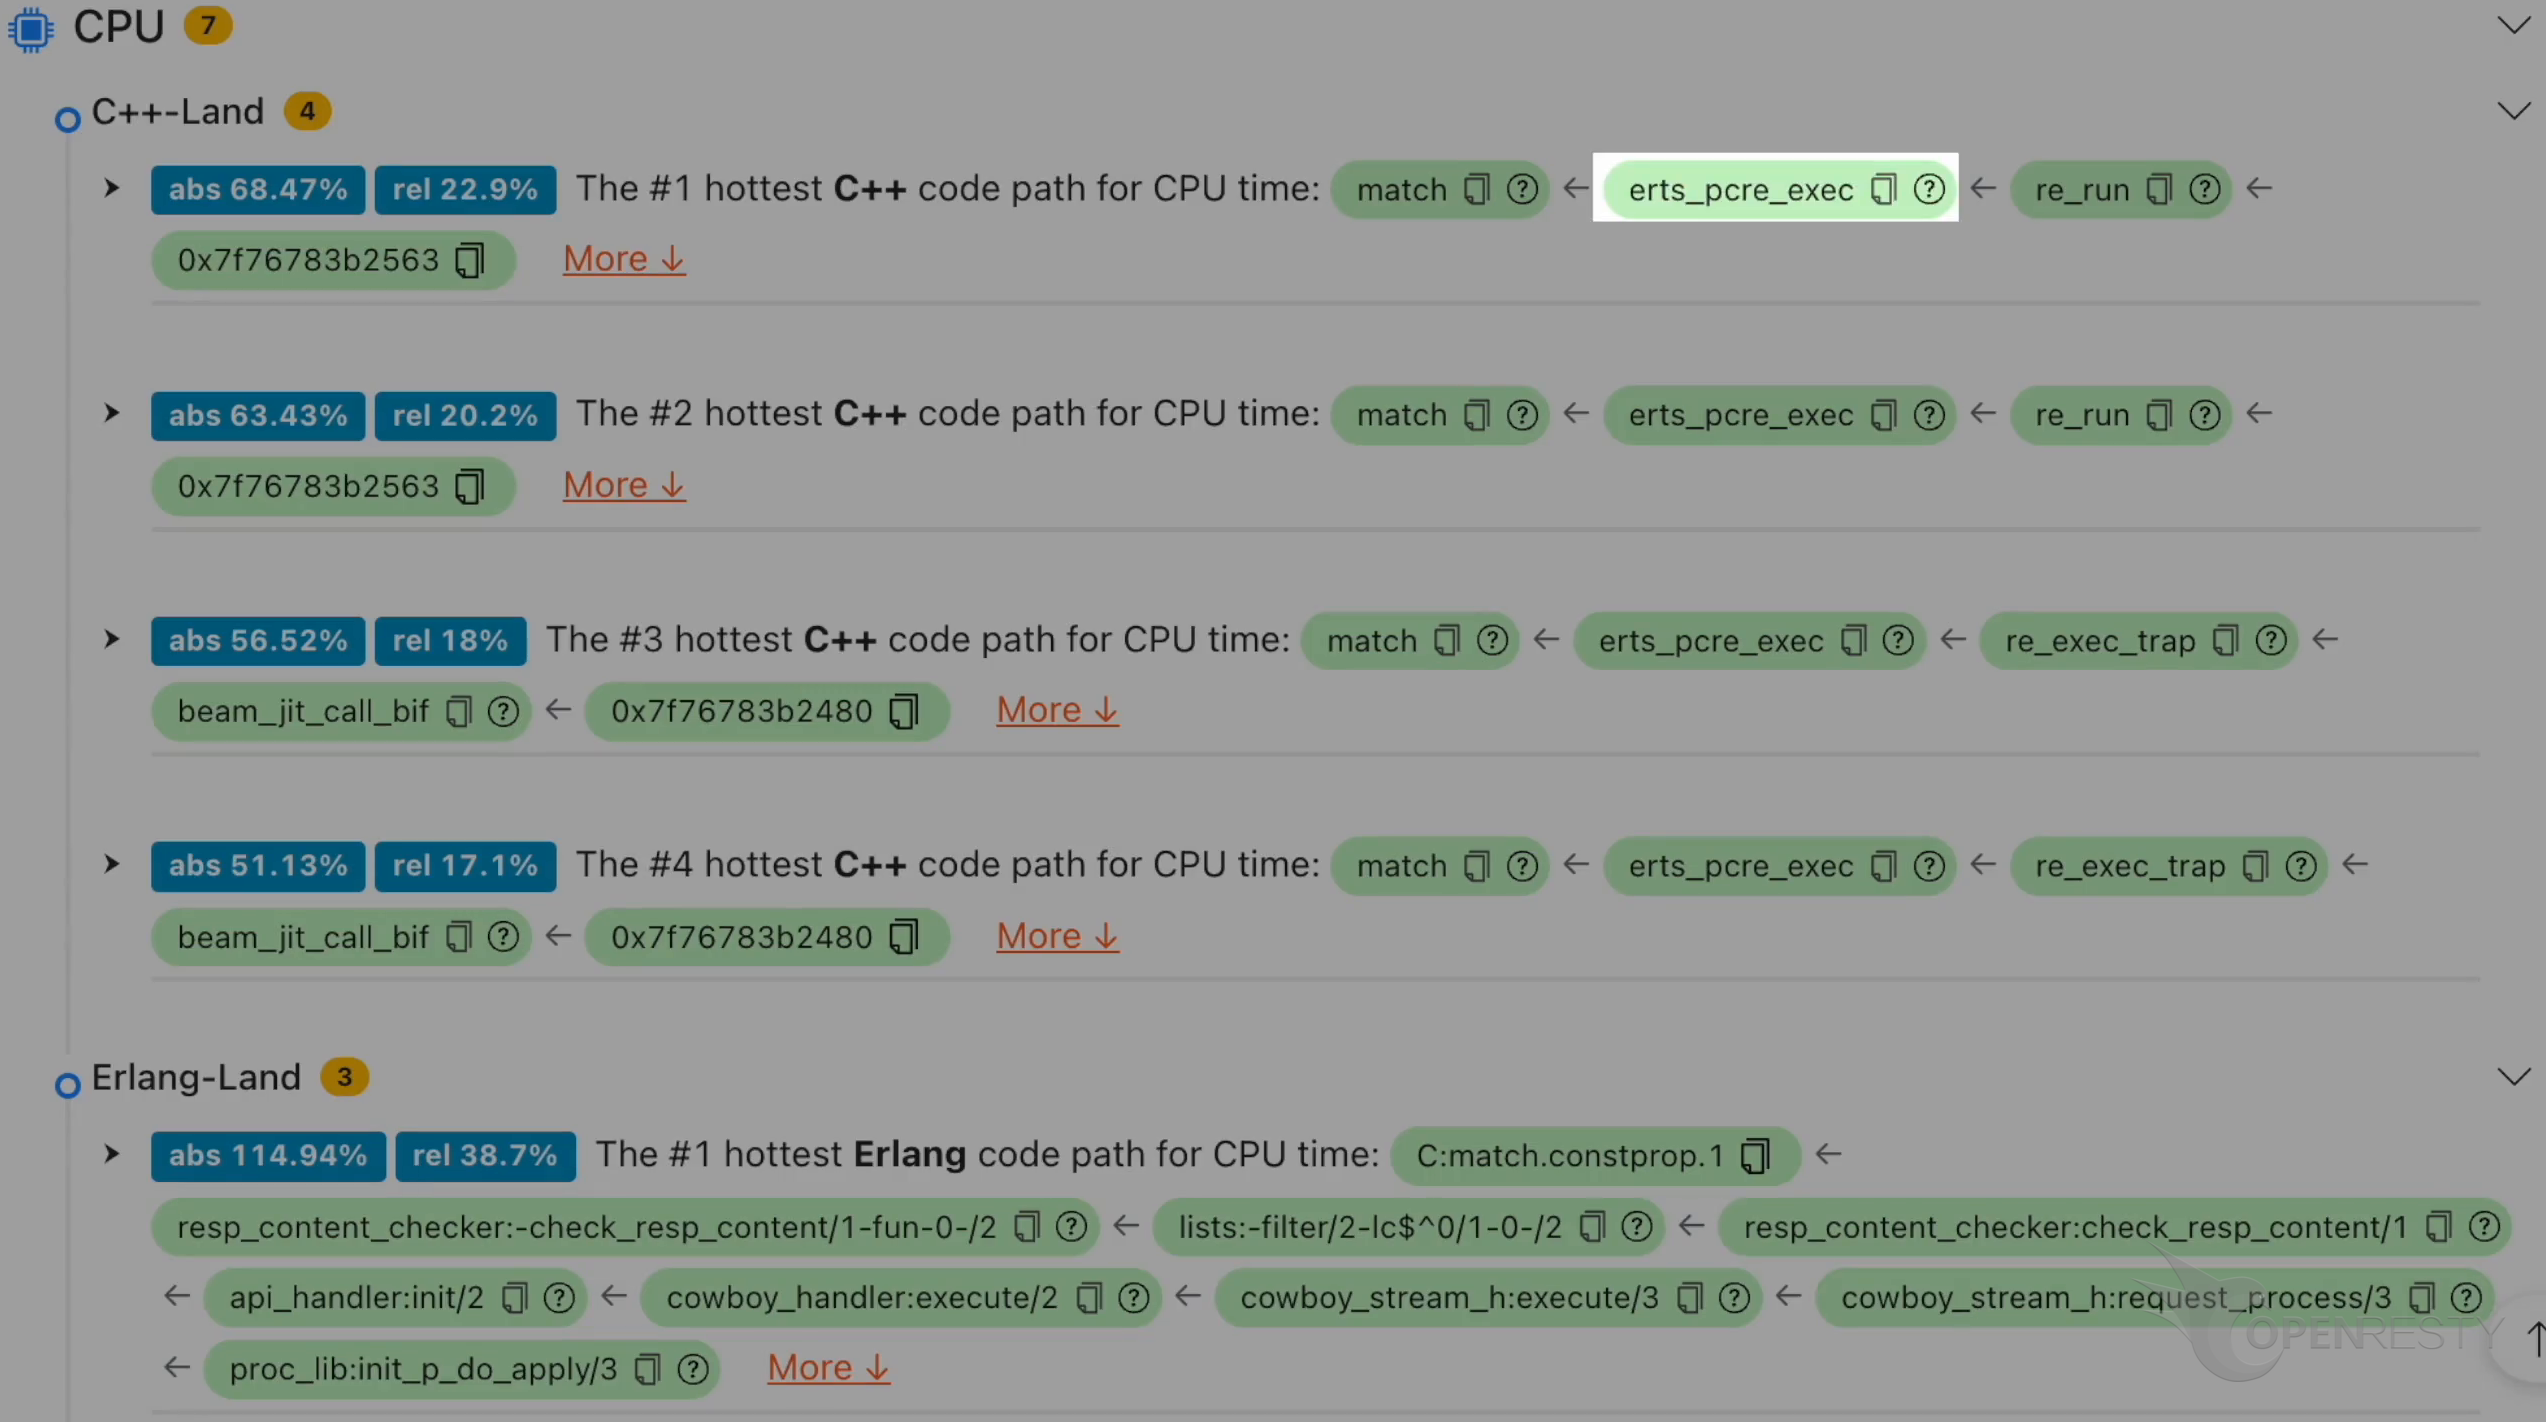
The re_run function in the re module of Erlang is used for executing regular expressions.
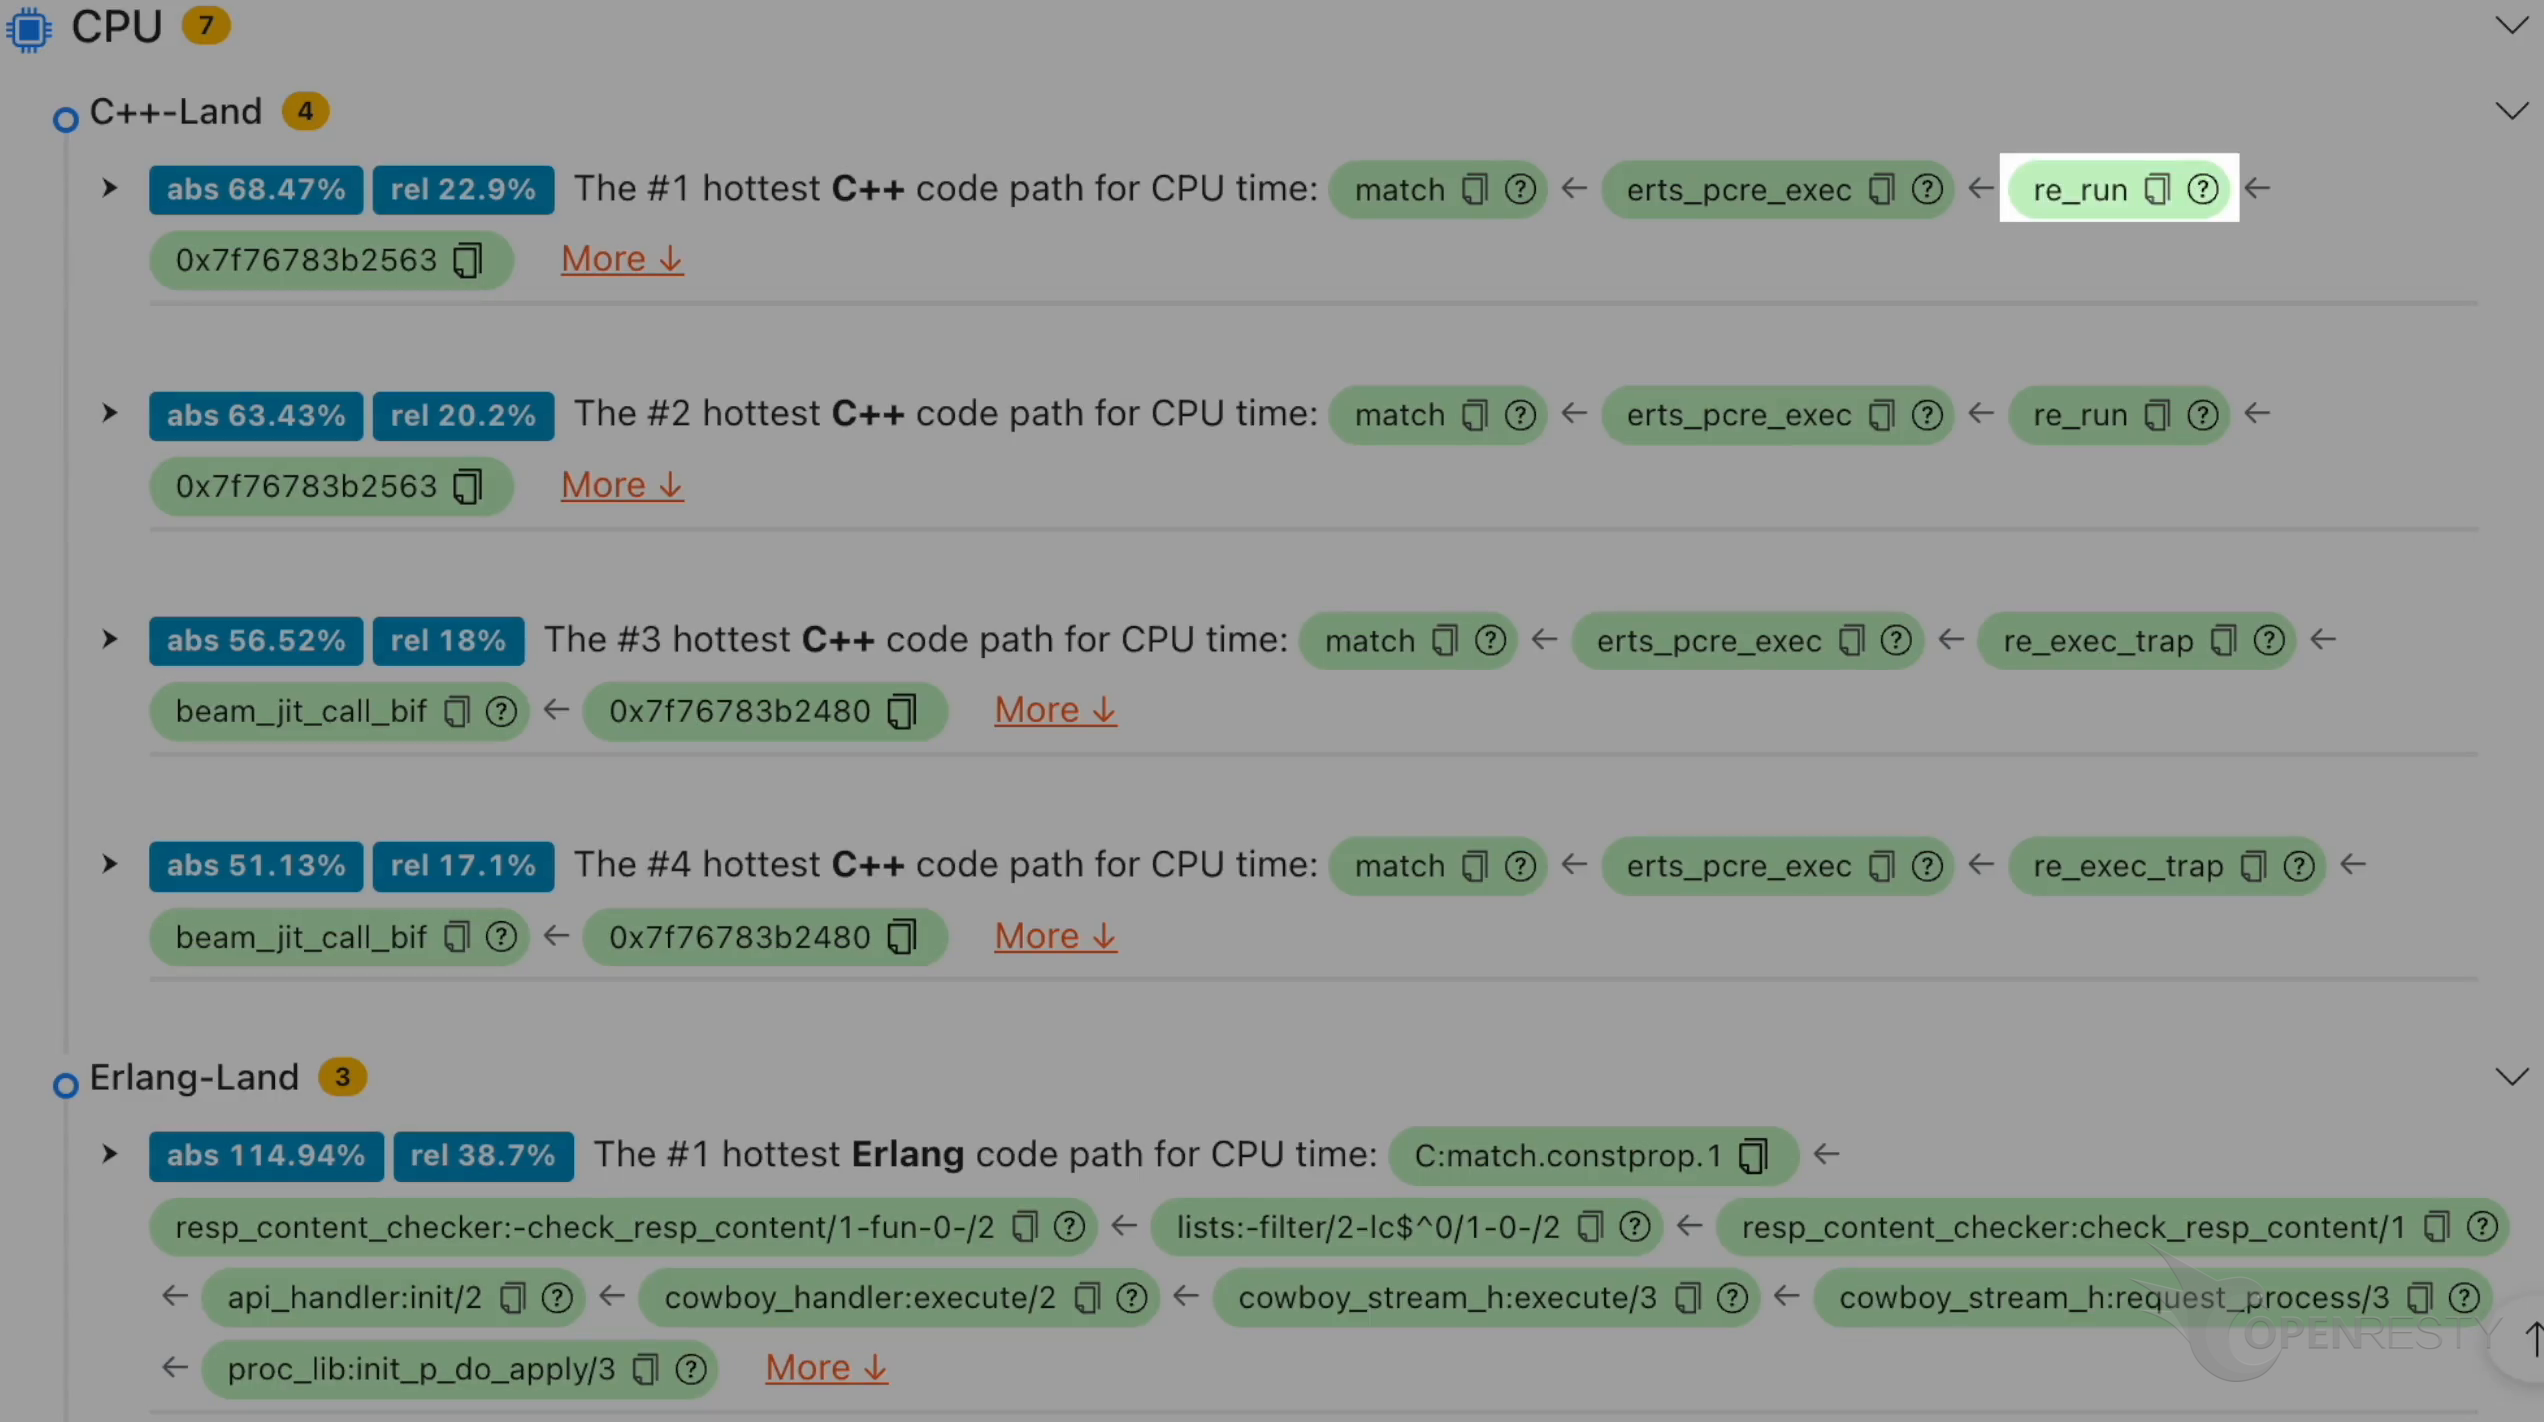
This hexadecimal address indicates that this code path is executed in JIT-compiled Erlang code.
Why PCRE Regex Backtracking Is Expensive in the BEAM VM
The C-level flame graph confirms that the CPU time is spent inside erts_pcre_exec — the BEAM VM’s built-in binding to the PCRE library. Erlang’s re module delegates all regex work to PCRE, which uses a backtracking NFA engine. When a pattern contains quantifiers like .*, .+, or nested alternations, the engine may explore an exponential number of match paths before concluding that no match exists. This is known as catastrophic backtracking.
To fix PCRE regex bottlenecks like this one, you can optimize the regex to avoid costly backtracking operations by the regex engine, or consider using a non-backtracking regex engine.
Automatic Monitoring and Reports
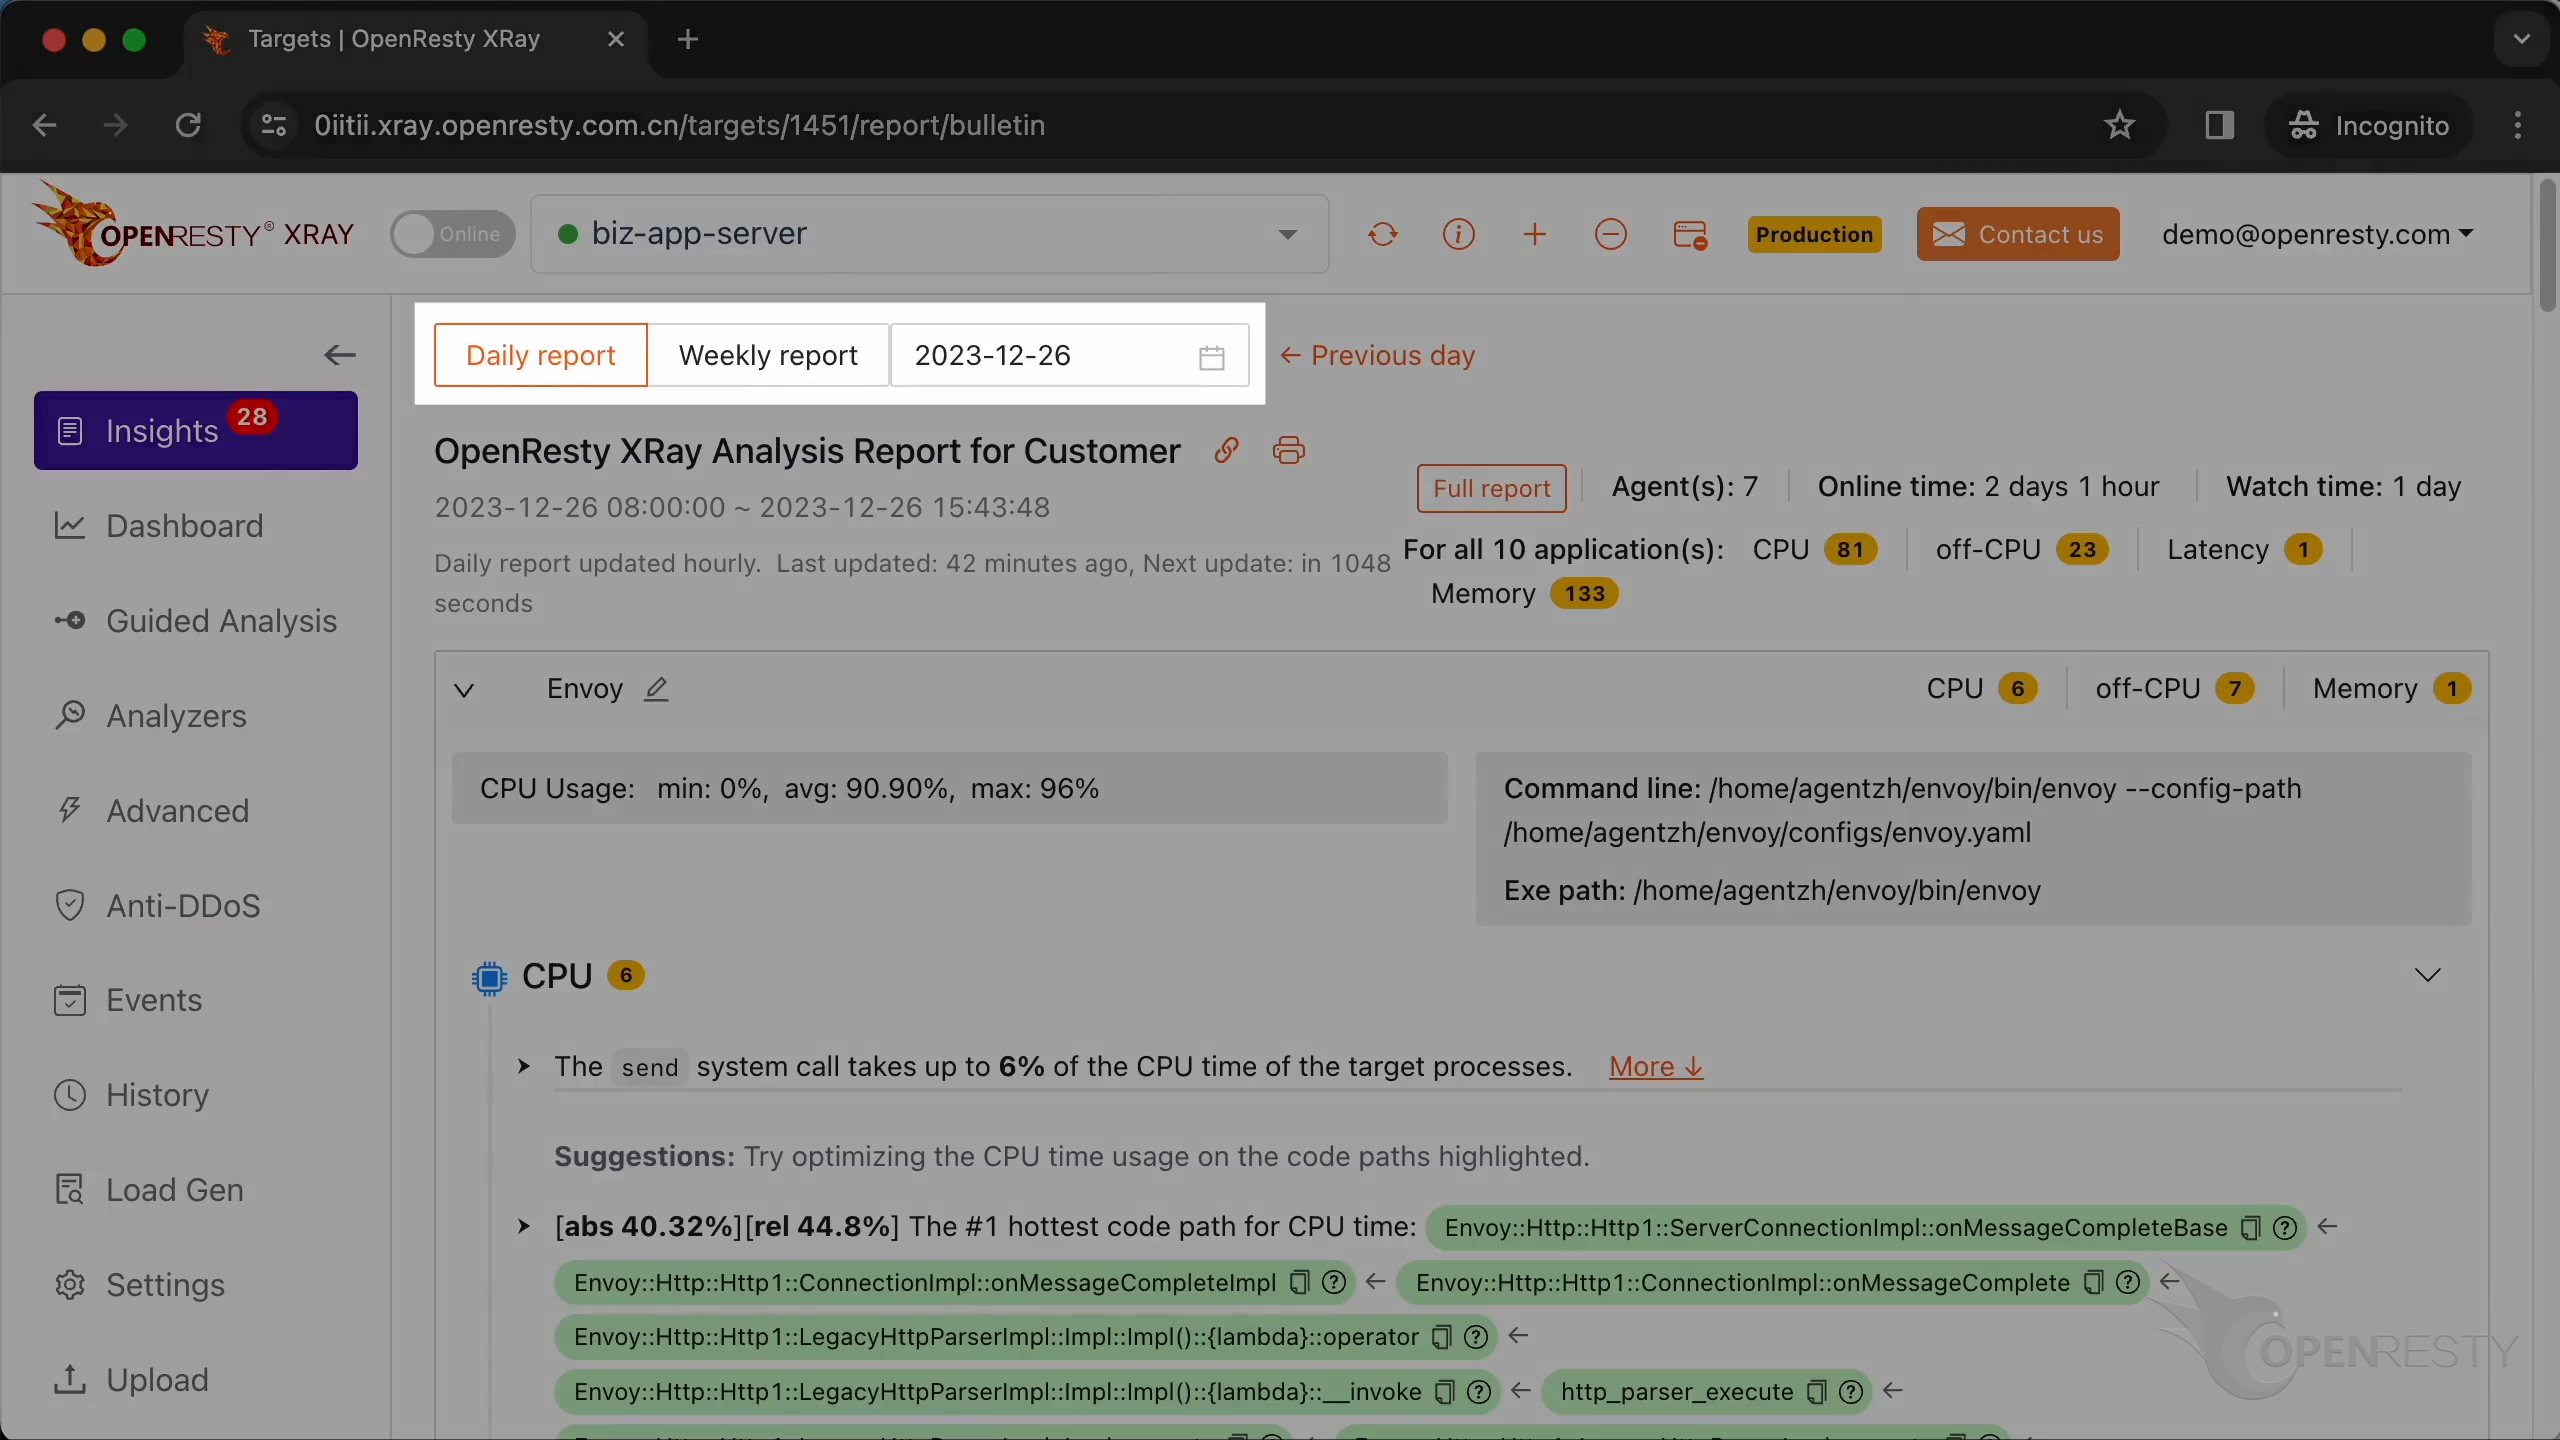
For production workloads, OpenResty XRay monitors Erlang processes continuously and generates daily and weekly reports on the Insights page — no manual guided analysis required.
FAQ: Erlang High CPU Usage
Why is my Erlang process using so much CPU?
A common cause of Erlang high CPU usage is an expensive operation in a hot code path — often regex matching, garbage collection pressure, or inefficient list processing. In this case, OpenResty XRay traced the CPU bottleneck to PCRE regex backtracking inside the check_resp_content function, where re:run/2 was called for every element in a lists:filter/2 loop. CPU flame graphs at both the Erlang and C levels reveal the full call chain down to erts_pcre_exec.
How do I find the Erlang code causing high CPU?
Use OpenResty XRay’s guided analysis to generate CPU flame graphs at both the Erlang and C language levels. The flame graph shows stacked function calls where width represents CPU time. Hover over a function box to see the source file path and line number, then open that file in any editor to inspect the exact code responsible. No code changes or restarts are needed — OpenResty XRay attaches to the running Erlang process directly.
Can PCRE regex patterns cause high CPU in Erlang?
Yes. Erlang’s re module delegates regex work to the PCRE library via erts_pcre_exec, and PCRE uses a backtracking NFA engine. Patterns with nested quantifiers or alternations can trigger catastrophic backtracking, consuming exponential CPU time. In this case, the PCRE match function appeared as the leaf CPU consumer in the C-level flame graph, confirming that regex backtracking was the root cause of the Erlang high CPU usage.
What is OpenResty XRay
OpenResty XRay is a dynamic-tracing product that automatically analyzes your running applications to troubleshoot performance problems, behavioral issues, and security vulnerabilities with actionable suggestions. Under the hood, OpenResty XRay is powered by our Y language targeting various runtimes like Stap+, eBPF+, GDB, and ODB, depending on the contexts.
If you like this tutorial, please subscribe to this blog site and/or our YouTube channel. Thank you!
About The Author
Yichun Zhang (Github handle: agentzh), is the original creator of the OpenResty® open-source project and the CEO of OpenResty Inc..
Yichun is one of the earliest advocates and leaders of “open-source technology”. He worked at many internationally renowned tech companies, such as Cloudflare, Yahoo!. He is a pioneer of “edge computing”, “dynamic tracing” and “machine coding”, with over 22 years of programming and 16 years of open source experience. Yichun is well-known in the open-source space as the project leader of OpenResty®, adopted by more than 40 million global website domains.
OpenResty Inc., the enterprise software start-up founded by Yichun in 2017, has customers from some of the biggest companies in the world. Its flagship product, OpenResty XRay, is a non-invasive profiling and troubleshooting tool that significantly enhances and utilizes dynamic tracing technology. And its OpenResty Edge product is a powerful distributed traffic management and private CDN software product.
As an avid open-source contributor, Yichun has contributed more than a million lines of code to numerous open-source projects, including Linux kernel, Nginx, LuaJIT, GDB, SystemTap, LLVM, Perl, etc. He has also authored more than 60 open-source software libraries.
Related Articles
OpenResty XRay Aug 23, 2023

OpenResty XRay Aug 4, 2023

OpenResty XRay Feb 27, 2024

OpenResty XRay Feb 27, 2024

OpenResty XRay Aug 27, 2026