Envoy CPU Profiling: Find Hot C++ Paths with Flame Graphs
Envoy proxy servers can burn a full CPU core on internal bookkeeping even for a simple “hello world” response. In this case study, a C++ CPU flame graph generated by OpenResty XRay reveals the three hottest code paths inside a live Envoy process — topped by the SchedulableCallbackImpl operator — without restarting or recompiling the binary. A throughput comparison then shows OpenResty handling over 200% more requests than Envoy on identical hardware.
Below: the full profiling walkthrough, flame graph readings, and automated reporting setup.
Scenario: Envoy Proxy Running at 90% CPU
Use the cat command to check this Envoy server configuration file.
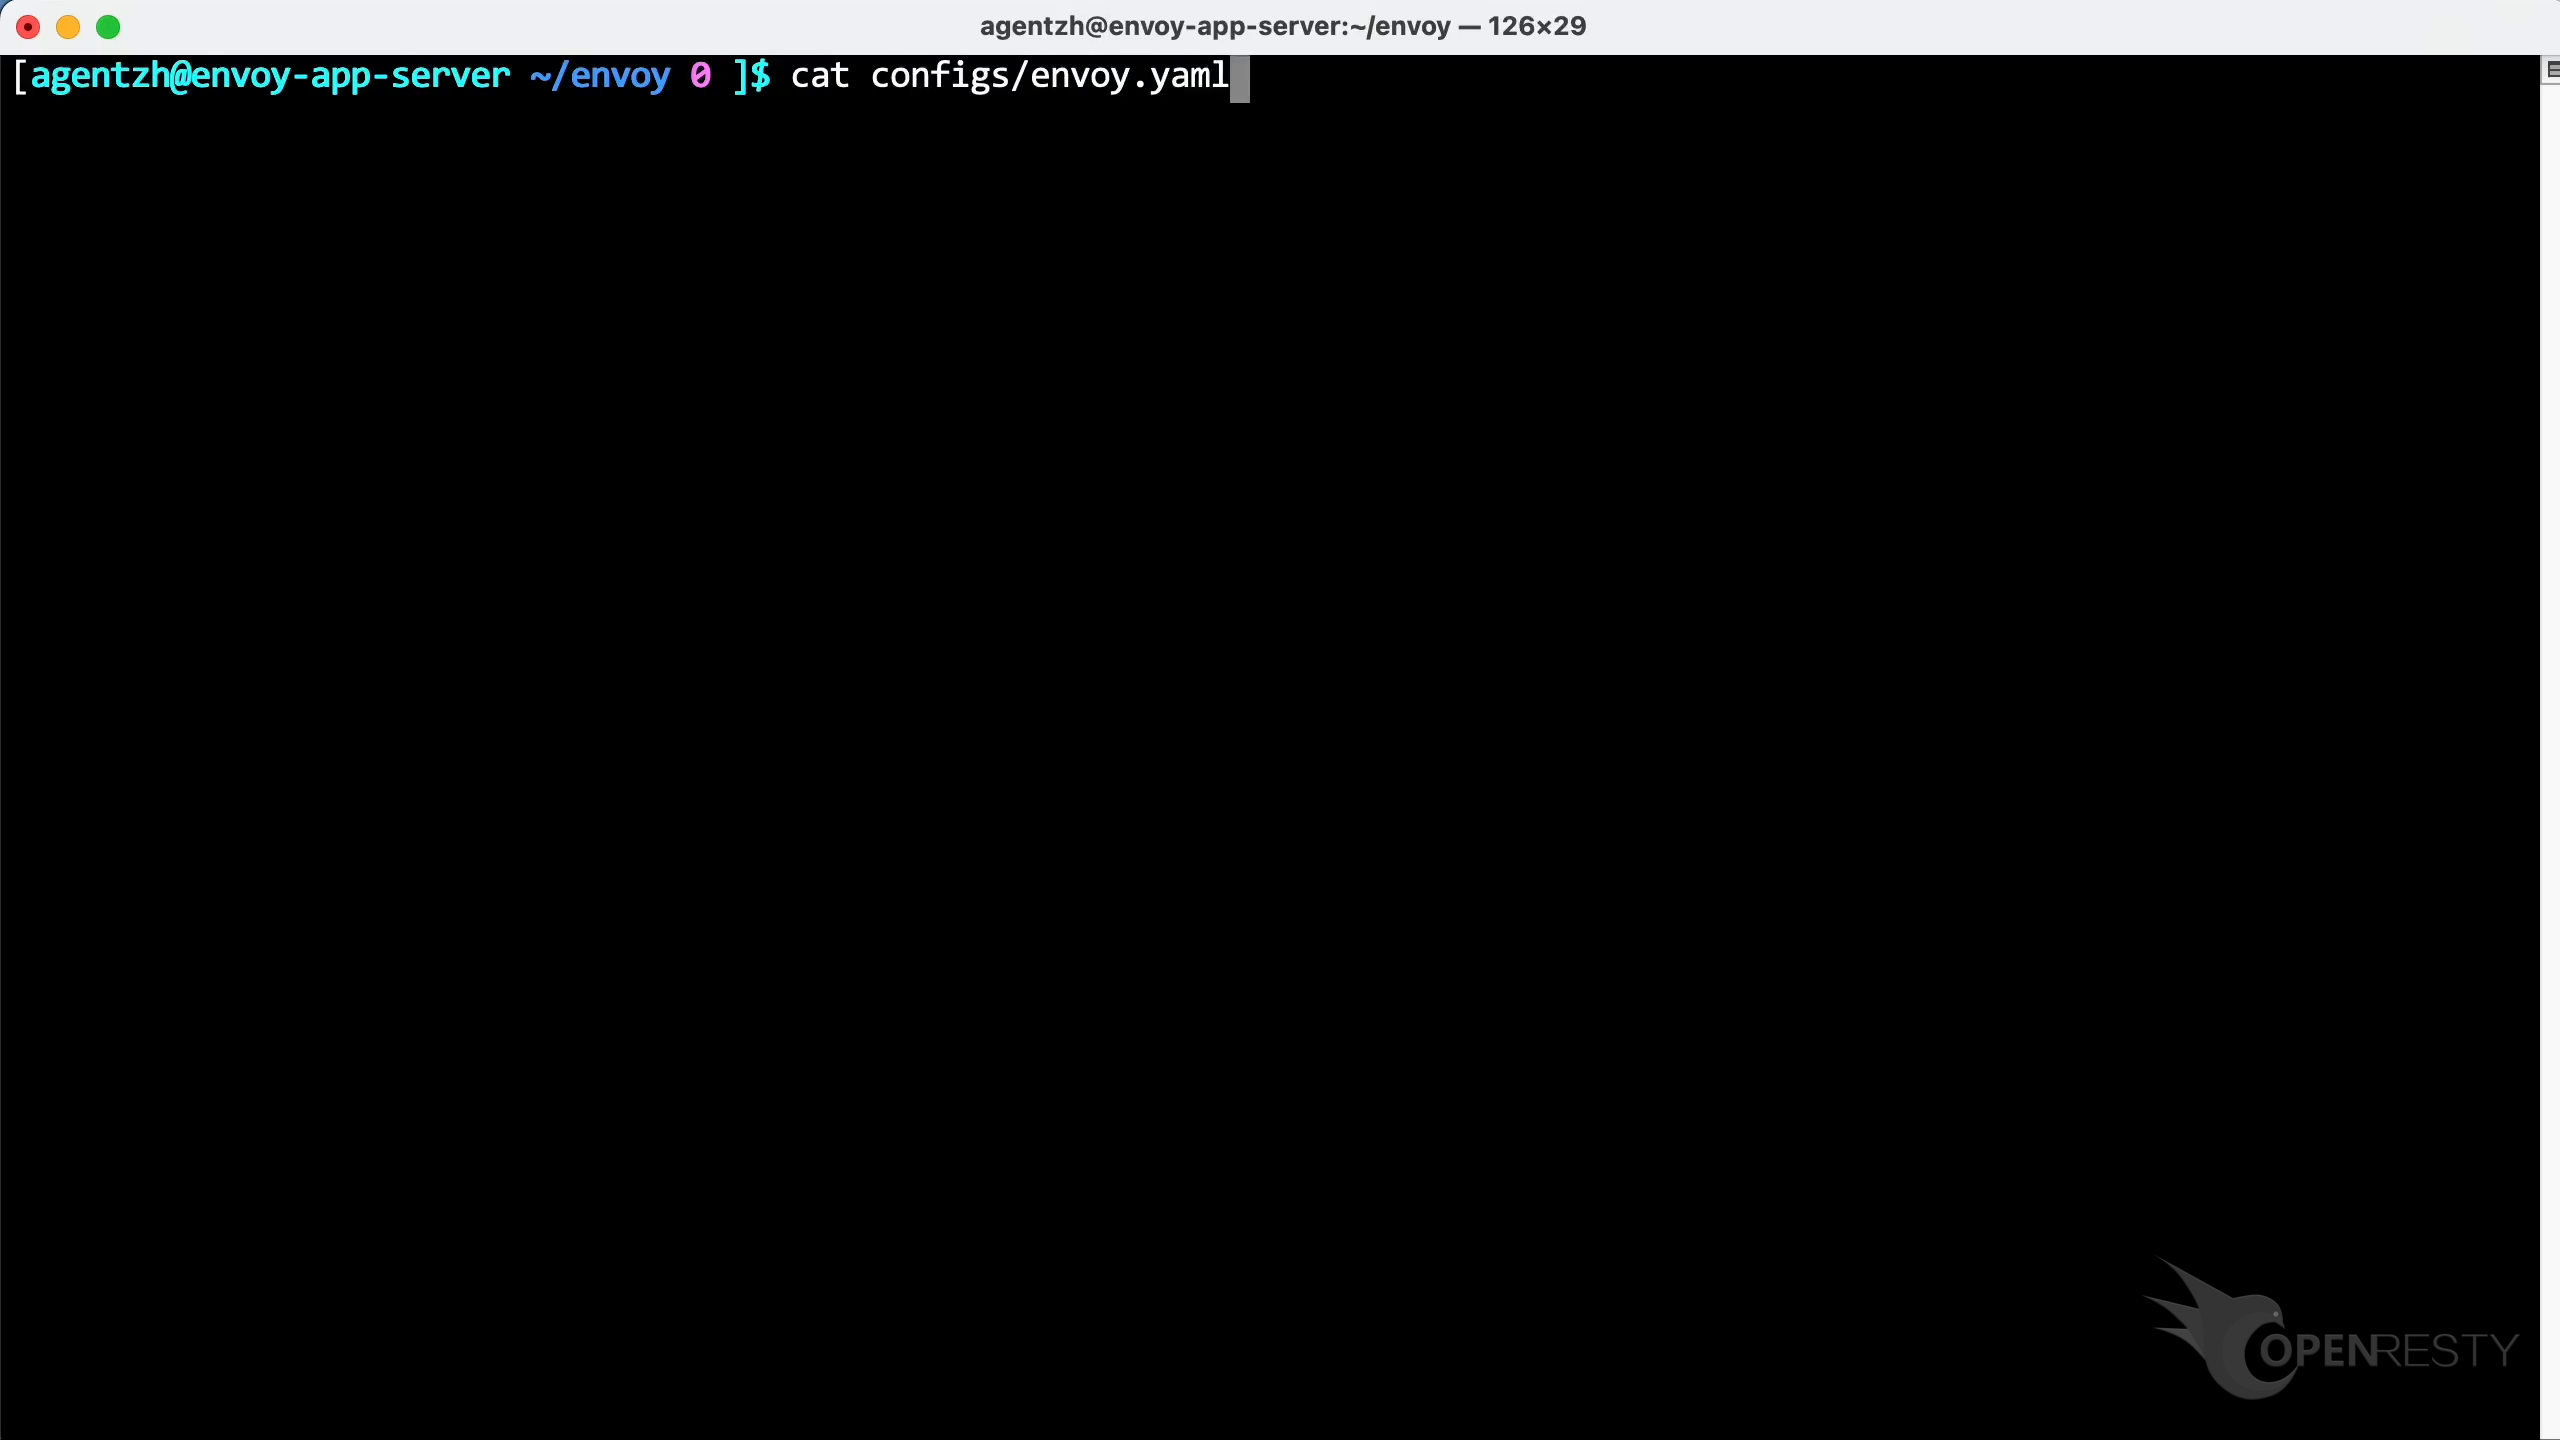
You can see that it listens on port 1088.
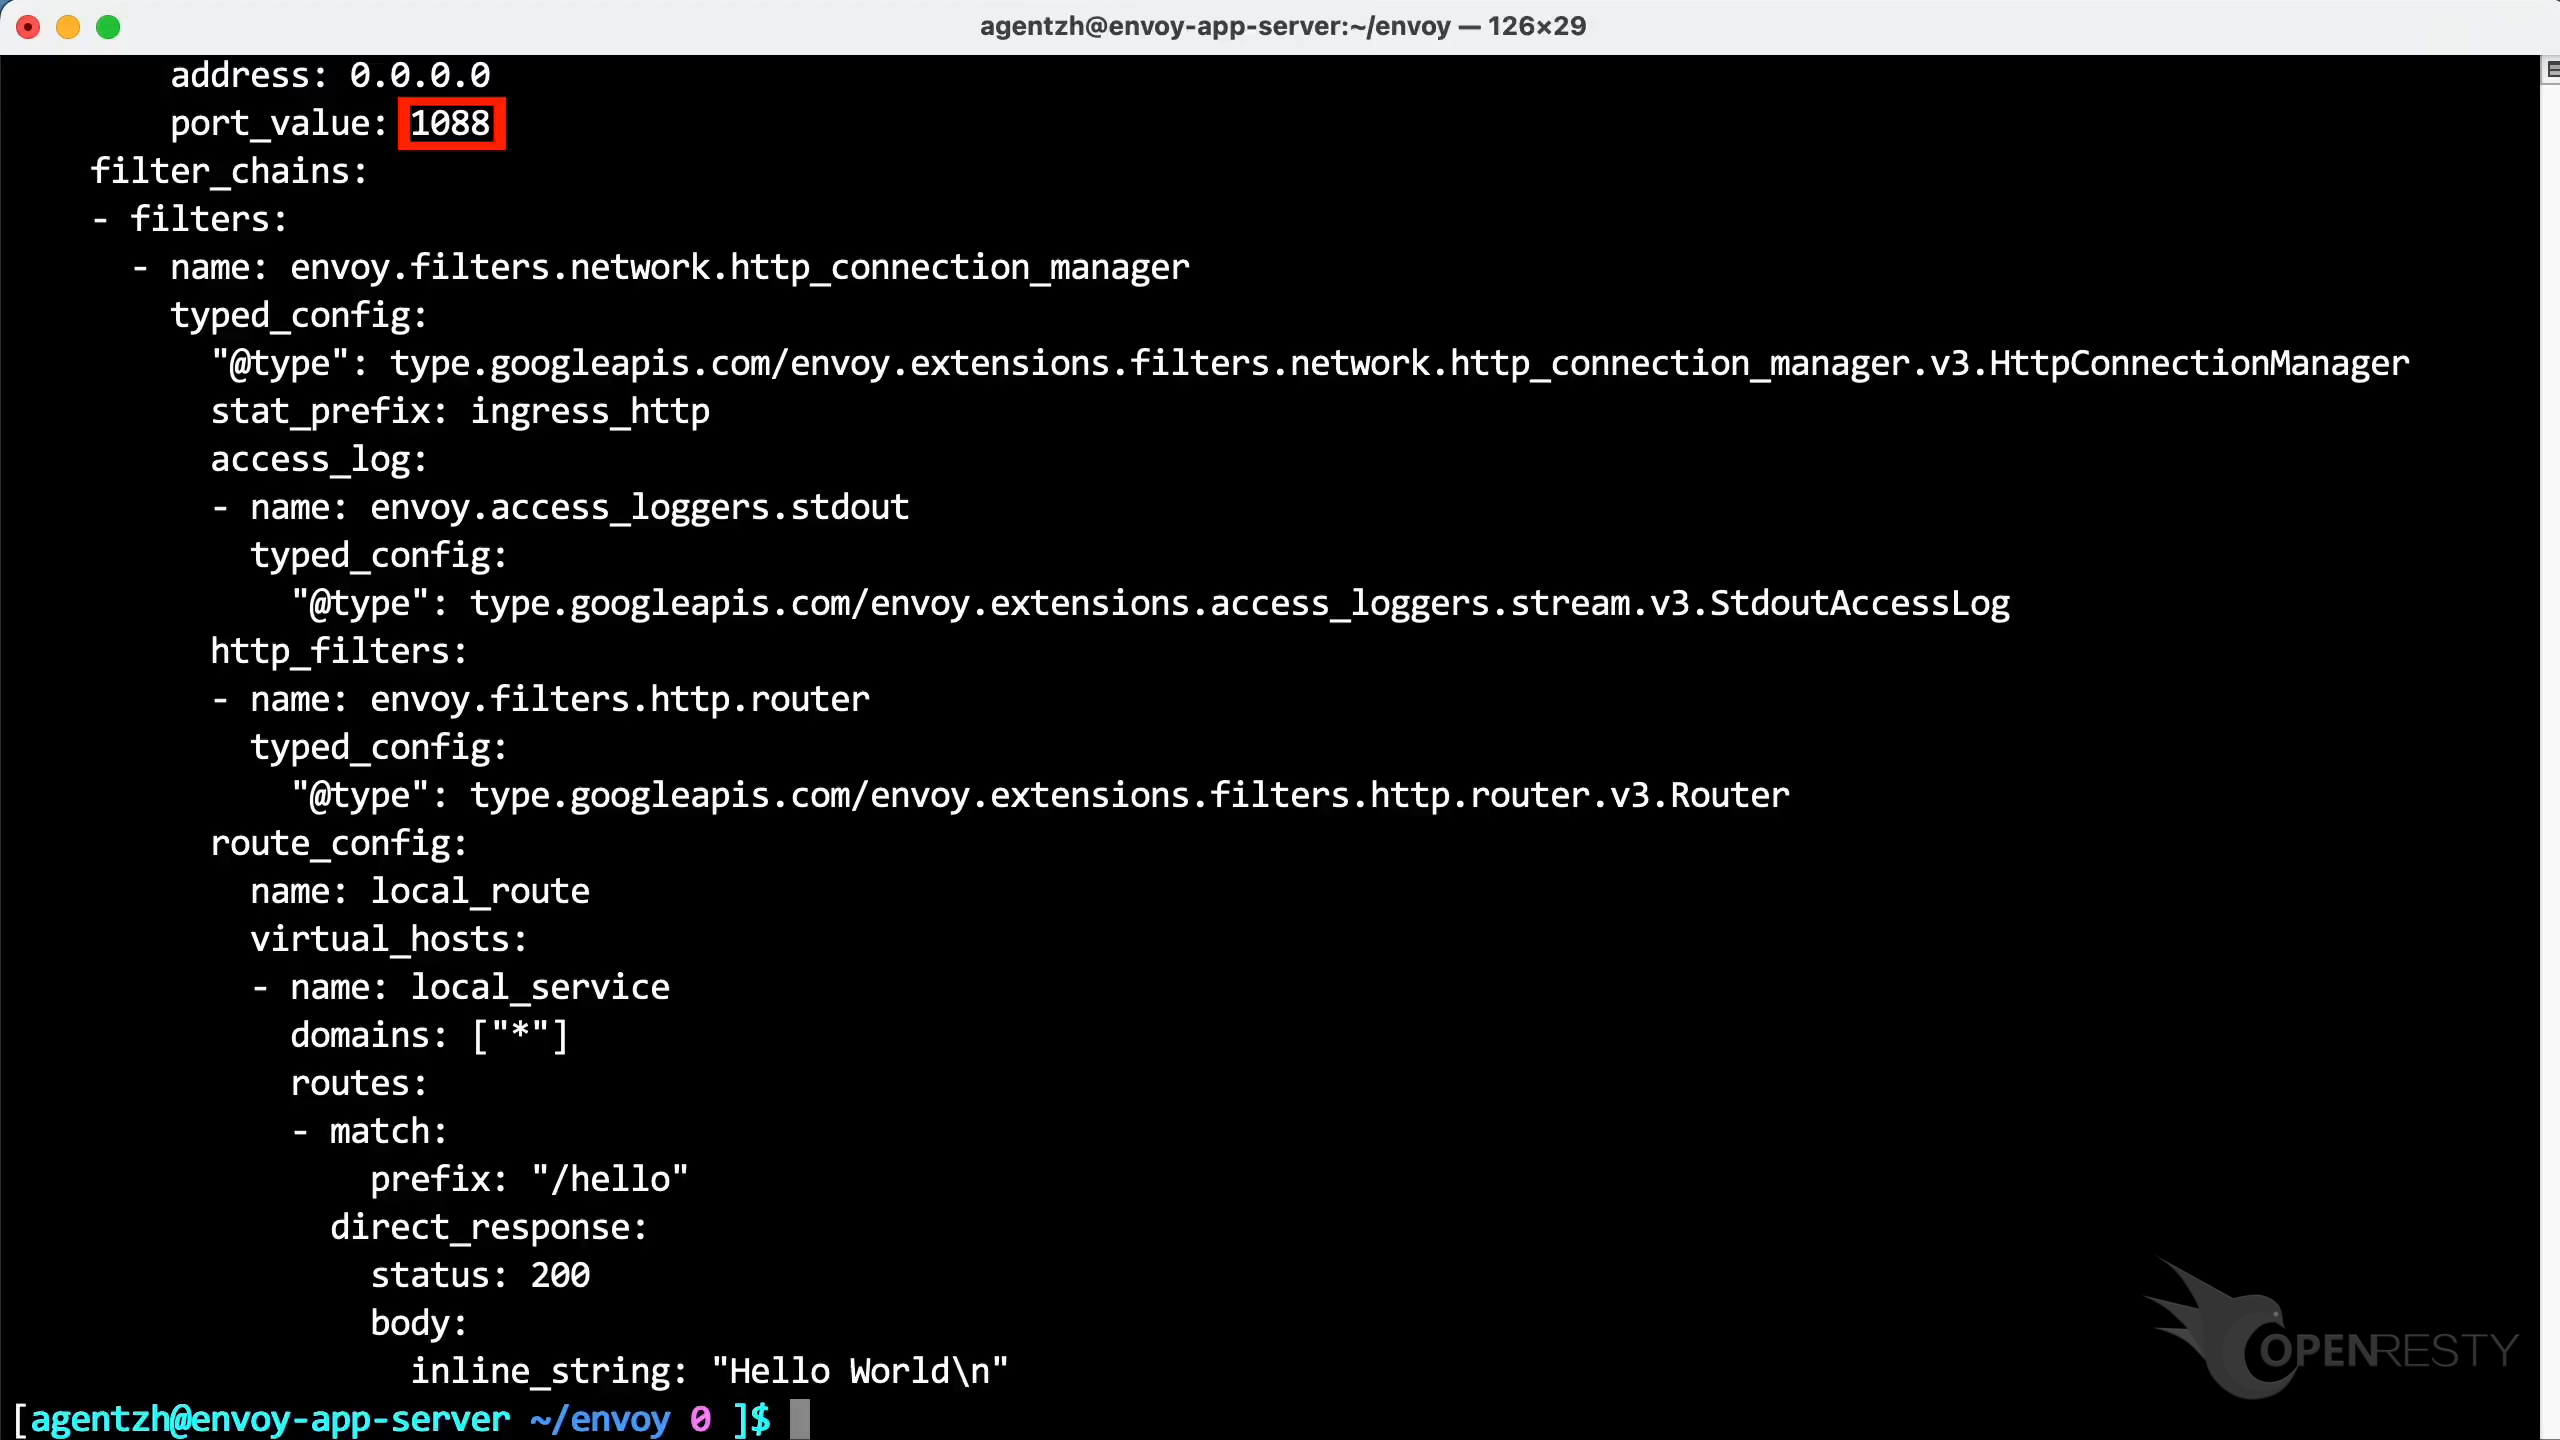
It replies with the “Hello world” response body.
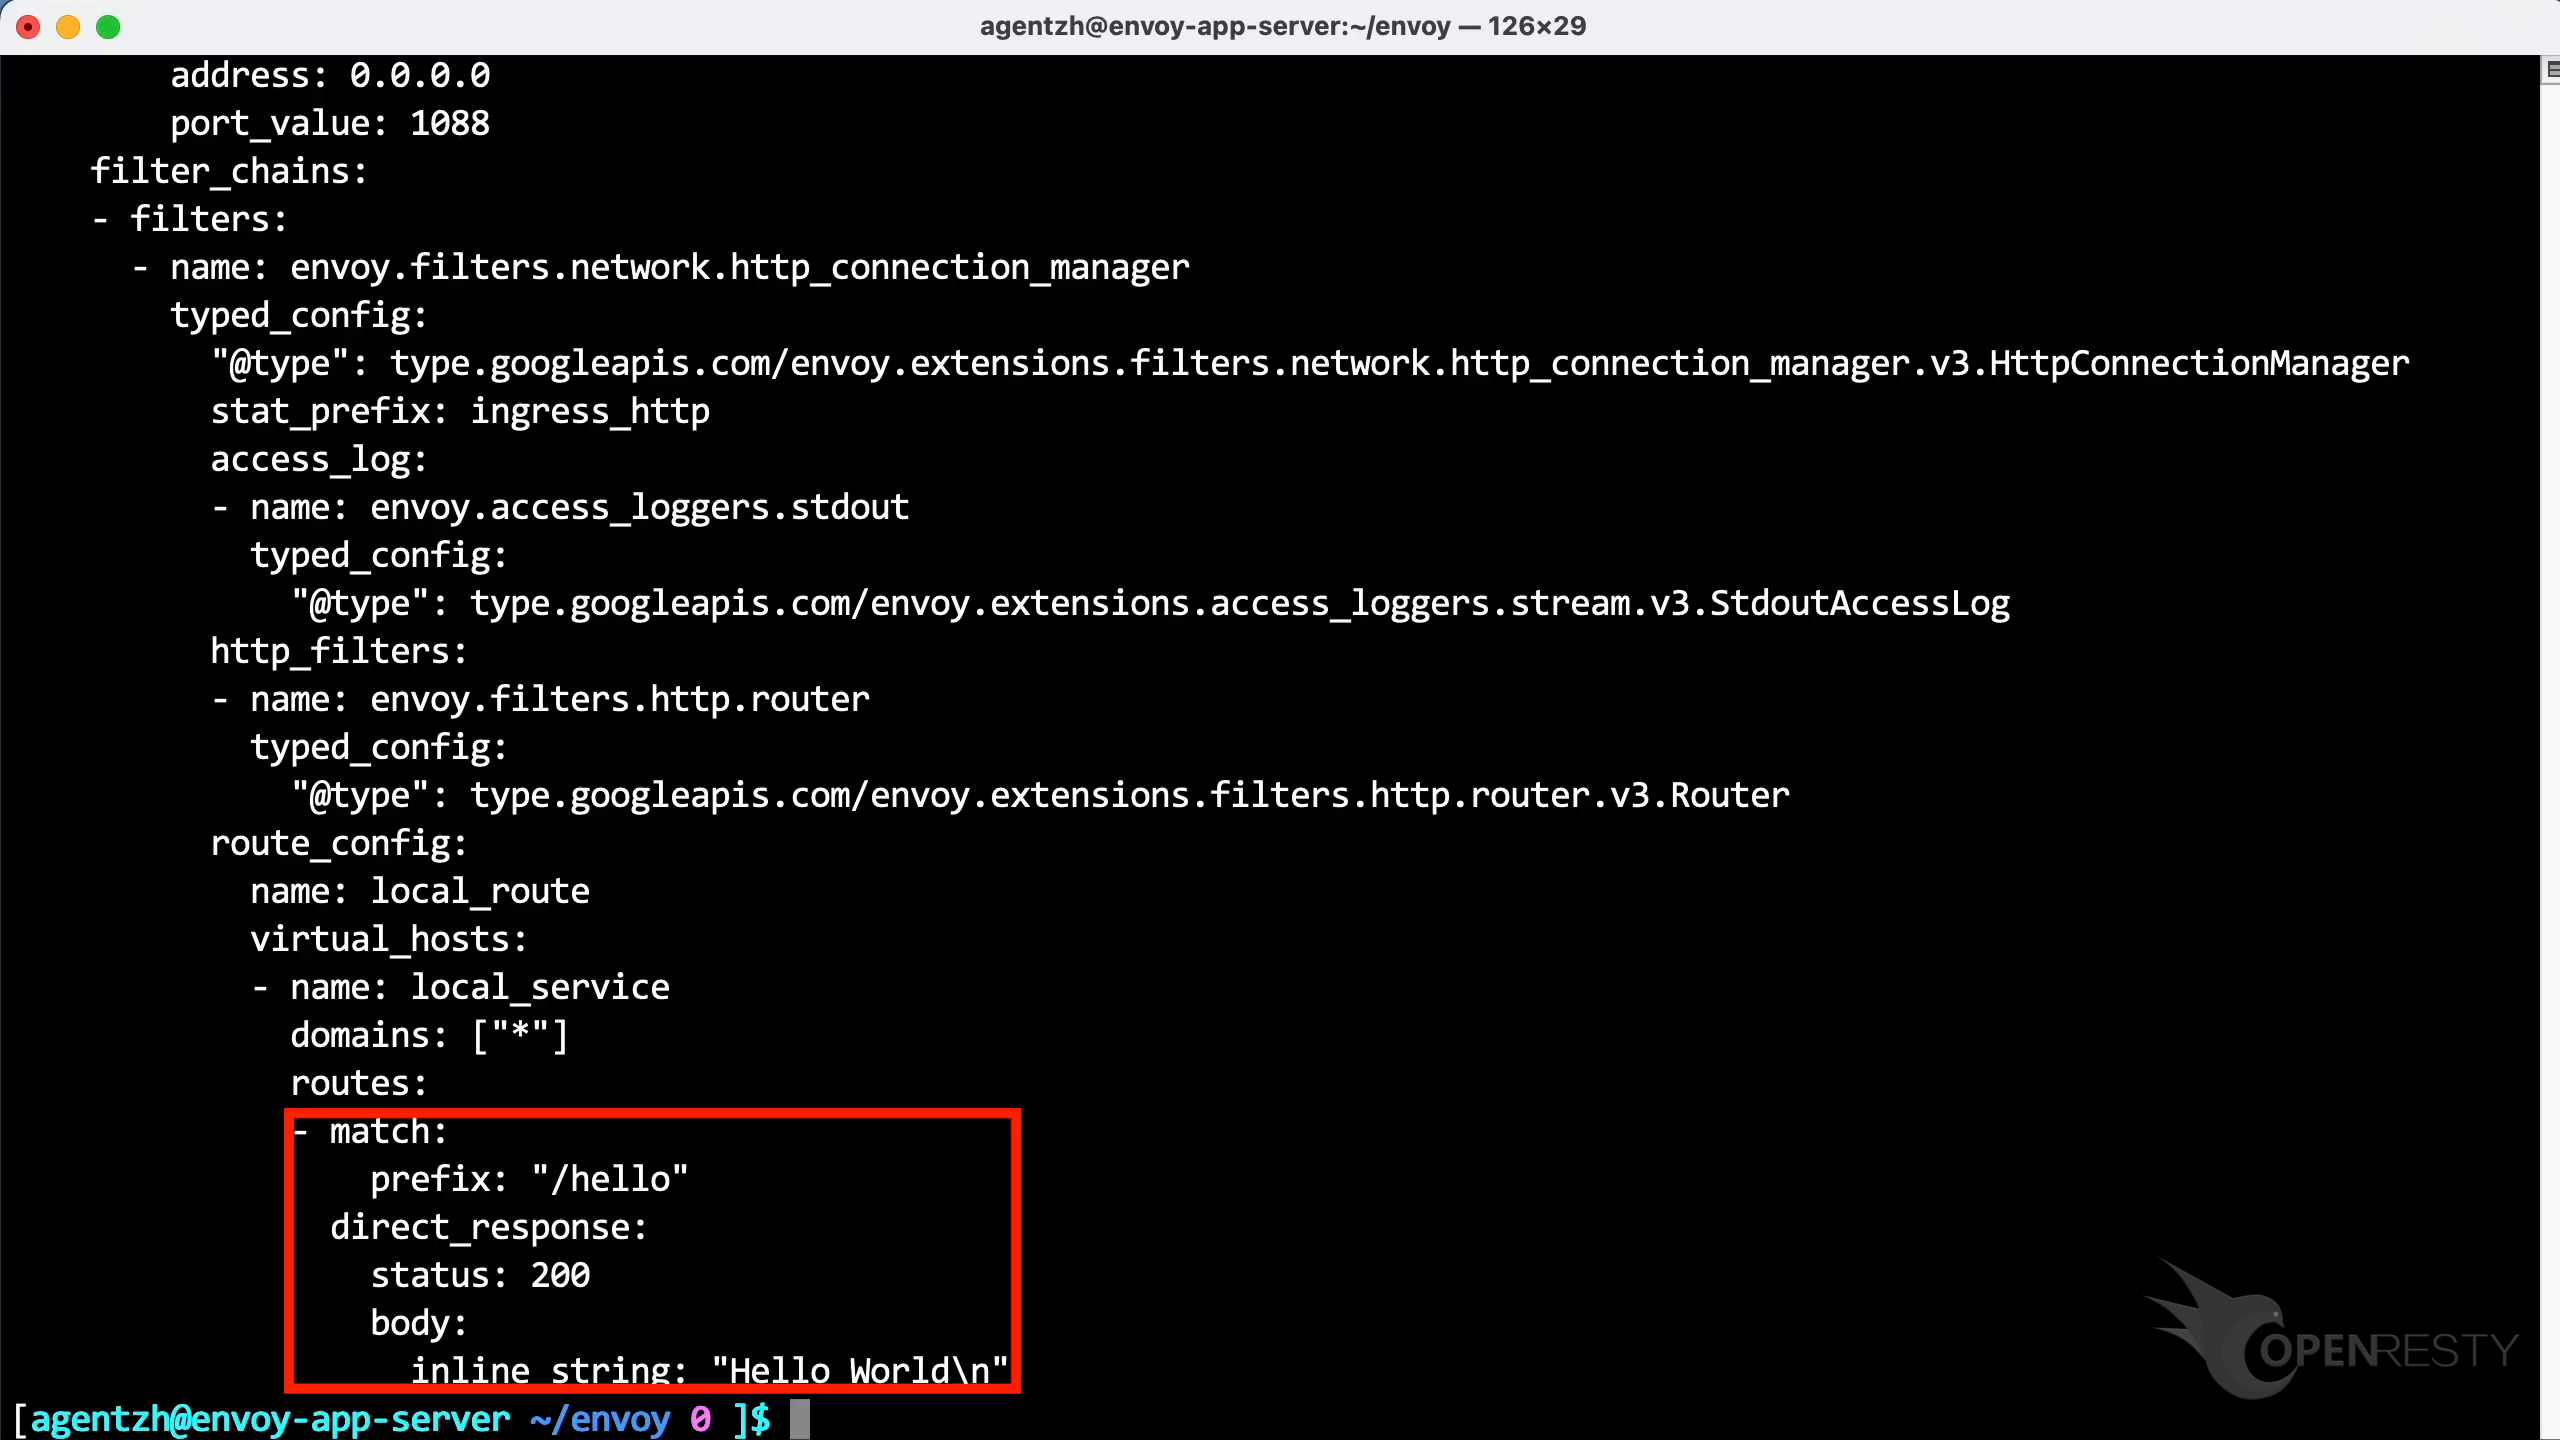
Test the response of this /hello interface.

The response is “hello world” indeed.
Run the top command to check the CPU usage. Look at this process named envoy.
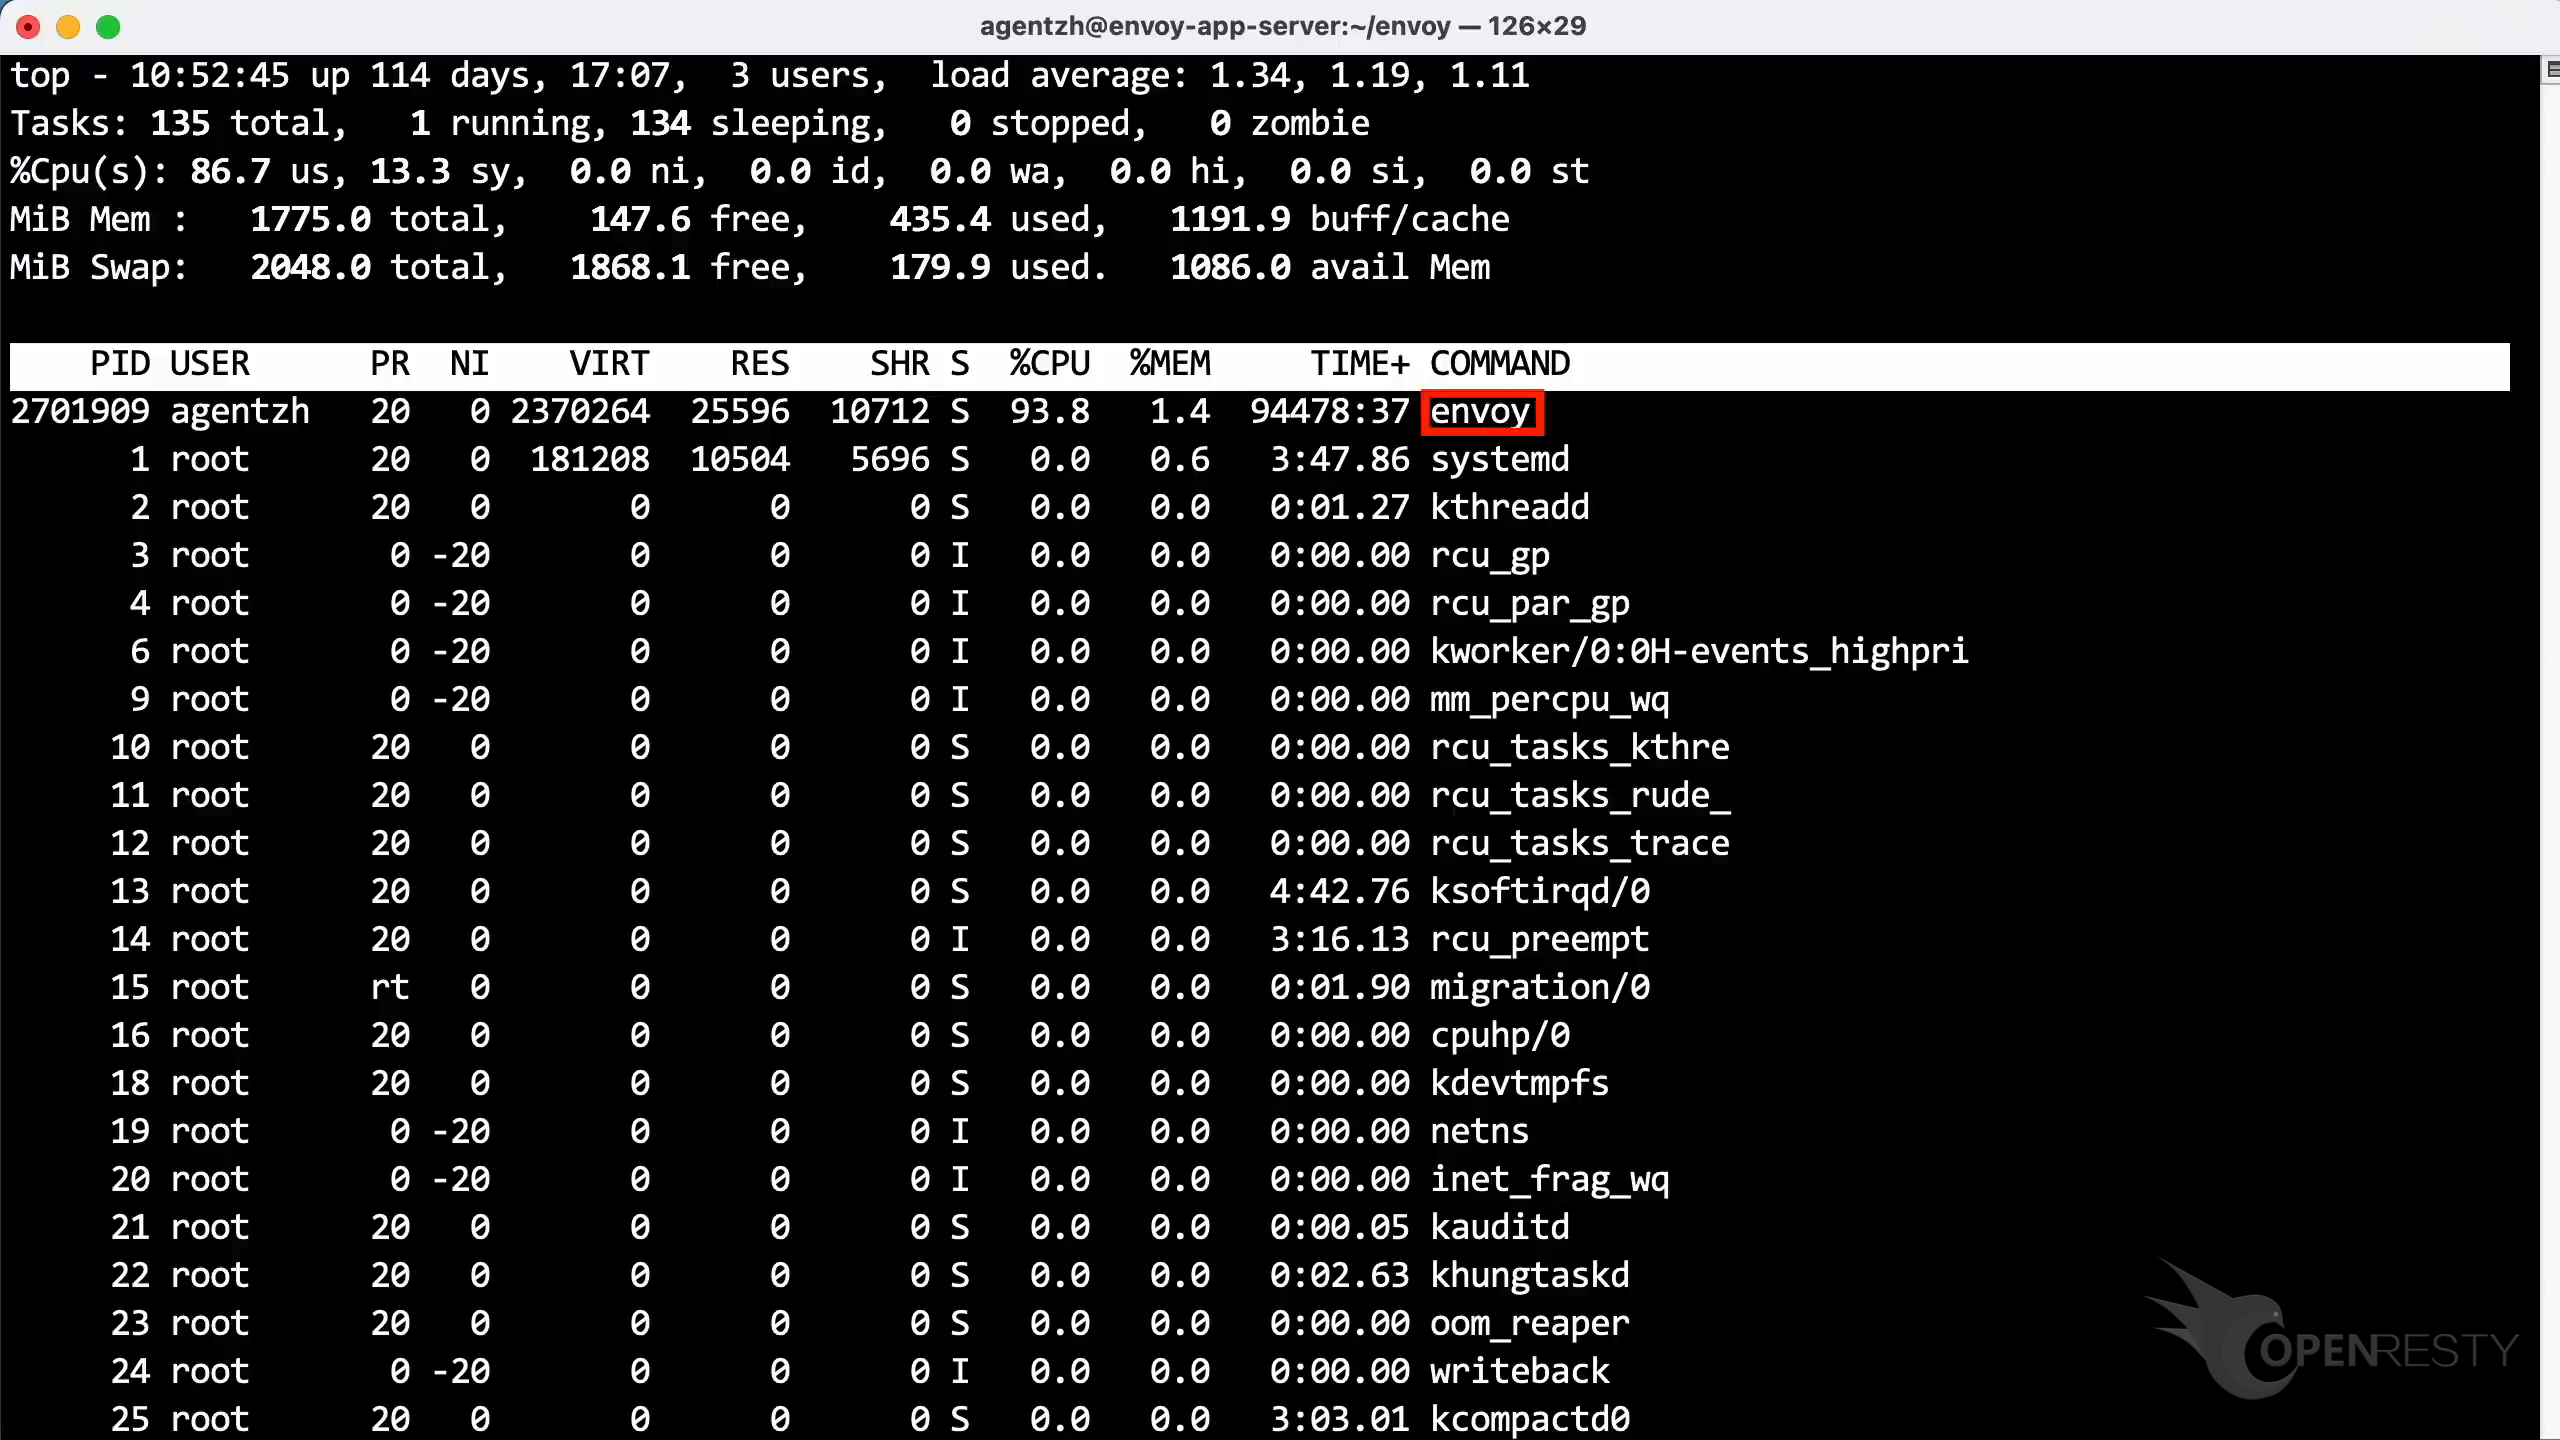
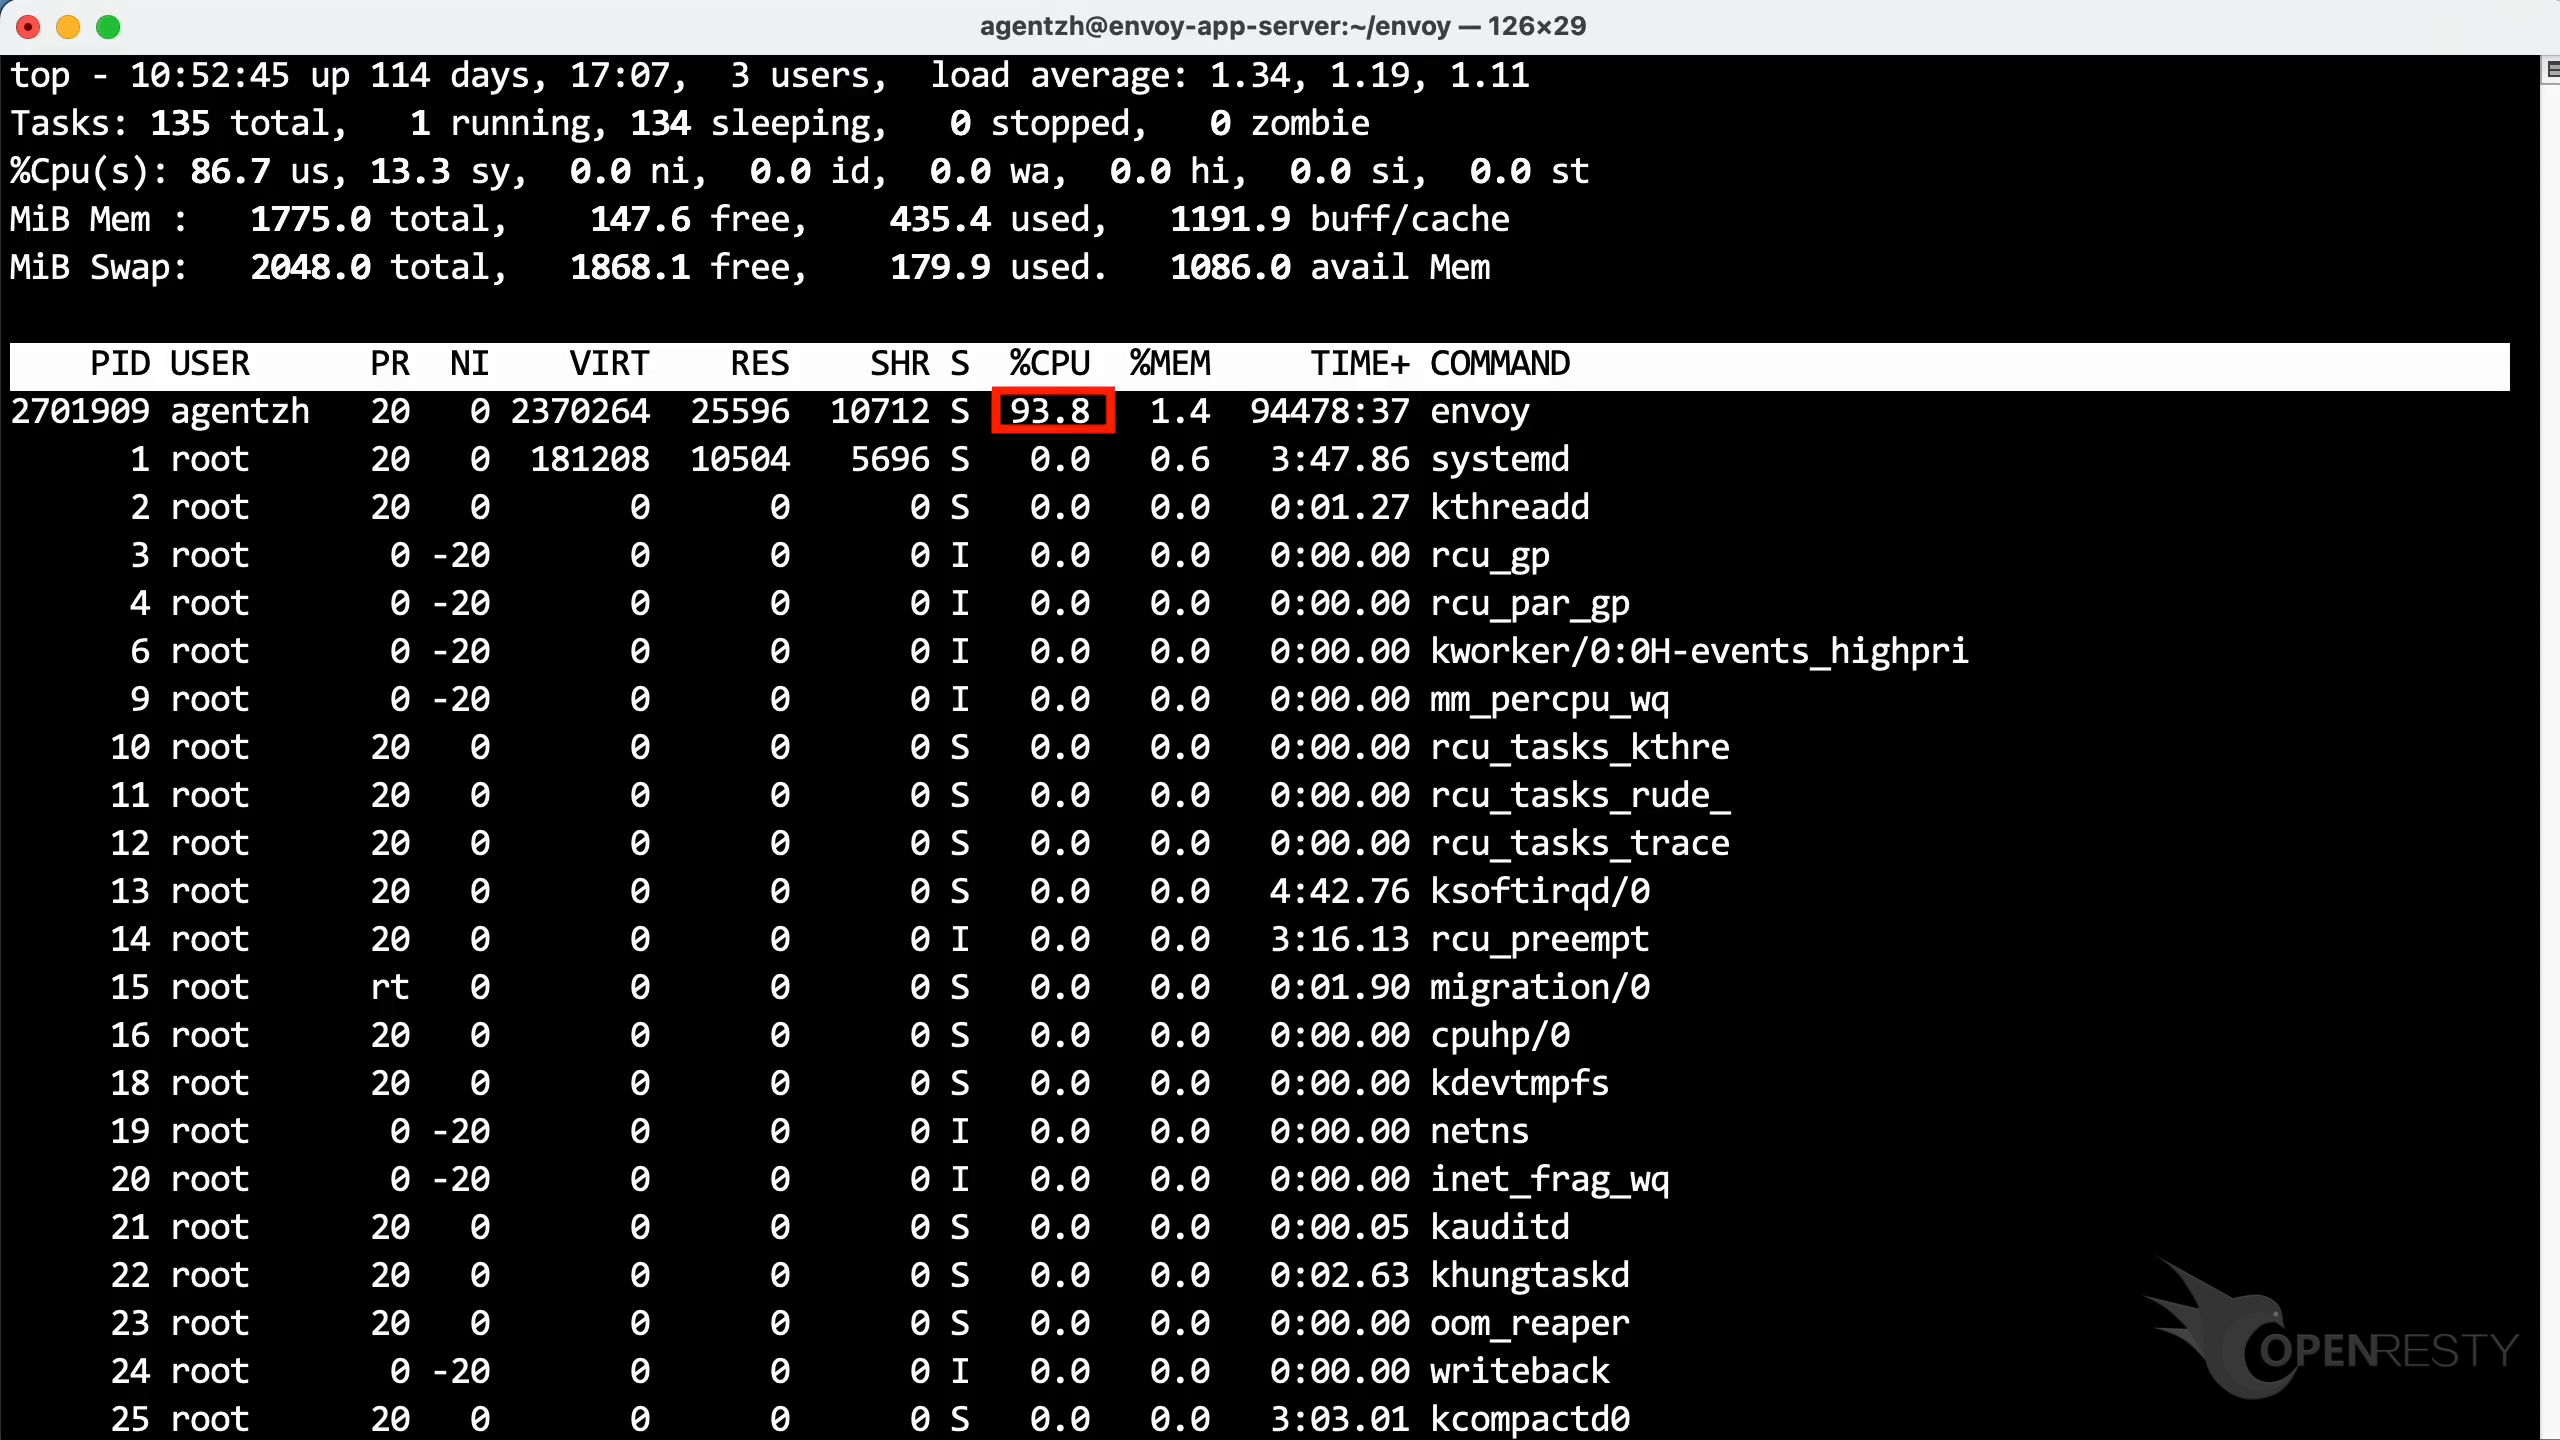
As shown, it consumes more than 90% of a CPU core.
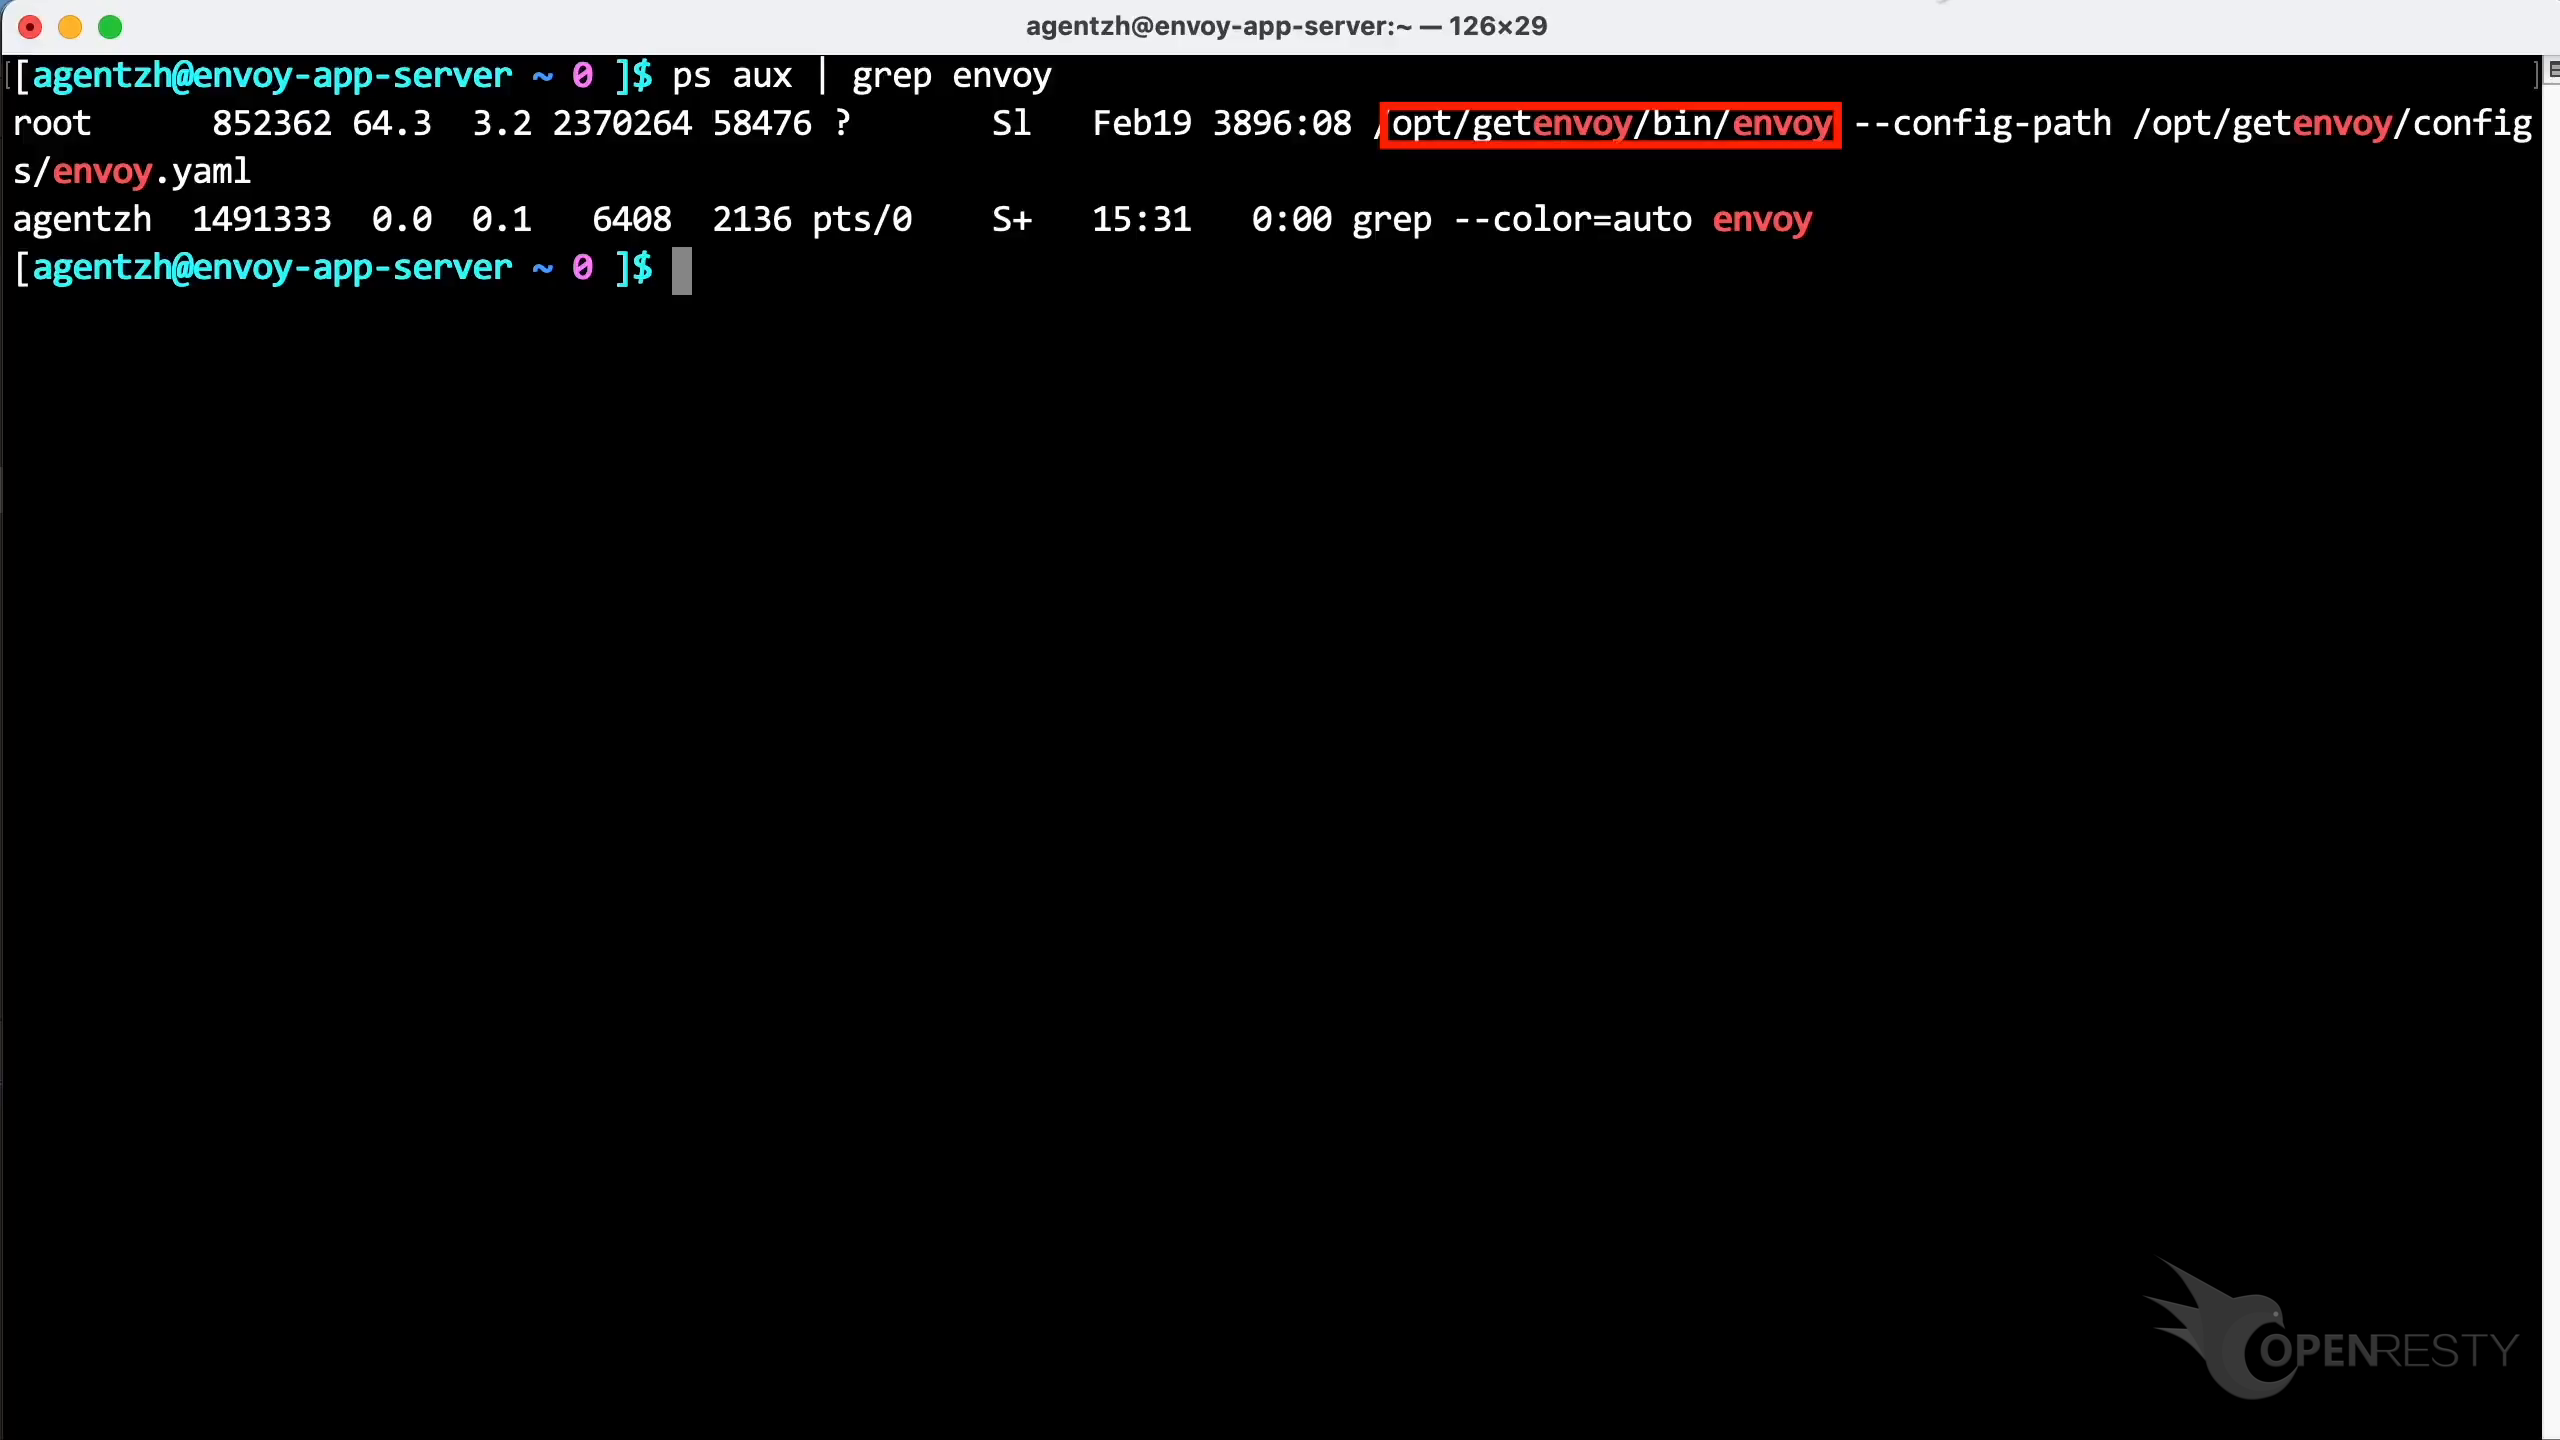
Run the ps command to see the full command line for this process. It is downloaded and installed from the Envoy official binary package repository.
Profile Envoy CPU with C++ Flame Graphs
Profile the Live Envoy Process
Open the OpenResty XRay web console. The dashboard for this machine already shows near-100% CPU utilization and detects the running Envoy application.
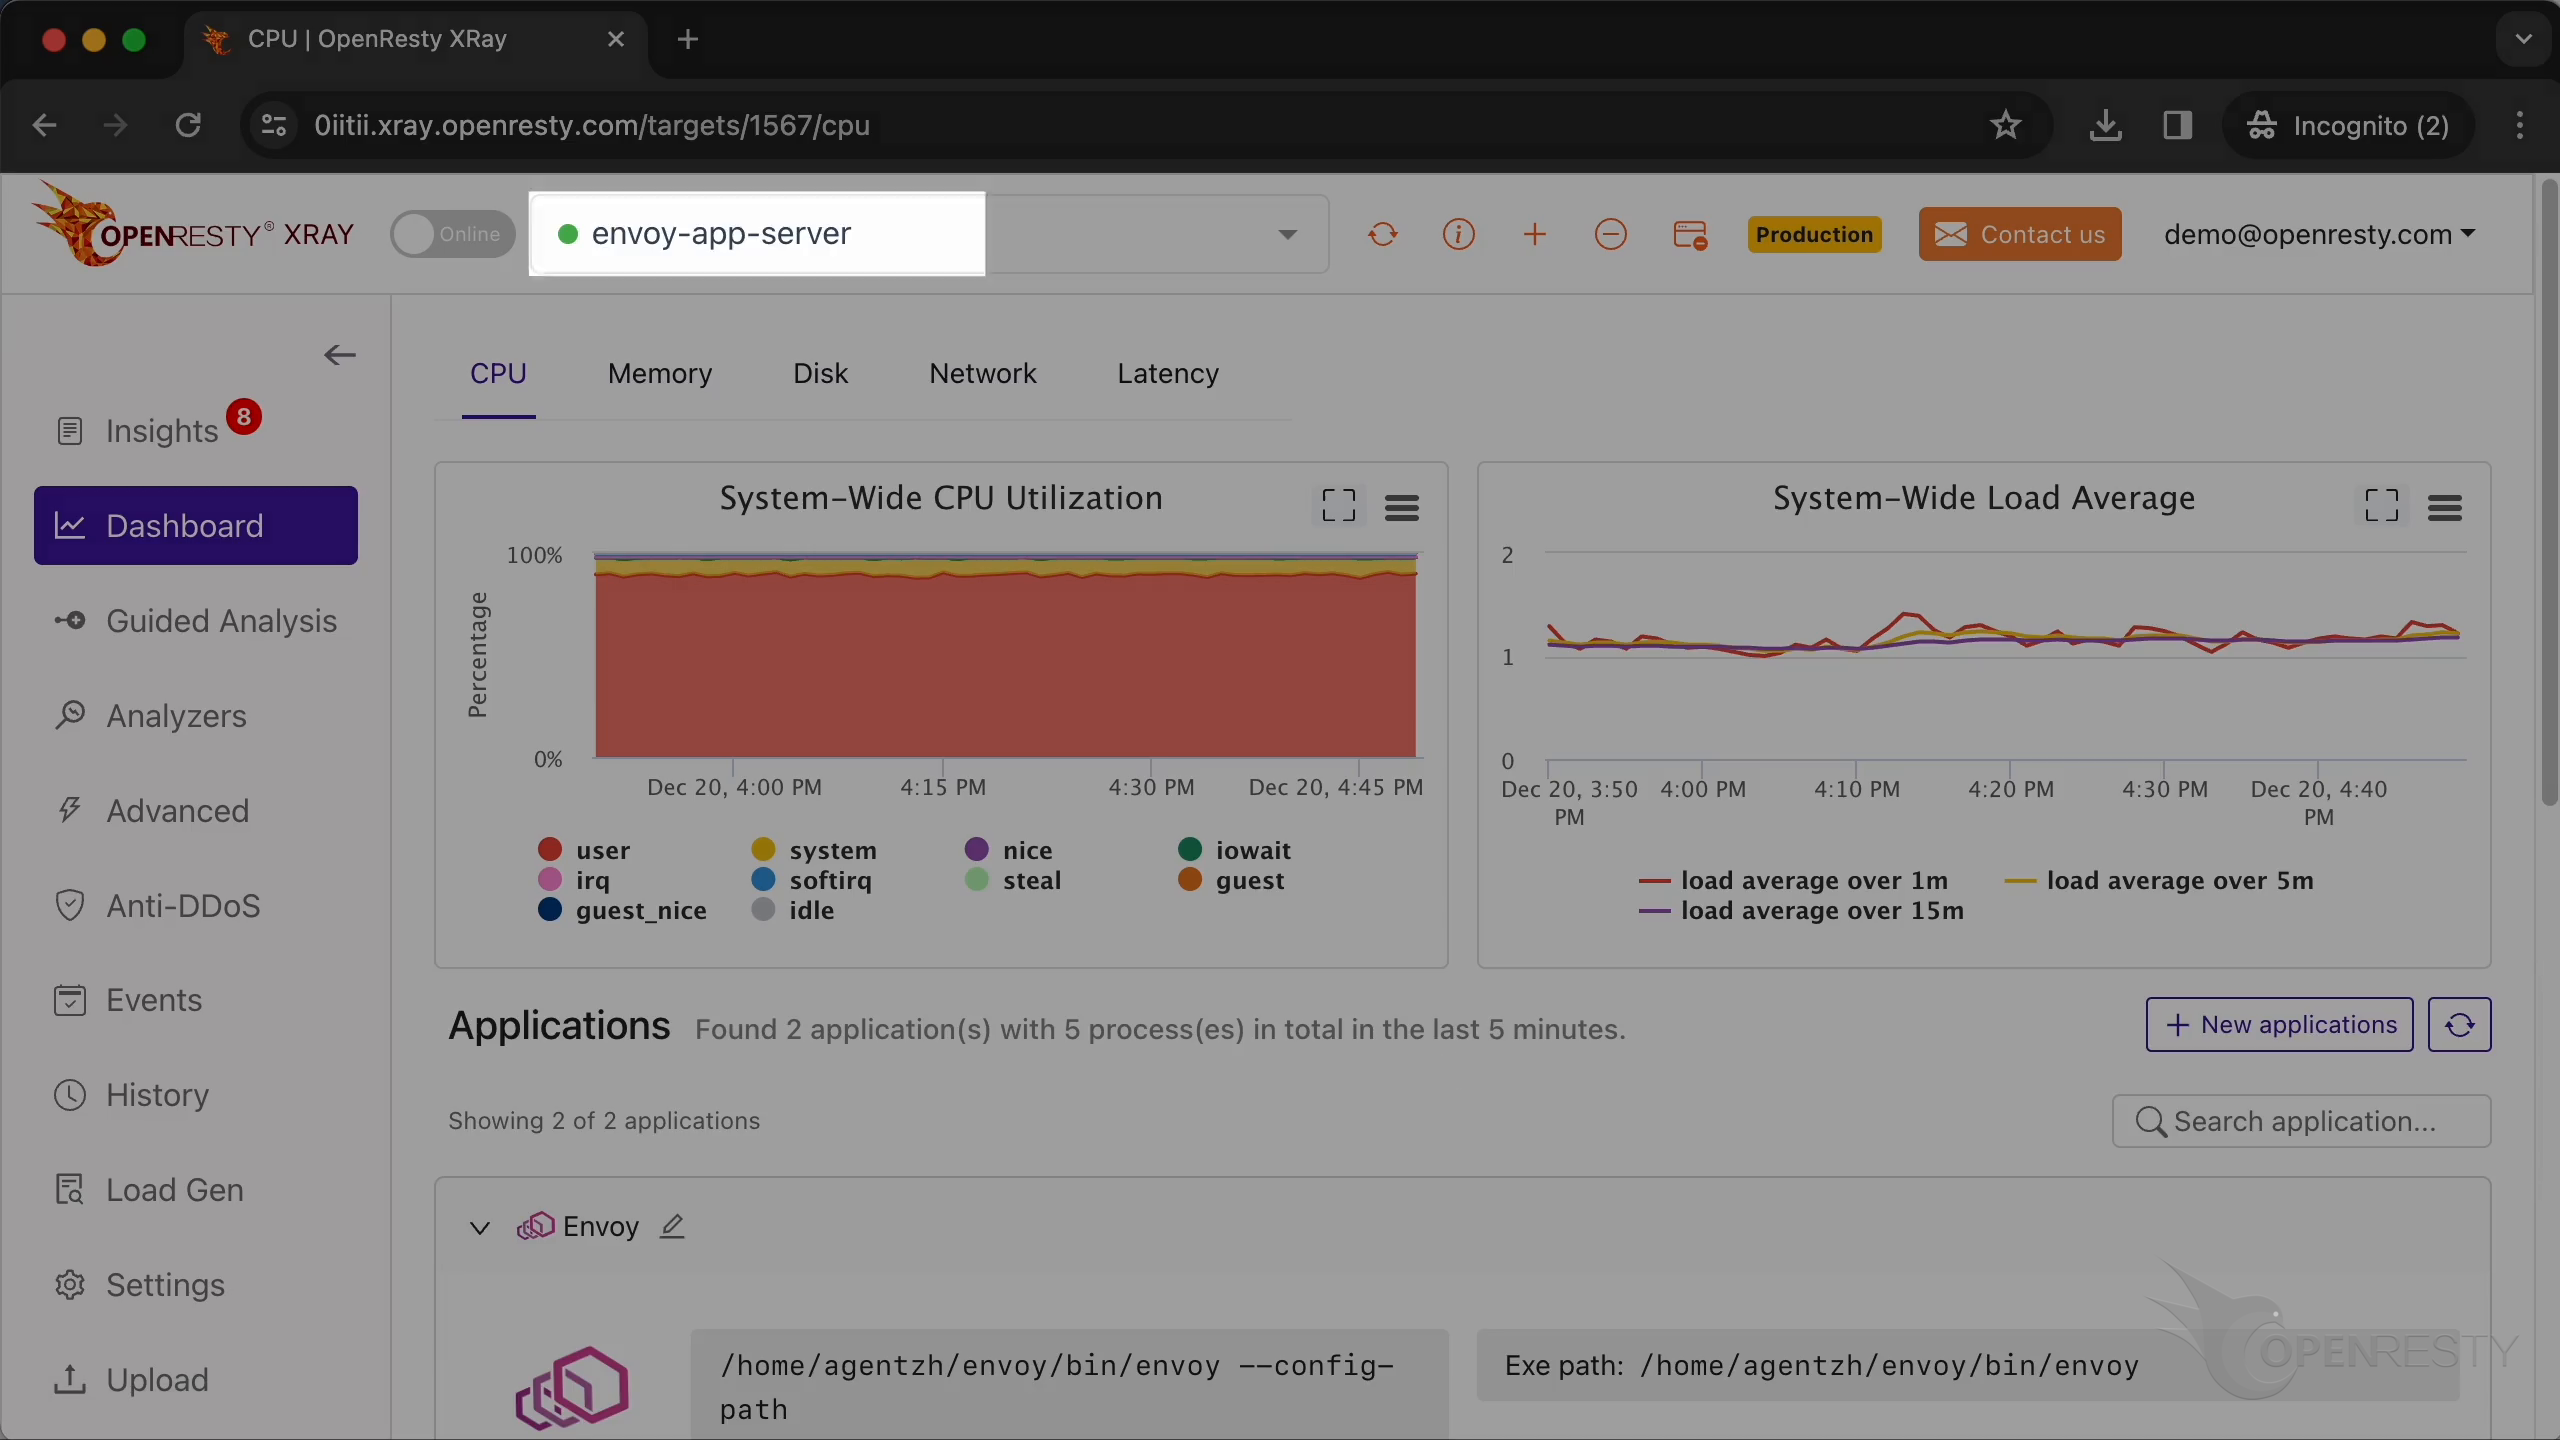
Navigate to “Guided Analysis” and select “High CPU usage” as the problem type. Then pick the Envoy worker process — it shows 93% CPU, matching what top reported:
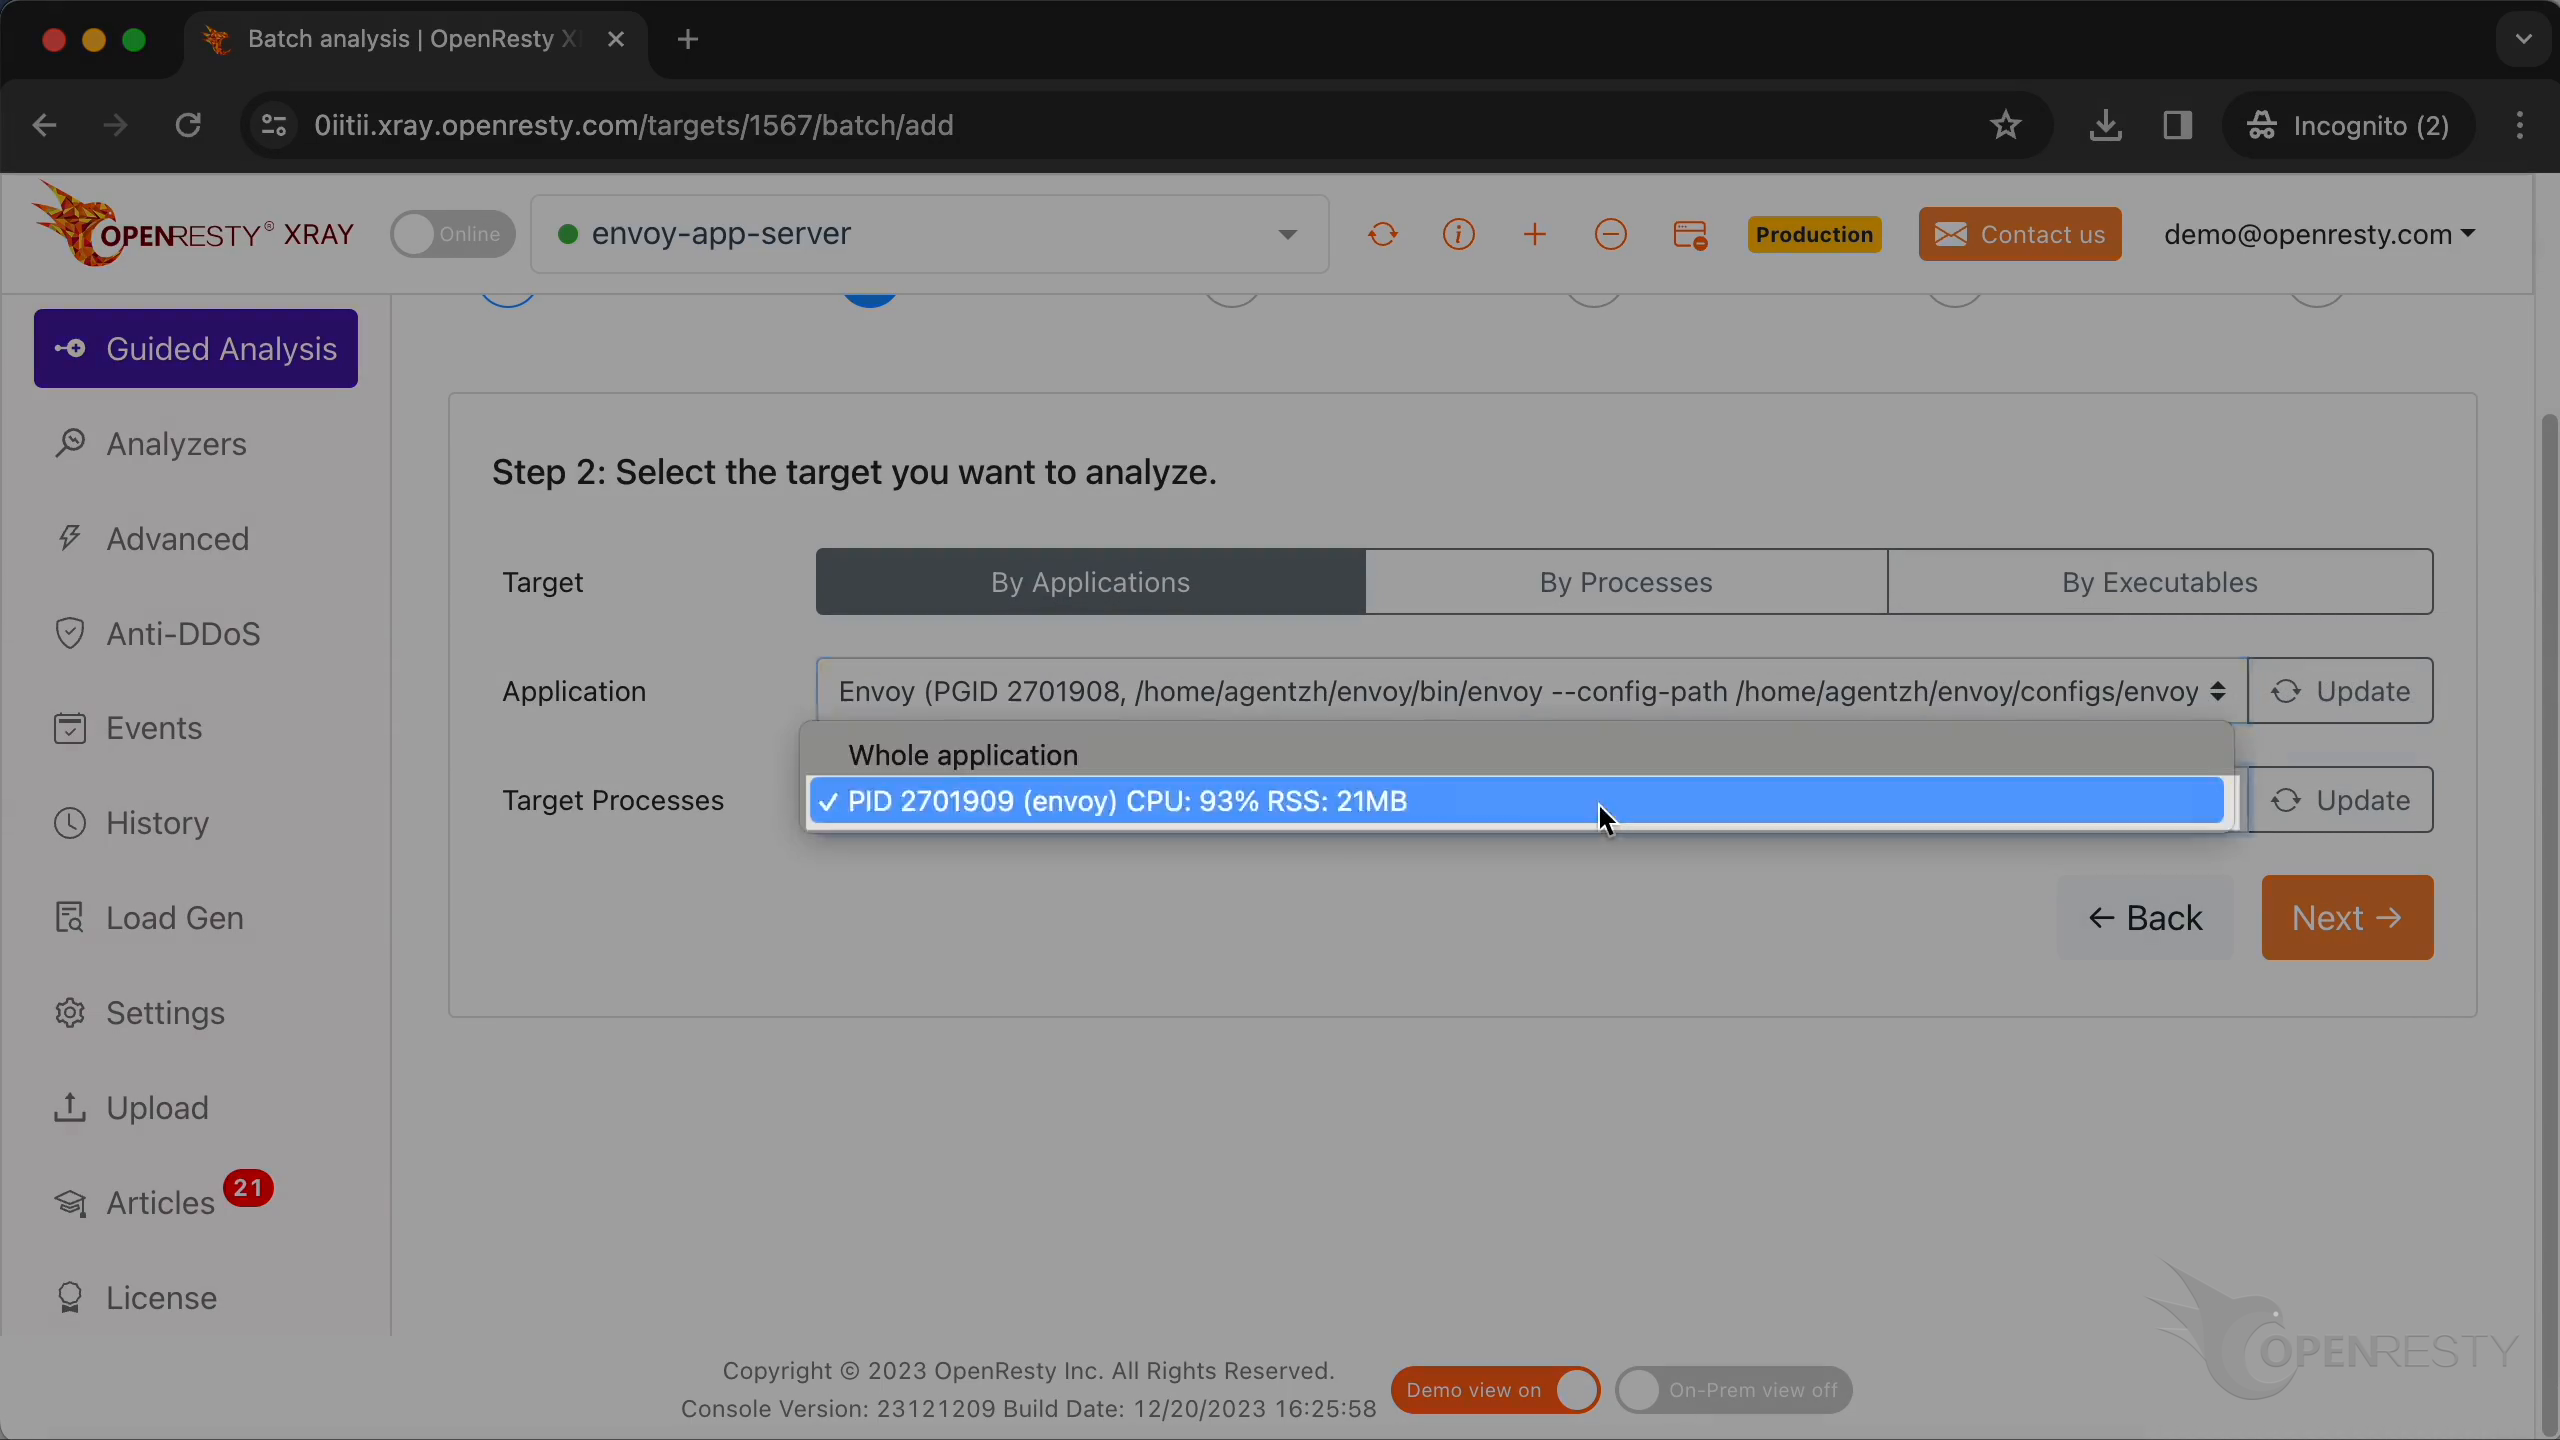
Leave the defaults (application type: Envoy, language level: C/C++, maximum running time: 300 seconds) and start the analysis. After two sampling rounds, OpenResty XRay automatically generates a report ranking the hottest C++ code paths:
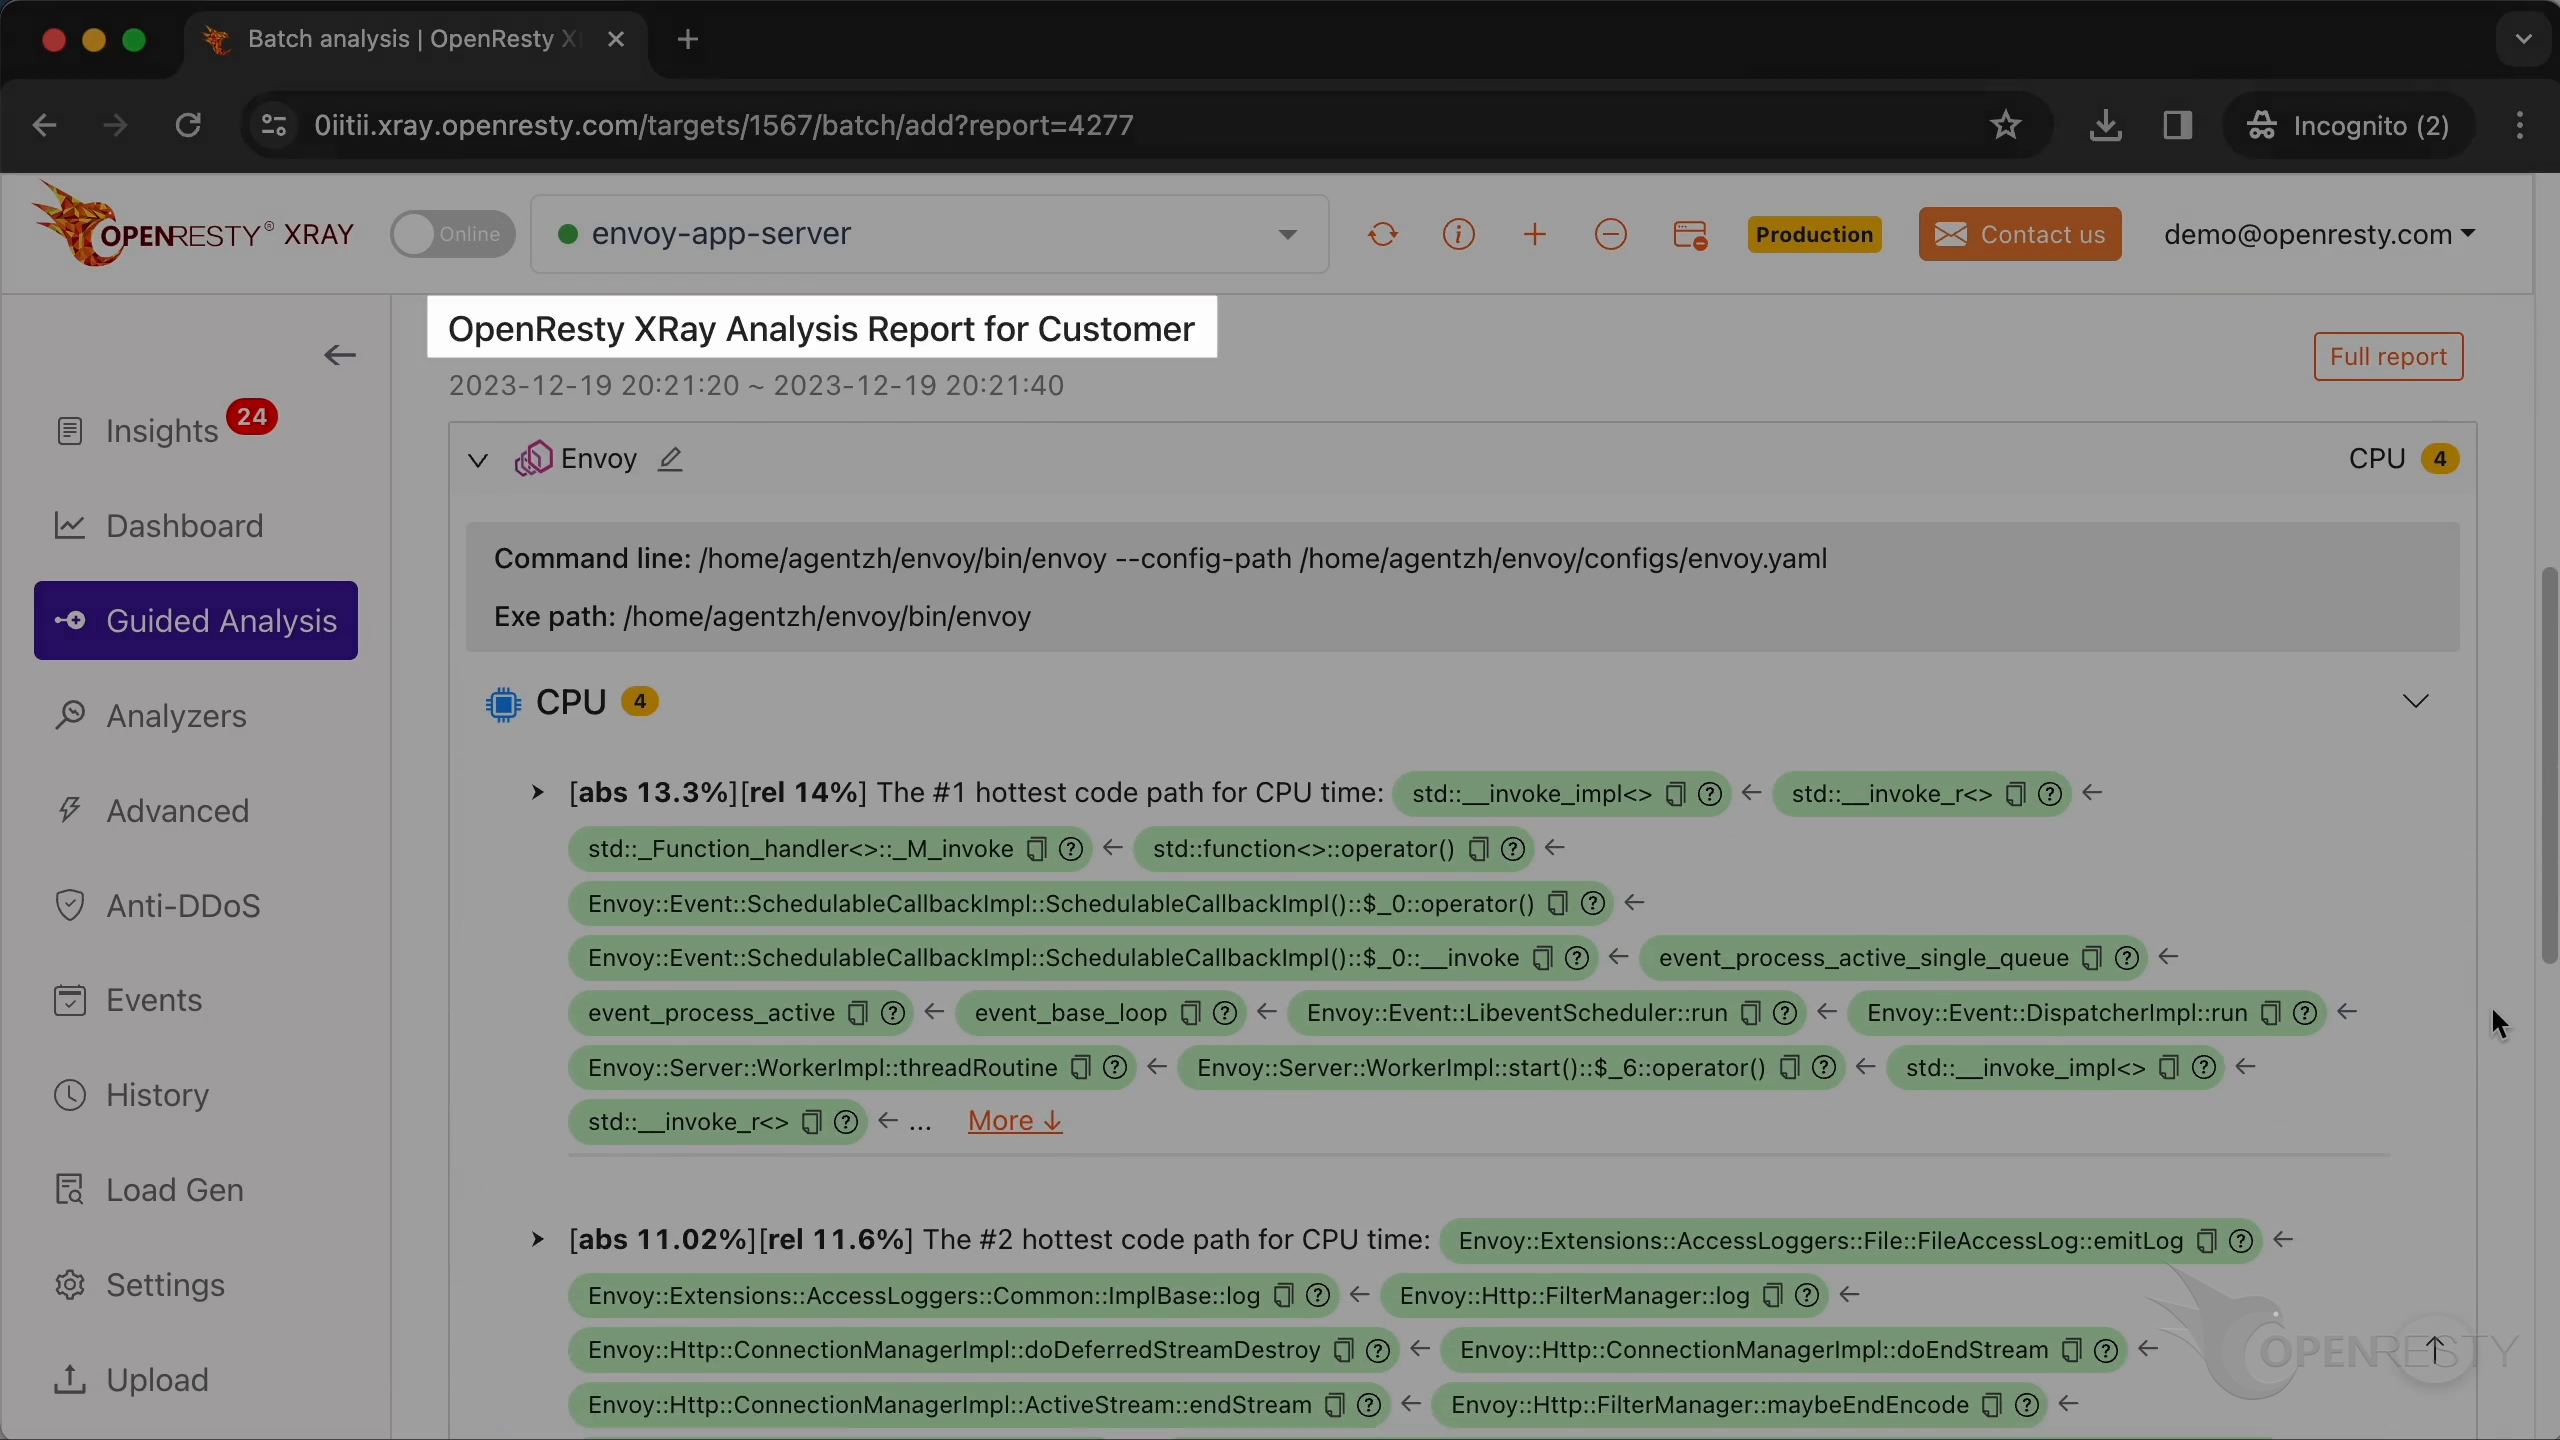
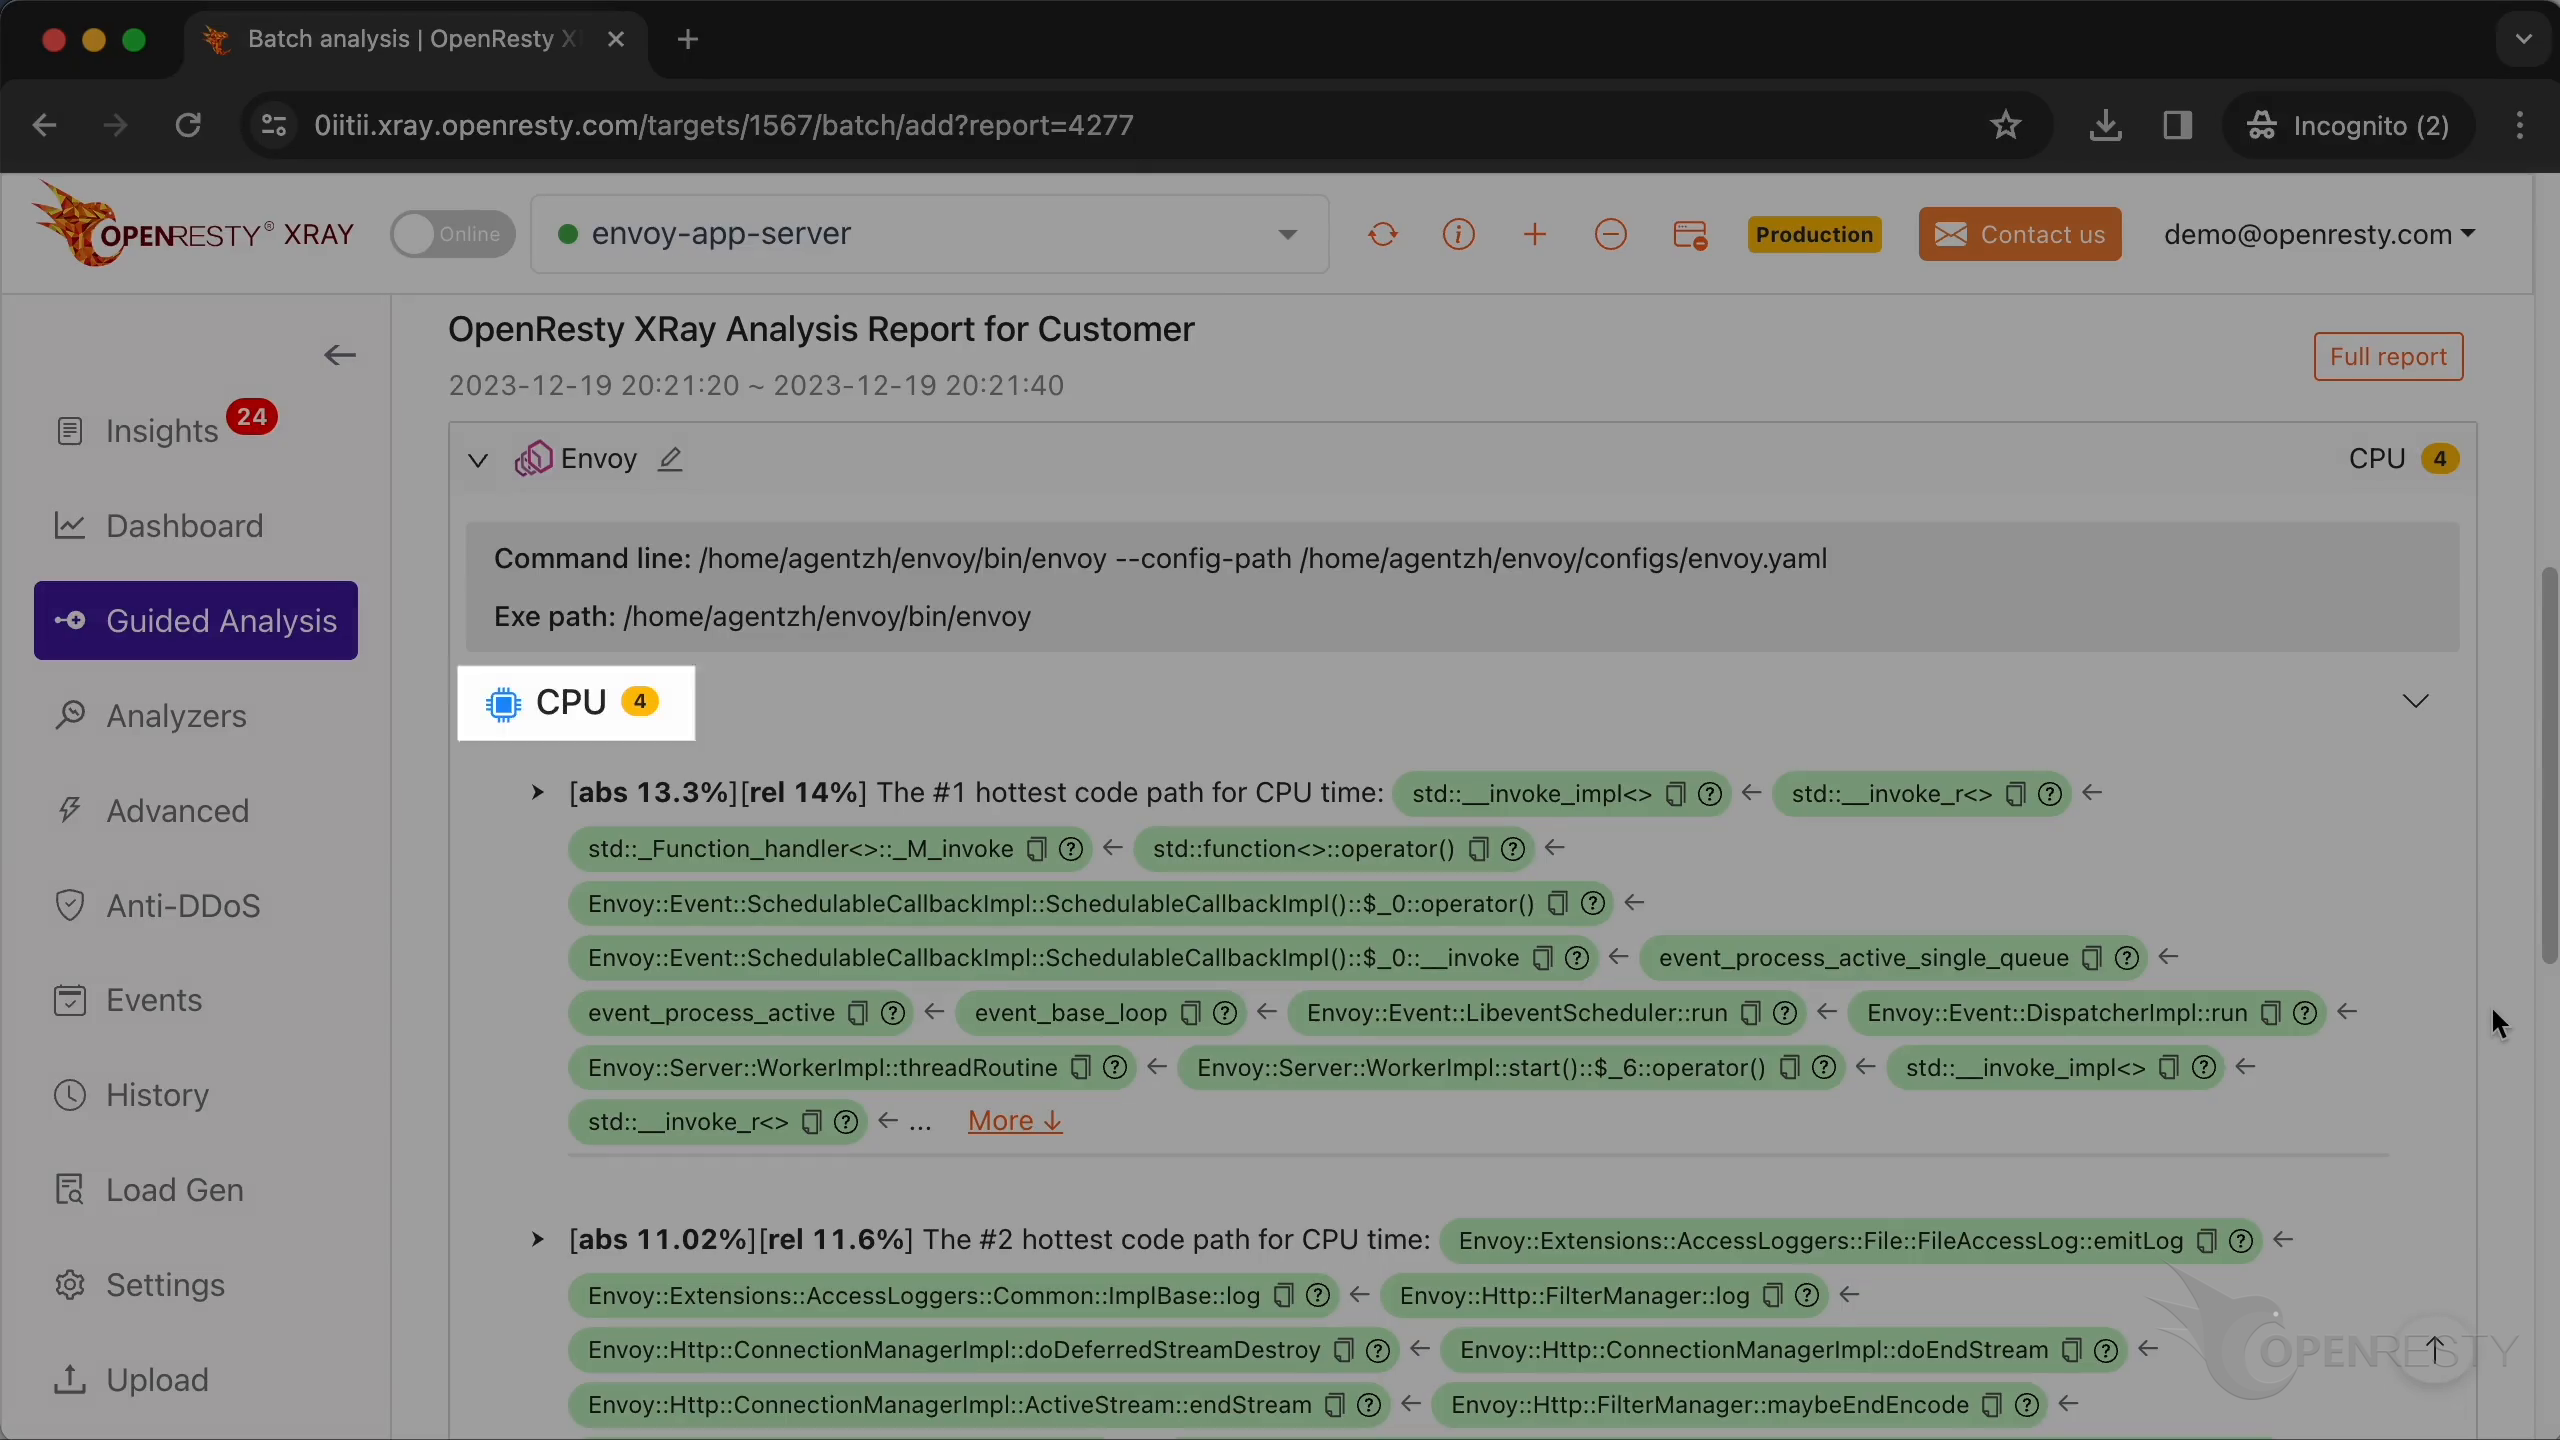
This is the type of problem we diagnose. It’s CPU.
#1 Hot Path — SchedulableCallbackImpl
This is the #1 hottest C++ code path for the CPU time.
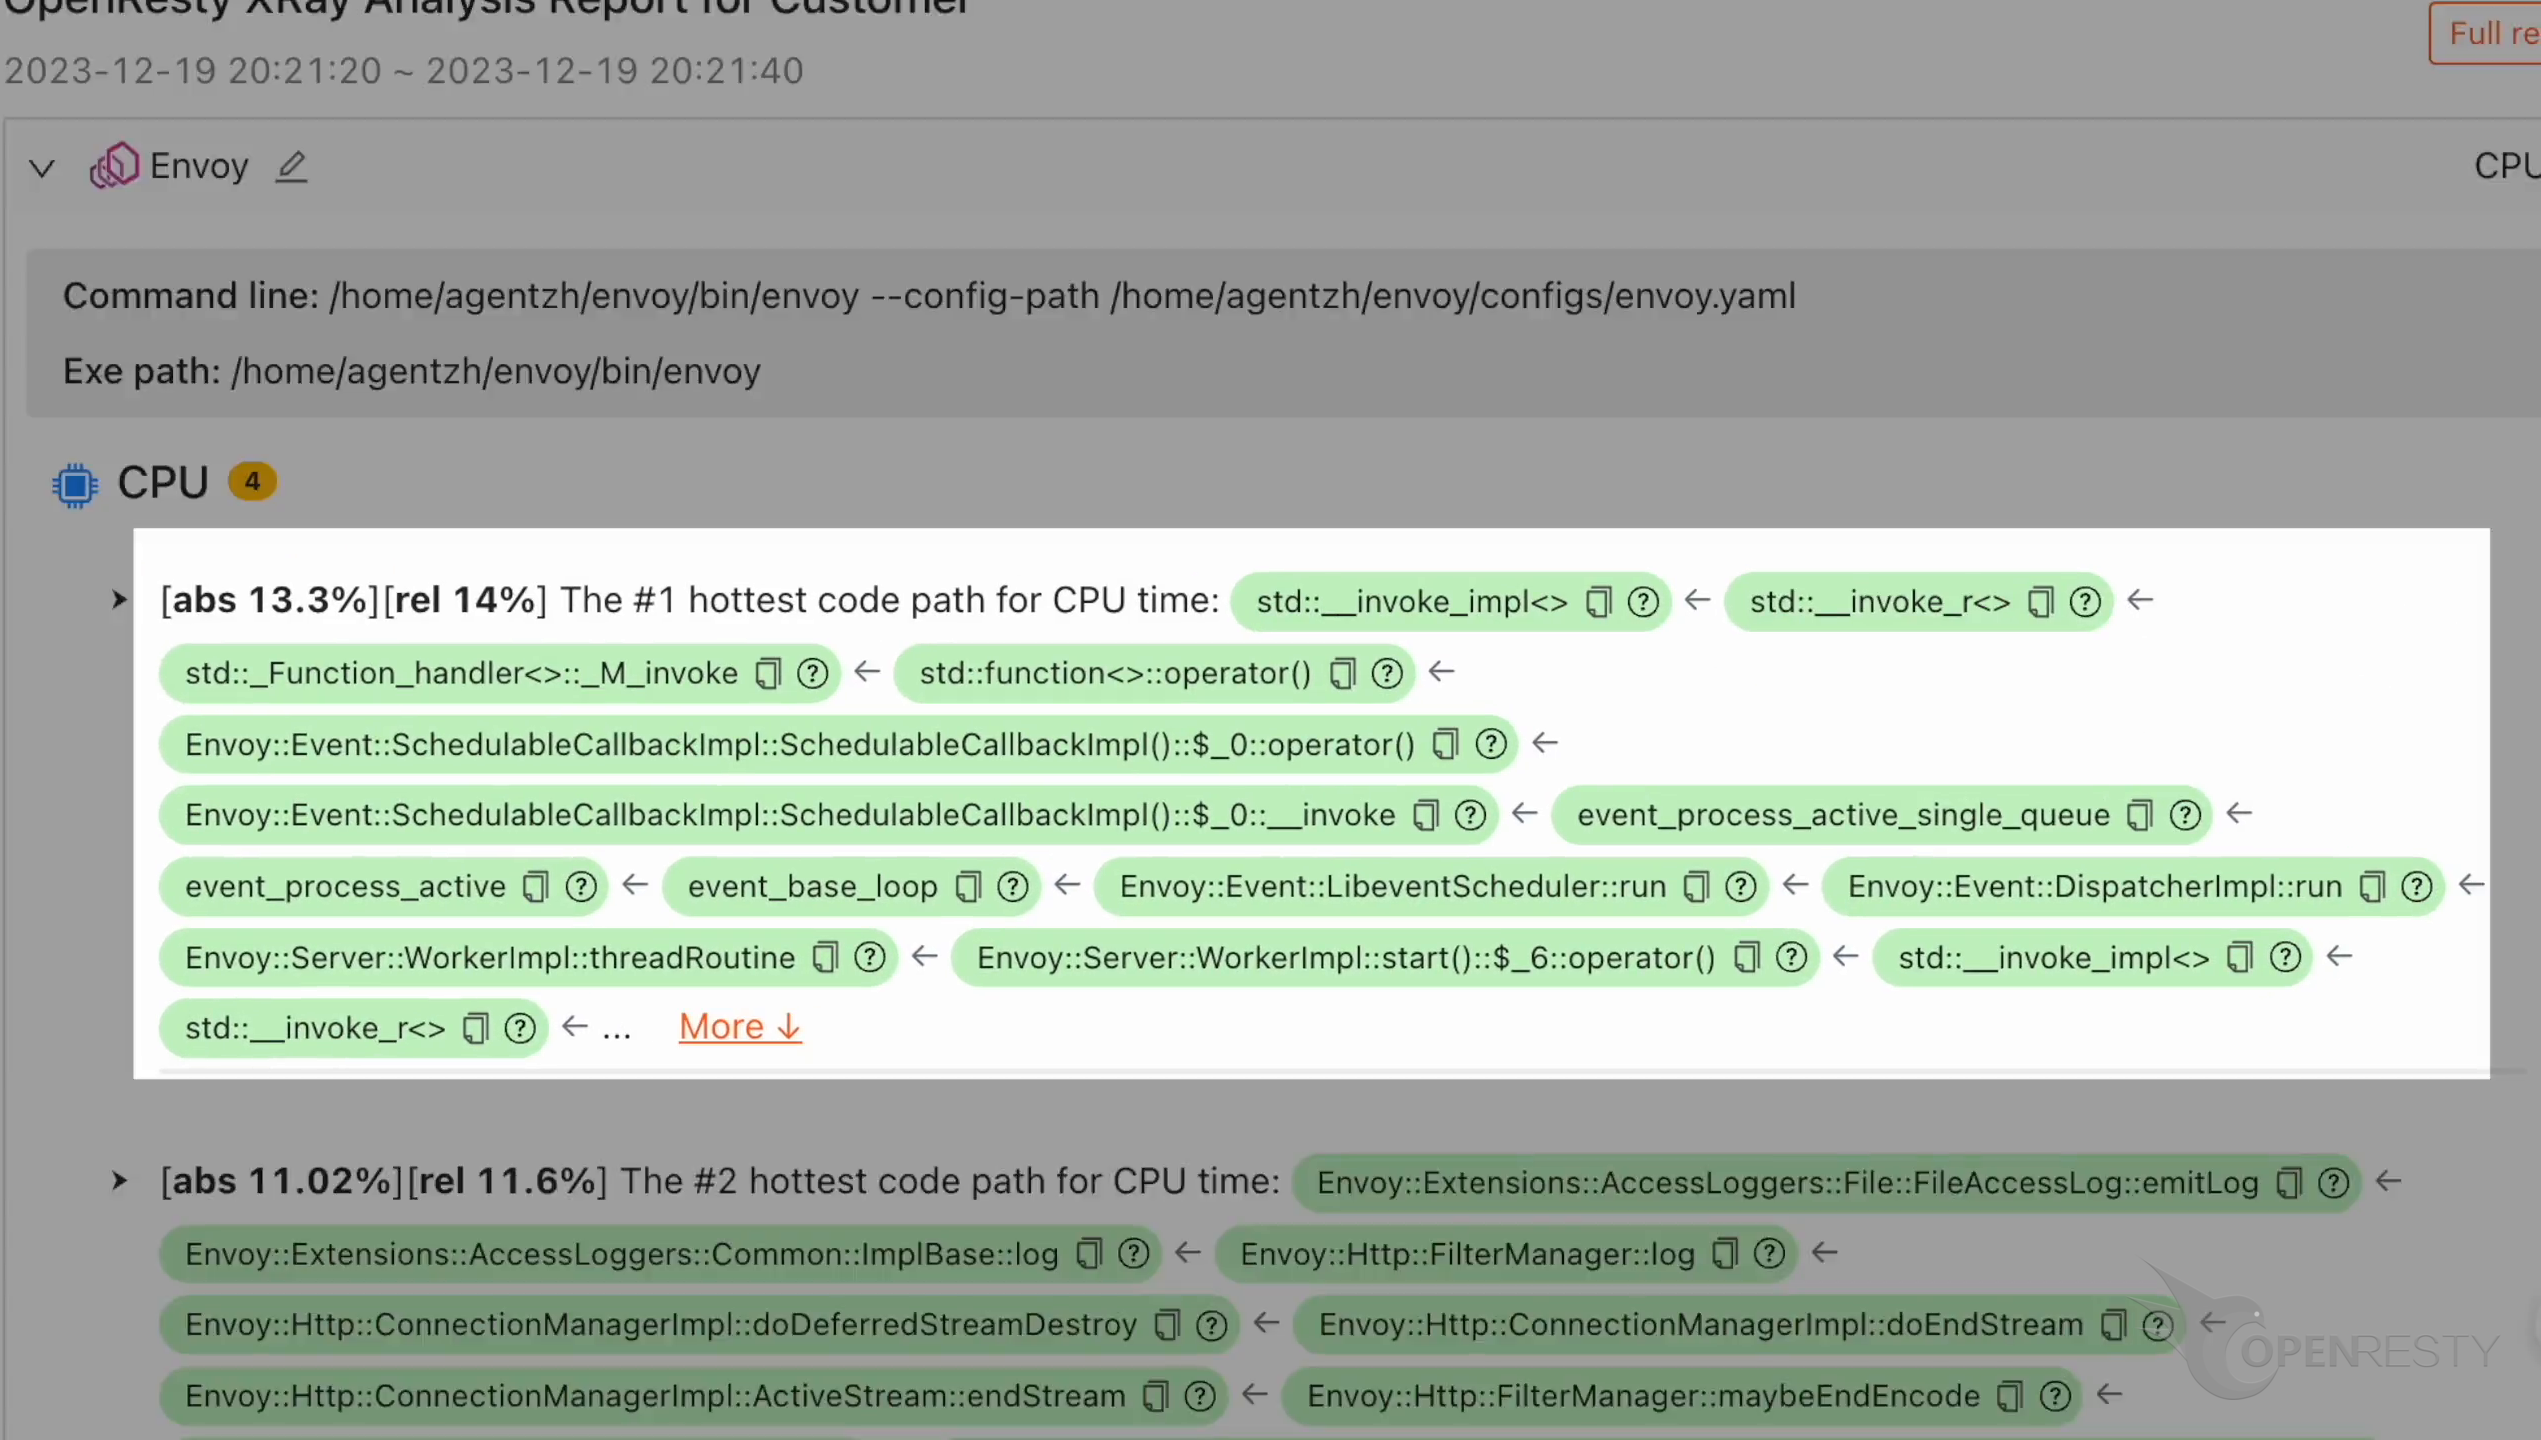
This is an overloaded operator of the SchedulableCallbackImpl class.
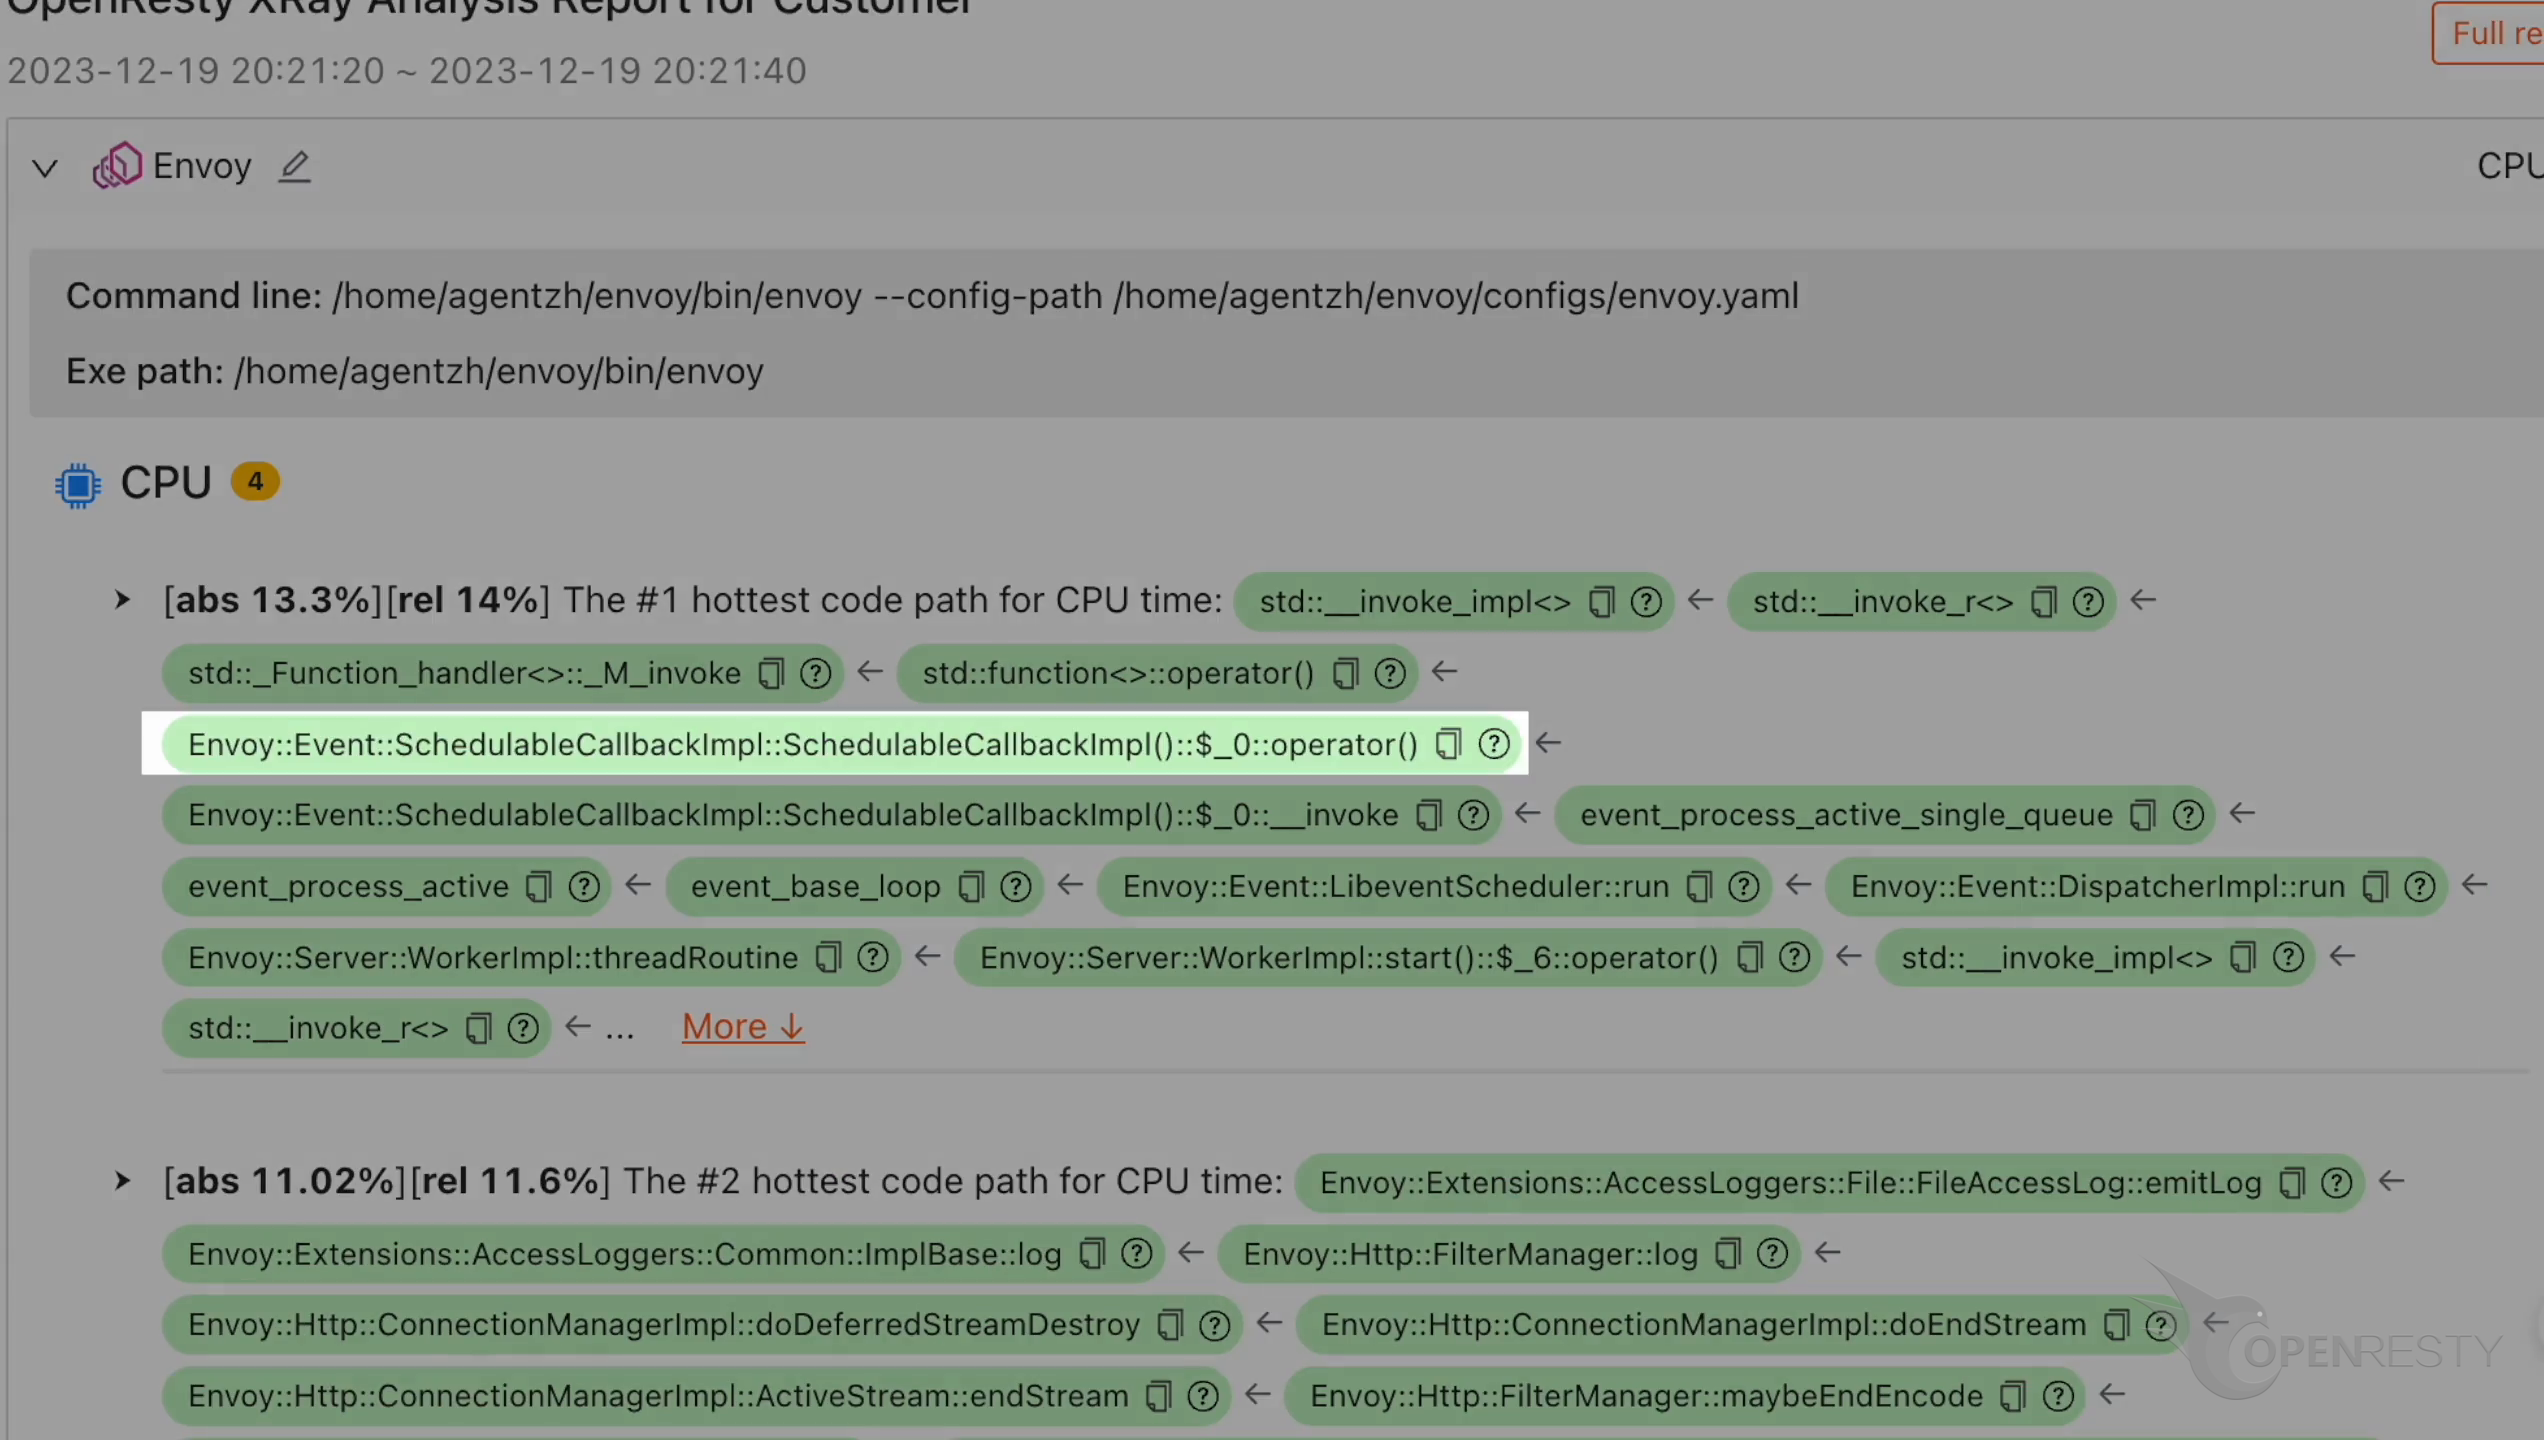
Click “More” to see details.
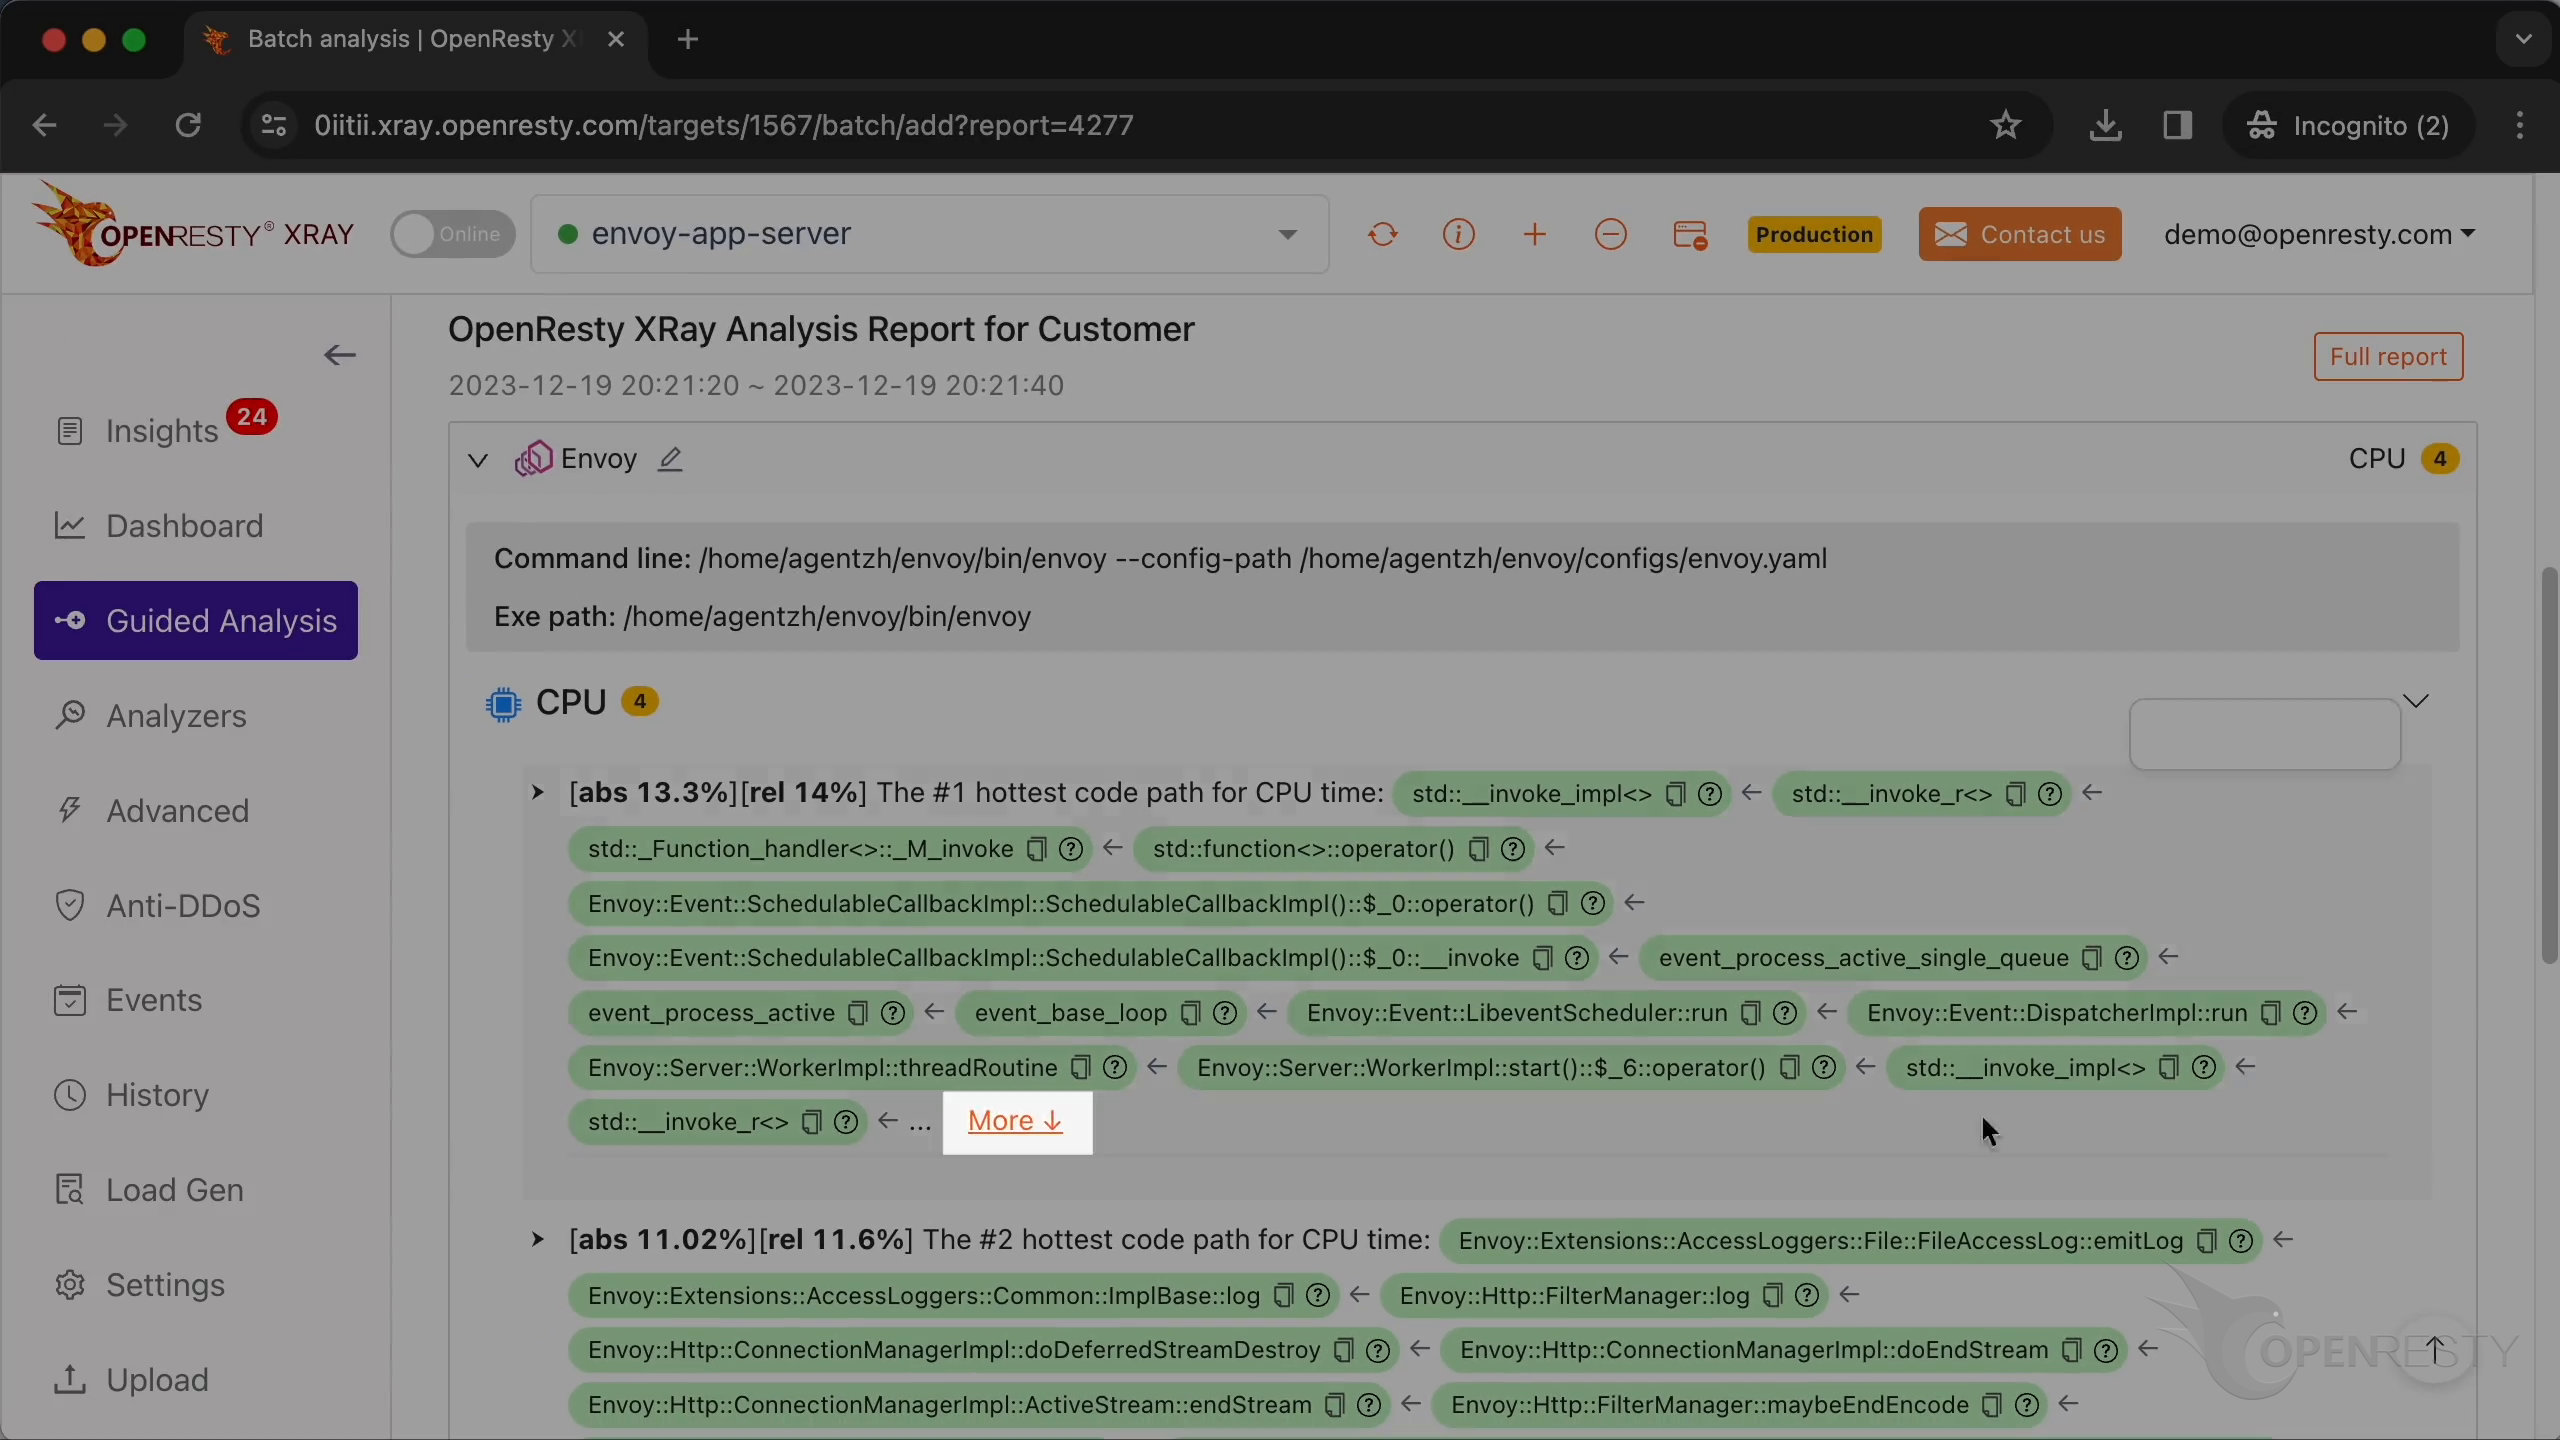
The hot code path was automatically derived from this C-land CPU flame graph.
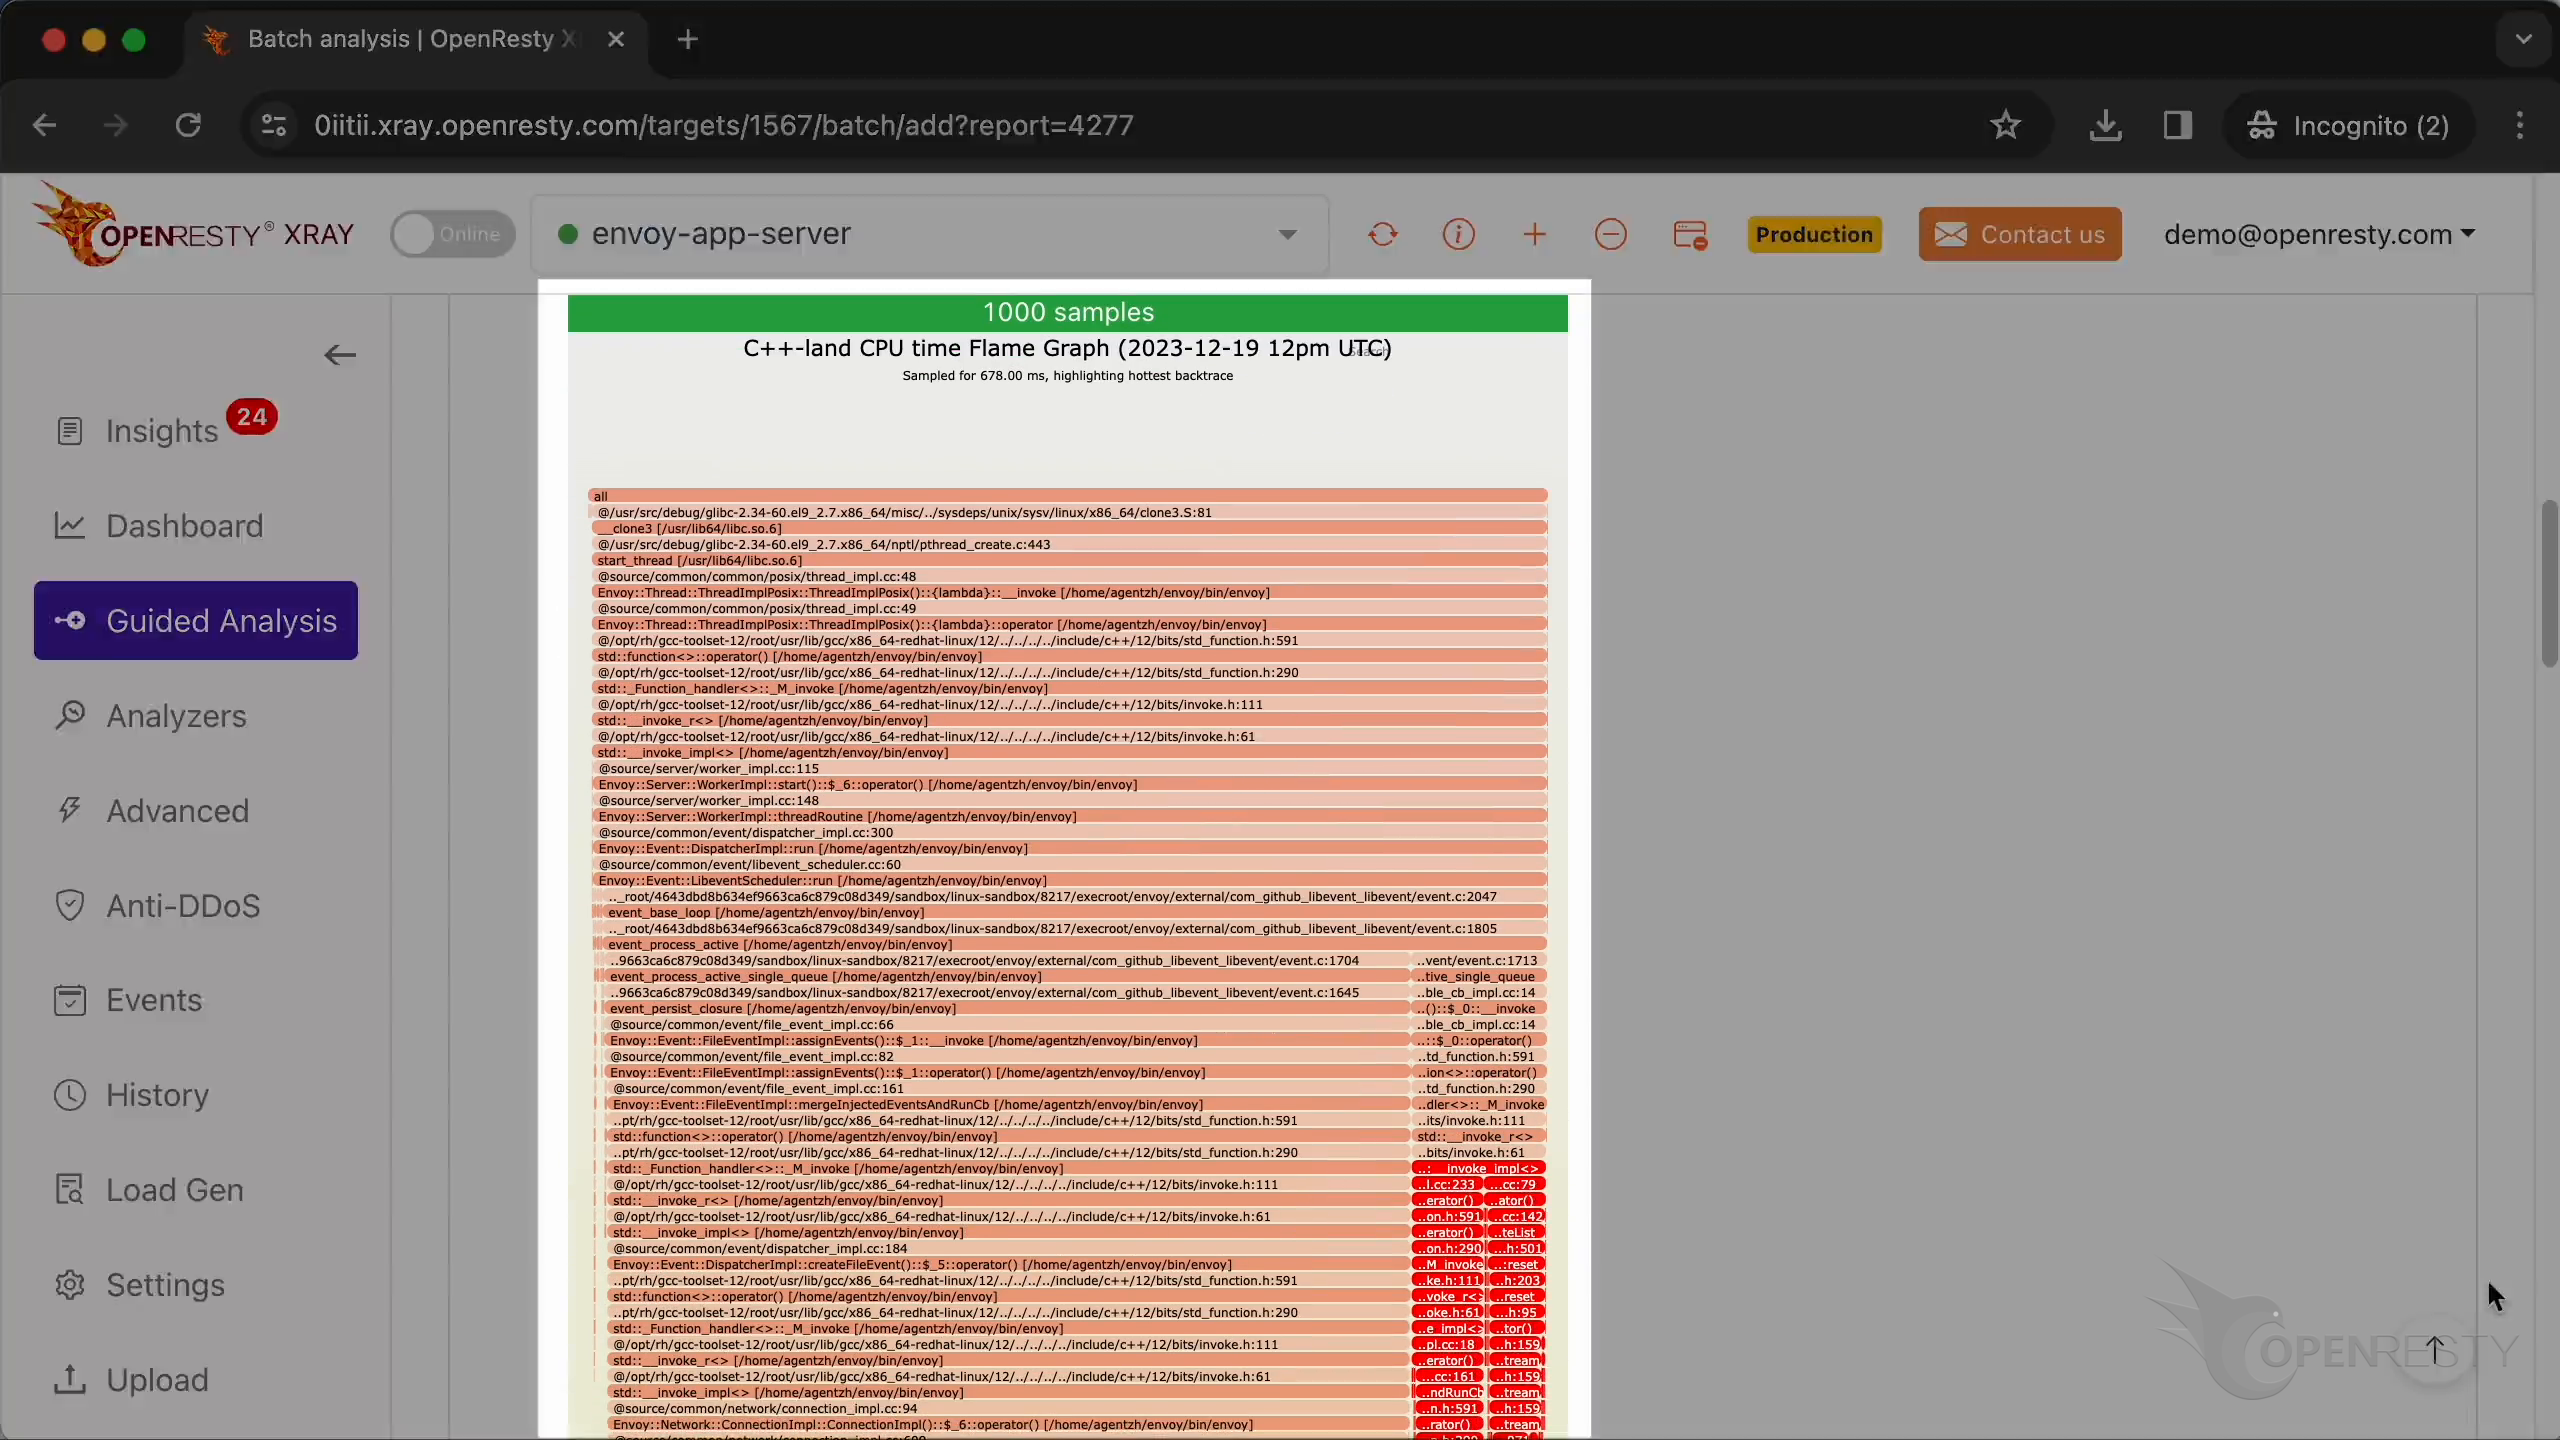
Click the icon to enlarge the flame graph.
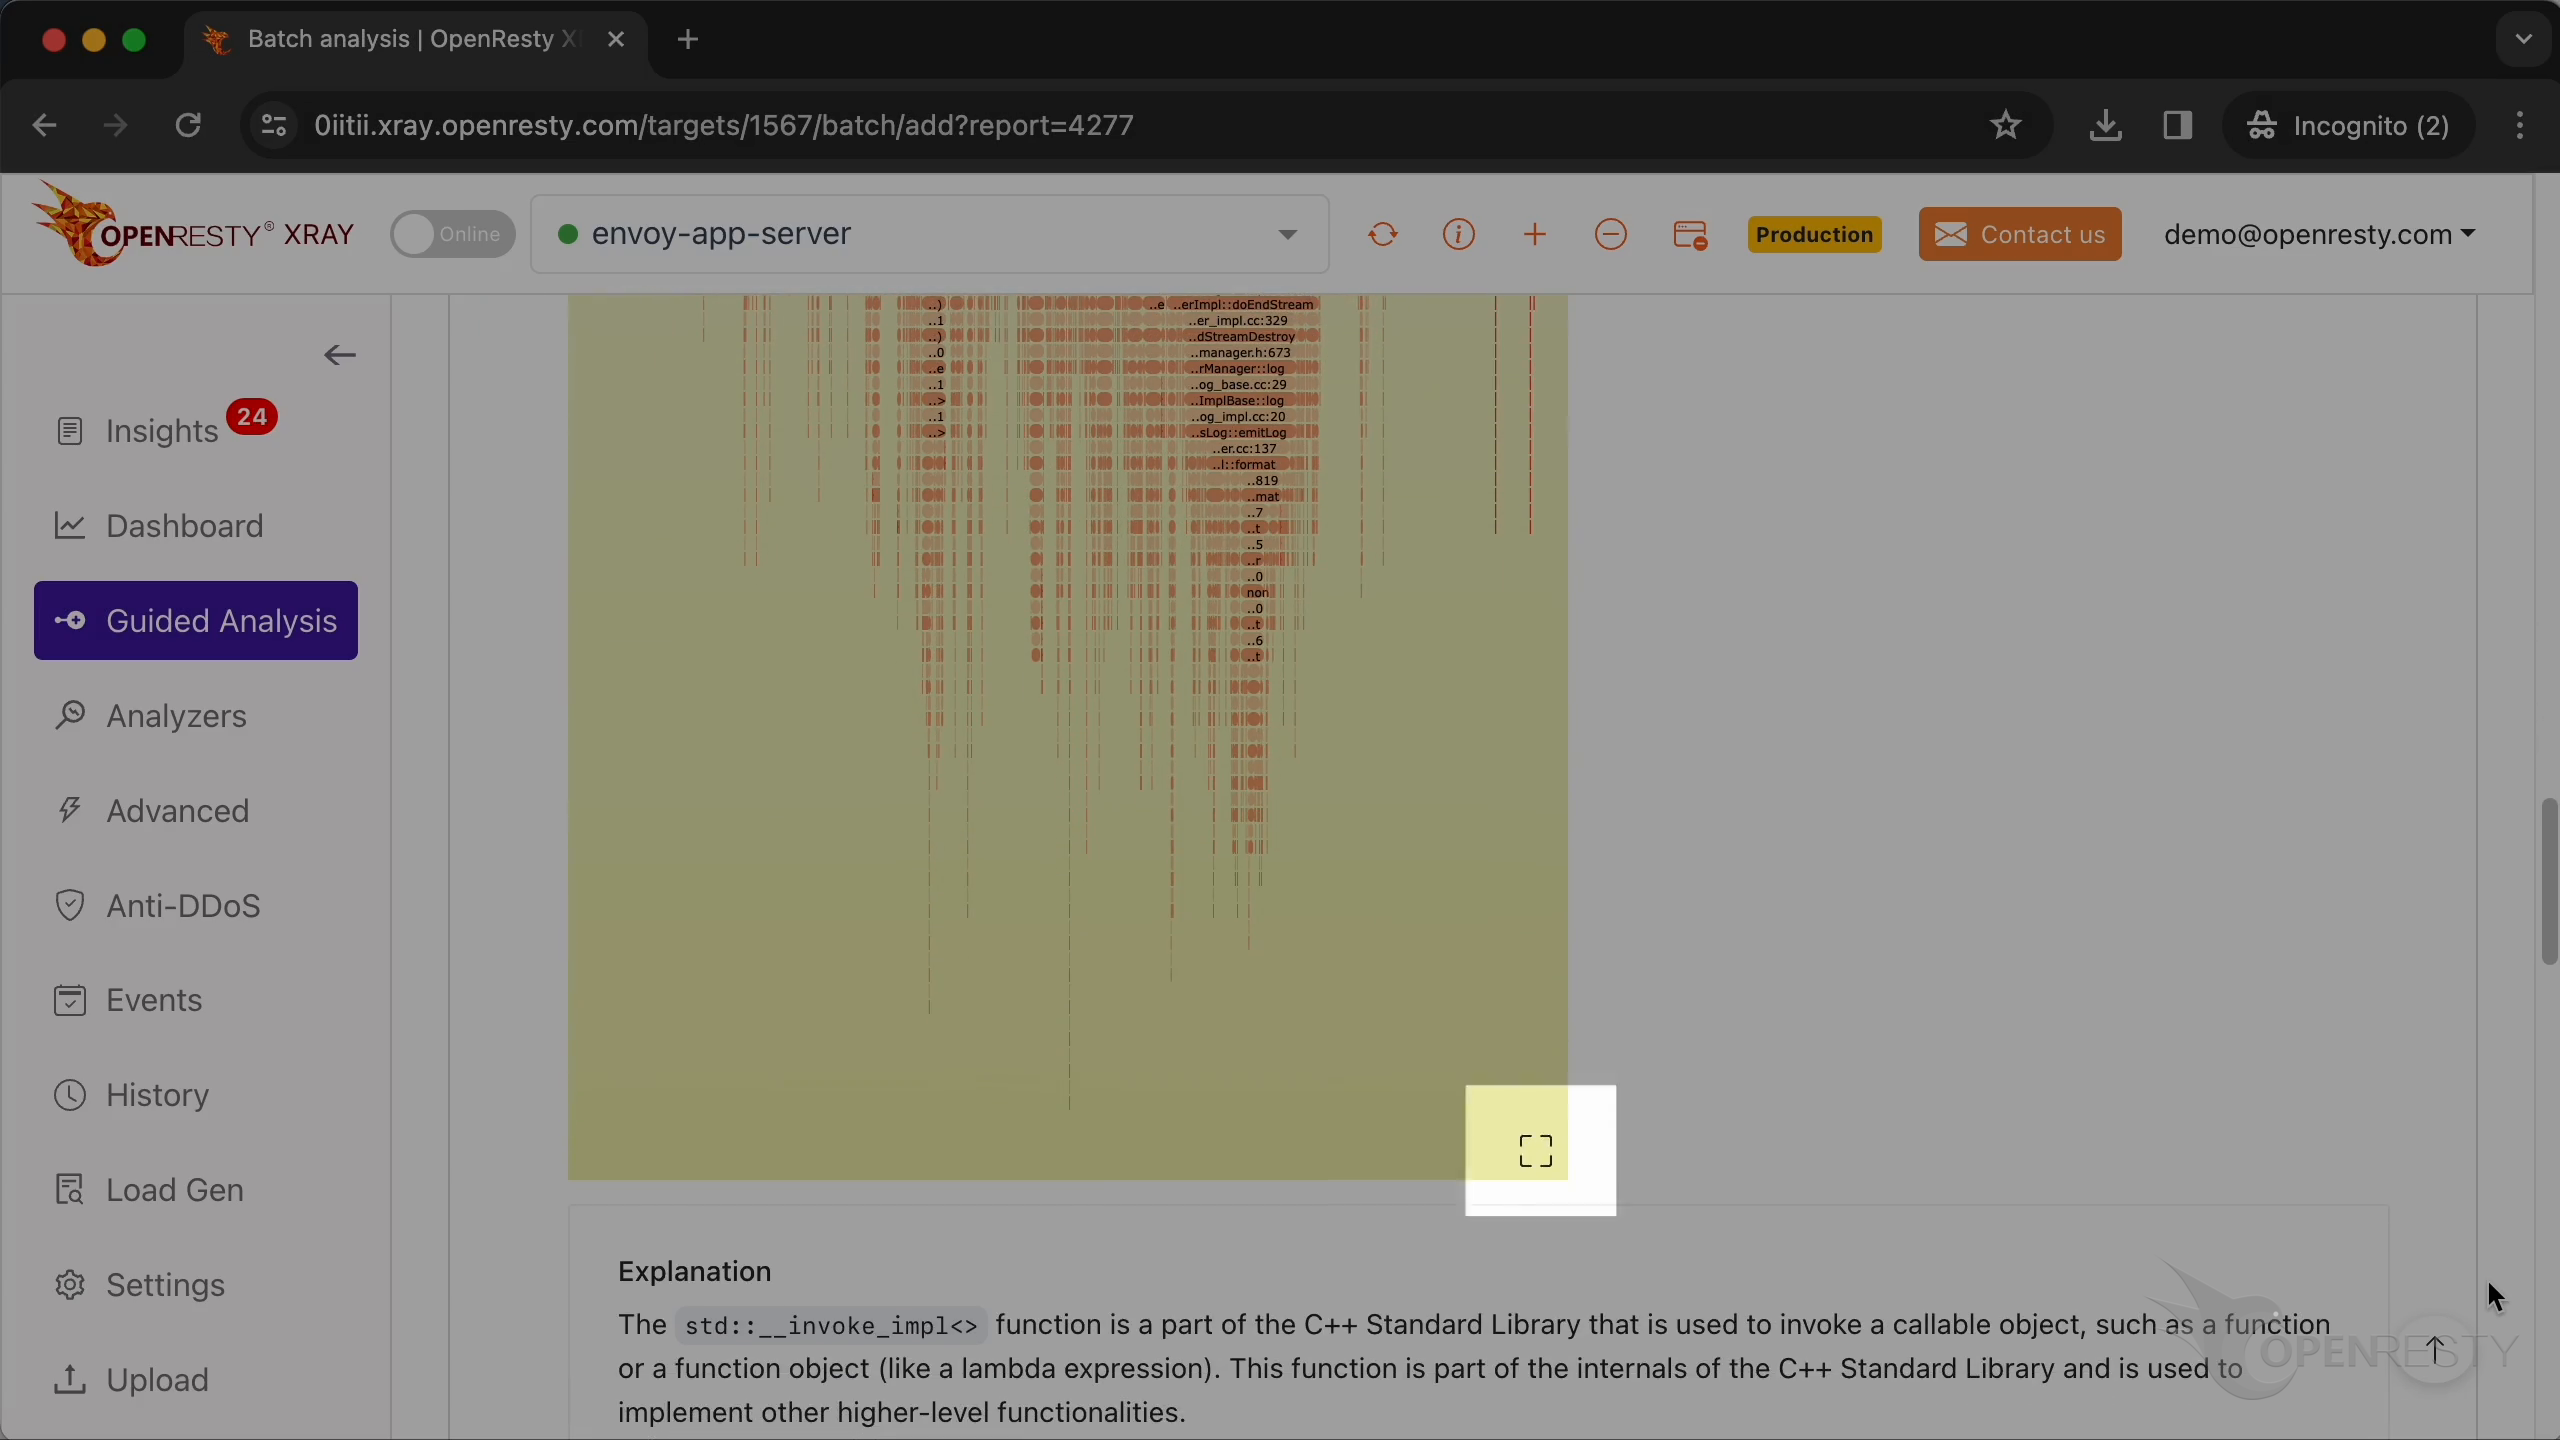
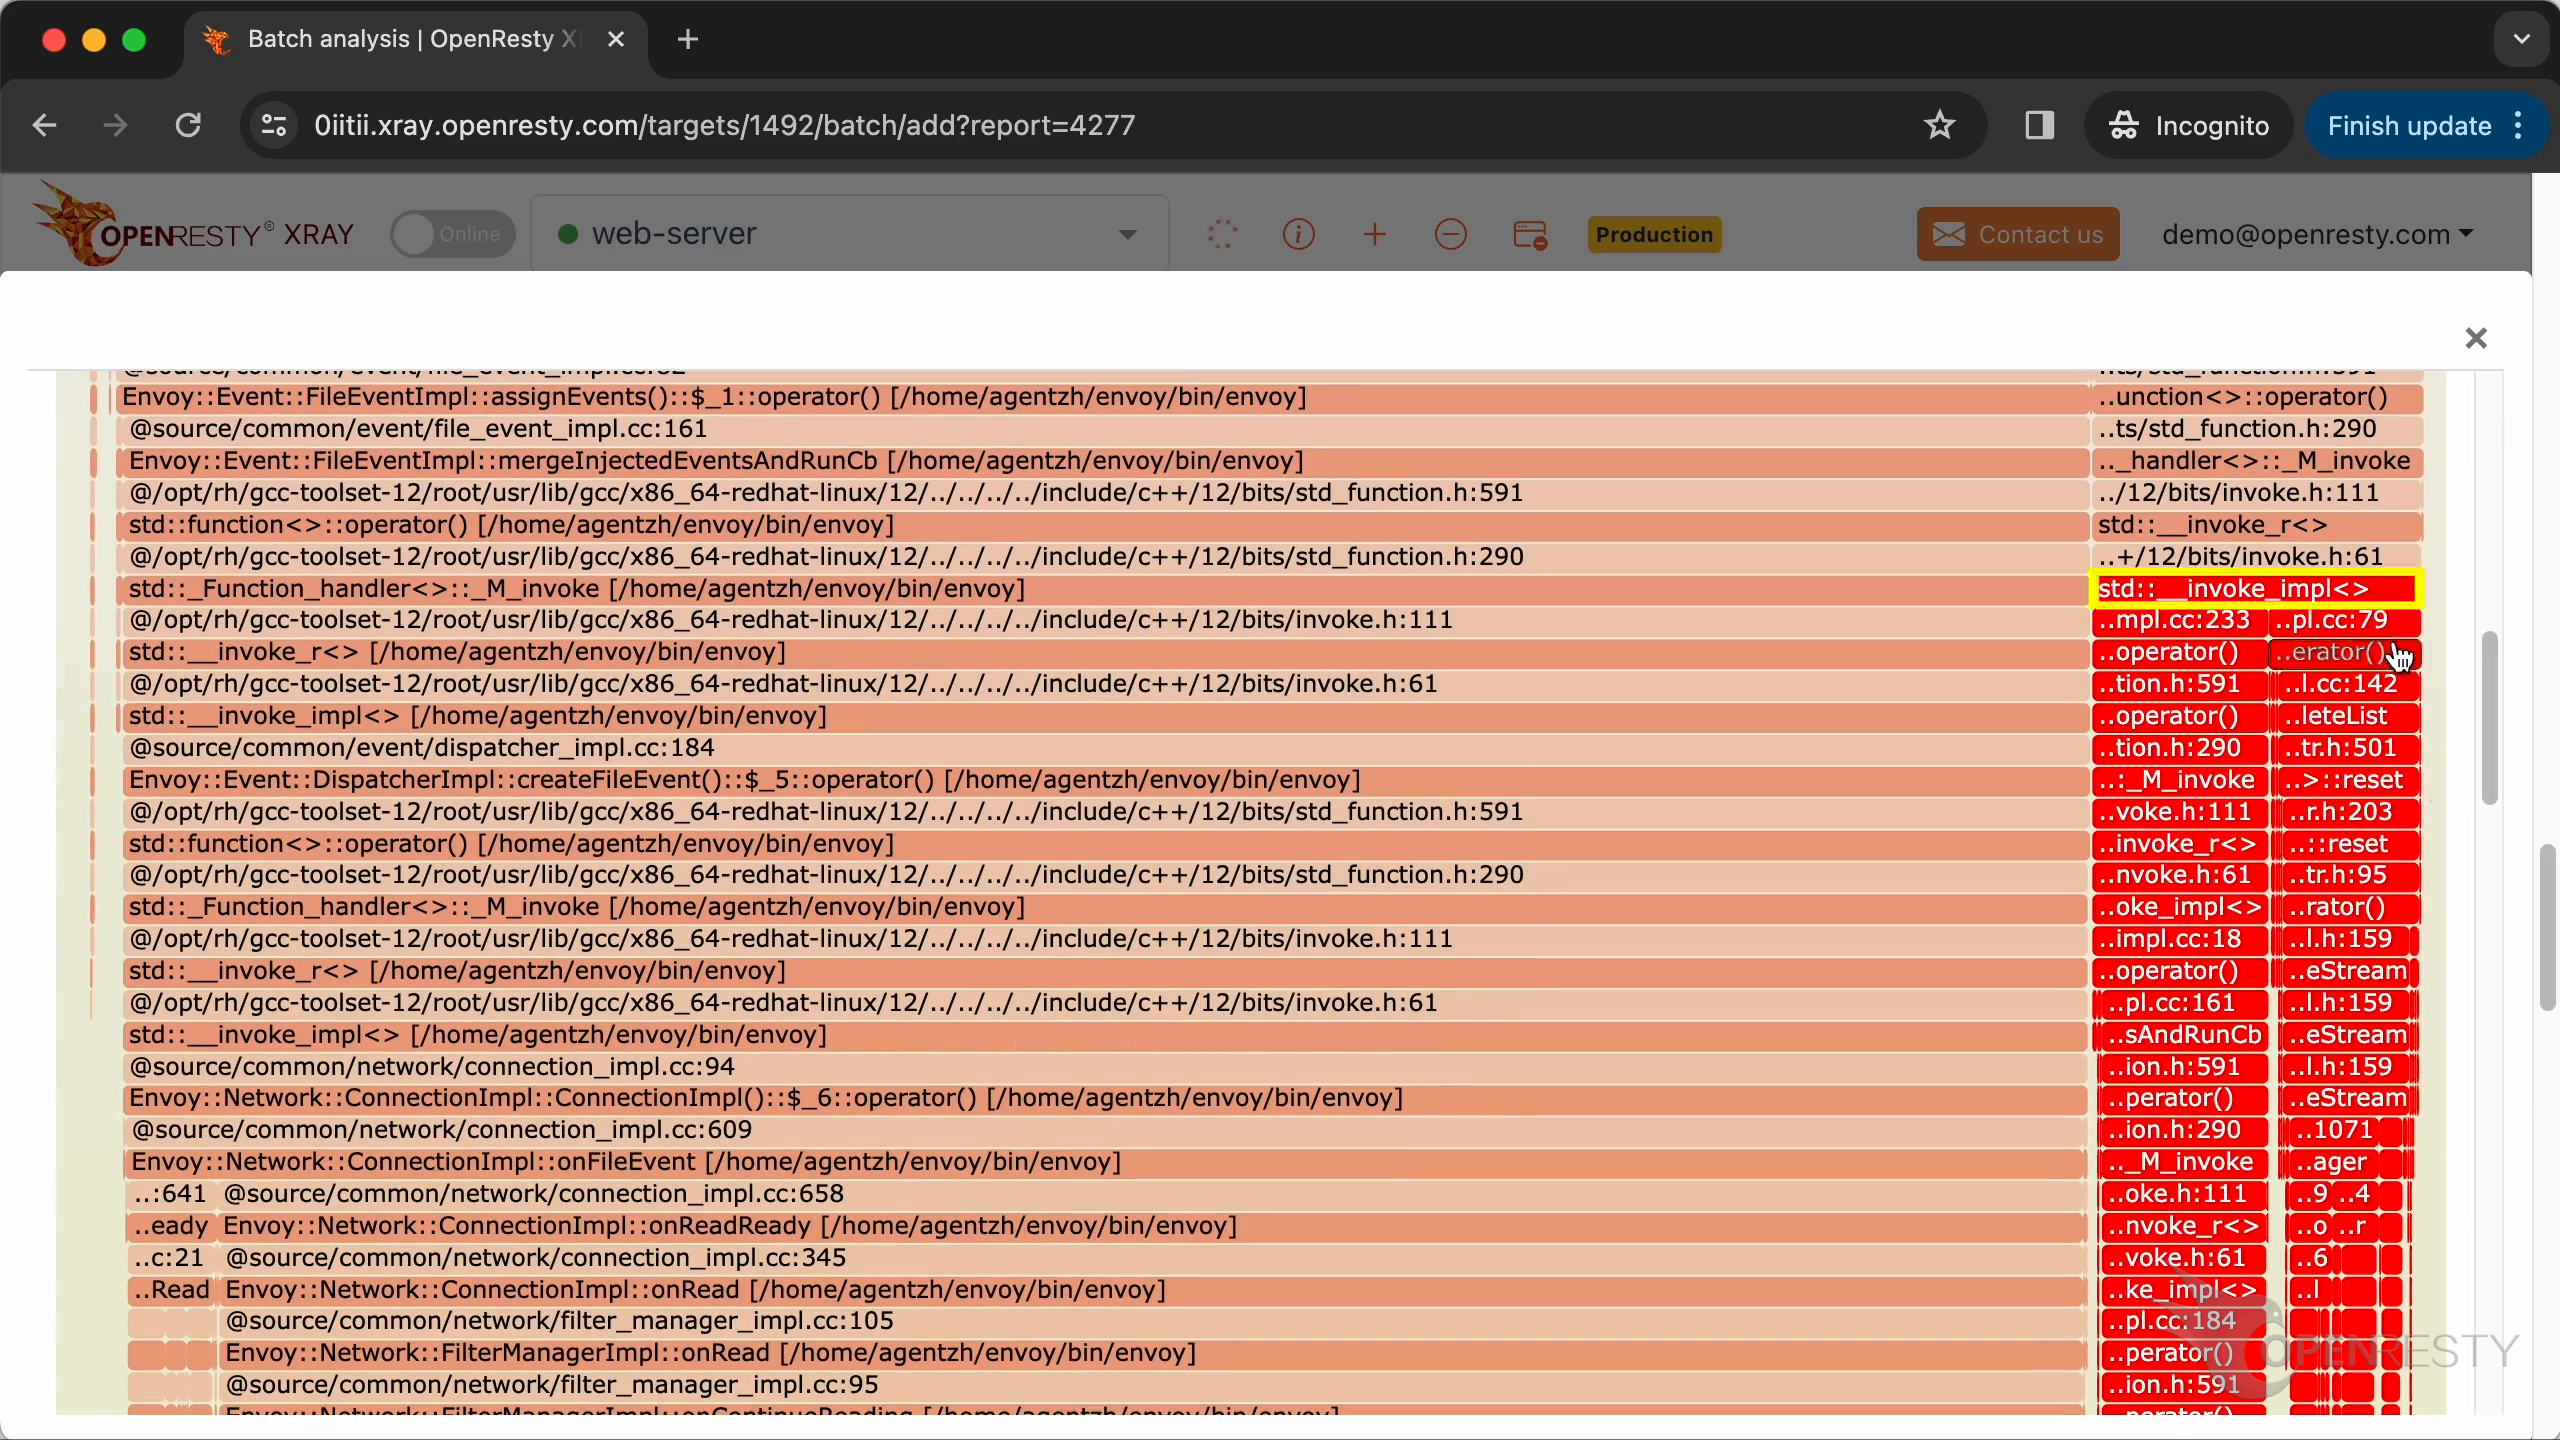
Continue to zoom in invoke_impl function.
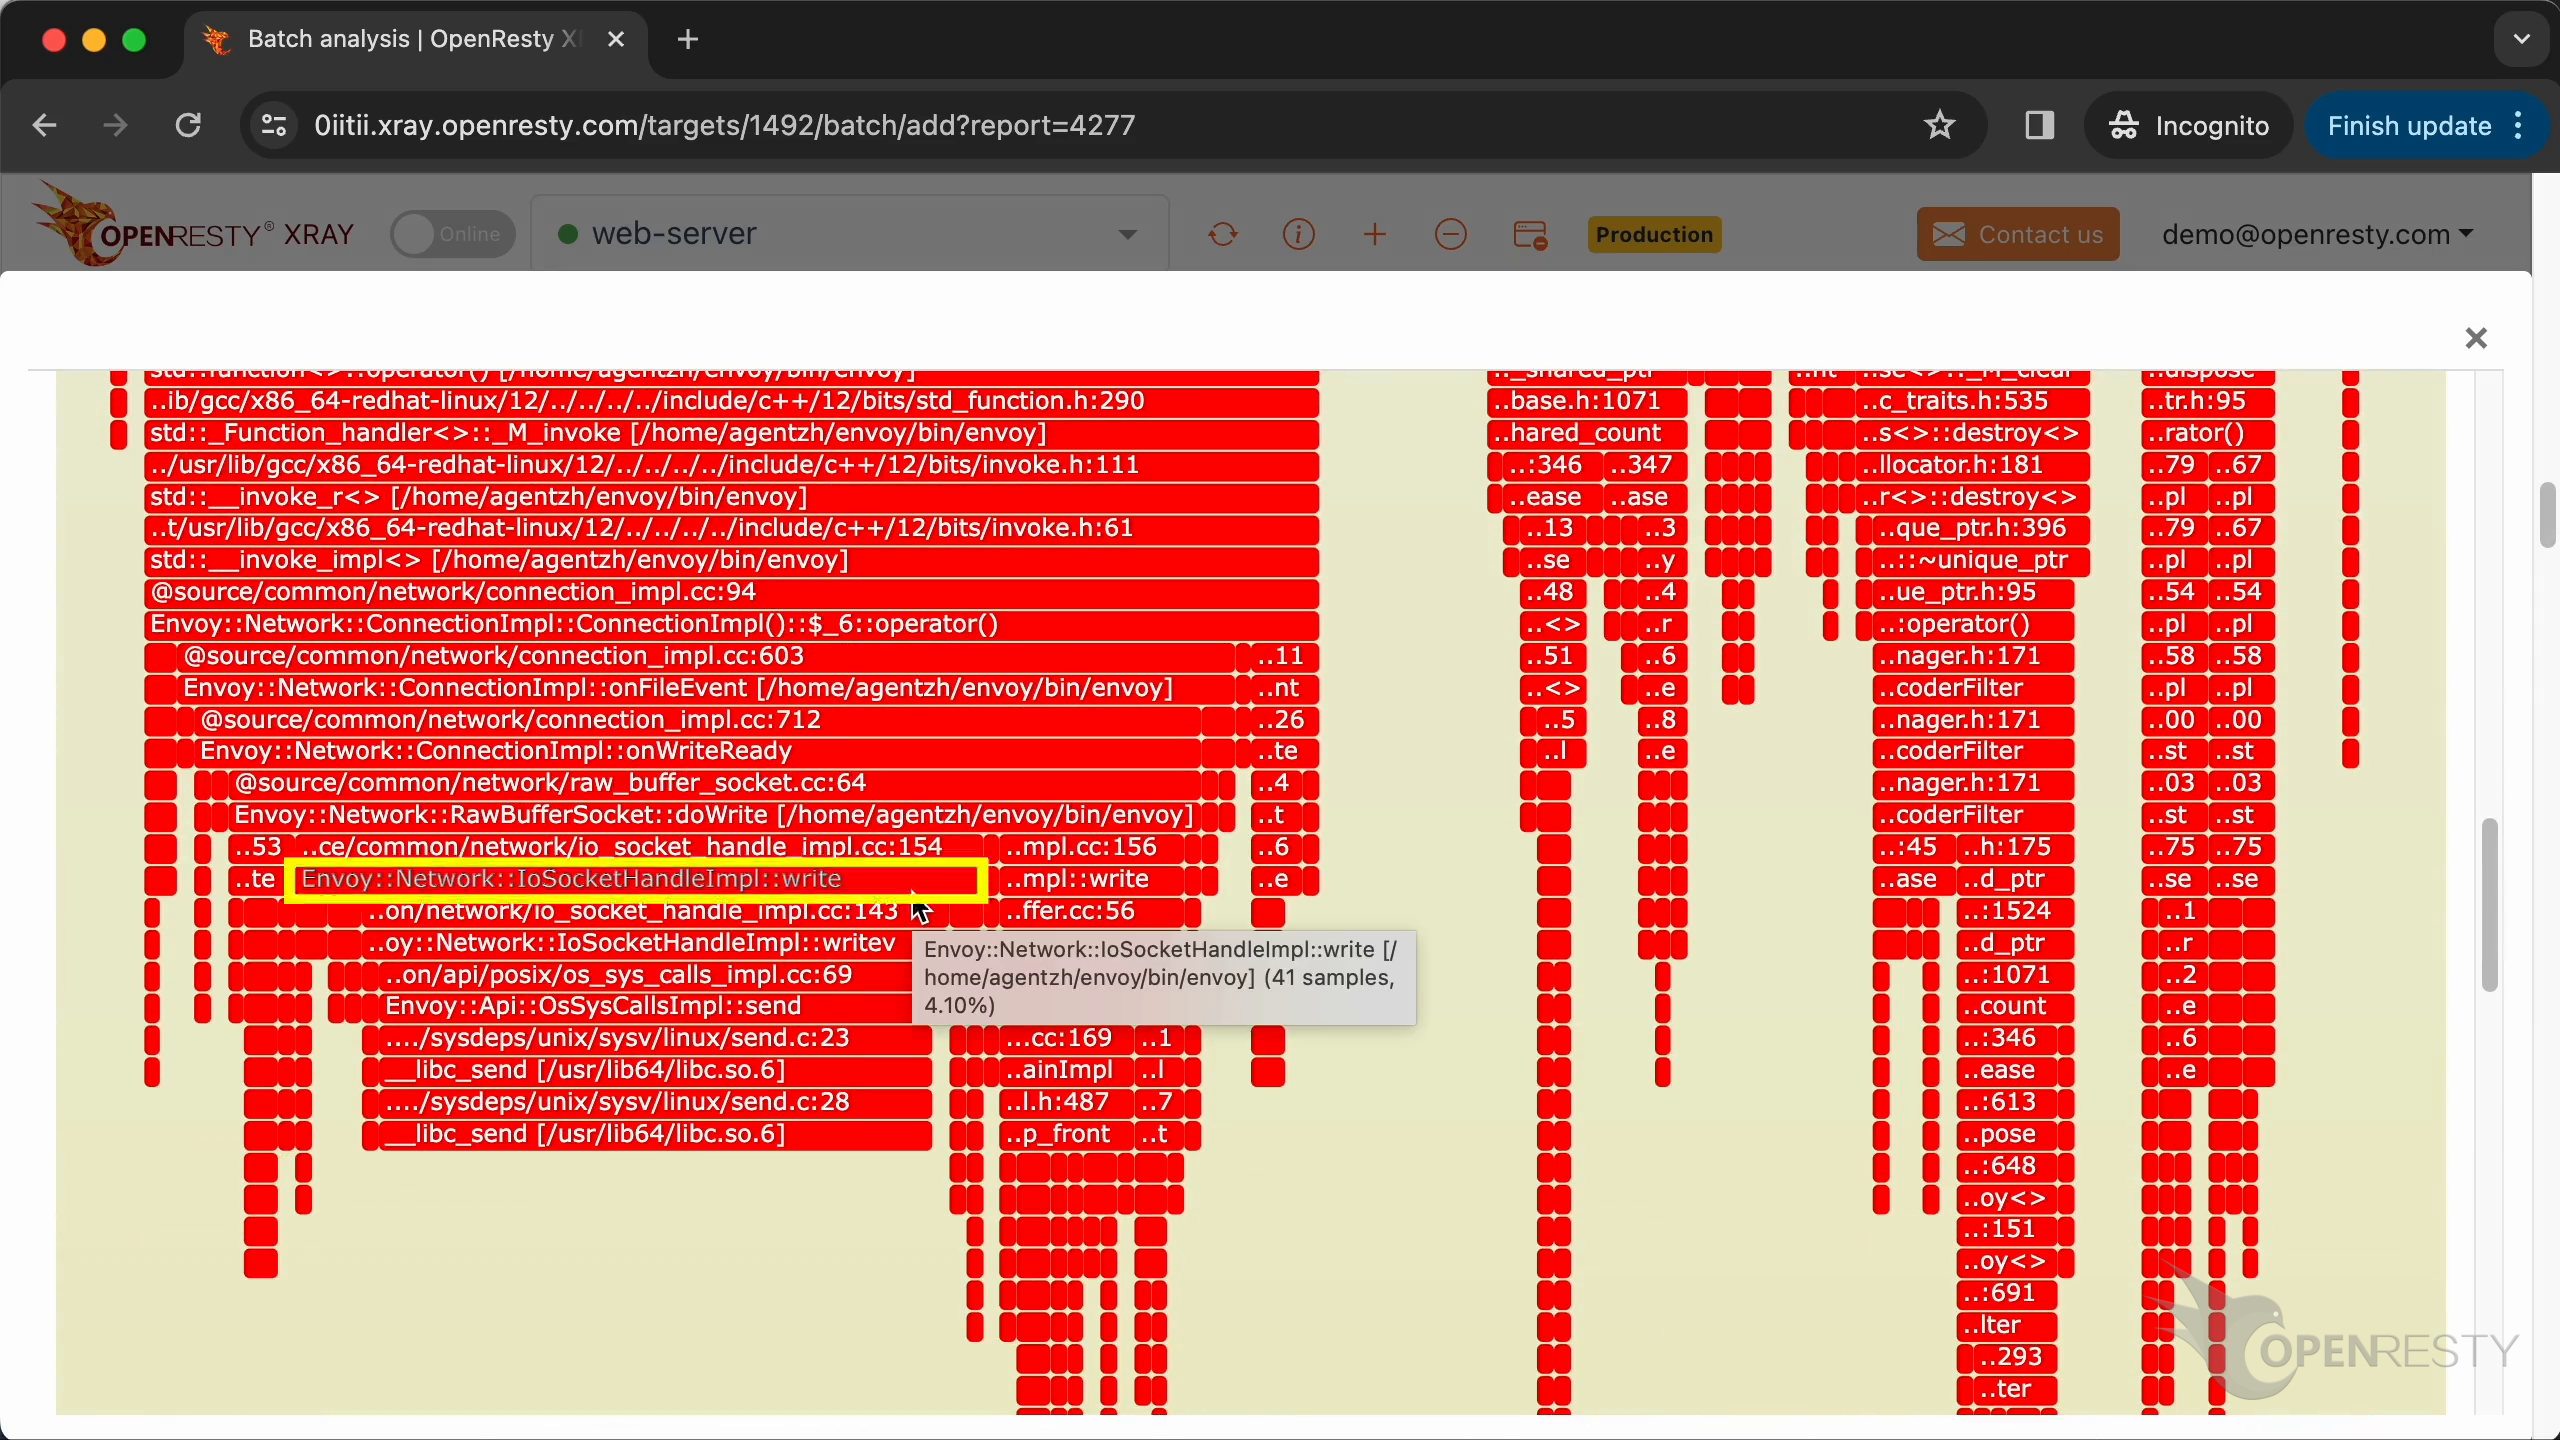
The write method of the Envoy network socket class performs socket writing. It sends out the HTTP response data.
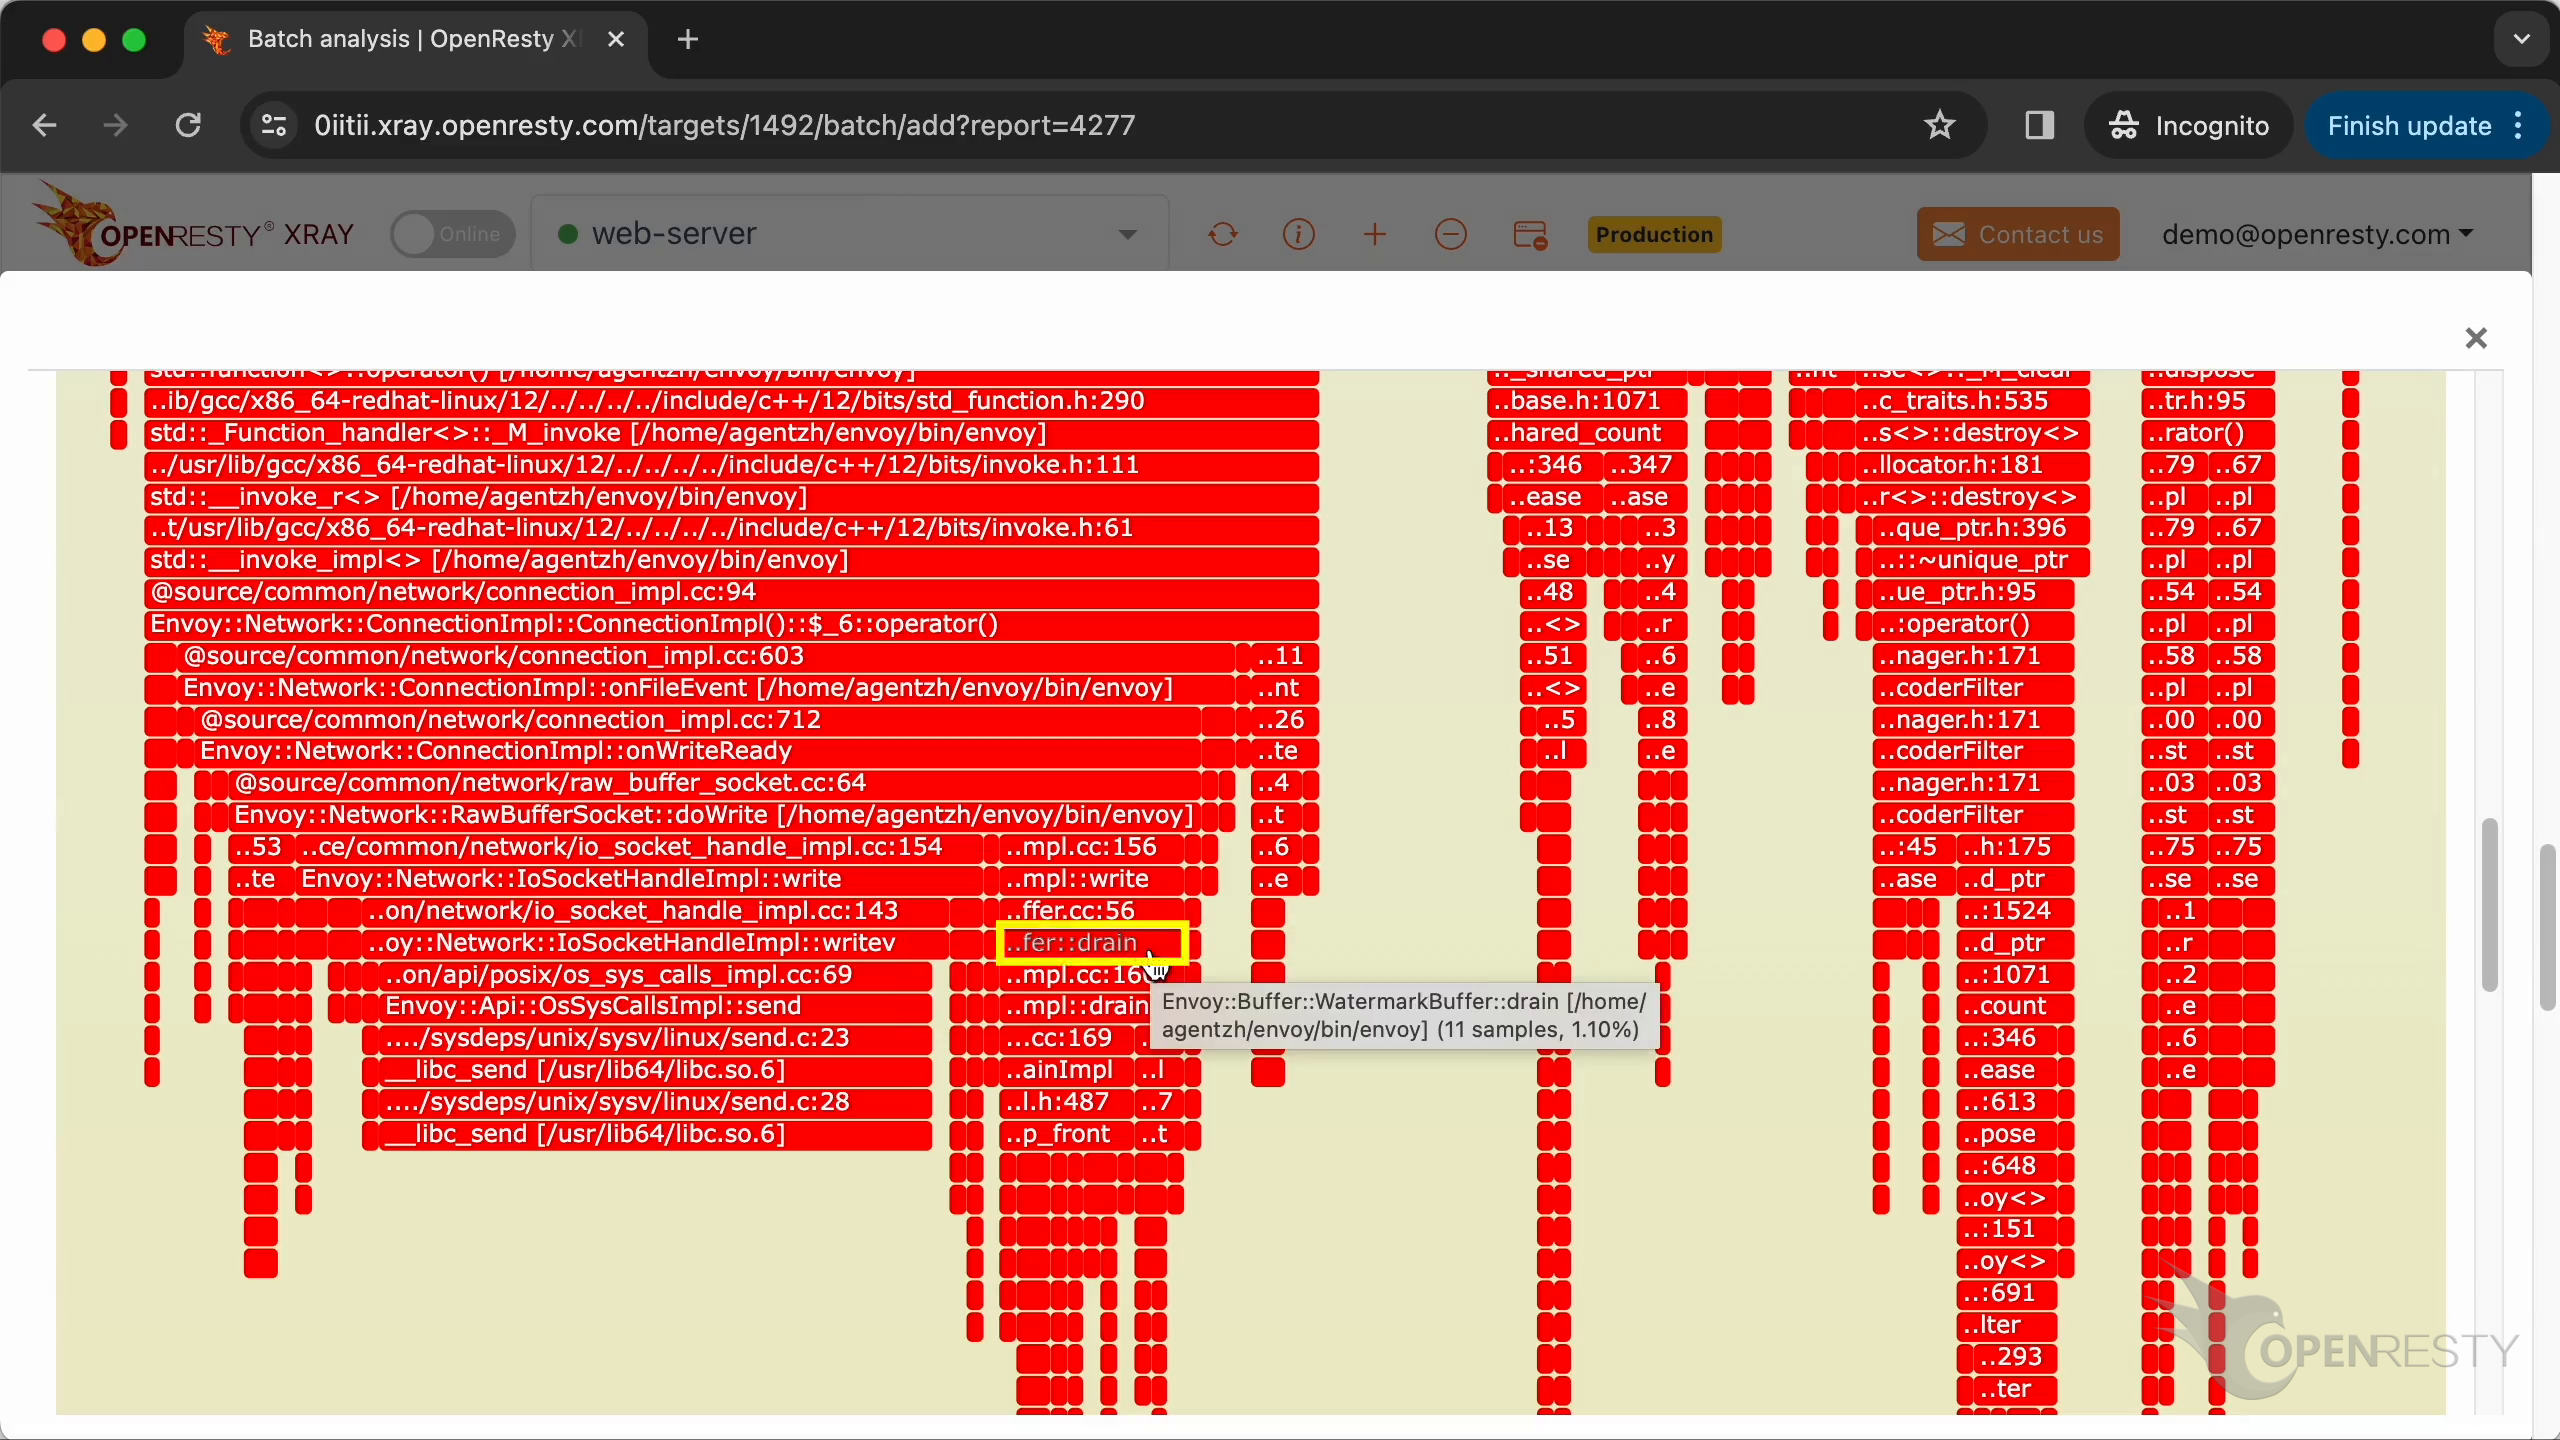
The drain method of the Envoy buffer class frees unused memory in the write buffer, and performs other cleanup work.
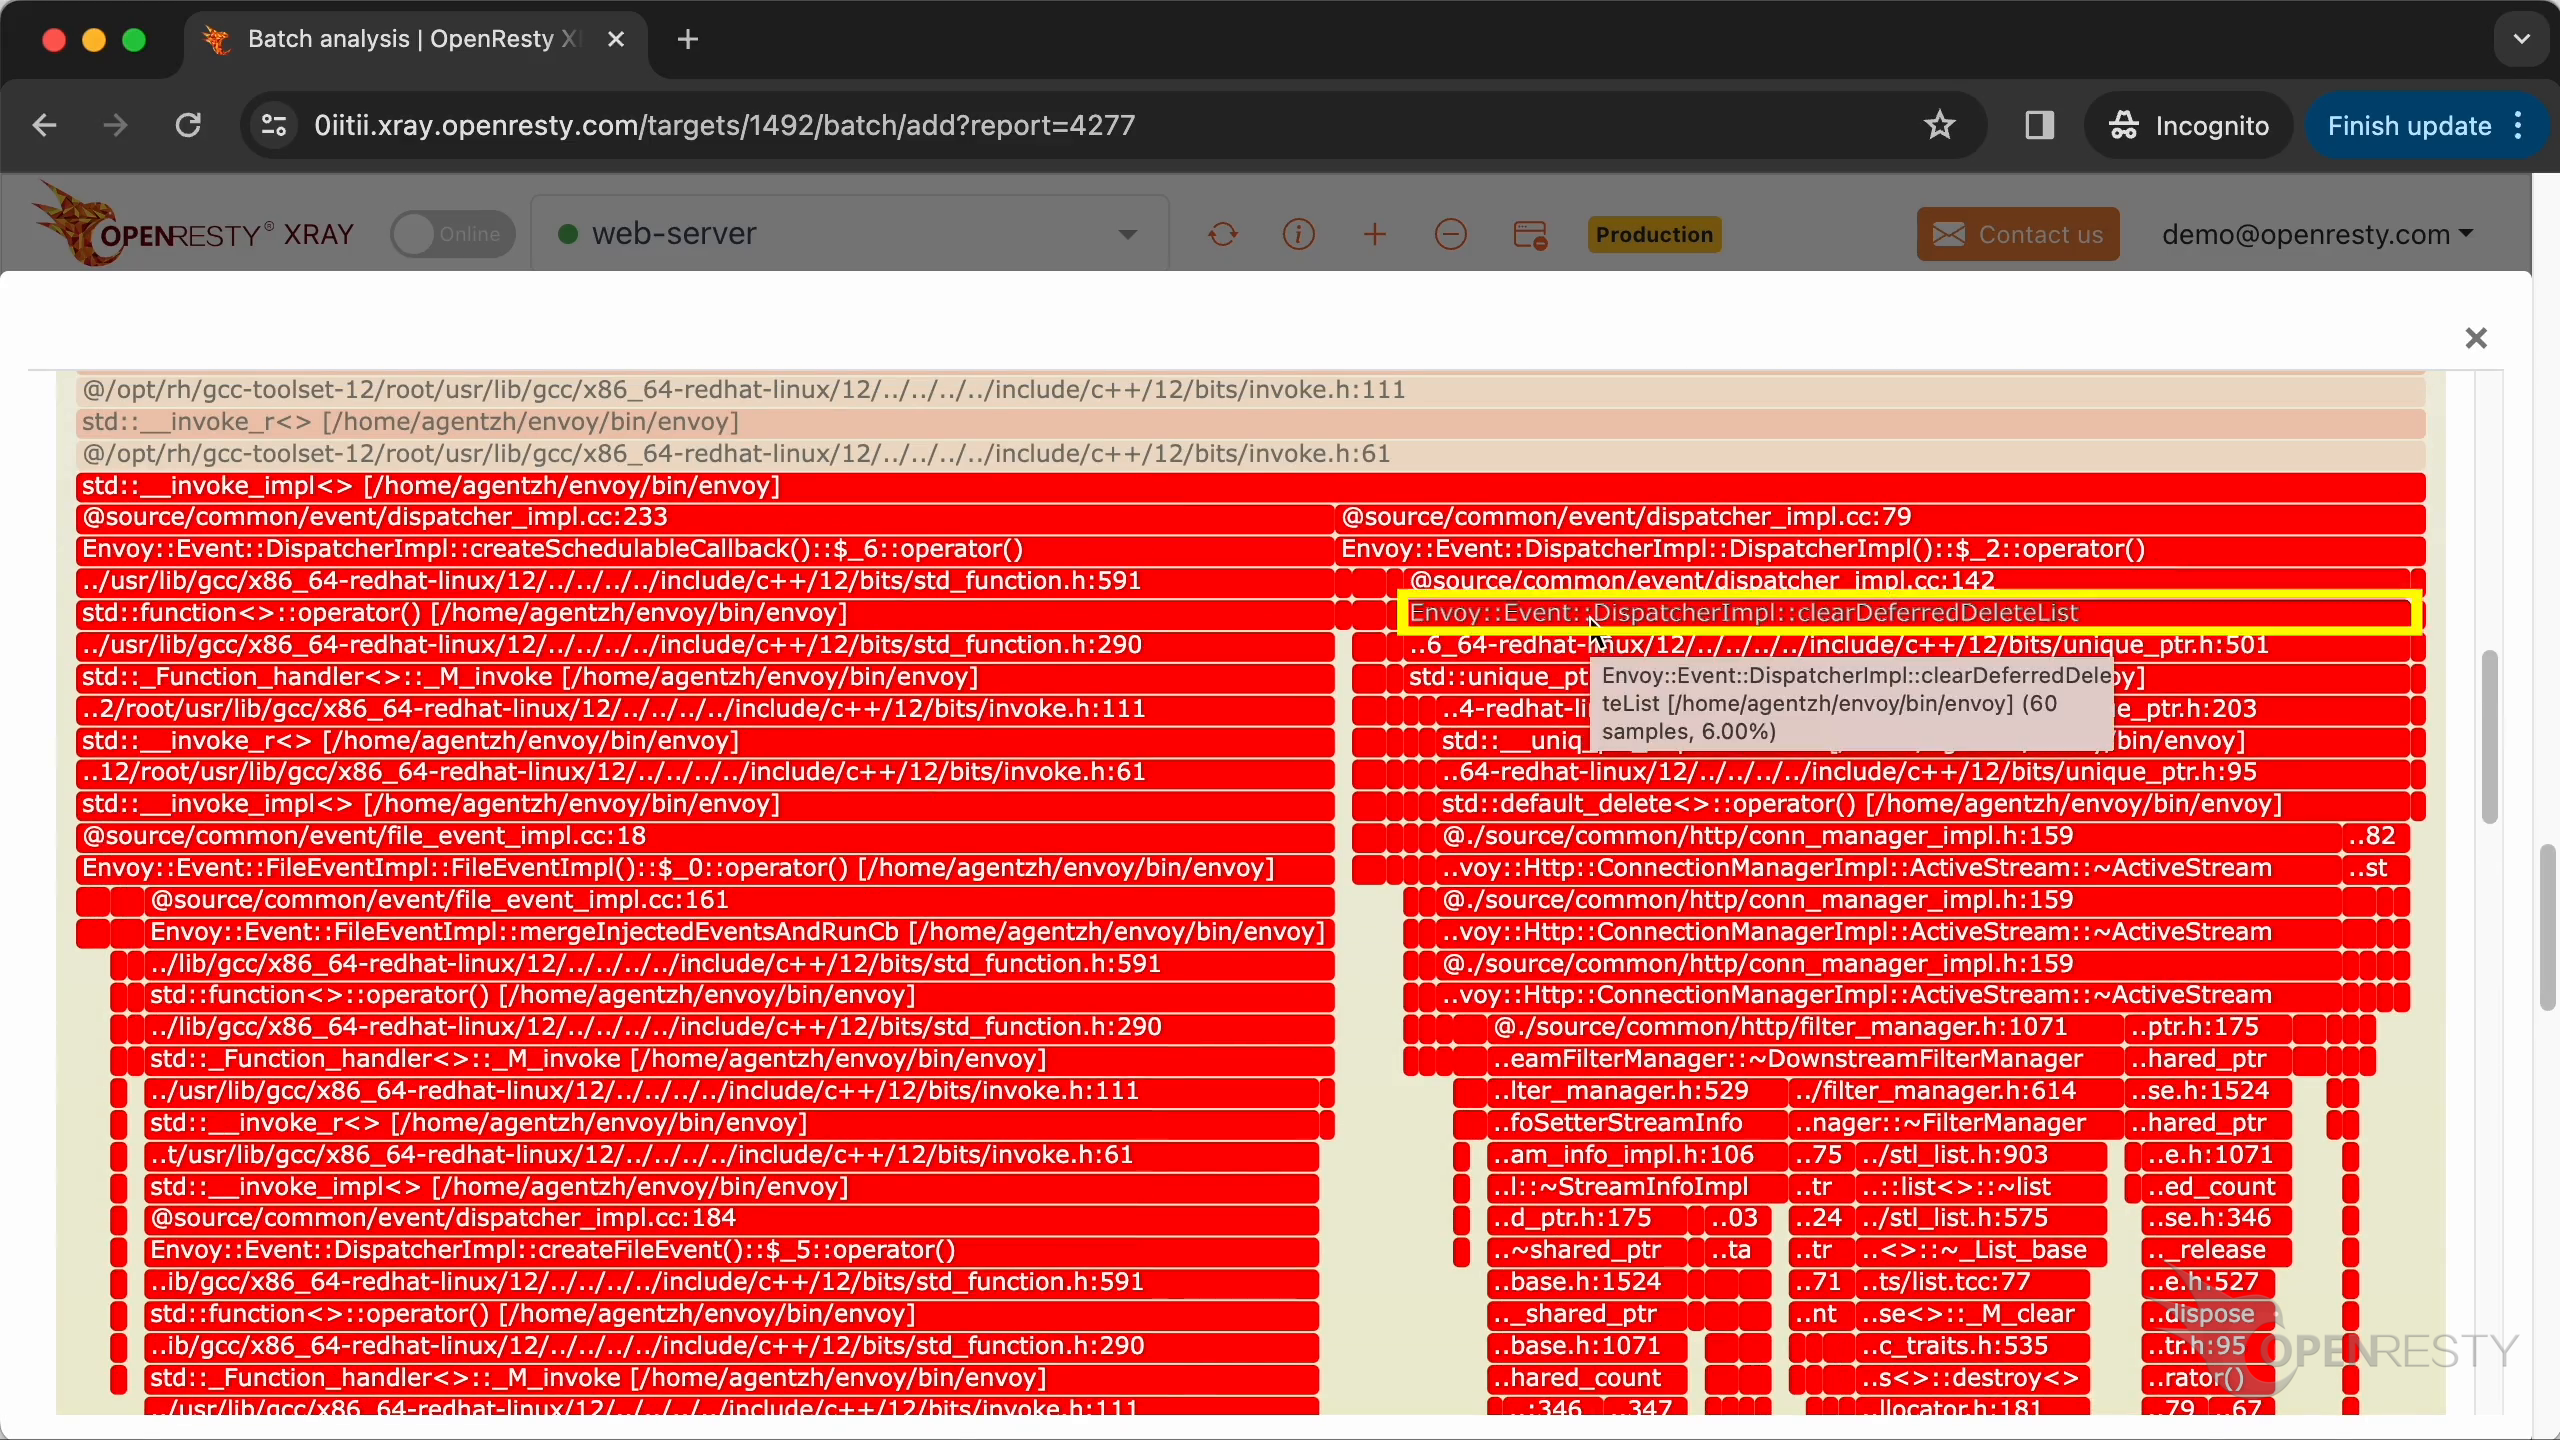
The clearDeferredDeletedList method of the Envoy dispatcher class frees up all the resources associated with the current request. And does all the cleanup work.
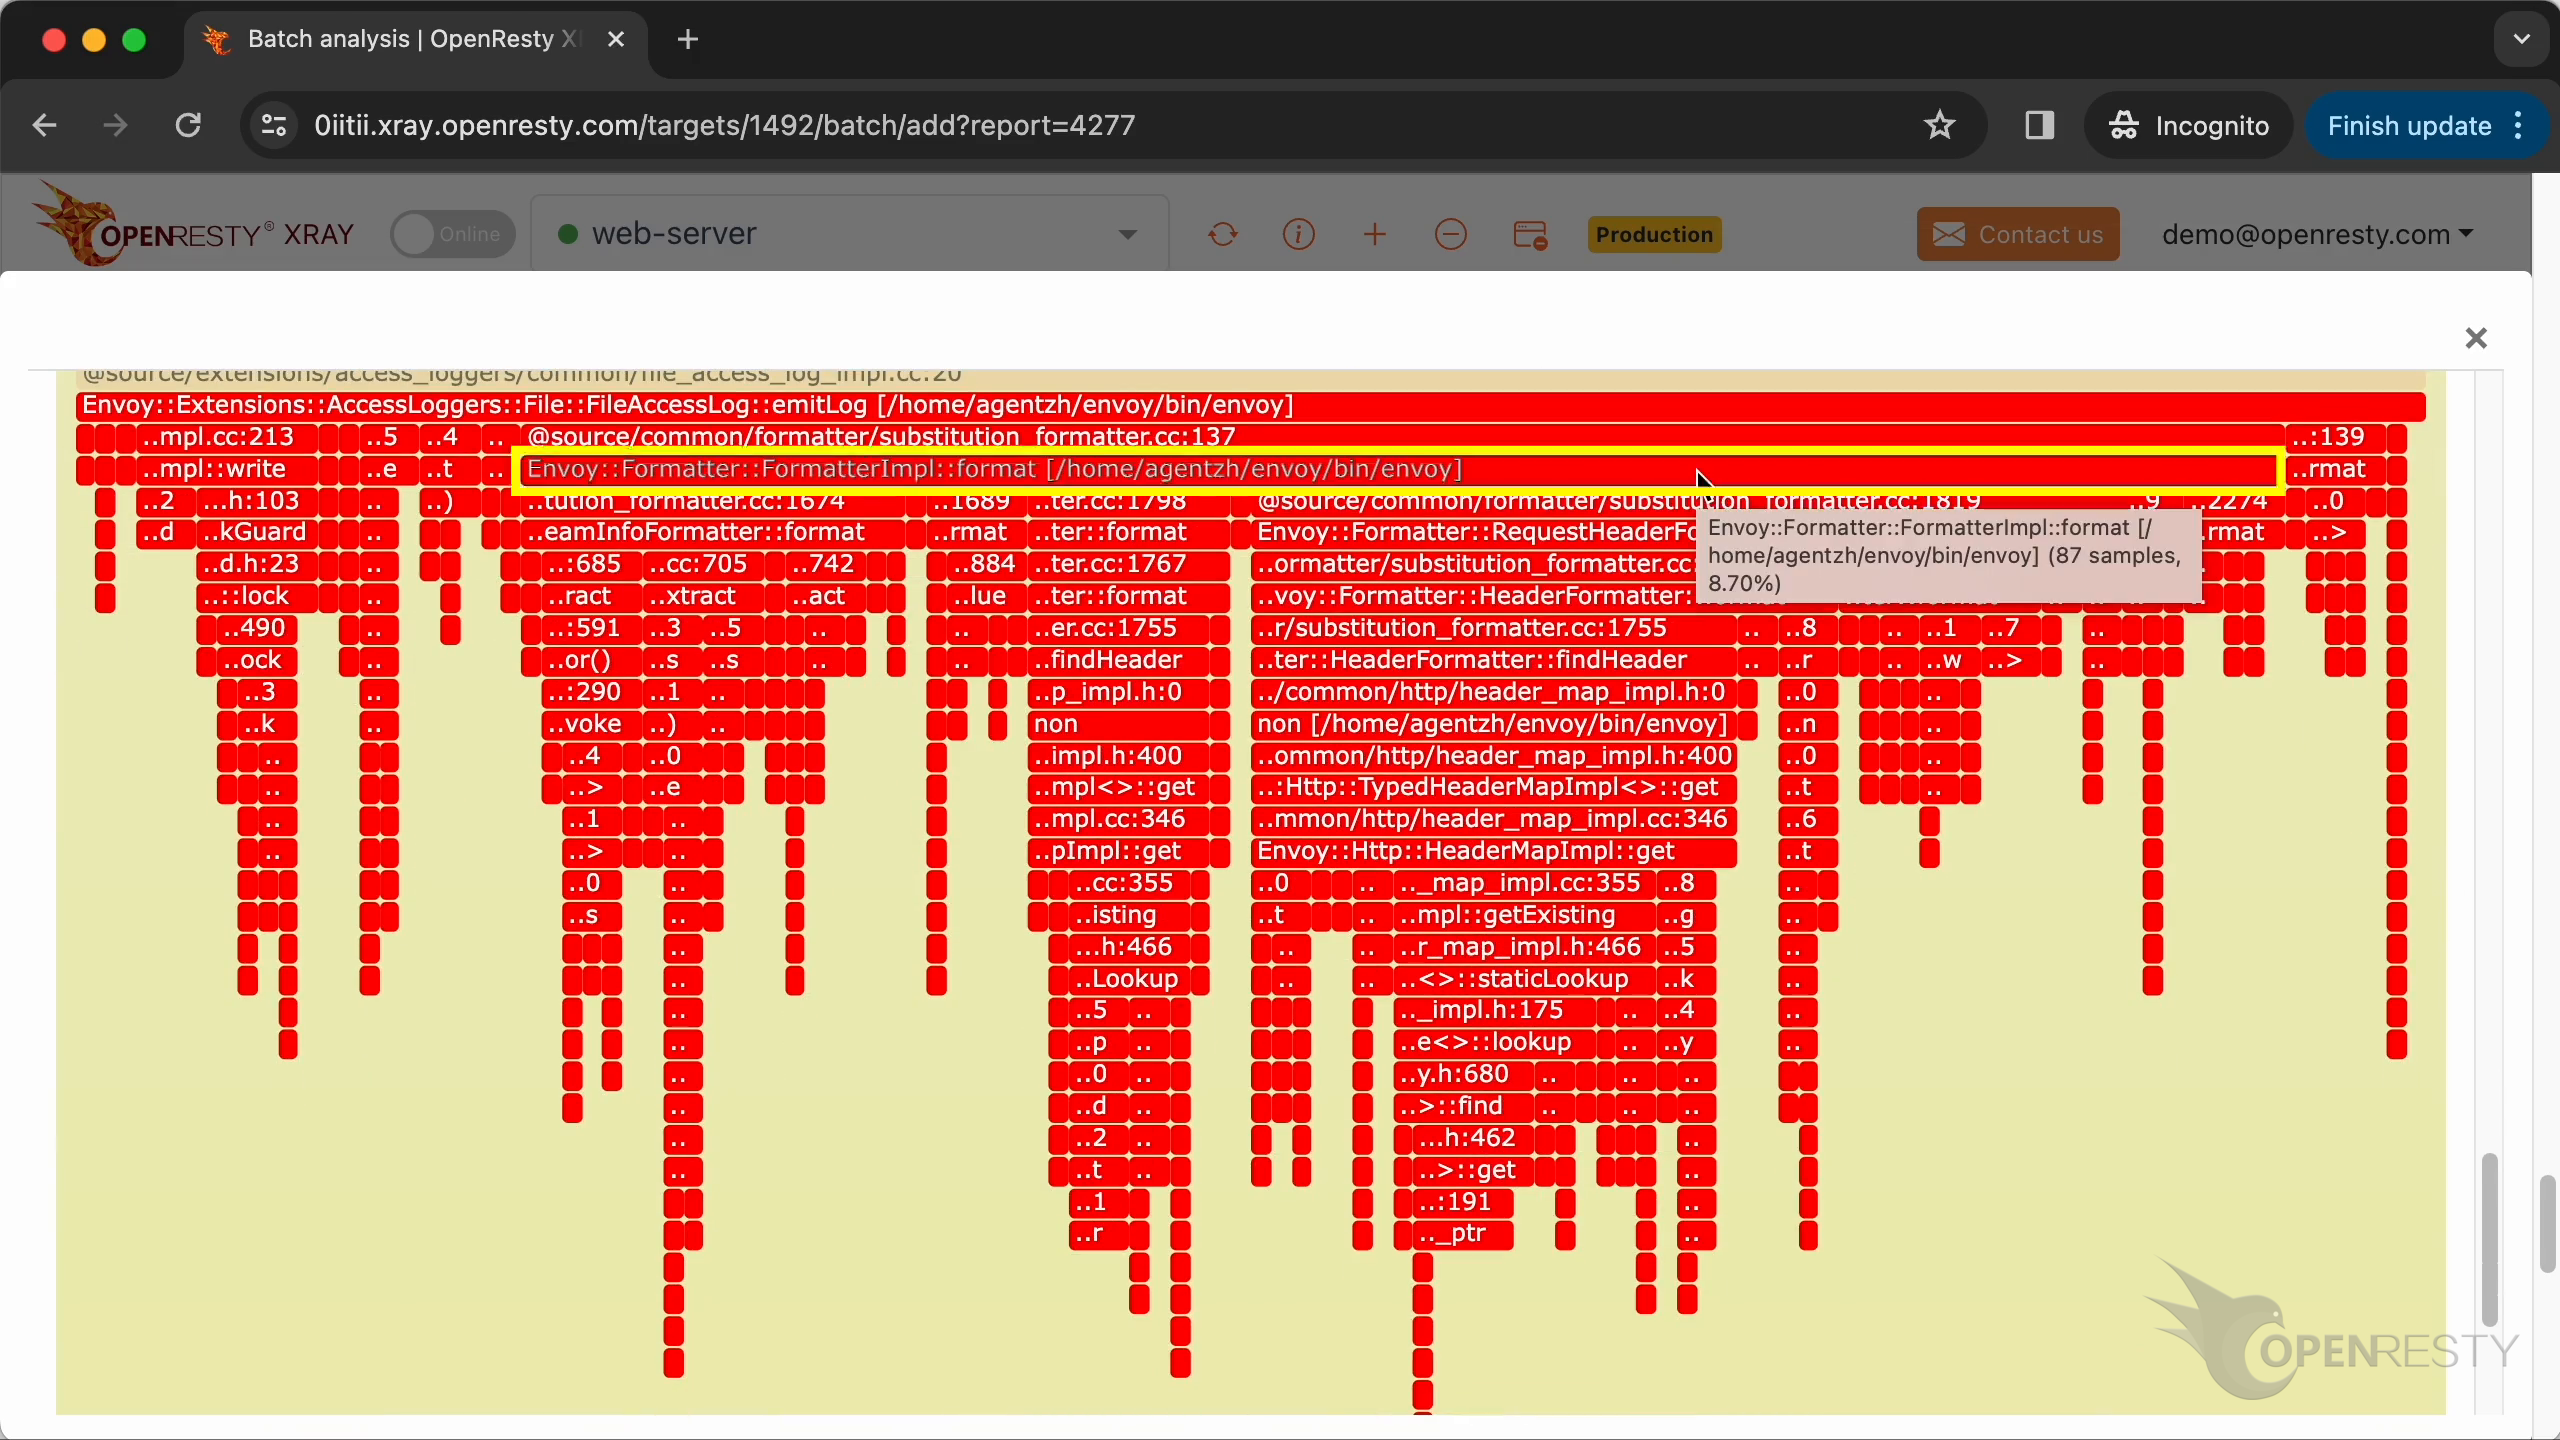
#2 Hot Path — emitLog Access-Log Formatting
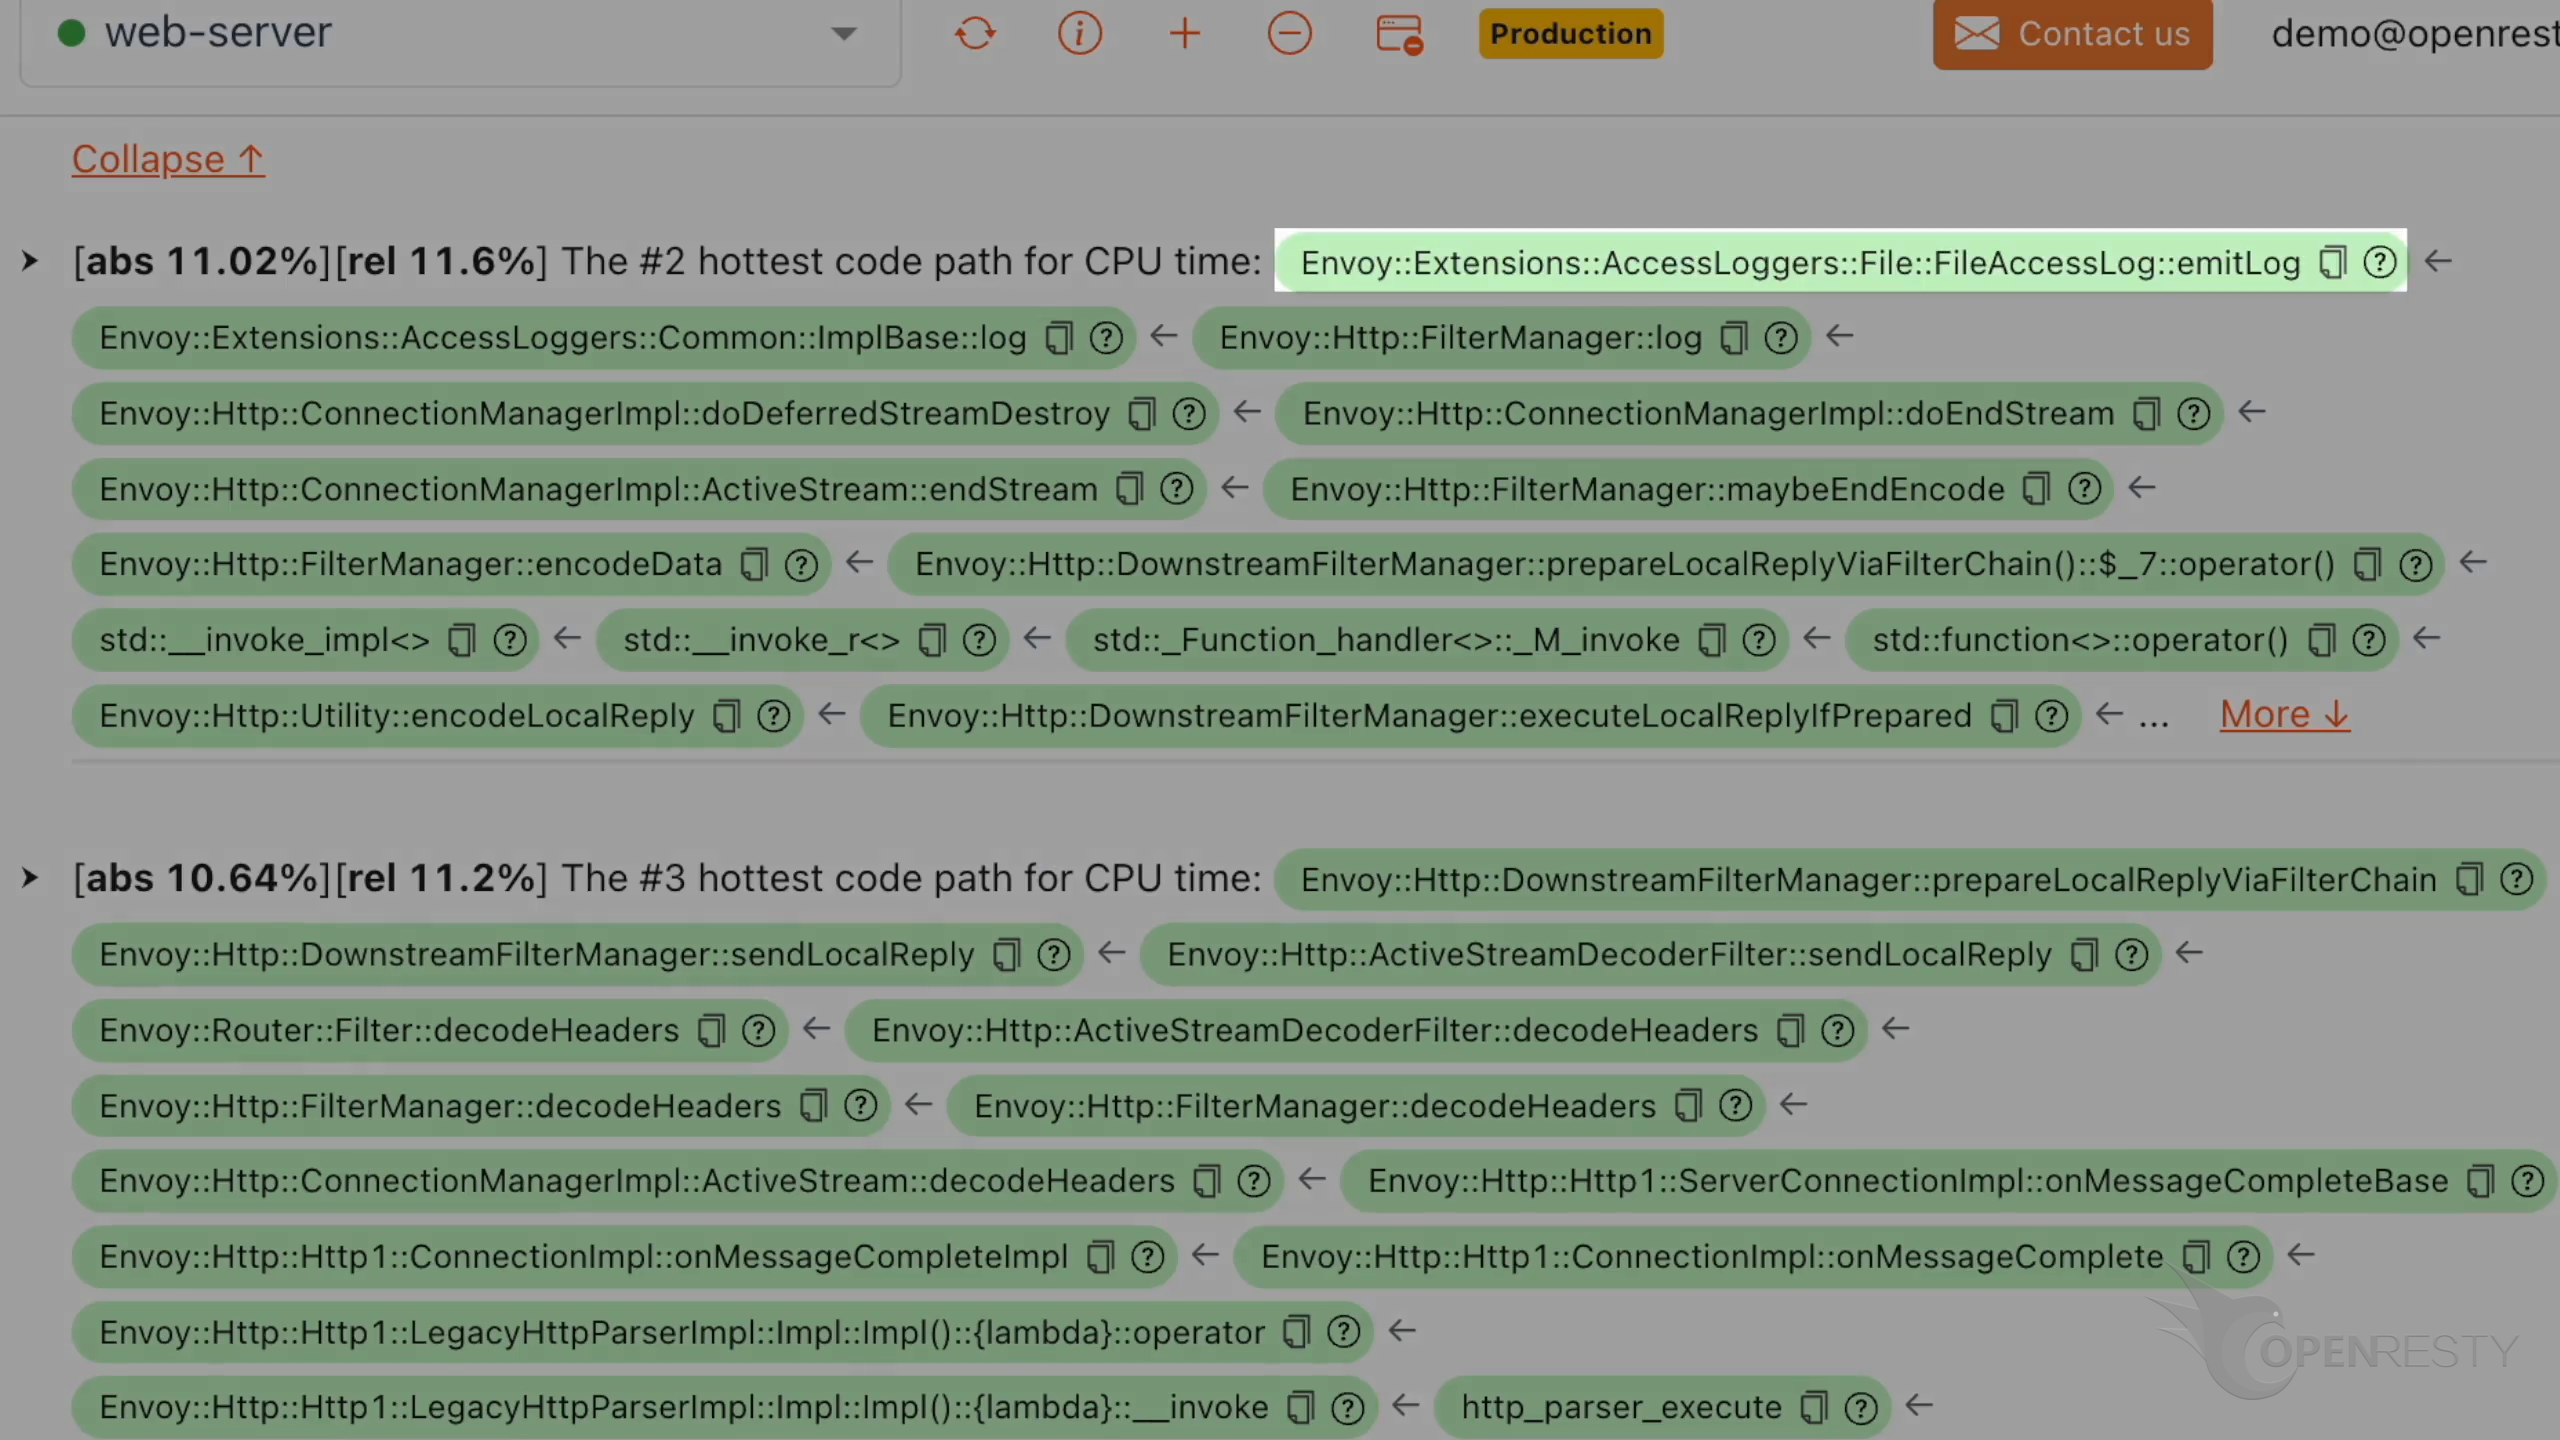
Check the #2 hottest C++ code path for the CPU time.
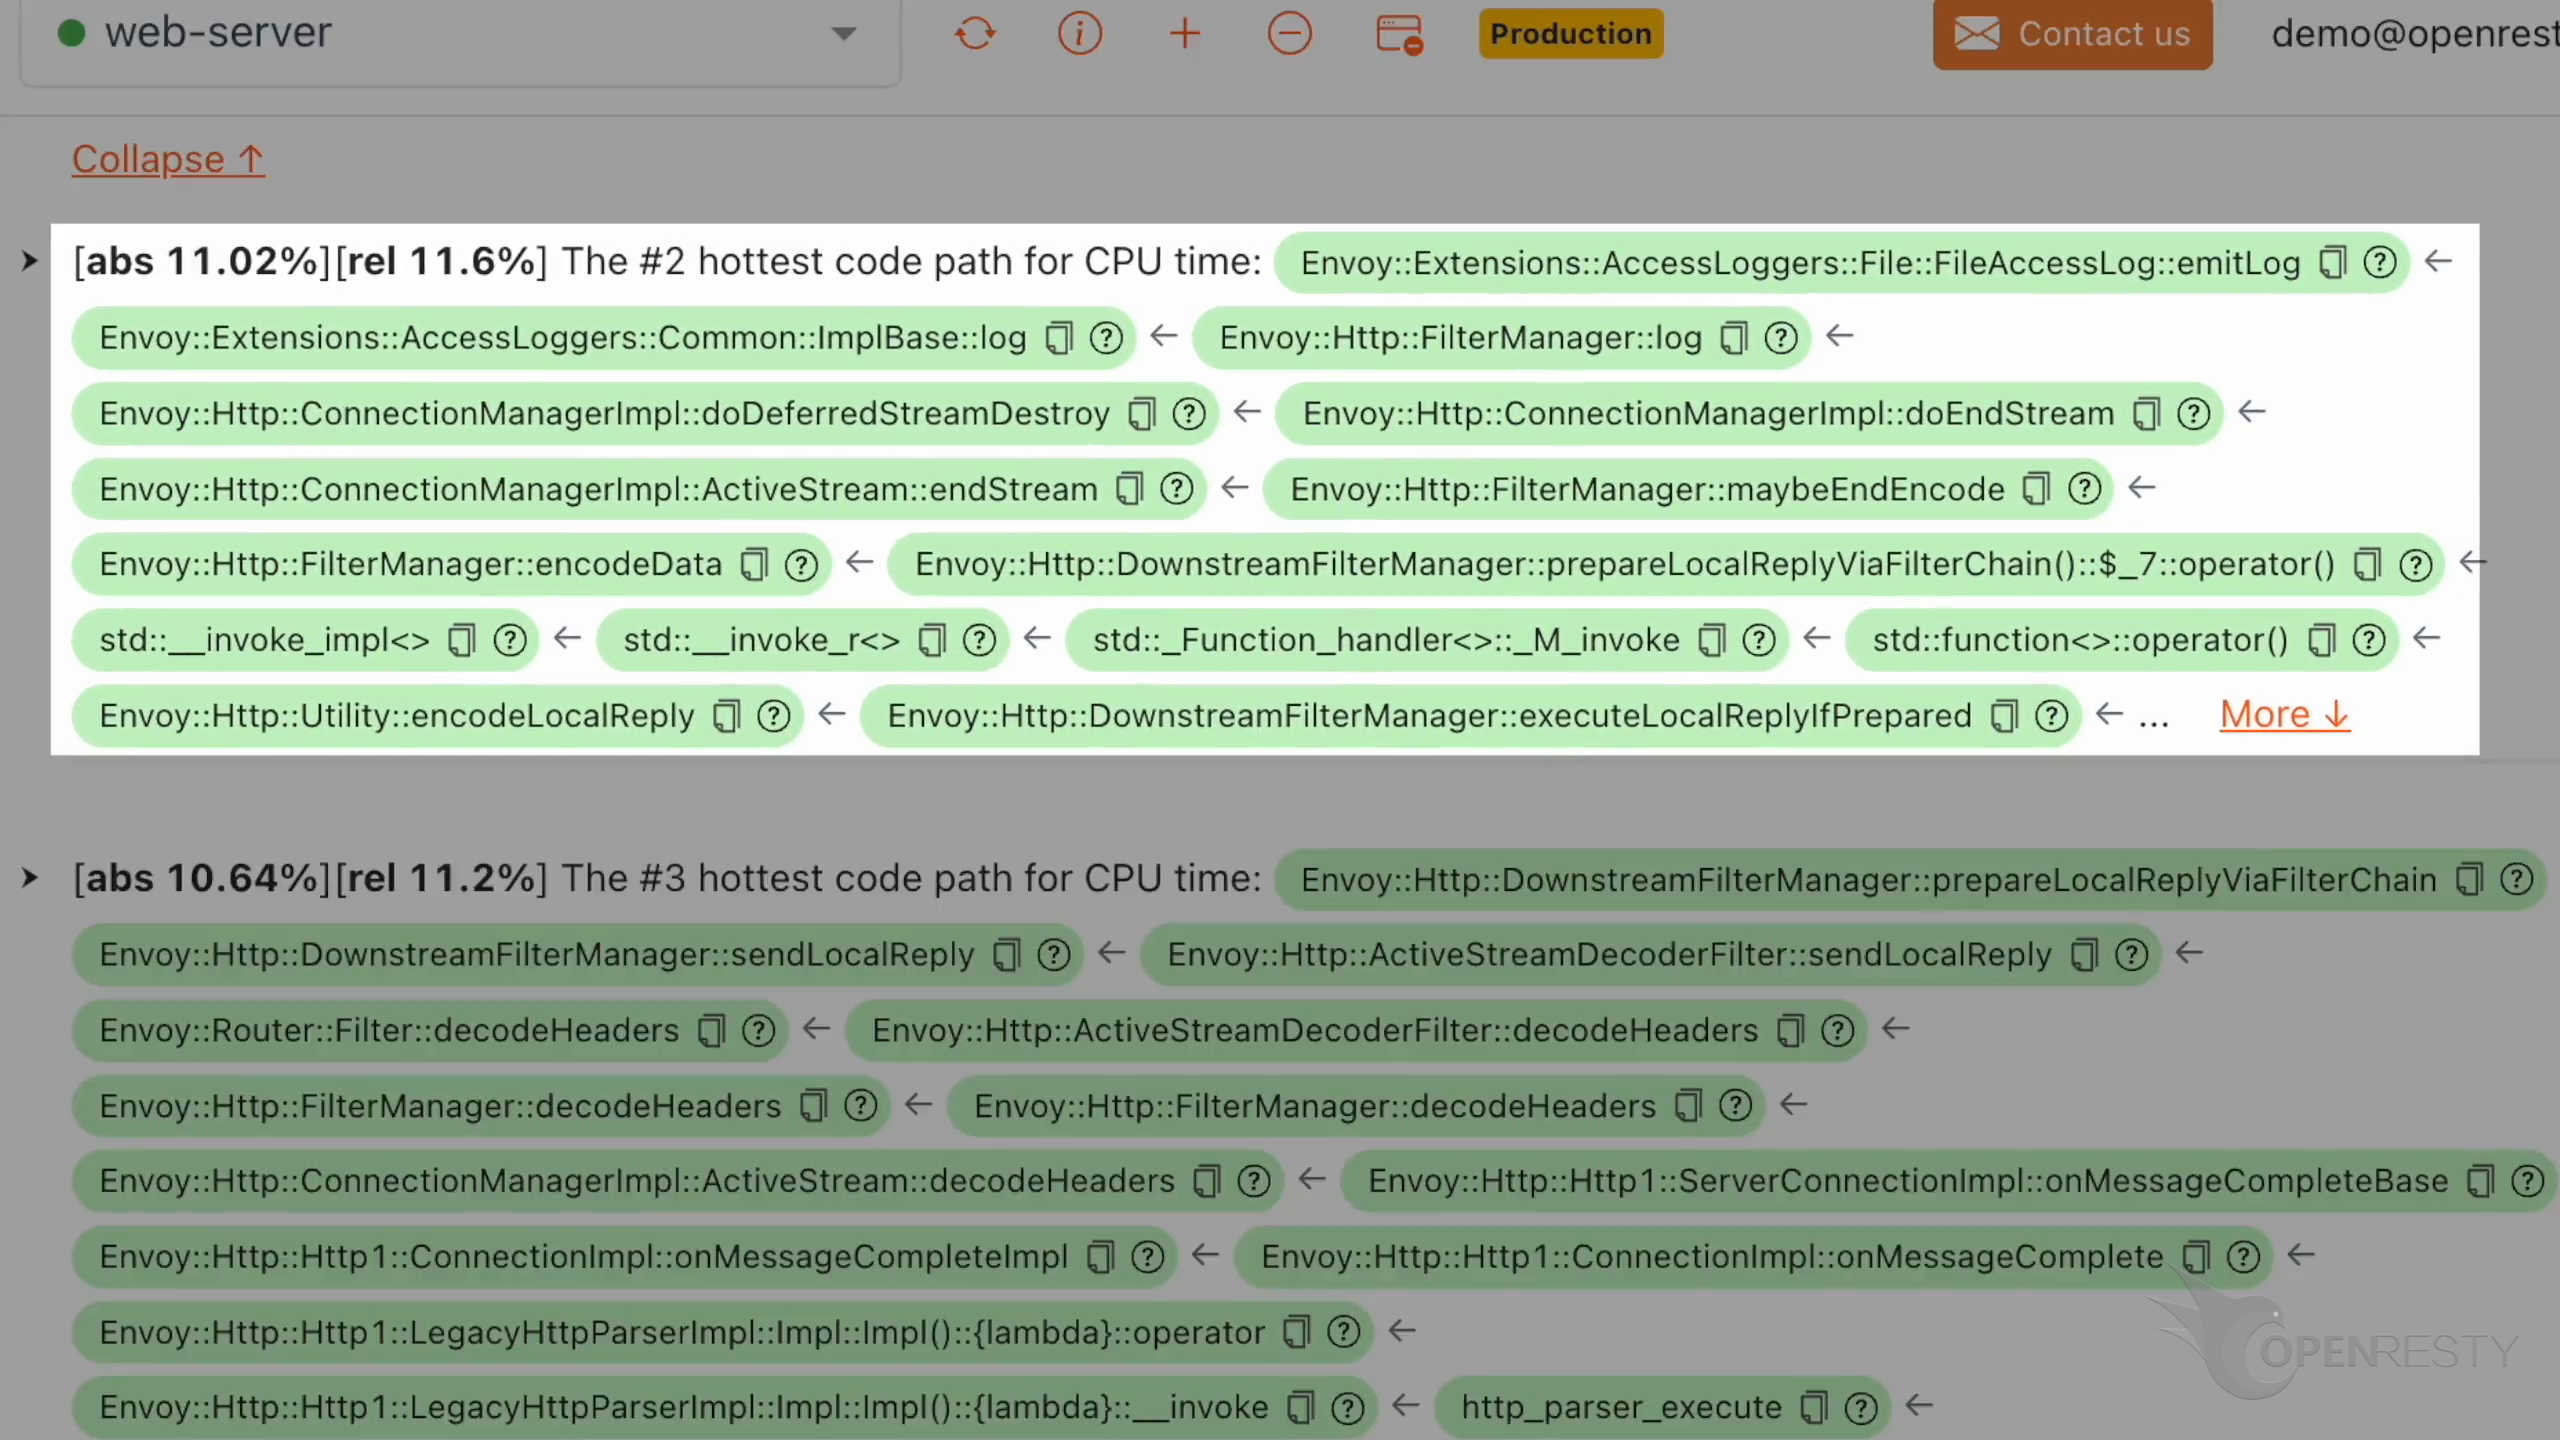
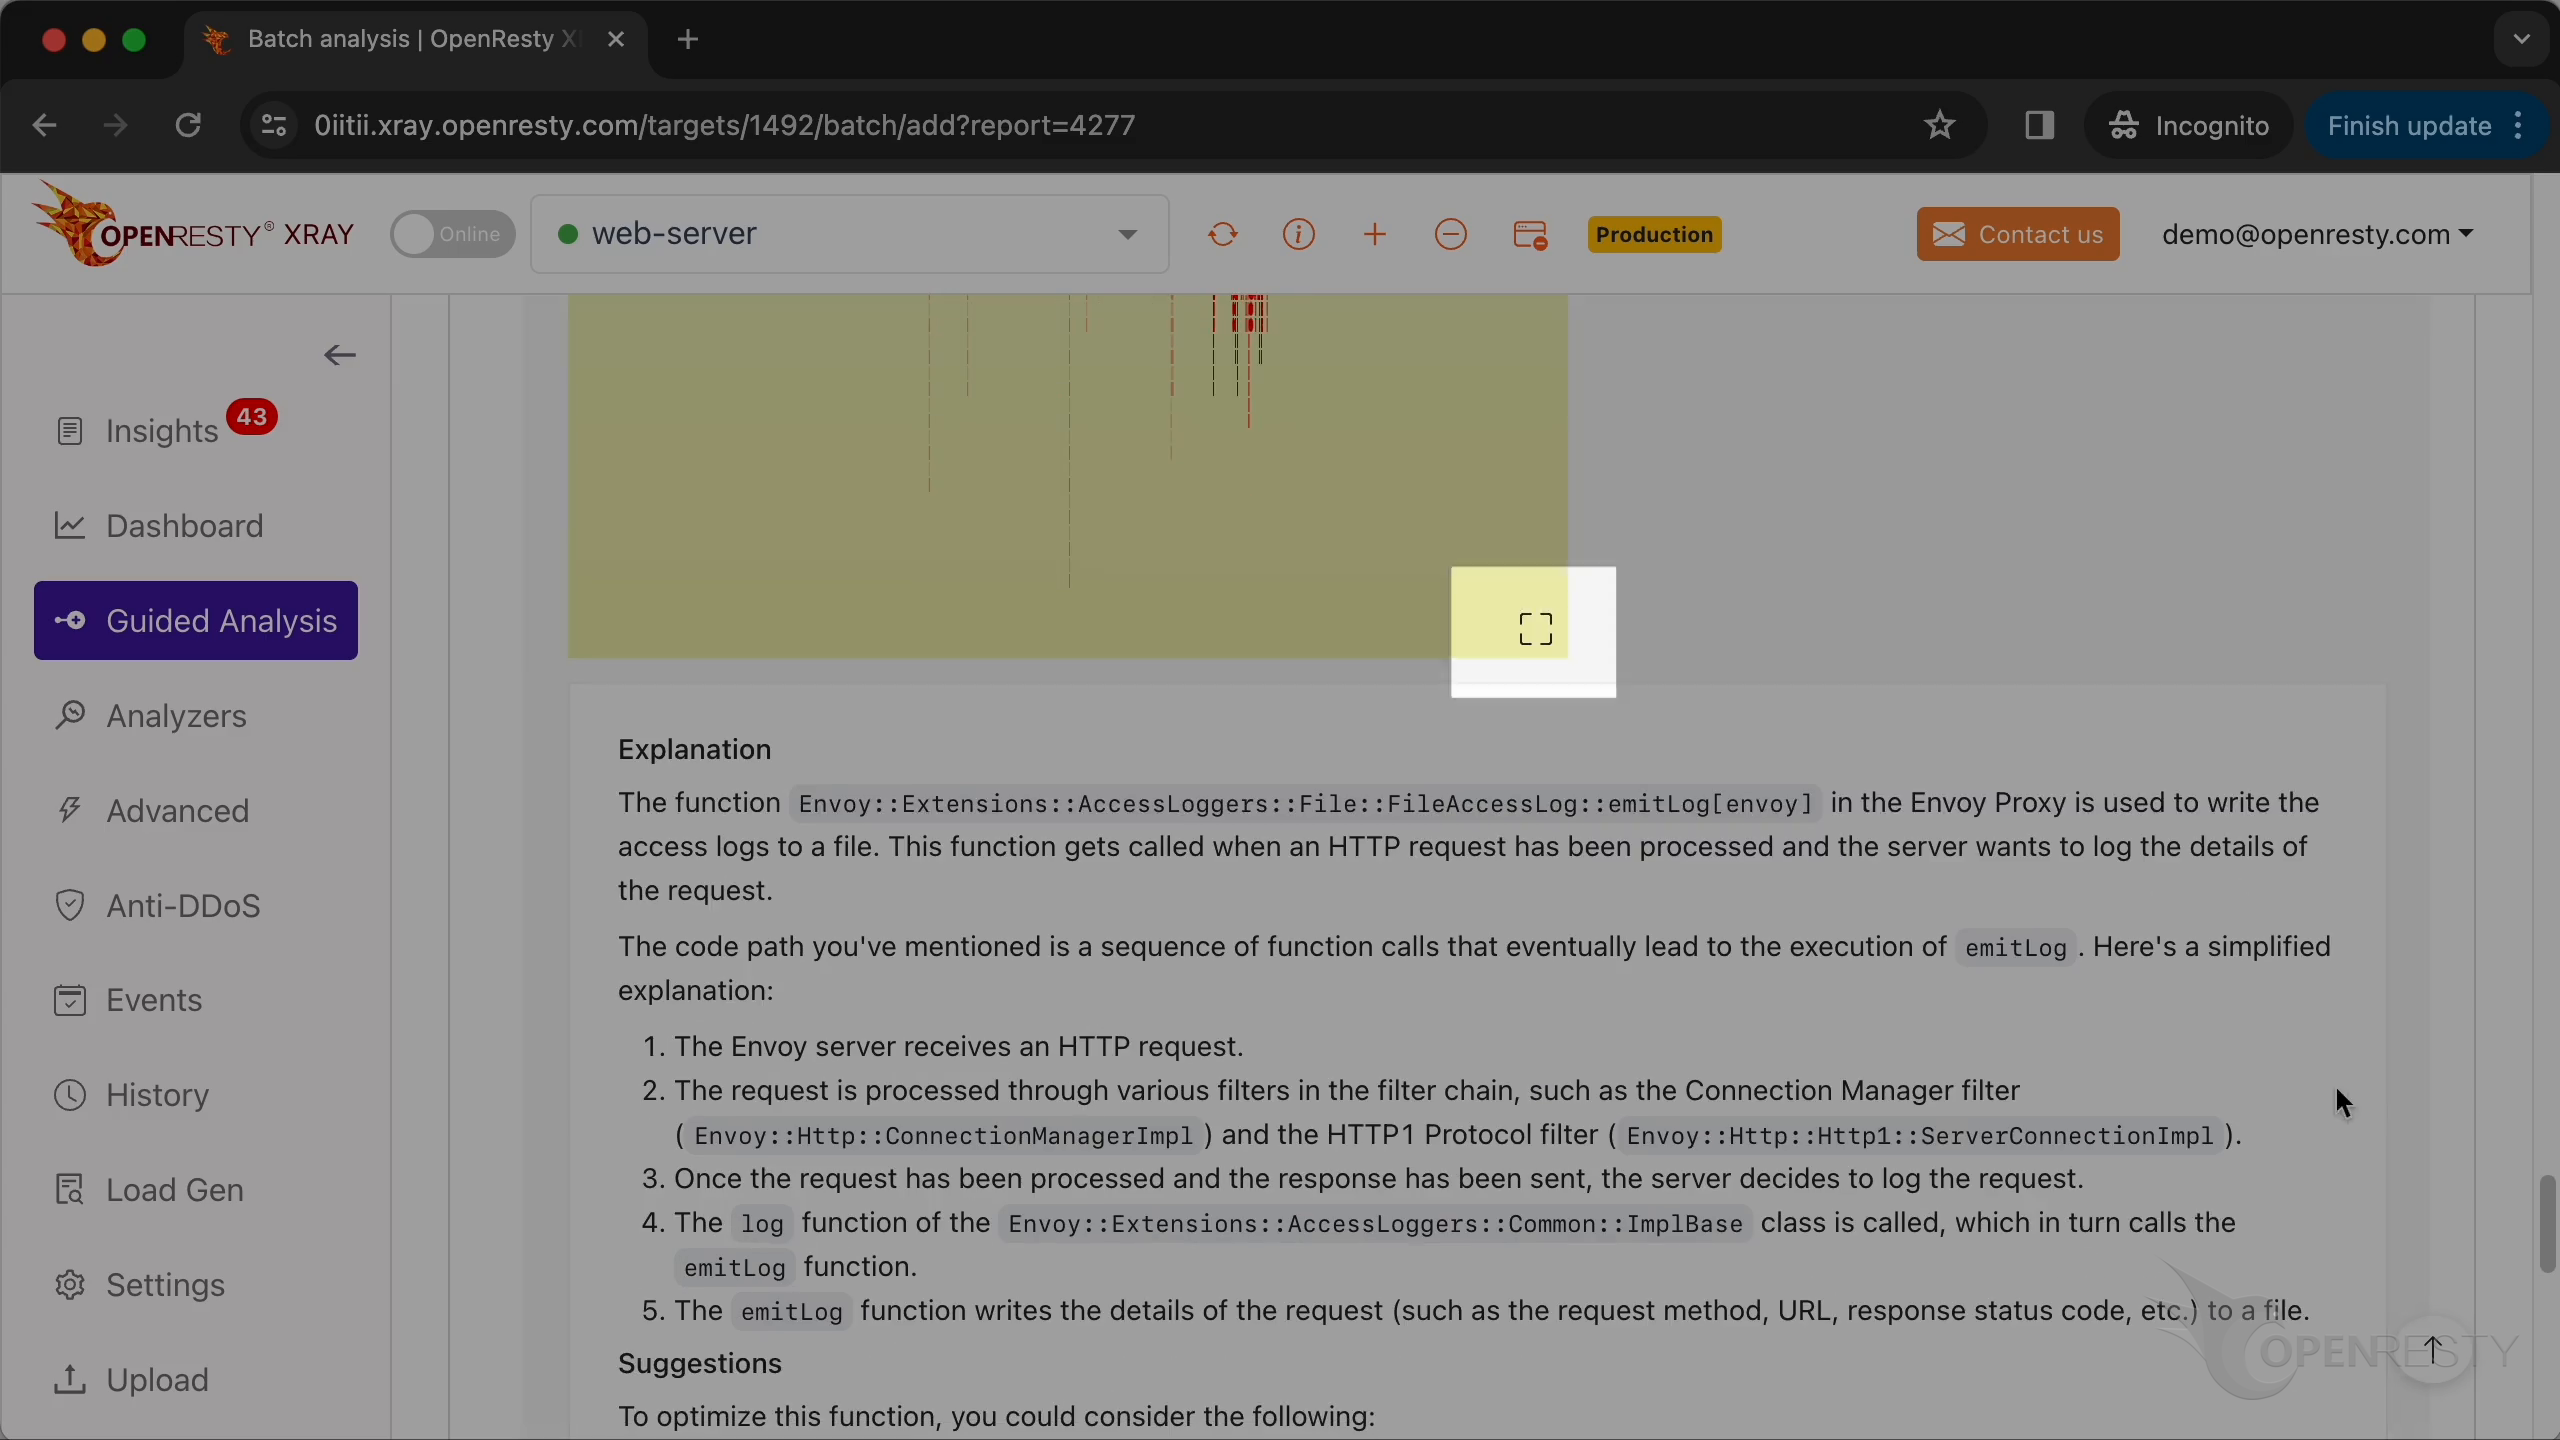
The function emitLog in the Envoy Proxy is used to write the access logs to a file.
Enlarge the flame graph.
Zoom in the emitLog function.
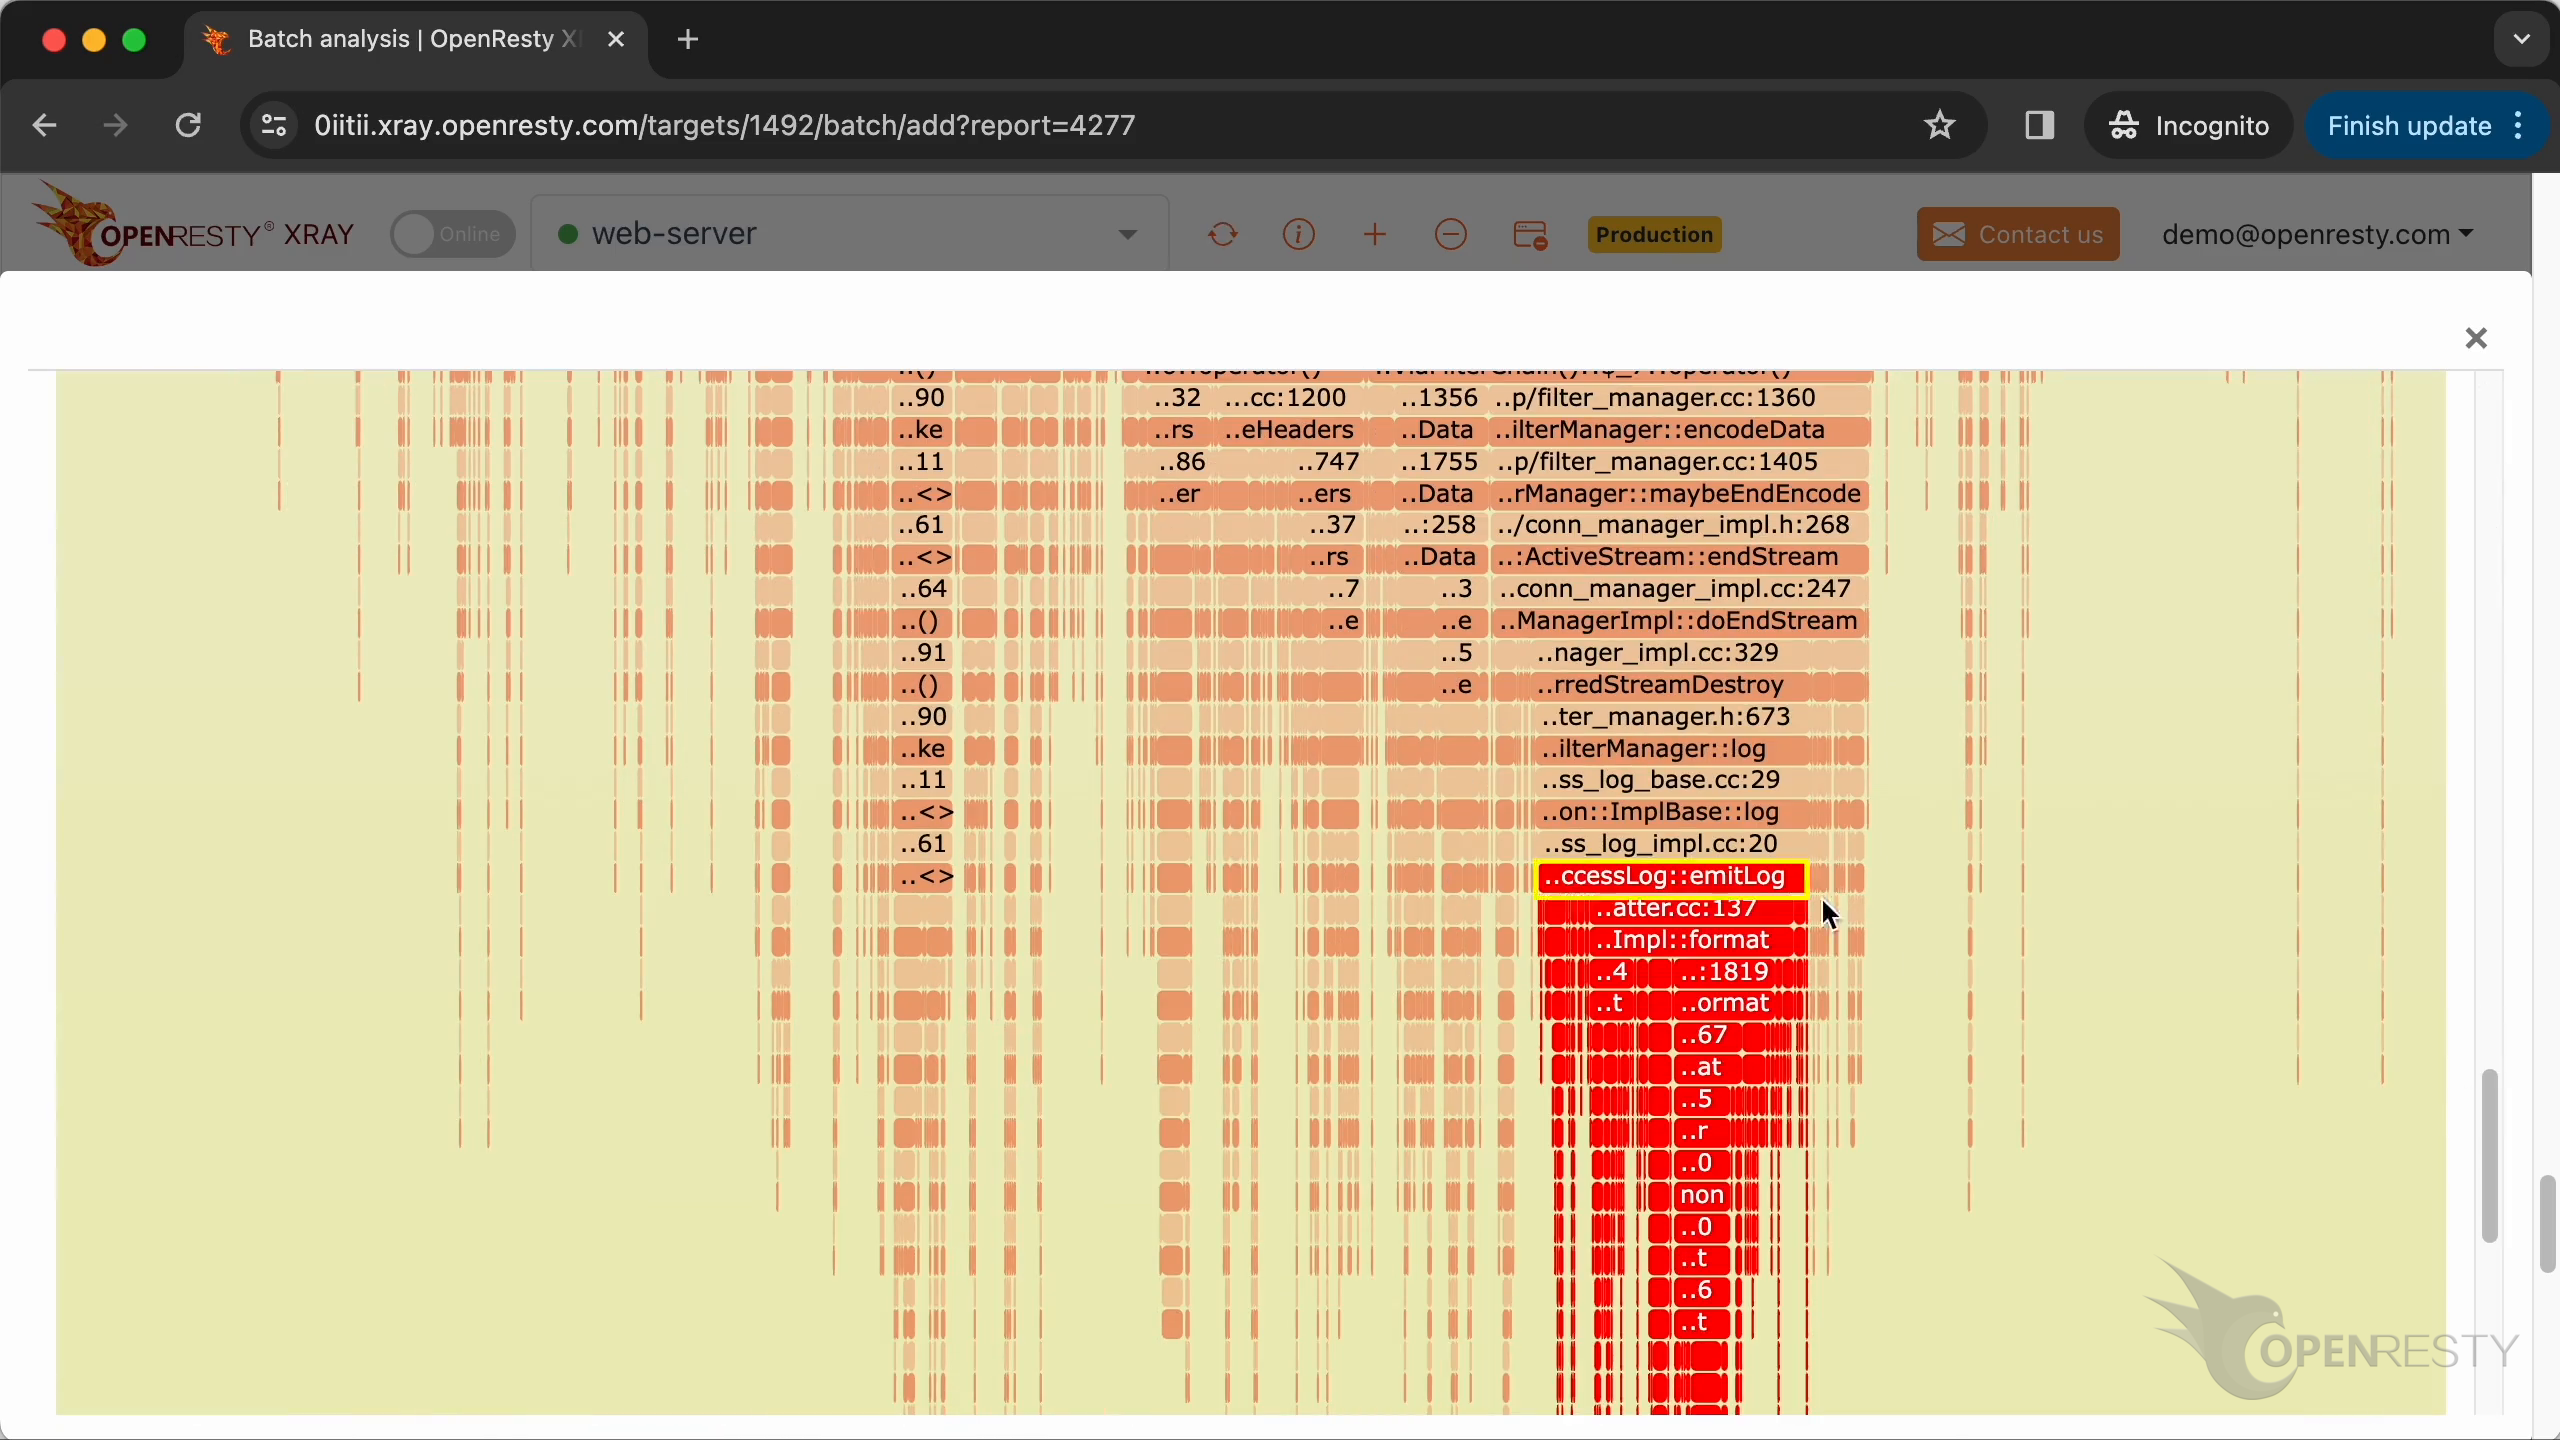
Most of the emitLog CPU time is spent formatting the log message string, not on writing file operations.
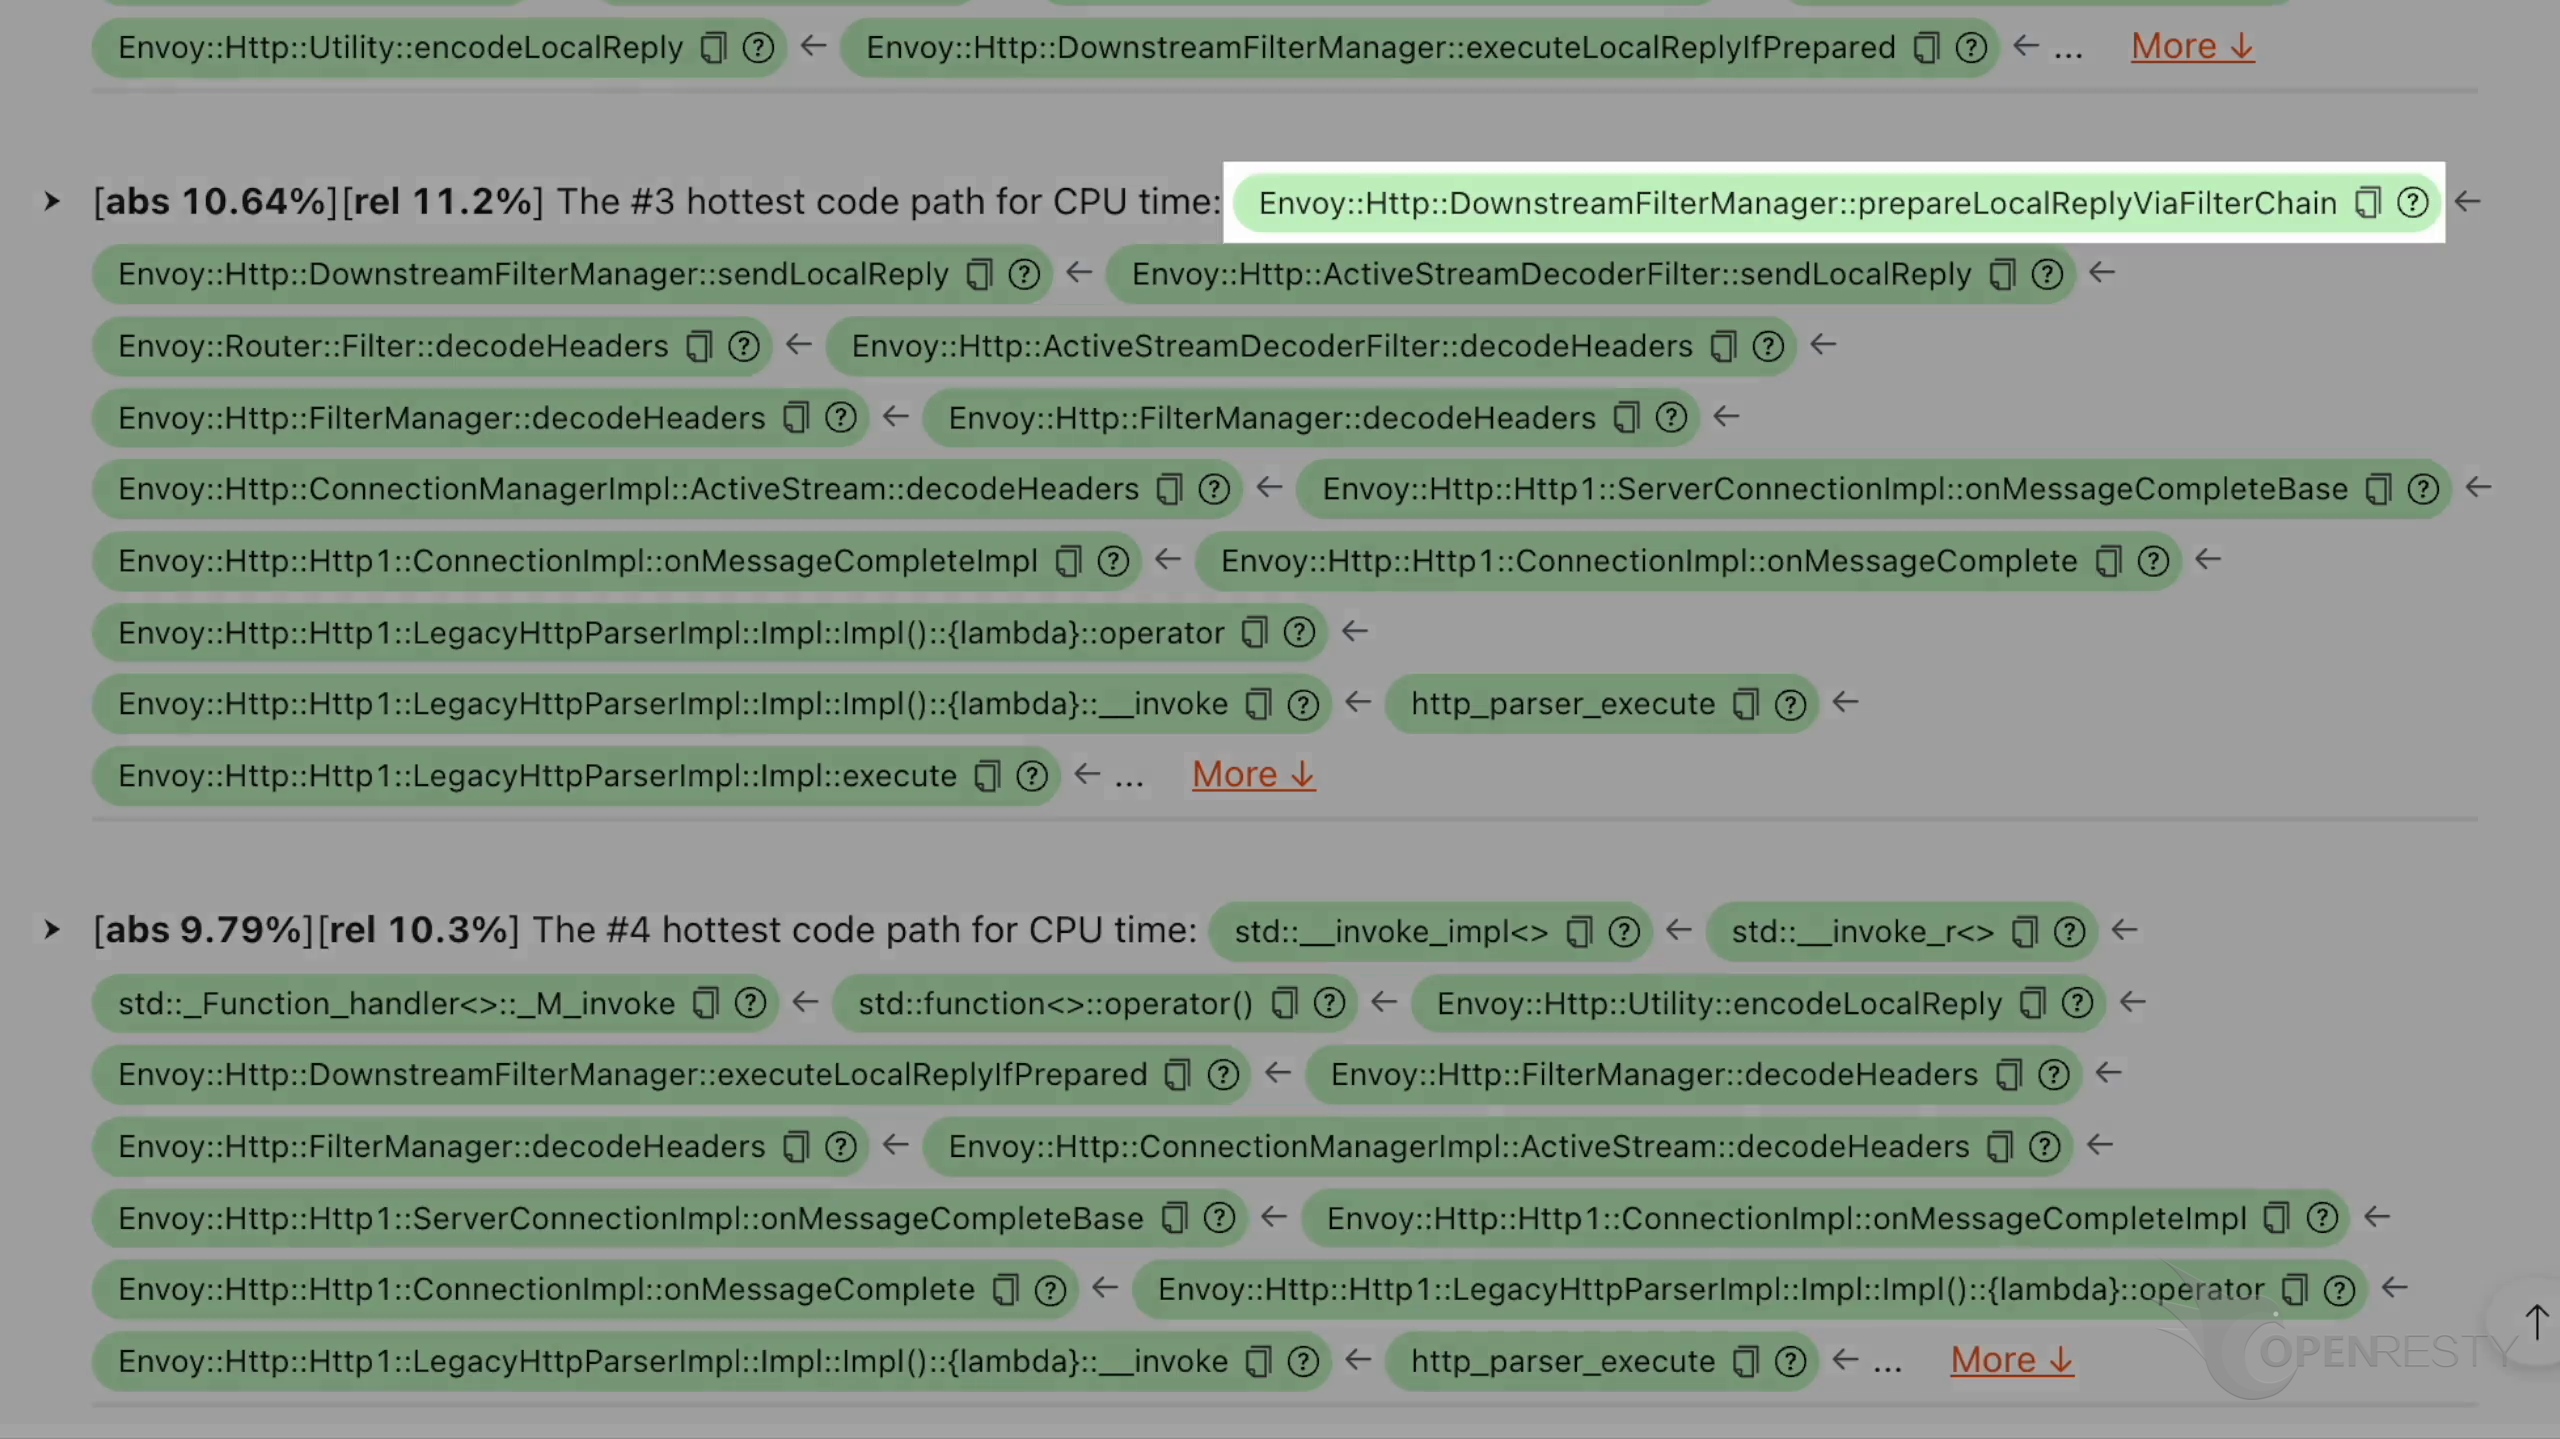
#3 Hot Path — prepareLocalReplayViaFilterChain
Here is the third hottest code path that costs the most CPU time.
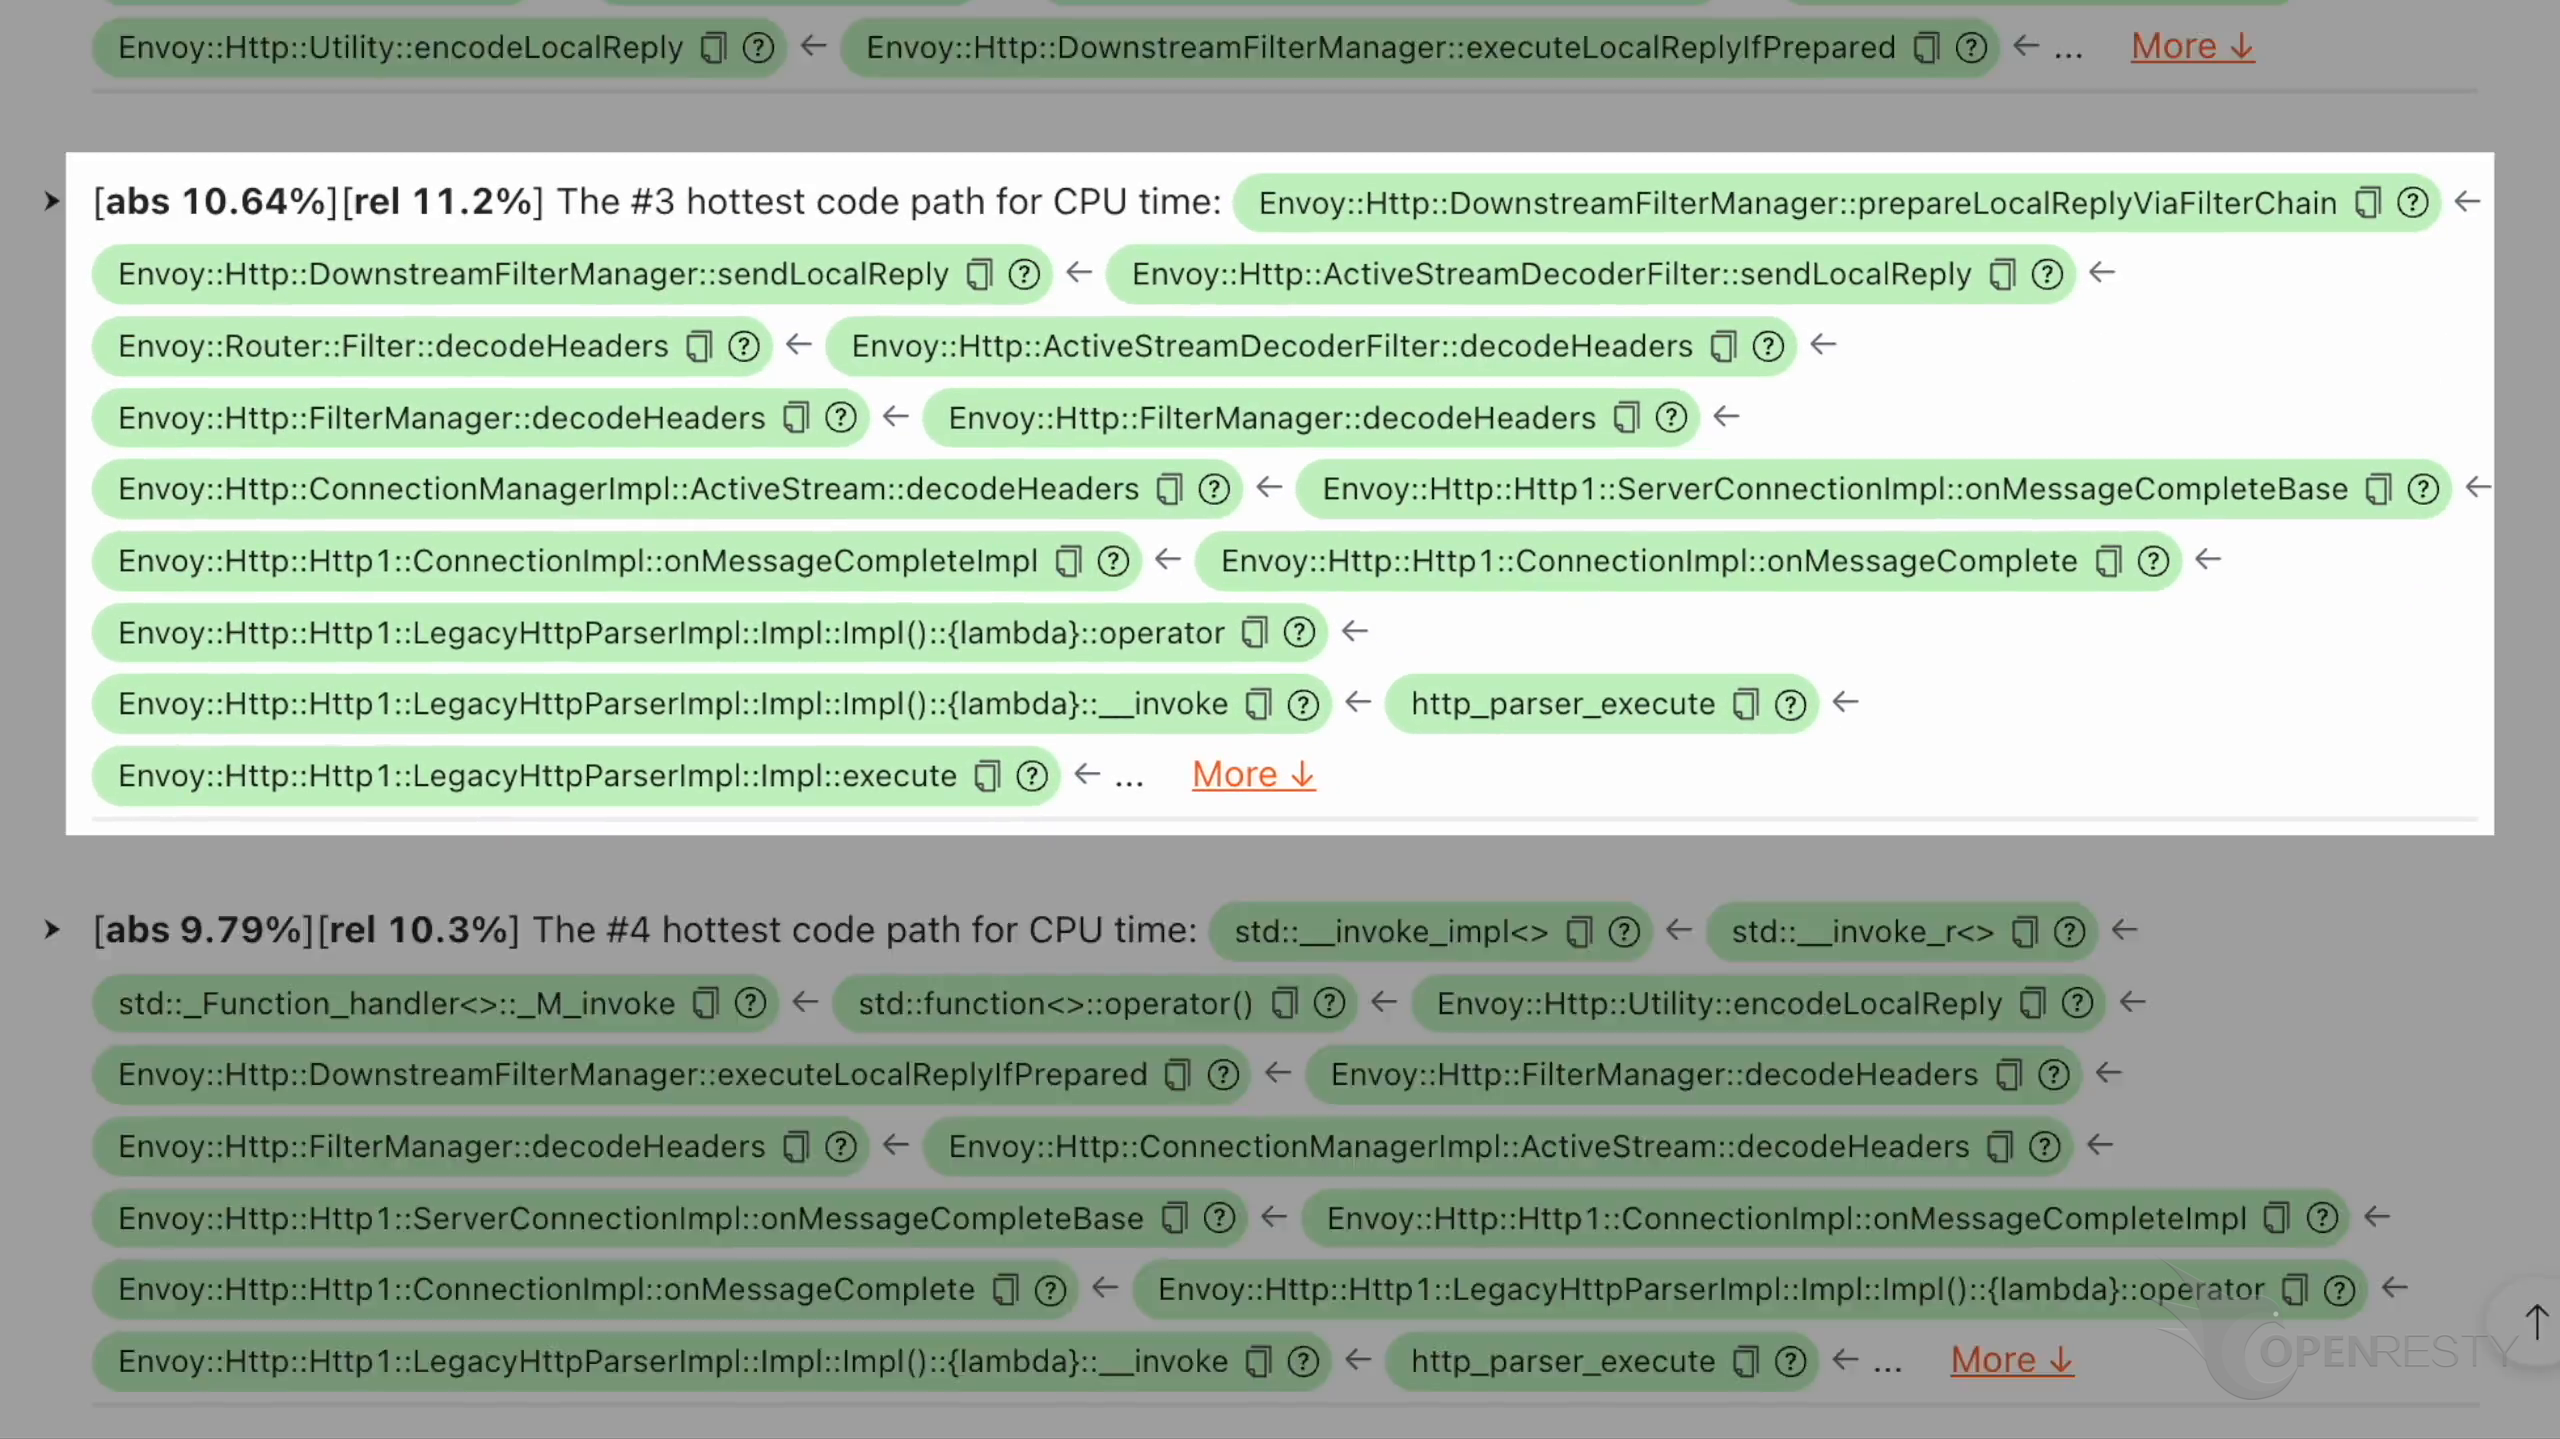
This prepareLocalReplayViaFilterChain function is in the chain of Envoy response output filters. Each filter in the chain has the potential to modify the response.
Enlarge the flame graph.
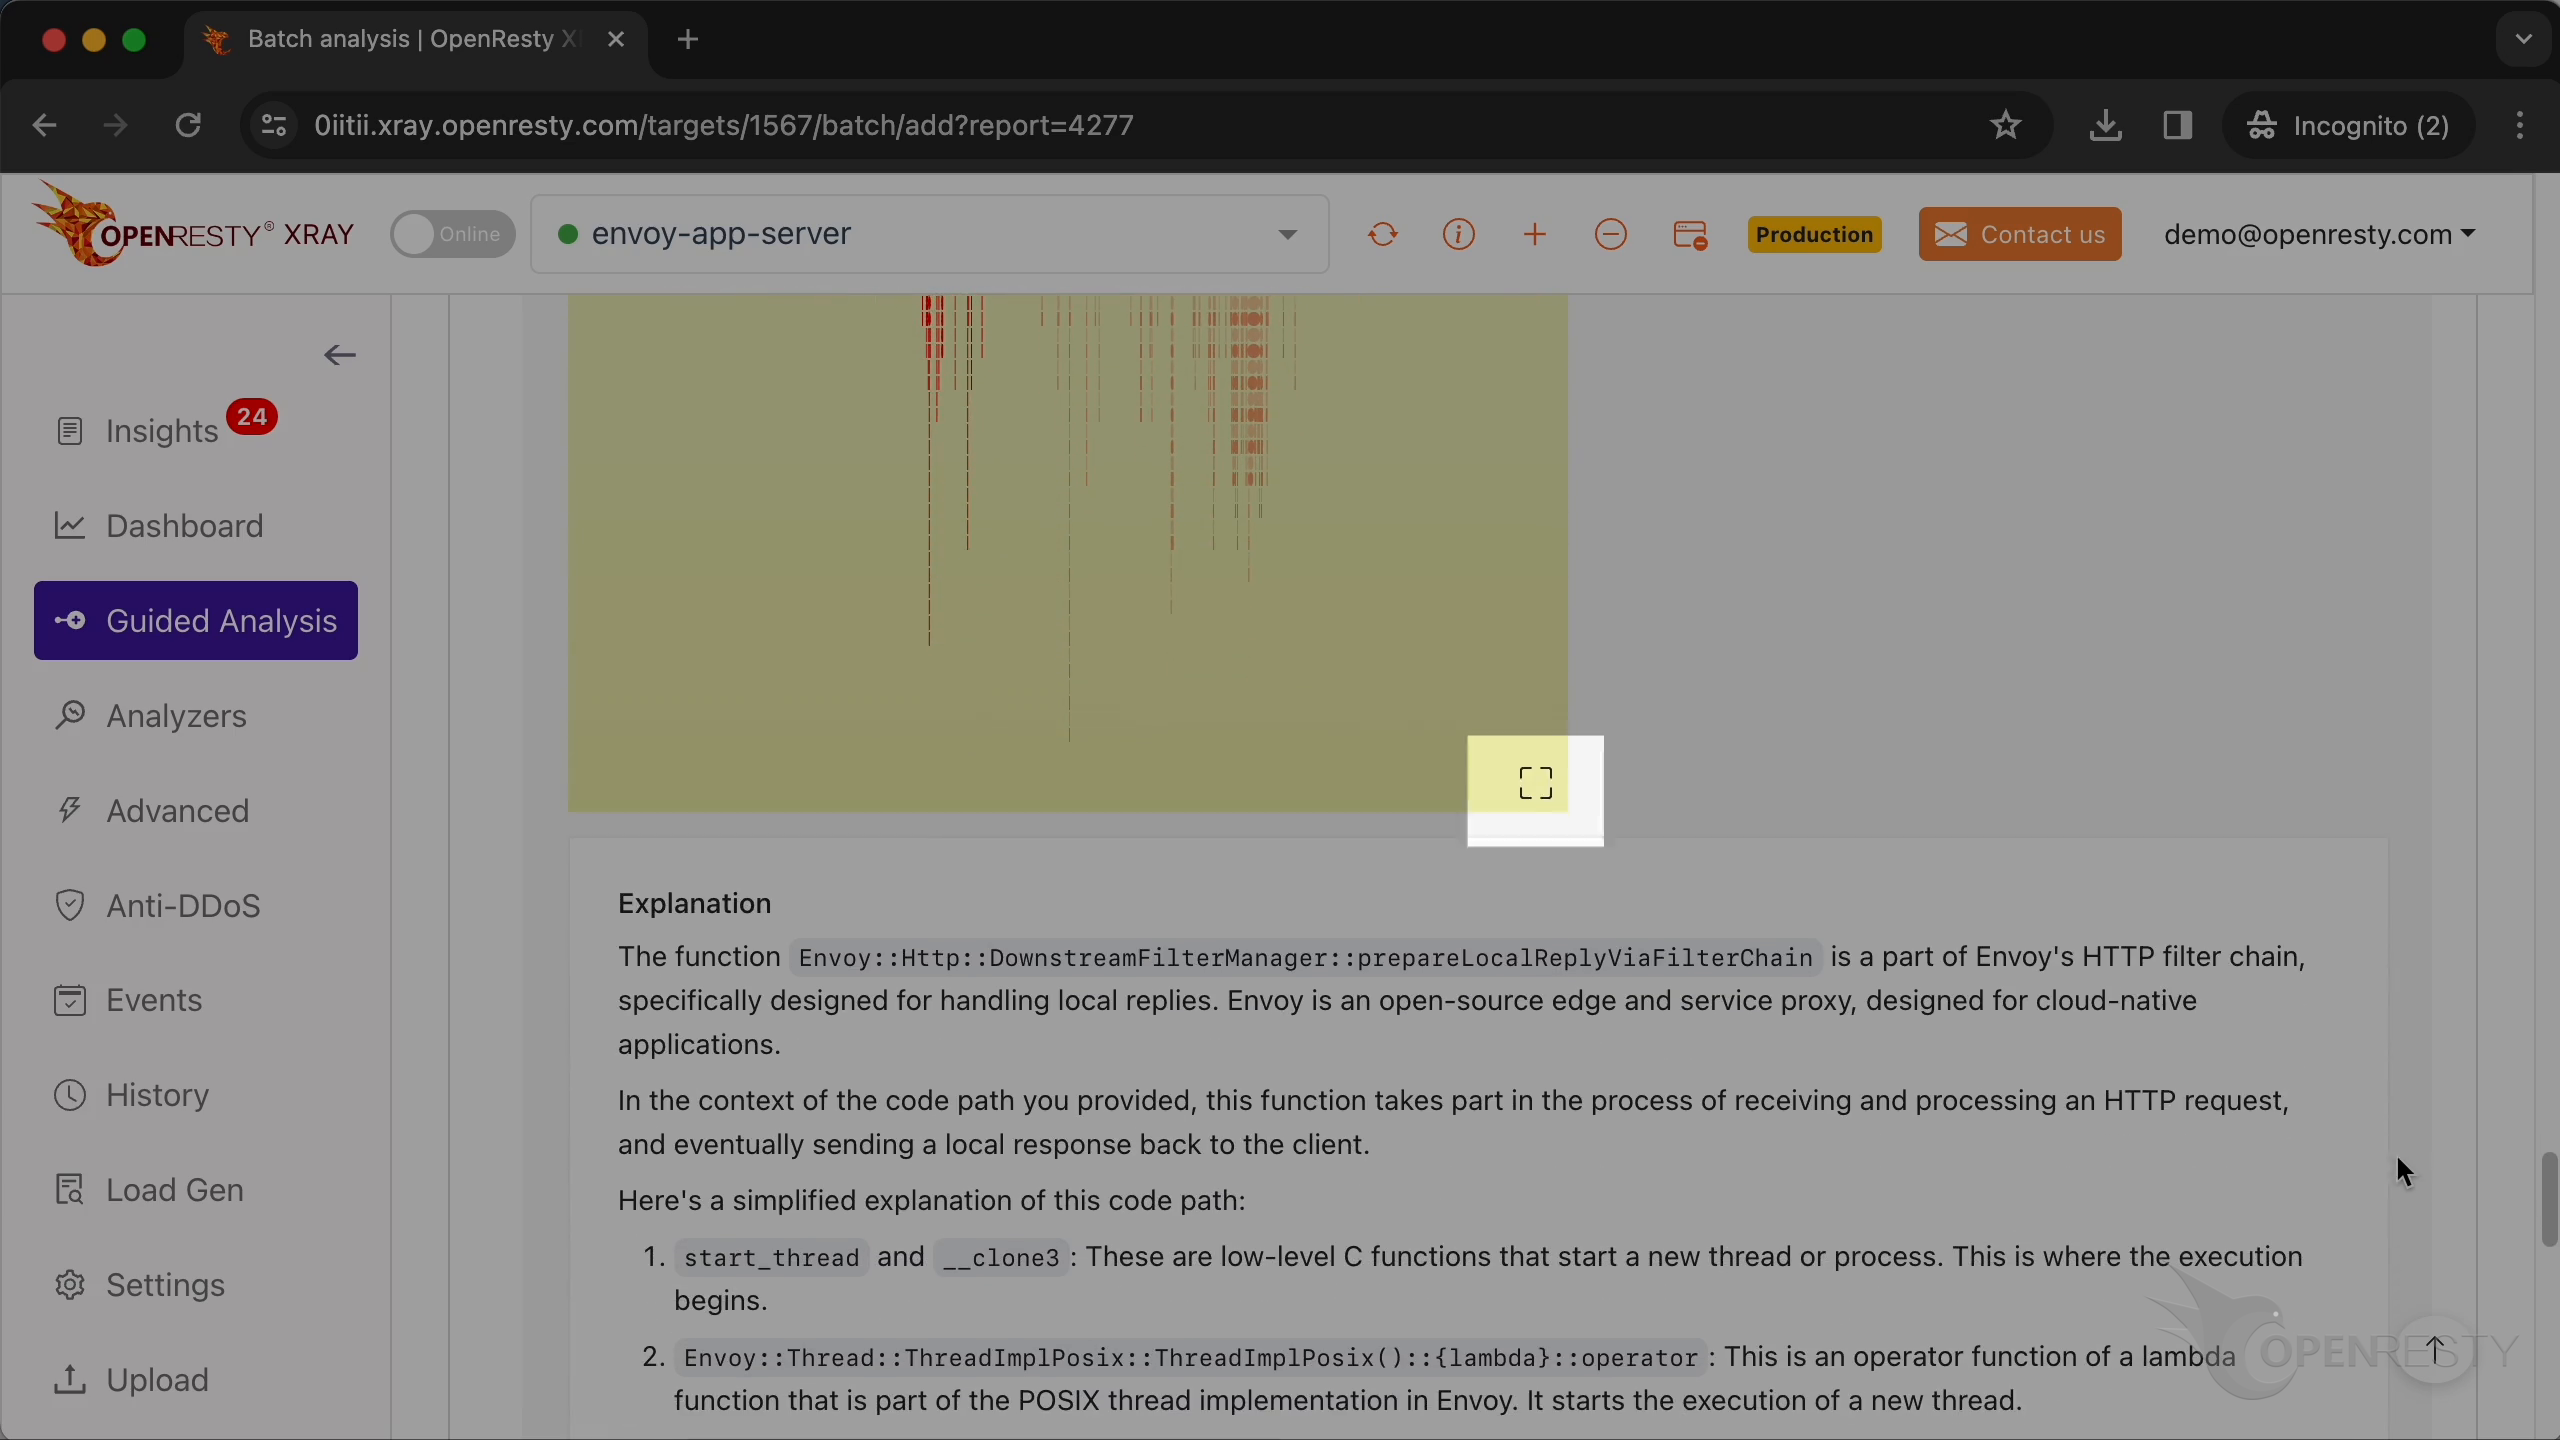
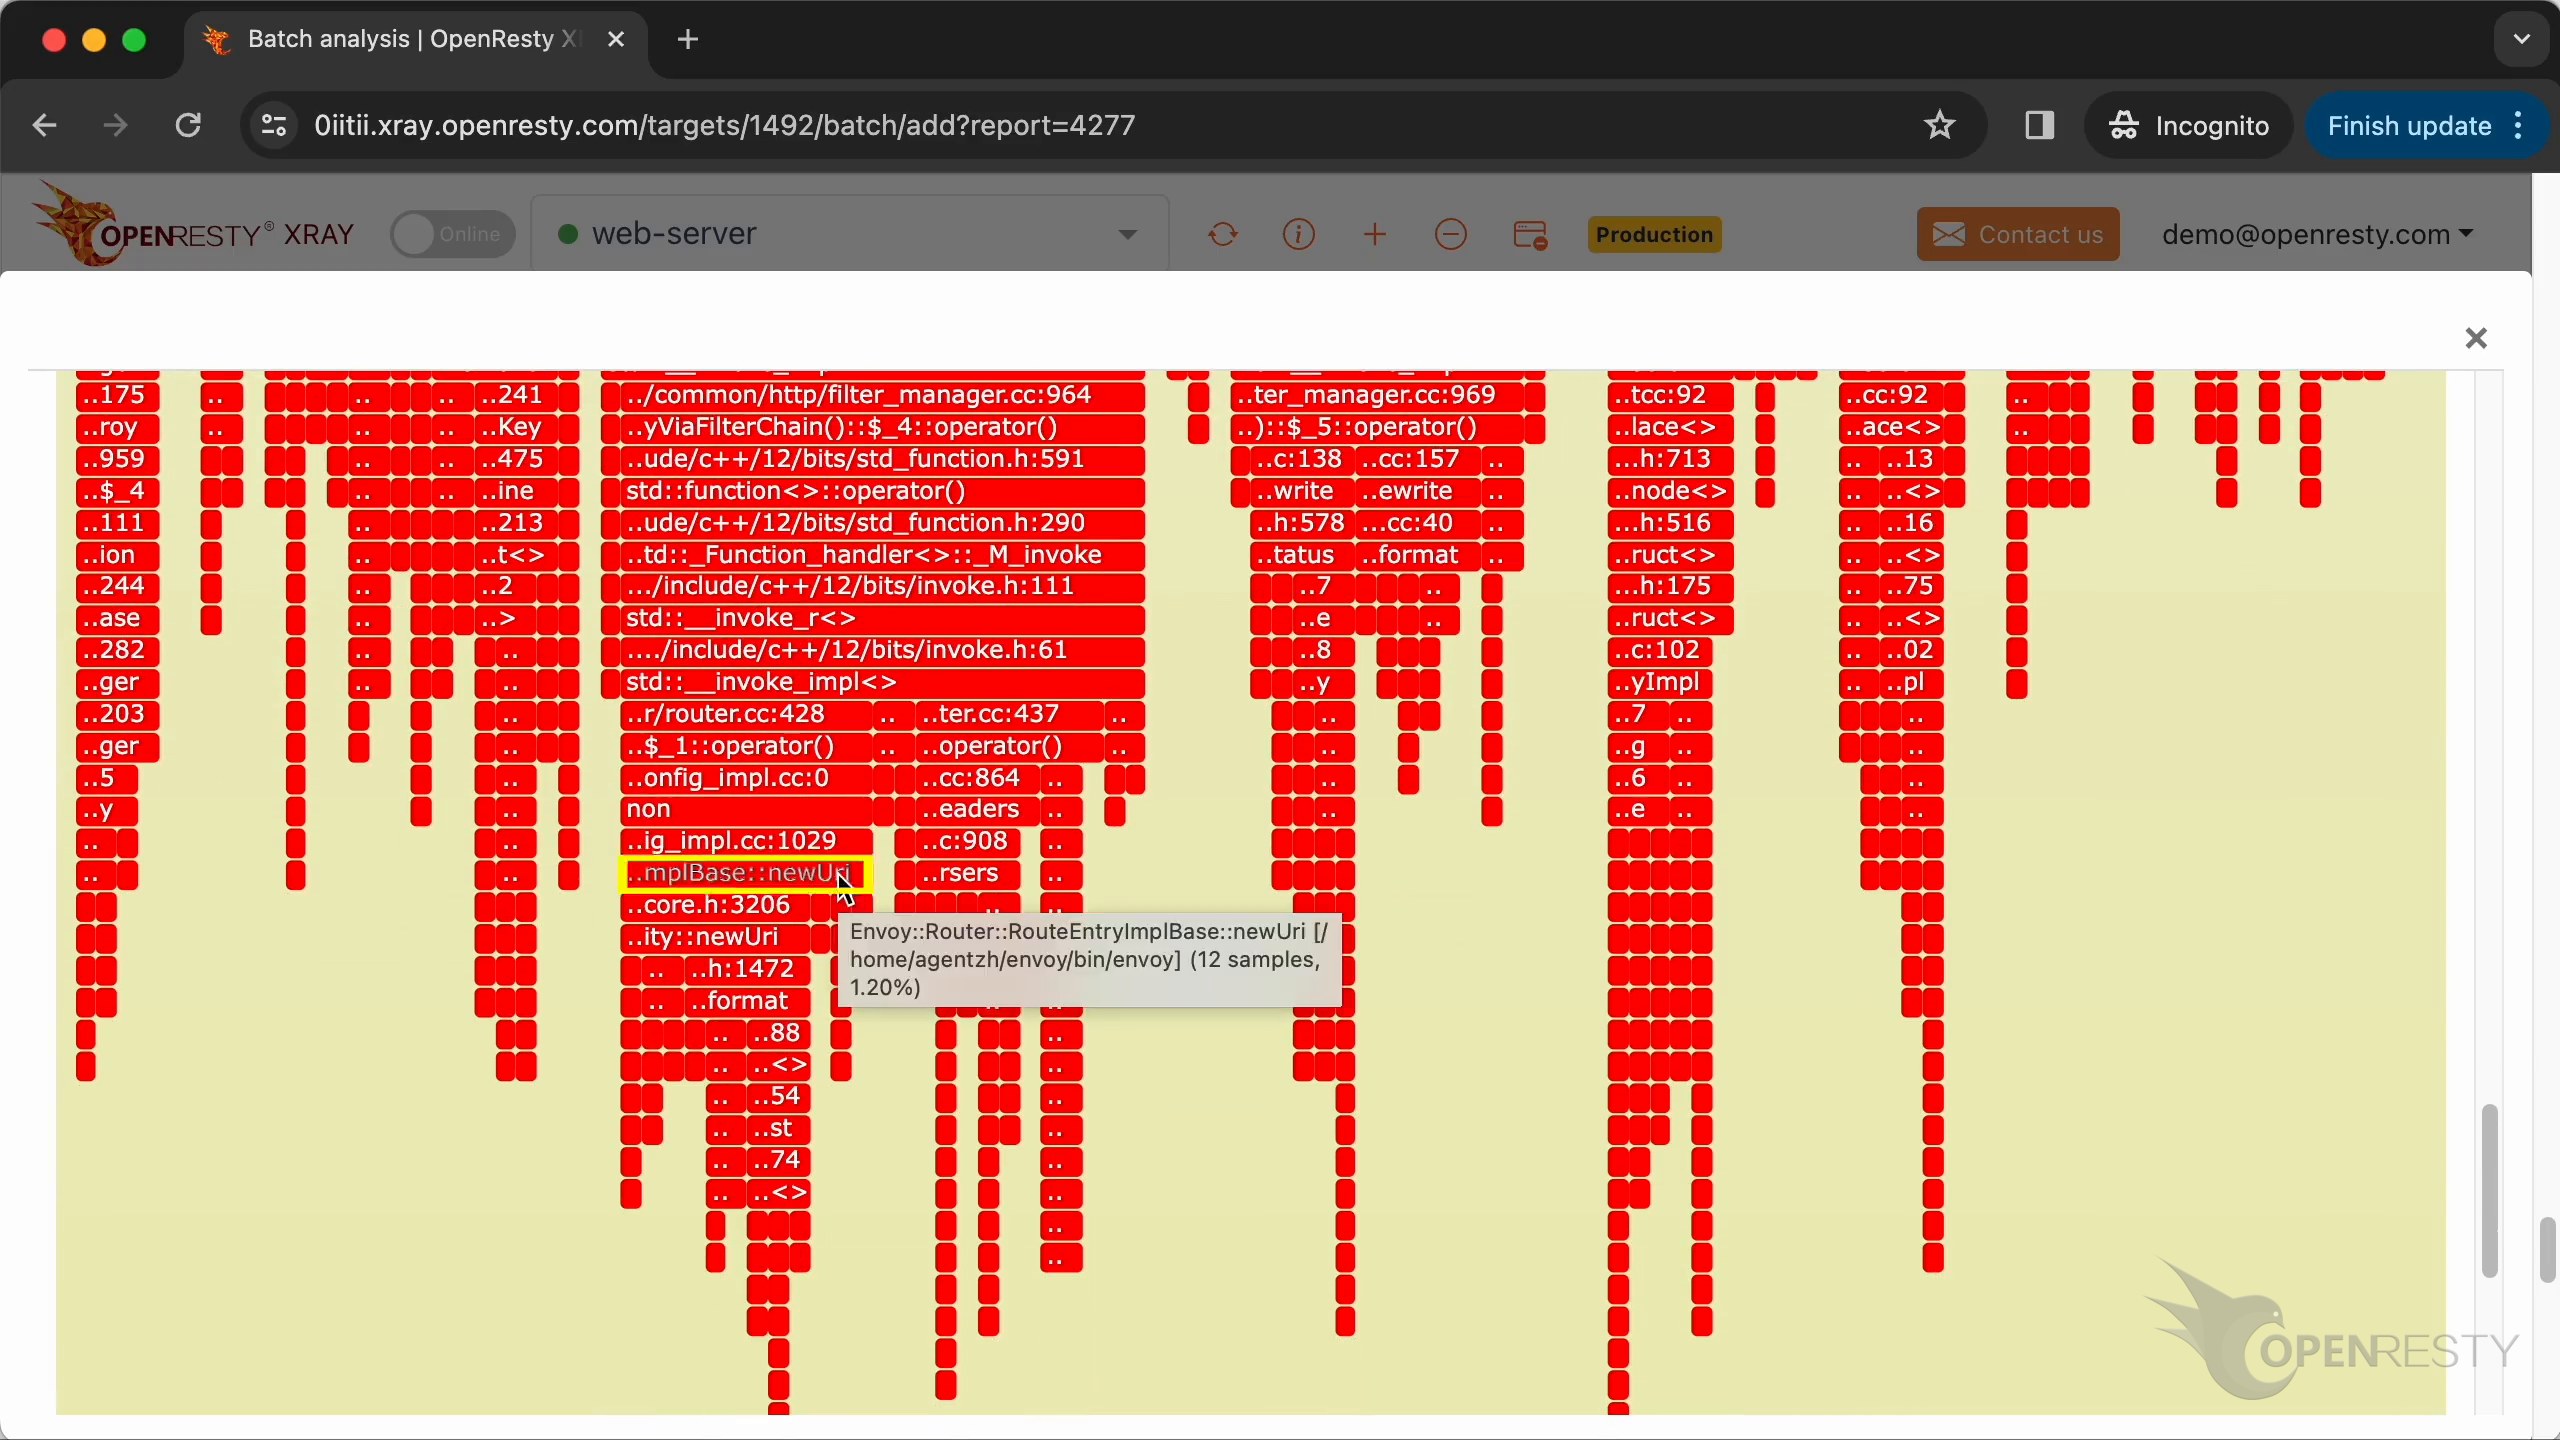
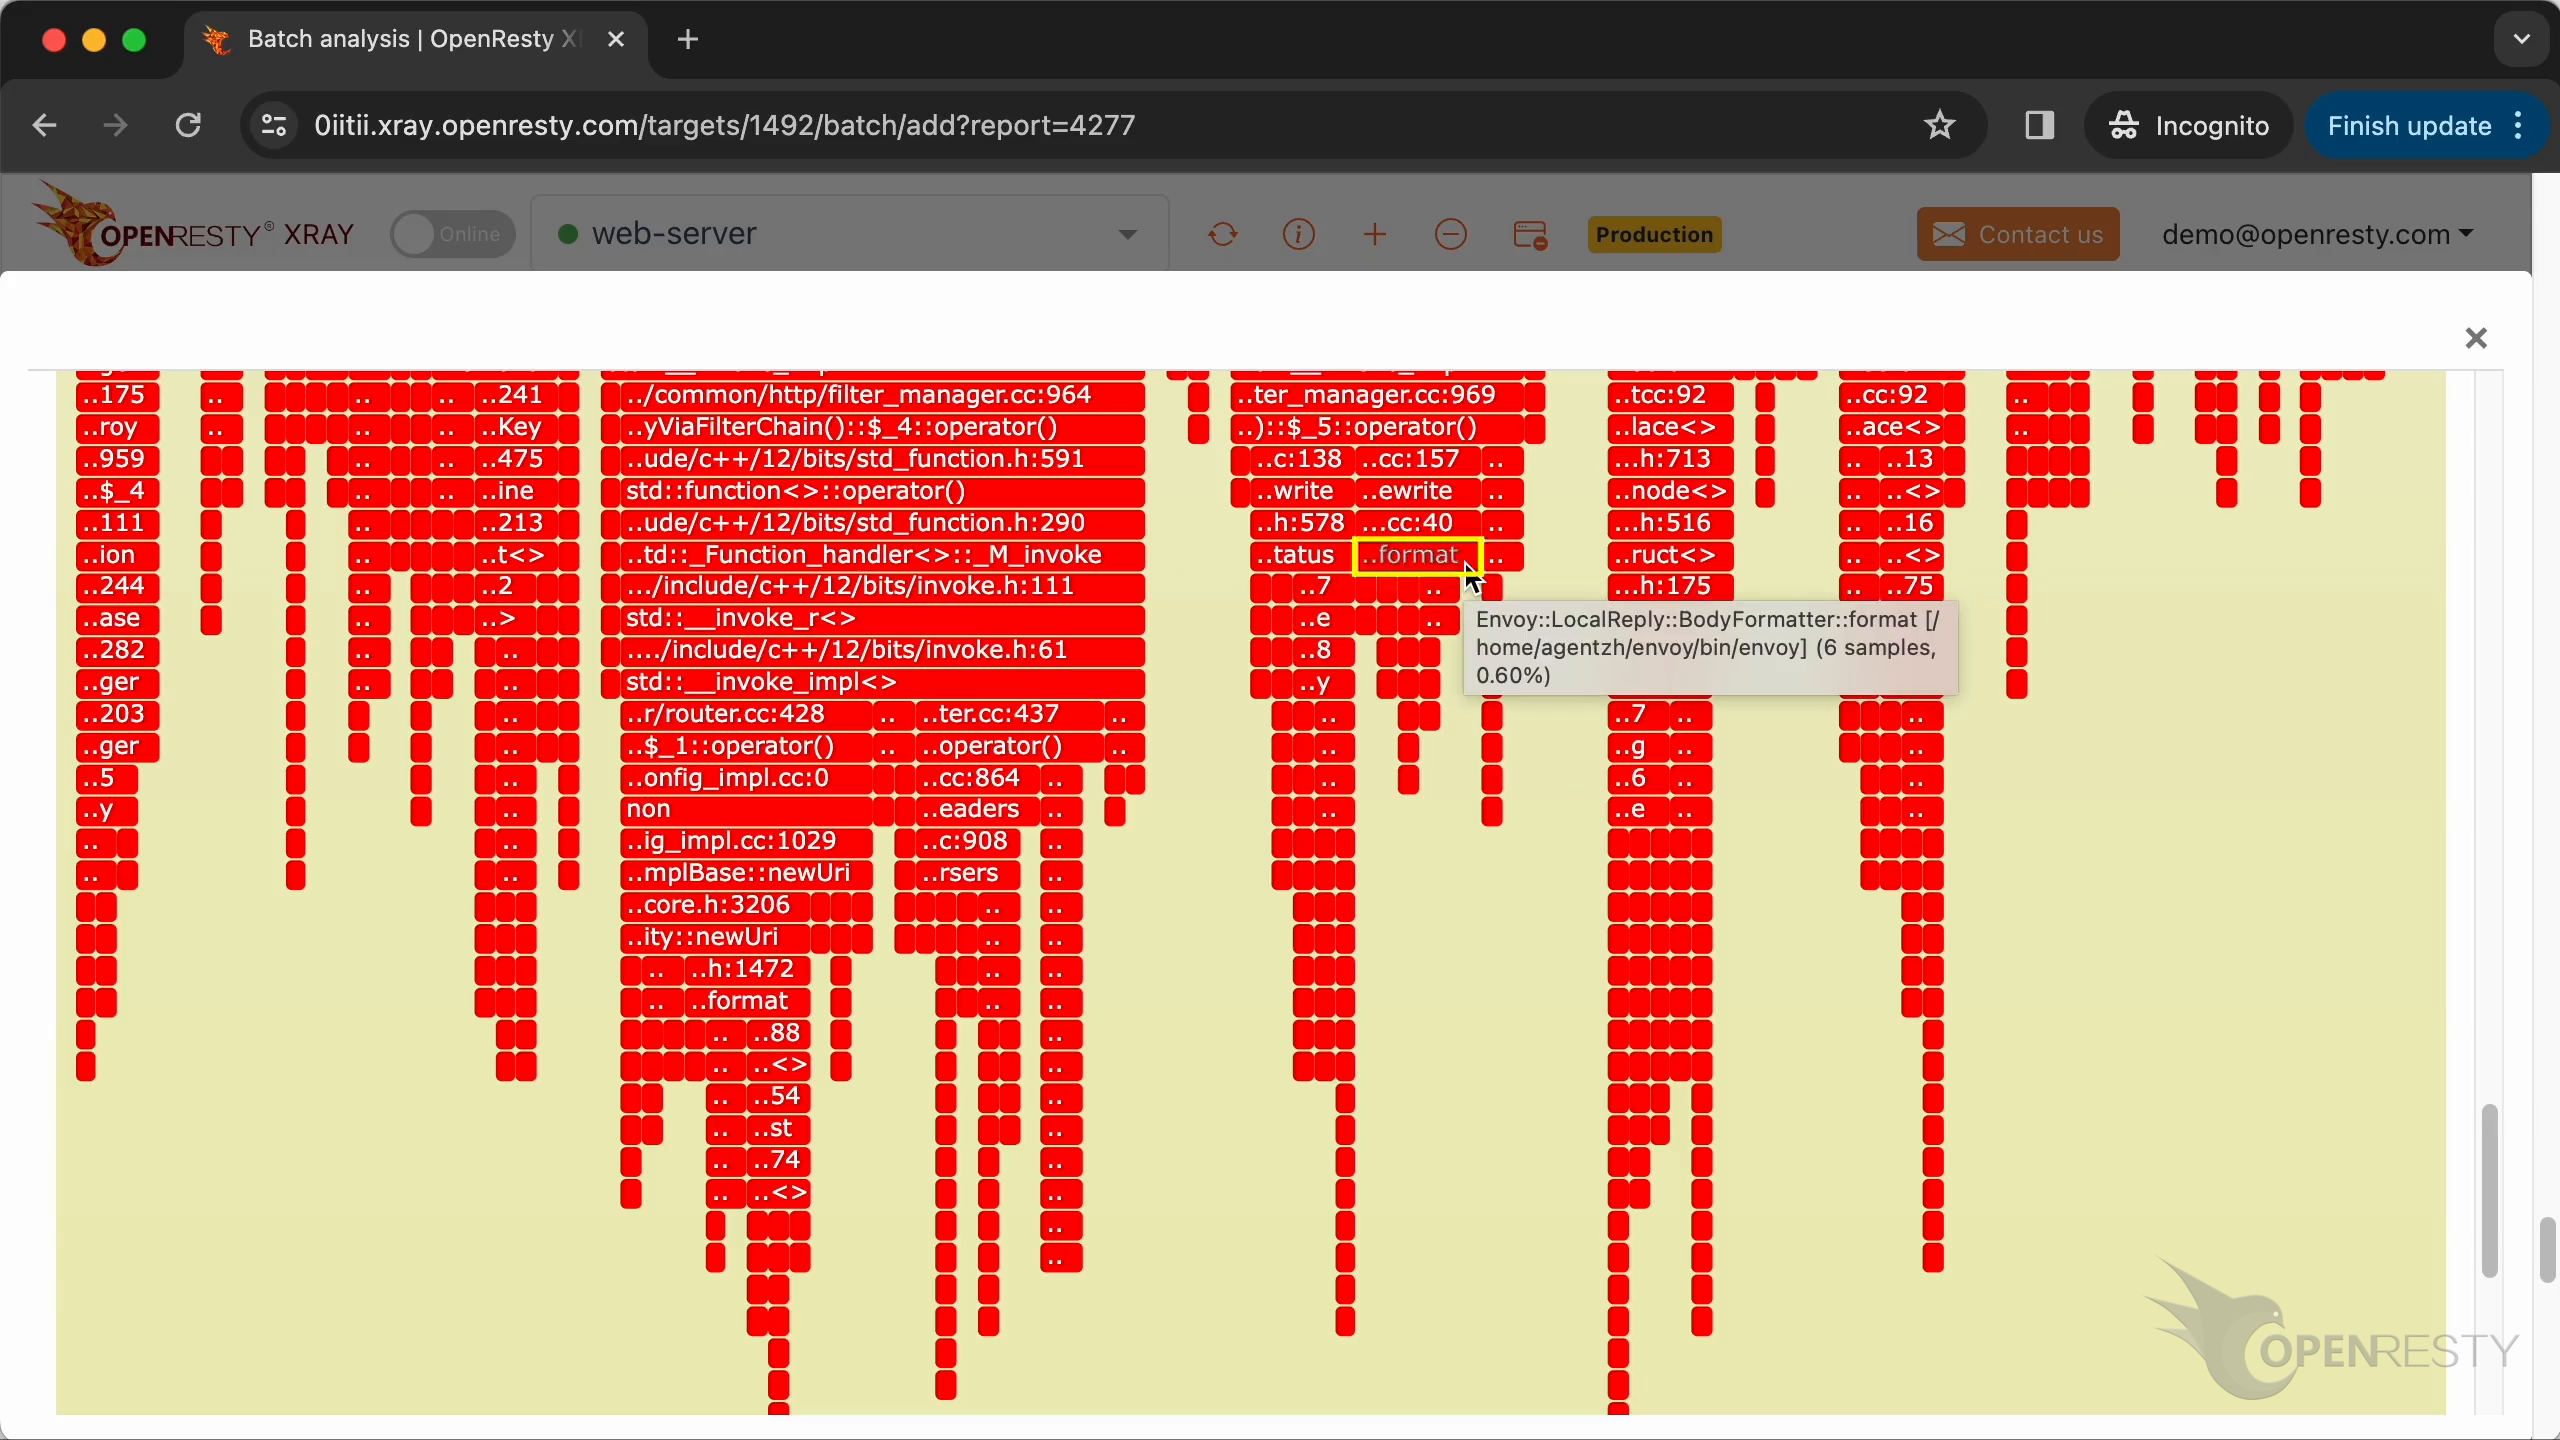
Zoom in the prepareLocalReplayViaFilterChain function.
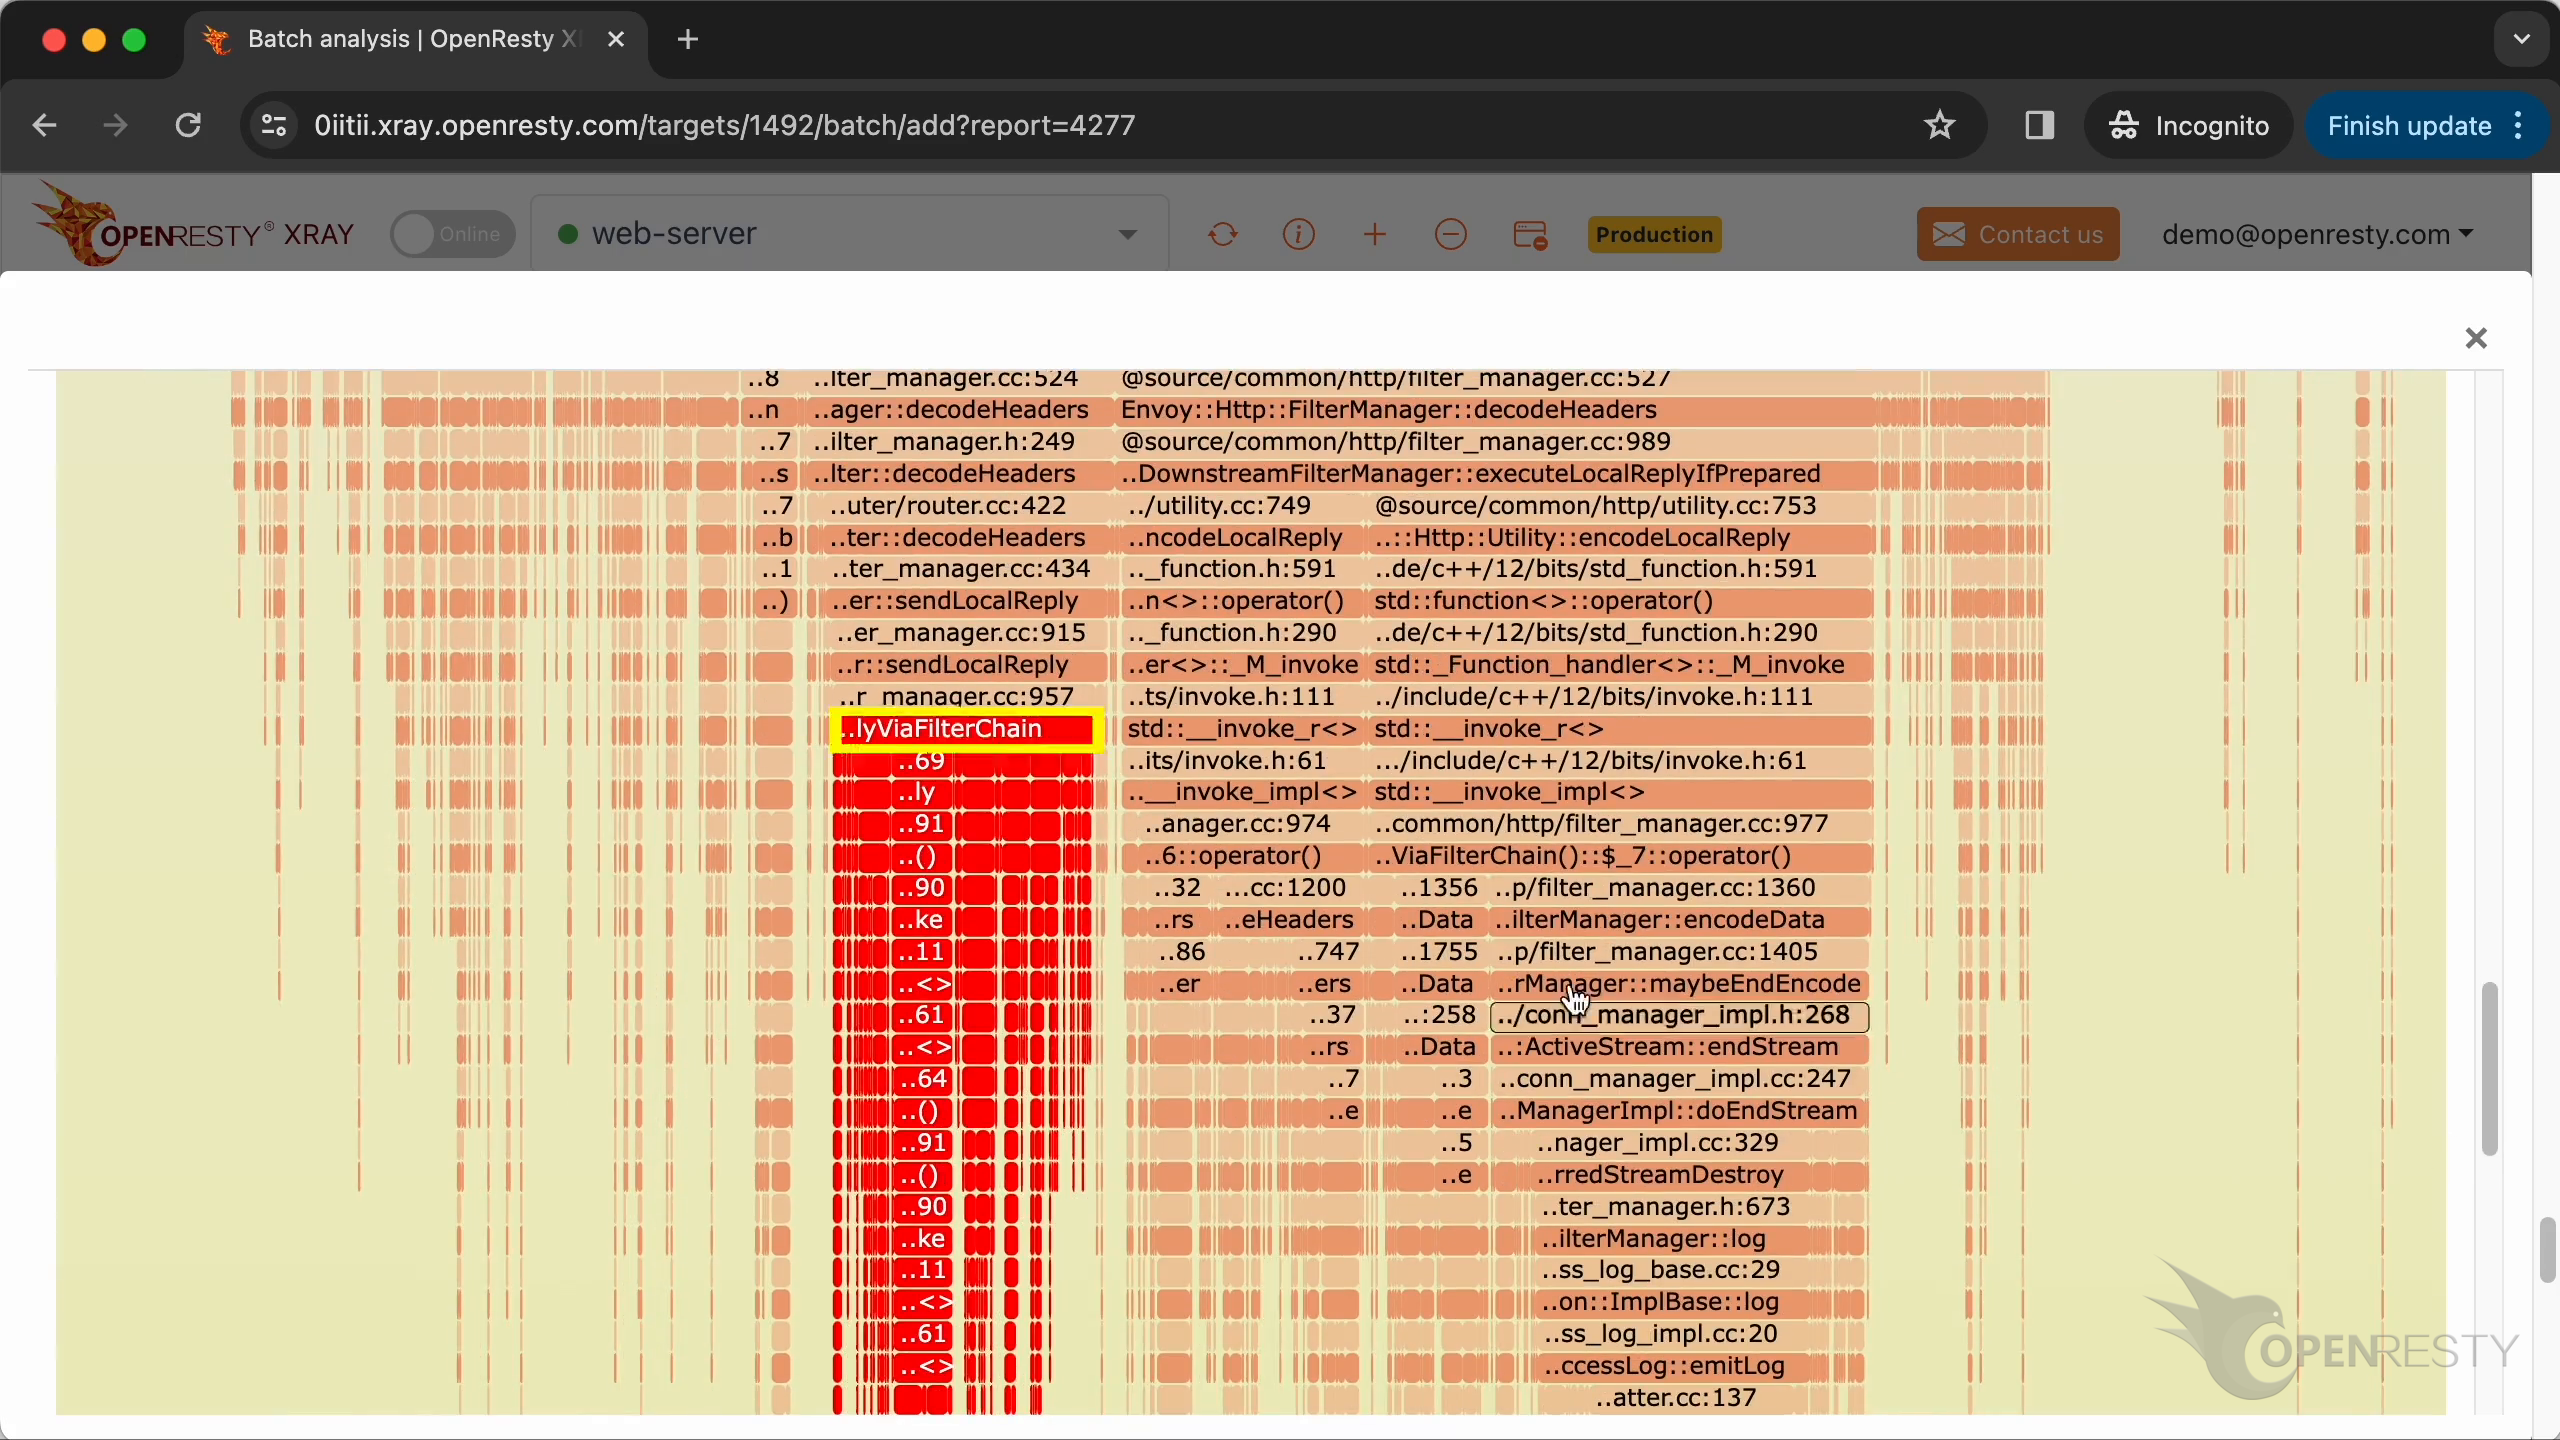
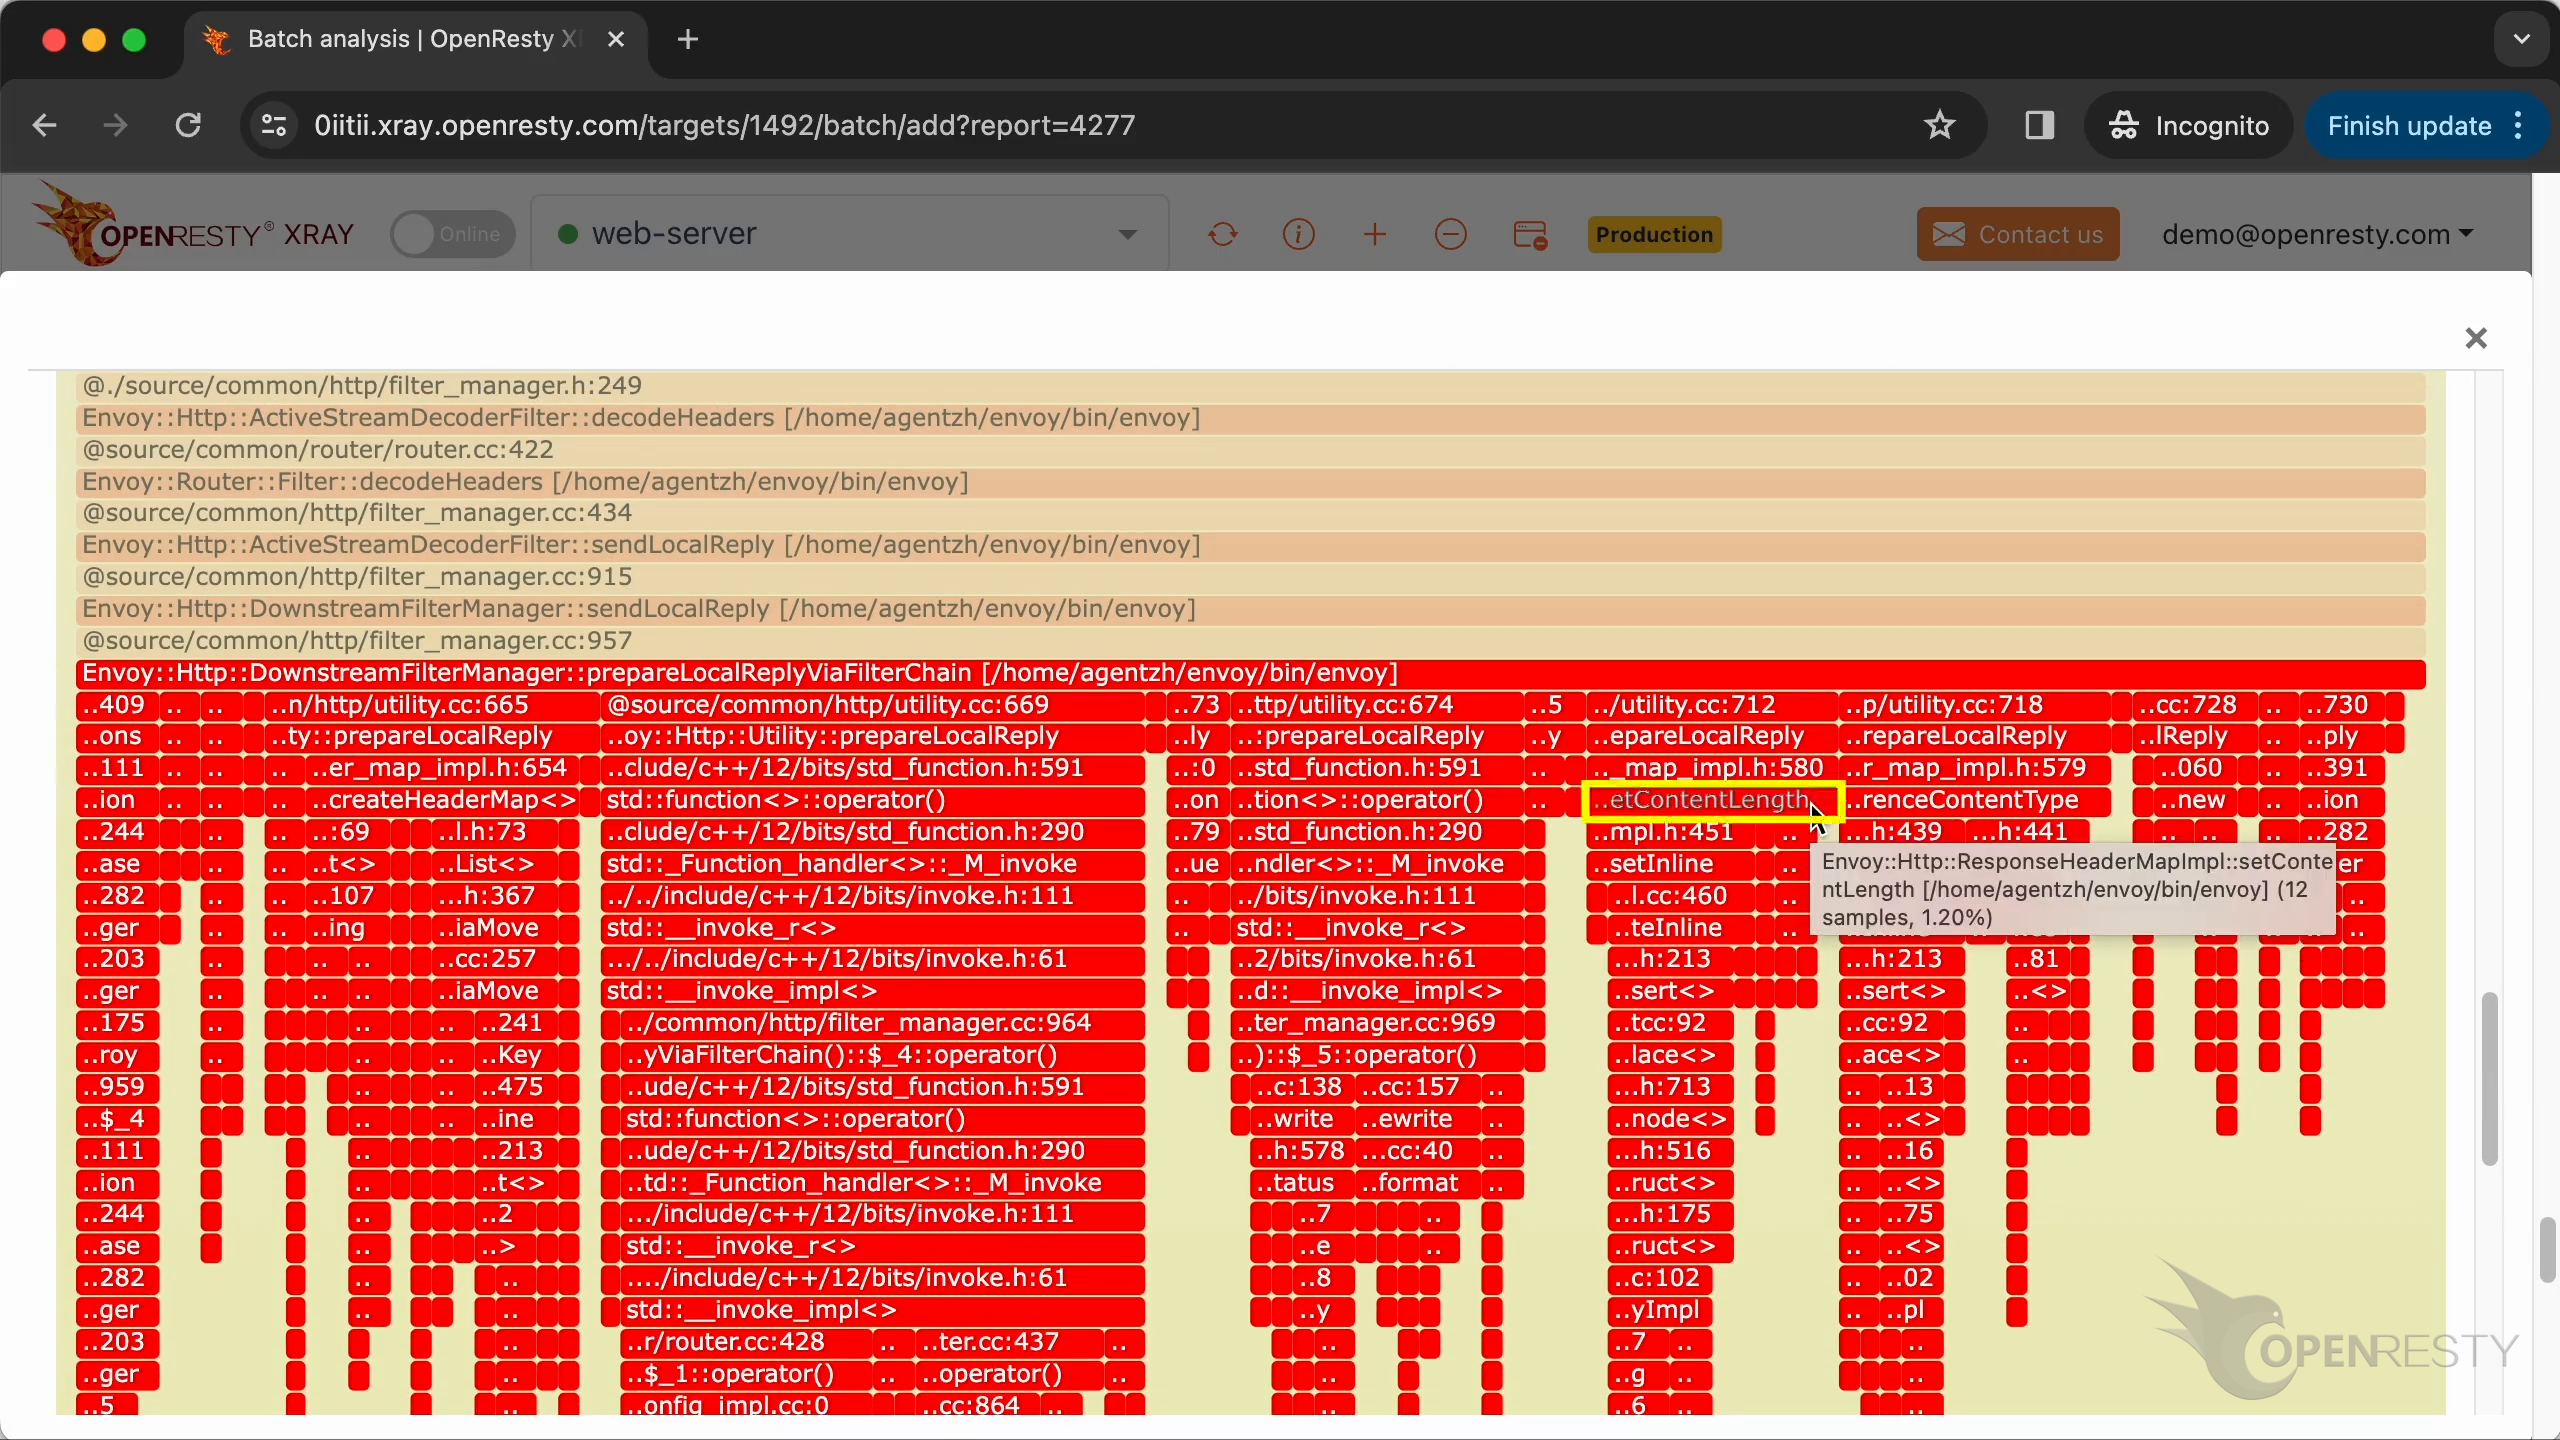
The createHeaderMap function is hot. It’s mainly for allocating new hash table for HTTP headers.
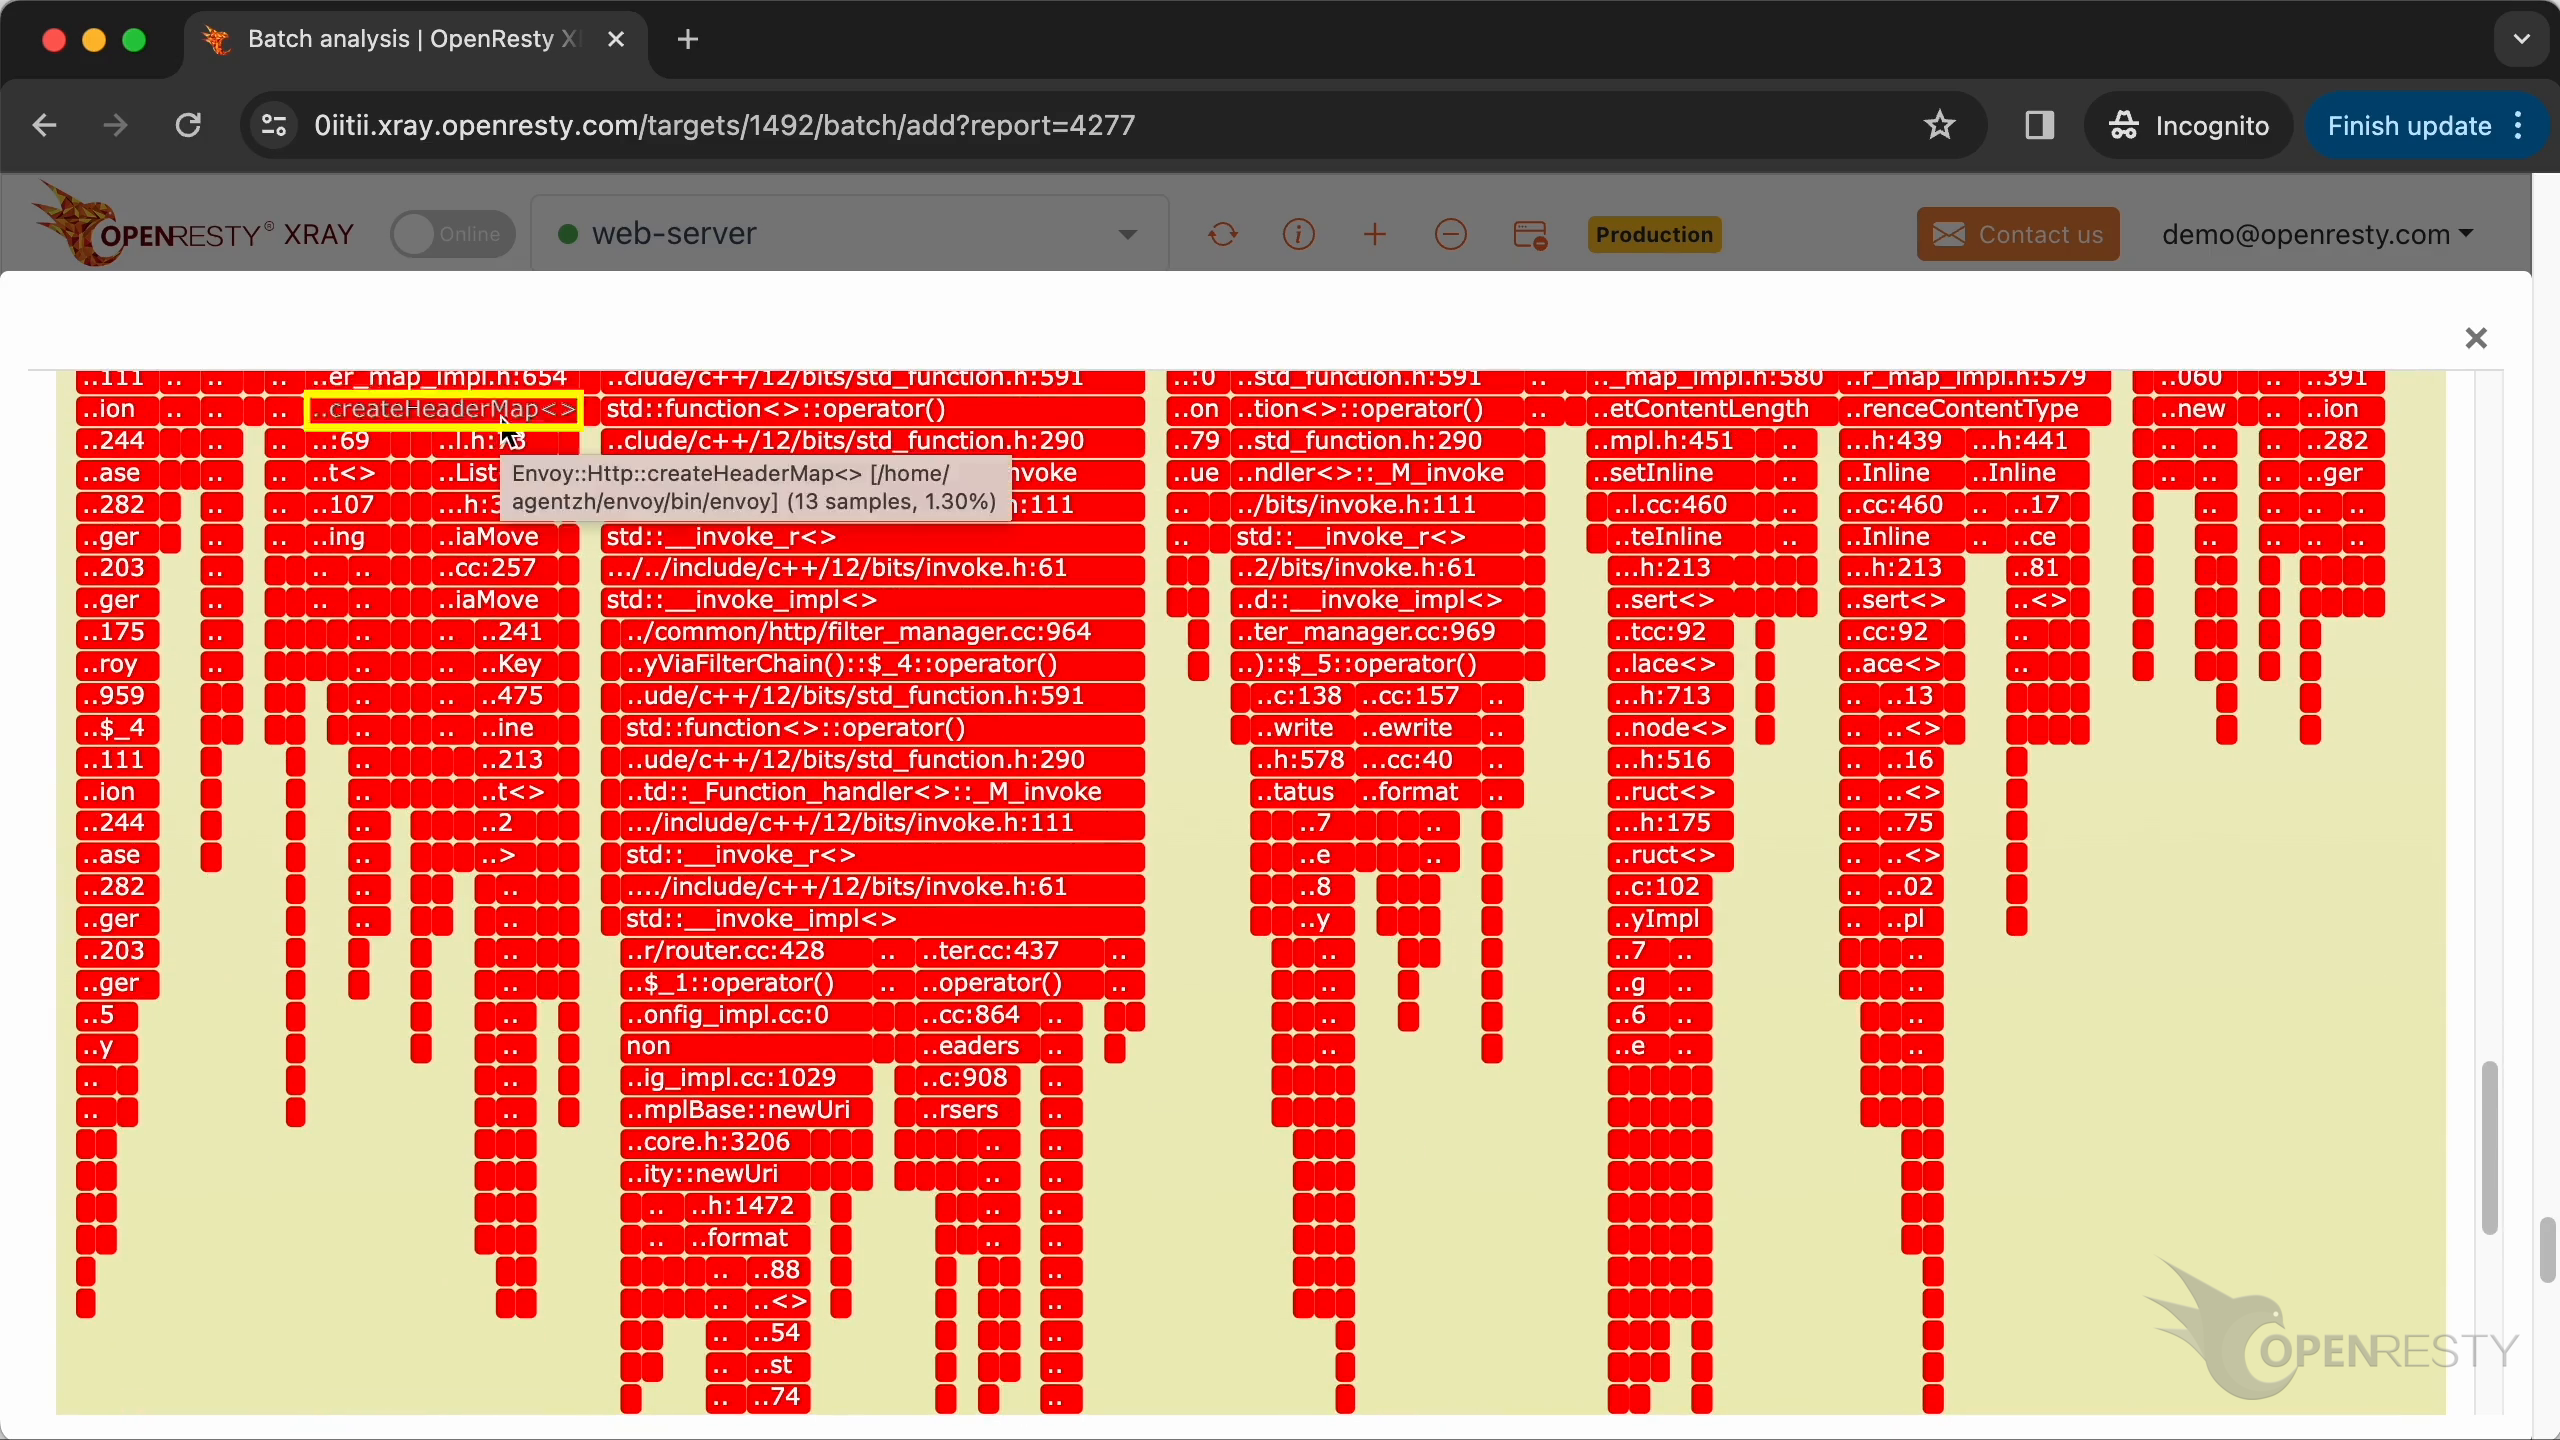
The newUri function is mainly for allocating and formatting the URI string.
The setStatus function sets the response status code.

The format method of the BodyFormatter formats the responses body data.
setContentLength method is used to set the response length header.
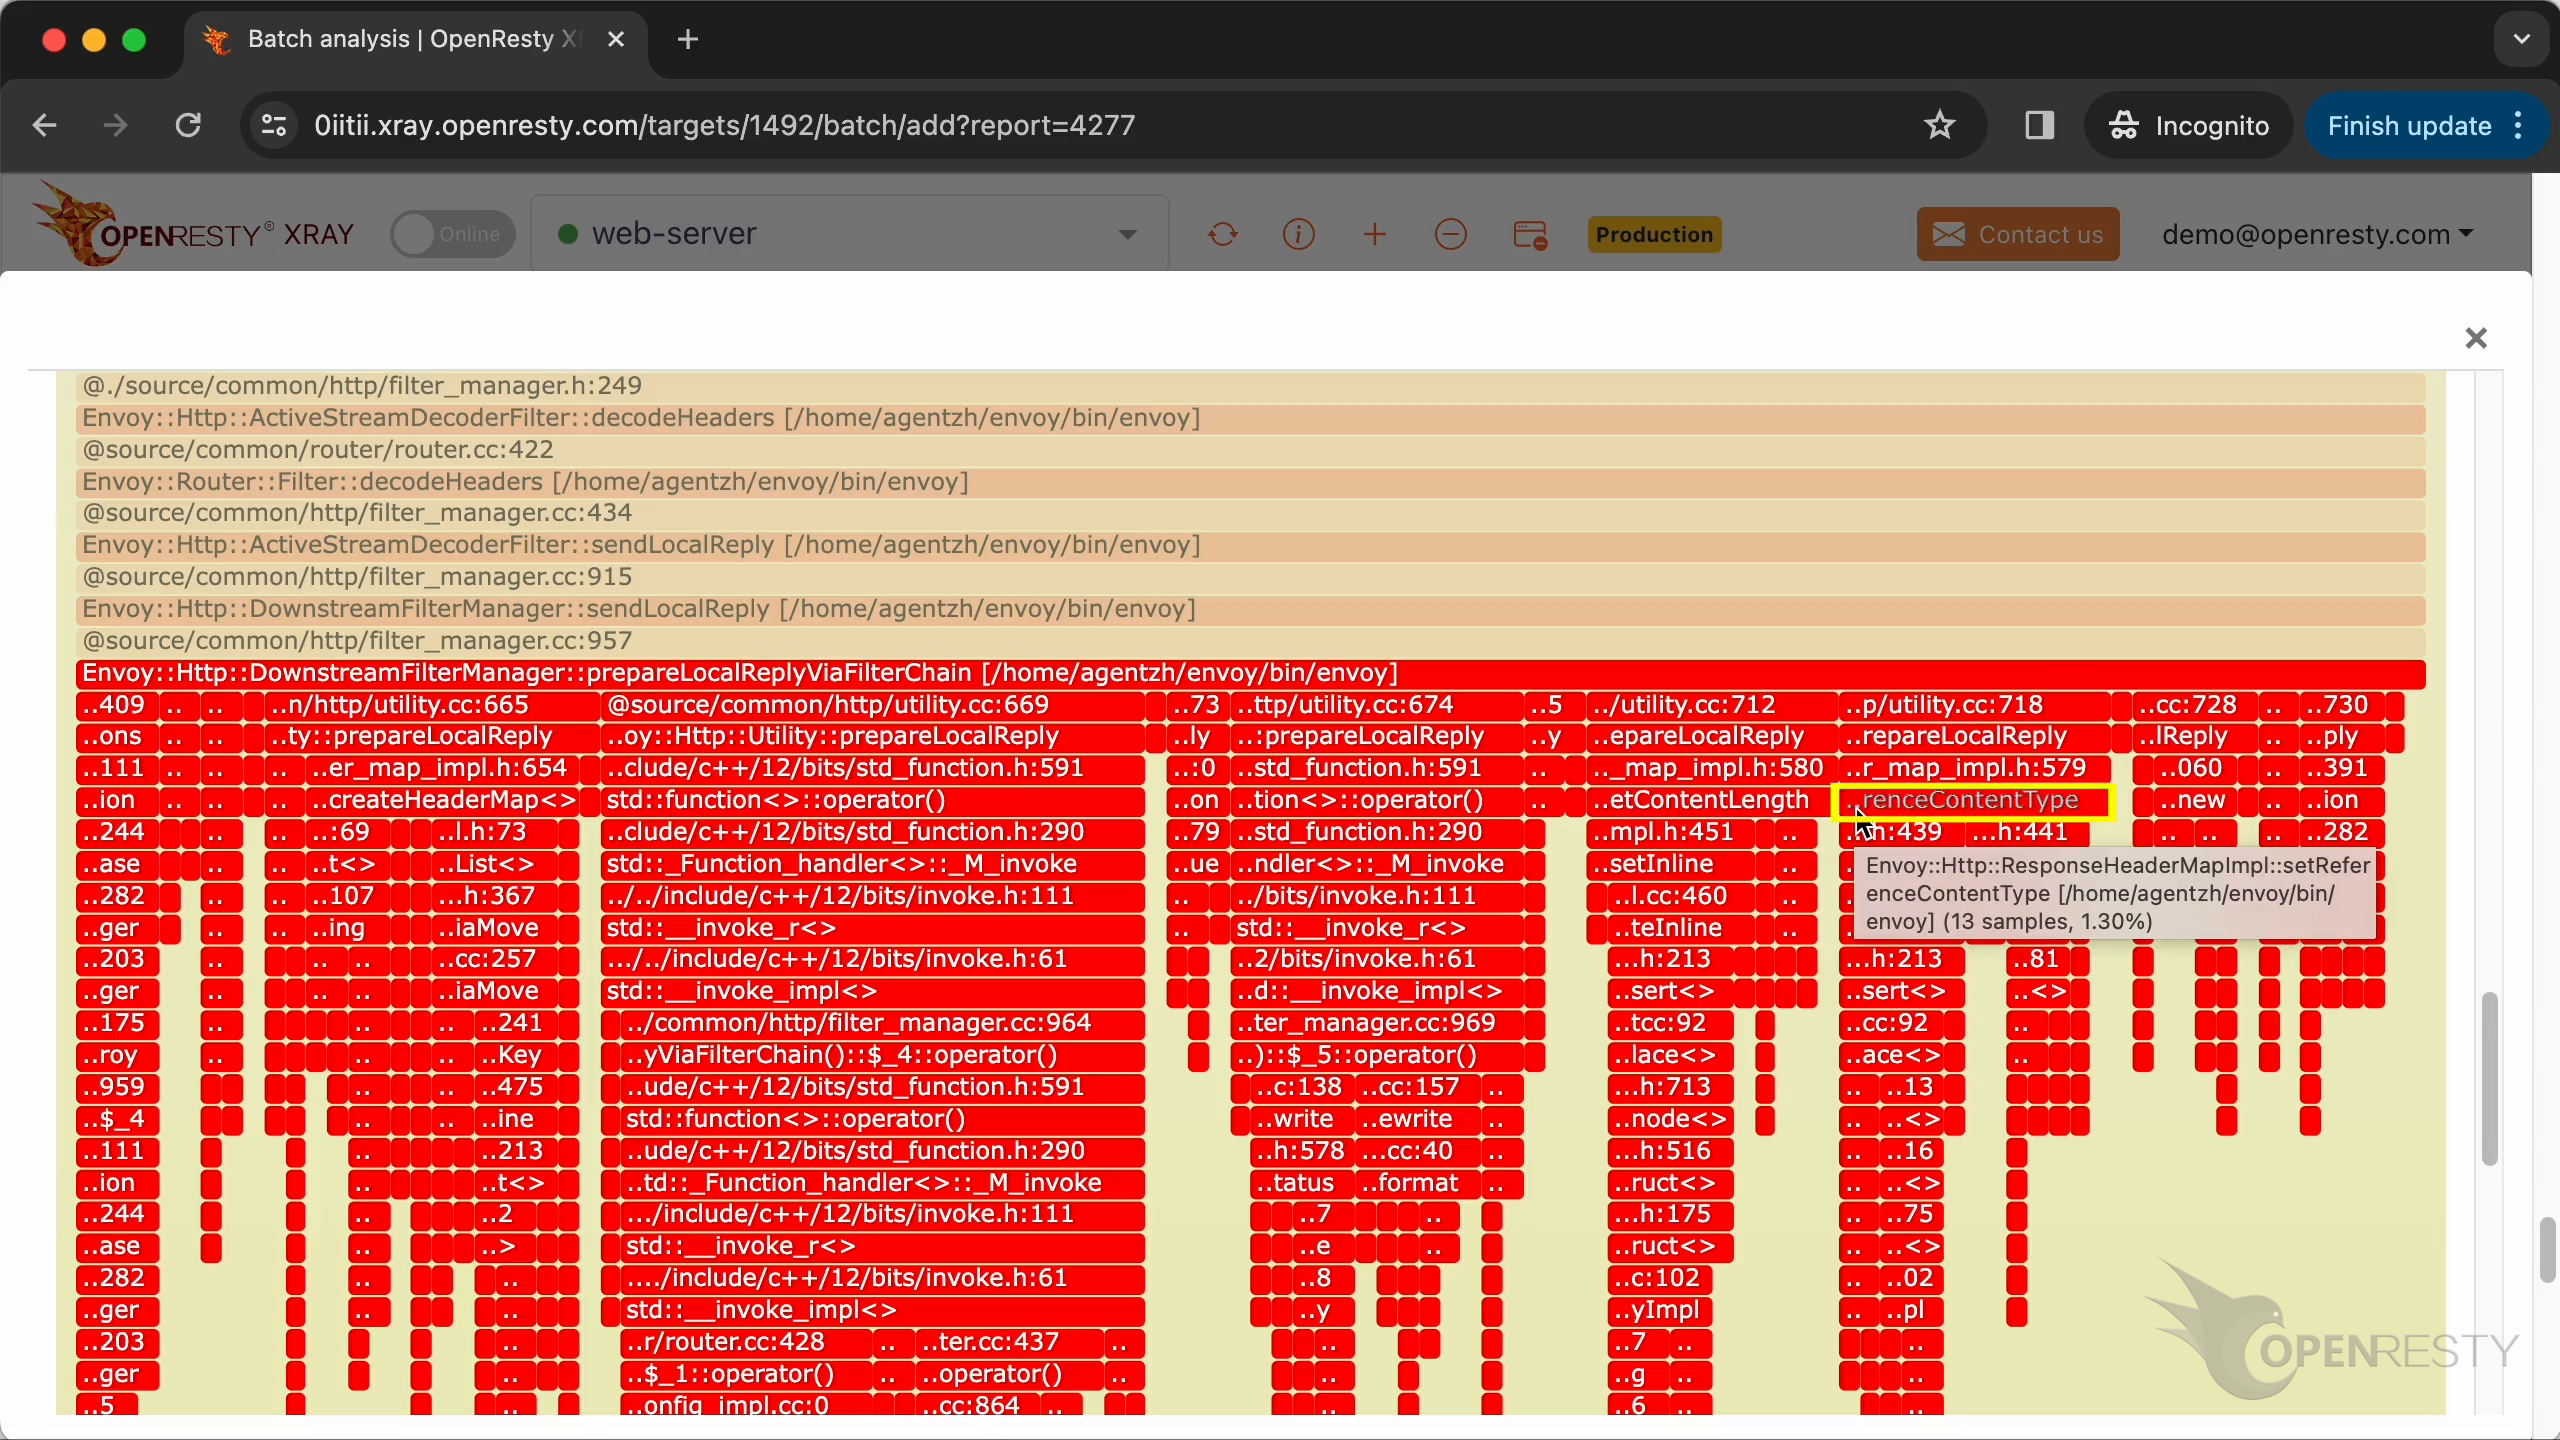
setReferenceContentType method is for setting the Content-Type response header.
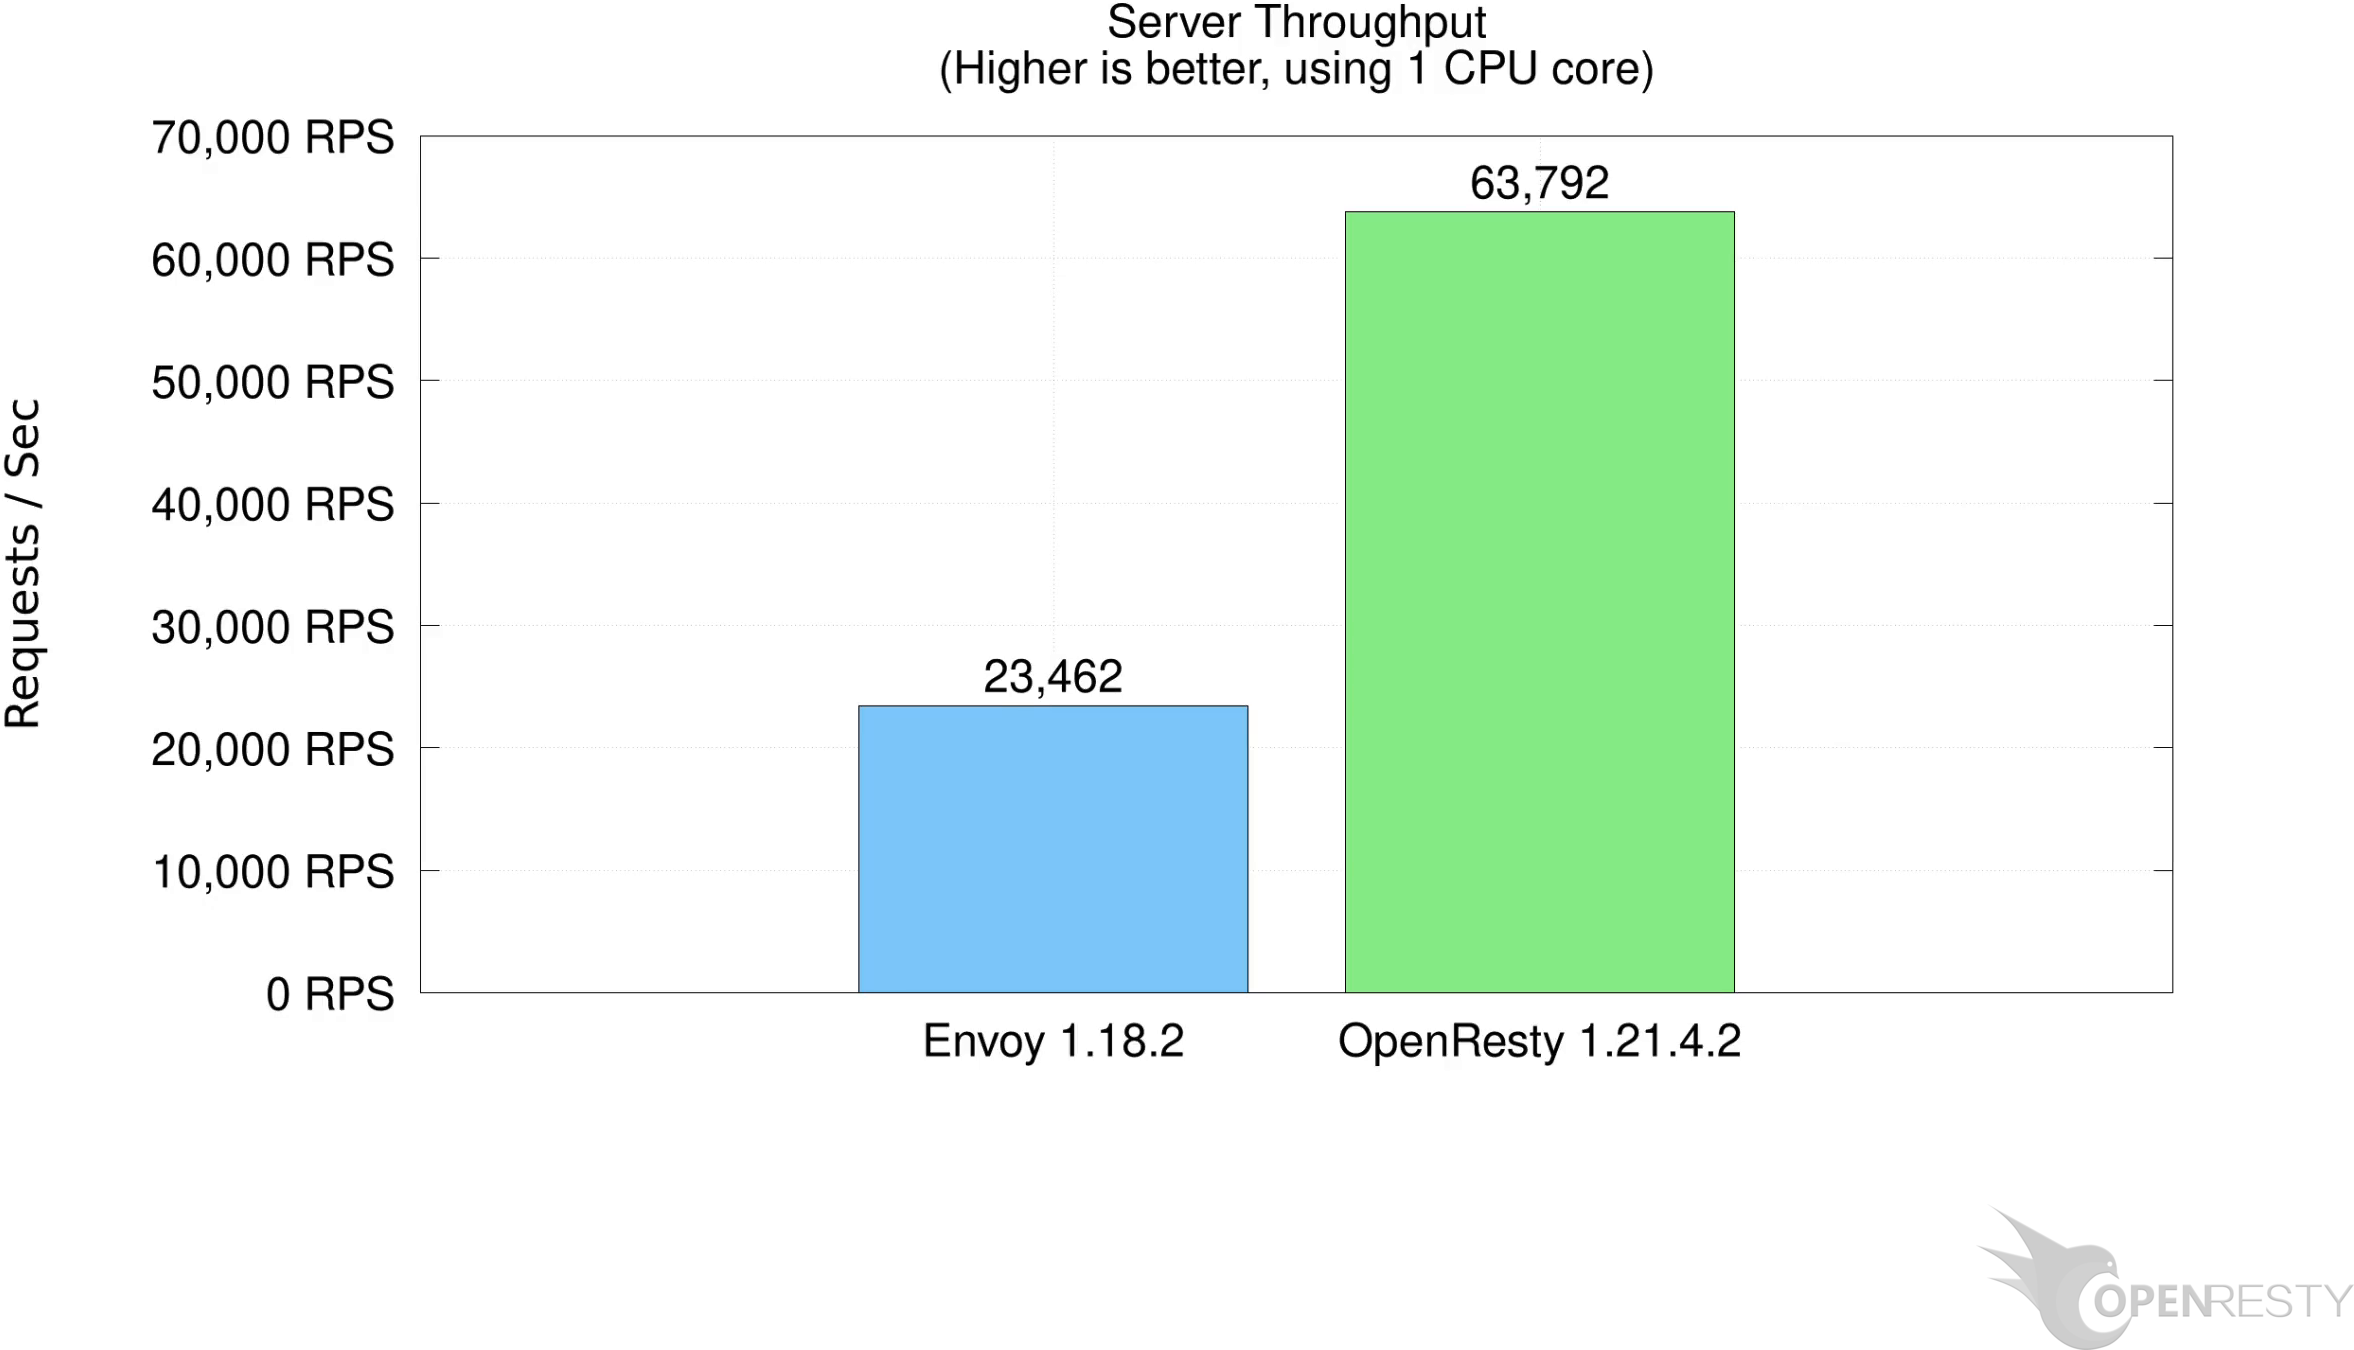
Envoy vs OpenResty Throughput Comparison
This is the performance comparison chart between Envoy servers and OpenResty. You can see that the throughput of OpenResty is more than 200% higher than Envoy servers.
Continuous CPU Monitoring with Automated Reports
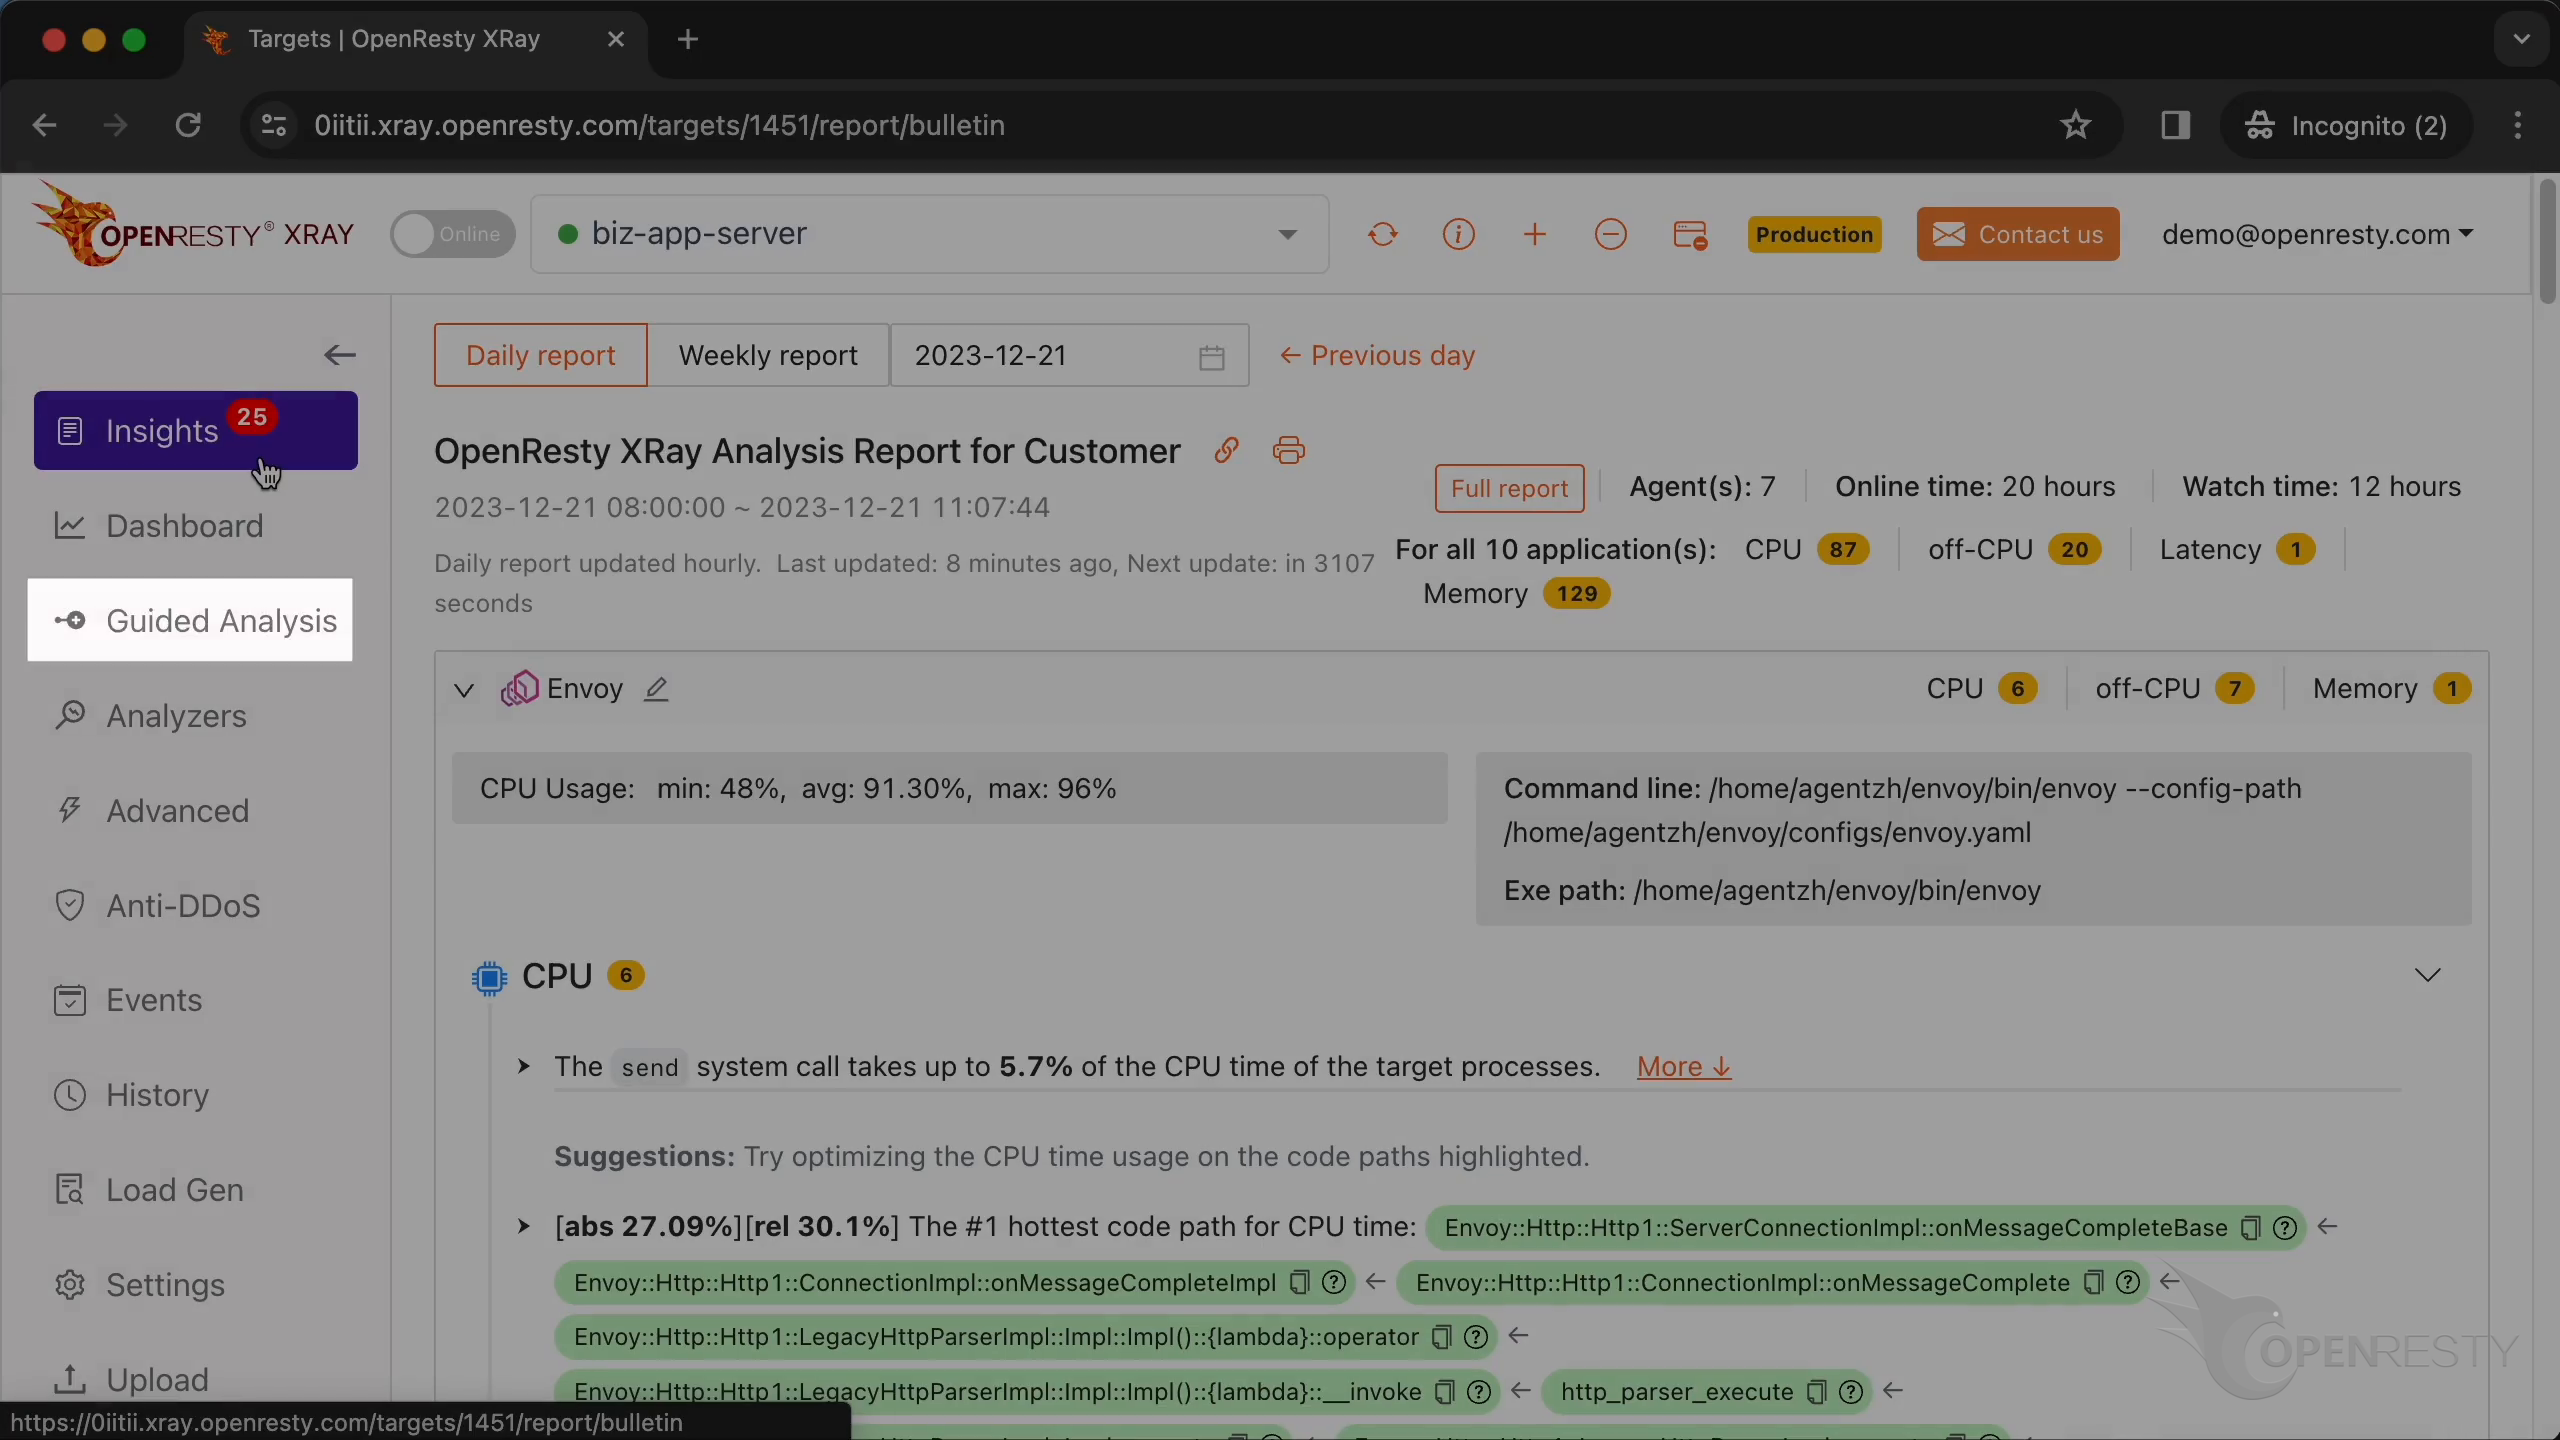
OpenResty XRay can also monitor online processes automatically and show analysis reports. Go to the “Insights” page.
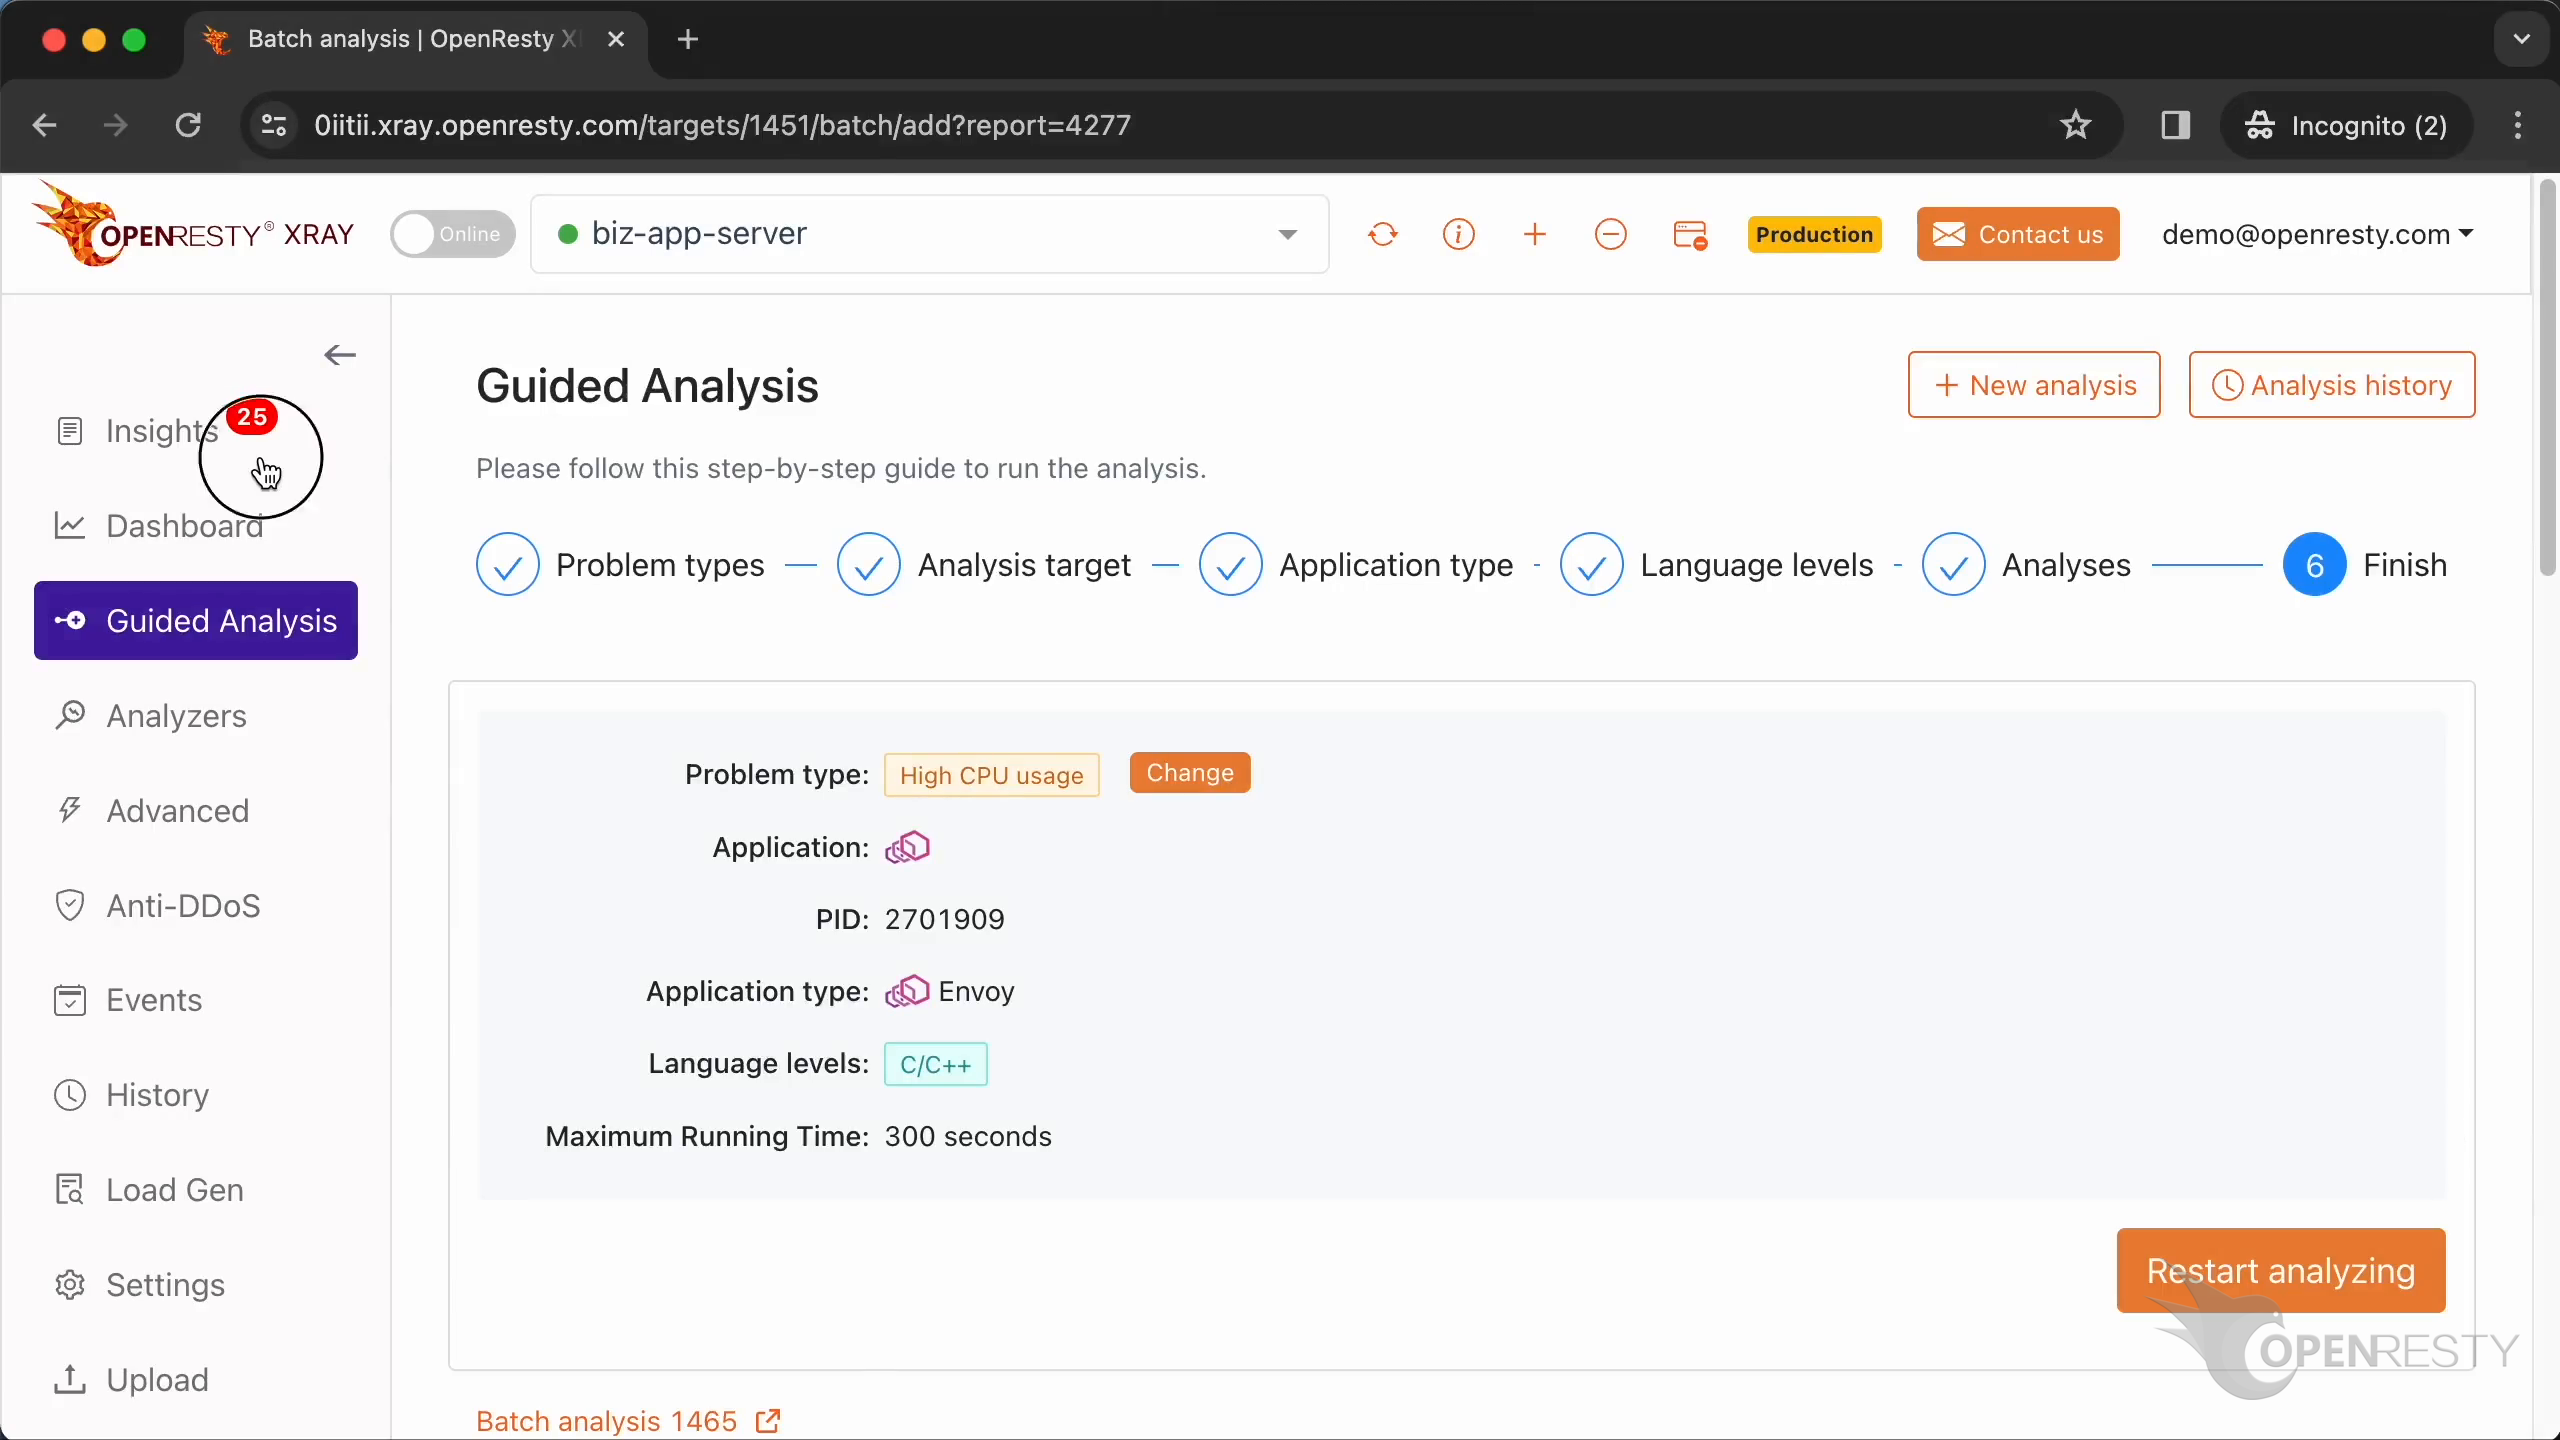
You can find the reports on the Insights page for daily and weekly periods. For this reason, you don’t have to use the “Guided Analysis” feature.
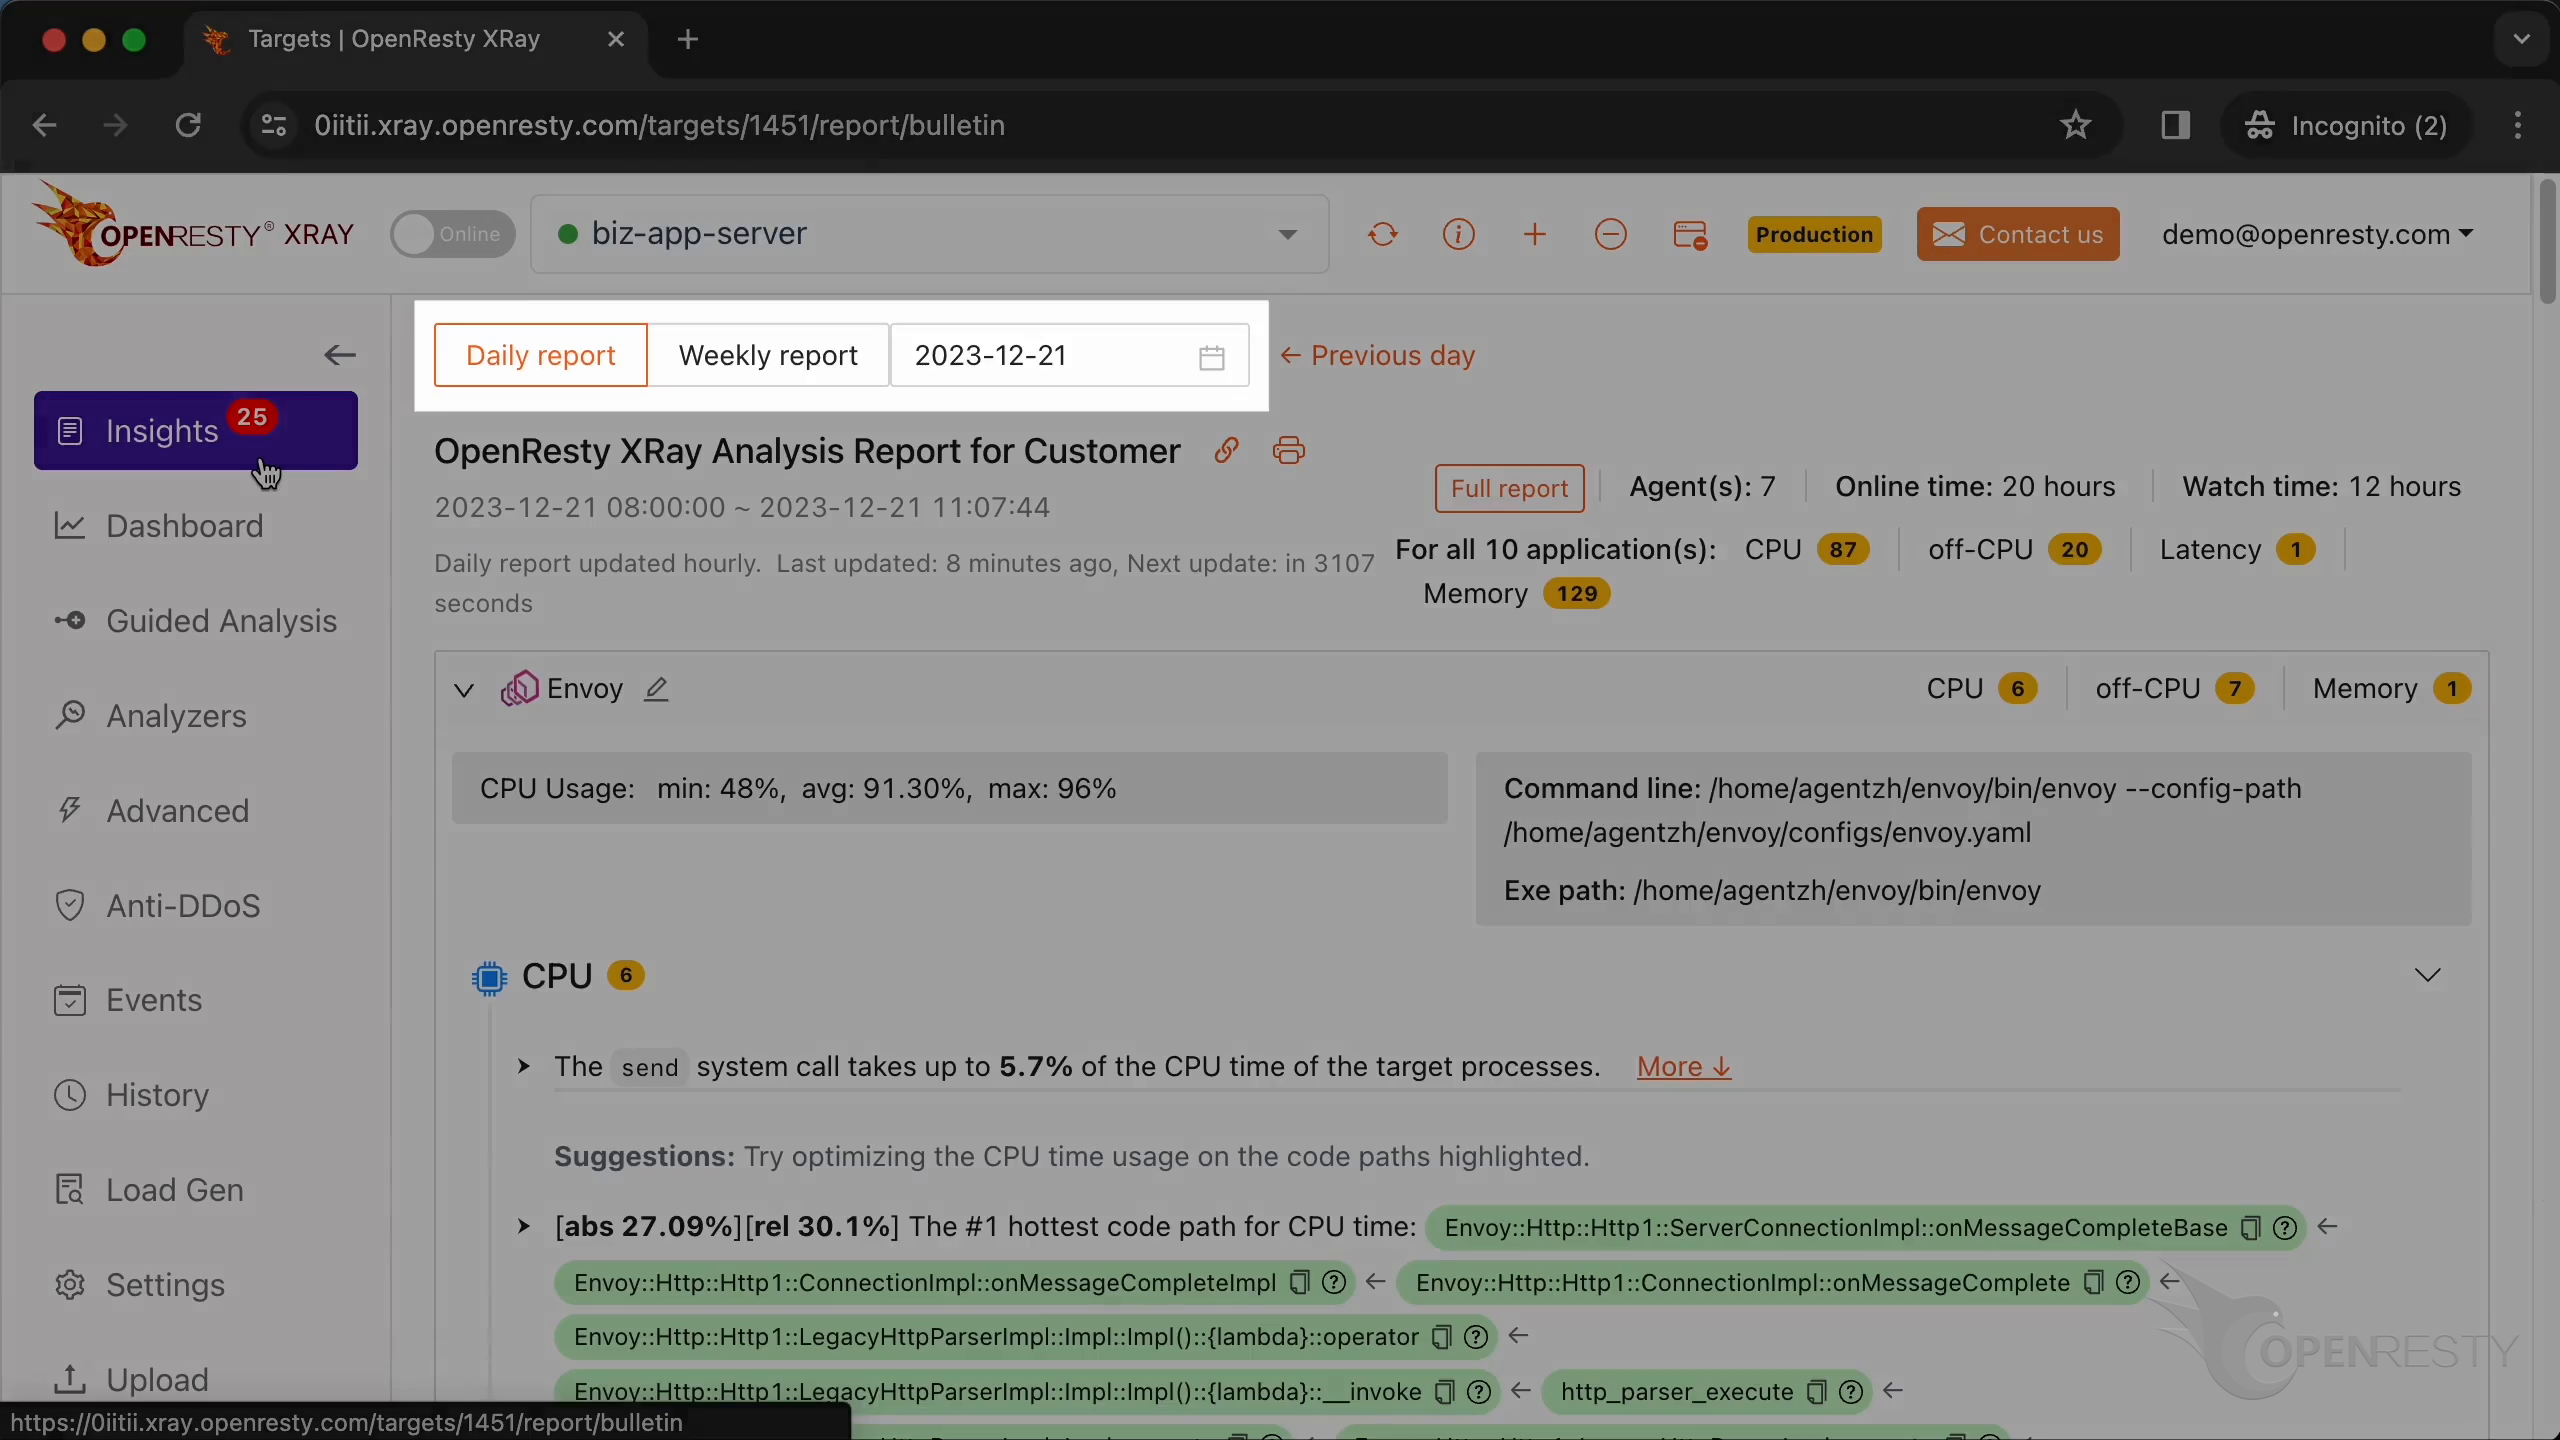
Though “Guided analysis” is useful for application development and demonstration purposes.
What is OpenResty XRay
OpenResty XRay is a dynamic-tracing product that automatically analyzes your running applications to troubleshoot performance problems, behavioral issues, and security vulnerabilities with actionable suggestions. Under the hood, OpenResty XRay is powered by our Y language targeting various runtimes like Stap+, eBPF+, GDB, and ODB, depending on the contexts.
If you like this tutorial, please subscribe to this blog site and/or our YouTube channel. Thank you!
FAQ: Envoy CPU Profiling
Why is my Envoy proxy using so much CPU?
Common CPU consumers revealed by flame graphs in this case study: socket-write callbacks and buffer cleanup (SchedulableCallbackImpl), access-log string formatting (emitLog), and response filter-chain processing including header-map allocation (prepareLocalReplayViaFilterChain). Profiling the live process with CPU flame graphs — rather than guessing from metrics — pinpoints which C++ code path actually dominates.
How do I generate a CPU flame graph for Envoy?
Point a dynamic-tracing profiler at the Envoy worker process PID. OpenResty XRay’s guided analysis samples the running binary, generates a C-land CPU flame graph, and automatically ranks the hottest C++ code paths — no recompile, restart, or instrumentation required. Alternatively, rebuild Envoy with gperftools and use pprof, but that demands source access and a service restart.
Can I profile Envoy CPU in production without restarting?
Yes. Dynamic-tracing tools analyze the live process from the outside, without changing its code or requiring any collaboration from the target. Sampling overhead is negligible, and when the tool is not sampling the impact is strictly zero — making the approach safe for latency-sensitive production deployments.
About The Author
Yichun Zhang (Github handle: agentzh), is the original creator of the OpenResty® open-source project and the CEO of OpenResty Inc..
Yichun is one of the earliest advocates and leaders of “open-source technology”. He worked at many internationally renowned tech companies, such as Cloudflare, Yahoo!. He is a pioneer of “edge computing”, “dynamic tracing” and “machine coding”, with over 22 years of programming and 16 years of open source experience. Yichun is well-known in the open-source space as the project leader of OpenResty®, adopted by more than 40 million global website domains.
OpenResty Inc., the enterprise software start-up founded by Yichun in 2017, has customers from some of the biggest companies in the world. Its flagship product, OpenResty XRay, is a non-invasive profiling and troubleshooting tool that significantly enhances and utilizes dynamic tracing technology. And its OpenResty Edge product is a powerful distributed traffic management and private CDN software product.
As an avid open-source contributor, Yichun has contributed more than a million lines of code to numerous open-source projects, including Linux kernel, Nginx, LuaJIT, GDB, SystemTap, LLVM, Perl, etc. He has also authored more than 60 open-source software libraries.
Related Articles
OpenResty XRay Apr 1, 2024

OpenResty XRay Feb 27, 2024

OpenResty XRay Aug 27, 2026

OpenResty XRay Dec 25, 2023

OpenResty XRay Sep 28, 2023