How to use standard dynamic metrics in OpenResty Edge
Today, I’ll demonstrate another cool feature in OpenResty Edge. That is, using the Metric SQL language to create new dynamic metrics.
Introduction to dynamic metrics
Dynamic metrics allow users to create metrics by writing SQL-like queries on the fly. OpenResty Edge automatically generates efficient code to collect and aggregate the metric data in each gateway server’s memory. The data is then reported to the web console and displayed in pretty charts in real-time.

Don’t worry. The system uses machine coding technologies to generate efficient native code for each user-defined and standard metric. It uses fixed-size memory for streaming aggregation.
Enable standard dynamic metrics for the sample application
Let’s go to the OpenResty Edge’s Admin web console. It is our sample deployment of the console. Every user has their local deployment.
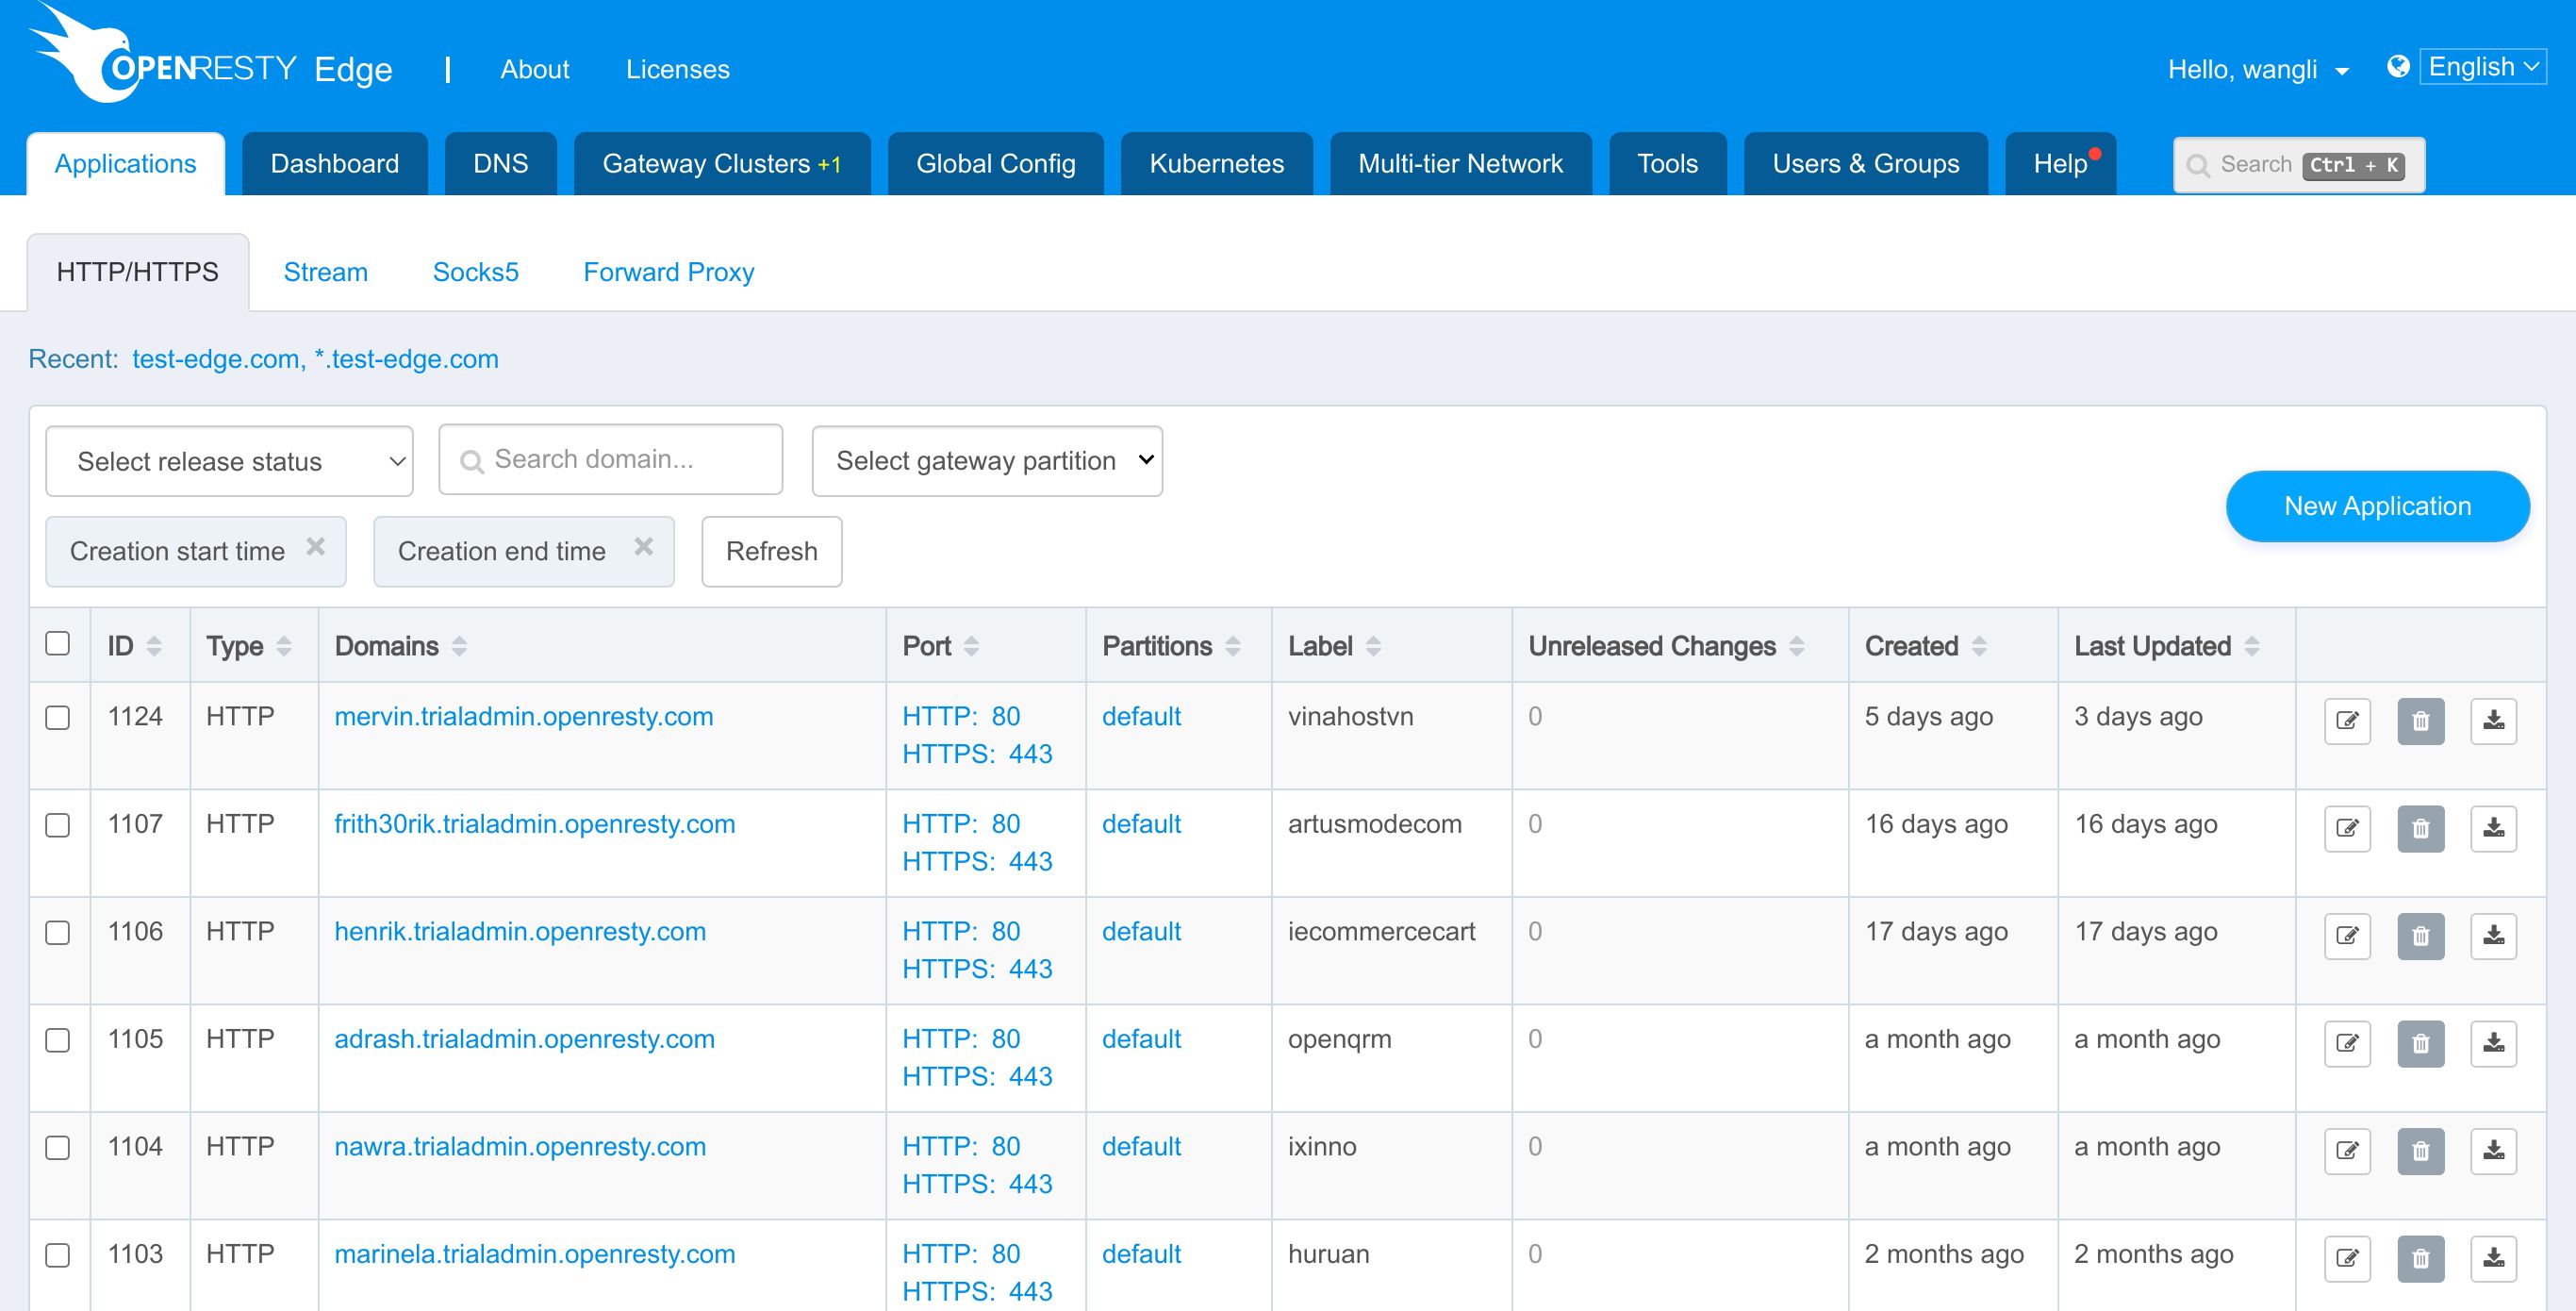
We use our ongoing sample application for the test-edge.com domain.
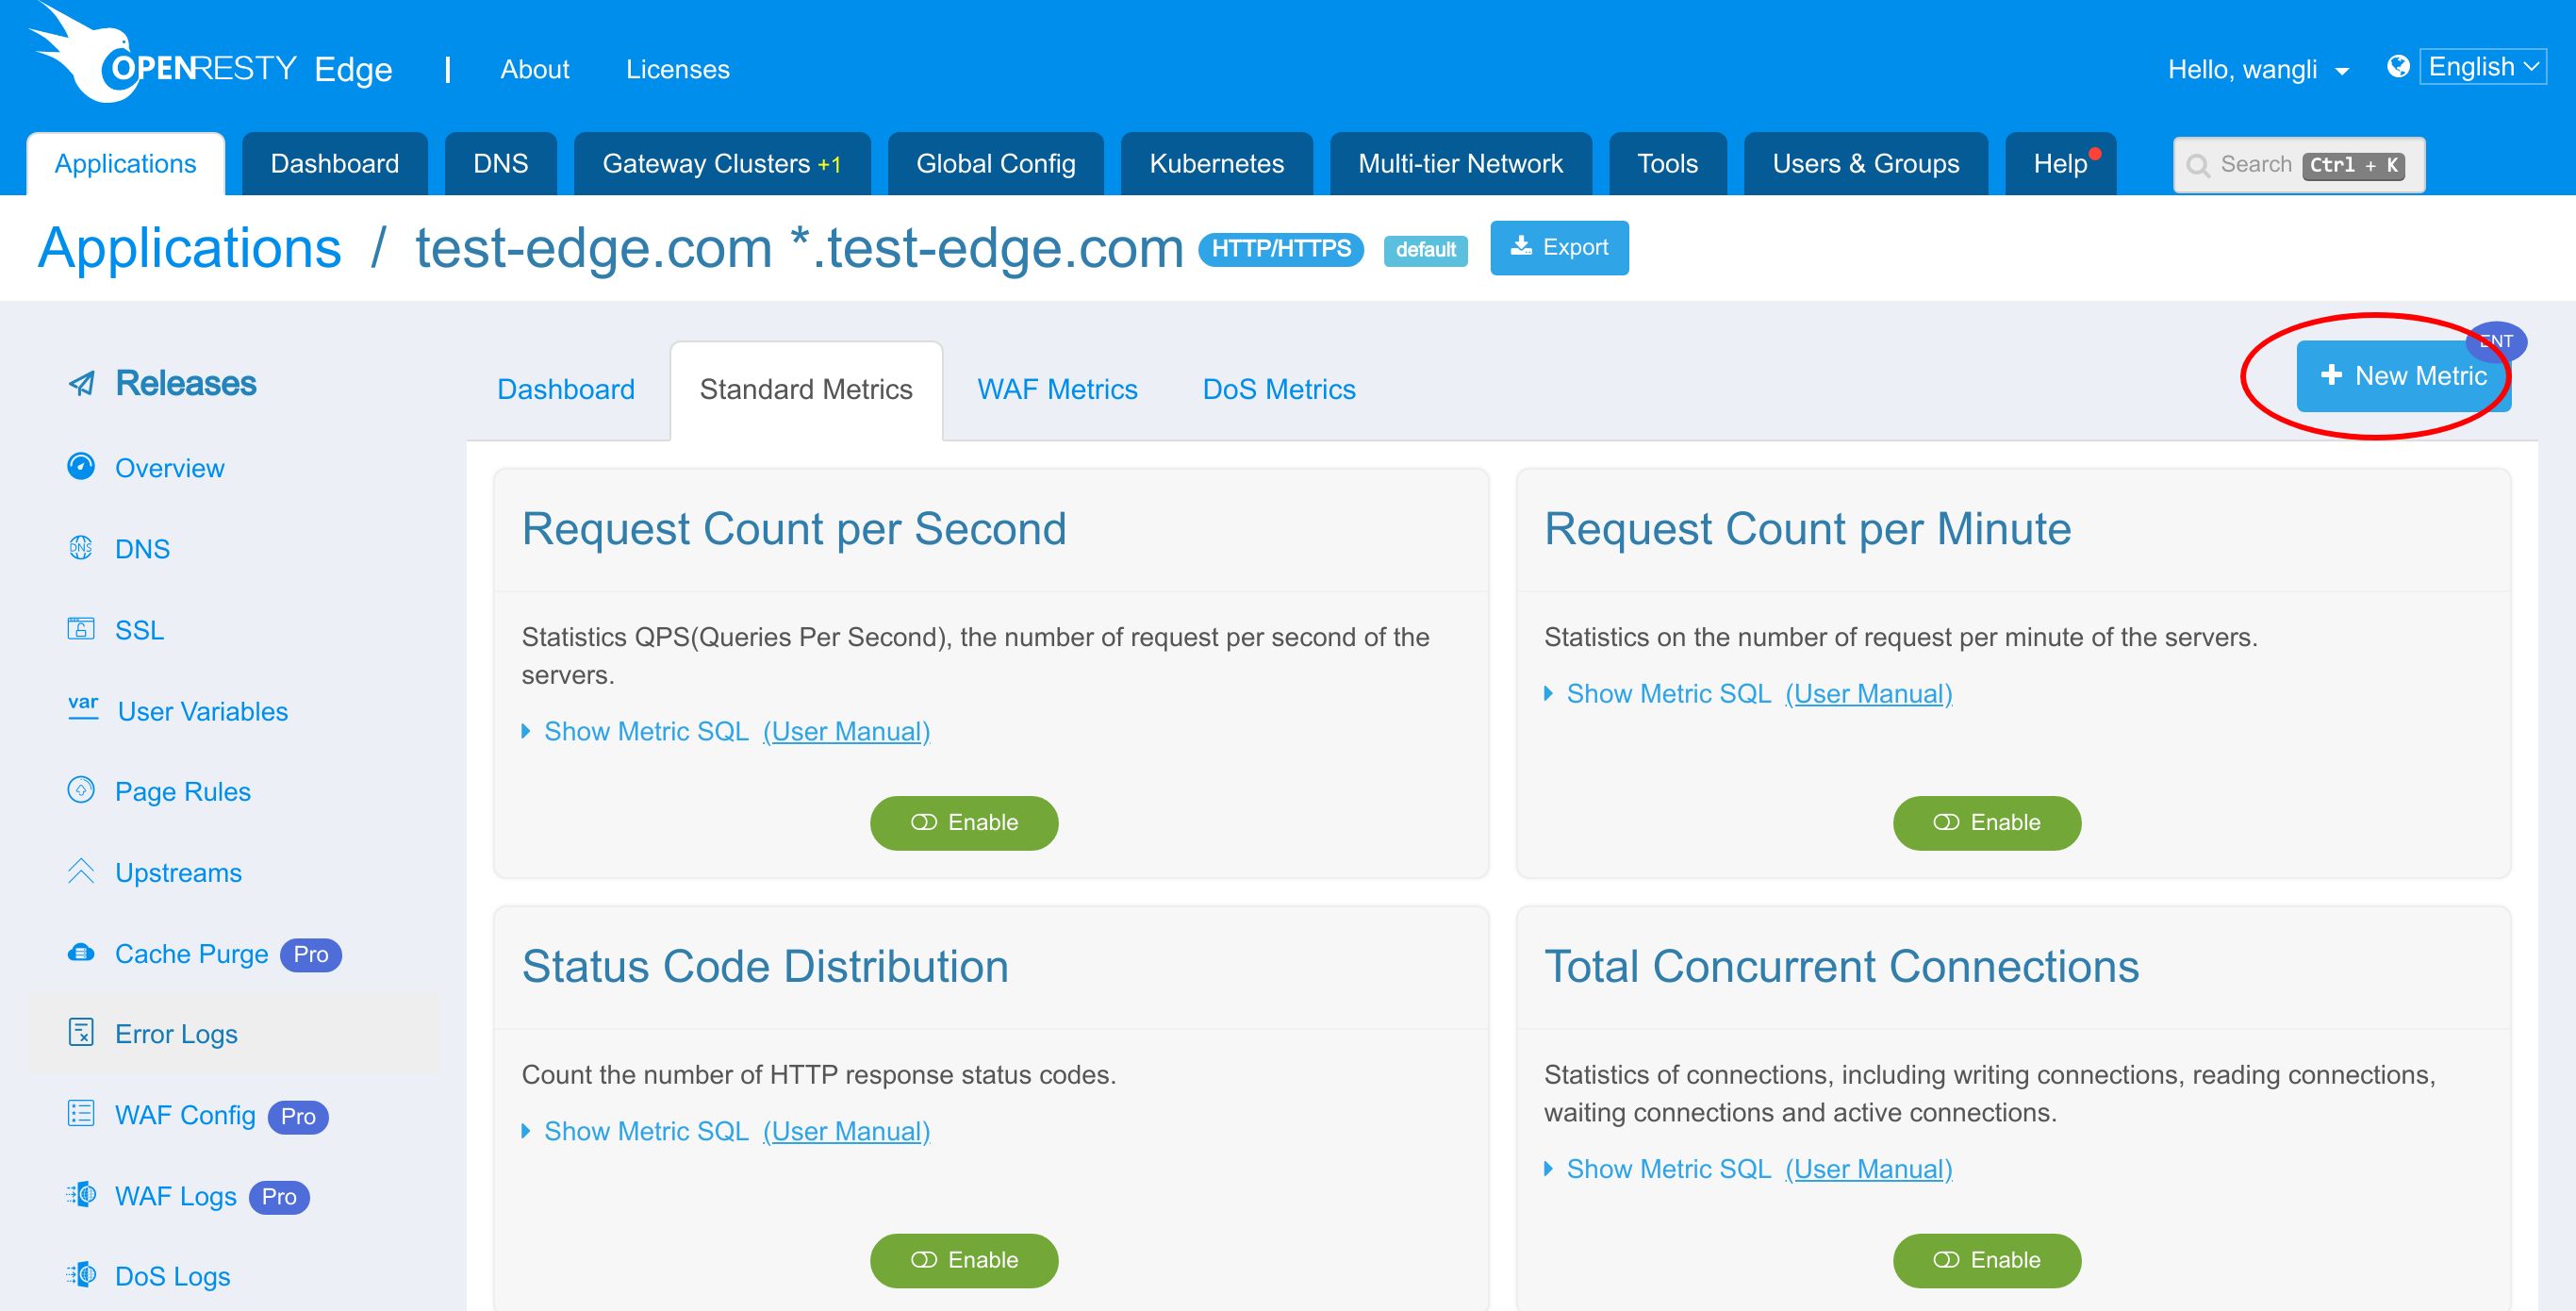
Let’s enter this application.

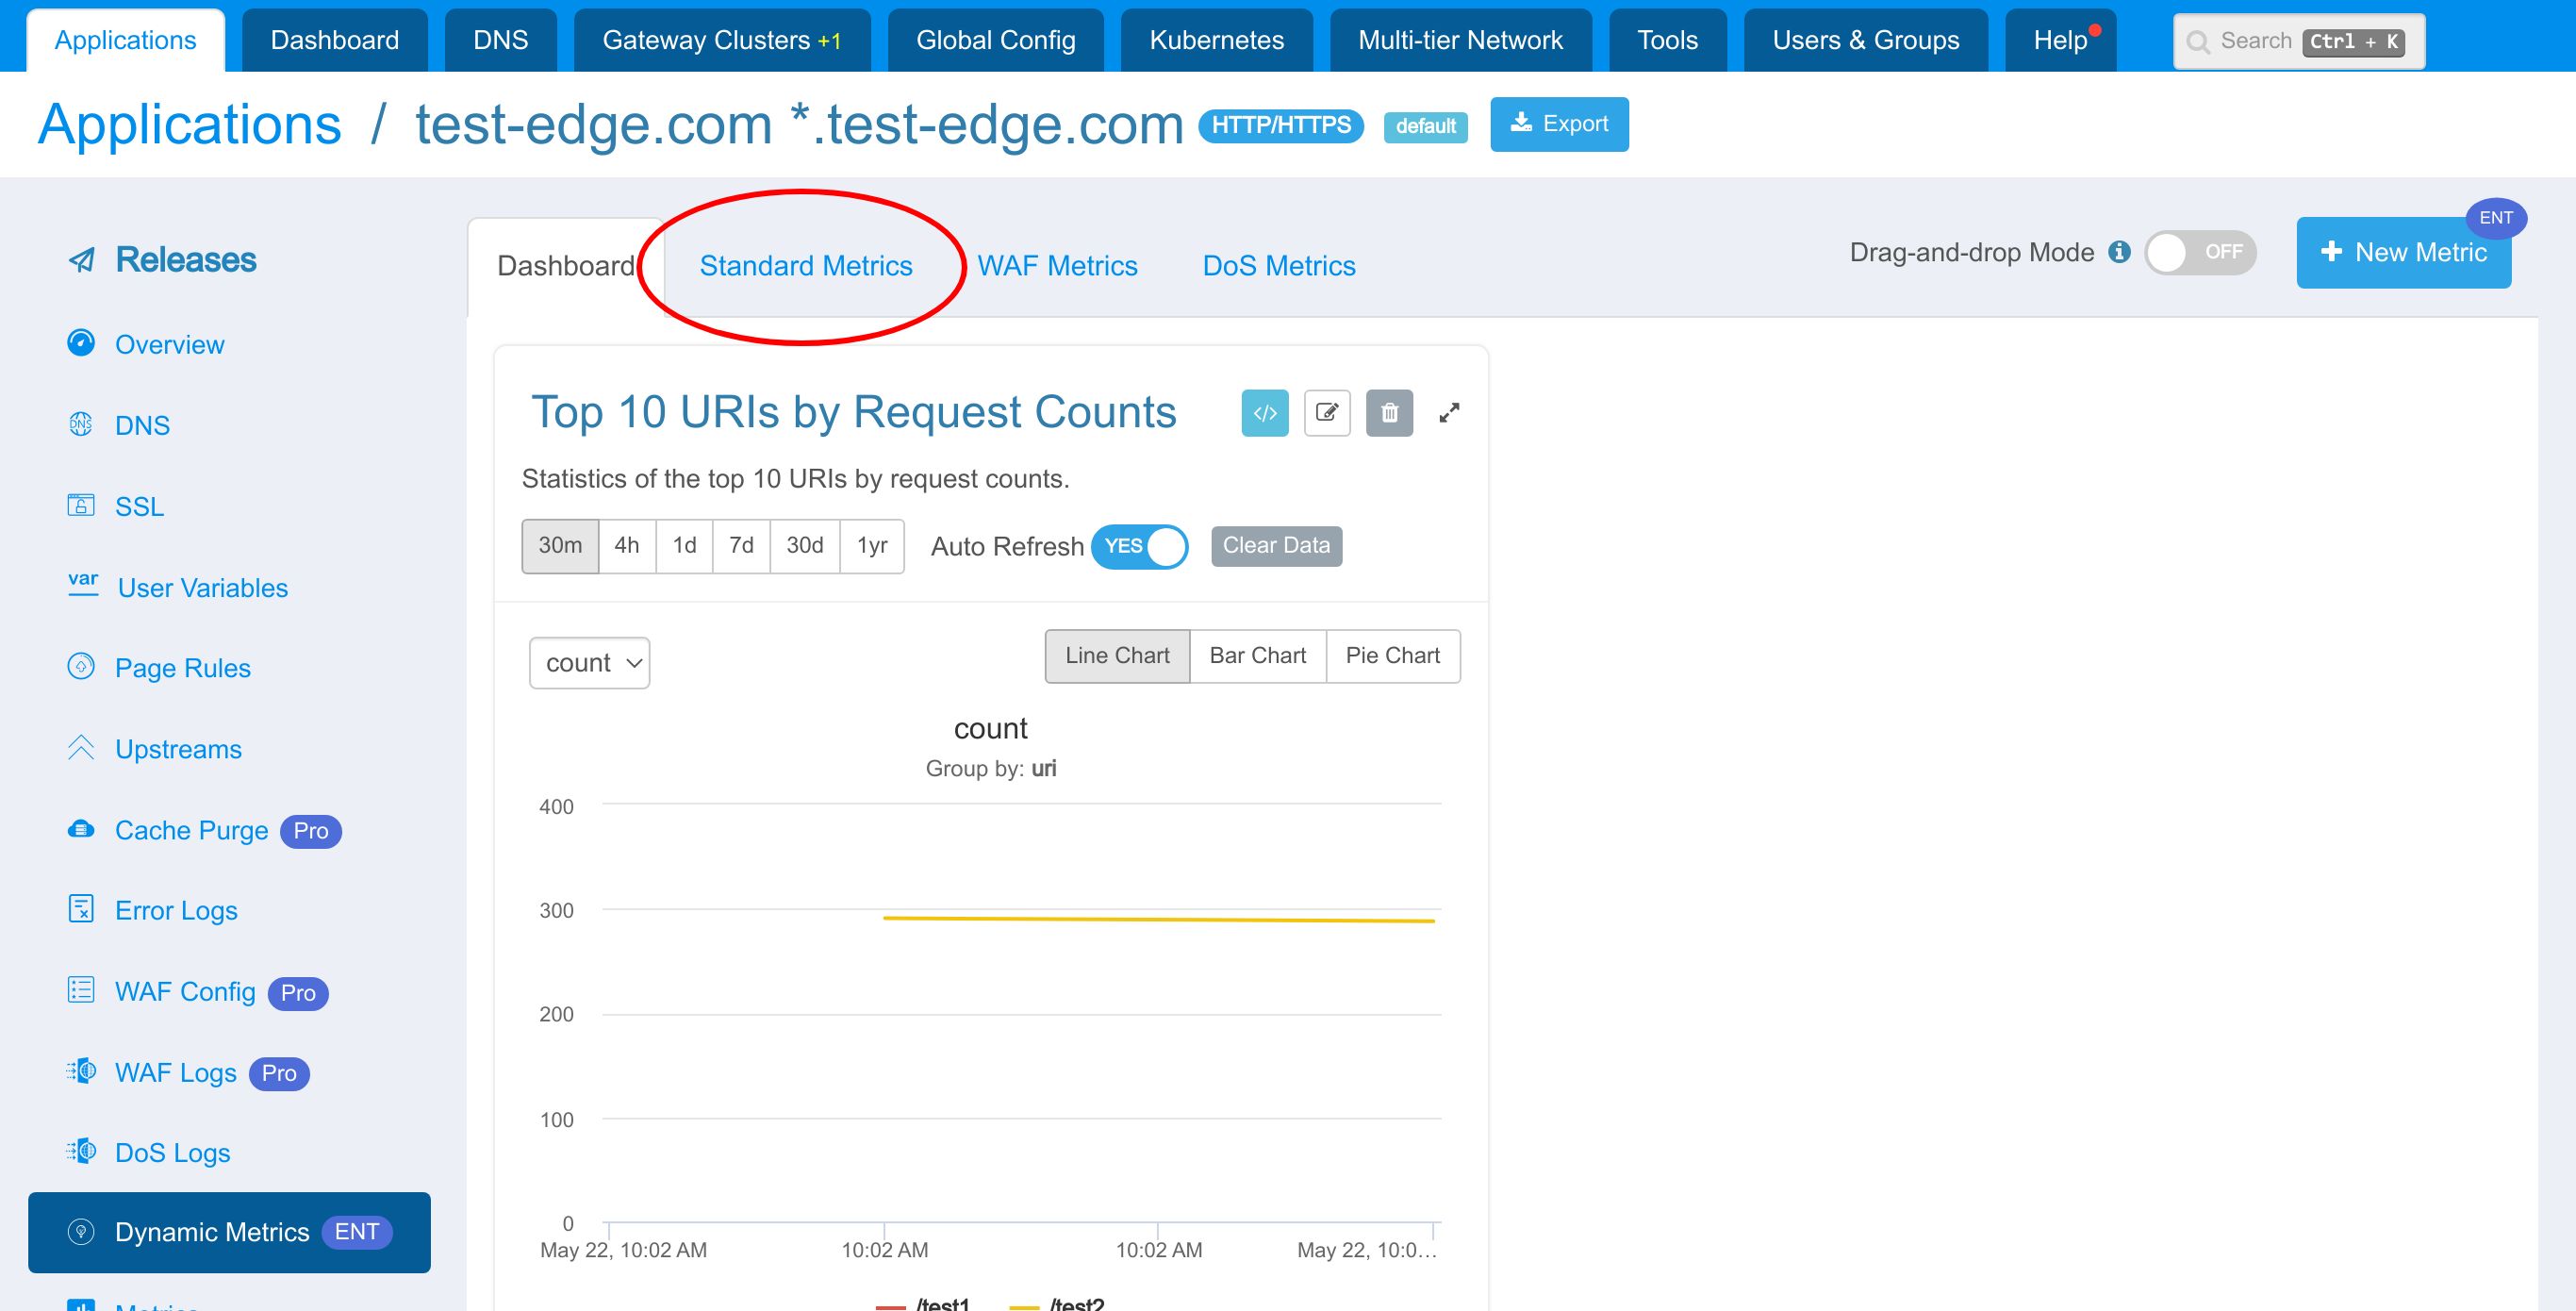
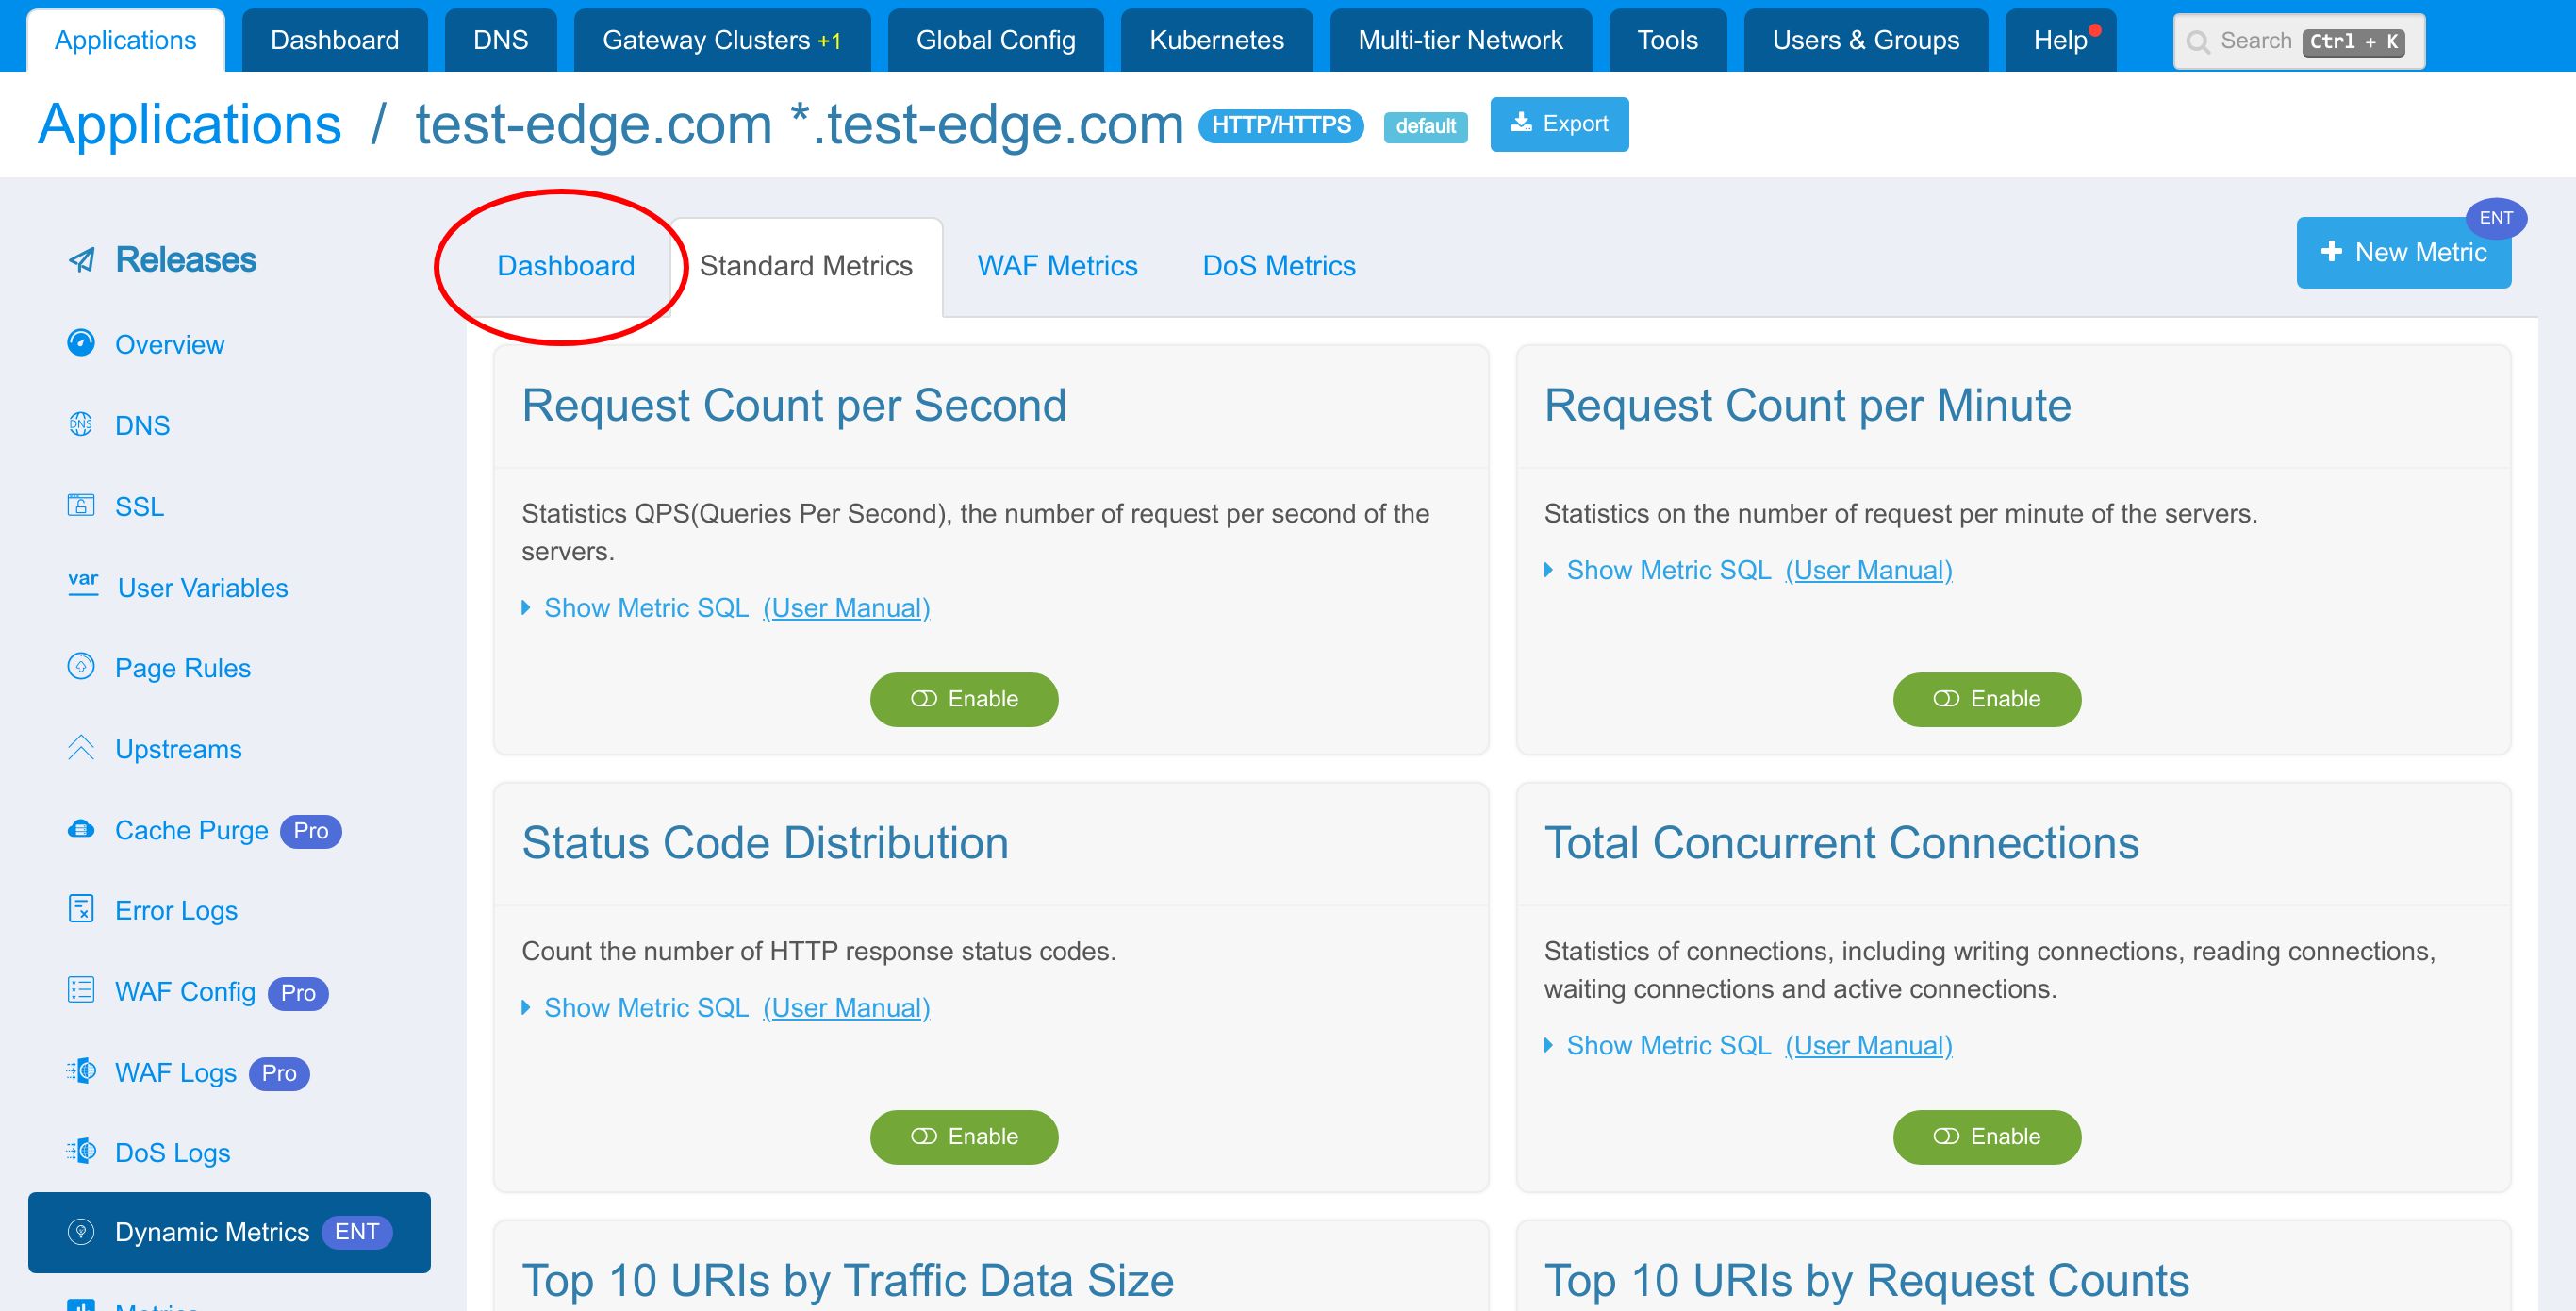
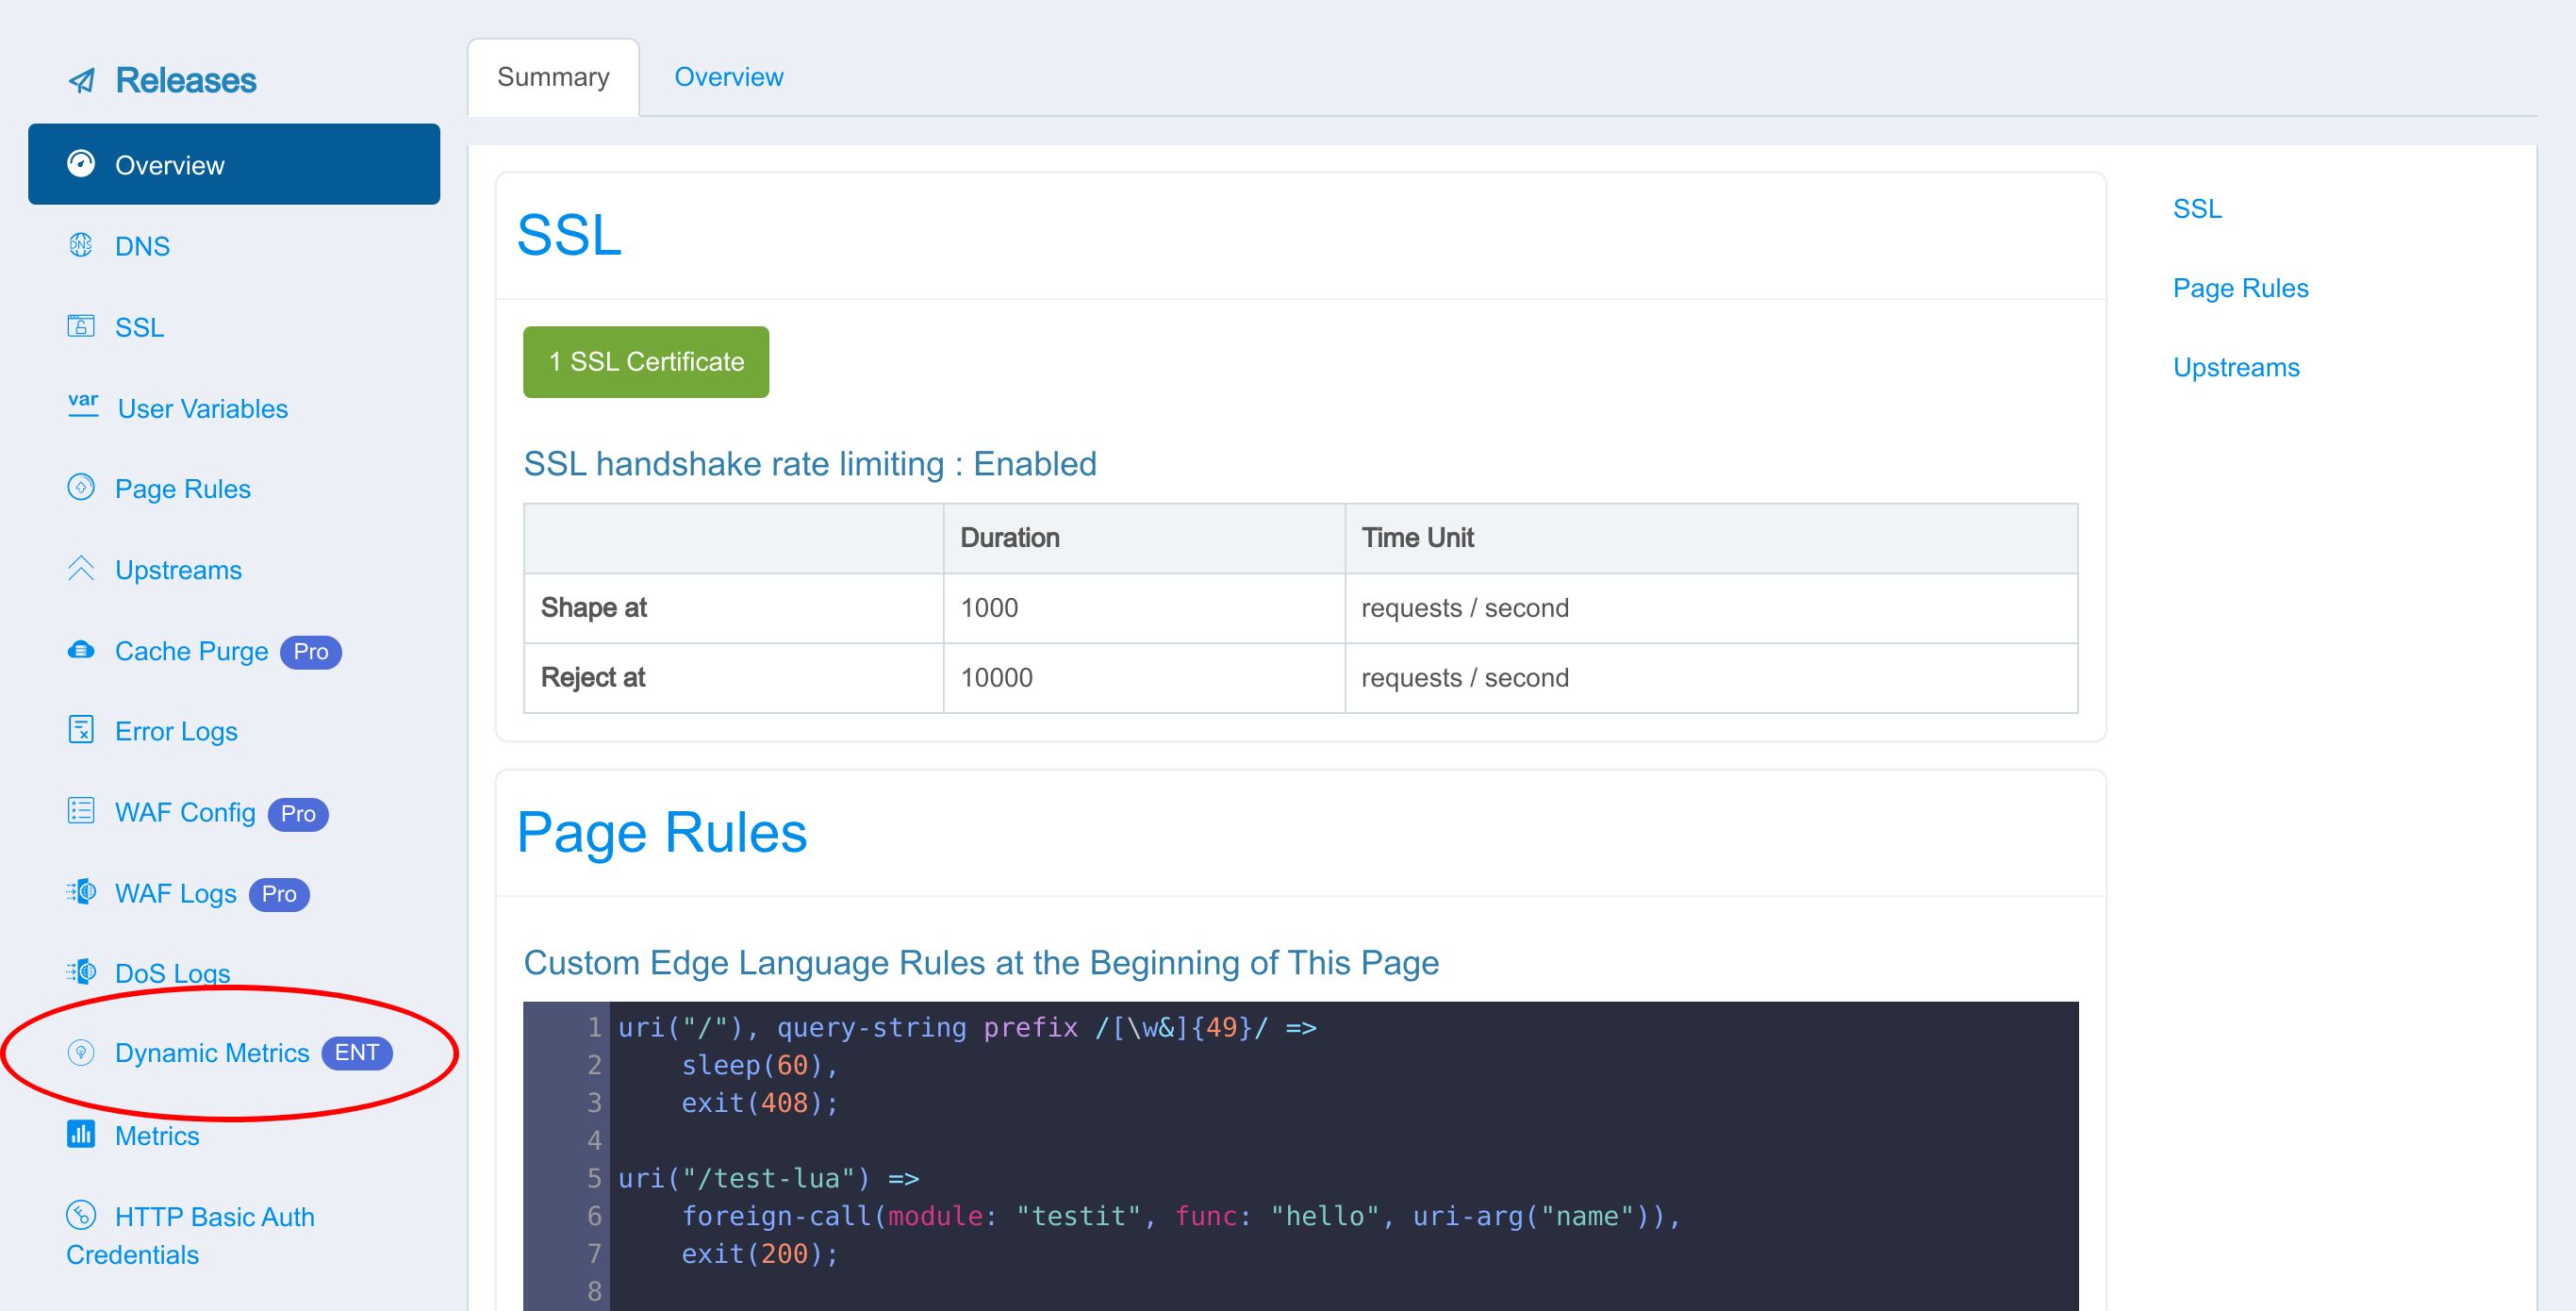
Click this menu to enter Dynamic Metrics page.
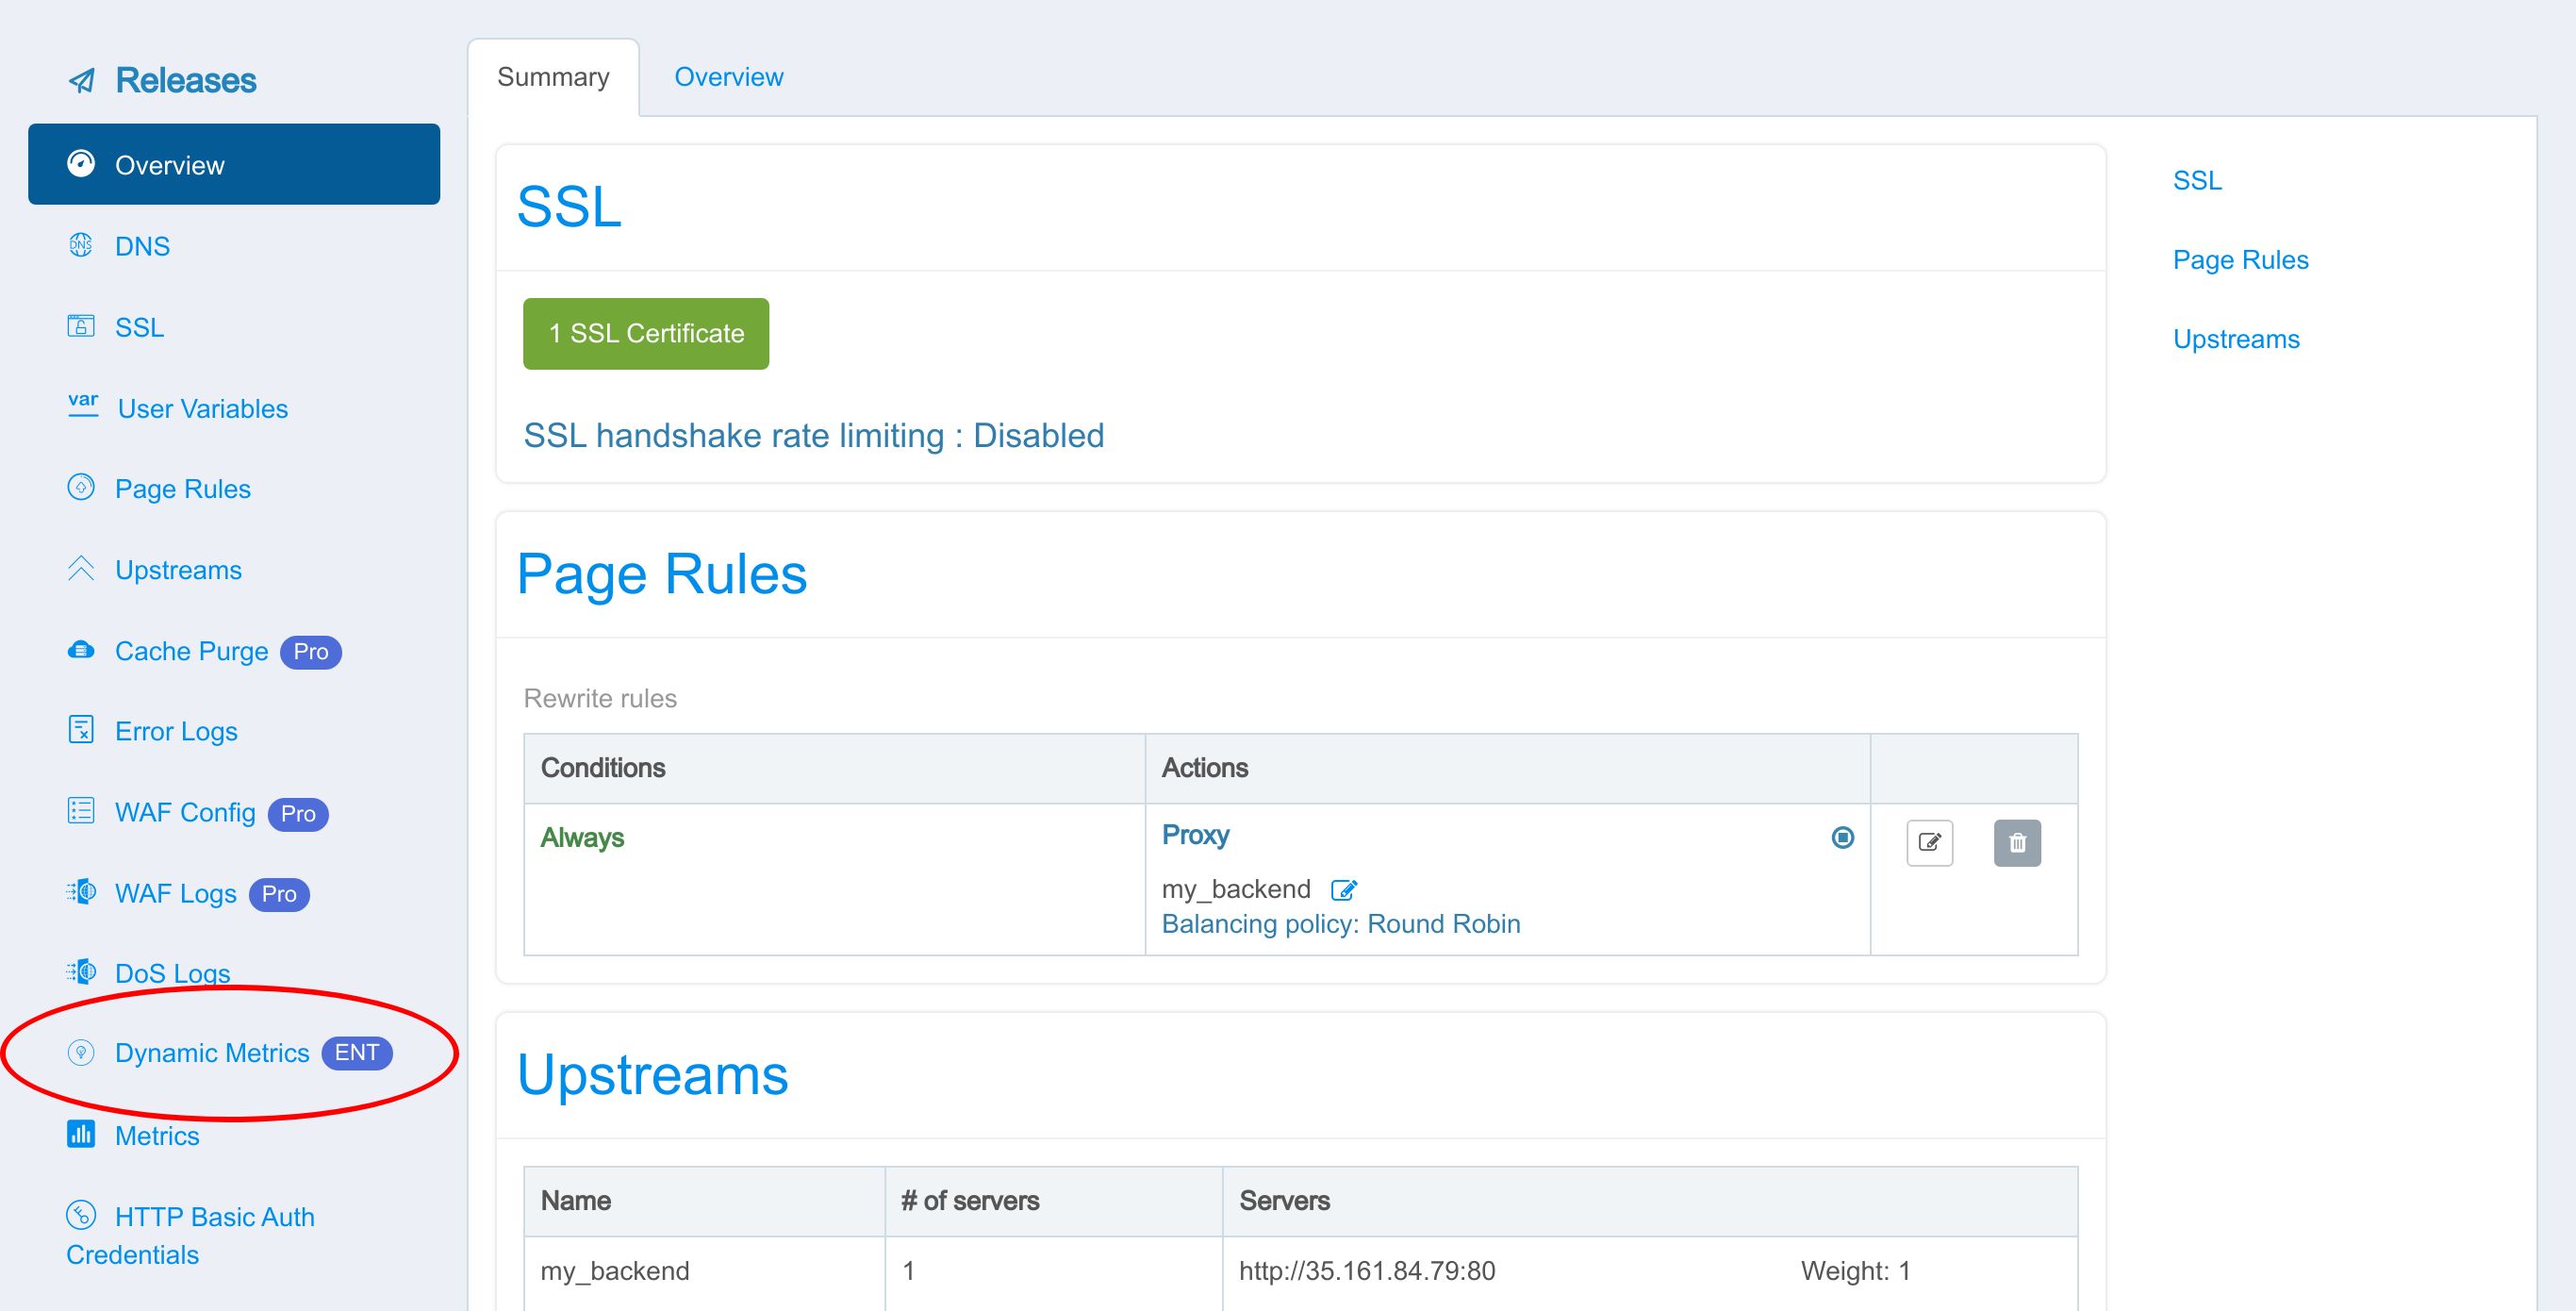
There are two types of dynamic metrics.
One is custom dynamic metrics defined by users.
The other one is standard dynamic metrics predefined by OpenResty Edge.
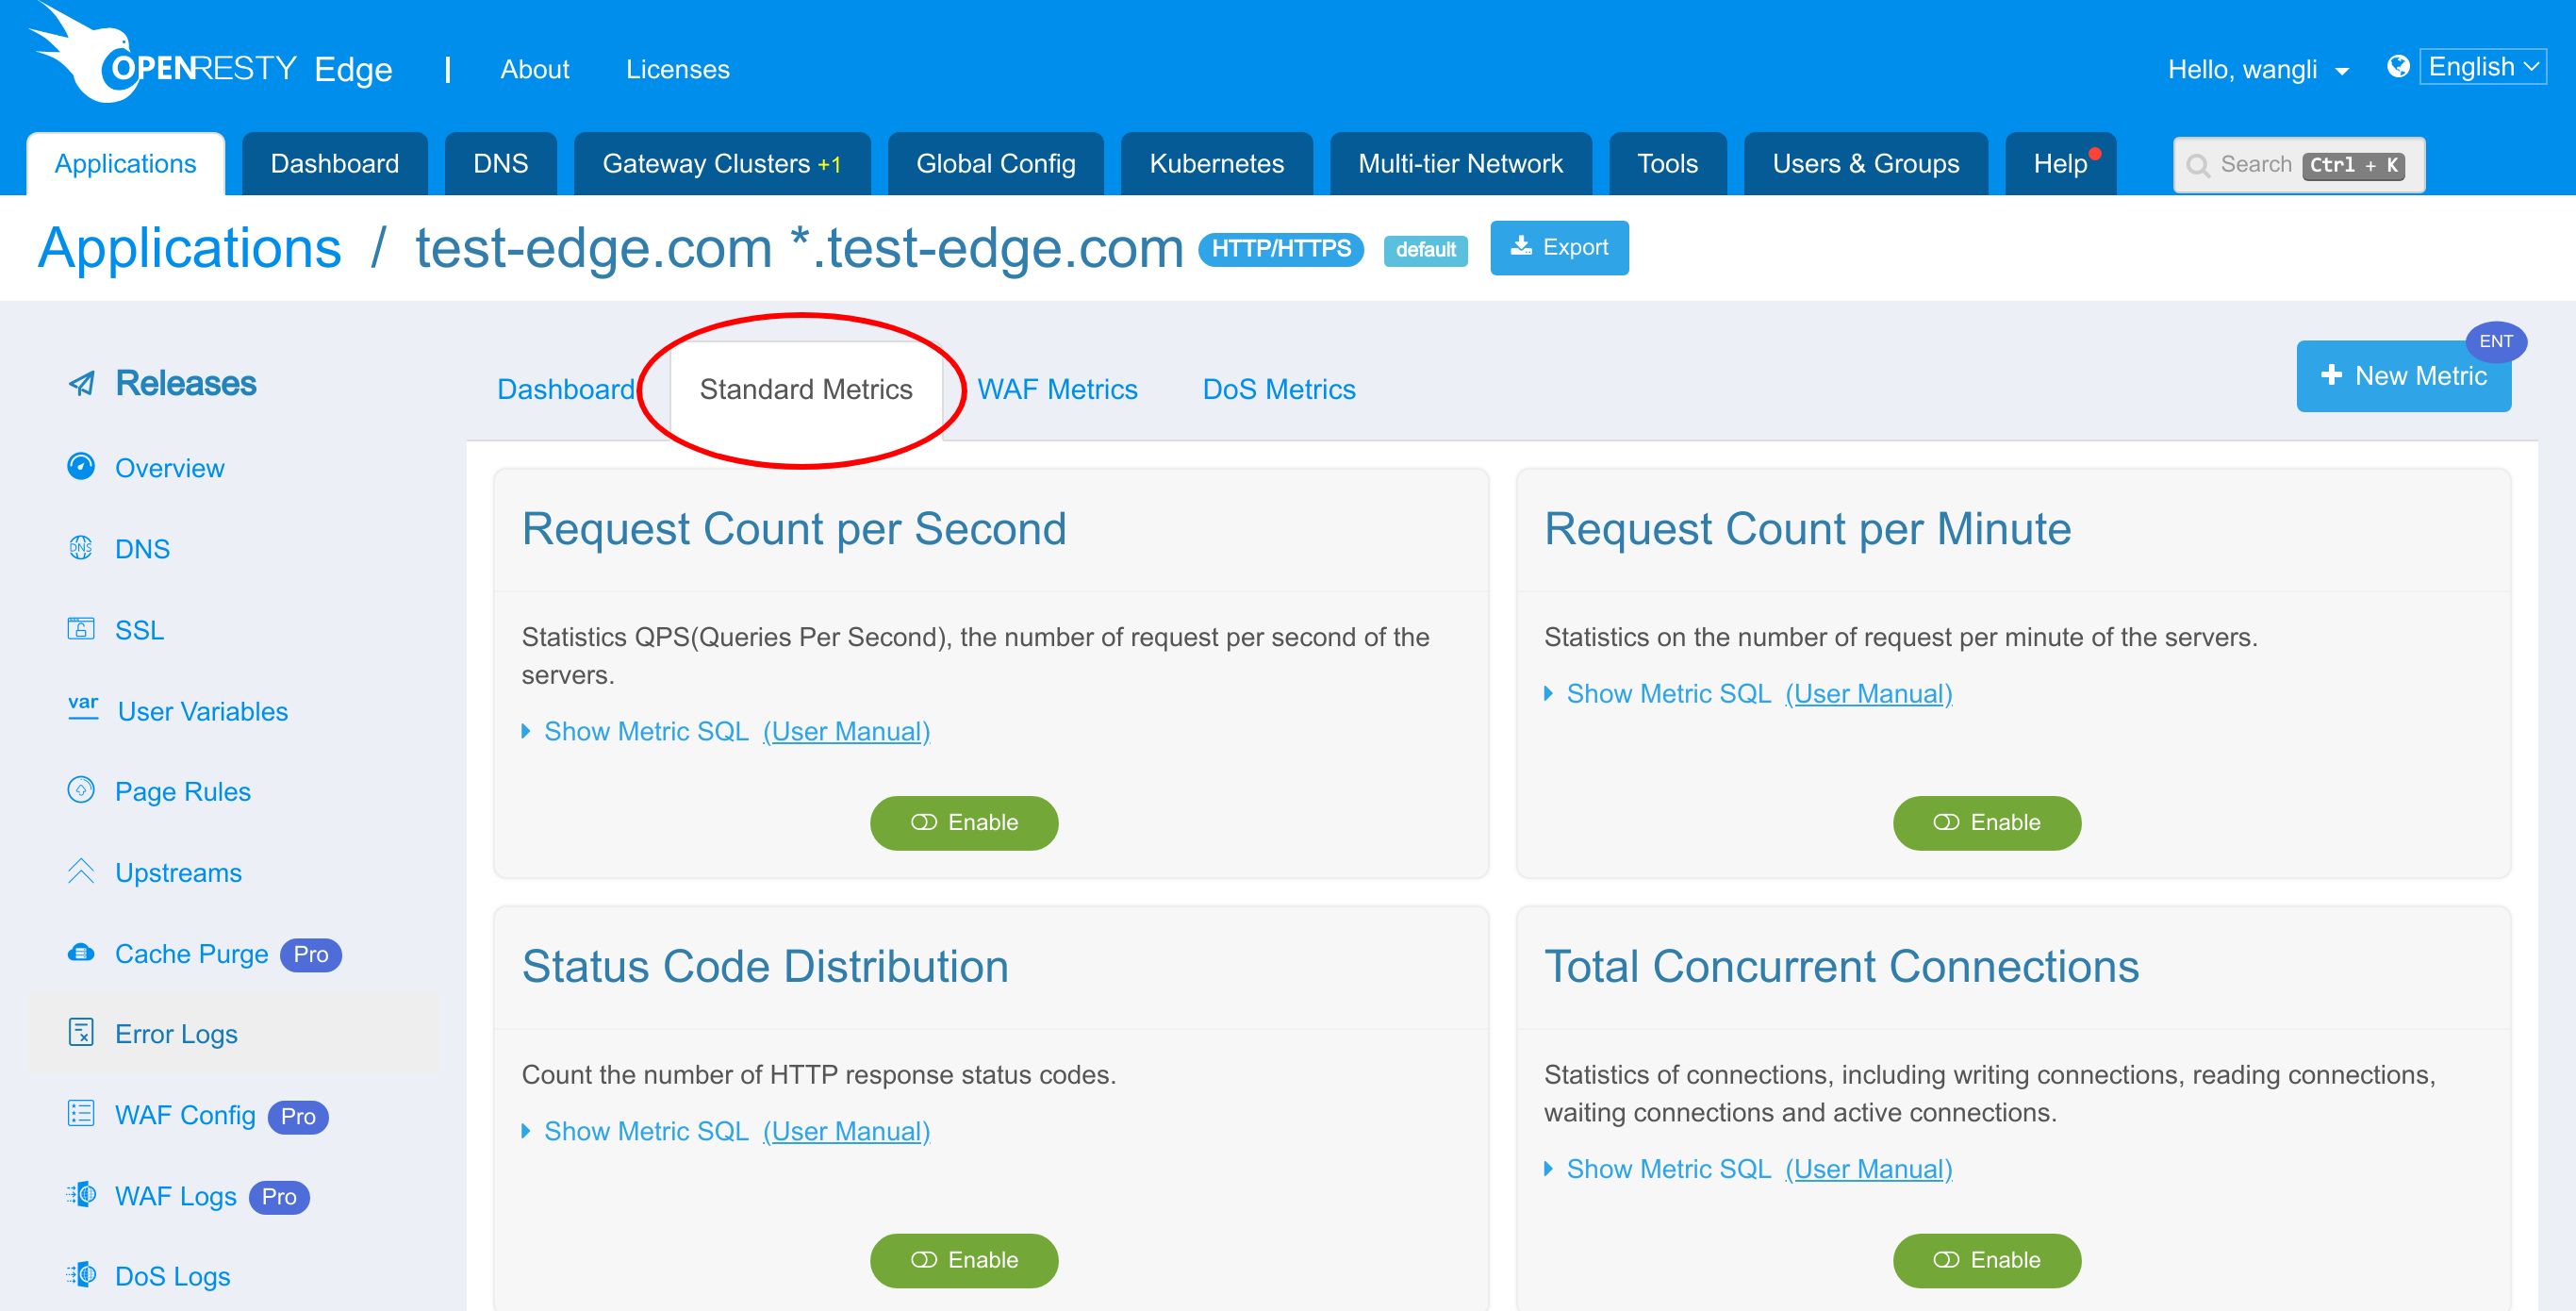
We will focus on the standard ones today. Custom one gets covered in another tutorial.
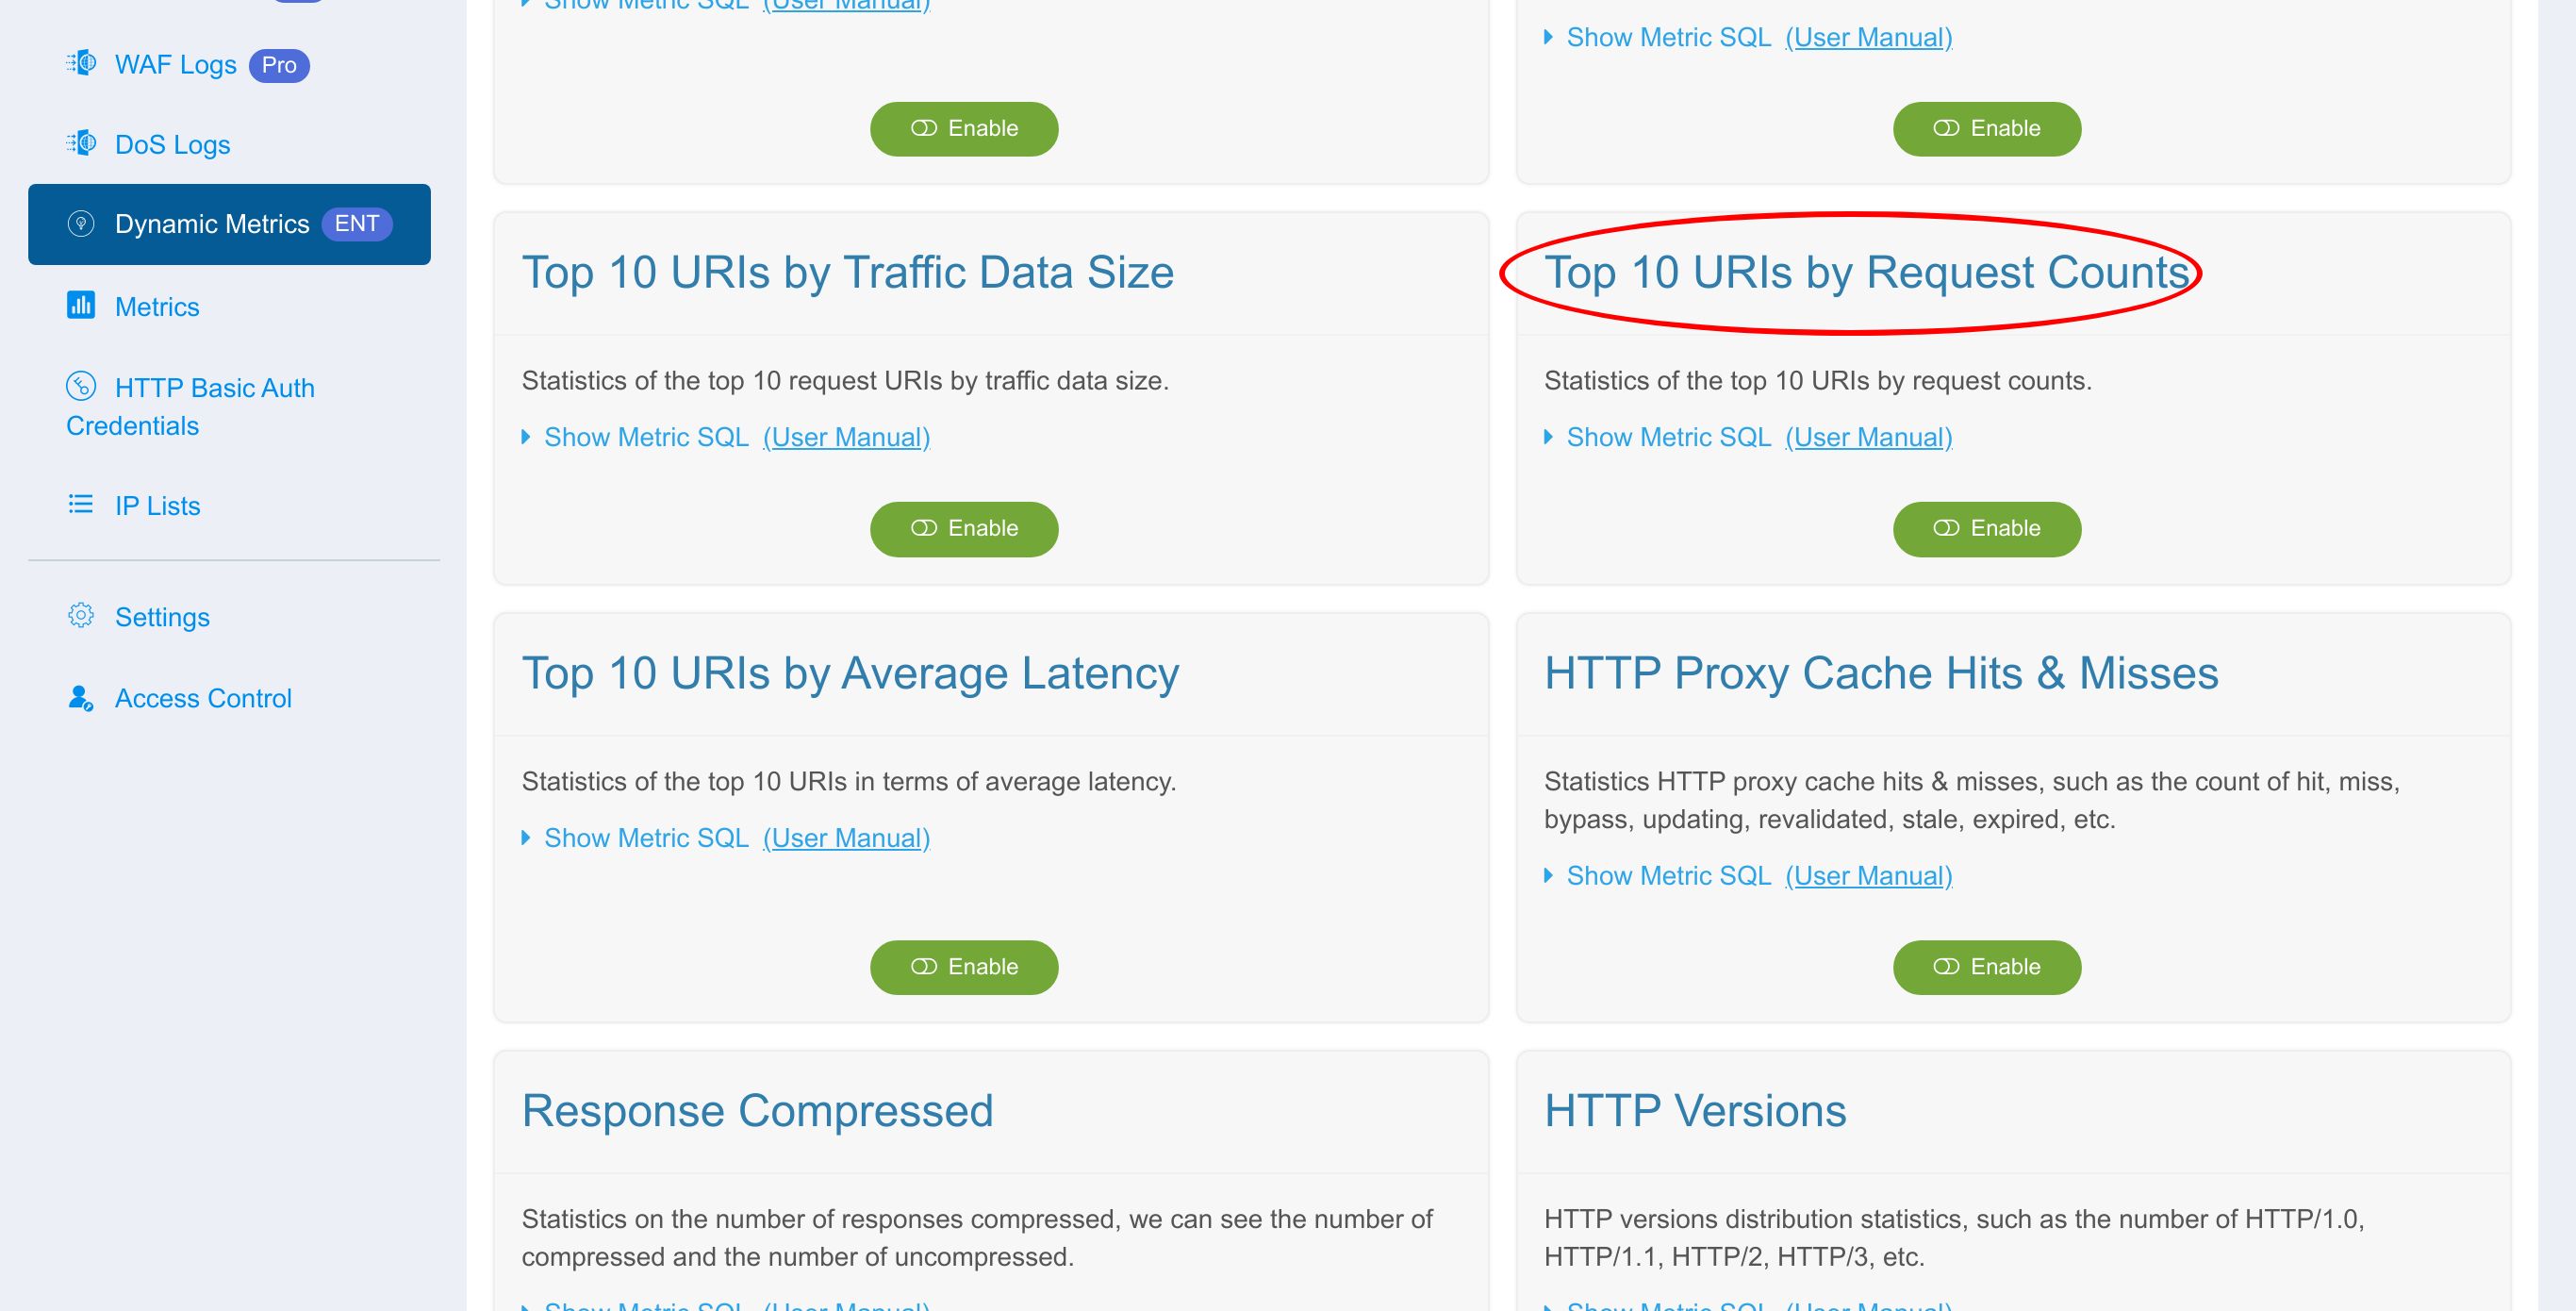
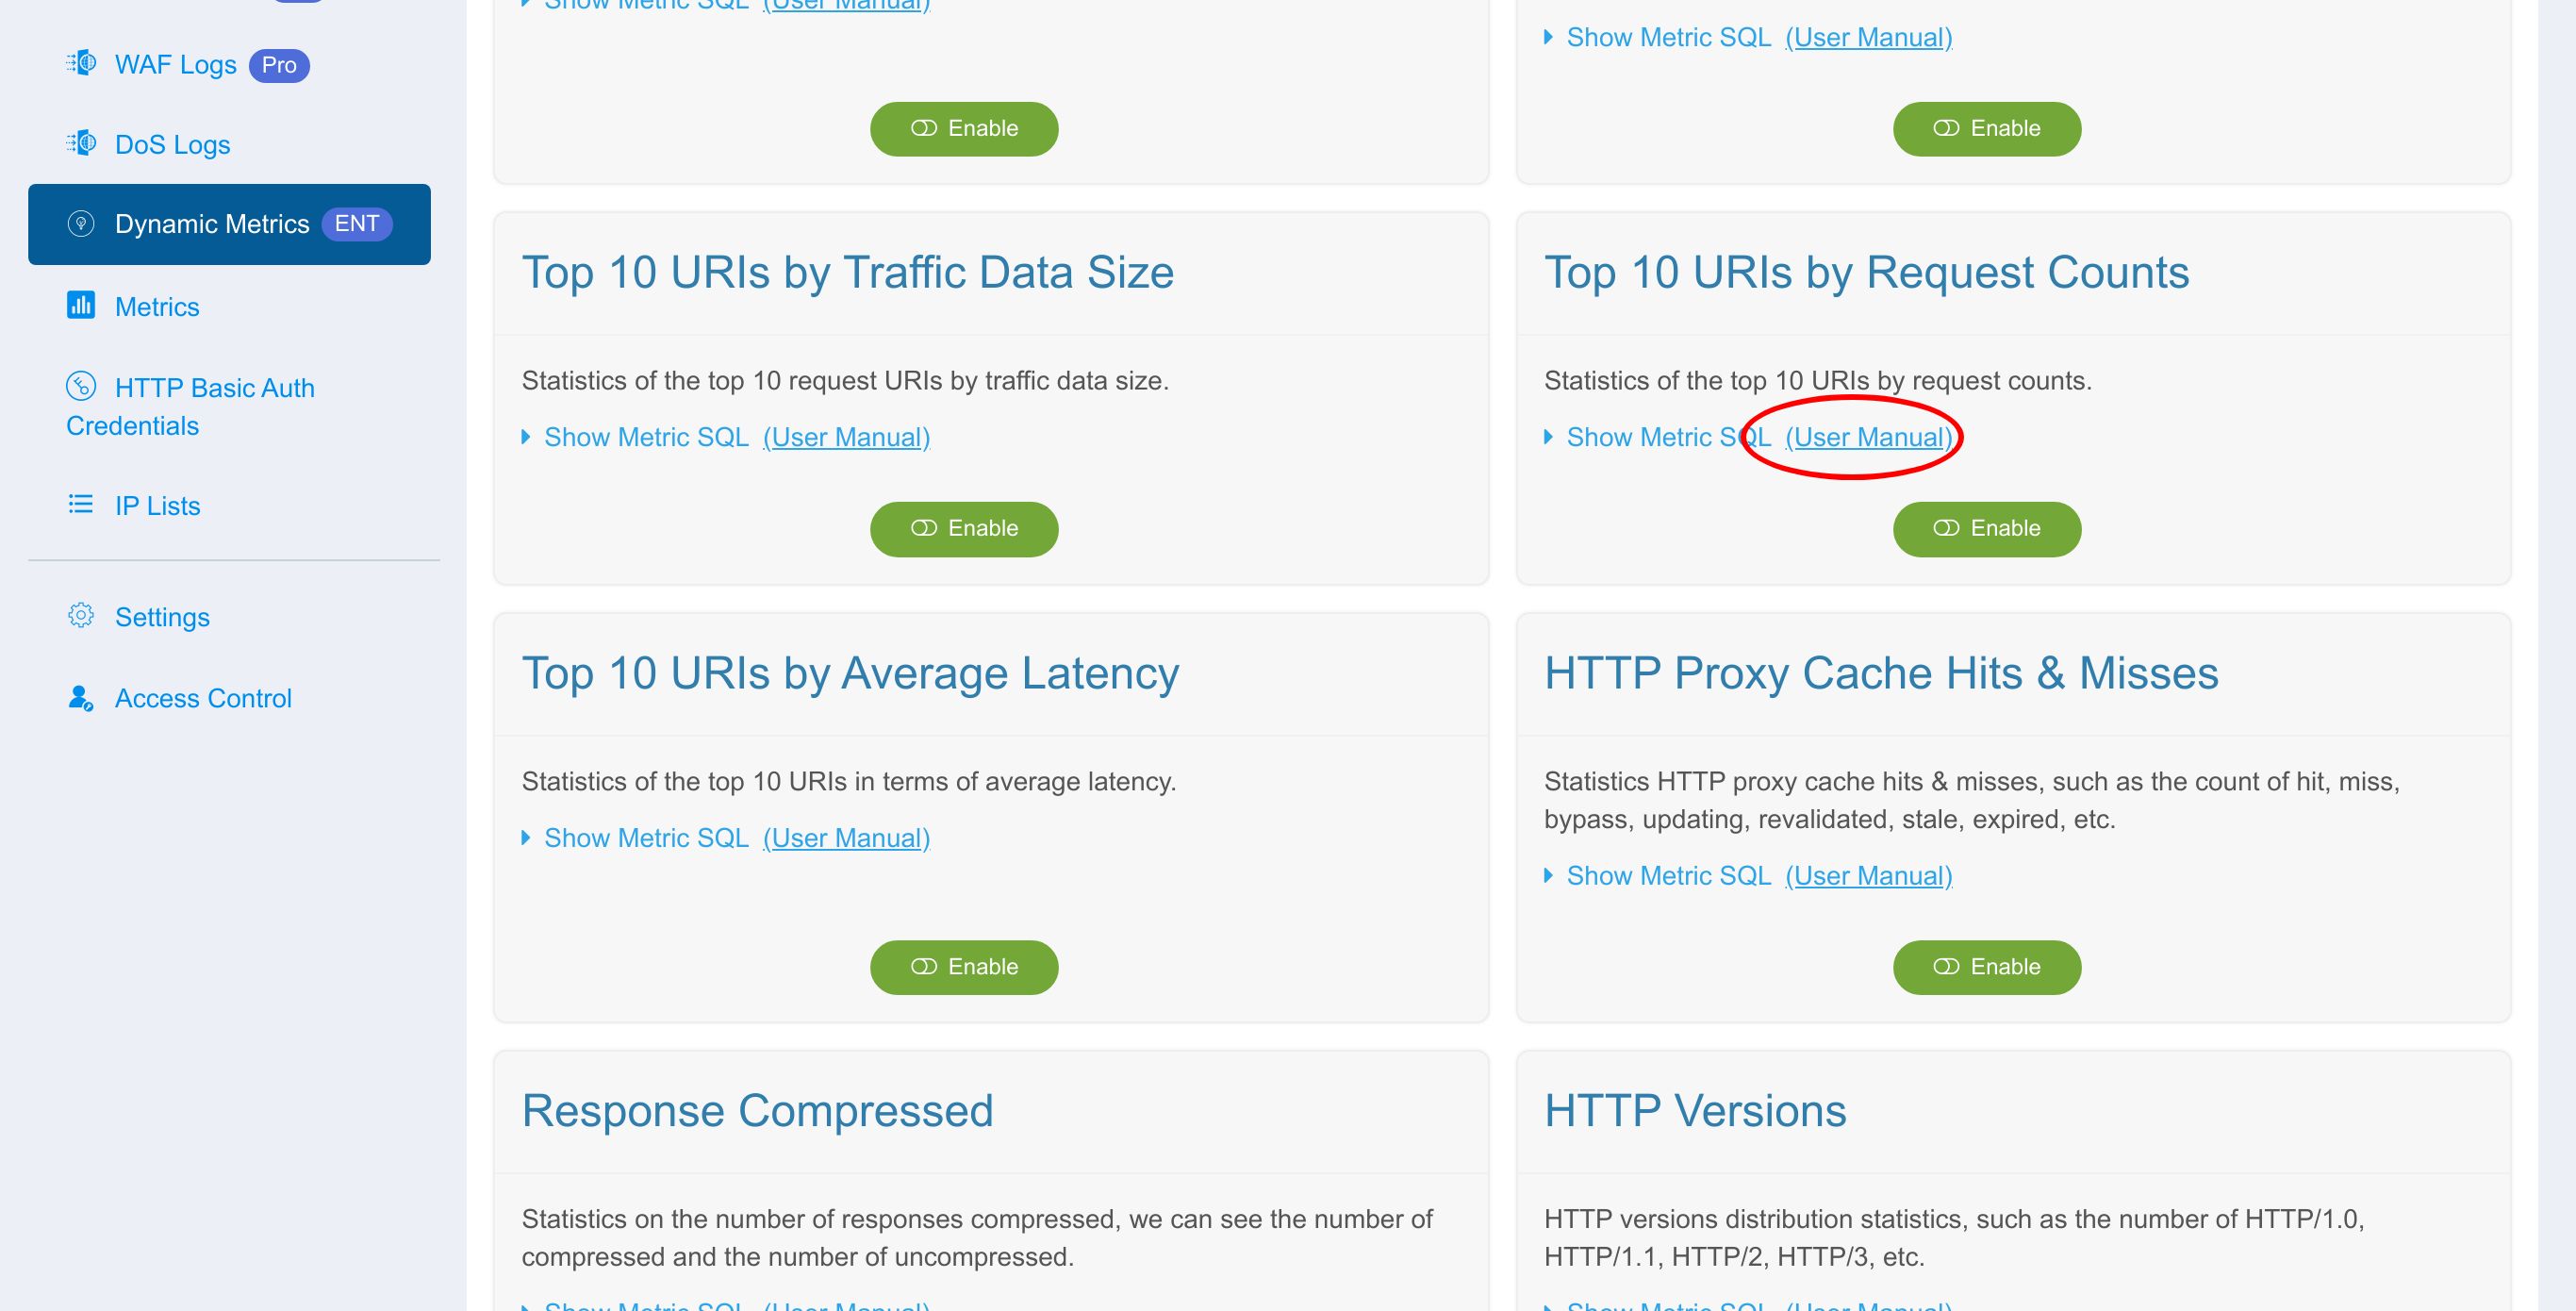
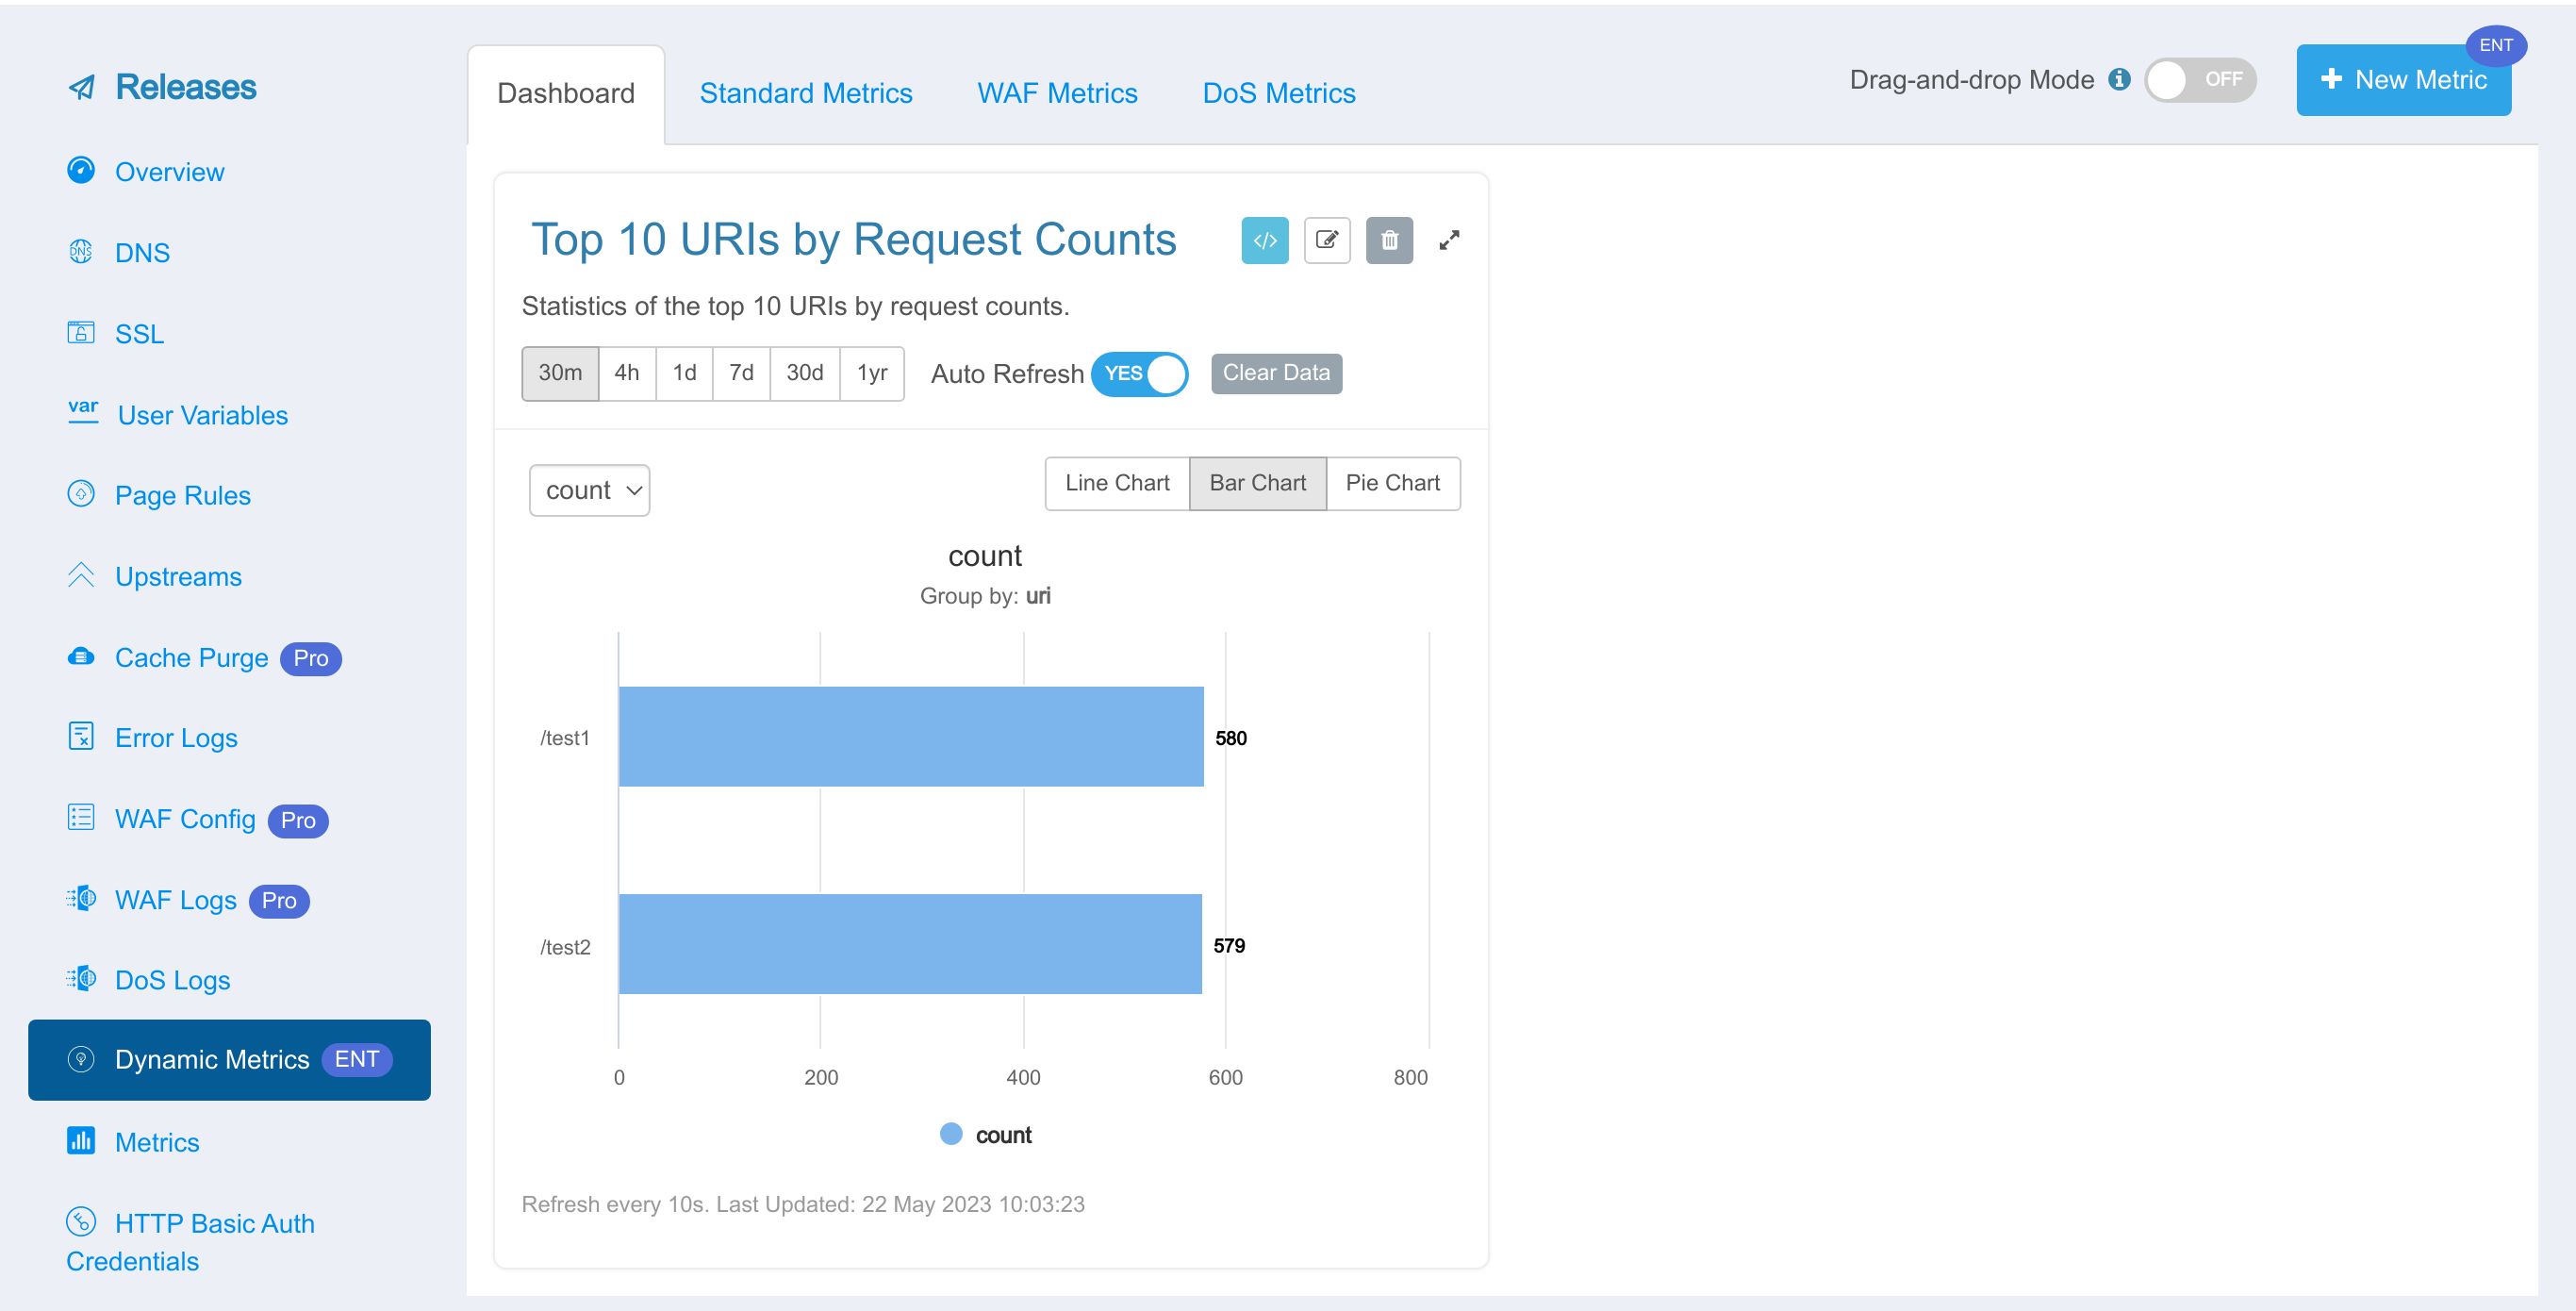
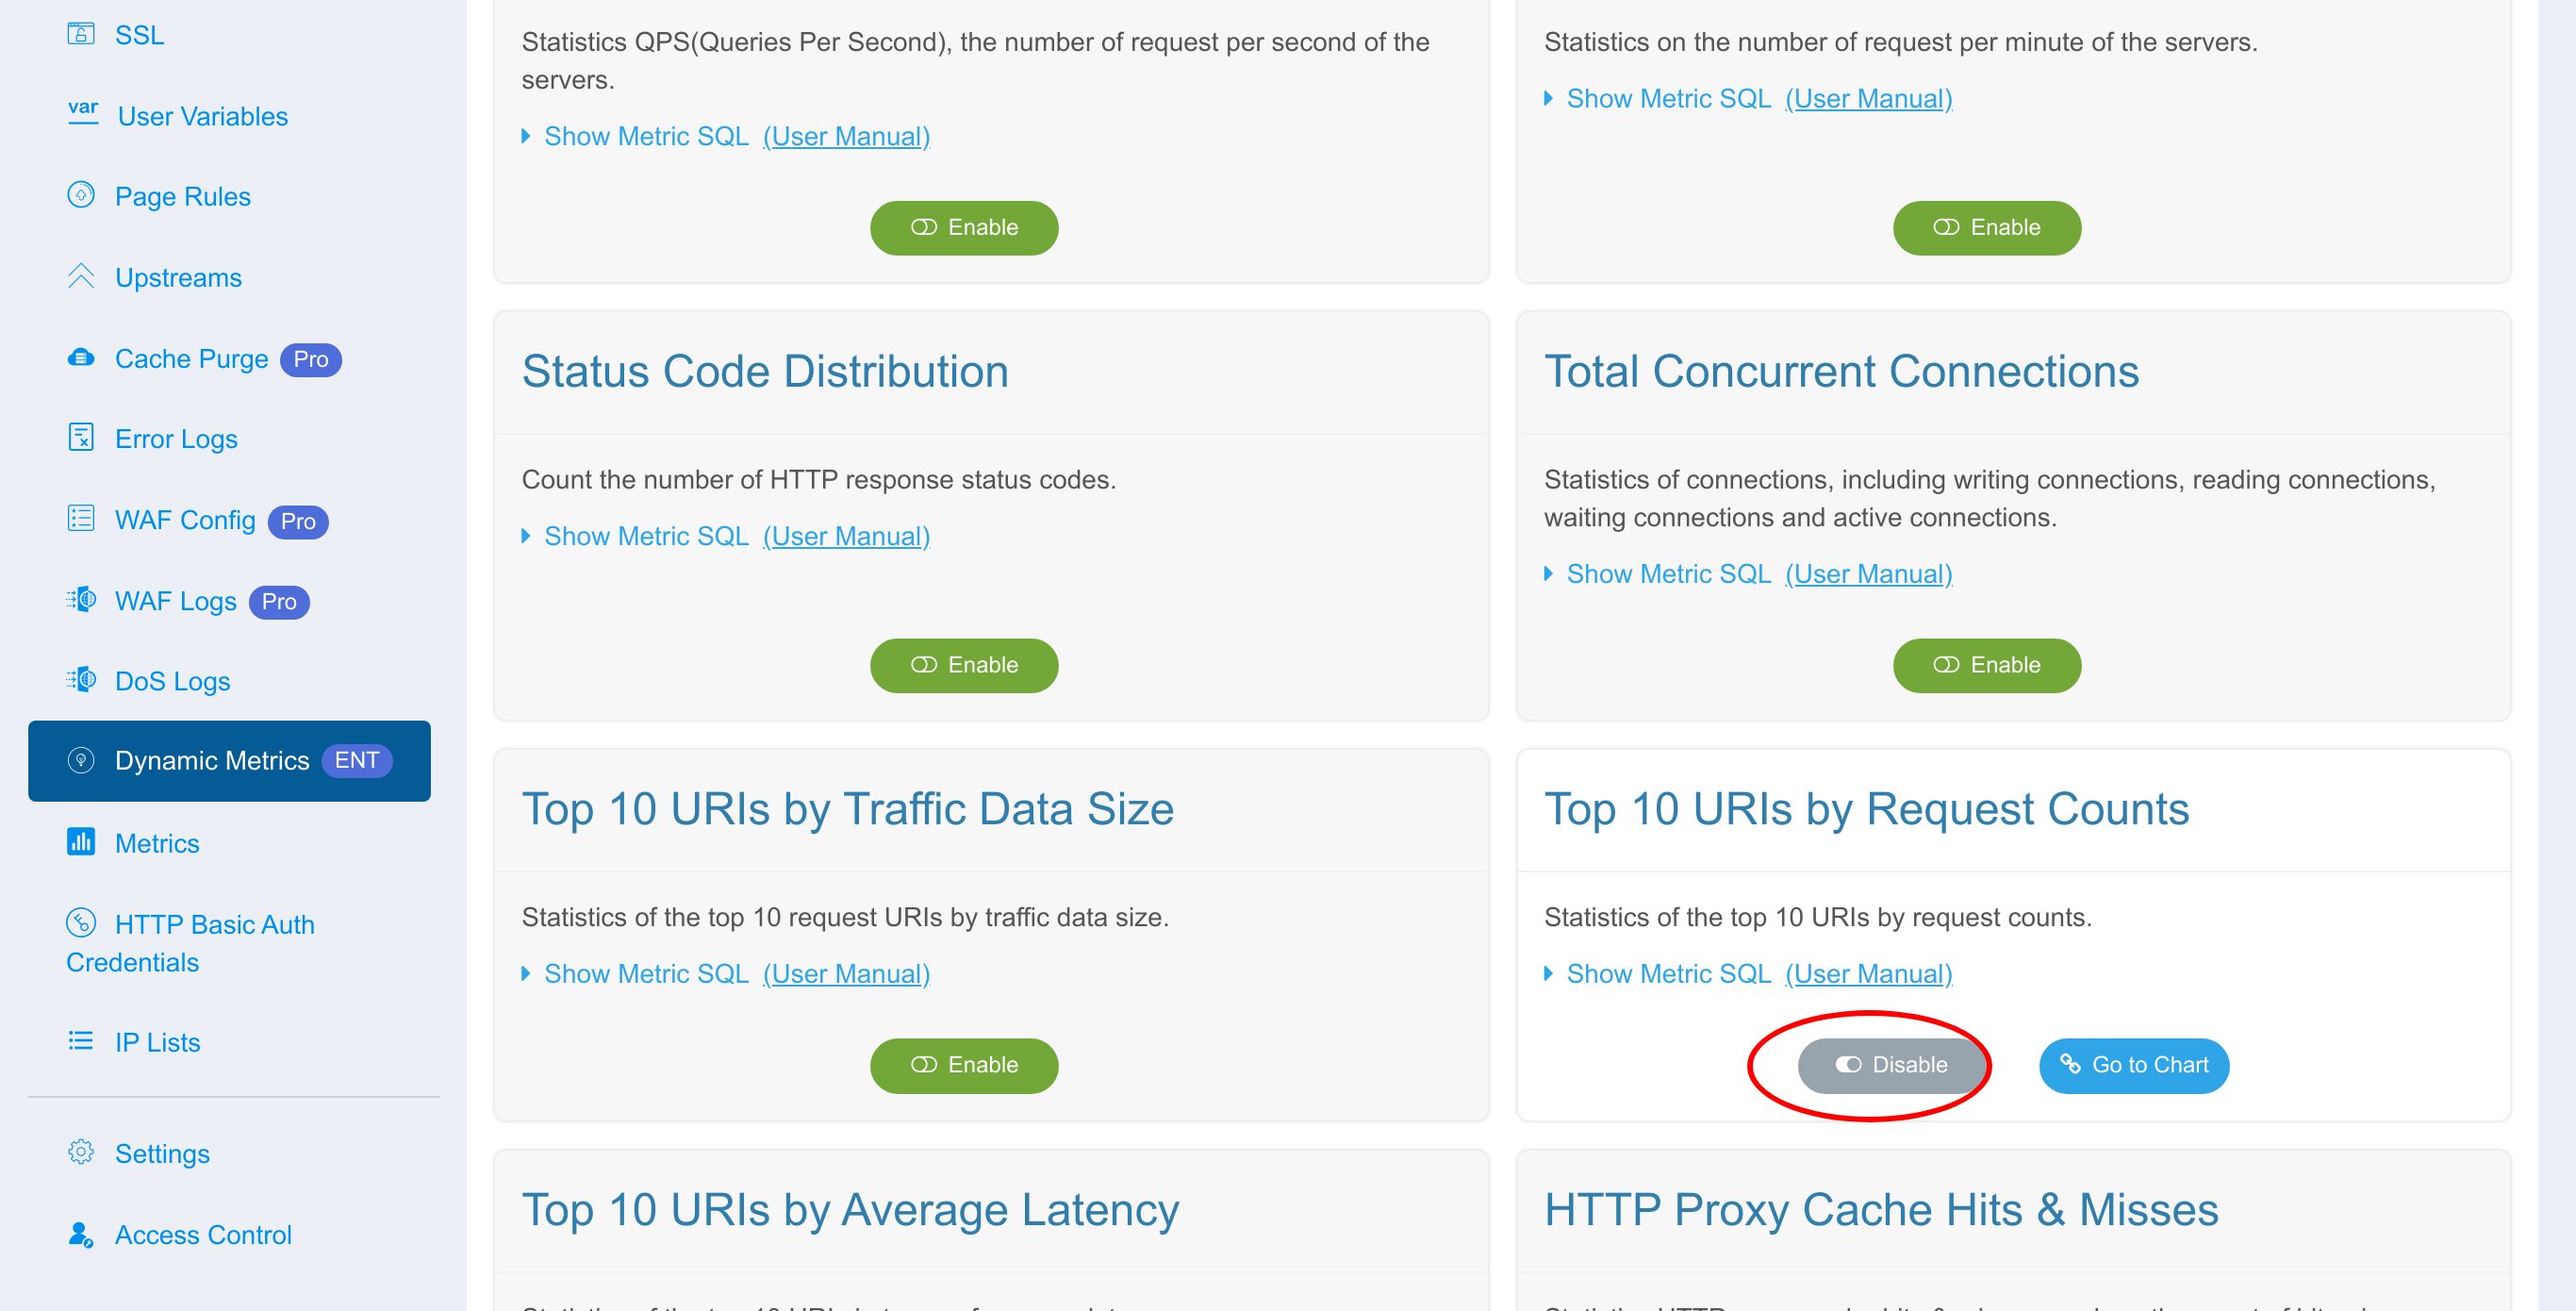
We use the metric “Top 10 URIs by Request Counts” as an example to explain how to enable a standard dynamic metric and how dynamic metrics work.
We use the Metric SQL language provided in the OpenResty Edge Platform. You can find the user manual on our documentation site.
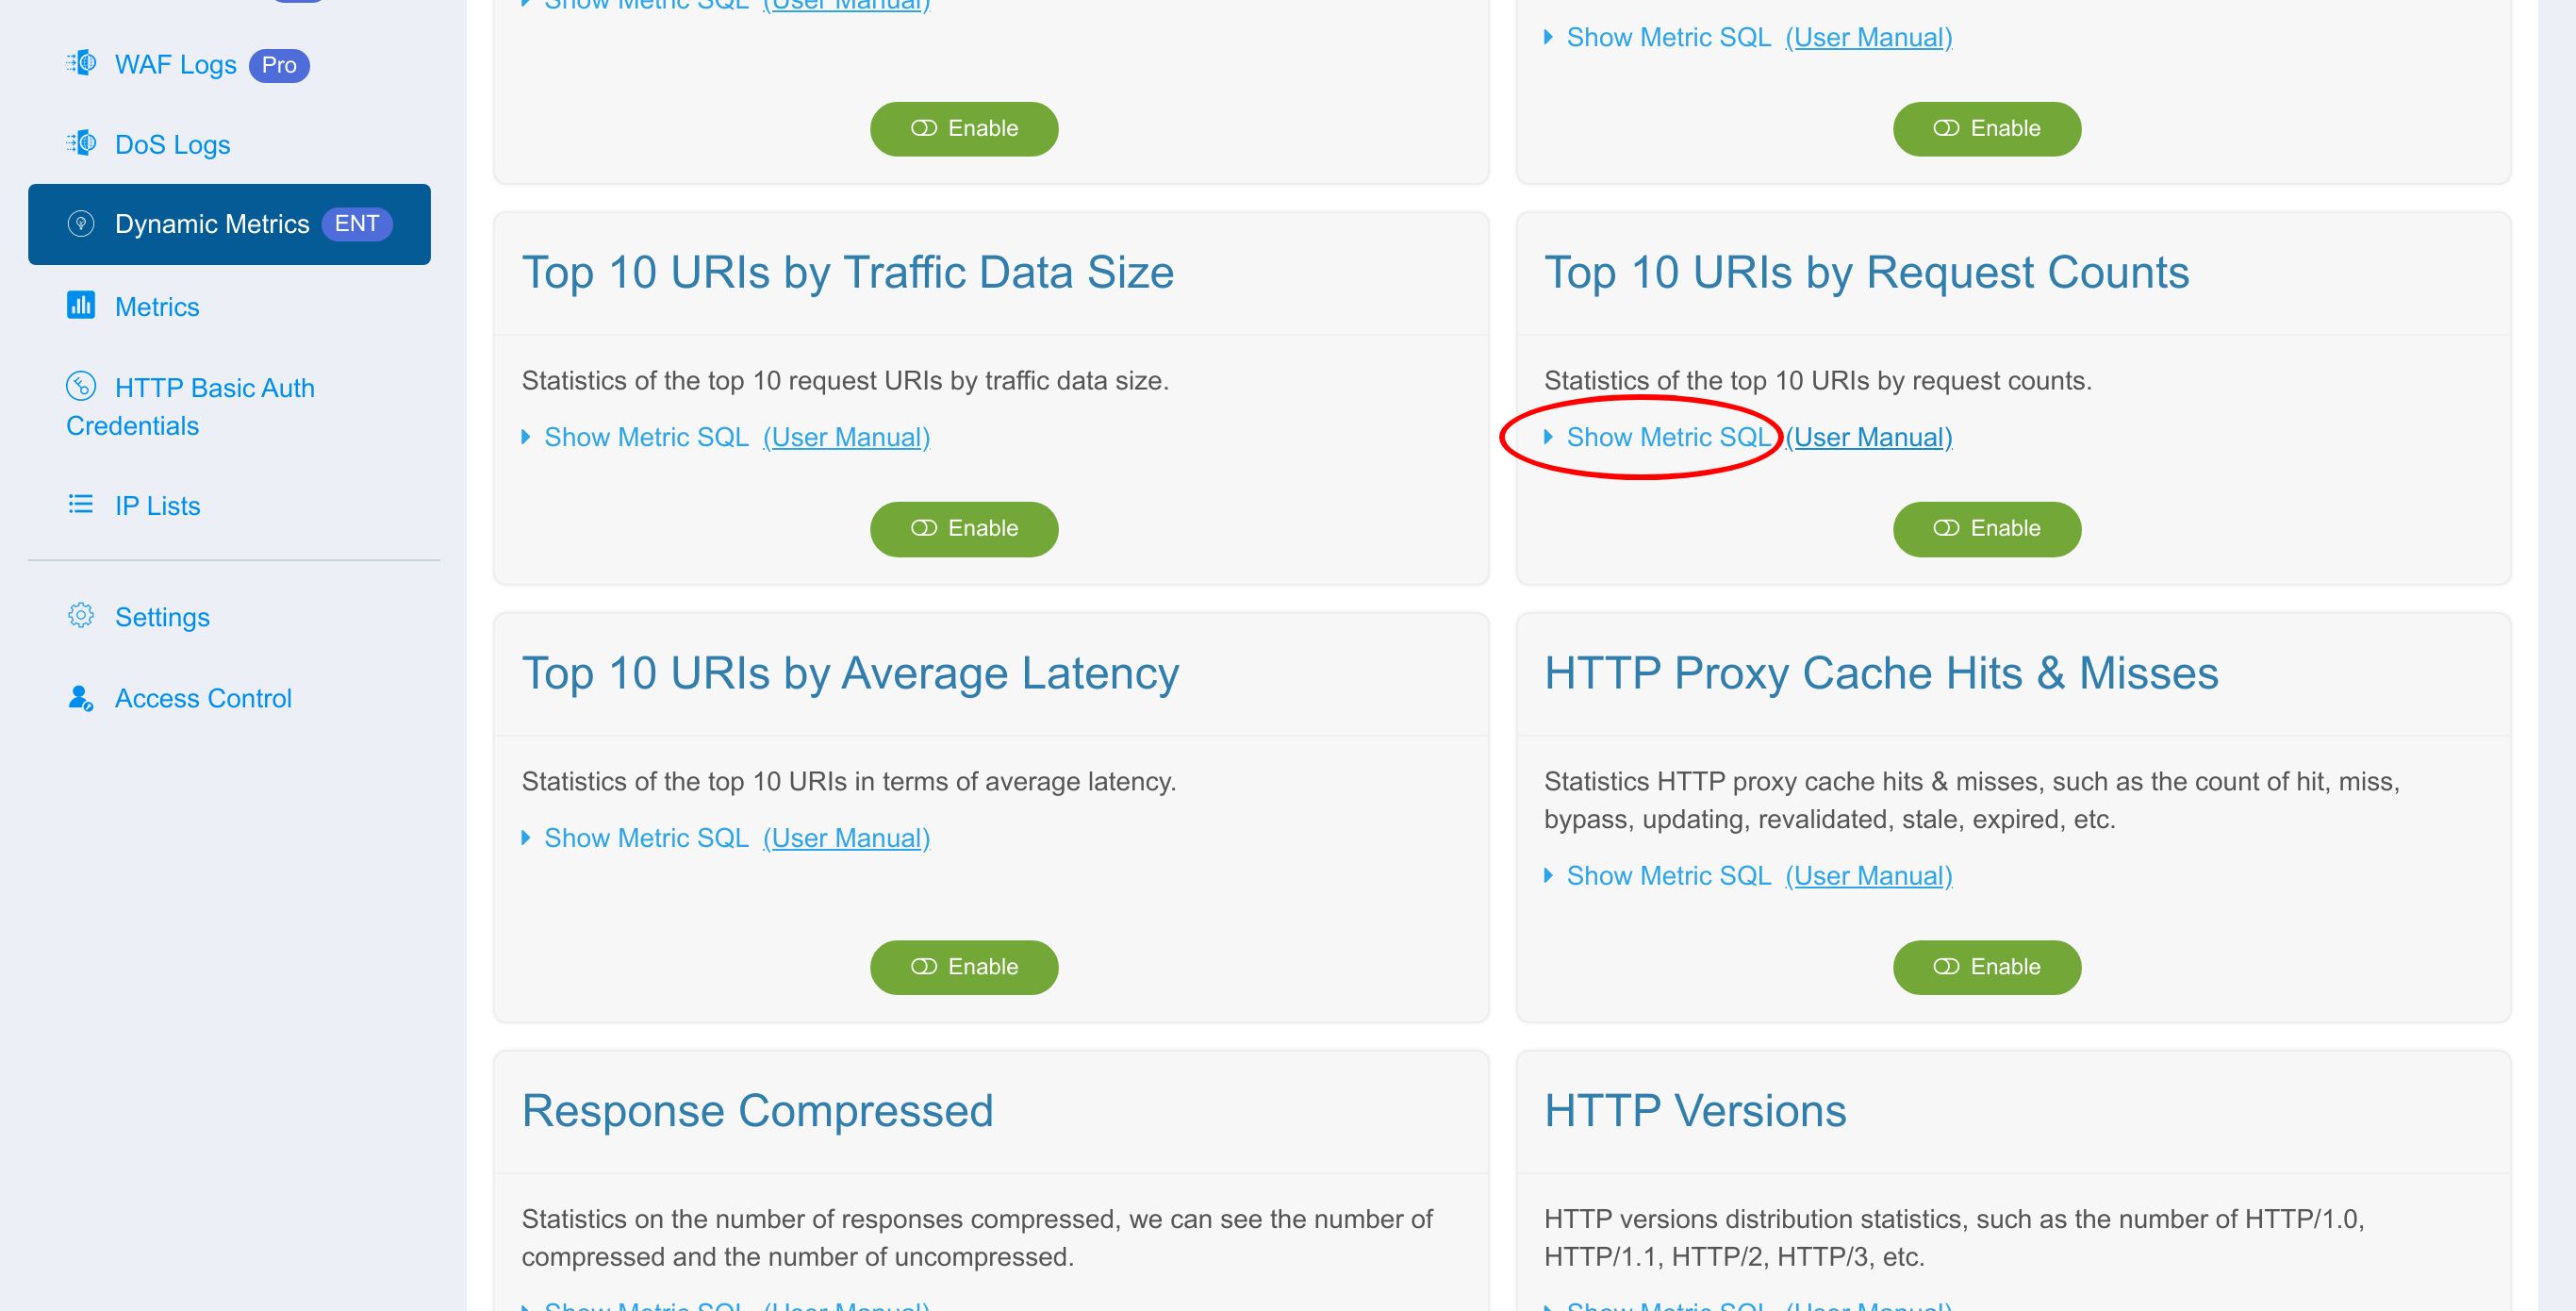
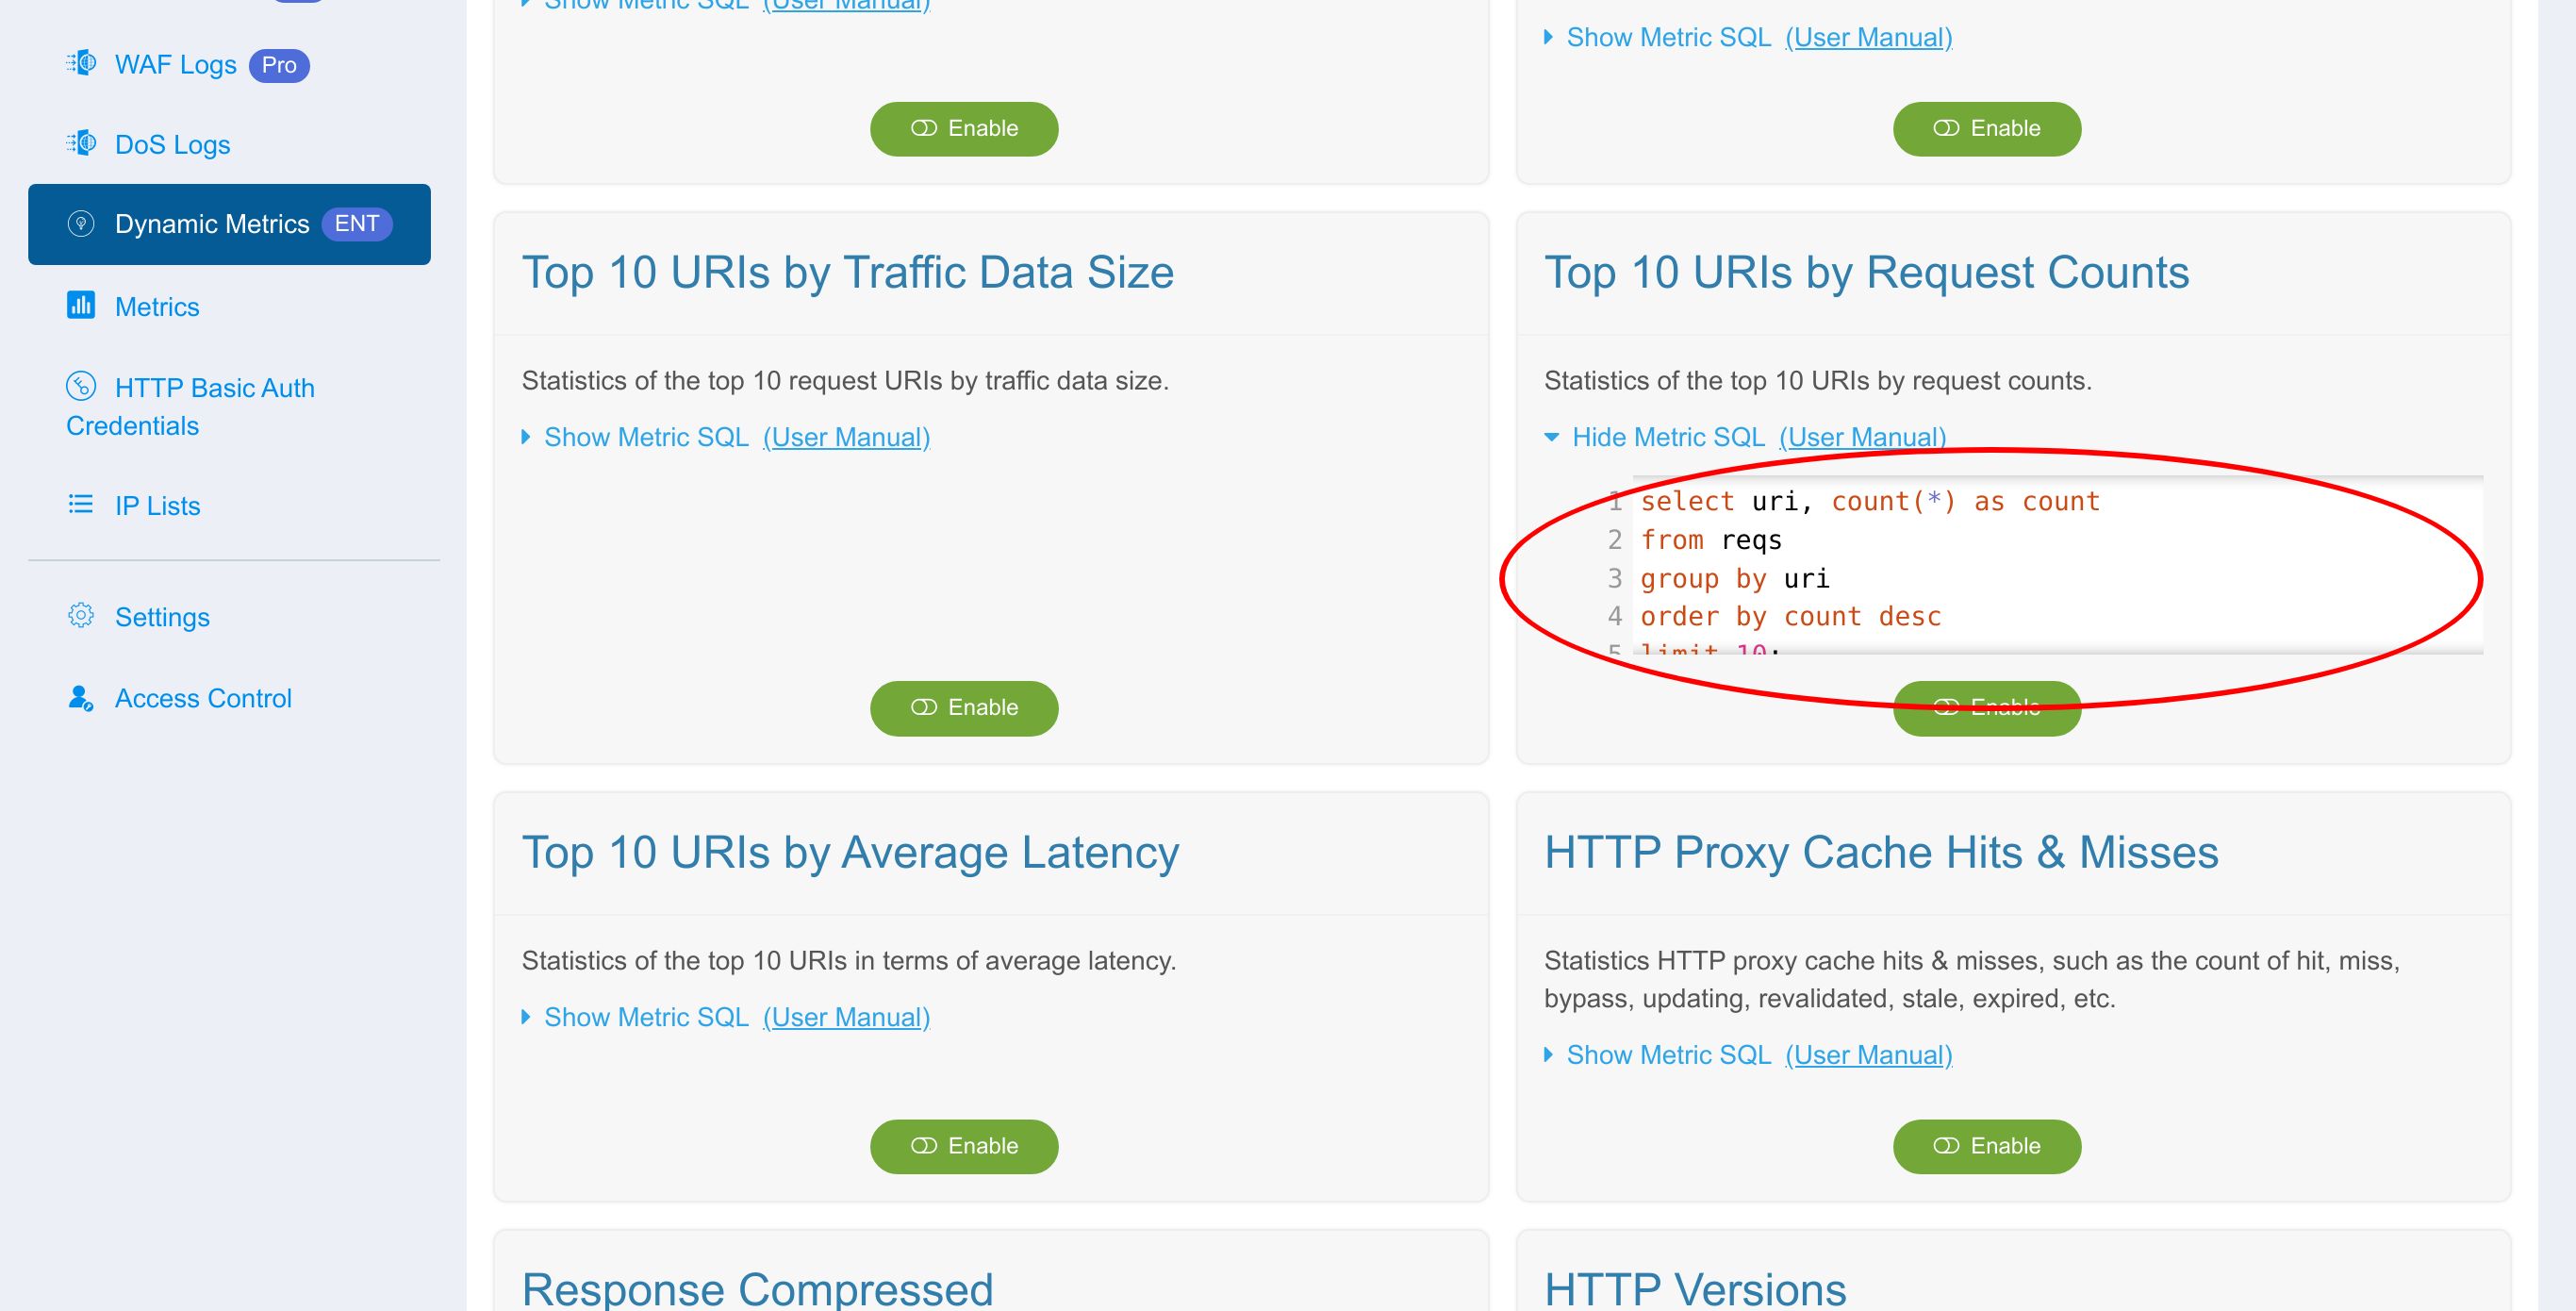
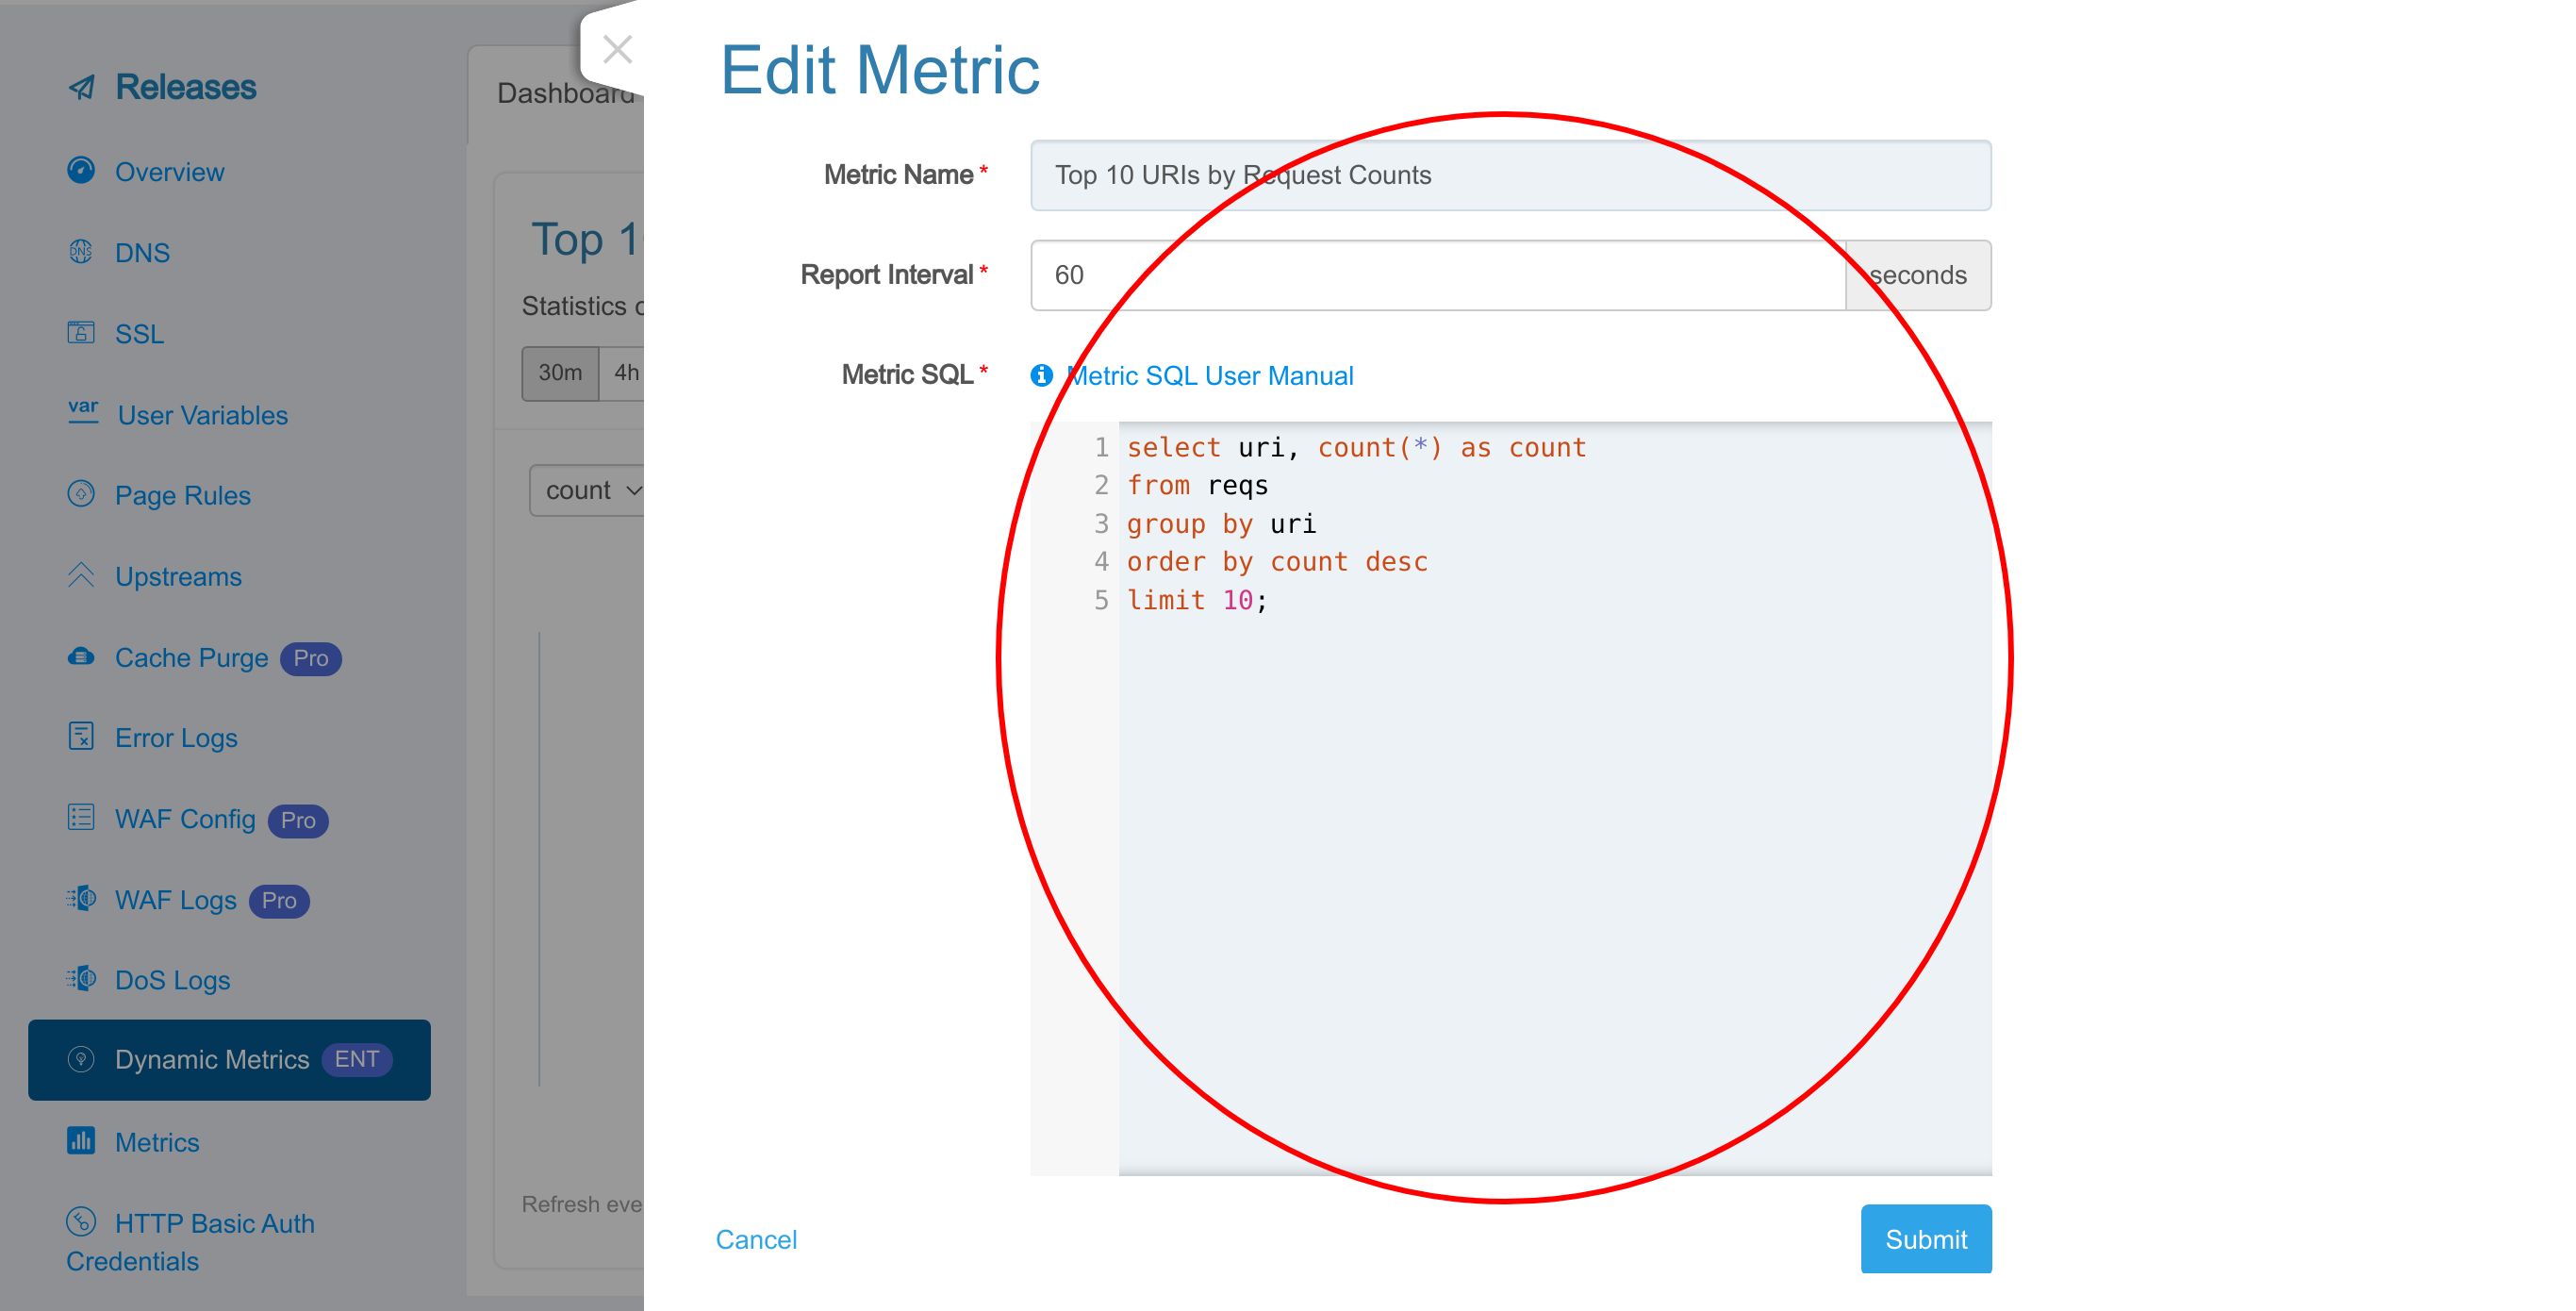
Let’s see the Metric SQL statement of this metric.
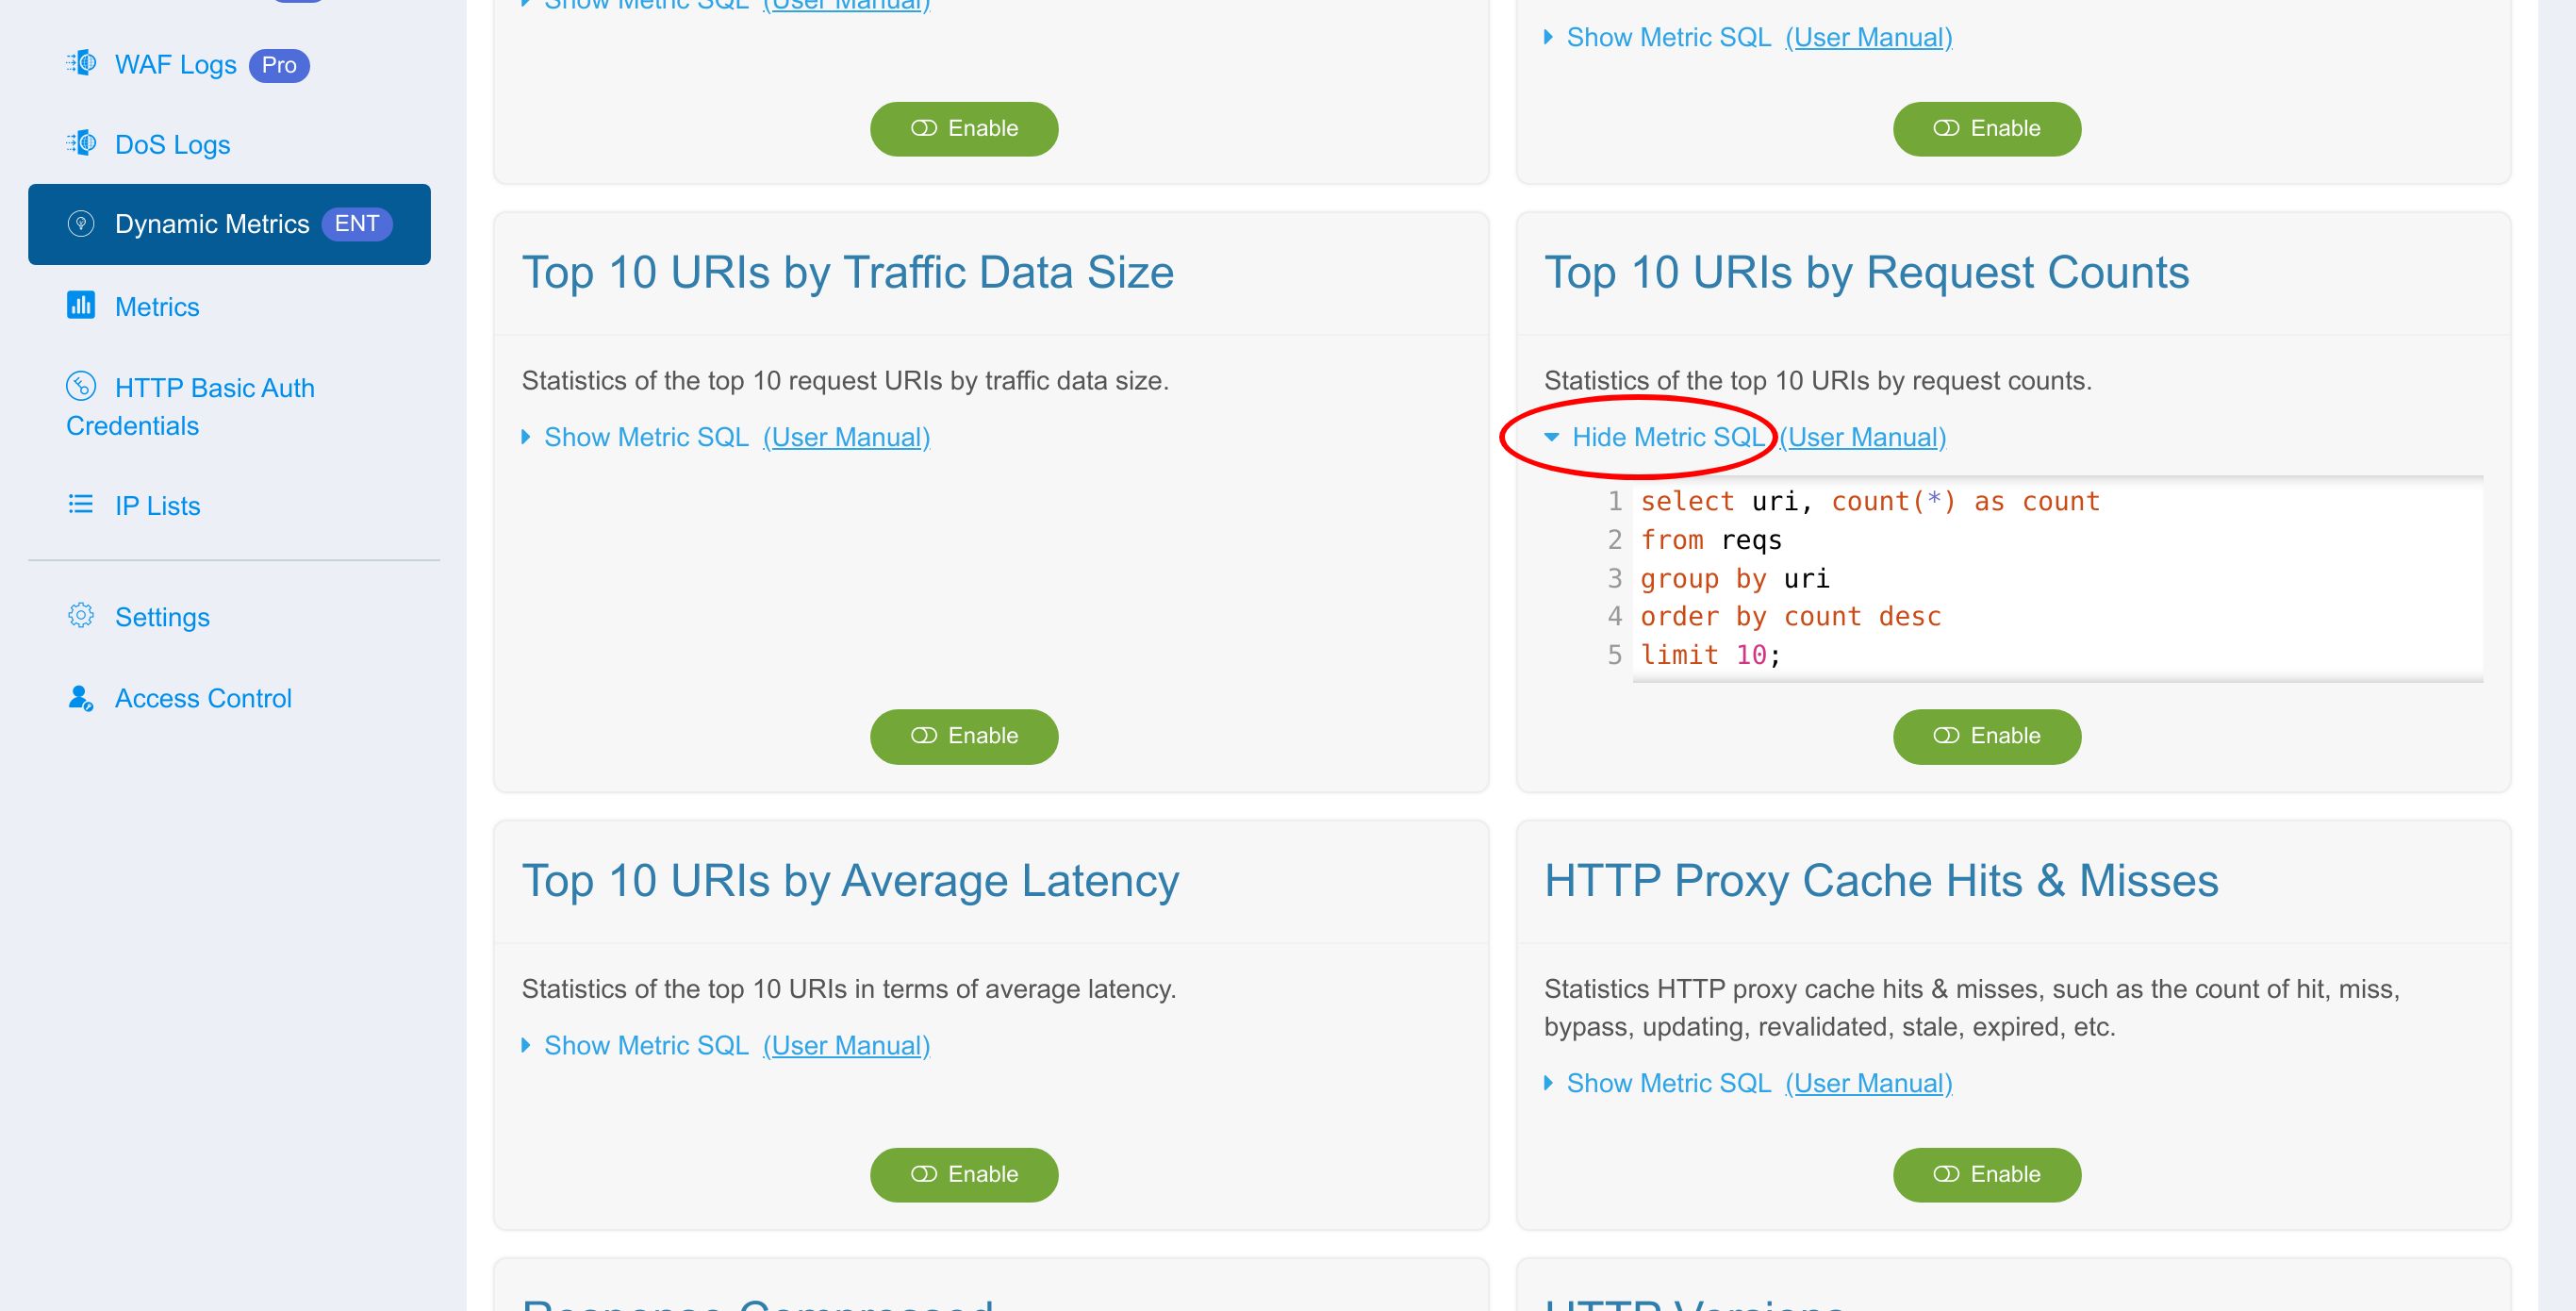
It groups all requests by their URIs, sorts them in descending order and selects the ten highest ones to display.
You can click this button to hide the Metric SQL statement.
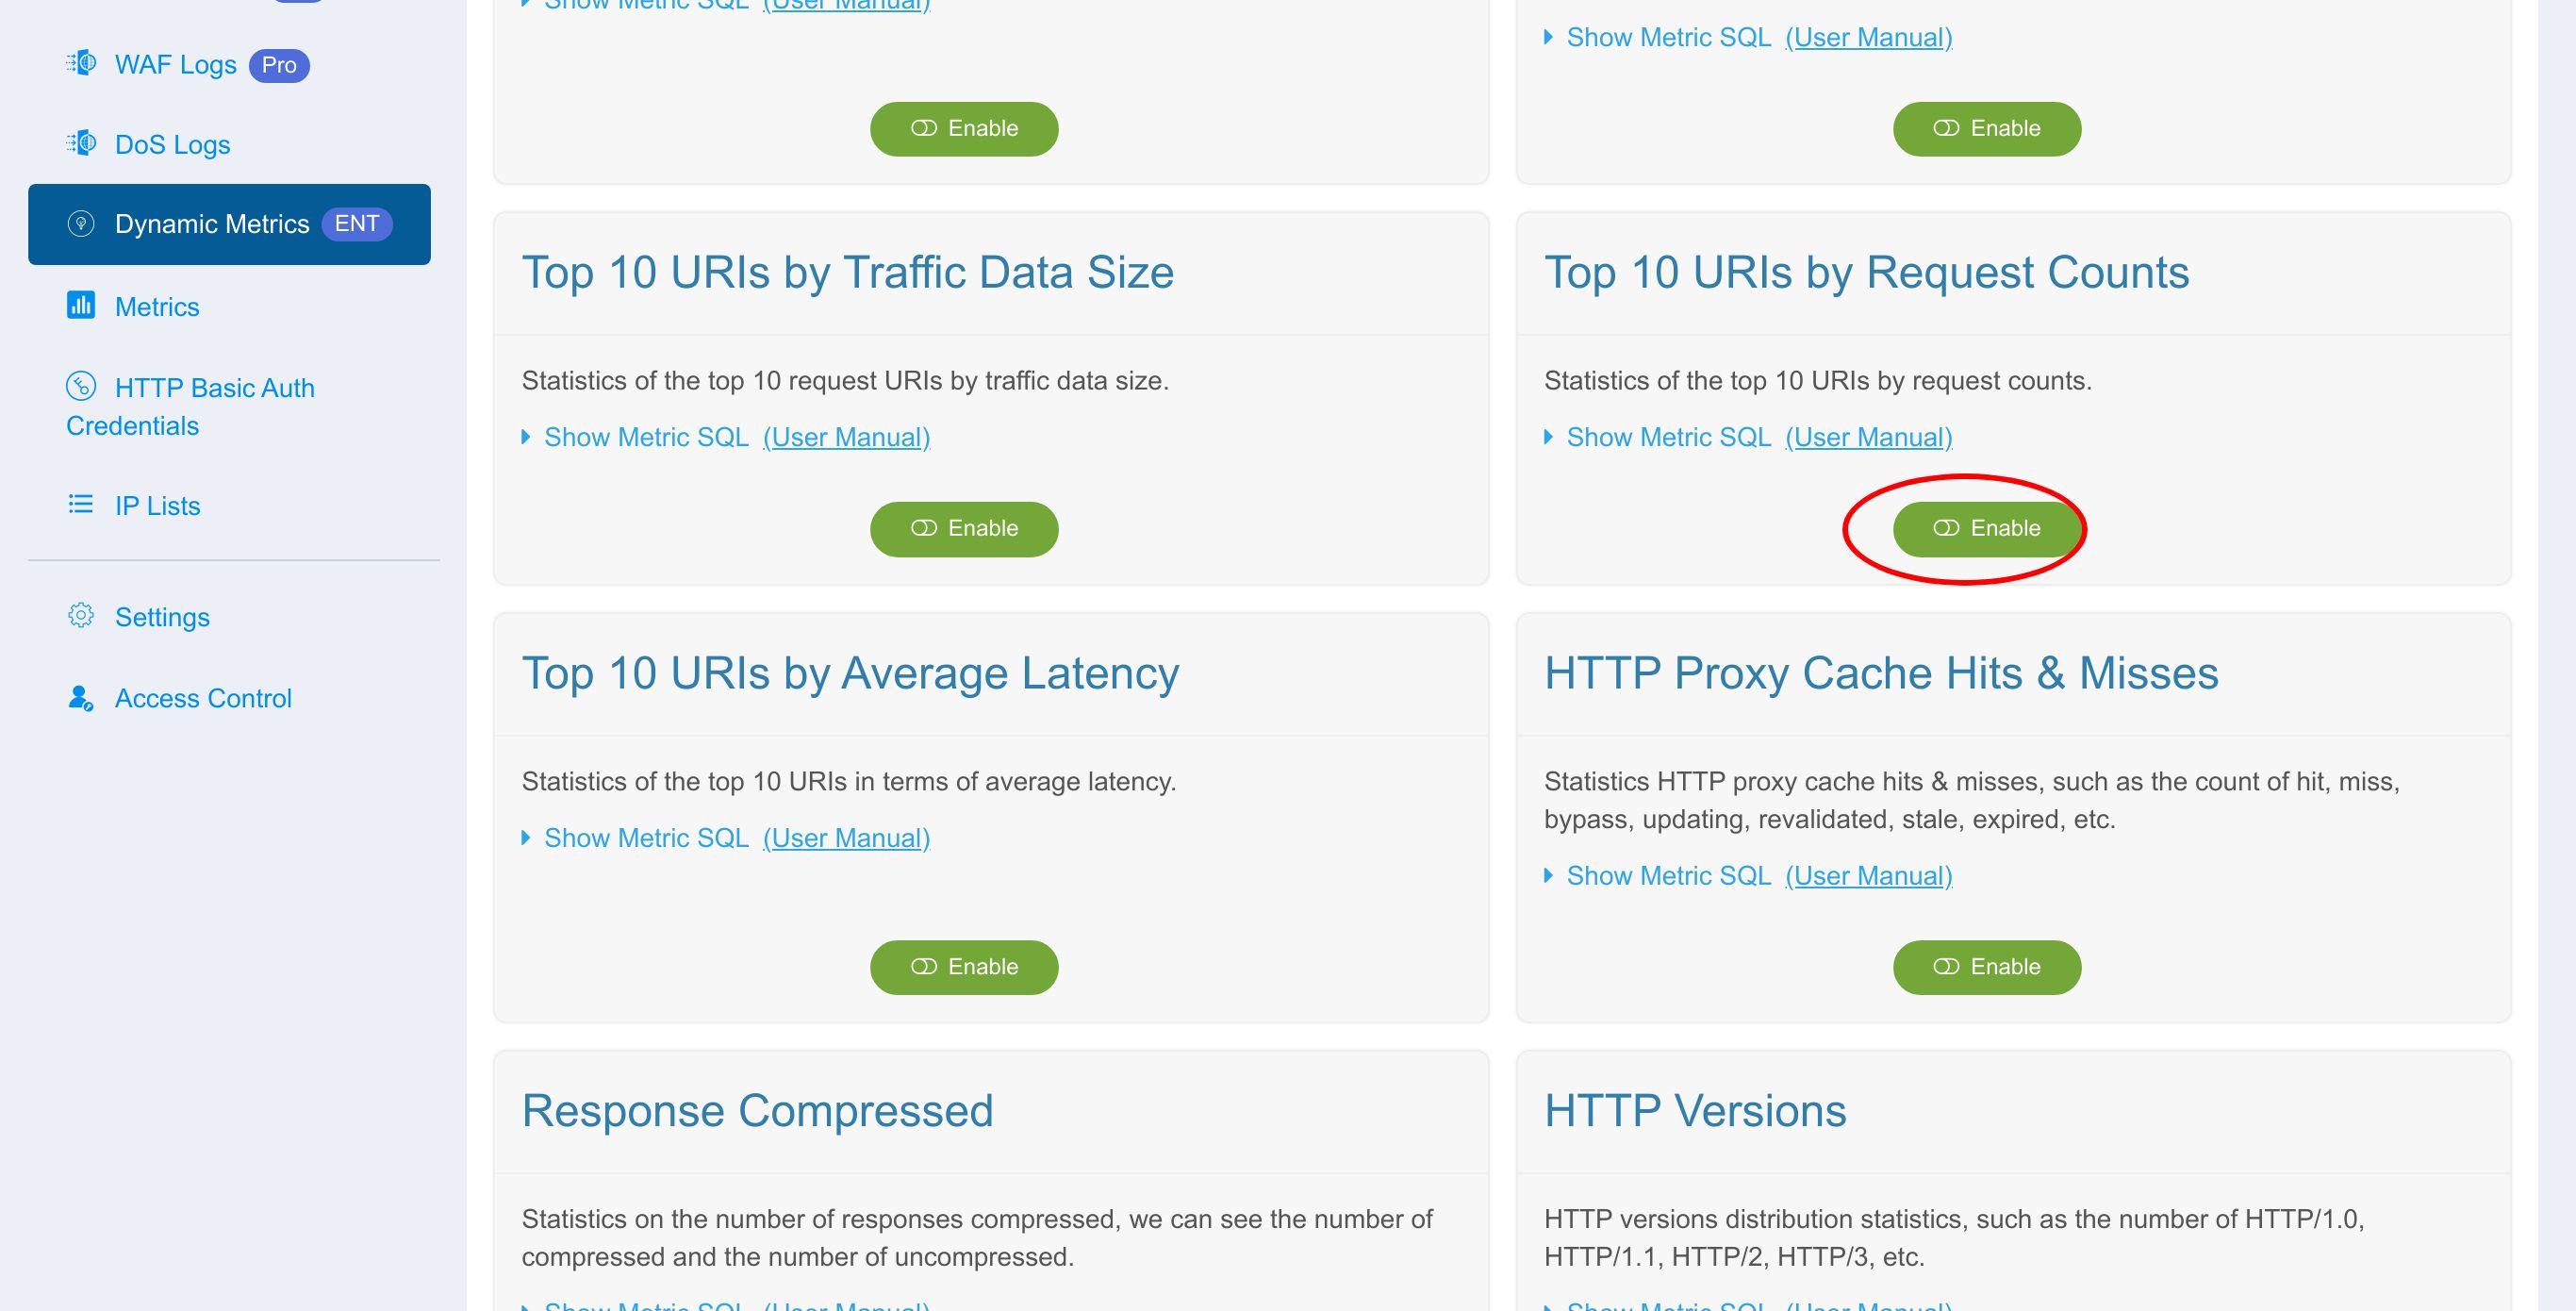
So far, what you see is definitions of standard dynamic metrics. They don’t get enabled yet.
You need to enable this metric by clicking on the “Enable” button.
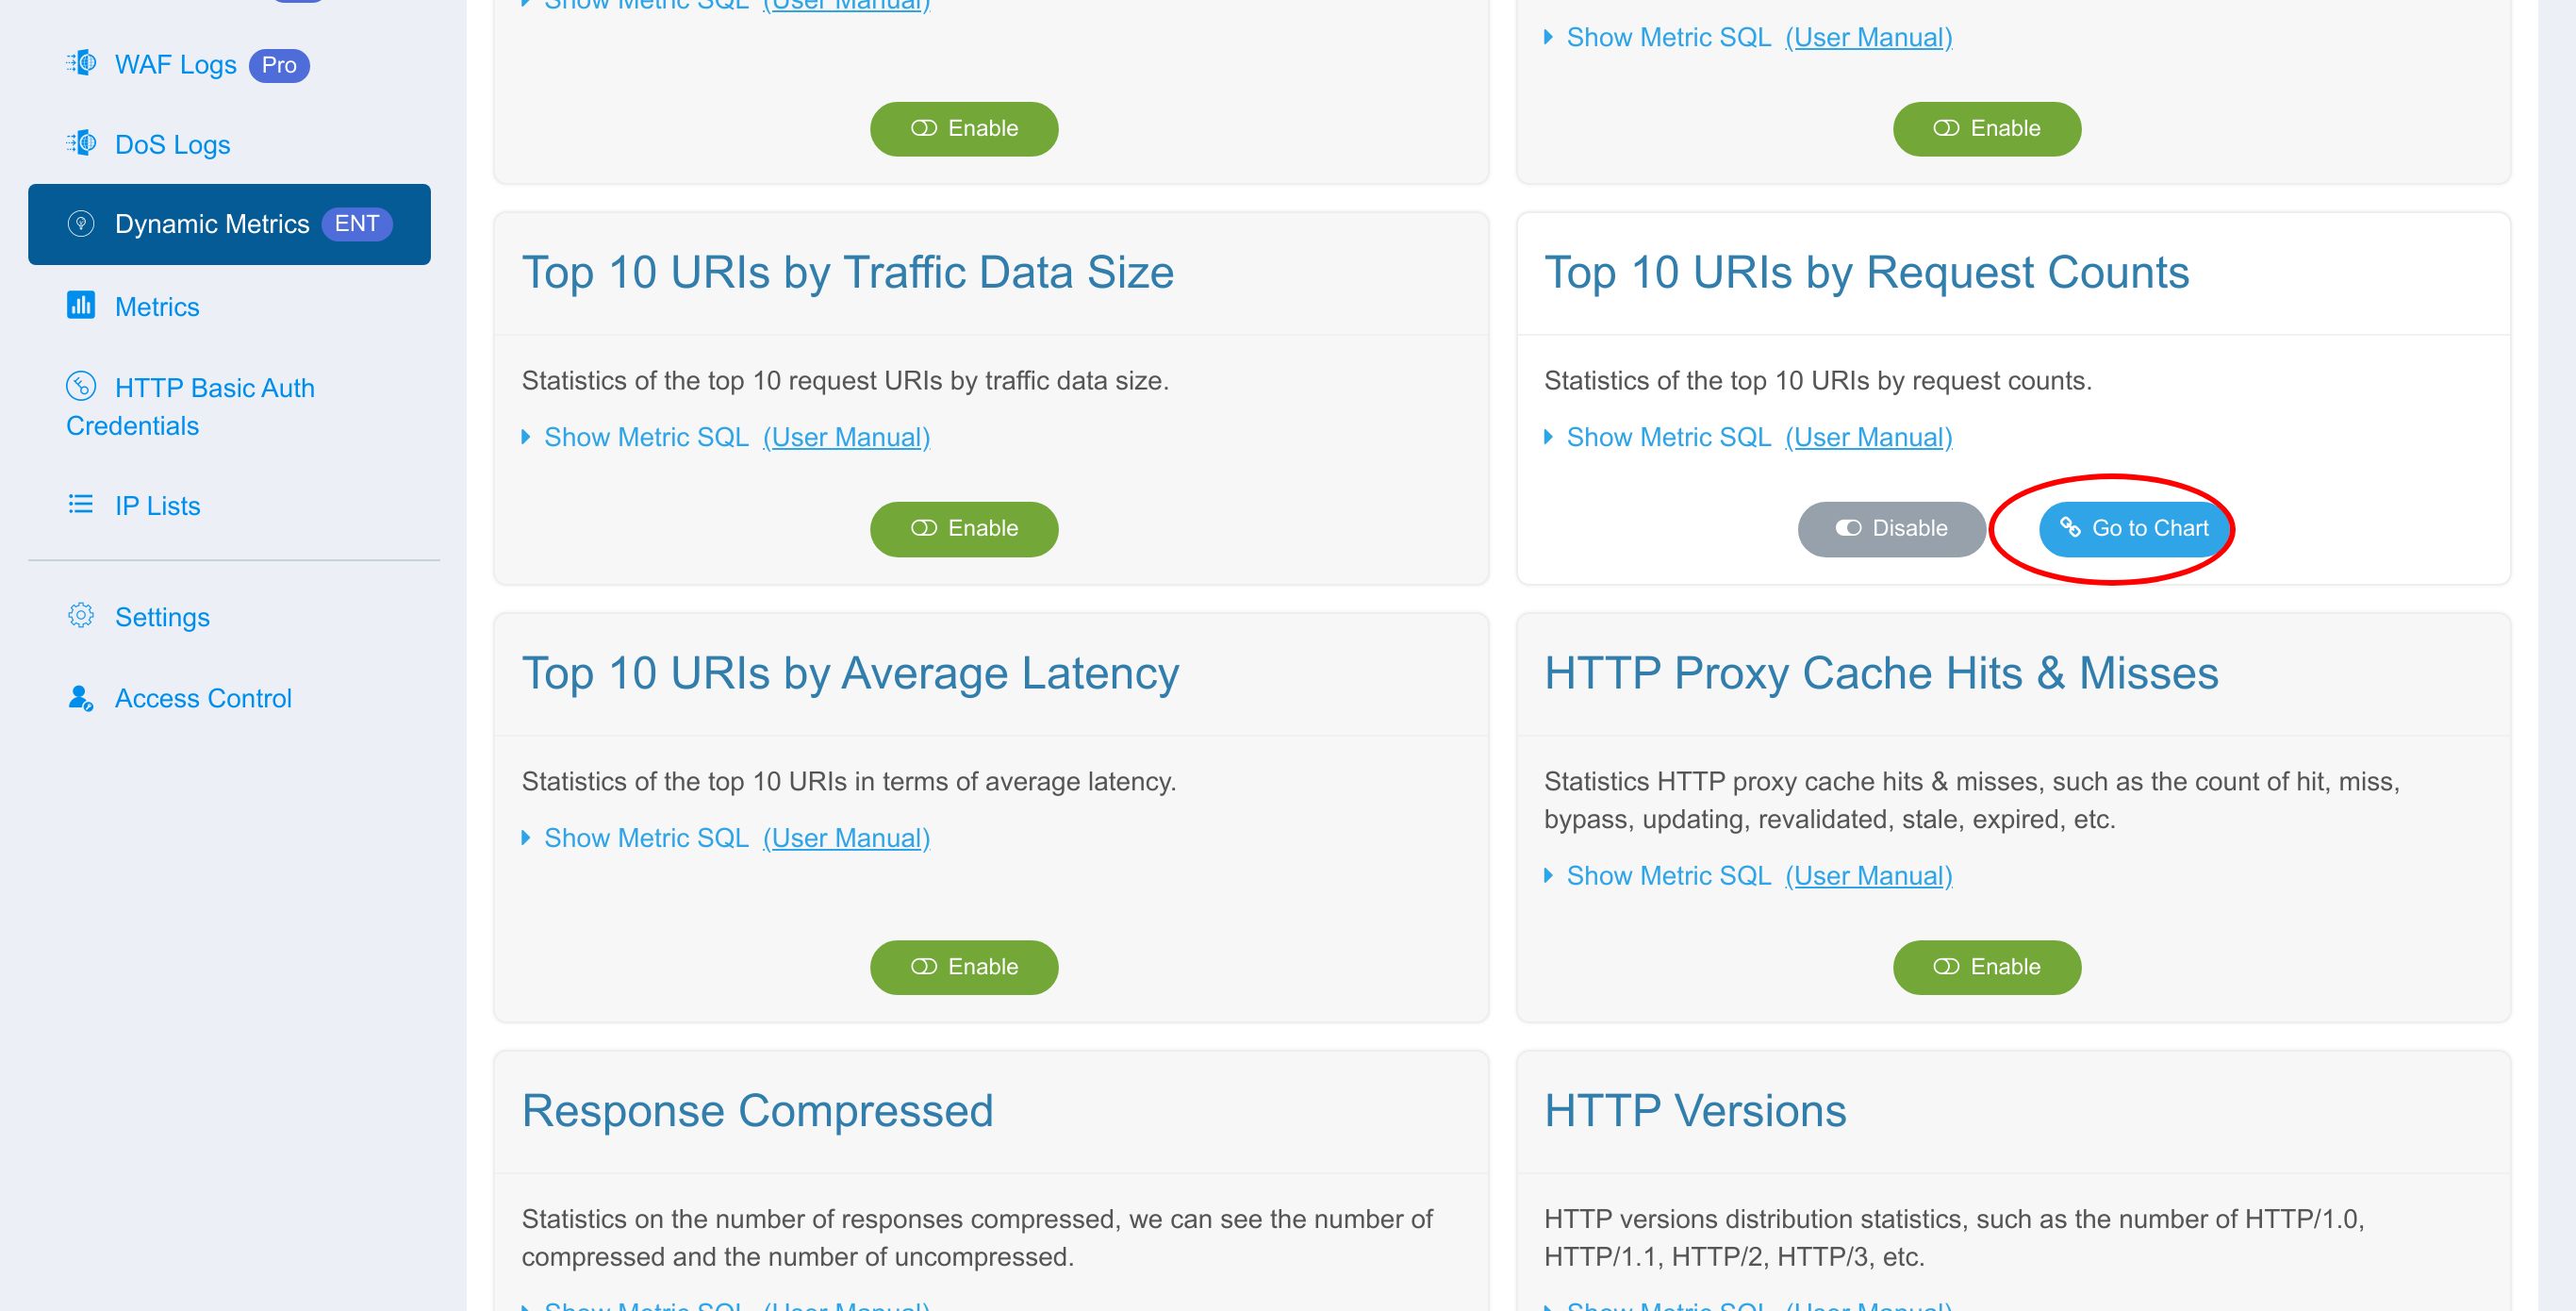
Click on the button “Go to Chart” to go to the dashboard of dynamic metrics.
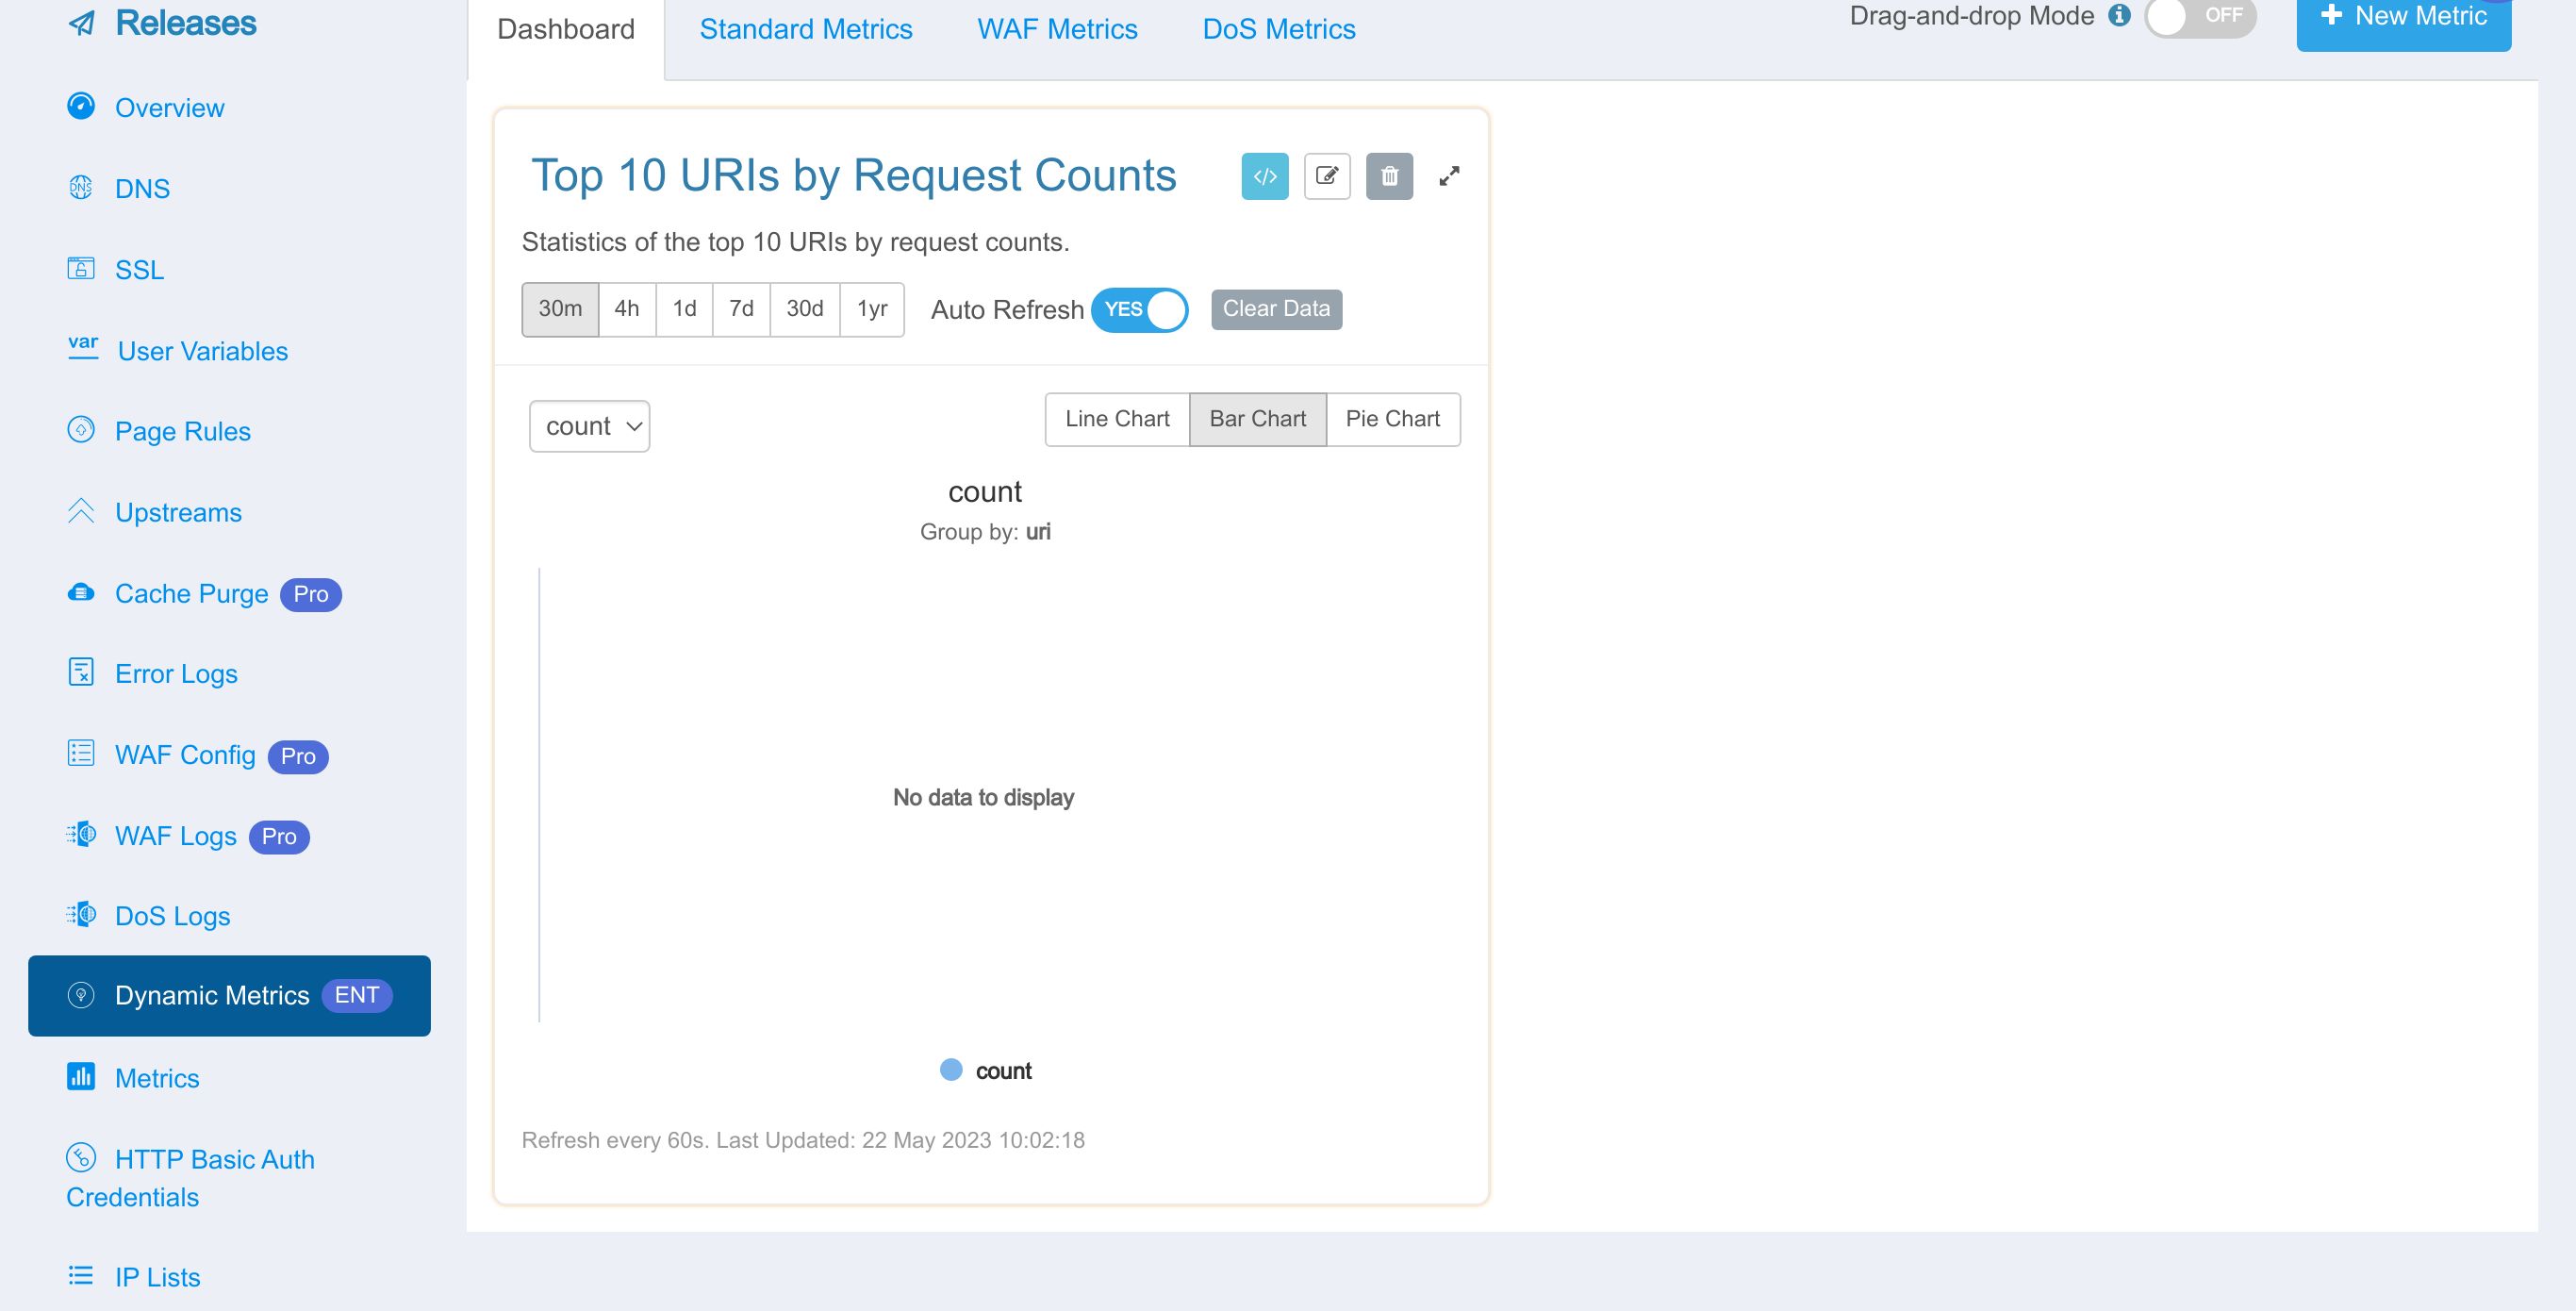
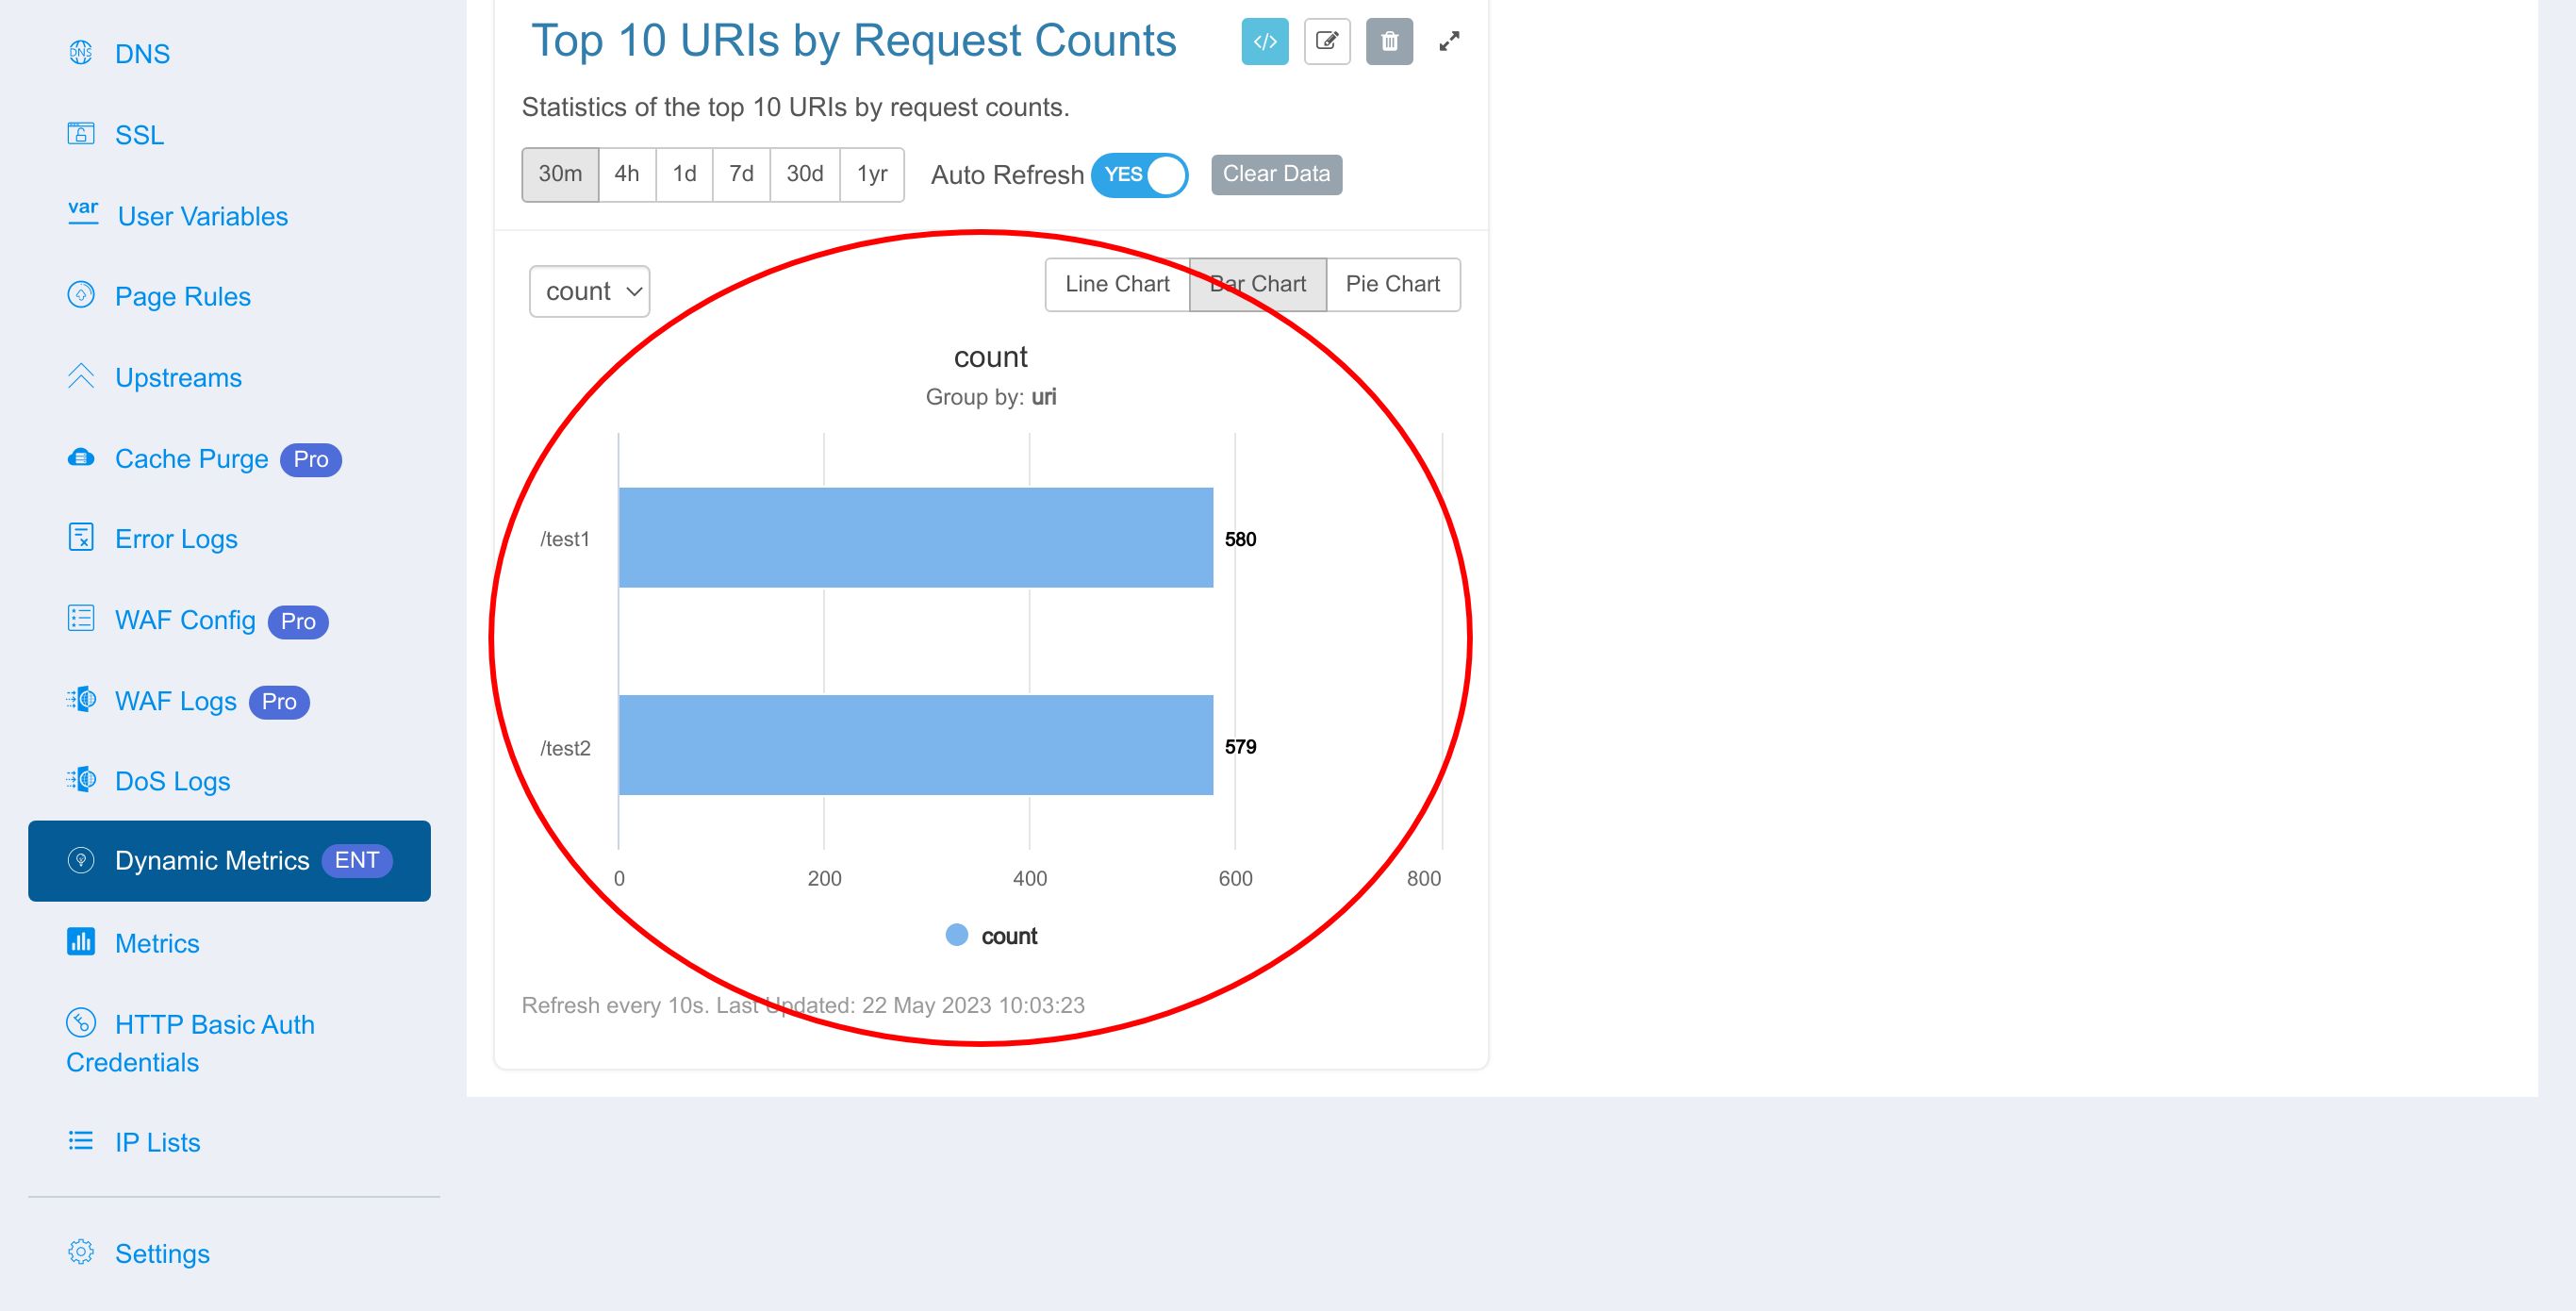
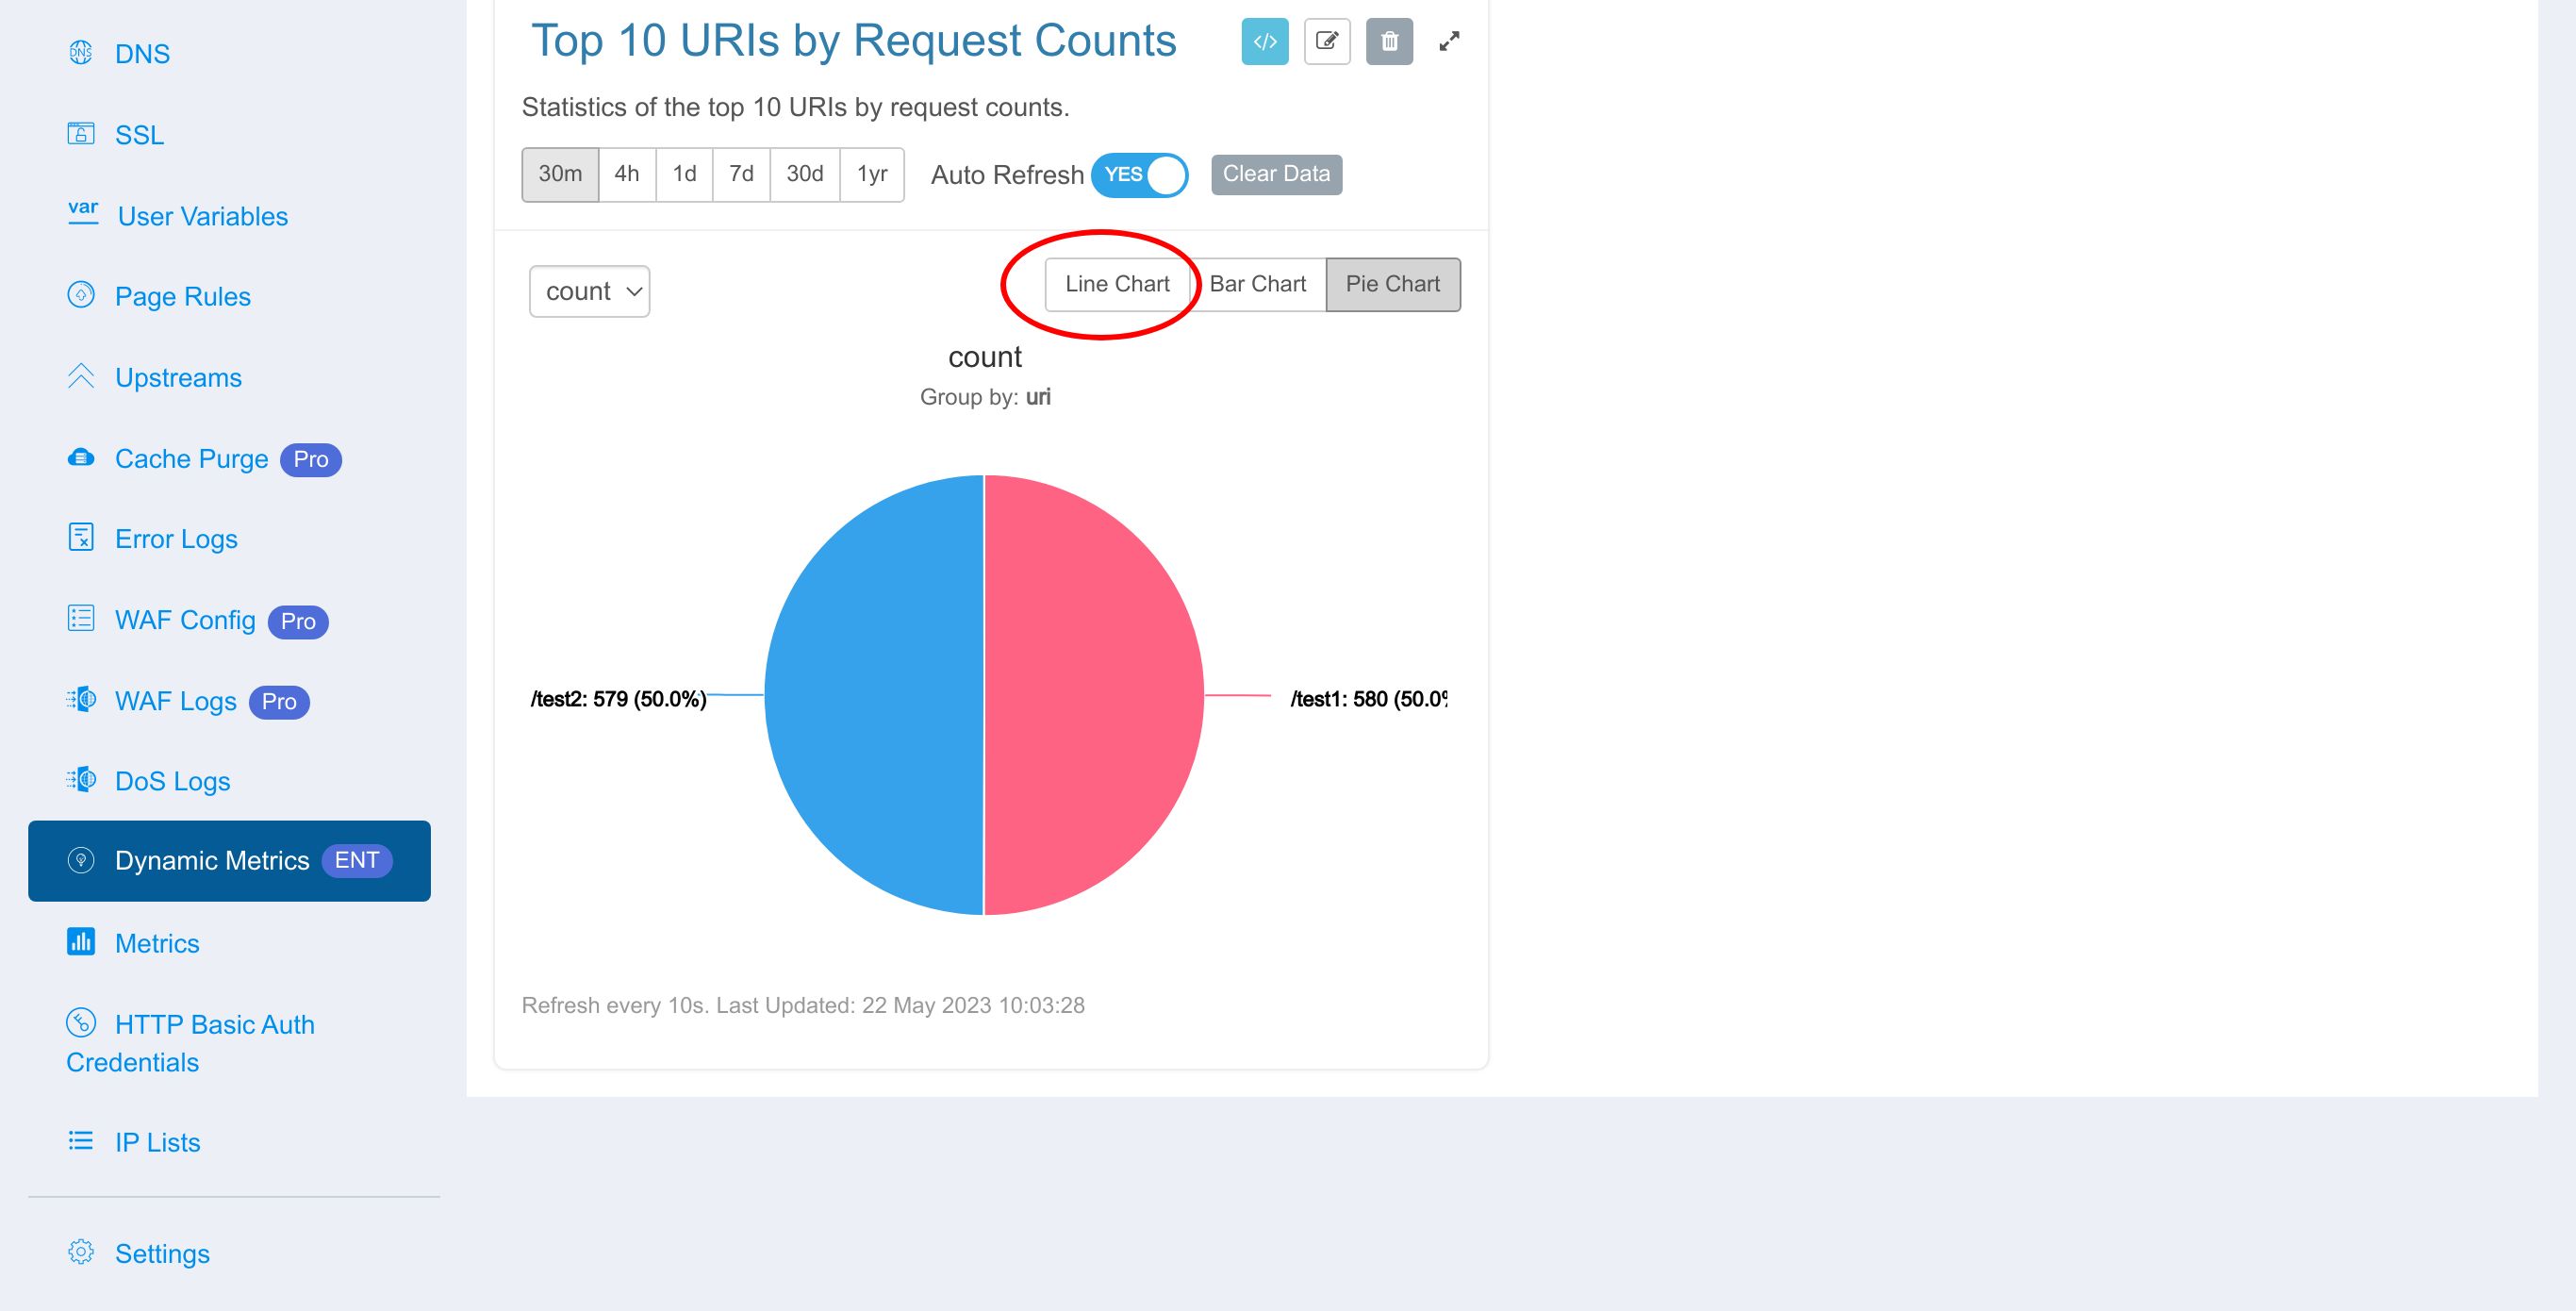
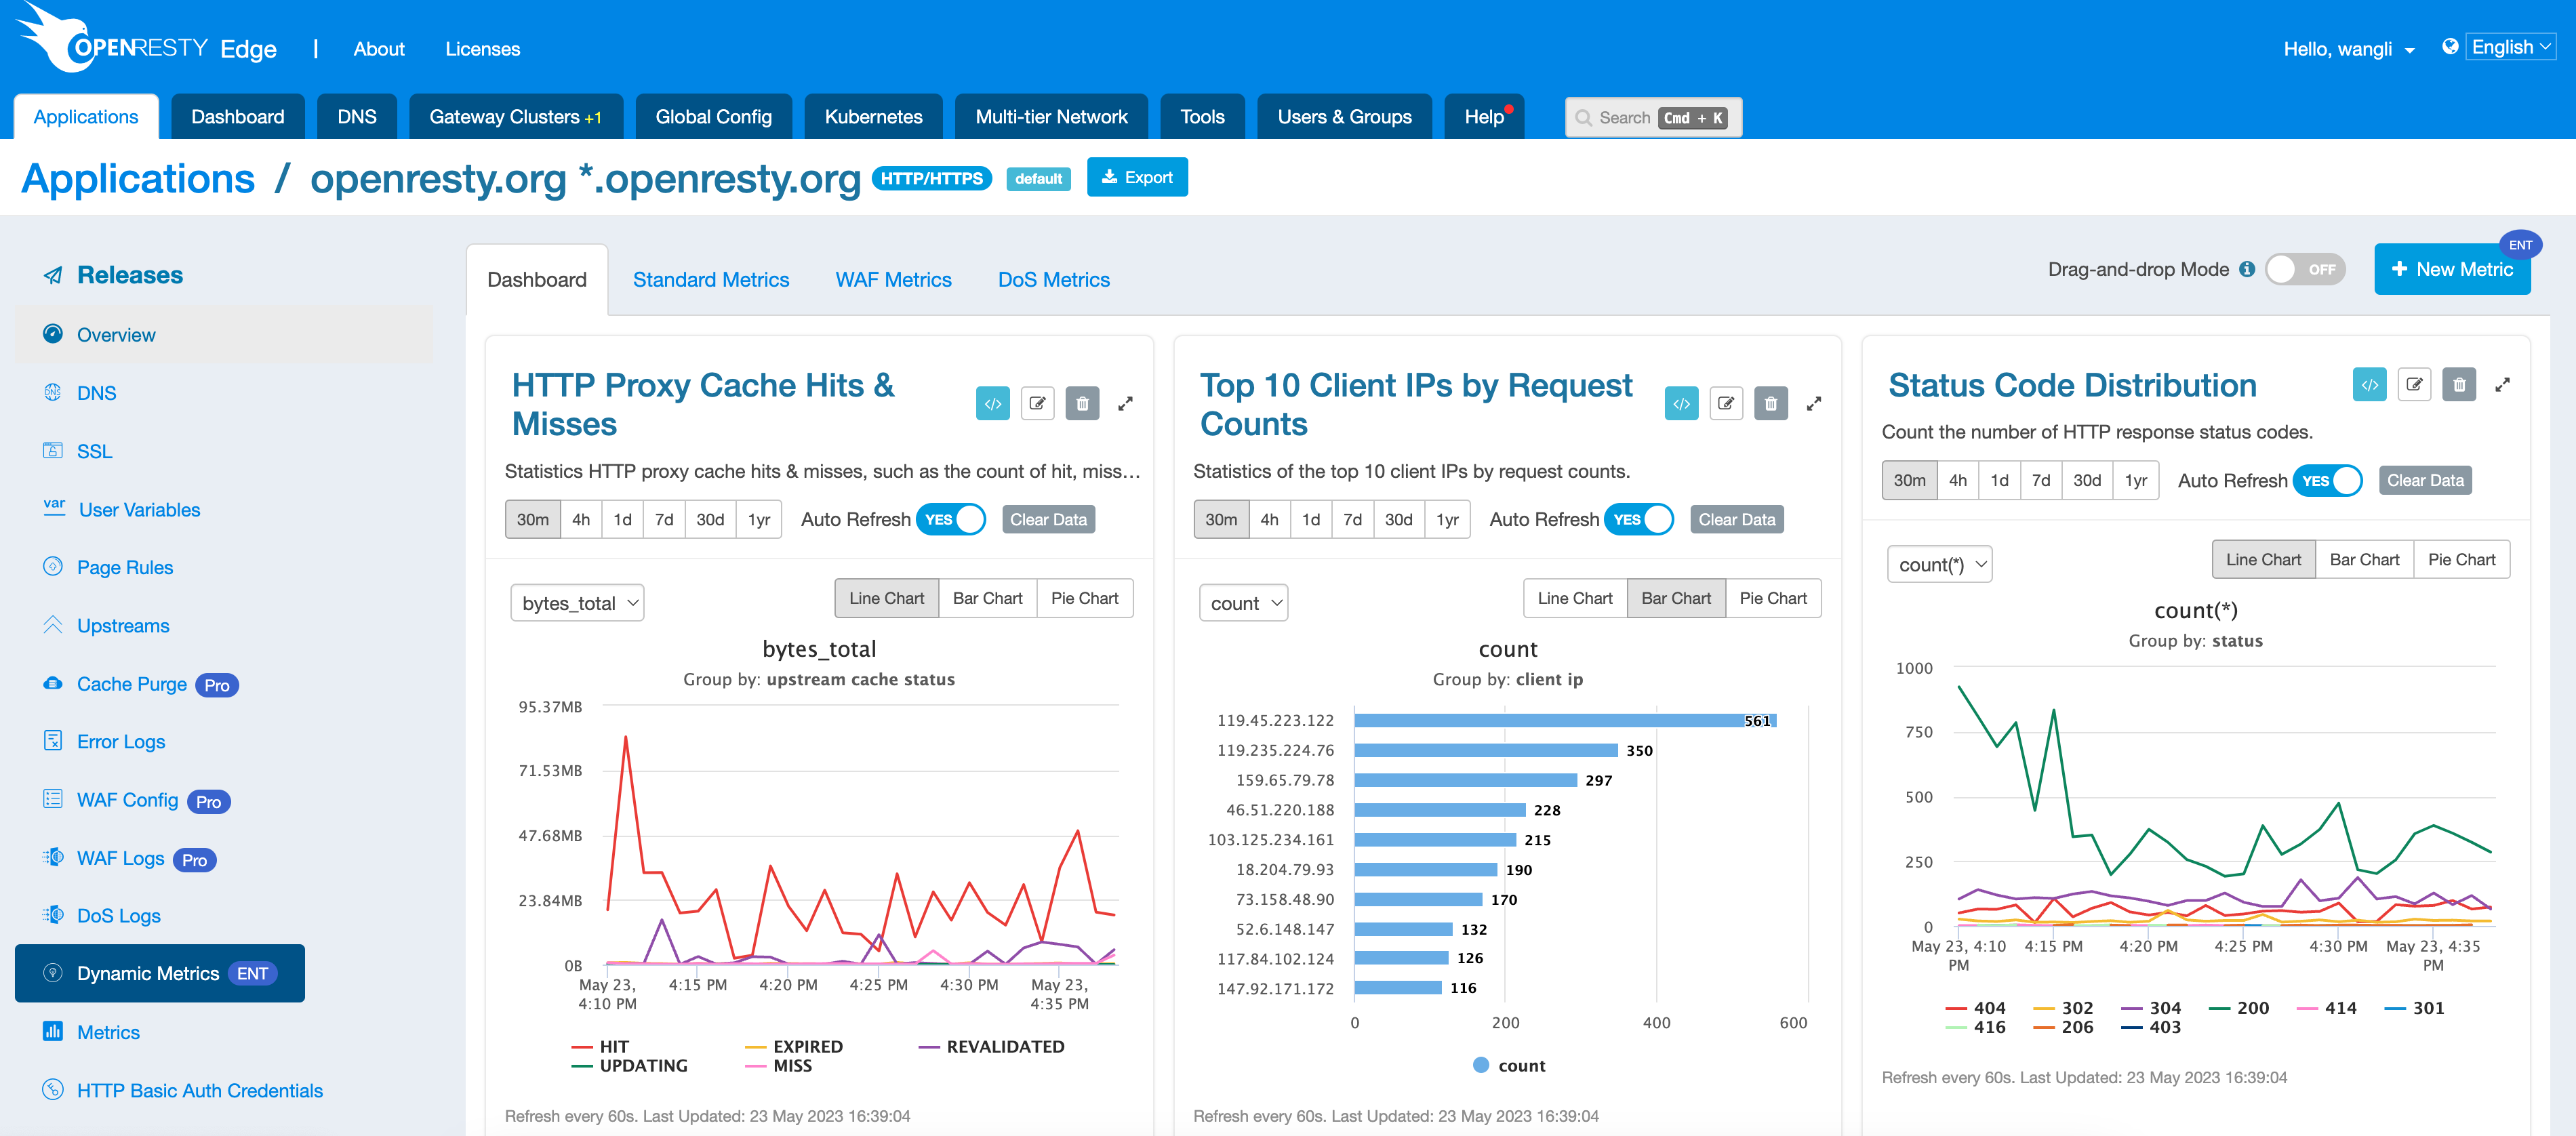
You will see this metric in the dashboard of dynamic metrics.
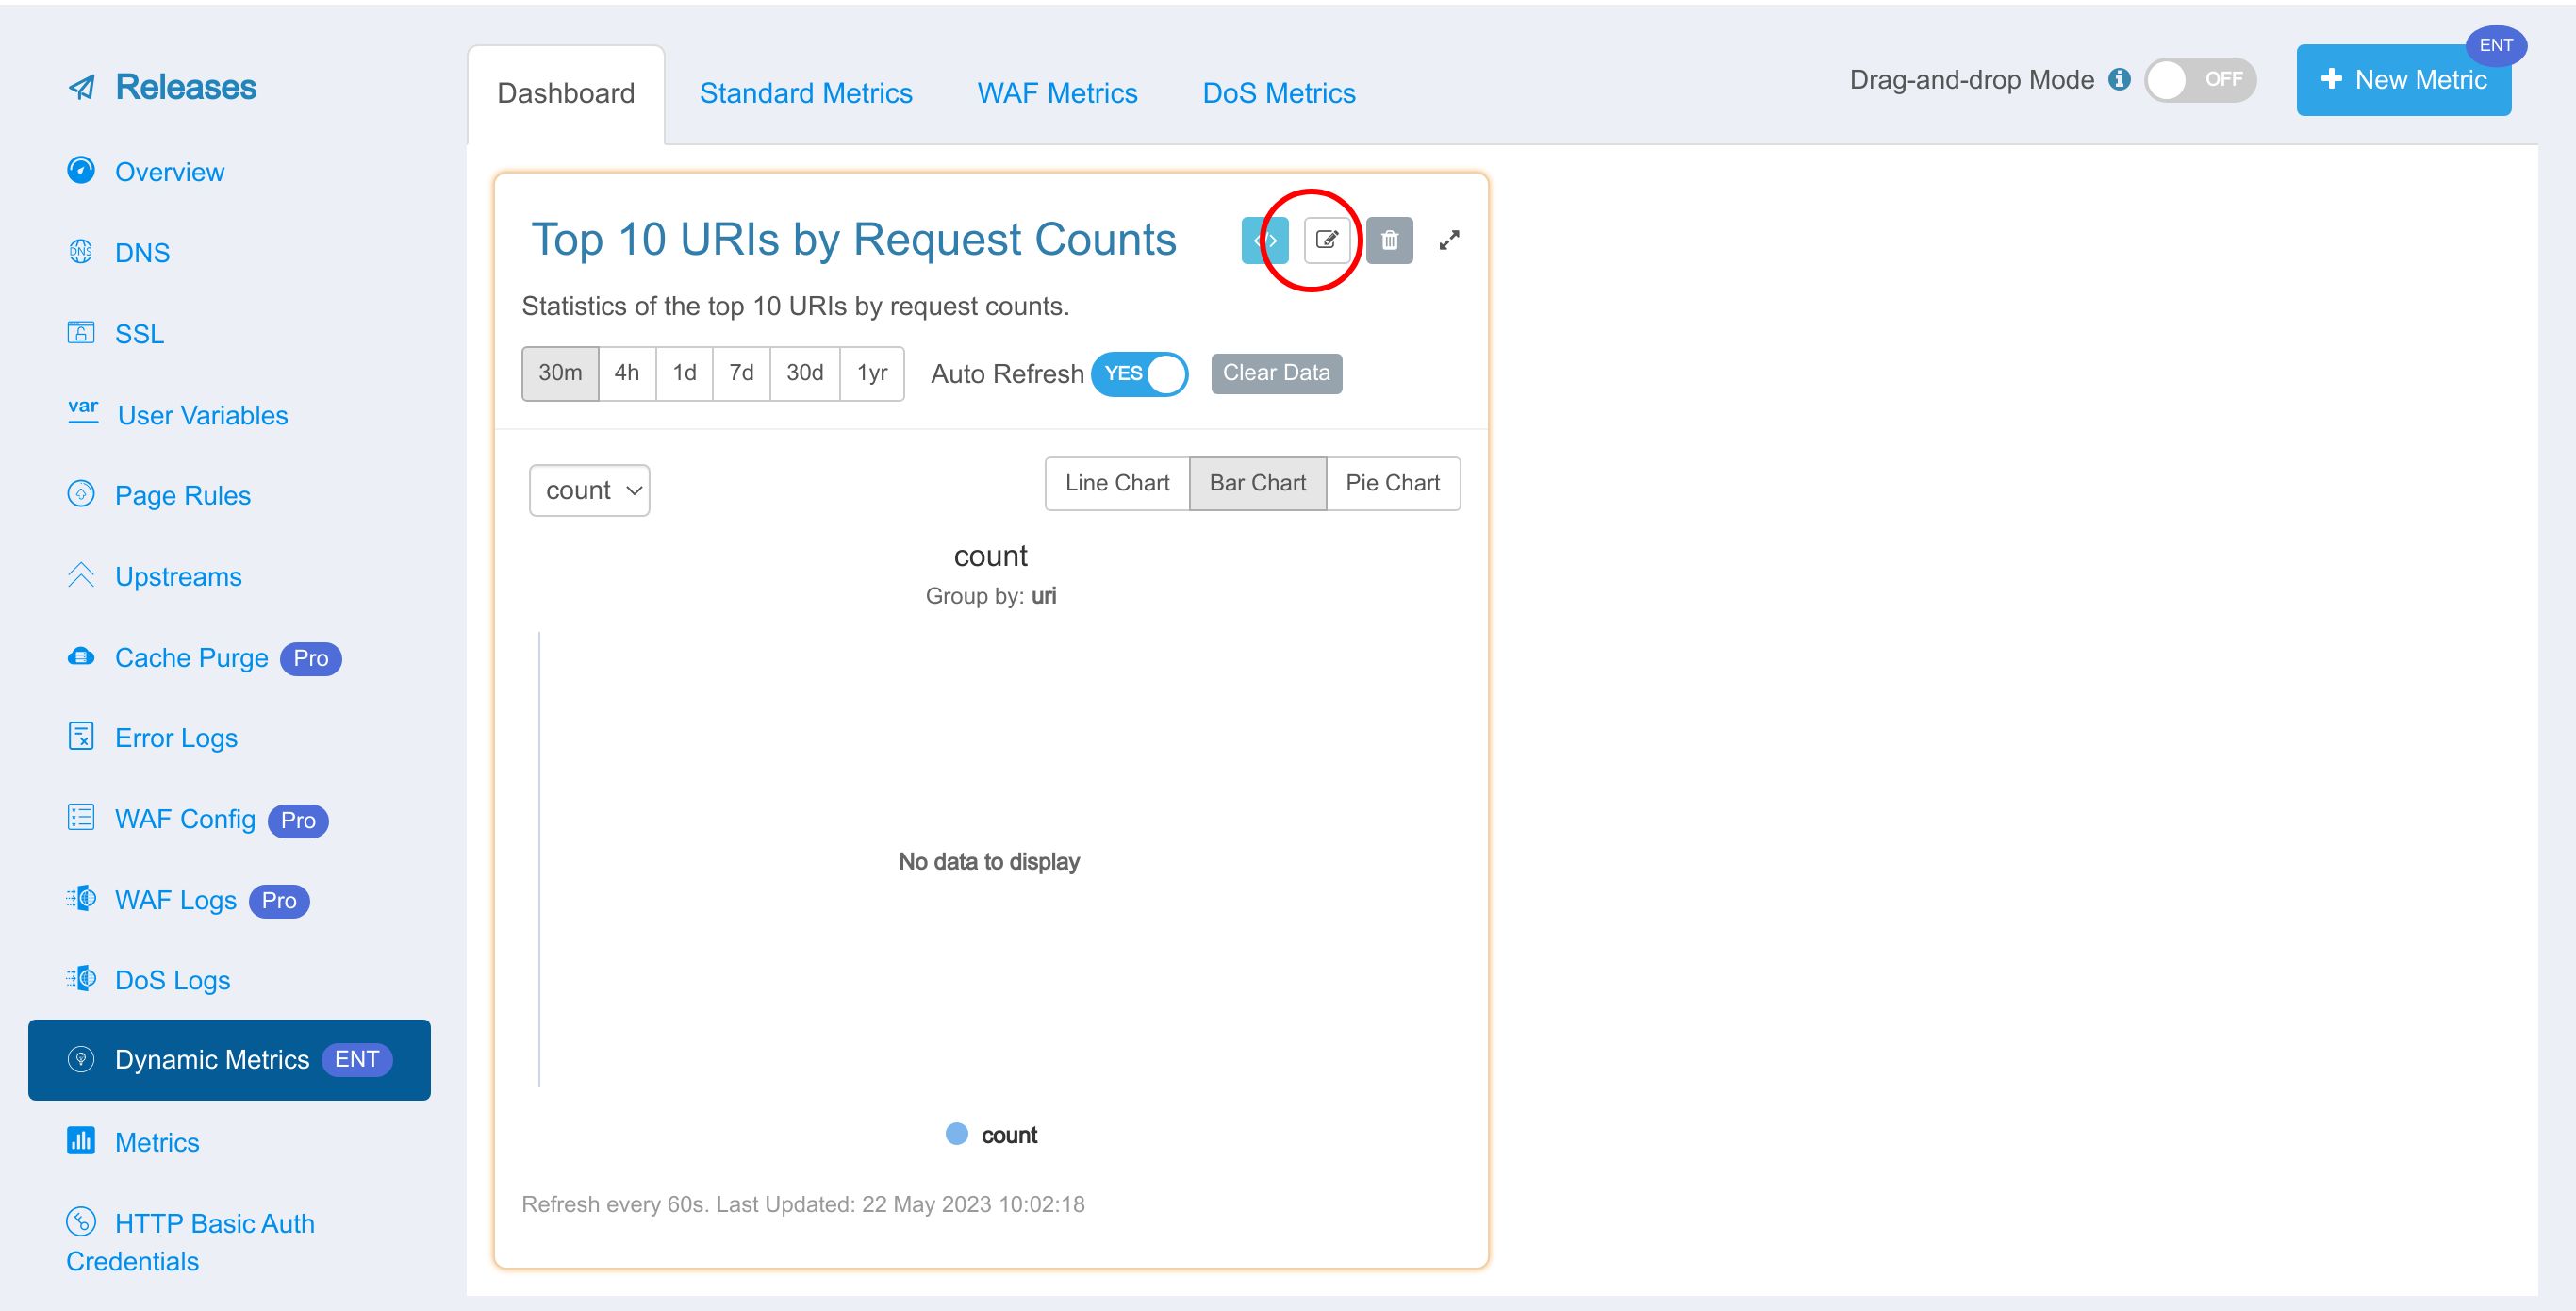
If you want to edit this metric, you can click the Edit button to open the edit panel.
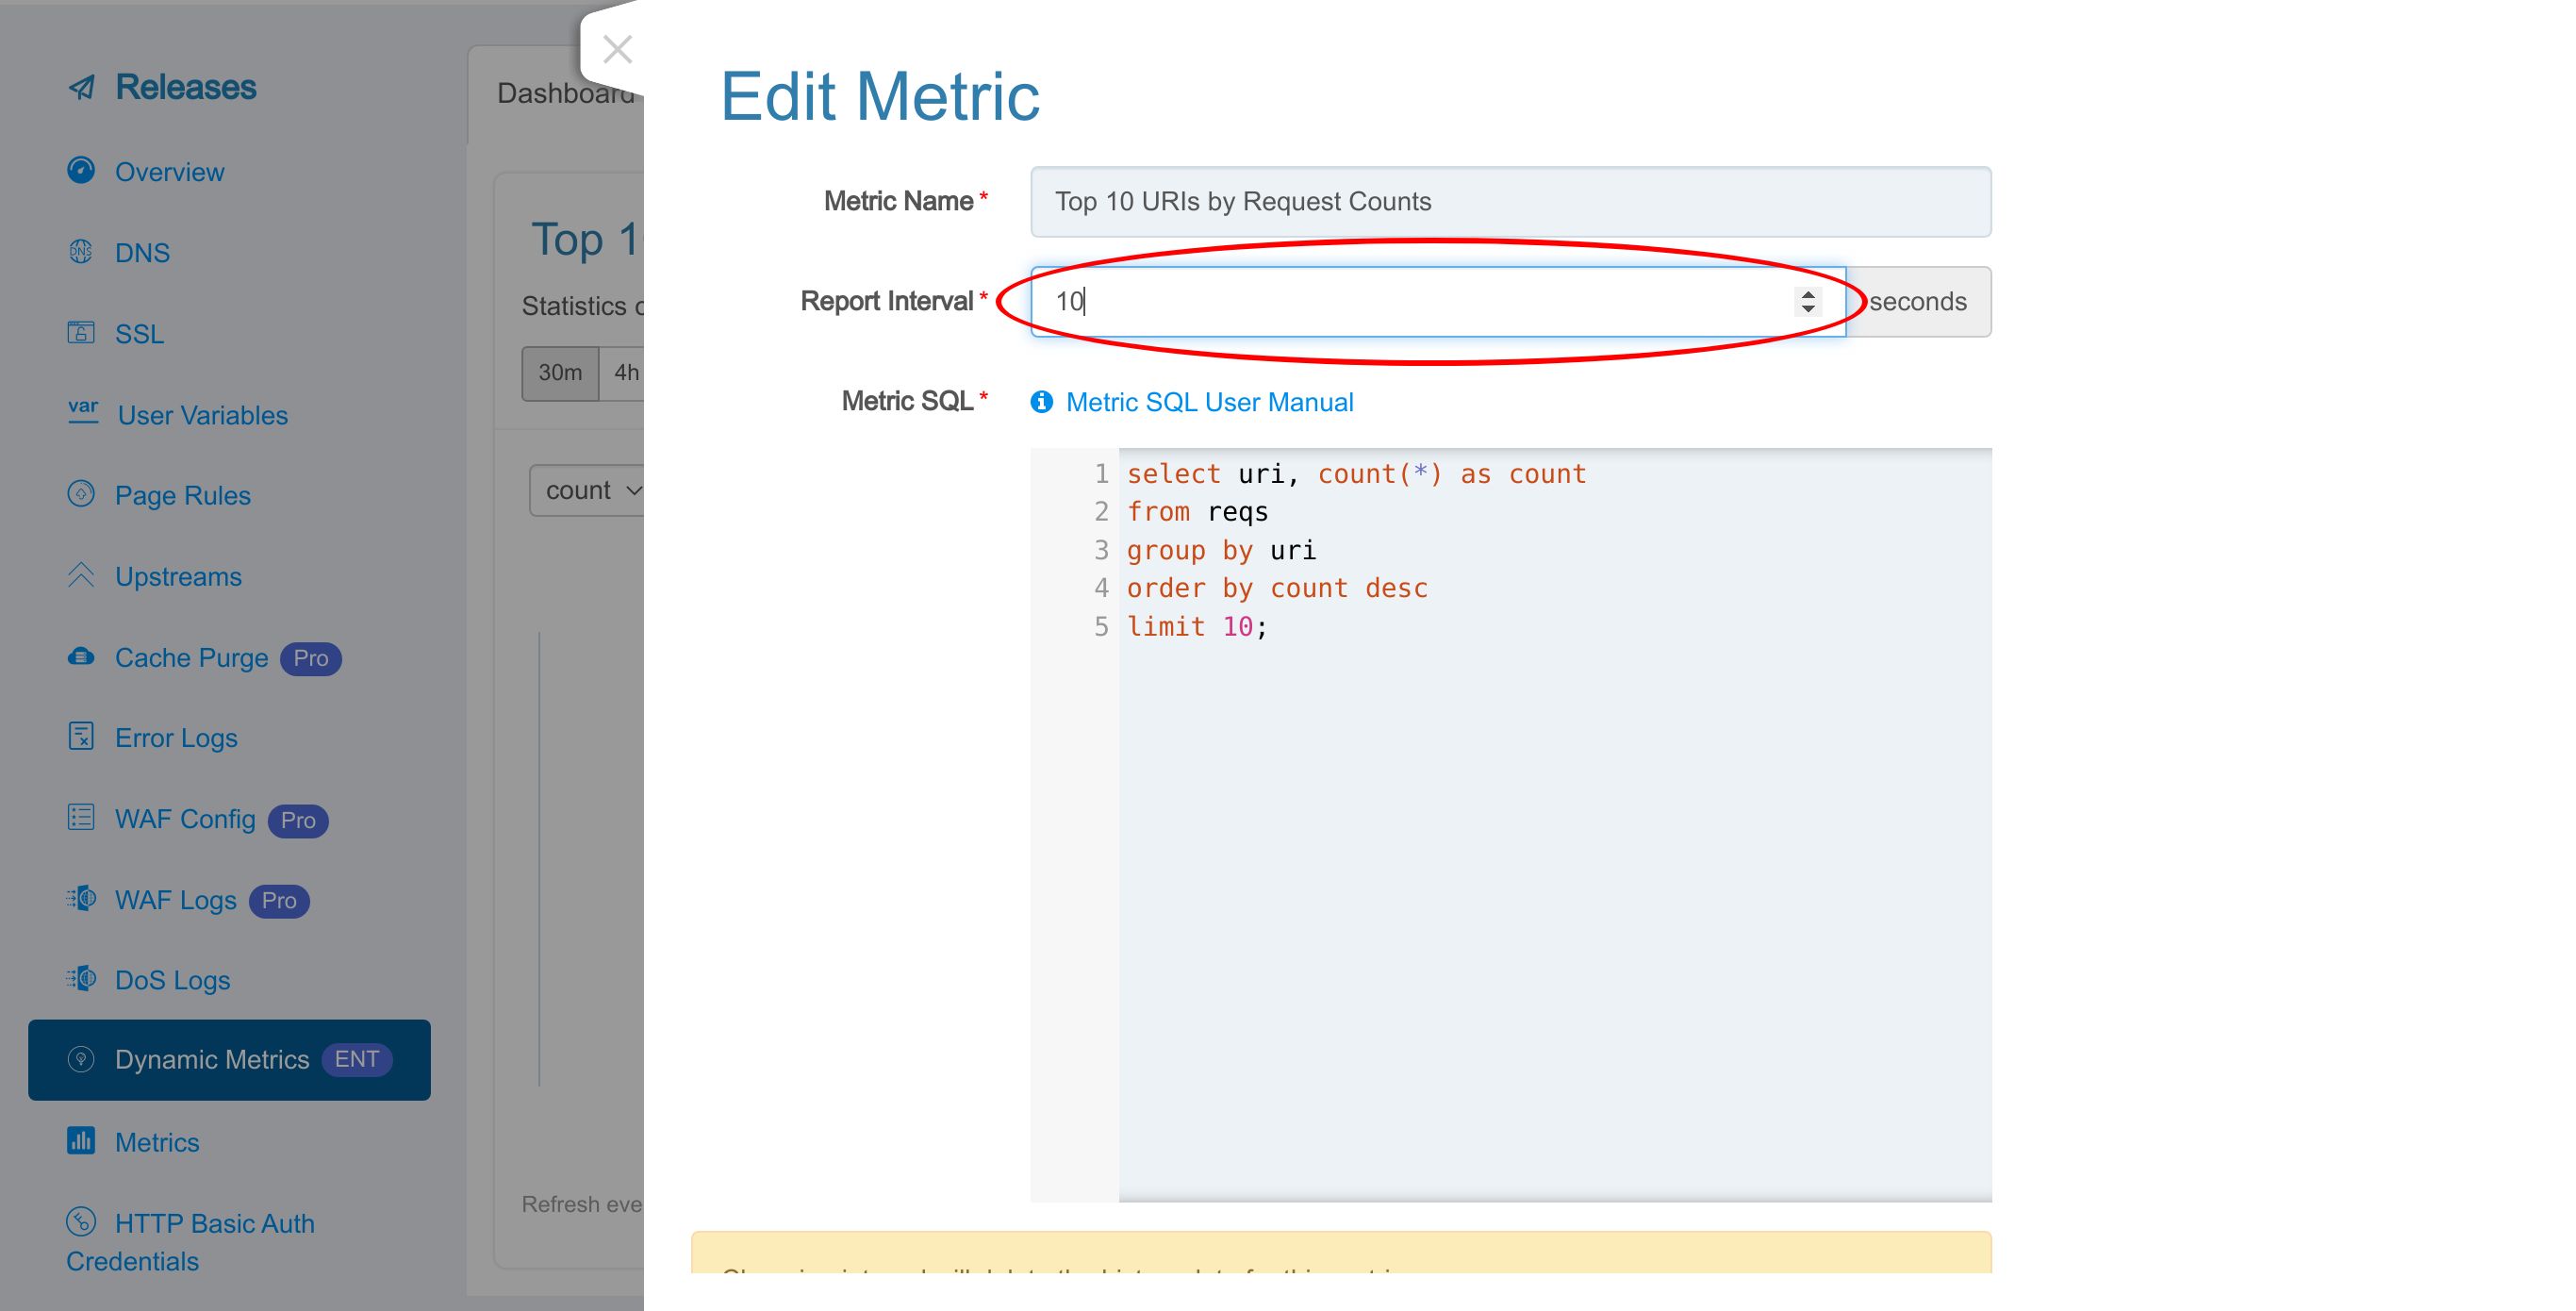
For standard dynamic metrics, only the report interval is editable.
The name and Metric SQL are read-only.
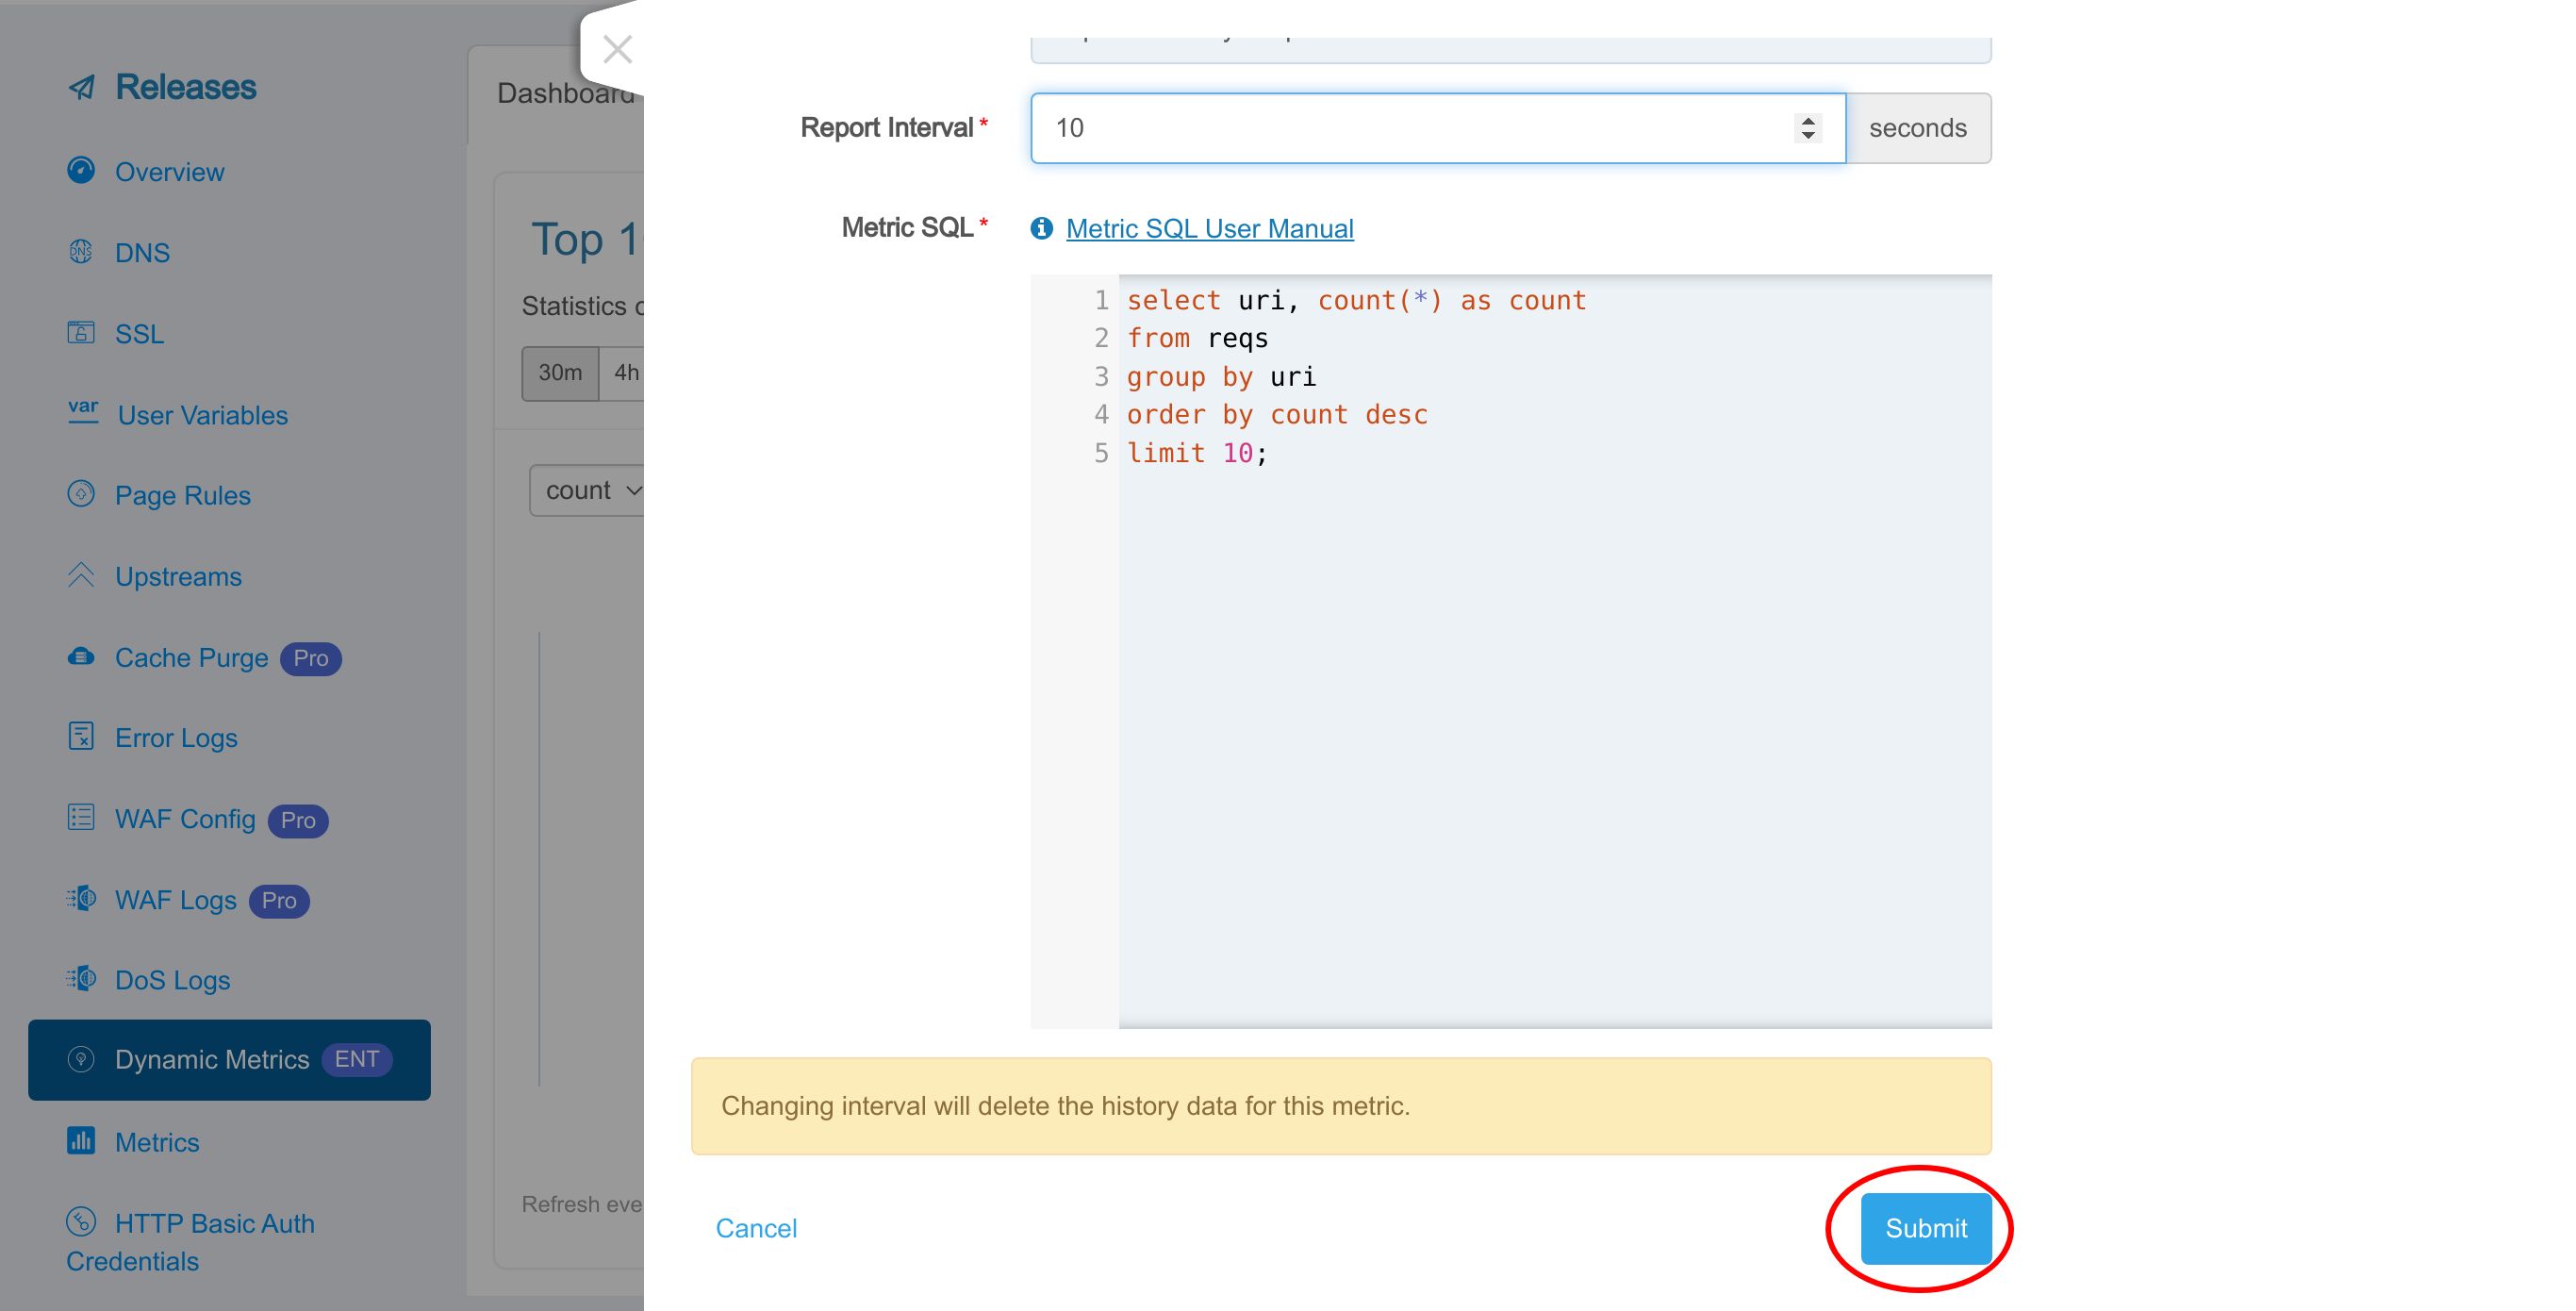
Specify the report interval. For the convenience of demonstration, we fill in 10 seconds here. Such short report intervals have a higher overhead. Therefore, we recommend intervals of at least 60 seconds.
Click Submit to save the changes we just made.
Test
Now let’s send requests and see how it works.
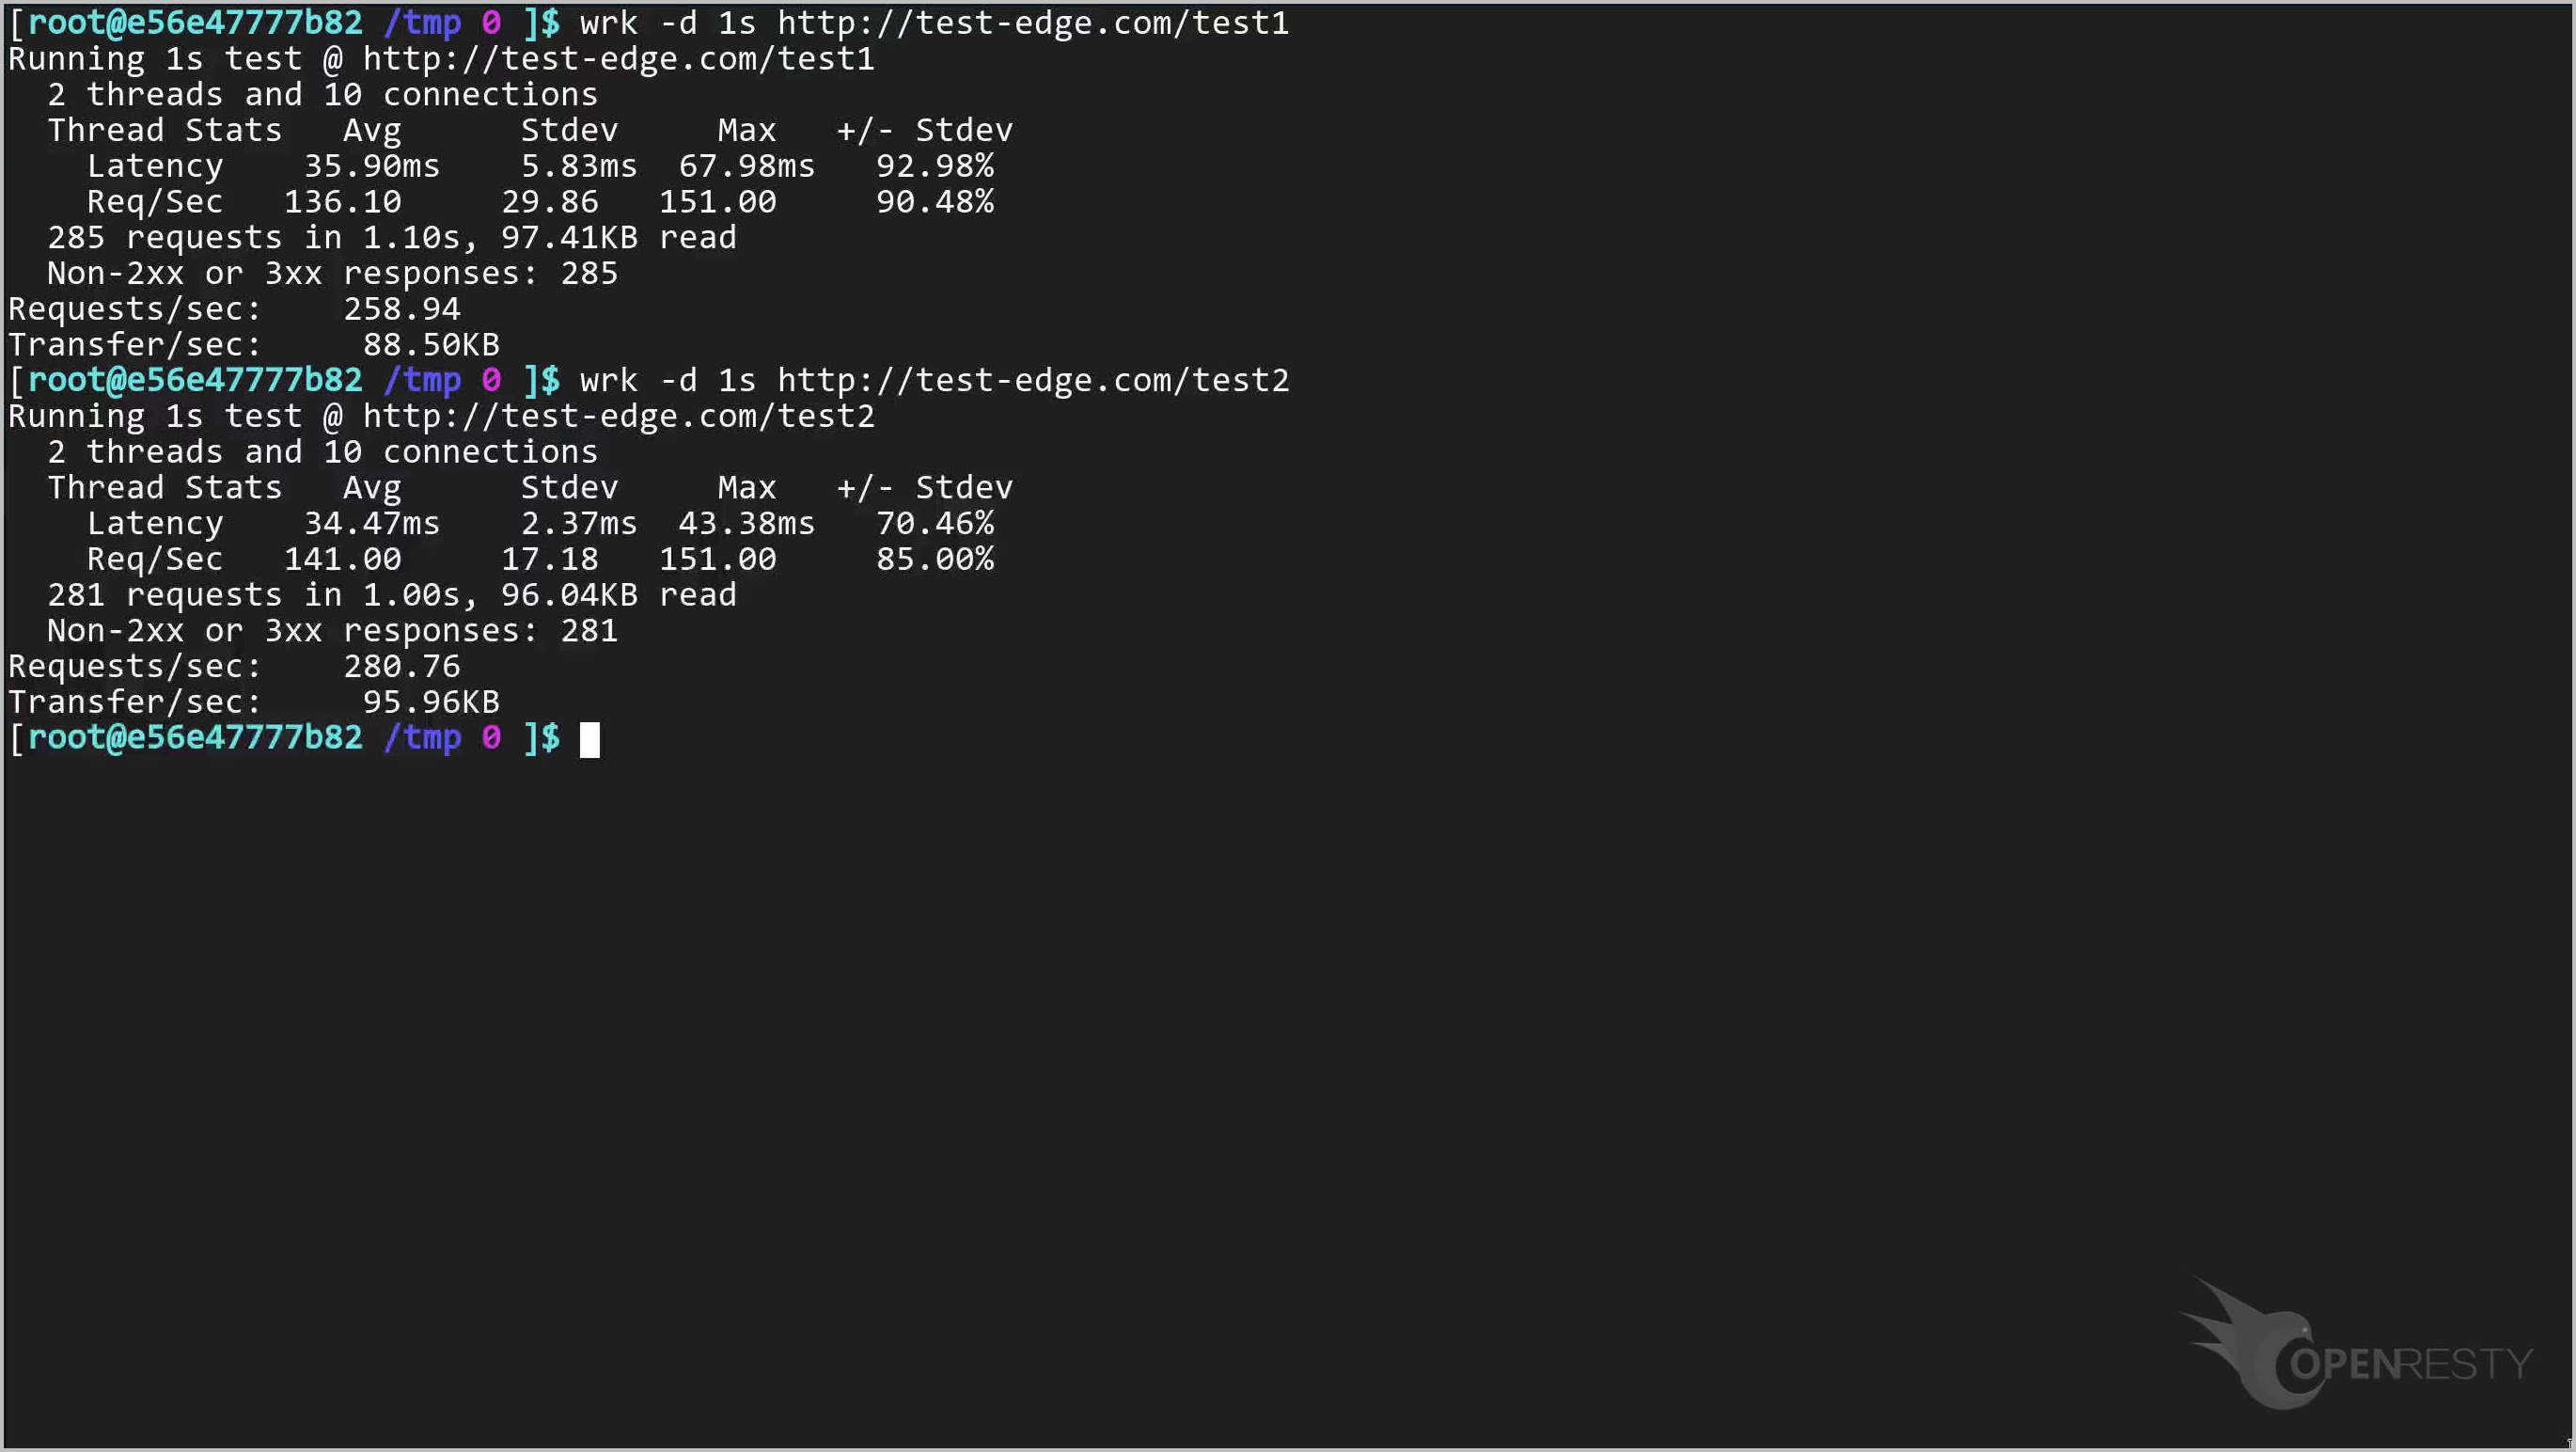
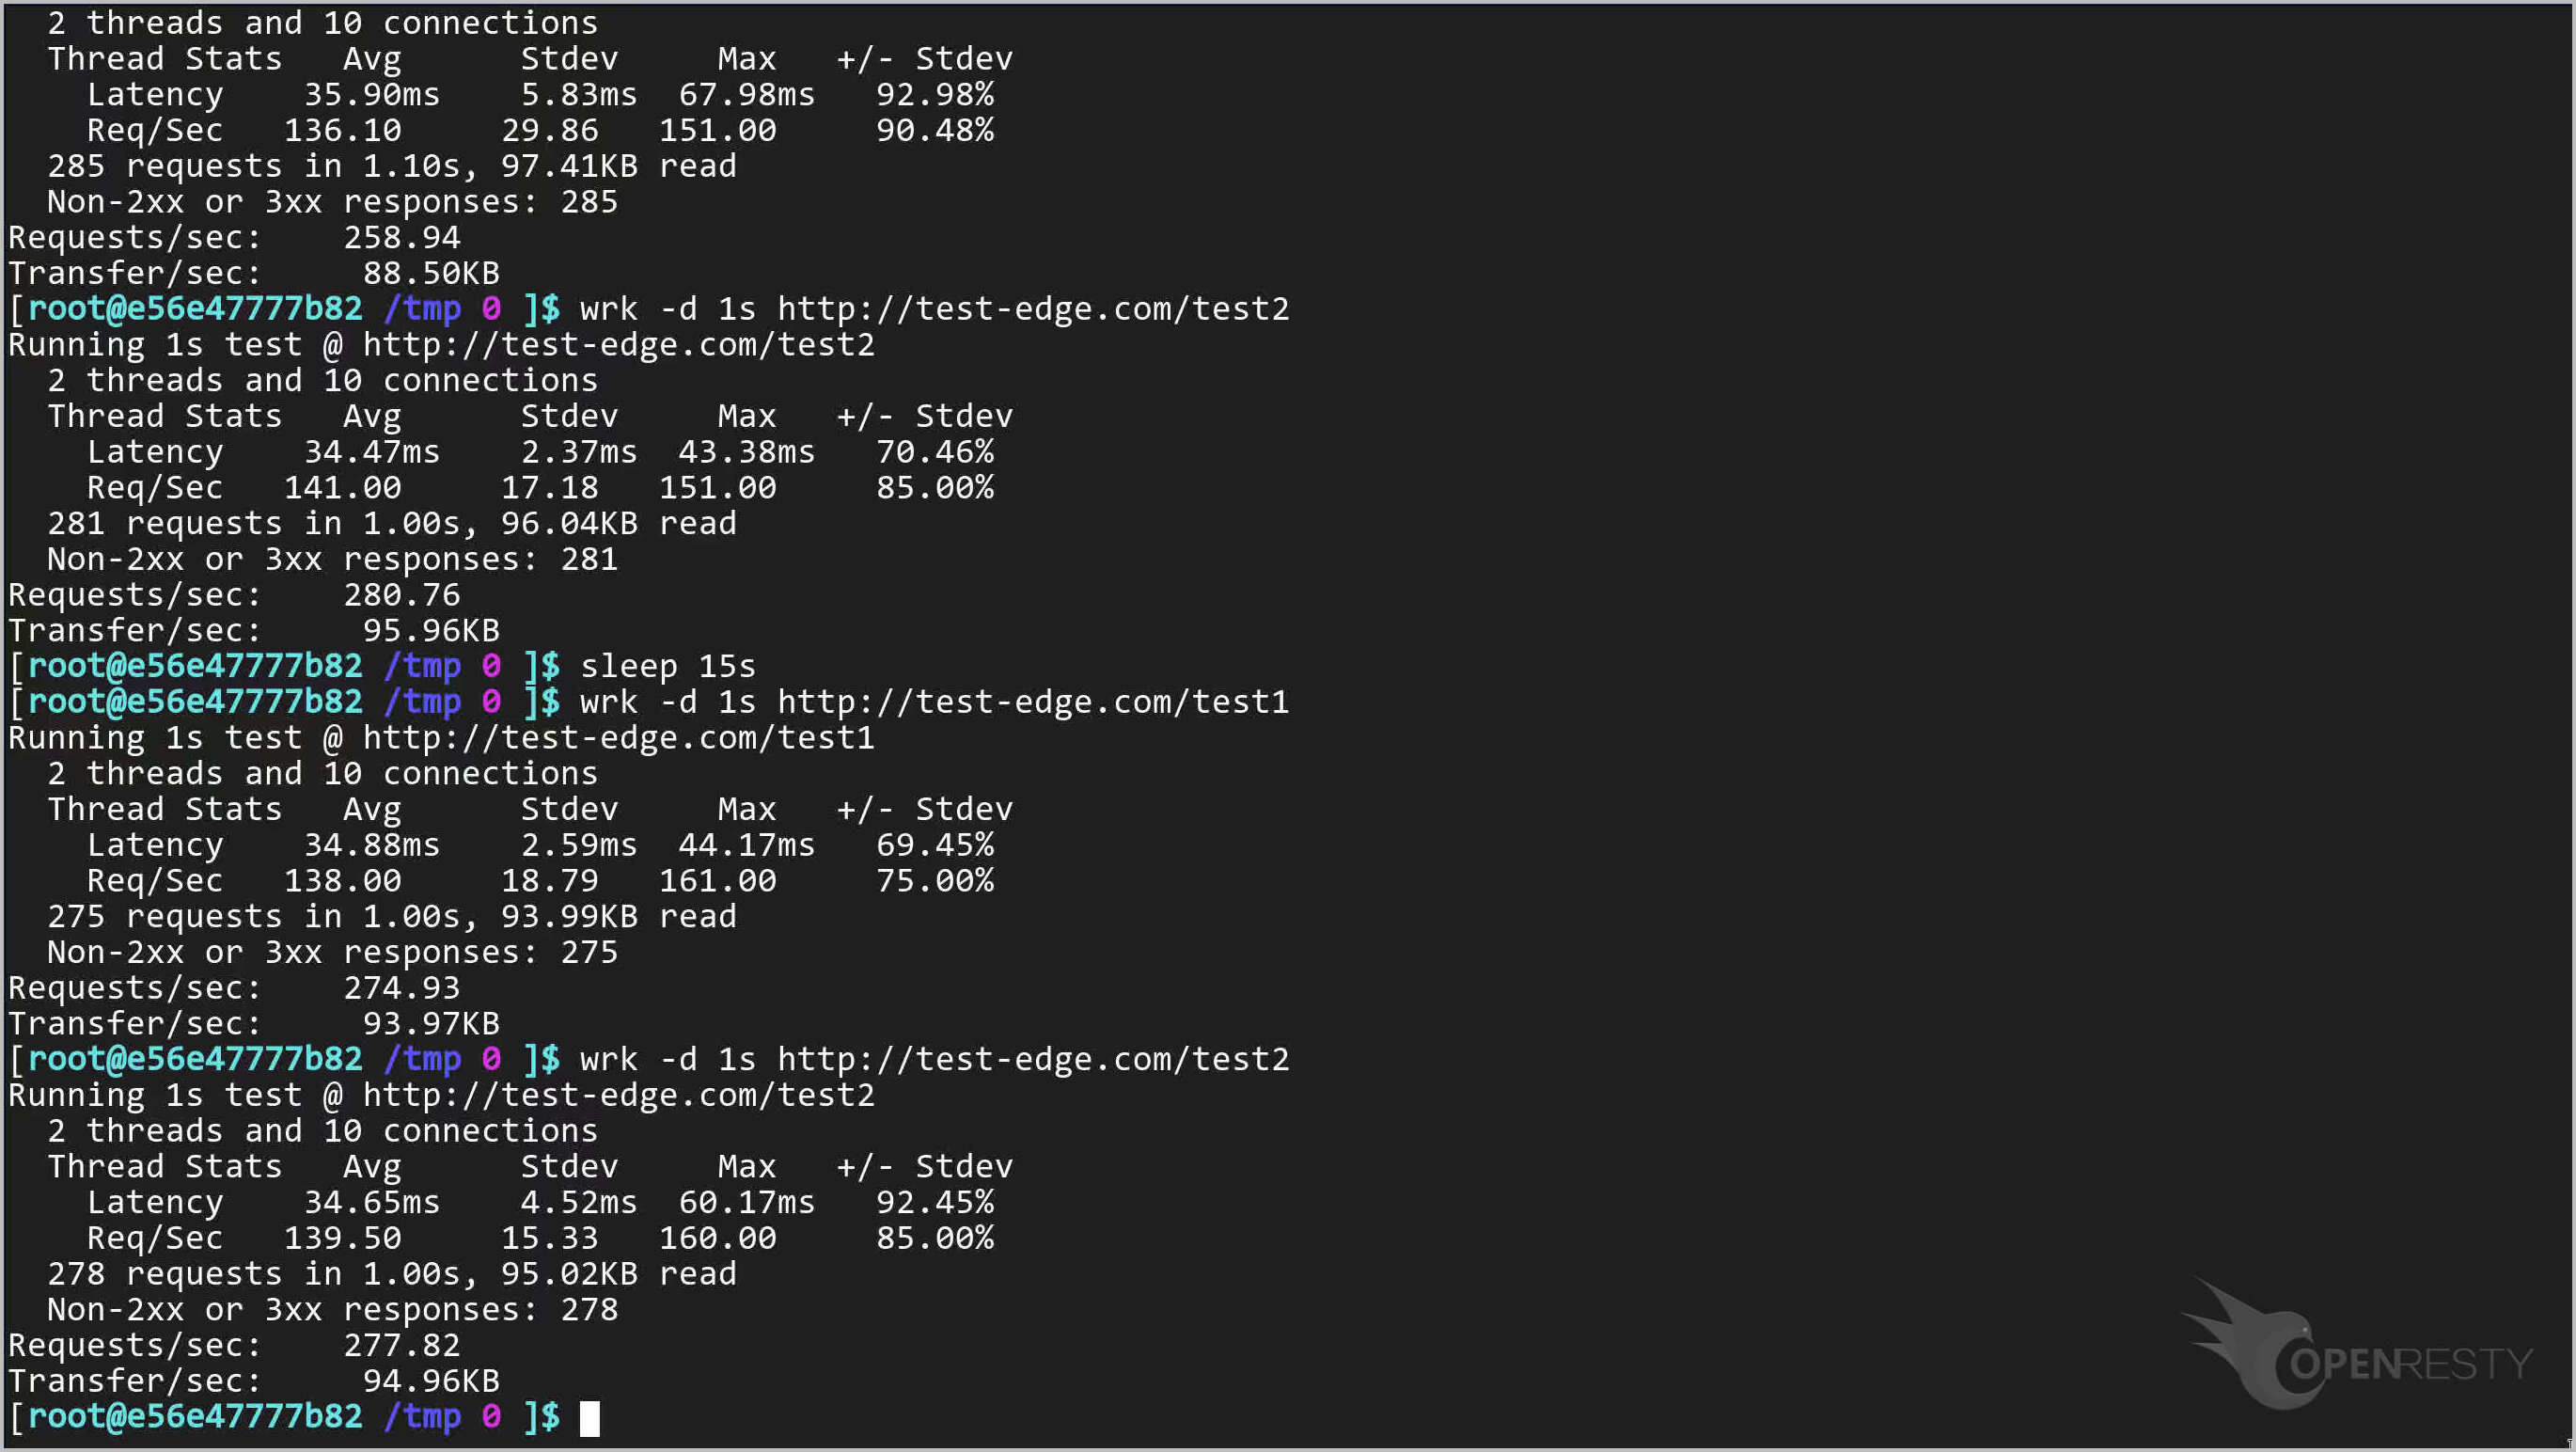
We can quickly send many requests on the terminal through the open-source utility named wrk.
wrk -d 1s http://test-edge.com/test1
wrk -d 1s http://test-edge.com/test2
We wait 15 seconds to send another batch of requests.
Data can be shown as a pie chart as well.
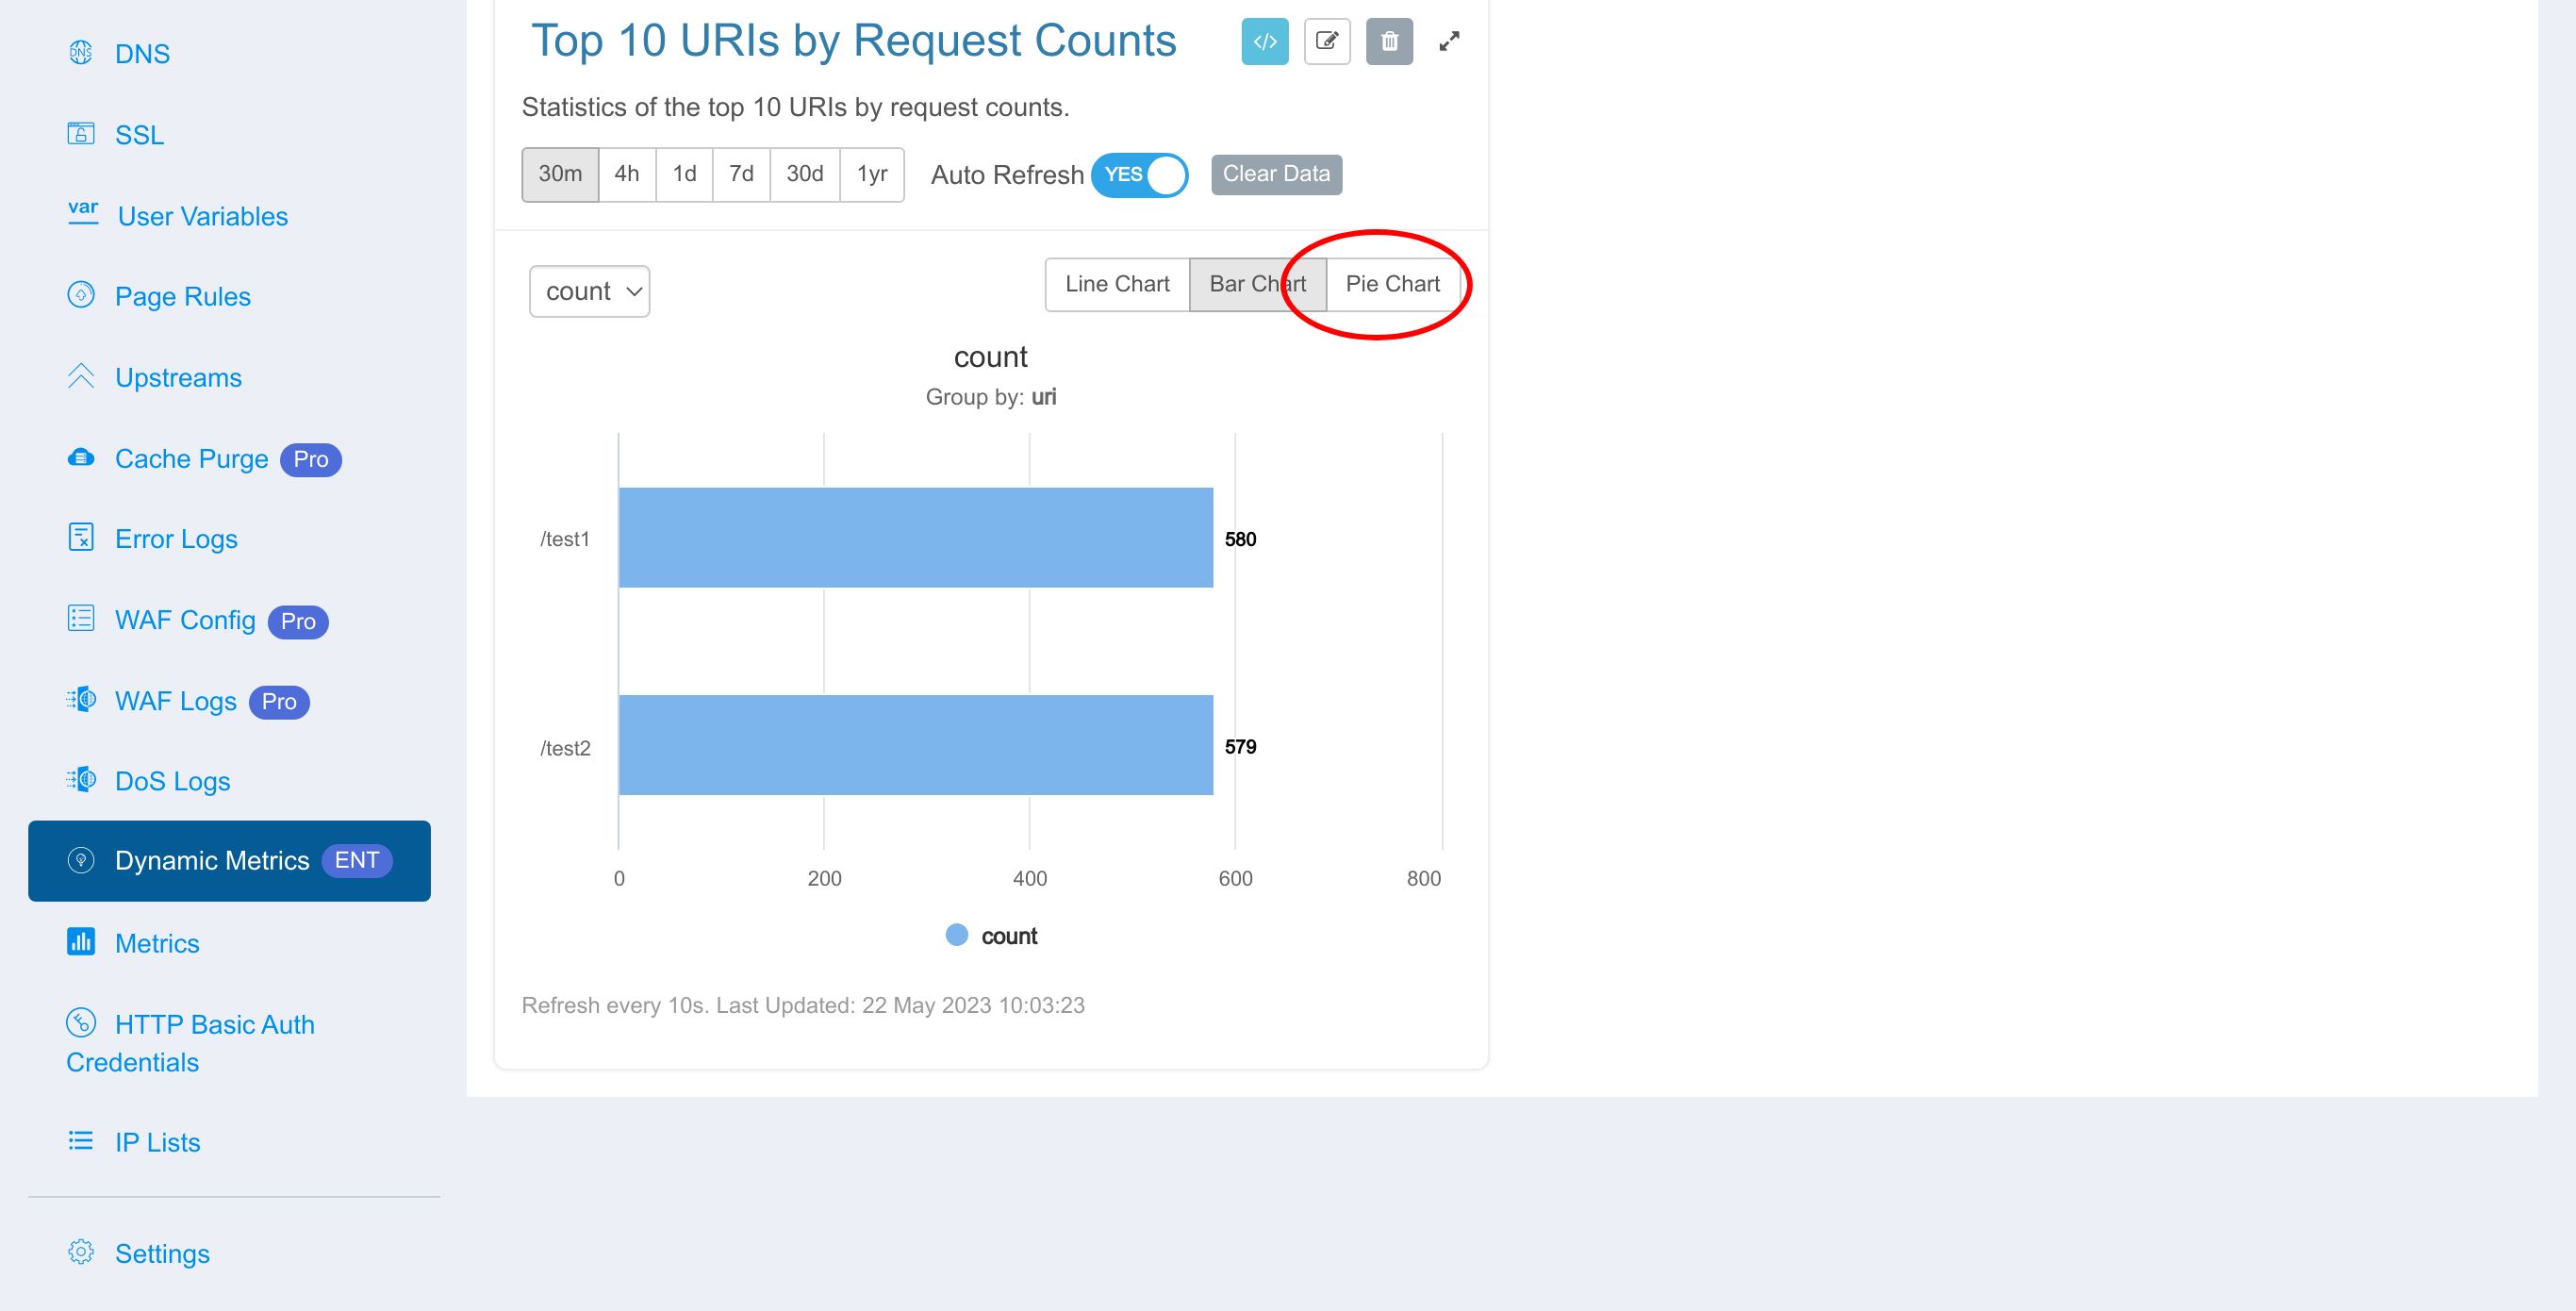
And also as a line chart.
It is what we expect.
You can delete the existing metric using the delete button.

Or go to the list of standard metrics
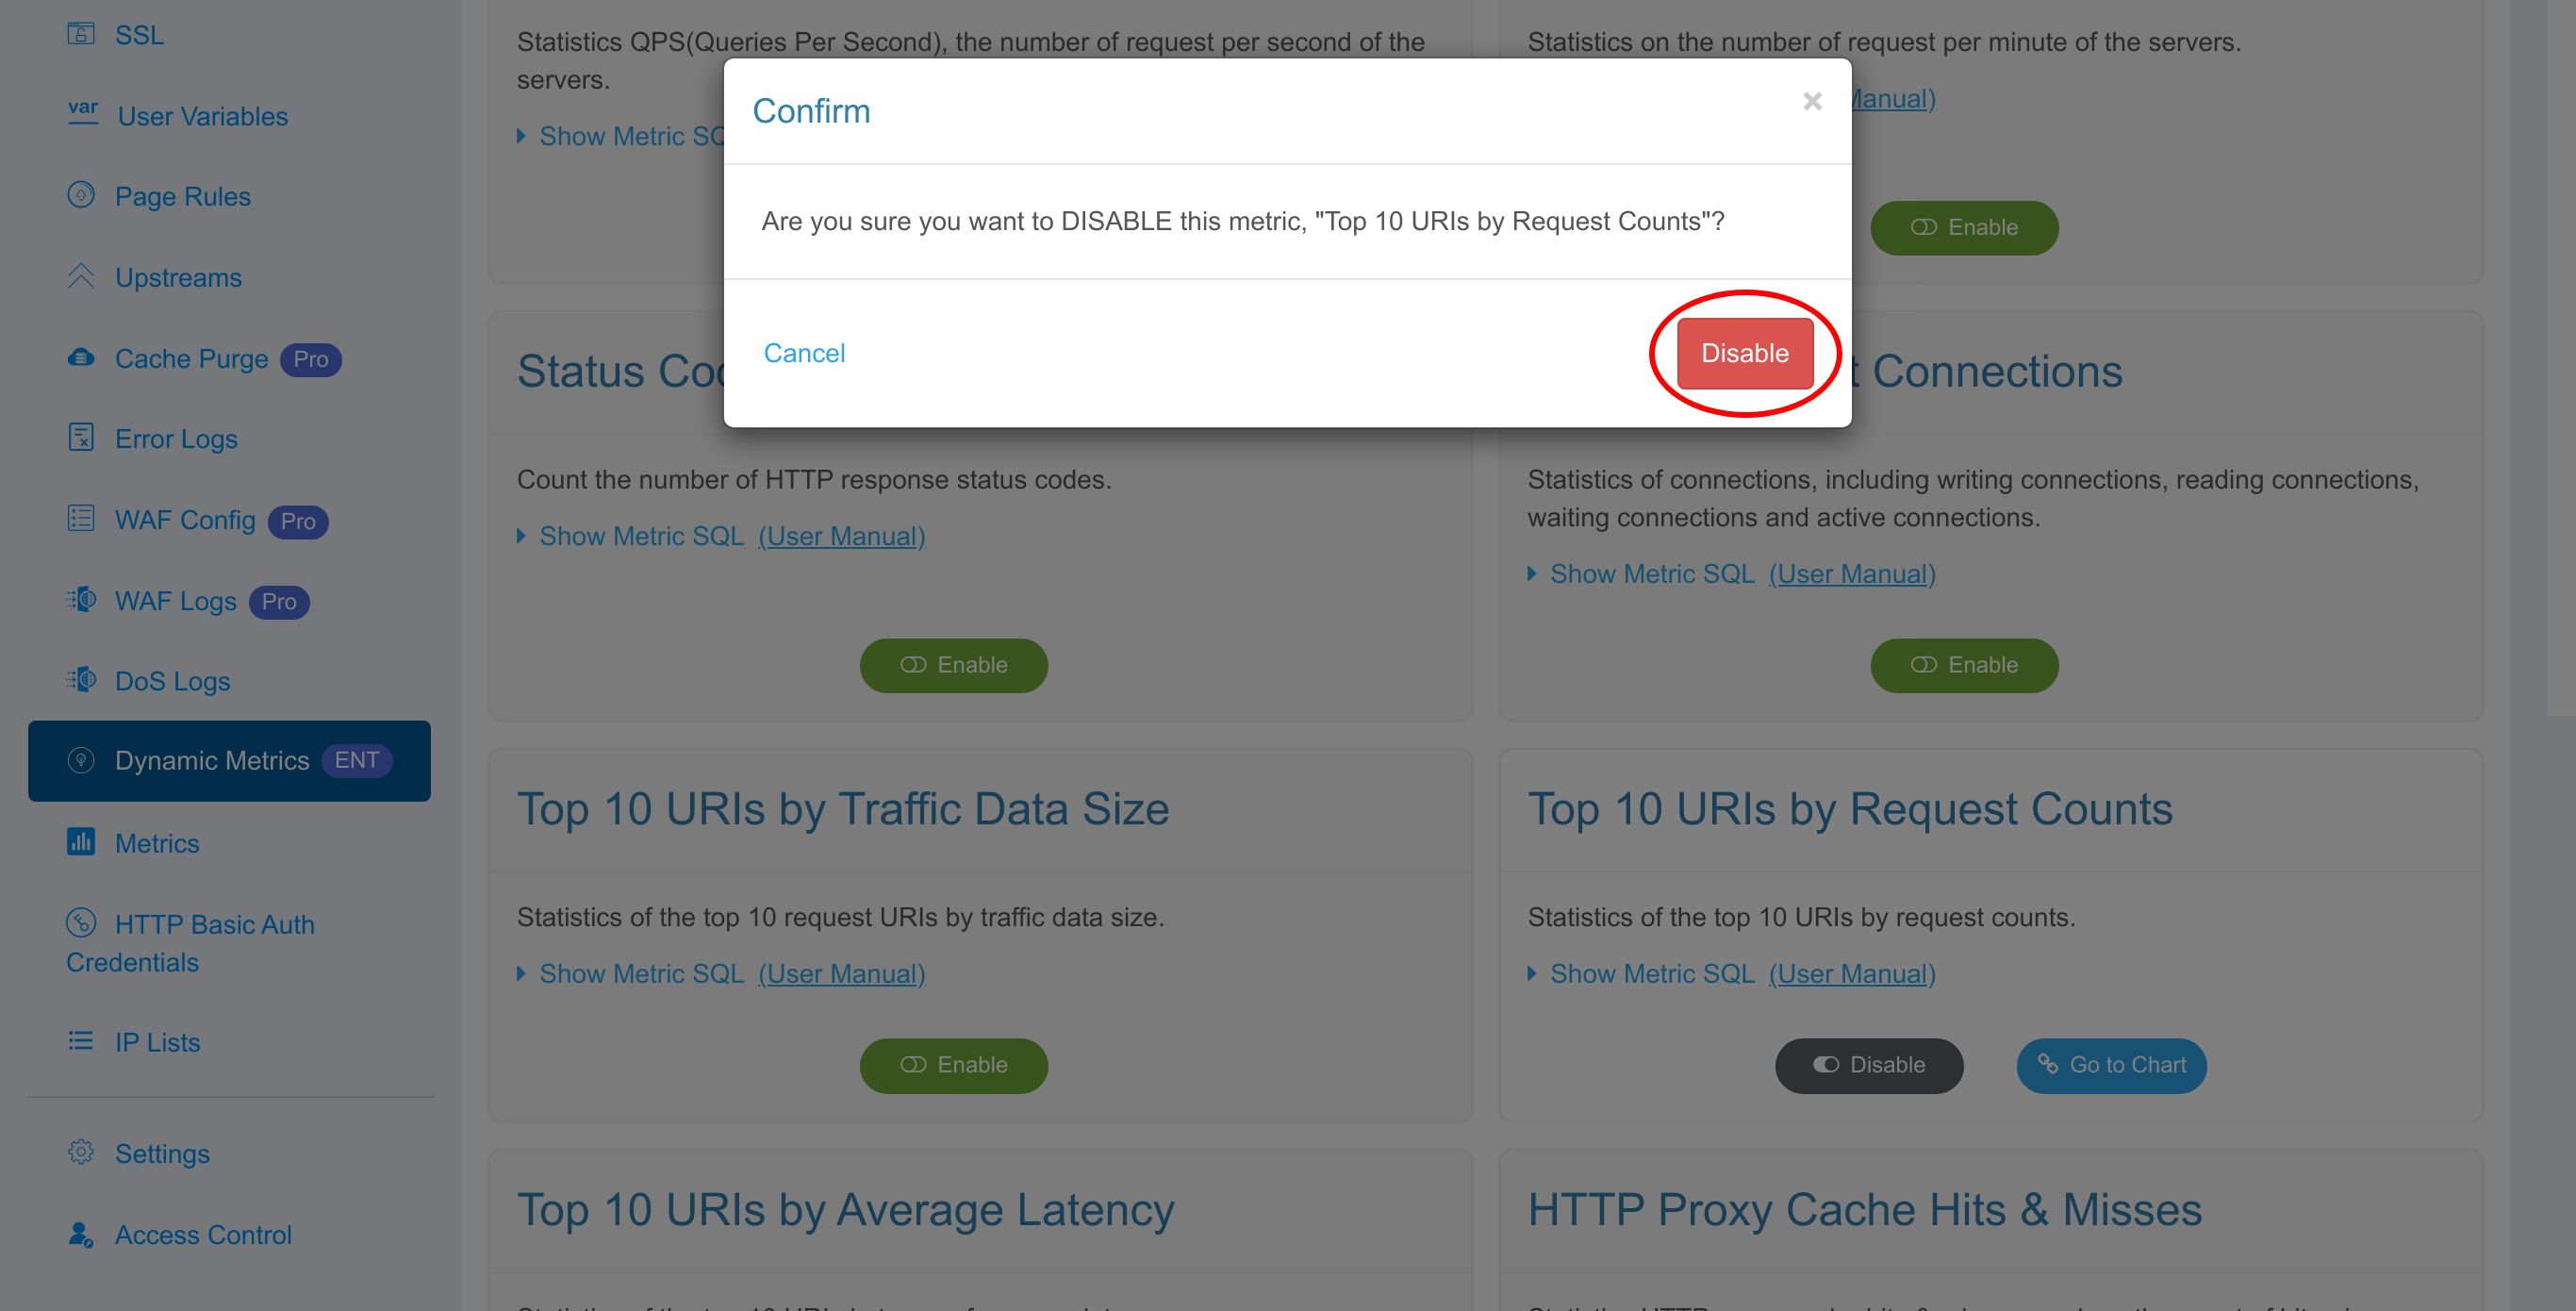
Click on this “Disable” button to disable this metric.
Click Confirm to disable this metric.
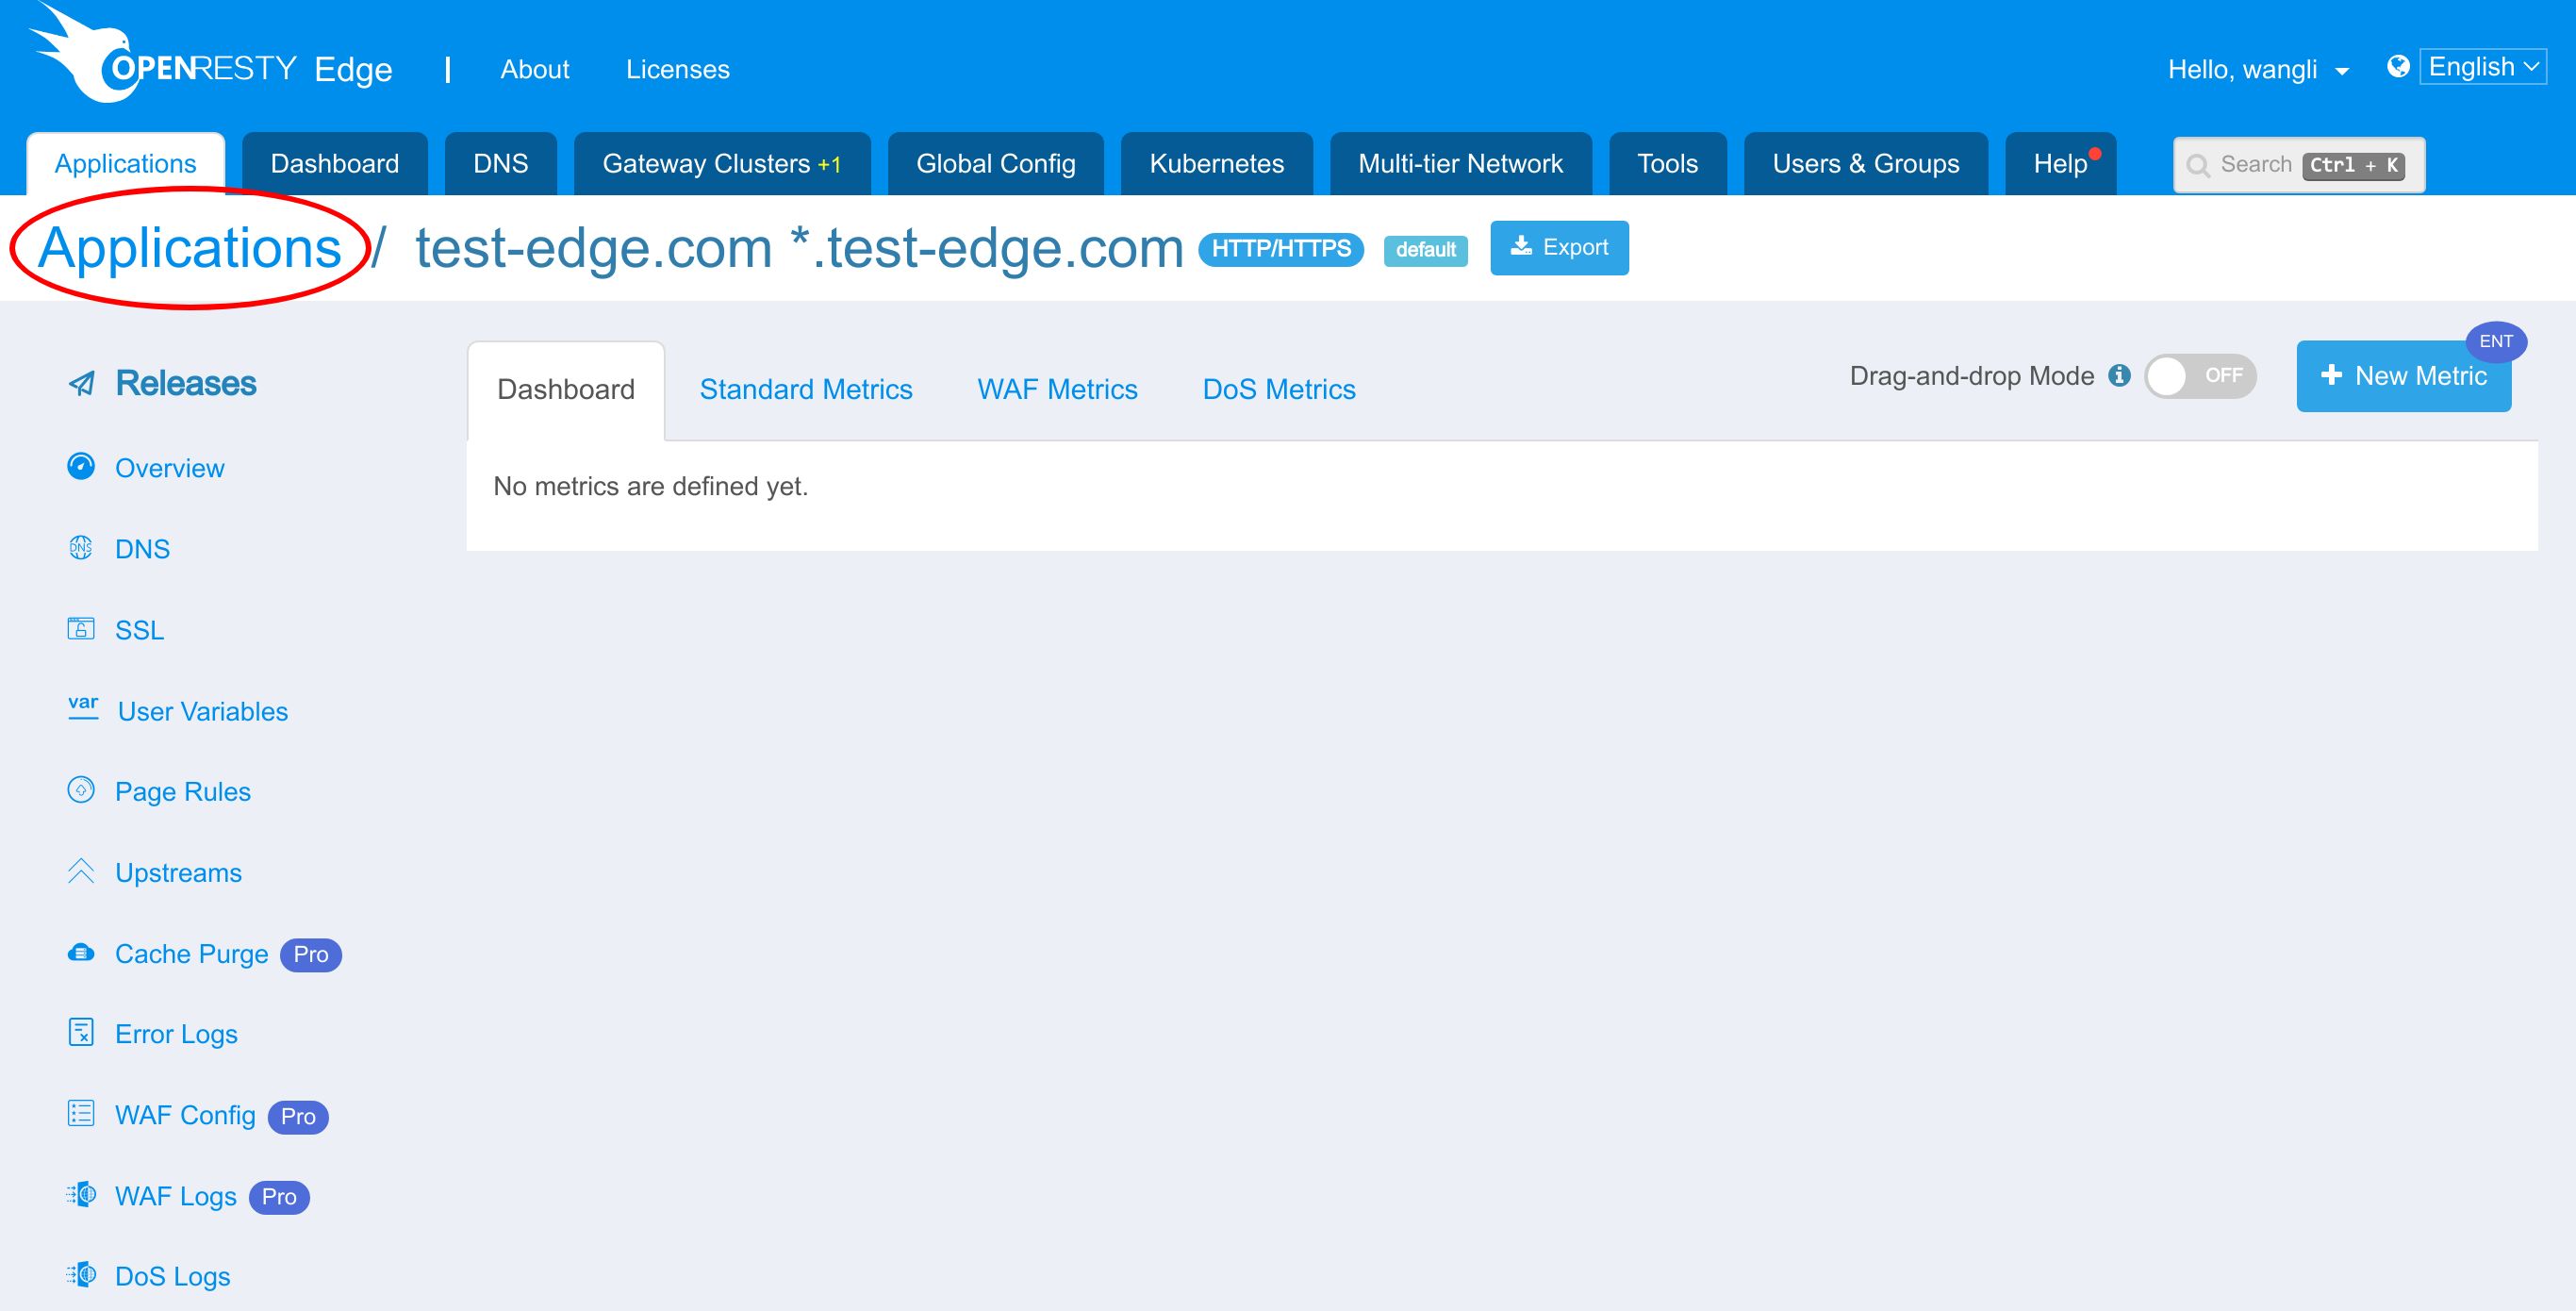
Back to the dashboard, you can see that this metric is no longer displayed.
Standard dynamic metrics of openresty.org
Now let’s check out standard dynamic metrics using real traffic hitting one of our open-source websites.
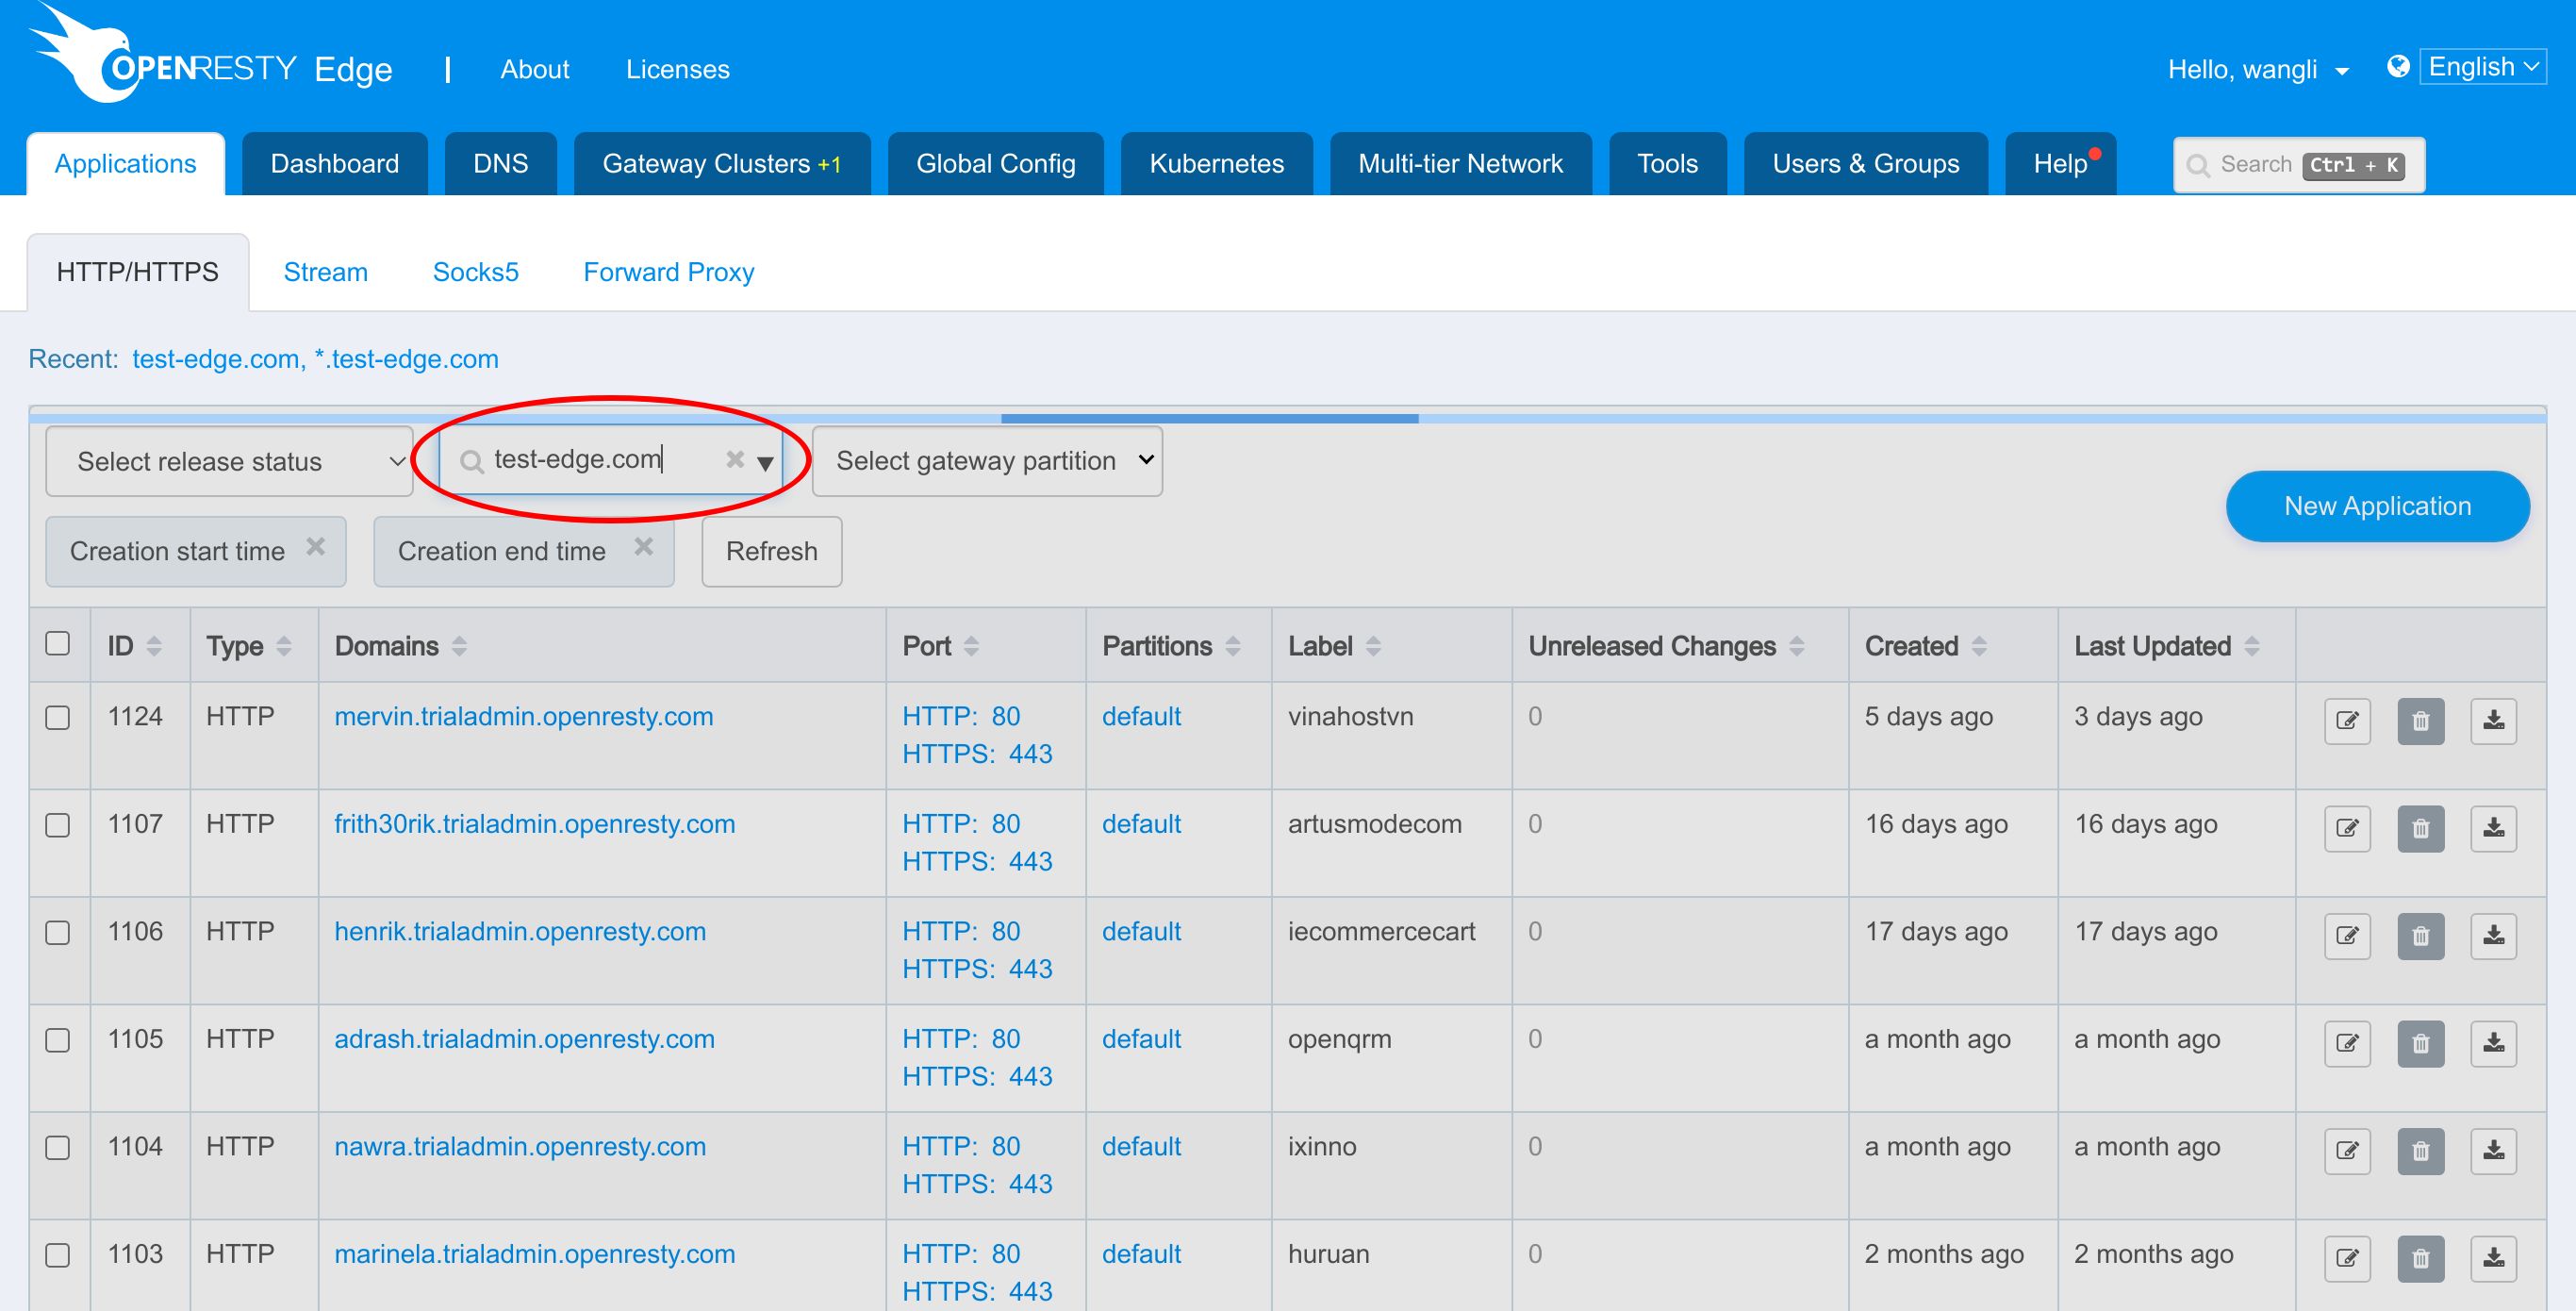
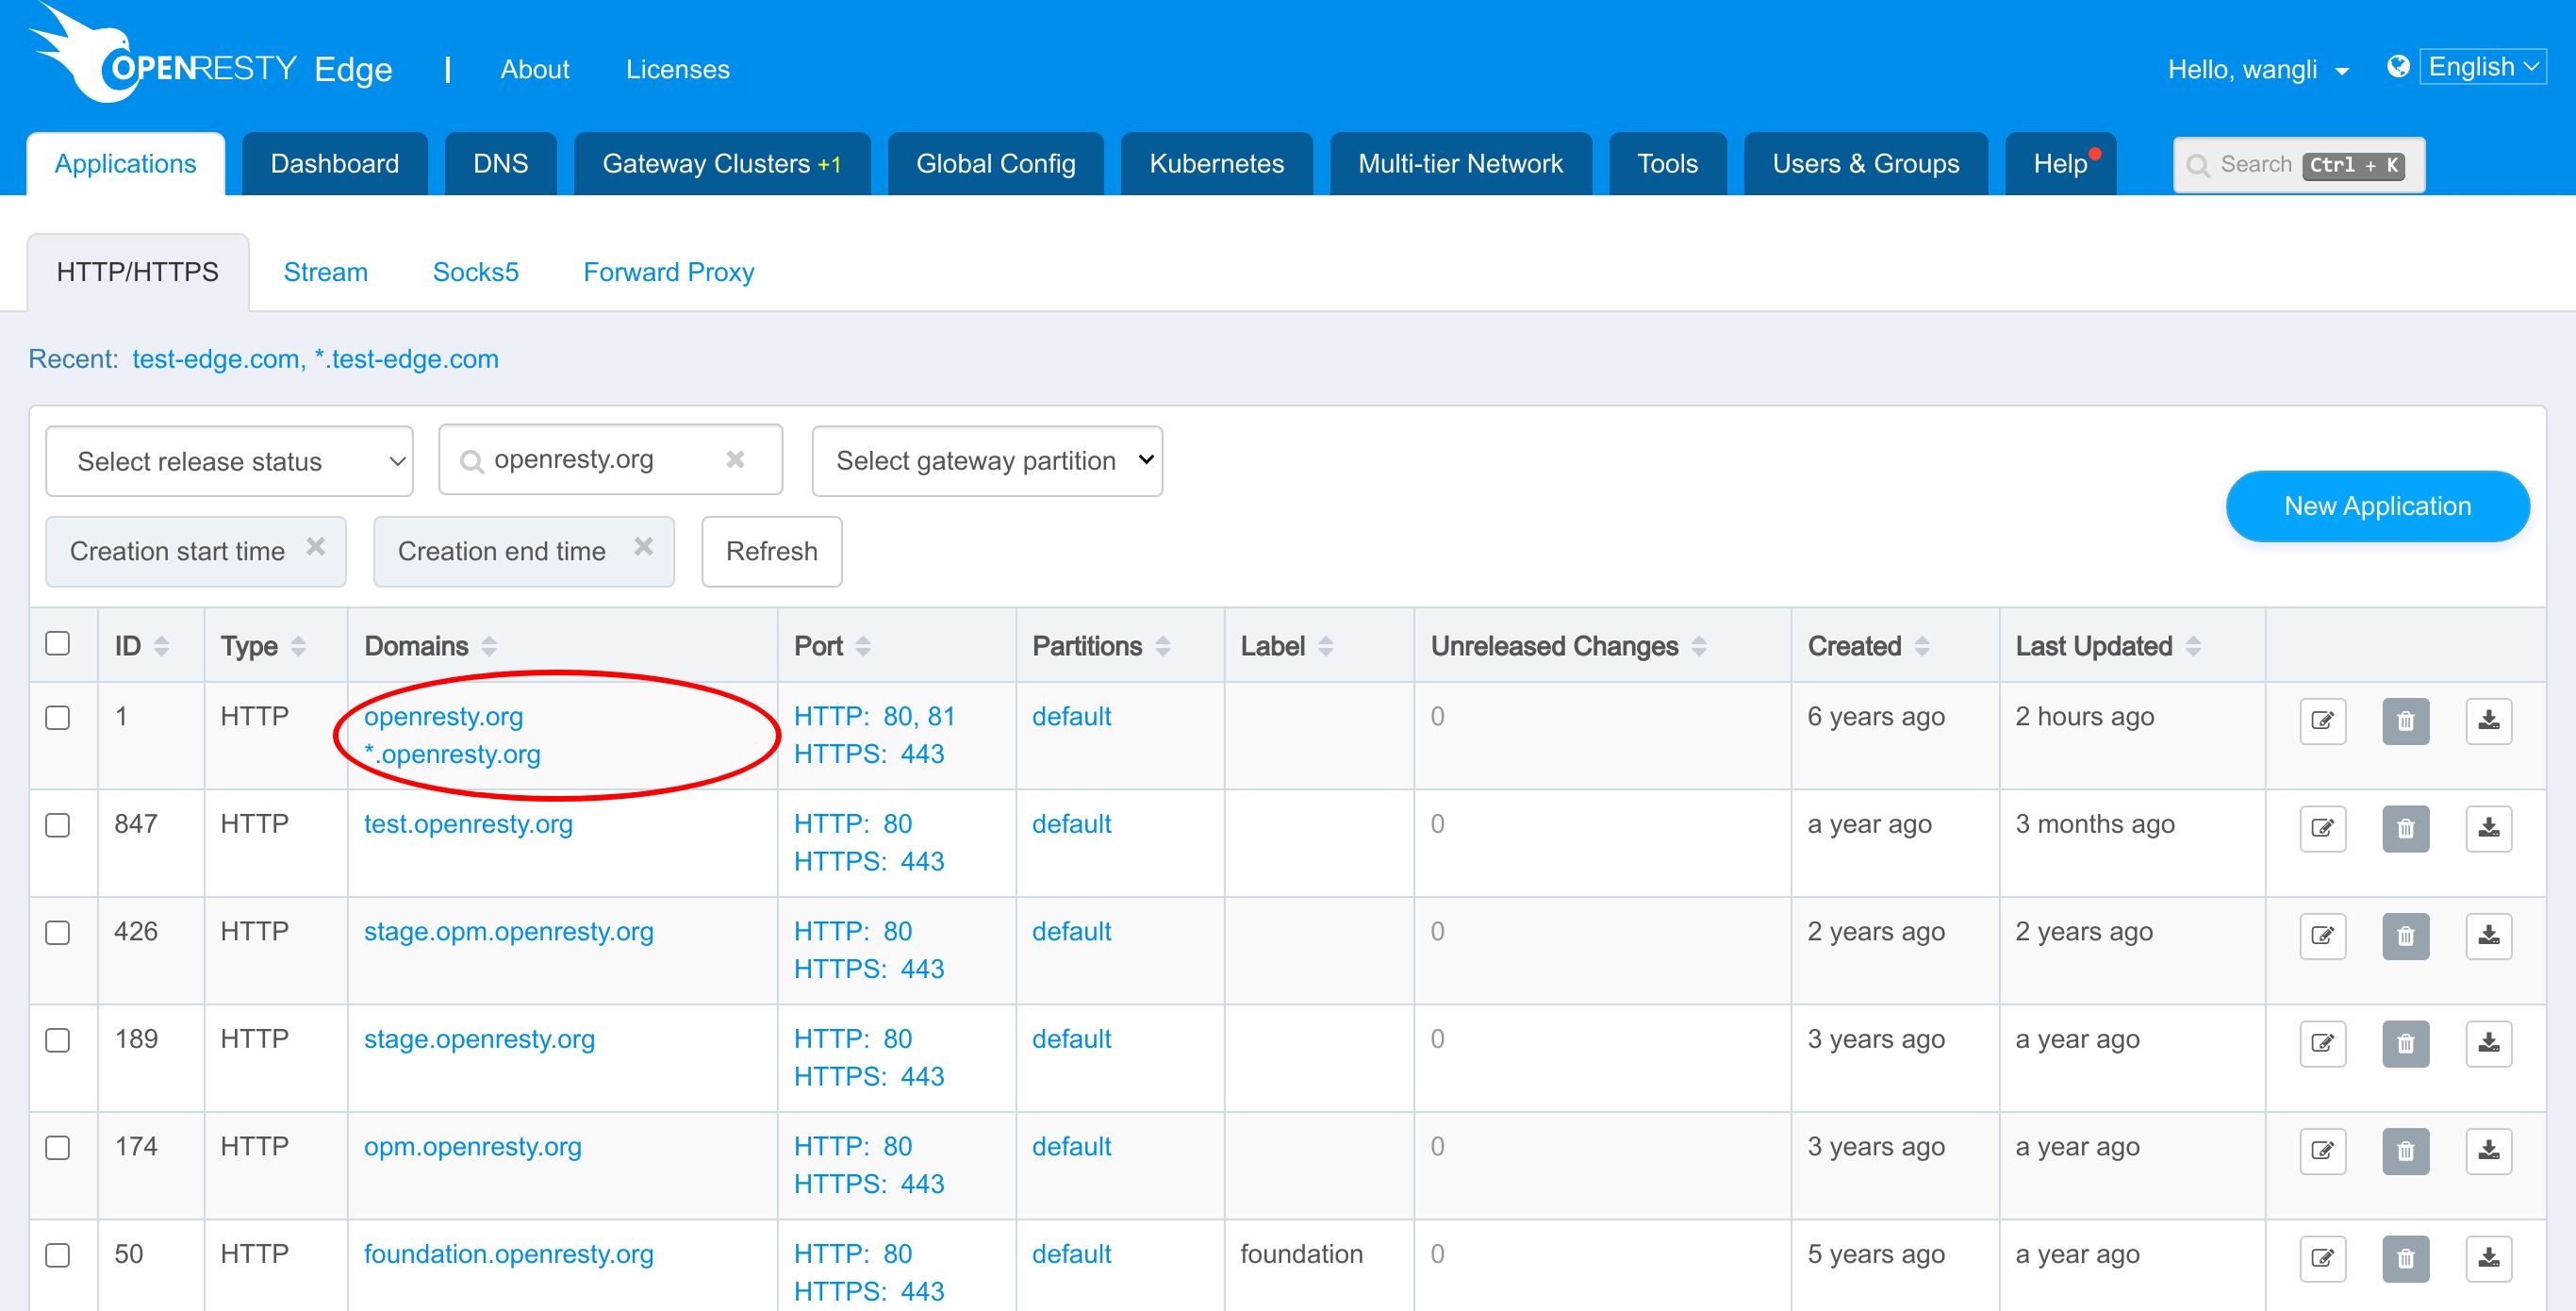
Type in openresty.org in the search box.

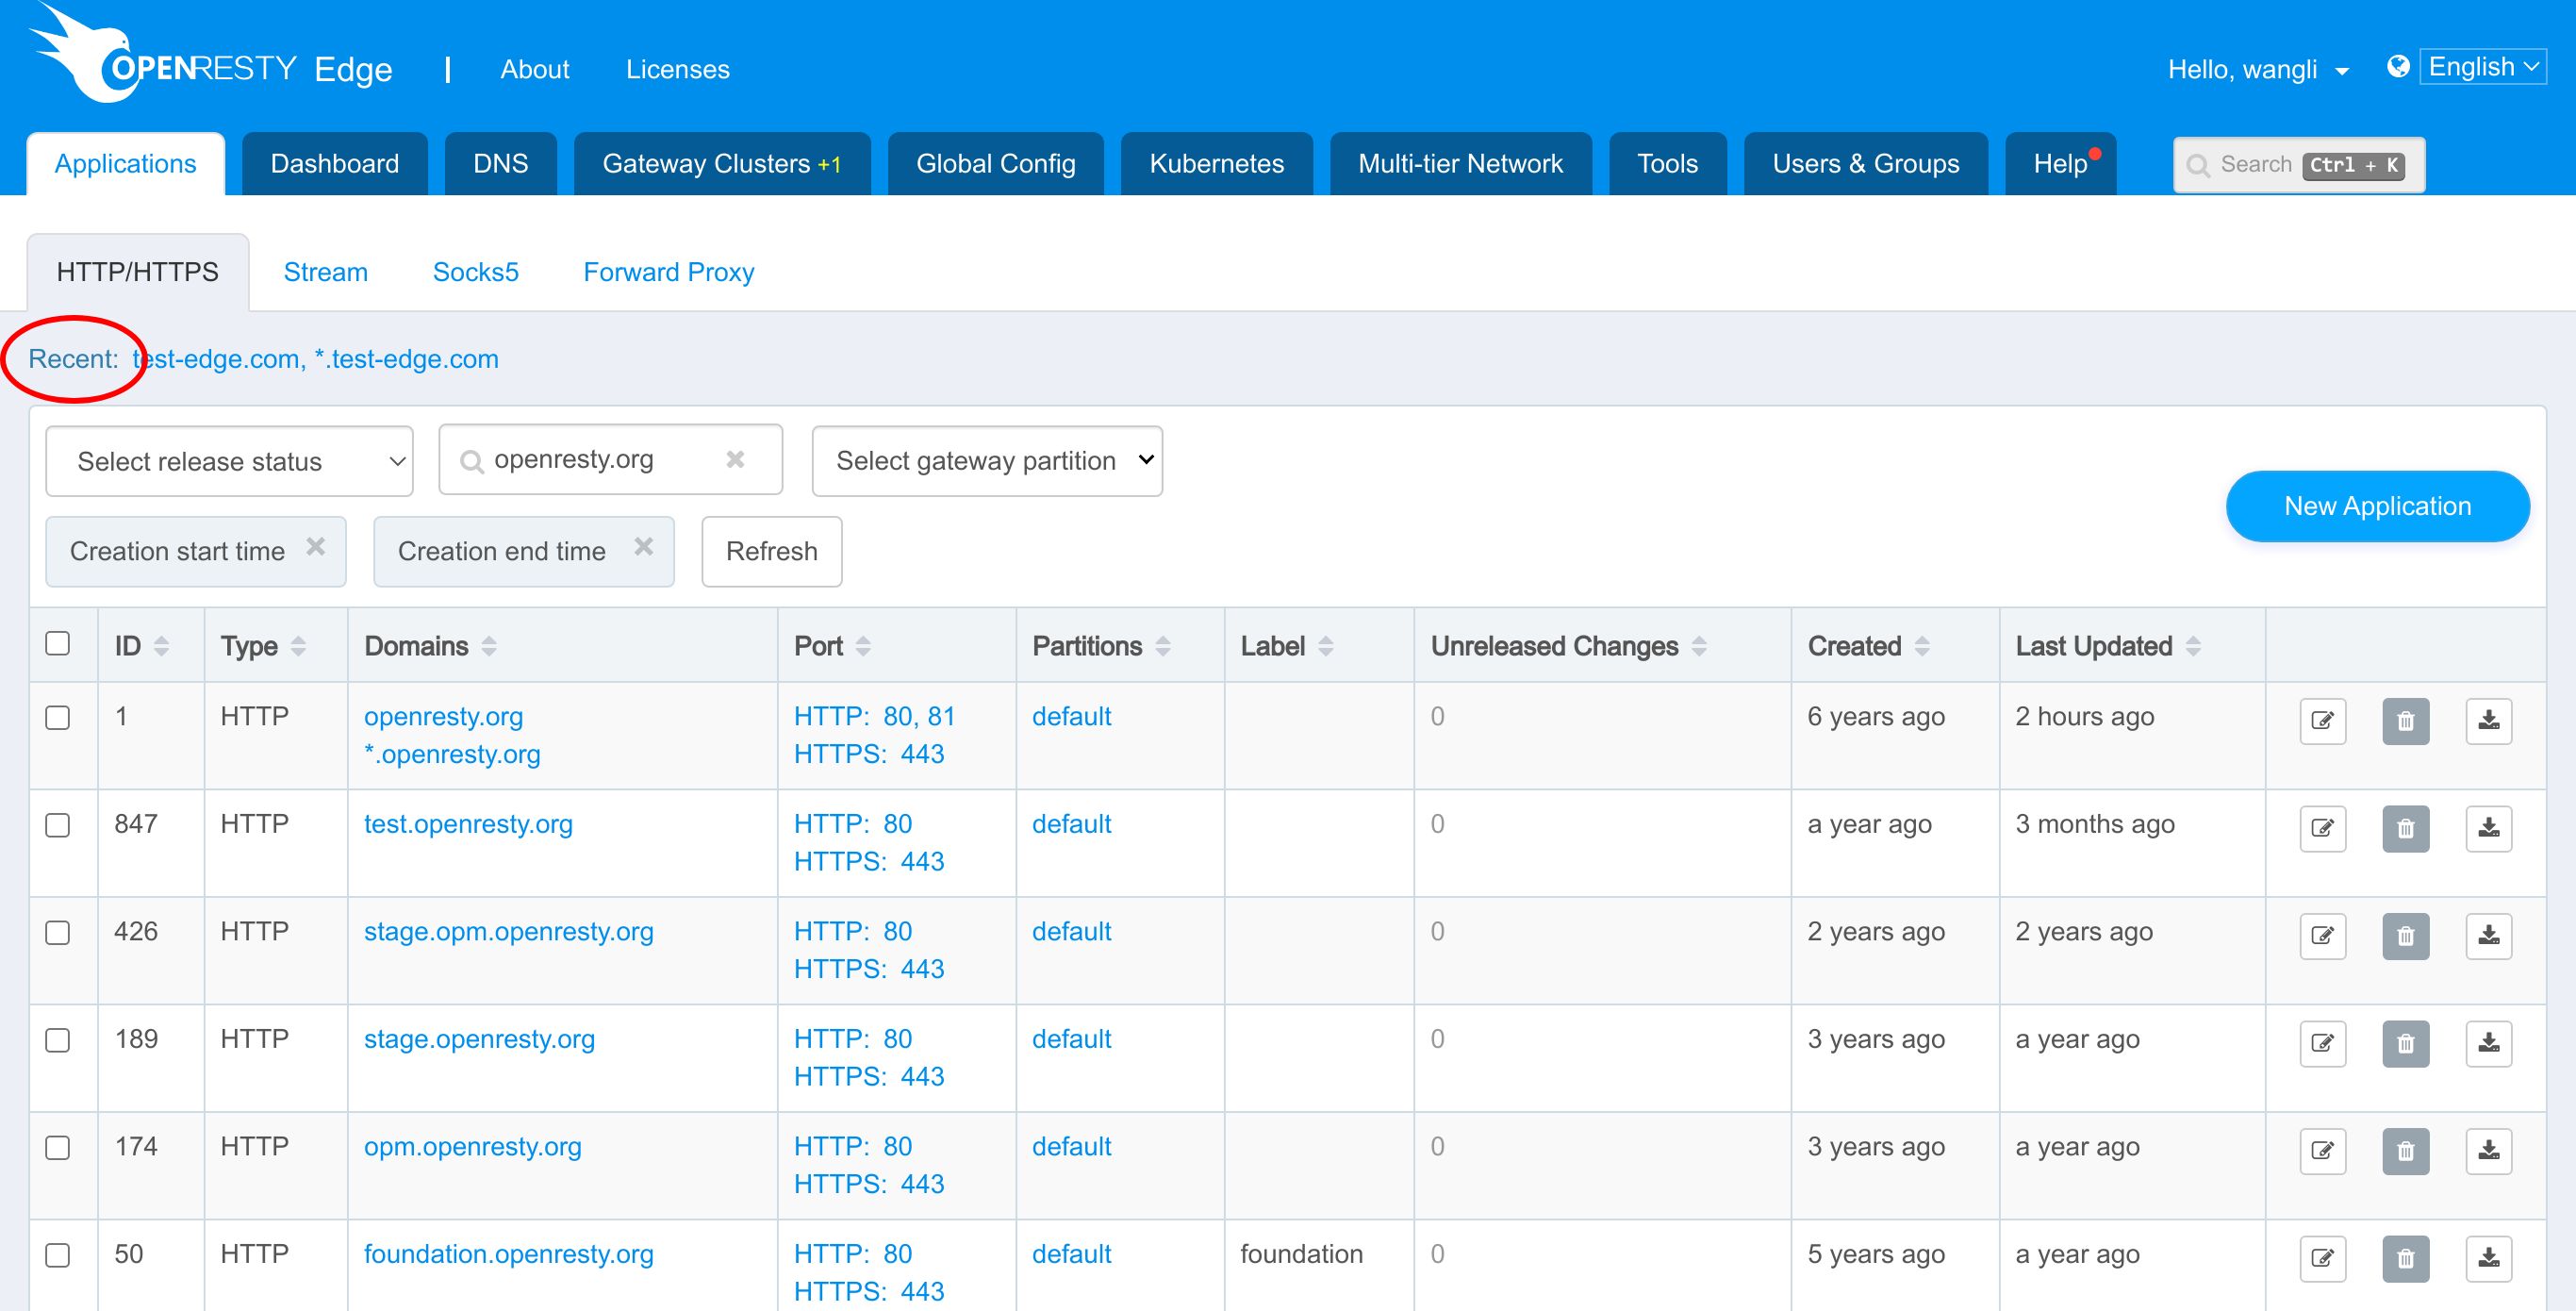
Enter this application.
Enter the Dynamic Metrics page.
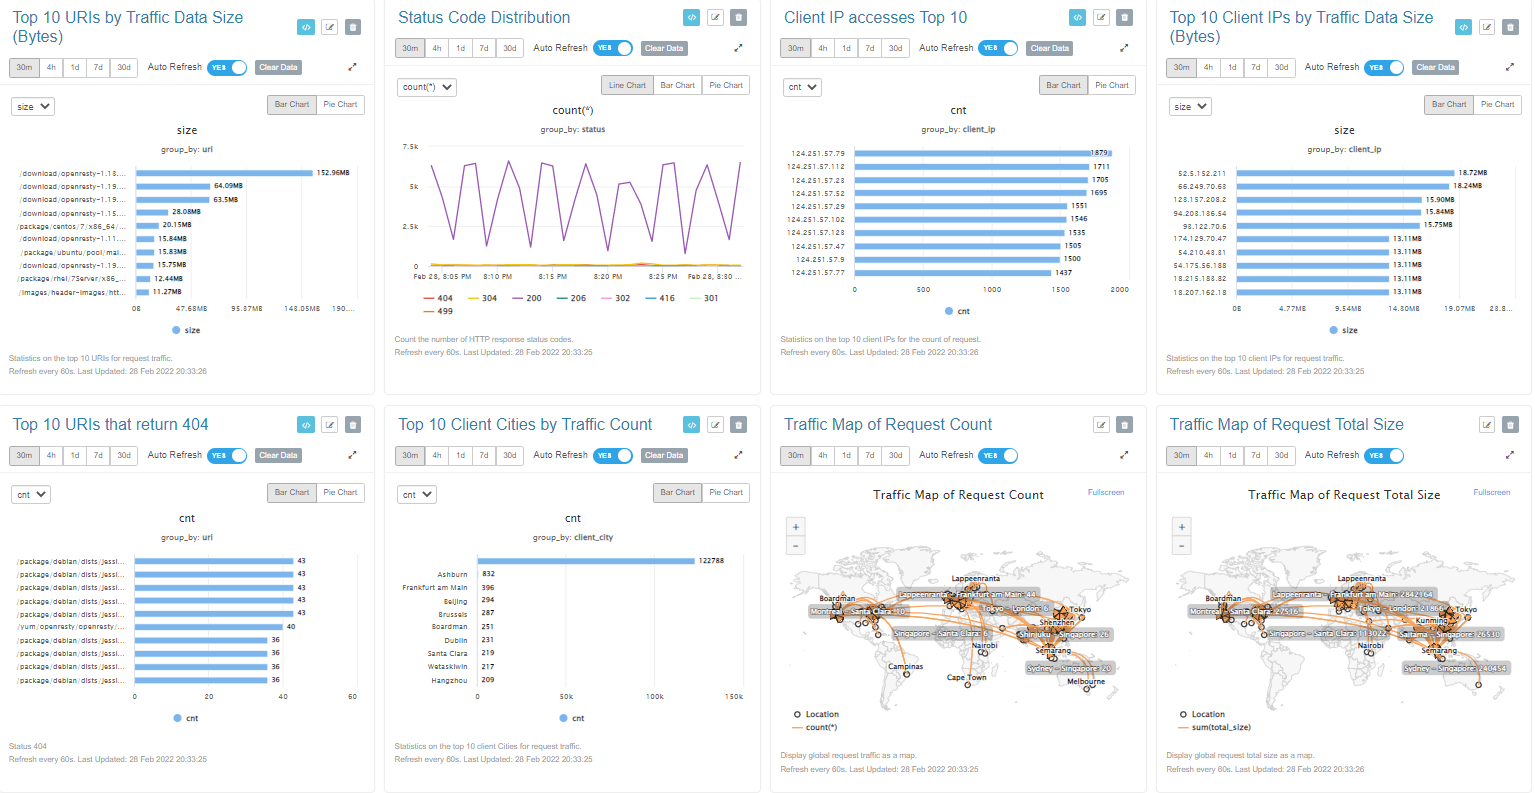
As you can see, we have already created many standard dynamic metrics. The data is displayed in various ways, like pie charts, bar charts, and line charts.
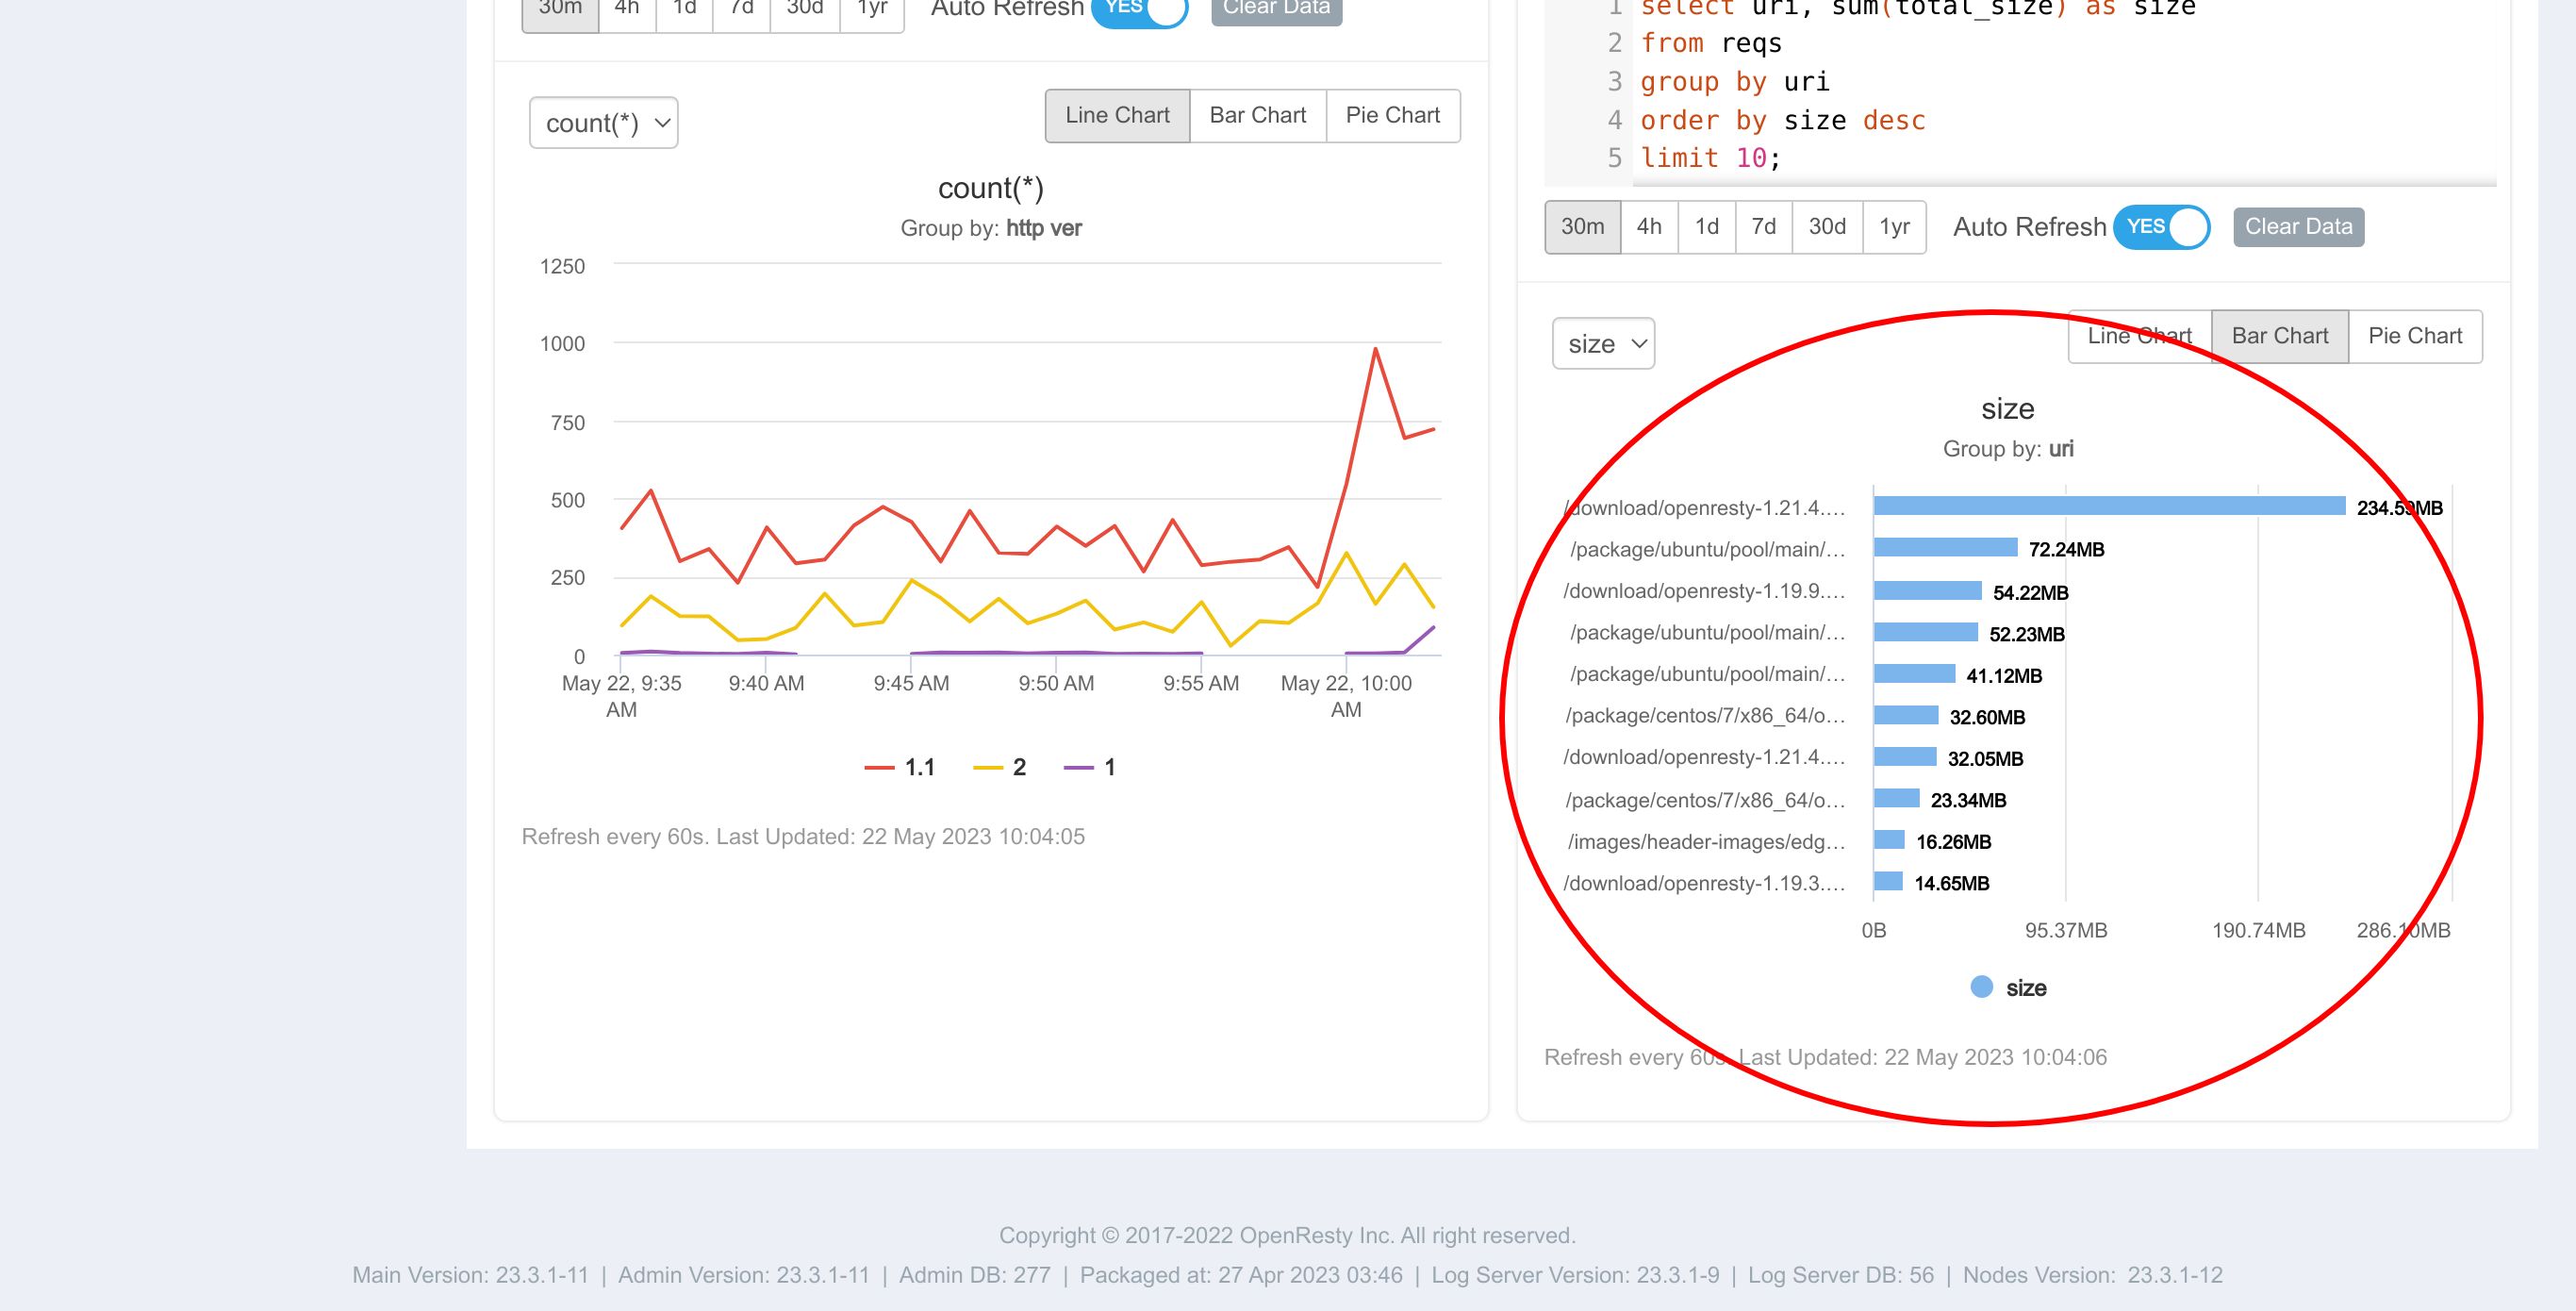
This one is interesting.
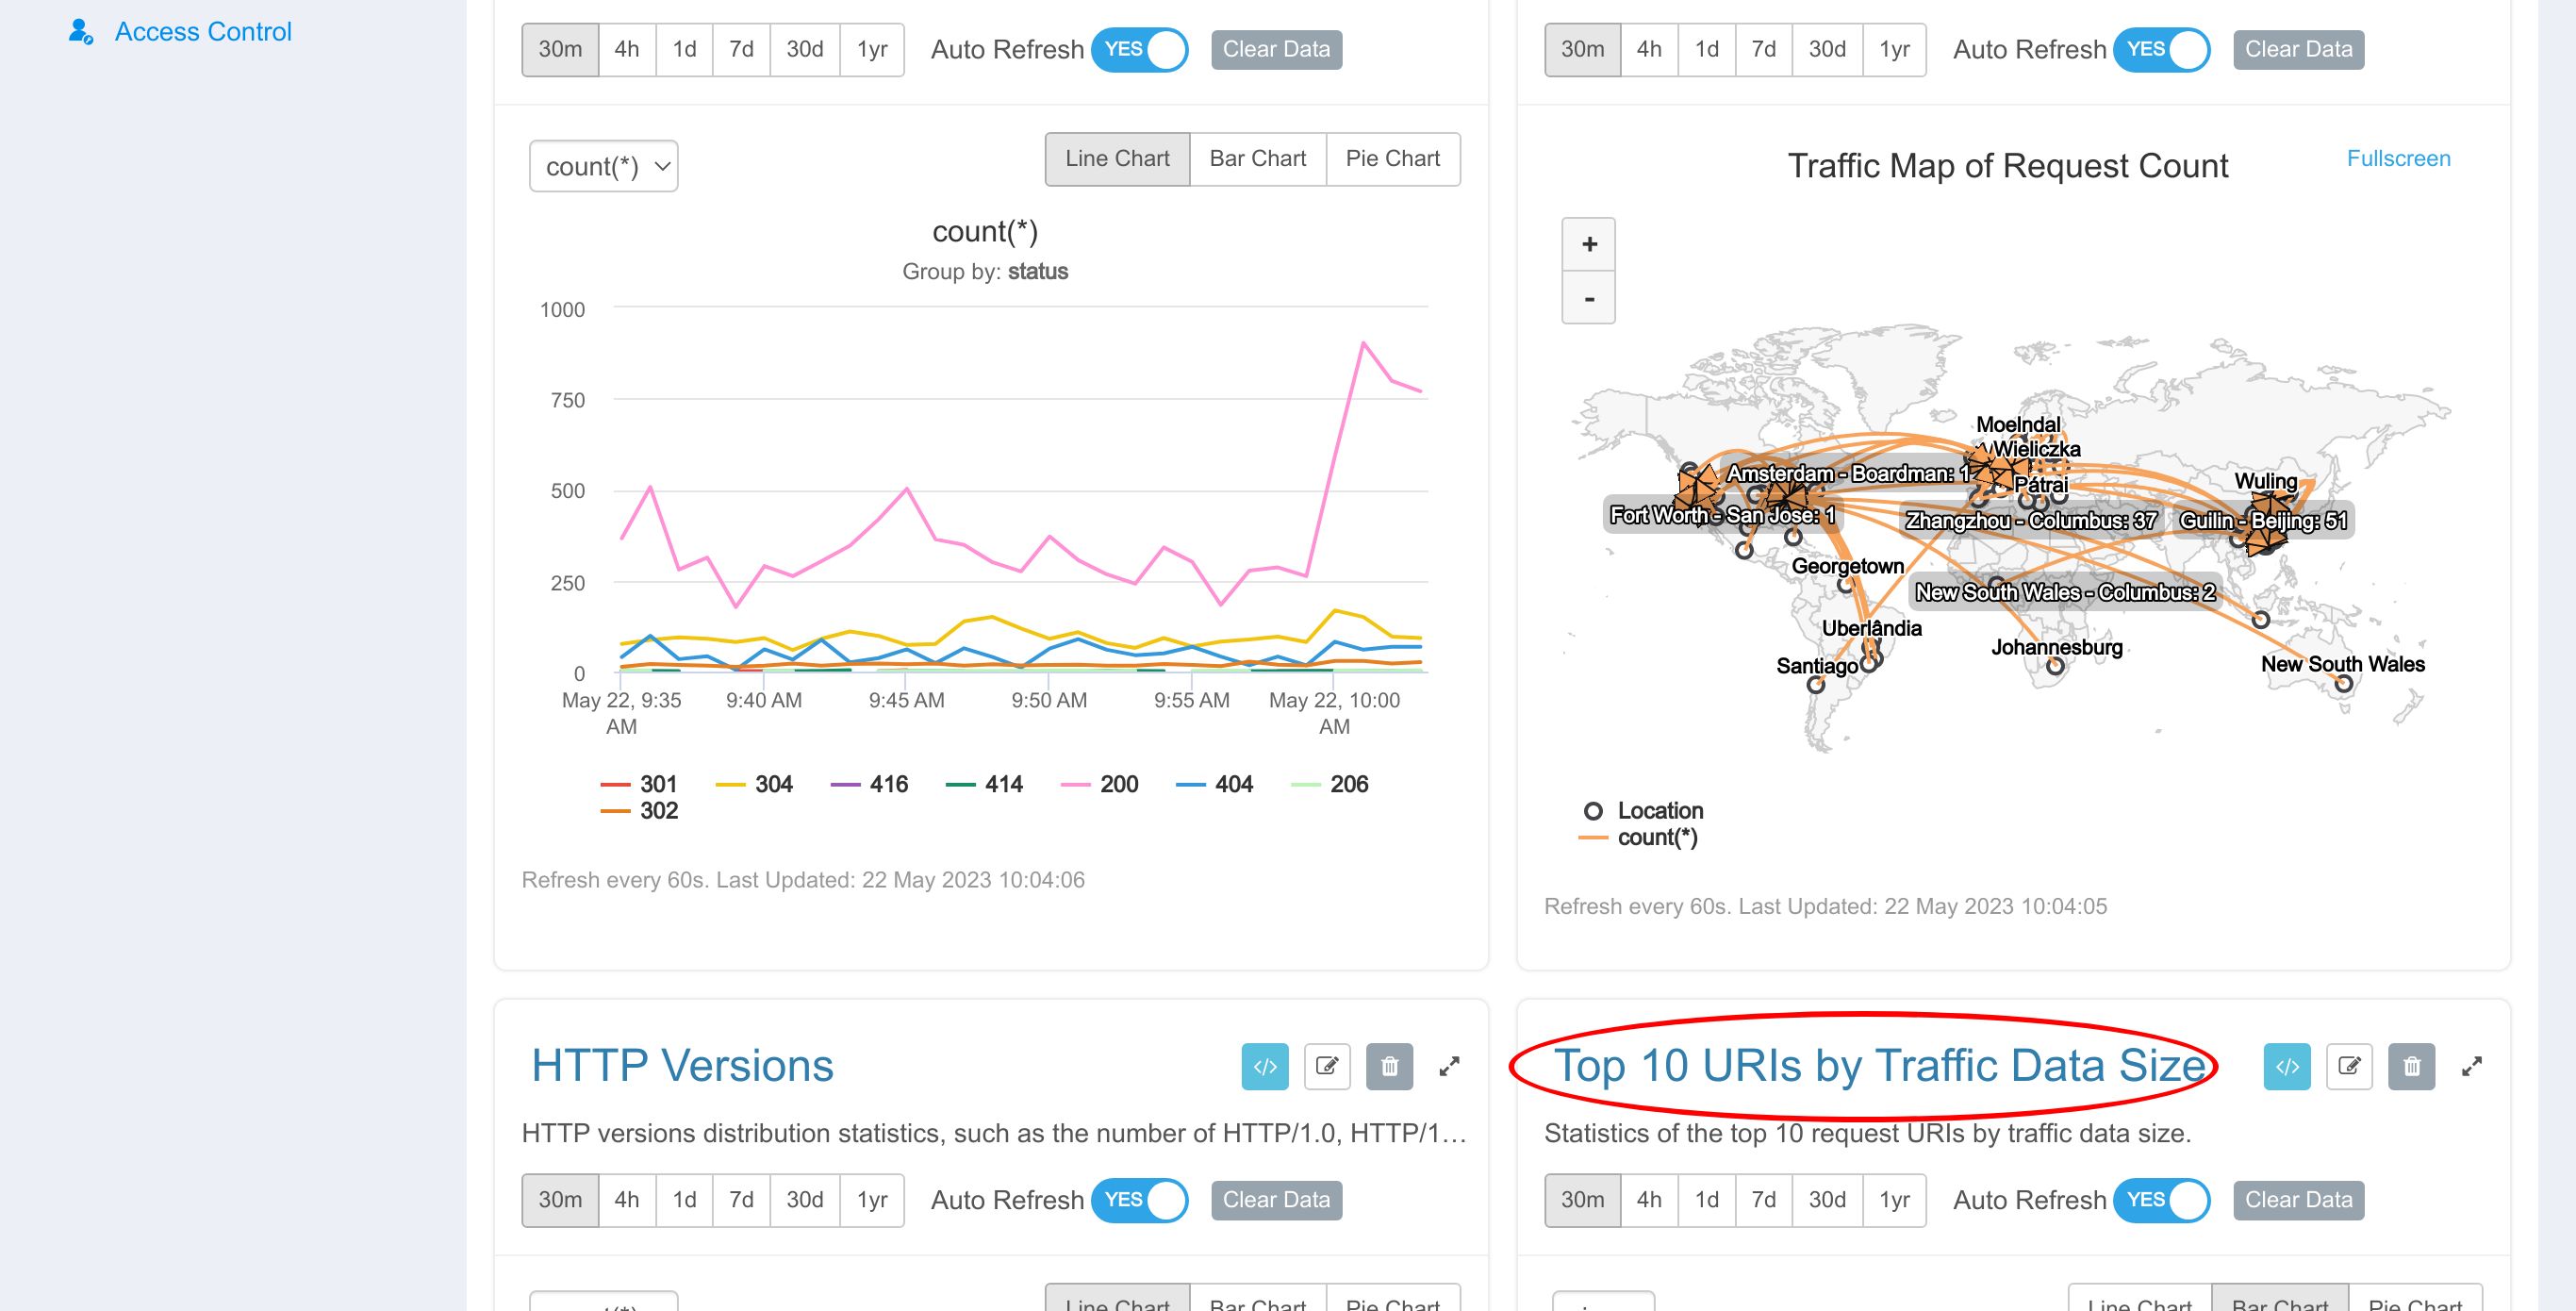
Let’s click this button to show its metric SQL statement.
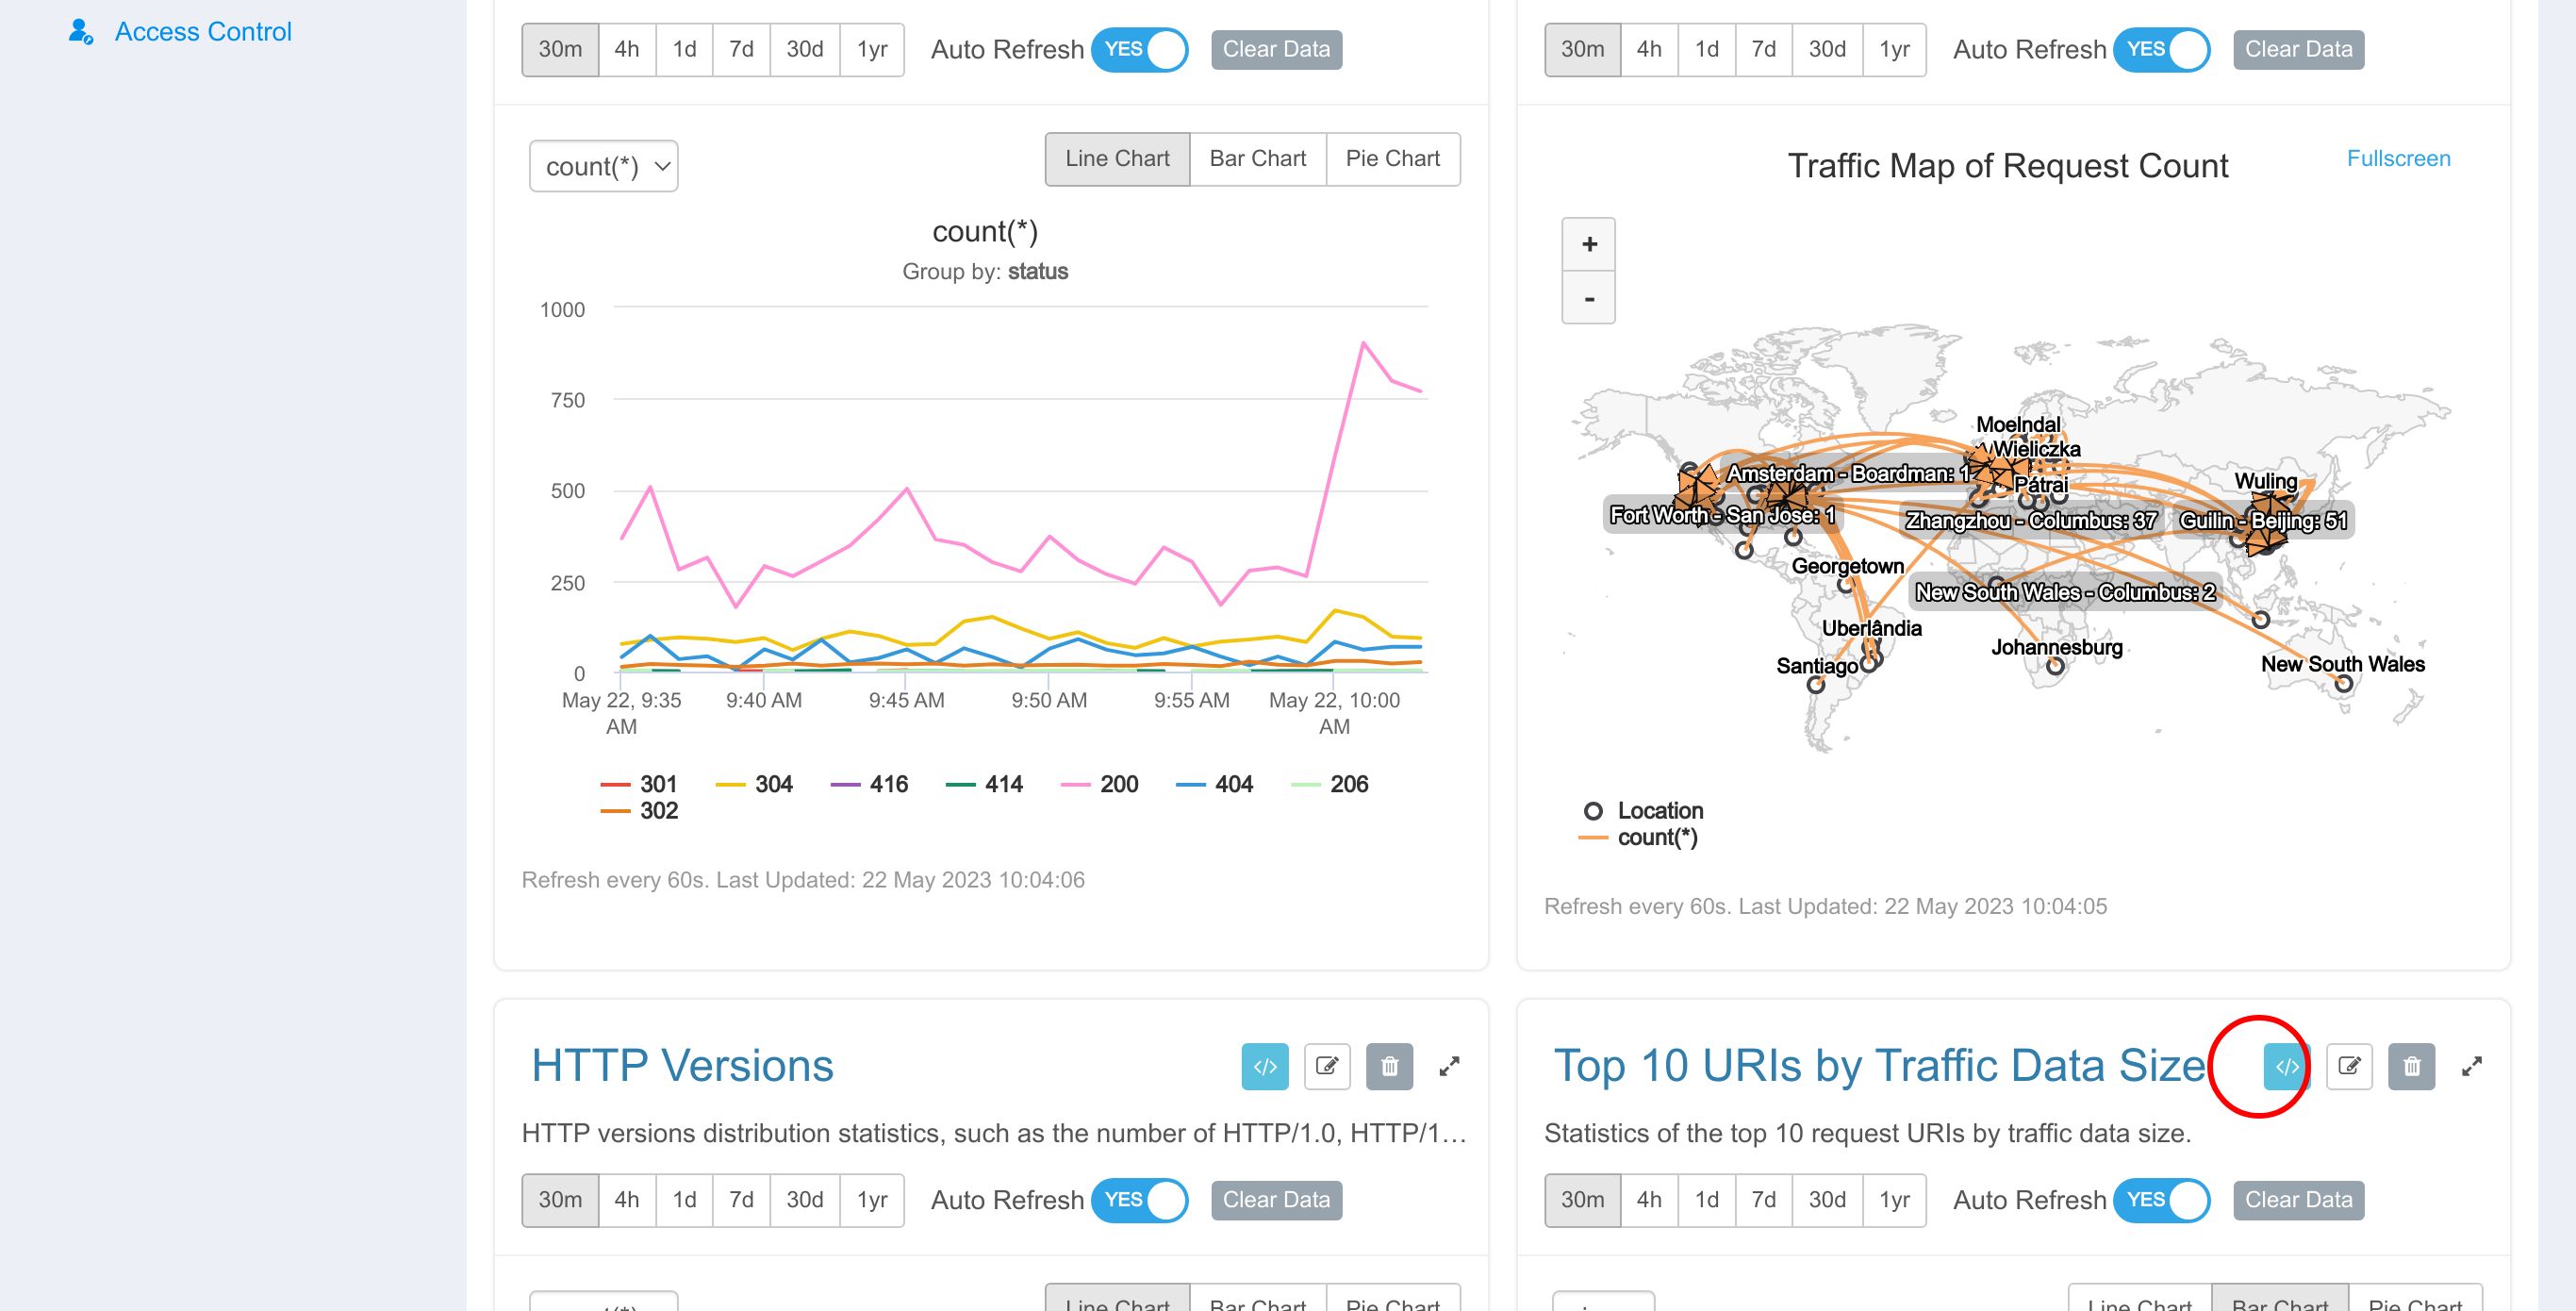
It shows size of traffic data grouped by URIs.
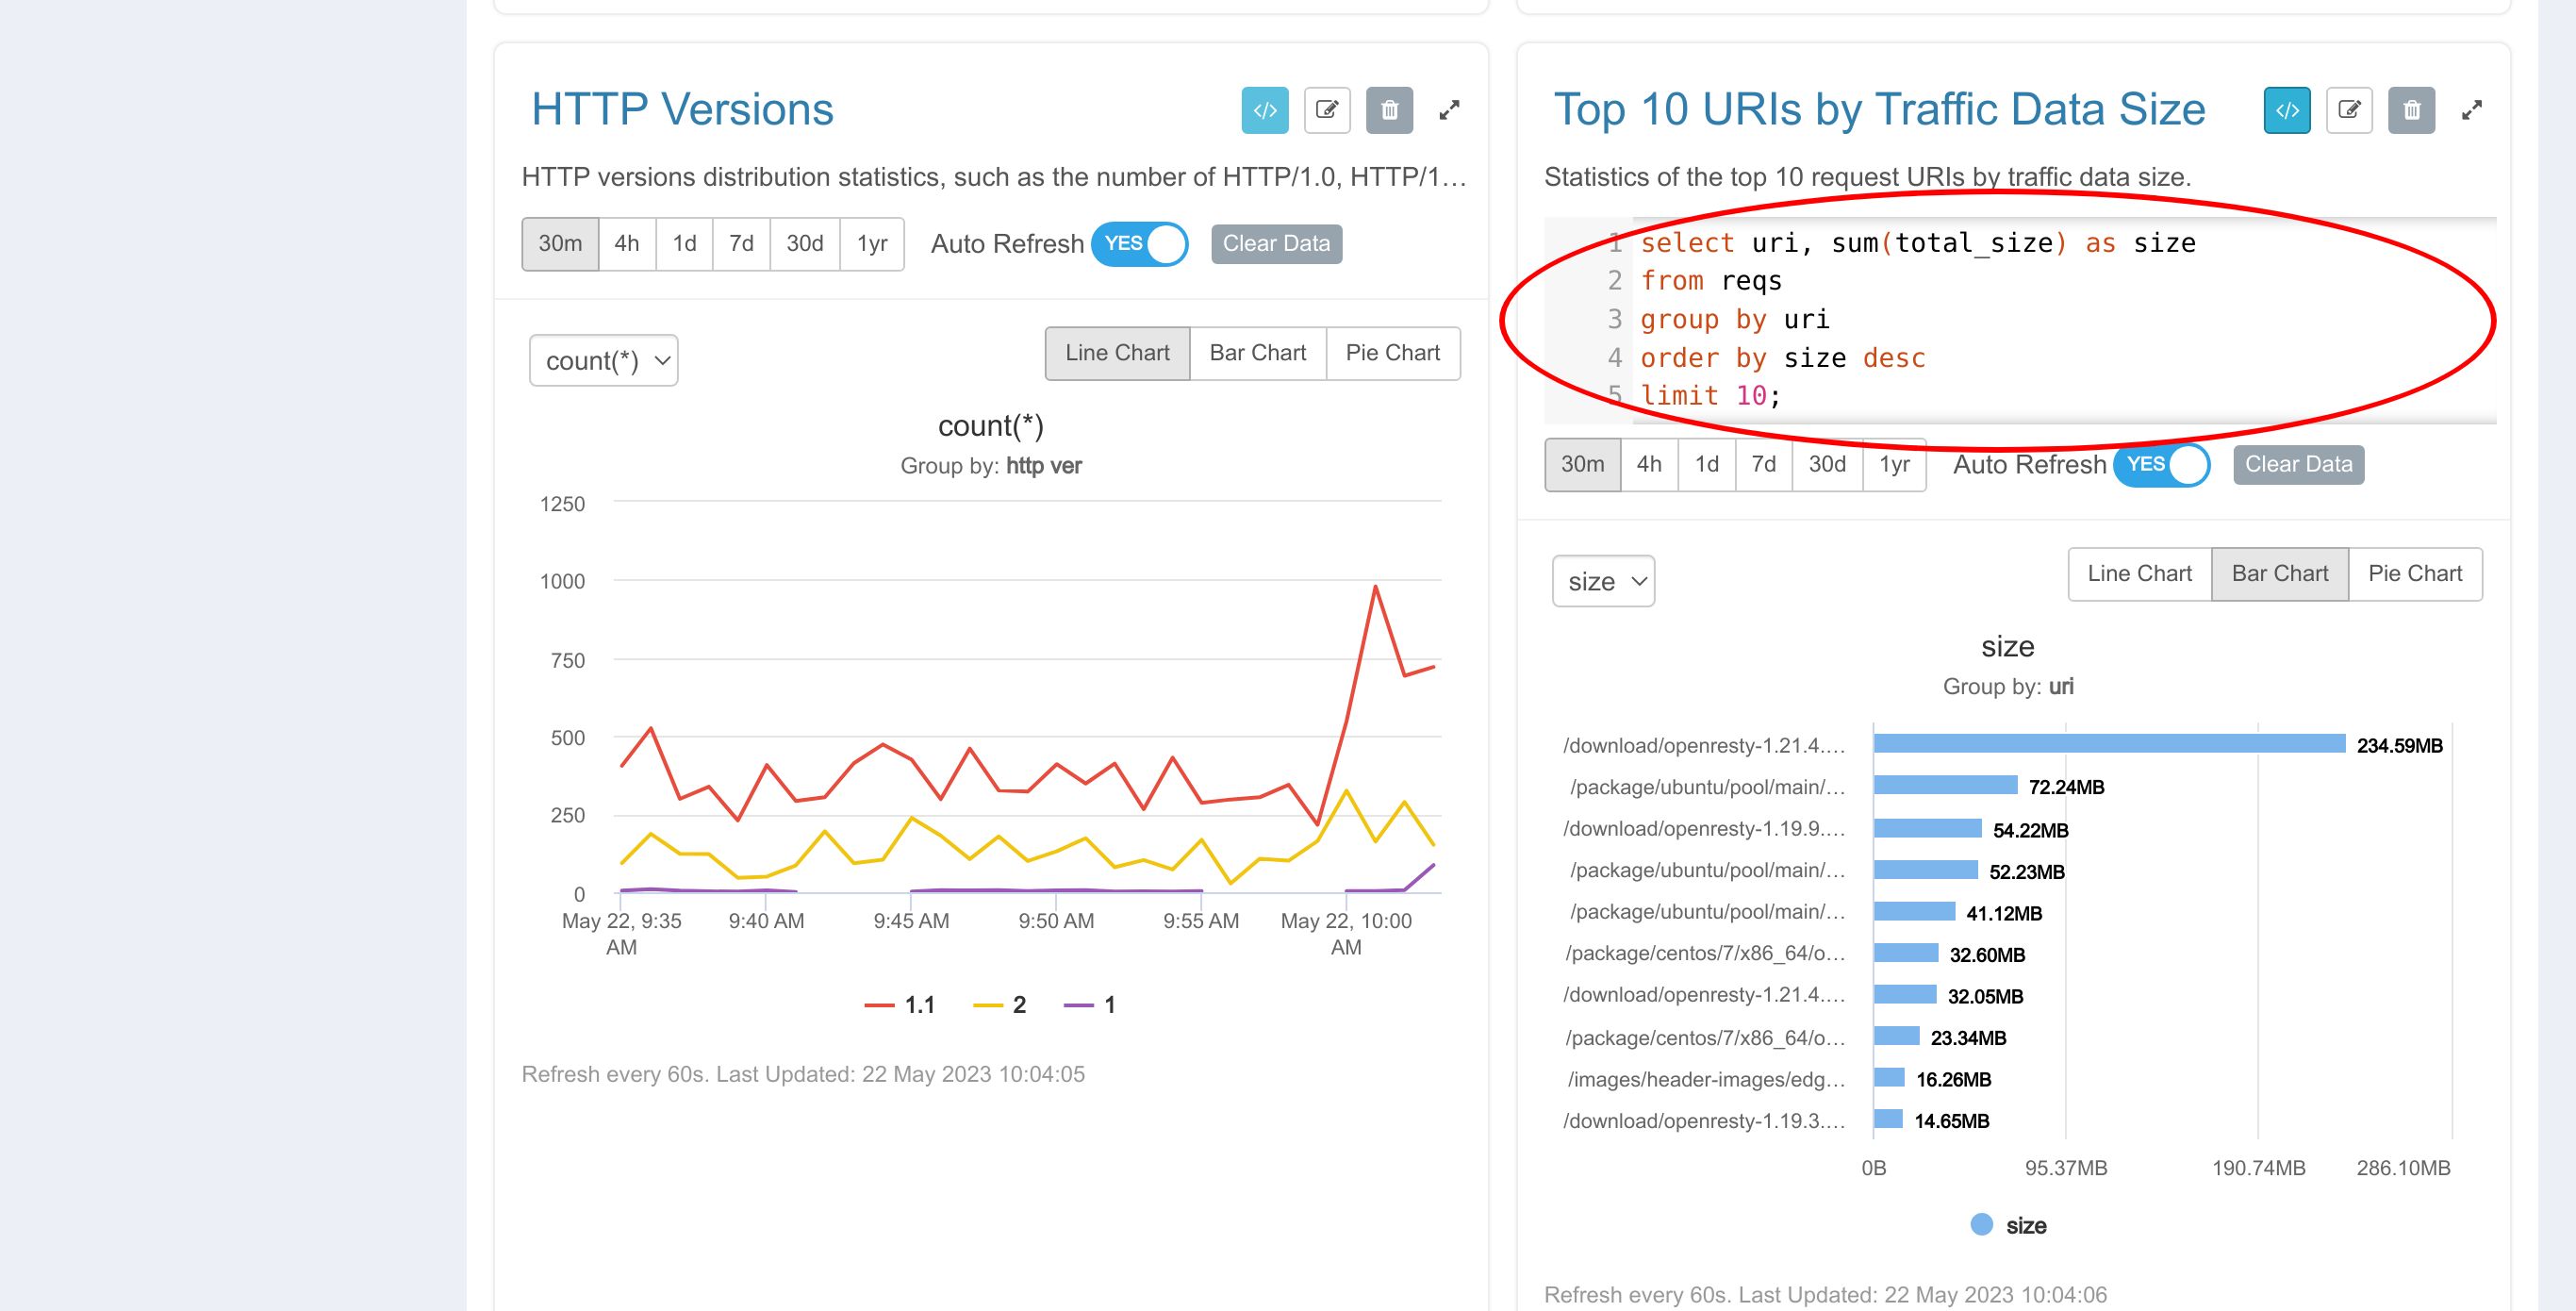
We can see which URI users are most interested in through such data.
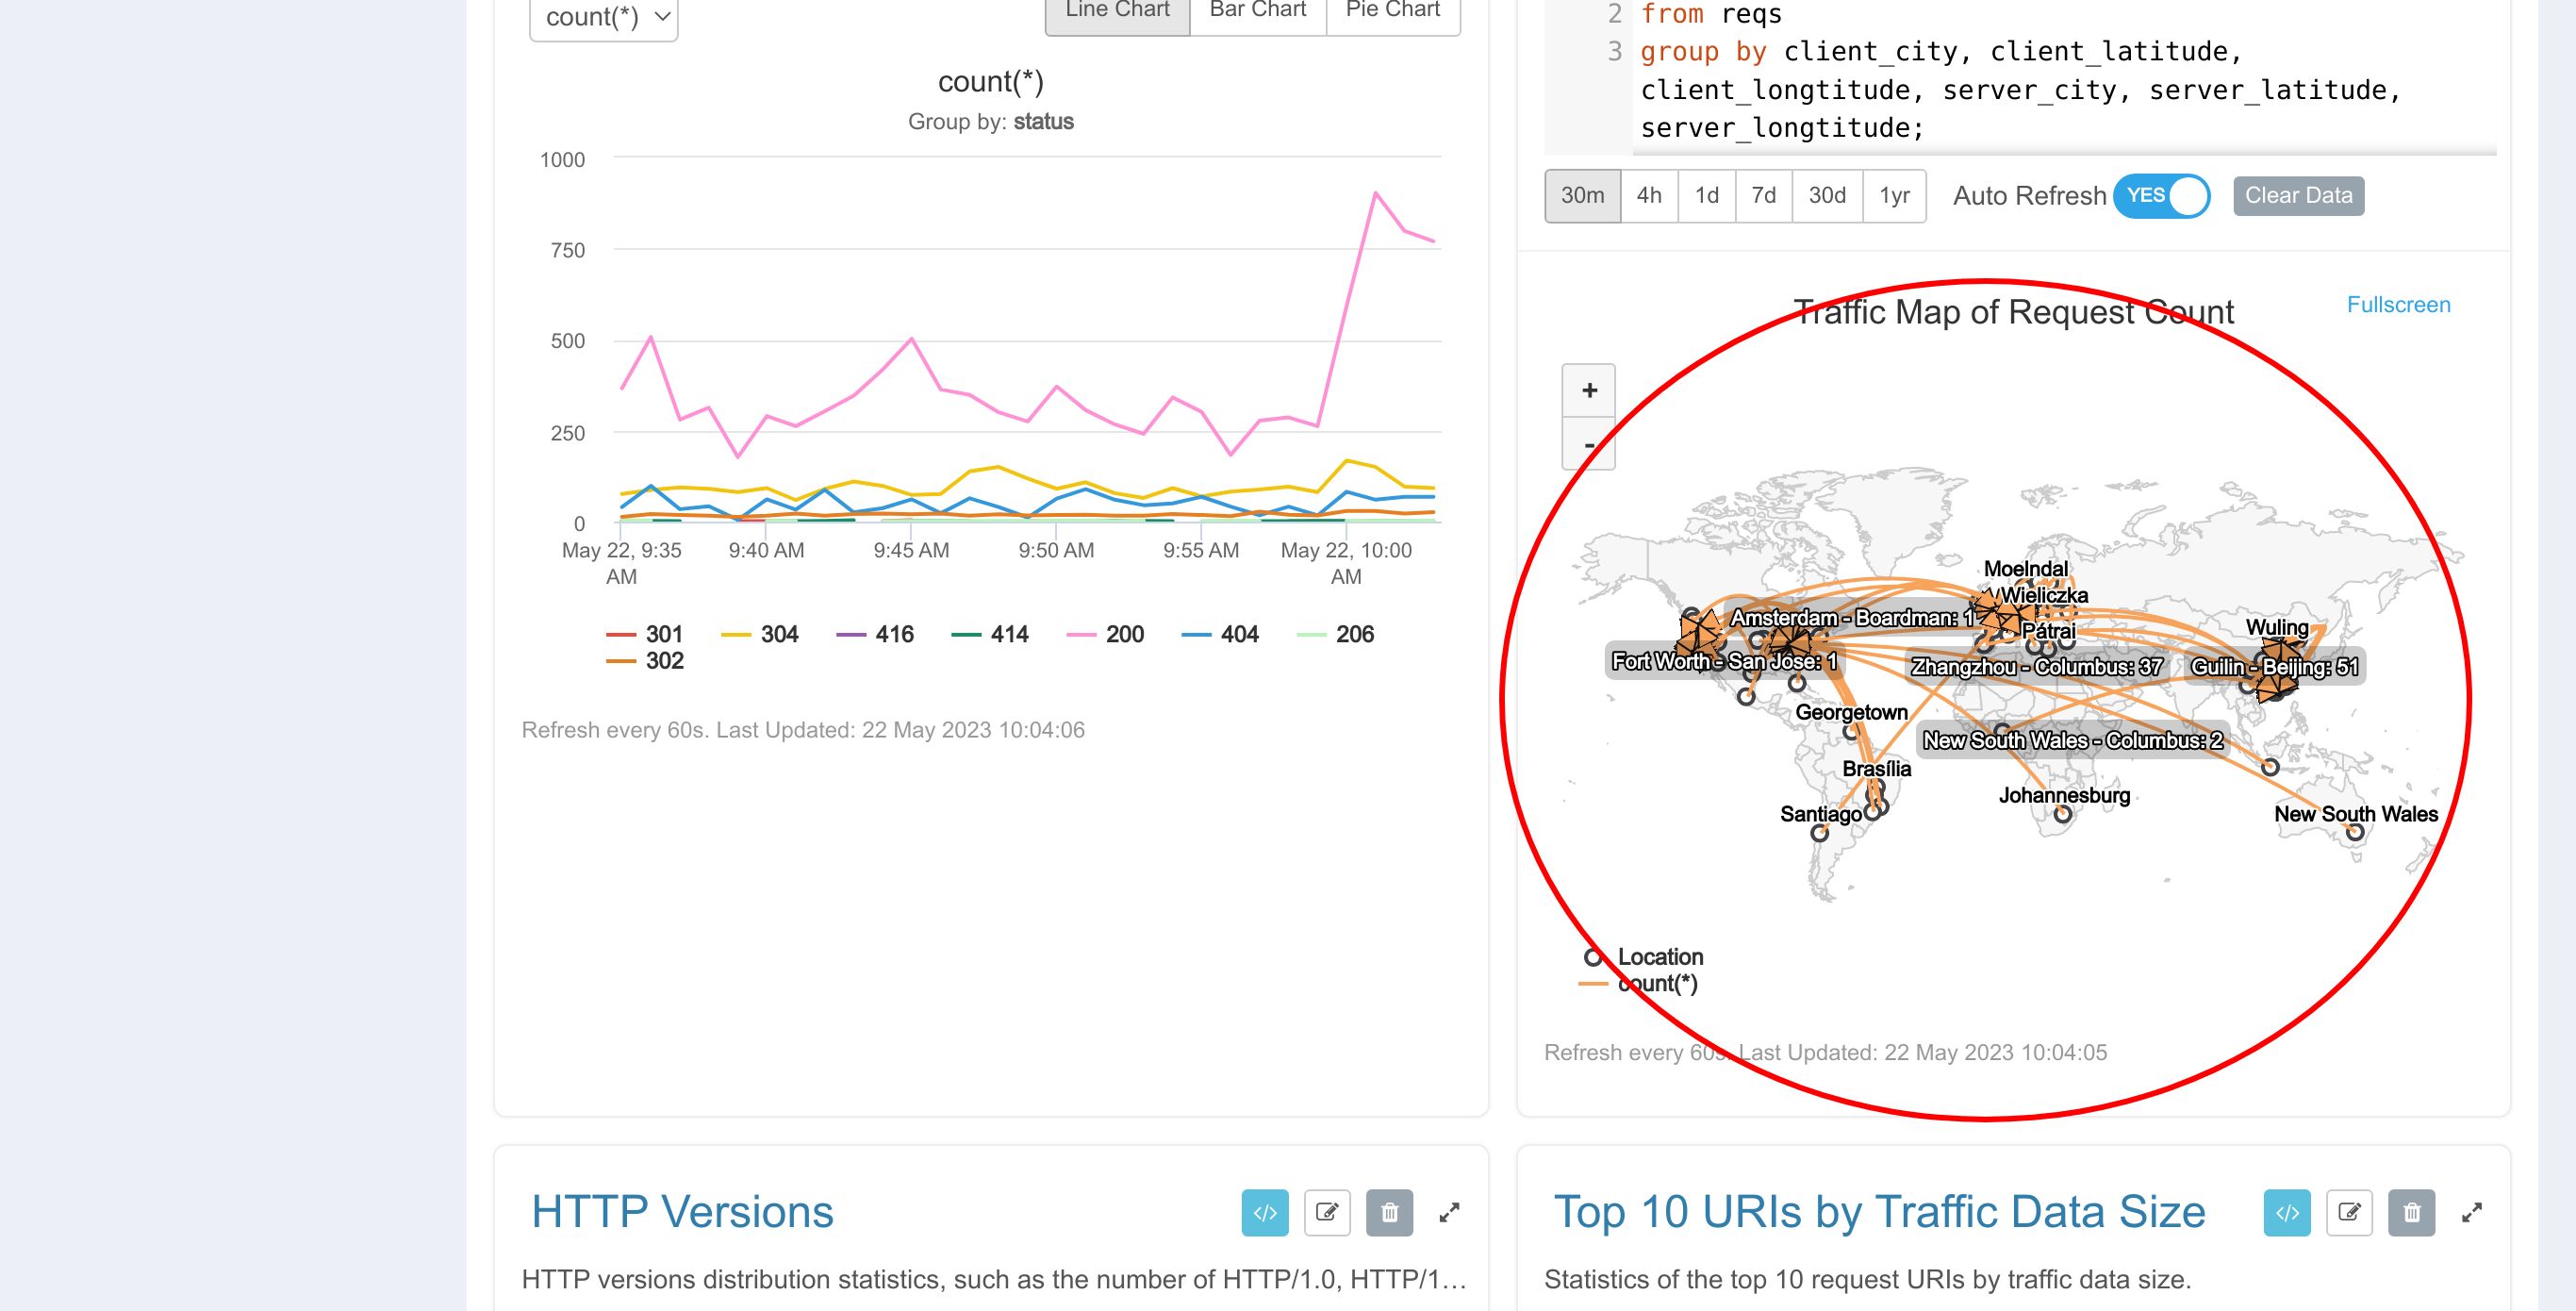
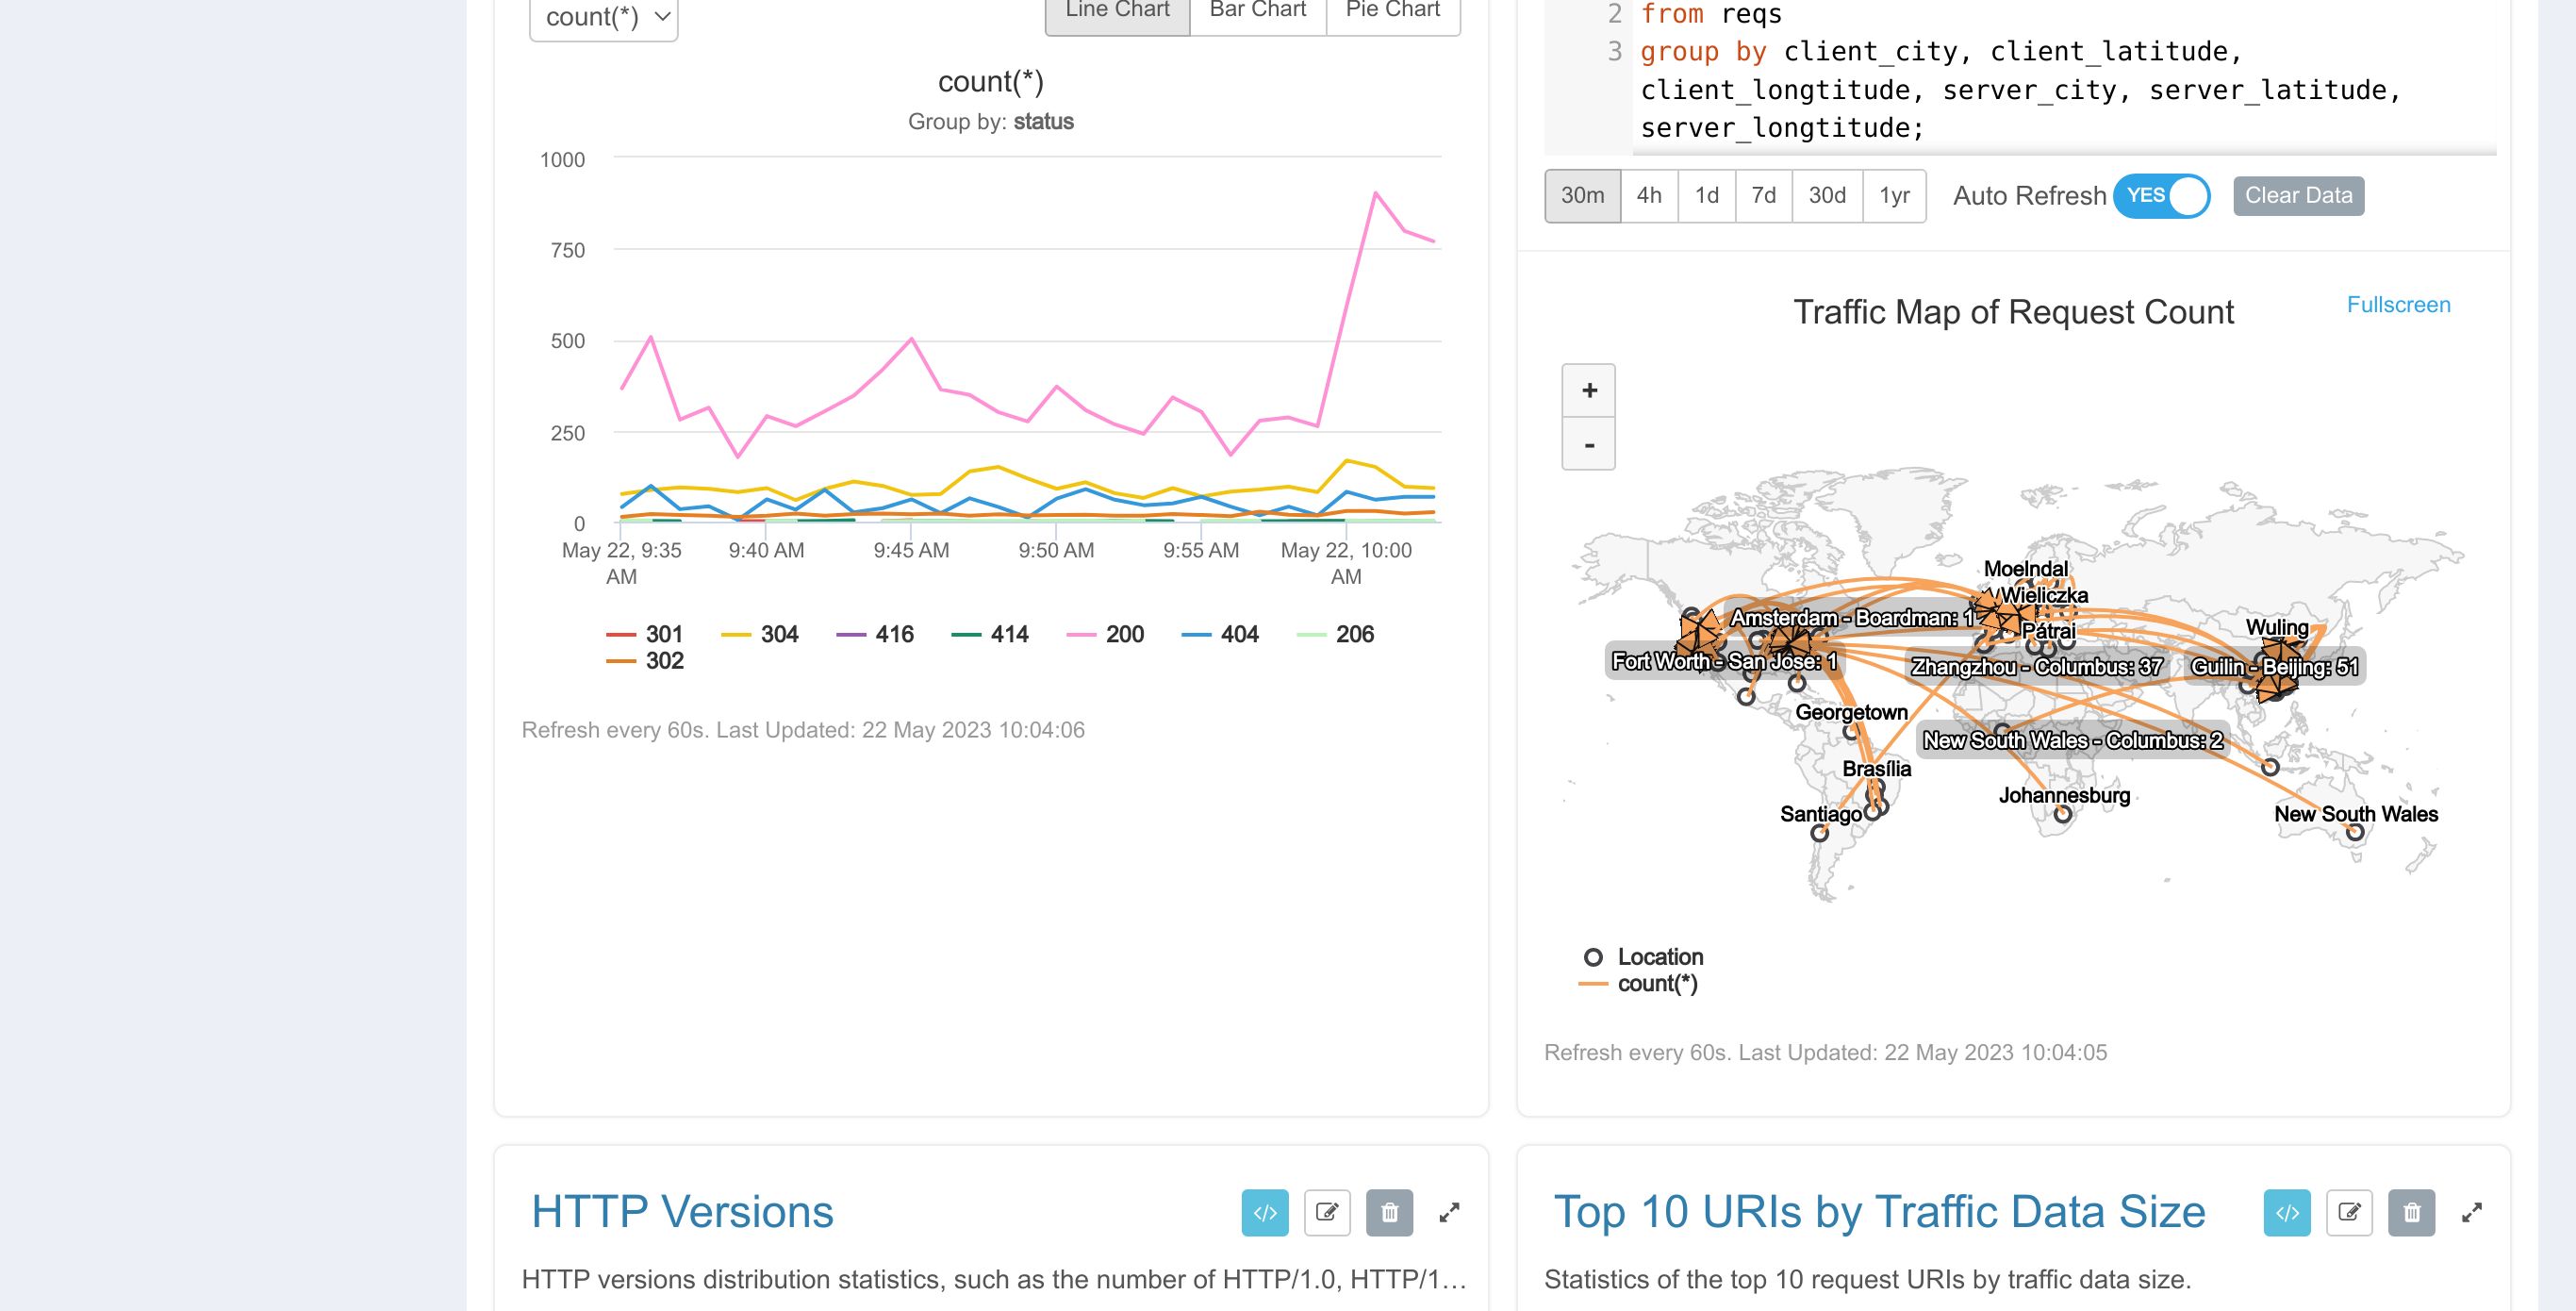
Look at this one.
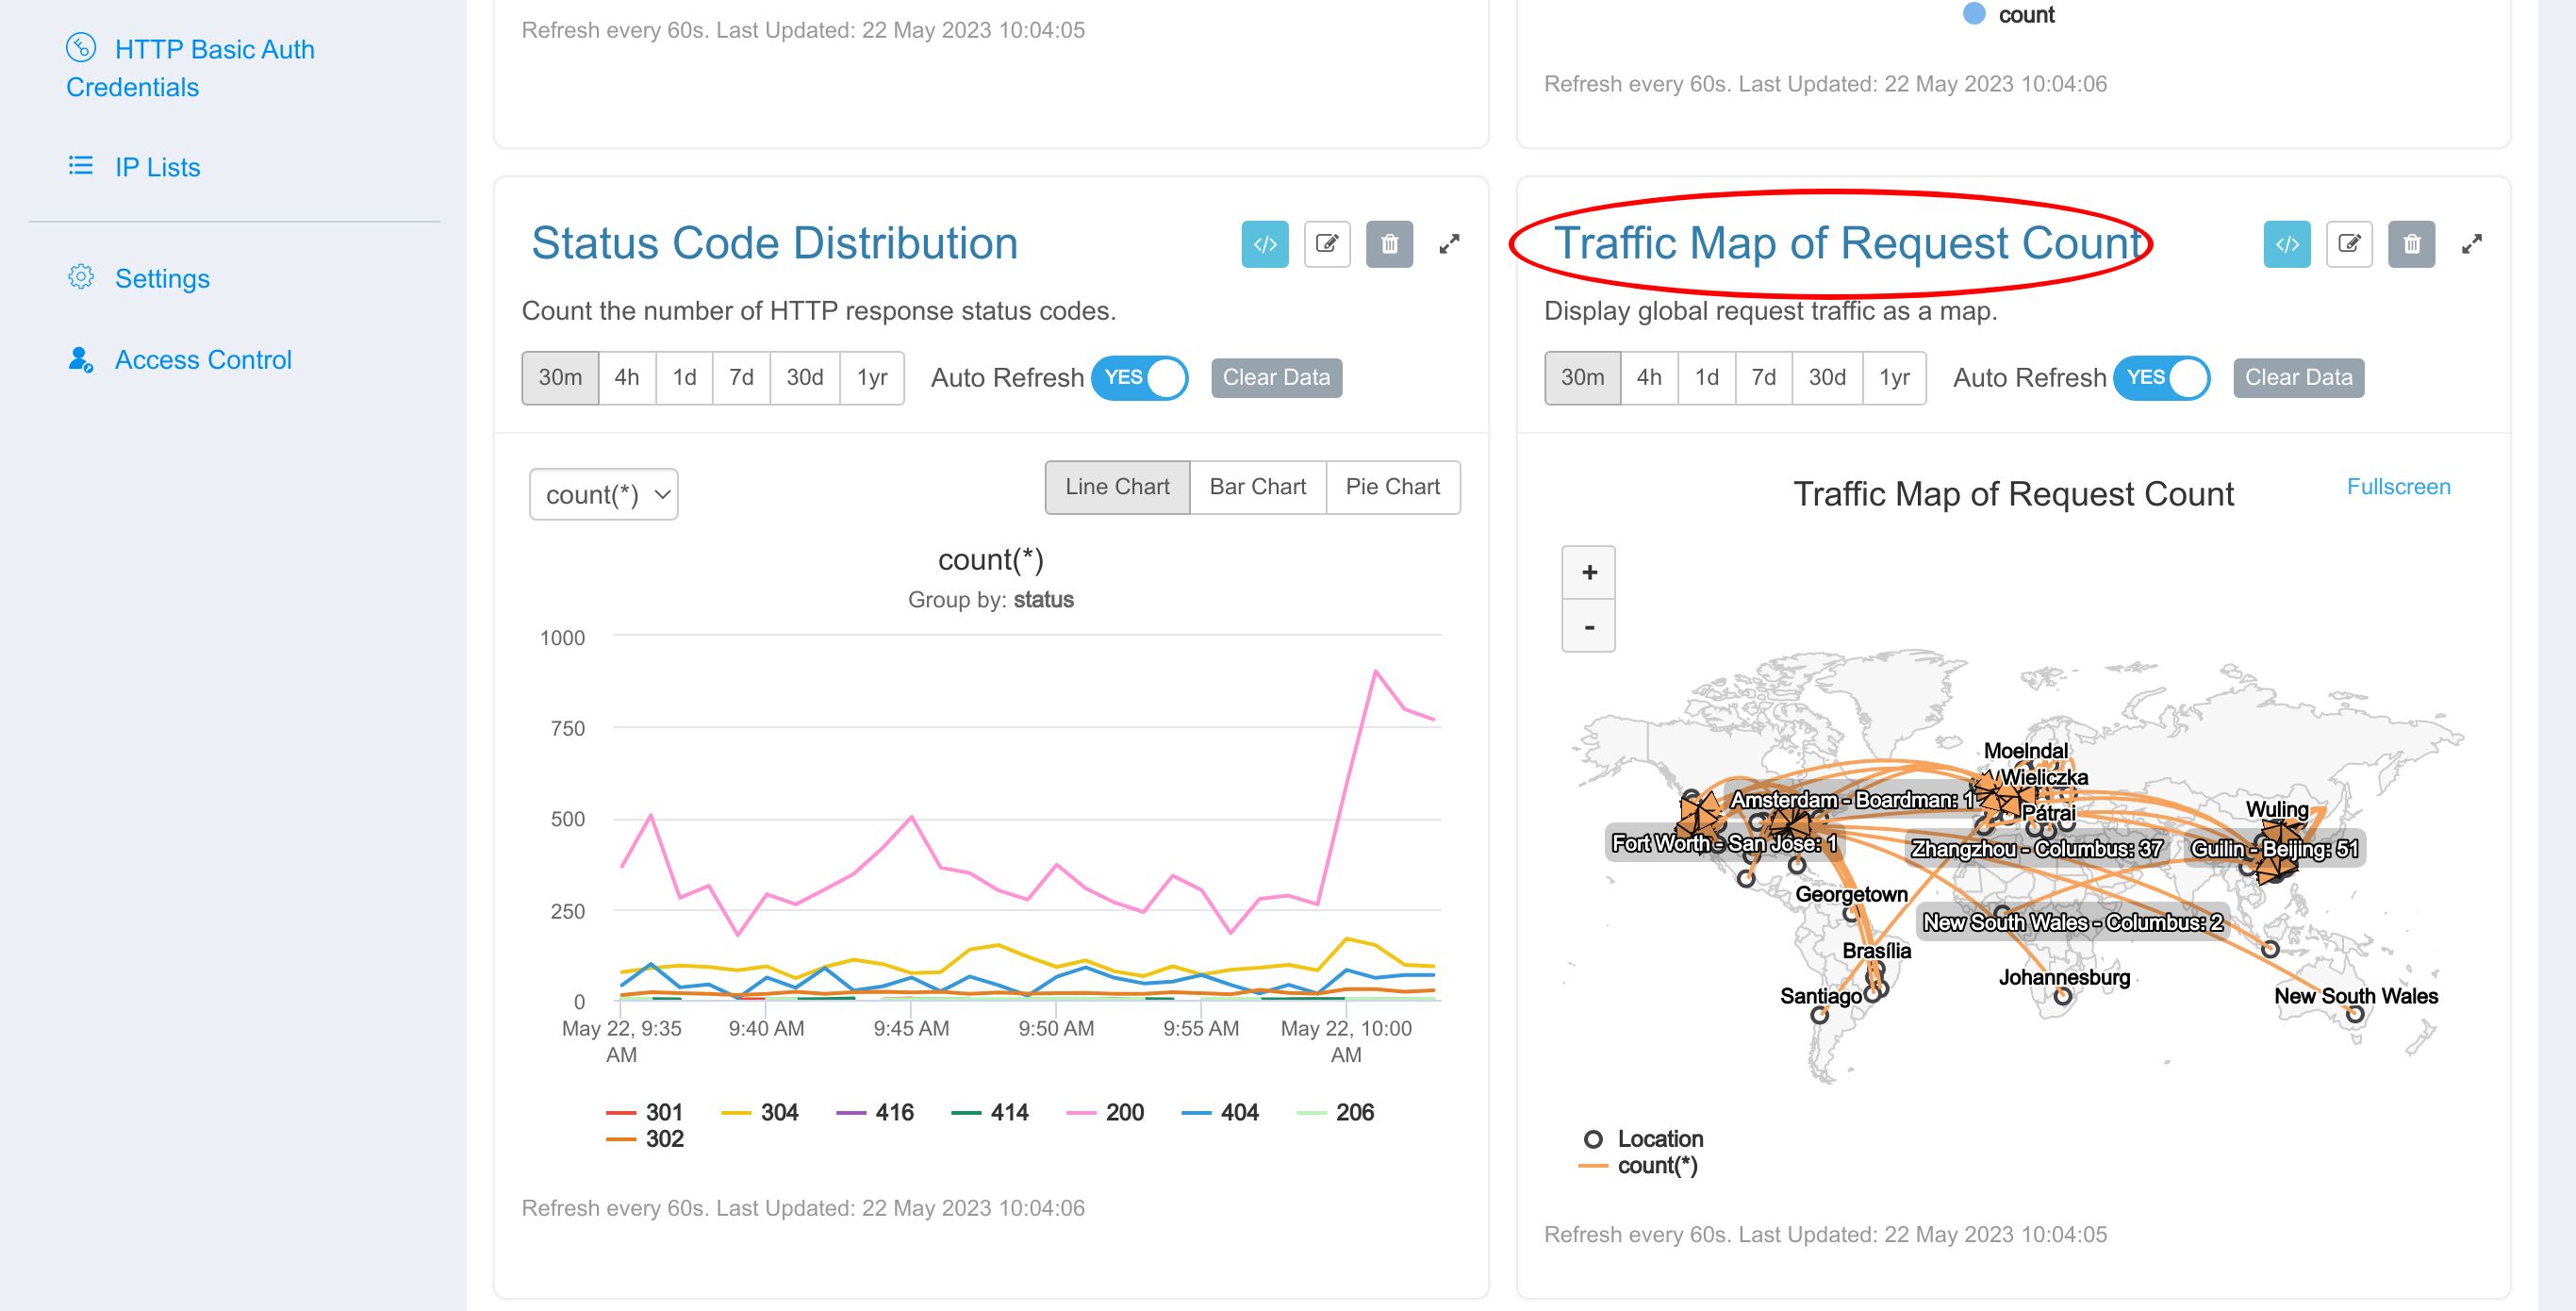
Click to see its metric SQL statement.
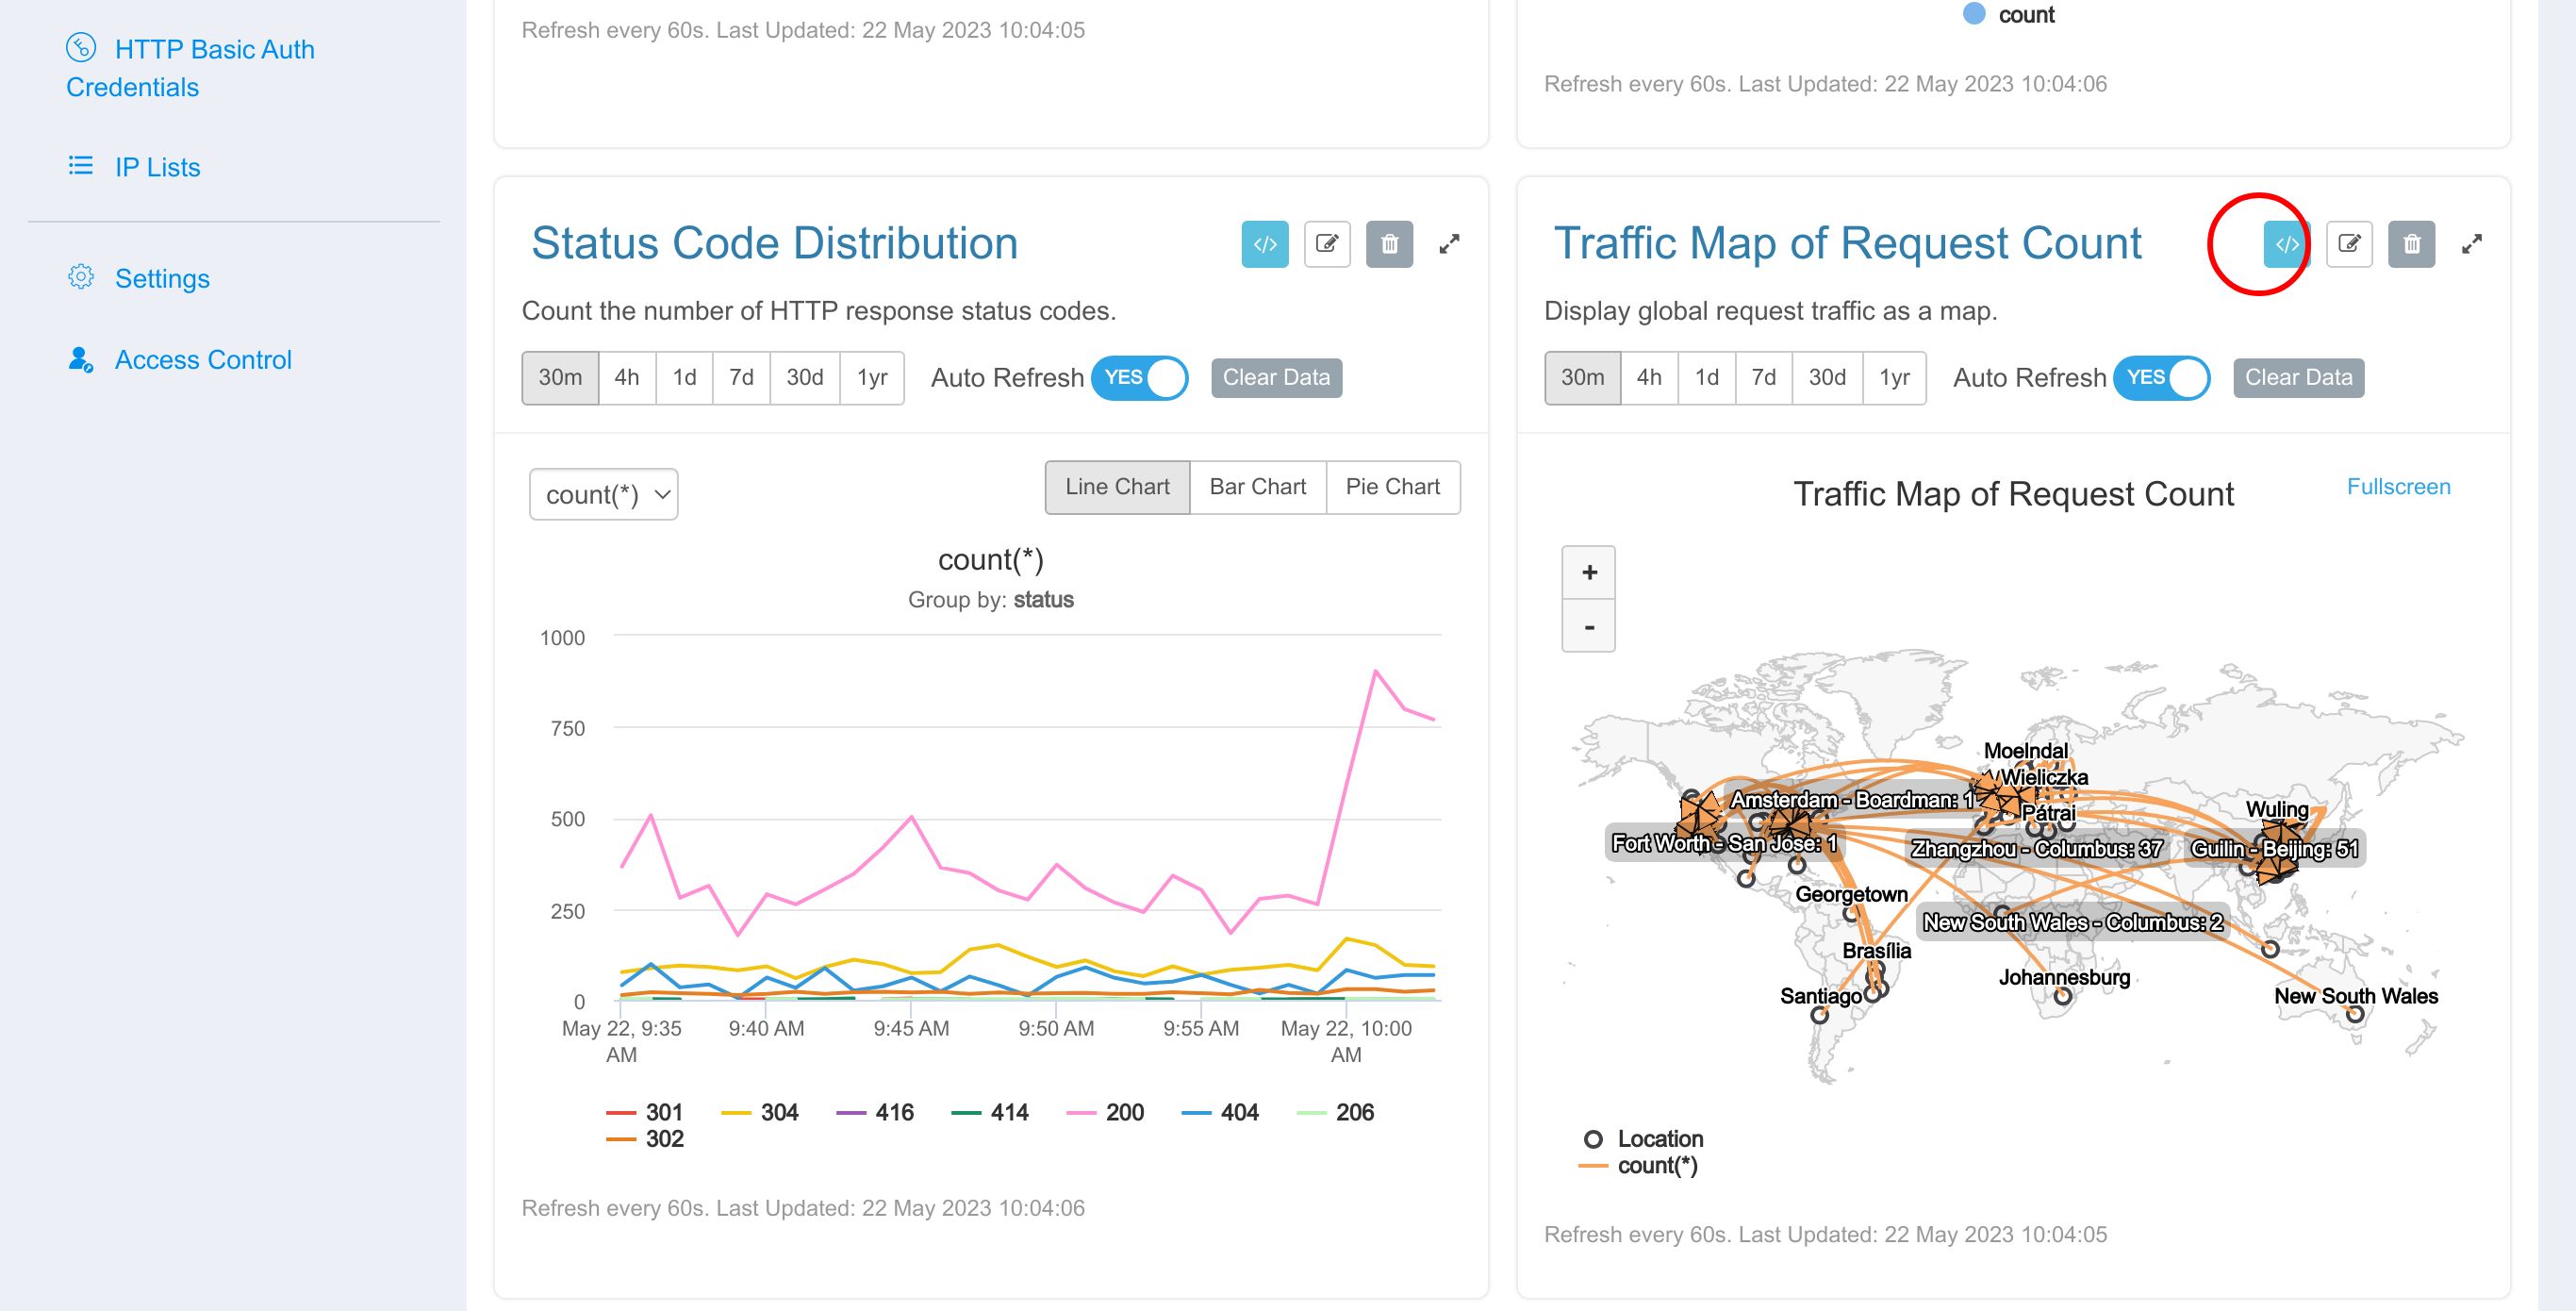
It lists all requesting client and server cities’ names, latitude, and longitude.
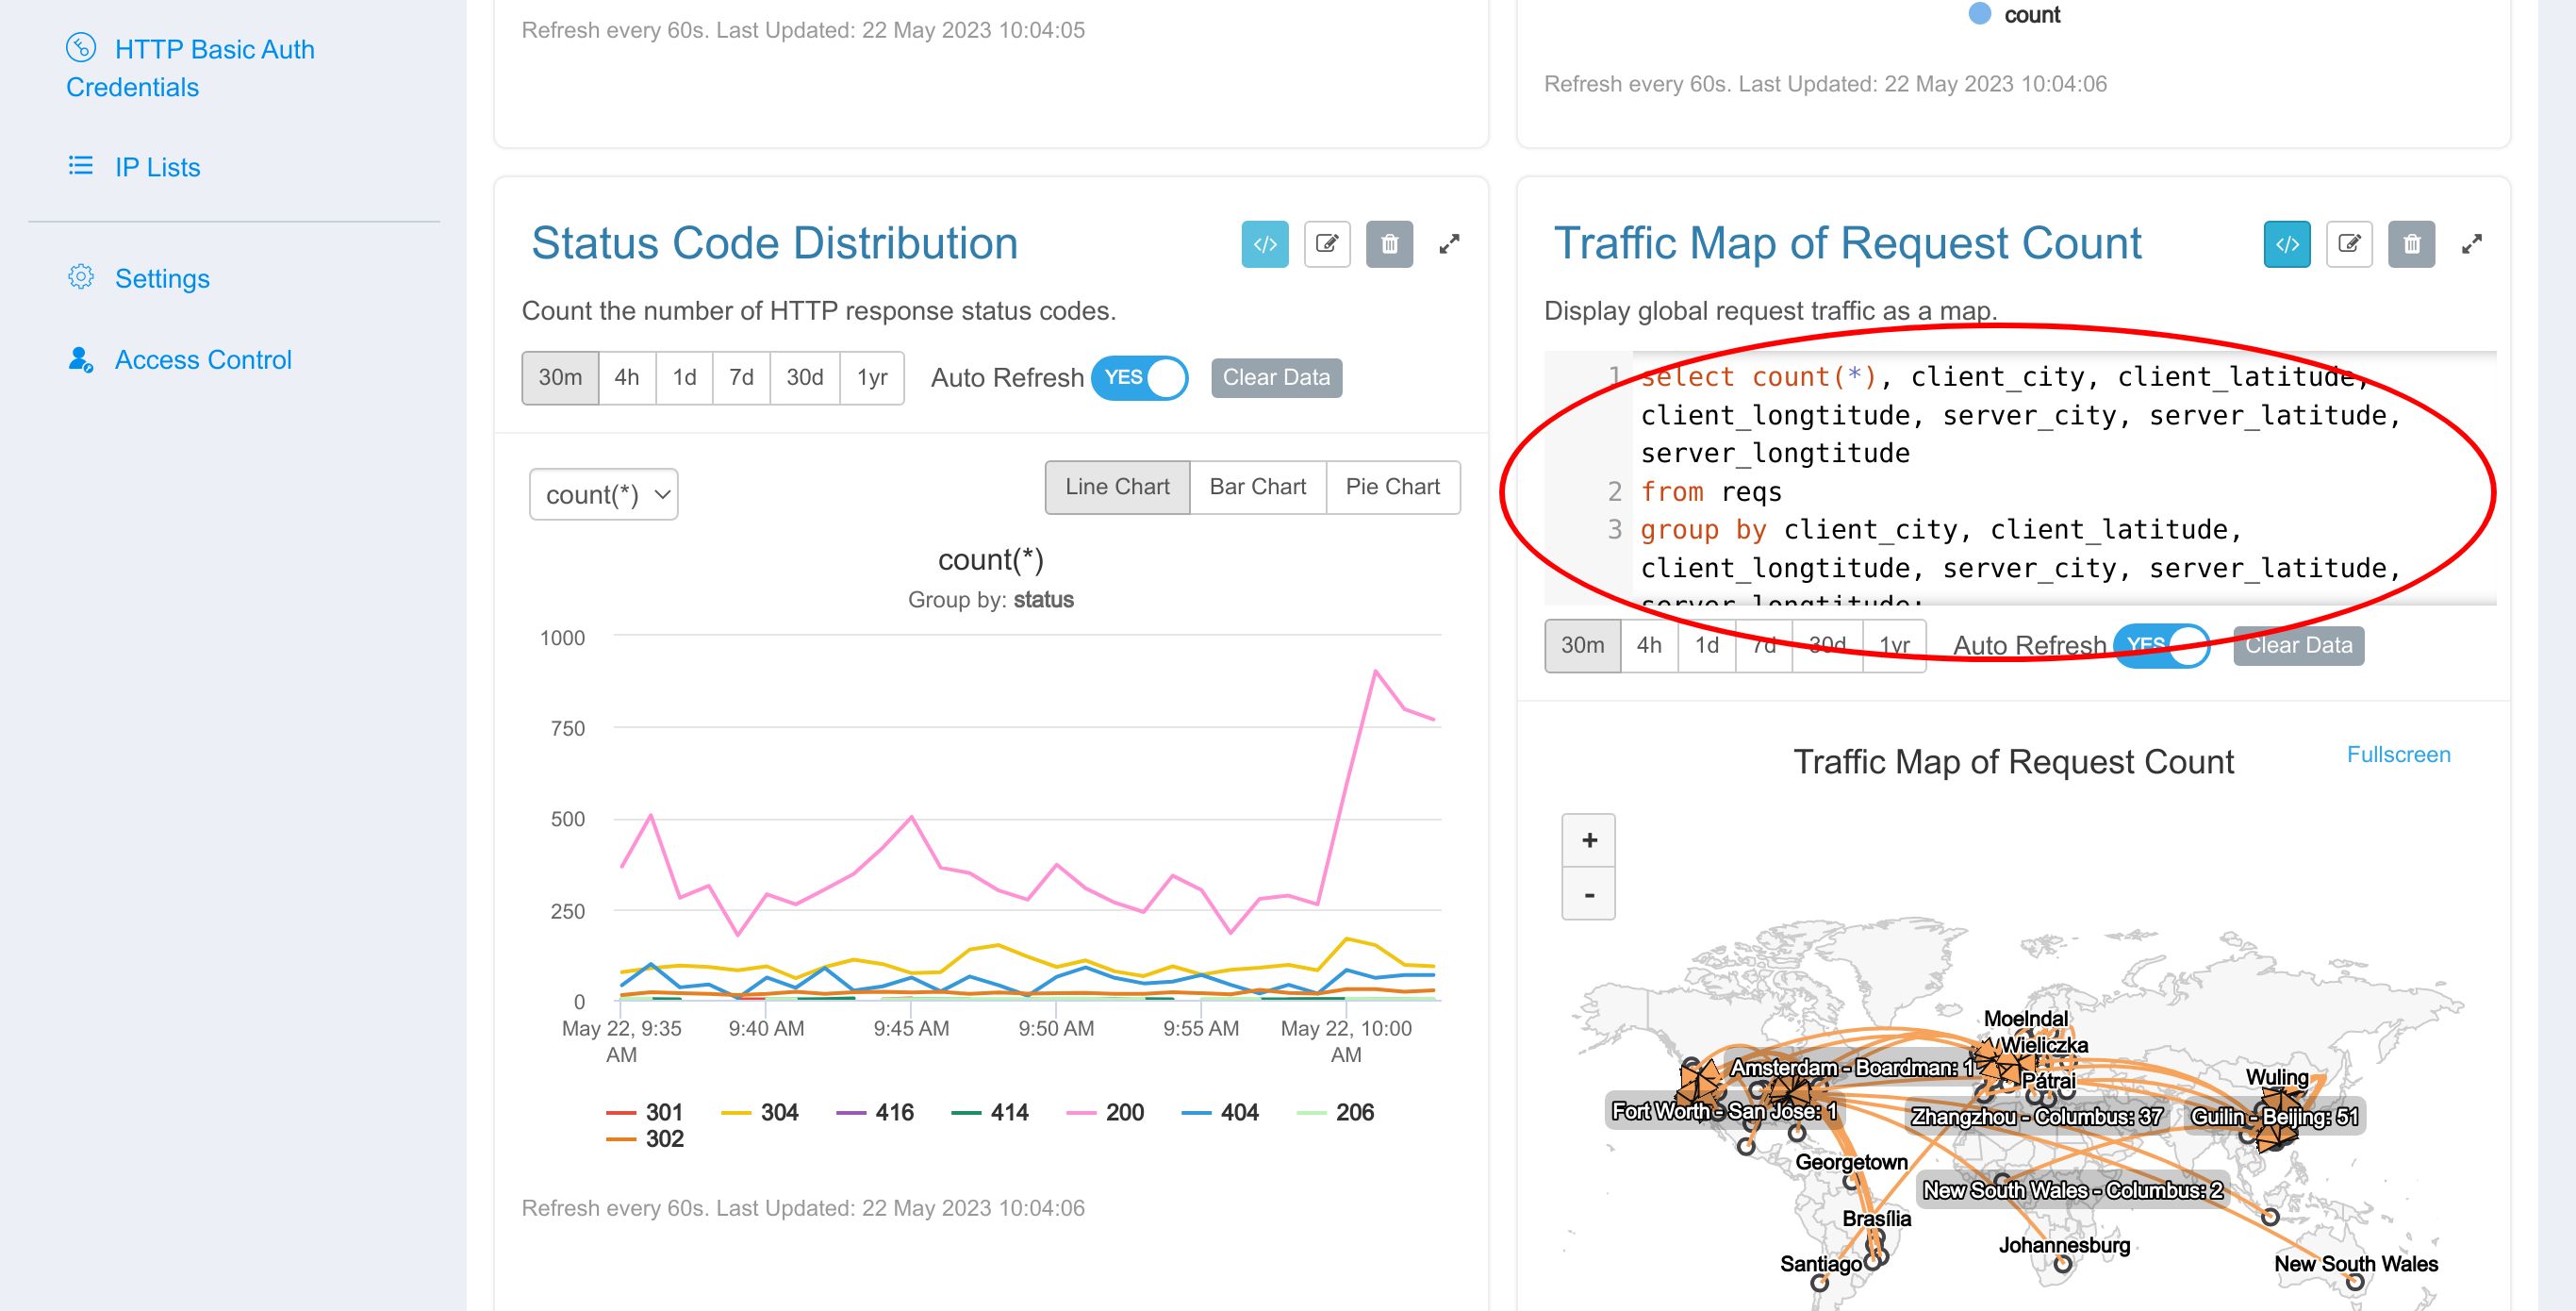
You can see the client city and the server city on the map, and then an arc is drawn from the client to the server. We can see the geographical distribution of requests from the map.
It is what I’d like to cover today.
What is OpenResty Edge
OpenResty Edge is our all-in-one gateway software for microservices and distributed traffic architectures. It combines traffic management, private CDN construction, API gateway, security, and more to help you easily build, manage, and protect modern applications. OpenResty Edge delivers industry-leading performance and scalability to meet the demanding needs of high concurrency, high load scenarios. It supports scheduling containerized application traffic such as K8s and manages massive domains, making it easy to meet the needs of large websites and complex applications.
If you like this tutorial, please subscribe to this blog site and/or our YouTube channel. Thank you!
About The Author
Yichun Zhang (Github handle: agentzh), is the original creator of the OpenResty® open-source project and the CEO of OpenResty Inc..
Yichun is one of the earliest advocates and leaders of “open-source technology”. He worked at many internationally renowned tech companies, such as Cloudflare, Yahoo!. He is a pioneer of “edge computing”, “dynamic tracing” and “machine coding”, with over 22 years of programming and 16 years of open source experience. Yichun is well-known in the open-source space as the project leader of OpenResty®, adopted by more than 40 million global website domains.
OpenResty Inc., the enterprise software start-up founded by Yichun in 2017, has customers from some of the biggest companies in the world. Its flagship product, OpenResty XRay, is a non-invasive profiling and troubleshooting tool that significantly enhances and utilizes dynamic tracing technology. And its OpenResty Edge product is a powerful distributed traffic management and private CDN software product.
As an avid open-source contributor, Yichun has contributed more than a million lines of code to numerous open-source projects, including Linux kernel, Nginx, LuaJIT, GDB, SystemTap, LLVM, Perl, etc. He has also authored more than 60 open-source software libraries.
Related Articles
OpenResty XRay Jun 7, 2022

OpenResty XRay Dec 21, 2023

OpenResty XRay Dec 4, 2023

OpenResty XRay Nov 23, 2023

OpenResty XRay Nov 21, 2023


